UNITED STATES
SECURITIES AND EXCHANGE COMMISSION
WASHINGTON, D.C. 20549
________________________________________
FORM 10-K
________________________________________
(Mark One)
ANNUAL REPORT PURSUANT TO SECTION 13 OR 15(d) OF THE SECURITIES EXCHANGE ACT OF 1934 | |
For the fiscal year ended December 31, 2019
or
TRANSITION REPORT PURSUANT TO SECTION 13 OR 15(d) OF THE SECURITIES EXCHANGE ACT OF 1934 | |
For the transition period from to
Commission file number: 001-32598
_______________________________________
(Exact name of registrant as specified in its charter)
_______________________________________
(State or Other Jurisdiction of Incorporation or Organization) | (I.R.S. Employer Identification No.) |
(Address of principal executive offices and zip code)
(978 ) 436-6500
(Registrant’s telephone number, including area code)
Securities registered pursuant to Section 12(b) of the Act:
Title of Each Class | Trading Symbol(s) | Name of Exchange on which Registered |
Securities registered pursuant to Section 12(g) of the Act: None
_______________________________________________________
Indicate by check mark if the registrant is a well known seasoned issuer, as defined in Rule 405 of the Securities Act. ☒ Yes ☐ No
Indicate by check mark if the registrant is not required to file reports pursuant to Section 13 or 15(d) of the Act. ☐ Yes ☒ No
Indicate by check mark whether the registrant: (1) has filed all reports required to be filed by Section 13 or 15(d) of the Securities Exchange Act of 1934 during the preceding 12 months (or for such shorter period that the registrant was required to file such reports), and (2) has been subject to such filing requirements for the past 90 days. Yes ☒ No ☐
Indicate by check mark whether the registrant has submitted electronically every Interactive Data File required to be submitted pursuant to Rule 405 of Regulation S-T (§232.405 of this chapter) during the preceding 12 months (or for such shorter period that the registrant was required to submit such files). Yes ☒ No ☐
Indicate by check mark whether the registrant is a large accelerated filer, an accelerated filer, a non-accelerated filer, smaller reporting company, or an emerging growth company. See the definitions of “large accelerated filer,” “accelerate filer,” “smaller reporting company,” and “emerging growth company” in Rule 12-b-2 of the Exchange Act.
☒ | Accelerated Filer | ☐ | |
Non-Accelerated Filer | ☐ | Smaller reporting company | |
Emerging growth company | |||
If an emerging growth company, indicate by check mark if registrant has elected not to use the extended transition period for complying with any new or revised financial accounting standards provided pursuant to Section 13(a) of the Exchange Act. ¨
Indicate by check mark whether the registrant is a shell company (as defined in Rule 12b-2 of the Exchange Act). Yes ☐ No ☒
The aggregate market value of voting stock held by non-affiliates of the registrant, based on the last sale price of the Common Stock on June 29, 2019, the last business day of registrant’s most recently completed second fiscal quarter, was $5,003,128,875 . Shares held by each officer and director of the registrant and by each person who owned 10 percent or more of the outstanding Common Stock have been excluded from this computation in that such persons may be deemed to be affiliates of the registrant. This determination of affiliate status for this purpose is not necessarily a conclusive determination for other purposes.
As of February 3, 2020, 134,627,369 shares of the registrant’s Common Stock were outstanding.
DOCUMENTS INCORPORATED BY REFERENCE
Portions of the registrant’s Definitive Proxy Statement for its 2020 Annual Meeting of Stockholders scheduled to be held on April 29, 2020, or the 2020 Proxy Statement, which is scheduled to be filed with the Securities and Exchange Commission, or SEC, not later than 120 days after December 31, 2019, are incorporated by reference into Part III of this Annual Report on Form 10-K. With the exception of the portions of the 2020 Proxy Statement expressly incorporated into this Annual Report on Form 10-K by reference, such document shall not be deemed to constitute part of this Annual Report on Form 10-K.
ENTEGRIS, INC.
INDEX TO ANNUAL REPORT ON FORM 10-K
FOR THE FISCAL YEAR ENDED DECEMBER 31, 2019
Caption | Page | ||
PART I | |||
Item 1. | |||
Item 1A. | |||
Item 1B. | |||
Item 2. | |||
Item 3. | |||
Item 4. | |||
PART II | |||
Item 5. | |||
Item 6. | |||
Item 7. | |||
Item 7A. | |||
Item 8. | |||
Item 9. | |||
Item 9A. | |||
Item 9B. | |||
PART III | |||
Item 10. | |||
Item 11. | |||
Item 12. | |||
Item 13. | |||
Item 14. | |||
PART IV | |||
Item 15. | |||
Item 16. | |||
PART I
Item 1. Business.
OUR COMPANY
Entegris, Inc. (“Entegris”, “the Company”, “us”, “we”, or “our”) is a leading global developer, manufacturer and supplier of microcontamination control products, specialty chemicals and advanced materials handling solutions for manufacturing processes in the semiconductor and other high-technology industries. We leverage our unique breadth of capabilities to create value for our customers by developing mission-critical solutions to maximize manufacturing yields, reduce manufacturing costs and enable higher device performance.
Semiconductors, or integrated circuits, are key components in modern electronic devices. Smartphones (including 5G), cloud computing, the Internet of Things, artificial intelligence, autonomous vehicles and other applications require faster, more powerful and more energy efficient semiconductors. In response to these requirements and the growing demand from these applications, semiconductor manufacturing technology has rapidly been moving to smaller and more complex dimensions, adopting new device architectures, such as FinFET transistors and 3D-NAND, and utilizing new and innovative manufacturing materials to increase transistor performance and bit density. As technology nodes becomes increasingly complex, to enable improvements and to maximize yields, manufacturers require the effective development and application of new materials, a reliable and consistent supply of high-value materials, and contamination-free transportation, storage and delivery of these materials, seamlessly integrated into the semiconductor manufacturing process, at ever-increasing levels of purity and contaminant control. Additionally, the effective management and maintenance of the entire materials handling system, from initial production of process chemistry, to transportation and dispensing onto the wafer, has grown in importance to enhanced device yield.
We believe that greater materials intensity and greater materials purity will be the two defining factors of the next generation of semiconductor performance. We are well positioned to help our customers achieve their targeted levels of chip performance, yields and reliability. Our technology portfolio includes advanced materials and high-purity chemistries, with optimized packaging and delivery systems and in-process filtration and purification solutions that ensure high-value liquid chemistries and gases are free from contaminants use. Our standard customized productions and solutions enable the highest levels of purity and performance that are essential to the manufacture of semiconductors, flat panel displays, light emitting diodes, or LEDs, high-purity chemicals, solar cells, gas lasers, optical and magnetic storage devices, and critical components for aerospace, glass manufacturing and biomedical applications. The majority of our products are consumed at various times throughout the manufacturing process, with demand driven in part by the level of semiconductor and other manufacturing activity.
Our business is organized and operated in three operating segments, which align with the key elements of the advanced semiconductor manufacturing ecosystem. The Specialty Chemicals and Engineered Materials, or SCEM, segment provides high-performance and high-purity process chemistries, gases, and materials, and safe and efficient delivery systems to support semiconductor and other advanced manufacturing processes. The Microcontamination Control, or MC, segment offers solutions to filter and purify critical liquid chemistries and gases used in semiconductor manufacturing processes and other high-technology industries. The Advanced Materials Handling, or AMH, segment develops solutions to monitor, protect, transport, and deliver critical liquid chemistries, wafers and other substrates for a broad set of applications in the semiconductor industry and other high-technology industries. While these segments have separate products and technical know-how, they share common business systems and processes, technology centers, and strategic and technology roadmaps. We leverage our expertise from these three segments and complementary product portfolios to create new and increasingly integrated solutions for our customers.
THE SEMICONDUCTOR ECOSYSTEM
The manufacture of semiconductors requires hundreds of highly complex and sensitive manufacturing steps, during which a variety of materials are repeatedly applied to a silicon wafer to build integrated circuits on the wafer surface. We serve the semiconductor ecosystem by providing specialty materials and chemicals utilized in many process steps, offering a broad range of products to monitor, protect, transport, and deliver these critical process materials during the manufacturing process and providing systems to purify liquid chemistry and gases throughout the manufacturing process. The areas of the semiconductor ecosystem that rely most heavily on our products and solutions are described below.
Deposition. Deposition processes include physical vapor deposition (PVD), where a thin film is deposited on a wafer surface in a low-pressure gas environment, chemical vapor deposition (CVD), where a thin film is deposited on a wafer surface by exposing it to one or more volatile precursors which react with the wafer surface, atomic-layer deposition (ALD), where a thin film is deposited on a wafer surface by exposing it to one or more precursors which react through a series of sequential, self-
1
limiting reactions, and electro-plating, where a metal layer, such as copper, is deposited using chemical baths. Our advanced precursor materials and electro-plating chemicals are utilized to meet the semiconductor industry’s composition, uniformity and thickness needs of deposited films. Our filtration and purification products are used to remove contaminants during the deposition process, consequently reducing defects on wafers. These products are critical to ensuring device performance and achieving the targeted manufacturing yields of semiconductor manufacturers.
Chemical Mechanical Planarization (CMP). CMP is a polishing process used by semiconductor manufacturers to planarize, or flatten, many of the layers of material that have been deposited upon silicon wafers. We offer a broad range of products used by semiconductor manufacturers during and immediately following the CMP process. Our CMP slurry products are used for polishing ultra-hard surface materials, including SiC (silicon carbide) and GaN (gallium nitride) substrates. Our formulated cleaning chemistries remove residue from wafer surfaces after the CMP process, and prevent subsequent corrosion. Our filtration and purification systems are used to filter liquid slurries and cleaning chemistries in order to remove select particles and contaminants that can cause defects on a wafer’s surface. Our roller brushes are used in conjunction with our clean chemistries to clean the wafer after completion of the CMP process in order to prepare the wafer for subsequent operations, and our pad conditioners are used to prepare the surface of the CMP polishing pad prior to every polishing cycle.
Photolithography. Photolithography is a process repeated many times throughout the semiconductor manufacturing process that uses light to print complex circuit patterns onto the wafer. To print the projected optical pattern, the wafer is coated with a thin film of light-sensitive material, called photoresist. Light is projected to expose the photoresist, which is then developed (somewhat like photographic film) to create a stenciled image pattern. Our liquid filtration and liquid packaging and dispense systems play a vital role in assuring the pure, accurate and uniform dispense of photoresists onto the wafer so that manufacturers can achieve acceptable yields in the manufacturing process, and our gas microcontamination control systems eliminate airborne contaminants that can disrupt effective photolithography processes.
Etch and Resist Strip. During the etch process, specific areas of the thin film that have been deposited on the surface of a wafer are removed to leave a desired circuit pattern. After the etch process, the hardened resist needs to be completely removed. Our formulated chemical solutions remove photo resists and post-etch residues, and our gas filters and purifiers help assure the purity of the process gas streams used in the etch process. Our precision-engineered coatings provide barriers to corrosive chemistries in the etch environment, protect surfaces from erosion and minimize particle generation.
Ion Implant. Ion implantation is a key technology for forming transistors and is used many times during semiconductor fabrication. During ion implantation, wafers are bombarded by a beam of electrically-charged ions, called dopants, which change the electrical properties of the exposed surface films. Our Safe Delivery Source® (SDS®) and VAC® (Vacuum Actuated Cylinders) gas delivery systems assure the safe, effective and efficient delivery of the toxic gases necessary for the implant process. In addition, our proprietary low temperature plasma coating processes for core components are critical elements of ion implantation equipment.
Wet Cleaning. Ultra-high purity chemicals of precise composition are used to clean the wafers before and after several of the processes described above, to pattern circuit images and to remove photoresists after etch. The cleaning chemicals must be maintained at very high purity levels without the presence of foreign material such as particles, ions or organic contaminants in order to maintain manufacturing yields and avoid defective products. Our proprietary formulated cleaning chemistries are used in these wet cleaning processes, and our liquid filters and purifiers ensure the purity of these chemicals.
Wafer Solutions. Our wafer and reticle carriers are high-purity “micro-environments” that carry wafers between manufacturing process steps. These products protect wafers from damage or abrasion and minimize contamination during transportation and automated processing. Front-end wafer processing can involve hundreds of steps and take several weeks. Protection of the processed wafer is essential, as a batch of fully processed 200 mm or 300 mm wafers transported in one of our products can be worth over a million dollars.
Chemical Containers. Semiconductor manufacturing and other high-technology processes utilize large volumes of high-purity, corrosive and hazardous chemicals. Our ultrahigh purity chemical container products, such as drums, flexible packaging and associated coded connection systems, maintain chemical purity, maximize utilization and ensure safe transport, containment and dispense of valuable, ultraclean process fluids, from storage by the chemical manufacturer to point-of-use. Our FluoroPure® containers and NOWPak® liner-based systems maximize chemical retrieval and minimize chemical waste, which lowers our semiconductor manufacturer customers’ costs. Our portfolio of bottles, canisters, closures and accessories enhance tool productivity, increase yields and reduce operating costs. Relatedly, our ultrapure valves, fitting, tubings, and sensing and control products are used to distribute these chemicals around the fab and in wet process tools.
2
Other Markets. Many of the processes used to manufacture semiconductors are also used to manufacture photovoltaic cells, LEDs, flat panel displays and magnetic storage devices resulting in the need for similar filtration, purification, control and measurement capabilities. We seek to leverage our products, technologies, expertise and core capabilities to address these important market opportunities and pursue opportunities in certain life sciences applications.
INDUSTRY TRENDS
Emerging Applications. The market for semiconductors has grown significantly over the past few decades, and we expect this trend to continue. We believe that smartphones (including 5G), Internet of Things and emerging applications in cloud computing, machine learning and artificial intelligence, autonomous vehicles, and virtual reality will drive growth in the demand for semiconductors, drive wafer starts and create significant opportunities for our products. Existing applications in data processing, wireless communications, broadband infrastructure, personal computers, handheld electronic devices and other consumer electronics are also expected to drive demand for semiconductors, and in turn, our products.
Manufacturing Complexity and Architecture. The emerging applications described above require more powerful, faster and more energy-efficient semiconductors. Semiconductor architectures are changing, with transistor design increasing in complexity, the use of multilayered patterning, vertical structures such as FinFET and 3D-NAND, and shrinking dimensions. These advanced architectures require more process steps to manufacture. We believe that demand for our materials and consumable products will be driven by the increase in process steps and the associated lithography, deposition, CMP, and etch and clean required to manufacture leading-edge semiconductors. Additionally, new materials have played a significant role in enabling improved devices performance, and we expect this trend to continue. As dimensions get smaller, new materials will be required for transistor connectivity. For example, leading-edge semiconductor manufacturers are moving towards atomic layer scale, where the precision of the manufacturing process and purity of the materials is extremely important to maintain the device integrity. These materials need to be supplied and delivered at ever-increasing levels of purity and control, from point-of-production to point-of-use and dispense on the wafer. We expect the trend for new materials supplied at high levels of purity to drive the demand for our advanced materials and our products and solutions designed to purify, monitor, protect, transport, and deliver critical materials. To address the challenges of the advanced technology nodes, we collaborate with our customers to develop new materials, to enhance our filtration and purification capabilities and to introduce advanced materials packaging and monitoring capabilities.
Material Handling Solutions. Our semiconductor customers have become increasingly focused on materials handling solutions that enable them to safely store, handle, process and transport critical materials throughout the manufacturing process to minimize the potential for damage or degradation to their materials and to protect their investment in processed wafers. We believe that these trends provide opportunities for us to utilize our breadth of capabilities to provide innovative materials, materials management, purification, wafer transport, and process solutions to semiconductor customers to enable them to successfully manage this growing complexity.
Reliance on Trusted Suppliers. Our customers require that their key materials suppliers demonstrate greater capabilities, such as sustainability, scalability, flexible manufacturing, quality control, supply chain management, and the ability to effectively collaborate on solutions to problems. We have responded to these demands by deploying resources to enable us to align with their requirements and drive operational excellence. For example, in 2016 and 2017, we expanded our technology centers in South Korea and Taiwan and in 2019, we opened a technology center in China, containing application and analytical labs, adding to our research and development capabilities to enhance local development and collaboration and to strengthen relationships with our key customers. We believe these trends will allow us to leverage our manufacturing, operational and technical capabilities, along with our broad technology portfolio, to become an increasingly important strategic supplier to our customers.
Continued Consolidation. Our customer base within the semiconductor industry has consolidated through mergers and acquisitions. As a result, the importance of maintaining and developing strong and close relationships with our customers becomes even more essential. While continuing to strengthen these relationships, we also seek to further broaden our customer base by leveraging our products, technologies, expertise and core capabilities in serving semiconductor applications to address adjacent market opportunities, including in manufacturing processes for flat panel displays, high-purity chemicals, solar cells, optical magnetic storage devices and products for life sciences applications.
Manufacturing in China. Sustained semiconductor industry development in China, which has experienced recent growth in semiconductor production, could spur future industry growth. Construction on an historic number of fabs has been commenced in recent years, and we expect that heavy investment in the semiconductor sector in China will continue, with many new fab projects expected to ramp in the next several years by local and multinational companies. As a result, we expect that China will remain one of the fastest growing regions in the semiconductor industry. Additionally, existing fabs in China are working to
3
rapidly enhance their capabilities to manufacture the latest generation advanced node products, targeting both leading-edge and mainstream applications. In 2019, we expanded our manufacturing footprint in China through the acquisitions of Hangzhou Anow Microfiltration Co., Ltd. (Anow) and opened a new technology center in Shanghai, China, containing application and analytical labs. We believe we are well positioned in China (with both local and global customers) and expansion and growth of the semiconductor industry in China could increase demand for our products.
OUR COMPETITIVE STRENGTHS
Technology Leadership. We are committed to being able to provide our customers with innovative solutions for their manufacturing needs. For example, we have introduced sub-10 nanometer and 7 nanometer filtration products, advanced deposition materials for next generation transistor and interconnect technologies, advanced reticle pods for extreme ultra-violet, or EUV, photolithography applications, advanced 300 mm wafer carriers and advanced coatings to meet the rigorous demands of the advanced technology nodes faced by our customers.
Comprehensive and Diverse Product Offerings. As semiconductor manufacturers are driving towards more advanced technology nodes, our customers are seeking suppliers who can provide a broad range of customized, reliable, flexible and cost-effective products and materials, as well as the technological and application design expertise necessary to enhancing their productivity, quality, and yield. We believe our comprehensive offering of materials and products creates a competitive advantage as it enables us to meet a broad range of customer needs and provide a single source of product offerings for semiconductor device and equipment manufacturers. Additionally, our broad product and solution portfolio allows us to serve many aspects of the semiconductor manufacturing ecosystem and to create synergies among certain of our products. For example, our microenvironment and fluidics products are utilized when a fab is being built to move wafers and materials throughout the fab, our chemistries and gas products are consumed during operation of the fab, and our contamination control products ensure the purity of chemistries and gases throughout the fab and its supply chain.
Global Presence. We have established a global infrastructure of design, manufacturing, distribution, service and technical support facilities to meet the needs of our global customers. We have, for example, expanded our manufacturing operations and increased our investment in advanced technology centers in Taiwan and South Korea to support our important customers in these regions, established or acquired new sales, manufacturing and service locations in China and opened a technology center in Shanghai, China to serve a growing semiconductor manufacturing base in that country, expanded manufacturing capacity in Malaysia and expanded our presence in Singapore to enhance our global and regional management of supply chain and manufacturing processes. We service our customer relationships in Asia, North America, Europe and the Middle East predominantly via direct sales and support personnel and to a lesser extent through selected independent sales representatives and distributors.
Advanced Manufacturing. We have established leading-edge manufacturing plants located in the United States, Canada, China, Malaysia, Japan, South Korea and Taiwan that possess the advanced manufacturing capabilities described under “Manufacturing” below.
Strong Relationships with Broad Customer Base. We have strong relationships with our customers, which include leading semiconductor manufacturers, original equipment manufacturers, or OEMs, and semiconductor materials suppliers. These relationships provide us with significant collaboration opportunities at the product design stage, which facilitate our ability to introduce new products and applications. For example, we work with our key customers in the development of advanced manufacturing processes to identify and respond to their requests for current and future generations of products for emerging applications requiring cleaner materials, as well as systems that maintain the integrity and stability of materials during transport through the manufacturing process. We believe that our customer base will continue to be an important source of new product development opportunities. Due to the specialized nature of our products, manufacturing complexity, qualification requirements in customers’ fabrication processes, high customer re-formulation and qualification change costs, and extensive proprietary products, we believe our supply position with our customers is strong.
Strong Financial Performance and Cash Flow Generation. We have a strong financial profile. In addition to servicing our debt obligations and effecting our capital allocation strategy, we expect that our financial profile will allow us to invest in the research and development and advanced manufacturing capabilities necessary to maintain and expand our technology leadership and to drive organic growth. Additionally, as we have done in the past, we expect that our cash flow generation will enable us to grow inorganically through smaller acquisitions of product lines or technology that expand upon our product portfolio or through larger acquisitions where we act as a consolidator in the industry and increase our scale and strengthen our position as a leading supplier to our customers.
OUR BUSINESS STRATEGY
4
We intend to build upon our position as a leading worldwide developer, manufacturer and supplier of advanced specialty materials, filtration and purification solutions, delivery systems, and materials packaging solutions to expand our core business and to grow in other high value-added manufacturing process markets. Our strategy includes the following key elements:
Commitment to Technology Leadership. We continuously seek to improve our products and develop new products as our customers’ needs evolve. As semiconductor devices become smaller and more powerful, and new materials and processes are deployed to produce them, we seek to expand our technological capabilities by developing advanced products that address the requirements for greater purification, protection and transport of high value-added materials and by developing advanced materials for use in critical fabrication processes.
Leveraging our Expertise. We leverage our broad expertise across our portfolio of advanced materials, materials handling and purification capabilities to create innovative new solutions to address unmet customer needs. For example, our industry-leading post-CMP cleaning chemistry is developed and manufactured by our SCEM segment, with collaboration from our MC segment, packaged with our ultra-clean container and connector system made by our AMH segment, and delivered to the process tools through fluid handling systems also made by our AMH segment. Furthermore, in the process tools, these chemistries may go through one or several purification systems made by our MC segment to eliminate particles and contaminants. Another example of this strategy is our advanced deposition materials business, where we leverage our ability to synthesize unique molecules, our knowledge of how to purify these materials, and our capability to safely transport these materials and deliver them onto the wafer at a high throughput. We seek to utilize our expertise in areas of increasing importance to semiconductor manufacturers, such as developing advanced materials and ensuring the purity of high-value materials, and our ability to work collaboratively across our three segments, which enables us to quickly and effectively develop optimized and complementary solutions for our customers.
Operational Excellence. Our strategy is to continue to develop our advanced manufacturing capabilities into a competitive advantage with our customers by focusing on the following priorities:
• | use of manufacturing equipment and facilities incorporating leading-edge technology including advanced cleanroom and cleaning procedures; |
• | implementation of standardized manufacturing systems stressing optimization of equipment effectiveness, predictive maintenance, and direct labor productivity; |
• | implementation of automated quality systems that provide both process monitoring and process control throughout the manufacturing process as well as predictive quality data to mitigate against potential quality excursions; |
• | implementation of supply chain management systems that ensure a reliable and responsive supply of high-quality raw materials; |
• | conduct of manufacturing operations to ensure the safety of our employees and of the individuals using our products; and |
• | maintaining an agile manufacturing organization that is capable of rapid design and development of prototypes of new and derivative products, as well as promptly responding to customer feedback concerning prototypes so that we can quickly commercialize and ramp production for our customers. |
Continued Focus on Customers. We view the strong relationships we have with our customers, which include leading semiconductor manufacturers, OEMs, and semiconductor materials suppliers, as critical to our long-term success. We intend to reinforce and further strengthen these relationships, through, among other things, collaborations and joint development. Customer intimacy enables us to respond rapidly and thoroughly to their manufacturing challenges and enables us to bring forth new products that serve an existing need.
Adjacent Markets. We leverage our expertise in the semiconductor industry by developing products for other industries that employ similar technologies and production processes and that utilize materials integrity management, high-purity fluids and integrated dispense systems. For example, outside of the semiconductor industry, our products are used in manufacturing processes for flat panel displays, high-purity chemicals, solar cells, optical magnetic storage devices and products for life sciences. We plan to continue to identify and develop products that address needs in adjacent markets. We believe that by utilizing our technology and core capabilities to provide solutions across multiple industries, we are able to increase the total available market for our products and reduce, to an extent, our exposure to the cyclicality of the semiconductor industry.
Strategic Acquisitions, Partnerships and Related Transactions. We will continue to pursue strategic acquisitions and business partnerships that enable us to address gaps in our product offerings, secure new customers, diversify into complementary product markets, broaden our technological capabilities and product offerings, access local or regional markets and achieve benefits of increased scale. For example, in January 2020, we acquired Sinmat, a CMP slurry manufacturer, with products used for polishing ultra-hard surface materials, including SiC (silicon carbide) and GaN (gallium nitride) substrates, supplementing our existing capabilities in CMP cleans, filtration and applications, which now reports into our SCEM division.
5
In 2019, we acquired Digital Specialty Chemicals Limited (DSC), a Toronto, Canada-based provider of advanced materials to the specialty chemical, technology, and pharmaceutical industries, and MPD Chemicals (MPD), a provider of advanced materials to the specialty chemical, technology, and life sciences industries, which each report into the SCEM division, to grow and diversify our engineered materials portfolio. Also in 2019, we acquired Hangzhou Anow Microfiltration Co., Ltd. (Anow), a filtration company for diverse industries including semiconductor, pharmaceutical, and medical, which reports into the MC division, which brought new polymeric membrane technologies and liquid filtration offerings to our portfolio, and also provided us with additional infrastructure to manufacture filtration products in the Asia region. In June 2018, we acquired from SAES Getters S.p.A. the SAES Pure Gas business, a leading provider of high-capacity gas purification systems used in semiconductor manufacturing and adjacent markets, which now reports into our Microcontamination Control division, enabling us to offer a broad portfolio of gas purifications solutions for both bulk and specialty gases to our customers. In January 2018, we acquired Particle Sizing Systems, LLC, a company focused on particle sizing instrumentation for liquid applications in both semiconductor and life science industries, which enables customers to perform particle size analysis online and in real time, directly in fluid stream process, preventing costly yield excursions. In April 2017, we acquired the water and chemical filtration product line for microelectronics applications from W. L. Gore & Associates, Inc., or Gore, where we acquired a synergistic product line that leverages our existing platform and expands our served markets. Our 2014 acquisition of ATMI, Inc., or ATMI, brought a whole new portfolio of technologies and materials products to serve our semiconductor customers. Further, as the dynamics of the markets that we serve shift, we will reevaluate our existing businesses and may decide to restructure or replace one or more businesses, such as the sale of our small cleaning business in France sold in 2018. Finally, we are continuously evaluating opportunities for strategic alliances, such as our strategic alliance with Enthone, joint development programs and collaborative marketing efforts with key customers and other industry leaders. For example, in connection with our strategic commitment to support the growing semiconductor and related microelectronics industries in China, in 2017, we entered into agreements with local partners to expand our capability to manufacture our specialty chemical and deposition products locally and shorten our supply chain for our customers in China.
OUR SEGMENTS
Our business is organized and operated in three segments which align with the key elements of the advanced semiconductor manufacturing ecosystem: Specialty Chemicals and Engineered Materials, or SCEM; Microcontamination Control, or MC; and Advanced Materials Handling, or AMH. We leverage our expertise from these three segments to create new and increasingly integrated solutions for our customers. The following is a detailed description of our three segments:
SPECIALTY CHEMICALS AND ENGINEERED MATERIALS SEGMENT
The SCEM segment provides high-performance and high-purity process chemistries, gases, and materials that enable enhanced device performance. These materials are utilized in critical semiconductor manufacturing processes such as deposition, cleaning, and integration of complex materials. Advanced materials, delivered at high purity, are critical to enabling the performance of leading-edge logic and memory applications. We believe the growing demand in the 3D-NAND market, challenges with metallization schemes and the need for specialized cleaning solutions will drive consumption for materials in our SCEM segment. In conjunction with products from our MC and AMH segments, the materials in our SCEM segment provide unique solutions to safely and efficiently deliver critical materials to support semiconductor and other advanced manufacturing processes.
Specialty Gas Products. Our specialty gas solutions provide advanced safety and process capabilities to semiconductor, display and solar panel manufacturers. Our SDS cylinders store and deliver hazardous gases, such as arsine, phosphine, germanium tetrafluoride and boron trifluoride, at sub-atmospheric pressure through the use of our proprietary carbon-based adsorbent materials. These products minimize potential leaks during transportation and use and allow more gas to be stored in the cylinder, features which provide significant safety, environmental and productivity benefits over traditional high-pressure cylinders. New generations of SDS products further increase the gas storage capacity, reducing tool down time, therefore, resulting in significant cost savings for our customers. We also offer VAC, a complementary technology to SDS, where select implant gases and gas mixtures are stored under high pressure but delivered sub-atmospherically.
Specialty Materials Products. Our specialty materials include specialized graphite, silicon carbide, thermally conductive foam and a variety of unique, high purity coatings for dry or plasma etch, chemical vapor deposition and ion implant applications. Our POCO® premium graphite is used to make precision consumable electrodes for electrical discharge machining, hot glass contact materials for glass product manufacturing and forming, and other consumable products for various industrial applications, including aerospace, optical, medical devices, air bearings and printing. Our high-performance specialty coatings, such as our Pegasus™ and our latest development Cearus™ coatings, provide erosion resistance, minimize particle generation and prevent contamination on critical components in semiconductor environments and other high-technology manufacturing operations. Our specialty materials provide customized solutions for applications challenged with unique temperature, corrosive, chemical or process environments, such as electrostatic chucks used to hold wafers during processing, plasma etch chamber components, aircraft bearings, and ultrasonic transducers.
6
Advanced Deposition Materials Products. Our advanced deposition materials include advanced liquid, gaseous and solid precursors which are incorporated in chemical vapor deposition (CVD) and atomic layer deposition (ALD) processes by the semiconductor industry, including organometallic precursors for the deposition of tungsten, titanium, cobalt and aluminum containing films and organosilane precursors for the deposition of silicon oxide and silicon nitride films. These precursors are designed in close collaboration with OEM process tool manufacturers as well as device makers to produce application specific solutions that are compatible with complex integrations of material solutions used to build the semiconductor device. We expanded our advanced deposition materials offerings and capabilities through our acquisitions of MPD and DSC. We offer containers that allow for reliable storage and delivery of low volatility solid and liquid precursors required in ALD processes. When combined with our proprietary corrosion-resistant coatings and filtration solutions from our MC segment, our advanced deposition materials enable the industry’s highest purity levels, resulting in improved device performance.
Surface Preparation and Integration Products. We offer a range of materials used to prepare the surface of a semiconductor wafer during the manufacturing process and to integrate with materials being used on the wafer. We also provide advanced plating solutions, such as our Viaform® product (a trademark of and exclusively licensed from Element Solutions, Inc.), which includes inorganic and proprietary organic molecules that provide the wiring for copper interconnects. We also offer CMP cleaning solutions for applications such as semiconductor post-etch residue removal, wafer etching, organics removal, negative resist removal, edge bead removal, and corrosion prevention. Our wet chemistries solutions, combined with filtration solutions from our MC segment and fluid handling solutions from our AMH segment, provide enhanced purity, which results in improvements in our customers’ processes. Our consumable PVA roller brush products are used to clean the wafer following the CMP process, and our pad conditioners, based on our silicon carbide capabilities, lengthen CMP pad life.Through the acquisition of Sinmat, we offer slurry products used for polishing ultra-hard surface materials, including SiC (silicon carbide) and GaN (gallium nitride) substrates, which are substrates utilized in the power electronics and advanced communications end-markets.
Specialty Chemicals. Our specialty chemicals include advanced liquid and solid materials, which are used in a range of high-performance material applications ranging from medical devices to materials used in semiconductor applications. Major areas of product solutions include organometallic and organosilane materials used in semiconductor device manufacturing, monomers and polymers used in the manufacture of medical devices, polyolefin catalysts used in the manufacture of polyethene and polypropylene, chromic materials used in security dyes and inks, isotopically labeled materials used in clinical diagnostics, and a range of materials used in the manufacture of approved pharmaceutical ingredients. In addition, our special chemicals business provides materials to a number of our other businesses to enable advanced performance of final product solutions.
MICROCONTAMINATION CONTROL SEGMENT
The MC segment offers solutions to purify critical liquid chemistries and gases used in semiconductor manufacturing processes and other high-technology industries. The design and performance of our liquid and gas filtration and purification products are important to the semiconductor manufacturing process because they remove contamination and directly reduce defects and improve manufacturing yield. Our proprietary filters remove organic and inorganic nanometer-sized contaminants from the different fluids and gases used in the manufacturing process, including photolithography, deposition, planarization and surface etching and cleaning. As our customers leverage leading-edge lithography tools and multi-patterning technology to enable each subsequent generation of products, our filtration and purification products are utilized to achieve necessary levels of purity and contamination control. We believe demand for purification and filtration products is being driven by the continuous node shrink in logic semiconductors and the ramp in the 3D-NAND market, as the risk of yield loss grows with the incremental manufacturing steps needed for the production of these devices. We utilize expertise from the AMH segment in polymer science and from the SCEM segment in chemical manufacturing to develop differentiated filtration and purification solutions for our customers.
Liquid Microcontamination Control Products. We offer a variety of products that control contaminants in our customers’ liquid processes. For example, our Torrento® series of filters is used for the filtration of aggressive acid and base chemistries for both semiconductor fabs as well as specialty chemical manufacturers including our SCEM segment. Manufacturers of high purity chemicals as well as semiconductor fabs use our Trinzik® products for the filtration of chemicals and ultra-pure water. Our Impact® series of filters are used in point-of-use photochemical dispense applications, including those provided by our AMH segment, where the delivery of superior flow rate performance and reduced microbubble formation is critical. In addition, we broadened our membrane and liquid filtration offerings serving semiconductor, pharmaceutical, and medical applications with the acquisition of Anow.
Gas Microcontamination Control Products. We offer a broad portfolio of products designed to remove particulate and molecular contaminates from gas streams from the point of creation on the gas pads to the point-of-use at the wafer in semiconductor, flat panel display and LED fabs. In addition, we provide products used to eliminate airborne molecular contamination from critical process tool areas or cleanrooms in the fab. Our Wafergard® gas filters reduce outgassing and
7
remove particle contamination. Our GateKeeper® gas purifiers and large facility-wide gas purification systems provide continuous purified gas supply to customer fabs by chemically reacting and absorbing contaminants, effectively removing gaseous contaminants down to part-per-trillion levels. Our Chambergard™ gas diffusers provide semiconductor equipment manufacturers with the capability to rapidly vent their tools to atmosphere to dramatically reduce process cycle times without adding particles to the wafers. These products are used in, or alongside, critical processing tools to improve yield and reduce tool downtime. In addition, we provide filters used to eliminate airborne molecular contamination from critical process tool areas or cleanrooms in the fab, improving process yield.
ADVANCED MATERIALS HANDLING SEGMENT
The AMH segment develops solutions to monitor, protect, transport, and deliver critical liquid chemistries, wafers and substrates for a broad set of applications in the semiconductor industry and other high-technology industries. These systems and products improve our customers’ yields by protecting wafers from abrasion, degradation and contamination during manufacturing and transportation and by assuring the consistent, clean and safe delivery of advanced chemicals from the chemical manufacturer to the point-of-use in the semiconductor fab. The construction of advanced semiconductor fabs drives demand for our wafer handling and fluid handling products. As those fabs move into production, we see demand for wafer carrying and fluid containment solutions offered by this segment. The AMH segment collaborates closely with the semiconductor chemical manufacturers segment in developing products that are compatible with advanced chemistries to enhance yield, and integrates liquid filtration technology from our MC segment to deliver consistent and pure chemistry.
Wafer Solutions. We lead the market with our high-volume line of Ultrapak® and Crystalpak® products for wafers ranging from 100 to 200 mm, which ensure the clean and secure transport of wafers from the wafer manufacturers to the semiconductor fab. We also offer a front-opening shipping box, or FOSB, for the transportation and automated interface of 300 mm wafers. We lead the market for 300mm front opening unified pods, or FOUPs, wafer transport and process carriers, and standard mechanical interface pods, or SMIF pods, for 200mm wafer applications. These microenvironment products safely and accurately deliver wafers within the semiconductor fab environment to the various process fabrication steps. We are a leader in reticle protection products for photolithography. This includes products that protect the high-value EUV (extreme ultraviolet) lithography masks during both the mask manufacturing process and their use in the semiconductor fab.
Chemical Containers. We have a broad portfolio of flexible and rigid polymer packaging and container products, from low-volume containers to transport high-value photoresist chemistries, such as our NOWPak® products, to large intermediate bulk containers (IBCs) to safely and efficiently transport chemicals in bulk, such as our FluoroPure® products. Our connection systems provide for safe and efficient chemical dispense from the container in the fab. Chemical companies utilize our packaging products to ensure the purity of chemistries shipped to semiconductor fabs, resulting in enhanced yields.
Fluidics. We are a leader in high-purity fluid transfer products such as valves, fittings, tubing, pipe, custom fabricated products and associated connection systems, such as our PrimeLock® connections, for high-purity chemical applications and our proprietary digital flow control technology improving the uniformity of chemicals applied on wafers. Our IntelliGen® integrated, high-precision liquid dispense systems enable the uniform application of advanced chemistries during the wafer fabrication process, integrating our valve control expertise with filter device technologies from our MC segment, so that filtering and dispensing of photochemicals can occur at different rates, conserving high-value chemistry and reducing defects on wafers. Our comprehensive product lines provide our semiconductor manufacturers, process tool makers and chemical customers with a single-source provider for their high-purity chemical management needs throughout the manufacturing process.
Particle Sizing Instrumentation. We build instrumentation for high-resolution and high-concentration particle counters that use Single Particle Optical Sizing (SPOS) technology to accurately determine particle size and counts. We also produce on-tool process monitoring systems that perform automated online particle size and/or counts analysis of suspensions. These applications include real-time monitoring of CMP slurries and other instrumentation for liquid applications in both semiconductor and life science industries.
OUR CUSTOMERS AND MARKETS
Our most significant customers include semiconductor device manufacturers, semiconductor equipment makers, gas and chemical manufacturing companies, leading wafer grower companies and manufacturers of high-precision electronics. We also sell our products to flat panel display equipment makers, materials suppliers and panel manufacturers, and manufacturers of hard disk drive components and devices.
Our other high-technology markets include manufacturers and suppliers in the solar and life science industries, electrical discharge machining customers, glass and glass container manufacturers, aerospace manufacturers and manufacturers of biomedical implantation devices.
8
In 2019, 2018 and 2017, net sales to our top ten customers accounted for 43%, 44% and 47%, respectively, of combined net sales. In 2019, 2018 and 2017, Taiwan Semiconductor Manufacturing Company Limited, accounted for $187 million, $154 million and $168 million of net sales, respectively, or approximately 12%, 10% and 13% of our net sales, respectively, including sales from each of our three reporting segments. In addition, in 2019, 2018, and 2017, Samsung Electronics Co. accounted for $128 million, $164 million and $141 million of net sales, respectively, or approximately 8%, 11% and 10% of our net sales, respectively, including sales from all of the Company’s segments, respectively. International net sales represented 76%, 78% and 79%, respectively, of total net sales in 2019, 2018 and 2017. Approximately 3,100 customers purchased products from us during 2019.
We may enter into supply agreements with our customers. These agreements generally have a term of one to three years, but do not contain any long-term purchase commitments. Instead, we work closely with our customers to develop non-binding forecasts of the future volume of orders. However, customers may cancel their orders, change production quantities from forecasted volumes or delay production for a number of reasons beyond our control.
SALES, MARKETING AND SUPPORT
We sell our products worldwide, primarily through our direct sales force and strategic independent distributors located in all major semiconductor markets. Independent distributors are also used in other semiconductor market territories and for specific market segments. As of December 31, 2019, our sales and marketing force consisted of approximately 500 employees worldwide.
Our unique capabilities and long-standing industry relationships have provided us with the opportunity for significant collaboration with our customers at the product design stage, which has facilitated our ability to introduce new materials and new solutions that meet our customers’ needs. We are constantly seeking to identify for our customers a variety of materials, purification and process control challenges that may be addressed by our product solutions. Our sales representatives provide our customers with worldwide technical support and information about our products and materials.
We believe that our technical support services are important to our sales and marketing efforts. These services include assisting in defining a customer’s needs, evaluating alternative products and materials, designing a specific system to perform the desired operation, training users and assisting customers in compliance with relevant government regulations. Additionally, our field application engineers, located in all of the major markets we serve, work directly with our customers on product qualification and process improvements in their facilities. We maintain a network of service centers, applications laboratories and technology centers located in all key markets internationally and in the United States to support our products and our customers with their advanced development needs, provide local technical service and ensure fast turnaround time.
COMPETITION
The market for our products is highly competitive. While price is an important factor, we compete primarily on the basis of the following factors:
technical expertise; | breadth of product line; |
product quality and performance; | breadth of geographic presence; |
advanced manufacturing capabilities; | customer service and support; and |
total cost of ownership; | after-sales service. |
historical customer relationships; | |
We believe that we compete favorably with respect to the factors listed above. We believe that our key competitive strengths include our broad product line, our strong research and development infrastructure and investment, our manufacturing excellence, our advanced quality control systems, the low total cost of ownership of our products, our ability to provide our customers with quick order fulfillment and our applications expertise in semiconductor manufacturing processes. However, our competitive position varies depending on the market segment and specific product areas within these segments. While we have longstanding relationships with a number of semiconductor and other electronic device manufacturers, we still face significant competition from companies that also have longstanding relationships with other semiconductor and electronic device manufacturers and, as a result, have been able to have their products specified by those customers for use in manufacturers’ fabrication facilities.
The competitive landscape is varied, ranging from large multinational companies to small regional or regionally-focused companies. While product quality and technology remain critical, overall, industry trends are indicating a shift to localized, cost-competitive and consolidated supply chains.
9
Because of the unique breadth of our capabilities, we believe that there are no global competitors that compete with us across the full range of our product offerings. Many of our competitors are local companies that participate in only a few products or in specific geographies. While there are other larger, broad-based materials suppliers, many are concentrated in specific product areas, such as filtration, specialty chemicals or materials handling. Notable competitors with respect to certain specific product areas include Pall Corporation (part of Danaher Corporation), Shin-Etsu Polymer Co., Ltd., Gemu Valves, Inc., Tokyo Keiso Co., Ltd., Mersen, the EMD Performance Materials division of Merck KGaA, E. I. du Pont de Nemours, Company, The Dow Chemical Company, Air Liquide, Praxair, Inc. (a subsidiary of Linde plc.), Donaldson Company, Inc. and Parker Hannifin Corp.
ENGINEERING, RESEARCH AND DEVELOPMENT
We believe that technology is important to the success of our businesses, and we plan to continue to devote significant resources to engineering, research and development (ER&D), balancing efforts between shorter-term market needs and longer-term investments. As of December 31, 2019, we had approximately 800 employees in engineering, research and development. We have supplemented and may continue to supplement our internal research and development efforts by licensing technology from third parties and/or acquiring rights with respect to products incorporating externally owned technologies. Our R&D expenses consist of personnel and other direct and indirect costs for internally funded project development, including the use of outside service providers.
We believe we have a rich pipeline of development projects. For example, our engineering, research and development efforts have been focusing on growth opportunities in areas such as bulk photochemical filtration, new boron mixtures for ion implant, new precursors for deposition, specialty coatings for key applications and new cleans chemistries. Our engineering, research and development efforts are directed toward developing and improving our technology platforms for semiconductor and advanced processing applications and identifying and developing products for new applications, often working directly with our customers to address their particular needs.
We have engineering, research and development capabilities in California, Colorado, Connecticut, Massachusetts, Minnesota, Texas, Canada, China, Japan, South Korea, Taiwan, Singapore and Malaysia to meet the global needs of our customers. We use sophisticated methodologies to research, develop and characterize our materials and products. Our capabilities to test and characterize our materials and products are focused on continuously reducing risks and threats to the integrity of the critical materials that our customers use in their manufacturing processes.
We participate in Semiconductor Equipment and Materials International (SEMI®), an association of semiconductor equipment suppliers, and we also collaborate with leading universities and industry consortia, such as the University of California and the Interuniversity Microelectronics Centre (imec®). We undertake this work to extend the reach of our internal R&D and to gain access to leadership ideas and concepts beyond the time horizon of our internal development activities.
PATENTS AND OTHER INTELLECTUAL PROPERTY RIGHTS
As of December 31, 2019, we own approximately 2,330 active patents worldwide, of which about 630 are United States patents. Additionally, we owns about 1,040 pending patent applications globally. In addition, we license certain patents owned by third parties. We rely on a combination of patent, copyright, trademark and trade secret laws and license agreements to establish and protect our proprietary rights. We seek to refresh our intellectual property on an ongoing basis through continued innovation. While we license and expect to continue to license technology used in the manufacture and distribution of products from third parties, we do not consider any particular patent or license to be material to our business.
We vigorously protect and defend our intellectual property. We require each of our employees, including our executive officers, to enter into agreements pursuant to which the employee agrees to keep confidential all of our proprietary information and to assign to us all inventions made during the course of employment. We also require outside scientific collaborators, sponsored researchers, and other advisors and consultants who are provided confidential information to execute confidentiality agreements. These agreements generally provide that all confidential information developed or made known to the entity or individual during the course of the entity’s or individual’s relationship with the Company is to be kept confidential and not disclosed to third parties except in specific limited circumstances.
MANUFACTURING
Our customers rely on our products and materials to ensure the integrity of the critical materials used in their manufacturing processes by providing purity, cleanliness, consistent performance, dimensional precision and stability. Our ability to meet our customers’ expectations, combined with our substantial investments in worldwide manufacturing capacity, position us to respond to the increasing demands from our customers for yield-enhancing materials and solutions.
10
To meet our customers’ needs worldwide, we have established an extensive global manufacturing network with facilities in the United States, Canada, Japan, Taiwan, Malaysia, South Korea and China. Because we work in an industry where contamination control is paramount, we maintain Class 100 to Class 10,000 cleanrooms for manufacturing and assembly. We believe that our worldwide advanced manufacturing capabilities are important competitive advantages. These include:
engineered polymer conversion and processing; | specialty coating capabilities; |
advanced membrane modification and cleaning; | solids and powders compounding and handling; |
chemical distillation, synthesis and purification; | graphite synthesis; |
gas delivery systems; | blow molding; |
high-purity gas handling and transfilling; | rotational molding; |
high-purity materials packaging; | machining; and |
membrane casting; | assembly. |
cartridge manufacturing and assembly; | |
We have made significant investments in systems and equipment to create innovative products and tool designs, including metrology and 3D printing capabilities for rapid analysis and production prototype of products. In addition, we use contract manufacturers for certain of our gas purification systems and certain electronic materials products both in the U.S. and Asia.
RAW MATERIALS
Our products are made from a wide variety of raw materials that are generally available from multiple sources of supply. However, while we seek to have several sources of supply for raw materials, certain materials included in our products, such as certain filtration membranes in our MC segment, petroleum coke and specialty and commodity chemicals in our SCEM segment and polymer resins in our AMH segment, are obtained from a single source or a limited group of suppliers or from suppliers in a single country. We have entered into multi-year supply agreements with a number of suppliers for the purchase of raw materials in the interest of supply assurance and to control costs.
GOVERNMENTAL REGULATION
Our operations are subject to federal, state and local regulatory requirements relating to environmental, waste management and health and safety matters, including measures relating to the release, use, storage, treatment, transportation, discharge, disposal and remediation of contaminants, hazardous substances and wastes, as well as practices and procedures applicable to the construction and operation of our plants. Although some risk of costs and liabilities related to these matters is inherent in our business, as with many similar businesses, we believe that our business is operated in substantial compliance with applicable regulations. However, new, modified or more stringent requirements or enforcement policies could be adopted, which could adversely affect us. While we expect that capital expenditures will be necessary to ensure that any new manufacturing facility is in compliance with environmental and health and safety laws, we do not expect these expenditures to be material.
EMPLOYEES
As of December 31, 2019, we had approximately 5,300 employees. Given the variability of business cycles in the semiconductor industry and the quick response time required by our customers, it is critical that we be able to quickly adjust the size of our production staff to maximize efficiency. Therefore, we use skilled temporary labor as required.
None of our employees are represented by a labor union or covered by a collective bargaining agreement other than statutorily mandated programs in certain European countries.
OUR HISTORY
The Company was incorporated in Delaware on March 17, 2005 in connection with a merger between Entegris, Inc., a Minnesota corporation, and Mykrolis Corporation, a Delaware corporation. On April 30, 2014, the Company acquired ATMI, based in Danbury, CT. Entegris has been helping its customers solve their critical materials challenges and enhance their manufacturing yields for over 50 years, tracing its corporate origins back to Fluoroware, Inc., which began operating in 1966.
AVAILABLE INFORMATION
Our Internet address is www.entegris.com. On this web site, under the “Investors-Financial Information-SEC Filings” section, we post the following filings as soon as reasonably practicable after they are electronically filed with, or furnished to, the U.S. Securities and Exchange Commission (SEC): our annual, quarterly, and current reports on Forms 10-K, 10-Q, and 8-K; our proxy statements; any amendments to those reports or statements, and Form SD. All such filings are available on our web site
11
free of charge. The SEC also maintains a web site (www.sec.gov) that contains reports, proxy and information statements, and other information regarding issuers that file electronically with the SEC. The content on our website, and any other website, as referred to in this Form 10-K is not incorporated by reference into this Form 10-K unless expressly noted.
12
Item 1A. Risk Factors.
In addition to the other information in this Annual Report on Form 10-K, the following risk factors should be carefully considered in evaluating us and our common stock. Any of the following risks, many of which are beyond our control, could materially and adversely affect our financial condition, results of operations or cash flows, or cause our actual results to differ materially from those projected in any forward-looking statements. We may also face other risks and uncertainties that are not presently known, are not currently believed to be material, or are not identified below because they are common to all businesses. Past financial performance may not be a reliable indicator of future performance and historical trends should not be used to anticipate results or trends in future periods. For more information, see “Cautionary Statement” in Item 7 of this Annual Report on Form 10-K.
Risks Related to Our Business and Industry
Declines in the semiconductor industry or worldwide economic conditions may cause demand for our products to decrease and may adversely affect our business.
Declines in industry or worldwide economic conditions may adversely affect our business. Our revenue is primarily dependent upon demand from semiconductor manufacturers, which is largely driven by the current and anticipated demand for electronic products that utilize semiconductors. Despite recent increases in demand for semiconductors in applications such as smartphones, cloud computing, the Internet of Things, and artificial intelligence, the semiconductor industry has historically been, and is likely to continue to be, highly cyclical with periodic significant downturns, resulting in significantly decreased demand for products such as ours. We have previously experienced significant revenue deterioration and operating losses due to severe downturns in the semiconductor industry, which often occur suddenly. The semiconductor industry is also affected by seasonal shifts in demand. We are unable to predict the timing, duration or severity of any future downturns in the semiconductor industry, and we could underperform the market or our peers.
During downturns and periods of soft demand, our revenue is reduced, and we typically experience greater pricing pressure and shifts in product and customer mix, which often adversely affect our gross margin and net income. Even moderate seasonality can cause our operating results to fluctuate significantly from one period to the next. Uncertain and volatile economic, political or business conditions in any of our key sales regions can cause or exacerbate negative trends in business and consumer spending and have historically impacted customer demand for our products. These conditions can cause material adverse changes in our results of operations and financial condition, including:
• | a decline in demand for our products, which, given our limited backlog, will have an immediate impact on our revenues; |
• | an increase in reserves for accounts receivable due to our customers’ inability to pay us; |
• | an increase in write-offs for excess or obsolete inventory that we cannot sell; |
• | greater challenges in forecasting operating results, making business decisions, and identifying and prioritizing business risks; and |
• | additional cost reduction efforts, including additional restructuring activities, which may adversely affect our ability to capitalize on opportunities. |
Furthermore, to remain competitive, we must maintain a satisfactory level of engineering, research and development, invest in our infrastructure and maintain the ability to respond to any increases in demand and, as a result, a lower volume of sales can have a large and disproportionate impact on our profitability.
The industries we serve are constantly evolving, and any failure to manage our business effectively during periods of rapid change may adversely affect our business performance and results of operations.
Intense competition in the semiconductor industry often leads to rapid changes in products and technology, and those changes can significantly alter demand for our products. Changes in demand may arise from factors such as advances in fabrication processes, new and emerging technologies, end-user demand, customers’ production capacity and customers’ capacity utilization. The amount and mix of spending on different products and solutions can have a significant impact on our results of operations.
We regularly reassess our allocation of resources in response to the changing business environment. To meet rapidly changing demand, we must accurately forecast demand for each of our products and effectively manage our resources and production capacity across our various businesses, and we may incur unexpected or additional costs to align our operations with demand. If we do not adequately adapt to changes in our business environment, we may lack the infrastructure and resources to scale up our business to meet customer expectations and compete successfully during a period of growth, or we may expand our capacity too rapidly, resulting in excess fixed costs. Even with effective allocation of resources and management of costs,
13
during periods of decreasing demand, our gross margins and earnings will usually be adversely impacted. Especially during transitional periods, resource allocation decisions can have a significant impact on our future performance, particularly if we have not accurately anticipated the correct mix of industry changes. Our success will depend, to a significant extent, on our management’s ability to identify and respond to these challenges effectively.
Our ability to increase sales of our products, particularly our capital equipment products, depends in part upon our ability in a very short timeframe to ramp up our manufacturing capacity and to mobilize our supply chain. If we are unable to expand our manufacturing capacity on a timely basis, manage the expansion effectively and obtain larger quantities of raw materials, our customers could obtain such products from our competitors, which would reduce our market share. Additionally, we typically operate our business on a just-in-time shipment basis with a modest level of inventory, ordering supplies and planning production based on internal demand forecasts. The failure to accurately forecast demand for our products, in terms of both volume and product type, has in the past led to, and may in the future lead to, delays in product shipments and disappointment of customer expectations, as well as an increased risk of excess and obsolete inventory.
Our revenues and operating results are variable.
Our revenues and operating results may fluctuate significantly from quarter to quarter or year to year due to a number of factors, many of which are outside our control. We manage our expenses based in part on our expectations of future revenues. Because some of our expenses are relatively fixed in the short term, a change in the timing of revenue or the amount of profit we generate from a small number of transactions can unfavorably affect operating results in a particular period. Factors that may cause our financial results to fluctuate unpredictably include:
• | economic conditions in the semiconductor industry; |
• | the size and timing of customer orders; |
• | consolidation of our customers could impact their purchasing decisions and negatively affect our revenues; |
• | procurement shortages; |
• | the failure of our suppliers or outsource providers to perform their obligations; |
• | manufacturing difficulties; |
• | customer cancellations of or delays in shipments, installations or customer acceptances; |
• | our customers’ rate of replacement of our consumable products; |
• | changes in average selling prices, customer mix, and product mix; |
• | our ability to develop, introduce, and market new, enhanced, and competitive products in a timely manner; |
• | our competitors’ introduction of new products; |
• | legal or technical challenges to our products or technologies; |
• | disruptions in transportation, communication, demand, information technology, or supply, including strikes, acts of God, wars, terrorist activities, and natural or man-made disasters; |
• | legal, tax, accounting, or regulatory changes (including changes in import/export regulations and tariffs) or changes in the interpretation or enforcement of existing requirements; |
• | changes in our estimated tax rate; and |
• | foreign currency exchange rate fluctuations. |
We depend on single and limited source suppliers and an interruption in our ordinary sources of supply could affect our ability to manufacture our products and have an adverse effect on our results of operations.
We rely on single or limited source suppliers for raw materials, such as plastic polymers, filtration membranes, petroleum coke and other materials, which are critical to the manufacturing of our products. If we were to lose any one of these sources, it could be difficult for us to find an alternative supplier and we would need to qualify this new source through our customers’ rigorous qualification processes. Although we seek to reduce our dependence on sole and limited source suppliers, the partial or complete loss of any of these sources could interrupt our manufacturing operations and result in a material adverse effect on our results of operations.
At times, we have experienced a limited supply of certain raw materials, which has resulted in delays, lost revenue, increased costs and risks associated with qualifying products made from such new raw materials with our customers. Events such as an industry-wide increase in demand for, or the discontinuation of, raw materials used in our products could harm our ability to
14
acquire sufficient quantities and our manufacturing operations may be interrupted. For example, in 2019, we experienced a disruption in the supply of certain ceramic material for use in our coatings business in our SCEM division when the supplier was unable to produce these materials at the required specifications. In response, we worked collaboratively with the supplier to determine the root cause and to solve the manufacturing issue, reestablishing the supply of these materials. Although we were able to reestablish our supply of this raw material, we may be unable to do so in the future or with other raw materials, in which case raw materials shortages may adversely affect our operations. Additionally, our suppliers may not have the capacity to meet increases in our demand for raw materials, in turn, making it difficult for us to meet demand from our customers. Furthermore, prices for our raw materials can vary widely. While we have long-term arrangements with certain key suppliers that fix our price for the purchase of certain raw materials, if the cost of our raw materials increases and we are unable to correspondingly increase the sales price of our products or find other cost savings, our profit margins will decline.
We are exposed to the risks of operating a global business as a significant amount of our sales and manufacturing activity occur outside the United States.
Sales to customers outside the United States accounted for approximately 76%, 78% and 79% of our net sales in 2019, 2018 and 2017, respectively. We anticipate that international sales will continue to account for a majority of our net sales. In addition, a number of our key domestic customers derive a significant portion of their revenues from sales in international markets. We also manufacture a significant portion of our products outside the United States and are dependent on international suppliers for many of our parts and raw materials. We intend to continue to pursue opportunities in both sales and manufacturing internationally. Our international operations are subject to a number of risks and potential costs that could adversely affect our revenue and profitability, including:
• | unanticipated government actions, laws, rules, regulations and policies, such as “trade wars,” tariffs, sanctions or other changes in international trade requirements that affect our business and that of our customers and suppliers, any of which that could impose additional costs on our operations, and limit our ability to operate our business; |
• | challenges in hiring and integrating workers in different countries; |
• | challenges in managing a diverse workforce with different experience levels, languages, cultures, customs, business practices and worker expectations, along with differing employment practices and labor issues; |
• | challenges of maintaining appropriate business processes, procedures and internal controls and complying with legal, environmental, health and safety, anti-bribery, anti-corruption and other regulatory requirements that vary by jurisdiction; |
• | challenges in developing relationships with local customers, suppliers and governments; |
• | fluctuating pricing and availability of raw materials and supply chain interruptions; |
• | expense and complexity of complying with U.S. and foreign import and export regulations, including the ability to obtain required import and export licenses; |
• | fluctuations in interest rates and currency exchange rates, including the relative strength or weakness of the U.S. dollar against foreign currency including Japanese yen, euro, Taiwanese dollar, Korean won, Chinese yuan, Singapore dollar or Malaysian ringgit, which could cause our sales and profitability to decline; |
• | liability for foreign taxes assessed at rates higher than those applicable to our domestic operations; |
• | customer or government efforts to encourage operations and sourcing in a particular country, such as Korea and China, including efforts to develop and grow local competitors, requiring local manufacturing, and providing special incentives to government-backed local customers to buy from local competitors, even if their products are inferior to ours; and |
• | political and economic instability and uncertainty, which may result in severely diminished liquidity and credit availability, rating downgrades of sovereign debt, declining valuation of certain investments, declines in consumer confidence, declines in economic growth, and volatility in unemployment rates, and uncertainty about economic stability. |
In the past, these factors have disrupted our operations and increased our costs, and we expect that these factors will continue to do so in the future.
Tariffs, trade restrictions and other protectionist measures resulting from international trade disputes or strained international relations could have an adverse impact on our operations.
15
Tariffs, export controls, additional taxes, trade barriers or sanctions, particularly those arising or that may arise out of U.S.-China relations, may increase costs of raw materials and our manufacturing costs, decrease margins, reduce the competitiveness of our products, or inhibit our ability to sell products or purchase necessary equipment and supplies, which could have a material adverse effect on our business, results of operations, or financial conditions. For example, effective October 30, 2018, the U.S. Department of Commerce restricted exports to a Chinese semiconductor manufacturing company and may impose further restrictions on this or other semiconductor manufacturers or industry participants. In 2019, U.S. and China implemented several rounds of tariff increases and retaliations. Also in 2019, trade tensions between Japan and Korea resulted in trade restrictions on several chemicals sold from Japan to Korea that are used in the production of advanced semiconductors. While these particular events did not have a direct material adverse effect on our revenue, other restrictions could impact our ability to serve customers in the regions in which we operate, which could reduce our revenue. In addition, the importation of gas canisters and chemicals viewed as dangerous has come under increased regulatory scrutiny by governmental officials in China. As a result, we have established partnerships with local suppliers. However, this increased regulation may impair the ability of our SCEM segment to import those products into China and may cause us to lose sales. Furthermore, there have historically been strained relations between China and Taiwan, Japan and Korea and there are continuing tensions between North Korea and other countries, including South Korea and the United States. Any adverse developments in those relations could significantly disrupt the worldwide production of semiconductors, which may lead to reduced sales of our products.
A significant amount of our sales is concentrated on a limited number of key customers and, therefore, our net sales and profitability may materially decline if we lost one or more of these customers.
Sales to a limited number of large customers constitute a significant portion of our overall revenue, shipments, cash flows, collections, and profitability. Our top ten customers accounted for 43%, 44% and 47% of our net sales in 2019, 2018 and 2017, respectively. Our customers could stop using our products in their manufacturing processes with limited advance notice to us and we would have limited or no contractual remedy for them doing so. The cancellation, reduction or deferral of purchases of our products by even a single customer could significantly reduce our revenues in any particular quarter. If we were to lose any of our significant customers, if our products are not specified for these customers’ products or production processes, or if we suffer a material reduction in their purchase orders, our revenue could decline and our business, financial condition and results of operations could be materially and adversely affected. Due to the long design and development cycle and lengthy customer product qualification periods required for most of our new products, we may be unable to replace these customers quickly, if at all.
Furthermore, the semiconductor industry has been undergoing, and is expected to continue to undergo, consolidation. If any of our customers merge or are acquired, we may experience lower overall sales from the merged or combined companies. In addition, our principal customers also hold considerable purchasing power and may be able to negotiate sales terms that result in decreased pricing, increased costs, and/or lower margins for us, and limitations on our ability to share jointly developed technology with others.
If we are unable to anticipate and respond to rapid technological change and customer requirements by continuing to innovate and introduce new and enhanced products and solutions, our business could be seriously harmed.
The semiconductor industry is subject to rapid technological change, changing customer requirements and frequent new product introductions. In our industry, the first company to introduce an innovative product meeting an identified customer need will often have a significant advantage over competing products. For this reason, we make significant cash expenditures to research, develop, engineer and market new products and make significant capital investments in technology and manufacturing capacity in advance of future business developing and without any purchase commitment from our customers. We incurred $121.1 million, $118.5 million and $107.0 million for engineering, research and development expense in 2019, 2018 and 2017, respectively, to support new product and technology development. Following development, it may take a number of years for sales of a new product to reach a substantial level, if ever. If a product concept does not progress beyond the development stage or only achieves limited acceptance in the marketplace, we may not receive a direct return on our expenditures, we may lose market share and our revenue and our profitability may decline. For example, in the past, we incurred significant impairment charges for capital expenditures relating to developing the capability to manufacture shippers and FOUPs for 450 mm wafers, for which major semiconductor manufacturers announced that they would not initiate manufacturing in the foreseeable future.
We believe that our future success will depend upon our ability to continue to develop mission-critical solutions to maximize our customers’ manufacturing yields and enable higher performance semiconductor devices. A failure to successfully anticipate and respond to technological changes by developing, marketing and manufacturing new products or enhancements to our existing products could harm our business prospects and significantly reduce our sales. For example, as 3D NAND technology advances to higher densities, the conventional process used to etch critical features no longer works. Recognizing the need for a new chemistry, we developed a series of prototype formulations for highly selective nitride etch and developed a specialized liquid filter to remove contaminants but maintain the critical components in the chemistry that make it function. While we
16
believe we are well positioned for selection as process-of-record for these certain etch processes and we are preparing for rapid, high-volume ramp once the final selection is made, we may not be selected by the customer and may not generate significant revenue from these solutions. We cannot assure you that the new products and technology we choose to develop and market in the ordinary course of our business will be successful. In addition, if new products have reliability or quality problems, we may experience reduced orders, higher manufacturing costs, delays in acceptance and payment, additional service and warranty expense, and damage to our reputation.
Competition from new or existing companies could harm our financial condition, results of operations and cash flow.
We operate in a highly competitive industry. Our competitors include many domestic and foreign companies, some of which have substantially greater manufacturing, financial, research and development, and marketing resources than we do. In addition, some of our competitors may have better-established customer relationships than we do, which may enable them to have their products specified for use more frequently and more quickly by these customers. We also face competition from smaller, regional companies, which focus on serving those customers in their same region. Another source of competition is from the manufacturing engineering teams of our customers, who continually evaluate the benefits of internal manufacturing versus outsourcing. If we are unable to maintain our competitive position, we could experience downward pressure on prices, fewer customer orders, reduced margins, the inability to take advantage of new business opportunities and a loss of market share, any of which could have a material adverse effect on our results of operations. Further, we expect that existing and new competitors will improve the design of their existing products and will introduce new products with enhanced performance characteristics. The introduction of new products or more efficient production of existing products by our competitors could diminish our market share and increase pricing pressure on our products.
We may acquire other businesses, form joint ventures or divest businesses, which could negatively affect our financial performance.
We intend to continue to engage in business combinations, acquisitions, joint ventures, investments or other types of collaborations to address gaps in our product offerings, adjust our business and product portfolio to meet our ongoing strategic objectives, diversify into complementary markets, increase our scale or accomplish other strategic objectives. These transactions involve numerous risks to our business, financial condition and operating results, including but not limited to:
• | experiencing difficulty in identifying suitable acquisition candidates and completing selected transactions at appropriate valuations, in a timely manner, on a cost-effective basis or at all, due to substantial competition for acquisition targets; |
• | inability to successfully integrate any acquisitions into our existing business operations; |
• | failure to realize the anticipated synergies or other benefits of any such transaction; |
• | entering into markets in which we have no or limited prior experience; |
• | finding acquirors and obtaining adequate value in connection with divesting businesses that no longer meet our objectives; |
• | inability to complete proposed transactions due to failure to obtain regulatory or other approvals; |
• | requirements imposed by government regulators in connection with their review of a transaction, which may include, among other things, divestitures and restrictions on the conduct of our existing business or the acquired business; |
• | undertaking multiple transactions at the same time in order to take advantage of acquisition opportunities that do arise, which could strain our ability to effectively execute and integrate such transactions; |
• | diversion of management’s attention from our day-to-day business due to dedication of significant management resources to such transactions; |
• | employee uncertainty and lack of focus during integration process that may also disrupt our business; |
• | the risk of litigation or claims associated with a proposed or completed transaction; |
• | challenges associated with managing new, more diverse and more widespread operations, projects and people, potentially located in regions where we have not historically conducted or operated our business; |
• | dependence on unfamiliar or less secure supply chains and inefficient scale of the acquired entity; |
• | despite our due diligence, we could assume unknown, underestimated or contingent liabilities, such as potential environmental, health and safety liabilities of the acquired company; |
• | an acquired technology or product may have inadequate or invalid intellectual property protection or may be subject to claims of infringement by a third party, which may result in lower than anticipated revenue or claims for damages; |
17
• | we could experience negative effects on our reported results of operations from dilutive results from operations and/or from future potential impairment of acquired assets, including goodwill, related to future acquisitions; |
• | an acquired company may have inadequate or ineffective internal control over financial reporting, disclosure controls and procedures, cybersecurity, privacy, environmental, health and safety, anti-bribery, anti-corruption, human resource, or other policies or practices; |
• | reductions in cash balances or increases in debt obligations to finance activities associated with a transaction, which reduce the availability of cash flow for general corporate or other purposes, including share repurchases and dividends; and |
• | difficulties in retaining key employees or customers of an acquired business. |
For example, an inability to realize the full extent of, or any of, the anticipated benefits of the Anow, MPD Chemical and DSC acquisitions we completed in 2019, as well as any delays encountered in the integration process, could have an adverse effect on our business and results of operations, which may adversely affect the value of the shares of our common stock.
Manufacturing interruptions or delays could adversely affect our business, financial condition and results of operations.
Our manufacturing processes are complex and require the use of expensive and technologically sophisticated equipment and materials. These processes are frequently modified to improve manufacturing yields and product quality. We have, on occasion, experienced manufacturing difficulties, such as critical equipment breakdowns or the introduction of impurities in the manufacturing process. Any future manufacturing difficulties could cause lower yields, make our products unmarketable and/or delay deliveries to customers. In addition, any modification to the manufacturing process of our products could require that the affected product be re-qualified by our customers, which can increase our costs and delay our ability to sell this product to our customers. These and other manufacturing difficulties may result in the loss of sales and exposure to warranty and product liability claims.
Some of our products are manufactured at only one or two facilities in different countries. A disruption at these facilities could impact sales of those products until another facility could commence or expand production of those products. We have in the past moved, and we may in the future move, the manufacture of certain products from one plant to another. If we fail to transfer and re-establish the manufacturing processes in the destination plant efficiently and effectively, we may not be able to meet customer demand, we may lose credibility with our customers and our business may be harmed. Even if we successfully move our manufacturing processes, we may not achieve any anticipated cost savings or efficiencies.
Our operations use hazardous materials, which expose us to various risks, including potential liability for personal injury and potential remediation obligations.
Our operations involve, and we are exposed to the risks associated with, the use and manufacture of hazardous materials. In particular, we manufacture specialty chemicals, which is inherently hazardous and may result in accidents, and store and transport hazardous raw materials, products and waste in, to and from various facilities. Potential risks which may disrupt our operations or expose us to significant losses and liabilities include explosions and fires, chemical spills and other discharges or releases of toxic or hazardous substances or gases, and pipeline and storage tank leaks and ruptures. Those hazards may result in liability for personal injury and loss of life, damage to property and contamination of the environment, suspension of operations, the imposition of civil or criminal fines, penalties and other sanctions, cleanup costs, claims by governmental entities or third-parties, reputational harm, increase in our insurance costs or otherwise adversely impact our results of operations. Moreover, a failure of one of our products at a customer site could interrupt the business operations of the customer. For example, while we believe that our SDS and VAC delivery systems are the safest available in the industry to transport, store and deliver toxic gases, any leakage could cause serious damage, including injury or death to any person exposed to those toxic gases, potentially creating significant product liability exposure for us. Our insurance may be inadequate to satisfy any such liabilities, and our financial results or financial condition could be adversely affected.
Loss of any of our key personnel could harm our business, and our inability to attract and retain new qualified personnel could inhibit our ability to operate and grow our business successfully.
Many of our key personnel have significant experience in the semiconductor industry and deep technical expertise. The loss of the services of any of our key employees or an inability to attract, train and retain qualified and skilled employees, specifically research and development and engineering personnel, could inhibit our ability to operate and grow our business successfully. As the semiconductor industry has experienced growth in recent years, competition among industry participants for qualified talent, particularly those with significant industry experience, has intensified. As a result, the difficulty and costs associated with attracting and retaining key employees has risen and may continue to rise.
If we fail to obtain, protect and enforce intellectual property rights, our business and prospects could be harmed.
18
Our future success and competitive position depend in part upon our ability to obtain, maintain and enforce intellectual property rights. We rely on patent, trade secret and trademark law to protect many of our major product platforms. Although we have filed applications for additional patents, our pending applications may not be approved. Moreover, any patents that we own or obtain may not provide us with any competitive advantage, and these patents may be challenged, invalidated, circumvented, rendered unenforceable or otherwise compromised by third parties. We may not develop additional proprietary technology. In addition, any failure to obtain intellectual property protection in the international jurisdictions we serve could expose us to increased competition, which could limit our growth and future revenue. Although we enter into confidentiality agreements with our employees and certain third parties to protect our proprietary information and technology, these agreements may be inadequate to protect our interests, and we may not have adequate remedies for any breach. Furthermore, third parties may be able to replicate or obtain our confidential and proprietary information and technology through lawful means, and they may also be able to design around our patents. Any weakness in our ability to protect our intellectual property could adversely affect our business, financial condition and results of operations.
Third parties may misappropriate our intellectual property rights, and disputes as to ownership of intellectual property rights may arise. We may institute litigation in order to enforce our patents, copyrights or other intellectual property rights, to protect our trade secrets, to determine the validity and scope of the proprietary rights of others or to defend against claims of infringement. Such litigation could result in substantial costs and diversion of resources and could negatively affect our sales, profitability and prospects regardless of whether we are able to successfully enforce our rights. For example, since 2015, we have had a pending litigation where we enforced our patent rights against Gudeng Precision Inc., Ltd. for their infringing acts related to reticle pods. We continue to vigorously defend our patents and rights, which will incur costs. We may initiate other costly patent litigation against our competitors or other third parties in order to protect and/or perfect our intellectual property rights. We cannot predict how any existing or future litigation will be resolved or what impact it may have on us.
Our commercial success also depends, in part, on our ability to avoid infringing or misappropriating any patents or other proprietary rights of third parties. If we infringe or misappropriate a third party’s patent or other proprietary rights, we could be required to pay damages to such third party, alter our products or processes, obtain a license from the third party or cease utilizing such proprietary rights, including making or selling products utilizing such proprietary rights. If we are required to obtain a license from a third party, we may be unable to do so on commercially acceptable terms or at all.
Our results of operations could be adversely affected by climate change, natural catastrophes or public health crises, in the locations in which we, our customers or our suppliers operate.
We have manufacturing and other operations in locations subject to severe weather and natural catastrophes, such as typhoons in Taiwan and China, earthquakes and tsunamis in Japan, hurricanes in east Texas (Hurricane Harvey) and in Florida (Hurricane Irma), each in 2017, wildfires in California in 2017 and 2018 and in Colorado in 2012 and flooding in Arkansas in 2019. Our suppliers and customers also have operations in locations exposed to similar dangers. A natural disaster could disrupt our operations, or our customers’ or suppliers’ operations and could adversely affect our results of operations and financial condition. Although we have continuity plans designed to mitigate the impact of natural disasters on our operations, those plans may be insufficient, and any catastrophe may disrupt our ability to manufacture and deliver products to our customers, resulting in an adverse impact on our business and results of operations. Also, climate change poses both regulatory and physical risks that could harm our results of operations or affect the way we conduct our businesses. For example, new or modified regulations could require us to spend substantial funds to enhance our environmental compliance efforts. In addition, our global operations expose us to risks associated with public health crises, such as pandemics and epidemics, which could harm our business and cause our operating results to suffer. For example, December 2019 and January 2020, an outbreak of a new strain of coronavirus in Wuhan, China has resulted in travel disruption and has effected certain companies’ operations in China. At this point, the extent to which the coronavirus may impact our results is uncertain.
We may be subject to information technology system failures, network disruptions and breaches in data security, which could damage our reputation and adversely affect our financial condition, results of operations and cash flows.
In the ordinary course of our business, we collect and store sensitive data, including our financial information, intellectual property, confidential information, proprietary business information and personally identifiable information of our employees and third parties, as well as similar information of our customers, suppliers and business partners. We maintain this information both in our data centers and on our networks. The secure processing, maintenance and transmission of this information is critical to our operations. All information systems are subject to disruption, breach or failure. While we have implemented network security procedures, virus protection software, intrusion prevention systems, access control, emergency recovery processes and internal control measures, we have experienced, and expect to continue to be subject to, cybersecurity threats and incidents ranging from employee error or misuse, to individual attempts to gain unauthorized access to our systems, to sophisticated and targeted measures known as advanced persistent threats. Despite our precautions, information technology system failures, network disruptions and breaches of data security could cause disruption in our operations, issues with customer communication and order management, the unintentional disclosure of sensitive information, the disruption in our
19
transaction processing or undermine the integrity of our disclosures controls and procedures and our internal control over our financial reporting, which could affect our reputation, result in significant liabilities and expenses, adversely affect our ability to report our financial results in a timely manner and could have a material adverse effect on our financial condition, results of operations and cash flows.
Moreover, new laws and regulations, such as the European Union’s General Data Protection Regulation that became effective in May 2018, and the California Consumer Privacy Act that became effective on January 1, 2019, add to the complexity of our compliance obligations, which increases our compliance costs, and a failure to comply with such laws and regulations could result in significant penalties.
We are subject to a variety of environmental laws and regulations that could cause us to incur significant liabilities and expenses.
Failure to comply with the wide variety of federal, state, local and non-U.S. regulatory requirements relating to the release, use, storage, treatment, transportation, discharge, disposal and remediation, of, and human exposure to, hazardous chemicals could result in future liabilities or the suspension of production or shipment. These requirements have tended to become stricter over time. For example, the Frank R. Lautenberg Chemical Safety for the 21st Century Act modified the Toxic Control Substances Act, or TSCA, by requiring the Environmental Protection Agency, or the EPA, to prioritize and evaluate the environmental and health risks of existing chemicals and provided the EPA with greater authority to regulate chemicals posing unreasonable risks. According to this statute, the EPA is required to make an affirmative finding that a new chemical will not pose an unreasonable risk before such chemical can go into production. As a result, TSCA has been updated so that it operates in a similar fashion to the Registration, Evaluation, and Authorization of Chemicals, or REACH, legislation in Europe. Regulations similar to REACH have been enacted in South Korea and Taiwan. These laws and regulations, among others, increase the complexity and costs of transporting our products from the country in which they are manufactured to our customers. Any further changes to these and similar regulations in the countries in which we operate or sell into could restrict our ability to expand, build or acquire new facilities, require us to acquire costly control equipment, cause us to incur expenses associated with remediation of contamination, cause us to modify our manufacture or shipping processes, or otherwise increase our cost of doing business and have a negative impact on our financial condition, results of operations and cash flows.
We are exposed to various risks from our regulatory environment.
We are subject to various risks related to new, different, inconsistent, or even conflicting laws, rules, and regulations that may be enacted by legislative or executive bodies and/or regulatory agencies in the countries where we operate; disagreements or disputes related to international trade; and the interpretation and application of laws, rules, and regulations. As a public company with global operations, we are subject to the laws of multiple jurisdictions and the rules and regulations of various governing bodies, including those related to export controls, financial and other disclosures, corporate governance, privacy, anti-corruption, such as the Foreign Corrupt Practices Act and other local laws prohibiting corrupt payments to governmental officials, conflict minerals or other social responsibility legislation, immigration or travel regulations, and antitrust regulations, among others. Each of these laws, rules, and regulations imposes costs on our business, including financial costs and potential diversion of our management’s attention associated with compliance, and may present risks to our business, including potential fines, restrictions on our actions, and reputational damage if we are unable to fully comply.
To maintain high standards of corporate governance and public disclosure, we intend to invest appropriate resources to comply with evolving standards. Changes in or ambiguous interpretations of laws, regulations, and standards may create uncertainty regarding compliance matters. Efforts to comply with new and changing regulations have resulted in, and are likely to continue to result in, increased administrative expenses and a diversion of management’s time and attention from revenue-generating activities to compliance activities. If we are found by a court or regulatory agency not to be in compliance with the laws and regulations, our business, financial condition, and/or results of operations could be adversely affected.
Changes in taxation or adverse tax rulings could adversely affect our results of operations.
We have facilities in many foreign countries and are subject to taxation at various rates and audit by multiple taxing authorities. Our results of operations could be affected by changes in tax rates or audits by the taxing authorities in the countries in which we operate or in the countries from which we purchase raw materials, changes in laws and regulations governing calculation and location of earned profit and taxation thereof, changes in laws and regulations affecting our ability to realize deferred tax assets on our balance sheet and changes in laws and regulations relating to the repatriation of cash into the United States. Each quarter we forecast our tax liability based on our forecast of our performance for the year in each tax jurisdiction. If our performance forecast changes, our forecasted tax liability would also likely change.
We have undertaken a number of complex internal reorganizations of our foreign subsidiaries in order to rationalize and streamline our foreign operations, focus our management efforts on certain local opportunities and take advantage of favorable business conditions in certain localities. Although we exercised diligence in undertaking these internal reorganizations, these reorganizations, or any future internal reorganization, could nonetheless result in adverse tax consequences in one or more tax
20
jurisdictions, which could adversely impact our profitability from foreign operations and result in a material reduction in our results of operations.
The U.S. Tax Cuts and Jobs Act of 2017, or the Tax Cuts and Jobs Act, significantly changed how the U.S. taxes corporations, including limitations on the deductibility of interest expense and executive compensation, and the imposition or acceleration of taxation on certain foreign income, each of which may increase our tax expense. Both the Tax Cuts and Jobs Act and subsequent regulations and interpretations require complex computations to be performed that were not previously required in U.S. tax law, significant judgments to be made in interpretation of the Tax Cuts and Jobs Act, significant estimates in calculations, and the preparation and analysis of information not previously relevant or regularly produced. The U.S. Treasury Department, the IRS, and other standard-setting bodies could interpret or issue guidance on how the Tax Cuts and Jobs Act will be applied or otherwise administered that is different from our interpretation. As additional clarification and guidance is issued regarding the Tax Cuts and Jobs Act, we may make adjustments to amounts that we have recorded, which may materially impact our provision for income taxes in the period in which the adjustments are made.
Various other jurisdictions, including members of the Organization for Economic Cooperation and Development, are considering changes to their tax laws, including provisions intended to address base erosion and profit shifting by taxpayers. Any tax reform adopted in these or other countries may exacerbate the risks described above.
Risks Related to Our Indebtedness
We have a substantial amount of indebtedness, which could adversely affect our ability to obtain financing in the future and react to changes in our business.
As of December 31, 2019, we have approximately an aggregate principal amount of $946.0 million indebtedness outstanding, including our 4.625% senior unsecured notes due April 1, 2026, or the Notes, and our senior secured term loan facility due 2025, or the Term Loan Facility. In addition, we have approximately $300 million of unutilized capacity under our senior secured revolving credit facility due 2023, or the Revolving Facility. We refer to the Term Loan Facility and the Revolving Facility as the Credit Facilities, and the credit agreement that governs the Credit Facilities as the Credit Agreement.
Our debt could have important consequences, including:
• | limiting our ability to obtain additional financing to fund future working capital, capital expenditures, acquisitions or other general corporate purposes; |
• | requiring a substantial portion of our cash flow to be dedicated to debt service payments instead of other purposes; |
• | increasing our vulnerability to adverse changes in general economic, industry and competitive conditions; |
• | exposing us to increased interest expense for borrowings with variable interest rates, including borrowings under the Credit Facilities; and |
• | placing us at a disadvantage compared to other, less leveraged competitors or competitors with comparable debt having more favorable terms. |
Despite our current level of indebtedness, we may incur substantially more debt, which could exacerbate the risks to our financial condition described above.
We may incur significant additional secured and unsecured indebtedness in the future. Although the indenture governing the Notes, or the Indenture, and the Credit Agreement restrict our ability to incur additional indebtedness, the restrictions have a number of significant qualifications and exceptions. For example, the Credit Agreement provides that we can request additional loans and commitments up to the greater of $400 million or 100% of our EBITDA, as well as additional amounts if our secured net leverage ratio is less than a specified ratio. Further, these restrictions do not prevent us from incurring monetary obligations that do not constitute indebtedness. If we add new indebtedness and other monetary obligations to our current debt levels, the related risks that we now face would intensify.
We may be unable to generate sufficient cash to service our indebtedness and may be forced to take other actions, which may not be successful, to satisfy our obligations under our indebtedness.
We may be unable to maintain sufficient cash flow from operating activities to permit us to pay the principal of, premium, if any, and interest on our indebtedness. Our ability to make scheduled payments on or to refinance our debt obligations depends on our financial condition and operating performance and the condition of the capital markets, which are subject to prevailing economic, industry and competitive conditions, as well as many financial, business, legislative, political, regulatory and other factors beyond our control. If our cash flow and capital resources are insufficient to fund our debt service obligations, we could face substantial liquidity problems, be forced to reduce or delay investments and capital expenditures, dispose of material assets or operations, seek additional debt or equity capital or restructure or refinance our indebtedness, any of which could have a material adverse effect on our business, financial position and results of operations.
21
Any refinancing of our debt could be at higher interest rates and may require us to comply with more onerous covenants, which could further restrict our business operations. We may not be able to implement any refinancing on commercially reasonable terms or at all and, even if successful, a refinancing may not allow us to meet our scheduled debt service obligations. The agreements governing our indebtedness restrict our ability to dispose of assets and use the proceeds of the dispositions, and we may be unable to consummate any dispositions or generate proceeds sufficient to meet our debt service obligations.
If we cannot make scheduled payments on our debt, holders of the Notes and lenders under the Credit Facilities could declare all outstanding principal and interest to be due and payable, the lenders under the Revolving Facility could terminate their commitments to advance further loans, our secured lenders could foreclose against the assets securing their borrowings, and we could be forced into bankruptcy or liquidation.
The terms of the credit agreement restrict our operations, particularly our ability to respond to changes or raise additional funds.
The Credit Agreement contains restrictive covenants that impose significant operating and financial restrictions that may limit our ability to take actions that may be in our long-term best interest, including restrictions on our ability to:
• | incur additional indebtedness and guarantee indebtedness; |
• | pay dividends or make other distributions in respect of, or repurchase or redeem, capital stock; |
• | prepay, redeem or repurchase certain debt; |
• | make investments, loans, advances and acquisitions; |
• | sell or otherwise dispose of assets, including capital stock of our subsidiaries; |
• | enter into transactions with affiliates; |
• | alter the businesses we conduct; and |
• | merge or sell all or substantially all of our assets or incur a change of control in our capital stock ownership. |
In addition, the restrictive covenants may, depending on the amount of revolving borrowings, unreimbursed letter of credit drawings and undrawn letters of credit, require us to maintain a secured net leverage ratio, which we may be unable to meet. Also, the Indenture contains limited covenants, such as a covenant restricting our ability and certain of our subsidiaries’ ability to incur certain debt secured by liens. Our failure to comply with these covenants could result in the acceleration of some or all of our indebtedness, which could lead to bankruptcy, reorganization or insolvency.
Risks Related to Owning our Common Stock
The price of our common stock has been volatile in the past and may be volatile in the future.
The price of our common stock has been volatile in the past and may be volatile in the future. In 2019, the closing price of our stock on The NASDAQ Global Select Market, or NASDAQ, ranged from a low of $27.43 to a high of $51.21, and, as in past years, the price of our common stock may show greater volatility. The trading price of our common stock is subject to significant volatility in response to numerous factors, many of which are beyond our control or may be unrelated to our operating results, and which may adversely affect the market price of our common stock, including the following:
• | the failure to meet the published expectations of securities analysts; |
• | changes in financial estimates by securities analysts; |
• | press releases or announcements by, or changes in market values of, comparable companies; |
• | volatility in the markets for high-technology stocks, general stock market price and volume fluctuations, which are particularly common among securities of high-technology companies; |
• | stock market price and volume fluctuations attributable to inconsistent trading volume levels; |
• | the public perception of equity values of publicly traded companies; |
• | fluctuations in our results of operations; and |
• | the other risks and uncertainties described in this Annual Report on Form 10-K and in our other filings with the SEC. |
Fluctuations in our results could cause our stock price to decline significantly. We believe that period-to-period comparisons of our results of operations may not be meaningful, and you should not rely upon them as indicators of our future performance. Future decreases in our stock price may adversely impact our ability to raise sufficient additional capital in the future, if needed.
22
There can be no assurance that we will continue to declare cash dividends or repurchase our shares at all or in any particular amounts.
Our intent to continue to pay quarterly dividends and to repurchase shares of our common stock is subject to capital availability and periodic determinations by our Board of Directors that such actions are in the best interest of our stockholders and are in compliance with all laws and applicable agreements. Future dividends and share repurchases may also be affected by, among other factors, our views on potential future capital requirements for investments in acquisitions and the funding of our research and development; legal risks; changes in federal and state income tax laws or corporate laws; contractual restrictions, such as financial or operating covenants in our debt arrangements; availability of domestic cash flow; and changes to our business model. Our dividend payments and share repurchases may change from time to time, and we may decide at any time to reduce, suspend or discontinue the payment of dividends or the repurchase of shares. A reduction, suspension or discontinuation of our dividend payments or share repurchases could have a negative effect on the price of our common stock.
Provisions in our charter documents and Delaware law may delay or prevent an acquisition of us, which could decrease the value of our shares.
Our restated certificate of incorporation, our by-laws and Delaware law contain provisions that could make it harder for a third party to acquire us without the consent of our board of directors. These provisions include limitations on actions by our stockholders by written consent.
Our restated certificate of incorporation makes us subject to the anti-takeover provisions of Section 203 of the Delaware General Corporation Law. In general, Section 203 prohibits publicly held Delaware corporations to which it applies from engaging in a “business combination” with an “interested stockholder” for a period of three years after the date of the transaction in which the person became an interested stockholder, unless the business combination is approved in a prescribed manner. This provision could discourage others from bidding for our shares of common stock and could, as a result, reduce the likelihood of an increase in the price of our common stock that would otherwise occur if a bidder sought to buy our common stock.
Our restated certificate of incorporation provides that our board of directors is authorized to issue from time to time, without further stockholder approval, up to 5,000,000 shares of preferred stock in one or more series and to fix and designate the rights, preferences, privileges and restrictions of the preferred stock, including dividend rights, conversion rights, voting rights, redemption rights and terms of redemption and liquidation preferences. Any shares of preferred stock could have preferences over our common stock with respect to dividends and liquidation rights. Any issuance of preferred stock may have the effect of delaying, deterring or preventing a change in control. Any issuance of preferred stock could decrease the amount of earnings and assets available for distribution to the holders of common stock and could adversely affect the rights and powers, including voting rights, of the holders of common stock. The issuance of preferred stock could have the effect of decreasing the market price of our common stock.
Item 1B. Unresolved Staff Comments.
Not Applicable.
23
Item 2. Properties.
Our principal executive offices are located in Billerica, Massachusetts. Information about our principal and certain other facilities is set forth below:
Location | Principal Function | Approximate Square Feet | Leased/ Owned | Reporting Segment |
Bedford, Massachusetts | Research & Manufacturing | 80,000 | Owned | MC & SCEM |
Billerica, Massachusetts(1) | Executive Offices, Research & Manufacturing | 175,000 | Leased | MC & SCEM |
Burnet, TX | Research & Manufacturing | 86,000 | Owned | SCEM |
Chaska, Minnesota | Executive Offices, Research & Manufacturing | 186,000 | Owned | AMH |
Colorado Springs, CO | Manufacturing | 82,000 | Owned | AMH |
Danbury, CT | Research & Manufacturing | 73,000 | Leased | SCEM |
Decatur, Texas | Manufacturing | 359,000 | Owned | SCEM |
Hsin-chu, Taiwan | Executive Offices, Sales Research & Manufacturing | 146,330 | Leased | MC, SCEM & AMH |
JangAn, South Korea | Manufacturing | 127,000 | Owned | SCEM & AMH |
Kulim, Malaysia | Manufacturing | 195,000 | Owned | SCEM & AMH |
San Luis Obispo, CA | Manufacturing | 37,000 | Owned | MC |
San Luis Obispo, CA | Manufacturing | 34,000 | Leased | MC |
Suwon, South Korea | Executive Offices & Research | 42,000 | Leased | MC & SCEM |
Yonezawa, Japan | Manufacturing | 185,000 | Owned | MC & AMH |
(1) This lease has been extended through September 30, 2026 and is subject to one five-year renewal option.
In addition, we own and lease space for manufacturing, distribution, technical support, sales, service, repair, and general administrative purposes in the United States, Canada, China, Germany, France, Israel, Japan, Malaysia, Singapore, South Korea and Taiwan. Leases for our facilities expire through September 2026. We currently expect to be able to extend the terms of expiring leases or to find suitable replacement facilities on reasonable terms. We believe that our facilities are well-maintained and suitable for their respective operations. We regularly assess the size, capability and location of our global infrastructure and periodically make adjustments based on these assessments.
Item 3. Legal Proceedings.
As of December 31, 2019, we were not involved in any legal proceedings that we believe will have a material impact on our consolidated financial position, results of operations or cash flows. From time to time the Company may be a party to litigation involving claims against the Company arising in the ordinary course of our business. We are not aware of any material potential litigation or claims against us which would have a material adverse effect upon our financial statements.
Item 4. Mine Safety Disclosures.
Not applicable.
24
EXECUTIVE OFFICERS OF THE REGISTRANT
The following is a list of our Executive Officers and their ages, as of the date of this this Annual Report on Form 10-K.
Name | Age | Office |
Bertrand Loy | 54 | President & Chief Executive Officer |
Gregory B. Graves | 59 | Executive Vice President, Chief Financial Officer & Treasurer |
Todd Edlund | 57 | Executive Vice President & Chief Operating Officer |
Sue Rice | 61 | Senior Vice President, Global Human Resources |
Corey Rucci | 60 | Senior Vice President, Business Development |
Jim O’Neill | 55 | Senior Vice President, Chief Technology Officer |
Stuart Tison | 56 | Senior Vice President & General Manager, Specialty Chemicals and Engineered Materials |
Clint Haris | 47 | Senior Vice President & General Manager, Microcontamination Control |
William Shaner | 52 | Senior Vice President & General Manager, Advanced Materials Handling |
Bruce W. Beckman | 52 | Senior Vice President, Finance |
Michael D. Sauer | 54 | Vice President, Controller & Chief Accounting Officer |
Bertrand Loy has been our Chief Executive Officer, President and a director since November 2012. From July 2008 to November 2012, Mr. Loy served as our Executive Vice President and Chief Operating Officer. From August 2005 until July 2008, he served as our Executive Vice President in charge of our global supply chain and manufacturing operations. He served as the Vice President and Chief Financial Officer of Mykrolis (a predecessor to Entegris) from January 2001 until August 2005. Prior to that, Mr. Loy served as the Chief Information Officer of Millipore Corporation during 1999 and 2000. From 1995 until 1999, he served as the Division Controller and Head of Manufacturing for Millipore’s Laboratory Water Division. From 1989 until 1995, Mr. Loy served Sandoz Pharmaceuticals (now Novartis) in a variety of strategic planning and finance positions located in Europe, Central America and Japan. Mr. Loy served as a director of BTU International, Inc. (supplier of advanced thermal processing equipment) from June 2010 until its acquisition in January 2015. He has served on the board of directors of Harvard Bioscience, Inc. (scientific equipment) since November 2014 and is now its lead independent director. Since July 2013, he has also been on the board of directors of SEMI, the global industry association representing the electronics manufacturing supply chain, and currently acts as the chairman of the association.
Gregory B. Graves has served as our Executive Vice President and Chief Financial Officer since July 2008. Prior to that, he served as Senior Vice President and Chief Financial Officer since April 2007. Prior to April 2007, he served as Senior Vice President, Strategic Planning & Business Development since the effectiveness of the merger with Mykrolis in August 2005. Mr. Graves served as the Chief Business Development Officer of Entegris Minnesota starting in September 2002 and from September 2003 until August 2004 he also served as Senior Vice President of Finance. Prior to joining Entegris Minnesota in September 2002, Mr. Graves held positions in investment banking and corporate development, including at U.S. Bancorp Piper Jaffray from June 1998 to August 2002 and at Dain Rauscher from October 1996 to May 1998. From May 2017 to June 2019, Mr. Graves served as a director of Plug Power Inc. (energy solutions provider).
Todd Edlund has been our Executive Vice President and Chief Operating Officer since July 2016. Prior to that, he was our Senior Vice President and Chief Operating Officer since November 2014. After the merger with ATMI in April 2014, Mr. Edlund served as Senior Vice President and General Manager of our Critical Materials Handling business and prior to that merger, he was the Vice President and General Manager of our Contamination Control Solutions division since December 2007. He served as the Vice President and General Manager of our Liquid Systems business unit from 2005 to 2007, and prior to that, as Entegris Minnesota’s Vice President of Sales for semiconductor markets from 2003 to 2005. Prior to 2003, Mr. Edlund held a variety of positions with our predecessor companies since 1995.
Sue Rice has been our Senior Vice President of Global Human Resources in September 2017. Prior to that, Ms. Rice served as Senior Vice President and Chief Human Resources Officer for Thermo Fisher Scientific from 2013 to 2017, Region Vice President HR Asia Pacific & Emerging Markets from 2009 to 2013 and Group Vice President, HR Analytical Technologies Group from 2006 to 2009. Prior to that, Ms. Rice held senior human resource positions with Fidelity Human Resources Services Company and Sherbrooke Associates.
Jim O’Neill has been our Senior Vice President, Chief Technology Officer since September 2019, having previously served as our Vice President, Chief Technology Officer since April 2014 when he joined Entegris as part of our acquisition of ATMI. At ATMI, Dr. O’Neill was Senior Vice President of Electronic Materials from January 2012 to April 2014. Prior to that, he held numerous technical and leadership roles in semiconductor research and development with over 23 years at IBM.
25
Corey Rucci has served as our Senior Vice President, Business Development since January 2018, having served as Vice President, Business Development since February 2014. Prior to that, he served as Vice President and General Manager of our Specialty Materials Division since 2011 and as General Manager of Poco Graphite, Inc. (POCO) since 2008 when we acquired POCO. Prior to joining Entegris, Mr. Rucci served POCO as the President and Chief Operating Officer since 2007, Chief Operating Officer since 2005, Chief Financial Officer since 2001 and Vice President of Business Development since 1998. Prior to that, he worked at UNOCAL Corp. for 17 years in a variety of accounting, marketing and business development roles.
Stuart Tison has been our Senior Vice President, Specialty Chemicals and Engineered Materials since July 2016. Prior to that, Mr. Tison served as Vice President, Specialty Gas Solutions since February 2015, as Vice President, Business Development since January 2010 and as Vice President, Corporate Development since July 2007. Prior to that, he served Celerity, Inc. as Vice President, Engineering and served Entegris predecessor companies Mykrolis and Millipore in a variety of sales, marketing, business development and engineering roles.
Clint Haris has been our Senior Vice President, Microcontamination Control since July 2016. Prior to that, Mr. Haris served as our Vice President, Liquid Microcontamination Control since August 2014. Prior to joining Entegris, Mr. Haris served in a variety of executive roles at Brooks Automation Inc. including Senior Vice President, Life Science Systems from 2010 to 2014 and Senior Vice President and General Manager, Systems Solutions from 2009 to 2010.
William Shaner has been our Senior Vice President, Advanced Materials Handling since July 2016. Prior to that, Mr. Shaner served as our Senior Vice President, Global Operations since February 2014 and, prior to that, as our Vice President and General Manager, Microenvironments division since 2007. He has served in a variety of sales, marketing, business development and engineering roles since joining Entegris in 1995.
Bruce W. Beckman has been our Senior Vice President, Finance since February 2018. Prior to that, Mr. Beckman served as Vice President, Finance since joining Entegris in April 2015. From 1990 to 2015, Mr. Beckman worked in numerous capacities for General Mills, Inc., including Vice President, Finance, Meals Division from July 2012 to January 2015, Director of Corporate Planning & Analysis from July 2008 to July 2012 and Director of Internal Controls from 2003 to 2005.
Michael D. Sauer has been our Vice President, Controller and Chief Accounting Officer since June 2012. Prior to that, he served as the Corporate Controller since 2008. From the time of the merger with Mykrolis in August 2005 until April 2008, Mr. Sauer served as Director of Treasury and Risk Management. Mr. Sauer joined Fluoroware, Inc., a predecessor to Entegris Minnesota in 1988 and held a variety of finance and accounting positions until 2001 when he became the Director of Business Development for Entegris Minnesota, the successor to Fluoroware, serving in that position until the merger with Mykrolis.
26
PART II
Item 5. Market for Registrant’s Common Equity, Related Stockholder Matters and Issuer Purchases of Equity Securities.
Market Information and Holders:
Entegris’ Common Stock, $0.01 par value, trades on the NASDAQ Global Select Market under the symbol “ENTG”. As of February 3, 2020, there were 999 shareholders of record.
Dividend Policy:
Holders of the Company’s common stock are entitled to receive dividends when and if they are declared by the Company’s Board of Directors. The Company’s Board of Directors declared a cash dividend of $0.07 per share during the first and second quarters and $0.08 in the third and fourth quarters of 2019, which totaled $40.8 million.
On January 15, 2020, the Company’s Board of Directors declared a quarterly cash dividend of $0.08 per share to be paid on February 19, 2020 to shareholders of record as of January 29, 2020.
Future dividend declarations, if any, as well as the record and payment dates for such dividends, are subject to the final determination of our board of directors. Furthermore, the credit agreement governing the Credit Facilities contains restrictions that may limit our ability to pay dividends.
Issuer Sales of Unregistered Securities During the Past Three Years:
None
Comparative Stock Performance
The following graph compares the cumulative total shareholder return on the common stock of Entegris, Inc. from December 31, 2014 through December 31, 2019 with the cumulative total return of (1) The NASDAQ Composite Index, and (2) The Philadelphia Semiconductor Index, assuming $100 was invested at the close of trading December 31, 2014 in Entegris, Inc. common stock, the NASDAQ Composite Index and the Philadelphia Semiconductor Index and that all dividends are reinvested.
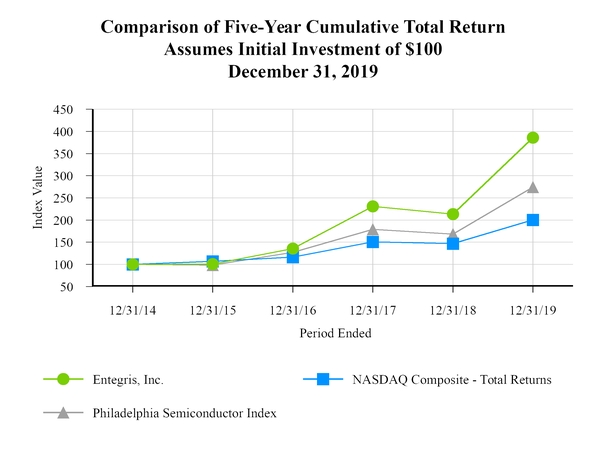
27
December 31, 2014 | December 31, 2015 | December 31, 2016 | December 31, 2017 | December 31, 2018 | December 31, 2019 | ||||||
Entegris, Inc. | $100.00 | $100.45 | $135.50 | $231.01 | $213.50 | $386.16 | |||||
NASDAQ Composite | 100.00 | 106.96 | 116.45 | 150.96 | 146.67 | 200.50 | |||||
Philadelphia Semiconductor Index | 100.00 | 98.38 | 127.23 | 178.82 | 168.01 | 274.30 | |||||
Issuer Purchases of Equity Securities:
On February 13, 2018, the Company’s Board of Directors authorized a repurchase program covering up to an aggregate of $100 million of the Company’s common stock, during a period of twenty-four months, in open market transactions and in accordance with one or more pre-arranged stock trading plans to be established in accordance with Rule 10b5-1 under the Securities Exchange Act of 1934, as amended. On November 19, 2018, the Company’s Board of Directors authorized the repurchase of up to an additional $250 million in aggregate principal amount of the Company’s common stock. The authorization was in addition to the amount remaining under the share repurchase program previously authorized in February 2018.
The following table provides information concerning shares of the Company’s Common Stock $0.01 par value purchased during the three months ended December 31, 2019:
Period | (a) Total Number of Shares Purchased | (b) Average Price Paid per Share | (c) Total Number of Shares Purchased as Part of Publicly Announced Plans or Programs | (d) Maximum Number (or Approximate Dollar Value) of Shares that May Yet Be Purchased Under the Plans or Programs | ||
September 29 through November 2, 2019 | 125,000 | $47.60 | 125,000 | $110,391,791 | ||
November 3 through November 30, 2019 | 95,000 | $47.85 | 95,000 | $105,845,995 | ||
December 1 through December 31, 2019 | 91,890 | $49.02 | 91,890 | $101,341,291 | ||
Total | 311,890 | 311,890 | $101,341,291 | |||
The Company issues common stock awards under its equity incentive plans. In the consolidated financial statements, the Company treats shares of common stock withheld for tax purposes on behalf of its employees in connection with the vesting or exercise of the awards as common stock repurchases because they reduce the number of shares that would have been issued upon vesting or exercise. These withheld shares of common stock are not considered common stock repurchases under the Company’s authorized common stock repurchase plan and accordingly are not included in the common stock repurchase totals in the preceding table.
28
Item 6. Selected Financial Data.
The table that follows presents selected financial data for each of the last five years from the Company’s consolidated financial statements and should be read in conjunction with the Company’s Consolidated Financial Statements and the related Notes and with “Management’s Discussion and Analysis of Financial Condition and Results of Operations” included elsewhere in this Annual Report on Form 10-K. The selected financial data set forth below as of December 31, 2019 and 2018 and for the years ended December 31, 2019, 2018 and 2017 are derived from our audited financial statements included in this Annual Report on Form 10-K. All other selected financial data set forth below is derived from our audited financial statements not included in this Annual Report on Form 10-K. Our historical results are not necessarily indicative of our results of operations to be expected in the future.
(In thousands, except per share amounts) | Year ended December 31, 2019(1) (6) | Year ended December 31, 2018(2) (5) | Year ended December 31, 2017 | Year ended December 31, 2016 | Year ended December 31, 2015 | ||||||||||||||
Operating Results | |||||||||||||||||||
Net sales | $ | 1,591,066 | $ | 1,550,497 | $ | 1,342,532 | $ | 1,175,270 | $ | 1,081,121 | |||||||||
Gross profit | 711,653 | 719,831 | 608,985 | 508,691 | 470,231 | ||||||||||||||
Selling, general and administrative expenses | 284,807 | 246,534 | 216,194 | 201,901 | 198,914 | ||||||||||||||
Engineering, research and development expenses | 121,140 | 118,456 | 106,951 | 106,991 | 105,900 | ||||||||||||||
Amortization of intangible assets | 66,428 | 62,152 | 44,023 | 44,263 | 47,349 | ||||||||||||||
Operating income | 239,278 | 292,689 | 241,817 | 155,536 | 118,068 | ||||||||||||||
Income before income taxes and equity in net loss of affiliate | 318,049 | 254,432 | 184,731 | 119,999 | 92,185 | ||||||||||||||
Income tax expense | 63,189 | 13,677 | 99,665 | 22,852 | 10,202 | ||||||||||||||
Net income | 254,860 | 240,755 | 85,066 | 97,147 | 80,296 | ||||||||||||||
Earnings Per Share Data | |||||||||||||||||||
Diluted earnings per share | $ | 1.87 | $ | 1.69 | $ | 0.59 | $ | 0.68 | $ | 0.57 | |||||||||
Weighted average shares outstanding – diluted | 136,568 | 142,610 | 143,518 | 142,050 | 141,121 | ||||||||||||||
Operating Ratios – % of net sales | |||||||||||||||||||
Gross profit | 44.7 | % | 46.4 | % | 45.4 | % | 43.3 | % | 43.5 | % | |||||||||
Selling, general and administrative expenses | 17.9 | 15.9 | 16.1 | 17.2 | 18.4 | ||||||||||||||
Engineering, research and development expenses | 7.6 | 7.6 | 8.0 | 9.1 | 9.8 | ||||||||||||||
Amortization of intangible assets | 4.2 | 4.0 | 3.3 | 3.8 | 4.4 | ||||||||||||||
Operating income | 15.0 | 18.9 | 18.0 | 13.2 | 10.9 | ||||||||||||||
Income before income taxes and equity in net loss of affiliate | 20.0 | 16.4 | 13.8 | 10.2 | 8.5 | ||||||||||||||
Effective tax rate(3) | 19.9 | 5.4 | 54.0 | 19.0 | 11.1 | ||||||||||||||
Net income(4) | 16.0 | 15.5 | 6.3 | 8.3 | 7.4 | ||||||||||||||
Cash Flow Statement Data | |||||||||||||||||||
Depreciation and amortization | $ | 141,403 | $ | 127,268 | $ | 102,231 | $ | 99,886 | $ | 101,654 | |||||||||
Capital expenditures | 112,355 | 110,153 | 93,597 | 65,260 | 71,977 | ||||||||||||||
Net cash provided by operating activities | 382,298 | 312,576 | 293,373 | 207,555 | 120,918 | ||||||||||||||
Net cash used in investing activities | (385,840 | ) | (485,944 | ) | (112,455 | ) | (66,686 | ) | (63,638 | ) | |||||||||
Net cash (used in) provided by financing activities | (126,820 | ) | 34,411 | 27,251 | (81,747 | ) | (92,787 | ) | |||||||||||
Balance Sheet and Other Data | |||||||||||||||||||
Current assets | $ | 932,397 | $ | 1,029,338 | $ | 1,057,608 | $ | 800,131 | $ | 708,787 | |||||||||
Current liabilities | 264,433 | 269,668 | 290,971 | 261,571 | 175,550 | ||||||||||||||
Working capital | 667,964 | 759,670 | 766,637 | 538,560 | 533,237 | ||||||||||||||
Current ratio | 3.53 | 3.82 | 3.63 | 3.06 | 4.04 | ||||||||||||||
Long-term debt, including current maturities(7) | 936,484 | 938,863 | 674,380 | 584,677 | 656,044 | ||||||||||||||
Shareholders’ equity | 1,165,889 | 1,012,025 | 993,018 | 899,218 | 802,883 | ||||||||||||||
Total assets | 2,516,086 | 2,317,641 | 1,976,172 | 1,699,532 | 1,646,697 | ||||||||||||||
Return on average shareholders’ equity – % | 23.4 | % | 24.0 | % | 9.0 | % | 11.4 | % | 10.4 | % | |||||||||
Shares outstanding at end of year | 134,728 | 135,977 | 141,283 | 141,320 | 140,716 | ||||||||||||||
29
1Reflects the adoption of the new accounting standard in fiscal year 2019 related to leases. See Note 10 of the Consolidated Financial Statements.
2Reflects the adoption of the new accounting standard in fiscal year 2018 related to revenue.
3In 2018, our effective tax rate benefited from the reduction of the U.S. statutory federal tax rate and other provisions of the Tax Cuts and Jobs act. In 2017, our effective tax rate increased due to the recognition of the one-time mandatory repatriation transition tax on the net accumulated earnings and profits of the Company’s foreign subsidiaries.
4 In 2019, the Company received net proceeds of $122.0 million resulting from the termination of the merger agreement with Versum (see note 9 to the Company’s consolidated financial statements).
5SAES Pure Gas business and Particle Sizing Systems, LLC have been included in our consolidated results of operations starting on the acquisition date of June 25, 2018 and January 22, 2018, respectively.
6 Hangzhou Anow Microfiltration Co., Ltd., MPD Chemicals, Digital Specialty Chemicals Limited have been included in our consolidated results of operations starting on the acquisition date of September 17, 2019, July 15, 2019 and March 8, 2019, respectively.
7 In 2018, the Company obtained a new $700 million senior secured credit facility. The Company used a portion of the proceeds to repay and terminate its previous credit facilities. See Note 8 of the Consolidated Financial Statements.
30
Item 7. Management’s Discussion and Analysis of Financial Condition and Results of Operations.
The following discussion and analysis of the Company’s consolidated financial condition and results of operations should be read along with the consolidated financial statements and the accompanying notes included elsewhere in this Annual Report on Form 10-K. This discussion contains forward-looking statements that involve numerous risks and uncertainties, including, but not limited to, those described in Item 1A. “Risk Factors” and the “Cautionary Statements” sections of this Item 7 below. You should review Item 1A “Risk Factors” of this Annual Report on Form 10-K for a discussion of important factors that could cause actual results to differ materially from the results described in or implied by the forward-looking statements contained in the following discussion and analysis.
Cautionary Statements
This Annual Report on Form 10-K and the documents incorporated by reference in this Annual Report on Form 10-K contain “forward-looking statements” within the meaning of the Private Securities Litigation Reform Act of 1995. The words “believe,” “expect,” “anticipate,” “intend,” “estimate,” “forecast,” “project,” “should,” “may,” “will,” “would” or the negative thereof and similar expressions are intended to identify such forward-looking statements. These forward-looking statements may include statements about future period guidance or projections; the Company’s performance relative to its markets; market and technology trends, including the duration and drivers of any growth trends; the development of new products and the success of their introductions; the focus of the Company’s engineering, research and development projects; the Company’s ability to execute on its business strategies; the Company’s capital allocation strategy, which may be modified at any time for any reason, including share repurchases, dividends, debt repayments and potential acquisitions; the effect of the Tax Cuts and Jobs Act; the impact of the acquisitions the Company has made and commercial partnerships the Company has established; future capital and other expenditures, including estimates thereof; the Company’s expected tax rate; the impact, financial or otherwise, of any organizational changes; the impact of accounting pronouncements; quantitative and qualitative disclosures about market risk; and other matters. These forward-looking statements are based on current management expectations and assumptions only as of the date of this Annual Report on Form 10-K, are not guarantees of future performance and involve substantial risks and uncertainties that are difficult to predict and that could cause actual results to differ materially from the results expressed in, or implied by, these forward-looking statements. These risks and uncertainties include, but are not limited to, the risk factors and additional information described in this Annual Report on Form 10-K under the caption “Risk Factors,” elsewhere in this Annual Report on Form 10-K and in the Company’s other periodic filings. Except as required under the federal securities laws and the rules and regulations of the SEC, the Company undertakes no obligation to update publicly any forward-looking statements or information contained herein, which speak as of their respective dates.
Overview
This overview is not a complete discussion of the Company’s financial condition, changes in financial condition and results of operations; it is intended merely to facilitate an understanding of the most salient aspects of its financial condition and operating performance and to provide a context for the detailed discussion and analysis that follows, and must be read in its entirety in order to fully understand the Company’s financial condition and results of operations.
The Company is a leading global developer, manufacturer and supplier of microcontamination control products, specialty chemicals and advanced materials handling solutions for manufacturing processes in the semiconductor and other high-technology industries. We leverage our unique breadth of capabilities to create value for our customers by developing mission-critical solutions to maximize manufacturing yields, reduce manufacturing costs and enable higher device performance.
Our technology portfolio includes advanced materials and high-purity chemistries, with optimized packaging and delivery systems and in-process filtration and purification solutions that ensure high-value liquid chemistries and gases are free from contaminants use. Our standard customized productions and solutions enable the highest levels of purity and performance that are essential to the manufacture of semiconductors, flat panel displays, light emitting diodes, or LEDs, high-purity chemicals, solar cells, gas lasers, optical and magnetic storage devices, and critical components for aerospace, glass manufacturing and biomedical applications. The majority of our products are consumed at various times throughout the manufacturing process, with demand driven in part by the level of semiconductor and other manufacturing activity.
Our business is organized and operated in three operating segments, which align with the key elements of the advanced semiconductor manufacturing ecosystem. The Specialty Chemicals and Engineered Materials, or SCEM, segment provides high-performance and high-purity process chemistries, gases, and materials, and safe and efficient delivery systems to support semiconductor and other advanced manufacturing processes. The Microcontamination Control, or MC, segment offers solutions to filter and purify critical liquid chemistries and gases used in semiconductor manufacturing processes and other high-technology industries. The Advanced Materials Handling, or AMH, segment develops solutions to monitor, protect, transport, and deliver critical liquid chemistries, wafers and other substrates for a broad set of applications in the semiconductor industry and other high-technology industries. While these segments have separate products and technical know-how, they share common business systems and processes, technology centers, and strategic and technology roadmaps. We leverage our
31
expertise from these three segments and complementary product portfolios to create new and increasingly integrated solutions for our customers.
Key operating factors Key factors, which management believes have the largest impact on the overall results of operations of the Company, include:
• | Level of sales Since a significant portion of the Company’s product costs (except for raw materials, purchased components and direct labor) are largely fixed in the short-to-medium term, an increase or decrease in sales affects gross profits and overall profitability significantly. Also, increases or decreases in sales and operating profitability affect certain costs such as incentive compensation and commissions, which are highly variable in nature. The Company’s sales are subject to the effects of industry cyclicality, technological change, substantial competition, pricing pressures and foreign currency fluctuation. |
• | Variable margin on sales The Company’s variable margin on sales is determined by selling prices and the costs of manufacturing and raw materials. This is affected by a number of factors, which include the Company’s sales mix, purchase prices of raw material (especially polymers, membranes, stainless steel and purchased components), domestic and international competition, direct labor costs, and the efficiency of the Company’s production operations, among others. |
• | Fixed cost structure The Company’s operations include a number of large fixed or semi-fixed cost components, which include salaries, indirect labor and benefits, facility costs, lease expenses, and depreciation and amortization. It is not possible to vary these costs easily in the short-term as volumes fluctuate. Accordingly, increases or decreases in sales volume can have a large effect on the usage and productivity of these cost components, resulting in a large impact on the Company’s profitability. |
Overall Summary of Financial Results for the Year Ended December 31, 2019
Total net sales for the year ended December 31, 2019 were $1,591.1 million, up $40.6 million, or 3%, from sales of $1,550.5 million for the year ended December 31, 2018.
Exclusive of net sales associated with acquisitions and divestitures of $87.6 million and unfavorable foreign currency translation effects of $4.5 million, the Company’s sales decreased by $42.6 million to $1,507.9 million, or 3%, reflecting a decrease in overall demand for the Company’s products from semiconductor industry customers, particularly in the sale of fluid handling products, liquid chemistry filtration solutions and certain specialty materials products.
The Company announced organizational changes in the third quarter of 2019 intended to enable us to be more responsive to our customers, increase our competitiveness, allow for scalable growth and result in cost savings. These changes were primarily focused on optimizing our customer-facing organization. As a result of this announcement, the Company recorded restructuring charges within cost of goods sold, selling, general and administrative (SG&A) and engineering, research and development of $1.0 million, $6.1 million and $1.4 million, respectively, for the twelve months ended December 31, 2019. The actions associated with the restructuring plan, including employee separations, were completed by the end of 2019, and the Company does not anticipate any additional material charges for the following year relating to the restructuring costs.
The Company’s gross profit declined by $8.2 million for the year ended December 31, 2019, to $711.7 million, down from $719.8 million for the year ended December 31, 2018. Accordingly, the Company reported a 44.7% gross margin rate compared to 46.4% in 2018. The gross profit and gross margin decrease reflects lower factory utilization associated with weaker sales levels and an unfavorable sales mix.
The Company’s selling, general and administrative (SG&A) and engineering, research and development (ER&D) expenses increased in 2019, mainly reflecting higher deal costs, the cost of integration activities and restructuring charges.
On January 28, 2019, the Company and Versum announced that they had entered into an Agreement and Plan of Merger, dated as of January 27, 2019 (the “Merger Agreement”), pursuant to which they agreed to combine in a merger of equals. On April 8, 2019, Versum announced that its Board of Directors had received a proposal from Merck KGaA to acquire Versum and that its Board of Directors had deemed such proposal as a “Superior Proposal” defined in the merger agreement. On April 12, 2019, the Company received a termination notice from Versum terminating the Merger Agreement. In accordance with the terms of the Merger Agreement, Entegris received a $140.0 million termination fee from Versum in the second quarter of 2019. Also in the second quarter of 2019, the Company paid a fee of $18.0 million to the third-party financial adviser it had engaged to assist with the transaction.
As a result of the aforementioned and other factors discussed below, net income for 2019 was $254.9 million, or $1.87 per diluted share, compared to net income of $240.8 million, or $1.69 per diluted share, in 2018.
32
On March 8, 2019, the Company acquired Digital Specialty Chemicals Limited (DSC), which provides advanced materials to the specialty chemical, technology and pharmaceutical industries. The total purchase price of the acquisition was $64.1 million, net of cash acquired. The Company funded the acquisition from its available cash.
On July 15, 2019, the Company acquired MPD Chemicals, a provider of advanced materials to the specialty chemical, technology, and life sciences industries. The Company acquired MPD Chemicals for approximately $161.0 million, net of cash acquired, subject to revision for customary working capital adjustments. The Company funded the acquisition from its available cash.
On September 17, 2019, the Company acquired Hangzhou Anow Microfiltration Co., Ltd., (Anow) a filtration company for diverse industries including semiconductor, pharmaceutical, and medical. The Company acquired Anow for $72.8 million, net of cash acquired. The Company funded the acquisition from its available cash.
During 2019, the Company’s operating activities provided cash flow of $382.3 million. Cash and cash equivalents, and short-term investments were $351.9 million at December 31, 2019 compared with $482.1 million at December 31, 2018. The Company had long-term borrowings, including current maturities, of $936.5 million at December 31, 2019 compared with $938.9 million at December 31, 2018.
Critical Accounting Policies
Management’s discussion and analysis of financial condition and results of operations are based upon the Company’s consolidated financial statements, which have been prepared in accordance with accounting principles generally accepted in the United States. The preparation of these consolidated financial statements requires the Company to make estimates, assumptions and judgments that affect the reported amounts of assets, liabilities, revenues and expenses and related disclosure of contingent assets and liabilities. At each balance sheet date, management evaluates its estimates, including, but not limited to, those related to long-lived assets (property, plant and equipment, and identified intangible assets), goodwill, income taxes and business combinations. The Company bases its estimates on historical experience and various other assumptions that are believed to be reasonable under the circumstances. If management made different judgments or utilized different estimates, this could result in material differences in the amount and timing of the Company’s results of operations for any period. In addition, actual results could be different from the Company’s current estimates, possibly resulting in increased future charges to earnings.
The critical accounting policies that are most significantly affected by estimates, assumptions and judgments used in the preparation of the Company’s consolidated financial statements are discussed below.
Impairment of Long-Lived Assets As of December 31, 2019, the Company had $479.5 million of net property, plant and equipment and $334.0 million of net intangible assets. The Company routinely considers whether indicators of impairment of the value of its long-lived assets, particularly its manufacturing equipment, and its intangible assets, are present. A long-lived asset (or asset group) must be tested for recoverability whenever events or changes in circumstances (triggering events) indicate that its carrying amount may not be recoverable. The following are examples of such events or changes in circumstances:
a. | A significant decrease in the market price of a long-lived asset (or asset group); |
b. | A significant adverse change in the extent or manner in which a long-lived asset (or asset group) is being used or in its physical condition; |
c. | A significant adverse change in legal factors or in the business climate that could affect the value of a long-lived asset (or asset group), including an adverse action or assessment by a regulator; |
d. | An accumulation of costs significantly in excess of the amount originally expected for the acquisition or construction of a long-lived asset (or asset group); |
e. | A current-period operating or cash flow loss combined with a history of operating or cash flow losses or a projection or forecast that demonstrates continuing losses associated with the use of a long-lived asset (or asset group); and |
f. | A current expectation that, more likely than not, a long-lived asset (or asset group) will be sold or otherwise disposed of significantly before the end of its previously estimated useful life. |
If any such indicators are present, it is determined whether the sum of the estimated undiscounted cash flows attributable to the asset group in question is less than its carrying value. If less, an impairment loss is recognized based on the excess of the carrying amount of the assets in the group over its respective fair value. Fair value is determined by discounting estimated future cash flows, appraisals or other methods deemed appropriate. If the asset groups determined to be impaired are to be held and used, the Company recognizes an impairment charge to the extent the fair value attributable to the asset group is less than the assets’ carrying value. The fair value of the assets then becomes the assets’ new carrying value, which is depreciated or amortized over the remaining estimated useful life of the assets.
33
The Company’s long-lived assets are grouped with other assets and liabilities at the lowest level (asset groups) for which the identifiable cash flows are largely independent of the cash flows of other assets and liabilities. As described above, the evaluation of the recoverability of long-lived assets requires the Company to make significant estimates and assumptions. These estimates and assumptions primarily include, but are not limited to, the identification of the asset group at the lowest level of independent cash flows, the primary asset of the group and long-range forecasts of revenue and costs, reflecting management’s assessment of general economic and industry conditions, operating income, depreciation and amortization and working capital requirements.
Due to the inherent uncertainty involved in making estimates, actual results could differ from those estimates. In addition, changes in the underlying assumptions would have a significant impact on the conclusion that an asset group’s carrying value is recoverable, or the determination of any impairment charge if it was determined that the asset values were indeed impaired. The Company regularly monitors circumstances and events to determine whether asset impairment testing is warranted. It is possible that in the future the Company may conclude that there is impairment of certain of its long-lived assets, and that significant impairment charges of long-lived assets may occur in future periods.
Goodwill Goodwill is not subject to amortization and is tested for impairment annually and whenever events or changes in circumstances indicate that impairment may have occurred. The Company performs its annual impairment test as of August 31. The Company first assesses qualitative factors to determine whether it is more likely than not (that is, a likelihood of more than 50%) that the fair value of a reporting unit is less than its carrying amount, including goodwill. If, after assessing qualitative factors, the Company determines that it is more likely than not that the fair value of a reporting unit is less than its carrying amount, then a two-step impairment test is performed to identify potential goodwill impairment and measure the amount of goodwill impairment loss to be recognized, if any.
As of August 31, 2019, the Company’s assessment of qualitative factors informed its conclusion that it was more likely than not that a goodwill impairment did not occur. The significant qualitative factors considered include a significant increase in the Company’s share price, increasing revenues and operating cash flow for each of the Company’s reporting units combined with solid demand in the semiconductor industry driven by the Internet of Things, 5G, autonomous car and artificial intelligence/machine learning applications. The Company noted that a significant number of its very largest customers purchase from all of the Company’s reporting units. For example, approximately 25 customers, accounting for approximately 56% of net sales, purchase from all of the Company’s reporting units.
Income Taxes In the preparation of the Company’s consolidated financial statements, the income tax expense, deferred tax assets and liabilities, and reserves for unrecognized tax benefits reflect management’s best assessment of estimated current and future taxes to be paid. The Company is subject to income taxes in both the United States and numerous foreign jurisdictions. Significant judgments and estimates are required in determining consolidated income tax expense.
Deferred income taxes arise from temporary differences between the tax basis of assets and liabilities and their reported amounts in the consolidated financial statements, which will result in taxable or deductible amounts in the future. In evaluating the Company’s ability to recover its deferred tax assets within the jurisdiction from which they arise, management considers all available positive and negative evidence, including scheduled reversals of deferred tax liabilities, projected future taxable income, tax-planning strategies, and results of recent operations. In projecting future taxable income, the Company begins with historical results and incorporates assumptions about the amount of future state, federal and foreign pretax operating income adjusted for items that do not have tax consequences. The assumptions about future taxable income require significant judgment and are consistent with the plans and estimates management is using to manage the underlying business. In evaluating the objective evidence that historical results provide, the Company considers three years of cumulative operating income.
The Company has deferred tax assets related to certain state and foreign credit carryforwards and net operating loss carryforwards of $22.3 million and $18.8 million as of December 31, 2019 and 2018, respectively. Management believes it is more likely than not that the benefit from a portion of these carryforwards will not be realized. In recognition of this risk, the Company provided a valuation allowance of $20.1 million and $18.1 million as of December 31, 2019 and 2018, respectively, relating to these carryforwards. If the Company’s assumptions change and it determines it will be able to realize these carryforwards, the tax benefits relating to any reversal of the valuation allowance on the deferred tax assets will be recognized as a reduction of income tax expense.
The calculation of tax liabilities involves dealing with uncertainties in the application of complex tax laws and regulations in a multitude of jurisdictions across our global operations. A tax benefit from an uncertain tax position may be recognized when it is more likely than not that the position will be sustained upon examination, including resolutions of any related appeals or litigation processes, on the basis of the technical merits. Resolution of these uncertainties in a manner inconsistent with management’s expectations could have a material impact on the Company’s financial condition and operating results.
Business Acquisitions
34
The Company accounts for acquired businesses using the acquisition method of accounting which requires that the assets acquired and liabilities assumed be recorded at the date of acquisition at their respective fair values. The judgments made in determining the estimated fair value assigned to each class of assets acquired and liabilities assumed, as well as asset lives, can materially impact net income. Accordingly, for significant items, the Company typically obtains assistance from a third-party valuation firm.
There are several methods that can be used to determine the fair value of assets acquired and liabilities assumed in a business combination. For intangible assets, the Company normally utilizes the “income method.” This method starts with a forecast of all of the expected future net cash flows attributable to the subject intangible asset. These cash flows are then adjusted to present value by applying an appropriate discount rate that reflects the risk factors associated with the cash flow streams. Depending on the asset valued, the key assumptions included one or more of the following: (1) future revenue growth rates, (2) future gross margin, (3) future selling general and administrative expense, (4) royalty rates, and (5) discount rates.
Estimating the useful life of an intangible asset also requires judgment. For example, different types of intangible assets will have different useful lives, influenced by the nature of the asset, competitive environment, and rate of change in the industry. Certain assets may even be considered to have indefinite useful lives. All of these judgments and estimates can significantly impact the determination of the amortization period of the intangible asset, and thus net income.
Results of Operations
Year ended December 31, 2019 compared to year ended December 31, 2018
The following table sets forth the results of operations and the relationship between various components of operations, stated as a percent of net sales, for the years ended December 31, 2019 and 2018.
(Dollars in thousands) | 2019 | 2018 | |||||||||||
% of net sales | % of net sales | ||||||||||||
Net sales | $ | 1,591,066 | 100.0 | % | $ | 1,550,497 | 100.0 | % | |||||
Cost of sales | 879,413 | 55.3 | 830,666 | 53.6 | |||||||||
Gross profit | 711,653 | 44.7 | 719,831 | 46.4 | |||||||||
Selling, general and administrative expenses | 284,807 | 17.9 | 246,534 | 15.9 | |||||||||
Engineering, research and development expenses | 121,140 | 7.6 | 118,456 | 7.6 | |||||||||
Amortization of intangible assets | 66,428 | 4.2 | 62,152 | 4.0 | |||||||||
Operating income | 239,278 | 15.0 | 292,689 | 18.9 | |||||||||
Interest expense | 46,962 | 3.0 | 34,094 | 2.2 | |||||||||
Interest income | (4,652 | ) | (0.3 | ) | (3,839 | ) | (0.2 | ) | |||||
Other (income) expense, net | (121,081 | ) | (7.6 | ) | 8,002 | 0.5 | |||||||
Income before income taxes | 318,049 | 20.0 | 254,432 | 16.4 | |||||||||
Income tax expense | 63,189 | 4.0 | 13,677 | 0.9 | |||||||||
Net income | $ | 254,860 | 16.0 | $ | 240,755 | 15.5 | |||||||
Net sales For the year ended December 31, 2019, net sales were $1,591.1 million, up $40.6 million, or 3%, from sales for the year ended December 31, 2018. An analysis of the factors underlying the increase in net sales is presented in the following table:
(In thousands) | |||
Net sales in 2018 | $ | 1,550,497 | |
Increase, net associated with acquired businesses and divestiture | 95,003 | ||
Decrease associated with volume and pricing | (42,574 | ) | |
Decrease associated with divestiture | (7,377 | ) | |
Decrease associated with effect of foreign currency translation | (4,483 | ) | |
Net sales in 2019 | $ | 1,591,066 | |
The Company’s sales increase was primarily due to sales associated with the Company’s recent acquisitions of $95.0 million, offset primarily by the absence of sales associated with a divestiture of an entity in 2018 and net unfavorable foreign currency translation effects of $4.5 million, mainly due to the weakening of the Korean won, Euro and Taiwanese dollar relative to the
35
U.S. dollar. Exclusive of these factors, sales decreased $42.6 million, or 3% to $1,508 million for the year, mainly from a decreased customer demand from the semiconductor market compared to the year ago.
Sales percentage on a geographic basis for the years ended December 31, 2019 and 2018 and the percentage increase (decrease) in sales for the year ended December 31, 2019 compared to the sales for the year ended December 31, 2018 were as follows:
Year ended | ||||||||
December 31, 2019 | December 31, 2018 | Percentage increase (decrease) in sales | ||||||
Taiwan | 19 | % | 19 | % | 7 | % | ||
North America | 24 | % | 22 | % | 10 | % | ||
South Korea | 15 | % | 16 | % | 1 | % | ||
Japan | 13 | % | 14 | % | (2 | )% | ||
China | 13 | % | 13 | % | 5 | % | ||
Europe | 8 | % | 9 | % | (4 | )% | ||
Southeast Asia | 7 | % | 8 | % | (12 | )% | ||
The increase in sales for North America and China was primarily driven by sales from acquisitions. The increase in sales from Taiwan was primarily driven from strong recovery from a major customer in 2019 compared to 2018. The decrease in sales from Europe relates to the absence of sales from the divestiture of a business in the fourth quarter of 2018. The decrease in sales from Southeast Asia relates to lower sales of specialty materials products.
Demand drivers for the Company’s business primarily consist of semiconductor fab utilization and production (unit-driven) as well as capital spending for new or upgraded semiconductor fabrication equipment and facilities (capital-driven). The Company analyzes sales of its products by these two key drivers. Sales of unit-driven products represented 70% of total sales and sales of capital-driven products represented 30% of total sales in both 2019 and 2018.
Gross profit Gross profit for 2019 decreased by $8.2 million, to $711.7 million, a decrease of 1% from $719.8 million for 2018. The gross margin rate for 2019 was 44.7% versus 46.4% for 2018. The gross profit and gross margin decrease reflects lower factory utilization associated with weaker sales levels and an unfavorable sales mix. The gross profit and gross margin figures include an incremental cost of sales charge of $7.5 million and $6.9 million, respectively, associated with the sale of inventory acquired in recent business acquisitions for the years ended December 31, 2019 and 2018 and $1.3 million and $0.5 million of restructuring charges for the year ended December 31, 2019 and 2018, respectively. Excluding those charges, the Company’s gross profit and gross margin for the year ended December 31, 2019 and 2018 were $720.5 million and $727.2 million, respectively, and 45.3% and 46.9%, respectively.
Selling, general and administrative expenses
Selling, general and administrative expense (SG&A) consists primarily of payroll and related expenses for the sales and administrative staff, professional fees (including accounting, legal and technology costs and expenses), and sales and marketing costs. SG&A expenses for 2019 increased $38.3 million, or 16%, to $284.8 million from $246.5 million in 2018. SG&A expenses, as a percent of net sales, increased to 17.9% from 15.9% a year earlier, reflecting primarily from the increase in deal and integration costs.
An analysis of the factors underlying the increase in SG&A is presented in the following table:
(In thousands) | |||
Selling, general and administrative expenses in 2018 | $ | 246,534 | |
Deal costs | 21,043 | ||
Severance and restructuring costs | 9,193 | ||
Integration costs | 6,695 | ||
Professional fees | 2,715 | ||
Travel costs | (2,192 | ) | |
Other increases, net | 819 | ||
Selling, general and administrative expenses in 2019 | $ | 284,807 | |
Engineering, research and development expenses
Engineering, research and development (ER&D) expenses consist of expenses for the support of current product lines and the development of new products and manufacturing technologies. These expenses were $121.1 million and $118.5 million in 2019 and 2018, respectively. ER&D expenses as a percent of net sales were 7.6% in both 2019 and 2018.
36
An analysis of the factors underlying the increase ER&D is presented in the following table:
(In thousands) | |||
Engineering, research and development expense in 2018 | $ | 118,456 | |
Employee costs | 3,769 | ||
Severance and restructuring costs | 1,965 | ||
Project related costs | (5,698 | ) | |
Other increases, net | 2,648 | ||
Engineering, research and development expense in 2019 | $ | 121,140 | |
The Company’s overall ER&D efforts will continue to focus on the support or extension of current product lines, the development of its technologies to create differentiated and high-value products for the most advanced and demanding semiconductor applications and leveraging its unique and diverse technology portfolio to develop innovative, integrated solutions for unmet customer needs. The Company expects ER&D costs to stay relatively stable as a percentage of net sales.
Amortization of intangible assets Amortization of intangible assets was $66.4 million in 2019 compared to $62.2 million for 2018. The increase reflects the additional amortization expense of $6.6 million associated with the Company’s recent 2019 and 2018 acquisitions as discussed in note 3 to the consolidated financial statements, offset primarily by the elimination of amortization expense of $2.0 million for identifiable developed technology and customer relationship assets acquired in the Poco acquisition.
Interest expense Interest expense was $47.0 million and $34.1 million in the years ended December 31, 2019 and 2018, respectively. Interest expense includes interest associated with debt outstanding and the amortization of debt issuance costs associated with such borrowings. The increase primarily reflects higher average debt levels in 2019 and a $1.6 million charge related the adjustment of the fair value of the fixed deferred payment owed to the sellers of its DSC acquisition. The Company entered into a settlement agreement to accelerate a fixed deferred payment of $16.1 million to no later than March 8, 2020. The Company adjusted the fair value of the fixed deferred payment from its fair value to the stated value resulting in the additional aforementioned charge.
Interest income Interest income was $4.7 million and $3.8 million in the years ended December 31, 2019 and 2018, respectively. The increase reflects higher average U.S. cash levels earning a higher rate of interest.
Other (income) expense, net Other income, net, was $121.1 million in 2019 compared to other expense, net, of $8.0 million in 2018.
In 2019, other income, net consisted mainly of net proceeds received of $122.0 million resulting from the termination of the merger agreement with Versum (see note 9 to the Company’s consolidated financial statements).
In 2018, other expense, net, included foreign currency transaction losses of $4.4 million, a loss of extinguishment of debt of $2.3 million associated with the redemption of the Company’s senior secured term loan facility due 2021 and asset-based revolving credit facility (see note 8 to the Company’s consolidated financial statements) and penalty charges of $1.1 million.
Income tax expense The Company recorded income tax expense of $63.2 million in 2019 compared to income tax expense of $13.7 million in 2018. The Company’s effective tax expense rate was 19.9% in 2019, compared to an effective tax rate of 5.4% in 2018.
The increase in the effective tax rate in 2019 from 2018 reflects several factors. The increase in the effective tax rate is primarily due to a $25.1 million benefit related to foreign tax credit generation and a $9.4 million benefit related to a dividends received deduction based on restructuring to simplify the legal entity structure in 2018 which did not recur in 2019. Additionally, the tax rate in 2019 includes a discrete tax charge of $9.4 million related to the reversal of the dividend received deduction benefit recorded in 2018. This discrete charge was recorded based on the issuance of final regulations during the second quarter of 2019. The discrete charge was partially offset by a benefit of $5.3 million recorded in the third quarter of 2019 based on the filing of the federal tax return. Additionally, in the second quarter 2019, the Company received a termination fee from Versum Materials, Inc. based on the termination of the Versum Merger Agreement. As a result of the termination fee, the Company released a valuation allowance on federal capital loss carryforwards and recorded a discrete benefit of $2.9 million.
Net income Net income was $254.9 million, or $1.87 per diluted share, in 2019 compared to net income of $240.8 million, or $1.69 per diluted share, in 2018. The increase reflects the Company’s aforementioned operating results described in greater detail above.
Non-GAAP Financial Measures Information The Company’s consolidated financial statements are prepared in conformity with accounting principles generally accepted in the United States (GAAP). The Company also utilizes certain non-GAAP financial measures as a complement to financial measures provided in accordance with GAAP in order to better assess and
37
reflect trends affecting the Company’s business and results of operations. See “Non-GAAP Information” included below in this section for additional detail, including the reconciliation of the Company’s non-GAAP measures to the most directly comparable GAAP measures.
The Company’s non-GAAP financial measures are Adjusted EBITDA and Adjusted Operating Income, together with related percentage changes, and non-GAAP Earnings Per Share (EPS).
Adjusted EBITDA was flat at $436.8 million in 2019, compared to $436.1 million in 2018. Adjusted EBITDA, as a percent of net sales, was 27.5% in 2019 compared to 28.1% in 2018. Adjusted Operating Income decreased 2% to $361.8 million in 2019, compared to $371.0 million in 2018. Adjusted Operating Income, as a percent of net sales, was 22.7% in 2019 compared to 23.9% in 2018. Non-GAAP Earnings Per Share increased 2% to $1.93 in 2019, compared to $1.89 in 2018. The decline in the Adjusted EBITDA and Adjusted Operating Income as a percentage of net sales reflects the decrease in gross profit. In addition, Non-GAAP Earnings Per Share was positively affected by lower diluted weighted average shares outstanding from the stock repurchases during 2019.
Segment Analysis
The Company reports its financial performance based on three reporting segments. In the first quarter of 2019, the Company changed its definition of segment profit to include inter-segment sales. Prior quarter information has been recast to reflect the change in the Company’s definition of segment profit. See note 16 to the consolidated financial statements for additional information on the Company’s three segments.
The following table and discussion concern the results of operations of the Company’s three reportable segments for the years ended December 31, 2019 and 2018.
(In thousands) | 2019 | 2018 | |||||
Specialty Chemicals and Engineered Materials | |||||||
Net sales | $ | 526,519 | $ | 530,241 | |||
Segment profit | 98,327 | 127,080 | |||||
Microcontamination Control | |||||||
Net sales | $ | 633,664 | $ | 553,838 | |||
Segment profit | 194,398 | 166,852 | |||||
Advanced Materials Handling | |||||||
Net sales | $ | 458,290 | $ | 493,404 | |||
Segment profit | 75,173 | 92,327 | |||||
Specialty Chemicals and Engineered Materials (SCEM)
For the year ended December 31, 2019, SCEM net sales decreased to $526.5 million, down 1%, from $530.2 million in the comparable period last year. The sales decrease was mainly due to decreased sales of specialty materials, specialty gases and surface prep and integration products, partially offset by $10.9 million of sales from the acquisition of DSC in the first quarter of 2019, $16.7 million sales from the acquisition of MPD in the third quarter of 2019 and improved sales from advanced deposition products.
SCEM reported a segment profit of $98.3 million for the year ended December 31, 2019, down 23%, compared to a $127.1 million segment profit in the year-ago period. The decrease in the SCEM’s profit in 2019 was primarily due to decreased sales, an incremental cost of sales charge of $6.9 million associated with the sale of inventory acquired in recent business acquisitions, unfavorable product mix and higher operating expenses of 3% mainly due to higher employee costs and R&D spending.
Microcontamination Control (MC)
For the year ended December 31, 2019, MC net sales increased to $633.7 million, up 14%, from $553.8 million in the comparable period last year. The sales increase was due to the acquisition of SPG in the second quarter of 2018, which contributed an additional $61.3 million of sales, $5.1 million of sales from the acquisition of Anow in the third quarter of 2019, and improved sales from liquid chemistry filters for wet, etch and clean applications and photolithography products, partially offset by weakened sales from gas microcontamination products.
MC reported a segment profit of $194.4 million for the year ended December 31, 2019, up 17%, compared to a $166.9 million segment profit in the year-ago period. The increase in MC’s profit in 2019 reflects increased sales, partially offset by higher operating expenses of 8%, primarily due to higher employee costs, increased R&D spending and SPG operating infrastructure.
Advanced Materials Handling (AMH)
For the year ended December 31, 2019, AMH net sales decreased 7% to $458.3 million, from $493.4 million in 2018. This decrease was mainly due to decreased sales of fluid handling products, liquid packaging and dispense products, wafer and reticle handling products and wafer shipping products.
38
AMH reported a segment profit of $75.2 million for the year ended December 31, 2019, down 19% compared to a $92.3 million segment profit in the year-ago period. The decrease in the AMH’s profit in 2019 was primarily due to lower sales.
Unallocated general and administrative expenses
Unallocated general and administrative expenses for the year ended December 31, 2019 totaled $62.2 million compared to $31.4 million for the year ended December 31, 2018. The $30.8 million increase mainly reflects the deal and integration costs of $27.7 million in the discussion of SG&A above.
Results of Operations
Year ended December 31, 2018 compared to year ended December 31, 2017
The following table sets forth the results of operations and the relationship between various components of operations, stated as a percent of net sales, for the years ended December 31, 2018 and 2017. The Company’s historical financial data was derived from its consolidated financial statements and related notes included elsewhere in this annual report.
(Dollars in thousands) | 2018 | 2017 | |||||||||||
% of net sales | % of net sales | ||||||||||||
Net sales | $ | 1,550,497 | 100.0 | % | $ | 1,342,532 | 100.0 | % | |||||
Cost of sales | 830,666 | 53.6 | 733,547 | 54.6 | |||||||||
Gross profit | 719,831 | 46.4 | 608,985 | 45.4 | |||||||||
Selling, general and administrative expenses | 246,534 | 15.9 | 216,194 | 16.1 | |||||||||
Engineering, research and development expenses | 118,456 | 7.6 | 106,951 | 8.0 | |||||||||
Amortization of intangible assets | 62,152 | 4.0 | 44,023 | 3.3 | |||||||||
Operating income | 292,689 | 18.9 | 241,817 | 18.0 | |||||||||
Interest expense | 34,094 | 2.2 | 32,343 | 2.4 | |||||||||
Interest income | (3,839 | ) | (0.2 | ) | (715 | ) | (0.1 | ) | |||||
Other expense, net | 8,002 | 0.5 | 25,458 | 1.9 | |||||||||
Income before income taxes | 254,432 | 16.4 | 184,731 | 13.8 | |||||||||
Income tax expense | 13,677 | 0.9 | 99,665 | 7.4 | |||||||||
Net income | $ | 240,755 | 15.5 | $ | 85,066 | 6.3 | |||||||
Net sales For the year ended December 31, 2018, net sales were $1,550.5 million, up $208.0 million, or 15%, from sales for the year ended December 31, 2017. An analysis of the factors underlying the increase in net sales is presented in the following table:
(In thousands) | |||
Net sales in 2017 | $ | 1,342,532 | |
Organic growth associated with volume and pricing | 119,820 | ||
Increase associated with acquired businesses | 79,980 | ||
Increase associated with effect of foreign currency translation | 8,165 | ||
Net sales in 2018 | $ | 1,550,497 | |
The Company’s sales increase was due to strong across-the-board demand for the Company’s products from semiconductor industry customers, reflecting both higher industry fab utilization and semiconductor industry capital spending compared to the year-ago period. This sales increase reflected improved sales of fluid handling products, liquid chemistry filtration solutions and certain specialty materials products. Exclusive of the sales of the acquired businesses of $80.0 million of revenue for 2018 and the favorable currency translation effects of $8.2 million for the year, mainly due to the strengthening of the Japanese yen, Korean won and Euro relative to the U.S. dollar, the Company’s sales grew 9% in 2018 when compared to 2017.
On a geographic basis, in 2018, total sales to Taiwan were 19%, to North America were 22%, to South Korea were 16%, to Japan were 14%, to China were 13%, to Europe were 9% and to Southeast Asia were 7%. In 2017, total sales to Taiwan were 22%, to North America were 21%, to South Korea were 16%, to Japan were 13%, to China were 11%, to Europe were 9%, and to Southeast Asia were 8%. From 2017 to 2018, net sales to customers in South Korea, China, Europe, North America, Japan and Southeast Asia increased 12%, 37%, 15%, 21%, 24%, and 7%, respectively, while net sales to customers in Taiwan were flat.
Demand drivers for the Company’s business primarily consist of semiconductor fab utilization and production (unit-driven) as well as capital spending for new or upgraded semiconductor fabrication equipment and facilities (capital-driven). The Company
39
analyzes sales of its products by these two key drivers. Sales of unit-driven products represented 70% of total sales and sales of capital-driven products represented 30% of total sales in 2018. This compares to a unit-driven to capital-driven ratio of 74%:26% for 2017 as a result of the acquisition of the Pure Gas business in 2018.
Gross profit Gross profit for 2018 increased by $110.8 million, to $719.8 million, an increase of 18% from $609.0 million for 2017. The gross margin rate for 2018 was 46.4% versus 45.4% for 2017. The gross profit and gross margin improvements reflect the improved factory utilization associated with strong sales levels and a slightly favorable sales mix. These factors were partly offset by an incremental cost of sales charge of $6.9 million associated with the sale of inventory acquired in the SAES Pure Gas business acquisition and price erosion for certain products in response to normal competitive pressures. In addition, the gross profit and gross margin figures include impairment charges of $0.4 million and $6.1 million for the year ended December 31, 2018 and 2017, respectively, related to equipment-related and severance related to organization realignment charges.
Selling, general and administrative expenses
Selling, general and administrative expense (SG&A) consists primarily of payroll and related expenses for the sales and administrative staff, professional fees (including accounting, legal and technology costs and expenses), and sales and marketing costs. SG&A expenses for 2018 increased $30.3 million, or 14%, to $246.5 million from $216.2 million in 2017. SG&A expenses, as a percent of net sales, decreased to 15.9% from 16.1% a year earlier, reflecting the increase in net sales.
An analysis of the factors underlying the increase in SG&A is presented in the following table:
(In thousands) | |||
Selling, general and administrative expenses in 2017 | $ | 216,194 | |
Deal costs | 5,121 | ||
Integration costs | 3,237 | ||
Employee costs | 15,181 | ||
Professional fees | 2,842 | ||
Travel costs | 2,164 | ||
Impairment charge related to acquired intangible assets recorded in prior year | (3,866 | ) | |
Other increases, net | 5,661 | ||
Selling, general and administrative expenses in 2018 | $ | 246,534 | |
Engineering, research and development expenses
Engineering, research and development (ER&D) expenses related to the support of current product lines and the development of new products and manufacturing technologies was $118.5 million and $107.0 million in 2018 and 2017, respectively. ER&D expenses as a percent of net sales were 7.6% compared to 8.0% a year ago, reflecting the increase in net sales, offset by the increase in ER&D expenditures levels, primarily due to higher employee costs of $7.8 million and project costs of $3.5 million.
The Company’s overall ER&D efforts will continue to focus on the support or extension of current product lines, the development of its technologies to create differentiated and high-value products for the most advanced and demanding semiconductor applications and leveraging its unique and diverse technology portfolio to develop innovative, integrated solutions for unmet customer needs. The Company expects ER&D costs to stay relatively stable as a percentage of net sales.
Amortization of intangible assets Amortization of intangible assets was $62.2 million in 2018 compared to $44.0 million for 2017. The increase reflects the the additional amortization expense associated with the PSS acquisition completed in the first quarter of 2018 and the SPG acquisition completed in the second quarter of 2018.
Interest expense Interest expense was $34.1 million and $32.3 million in the years ended December 31, 2018 and 2017, respectively. Interest expense includes interest associated with debt outstanding and the amortization of debt issuance costs associated with such borrowings. The increase in 2018 reflects higher average debt levels.
Interest income Interest income was $3.8 million and $0.7 million in the years ended December 31, 2018 and 2017, respectively. The increase reflects higher average U.S. cash levels earning a higher rate of interest.
Other expense, net Other expense, net, was $8.0 million in 2018 compared to other expense, net, of $25.5 million in 2017.
In 2018, other expense, net, included a loss of extinguishment of debt of $2.3 million associated with the redemption of the Company’s senior secured term loan facility due 2021 and asset-based revolving credit facility (see note 8 to the Company’s consolidated financial statements), foreign currency transaction losses of $4.4 million and penalty charges of $1.1 million.
In 2017, other expense, net, included an impairment charge of $2.8 million, a loss of extinguishment of debt of $20.7 million associated with the redemption of the Company’s 2022 Notes (see note 8 to the Company’s consolidated financial statements), and foreign currency transaction losses of $2.3 million.
40
Income tax expense The Company recorded income tax expense of $13.7 million in 2018 compared to income tax expense of $99.7 million in 2017. The Company’s effective tax expense rate was 5.4% in 2018, compared to an effective tax rate of 54.0% in 2017.
The decrease in the effective tax rate in 2018 from 2017 reflects several factors. The decrease in the effective rate is primarily due to the reduction in the U.S. corporate tax rate from 35% in 2017 to 21% in 2018. Additionally, in 2018, the Company recorded a $25.1 million benefit related to foreign tax credit generation and a $9.4 million benefit related to a dividend received deduction based on a restructuring to simplify its legal entity structure. In 2017, the effective tax rate increased due to the recognition of the one-time mandatory repatriation transition tax of $73.0 million on the net accumulated earnings and profits of the Company’s foreign subsidiaries and $4.0 million of incremental tax related to no longer asserting that a significant portion of the Company’s undistributed earnings are considered indefinitely invested overseas. The increase was partially offset by the remeasurement of the U.S. deferred taxes of $10.3 million to reflect the lower U.S. federal tax rate.
The $9.4 million tax benefit for the dividends received deduction was based on the Company’s assessment of the treatment under the provisions of the Tax Cuts and Jobs Act. Congress or the Department of Treasury may provide legislative or regulatory updates which would change the Company’s assessment. If legislative or regulatory updates are issued related to this item, the timing of which is uncertain, the Company may be required to recognize additional tax expense up to the full amount of the $9.4 million in the period such updates are issued.
Net income Net income was $240.8 million, or $1.69 per diluted share, in 2018 compared to net income of $85.1 million, or $0.59 per diluted share, in 2017. The decrease reflects the Company’s aforementioned operating results described in greater detail above.
Non-GAAP Measures Information The Company’s consolidated financial statements are prepared in conformity with accounting principles generally accepted in the United States (GAAP). The Company also utilizes certain non-GAAP financial measures as a complement to financial measures provided in accordance with GAAP in order to better assess and reflect trends affecting the Company’s business and results of operations. See “Non-GAAP Information” included below in this section for additional detail, including the reconciliation of GAAP measures to the Company’s non-GAAP measures.
The Company’s non-GAAP financial measures are Adjusted EBITDA and Adjusted Operating Income, together with related measures thereof, and non-GAAP Earnings Per Share (EPS).
Adjusted EBITDA increased 22% to $436.1 million in 2018, compared to $357.1 million in 2017. Adjusted EBITDA, as a percent of net sales, was 28.1% in 2018 compared to 26.6% in 2017. Adjusted Operating Income increased 24% to $371.0 million in 2018, compared to $298.9 million in 2017. Adjusted Operating Income, as a percent of net sales, was 23.9% in 2018 compared to 22.3% in 2017. Non-GAAP Earnings Per Share increased 31% to $1.89 in 2018, compared to $1.44 in 2017. The improvement in the Adjusted EBITDA and Adjusted Operating Income reflects the increase in net sales and related increase in gross profit. In addition, Non-GAAP Earnings Per Share was positively affected by a lower adjusted effective tax rate.
Segment Analysis
The Company reports its financial performance based on three reporting segments. In the first quarter of 2019, the Company changed its definition of segment profit to include inter-segment sales. Prior quarter information has been recast to reflect the change in the Company’s definition of segment profit. See note 16 to the consolidated financial statements for additional information on the Company’s three segments.
The following table and discussion concern the results of operations of the Company’s three reportable segments for the years ended December 31, 2018 and 2017.
(In thousands) | 2018 | 2017 | |||||
Specialty Chemicals and Engineered Materials | |||||||
Net sales | $ | 530,241 | $ | 485,470 | |||
Segment profit | 127,080 | 109,571 | |||||
Microcontamination Control | |||||||
Net sales | $ | 553,838 | $ | 436,812 | |||
Segment profit | 166,852 | 134,439 | |||||
Advanced Materials Handling | |||||||
Net sales | $ | 493,404 | $ | 444,743 | |||
Segment profit | 92,327 | 69,043 | |||||
Specialty Chemicals and Engineered Materials (SCEM)
For the year ended December 31, 2018, SCEM net sales increased to $530.2 million, up 9%, from $485.5 million in the comparable period last year. The sales increase primarily reflects strong product sales for specialty gases and specialty materials.
41
SCEM reported a segment profit of $127.0 million for the year ended December 31, 2018, up 16%, compared to a $109.6 million segment profit in the year-ago period. The increase in the SCEM’s profit in 2018 was primarily due to increased sales, partially offset by higher operating expenses of 8% mainly due to higher employee costs and R&D spending.
Microcontamination Control (MC)
For the year ended December 31, 2018, MC net sales increased to $553.8 million, up 27%, from $436.8 million in the comparable period last year. The sales increase primarily reflects strength in photolithography applications, liquid chemistry filters for wet, etch and clean driven by strong industry tool shipments, and the acquisition of SPG in the second quarter of 2018, which contributed $62.4 million of sales.
MC reported a segment profit of $166.9 million for the year ended December 31, 2018, up 24%, compared to a $134.4 million segment profit in the year-ago period. The increase in MC’s profit in 2018 reflects increased sales, partially offset by higher operating expenses of 21%, primarily due to higher employee costs, increased R&D spending and SPG operating infrastructure.
Advanced Materials Handling (AMH)
For the year ended December 31, 2018, AMH net sales increased 11% to $493.4 million, from $444.7 million in 2017. The increase primarily reflects strong sales of fluid handling products and liquid packaging and dispense products, and the acquisition of PSS in the first quarter of 2018, which contributed $16.0 million of sales.
AMH reported a segment profit of $92.3 million for the year ended December 31, 2018, up 34% compared to a $69.0 million segment profit in the year-ago period. The increase in the AMH’s profit in 2018 was due to higher sales, partially offset by a 9% increase in operating expenses primarily related to higher employee costs and the absence of $7.1 million of impairment and severance related to organizational realignment from 2017.
Unallocated general and administrative expenses
Unallocated general and administrative expenses for the year ended December 31, 2018 totaled $31.4 million compared to $27.2 million for the year ended December 31, 2017. The $4.2 million increase mainly reflects the deal and integration costs of $8.4 million in the discussion of SG&A above, partially offset by the absence of $3.9 million of impairment charges related to certain acquired intangible assets recorded in 2017.
42
Quarterly Results of Operations
The following table presents selected data from the Company’s consolidated statements of operations for the eight quarters ended December 31, 2019. This unaudited information has been prepared on the same basis as the audited consolidated financial statements appearing elsewhere in this annual report. All adjustments that management considers necessary for the fair presentation of the unaudited information have been included in the quarters presented.
QUARTERLY STATEMENTS OF OPERATIONS DATA
2018 | 2019 | ||||||||||||||||||||||||||||||
Q1 | Q2 | Q3 | Q4 | Q1 | Q2 | Q3 | Q4 | ||||||||||||||||||||||||
(In thousands) | |||||||||||||||||||||||||||||||
Net sales | $ | 367,199 | $ | 383,059 | $ | 398,597 | $ | 401,642 | $ | 391,047 | $ | 378,874 | $ | 394,147 | $ | 426,998 | |||||||||||||||
Gross profit | 175,997 | 182,378 | 181,716 | 179,740 | 177,393 | 166,274 | 170,350 | 197,636 | |||||||||||||||||||||||
Selling, general and administrative expenses | 58,269 | 65,200 | 62,358 | 60,707 | 82,254 | 64,150 | 71,232 | 67,171 | |||||||||||||||||||||||
Engineering, research and development expenses | 27,586 | 30,231 | 29,964 | 30,675 | 28,991 | 30,624 | 31,173 | 30,352 | |||||||||||||||||||||||
Amortization of intangible assets | 11,669 | 12,014 | 21,419 | 17,050 | 18,657 | 16,591 | 15,152 | 16,028 | |||||||||||||||||||||||
Operating income | 78,473 | 74,933 | 67,975 | 71,308 | 47,491 | 54,909 | 52,793 | 84,085 | |||||||||||||||||||||||
Net income | 57,562 | 54,349 | 48,060 | 80,784 | 32,658 | 123,997 | 40,767 | 57,438 | |||||||||||||||||||||||
Q1 | Q2 | Q3 | Q4 | Q1 | Q2 | Q3 | Q4 | ||||||||||||||||||||||||
(Percent of net sales) | |||||||||||||||||||||||||||||||
Net sales | 100.0 | % | 100.0 | % | 100.0 | % | 100.0 | % | 100.0 | % | 100.0 | % | 100.0 | % | 100.0 | % | |||||||||||||||
Gross profit | 47.9 | 47.6 | 45.6 | 44.8 | 45.4 | 43.9 | 43.2 | 46.3 | |||||||||||||||||||||||
Selling, general and administrative expenses | 15.9 | 17.0 | 15.6 | 15.1 | 21.0 | 16.9 | 18.1 | 15.7 | |||||||||||||||||||||||
Engineering, research and development expenses | 7.5 | 7.9 | 7.5 | 7.6 | 7.4 | 8.1 | 7.9 | 7.1 | |||||||||||||||||||||||
Amortization of intangibles | 3.2 | 3.1 | 5.4 | 4.2 | 4.8 | 4.4 | 3.8 | 3.8 | |||||||||||||||||||||||
Operating income | 21.4 | 19.6 | 17.1 | 17.8 | 12.1 | 14.5 | 13.4 | 19.7 | |||||||||||||||||||||||
Net income | 15.7 | 14.2 | 12.1 | 20.1 | 8.4 | 32.7 | 10.3 | 13.5 | |||||||||||||||||||||||
The Company’s quarterly results of operations have been, and will likely continue to be, subject to significant fluctuations due to a myriad of factors, many of which are beyond the Company’s control. The variability in sales, and its corresponding effect on gross profit, are generally the most important factors underlying the changes in the Company’s operating income and net income over the past eight quarters.
Liquidity and Capital Resources
We consider the following when assessing our liquidity and capital resources:
In thousands | December 31, 2019 | December 31, 2018 | ||||||
Cash and cash equivalents | $ | 351,911 | $ | 482,062 | ||||
Working capital | 667,964 | 759,670 | ||||||
Total debt | 936,484 | 938,863 | ||||||
The Company has historically financed its operations and capital requirements through cash flow from its operating activities, long-term loans, lease financing and borrowings under domestic and international short-term lines of credit.
In summary, our cash flows for each period were as follows:
Years ended (in thousands) | December 31, 2019 | December 31, 2018 | December 31, 2017 | ||||||||
Net cash provided by operating activities | $ | 382,298 | $ | 312,576 | $ | 293,373 | |||||
Net cash used in investing activities | (385,840 | ) | (485,944 | ) | (112,455 | ) | |||||
Net (used in) provided by cash financing activities | (126,820 | ) | 34,411 | 27,251 | |||||||
(Decrease) increase in cash and cash equivalents | $ | (130,151 | ) | $ | (143,346 | ) | $ | 219,019 | |||
Operating activities
Cash provided by operating activities is net income adjusted for certain non-cash items and changes in assets and liabilities.
43
For 2019 compared to 2018, the $69.7 million increase in cash provided by operating activities was primarily due to higher net income, depreciation and changes in working capital. Depreciation expense increased due to higher levels of capital spending in recent years. Changes in working capital for 2019 were driven by income taxes and inventories, offset by accounts payable and other accrued liabilities. The change for taxes was primarily the result in 2018 tax credits that were utilized against a one time toll charge accrual recorded in 2017. The change for inventory is due to lower production activity in 2019 compared to 2018. The decrease in accounts payable and accrued liabilities is due to lower accrued bonuses in 2019 and lower payables due to timing of payments.
For 2018 compared to 2017, the $19.2 million increase in cash provided by operating activities was primarily due to higher net income, offset by changes in working capital. Changes in working capital were driven by inventory and taxes. The increases in inventory were primarily the result of increased sales and production activity. The change for taxes was primarily related to a one time toll charge accrual recorded in 2017 as result of the tax reform and the utilization of tax credits against this accrual in 2018.
Investing activities
Investing cash flows consist primarily of capital expenditures, cash used for acquisitions and proceeds from sales of property and equipment.
The decrease in cash used in investing activities in 2019 compared to 2018 was primarily due to lower cash paid on acquisitions. This was partially offset by increased capital expenditures and lower proceeds from sales of property and equipment.
The increase in cash used in investing activities in 2018 compared to 2017 was primarily due to higher cash paid on acquisitions and increased capital expenditures.
Acquisition of property and equipment totaled $112.4 million, which primarily reflected investments in equipment and tooling. Capital expenditures in 2019 generally reflected more normalized capital spending levels. The Company expects its capital expenditures in 2020 to be approximately $120 million.
On March 8, 2019, the Company acquired DSC, which provides advanced materials to the specialty chemical, technology and pharmaceutical industries. The total purchase price of the acquisition was $64.1 million, net of cash acquired. The transaction is described in further detail in note 3 to the Company’s consolidated financial statements.
On July 15, 2019, the Company acquired MPD Chemicals, a provider of advanced materials to the specialty chemical, technology, and life sciences industries. The Company acquired MPD Chemicals for approximately $161.0 million, subject to revision for customary working capital adjustments. The transaction is described in further detail in note 3 to the Company’s consolidated financial statements.
On September 17, 2019, the Company acquired Anow, a filtration company for diverse industries including semiconductor, pharmaceutical, and medical. The Company acquired Anow for $72.8 million, net of cash acquired. The transaction is described in further detail in note 3 to the Company’s consolidated financial statements.
Financing activities
Financing cash flows consist primarily of repurchases of common stock, payment of dividends to stockholders, issuance and repayment of short-term and long-term debt, and proceeds from the sale of shares of common stock through employee equity incentive plans.
In 2019, there was $126.8 million of cash used in financing activities compared to $34.4 million cash provided by financing activities in 2018. The change was primarily due to net long-term debt activity, which was a use of cash of $4.0 million in 2019 compared to a source of cash of $266.2 million in 2018, primarily offset by decreased repurchases of common stock. During 2019, we repurchased $80.3 million of common stock under our authorized common stock repurchase program, compared to $173.8 million in 2018. Our total dividend payments were $40.6 million in 2019 compared to $39.6 million in 2018. We have paid a cash dividend in each of the past 9 quarters. In Q1 2020, the Board declared a quarterly cash dividend of $0.08 per share of common stock, payable on February 19, 2020 to stockholders of record on January 29, 2020.
The increase in cash provided by financing activities in 2018 compared to 2017 was primarily due to net long-term debt activity, which was a source of cash of $266.2 million compared to a source of cash of $90.0 million in 2017 and the absence of $16.2 million of debt extinguishment costs of in 2017 related to the redemption of the Company’s senior secured term loan facility due 2021, primarily, offset by increased repurchases of common stock. During 2018, we repurchased $173.8 million of common stock under our authorized common stock repurchase program, compared to $28.0 million in 2017. Also, offsetting the increase were dividend payments of $39.6 million in 2018 compared to $9.9 million in 2017. The Board declared its first quarterly dividend in the fourth quarter of 2017.
44
Other Liquidity and Capital Resources Considerations
In October 2019, the Company amended its credit and guaranty agreement (the “Credit Agreement”) dated as of November 6, 2018. The amendment changed the agency bank from Goldman Sachs Bank USA, as administrative agent and collateral agent, a to Morgan Stanley, and adds two additional lenders to the Company’s Credit Agreement. There was no change to the total commitment or the term length for either the Term Loan Facility or the Revolving Facility as defined in note 8 to the Company’s consolidated financial statement under Senior Secured Credit Facilities. However, the amendment changed the amount committed for each of the previous lenders.
The Company’s Term Loan Facility has a principal amount of $396 million outstanding that matures on November 6, 2025 and bears an interest rate of 3.80% at December 31, 2019.
The Company’s Revolving Facility has a senior secured revolving commitment facility in an aggregate amount of $300 million maturing November 6, 2023. The Revolving Facility bears interest at a rate per annum equal to, at the Company’s
option, a base rate (such as prime rate or LIBOR) plus, an applicable margin. At December 31, 2019, the only outstanding
amounts under the Revolving Facility were undrawn outstanding letters of credit of $0.2 million.
We have $550 million aggregate principal amount of 4.625% senior unsecured notes due February 10, 2026 outstanding.
Through December 31, 2019, the Company was in compliance with all applicable financial covenants included in the terms of its credit facilities.
The Company also has lines of credit with two banks that provide for borrowings of Japanese yen for the Company’s Japanese subsidiary equivalent to an aggregate of approximately $11.0 million. There were no outstanding borrowings under these lines of credit at December 31, 2019.
As of December 31, 2019, the Company’s sources of available funds were its cash and cash equivalents of $351.9 million, funds available under the Revolving Facility and international credit facilities and cash flow generated from operations. As of December 31, 2019, the amount of cash and cash equivalents held in certain of our foreign operations totaled approximately $180.4 million. As of December 31, 2019, we had not repatriated any of these funds to the U.S. However, to the extent we repatriate these funds to the U.S., we will be required to pay income taxes in certain U.S. states and applicable foreign withholding taxes on those amounts during the period when such repatriation occurs. We have accrued taxes for the tax effect of repatriating the funds to the U.S.
The Company believes its existing balances of domestic cash and cash equivalents and operating cash flows will be sufficient to meet the Company’s domestic cash needs arising in the ordinary course of business for the next twelve months. If available liquidity is not sufficient to meet the Company’s operating and debt service obligations as they come due, management would need to pursue alternative arrangements through additional equity or debt financing in order to meet the Company’s cash requirements. There can be no assurance that any such financing would be available on commercially acceptable terms, or at all.
New Accounting Pronouncements
Recently adopted accounting pronouncements Refer to note 1 to the Company’s consolidated financial statements for a discussion of accounting pronouncements implemented in 2019. Other than the adoption of ASU 2016-02 Leases, there were no recently issued accounting pronouncements adopted in 2019.
Recently issued accounting pronouncements Refer to note 1 of the Company’s consolidated financial statements for a discussion of accounting pronouncements recently issued but not yet adopted.
45
Contractual Obligations
The following table summarizes the maturities of the Company’s significant financial obligations as of December 31, 2019:
(In thousands) | Total | 2020 | 2021 | 2022 | 2023 | 2024 | Thereafter | ||||||||||||||||||||
Long-term debt1 | $ | 946,000 | $ | 4,000 | $ | 4,000 | $ | 4,000 | $ | 4,000 | $ | 4,000 | $ | 926,000 | |||||||||||||
Interest2 | 256,422 | 40,482 | 40,330 | 40,178 | 40,026 | 39,874 | 55,532 | ||||||||||||||||||||
Pension obligations | 6,036 | 40 | 225 | 113 | 201 | 399 | 5,058 | ||||||||||||||||||||
Capital purchase obligations3 | 27,064 | 27,064 | — | — | — | — | — | ||||||||||||||||||||
Supply purchase obligations4 | 15,785 | 7,506 | 7,506 | 773 | — | — | — | ||||||||||||||||||||
Operating leases | 67,548 | 12,407 | 10,221 | 6,909 | 6,055 | 5,052 | 26,904 | ||||||||||||||||||||
Total | $ | 1,318,855 | $ | 91,499 | $ | 62,282 | $ | 51,973 | $ | 50,282 | $ | 49,325 | $ | 1,013,494 | |||||||||||||
Unrecognized tax benefits5 | |||||||||||||||||||||||||||
1Debt obligations are classified based on their stated maturity date, regardless of their classification on the Company’s consolidated balance sheets.
2Interest projections on both variable and fixed rate long-term debt are based on interest rates effective as of December 31, 2019 and do not include $9.5 million for net unamortized discounts and debt issuance costs.
3Capital purchase obligations represent commitments for the construction or purchase of property, plant and equipment. They were not recorded as liabilities on the Company’s consolidated balance sheet as of December 31, 2019, as the Company had not yet received the related goods or taken title to the property.
4Supply purchase obligations represent commitments, including take-or-pay contracts, that are not presented as capital purchase commitments above.
5The Company had $16.2 million of total gross unrecognized tax benefits at December 31, 2019. The timing of any payments associated with these unrecognized tax benefits will depend on a number of factors. Accordingly, the Company cannot make reasonably reliable estimates of the amount and period of potential cash settlements, if any, with taxing authorities and are not included in the table above.
46
Non-GAAP Information The Company’s consolidated financial statements are prepared in conformity with accounting principles generally accepted in the United States (GAAP).
The Company also provides certain non-GAAP financial measures as a complement to financial measures provided in accordance with GAAP in order to better assess and reflect trends affecting the Company’s business and results of operations. These non-GAAP financial measures include Adjusted EBITDA and Adjusted Operating Income together with related measures thereof, and non-GAAP Earnings Per Share (EPS), as well as certain other supplemental non-GAAP financial measures included in the discussion of the Company’s financial results.
Adjusted EBITDA, a non-GAAP financial measure, is defined by the Company as net income before (1) income tax expense, (2) interest expense, (3) interest income, (4) other (income) expense, net, (5) charge for fair value write-up of acquired inventory sold, (6) deal costs, (7) integration costs, (8) severance and restructuring costs, (9) impairment of equipment and intangibles, (10) loss on sale of subsidiary, (11) amortization of intangible assets and (12) depreciation. Adjusted Operating Income, another non-GAAP financial measure, is defined by the Company as Adjusted EBITDA exclusive of the depreciation addback noted above. The Company also utilizes non-GAAP financial measures whereby Adjusted EBITDA and Adjusted Operating Income are each divided by the Company’s net sales to derive Adjusted EBITDA Margin and Adjusted Operating Margin, respectively.
Non-GAAP EPS, a non-GAAP financial measure, is defined by the Company as net income before (1) charge for fair value write-up of inventory sold, (2) deal costs, (3) integration costs, (4) severance and restructuring costs, (5) impairment of equipment and intangibles, (6) loss on debt extinguishment and modification, (7) Versum termination fee, net, (8) loss on sale of subsidiary, (9) amortization of intangible assets, (10) the tax effect of those adjustments to net income and discrete tax items, (11) the tax effect of legal entity restructuring and (12) the Tax Cuts and Jobs Act, divided by diluted weighted average shares outstanding.
The Company provides supplemental non-GAAP financial measures to better understand and manage its business and believes these measures provide investors and analysts additional and meaningful information for the assessment of the Company’s ongoing results. Management also uses these non-GAAP measures to assist in the evaluation of the performance of its business segments and to make operating decisions.
Management believes the Company’s non-GAAP measures help indicate the Company’s baseline performance before certain gains, losses or other charges that may not be indicative of the Company’s business or future outlook and offer a useful view of business performance in that the measures provide a more consistent means of comparing performance. The Company believes the non-GAAP measures aid investors’ overall understanding of the Company’s results by providing a higher degree of transparency for such items and providing a level of disclosure that will help investors understand how management plans, measures and evaluates the Company’s business performance. Management believes that the inclusion of non-GAAP measures provides greater consistency in its financial reporting and facilitates investors’ understanding of the Company’s historical operating trends by providing an additional basis for comparisons to prior periods.
Management uses Adjusted EBITDA and Adjusted Operating Income to assist it in evaluations of the Company’s operating performance by excluding items that management does not consider as relevant in the results of its ongoing operations. Internally, these non-GAAP measures are used by management for planning and forecasting purposes, including the preparation of internal budgets; for allocating resources to enhance financial performance; for evaluating the effectiveness of operational strategies; and for evaluating the Company’s capacity to fund capital expenditures, secure financing and expand its business.
In addition, and as a consequence of the importance of these non-GAAP financial measures in managing its business, the Company’s Board of Directors uses non-GAAP financial measures in the evaluation process to determine management compensation.
The Company believes that certain analysts and investors use Adjusted EBITDA, Adjusted Operating Income and non-GAAP EPS as supplemental measures to evaluate the overall operating performance of firms in the Company’s industry. Additionally, lenders or potential lenders use Adjusted EBITDA measures to evaluate the Company’s creditworthiness.
The presentation of non-GAAP financial measures is not meant to be considered in isolation, as a substitute for, or superior to, financial measures or information provided in accordance with GAAP. Management strongly encourages investors to review the Company’s consolidated financial statements in their entirety and to not rely on any single financial measure.
Management notes that the use of non-GAAP measures has limitations:
First, non-GAAP financial measures are not standardized. Accordingly, the methodology used to produce the Company’s non-GAAP financial measures is not computed under GAAP and may differ notably from the methodology used by other companies. For example, the Company’s non-GAAP measure of Adjusted EBITDA may not be directly comparable to EBITDA or an adjusted EBITDA measure reported by other companies.
47
Second, the Company’s non-GAAP financial measures exclude items such as amortization and depreciation that are recurring. Amortization of intangibles and depreciation have been, and will continue to be for the foreseeable future, a significant recurring expense with an impact upon the Company’s results of operations, notwithstanding the lack of immediate impact upon cash flows.
Third, there is no assurance the Company will not have future restructuring activities, gains or losses on sale of equity investments, contingent consideration fair value adjustments or similar items and, therefore, may need to record additional charges (or credits) associated with such items, including the tax effects thereon. The exclusion of these items from the Company’s non-GAAP measures should not be construed as an implication that these costs are unusual, infrequent or non-recurring.
Management considers these limitations by providing specific information regarding the GAAP amounts excluded from these non-GAAP financial measures and evaluating these non-GAAP financial measures together with their most directly comparable financial measures calculated in accordance with GAAP. The calculations of Adjusted EBITDA, Adjusted Operating Income, and non-GAAP EPS, and reconciliations between these financial measures and their most directly comparable GAAP equivalents are presented below in the accompanying tables.
The reconciliation of GAAP measures to Adjusted Operating Income and Adjusted EBITDA for the years ended December 31, 2019, 2018 and 2017 are presented below:
In thousands | 2019 | 2018 | 2017 | ||||||||
Net sales | $ | 1,591,066 | $ | 1,550,497 | $ | 1,342,532 | |||||
Net income | $ | 254,860 | $ | 240,755 | $ | 85,066 | |||||
Adjustments to net income | |||||||||||
Income tax expense | 63,189 | 13,677 | 99,665 | ||||||||
Interest expense | 46,962 | 34,094 | 32,343 | ||||||||
Interest income | (4,652 | ) | (3,839 | ) | (715 | ) | |||||
Other (income) expense, net | (121,081 | ) | 8,002 | 25,458 | |||||||
GAAP – Operating income | 239,278 | 292,689 | 241,817 | ||||||||
Charge for fair value write-up of acquired inventory sold | 7,544 | 6,868 | — | ||||||||
Deal costs | 26,164 | 5,121 | — | ||||||||
Integration costs | 9,932 | 3,237 | — | ||||||||
Severance and restructuring costs | 12,494 | 460 | 2,700 | ||||||||
Impairment of equipment and intangibles 1 | — | — | 10,400 | ||||||||
Loss on sale of subsidiary | — | 466 | — | ||||||||
Amortization of intangible assets | 66,428 | 62,152 | 44,023 | ||||||||
Adjusted operating income | 361,840 | 370,993 | 298,940 | ||||||||
Depreciation | 74,975 | 65,116 | 58,208 | ||||||||
Adjusted EBITDA | $ | 436,815 | $ | 436,109 | $ | 357,148 | |||||
Net income - as a % of net sales | 16.0 | % | 15.5 | % | 6.3 | % | |||||
Adjusted operating margin | 22.7 | % | 23.9 | % | 22.3 | % | |||||
Adjusted EBITDA – as a % of net sales | 27.5 | % | 28.1 | % | 26.6 | % | |||||
1Includes product line impairment charges of $5,330 classified as cost of sales for the years ended December 31, 2017.
Includes intangible impairment charge of $3,866 classified as selling, general and administrative expense for the year ended December 31, 2017.
Includes product line impairment charge of $320 classified as selling, general and administrative expense for the year ended December 31, 2017.
Includes product line impairment charge of $884 classified as engineering, research and development expense for the year ended December 31, 2017.
48
The reconciliation of GAAP measures to Non-GAAP Earnings per share for the years ended December 31, 2019, 2018 and 2017 are presented below:
In thousands, except per share data | 2019 | 2018 | 2017 | ||||||||
Net income | $ | 254,860 | $ | 240,755 | $ | 85,066 | |||||
Adjustments to net income: | |||||||||||
Charge for fair value write-up of acquired inventory sold | 7,544 | 6,868 | — | ||||||||
Deal costs | 26,575 | 5,121 | — | ||||||||
Integration costs | 9,932 | 3,237 | — | ||||||||
Severance and restructuring costs | 12,494 | 460 | 2,700 | ||||||||
Impairment of equipment and intangibles1 | — | — | 13,200 | ||||||||
Loss on debt extinguishment and modification | 1,980 | 2,319 | 20,687 | ||||||||
Versum termination fee, net | (122,000 | ) | — | — | |||||||
Loss on sale of subsidiary | — | 466 | — | ||||||||
Amortization of intangible assets | 66,428 | 62,152 | 44,023 | ||||||||
Tax effect of adjustments to net income and discrete tax items 2 | (3,124 | ) | (17,812 | ) | (26,046 | ) | |||||
Tax effect of legal entity restructuring | 9,398 | (34,478 | ) | — | |||||||
Tax effect of Tax Cuts and Jobs Act | — | 683 | 66,713 | ||||||||
Non-GAAP net income | $ | 264,087 | $ | 269,771 | $ | 206,343 | |||||
Diluted earnings per common share | $ | 1.87 | $ | 1.69 | $ | 0.59 | |||||
Effect of adjustments to net income | $ | 0.07 | $ | 0.20 | $ | 0.85 | |||||
Diluted non-GAAP earnings per common share | $ | 1.93 | $ | 1.89 | $ | 1.44 | |||||
1Includes product line impairment charges of $5,330 classified as cost of sales for the years ended December 31, 2017..
Includes intangible impairment charge of $3,866 classified as selling, general and administrative expense for the year ended December 31, 2017.
Includes product line impairment charge of $320 classified as selling, general and administrative expense for the year ended December 31, 2017.
Includes product line impairment charge of $884 classified as engineering, research and development expense for the year ended December 31, 2017.
Includes product line impairment charge of $2,800 classified as other expense for the year ended December 31, 2017.
2The tax effect of the non-GAAP adjustments was calculated using the applicable marginal tax rate during the respective years.
Item 7A. Quantitative and Qualitative Disclosure About Market Risks
Entegris’ principal financial market risks are sensitivities to interest rates and foreign currency exchange rates. The Company’s interest-bearing cash equivalents and variable rate debt are subject to interest rate fluctuations. The Company’s cash equivalents are instruments with maturities of three months or less. A 100 basis point change in interest rates would potentially increase or decrease annual net income by approximately $0.3 million annually.
The cash flows and results of operations of the Company’s foreign-based operations are subject to fluctuations in foreign exchange rates. We have sales denominated in the South Korean Won, New Taiwan Dollar, Chinese Renmibi, Canadian Dollar Malayisan Ringgit, Singapore Dollar, Euro, Israeli Shekel and the Japanese Yen. Approximately 22.6% of the Company’s sales are denominated in these currencies. Financial results therefore will be affected by changes in currency exchange rates. If all foreign currencies were to see a 10% reduction versus the U.S. dollar during the year ended December 31, 2019 the operating income would be negatively impacted by approximately $36.0 million.
The Company occasionally uses derivative financial instruments to manage the foreign currency exchange rate risks associated with its foreign-based operations. At December 31, 2019, the Company had no net exposure to any foreign currency forward contracts.
49
Item 8. Financial Statements and Supplementary Data.
The information called for by this item is set forth in the Consolidated Financial Statements covered by the Report of Independent Registered Public Accounting Firm at the end of this report.
Item 9. Changes in and Disagreements with Accountants on Accounting and Financial Disclosure.
This item is not applicable.
Item 9A. Controls and Procedures.
Evaluation of Disclosure Controls and Procedures
Based on management’s evaluation (with the participation of our principal executive officer and principal financial officer), as of the end of the period covered by this report, our principal executive officer and principal financial officer have concluded that our disclosure controls and procedures (as defined in Rules 13a-15(e) and 15d-15(e) under the Securities Exchange Act of 1934, as amended (the Exchange Act)), are effective to provide reasonable assurance that information required to be disclosed by us in reports that we file or submit under the Exchange Act is recorded, processed, summarized, and reported within the time periods specified in SEC rules and forms, and is accumulated and communicated to management, including our principal executive officer and principal financial officer, as appropriate, to allow timely decisions regarding required disclosure.
Changes in Internal Control Over Financial Reporting
There were no changes to our internal control over financial reporting (as defined in Rules 13a-15(f) and 15d-15(f) under the Exchange Act) that occurred during the quarter ended December 31, 2019 that have materially affected, or are reasonably likely to materially affect, our internal control over financial reporting.
Management Report on Internal Control Over Financial Reporting
Our management is responsible for establishing and maintaining adequate internal control over financial reporting (as defined in Rules 13a-15(f) and 15d-15(f) under the Exchange Act) to provide reasonable assurance regarding the reliability of our financial reporting and the preparation of consolidated financial statements for external purposes in accordance with GAAP.
Management assessed our internal control over financial reporting as of December 31, 2019. Management based its assessment on criteria established in Internal Control-Integrated Framework issued by the Committee of Sponsoring Organizations of the Treadway Commission (2013 framework). Management’s assessment included evaluation of elements such as the design and operating effectiveness of key financial reporting controls, process documentation, accounting policies, and our overall control environment.
The Company acquired Digital Specialty Chemicals Limited (DSC), MPD Chemicals (MPD) and Hangzhou Anow
Microfiltration Co., Ltd. (Anow) on March 8, 2019, July 15, 2019 and September 17, 2019, respectively. None of DSC, MPD
and Anow is significant to the Company’s financial statements. The Company is continuing to integrate DSC, MPD and Anow
into the Company’s internal control over financial reporting, and the foregoing evaluation of the effectiveness of the
Company’s internal control over financial reporting and has excluded total assets of approximately $324 million and net sales of approximately $33 million related to the DSC, MPD and Anow in the assessment of those disclosure controls and procedures of DSC, MPD and Anow that are subsumed by internal control over financial reporting.
Based on its assessment, management has concluded that our internal control over financial reporting was effective as of the end of the fiscal year to provide reasonable assurance regarding the reliability of financial reporting and the preparation of consolidated financial statements for external reporting purposes in accordance with GAAP. We reviewed the results of management’s assessment with the Audit Committee of our Board of Directors.
KPMG LLP, the independent registered public accounting firm which audited the consolidated financial statements included in this annual report, has issued an attestation report on our internal control over financial reporting.
Inherent Limitations on Effectiveness of Controls
Our management, including our principal executive officer and principal financial officer, does not expect that our disclosure controls and procedures or our internal control over financial reporting will prevent or detect all errors and all fraud. A control system, no matter how well-designed and operated, can provide only reasonable, not absolute, assurance that the control system’s objectives will be met. The design of a control system must reflect the fact that there are resource constraints, and the
50
benefits of controls must be considered relative to their costs. Further, because of the inherent limitations in all control systems, no evaluation of controls can provide absolute assurance that misstatements due to error or fraud will not occur or that all control issues and instances of fraud, if any, have been detected.
51
Report of Independent Registered Public Accounting Firm
To the Stockholders and Board of Directors
Entegris, Inc.:
Opinion on Internal Control Over Financial Reporting
We have audited Entegris, Inc. and subsidiaries’ (the Company) internal control over financial reporting as of December 31, 2019, based on criteria established in Internal Control - Integrated Framework (2013) issued by the Committee of Sponsoring Organizations of the Treadway Commission. In our opinion, the Company maintained, in all material respects, effective internal control over financial reporting as of December 31, 2019, based on criteria established in Internal Control - Integrated Framework (2013) issued by the Committee of Sponsoring Organizations of the Treadway Commission.
We also have audited, in accordance with the standards of the Public Company Accounting Oversight Board (United States) (PCAOB), the consolidated balance sheets of the Company as of December 31, 2019 and 2018, and the related consolidated statements of operations, comprehensive income, equity, and cash flows for each of the years in the three-year period ended December 31, 2019, and related notes (collectively, the consolidated financial statements), and our report dated February 7, 2020 expressed an unqualified opinion on those consolidated financial statements.
The Company acquired Digital Specialty Chemicals Limited, MPD Chemicals, and Hangzhou Anow Microfiltration Co. Ltd. during 2019, and management excluded from its assessment of the effectiveness of the Company’s internal control over financial reporting as of December 31, 2019, the Company’s internal control over financial reporting associated with total assets of $324 million and total revenues of $33 million included in the consolidated financial statements of the Company as of and for the year ended December 31, 2019. Our audit of internal control over financial reporting of the Company also excluded an evaluation of the internal control over financial reporting of Digital Specialty Chemicals Limited, MPD Chemicals, and Hangzhou Anow Microfiltration Co. Ltd.
Basis for Opinion
The Company’s management is responsible for maintaining effective internal control over financial reporting and for its assessment of the effectiveness of internal control over financial reporting, included in the accompanying Management’s Annual Report on Internal Control Over Financial Reporting appearing under Item 9A of the Company’s December 31, 2019 Annual Report on Form 10-K. Our responsibility is to express an opinion on the Company’s internal control over financial reporting based on our audit. We are a public accounting firm registered with the PCAOB and are required to be independent with respect to the Company in accordance with the U.S. federal securities laws and the applicable rules and regulations of the Securities and Exchange Commission and the PCAOB.
We conducted our audit in accordance with the standards of the PCAOB. Those standards require that we plan and perform the audit to obtain reasonable assurance about whether effective internal control over financial reporting was maintained in all material respects. Our audit of internal control over financial reporting included obtaining an understanding of internal control over financial reporting, assessing the risk that a material weakness exists, and testing and evaluating the design and operating effectiveness of internal control based on the assessed risk. Our audit also included performing such other procedures as we considered necessary in the circumstances. We believe that our audit provides a reasonable basis for our opinion.
Definition and Limitations of Internal Control Over Financial Reporting
A company’s internal control over financial reporting is a process designed to provide reasonable assurance regarding the reliability of financial reporting and the preparation of financial statements for external purposes in accordance with generally accepted accounting principles. A company’s internal control over financial reporting includes those policies and procedures that (1) pertain to the maintenance of records that, in reasonable detail, accurately and fairly reflect the transactions and dispositions of the assets of the company; (2) provide reasonable assurance that transactions are recorded as necessary to permit preparation of financial statements in accordance with generally accepted accounting principles, and that receipts and expenditures of the company are being made only in accordance with authorizations of management and directors of the company; and (3) provide reasonable assurance regarding prevention or timely detection of unauthorized acquisition, use, or disposition of the company’s assets that could have a material effect on the financial statements.
52
Because of its inherent limitations, internal control over financial reporting may not prevent or detect misstatements. Also, projections of any evaluation of effectiveness to future periods are subject to the risk that controls may become inadequate because of changes in conditions, or that the degree of compliance with the policies or procedures may deteriorate.
/s/ KPMG LLP
Minneapolis, Minnesota
February 7, 2020
Item 9B. Other Information.
Amendment to Executive Change of Control Termination Agreement with Mr. Loy
In connection with the annual review of the compensation of our executive officers in February 2020, the Management Development & Compensation Committee of our Board of Directors (the “Compensation Committee”) reviewed, in consultation with Frederic W. Cook & Co., Inc., the independent compensation advisory firm retained by the Compensation Committee, current practices of other companies in our peer group with respect to compensation payable to the chief executive officer upon termination of employment following a change of control by the company without cause or by the executive for good reason. The Compensation Committee noted that our current arrangement with Bertrand Loy, our President and Chief Executive Officer, for termination of employment by us without cause or by Mr. Loy for good reason within 24 months after a change of control provides for, among other things, certain cash severance payments based on two years of compensation, consistent with the most common practice for chief executive officers of companies in our peer group. The Compensation Committee noted, however, that a substantial number of peer companies provide cash severance payments based on three years of compensation. In light of this background, and after considering consolidation in our industry generally, our recent experience with the terminated transaction with Versum Materials, Inc., our performance relative to our peers, Mr. Loy’s role in achieving that performance and the importance of retaining Mr. Loy’s services, the Compensation Committee concluded that the severance amounts payable to Mr. Loy upon termination of employment by us without cause or by the executive for good reason within 24 months after a change of control should generally be increased from two years of compensation to three years of compensation.
Accordingly, on February 5, 2020, we entered into an amendment to Mr. Loy’s change of control termination agreement, which increased the amount of the lump-sum severance payment that he would receive upon a termination of employment by us without cause (as defined in the change of control termination agreement) or by him for good reason (as defined in the change of control termination agreement) within 24 months after a change of control. Under Mr. Loy’s amended change of control termination agreement, his lump-sum severance payment would equal the sum of three times (rather than two times) his base salary plus three times (rather than two times) the greater of his highest annual bonus during the three years before termination of his employment or his target bonus for the year of termination. The amendment to Mr. Loy’s change of control termination agreement also extended his existing non-competition and non-solicitation obligations from a period of two years after termination of employment to a period of three years after termination of employment.
53
PART III
Item 10. Directors, Executive Officers and Corporate Governance.
Except as set forth below, the information required by this Item 10 has been omitted from this report, and is incorporated by reference to our definitive Proxy Statement for the Entegris, Inc. Annual Meeting of Stockholders, which is currently scheduled to be held on April 29, 2020, and to be filed with the Securities and Exchange Commission pursuant to Regulation 14A within 120 days after the end of our 2019 fiscal year.
Information called for by this item with respect to registrant’s executive officers is set forth under “Executive Officers of the Registrant” in Part I of this report.
In 2005, our Board of Directors adopted a code of business ethics, The Entegris, Inc. Code of Business Ethics applicable to all of our executives, directors and employees as well as a set of corporate governance guidelines, which have been updated from time to time. The Entegris, Inc. Code of Business Ethics, the Corporate Governance Guidelines and the charters for our Audit & Finance Committee, Governance & Nominating Committee and our Management Development & Compensation Committee all appear on our website at http://www.Entegris.com under “Investors - Corporate Governance”. The Entegris, Inc. Code of Business Ethics, Corporate Governance Guidelines and committee charters are also available in print to any shareholder that requests a copy. Copies may be obtained by contacting our Assistant Secretary through our corporate headquarters. The Company intends to comply with the requirements of Item 5.05 of Form 8-K with respect to any amendment to or waiver of the provisions of the Entegris, Inc. Code of Business Ethics applicable to the registrant’s Chief Executive Officer, Chief Financial Officer, Chief Accounting Officer or Controller by posting notice of any such amendment or waiver at the same location on our website.
Item 11. Executive Compensation.
The information required by this Item 11 has been omitted from this report, and is incorporated by reference to our definitive Proxy Statement for the Entegris, Inc. Annual Meeting of Stockholders to be held on April 29, 2020, and to be filed with the Securities and Exchange Commission pursuant to Regulation 14A within 120 days after the end of our 2019 fiscal year.
Item 12. Security Ownership of Certain Beneficial Owners and Management and Related Stockholder Matters.
Securities Authorized for Issuance Under Equity Compensation Plans:
As of December 31, 2019, our equity compensation plan information is as follows:
Equity Compensation Plan Information
Number of securities to be issued upon exercise of outstanding options, warrants and rights | Weighted-average exercise price of outstanding options, warrants and rights (1) | Number of securities remaining available for future issuance under equity compensation plans (excluding securities reflected in column (a)) (2) (3) | ||||||||
Plan category | (a) | (b) | (c) | |||||||
Equity compensation plans approved by security holders | 3,153,824 | $ | 21.39 | 9,911,101 | ||||||
Equity compensation plans not approved by security holders | — | — | — | |||||||
Total | 3,153,824 | $ | 21.39 | 9,911,101 | ||||||
(1) | The weighted average exercise price does not take into account the shares issuable upon vesting of outstanding restricted stock units, which have no exercise price. |
(2) | These shares are available under the 2010 Stock Plan for future issuance for stock options, restricted stock units, performance shares and stock awards in accordance with the terms of the 2010 Stock Plan. |
(3) | Includes 1,699,619 shares remaining available for issuance as of December 31, 2019 under the Employee Stock Purchase Plan. |
The other information called for by this Item 12 has been omitted from this report, and is incorporated by reference to our definitive Proxy Statement for the Entegris, Inc. Annual Meeting of Stockholders to be held on April 29, 2020, and to be filed with the Securities and Exchange Commission pursuant to Regulation 14A within 120 days after the end of our 2019 fiscal year.
Item 13. Certain Relationships and Related Transactions, and Director Independence.
The information required by this Item 13 has been omitted from this report, and is incorporated by reference to our definitive Proxy Statement for the Entegris, Inc. Annual Meeting of Stockholders to be held on April 29, 2020, and to be filed with the Securities and Exchange Commission pursuant to Regulation 14A within 120 days after the end of our 2019 fiscal year.
54
Item 14. Principal Accountant Fees and Services.
The information required by this Item 14 has been omitted from this report, and is incorporated by reference to our definitive Proxy Statement for the Entegris, Inc. Annual Meeting of Stockholders to be held on April 29, 2020, and to be filed with the Securities and Exchange Commission pursuant to Regulation 14A within 120 days after the end of our 2019 fiscal year.
55
PART IV
Item 15. Exhibits and Financial Statement Schedules.
(a) | The following documents are filed as a part of this report: |
1. | Financial Statements. The Consolidated Financial Statements listed under Item 8 of this report and in the Index to Consolidated Financial Statements on page F-1 of this report are incorporated by reference herein. |
2. | Exhibits. |
A. | The following exhibits are incorporated by reference: |
Reg. S-K Item 601(b) Reference | Document Incorporated | Referenced Document on file with the Commission | ||
(2) | Exhibit 2.1 to Entegris, Inc. Current Report on Form 8-K filed on June 7, 2018. | |||
(3) | Exhibit 3.1 to Entegris, Inc. Annual Report on Form 10-K for the fiscal year ended December 31, 2011 | |||
(3) | Exhibit 3 to Entegris, Inc. Annual Report on Form 10-K for the fiscal year ended December 31, 2008 | |||
(4) | Exhibit 4.1 to Form S-4 Registration Statement of Entegris, Inc. and Eagle DE, Inc. (No. 333-124719) | |||
(4) | Exhibit 4.1 to Entegris, Inc. Current Report on Form 8-K filed with the Securities and Exchange Commission on November 13, 2017 | |||
(10) | Exhibit 10.1 to Entegris, Inc. Current Report on Form 8-K filed with the Securities and Exchange Commission on November 6, 2018. | |||
(10) | Exhibit 10.1 to Entegris, Inc. Current Report on Form 8-K filed with the Securities and Exchange Commission on February 8, 2019 | |||
(10) | Exhibit 10.1 to Entegris, Inc. Current Report on Form 8-K filed with the Securities and Exchange Commission on November 6, 2018. | |||
(10) | Exhibit 10.1 to Entegris, Inc. Quarterly Report on Form 10-Q for the period ended July 3, 2010 | |||
(10) | Exhibit 10.2 to Entegris, Inc. Registration Statement on Form S-1 (No. 333-33668) | |||
(10) | Exhibit 4.1 to Entegris, Inc. Registration Statement on Form S-8 (No. 333-211444) | |||
(10) | Exhibit 10.1 to Entegris, Inc. Current Report on Form 8-K filed with the Securities and Exchange Commission on May 24, 2017 | |||
(10) | Exhibit 10.3 to Entegris, Inc. Annual Report on Form 10-K for the fiscal year ended December 31, 2007 | |||
56
(10) | Exhibit 10.1 to Entegris, Inc. Annual Report on Form 10-K filed with the Securities and Exchange Commission on February 17, 2017 | |||
(10) | Exhibit 10.2 to Entegris, Inc. Quarterly Report on Form10-Q for the fiscal period ended June 30, 2007 | |||
(10) | Exhibit 10.2 to Entegris, Inc. Annual Report on Form 10-K for the fiscal year ended December 31, 2008 | |||
(10) | Exhibit 10.15 to Entegris, Inc. Annual Report on Form 10-K for the fiscal year ended December 31, 2009. | |||
(10) | Exhibit 10.1.3 to Mykrolis Corporation’s Quarterly Report on Form 10-Q for the quarter ended March 31, 2002 | |||
(10) | Exhibit 10.1 to Entegris, Inc. Quarterly Report on Form 10-Q for the period ended June 30, 2012 | |||
(10) | Exhibit 10.1 to Entegris, Inc. Current Report on Form 8-K filed with the Securities and Exchange Commission on March 11, 2016 | |||
(10) | Exhibit 10.2 to Entegris, Inc. Quarterly Report on Form 10-Q for the quarter ended April 2, 2011 | |||
(10) | Exhibit 10.30 to Entegris, Inc. Annual Report on Form 10-K for the fiscal year ended August 27, 2005 | |||
(10) | Exhibit 10.31 to Entegris, Inc. Annual Report on Form 10-K for the fiscal year ended August 27, 2005 | |||
(10) | Exhibit 10.1 to Entegris, Inc. Annual Report on Form 10-K filed with the Securities and Exchange Commission on February 29, 2016 | |||
(10) | Exhibit 10.2 to Entegris, Inc. Annual Report on Form 10-K filed with the Securities and Exchange Commission on February 26, 2015 | |||
(10) | Exhibit 10.4 to Entegris, Inc. Annual Report on Form 10-K filed with the Securities and Exchange Commission on February 26, 2015 | |||
(10) | Exhibit 10.4 to Entegris, Inc. Annual Report on Form 10-K filed with the Securities and Exchange Commission on February 29, 2016 | |||
(10) | Exhibit 10.3 to Entegris, Inc. Annual Report on Form 10-K filed with the Securities and Exchange Commission on February 17, 2017 | |||
(10) | Exhibit 10.4 to Entegris, Inc. Annual Report on Form 10-K filed with the Securities and Exchange Commission on February 17, 2017 | |||
(10) | Exhibit 10.1 to Entegris, Inc. Annual Report on Form 10-K filed with the Securities and Exchange Commission on February 15, 2018 | |||
57
(10) | Exhibit 10.2 to Entegris, Inc. Annual Report on Form 10-K filed with the Securities and Exchange Commission on February 15, 2018 | |||
(10) | Exhibit 10.3 to Entegris, Inc. Annual Report on Form 10-K filed with the Securities and Exchange Commission on February 15, 2018 | |||
(10) | Exhibit 10.1 to Entegris, Inc. Annual Report on Form 10-K filed with the Securities and Exchange Commission on February 11, 2019 | |||
(10) | Exhibit 10.2 to Entegris, Inc. Annual Report on Form 10-K filed with the Securities and Exchange Commission on February 11, 2019 | |||
(10) | Exhibit 10.3 to Entegris, Inc. Annual Report on Form 10-K filed with the Securities and Exchange Commission on February 11, 2019 | |||
(10) | Exhibit 10.1 to Entegris, Inc. Annual Report on Form 10-K for the fiscal year ended December 31, 2012 | |||
(10) | Exhibit 99.1 to Entegris, Inc. Current Report on Form 8-K filed with the Securities and Exchange Commission on April 26, 2013 | |||
(10) | Exhibit 10.2 to Entegris, Inc. Quarterly Report on Form 10-Q for the period ended July 2, 2011 | |||
(10) | Exhibit 10.2 to Entegris, Inc. Quarterly Report on Form 10-Q filed with the Securities and Exchange Commission on April 28, 2016 | |||
(10) | Exhibit 10.1 to Entegris, Inc. Quarterly Report on Form 10-Q filed with the Securities and Exchange Commission on October 24, 2019 | |||
* A “management contract or compensatory plan”
B. The Company hereby files as exhibits to this Annual Report on Form 10-K the following documents:
Reg. S-K
Item 601(b)
58
Reference | Exhibit No. | Documents Filed Herewith | ||
(4) | 4.1 | |||
(10) | 10.1 | |||
(10) | 10.2 | |||
(10) | 10.3 | |||
(10) | 10.4 | |||
(10) | 10.5 | |||
(10) | 10.6 | |||
(21) | 21 | |||
(23) | 23 | |||
(24) | 24 | |||
(31) | 31.1 | |||
(31) | 31.2 | |||
(32) | 32.1 | |||
(32) | 32.2 | |||
(101) | 101.INS | XBRL Instance Document | ||
(101) | 101.SCH | XBRL Taxonomy Extension Schema Document | ||
(101) | 101.CAL | XBRL Taxonomy Extension Calculation Linkbase Document | ||
(101) | 101.DEF | XBRL Taxonomy Extension Definition Linkbase Document | ||
(101) | 101.LAB | XBRL Taxonomy Extension Label Linkbase Document | ||
(101) | 101.PRE | XBRL Taxonomy Extension Presentation Linkbase Document | ||
* A “management contract or compensatory plan”
Item 16. Form 10-K Summary.
None.
59
SIGNATURES
Pursuant to the requirements of Section 13 or 15(d) of the Securities Exchange Act of 1934, the Registrant has duly caused this report to be signed on its behalf by the undersigned thereunto duly authorized.
ENTEGRIS, INC. | |||
Date: February 7, 2020 | By | /s/ BERTRAND LOY | |
Bertrand Loy | |||
President & Chief Executive Officer | |||
Pursuant to the requirements of the Securities Exchange Act of 1934, this report has been signed below by the following persons on behalf of the Registrant and in the capacities and on the dates indicated.
SIGNATURE | TITLE | DATE | ||
/s/ BERTRAND LOY | President, Chief Executive Officer and Director (Principal executive officer) | February 7, 2020 | ||
Bertrand Loy | ||||
/s/ GREGORY B. GRAVES | Executive Vice President, Chief Financial Officer & Treasurer (Principal financial officer) | February 7, 2020 | ||
Gregory B. Graves | ||||
/s/ MICHAEL D. SAUER | Vice President, Controller & Chief Accounting Officer (Principal accounting officer) | February 7, 2020 | ||
Michael D. Sauer | ||||
PAUL L.H. OLSON* | Director, Chairman of the Board | February 7, 2020 | ||
Paul L.H. Olson | ||||
MICHAEL A. BRADLEY* | Director | February 7, 2020 | ||
Michael A. Bradley | ||||
R. NICHOLAS BURNS* | Director | February 7, 2020 | ||
R. Nicholas Burns | ||||
JAMES F. GENTILCORE* | Director | February 7, 2020 | ||
James F. Gentilcore | ||||
JAMES P. LEDERER* | Director | February 7, 2020 | ||
James P. Lederer | ||||
AZITA SALEKI-GERHARDT* | Director | February 7, 2020 | ||
Azita Saleki-Gerhardt | ||||
BRIAN F. SULLIVAN* | Director | February 7, 2020 | ||
Brian F. Sullivan | ||||
*By | /s/ Gregory B. Graves | |
Gregory B. Graves, Attorney-in-fact | ||
60
ENTEGRIS, INC.
INDEX TO FINANCIAL STATEMENTS
F-1
Report of Independent Registered Public Accounting Firm
To the Stockholders and Board of Directors
Entegris, Inc.:
Opinion on the Consolidated Financial Statements
We have audited the accompanying consolidated balance sheets of Entegris, Inc. and subsidiaries (the Company) as of December 31, 2019 and 2018, the related consolidated statements of operations, comprehensive income, equity, and cash flows for each of the years in the three-year period ended December 31, 2019, and the related notes (collectively, the consolidated financial statements). In our opinion, the consolidated financial statements present fairly, in all material respects, the financial position of the Company as of December 31, 2019 and 2018, and the results of its operations and its cash flows for each of the years in the three-year period ended December 31, 2019, in conformity with U.S. generally accepted accounting principles.
We also have audited, in accordance with the standards of the Public Company Accounting Oversight Board (United States) (PCAOB), the Company’s internal control over financial reporting as of December 31, 2019, based on criteria established in Internal Control - Integrated Framework (2013) issued by the Committee of Sponsoring Organizations of the Treadway Commission, and our report dated February 7, 2020 expressed an unqualified opinion on the effectiveness of the Company’s internal control over financial reporting.
Change in Accounting Principle
As discussed in Note 10 to the consolidated financial statements, the Company has changed its method of accounting for leases in 2019 due to the adoption of FASB Accounting Standard Codification (Topic 842) Leases.
Basis for Opinion
These consolidated financial statements are the responsibility of the Company’s management. Our responsibility is to express an opinion on these consolidated financial statements based on our audits. We are a public accounting firm registered with the PCAOB and are required to be independent with respect to the Company in accordance with the U.S. federal securities laws and the applicable rules and regulations of the Securities and Exchange Commission and the PCAOB.
F-2
We conducted our audits in accordance with the standards of the PCAOB. Those standards require that we plan and perform the audit to obtain reasonable assurance about whether the consolidated financial statements are free of material misstatement, whether due to error or fraud. Our audits included performing procedures to assess the risks of material misstatement of the consolidated financial statements, whether due to error or fraud, and performing procedures that respond to those risks. Such procedures included examining, on a test basis, evidence regarding the amounts and disclosures in the consolidated financial statements. Our audits also included evaluating the accounting principles used and significant estimates made by management, as well as evaluating the overall presentation of the consolidated financial statements. We believe that our audits provide a reasonable basis for our opinion.
Critical Audit Matters
The critical audit matters communicated below are matters arising from the current period audit of the consolidated financial statements that were communicated or required to be communicated to the audit committee and that: (1) relate to accounts or disclosures that are material to the consolidated financial statements and (2) involved our especially challenging, subjective, or complex judgments. The communication of critical audit matters does not alter in any way our opinion on the consolidated financial statements, taken as a whole, and we are not, by communicating the critical audit matters below, providing separate opinions on the critical audit matters or on the accounts or disclosures to which they relate.
Assessment of the recoverability of long-lived assets used to manufacture new products
As discussed in Note 1 to the consolidated financial statements, the Company routinely evaluates for indicators of impairment of its long-lived assets. The Company performs asset recoverability tests whenever events and changes in circumstances indicate the carrying amount of an asset group may not be recoverable and recognizes an impairment loss, if any, based on the excess of the carrying amount over fair value. It may take a number of years for sales of a new product to support the recoverability of an asset group, if ever. A product’s concept may never progress beyond the development stage or may only achieve limited acceptance in the marketplace. The balance of long-lived assets, which includes long-lived assets used to manufacture new products, as of December 31, 2019 was $864 million, or 34% of total assets.
We identified the assessment of the recoverability of long-lived assets used to manufacture new products as a critical audit matter. There was a high degree of subjectivity in evaluating events or circumstances that may indicate the carrying amount of an asset group may not be recoverable. Additionally, when events or circumstances indicated the carrying amount of an asset group may not be recoverable, a high degree of auditor judgment was required in performing procedures related to future cash flows.
The primary procedures we performed to address this critical audit matter included the following. We tested certain internal controls over the Company’s long-lived asset impairment assessment process. This included controls related to the identification of indicators that an asset group may not be recoverable and the determination of future cash flows when indicators of impairment exist. We performed analyses over asset groups with negative gross margin, which included obtaining future business plans and evaluating the Company’s identification of indicators of impairment. We evaluated the Company’s cash flow assumptions when events or changes in circumstances indicated the carrying amount of an asset group may not be recoverable and an asset recoverability test was performed. Where indicators of impairment existed, we compared the Company’s historical cash flow forecasts to actual results to assess the Company’s ability to accurately forecast cash flows.
Assessment of the fair value of acquired customer relationships, developed technology, and trademarks and trade names
As discussed in Note 3 to the consolidated financial statements, the Company accounts for acquired businesses using the acquisition method of accounting by recording assets and liabilities acquired at their respective fair values. During 2019, the Company acquired Digital Specialty Chemicals Limited, MPD Chemicals, and Hangzhou Anow Microfiltration Co., Ltd. for an aggregate purchase price of $298 million. The Company recorded intangible assets of $105 million during the year related to these acquisitions. The determination of the acquisition date fair value of the customer relationships, developed technology, and trademark and trade name intangible assets required the Company to make significant estimates and assumptions regarding (1) future revenue growth rates, (2) future gross margin, (3) future selling general and administrative expense, (4) royalty rates, and (5) discount rates.
We identified the assessment of the fair value of acquired customer relationships, developed technology, and trademarks and trade names as a critical audit matter. Depending on the asset valued, the key assumptions included one or more of the following: (1) future revenue growth rates, (2) future gross margin, (3) future selling general and administrative expense, (4) royalty rates, and (5) discount rates. Testing the key assumptions that were used to estimate the fair values of individual assets acquired involved a high degree of subjectivity.
F-3
The primary procedures we performed to address this critical audit matter included the following. We tested certain internal controls over the Company’s intangible asset valuation process, including controls related to the development of the key assumptions discussed above. We evaluated the Company’s key future revenue growth rates by comparing them to analyst reports about the Company and its peer companies. We compared the key future revenue growth rates, gross margin and selling general and administrative expense assumptions to historical results of the acquired companies. We evaluated the amount of future estimated cost savings by comparing them to planned actions and historical amounts incurred by the acquired companies. We involved a valuation professional with specialized skills and knowledge who assisted in:
• | evaluating each of the Company’s selected key royalty rates, by comparing them to royalty rates used in other comparable market transactions, |
• | evaluating each of the Company’s key discount rates, by comparing it against a discount rate range that was independently developed using publicly available data for comparable entities, and |
• | developing an estimate of the fair value of certain intangible assets acquired using the Company’s cash flow forecast and independently developed discount and royalty rates, and comparing the results of our estimate of fair value to the Company’s fair value estimate. |
/s/ KPMG LLP
We or our predecessor firms have served as the Company’s auditor since 1966.
Minneapolis, Minnesota
February 7, 2020
F-4
ENTEGRIS, INC. AND SUBSIDIARIES
CONSOLIDATED BALANCE SHEETS
(In thousands, except share and per share data) | December 31, 2019 | December 31, 2018 | |||||
ASSETS | |||||||
Current assets: | |||||||
Cash and cash equivalents | $ | $ | |||||
Trade accounts and notes receivable, net | |||||||
Inventories, net | |||||||
Deferred tax charges and refundable income taxes | |||||||
Other current assets | |||||||
Total current assets | |||||||
Property, plant and equipment, net | |||||||
Other assets: | |||||||
Right-of-use assets | |||||||
Goodwill | |||||||
Intangible assets, net | |||||||
Deferred tax assets and other noncurrent tax assets | |||||||
Other noncurrent assets | |||||||
Total assets | $ | $ | |||||
LIABILITIES AND EQUITY | |||||||
Current liabilities: | |||||||
Long-term debt, current maturities | $ | $ | |||||
Accounts payable | |||||||
Accrued payroll and related benefits | |||||||
Other accrued liabilities | |||||||
Income taxes payable | |||||||
Total current liabilities | |||||||
Long-term debt, excluding current maturities | |||||||
Pension benefit obligations and other liabilities | |||||||
Deferred tax liabilities and other noncurrent tax liabilities | |||||||
Long-term lease liabilities | |||||||
Commitments and contingent liabilities | |||||||
Equity: | |||||||
Preferred stock, par value $.01; 5,000,000 shares authorized; none issued and outstanding | |||||||
Common stock, par value $.01; 400,000,000 shares authorized; issued and outstanding shares as of December 31, 2019: 134,929,768 and 134,727,368, respectively; issued and outstanding shares as of December 31, 2018: 136,179,381 and 135,976,981, respectively | |||||||
Treasury stock, common, at cost: 202,400 shares held as of December 31, 2019 and December 31, 2018 | ( | ) | ( | ) | |||
Additional paid-in capital | |||||||
Retained earnings | |||||||
Accumulated other comprehensive loss | ( | ) | ( | ) | |||
Total equity | |||||||
Total liabilities and equity | $ | $ | |||||
F-5
ENTEGRIS, INC. AND SUBSIDIARIES
CONSOLIDATED STATEMENTS OF OPERATIONS
(In thousands, except per share data) | Year ended December 31, 2019 | Year ended December 31, 2018 | Year ended December 31, 2017 | ||||||||
Net sales | $ | $ | $ | ||||||||
Cost of sales | |||||||||||
Gross profit | |||||||||||
Selling, general and administrative expenses | |||||||||||
Engineering, research and development expenses | |||||||||||
Amortization of intangible assets | |||||||||||
Operating income | |||||||||||
Interest expense | |||||||||||
Interest income | ( | ) | ( | ) | ( | ) | |||||
Other (income) expense, net | ( | ) | |||||||||
Income before income tax expense | |||||||||||
Income tax expense | |||||||||||
Net income | $ | $ | $ | ||||||||
Basic net income per common share | $ | $ | $ | ||||||||
Diluted net income per common share | $ | $ | $ | ||||||||
Weighted average shares outstanding | |||||||||||
Basic | |||||||||||
Diluted | |||||||||||
See the accompanying notes to consolidated financial statements.
F-6
ENTEGRIS, INC. AND SUBSIDIARIES
CONSOLIDATED STATEMENTS OF COMPREHENSIVE INCOME
(In thousands) | Year ended December 31, 2019 | Year ended December 31, 2018 | Year ended December 31, 2017 | ||||||||
Net income | $ | $ | $ | ||||||||
Other comprehensive (loss) income, net of tax | |||||||||||
Foreign currency translation adjustments | ( | ) | ( | ) | |||||||
Reclassification of cumulative translation adjustment associated with liquidated and planned sale of subsidiaries | |||||||||||
Pension liability adjustments, net of income tax benefit of $(10), $(13), and $(26) for year ended December 31, 2019, 2018, and 2017 | ( | ) | |||||||||
Other comprehensive (loss) income | ( | ) | ( | ) | |||||||
Comprehensive income | $ | $ | $ | ||||||||
See the accompanying notes to consolidated financial statements.
F-7
ENTEGRIS, INC. AND SUBSIDIARIES
CONSOLIDATED STATEMENTS OF EQUITY
(In thousands) | Common shares outstanding | Common stock | Treasury shares | Treasury stock | Additional paid-in capital | Retained earnings (deficit) | Foreign currency translation adjustments | Defined benefit pension adjustments | Total | ||||||||||||||||||||||||
Balance at December 31, 2016 | $ | — | $ | $ | $ | $ | ( | ) | $ | ( | ) | $ | |||||||||||||||||||||
Shares issued under stock plans | — | ( | ) | ( | ) | ||||||||||||||||||||||||||||
Share-based compensation expense | — | — | |||||||||||||||||||||||||||||||
Repurchase and retirement of common stock | ( | ) | ( | ) | — | ( | ) | ( | ) | ( | ) | ||||||||||||||||||||||
Dividends declared ($0.07 per share) | — | — | ( | ) | ( | ) | |||||||||||||||||||||||||||
Pension liability adjustment | — | — | ( | ) | ( | ) | |||||||||||||||||||||||||||
Foreign currency translation | — | — | |||||||||||||||||||||||||||||||
Reclassification of cumulative translation adjustment associated with liquidated and planned sale of subsidiaries | — | — | |||||||||||||||||||||||||||||||
Cumulative effect of change in accounting principle | — | — | ( | ) | |||||||||||||||||||||||||||||
Net income | — | — | |||||||||||||||||||||||||||||||
Balance at December 31, 2017 | — | ( | ) | ( | ) | ||||||||||||||||||||||||||||
Shares issued under stock plans | — | ( | ) | ( | ) | ||||||||||||||||||||||||||||
Share-based compensation expense | — | — | |||||||||||||||||||||||||||||||
Repurchase and retirement of common stock | ( | ) | ( | ) | ( | ) | ( | ) | ( | ) | ( | ) | |||||||||||||||||||||
Dividends declared ($0.28 per share) | — | — | ( | ) | ( | ) | |||||||||||||||||||||||||||
Pension liability adjustment | — | — | |||||||||||||||||||||||||||||||
Foreign currency translation | — | — | ( | ) | ( | ) | |||||||||||||||||||||||||||
Cumulative effect of change in accounting principle | — | — | ( | ) | ( | ) | |||||||||||||||||||||||||||
Net income | — | — | |||||||||||||||||||||||||||||||
Balance at December 31, 2018 | ( | ) | ( | ) | ( | ) | |||||||||||||||||||||||||||
Shares issued under stock plans | — | ( | ) | ( | ) | ||||||||||||||||||||||||||||
Share-based compensation expense | — | — | |||||||||||||||||||||||||||||||
Repurchase and retirement of common stock | ( | ) | ( | ) | ( | ) | ( | ) | ( | ) | |||||||||||||||||||||||
Dividends declared ($0.30 per share) | — | — | ( | ) | ( | ) | |||||||||||||||||||||||||||
Pension liability adjustment | — | — | |||||||||||||||||||||||||||||||
Foreign currency translation | — | — | ( | ) | ( | ) | |||||||||||||||||||||||||||
Net income | — | — | |||||||||||||||||||||||||||||||
Balance at December 31, 2019 | $ | $ | ( | ) | $ | $ | $ | ( | ) | $ | ( | ) | $ | ||||||||||||||||||||
See the accompanying notes to consolidated financial statements.
F-8
ENTEGRIS, INC. AND SUBSIDIARIES
CONSOLIDATED STATEMENTS OF CASH FLOWS
(In thousands) | Year ended December 31, 2019 | Year ended December 31, 2018 | Year ended December 31, 2017 | ||||||||
Operating activities: | |||||||||||
Net income | $ | $ | $ | ||||||||
Adjustments to reconcile net income to net cash provided by operating activities: | |||||||||||
Depreciation | |||||||||||
Amortization | |||||||||||
Share-based compensation expense | |||||||||||
Provision for deferred income taxes | ( | ) | ( | ) | |||||||
Charge for excess and obsolete inventory | |||||||||||
Amortization of debt issuance costs | |||||||||||
Loss on extinguishment of debt | |||||||||||
Other | |||||||||||
Changes in operating assets and liabilities, net of effects of acquisitions: | |||||||||||
Trade accounts receivable and notes receivable | ( | ) | ( | ) | ( | ) | |||||
Inventories | ( | ) | ( | ) | ( | ) | |||||
Accounts payable and other accrued liabilities | ( | ) | |||||||||
Other current assets | ( | ) | ( | ) | |||||||
Income taxes payable, refundable income taxes and noncurrent taxes payable | ( | ) | ( | ) | |||||||
Other | ( | ) | ( | ) | |||||||
Net cash provided by operating activities | |||||||||||
Investing activities: | |||||||||||
Acquisition of property and equipment | ( | ) | ( | ) | ( | ) | |||||
Acquisition of business, net of cash acquired | ( | ) | ( | ) | ( | ) | |||||
Other | |||||||||||
Net cash used in investing activities | ( | ) | ( | ) | ( | ) | |||||
Financing activities: | |||||||||||
Proceeds from long-term debt | |||||||||||
Payments of long-term debt | ( | ) | ( | ) | ( | ) | |||||
Payments for debt issuance costs | ( | ) | ( | ) | |||||||
Payments for debt extinguishment costs | ( | ) | |||||||||
Payments for dividends | ( | ) | ( | ) | ( | ) | |||||
Issuance of common stock from employee stock plans | |||||||||||
Taxes paid related to net share settlement of equity awards | ( | ) | ( | ) | ( | ) | |||||
Repurchase and retirement of common stock | ( | ) | ( | ) | ( | ) | |||||
Other | ( | ) | ( | ) | ( | ) | |||||
Net cash (used in) provided by financing activities | ( | ) | |||||||||
Effect of exchange rate changes on cash and cash equivalents | ( | ) | |||||||||
(Decrease) increase in cash and cash equivalents | ( | ) | ( | ) | |||||||
Cash and cash equivalents at beginning of year | |||||||||||
Cash and cash equivalents at end of year | $ | $ | $ | ||||||||
F-9
Supplemental Cash Flow Information
(In thousands) | Year ended December 31, 2019 | Year ended December 31, 2018 | Year ended December 31, 2017 | ||||||||
Non-cash transactions: | |||||||||||
Contingent consideration obligation | $ | $ | $ | ||||||||
Deferred acquisition payments, net | $ | $ | $ | ||||||||
Equipment purchases in accounts payable | $ | $ | $ | ||||||||
Repurchase and retirement of common stock to be settled | $ | $ | $ | ||||||||
Capital lease obligations incurred | $ | $ | $ | ||||||||
Dividends payable | $ | $ | $ | ||||||||
Schedule of interest and income taxes paid: | |||||||||||
Interest paid | $ | $ | $ | ||||||||
Income taxes, net of refunds received | $ | $ | $ | ||||||||
See the accompanying notes to consolidated financial statements.
F-10
ENTEGRIS, INC.
NOTES TO CONSOLIDATED FINANCIAL STATEMENTS
DECEMBER 31, 2019
(1) SUMMARY OF SIGNIFICANT ACCOUNTING POLICIES
Principles of Consolidation The consolidated financial statements include the accounts of the Company and its majority-owned subsidiaries. Intercompany profits, transactions and balances have been eliminated in consolidation.
Use of Estimates and Basis of Presentation The preparation of consolidated financial statements in conformity with accounting principles generally accepted in the United States requires management to make judgments, estimates and assumptions that affect the amounts reported in the consolidated financial statements and accompanying notes. On an ongoing basis, Entegris evaluates its estimates, including those related to receivables, inventories, property, plant and equipment, goodwill, intangible assets, accrued liabilities, income taxes and share-based compensation, among others. Actual results could differ from those estimates.
Allowance for Doubtful Accounts An allowance for uncollectible trade receivables is estimated based on a combination of write-off history, aging analysis and any specific, known troubled accounts. The Company maintains an allowance for doubtful accounts that management believes is adequate to cover expected losses on trade receivables.
Inventories Inventories are stated at the lower of cost and net realizable value. Cost is determined by the first-in, first-out (FIFO) method.
Leases The Company determines if an arrangement is a lease at inception. Right-of-use (ROU) assets include operating leases. Lease liabilities for operating leases are classified in “Other accrued liabilities” and “Long-term lease liabilities” in our consolidated balance sheet. We do not have material financing leases.
Operating assets and liabilities are recognized at commencement date based on the present value of the lease payments over the lease term. As most of our leases do not provide an implicit rate, we use our incremental borrowing rate based on the information available at commencement date in determining the present value of lease payments. We use the implicit rate when readily determinable. The ROU assets includes prepaid lease payments and excludes lease incentives. Lease terms may include options to extend or terminate the lease when it is reasonably certain that the Company will exercise that option. Lease expense for lease payments is recognized on a straight-line basis over the lease term.
Lease and non-lease components are generally accounted for separately for real estate leases. For non-real estate leases, we account for the lease and non-lease components as a single lease component.
Property, Plant, and Equipment Property, plant and equipment are carried at cost and are depreciated on the straight-line method over the estimated useful lives of the assets. When assets are retired or disposed of, the cost and related accumulated depreciation are removed from the accounts, and gains or losses are recognized in the same period. Maintenance and repairs are expensed as incurred, while significant additions and improvements are capitalized. Long-lived assets, including property, plant and equipment, are reviewed for impairment whenever events or changes in circumstances indicate that the carrying amount of an asset or group of assets may not be recoverable based on estimated future undiscounted cash flows. The amount of impairment, if any, is measured as the difference between the net book value and the estimated fair value of the asset(s).
Fair Value of Financial Instruments The carrying value of cash equivalents, accounts receivable, accounts payable, accrued payroll and related benefits, and other accrued liabilities approximates fair value due to the short maturity of those instruments.
The fair value of long-term debt, including current maturities, based upon models utilizing market observable (Level 2) inputs and credit risk, was $958 million at December 31, 2019 compared to the carrying amount of long-term debt, including current maturities, of $936 million at December 31, 2019.
Goodwill and Intangible Assets Goodwill represents the excess of acquisition costs over the fair value of the net assets of businesses acquired. Goodwill is not subject to amortization, but is tested for impairment annually at August 31, the Company’s annual testing date, and whenever events or changes in circumstances indicate that impairment may have occurred. The Company compares the carrying value of its reporting units, including goodwill, to their fair value. For reporting units in which the assessment indicates that it is more likely than not that the fair value is more than its carrying value, goodwill is not considered impaired. If the carrying value of the reporting unit exceeds fair value, goodwill is considered impaired.
F-11
Based on its annual analysis, the Company determined there was no indication of impairment of goodwill and the estimated fair value of each reporting unit substantially exceeded its carrying value.
Amortizable intangible assets include, among other items, patented, unpatented and other developed technology and customer-based intangibles, and are amortized using the straight-line method over their respective estimated useful lives. The Company reviews intangible assets and other long-lived assets for impairment if changes in circumstances or the occurrence of events suggest the remaining value may not be recoverable.
Derivative Financial Instruments The Company records derivatives as assets or liabilities on the balance sheet and measures such instruments at fair value. Changes in fair value of derivatives are recorded each period in the Company’s consolidated statements of operations.
The Company periodically enters into forward foreign currency contracts to reduce exposures relating to rate changes in certain foreign currencies. Certain exposures to credit losses related to counterparty nonperformance exist. However, the Company does not anticipate nonperformance by the counterparties since they are large, well-established financial institutions. None of these derivatives is accounted for as a hedge transaction. Accordingly, changes in the fair value of forward foreign currency contracts are recorded as other expense (income), net, in the Company’s consolidated statements of operations. The fair values of the Company’s derivative financial instruments are based on prices quoted by financial institutions for these instruments.
Foreign Currency Translation Assets and liabilities of certain foreign subsidiaries are translated from foreign currencies into U.S. dollars at period-end exchange rates, and the resulting gains and losses arising from translation of net assets located outside the U.S. are recorded as a cumulative translation adjustment, a component of accumulated other comprehensive loss in the consolidated balance sheets. Income statement amounts are translated at the weighted average exchange rates for the year. Translation adjustments are not adjusted for income taxes, as substantially all translation adjustments relate to permanent investments in non-U.S. subsidiaries. Gains and losses resulting from foreign currency transactions are included in other expense (income), net, in the Company’s consolidated statements of operations.
Revenue Recognition Revenue is measured based on consideration specified in a contract with a customer, and excludes any sales incentives and amounts collected on behalf of third parties. The Company recognizes revenue when it satisfies a performance obligation by transferring control over a product or service to a customer.
Taxes assessed by a governmental authority that are both imposed on and concurrent with a specific revenue-producing transaction, that are collected by the Company from a customer, are excluded from revenue.
Engineering, Research and Development Expenses Engineering, research and development costs are expensed as incurred.
Share-based Compensation The Company measures the cost of employee services received in exchange for the award of equity instruments based on the fair value of the award at the date of grant. Compensation expense is recognized using the straight-line attribution method to recognize share-based compensation over the service period of the award, with adjustments recorded for forfeitures as they occur.
The Company recognizes deferred tax assets to the extent that it believes these assets are more likely than not to be realized. A valuation allowance is recorded to reduce deferred tax assets when it is more likely than not that the Company would not be able to realize all or part of its deferred tax assets. In making such a determination, the Company considers all available positive and negative evidence, including future reversals of existing temporary differences, projected future taxable income, tax-planning strategies, and results of recent operations. If the Company determines that it would be able to realize its deferred tax assets in the future in excess of their net recorded amount, the Company would make an adjustment to the deferred tax asset valuation allowance, which would reduce the provision for income taxes.
The Company’s policy for recording interest and penalties associated with audits and unrecognized tax benefits is to record such items as a component of income before taxes. Penalties and interest to be paid or received are recorded in other expense (income), net, in the statement of operations.
Comprehensive Income (Loss) Comprehensive income (loss) represents the change in equity resulting from items other than shareholder investments and distributions. The Company’s foreign currency translation adjustments, unrealized gains and
F-12
losses on available-for-sale investments, and minimum pension liability adjustments are included in accumulated other comprehensive loss. Comprehensive income (loss) and the components of accumulated other comprehensive loss are presented in the accompanying consolidated statements of comprehensive income (loss) and consolidated statements of equity.
Recent Accounting Pronouncements Adopted in 2019 In February 2016, the FASB established Topic 842, Leases, by issuing Accounting Standards Update (ASU) No. 2016-02, which requires lessees to recognize leases on the balance sheet and disclose key information about leasing arrangements. Topic 842 was subsequently amended by ASU No. 2018-01, Land Easement Practical Expedient for Transition to Topic 842; ASU No. 2018-10, Codification Improvements to Topic 842, Leases; and ASU No. 2018-11, Targeted Improvements. The new standard establishes a right-of-use (ROU) model that requires a lessee to recognize a ROU asset and lease liability on the balance sheet for all leases with a term longer than 12 months. Leases will be classified as finance or operating, with classification affecting the pattern and expense recognition in the income statement.
The Company adopted ASU No. 2016-02 using the modified retrospective method. See Note 10 Leases to the consolidated financial statements for further details.
Recent Accounting Pronouncements Yet to be Adopted In June 2016, the FASB issued ASU 2016-13, Financial Instruments - Credit Losses (Topic 326): Measurement of Credit Losses on Financial Instruments. ASU 2016-13 changes the impairment model for most financial assets and certain other instruments. For trade and other receivables, held-to-maturity debt securities, loans and other instruments, entities will be required to use a new forward-looking “expected loss” model that will replace the current “incurred loss” model and generally will result in the earlier recognition of allowances for losses. The Company is required to adopt this new guidance in the first quarter of fiscal 2020. The Company is reviewing the provisions of the new standard and currently does not expect a material effect on its consolidated financial statements.
2. REVENUES
Revenue Recognition Revenue is measured based on consideration specified in a contract with a customer, and excludes any sales incentives and amounts collected on behalf of third parties. The Company recognizes revenue when it satisfies a performance obligation by transferring control over a product or service to a customer.
Taxes assessed by a governmental authority that are both imposed on and concurrent with a specific revenue-producing transaction, that are collected by the Company from a customer, are excluded from revenue.
Shipping and handling costs associated with outbound freight after control over a product has transferred to a customer are accounted for as a fulfillment cost and are included in cost of goods sales.
The Company recognizes the incremental costs of obtaining contracts as an expense when incurred if the amortization period of the assets that the Company otherwise would have recognized is one year or less.
When the Company receives consideration, or such consideration is unconditionally due, from a customer prior to transferring goods or services to the customer under the terms of a sales contract, the Company records deferred revenue, which represents a contract liability. Such deferred revenue typically results from advance payments received on sales of the Company’s products. The Company makes the required disclosures below.
The Company does not disclose information about remaining performance obligations that have original expected durations of one year or less.
Nature of goods and services The following is a description of principal activities from which the Company generates its revenues. The Company has three reportable segments. For more detailed information about reportable segments, see note 16 to the consolidated financial statements. For each of the three reportable segments, the recognition of revenue regarding the nature of goods and services provided by the segments are similar and described below. The Company recognizes revenue for product sales at a point in time following the transfer of control of such products to the customer, which generally occurs upon shipment or delivery, depending on the terms of the underlying contracts. For product sales contracts that contain multiple performance obligations, the Company allocates the transaction price to each performance obligation identified in the contract based on relative standalone selling prices, or estimates of such prices, and recognizes the related revenue as control of each individual product is transferred to the customer in satisfaction of the corresponding performance obligations.
The Company generally recognizes revenue for sales of services when the Company has satisfied the performance obligation. The payment terms and revenue recognized is based on time and materials.
The Company also enters into arrangements to license its intellectual property. These arrangements typically permit the customer to use a specialized manufacturing process and in return the Company receives a royalty fee. The Company recognizes revenue for a sales-based or usage-based royalty promised in exchange for a license of intellectual property when the subsequent sale or usage occurs.
F-13
The Company offers certain customers cash discounts and volume rebates as sales incentives. The discounts and volume rebates are recorded as a reduction in sales at the time revenue is recognized in an amount estimated based on historical experience and contractual obligations. The Company periodically reviews the assumptions underlying its estimates of discounts and volume rebates and adjusts its revenues accordingly.
In addition, the Company offers free product rebates to certain customers. The Company utilizes an adjusted market approach to estimate the stand-alone selling price of the loyalty program and allocates a portion of the consideration received to the free product offering. The free product offering is redeemable upon future purchases of the Company’s products. The amount associated with free product rebates is recorded as deferred revenue on the balance sheet and is recognized as revenue when the free product is redeemed or when the likelihood of redemption is remote. The Company has deemed that the amount is immaterial for disclosure. The Company applies the practical expedient in ASU No. 2014-09 and does not disclose information about remaining performance obligations that have original expected durations of one year or less.
The Company provides for the estimated costs of fulfilling its obligations under product warranties at the time the related revenue is recognized. The Company estimates the costs based on historical failure rates, projected repair costs, and knowledge of specific product failures (if any). The specific warranty terms and conditions vary depending upon the product sold and the country in which we do business, but generally include parts and labor over a period generally ranging from 90 days to one year. The Company regularly reevaluates its estimates to assess the adequacy of the recorded warranty liabilities and adjusts the amounts as necessary.
The Company’s contracts are generally short-term in nature. Most contracts do not exceed twelve months. Payment terms vary by the type and location of the Company’s customers and the products or services offered. The term between invoicing and when payment is due is not significant. For certain products or services and customer types, the Company requires payment before the products or services are delivered to the customer. Those customers that prepay are represented by the contract liabilities below until the performance obligations are satisfied.
The following table provides information about contract liabilities from contracts with customers. The contract liabilities are included in other accrued liabilities balance in the consolidated balance sheet.
(In thousands) | December 31, 2019 | December 31, 2018 | |||||
Contract liabilities - current | $ | $ | |||||
Significant changes in the contract liabilities balances during the period are as follows:
(In thousands) | 2019 | ||
Revenue recognized that was included in the contract liability balance at the beginning of the period | $ | ( | ) |
Increases due to cash received, excluding amounts recognized as revenue during the period | |||
(3) ACQUISITIONS
Hangzhou Anow Microfiltration Co., Ltd.
On September 17, 2019 , the Company acquired Hangzhou Anow Microfiltration Co., Ltd. (Anow), a filtration company for diverse industries including semiconductor, pharmaceutical, and medical. Anow reports into the Microcontamination Control segment of the Company. The acquisition was accounted for under the acquisition method of accounting and the results of Anow are included in the Company’s consolidated financial statements as of and since September 17, 2019. Costs associated with the acquisition of Anow were $2.5 million for the year ended December 31, 2019 and were expensed as incurred. These costs are included in selling, general and administrative expenses in the Company’s consolidated statement of operations. The acquisition does not constitute a material business combination.
The purchase price for Anow is $72.8 million, net of cash acquired. The purchase price includes (1) cash consideration of $73.0 million, or $69.3 million net of cash acquired, which was funded from the Company’s existing cash on hand and (2) $3.5 million deferred payment due to the seller at no earlier than September 18, 2021 at which time either the seller or the Company can exercise its option to receive the deferred payment.
The purchase price of Anow exceeds the net of the acquisition-date fair value of the identifiable assets acquired and the liabilities assumed by $47.7 million. Cash flows used to determine the purchase price included strategic and synergistic benefits (investment value) specific to the Company, which resulted in a purchase price in excess of the fair value of identifiable net assets. This additional investment value resulted in goodwill, which is expected to be non-deductible for income tax purposes.
F-14
The following table summarizes the provisional allocation of the purchase price to the fair values assigned to the assets acquired and liabilities assumed at the date of the acquisition and adjusted as of December 31, 2019.
(In thousands): | As of September 17, 2019 | As of December 31, 2019 | |||||
Trade accounts and note receivable, net | $ | $ | |||||
Inventories, net | |||||||
Other current assets | |||||||
Property, plant and equipment | |||||||
Identifiable intangible assets | |||||||
Right-of-use assets | |||||||
Other noncurrent assets | |||||||
Accounts payable and accrued liabilities | ( | ) | ( | ) | |||
Short-term lease liability | ( | ) | |||||
Long-term lease liability | ( | ) | |||||
Deferred tax liabilities | ( | ) | ( | ) | |||
Other noncurrent liabilities | ( | ) | |||||
Net assets acquired | |||||||
Goodwill | |||||||
Total purchase price, net of cash acquired | $ | $ | |||||
The Company recognized the following finite-lived intangible assets as part of the acquisition of Anow:
(In thousands) | Amount | Weighted average life in years | |||
Developed technology | $ | ||||
Trademarks and trade names | |||||
Customer relationships | |||||
$ | |||||
The final valuation of assets acquired and liabilities assumed is expected to be completed as soon as possible, but no later than one year from the acquisition date. The allocation of the purchase price to the assets acquired and liabilities assumed is complete with the exception of the value allocated to income tax accounts and intangible assets. To the extent that the Company's estimates require adjustment, the Company will modify the values.
MPD Chemicals
On July 15, 2019 , the Company acquired MPD Chemicals (MPD), a provider of advanced materials to the specialty chemical, technology, and life sciences industries. MPD reports into the Specialty Chemicals and Engineered Material segment of the Company. The acquisition was accounted for under the acquisition method of accounting and the results of MPD are included in the Company’s consolidated financial statements as of and since July 15, 2019. Costs associated with the acquisition of MPD were $4.0 million for the year ended December, 2019 and were expensed as incurred. These costs are included in selling, general and administrative expense in the Company’s consolidated statement of operations. The acquisition does not constitute a material business combination.
The purchase price for MPD is $161.0 million, net of cash acquired. The purchase price includes (1) cash consideration of $156.5 million (subject to revision for customary working capital adjustments), which was funded from the Company’s existing cash on hand, and (2) a fixed deferred payment of $5.0 million that is due on January 15, 2022, recorded at $4.5 million, which represents the fair value of this fixed deferred payment as of the acquisition date.
The fair value of the fixed deferred payment was determined by taking the present value of this fixed deferred payment based on the term and a discount factor. The fixed deferred payment is reflected in pension benefit obligations and other liabilities in the Company’s consolidated balance sheets.
The purchase price of MPD exceeds the net of the acquisition-date amounts of the identifiable assets acquired and the liabilities assumed by $61.9 million. Cash flows used to determine the purchase price included strategic and synergistic benefits (investment value) specific to the Company, which resulted in a purchase price in excess of the fair value of identifiable net assets. This additional investment value resulted in goodwill, which is expected to be deductible for income tax purposes.
F-15
The following table summarizes the provisional allocation of the purchase price to the fair values assigned to the assets acquired and liabilities assumed at the date of the acquisition and adjusted as of December 31, 2019
(In thousands): | As of July 15, 2019 | As of December 31, 2019 | |||||
Trade accounts and note receivable, net | $ | $ | |||||
Inventories, net | |||||||
Other current assets | |||||||
Property, plant and equipment | |||||||
Identifiable intangible assets | |||||||
Right-of-use assets | |||||||
Accounts payable and accrued liabilities | ( | ) | ( | ) | |||
Short-term lease liability | ( | ) | ( | ) | |||
Long-term lease liability | ( | ) | ( | ) | |||
Other noncurrent liabilities | ( | ) | ( | ) | |||
Net assets acquired | |||||||
Goodwill | |||||||
Total purchase price, net of cash acquired | $ | $ | |||||
The allocation of the purchase price to the assets acquired and liabilities assumed is complete with the exception of the value
allocated to income tax accounts. To the extent that the Company's estimates require adjustment, the Company will modify the
values.
The Company recognized the following finite-lived intangible assets as part of the acquisition of MPD:
(In thousands) | Amount | Weighted average life in years | |||
Developed technology | $ | ||||
Trademarks and trade names | |||||
Customer relationships | |||||
$ | |||||
Digital Specialty Chemicals
On March 8, 2019 , the Company acquired Digital Specialty Chemicals Limited (DSC), a Toronto, Canada-based provider of advanced materials to the specialty chemical, technology, and pharmaceutical industries. DSC reports into the Specialty Chemicals and Engineered Materials segment of the Company. The acquisition was accounted for under the acquisition method of accounting and the results of operations of DSC are included in the Company’s consolidated financial statements as of and since March 8, 2019. Costs associated with the acquisition of DSC were $2.1 million for the fiscal year ended December 31, 2019 and were expensed as incurred. These costs are included in selling, general and administrative expense in the Company’s consolidated statements of operations. The acquisition does not constitute a material business combination.
The purchase price for DSC is $64.1 million, net of cash acquired. The purchase price includes (1) cash consideration of $49.9 million, or $49.4 million net of cash acquired, which was funded from the Company’s existing cash on hand, (2) a fixed deferred payment of $16.1 million that is due on March 31, 2022, recorded at $14.0 million representing the fair value of this fixed deferred payment as of the acquisition date, and (3) an earnout-based contingent consideration of $0.7 million based on the operating performance of DSC for a twelve-month period ended March 31, 2021.
The fair value of the fixed deferred payment was determined by taking the present value of this fixed deferred payment based on the term and a discount factor. The fixed deferred payment is reflected in pension benefit obligations and other liabilities in the Company’s consolidated balance sheets.
Upon closing the acquisition, the Company recorded a contingent consideration obligation of $0.7 million, which represents the fair value of the earnout-based contingent consideration. This amount was estimated based on a Black Scholes model. Subsequent changes in the fair value of this obligation will be recognized as adjustments to the contingent consideration obligation and reflected within the Company’s consolidated statements of operations.
F-16
On December 3, 2019, the Company entered into a settlement agreement to accelerate the fixed deferred payment of $16.1 million to no later than March 8, 2020. The Company adjusted the fair value of the fixed deferred payment from its fair value to the full value resulting in an additional $1.6 million charge to interest expense in the consolidated income statement and the liability was adjusted from other long-term liabilities to other accrued liabilities. In addition the acceleration of the fixed deferred payment, it was determined the earnout-based contingent consideration of $0.7 million will never become owed to the sellers under the original purchase agreement. The Company removed the liability and credited selling, general and administrative expenses in the consolidated income statement.
The purchase price of DSC exceeds the net of the acquisition-date amounts of the identifiable assets acquired and the liabilities assumed by $36.5 million. Cash flows used to determine the purchase price included strategic and synergistic benefits (investment value) specific to the Company, which resulted in a purchase price in excess of the fair value of identifiable net assets. This additional investment value resulted in goodwill, which is expected to be non-deductible for income tax purposes.
The following table summarizes the allocation of the purchase price to the fair values assigned to the assets acquired and liabilities assumed at the date of the acquisition and as adjusted as of December 31, 2019:
(In thousands): | As of March 8, 2019 | December 31, 2019 | |||||
Trade accounts and note receivable, net | $ | $ | |||||
Inventories, net | |||||||
Other current assets | |||||||
Property, plant and equipment | |||||||
Identifiable intangible assets | |||||||
Right-of-use assets | |||||||
Deferred tax asset | |||||||
Other noncurrent assets | |||||||
Accounts payable and accrued liabilities | ( | ) | ( | ) | |||
Deferred tax liabilities | ( | ) | ( | ) | |||
Long-term lease liability | ( | ) | ( | ) | |||
Net assets acquired | |||||||
Goodwill | |||||||
Total purchase price, net of cash acquired | $ | $ | |||||
During the year ended December 31, 2019, the Company finalized its fair value determination of the assets acquired and liabilities assumed. The valuation of the assets acquired and liabilities assumed was based on the information that was available as of the acquisition date, and the expectations and assumptions that have been deemed reasonable by the Company’s management.
Flex Concepts
On June 26, 2019 , the Company acquired Flex Concepts, Inc. (Flex), a technology company focused on single-use fluid handling bags, tubing manifolds and hardware for the life sciences industry. Flex reports into the Advanced Materials Handling segment of the Company. The purchase price of Flex was for cash consideration of $1.9 million. The transaction was accounted for under the acquisition method of accounting and the results of operations of Flex are included in the Company’s consolidated financial statements since June 26, 2018. The acquisition does not constitute a material business combination.
During the year ended December 31, 2018, the Company finalized its fair value determinations of the assets acquired and liabilities assumed. The valuation of the assets acquired and liabilities assumed was based on the information that was available as of the acquisition date and the expectations and assumptions that have been deemed reasonable by the Company’s management.
SAES Pure Gas
On June 25, 2018 , the Company acquired the SAES Pure Gas business (SPG), from SAES Getters S.p.A. for approximately $352.7 million in cash, or $341.5 million net of cash acquired, funded from the Company’s existing cash on hand. The acquisition was accounted for under the acquisition method of accounting and the results of operations of SPG are included in the Company’s consolidated financial statements as of and since June 25, 2018. Direct costs of $4.8 million associated with the acquisition of SPG, consisting mainly of professional and consulting fees, were expensed as incurred for the year ended December 31, 2018. These costs are included in selling, general and administrative expense in the Company’s consolidated statements of operations.
F-17
SPG, based in San Luis Obispo, California, is a leading provider of high-capacity gas purification systems used in semiconductor manufacturing and adjacent markets, and reports into the Microcontamination Control segment of the Company. This acquisition expanded the gas purification solutions portfolio in our Microcontamination Control segment with high-capacity products suited for bulk chemical purification applications.
The following table summarizes the provisional allocation of the purchase price to the fair values assigned to the assets acquired and liabilities assumed at the date of the acquisition and adjusted as of December 31, 2019.
(In thousands): | As of June 30, 2018 | As of December 31, 2019 | |||||
Trade accounts and notes receivable, net | $ | $ | |||||
Inventories, net | |||||||
Other current assets | |||||||
Property, plant and equipment, net | |||||||
Identifiable intangible assets | |||||||
Deferred tax asset | |||||||
Other noncurrent assets | |||||||
Current liabilities | ( | ) | ( | ) | |||
Deferred tax liabilities | ( | ) | ( | ) | |||
Other noncurrent liabilities | ( | ) | ( | ) | |||
Net assets acquired | |||||||
Goodwill | |||||||
Total purchase price, net of cash acquired | $ | $ | |||||
The fair value of acquired inventories of $42.8 million is valued at the estimated selling price less the cost of disposal and reasonable profit for the selling effort. The fair value write-up of acquired work-in-process and finished goods inventory was $8.9 million, the amount of which will be amortized over the expected turn of the acquired inventory. Accordingly, a $2.0 million and a $6.9 million incremental cost of sales charge associated with the fair value write-up of inventory acquired in the acquisition of SPG was recorded for the years ended December 31, 2019 and 2018, respectively.
The fair value of acquired property, plant and equipment of $6.7 million is valued at its value-in-use.
The Company recognized the following finite-lived intangible assets as part of the acquisition of SPG:
(In thousands) | Amount | Weighted average life in years | |||
Developed technology | $ | ||||
Trademarks and trade names | |||||
Customer relationships | |||||
Other | |||||
$ | |||||
The acquired identifiable intangible assets are being amortized on a straight-line basis. The fair value of acquired identifiable intangible assets was determined using the “income approach”. In performing these valuations, the key underlying probability-adjusted assumptions of the discounted cash flows were projected revenues, gross margin expectations, discount rate and operating cost estimates. The valuations were based on the information that was available as of the acquisition date and the expectations and assumptions that have been deemed reasonable by the Company’s management. There are inherent uncertainties and management judgment required in these determinations. The fair value measurements of the assets acquired and liabilities assumed were based on valuations involving significant unobservable inputs, or Level 3 in the fair value hierarchy.
The purchase price of SPG exceeded the net of the acquisition-date amounts of the identifiable assets acquired and the liabilities assumed by $184.2 million. Cash flows used to determine the purchase price included strategic and synergistic benefits (investment value) specific to the Company, which resulted in a purchase price in excess of the fair value of identifiable net assets. The purchase price also included the fair values of other assets that were not identifiable, not separately recognizable under accounting rules (e.g., assembled workforce) or of immaterial value in addition to a going-concern element that represents the Company’s ability to earn a higher rate of return on the group of assets than would be expected on the
F-18
separate assets as determined during the valuation process. This additional investment value resulted in goodwill. No amount of goodwill is expected to be deductible for income tax purposes.
During the quarter ended June 29, 2019, the Company finalized its fair value determination of the assets acquired and liabilities assumed. The valuation of the assets acquired and liabilities assumed was based on the information that was available as of the acquisition date, and the expectations and assumptions that have been deemed reasonable by the Company’s management.
Particle Sizing Systems
On January 22, 2018 , the Company acquired Particle Sizing Systems, LLC (PSS), which provides particle sizing instrumentation for liquid applications to the semiconductor and life science industries. The acquired assets and assumed liabilities became part of the Company’s Advanced Materials Handling segment. The transaction was accounted for under the acquisition method of accounting and the results of operations of PSS are included in the Company’s consolidated financial statements since January 22, 2018. The acquisition does not constitute a material business combination.
The purchase price for PSS was cash consideration of $37.3 million, funded from the Company’s existing cash on hand. Costs associated with the acquisition of the product line were not significant and were expensed as incurred.
The purchase price of PSS exceeds the net of the acquisition-date amounts of the identifiable assets acquired and the liabilities assumed by $8.8 million. Cash flows used to determine the purchase price included strategic and synergistic benefits (investment value) specific to the Company, which resulted in a purchase price in excess of the fair value of identifiable net assets. This additional investment value resulted in goodwill, which is expected to be deductible for income tax purposes.
The following table summarizes the final allocation of the purchase price to the fair values assigned to the assets acquired and liabilities assumed at the date of acquisition and adjusted as of December 31, 2018.
(In thousands): | As of March 31, 2018 | As of December 31, 2018 | |||||
Trade accounts and notes receivable, net | $ | $ | |||||
Inventories, net | |||||||
Other current assets | |||||||
Property, plant and equipment, net | |||||||
Identifiable intangible assets | |||||||
Other noncurrent assets | |||||||
Accounts payables | ( | ) | ( | ) | |||
Other accrued liabilities | ( | ) | ( | ) | |||
Net assets acquired | |||||||
Goodwill | |||||||
Total purchase price | $ | $ | |||||
As of December 31, 2018, the Company finalized its fair value determinations of the assets acquired and liabilities assumed. The valuation of the assets acquired and liabilities assumed was based on the information that was available as of the acquisition date, and the expectations and assumptions that have been deemed reasonable by the Company’s management.
F-19
(4) TRADE ACCOUNTS AND NOTES RECEIVABLE
Trade accounts and notes receivable from customers at December 31, 2019 and 2018 consist of the following:
(In thousands) | 2019 | 2018 | |||||
Accounts receivable | $ | $ | |||||
Notes receivable | |||||||
Total trade accounts and notes receivable | |||||||
Less allowance for doubtful accounts | |||||||
Trade accounts and notes receivable, net | $ | $ | |||||
(5) INVENTORIES
Inventories at December 31, 2019 and 2018 consist of the following:
(In thousands) | 2019 | 2018 | |||||
Raw materials | $ | $ | |||||
Work-in-process | |||||||
Finished goods (a) | |||||||
Inventories, net | $ | $ | |||||
(a) Includes consignment inventories held by customers for $13.6 million and $12.5 million at December 31, 2019 and 2018, respectively.
(6) PROPERTY, PLANT AND EQUIPMENT
Property, plant and equipment at December 31, 2019 and 2018 consists of the following:
(In thousands) | 2019 | 2018 | Estimated useful lives in years | ||||||
Land | $ | $ | |||||||
Buildings and improvements | 5-35 | ||||||||
Manufacturing equipment | 5-10 | ||||||||
Canisters and cylinders | 3-12 | ||||||||
Molds | 3-5 | ||||||||
Office furniture and equipment | 3-8 | ||||||||
Construction in progress | |||||||||
Total property, plant and equipment | |||||||||
Less accumulated depreciation | |||||||||
Property, plant and equipment, net | $ | $ | |||||||
The table below sets forth the depreciation expense for the years ended December 31, 2019, 2018 and 2017:
(In thousands) | 2019 | 2018 | 2017 | ||||||||
Depreciation expense | $ | $ | $ | ||||||||
F-20
(7) GOODWILL AND INTANGIBLE ASSETS
Goodwill activity for each of the Company’s reportable segments that carry goodwill, Specialty Chemicals and Engineered Materials (SCEM), Microcontamination Control (MC) and Advanced Materials Handling (AMH), for the years ended December 31, 2019 and 2018 is shown below:
(In thousands) | SCEM | MC | AMH | Total | |||||||||||
December 31, 2017 | $ | $ | $ | $ | |||||||||||
Addition due to acquisitions | |||||||||||||||
Other, including foreign currency translation | ( | ) | ( | ) | ( | ) | |||||||||
December 31, 2018 | |||||||||||||||
Addition due to acquisitions | |||||||||||||||
Purchase accounting adjustments | |||||||||||||||
Other, including foreign currency translation | ( | ) | ( | ) | |||||||||||
December 31, 2019 | $ | $ | $ | $ | |||||||||||
As of December 31, 2019, goodwill amounted to approximately $695.0 million, an increase of $144.8 million from the balance at December 31, 2018. The increase in goodwill in 2019 reflects the acquisition of DSC, MPD, and Anow described in note 3 offset by the decrease resulting from foreign currency translation. The increase in goodwill in 2018 reflects the acquisition of SPG, PSS and Flex described in note 3 offset by the decrease resulting from foreign currency translation.
Identifiable intangible assets at December 31, 2019 and 2018 consist of the following:
2019 | |||||||||||||
(In thousands) | Gross carrying Amount | Accumulated amortization | Net carrying value | Weighted average life in years | |||||||||
Developed technology | |||||||||||||
Trademarks and trade names | |||||||||||||
Customer relationships | |||||||||||||
Other | |||||||||||||
$ | $ | $ | |||||||||||
2018 | |||||||||||||
(In thousands) | Gross carrying amount | Accumulated amortization | Net carrying value | Weighted average life in years | |||||||||
Developed technology | |||||||||||||
Trademarks and trade names | |||||||||||||
Customer relationships | |||||||||||||
Other | |||||||||||||
$ | $ | $ | |||||||||||
The table below sets forth the amortization expense for the years ended December 31, 2019, 2018, and 2017:
(In thousands) | 2019 | 2018 | 2017 | ||||||||
Amortization expense | $ | $ | $ | ||||||||
The amortization expense for each of the five succeeding years and thereafter relating to intangible assets currently recorded in the Company’s consolidated balance sheets is estimated to be the following at December 31, 2019:
(In thousands) | 2020 | 2021 | 2022 | 2023 | 2024 | Thereafter | Total | ||||||||||||||||||||
Future amortization expense | $ | $ | $ | $ | $ | $ | $ | ||||||||||||||||||||
F-21
(8) DEBT
Long-term debt at December 31, 2019 and 2018 consists of the following:
(In thousands) | December 31, 2019 | December 31, 2018 | |||||
Senior secured term loan facility due 2025 | |||||||
Senior unsecured notes due 2026 | |||||||
Unamortized discount and debt issuance costs | |||||||
Total long-term debt | |||||||
Less current maturities of long-term debt | |||||||
Long-term debt less current maturities | $ | $ | |||||
Annual maturities of long-term debt, excluding unamortized discount and issuance costs, due as of December 31, 2019 are as follows:
(In thousands) | 2020 | 2021 | 2022 | 2023 | 2024 | Thereafter | Total | |||||||||||||||
Contractual debt obligation maturities* | $ | $ | ||||||||||||||||||||
*Subject to Excess Cash Flow payments to the lenders, see discussion below.
In November 2018, the Company entered into the New Term Loan Facility and the New Revolving Facility described below. The Company used the net proceeds of the term loans under the New Term Loan Facility to repay and terminate the Previous Credit Facilities, described below, to pay fees and expenses related to the issuance and the repayment, and for general corporate purposes.
In October 2019, the Company amended its credit and guaranty agreement (the “Credit Agreement”) dated as of November 6, 2018. The amendment changed the agency bank from Goldman Sachs Bank USA, as administrative agent and collateral agent, to Morgan Stanley, and adds two additional lenders to the Company’s Credit Agreement. There was no change to the total commitment or the term length for either the New Term Loan Facility or the New Revolving Facility as defined below under Senior Secured Credit Facilities. However, the amendment changed the amount committed for each of the previous lenders.
Debt issuance costs of $5.1 million for the year ended December 31, 2018 were paid to third parties are capitalized as debt issuance costs in connection with the New Credit Facilities. These debt issuance costs are being amortized as interest expense in the Company’s consolidated statements of operations over the term of the debt instrument using the straight-line method. The term loans under the Previous Term Loan Facility were repaid without premium or penalty at 100 % of the outstanding principal amount, plus accrued and unpaid interest.
2026 Senior Unsecured Notes
On November 10, 2017, the Company issued $550 million aggregate principal amount of 4.625 % senior unsecured notes due February 10, 2026 (“the 2026 Notes”). The 2026 Notes were issued under an indenture dated as of November 10, 2017 (the “2026 Notes Indenture”) by and among the Company and Wells Fargo Bank, National Association, as trustee. Interest on the 2026 Notes is payable semi-annually in arrears on February 15 and August 15, which commenced on February 15, 2018.
The 2026 Notes are guaranteed, jointly and severally, fully and unconditionally, on a senior unsecured basis, by, subject to certain exclusions, each of the Company’s domestic subsidiaries that guarantee indebtedness under the New Credit Facilities.
As provided in the 2026 Notes Indenture, the Company may at its option on one or more occasions redeem all or a part of the 2026 Notes at a redemption price equal to (a) 100 % of the principal amount of the 2026 Notes redeemed plus a make-whole premium if redeemed prior to November 10, 2020, or (b) 100 % of the principal amount of the 2026 Notes redeemed plus a percentage of principal amount between 100 % and 103.469 % of the aggregate principal amount of the 2026 Notes to be redeemed, depending on the period of redemption, if redeemed on or after November 10, 2020, plus, in each case, accrued and unpaid interest on the amount of 2026 Notes being redeemed.
Upon a change in control accompanied by certain rating events, the Company is required to offer to repurchase all of the 2026 Notes at a price in cash equal to 101 % of the aggregate principal amount thereof, plus accrued and unpaid interest, if any, to, but not including, the date of repurchase.
The 2026 Notes Indenture contains covenants that, among other things and subject to certain exceptions, limit the Company’s ability and the ability of the Company’s restricted subsidiaries to create liens, enter into sale and leaseback transactions, engage in consolidations or mergers, or sell, transfer or otherwise dispose of all or substantially all of their assets. The 2026 Notes
F-22
Indenture also, subject to certain exceptions, limits the ability of any subsidiary of the Company that is not a guarantor under the 2026 Notes to incur indebtedness. The Company is in compliance with all of the above covenants at December 31, 2019.
The 2026 Notes Indenture also provides for events of default which, if certain of them occur, would permit the trustee or the holders of at least 25 % in aggregate principal amount of the then outstanding 2026 Notes to declare the principal, premium, if any, interest and any other monetary obligations on all the then-outstanding 2026 Notes to be due and payable immediately.
Senior Secured Credit Facilities
On November 6, 2018, the Company entered into a credit and guaranty agreement (the “Credit Agreement”) with Goldman Sachs Bank USA, subsequently amended in October of 2019 to Morgan Stanley, as administrative agent and collateral agent, and the lenders party thereto, that provides senior secured financing in an aggregate principal amount of $700 million, consisting initially of (a) term loans in an aggregate principal amount of $400 million (the “New Term Loan Facility”) and (b) revolving commitments in an aggregate amount of $300 million (the “New Revolving Facility”, and together with the New Term Loan Facility, the “New Credit Facilities”). Borrowings under the New Credit Facilities bear interest at a rate per annum equal to, at the Company’s option, a base rate (such as prime rate or LIBOR) plus an applicable margin. The Company’s interest rate on the term loans under the New Term Loan Facility is 3.80 % at December 31, 2019. In addition to paying interest on the outstanding principal under the New Credit Facilities, the Company will pay (i) with respect to the New Term Loan Facility, customary agency fees, and (ii) with respect to the New Revolving Facility, a commitment fee in respect of the unutilized commitments thereunder and customary letter of credit fees and agency fees. The initial commitment fee is 0.20 % per annum.
The Company may voluntarily prepay outstanding term loans and revolving loans under the New Credit Facilities and may reduce the unutilized portion of the New Revolving Facility at any time without premium or penalty other than customary “breakage” costs with respect to LIBOR loans.
It is unclear whether the LIBOR will continue to be calculated or published as a reference rate/benchmark after 2021.The Company’s New Credit Facilities do not have fallback language for when LIBOR is unavailable. The Company is currently assessing its alternatives and cannot yet reasonably estimate the expected impact. The Company believes that it could renegotiate the agreement prior to the discontinuation to determine an alternative rate.
The Credit Agreement requires scheduled quarterly installment payments of 0.25 % of the aggregate principal amount of the outstanding term loans commencing March 31, 2019. The Credit Agreement does not require scheduled amortization under the New Revolving Facility.
The Credit Agreement also requires the Company to prepay outstanding term loans, subject to certain exceptions, with (a) up to 50 % of the Company’s annual Excess Cash Flow (as defined in the Credit Agreement) and (b) 100 % of the net cash proceeds of (i) certain asset sales and casualty and condemnation events, subject to reinvestment rights and certain other exceptions; and (ii) any incurrence or issuance of certain debt, other than debt permitted under the New Credit Facilities.
The New Term Loan Facility matures November 6, 2025 and the New Revolving Facility matures November 6, 2023 . At December 31, 2019, the only outstanding amounts under the New Revolving Facility were undrawn outstanding letters of credit of $0.2 million.
All obligations under the New Credit Facilities are unconditionally guaranteed by certain of the Company’s wholly-owned domestic subsidiaries and are secured, subject to certain exceptions, by substantially all of the Company’s assets and the assets of the Company’s subsidiaries that have guaranteed the New Credit Facilities.
The New Credit Facilities contain a number of negative covenants that, subject to certain exceptions, restrict the Company’s ability and each of the Company’s subsidiaries’ ability to incur additional indebtedness; pay dividends on its capital stock or redeem, repurchase or retire its capital stock or its other indebtedness; make investments, loans and acquisitions, create restrictions on the payment of dividends or other amounts to the Company from the Company’s restricted subsidiaries; engage in transactions with its affiliates; sell assets, including capital stock of its subsidiaries; materially alter the business it conducts; consolidate or merge; incur liens; and engage in sale-leaseback transactions. If at any time, commencing with the fiscal quarter ending March 31, 2019, the Company has revolving borrowings, unreimbursed letter of credit drawings and undrawn letters of credit outstanding in an amount in excess of 35.0% of the commitment amount under the New Revolving Facility, the Credit Agreement requires the Company to maintain a secured net leverage ratio of at least 3.25 to 1.0. The Company is in compliance with all of the above covenants at December 31, 2019.
Previous Senior Secured Loan Facilities
On April 30, 2014, the Company entered into (a) a term loan credit and guaranty agreement with Goldman Sachs Bank USA, as administrative agent, collateral agent, sole lead arranger, sole bookrunner and sole syndication agent, that provided senior secured financing of $460.0 million (the “Previous Term Loan Facility”) and (b) an asset-based revolving credit and guaranty
F-23
agreement with Goldman Sachs Bank USA, as administrative agent, collateral agent, sole lead arranger, sole bookrunner and sole syndication agent, that provided senior secured financing of $75.0 million, subject to a borrowing base (the “Previous ABL Loan Facility”). As stated above, the Previous Term Loan Facility and the Previous ABL Loan Facility were repaid in full in November 2018. The repayment of the Previous Term Loan Facility and the Previous ABL Loan Facility resulted in a loss of $2.3 million for the year ended December 31, 2018 on extinguishment of debt, which is included in other expense (income), net in the Company’s consolidated statement of operations.
(9) OTHER (INCOME) EXPENSE, NET
The table below sets forth the Other (income) expense, net for the years ended December 31, 2019, 2018 and 2017:
(In thousands) | 2019 | 2018 | 2017 | ||||||||
Versum termination fee, net | $ | ( | ) | $ | $ | ||||||
(Gain) loss on foreign currency remeasurement | ( | ) | |||||||||
Loss on extinguishment of debt | |||||||||||
Other, net | |||||||||||
Other (income) expense, net | $ | ( | ) | $ | $ | ||||||
Versum termination fee, net
On January 28, 2019, the Company and Versum announced that they had entered into an Agreement and Plan of Merger, dated as of January 27, 2019 (the “Merger Agreement”), pursuant to which they agreed to combine in a merger of equals. On April 8, 2019, Versum announced that its Board of Directors had received a proposal from Merck KGaA to acquire Versum and that its Board of Directors had deemed such proposal as a “Superior Proposal” defined in the merger agreement. On April 12, 2019, the Company received a termination notice from Versum terminating the Merger Agreement. In accordance with the terms of the Merger Agreement, Entegris received a $140.0 million termination fee from Versum in the second quarter of 2019. Also in the second quarter of 2019, the Company paid a fee of $18.0 million to the third-party financial adviser it had engaged to assist with the transaction.
(10) LEASES
Adoption of ASC ASU No. 2016-02, Leases On January 1, 2019, the Company adopted ASU No. 2016-02 using the modified retrospective method applied to existing leases in place as of January 1, 2019. Leases entered into after January 1, 2019 are presented under the provisions of ASU No. 2016-02, while prior periods are not adjusted and continue to be reported in accordance with previous accounting guidance. Leases commencing or renewing after the adoption date are evaluated based on the guidance in ASU No. 2016-02 and may result in more finance leases being recognized even for the renewal of previously classified operating leases.
The Company elected to adopt the ‘package of practical expedients’, which permitted the Company not to reassess under the new standard our prior conclusions about lease identification, lease classification and initial direct costs. The Company also elected the practical expedient pertaining to land easements, which allowed the Company to exclude evaluation of all existing land easements in connection with the adoption of the new lease requirements to assess whether they meet the definition of a lease. The Company did not elect the use-of-hindsight practical expedient and therefore did not reassess the lease terms for purposes of calculation of the lease liabilities and right-of-use assets at the adoption date. The Company elected the short-term lease recognition exemption for all leases that qualified. This means, for those leases that qualified, the Company did not recognize right-of-use assets or lease liabilities, and this included not recognizing right-of-use assets or lease liabilities for existing short-term leases of those assets in transition. The Company also elected the practical expedient to not separate lease and non-lease components for all leases other than leases of real estate, and this included not separating lease and non-lease components for all leases other than leases of real estate in transition.
The Company adopted ASU 2016-02 using the modified retrospective method, recognizing the cumulative effect of application as an adjustment to the opening balance sheet. The standard had a material impact on our consolidated balance sheets, but did not have a material impact on our consolidated statement of income or cash flows. The most significant impact was the recognition of the right-of-use asset and lease liabilities for operating leases. As of December 31, 2019, we do not have any material finance leases.
The details of the impact of the changes made to the Company’s consolidated balance sheet date as of January 1, 2019, the date of adoption, are reflected in the following table.
F-24
(In thousands) | Debit/(Credit) | ||
Right-of-use assets | $ | ||
Prepaid rent | ( | ) | |
Short-term lease liability | ( | ) | |
Short-term deferred rent | |||
Long-term lease liability | ( | ) | |
Long-term deferred rent | |||
Deferred tax asset | |||
Deferred tax liability | ( | ) | |
Leases As of December 31, 2019, the Company was obligated under operating lease agreements for certain sales offices and manufacturing facilities, manufacturing equipment, vehicles, information technology equipment and warehouse space. Our leases have remaining lease terms of 1 year to 14 years, some of which may include options to extend the lease for up to 6 years, and some of which may include options to terminate the leases within 1 year . For the year ended December 31, 2019, the Company has obtained $9.1 million of operating lease assets in exchange for lease obligations.
As of December 31, 2019, the Company’s operating lease components with initial or remaining terms in excess of one year were classified on the consolidated balance sheet as follows:
(In thousands) | Classification | December 31, 2019 | ||
Assets | ||||
Right-of-use assets | Right-of-use assets | $ | ||
Liabilities | ||||
Short-term lease liability | Other accrued liabilities | |||
Long-term lease liability | Long-term lease liability | |||
Total lease liabilities | $ | |||
Expense for leases less than 12 months for the year ended December 31, 2019 were not material. The components of lease expense for the year ended December 31, 2019 are as follows:
(In thousands) | December 31, 2019 | ||
Operating lease cost | $ | ||
The Company combines the amortization of the ROU assets and the change in the operating lease liability in the same line item in the Statement of Cash Flows. Other information related to the Company’s operating leases was as follows:
(In thousands) | December 31, 2019 | ||
Cash paid for amounts included in the measurement of lease liabilities: | |||
Operating cash flows from leases | $ | ||
Lease Term and Discount Rate | |||
Weighted average remaining lease term (years) | |||
Weighted average discount rate | % | ||
F-25
Future minimum lease payments for noncancellable operating leases as of December 31, 2019, were as follows:
(In thousands) | Operating Leases | ||
2020 | $ | ||
2021 | |||
2022 | |||
2023 | |||
2024 | |||
Thereafter | |||
Total | $ | ||
Less: Interest | |||
Present value of lease liabilities | $ | ||
Future minimum lease payments for noncancellable operating leases as of December 31, 2018, were as follows:
(In thousands) | Operating Leases | ||
2019 | $ | ||
2020 | |||
2021 | |||
2022 | |||
2023 | |||
Thereafter | |||
Total | $ | ||
(11) ASSET RETIREMENT OBLIGATIONS
The Company has asset retirement obligations (AROs) related to environmental disposal obligations associated with cylinders used to supply customers with gas products, and certain restoration obligations associated with its leased facilities.
Changes in the carrying amounts of the Company’s AROs for the years ended December 31, 2019 and 2018 are shown below:
(In thousands) | 2019 | 2018 | ||||
Balance at beginning of year | $ | $ | ||||
Liabilities assumed in acquisitions | ||||||
Liabilities settled | ( | ) | ( | ) | ||
Liabilities incurred | ||||||
Accretion expense | ||||||
Revision of estimate | ( | ) | ( | ) | ||
Balance at end of year | $ | $ | ||||
ARO liabilities expected to be settled within twelve months are included in the consolidated balance sheets in other accrued liabilities, while all other ARO liabilities are included in pension benefit obligations and other liabilities in the consolidated balance sheets.
(12) INCOME TAXES
Income before income taxes for the years ended December 31, 2019, 2018 and 2017 was derived from the following sources:
(In thousands) | 2019 | 2018 | 2017 | ||||||||
Domestic | $ | $ | $ | ||||||||
Foreign | |||||||||||
Income before income tax expense | $ | $ | $ | ||||||||
F-26
Income tax expense for the years ended December 31, 2019, 2018 and 2017 is summarized as follows:
(In thousands) | 2019 | 2018 | 2017 | ||||||||
Current: | |||||||||||
Federal | $ | $ | ( | ) | $ | ||||||
State | |||||||||||
Foreign | |||||||||||
Deferred (net of valuation allowance): | |||||||||||
Federal | ( | ) | ( | ) | |||||||
State | ( | ) | ( | ) | ( | ) | |||||
Foreign | ( | ) | |||||||||
( | ) | ( | ) | ||||||||
Income tax expense | $ | $ | $ | ||||||||
Income tax expense differs from the expected amounts based upon the statutory federal tax rates for the years ended December 31, 2019, 2018 and 2017 as follows:
(In thousands) | 2019 | 2018 | 2017 | ||||||||
Expected federal income tax at statutory rate | $ | $ | $ | ||||||||
State income taxes before valuation allowance, net of federal tax effect | ( | ) | ( | ) | |||||||
Effect of foreign source income | ( | ) | ( | ) | |||||||
Tax contingencies | |||||||||||
Valuation allowance | |||||||||||
U.S. federal research credit | ( | ) | ( | ) | ( | ) | |||||
Equity compensation | ( | ) | ( | ) | ( | ) | |||||
Transition tax | |||||||||||
Remeasurement of deferred taxes | ( | ) | |||||||||
Incremental taxes on unremitted foreign earnings release | |||||||||||
Foreign derived intangible income | ( | ) | ( | ) | |||||||
Legal entity restructuring foreign tax credit | ( | ) | |||||||||
Legal entity restructuring dividends received deduction | ( | ) | |||||||||
Other items, net | ( | ) | |||||||||
Income tax expense | $ | $ | $ | ||||||||
In 2012, Entegris’ Korean subsidiary made commitments to produce a certain line of products in Korea. In return for this commitment, the Company had a tax holiday on income earned on sales of these products for five years and a partial holiday for two additional years. The income tax benefits attributable to this tax holiday are $4.0 million ($0.03 per diluted share) and $7.4 million ($0.05 per diluted share) for the years ended December 31, 2018 and 2017, respectively. The tax holiday benefit ceased during the year ended December 31, 2018. The 2017 effective tax rate included an additional benefit of $4.3 million since the corporate tax rate in Korea was lower than the U.S. rate.
The Company also has made employment and spending commitments to Singapore. In return for those commitments, the Company has been granted a partial tax holiday for eight years starting in 2013. During 2017, this agreement was extended to 2027 in exchange for revised employment and spending commitments. The income tax benefits attributable to the tax status are $5.8 million ($0.04 per diluted share), $6.3 million ($0.04 per diluted share) and $4.7 million ($0.03 per diluted share) for the years ending December 31, 2019, 2018 and 2017, respectively. The 2019, 2018 and 2017 effective tax rates include additional benefits of $3.3 million, $3.6 million and $12.4 million, because the corporate tax rate in Singapore is lower than the U.S. rate.
At December 31, 2019, there were approximately $35.9 million of accumulated undistributed earnings of subsidiaries outside of the United States, all of which are considered to be indefinitely reinvested. Management estimates that no material withholding taxes would be incurred if these undistributed earnings were distributed.
F-27
The significant components of the Company’s deferred tax assets and deferred tax liabilities at December 31, 2019 and 2018 are as follows:
(In thousands) | 2019 | 2018 | |||||
Deferred tax assets attributable to: | |||||||
Accounts receivable | $ | $ | |||||
Inventory | |||||||
Accruals not currently deductible for tax purposes | |||||||
Net operating loss and credit carryforwards | |||||||
Capital loss carryforward | |||||||
Equity compensation | |||||||
Asset impairments | |||||||
Other, net | |||||||
Gross deferred tax assets | |||||||
Valuation allowance | ( | ) | ( | ) | |||
Total deferred tax assets | |||||||
Deferred tax liabilities attributable to: | |||||||
Purchased intangible assets | ( | ) | ( | ) | |||
Depreciation | ( | ) | ( | ) | |||
Total deferred tax liabilities | ( | ) | ( | ) | |||
Net deferred tax liabilities | $ | ( | ) | $ | ( | ) | |
Deferred tax assets are generally required to be reduced by a valuation allowance if, based on the weight of available positive and negative evidence, it is more likely than not that some portion or all of the deferred tax assets will not be realized.
As of December 31, 2019 and 2018, the Company had a net U.S. deferred tax liability of $12.2 million and $24.5 million, respectively, which are composed of temporary differences and various tax credit carryforwards. Management believes that it is more likely than not that the benefit from certain state net operating loss carryforwards and state credits will not be realized. In recognition of this risk, management has provided a valuation allowance of $10.4 million and $10.7 million as of December 31, 2019 and 2018, respectively, on the related deferred tax assets. If the assumptions change and management determines the assets will be realized, the tax benefits relating to any reversal of the valuation allowance on deferred tax assets at December 31, 2019 will be recognized as a reduction of income tax expense.
At December 31, 2019, the Company had state operating loss and credit carryforwards of approximately $10.5 million, which begin to expire in 2020 and foreign operating loss carryforwards of $29.6 million, which begin to expire in 2020.
As of December 31, 2019 and 2018, the Company had a net non-U.S. deferred tax asset of $7.7 million and $8.8 million, respectively, for which management determined based upon the available evidence a valuation allowance of $9.7 million and $7.3 million as of December 31, 2019 and 2018, respectively, was required against the non-U.S. gross deferred tax assets. For other non-U.S. jurisdictions, management is relying upon projections of future taxable income to utilize deferred tax assets.
Benefits from tax positions should be recognized in the financial statements only when it is more likely than not that the tax positions will be sustained upon examination by the appropriate taxing authority that would have full knowledge of all relevant information. A tax position that meets the more-likely-than-not recognition threshold is measured at the largest amount of benefit that is greater than fifty percent likely of being realized upon ultimate settlement. Tax positions that fail to meet the more-likely-than-not recognition threshold should be recognized in the first subsequent financial reporting period in which that threshold is met. Previously recognized tax positions that no longer meet the more-likely-than-not recognition threshold should be derecognized in the first subsequent financial reporting period in which that threshold is no longer met. The provisions also provide guidance on the accounting for and disclosure of unrecognized tax benefits, interest and penalties.
F-28
Reconciliations of the beginning and ending balances of the total amounts of gross unrecognized tax benefits for the years ended December 31, 2019 and 2018 are as follows:
(In thousands) | 2019 | 2018 | |||||
Gross unrecognized tax benefits at beginning of year | $ | $ | |||||
Increase in tax positions from prior years | |||||||
Decrease in tax positions from prior years | ( | ) | ( | ) | |||
Increases in tax positions for current year | |||||||
Settlement of tax positions for current year | ( | ) | ( | ) | |||
Lapse in statute of limitations | ( | ) | ( | ) | |||
Gross unrecognized tax benefits at end of year | $ | $ | |||||
The total amount of net unrecognized tax benefits that, if recognized, would affect the effective tax rate was $12.5 million at December 31, 2019.
Penalties and interest paid or received are recorded in other income, net, in the consolidated statements of operations. As of December 31, 2019 and 2018, the Company has accrued interest and penalties related to unrecognized tax benefits of $3.9 million and $1.7 million, respectively. Expenses of $0.6 million, $0.8 million and $0.3 million were recognized as interest and penalties in the consolidated statements of operations for the years ended December 31, 2019, 2018 and 2017, respectively.
The Company files income tax returns in the U.S. and in various state, local and foreign jurisdictions. The statutes of limitations related to both the consolidated Federal income tax return and state returns are closed for all years up to and including 2015 and 2015, respectively. With respect to foreign jurisdictions, the statute of limitations varies from country to country, with the earliest open year for the Company’s major foreign subsidiaries being 2013.
Due to the expiration of various statutes of limitations and settlement of audits, it is reasonably possible that the Company’s gross unrecognized tax benefit balance may decrease within the next twelve months by approximately $2.0 million.
(13) EQUITY
Dividend
Holders of the Company’s common stock are entitled to receive dividends when and if they are declared by the Company’s Board of Directors. The Company’s Board of Directors declared a cash dividend of $0.07 per share during the first and second quarters and $0.08 per share during the third and fourth quarters of 2019, which totaled $40.8 million. During 2018, the Company’s Board of Directors declared a cash dividend of $0.07 per share during the first, second, third and fourth quarters of 2018, which totaled $39.7 million. During 2017, the Company’s Board of Directors declared a cash dividend of $0.07 per share during the fourth quarter which totaled $9.9 million.
On January 15, 2020, the Company’s Board of Directors declared a quarterly cash dividend of $0.08 per share to be paid on February 19, 2020 to shareholders of record as of January 29, 2020.
Future dividend declarations, if any, as well as the record and payment dates for such dividends, are subject to the final determination of the Company’s Board of Directors. Furthermore, the credit agreements governing the New Credit Facilities contain restrictions that may limit our ability to pay dividends.
Share Repurchase Program
On February 13, 2018, the Company’s Board of Directors authorized a repurchase program covering up to an aggregate of $100.0 million of the Company’s common stock, during a period of twenty-four months, in open market transactions and in accordance with one or more pre-arranged stock trading plans to be established in accordance with Rule 10b5-1 under the Securities Exchange Act of 1934, as amended. On November 19, 2018, the Company’s Board of Directors authorized the repurchase of up to an additional $250 million in aggregate principal amount of the Company’s common stock. The authorization was in addition to the amount remaining under the share repurchase program previously authorized in February 2018.
The Company repurchased $74.8 million, $179.3 million and $28 million of shares for the years ended December 31, 2019, December 31, 2018 and December 31, 2017, respectively.
The credit agreement governing the New Credit Facilities contain restrictions that may limit our ability to continue to repurchase shares.
2010 Stock Plan
F-29
In 2009, the Company’s Board of Directors approved the 2010 Stock Plan, subject to the approval by the Company’s stockholders in 2010. The 2010 Stock Plan replaced the predecessor plans for future stock awards and stock option grants. Subsequent to the acquisition of ATMI, Inc. in 2014, the Company’s Board of Directors approved the absorption of 5.7 million additional shares of the ATMI, Inc. 2010 Stock Plan (ATMI Plan) into the Company’s 2010 Stock Plan for the remaining term of the ATMI Plan.
The 2010 Stock Plan has a term of ten years and provides for the issuance of stock options and other share-based awards to selected employees, directors, and other individuals or entities that provide services to the Company or its affiliates. Under the 2010 Stock Plan, the Board of Directors or a committee selected by the Board of Directors will determine for each award, the term, price, number of shares, rate at which each award is exercisable and whether restrictions are imposed on the shares subject to the awards. The exercise price for option awards generally may not be less than the fair market value per share of the underlying common stock on the date granted. The 2010 Stock Plan provides that after December 31, 2009 any shares subject to stock awards that were awarded from the Company’s expired plans and that are forfeited, expired or otherwise terminated without issuance of shares will again be available for issuance under the 2010 Stock Plan.
Stock Options
Stock option activity for the 2010 Stock Plan for the years ended December 31, 2019, 2018 and 2017 is summarized as follows:
2019 | 2018 | 2017 | ||||||||||||||||||
(Shares in thousands) | Number of shares | Weighted average exercise price | Number of shares | Weighted average exercise price | Number of shares | Weighted average exercise price | ||||||||||||||
Options outstanding, beginning of year | $ | $ | $ | |||||||||||||||||
Granted | ||||||||||||||||||||
Exercised | ( | ) | ( | ) | ( | ) | ||||||||||||||
Expired or forfeited | ( | ) | ( | ) | ||||||||||||||||
Options outstanding, end of year | $ | $ | $ | |||||||||||||||||
Options exercisable, end of year | $ | $ | $ | |||||||||||||||||
Options outstanding for the Company’s stock plans at December 31, 2019 are summarized as follows:
(Shares in thousands) | Options outstanding | Options exercisable | |||||||||||||
Range of exercise prices | Number outstanding | Weighted average remaining life in years | Weighted- average exercise price | Number exercisable | Weighted average exercise price | ||||||||||
$9.88 to $11.71 | $ | $ | |||||||||||||
$12.20 to $12.20 | |||||||||||||||
$13.49 to $13.49 | |||||||||||||||
$21.60 to $21.60 | |||||||||||||||
$31.10 to $31.10 | |||||||||||||||
$33.33 to $33.33 | |||||||||||||||
$ | $ | ||||||||||||||
The weighted average remaining contractual term for options outstanding and options exercisable for all plans at December 31, 2019 was 4.0 years and 3.0 years, respectively.
Under the 2010 Stock Plan, the Company had shares available for future grants of 8.2 million shares, 8.7 million shares, and 8.8 million shares at December 31, 2019, 2018 and 2017, respectively.
Under the 2010 Stock Plan, the total pre-tax intrinsic value of stock options exercised during the years ended December 31, 2019 and 2018 was $3.2 million and $16.7 million, respectively. The aggregate intrinsic value, which represents the total pre-tax intrinsic value based on the Company’s closing stock price of $50.09 at December 31, 2019, which theoretically could have been received by the option holders had all option holders exercised their options as of that date, was $45.2 million and $27.1 million for options outstanding and options exercisable, respectively.
Share-based payment awards in the form of stock option awards for 0.3 million, 0.3 million and 0.3 million shares were granted to employees during the years ended December 31, 2019, 2018 and 2017, respectively. Compensation expense is based on the
F-30
grant date fair value. The awards vest annually over a four-year period and have a contractual term of 7 years. The Company estimates the fair value of stock options using the Black-Scholes valuation model. Key inputs and assumptions used to estimate the fair value of stock options include the grant price of the award, the expected option term, volatility of the Company’s stock, the risk-free rate and the Company’s dividend yield. Estimates of fair value are not intended to predict actual future events or the value ultimately realized by employees who receive equity awards, and subsequent events are not indicative of reasonableness of the original estimates of fair value made by the Company.
The fair value of each stock option grant was estimated at the date of grant using a Black-Scholes option pricing model. The following table presents the weighted-average assumptions used in the valuation and the resulting weighted-average fair value per option granted for the years ended December 31, 2019, 2018 and 2017:
Employee stock options: | 2019 | 2018 | 2017 | ||||||||
Volatility | % | % | % | ||||||||
Risk-free interest rate | % | % | % | ||||||||
Dividend yield | % | % | % | ||||||||
Expected life (years) | |||||||||||
Weighted average fair value per option | $ | $ | $ | ||||||||
A historical daily measurement of volatility is determined based on the expected life of the option granted. The risk-free interest rate is determined by reference to the yield on an outstanding U.S. Treasury note with a term equal to the expected life of the option granted. Expected life is determined by reference to the Company’s historical experience. The Company determines the dividend yield by dividing the expected annual dividend on the Company’s stock by the option exercise price.
Employee Stock Purchase Plan
The Company maintains the Entegris, Inc. Amended and Restated Employee Stock Purchase Plan (ESPP). The ESPP allows employees to elect, at six-month intervals, to contribute up to 10 % of their compensation, subject to certain limitations, to purchase shares of common stock at a discount of 15 % from the fair market value on the first day or last day of each six-month period. The Company treats the ESPP as a compensatory plan. At December 31, 2019, 1.7 million shares remained available for issuance under the ESPP. Employees purchased 0.2 million shares, 0.2 million shares and 0.2 million shares, at a weighted-average price of $28.67 , $24.86 , and $16.92 during the years ended December 31, 2019, 2018 and 2017, respectively.
Restricted Stock Units
Restricted stock units are awards of common stock made under the 2010 Stock Plan that are subject to a risk of forfeiture if the awardee terminates employment with the Company prior to the lapse of the restrictions. The value of such restricted stock units is determined using the market price on the grant date. Compensation expense for restricted stock units is generally recognized using the straight-line single-option method. A summary of the Company’s restricted stock unit activity for the years ended December 31, 2019, 2018 and 2017 is presented in the following table:
2019 | 2018 | 2017 | ||||||||||||||||||
(Shares in thousands) | Number of shares | Weighted average grant date fair value | Number of shares | Weighted average grant date fair value | Number of shares | Weighted average grant date fair value | ||||||||||||||
Unvested, beginning of year | $ | $ | $ | |||||||||||||||||
Granted | ||||||||||||||||||||
Vested | ( | ) | ( | ) | ( | ) | ||||||||||||||
Forfeited | ( | ) | ( | ) | ( | ) | ||||||||||||||
Unvested, end of year | ||||||||||||||||||||
The weighted average remaining contractual term for unvested restricted shares at December 31, 2019 and 2018 was 2.0 years and 1.9 years, respectively.
During the years ended December 31, 2019, 2018 and 2017, the Company awarded performance-based restricted stock units for up to 0.1 million shares of common stock, 0.2 million shares of common stock and 0.1 million shares of common stock, respectively, to be issued upon the achievement of performance conditions under the Company’s 2010 Stock Plan to certain officers and other key employees. Compensation expense is based on the grant date fair value. The awards vest on the third
F-31
anniversary of the award date. The Company estimates the fair value of the performance shares using a Monte Carlo simulation process.
As of December 31, 2019, the total compensation cost related to unvested stock options, performance-based restricted stock units and restricted stock unit awards not yet recognized was $3.7 million, $2.6 million and $22.1 million, respectively, and is expected to be recognized over the next 2.5 years on a weighted-average basis.
Valuation and Expense Information
The Company recognizes compensation expense for all share-based payment awards made to employees and directors based on their estimated fair values on the date of grant. Compensation expense is recognized using the straight-line attribution method to recognize share-based compensation over the service period of the award, with adjustments recorded for forfeitures as they occur. The following table summarizes the allocation of share-based compensation expense related to employee stock options, restricted stock awards, performance-based restricted stock awards and grants under the employee stock purchase plan for the years ended December 31, 2019, 2018 and 2017:
(In thousands) | 2019 | 2018 | 2017 | ||||||||
Cost of sales | $ | $ | $ | ||||||||
Engineering, research and development expenses | |||||||||||
Selling, general and administrative expenses | |||||||||||
Share-based compensation expense | |||||||||||
Tax benefit | |||||||||||
Share-based compensation expense, net of tax | $ | $ | $ | ||||||||
(14) BENEFIT PLANS
401(k) Plan
The Company maintains the Entegris, Inc. 401(k) Savings and Profit Sharing Plan (the 401(k) Plan) that qualifies as a deferred salary arrangement under Section 401(k) of the Internal Revenue Code. Under the Plan, eligible employees may defer a portion of their pre-tax wages, up to the Internal Revenue Service annual contribution limit. Entegris matches employees’ contributions to a maximum match of 4 % of the employee’s eligible wages. The employer matching contribution expense under the 401(k)Plan was $7.1 million, $6.1 million and $5.1 million in the fiscal years ended December 31, 2019, 2018 and 2017, respectively.
Defined Benefit Plans
The employees of the Company’s subsidiaries in Japan, Taiwan and Germany are covered in defined benefit pension plans. The Company uses a December 31 measurement date for its pension plans.
F-32
The tables below set forth the Company’s estimated funded status as of December 31, 2019 and 2018:
(In thousands) | 2019 | 2018 | |||||
Change in benefit obligation: | |||||||
Benefit obligation at beginning of year | $ | $ | |||||
Service cost | |||||||
Interest cost | |||||||
Actuarial (gain) loss | |||||||
Benefits paid | ( | ) | ( | ) | |||
Curtailment | ( | ) | |||||
Other | |||||||
Foreign exchange impact | ( | ) | |||||
Benefit obligation at end of year | |||||||
Change in plan assets: | |||||||
Fair value of plan assets at beginning of year | |||||||
Return on plan assets | |||||||
Employer contributions | |||||||
Benefits paid | ( | ) | ( | ) | |||
Foreign exchange impact | ( | ) | |||||
Fair value of plan assets at end of year | |||||||
Funded status: | |||||||
Plan assets less than benefit obligation - Net amount recognized | $ | ( | ) | $ | ( | ) | |
Amounts recognized in the consolidated balance sheets consist of:
(In thousands) | 2019 | 2018 | |||||
Noncurrent liability | $ | ( | ) | $ | ( | ) | |
Accumulated other comprehensive loss, net of taxes | |||||||
Amounts recognized in accumulated other comprehensive loss, net of tax consist of:
(In thousands) | 2019 | 2018 | |||||
Net actuarial loss | $ | $ | |||||
Prior service cost | |||||||
Gross amount recognized | |||||||
Deferred income taxes | ( | ) | ( | ) | |||
Net amount recognized | $ | $ | |||||
Information for pension plans with an accumulated benefit obligation in excess of plan assets:
(In thousands) | 2019 | 2018 | |||||
Projected benefit obligation | $ | $ | |||||
Accumulated benefit obligation | |||||||
Fair value of plan assets | |||||||
F-33
The components of the net periodic benefit cost for the years ended December 31, 2019, 2018 and 2017 were as follows:
(In thousands) | 2019 | 2018 | 2017 | ||||||||
Pension benefits: | |||||||||||
Service cost | $ | $ | $ | ||||||||
Interest cost | |||||||||||
Expected return on plan assets | ( | ) | ( | ) | ( | ) | |||||
Curtailments | |||||||||||
Amortization of prior service cost | |||||||||||
Amortization of net transition obligation | |||||||||||
Amortization of plan loss | |||||||||||
Net periodic pension benefit cost | $ | $ | $ | ||||||||
The estimated amount that will be amortized from accumulated other comprehensive income into net periodic benefit cost in 2020 is as follows:
(In thousands) | |||
Prior service cost | $ | ||
Net actuarial loss | |||
$ | |||
Assumptions used in determining the benefit obligation and net periodic benefit cost for the Company’s pension plans for the years ended December 31, 2019, 2018 and 2017 are presented in the following table as weighted-averages:
2019 | 2018 | 2017 | ||||||
Benefit obligations: | ||||||||
Discount rate | % | % | % | |||||
Rate of compensation increase | % | % | % | |||||
Net periodic benefit cost: | ||||||||
Discount rate | % | % | % | |||||
Rate of compensation increase | % | % | % | |||||
Expected return on plan assets | % | % | % | |||||
The plans’ expected return on assets as shown above is based on management’s expectations of long-term average rates of return to be achieved by the underlying investment portfolios. In establishing this assumption, management considers historical and expected returns for the asset classes in which the plans are invested, as well as current economic and capital market conditions. The discount rate primarily used by the Company is based on market yields at the valuation date on government bonds as well as the estimated maturity of benefit payments.
Plan Assets
At December 31, 2019, the majority of the Company’s pension plan assets are deposited in Bank of Taiwan in the form of money market funds, where the Bank of Taiwan is the assigned funding vehicle for the statutory retirement benefit. The remaining portion of the Company’s plan assets is deposited in a German insurance company’s investment fund.
The fair value measurements of the Company’s pension plan assets at December 31, 2019, by asset category are as follows:
(In thousands) | Quoted prices in active markets for identical assets | Significant observable inputs | Significant unobservable inputs | ||||||||||
Asset category | Total | (Level 1) | (Level 2) | (Level 3) | |||||||||
Taiwan plan assets (a) | $ | $ | — | — | |||||||||
Germany plan assets (b) | $ | $ | — | — | |||||||||
$ | $ | — | — | ||||||||||
(a) | This category includes investments in the government of Taiwan’s pension fund. The government of Taiwan is responsible for the strategy and allocation of the investment contributions. |
F-34
(b) | This category includes investments in an insurer’s balanced asset fund. The insurer is responsible for the strategy and allocation of the investment contributions. The Company selects a pre-packaged portfolio pooled investment fund that is conservative. The majority of the funds are invested broadly in German mortgage bonds, construction loans and government bonds with good credit ratings. |
The fair value measurements of the Company’s pension plan assets at December 31, 2018, by asset category are as follows:
(In thousands) | Quoted prices in active markets for identical assets | Significant observable inputs | Significant unobservable inputs | ||||||||||
Asset category | Total | (Level 1) | (Level 2) | (Level 3) | |||||||||
Taiwan plan assets (a) | $ | $ | — | — | |||||||||
Germany plan assets (b) | $ | $ | — | — | |||||||||
$ | $ | — | — | ||||||||||
This category includes investments in the government of Taiwan’s pension fund. The government of Taiwan is responsible for the strategy and allocation of the investment contributions. |
(b) | This category includes investments in an insurer’s balanced asset fund. The insurer is responsible for the strategy and allocation of the investment contributions. The Company selects a pre-packaged portfolio pooled investment fund that is conservative. The majority of the funds are invested broadly in German mortgage bonds, construction loans and government bonds with good credit ratings. |
Cash Flows
The Company expects to make the following contributions and benefit payments:
(In thousands) | Contributions | Payments | |||||
2020 | $ | $ | |||||
2021 | — | ||||||
2022 | — | ||||||
2023 | — | ||||||
2024 | — | ||||||
Years 2025-2029 | — | ||||||
(15) EARNINGS PER SHARE (EPS)
Basic EPS is computed by dividing net income by the weighted average number of shares of common stock outstanding during each period. The following table presents a reconciliation of the share amounts used in the computation of basic and diluted earnings per share:
(In thousands) | 2019 | 2018 | 2017 | |||||
Basic earnings per share—Weighted common shares outstanding | ||||||||
Weighted common shares assumed upon exercise of options and vesting of restricted stock units | ||||||||
Diluted earnings per share—Weighted common shares outstanding | ||||||||
The Company excluded the following shares underlying stock-based awards from the calculations of diluted EPS because their inclusion would have been anti-dilutive for the years ended December 31, 2019, 2018 and 2017:
(In thousands) | 2019 | 2018 | 2017 | |||||
Shares excluded from calculations of diluted EPS | ||||||||
(16) SEGMENT INFORMATION
The Company’s financial segment reporting reflects an organizational alignment intended to leverage the Company’s unique portfolio of capabilities to create value for its customers by developing mission-critical solutions to maximize manufacturing yields and enable higher performance of devices. While these segments have separate products and technical know-how, they share a common business systems and processes, technology centers, and strategic and technology roadmaps. The Company leverages its expertise from these three segments to create new and increasingly integrated solutions for its customers. The Company’s business is reported in the following segments:
F-35
• | Specialty Chemicals and Engineered Materials (SCEM): SCEM provides high-performance and high-purity process chemistries, gases, and materials and safe and efficient delivery systems to support semiconductor and other advanced manufacturing processes. |
• | Microcontamination Control (MC): MC offers solutions to filter and purify critical liquid chemistries and gases used in semiconductor manufacturing processes and other high-technology industries. |
• | Advanced Materials Handling (AMH): AMH develops solutions to monitor, protect, transport, and deliver critical liquid chemistries and substrates for a broad set of applications in the semiconductor industry and other high-technology industries. |
In the first quarter of 2019, the Company changed its definition of segment profit to include inter-segment sales. The Company updated its recognition of inter-segment sales to recognize the revenue and profit associated with products and components produced in one segment and supplied to another, before being sold to the ultimate end customer. The Company accounts for inter-segment sales and transfers as if the sales or transfers were to third parties, that is, at approximate market prices. Inter-segment sales are presented as an elimination below. Segment profit is defined as net sales less direct and indirect segment operating expenses, including certain general and administrative costs for the Company’s human resources, finance and information technology functions. The remaining unallocated expenses consist mainly of the Company’s corporate functions as well as interest expense, amortization of intangible assets and income tax expense. Prior quarter information has been recast to reflect the change in the Company’s definition of segment profit.
Corporate assets consist primarily of cash and cash equivalents, deferred tax assets and deferred tax charges.
Summarized financial information for the Company’s reportable segments is shown in the following tables.
(In thousands) | 2019 | 2018 | 2017 | ||||||||
Net sales: | |||||||||||
SCEM | $ | $ | $ | ||||||||
MC | |||||||||||
AMH | |||||||||||
Inter-segment elimination | ( | ) | ( | ) | ( | ) | |||||
Total net sales | $ | $ | $ | ||||||||
(In thousands) | 2019 | 2018 | 2017 | ||||||||
Segment profit: | |||||||||||
SCEM | $ | $ | $ | ||||||||
MC | |||||||||||
AMH | |||||||||||
Total segment profit | $ | $ | $ | ||||||||
(In thousands) | 2019 | 2018 | 2017 | ||||||||
Total assets: | |||||||||||
SCEM | $ | $ | $ | ||||||||
MC | |||||||||||
AMH | |||||||||||
Corporate | |||||||||||
Total assets | $ | $ | $ | ||||||||
F-36
(In thousands) | 2019 | 2018 | 2017 | ||||||||
Depreciation and amortization: | |||||||||||
SCEM | $ | $ | $ | ||||||||
MC | |||||||||||
AMH | |||||||||||
Corporate | |||||||||||
Total depreciation and amortization | $ | $ | $ | ||||||||
(In thousands) | 2019 | 2018 | 2017 | ||||||||
Capital expenditures: | |||||||||||
SCEM | $ | $ | $ | ||||||||
MC | |||||||||||
AMH | |||||||||||
Corporate | |||||||||||
Total capital expenditures | $ | $ | $ | ||||||||
The following table reconciles total segment profit to income before income taxes and equity in net loss of affiliate:
(In thousands) | 2019 | 2018 | 2017 | ||||||||
Total segment profit | $ | $ | $ | ||||||||
Less: | |||||||||||
Amortization of intangibles | |||||||||||
Unallocated general and administrative expenses | |||||||||||
Operating income | |||||||||||
Interest expense | |||||||||||
Interest income | ( | ) | ( | ) | ( | ) | |||||
Other (income) expense, net | ( | ) | |||||||||
Income before income tax expense | $ | $ | $ | ||||||||
In the following tables, revenue is disaggregated by country or region based on the ship to location of the customer for the years ended December 31, 2019, 2018 and 2017:
(In thousands) | 2019 | ||||||||||||||
SCEM | MC | AMH | Inter-segment | Total | |||||||||||
Taiwan | $ | $ | $ | $ | $ | ||||||||||
United States | ( | ) | |||||||||||||
South Korea | |||||||||||||||
Japan | |||||||||||||||
China | |||||||||||||||
Europe | |||||||||||||||
Southeast Asia | |||||||||||||||
$ | $ | $ | $ | ( | ) | $ | |||||||||
F-37
2018 | |||||||||||||||
(In thousands) | SCEM | MC | AMH | Inter-segment | Total | ||||||||||
Taiwan | $ | $ | $ | $ | $ | ||||||||||
United States | ( | ) | |||||||||||||
South Korea | |||||||||||||||
Japan | |||||||||||||||
China | |||||||||||||||
Europe | |||||||||||||||
Southeast Asia | |||||||||||||||
$ | $ | $ | $ | ( | ) | $ | |||||||||
(In thousands) | 2017 | ||||||||||||||
SCEM | MC | AMH | Inter-segment | Total | |||||||||||
Taiwan | $ | $ | $ | $ | $ | ||||||||||
United States | ( | ) | |||||||||||||
South Korea | |||||||||||||||
Japan | |||||||||||||||
China | |||||||||||||||
Europe | |||||||||||||||
Southeast Asia | |||||||||||||||
$ | $ | $ | $ | ( | ) | $ | |||||||||
The following table summarizes property, plant and equipment, net, attributed to significant countries for the years ended December 31, 2019, 2018 and 2017:
(In thousands) | 2019 | 2018 | 2017 | ||||||||
Property, plant and equipment: | |||||||||||
United States | $ | $ | $ | ||||||||
South Korea | |||||||||||
Japan | |||||||||||
Malaysia | |||||||||||
Taiwan | |||||||||||
Other | |||||||||||
$ | $ | $ | |||||||||
In the years ended December 31, 2019, 2018 and 2017, Taiwan Semiconductor Manufacturing Company Limited accounted for $187.0 million, $153.9 million and $167.9 million of net sales, respectively, all of which include sales from all of the Company’s segments. In addition, in the years ended December 31, 2019, 2018 and 2017, Samsung Electronics Co. accounted for $128.0 million, $164.3 million and $140.6 million of net sales, respectively, which include sales from all of the Company’s segments.
(17) COMMITMENTS AND CONTINGENT LIABILITIES
The Company is subject to various claims, legal actions, and complaints arising in the ordinary course of business. The Company believes the final outcome of these matters will not have a material adverse effect on its consolidated financial statements. The Company expenses legal costs as incurred.
F-38
(18) QUARTERLY INFORMATION-UNAUDITED
Fiscal quarter ended | |||||||||||||||
(In thousands, except per share data) | March 30, 2019 | June 29, 2019 | September 28, 2019 | December 31, 2019 | |||||||||||
Net sales | $ | $ | $ | $ | |||||||||||
Gross profit | |||||||||||||||
Net income | |||||||||||||||
Basic net income per common share | |||||||||||||||
Diluted net income per common share | |||||||||||||||
Fiscal quarter ended | |||||||||||||||
(In thousands, except per share data) | March 31, 2018 | June 30, 2018 | September 29, 2018 | December 31, 2018 | |||||||||||
Net sales | $ | $ | $ | $ | |||||||||||
Gross profit | |||||||||||||||
Net income | |||||||||||||||
Basic net income per common share | |||||||||||||||
Diluted net income per common share | |||||||||||||||
(19) SUBSEQUENT EVENTS
On January 10, 2020 , The Company acquired Sinmat, a CMP slurry manufacturer for approximately $75 million, subject to customary purchase price adjustments. The Company funded the acquisition from its available cash. Sinmat will be a part of the SCEM segment. The acquisition does not constitute a material business combination.
On February 5, 2020 , the Company’s Board of Directors authorized a repurchase program, effective February 16, 2020, covering up to an aggregate of $125 million of the Company’s common stock, during a period of twelve months, in open market transactions and in accordance with one or more pre-arranged stock trading plans to be established in accordance with Rule 10b5-1 under the Securities Exchange Act of 1934, as amended. This repurchase program is intended to replace the existing repurchase program, which was originally approved in February 2018 and amended in November 2018, which is set to expire pursuant to its terms on February 15, 2020.
F-39