Exhibit 99.1

|
Contacts:
|
UInvestors/Analysts
|
|
Tiffany Louder
|
|
|
Alliance Data
|
|
|
214-494-3048
|
|
|
Tiffany.Louder@alliancedata.com
|
|
|
UMedia
|
|
|
Shelley Whiddon
|
|
|
Alliance Data
|
|
|
214-494-3811
|
|
|
Shelley.Whiddon@alliancedata.com
|
Alliance Data Reports Second Quarter 2019 Results
|
•
|
Epsilon® Sale to Publicis Groupe Completed; Company Continues to Execute
on Business Strategy Shift
|
|
•
|
Modified Dutch Auction to Purchase $700 to $750 Million of Common Stock
Anticipated to Launch in the Near-term
|
|
•
|
Company Acquires over $900 Million in New Credit Card Portfolios;
Temporarily Pressures Q2 Performance
|
Columbus, OH, July 18, 2019 – Alliance Data Systems Corporation (NYSE: ADS), a leading global provider of data-driven
marketing and loyalty solutions, today announced results for the quarter ended June 30, 2019.
|
SUMMARY
|
Quarter Ended June 30,
|
||||||||||||
|
(in millions, except per share amounts)
|
2019
|
2018
|
% Change
|
||||||||||
|
Revenue
|
$
|
1,348
|
$
|
1,397
|
-3
|
%
|
|||||||
|
Income from continuing operations
|
$
|
142
|
$
|
224
|
-36
|
%
|
|||||||
|
Net income
|
$
|
139
|
$
|
218
|
-36
|
%
|
|||||||
|
Income from continuing operations per diluted share (“EPS”)
|
$
|
2.71
|
$
|
4.04
|
-33
|
%
|
|||||||
|
Net income per diluted share
|
$
|
2.64
|
$
|
3.93
|
-33
|
%
|
|||||||
|
Diluted shares outstanding
|
52.6
|
55.4
|
|||||||||||
|
*******************************
|
|
||||||||||||
|
Supplemental Non-GAAP Metrics (a):
|
|||||||||||||
|
Adjusted EBITDA
|
$
|
414
|
$
|
457
|
-9
|
%
|
|||||||
|
Adjusted EBITDA, net of funding costs
(“adjusted EBITDA, net”)
|
$
|
310
|
$
|
365
|
-15
|
%
|
|||||||
|
Core earnings per diluted share (“core EPS”)
|
$
|
3.83
|
$
|
4.37
|
-12
|
%
|
|||||||
|
(a)
|
See “Financial Measures” for a discussion of non-GAAP financial measures.
|
1
Alliance Data Systems Corporation
July 18, 2019
“In keeping with our business transformation plans, I am pleased to say that we successfully completed the sale of Epsilon to
Publicis Groupe on July 1st. As previously disclosed, we expect to use the net proceeds to retire $2.4 billion of corporate debt and repurchase up to $1.1 billion of our
shares, per our recently announced Board-authorized plan. Towards that end, we anticipate launching in the next few days a “modified dutch auction” tender offer to acquire between $700 to $750 million of our common stock. The Epsilon divestiture
underscores our stated commitments to move toward a more simplified and focused business model with the goal of returning to our more traditional growth profile.”
Miller continued, “In addition to my new role, Tim King, former CFO of our Card Services business, has succeeded Charles Horn
as Alliance Data’s CFO. I believe Tim will do a tremendous job leading the financial stewardship of the company and engaging with the investor community. I want to thank Charles for his ongoing support through his new role as Vice Chairman. During
our extended transition, he will be focused on several key initiatives related to our business transition. I am deeply honored and excited to be in this new leadership position, and with the support of our Board, the commitment of our strong
management team, and the dedication of our 10,000+ associates, Alliance Data is well positioned for our growth comeback.
“In closing, as we enter into the final stages of our business strategy transformation, I am confident that we are taking the
right steps, and making the necessary important decisions and changes to drive long-term sustainable growth. I am eager for the challenge of leading this great organization’s evolution where we will build upon our strongest, most successful assets,
and return to driving growth for the business and our stockholders.”
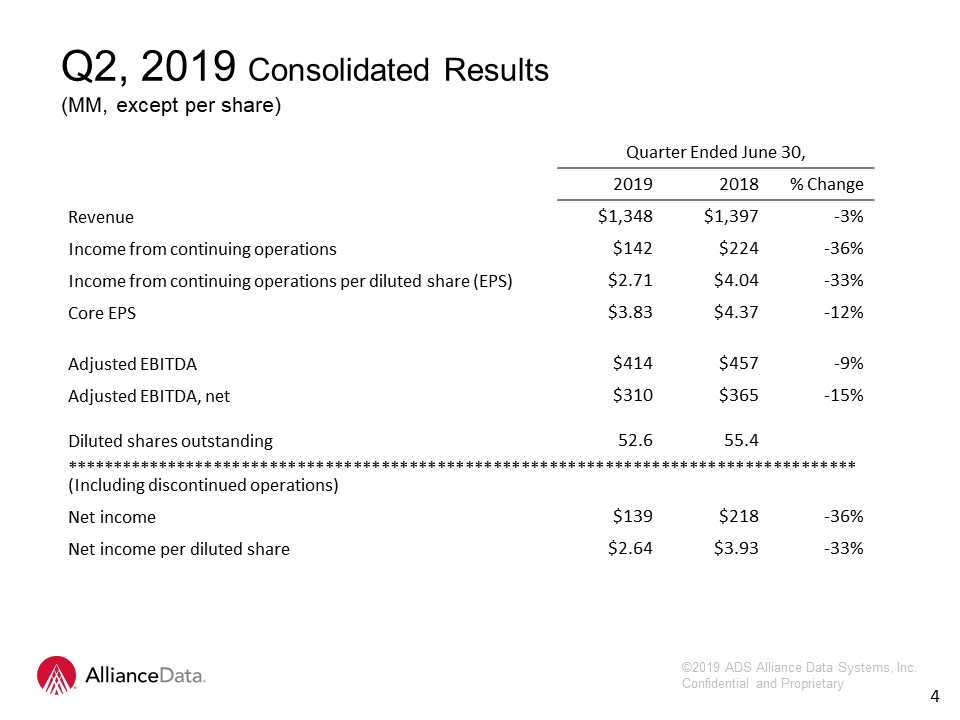
CONSOLIDATED RESULTS
Revenue decreased 3 percent to $1.35 billion, while EPS decreased 33 percent to $2.71 for the second quarter of 2019. The
higher effective tax rate for EPS, 27 percent, compared to 15 percent for the second quarter of 2018, reduced EPS by approximately $0.43 for the second quarter. Core EPS decreased 12 percent to $3.83 for the second quarter of 2019, while adjusted
EBITDA, net decreased 15 percent to $310 million for the second quarter of 2019.
2
Alliance Data Systems Corporation
July 18, 2019
SEGMENT RESULTS
|
Quarter Ended June 30,
|
||||||||||||
|
(in millions)
|
2019
|
2018
|
% Change
|
|||||||||
|
Revenue:
|
||||||||||||
|
LoyaltyOne
|
$
|
251
|
$
|
249
|
+1
|
%
|
||||||
|
Card Services
|
$
|
1,097
|
$
|
1,148
|
-4
|
%
|
||||||
|
Total revenue
|
$
|
1,348
|
$
|
1,397
|
-3
|
%
|
||||||
|
Adjusted EBITDA, net:
|
||||||||||||
|
LoyaltyOne
|
$
|
51
|
$
|
69
|
-27
|
%
|
||||||
|
Card Services
|
$
|
287
|
$
|
336
|
-14
|
%
|
||||||
|
Corporate/other
|
$
|
(28
|
)
|
$
|
(40
|
)
|
||||||
|
Total adjusted EBITDA, net
|
$
|
310
|
$
|
365
|
-15
|
%
|
||||||
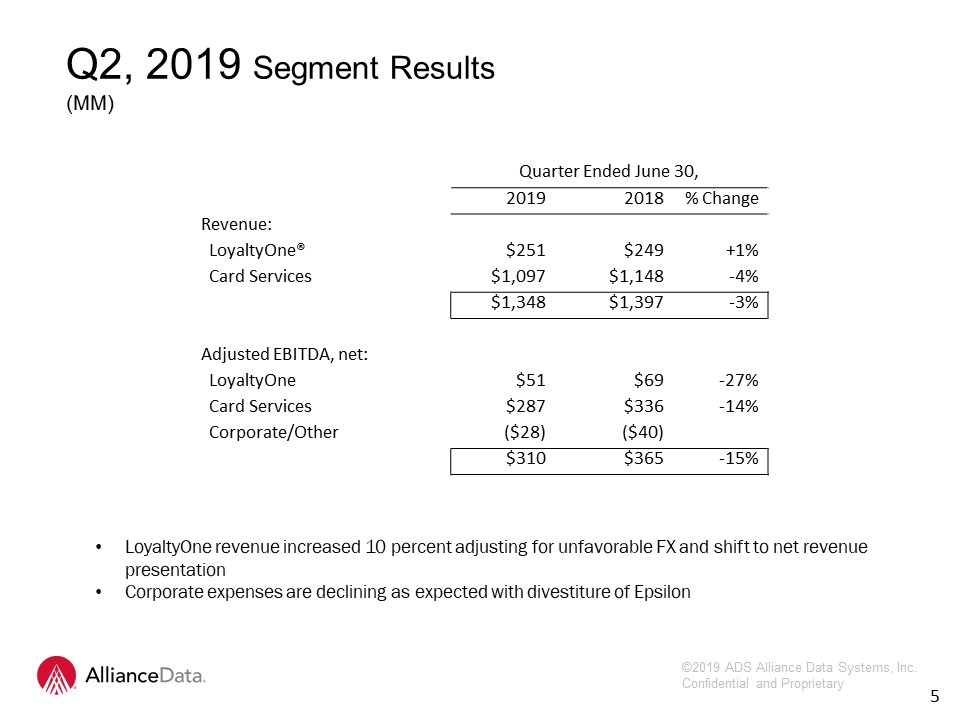
LoyaltyOne®: Revenue increased 1 percent to $251 million, while adjusted EBITDA decreased 27 percent to $51 million for the quarter ended June 30, 2019. Revenue increased 10 percent
compared with the prior year when adjusted for unfavorable foreign exchange rates and additional product redemptions now recorded as net revenue. Adjusted EBITDA, net decreased 23 percent on a constant currency basis due to higher redemption costs at
AIR MILES®, which is largely a function of product mix redeemed. AIR MILES reward miles issued decreased 2 percent for the second quarter of 2019, primarily due to less
promotional activity in the grocery vertical.
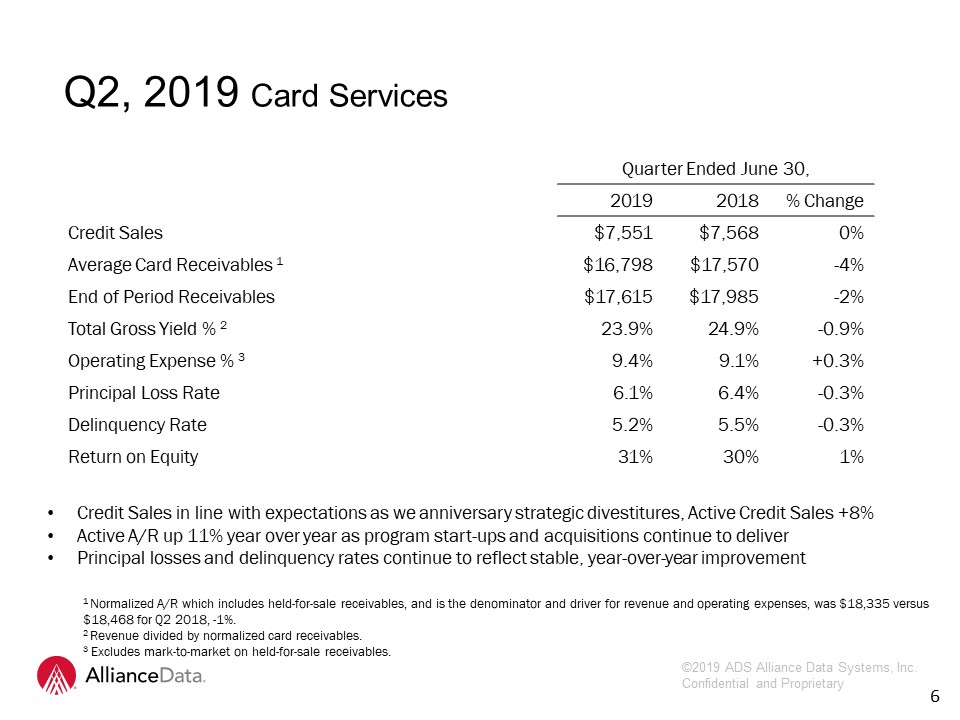
Card Services: Revenue decreased 4 percent to $1.10 billion and
adjusted EBITDA, net decreased 14 percent to $287 million for the second quarter of 2019. Gross yields decreased 90 basis points to 23.9 percent on essentially flat normalized average card receivables growth (card receivables plus held-for-sale
receivables). The loan loss provision decreased 17 percent to $257 million as a result of a 7 percent decrease in reservable card receivables and a 30 basis point improvement in principal loss rates. Operating expenses increased $35 million to $472
million, primarily due to an approximate $26 million increase in mark-to-market charges on held-for-sale receivables. Excluding the mark-to-market charges, operating expenses expressed as a percentage of normalized average card receivables increased
approximately 25 basis points to 9.4 percent. During the quarter, over $900 million in credit card receivables were acquired from third parties, while approximately $510 million in credit card receivables were reclassified as held-for-sale.
2019 Guidance
Guidance for revenue is $5.8 billion, up 4 percent over 2018, and core EPS of $19.50 to $19.75, flat to up 1 percent compared
to $19.49 for 2018. These amounts include the partial-year benefit of anticipated share repurchases and cost reductions.
3
Alliance Data Systems Corporation
July 18, 2019
Forward Looking Statements
This release contains forward-looking statements within the meaning of Section 27A of the Securities Act of 1933 and Section
21E of the Securities Exchange Act of 1934. Forward-looking statements give our expectations or forecasts of future events and can generally be identified by the use of words such as “believe,” “expect,” “anticipate,” “estimate,” “intend,” “project,”
“plan,” “likely,” “may,” “should” or other words or phrases of similar import. Similarly, statements that describe our business strategy, outlook, objectives, plans, intentions or goals also are forward-looking statements. Examples of forward-looking
statements include, but are not limited to, statements we make regarding strategic initiatives, the expected use of proceeds from the Epsilon divestiture, our expected operating results, future economic conditions including currency exchange rates,
future dividend declarations and the guidance we give with respect to our anticipated financial performance.
We believe that our expectations are based on reasonable assumptions. Forward-looking statements, however, are subject to a
number of risks and uncertainties that could cause actual results to differ materially from the projections, anticipated results or other expectations expressed in this release, and no assurances can be given that our expectations will prove to have
been correct. These risks and uncertainties include, but are not limited to, factors set forth in the Risk Factors section in our Annual Report on Form 10-K for the most recently ended fiscal year, which may be updated in Item 1A of, or elsewhere in,
our Quarterly Reports on Form 10-Q filed for periods subsequent to such Form 10-K. Further risks and uncertainties include, but are not limited to, the impact of strategic initiatives on us or our business if any transactions are undertaken, and
whether the anticipated benefits of such transactions can be realized as well as whether or if any share repurchases, including tender offers, are undertaken.
Our forward-looking statements speak only as of the date made, and we undertake no obligation, other than as required by
applicable law, to update or revise any forward-looking statements, whether as a result of new information, subsequent events, anticipated or unanticipated circumstances or otherwise.
Financial Measures
In addition to the results presented in accordance with generally accepted accounting principles, or GAAP, the Company may
present financial measures that are non-GAAP measures, such as constant currency financial measures, adjusted EBITDA, adjusted EBITDA margin, adjusted EBITDA, net of funding costs, core earnings and core earnings per diluted share (core EPS).
Constant currency excludes the impact of fluctuations in foreign exchange rates. The Company calculates constant currency by converting our current period local currency financial results using the prior period exchange rates. The Company uses
adjusted EBITDA and adjusted EBITDA, net as an integral part of internal reporting to measure the performance and operational strength of reportable segments and to evaluate the performance of senior management. Adjusted EBITDA eliminates the uneven
effect across all reportable segments of non-cash depreciation of tangible assets and amortization of intangible assets, including certain intangible assets that were recognized in business combinations, and the non-cash effect of stock compensation
expense. Similarly, core earnings and core EPS eliminate non-cash or non-operating items, including, but not limited to, stock compensation expense, amortization of purchased intangibles, restructuring or strategic transaction costs, amortization of
debt issuance and hedging costs. The Company believes that these non-GAAP financial measures, viewed in addition to and not in lieu of the Company’s reported GAAP results, provide useful information to investors regarding the Company’s performance
and overall results of operations.
4
Alliance Data Systems Corporation
July 18, 2019
Reconciliation of Non-GAAP Financial Measures
Reconciliations to comparable GAAP financial measures are available in the accompanying schedules, which are posted as part
of this earnings release in both the News and Investors sections on the Company’s website (www.alliancedata.com). No reconciliation is provided with respect to forward-looking annual guidance for 2019 core EPS as the Company cannot reliably
predict all necessary components or their impact to reconcile core EPS to GAAP EPS without unreasonable effort. The events necessitating a non-GAAP adjustment are inherently unpredictable and may have a material impact on the Company’s future
results.
The financial measures presented are consistent with the Company’s historical financial reporting practices. Core earnings
and core EPS represent performance measures and are not intended to represent liquidity measures. The non-GAAP financial measures presented herein may not be comparable to similarly titled measures presented by other companies, and are not identical
to corresponding measures used in other various agreements or public filings.
Conference Call
Alliance Data will host a conference call on Thursday, July 18, 2019 at 8:30 a.m. (Eastern Time) to discuss the Company’s
second-quarter 2019 results. The conference call will be available via the Internet at www.alliancedata.com. There will be several slides accompanying the webcast. Please go to the website at least 15 minutes prior to the call to register, download
and install any necessary software. The recorded webcast will also be available on the Company’s website.
If you are unable to participate in the conference call, a replay will be available. To access the replay, please dial (800)
585-8367 or (416) 621-4642 and enter “6097910”. The replay will be available at approximately 11:45 a.m. (Eastern Time) on Thursday, July 18, 2019.
About Alliance Data
Alliance Data® (NYSE: ADS) is a leading
global provider of data-driven marketing and loyalty solutions serving large, consumer-based industries. The Company creates and deploys customized solutions, enhancing the critical customer marketing experience; the result is measurably changing
consumer behavior while driving business growth and profitability for some of today's most recognizable brands. Alliance Data helps its clients create and increase customer loyalty through solutions that engage millions of customers each day across
multiple touch points using traditional, digital, mobile and emerging technologies. An S&P 500, FORTUNE 500 and FORTUNE 100 Best Companies to Work For company headquartered in Columbus, Ohio, Alliance Data consists of businesses that together
employ over 10,000 associates at more than 50 locations worldwide.
Alliance Data’s card services business is a provider of market-leading private label, co-brand, and business credit card
programs. LoyaltyOne® owns and operates the AIR MILES® Reward Program, Canada’s most recognized loyalty program, and Netherlands-based BrandLoyalty, a global provider of
tailor-made loyalty programs for grocers. In July 2019 Alliance Data completed the sale of its Epsilon® business to Publicis Groupe.
Follow Alliance Data on Twitter, Facebook, LinkedIn, Instagram and YouTube.
5
Alliance Data Systems Corporation
July 18, 2019
ALLIANCE DATA SYSTEMS CORPORATION
CONDENSED CONSOLIDATED STATEMENTS OF INCOME
(In millions, except per share amounts)
(Unaudited)
|
|
Three Months Ended
June 30,
|
Six Months Ended
June 30,
|
|||||||||||||||
|
|
2019
|
2018
|
2019
|
2018
|
|||||||||||||
|
Revenue
|
$
|
1,348.5
|
$
|
1,397.2
|
$
|
2,682.7
|
$
|
2,778.9
|
|||||||||
|
Operating expenses:
|
|||||||||||||||||
|
Cost of operations
|
712.1
|
640.0
|
1,390.8
|
1,263.0
|
|||||||||||||
|
Provision for loan loss
|
257.3
|
311.9
|
509.5
|
649.6
|
|||||||||||||
|
Depreciation and amortization
|
41.8
|
48.6
|
88.2
|
97.4
|
|||||||||||||
|
Total operating expenses
|
1,011.2
|
1,000.5
|
1,988.5
|
2,010.0
|
|||||||||||||
|
Operating income
|
337.3
|
396.7
|
694.2
|
768.9
|
|||||||||||||
|
Interest expense, net:
|
|||||||||||||||||
|
Securitization funding costs
|
51.6
|
55.2
|
108.8
|
107.3
|
|||||||||||||
|
Interest expense on deposits
|
53.2
|
36.8
|
102.0
|
72.3
|
|||||||||||||
|
Interest expense on long-term and other debt, net
|
38.7
|
41.6
|
76.6
|
81.1
|
|||||||||||||
|
Total interest expense, net
|
143.5
|
133.6
|
287.4
|
260.7
|
|||||||||||||
|
Income from continuing operations before income taxes
|
$
|
193.8
|
$
|
263.1
|
$
|
406.8
|
$
|
508.2
|
|||||||||
|
Income tax expense
|
51.4
|
39.3
|
86.1
|
104.5
|
|||||||||||||
|
Income from continuing operations
|
142.4
|
223.8
|
320.7
|
403.7
|
|||||||||||||
|
Loss from discontinued operations, net of taxes (1)
|
(3.4
|
)
|
(6.0
|
)
|
(32.6
|
)
|
(21.9
|
)
|
|||||||||
|
Net income
|
$
|
139.0
|
$
|
217.8
|
$
|
288.1
|
$
|
381.8
|
|||||||||
|
Per share data:
|
|||||||||||||||||
|
Weighted average shares outstanding – basic
|
51.3
|
55.2
|
52.1
|
55.3
|
|||||||||||||
|
Weighted average shares outstanding – diluted
|
52.6
|
55.4
|
52.9
|
55.5
|
|||||||||||||
|
Basic – Income from continuing operations
|
$
|
2.76
|
$
|
4.05
|
$
|
6.13
|
$
|
7.30
|
|||||||||
|
Basic – Loss from discontinued operations
|
(0.07
|
)
|
(0.11
|
)
|
(0.62
|
)
|
(0.40
|
)
|
|||||||||
|
Basic – Net income
|
$
|
2.69
|
$
|
3.94
|
$
|
5.51
|
$
|
6.90
|
|||||||||
|
Diluted – Income from continuing operations
|
$
|
2.71
|
$
|
4.04
|
$
|
6.07
|
$
|
7.27
|
|||||||||
|
Diluted – Loss from discontinued operations
|
(0.07
|
)
|
(0.11
|
)
|
(0.62
|
)
|
(0.40
|
)
|
|||||||||
|
Diluted – Net income
|
$
|
2.64
|
$
|
3.93
|
$
|
5.45
|
$
|
6.87
|
|||||||||
|
(1)
|
Includes the allocation of interest expense associated with the Company’s $500.0 million mandatory repayment of its revolving credit facility and $1.9 billion in senior notes outstanding. On April 30, 2019, the Company amended its credit
agreement, which among other items, provided that upon consummation of the sale of Epsilon, a mandatory payment of $500.0 million of the revolving credit facility was required and all of the Company’s $1.9 billion outstanding senior notes
were required to be redeemed.
|
6
Alliance Data Systems Corporation
July 18, 2019
ALLIANCE DATA SYSTEMS CORPORATION
CONDENSED CONSOLIDATED BALANCE SHEETS
(In millions)
(Unaudited)
|
June 30,
2019
|
December 31,
2018
|
|||||||
|
Assets
|
||||||||
|
Cash and cash equivalents
|
$
|
4,026.8
|
$
|
3,817.4
|
||||
|
Credit card and loan receivables:
|
||||||||
|
Credit card and loan receivables
|
17,614.5
|
17,855.0
|
||||||
|
Allowance for loan loss
|
(1,010.9
|
)
|
(1,038.3
|
)
|
||||
|
Credit card and loan receivables, net
|
16,603.6
|
16,816.7
|
||||||
|
Credit card receivables held for sale
|
1,834.3
|
1,951.6
|
||||||
|
Redemption settlement assets, restricted
|
594.0
|
558.6
|
||||||
|
Right of use assets - operating
|
268.4
|
—
|
||||||
|
Intangible assets, net
|
195.8
|
217.4
|
||||||
|
Goodwill
|
960.3
|
954.8
|
||||||
|
Other assets
|
1,992.2
|
1,913.8
|
||||||
|
Assets of discontinued operations
|
4,264.3
|
4,157.4
|
||||||
|
Total assets
|
$
|
30,739.7
|
$
|
30,387.7
|
||||
|
Liabilities and Stockholders’ Equity
|
||||||||
|
Deferred revenue
|
$
|
902.7
|
$
|
875.3
|
||||
|
Deposits
|
12,534.7
|
11,793.7
|
||||||
|
Non-recourse borrowings of consolidated securitization entities
|
6,727.0
|
7,651.7
|
||||||
|
Long-term and other debt
|
5,825.6
|
5,725.4
|
||||||
|
Operating lease liabilities
|
318.8
|
—
|
||||||
|
Other liabilities
|
1,687.8
|
1,749.1
|
||||||
|
Liabilities of discontinued operations
|
351.4
|
260.4
|
||||||
|
Total liabilities
|
28,348.0
|
28,055.6
|
||||||
|
Stockholders’ equity
|
2,391.7
|
2,332.1
|
||||||
|
Total liabilities and stockholders’ equity
|
$
|
30,739.7
|
$
|
30,387.7
|
||||
7
Alliance Data Systems Corporation
July 18, 2019
ALLIANCE DATA SYSTEMS CORPORATION
CONDENSED CONSOLIDATED STATEMENTS OF CASH FLOWS
(In millions)
(Unaudited)
|
|
Six Months Ended
June 30,
|
||||||||
|
|
2019
|
2018
|
|||||||
|
|
|||||||||
|
Cash Flows from Operating Activities:
|
|||||||||
|
Net income
|
$
|
288.1
|
$
|
381.8
|
|||||
|
Adjustments to reconcile net income to net cash provided by operating activities:
|
|||||||||
|
Depreciation and amortization
|
161.5
|
243.7
|
|||||||
|
Deferred income taxes
|
(47.6
|
)
|
(82.0
|
)
|
|||||
|
Provision for loan loss
|
509.5
|
649.6
|
|||||||
|
Non-cash stock compensation
|
51.3
|
46.3
|
|||||||
|
Amortization of deferred financing costs
|
22.1
|
25.5
|
|||||||
|
Change in operating assets and liabilities
|
(38.3
|
)
|
(87.1
|
)
|
|||||
|
Originations of loan receivables held for sale
|
—
|
(4,743.4
|
)
|
||||||
|
Sales of loan receivables held for sale
|
—
|
4,791.9
|
|||||||
|
Other
|
143.1
|
95.5
|
|||||||
|
Net cash provided by operating activities
|
1,089.7
|
1,321.8
|
|||||||
|
Cash Flows from Investing Activities:
|
|||||||||
|
Change in redemption settlement assets
|
(2.0
|
)
|
(39.7
|
)
|
|||||
|
Change in credit card and loan receivables
|
(20.9
|
)
|
(121.2
|
)
|
|||||
|
Purchase of credit card portfolios
|
(936.5
|
)
|
—
|
||||||
|
Sale of credit card portfolios
|
539.3
|
55.6
|
|||||||
|
Capital expenditures
|
(92.2
|
)
|
(98.5
|
)
|
|||||
|
Other
|
(2.0
|
)
|
(32.4
|
)
|
|||||
|
Net cash used in investing activities
|
(514.3
|
)
|
(236.2
|
)
|
|||||
|
Cash Flows from Financing Activities:
|
|||||||||
|
Borrowings under debt agreements
|
2,077.3
|
2,399.1
|
|||||||
|
Repayments of borrowings
|
(1,974.8
|
)
|
(2,678.5
|
)
|
|||||
|
Net increase (decrease) in deposits
|
742.8
|
(373.2
|
)
|
||||||
|
Non-recourse borrowings of consolidated securitization entities
|
2,193.3
|
1,475.0
|
|||||||
|
Repayments/maturities of non-recourse borrowings of consolidated securitization entities
|
(3,117.2
|
)
|
(2,510.0
|
)
|
|||||
|
Payment of deferred financing costs
|
(18.8
|
)
|
(7.8
|
)
|
|||||
|
Purchase of treasury shares
|
(222.8
|
)
|
(94.5
|
)
|
|||||
|
Dividends paid
|
(67.0
|
)
|
(63.3
|
)
|
|||||
|
Other
|
(9.4
|
)
|
(15.8
|
)
|
|||||
|
Net cash used in financing activities
|
(396.6
|
)
|
(1,869.0
|
)
|
|||||
|
Effect of exchange rate changes on cash, cash equivalents and restricted cash
|
8.2
|
(4.1
|
)
|
||||||
|
Change in cash, cash equivalents and restricted cash
|
187.0
|
(787.5
|
)
|
||||||
|
Cash, cash equivalents and restricted cash at beginning of period
|
3,967.7
|
4,314.7
|
|||||||
|
Cash, cash equivalents and restricted cash at end of period
|
$
|
4,154.7
|
$
|
3,527.2
|
|||||
Note: The cash flow statement is presented with the combined cash flows from discontinued operations with cash flows from continuing operations within each cash flow statement category.
8
Alliance Data Systems Corporation
July 18, 2019
ALLIANCE DATA SYSTEMS CORPORATION
SUMMARY FINANCIAL HIGHLIGHTS
(In millions)
(Unaudited)
|
Three Months Ended
June 30,
|
Six Months Ended
June 30,
|
|||||||||||||||||||||||
|
2019
|
2018
|
Change
|
2019
|
2018
|
Change
|
|||||||||||||||||||
|
Segment Revenue:
|
||||||||||||||||||||||||
|
LoyaltyOne
|
$
|
251.5
|
$
|
248.6
|
1
|
%
|
$
|
455.3
|
$
|
474.9
|
(4
|
)%
|
||||||||||||
|
Card Services
|
1,096.9
|
1,148.5
|
(4
|
)
|
2,227.3
|
2,303.7
|
(3
|
)
|
||||||||||||||||
|
Corporate/Other
|
0.1
|
0.1
|
nm*
|
0.1
|
0.3
|
nm*
|
||||||||||||||||||
|
Total
|
$
|
1,348.5
|
$
|
1,397.2
|
(3
|
)%
|
$
|
2,682.7
|
$
|
2,778.9
|
(3
|
)%
|
||||||||||||
|
Segment Adjusted EBITDA, net:
|
||||||||||||||||||||||||
|
LoyaltyOne
|
$
|
51.0
|
$
|
69.5
|
(27
|
)%
|
$
|
106.1
|
$
|
123.4
|
(14
|
)%
|
||||||||||||
|
Card Services
|
287.2
|
335.7
|
(14
|
)
|
582.1
|
654.3
|
(11
|
)
|
||||||||||||||||
|
Corporate/Other
|
(28.6
|
)
|
(39.9
|
)
|
(28
|
)
|
(62.0
|
)
|
(65.4
|
)
|
(5
|
)
|
||||||||||||
|
Total
|
$
|
309.6
|
$
|
365.3
|
(15
|
)%
|
$
|
626.2
|
$
|
712.3
|
(12
|
)%
|
||||||||||||
|
Key Performance Indicators:
|
||||||||||||||||||||||||
|
Credit sales
|
$
|
7,551
|
$
|
7,568
|
—
|
%
|
$
|
13,867
|
$
|
14,373
|
(4
|
)%
|
||||||||||||
|
Credit sales - active
|
$
|
6,675
|
$
|
6,157
|
8
|
%
|
$
|
12,220
|
$
|
11,460
|
7
|
%
|
||||||||||||
|
Average receivables
|
$
|
16,798
|
$
|
17,570
|
(4
|
)%
|
$
|
16,824
|
$
|
17,646
|
(5
|
)%
|
||||||||||||
|
Gross yield
|
23.9
|
%
|
24.9
|
%
|
(0.9
|
)%
|
24.0
|
%
|
24.8
|
%
|
(0.8
|
)%
|
||||||||||||
|
Net principal loss rate
|
6.1
|
%
|
6.4
|
%
|
(0.3
|
)%
|
6.3
|
%
|
6.6
|
%
|
(0.3
|
)%
|
||||||||||||
|
Delinquency rate
|
5.2
|
%
|
5.5
|
%
|
(0.3
|
)%
|
5.2
|
%
|
5.5
|
%
|
(0.3
|
)%
|
||||||||||||
|
AIR MILES reward miles issued
|
1,423
|
1,445
|
(2
|
)%
|
2,681
|
2,671
|
—
|
%
|
||||||||||||||||
|
AIR MILES reward miles redeemed
|
1,050
|
1,068
|
(2
|
)%
|
2,139
|
2,246
|
(5
|
)%
|
||||||||||||||||
* nm-not meaningful
9
Alliance Data Systems Corporation
July 18, 2019
ALLIANCE DATA SYSTEMS CORPORATION
RECONCILIATION OF NON-GAAP FINANCIAL MEASURES
(In millions, except per share amounts)
(Unaudited)
|
|
Three Months Ended
June 30,
|
Six Months Ended
June 30,
|
|||||||||||||||
|
|
2019
|
2018
|
2019
|
2018
|
|||||||||||||
|
Adjusted EBITDA and Adjusted EBITDA, net:
|
|||||||||||||||||
|
Income from continuing operations
|
$
|
142.4
|
$
|
223.8
|
$
|
320.7
|
$
|
403.7
|
|||||||||
|
Income tax expense
|
51.4
|
39.3
|
86.1
|
104.5
|
|||||||||||||
|
Total interest expense, net
|
143.5
|
133.6
|
287.4
|
260.7
|
|||||||||||||
|
Depreciation and other amortization
|
19.3
|
19.8
|
39.9
|
39.1
|
|||||||||||||
|
Amortization of purchased intangibles
|
22.5
|
28.8
|
48.3
|
58.3
|
|||||||||||||
|
Stock compensation expense
|
10.2
|
12.0
|
21.6
|
25.6
|
|||||||||||||
|
Strategic transaction costs (1)
|
2.7
|
—
|
2.7
|
—
|
|||||||||||||
|
Restructuring charges (2)
|
22.4
|
—
|
30.3
|
—
|
|||||||||||||
|
Adjusted EBITDA
|
$
|
414.4
|
$
|
457.3
|
$
|
837.0
|
$
|
891.9
|
|||||||||
|
Less: Funding costs (3)
|
104.8
|
92.0
|
210.8
|
179.6
|
|||||||||||||
|
Adjusted EBITDA, net of funding costs
|
$
|
309.6
|
$
|
365.3
|
$
|
626.2
|
$
|
712.3
|
|||||||||
|
Core Earnings:
|
|||||||||||||||||
|
Income from continuing operations
|
$
|
142.4
|
$
|
223.8
|
$
|
320.7
|
$
|
403.7
|
|||||||||
|
Add back: non-cash/ non-operating items:
|
|||||||||||||||||
|
Stock compensation expense
|
10.2
|
12.0
|
21.6
|
25.6
|
|||||||||||||
|
Amortization of purchased intangibles
|
22.5
|
28.8
|
48.3
|
58.3
|
|||||||||||||
|
Non-cash interest (4)
|
9.5
|
12.4
|
18.7
|
22.0
|
|||||||||||||
|
Strategic transaction costs (1)
|
2.7
|
—
|
2.7
|
—
|
|||||||||||||
|
Restructuring charges (2)
|
22.4
|
—
|
30.3
|
—
|
|||||||||||||
|
Income tax effect (5)
|
(8.3
|
)
|
(34.9
|
)
|
(39.1
|
)
|
(44.2
|
)
|
|||||||||
|
Core earnings
|
$
|
201.4
|
$
|
242.1
|
$
|
403.2
|
$
|
465.4
|
|||||||||
|
Weighted average shares outstanding – diluted
|
52.6
|
55.4
|
52.9
|
55.5
|
|||||||||||||
|
Core earnings per share – diluted
|
$
|
3.83
|
$
|
4.37
|
$
|
7.62
|
$
|
8.38
|
|||||||||
|
(1)
|
Represents costs for professional services associated with strategic initiatives.
|
|
(2)
|
Represents costs associated with the wind-down of Merison, a retail marketing division within BrandLoyalty, in the first quarter of 2019 and a reorganization of Corporate, resulting from the sale of Epsilon.
|
|
(3)
|
Represents interest expense on deposits and securitization funding costs.
|
|
(4)
|
Represents amortization of debt issuance costs.
|
|
(5)
|
Represents the tax effect including the related non-GAAP measure adjustments using the expected effective annual tax rate.
|
10
Alliance Data Systems Corporation
July 18, 2019
|
Three Months Ended June 30, 2019
|
||||||||||||||||
|
|
LoyaltyOne
|
Card
Services
|
Corporate/
Other
|
Total
|
||||||||||||
|
Operating income (loss)
|
$
|
28.3
|
$
|
367.6
|
$
|
(58.6
|
)
|
$
|
337.3
|
|||||||
|
Depreciation and amortization
|
19.6
|
20.8
|
1.4
|
41.8
|
||||||||||||
|
Stock compensation expense
|
2.9
|
3.6
|
3.7
|
10.2
|
||||||||||||
|
Strategic transaction costs
|
0.2
|
—
|
2.5
|
2.7
|
||||||||||||
|
Restructuring charges
|
—
|
—
|
22.4
|
22.4
|
||||||||||||
|
Adjusted EBITDA
|
51.0
|
392.0
|
(28.6
|
)
|
414.4
|
|||||||||||
|
Less: Funding costs
|
—
|
104.8
|
—
|
104.8
|
||||||||||||
|
Adjusted EBITDA, net
|
$
|
51.0
|
$
|
287.2
|
$
|
(28.6
|
)
|
$
|
309.6
|
|||||||
|
Three Months Ended June 30, 2018
|
||||||||||||||||
|
|
LoyaltyOne
|
Card
Services
|
Corporate/
Other
|
Total
|
||||||||||||
|
Operating income (loss)
|
$
|
45.6
|
$
|
399.3
|
$
|
(48.2
|
)
|
$
|
396.7
|
|||||||
|
Depreciation and amortization
|
21.5
|
25.3
|
1.8
|
48.6
|
||||||||||||
|
Stock compensation expense
|
2.4
|
3.1
|
6.5
|
12.0
|
||||||||||||
|
Adjusted EBITDA
|
69.5
|
427.7
|
(39.9
|
)
|
457.3
|
|||||||||||
|
Less: Funding costs
|
—
|
92.0
|
—
|
92.0
|
||||||||||||
|
Adjusted EBITDA, net
|
$
|
69.5
|
$
|
335.7
|
$
|
(39.9
|
)
|
$
|
365.3
|
|||||||
|
Six Months Ended June 30, 2019
|
||||||||||||||||
|
|
LoyaltyOne
|
Card
Services
|
Corporate/
Other
|
Total
|
||||||||||||
|
Operating income (loss)
|
$
|
52.4
|
$
|
740.5
|
$
|
(98.7
|
)
|
$
|
694.2
|
|||||||
|
Depreciation and amortization
|
39.8
|
45.0
|
3.4
|
88.2
|
||||||||||||
|
Stock compensation expense
|
5.8
|
7.4
|
8.4
|
21.6
|
||||||||||||
|
Strategic transaction costs
|
0.2
|
—
|
2.5
|
2.7
|
||||||||||||
|
Restructuring charges
|
7.9
|
—
|
22.4
|
30.3
|
||||||||||||
|
Adjusted EBITDA
|
106.1
|
792.9
|
(62.0
|
)
|
837.0
|
|||||||||||
|
Less: Funding costs
|
—
|
210.8
|
—
|
210.8
|
||||||||||||
|
Adjusted EBITDA, net
|
$
|
106.1
|
$
|
582.1
|
$
|
(62.0
|
)
|
$
|
626.2
|
|||||||
|
Six Months Ended June 30, 2018
|
||||||||||||||||
|
|
LoyaltyOne
|
Card
Services
|
Corporate/
Other
|
Total
|
||||||||||||
|
Operating income (loss)
|
$
|
74.0
|
$
|
776.2
|
$
|
(81.3
|
)
|
$
|
768.9
|
|||||||
|
Depreciation and amortization
|
43.5
|
50.1
|
3.8
|
97.4
|
||||||||||||
|
Stock compensation expense
|
5.9
|
7.6
|
12.1
|
25.6
|
||||||||||||
|
Adjusted EBITDA
|
123.4
|
833.9
|
(65.4
|
)
|
891.9
|
|||||||||||
|
Less: Funding costs
|
—
|
179.6
|
—
|
179.6
|
||||||||||||
|
Adjusted EBITDA, net
|
$
|
123.4
|
$
|
654.3
|
$
|
(65.4
|
)
|
$
|
712.3
|
|||||||
11