000109980012/312021Q2false00010998002021-01-012021-06-30xbrli:shares00010998002021-07-26iso4217:USD00010998002021-06-3000010998002020-12-31iso4217:USDxbrli:shares00010998002021-04-012021-06-3000010998002020-04-012020-06-3000010998002020-01-012020-06-3000010998002019-12-3100010998002020-06-300001099800us-gaap:CommonStockMember2020-12-310001099800us-gaap:TreasuryStockMember2020-12-310001099800us-gaap:AdditionalPaidInCapitalMember2020-12-310001099800us-gaap:RetainedEarningsMember2020-12-310001099800us-gaap:AccumulatedOtherComprehensiveIncomeMember2020-12-310001099800us-gaap:RetainedEarningsMember2021-01-012021-03-3100010998002021-01-012021-03-310001099800us-gaap:AccumulatedOtherComprehensiveIncomeMember2021-01-012021-03-310001099800us-gaap:CommonStockMember2021-01-012021-03-310001099800us-gaap:AdditionalPaidInCapitalMember2021-01-012021-03-310001099800us-gaap:TreasuryStockMember2021-01-012021-03-310001099800us-gaap:CommonStockMember2021-03-310001099800us-gaap:TreasuryStockMember2021-03-310001099800us-gaap:AdditionalPaidInCapitalMember2021-03-310001099800us-gaap:RetainedEarningsMember2021-03-310001099800us-gaap:AccumulatedOtherComprehensiveIncomeMember2021-03-3100010998002021-03-310001099800us-gaap:RetainedEarningsMember2021-04-012021-06-300001099800us-gaap:AccumulatedOtherComprehensiveIncomeMember2021-04-012021-06-300001099800us-gaap:CommonStockMember2021-04-012021-06-300001099800us-gaap:AdditionalPaidInCapitalMember2021-04-012021-06-300001099800us-gaap:TreasuryStockMember2021-04-012021-06-300001099800us-gaap:CommonStockMember2021-06-300001099800us-gaap:TreasuryStockMember2021-06-300001099800us-gaap:AdditionalPaidInCapitalMember2021-06-300001099800us-gaap:RetainedEarningsMember2021-06-300001099800us-gaap:AccumulatedOtherComprehensiveIncomeMember2021-06-300001099800us-gaap:CommonStockMember2019-12-310001099800us-gaap:TreasuryStockMember2019-12-310001099800us-gaap:AdditionalPaidInCapitalMember2019-12-310001099800us-gaap:RetainedEarningsMember2019-12-310001099800us-gaap:AccumulatedOtherComprehensiveIncomeMember2019-12-310001099800us-gaap:RetainedEarningsMember2020-01-012020-03-3100010998002020-01-012020-03-310001099800us-gaap:AccumulatedOtherComprehensiveIncomeMember2020-01-012020-03-310001099800us-gaap:CommonStockMember2020-01-012020-03-310001099800us-gaap:AdditionalPaidInCapitalMember2020-01-012020-03-310001099800us-gaap:TreasuryStockMember2020-01-012020-03-310001099800us-gaap:CommonStockMember2020-03-310001099800us-gaap:TreasuryStockMember2020-03-310001099800us-gaap:AdditionalPaidInCapitalMember2020-03-310001099800us-gaap:RetainedEarningsMember2020-03-310001099800us-gaap:AccumulatedOtherComprehensiveIncomeMember2020-03-3100010998002020-03-310001099800us-gaap:RetainedEarningsMember2020-04-012020-06-300001099800us-gaap:AccumulatedOtherComprehensiveIncomeMember2020-04-012020-06-300001099800us-gaap:CommonStockMember2020-04-012020-06-300001099800us-gaap:AdditionalPaidInCapitalMember2020-04-012020-06-300001099800us-gaap:TreasuryStockMember2020-04-012020-06-300001099800us-gaap:CommonStockMember2020-06-300001099800us-gaap:TreasuryStockMember2020-06-300001099800us-gaap:AdditionalPaidInCapitalMember2020-06-300001099800us-gaap:RetainedEarningsMember2020-06-300001099800us-gaap:AccumulatedOtherComprehensiveIncomeMember2020-06-300001099800us-gaap:BankTimeDepositsMember2021-06-300001099800us-gaap:BankTimeDepositsMember2020-12-310001099800us-gaap:CommercialPaperMember2021-06-300001099800us-gaap:CommercialPaperMember2020-12-310001099800us-gaap:USTreasuryAndGovernmentMember2021-06-300001099800us-gaap:USTreasuryAndGovernmentMember2020-12-310001099800us-gaap:AssetBackedSecuritiesMember2021-06-300001099800us-gaap:AssetBackedSecuritiesMember2020-12-310001099800us-gaap:CorporateDebtSecuritiesMember2021-06-300001099800us-gaap:CorporateDebtSecuritiesMember2020-12-310001099800us-gaap:MunicipalBondsMember2021-06-300001099800us-gaap:MunicipalBondsMember2020-12-31ew:investment0001099800us-gaap:OtherNonoperatingIncomeExpenseMember2021-06-300001099800ew:KardionIncMember2021-04-300001099800ew:KardionIncMemberus-gaap:EquitySecuritiesMember2021-04-300001099800ew:KardionIncMember2021-06-300001099800us-gaap:FairValueInputsLevel2Member2021-06-300001099800us-gaap:FairValueMeasurementsRecurringMemberus-gaap:FairValueInputsLevel1Memberus-gaap:EstimateOfFairValueFairValueDisclosureMember2021-06-300001099800us-gaap:FairValueInputsLevel2Memberus-gaap:FairValueMeasurementsRecurringMemberus-gaap:EstimateOfFairValueFairValueDisclosureMember2021-06-300001099800us-gaap:FairValueMeasurementsRecurringMemberus-gaap:FairValueInputsLevel3Memberus-gaap:EstimateOfFairValueFairValueDisclosureMember2021-06-300001099800us-gaap:FairValueMeasurementsRecurringMemberus-gaap:EstimateOfFairValueFairValueDisclosureMember2021-06-300001099800us-gaap:FairValueMeasurementsRecurringMemberus-gaap:FairValueInputsLevel1Memberus-gaap:BankTimeDepositsMemberus-gaap:EstimateOfFairValueFairValueDisclosureMember2021-06-300001099800us-gaap:FairValueInputsLevel2Memberus-gaap:FairValueMeasurementsRecurringMemberus-gaap:BankTimeDepositsMemberus-gaap:EstimateOfFairValueFairValueDisclosureMember2021-06-300001099800us-gaap:FairValueMeasurementsRecurringMemberus-gaap:FairValueInputsLevel3Memberus-gaap:BankTimeDepositsMemberus-gaap:EstimateOfFairValueFairValueDisclosureMember2021-06-300001099800us-gaap:FairValueMeasurementsRecurringMemberus-gaap:BankTimeDepositsMemberus-gaap:EstimateOfFairValueFairValueDisclosureMember2021-06-300001099800us-gaap:CorporateDebtSecuritiesMemberus-gaap:FairValueMeasurementsRecurringMemberus-gaap:FairValueInputsLevel1Memberus-gaap:EstimateOfFairValueFairValueDisclosureMember2021-06-300001099800us-gaap:CorporateDebtSecuritiesMemberus-gaap:FairValueInputsLevel2Memberus-gaap:FairValueMeasurementsRecurringMemberus-gaap:EstimateOfFairValueFairValueDisclosureMember2021-06-300001099800us-gaap:CorporateDebtSecuritiesMemberus-gaap:FairValueMeasurementsRecurringMemberus-gaap:FairValueInputsLevel3Memberus-gaap:EstimateOfFairValueFairValueDisclosureMember2021-06-300001099800us-gaap:CorporateDebtSecuritiesMemberus-gaap:FairValueMeasurementsRecurringMemberus-gaap:EstimateOfFairValueFairValueDisclosureMember2021-06-300001099800us-gaap:FairValueMeasurementsRecurringMemberus-gaap:FairValueInputsLevel1Memberus-gaap:AssetBackedSecuritiesMemberus-gaap:EstimateOfFairValueFairValueDisclosureMember2021-06-300001099800us-gaap:FairValueInputsLevel2Memberus-gaap:FairValueMeasurementsRecurringMemberus-gaap:AssetBackedSecuritiesMemberus-gaap:EstimateOfFairValueFairValueDisclosureMember2021-06-300001099800us-gaap:FairValueMeasurementsRecurringMemberus-gaap:AssetBackedSecuritiesMemberus-gaap:FairValueInputsLevel3Memberus-gaap:EstimateOfFairValueFairValueDisclosureMember2021-06-300001099800us-gaap:FairValueMeasurementsRecurringMemberus-gaap:AssetBackedSecuritiesMemberus-gaap:EstimateOfFairValueFairValueDisclosureMember2021-06-300001099800us-gaap:USTreasuryAndGovernmentMemberus-gaap:FairValueMeasurementsRecurringMemberus-gaap:FairValueInputsLevel1Memberus-gaap:EstimateOfFairValueFairValueDisclosureMember2021-06-300001099800us-gaap:USTreasuryAndGovernmentMemberus-gaap:FairValueInputsLevel2Memberus-gaap:FairValueMeasurementsRecurringMemberus-gaap:EstimateOfFairValueFairValueDisclosureMember2021-06-300001099800us-gaap:USTreasuryAndGovernmentMemberus-gaap:FairValueMeasurementsRecurringMemberus-gaap:FairValueInputsLevel3Memberus-gaap:EstimateOfFairValueFairValueDisclosureMember2021-06-300001099800us-gaap:USTreasuryAndGovernmentMemberus-gaap:FairValueMeasurementsRecurringMemberus-gaap:EstimateOfFairValueFairValueDisclosureMember2021-06-300001099800us-gaap:FairValueMeasurementsRecurringMemberus-gaap:FairValueInputsLevel1Memberus-gaap:CommercialPaperMemberus-gaap:EstimateOfFairValueFairValueDisclosureMember2021-06-300001099800us-gaap:FairValueInputsLevel2Memberus-gaap:FairValueMeasurementsRecurringMemberus-gaap:CommercialPaperMemberus-gaap:EstimateOfFairValueFairValueDisclosureMember2021-06-300001099800us-gaap:FairValueMeasurementsRecurringMemberus-gaap:CommercialPaperMemberus-gaap:FairValueInputsLevel3Memberus-gaap:EstimateOfFairValueFairValueDisclosureMember2021-06-300001099800us-gaap:FairValueMeasurementsRecurringMemberus-gaap:CommercialPaperMemberus-gaap:EstimateOfFairValueFairValueDisclosureMember2021-06-300001099800us-gaap:FairValueMeasurementsRecurringMemberus-gaap:FairValueInputsLevel1Memberus-gaap:MunicipalBondsMemberus-gaap:EstimateOfFairValueFairValueDisclosureMember2021-06-300001099800us-gaap:FairValueInputsLevel2Memberus-gaap:FairValueMeasurementsRecurringMemberus-gaap:MunicipalBondsMemberus-gaap:EstimateOfFairValueFairValueDisclosureMember2021-06-300001099800us-gaap:FairValueMeasurementsRecurringMemberus-gaap:MunicipalBondsMemberus-gaap:FairValueInputsLevel3Memberus-gaap:EstimateOfFairValueFairValueDisclosureMember2021-06-300001099800us-gaap:FairValueMeasurementsRecurringMemberus-gaap:MunicipalBondsMemberus-gaap:EstimateOfFairValueFairValueDisclosureMember2021-06-300001099800us-gaap:FairValueMeasurementsRecurringMemberus-gaap:FairValueInputsLevel1Memberus-gaap:EstimateOfFairValueFairValueDisclosureMember2020-12-310001099800us-gaap:FairValueInputsLevel2Memberus-gaap:FairValueMeasurementsRecurringMemberus-gaap:EstimateOfFairValueFairValueDisclosureMember2020-12-310001099800us-gaap:FairValueMeasurementsRecurringMemberus-gaap:FairValueInputsLevel3Memberus-gaap:EstimateOfFairValueFairValueDisclosureMember2020-12-310001099800us-gaap:FairValueMeasurementsRecurringMemberus-gaap:EstimateOfFairValueFairValueDisclosureMember2020-12-310001099800us-gaap:FairValueMeasurementsRecurringMemberus-gaap:FairValueInputsLevel1Memberus-gaap:BankTimeDepositsMemberus-gaap:EstimateOfFairValueFairValueDisclosureMember2020-12-310001099800us-gaap:FairValueInputsLevel2Memberus-gaap:FairValueMeasurementsRecurringMemberus-gaap:BankTimeDepositsMemberus-gaap:EstimateOfFairValueFairValueDisclosureMember2020-12-310001099800us-gaap:FairValueMeasurementsRecurringMemberus-gaap:FairValueInputsLevel3Memberus-gaap:BankTimeDepositsMemberus-gaap:EstimateOfFairValueFairValueDisclosureMember2020-12-310001099800us-gaap:FairValueMeasurementsRecurringMemberus-gaap:BankTimeDepositsMemberus-gaap:EstimateOfFairValueFairValueDisclosureMember2020-12-310001099800us-gaap:CorporateDebtSecuritiesMemberus-gaap:FairValueMeasurementsRecurringMemberus-gaap:FairValueInputsLevel1Memberus-gaap:EstimateOfFairValueFairValueDisclosureMember2020-12-310001099800us-gaap:CorporateDebtSecuritiesMemberus-gaap:FairValueInputsLevel2Memberus-gaap:FairValueMeasurementsRecurringMemberus-gaap:EstimateOfFairValueFairValueDisclosureMember2020-12-310001099800us-gaap:CorporateDebtSecuritiesMemberus-gaap:FairValueMeasurementsRecurringMemberus-gaap:FairValueInputsLevel3Memberus-gaap:EstimateOfFairValueFairValueDisclosureMember2020-12-310001099800us-gaap:CorporateDebtSecuritiesMemberus-gaap:FairValueMeasurementsRecurringMemberus-gaap:EstimateOfFairValueFairValueDisclosureMember2020-12-310001099800us-gaap:FairValueMeasurementsRecurringMemberus-gaap:FairValueInputsLevel1Memberus-gaap:AssetBackedSecuritiesMemberus-gaap:EstimateOfFairValueFairValueDisclosureMember2020-12-310001099800us-gaap:FairValueInputsLevel2Memberus-gaap:FairValueMeasurementsRecurringMemberus-gaap:AssetBackedSecuritiesMemberus-gaap:EstimateOfFairValueFairValueDisclosureMember2020-12-310001099800us-gaap:FairValueMeasurementsRecurringMemberus-gaap:AssetBackedSecuritiesMemberus-gaap:FairValueInputsLevel3Memberus-gaap:EstimateOfFairValueFairValueDisclosureMember2020-12-310001099800us-gaap:FairValueMeasurementsRecurringMemberus-gaap:AssetBackedSecuritiesMemberus-gaap:EstimateOfFairValueFairValueDisclosureMember2020-12-310001099800us-gaap:USTreasuryAndGovernmentMemberus-gaap:FairValueMeasurementsRecurringMemberus-gaap:FairValueInputsLevel1Memberus-gaap:EstimateOfFairValueFairValueDisclosureMember2020-12-310001099800us-gaap:USTreasuryAndGovernmentMemberus-gaap:FairValueInputsLevel2Memberus-gaap:FairValueMeasurementsRecurringMemberus-gaap:EstimateOfFairValueFairValueDisclosureMember2020-12-310001099800us-gaap:USTreasuryAndGovernmentMemberus-gaap:FairValueMeasurementsRecurringMemberus-gaap:FairValueInputsLevel3Memberus-gaap:EstimateOfFairValueFairValueDisclosureMember2020-12-310001099800us-gaap:USTreasuryAndGovernmentMemberus-gaap:FairValueMeasurementsRecurringMemberus-gaap:EstimateOfFairValueFairValueDisclosureMember2020-12-310001099800us-gaap:FairValueMeasurementsRecurringMemberus-gaap:FairValueInputsLevel1Memberus-gaap:MunicipalBondsMemberus-gaap:EstimateOfFairValueFairValueDisclosureMember2020-12-310001099800us-gaap:FairValueInputsLevel2Memberus-gaap:FairValueMeasurementsRecurringMemberus-gaap:MunicipalBondsMemberus-gaap:EstimateOfFairValueFairValueDisclosureMember2020-12-310001099800us-gaap:FairValueMeasurementsRecurringMemberus-gaap:MunicipalBondsMemberus-gaap:FairValueInputsLevel3Memberus-gaap:EstimateOfFairValueFairValueDisclosureMember2020-12-310001099800us-gaap:FairValueMeasurementsRecurringMemberus-gaap:MunicipalBondsMemberus-gaap:EstimateOfFairValueFairValueDisclosureMember2020-12-310001099800ew:ContingentConsiderationLiabilityMember2020-12-310001099800us-gaap:OtherLiabilitiesMember2020-12-310001099800ew:ContingentConsiderationLiabilityMember2021-01-012021-06-300001099800us-gaap:OtherLiabilitiesMember2021-01-012021-06-300001099800ew:ContingentConsiderationLiabilityMember2021-06-300001099800us-gaap:OtherLiabilitiesMember2021-06-300001099800ew:ContingentConsiderationLiabilityMember2019-12-310001099800us-gaap:OtherLiabilitiesMember2019-12-310001099800ew:ContingentConsiderationLiabilityMember2020-01-012020-06-300001099800us-gaap:OtherLiabilitiesMember2020-01-012020-06-300001099800ew:ContingentConsiderationLiabilityMember2020-06-300001099800us-gaap:OtherLiabilitiesMember2020-06-300001099800ew:PreviousAcquisitionsMember2021-04-012021-06-30xbrli:pure0001099800us-gaap:MeasurementInputDiscountRateMembersrt:MinimumMemberus-gaap:FairValueInputsLevel3Member2021-06-300001099800srt:MaximumMemberus-gaap:MeasurementInputDiscountRateMemberus-gaap:FairValueInputsLevel3Member2021-06-300001099800us-gaap:MeasurementInputDiscountRateMembersrt:WeightedAverageMemberus-gaap:FairValueInputsLevel3Member2021-06-300001099800ew:MeasurementInputProbabilityOfMilestoneAchievementMembersrt:MinimumMemberus-gaap:FairValueInputsLevel3Member2021-06-300001099800srt:MaximumMemberew:MeasurementInputProbabilityOfMilestoneAchievementMemberus-gaap:FairValueInputsLevel3Member2021-06-300001099800ew:MeasurementInputProbabilityOfMilestoneAchievementMembersrt:WeightedAverageMemberus-gaap:FairValueInputsLevel3Member2021-06-300001099800ew:MeasurementInputVolatilityOfFutureRevenueMembersrt:MinimumMemberus-gaap:FairValueInputsLevel3Member2021-06-300001099800srt:MaximumMemberew:MeasurementInputVolatilityOfFutureRevenueMemberus-gaap:FairValueInputsLevel3Member2021-06-300001099800ew:MeasurementInputVolatilityOfFutureRevenueMembersrt:WeightedAverageMemberus-gaap:FairValueInputsLevel3Member2021-06-300001099800us-gaap:DesignatedAsHedgingInstrumentMemberus-gaap:ForeignExchangeForwardMember2021-06-300001099800us-gaap:DesignatedAsHedgingInstrumentMemberus-gaap:ForeignExchangeForwardMember2020-12-310001099800us-gaap:CurrencySwapMemberus-gaap:DesignatedAsHedgingInstrumentMember2021-06-300001099800us-gaap:CurrencySwapMemberus-gaap:DesignatedAsHedgingInstrumentMember2020-12-310001099800us-gaap:ForeignExchangeContractMemberus-gaap:OtherCurrentAssetsMemberus-gaap:DesignatedAsHedgingInstrumentMember2021-06-300001099800us-gaap:ForeignExchangeContractMemberus-gaap:OtherCurrentAssetsMemberus-gaap:DesignatedAsHedgingInstrumentMember2020-12-310001099800us-gaap:CurrencySwapMemberus-gaap:DesignatedAsHedgingInstrumentMemberus-gaap:OtherNoncurrentAssetsMember2021-06-300001099800us-gaap:CurrencySwapMemberus-gaap:DesignatedAsHedgingInstrumentMemberus-gaap:OtherNoncurrentAssetsMember2020-12-310001099800us-gaap:ForeignExchangeContractMemberus-gaap:DesignatedAsHedgingInstrumentMemberus-gaap:AccountsPayableAndAccruedLiabilitiesMember2021-06-300001099800us-gaap:ForeignExchangeContractMemberus-gaap:DesignatedAsHedgingInstrumentMemberus-gaap:AccountsPayableAndAccruedLiabilitiesMember2020-12-310001099800us-gaap:ForeignExchangeContractMember2021-06-300001099800us-gaap:CurrencySwapMember2021-06-300001099800us-gaap:ForeignExchangeContractMember2020-12-310001099800us-gaap:CurrencySwapMember2020-12-310001099800us-gaap:ForeignExchangeContractMemberus-gaap:DesignatedAsHedgingInstrumentMemberus-gaap:CashFlowHedgingMember2021-04-012021-06-300001099800us-gaap:ForeignExchangeContractMemberus-gaap:DesignatedAsHedgingInstrumentMemberus-gaap:CashFlowHedgingMember2020-04-012020-06-300001099800us-gaap:ForeignExchangeContractMemberus-gaap:CostOfSalesMemberus-gaap:DesignatedAsHedgingInstrumentMemberus-gaap:CashFlowHedgingMember2021-04-012021-06-300001099800us-gaap:ForeignExchangeContractMemberus-gaap:CostOfSalesMemberus-gaap:DesignatedAsHedgingInstrumentMemberus-gaap:CashFlowHedgingMember2020-04-012020-06-300001099800us-gaap:SellingGeneralAndAdministrativeExpensesMemberus-gaap:ForeignExchangeContractMemberus-gaap:DesignatedAsHedgingInstrumentMemberus-gaap:CashFlowHedgingMember2021-04-012021-06-300001099800us-gaap:SellingGeneralAndAdministrativeExpensesMemberus-gaap:ForeignExchangeContractMemberus-gaap:DesignatedAsHedgingInstrumentMemberus-gaap:CashFlowHedgingMember2020-04-012020-06-300001099800us-gaap:ForeignExchangeContractMemberus-gaap:DesignatedAsHedgingInstrumentMemberus-gaap:CashFlowHedgingMember2021-01-012021-06-300001099800us-gaap:ForeignExchangeContractMemberus-gaap:DesignatedAsHedgingInstrumentMemberus-gaap:CashFlowHedgingMember2020-01-012020-06-300001099800us-gaap:ForeignExchangeContractMemberus-gaap:CostOfSalesMemberus-gaap:DesignatedAsHedgingInstrumentMemberus-gaap:CashFlowHedgingMember2021-01-012021-06-300001099800us-gaap:ForeignExchangeContractMemberus-gaap:CostOfSalesMemberus-gaap:DesignatedAsHedgingInstrumentMemberus-gaap:CashFlowHedgingMember2020-01-012020-06-300001099800us-gaap:SellingGeneralAndAdministrativeExpensesMemberus-gaap:ForeignExchangeContractMemberus-gaap:DesignatedAsHedgingInstrumentMemberus-gaap:CashFlowHedgingMember2021-01-012021-06-300001099800us-gaap:SellingGeneralAndAdministrativeExpensesMemberus-gaap:ForeignExchangeContractMemberus-gaap:DesignatedAsHedgingInstrumentMemberus-gaap:CashFlowHedgingMember2020-01-012020-06-300001099800us-gaap:NetInvestmentHedgingMemberus-gaap:CurrencySwapMemberus-gaap:DesignatedAsHedgingInstrumentMember2021-04-012021-06-300001099800us-gaap:NetInvestmentHedgingMemberus-gaap:CurrencySwapMemberus-gaap:DesignatedAsHedgingInstrumentMember2020-04-012020-06-300001099800us-gaap:NetInvestmentHedgingMemberus-gaap:InterestIncomeMemberus-gaap:CurrencySwapMemberus-gaap:DesignatedAsHedgingInstrumentMember2021-04-012021-06-300001099800us-gaap:NetInvestmentHedgingMemberus-gaap:InterestIncomeMemberus-gaap:CurrencySwapMemberus-gaap:DesignatedAsHedgingInstrumentMember2020-04-012020-06-300001099800us-gaap:NetInvestmentHedgingMemberus-gaap:CurrencySwapMemberus-gaap:DesignatedAsHedgingInstrumentMember2021-01-012021-06-300001099800us-gaap:NetInvestmentHedgingMemberus-gaap:CurrencySwapMemberus-gaap:DesignatedAsHedgingInstrumentMember2020-01-012020-06-300001099800us-gaap:NetInvestmentHedgingMemberus-gaap:InterestIncomeMemberus-gaap:CurrencySwapMemberus-gaap:DesignatedAsHedgingInstrumentMember2021-01-012021-06-300001099800us-gaap:NetInvestmentHedgingMemberus-gaap:InterestIncomeMemberus-gaap:CurrencySwapMemberus-gaap:DesignatedAsHedgingInstrumentMember2020-01-012020-06-30iso4217:EUR0001099800us-gaap:NetInvestmentHedgingMemberus-gaap:CurrencySwapMemberus-gaap:DesignatedAsHedgingInstrumentMember2021-06-300001099800us-gaap:ForeignExchangeContractMemberus-gaap:FairValueHedgingMemberus-gaap:DesignatedAsHedgingInstrumentMemberus-gaap:OtherNonoperatingIncomeExpenseMember2021-04-012021-06-300001099800us-gaap:ForeignExchangeContractMemberus-gaap:FairValueHedgingMemberus-gaap:DesignatedAsHedgingInstrumentMemberus-gaap:OtherNonoperatingIncomeExpenseMember2020-04-012020-06-300001099800us-gaap:ForeignExchangeContractMemberus-gaap:FairValueHedgingMemberus-gaap:DesignatedAsHedgingInstrumentMemberus-gaap:OtherNonoperatingIncomeExpenseMember2021-01-012021-06-300001099800us-gaap:ForeignExchangeContractMemberus-gaap:FairValueHedgingMemberus-gaap:DesignatedAsHedgingInstrumentMemberus-gaap:OtherNonoperatingIncomeExpenseMember2020-01-012020-06-300001099800us-gaap:ForeignExchangeContractMemberus-gaap:NondesignatedMemberus-gaap:OtherNonoperatingIncomeExpenseMember2021-04-012021-06-300001099800us-gaap:ForeignExchangeContractMemberus-gaap:NondesignatedMemberus-gaap:OtherNonoperatingIncomeExpenseMember2020-04-012020-06-300001099800us-gaap:ForeignExchangeContractMemberus-gaap:NondesignatedMemberus-gaap:OtherNonoperatingIncomeExpenseMember2021-01-012021-06-300001099800us-gaap:ForeignExchangeContractMemberus-gaap:NondesignatedMemberus-gaap:OtherNonoperatingIncomeExpenseMember2020-01-012020-06-300001099800us-gaap:ForeignExchangeContractMemberus-gaap:CostOfSalesMember2021-04-012021-06-300001099800us-gaap:ForeignExchangeContractMemberus-gaap:SellingGeneralAndAdministrativeExpensesMember2021-04-012021-06-300001099800us-gaap:ForeignExchangeContractMemberus-gaap:OtherNonoperatingIncomeExpenseMember2021-04-012021-06-300001099800us-gaap:ForeignExchangeContractMemberus-gaap:CostOfSalesMember2021-01-012021-06-300001099800us-gaap:ForeignExchangeContractMemberus-gaap:SellingGeneralAndAdministrativeExpensesMember2021-01-012021-06-300001099800us-gaap:ForeignExchangeContractMemberus-gaap:OtherNonoperatingIncomeExpenseMember2021-01-012021-06-300001099800us-gaap:ForeignExchangeContractMemberus-gaap:CostOfSalesMemberus-gaap:DesignatedAsHedgingInstrumentMember2021-04-012021-06-300001099800us-gaap:SellingGeneralAndAdministrativeExpensesMemberus-gaap:ForeignExchangeContractMemberus-gaap:DesignatedAsHedgingInstrumentMember2021-04-012021-06-300001099800us-gaap:ForeignExchangeContractMemberus-gaap:DesignatedAsHedgingInstrumentMemberus-gaap:OtherNonoperatingIncomeExpenseMember2021-04-012021-06-300001099800us-gaap:ForeignExchangeContractMemberus-gaap:CostOfSalesMemberus-gaap:DesignatedAsHedgingInstrumentMember2021-01-012021-06-300001099800us-gaap:SellingGeneralAndAdministrativeExpensesMemberus-gaap:ForeignExchangeContractMemberus-gaap:DesignatedAsHedgingInstrumentMember2021-01-012021-06-300001099800us-gaap:ForeignExchangeContractMemberus-gaap:DesignatedAsHedgingInstrumentMemberus-gaap:OtherNonoperatingIncomeExpenseMember2021-01-012021-06-300001099800us-gaap:ForeignExchangeContractMemberus-gaap:CostOfSalesMember2020-04-012020-06-300001099800us-gaap:ForeignExchangeContractMemberus-gaap:SellingGeneralAndAdministrativeExpensesMember2020-04-012020-06-300001099800us-gaap:ForeignExchangeContractMemberus-gaap:OtherNonoperatingIncomeExpenseMember2020-04-012020-06-300001099800us-gaap:ForeignExchangeContractMemberus-gaap:CostOfSalesMember2020-01-012020-06-300001099800us-gaap:ForeignExchangeContractMemberus-gaap:SellingGeneralAndAdministrativeExpensesMember2020-01-012020-06-300001099800us-gaap:ForeignExchangeContractMemberus-gaap:OtherNonoperatingIncomeExpenseMember2020-01-012020-06-300001099800us-gaap:ForeignExchangeContractMemberus-gaap:CostOfSalesMemberus-gaap:DesignatedAsHedgingInstrumentMember2020-04-012020-06-300001099800us-gaap:SellingGeneralAndAdministrativeExpensesMemberus-gaap:ForeignExchangeContractMemberus-gaap:DesignatedAsHedgingInstrumentMember2020-04-012020-06-300001099800us-gaap:ForeignExchangeContractMemberus-gaap:DesignatedAsHedgingInstrumentMemberus-gaap:OtherNonoperatingIncomeExpenseMember2020-04-012020-06-300001099800us-gaap:ForeignExchangeContractMemberus-gaap:CostOfSalesMemberus-gaap:DesignatedAsHedgingInstrumentMember2020-01-012020-06-300001099800us-gaap:SellingGeneralAndAdministrativeExpensesMemberus-gaap:ForeignExchangeContractMemberus-gaap:DesignatedAsHedgingInstrumentMember2020-01-012020-06-300001099800us-gaap:ForeignExchangeContractMemberus-gaap:DesignatedAsHedgingInstrumentMemberus-gaap:OtherNonoperatingIncomeExpenseMember2020-01-012020-06-300001099800us-gaap:CostOfSalesMember2021-04-012021-06-300001099800us-gaap:CostOfSalesMember2020-04-012020-06-300001099800us-gaap:CostOfSalesMember2021-01-012021-06-300001099800us-gaap:CostOfSalesMember2020-01-012020-06-300001099800us-gaap:SellingGeneralAndAdministrativeExpensesMember2021-04-012021-06-300001099800us-gaap:SellingGeneralAndAdministrativeExpensesMember2020-04-012020-06-300001099800us-gaap:SellingGeneralAndAdministrativeExpensesMember2021-01-012021-06-300001099800us-gaap:SellingGeneralAndAdministrativeExpensesMember2020-01-012020-06-300001099800us-gaap:ResearchAndDevelopmentExpenseMember2021-04-012021-06-300001099800us-gaap:ResearchAndDevelopmentExpenseMember2020-04-012020-06-300001099800us-gaap:ResearchAndDevelopmentExpenseMember2021-01-012021-06-300001099800us-gaap:ResearchAndDevelopmentExpenseMember2020-01-012020-06-300001099800us-gaap:RestrictedStockUnitsRSUMember2021-01-012021-06-300001099800ew:MarketBasedRestrictedStockUnitsMember2021-01-012021-06-300001099800ew:MarketBasedRestrictedStockUnitsRelatedToPreviousYearsGrantMember2021-01-012021-06-300001099800ew:MarketBasedRestrictedStockUnitsMembersrt:MinimumMember2021-01-012021-06-300001099800ew:MarketBasedRestrictedStockUnitsMembersrt:MaximumMember2021-01-012021-06-300001099800ew:MarketBasedRestrictedStockUnitsMember2020-01-012020-06-300001099800ew:EmployeeAndNonemployeeStockOptionsMember2021-04-012021-06-300001099800ew:EmployeeAndNonemployeeStockOptionsMember2020-04-012020-06-300001099800ew:EmployeeAndNonemployeeStockOptionsMember2021-01-012021-06-300001099800ew:EmployeeAndNonemployeeStockOptionsMember2020-01-012020-06-300001099800us-gaap:EmployeeStockMember2021-04-012021-06-300001099800us-gaap:EmployeeStockMember2020-04-012020-06-300001099800us-gaap:EmployeeStockMember2021-01-012021-06-300001099800us-gaap:EmployeeStockMember2020-01-012020-06-300001099800ew:February2021StockRepurchaseProgramMember2021-02-280001099800ew:February2021StockRepurchaseProgramMember2021-02-012021-02-280001099800ew:March2021StockRepurchaseProgramMember2021-03-012021-03-31ew:lawsuit0001099800us-gaap:AccumulatedTranslationAdjustmentMember2020-12-310001099800us-gaap:AccumulatedGainLossNetCashFlowHedgeParentMember2020-12-310001099800us-gaap:AccumulatedNetUnrealizedInvestmentGainLossMember2020-12-310001099800us-gaap:AccumulatedDefinedBenefitPlansAdjustmentMember2020-12-310001099800us-gaap:AccumulatedTranslationAdjustmentMember2021-01-012021-03-310001099800us-gaap:AccumulatedGainLossNetCashFlowHedgeParentMember2021-01-012021-03-310001099800us-gaap:AccumulatedNetUnrealizedInvestmentGainLossMember2021-01-012021-03-310001099800us-gaap:AccumulatedDefinedBenefitPlansAdjustmentMember2021-01-012021-03-310001099800us-gaap:AccumulatedTranslationAdjustmentMember2021-03-310001099800us-gaap:AccumulatedGainLossNetCashFlowHedgeParentMember2021-03-310001099800us-gaap:AccumulatedNetUnrealizedInvestmentGainLossMember2021-03-310001099800us-gaap:AccumulatedDefinedBenefitPlansAdjustmentMember2021-03-310001099800us-gaap:AccumulatedTranslationAdjustmentMember2021-04-012021-06-300001099800us-gaap:AccumulatedGainLossNetCashFlowHedgeParentMember2021-04-012021-06-300001099800us-gaap:AccumulatedNetUnrealizedInvestmentGainLossMember2021-04-012021-06-300001099800us-gaap:AccumulatedDefinedBenefitPlansAdjustmentMember2021-04-012021-06-300001099800us-gaap:AccumulatedTranslationAdjustmentMember2021-06-300001099800us-gaap:AccumulatedGainLossNetCashFlowHedgeParentMember2021-06-300001099800us-gaap:AccumulatedNetUnrealizedInvestmentGainLossMember2021-06-300001099800us-gaap:AccumulatedDefinedBenefitPlansAdjustmentMember2021-06-300001099800us-gaap:AccumulatedTranslationAdjustmentMember2019-12-310001099800us-gaap:AccumulatedGainLossNetCashFlowHedgeParentMember2019-12-310001099800us-gaap:AccumulatedNetUnrealizedInvestmentGainLossMember2019-12-310001099800us-gaap:AccumulatedDefinedBenefitPlansAdjustmentMember2019-12-310001099800us-gaap:AccumulatedTranslationAdjustmentMember2020-01-012020-03-310001099800us-gaap:AccumulatedGainLossNetCashFlowHedgeParentMember2020-01-012020-03-310001099800us-gaap:AccumulatedNetUnrealizedInvestmentGainLossMember2020-01-012020-03-310001099800us-gaap:AccumulatedDefinedBenefitPlansAdjustmentMember2020-01-012020-03-310001099800us-gaap:AccumulatedTranslationAdjustmentMember2020-03-310001099800us-gaap:AccumulatedGainLossNetCashFlowHedgeParentMember2020-03-310001099800us-gaap:AccumulatedNetUnrealizedInvestmentGainLossMember2020-03-310001099800us-gaap:AccumulatedDefinedBenefitPlansAdjustmentMember2020-03-310001099800us-gaap:AccumulatedTranslationAdjustmentMember2020-04-012020-06-300001099800us-gaap:AccumulatedGainLossNetCashFlowHedgeParentMember2020-04-012020-06-300001099800us-gaap:AccumulatedNetUnrealizedInvestmentGainLossMember2020-04-012020-06-300001099800us-gaap:AccumulatedDefinedBenefitPlansAdjustmentMember2020-04-012020-06-300001099800us-gaap:AccumulatedTranslationAdjustmentMember2020-06-300001099800us-gaap:AccumulatedGainLossNetCashFlowHedgeParentMember2020-06-300001099800us-gaap:AccumulatedNetUnrealizedInvestmentGainLossMember2020-06-300001099800us-gaap:AccumulatedDefinedBenefitPlansAdjustmentMember2020-06-300001099800us-gaap:AccumulatedTranslationAdjustmentMemberus-gaap:ReclassificationOutOfAccumulatedOtherComprehensiveIncomeMember2021-04-012021-06-300001099800us-gaap:AccumulatedTranslationAdjustmentMemberus-gaap:ReclassificationOutOfAccumulatedOtherComprehensiveIncomeMember2020-04-012020-06-300001099800us-gaap:AccumulatedTranslationAdjustmentMemberus-gaap:ReclassificationOutOfAccumulatedOtherComprehensiveIncomeMember2021-01-012021-06-300001099800us-gaap:AccumulatedTranslationAdjustmentMemberus-gaap:ReclassificationOutOfAccumulatedOtherComprehensiveIncomeMember2020-01-012020-06-300001099800us-gaap:AccumulatedGainLossNetCashFlowHedgeParentMemberus-gaap:ReclassificationOutOfAccumulatedOtherComprehensiveIncomeMember2021-04-012021-06-300001099800us-gaap:AccumulatedGainLossNetCashFlowHedgeParentMemberus-gaap:ReclassificationOutOfAccumulatedOtherComprehensiveIncomeMember2020-04-012020-06-300001099800us-gaap:AccumulatedGainLossNetCashFlowHedgeParentMemberus-gaap:ReclassificationOutOfAccumulatedOtherComprehensiveIncomeMember2021-01-012021-06-300001099800us-gaap:AccumulatedGainLossNetCashFlowHedgeParentMemberus-gaap:ReclassificationOutOfAccumulatedOtherComprehensiveIncomeMember2020-01-012020-06-300001099800us-gaap:AccumulatedNetUnrealizedInvestmentGainLossMemberus-gaap:ReclassificationOutOfAccumulatedOtherComprehensiveIncomeMember2021-04-012021-06-300001099800us-gaap:AccumulatedNetUnrealizedInvestmentGainLossMemberus-gaap:ReclassificationOutOfAccumulatedOtherComprehensiveIncomeMember2020-04-012020-06-300001099800us-gaap:AccumulatedNetUnrealizedInvestmentGainLossMemberus-gaap:ReclassificationOutOfAccumulatedOtherComprehensiveIncomeMember2021-01-012021-06-300001099800us-gaap:AccumulatedNetUnrealizedInvestmentGainLossMemberus-gaap:ReclassificationOutOfAccumulatedOtherComprehensiveIncomeMember2020-01-012020-06-300001099800us-gaap:StockCompensationPlanMember2021-04-012021-06-300001099800us-gaap:StockCompensationPlanMember2020-04-012020-06-300001099800us-gaap:StockCompensationPlanMember2021-01-012021-06-300001099800us-gaap:StockCompensationPlanMember2020-01-012020-06-300001099800us-gaap:OperatingSegmentsMemberew:UnitedStatesSegmentMember2021-04-012021-06-300001099800us-gaap:OperatingSegmentsMemberew:UnitedStatesSegmentMember2020-04-012020-06-300001099800us-gaap:OperatingSegmentsMemberew:UnitedStatesSegmentMember2021-01-012021-06-300001099800us-gaap:OperatingSegmentsMemberew:UnitedStatesSegmentMember2020-01-012020-06-300001099800us-gaap:OperatingSegmentsMemberew:EuropeSegmentMember2021-04-012021-06-300001099800us-gaap:OperatingSegmentsMemberew:EuropeSegmentMember2020-04-012020-06-300001099800us-gaap:OperatingSegmentsMemberew:EuropeSegmentMember2021-01-012021-06-300001099800us-gaap:OperatingSegmentsMemberew:EuropeSegmentMember2020-01-012020-06-300001099800ew:JapanSegmentMemberus-gaap:OperatingSegmentsMember2021-04-012021-06-300001099800ew:JapanSegmentMemberus-gaap:OperatingSegmentsMember2020-04-012020-06-300001099800ew:JapanSegmentMemberus-gaap:OperatingSegmentsMember2021-01-012021-06-300001099800ew:JapanSegmentMemberus-gaap:OperatingSegmentsMember2020-01-012020-06-300001099800us-gaap:OperatingSegmentsMemberew:RestOfWorldSegmentMember2021-04-012021-06-300001099800us-gaap:OperatingSegmentsMemberew:RestOfWorldSegmentMember2020-04-012020-06-300001099800us-gaap:OperatingSegmentsMemberew:RestOfWorldSegmentMember2021-01-012021-06-300001099800us-gaap:OperatingSegmentsMemberew:RestOfWorldSegmentMember2020-01-012020-06-300001099800us-gaap:OperatingSegmentsMember2021-04-012021-06-300001099800us-gaap:OperatingSegmentsMember2020-04-012020-06-300001099800us-gaap:OperatingSegmentsMember2021-01-012021-06-300001099800us-gaap:OperatingSegmentsMember2020-01-012020-06-300001099800us-gaap:MaterialReconcilingItemsMember2021-04-012021-06-300001099800us-gaap:MaterialReconcilingItemsMember2020-04-012020-06-300001099800us-gaap:MaterialReconcilingItemsMember2021-01-012021-06-300001099800us-gaap:MaterialReconcilingItemsMember2020-01-012020-06-300001099800us-gaap:CorporateNonSegmentMember2021-04-012021-06-300001099800us-gaap:CorporateNonSegmentMember2020-04-012020-06-300001099800us-gaap:CorporateNonSegmentMember2021-01-012021-06-300001099800us-gaap:CorporateNonSegmentMember2020-01-012020-06-300001099800country:US2021-04-012021-06-300001099800country:US2020-04-012020-06-300001099800country:US2021-01-012021-06-300001099800country:US2020-01-012020-06-300001099800srt:EuropeMember2021-04-012021-06-300001099800srt:EuropeMember2020-04-012020-06-300001099800srt:EuropeMember2021-01-012021-06-300001099800srt:EuropeMember2020-01-012020-06-300001099800country:JP2021-04-012021-06-300001099800country:JP2020-04-012020-06-300001099800country:JP2021-01-012021-06-300001099800country:JP2020-01-012020-06-300001099800ew:RestOfWorldMember2021-04-012021-06-300001099800ew:RestOfWorldMember2020-04-012020-06-300001099800ew:RestOfWorldMember2021-01-012021-06-300001099800ew:RestOfWorldMember2020-01-012020-06-300001099800ew:TranscatheterAorticValveReplacementMember2021-04-012021-06-300001099800ew:TranscatheterAorticValveReplacementMember2020-04-012020-06-300001099800ew:TranscatheterAorticValveReplacementMember2021-01-012021-06-300001099800ew:TranscatheterAorticValveReplacementMember2020-01-012020-06-300001099800ew:TranscatheterMitralAndTricuspidTherapiesMember2021-04-012021-06-300001099800ew:TranscatheterMitralAndTricuspidTherapiesMember2020-04-012020-06-300001099800ew:TranscatheterMitralAndTricuspidTherapiesMember2021-01-012021-06-300001099800ew:TranscatheterMitralAndTricuspidTherapiesMember2020-01-012020-06-300001099800ew:SurgicalHeartValveTherapyMember2021-04-012021-06-300001099800ew:SurgicalHeartValveTherapyMember2020-04-012020-06-300001099800ew:SurgicalHeartValveTherapyMember2021-01-012021-06-300001099800ew:SurgicalHeartValveTherapyMember2020-01-012020-06-300001099800ew:CriticalCareMember2021-04-012021-06-300001099800ew:CriticalCareMember2020-04-012020-06-300001099800ew:CriticalCareMember2021-01-012021-06-300001099800ew:CriticalCareMember2020-01-012020-06-300001099800country:US2021-06-300001099800country:US2020-12-310001099800srt:EuropeMember2021-06-300001099800srt:EuropeMember2020-12-310001099800country:JP2021-06-300001099800country:JP2020-12-310001099800ew:RestOfWorldMember2021-06-300001099800ew:RestOfWorldMember2020-12-31
UNITED STATES
SECURITIES AND EXCHANGE COMMISSION
Washington, D.C. 20549
FORM 10-Q
(Mark One)
| | | | | |
| ☒ | QUARTERLY REPORT PURSUANT TO SECTION 13 OR 15(d) OF THE SECURITIES EXCHANGE ACT OF 1934 |
For the Quarterly Period Ended June 30, 2021
or
| | | | | |
| ☐ | TRANSITION REPORT PURSUANT TO SECTION 13 OR 15(d) OF THE SECURITIES EXCHANGE ACT OF 1934 |
For the transition period from to
Commission file number 1-15525
EDWARDS LIFESCIENCES CORPORATION
(Exact name of registrant as specified in its charter)
| | | | | | | | | | | | | | |
Delaware | | 36-4316614 | |
(State or other jurisdiction of incorporation or organization) | | (I.R.S. Employer Identification No.) | |
One Edwards Way
Irvine, California 92614
(Address of principal executive offices and zip code)
(949) 250-2500
(Registrant's telephone number, including area code)
Securities registered pursuant to Section 12(b) of the Act:
| | | | | | | | |
| Title of each class | Trading Symbol(s) | Name of each exchange on which registered |
| Common Stock, par value $1.00 per share | EW | New York Stock Exchange |
Indicate by check mark whether the registrant (1) has filed all reports required to be filed by Section 13 or 15(d) of the Securities Exchange Act of 1934 during the preceding 12 months (or for such shorter period that the registrant was required to file such reports), and (2) has been subject to such filing requirements for the past 90 days. Yes ☒ No ☐
Indicate by check mark whether the registrant has submitted electronically every Interactive Data File required to be submitted pursuant to Rule 405 of Regulation S-T (§232.405 of this chapter) during the preceding 12 months (or for such shorter period that the registrant was required to submit such files). Yes ☒ No ☐
Indicate by check mark whether the registrant is a large accelerated filer, an accelerated filer, a non-accelerated filer, a smaller reporting company, or an emerging growth company. See the definitions of "large accelerated filer," "accelerated filer," "smaller reporting company," and "emerging growth company" in Rule 12b-2 of the Exchange Act.
| | | | | | | | | | | | | | | | | | | | | | | | | | | | | |
| Large accelerated filer | ☒ | Accelerated filer | ☐ | Non-accelerated filer | ☐ | Smaller reporting company | ☐ | Emerging growth company | ☐ |
If an emerging growth company, indicate by check mark if the registrant has elected not to use the extended transition period for complying with any new or revised financial accounting standards provided pursuant to Section 13(a) of the Exchange Act. ☐
Indicate by check mark whether the registrant is a shell company (as defined in Rule 12b-2 of the Exchange Act). Yes ☐ No ☒
The number of shares outstanding of the registrant's common stock, $1.00 par value, as of July 26, 2021 was 623,327,843.
EDWARDS LIFESCIENCES CORPORATION
FORM 10-Q
For the quarterly period ended June 30, 2021
TABLE OF CONTENTS
NOTE REGARDING FORWARD-LOOKING STATEMENTS
This report contains forward-looking statements within the meaning of Section 27A of the Securities Act of 1933 and Section 21E of the Securities Exchange Act of 1934. We intend the forward-looking statements contained in this report to be covered by the safe harbor provisions of such Acts. Some statements other than statements of historical fact in this report or referred to or incorporated by reference into this report are "forward-looking statements" for purposes of these sections. These statements include, among other things, the expected impact of COVID-19 on our business, any predictions, opinions, expectations, plans, strategies, objectives and any statements of assumptions underlying any of the foregoing relating to the company's current and future business and operations, including, but not limited to, financial matters, development activities, clinical trials and regulatory matters, manufacturing and supply operations, and product sales and demand. These statements can sometimes be identified by the use of the forward-looking words such as "may," "believe," "will," "expect," "project," "estimate," "should," "anticipate," "plan," "goal," "continue," "seek," "pro forma," "forecast," "intend," "guidance," "optimistic," "aspire," "confident," other forms of these words or similar words or expressions or the negative thereof. Statements of past performance, efforts, or results about which inferences or assumptions may be made can also be forward-looking statements and are not indicative of future performance or results; these statements can be identified by the use of words such as "preliminary," "initial," diligence," "industry-leading," "compliant," "indications," or "early feedback" or other forms of these words or similar words or expressions or the negative thereof. These forward-looking statements are subject to substantial risks and uncertainties that could cause our results or future business, financial condition, results of operations or performance to differ materially from our historical results or experiences or those expressed or implied in any forward-looking statements contained in this report. These risks and uncertainties include, but are not limited to: uncertainties regarding the severity and duration of the COVID-19 pandemic and its impact on our business and the economy generally, clinical trial or commercial results or new product approvals and therapy adoption; inability or failure to comply with regulations; unpredictability of product launches; competitive dynamics; changes to reimbursement for the company's products; the company’s success in developing new products and avoiding manufacturing and quality issues; the impact of currency exchange rates; the timing or results of research and development and clinical trials; unanticipated actions by the U.S. Food and Drug Administration and other regulatory agencies; unexpected impacts or expenses of litigation or internal or government investigations; and other risks detailed under “Risk Factors” in our annual report on Form 10-K for the year ended December 31, 2020, as such risks and uncertainties may be amended, supplemented or superseded from time to time by our subsequent reports on Forms 10-Q and 8-K we file with the Securities and Exchange Commission. These forward-looking statements speak only as of the date on which they are made and we do not undertake any obligation to update any forward-looking statement to reflect events or circumstances after the date of the statement. If we do update or correct one or more of these statements, investors and others should not conclude that we will make additional updates or corrections.
Unless otherwise indicated or otherwise required by the context, the terms "we," "our," "it," "its," "Company," "Edwards," and "Edwards Lifesciences" refer to Edwards Lifesciences Corporation and its subsidiaries.
Part I. Financial Information
Item 1. Financial Statements
EDWARDS LIFESCIENCES CORPORATION
CONSOLIDATED CONDENSED BALANCE SHEETS
(in millions, except par value; unaudited)
| | | | | | | | | | | |
| | June 30,
2021 | | December 31,
2020 |
| ASSETS | | | |
| Current assets | | | |
| Cash and cash equivalents | $ | 1,312.8 | | | $ | 1,183.2 | |
| Short-term investments (Note 3) | 248.4 | | | 219.4 | |
Accounts receivable, net of allowances of $9.0 and $9.6, respectively | 640.5 | | | 514.6 | |
| Other receivables | 59.8 | | | 88.2 | |
| Inventories (Note 2) | 759.5 | | | 802.3 | |
| | | |
| Prepaid expenses | 68.6 | | | 75.1 | |
| Other current assets | 233.3 | | | 208.2 | |
| Total current assets | 3,322.9 | | | 3,091.0 | |
| Long-term investments (Note 3) | 1,014.2 | | | 801.6 | |
| Property, plant, and equipment, net | 1,445.8 | | | 1,395.2 | |
| Operating lease right-of-use assets | 84.6 | | | 94.2 | |
| Goodwill | 1,171.8 | | | 1,173.2 | |
| Other intangible assets, net | 327.0 | | | 331.4 | |
| Deferred income taxes | 190.5 | | | 230.9 | |
| Other assets | 105.3 | | | 119.6 | |
| Total assets | $ | 7,662.1 | | | $ | 7,237.1 | |
| LIABILITIES AND STOCKHOLDERS' EQUITY | | | |
| Current liabilities | | | |
| Accounts payable and accrued liabilities (Note 2) | $ | 861.1 | | | $ | 866.7 | |
| Operating lease liabilities | 25.1 | | | 27.2 | |
| | | |
| | | |
Total current liabilities | 886.2 | | | 893.9 | |
| Long-term debt | 595.4 | | | 595.0 | |
| Contingent consideration liabilities (Note 4) | 79.0 | | | 186.1 | |
| Taxes payable | 190.2 | | | 215.3 | |
| Operating lease liabilities | 63.7 | | | 72.7 | |
| Uncertain tax positions | 234.2 | | | 214.4 | |
| Litigation settlement accrual | 211.7 | | | 233.0 | |
| Other liabilities | 268.4 | | | 252.4 | |
| Commitments and contingencies (Note 8) | | | |
| Stockholders' equity | | | |
Preferred stock, $0.01 par value, authorized 50.0 shares, no shares outstanding | — | | | — | |
Common stock, $1.00 par value, 1,050.0 shares authorized, 640.1 and 636.4 shares issued, and 623.1 and 624.3 shares outstanding, respectively | 640.1 | | | 636.4 | |
| Additional paid-in capital | 1,578.7 | | | 1,438.1 | |
| Retained earnings | 5,392.7 | | | 4,565.0 | |
| Accumulated other comprehensive loss (Note 9) | (159.6) | | | (161.1) | |
Treasury stock, at cost, 17.0 and 12.1 shares, respectively | (2,318.6) | | | (1,904.1) | |
| Total stockholders' equity | 5,133.3 | | | 4,574.3 | |
| Total liabilities and stockholders' equity | $ | 7,662.1 | | | $ | 7,237.1 | |
The accompanying notes are an integral part of these
consolidated condensed financial statements.
EDWARDS LIFESCIENCES CORPORATION
CONSOLIDATED CONDENSED STATEMENTS OF OPERATIONS
(in millions, except per share information; unaudited)
| | | | | | | | | | | | | | | | | | | | | | | |
| | Three Months Ended
June 30, | | Six Months Ended
June 30, |
| | 2021 | | 2020 | | 2021 | | 2020 |
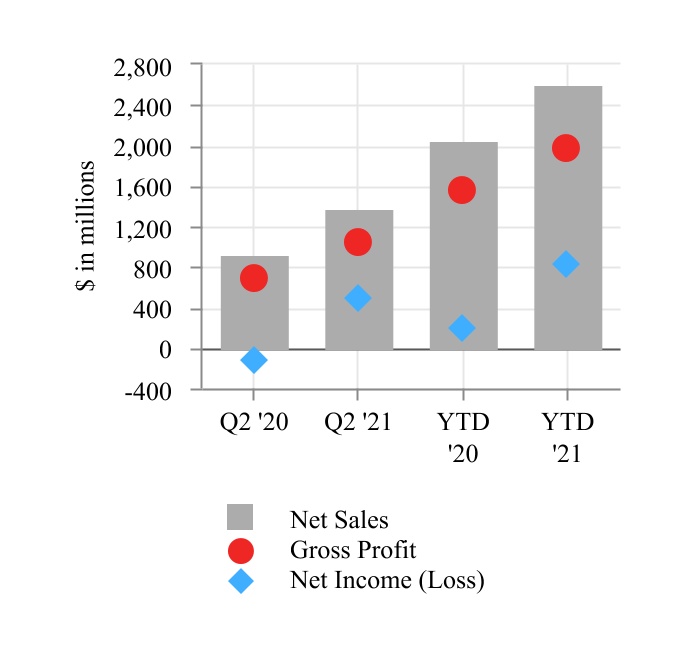
| Net sales | $ | 1,376.0 | | | $ | 925.0 | | | $ | 2,592.6 | | | $ | 2,053.7 | |
| Cost of sales | 334.3 | | | 238.2 | | | 627.7 | | | 503.3 | |
| Gross profit | 1,041.7 | | | 686.8 | | | 1,964.9 | | | 1,550.4 | |
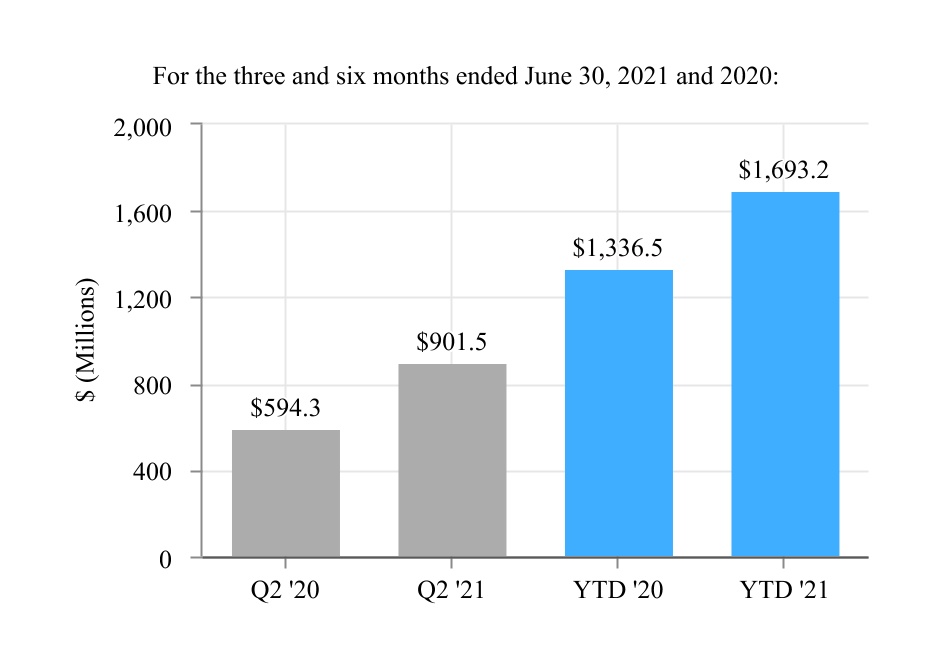
| Selling, general, and administrative expenses | 374.5 | | | 274.9 | | | 705.3 | | | 582.7 | |
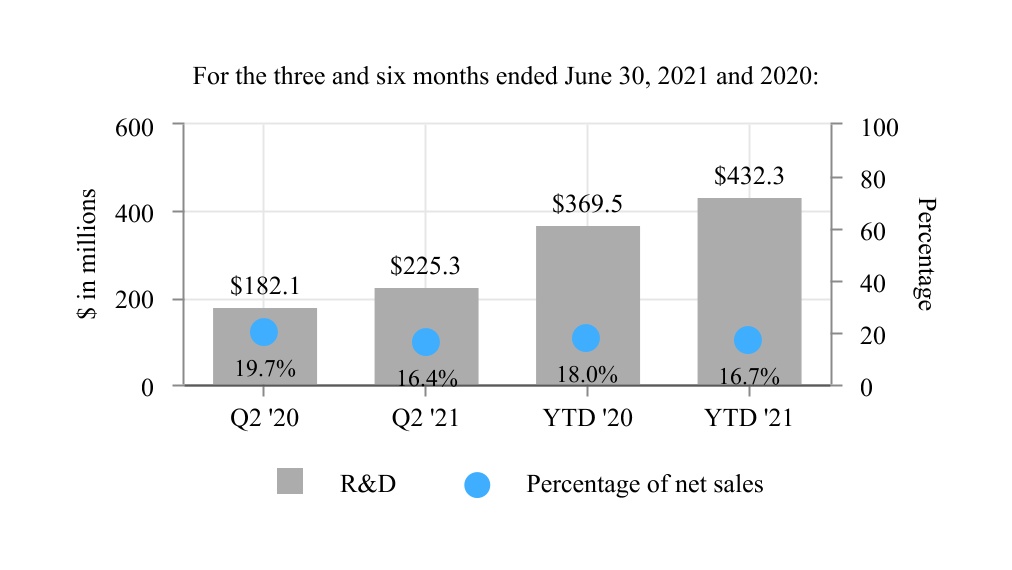
| Research and development expenses | 225.3 | | | 182.1 | | | 432.3 | | | 369.5 | |
| Intellectual property litigation expenses, net | 2.4 | | | 379.9 | | | 8.8 | | | 392.4 | |
| Change in fair value of contingent consideration liabilities (Note 4) | (102.6) | | | 19.6 | | | (107.1) | | | 17.4 | |
| | | | | | | |
| | | | | | | |
| Operating income (loss) | 542.1 | | | (169.7) | | | 925.6 | | | 188.4 | |
| Interest expense (income), net | 1.0 | | | (1.8) | | | 0.7 | | | (6.3) | |
| | | | | | | |
| Other (income) expense, net | (4.4) | | | 0.3 | | | (9.9) | | | (1.6) | |
| Income (loss) before provision for income taxes | 545.5 | | | (168.2) | | | 934.8 | | | 196.3 | |
| Provision for (benefit from) income taxes | 56.0 | | | (46.3) | | | 107.1 | | | 7.6 | |
| Net income (loss) | $ | 489.5 | | | $ | (121.9) | | | $ | 827.7 | | | $ | 188.7 | |
| | | | | | | |
Share information (Note 10) | | | | | | | |
| Earnings (loss) per share: | | | | | | | |
| Basic | $ | 0.79 | | | $ | (0.20) | | | $ | 1.33 | | | $ | 0.30 | |
| Diluted | $ | 0.78 | | | $ | (0.20) | | | $ | 1.31 | | | $ | 0.30 | |
| Weighted-average number of common shares outstanding: | | | | | | | |
| Basic | 622.3 | | | 620.3 | | | 622.7 | | | 622.5 | |
| Diluted | 629.9 | | | 620.3 | | | 630.6 | | | 627.7 | |
The accompanying notes are an integral part of these
consolidated condensed financial statements.
EDWARDS LIFESCIENCES CORPORATION
CONSOLIDATED CONDENSED STATEMENTS OF COMPREHENSIVE INCOME (LOSS)
(in millions; unaudited)
| | | | | | | | | | | | | | | | | | | | | | | |
| | Three Months Ended
June 30, | | Six Months Ended
June 30, |
| | 2021 | | 2020 | | 2021 | | 2020 |
| Net income (loss) | $ | 489.5 | | | $ | (121.9) | | | $ | 827.7 | | | $ | 188.7 | |
| Other comprehensive income, net of tax (Note 9): | | | | | | | |
| Foreign currency translation adjustments | 10.5 | | | 1.7 | | | (21.7) | | | 4.0 | |
| Unrealized gain (loss) on hedges | 2.4 | | | (7.3) | | | 26.9 | | | (0.7) | |
| Defined benefit pension plans | (0.2) | | | — | | | 0.1 | | | (0.2) | |
| Unrealized (loss) gain on available-for-sale investments | (1.0) | | | 11.3 | | | (5.8) | | | 6.7 | |
| Reclassification of net realized investment loss to earnings | 1.1 | | | 0.2 | | | 2.0 | | | 0.1 | |
| Other comprehensive income | 12.8 | | | 5.9 | | | 1.5 | | | 9.9 | |
| Comprehensive income (loss) | $ | 502.3 | | | $ | (116.0) | | | $ | 829.2 | | | $ | 198.6 | |
The accompanying notes are an integral part of these
consolidated condensed financial statements.
EDWARDS LIFESCIENCES CORPORATION
CONSOLIDATED CONDENSED STATEMENTS OF CASH FLOWS
(in millions; unaudited) | | | | | | | | | | | |
| | Six Months Ended
June 30, |
| | 2021 | | 2020 |
| Cash flows from operating activities | | | |
| Net income | $ | 827.7 | | | $ | 188.7 | |
| Adjustments to reconcile net income to net cash provided by operating activities: | | | |
| Depreciation and amortization | 68.2 | | | 49.0 | |
| Non-cash operating lease cost | 14.3 | | | 13.3 | |
| Stock-based compensation (Note 6) | 58.5 | | | 48.7 | |
| | | |
| | | |
| | | |
| Change in fair value of contingent consideration liabilities (Note 4) | (107.1) | | | 17.4 | |
| | | |
| Deferred income taxes | 16.2 | | | (39.2) | |
| | | |
| Other | (13.2) | | | 4.8 | |
| Changes in operating assets and liabilities: | | | |
| Accounts and other receivables, net | (135.9) | | | 21.5 | |
| Inventories | 17.5 | | | (99.2) | |
| Accounts payable and accrued liabilities | 84.8 | | | (135.3) | |
| Income taxes | 23.2 | | | 9.1 | |
| Prepaid expenses and other current assets | 0.4 | | | — | |
| Litigation settlement accrual | 3.7 | | | 367.9 | |
| Other | (31.7) | | | (8.3) | |
| Net cash provided by operating activities | 826.6 | | | 438.4 | |
| Cash flows from investing activities | | | |
| Capital expenditures | (175.3) | | | (190.5) | |
| Purchases of held-to-maturity investments (Note 3) | (35.0) | | | (112.0) | |
| Proceeds from held-to-maturity investments (Note 3) | 50.0 | | | 212.2 | |
| Purchases of available-for-sale investments (Note 3) | (376.5) | | | (275.7) | |
| Proceeds from available-for-sale investments (Note 3) | 168.5 | | | 255.0 | |
| | | |
| | | |
| | | |
| | | |
| | | |
| Payment for acquisition option (Note 3) | (5.7) | | | (10.0) | |
| Issuances of notes receivable | (3.6) | | | (21.9) | |
| Collections of notes receivable | 10.0 | | | — | |
| Other | (11.6) | | | (2.0) | |
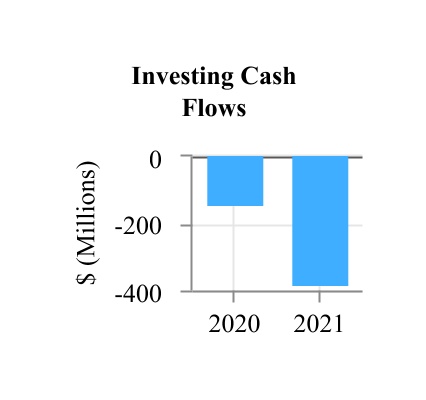
| Net cash used in investing activities | (379.2) | | | (144.9) | |
| Cash flows from financing activities | | | |
| Proceeds from issuance of debt | 14.0 | | | 10.6 | |
| Payments on debt and finance lease obligations | (15.6) | | | (11.8) | |
| Purchases of treasury stock | (414.5) | | | (623.8) | |
| | | |
| | | |
| Proceeds from stock plans | 85.8 | | | 67.3 | |
| | | |
| Other | (3.0) | | | (4.6) | |
| Net cash used in financing activities | (333.3) | | | (562.3) | |
| Effect of currency exchange rate changes on cash, cash equivalents, and restricted cash | 11.6 | | | (6.6) | |
| Net increase (decrease) in cash, cash equivalents, and restricted cash | 125.7 | | | (275.4) | |
| Cash, cash equivalents, and restricted cash at beginning of period | 1,200.2 | | | 1,184.4 | |
| Cash, cash equivalents, and restricted cash at end of period | $ | 1,325.9 | | | $ | 909.0 | |
| | | |
The accompanying notes are an integral part of these
consolidated condensed financial statements.
EDWARDS LIFESCIENCES CORPORATION
CONSOLIDATED CONDENSED STATEMENTS OF STOCKHOLDERS' EQUITY
(in millions; unaudited)
| | | | | | | | | | | | | | | | | | | | | | | | | | | | | | | | | | | | | | | | | | | | | | | |
| | Common Stock | | Treasury Stock | | | | | | | | |
| | Shares | | Par Value | | Shares | | Amount | | Additional Paid-in Capital | | Retained Earnings | | Accumulated Other Comprehensive Loss | | Total Stockholders' Equity |
| Balance at December 31, 2020 | 636.4 | | | $ | 636.4 | | | 12.1 | | | $ | (1,904.1) | | | $ | 1,438.1 | | | $ | 4,565.0 | | | $ | (161.1) | | | $ | 4,574.3 | |
| Net income | | | | | | | | | | | 338.2 | | | | | 338.2 | |
| Other comprehensive loss, net of tax | | | | | | | | | | | | | (11.3) | | | (11.3) | |
| Common stock issued under stock plans | 1.1 | | | 1.1 | | | | | | | 30.5 | | | | | | | 31.6 | |
| Stock-based compensation expense | | | | | | | | | 28.2 | | | | | | | 28.2 | |
| | | | | | | | | | | | | | | |
| Purchases of treasury stock | | | | | 3.6 | | | (302.6) | | | | | | | | | (302.6) | |
| | | | | | | | | | | | | | | |
| | | | | | | | | | | | | | | |
Balance at March 31, 2021 | 637.5 | | | $ | 637.5 | | | 15.7 | | | $ | (2,206.7) | | | $ | 1,496.8 | | | $ | 4,903.2 | | | $ | (172.4) | | | $ | 4,658.4 | |
| Net income | | | | | | | | | | | 489.5 | | | | | 489.5 | |
| Other comprehensive income, net of tax | | | | | | | | | | | | | 12.8 | | | 12.8 | |
Common stock issued under equity plans | 2.6 | | | 2.6 | | | | | | | 51.6 | | | | | | | 54.2 | |
| Stock-based compensation expense | | | | | | | | | 30.3 | | | | | | | 30.3 | |
| | | | | | | | | | | | | | | |
| Purchases of treasury stock | | | | | 1.3 | | | (111.9) | | | | | | | | | (111.9) | |
| | | | | | | | | | | | | | | |
| | | | | | | | | | | | | | | |
Balance at June 30, 2021 | 640.1 | | | $ | 640.1 | | | 17.0 | | | $ | (2,318.6) | | | $ | 1,578.7 | | | $ | 5,392.7 | | | $ | (159.6) | | | $ | 5,133.3 | |
| | | | | | | | | | | | | | | |
| | | | | | | | | | | | | | | |
| | | | | | | | | | | | | | | |
| | | | | | | | | | | | | | | |
| | | | | | | | | | | | | | | |
| | | | | | | | | | | | | | | |
| | | | | | | | | | | | | | | |
| | | | | | | | | | | | | | | |
| | | | | | | | | | | | | | | |
The accompanying notes are an integral part of these
consolidated condensed financial statements.
EDWARDS LIFESCIENCES CORPORATION
CONSOLIDATED CONDENSED STATEMENTS OF STOCKHOLDERS' EQUITY
(in millions; unaudited)
| | | | | | | | | | | | | | | | | | | | | | | | | | | | | | | | | | | | | | | | | | | | | | | |
| | Common Stock | | Treasury Stock | | | | | | | | |
| | Shares | | Par Value | | Shares | | Amount | | Additional Paid-in Capital | | Retained Earnings | | Accumulated Other Comprehensive Loss | | Total Stockholders' Equity |
| Balance at December 31, 2019 | 218.1 | | | $ | 218.1 | | | 9.0 | | | $ | (1,278.7) | | | $ | 1,623.3 | | | $ | 3,741.6 | | | $ | (156.0) | | | $ | 4,148.3 | |
| Net income | | | | | | | | | | | 310.6 | | | | | 310.6 | |
| Other comprehensive income, net of tax | | | | | | | | | | | | | 4.0 | | | 4.0 | |
| Common stock issued under stock plans | 0.4 | | | 0.4 | | | | | | | 28.7 | | | | | | | 29.1 | |
| Stock-based compensation expense | | | | | | | | | 23.9 | | | | | | | 23.9 | |
| | | | | | | | | | | | | | | |
| Purchases of treasury stock | | | | | 3.0 | | | (614.8) | | | | | | | | | (614.8) | |
| | | | | | | | | | | | | | | |
Balance at March 31, 2020 | 218.5 | | | $ | 218.5 | | | 12.0 | | | $ | (1,893.5) | | | $ | 1,675.9 | | | $ | 4,052.2 | | | $ | (152.0) | | | $ | 3,901.1 | |
| Net loss | | | | | | | | | | | (121.9) | | | | | (121.9) | |
| Other comprehensive income, net of tax | | | | | | | | | | | | | 5.9 | | | 5.9 | |
Common stock issued under equity plans | 1.2 | | | 1.2 | | | | | | | 37.0 | | | | | | | 38.2 | |
| Stock-based compensation expense | | | | | | | | | 24.8 | | | | | | | 24.8 | |
| | | | | | | | | | | | | | | |
| Purchases of treasury stock | | | | | 0.1 | | | (9.0) | | | — | | | | | | | (9.0) | |
| | | | | | | | | | | | | | | |
| Stock issued to effect stock split | 413.8 | | | 413.8 | | | | | | | (413.8) | | | | | | | — | |
Balance at June 30, 2020 | 633.5 | | | $ | 633.5 | | | 12.1 | | | $ | (1,902.5) | | | $ | 1,323.9 | | | $ | 3,930.3 | | | $ | (146.1) | | | $ | 3,839.1 | |
| | | | | | | | | | | | | | | |
| | | | | | | | | | | | | | | |
| | | | | | | | | | | | | | | |
| | | | | | | | | | | | | | | |
| | | | | | | | | | | | | | | |
| | | | | | | | | | | | | | | |
| | | | | | | | | | | | | | | |
| | | | | | | | | | | | | | | |
The accompanying notes are an integral part of these
consolidated condensed financial statements.
1. BASIS OF PRESENTATION
The accompanying interim consolidated condensed financial statements and related disclosures have been prepared pursuant to the rules and regulations of the Securities and Exchange Commission ("SEC") and should be read in conjunction with the consolidated financial statements and notes included in Edwards Lifesciences' Annual Report on Form 10-K for the year ended December 31, 2020. Certain information and footnote disclosures normally included in financial statements prepared in accordance with generally accepted accounting principles in the United States of America ("GAAP") have been condensed or omitted.
The preparation of financial statements in conformity with GAAP requires management to make estimates and assumptions that affect the amounts reported in the financial statements. Actual results could differ from those estimates. In particular, the COVID-19 pandemic has adversely impacted, and may further adversely impact, nearly all aspects of our business and markets, including our workforce and the operations of our customers, suppliers, and business partners. The full extent to which the pandemic will directly or indirectly impact the Company's business, results of operations and financial condition, including sales, expenses, manufacturing, clinical trials, research and development costs, reserves and allowances, fair value measurements, asset impairment charges, contingent consideration obligations, and the effectiveness of the Company's hedging instruments, will depend on future developments that are highly uncertain and difficult to predict. These developments include, but are not limited to, the duration and spread of the outbreak (including new and more contagious
variants of COVID-19), its severity, the actions to contain the virus or address its impact, the timing, distribution, public acceptance and efficacy of vaccines and other treatments, U.S. and foreign government actions to respond to the reduction in global economic activity, and how quickly and to what extent normal economic and operating conditions can resume.
In the opinion of management, the interim consolidated condensed financial statements reflect all adjustments necessary for a fair statement of the results for the interim periods presented. All such adjustments are of a normal, recurring nature. The results of operations for the interim periods are not necessarily indicative of the results of operations to be expected for the full year.
Certain reclassifications have been made to the prior year's consolidated condensed financial statements to conform to the current year presentation.
2. OTHER CONSOLIDATED FINANCIAL STATEMENT DETAILS
Composition of Certain Financial Statement Captions
(in millions)
Components of selected captions in the consolidated condensed balance sheets consisted of the following:
| | | | | | | | | | | |
| June 30, 2021 | | December 31, 2020 |
| Inventories | | | |
| Raw materials | $ | 131.4 | | | $ | 136.7 | |
| Work in process | 151.0 | | | 140.0 | |
| Finished products | 477.1 | | | 525.6 | |
| $ | 759.5 | | | $ | 802.3 | |
At June 30, 2021 and December 31, 2020, $127.0 million and $130.0 million, respectively, of the Company's finished products inventories were held on consignment.
| | | | | | | | | | | |
| June 30, 2021 | | December 31, 2020 |
| Accounts payable and accrued liabilities | | | |
| Accounts payable | $ | 144.6 | | | $ | 196.5 | |
| Employee compensation and withholdings | 262.2 | | | 236.7 | |
| Taxes payable | 23.2 | | | 18.6 | |
| Property, payroll, and other taxes | 62.8 | | | 49.7 | |
| Research and development accruals | 62.0 | | | 52.3 | |
| Accrued rebates | 74.0 | | | 67.2 | |
| Fair value of derivatives | 7.9 | | | 39.3 | |
| Accrued marketing expenses | 16.2 | | | 14.3 | |
| Legal and insurance | 75.8 | | | 60.8 | |
| Accrued relocation costs | 24.6 | | | 21.0 | |
| Accrued professional services | 7.6 | | | 7.6 | |
| Accrued realignment reserves | 17.8 | | | 14.5 | |
| | | |
| Other accrued liabilities | 82.4 | | | 88.2 | |
| $ | 861.1 | | | $ | 866.7 | |
Supplemental Cash Flow Information
(in millions)
| | | | | | | | | | | |
| Six Months Ended
June 30, |
| 2021 | | 2020 |
| Cash paid during the year for: | | | |
| | | |
| Amounts included in the measurement of lease liabilities: | | | |
Operating cash flows from operating leases | $ | 16.3 | | | $ | 14.1 | |
| Non-cash investing and financing transactions: | | | |
| | | |
| | | |
| | | |
| Right-of-use assets obtained in exchange for new lease liabilities | $ | 5.4 | | | $ | 19.5 | |
| Capital expenditures accruals | $ | 25.1 | | | $ | 41.7 | |
| | | |
| Conversion of notes receivable to equity investment | $ | 21.5 | | | $ | 4.5 | |
Cash, Cash Equivalents, and Restricted Cash
(in millions)
| | | | | | | | | | | | | | |
| June 30, 2021 | | December 31, 2020 | |
| Cash and cash equivalents | $ | 1,312.8 | | | $ | 1,183.2 | | |
| Restricted cash included in other current assets | 12.8 | | | 16.6 | | |
| Restricted cash included in other assets | 0.3 | | | 0.4 | | |
| Total cash, cash equivalents, and restricted cash | $ | 1,325.9 | | | $ | 1,200.2 | | |
Amounts included in restricted cash primarily represent funds placed in escrow related to litigation and real estate purchases.
3. INVESTMENTS
Debt Securities
Investments in debt securities at the end of each period were as follows (in millions):
| | | | | | | | | | | | | | | | | | | | | | | | | | | | | | | | | | | | | | | | | | | | | | | |
| | June 30, 2021 | | December 31, 2020 |
| Held-to-maturity | Amortized Cost | | Gross Unrealized Gains | | Gross Unrealized Losses | | Fair Value | | Amortized Cost | | Gross Unrealized Gains | | Gross Unrealized Losses | Fair Value |
| Bank time deposits | $ | 35.0 | | | $ | — | | | $ | — | | | $ | 35.0 | | | $ | 50.0 | | | $ | — | | | $ | — | | | $ | 50.0 | |
| | | | | | | | | | | | | | | |
| | | | | | | | | | | | | | | |
| | | | | | | | | | | | | | | |
| | | | | | | | | | | | | | | |
| | | | | | | | | | | | | | | |
| | | | | | | | | | | | | | | |
| | | | | | | | | | | | | | | |
| | | | | | | | | | | | | | | |
| Available-for-sale | | | | | | | | | | | | | | | |
| Bank time deposits | $ | 3.0 | | | $ | — | | | $ | — | | | $ | 3.0 | | | $ | 24.1 | | | $ | — | | | $ | — | | | $ | 24.1 | |
| Commercial paper | 13.2 | | | — | | | — | | | 13.2 | | | — | | | — | | | — | | | — | |
U.S. government and agency securities | 141.7 | | | 1.4 | | | (0.2) | | | 142.9 | | | 147.0 | | | 2.2 | | | — | | | 149.2 | |
| | | | | | | | | | | | | | | |
| Asset-backed securities | 211.5 | | | 1.2 | | | (0.2) | | | 212.5 | | | 149.6 | | | 1.9 | | | — | | | 151.5 | |
| Corporate debt securities | 767.4 | | | 5.0 | | | (0.8) | | | 771.6 | | | 600.8 | | | 7.5 | | | — | | | 608.3 | |
| Municipal securities | 2.8 | | | — | | | — | | | 2.8 | | | 2.8 | | | — | | | — | | | 2.8 | |
| Total | $ | 1,139.6 | | | $ | 7.6 | | | $ | (1.2) | | | $ | 1,146.0 | | | $ | 924.3 | | | $ | 11.6 | | | $ | — | | | $ | 935.9 | |
The cost and fair value of investments in debt securities, by contractual maturity, as of June 30, 2021, were as follows:
| | | | | | | | | | | | | | | | | | | | | | | |
| Held-to-Maturity | | Available-for-Sale |
| | Amortized Cost | | Fair Value | | Amortized Cost | | Fair Value |
| | (in millions) |
| Due in 1 year or less | $ | 35.0 | | | $ | 35.0 | | | $ | 212.1 | | | $ | 213.4 | |
| Due after 1 year through 5 years | — | | | — | | | 663.6 | | | 667.1 | |
| Due after 5 years through 10 years | — | | | — | | | 10.2 | | | 10.4 | |
| | | | | | | |
| Instruments not due at a single maturity date | — | | | — | | | 253.7 | | | 255.1 | |
| $ | 35.0 | | | $ | 35.0 | | | $ | 1,139.6 | | | $ | 1,146.0 | |
Actual maturities may differ from the contractual maturities due to call or prepayment rights.
The following table presents gross unrealized losses and fair values for those investments that were in an unrealized loss position as of June 30, 2021, aggregated by investment category and the length of time that individual securities have been in a continuous loss position (in millions):
| | | | | | | | | | | | | | | | | | | | | | | | | | | | | | | | | | | |
| June 30, 2021 |
| Less than 12 Months | | 12 Months or Greater | | Total |
| Fair Value | | Gross Unrealized Losses | | Fair Value | | Gross Unrealized Losses | | Fair Value | | Gross Unrealized Losses |
| | | | | | | | | | | |
| | | | | | | | | | | |
| U.S. government and agency securities | $ | 38.1 | | | $ | (0.2) | | | $ | — | | | $ | — | | | $ | 38.1 | | | $ | (0.2) | |
| | | | | | | | | | | |
| Asset-backed securities | 83.4 | | | (0.2) | | | — | | | — | | | 83.4 | | | (0.2) | |
| Corporate debt securities | 260.5 | | | (0.8) | | | — | | | — | | | 260.5 | | | (0.8) | |
| | | | | | | | | | | |
| $ | 382.0 | | | $ | (1.2) | | | $ | — | | | $ | — | | | $ | 382.0 | | | $ | (1.2) | |
There were no investments that were in an unrealized loss position as of December 31, 2020.
Investments in Unconsolidated Entities
The Company has a number of equity investments in privately and publicly held companies. Investments in these unconsolidated entities are recorded in "Long-term Investments" on the consolidated condensed balance sheets, and are as follows:
| | | | | | | | | | | |
| | June 30,
2021 | | December 31,
2020 |
| | (in millions) |
| Equity method investments | | | |
| Carrying value of equity method investments | $ | 8.0 | | | $ | 5.7 | |
| Equity securities | | | |
| Carrying value of non-marketable equity securities | 73.6 | | | 29.4 | |
| Total investments in unconsolidated entities | $ | 81.6 | | | $ | 35.1 | |
Non-marketable equity securities consist of investments in privately held companies without readily determinable fair values, and are reported at cost minus impairment, if any, plus or minus changes resulting from observable price changes in orderly transactions for the identical or similar investment of the same issuer. The Company recorded an upward adjustment of $2.6 million during the six months ended June 30, 2021 based on observable price changes. As of June 30, 2021, the Company had recorded accumulated upward adjustments of $6.4 million based on observable price changes, and accumulated downward adjustments of $2.6 million due to impairments and observable price changes.
In April 2021, the Company recorded $35.9 million related to its investment in a privately-held medical device company (the "investee"), including an initial cash investment in the investee's preferred equity securities and other consideration. Edwards also paid $5.7 million, included in "Other Assets," for an exclusive contingent option to acquire the investee. Edwards may be required to invest up to an additional $9.9 million in the investee's preferred equity securities and up to an additional $21.8 million for the option to acquire the investee, depending on the achievement of certain milestones. Edwards also agreed to loan the investee up to $45 million under a secured promissory note. As of June 30, 2021, there had been no borrowings under this secured promissory note.
The investee is a variable interest entity ("VIE"); however, Edwards has determined that it is not the primary beneficiary of the VIE since Edwards does not have the power to direct the activities of the investee that most significantly impact the investee's economic performance. Edwards accounts for this investment as a non-marketable equity security under the measurement alternative.
During the three and six months ended June 30, 2021, the gross realized gains or losses from sales of available-for-sale investments were not material.
4. FAIR VALUE MEASUREMENTS
Fair value is defined as the price that would be received to sell an asset or paid to transfer a liability in an orderly transaction between market participants. The Company prioritizes the inputs used to determine fair values in one of the following three categories:
Level 1—Quoted market prices in active markets for identical assets or liabilities.
Level 2—Inputs, other than quoted prices in active markets, that are observable, either directly or indirectly.
Level 3—Unobservable inputs that are not corroborated by market data.
In certain cases, the inputs used to measure fair value may fall into different levels of the fair value hierarchy. In such cases, the level in the fair value hierarchy within which the fair value measurement in its entirety falls has been determined based on the lowest level input that is significant to the fair value measurement in its entirety.
The consolidated condensed financial statements include financial instruments for which the fair market value of such instruments may differ from amounts reflected on a historical cost basis. Financial instruments of the Company consist of cash deposits, accounts and other receivables, investments, accounts payable, certain accrued liabilities, and borrowings under a revolving credit agreement. These financial instruments are held at cost, which generally approximates fair value due to their short-term nature.
Financial instruments also include notes payable. As of June 30, 2021, the fair value of the notes payable, based on Level 2 inputs, was $696.0 million.
Assets and Liabilities Measured at Fair Value on a Recurring Basis
The following table summarizes the Company's financial instruments which are measured at fair value on a recurring basis (in millions):
| | | | | | | | | | | | | | | | | | | | | | | |
| June 30, 2021 | Level 1 | | Level 2 | | Level 3 | | Total |
| Assets | | | | | | | |
| Cash equivalents | $ | 77.8 | | | $ | 22.1 | | | $ | — | | | $ | 99.9 | |
| Available-for-sale investments: | | | | | | | |
Bank time deposits | — | | | 3.0 | | | — | | | 3.0 | |
Corporate debt securities | — | | | 771.6 | | | — | | | 771.6 | |
Asset-backed securities | — | | | 212.5 | | | — | | | 212.5 | |
U.S. government and agency securities | 48.2 | | | 94.7 | | | — | | | 142.9 | |
| | | | | | | |
Commercial paper | — | | | 13.2 | | | — | | | 13.2 | |
Municipal securities | — | | | 2.8 | | | — | | | 2.8 | |
| | | | | | | |
| Investments held for deferred compensation plans | 121.5 | | | — | | | — | | | 121.5 | |
| Derivatives | — | | | 32.1 | | | — | | | 32.1 | |
| $ | 247.5 | | | $ | 1,152.0 | | | $ | — | | | $ | 1,399.5 | |
| Liabilities | | | | | | | |
| Derivatives | $ | — | | | $ | 7.9 | | | $ | — | | | $ | 7.9 | |
| Deferred compensation plans | 121.8 | | | — | | | — | | | 121.8 | |
| Contingent consideration liabilities | — | | | — | | | 79.0 | | | 79.0 | |
| Other liability | — | | | — | | | 14.0 | | | 14.0 | |
| $ | 121.8 | | | $ | 7.9 | | | $ | 93.0 | | | $ | 222.7 | |
| December 31, 2020 | | | | | | | |
| Assets | | | | | | | |
| Cash equivalents | $ | 16.2 | | | $ | — | | | $ | — | | | $ | 16.2 | |
| Available-for-sale investments: | | | | | | | |
Bank time deposits | — | | | 24.1 | | | — | | | 24.1 | |
Corporate debt securities | — | | | 608.3 | | | — | | | 608.3 | |
Asset-backed securities | — | | | 151.5 | | | — | | | 151.5 | |
U.S. government and agency securities | 56.9 | | | 92.2 | | | — | | | 149.1 | |
| | | | | | | |
| | | | | | | |
Municipal securities | — | | | 2.8 | | | — | | | 2.8 | |
| | | | | | | |
| Investments held for deferred compensation plans | 111.2 | | | — | | | — | | | 111.2 | |
| Derivatives | — | | | 8.1 | | | — | | | 8.1 | |
| $ | 184.3 | | | $ | 887.0 | | | $ | — | | | $ | 1,071.3 | |
| Liabilities | | | | | | | |
| Derivatives | $ | — | | | $ | 39.3 | | | $ | — | | | $ | 39.3 | |
| Deferred compensation plans | 111.6 | | | — | | | — | | | 111.6 | |
| Contingent consideration liabilities | — | | | — | | | 186.1 | | | 186.1 | |
| $ | 111.6 | | | $ | 39.3 | | | $ | 186.1 | | | $ | 337.0 | |
The following tables summarize the changes in fair value of the contingent consideration and the other liability (in millions):
| | | | | | | | | | | | | | | | | |
| | Contingent Consideration | | Other liability | | Total |
Balance at December 31, 2020 | $ | 186.1 | | | $ | — | | | $ | 186.1 | |
| Additions | — | | | 14.0 | | | 14.0 | |
| | | | | |
| Changes in fair value | (107.1) | | | — | | | (107.1) | |
| | | | | |
| Balance at June 30, 2021 | $ | 79.0 | | | $ | 14.0 | | | $ | 93.0 | |
| | | | | |
| Contingent Consideration | | Other liability | | Total |
Balance at December 31, 2019 | $ | 172.5 | | | $ | — | | | $ | 172.5 | |
| | | | | |
| | | | | |
| Changes in fair value | 17.4 | | | — | | | 17.4 | |
| | | | | |
| Balance at June 30, 2020 | $ | 189.9 | | | $ | — | | | $ | 189.9 | |
During the three months ended June 30, 2021, the contingent consideration liabilities related to certain of the Company's previous business acquisitions was reduced by $105.2 million due to changes in the projected probabilities and timing of milestone achievements and the projected timing of cash inflows.
Cash Equivalents and Available-for-sale Investments
The Company estimates the fair values of its money market funds based on quoted prices in active markets for identical assets. The Company estimates the fair values of its time deposits, commercial paper, U.S. and foreign government and agency securities, municipal securities, asset-backed securities, and corporate debt securities by taking into consideration valuations obtained from third-party pricing services. The pricing services use industry standard valuation models, including both income and market-based approaches, for which all significant inputs are observable, either directly or indirectly, to estimate fair value. These inputs include reported trades and broker-dealer quotes on the same or similar securities, benchmark yields, credit spreads, prepayment and default projections based on historical data, and other observable inputs. The Company independently reviews and validates the pricing received from the third-party pricing service by comparing the prices to prices reported by a secondary pricing source. The Company’s validation procedures have not resulted in an adjustment to the pricing received from the pricing service.
Deferred Compensation Plans
The Company holds investments in trading securities related to its deferred compensation plans. The investments are in a variety of stock and bond mutual funds. The fair values of these investments and the corresponding liabilities are based on quoted market prices.
Derivative Instruments
The Company uses derivative financial instruments in the form of foreign currency forward exchange contracts and cross currency swap contracts to manage foreign currency exposures. All derivatives contracts are recognized on the balance sheet at their fair value. The fair value of the derivative financial instruments was estimated based on quoted market foreign exchange rates and market discount rates. Judgment was employed in interpreting market data to develop estimates of fair value; accordingly, the estimates presented herein are not necessarily indicative of the amounts that the Company could realize in a current market exchange. The use of different market assumptions or valuation methodologies could have a material effect on the estimated fair value amounts.
Contingent Consideration Liabilities
Certain of the Company's acquisitions involve contingent consideration arrangements. Payment of additional consideration is contingent upon the acquired company reaching certain performance milestones, such as attaining specified revenue levels or obtaining regulatory approvals. These contingent consideration liabilities are measured at estimated fair value using either a probability weighted discounted cash flow analysis or a Monte Carlo simulation model, both of which consider significant unobservable inputs. These inputs include (1) the discount rate used to present value the projected cash flows (ranging from 0.1% to 9.0%; weighted average of 4.6%), (2) the probability of milestone achievement (ranging from 0% to
98.2%; weighted average of 64.6%), (3) the projected payment dates (ranging from 2023 to 2027; weighted average of 2026), and (4) the volatility of future revenue (ranging from 37.0% to 40.0%; weighted average of 38.1%). The weighted average of each of the above inputs was determined based on the relative fair value of each obligation. The use of different assumptions could have a material effect on the estimated fair value amounts.
5. DERIVATIVE INSTRUMENTS AND HEDGING ACTIVITIES
The Company uses derivative financial instruments to manage its currency exchange rate risk and its interest rate risk as summarized below. Notional amounts are stated in United States dollar equivalents at spot exchange rates at the respective dates. The Company does not enter into these arrangements for trading or speculation purposes.
| | | | | | | | | | | |
| | Notional Amount |
| | June 30, 2021 | | December 31, 2020 |
| | (in millions) |
| Foreign currency forward exchange contracts | $ | 1,498.8 | | | $ | 1,525.5 | |
| Cross currency swap contracts | 300.0 | | | 300.0 | |
| | | |
Derivative financial instruments involve credit risk in the event the counterparty should default. It is the Company's policy to execute such instruments with global financial institutions that the Company believes to be creditworthy. The Company diversifies its derivative financial instruments among counterparties to minimize exposure to any one of these entities. The Company also uses International Swap Dealers Association master-netting agreements. The master-netting agreements provide for the net settlement of all contracts through a single payment in a single currency in the event of default, as defined by the agreements.
The Company uses foreign currency forward exchange contracts and cross currency swap contracts to manage its exposure to changes in currency exchange rates from (a) future cash flows associated with intercompany transactions and certain local currency expenses expected to occur within the next 13 months (designated as cash flow hedges), (b) its net investment in certain foreign subsidiaries (designated as net investment hedges) and (c) foreign currency denominated assets or liabilities (designated as fair value hedges). The Company also uses foreign currency forward exchange contracts that are not designated as hedging instruments to offset the transaction gains and losses associated with revaluation of certain assets and liabilities denominated in currencies other than their functional currencies (resulting principally from intercompany and local currency transactions).
All derivative financial instruments are recognized at fair value in the consolidated condensed balance sheets. For each derivative instrument that is designated as a fair value hedge, the gain or loss on the derivative included in the assessment of hedge effectiveness is recognized immediately to earnings, and offsets the loss or gain on the underlying hedged item. The Company reports in "Accumulated Other Comprehensive Loss" the gain or loss on derivative financial instruments that are designated, and that qualify, as cash flow hedges. The Company reclassifies these gains and losses into earnings in the same line item and in the same period in which the underlying hedged transactions affect earnings. Changes in the fair value of net investment hedges are reported in "Accumulated Other Comprehensive Loss" as a part of the cumulative translation adjustment and would be reclassified into earnings if the underlying net investment is sold or substantially liquidated. The portion of the change in fair value related to components excluded from the hedge effectiveness assessment are amortized into earnings over the life of the derivative. The gains and losses on derivative financial instruments for which the Company does not elect hedge accounting treatment are recognized in the consolidated statements of operations in each period based upon the change in the fair value of the derivative financial instrument. Cash flows from net investment hedges are reported as investing activities in the consolidated statements of cash flows, and cash flows from all other derivative financial instruments are reported as operating activities.
The following table presents the location and fair value amounts of derivative instruments reported in the consolidated condensed balance sheets (in millions):
| | | | | | | | | | | | | | | | | | | | |
| | | | | Fair Value |
| Derivatives designated as hedging instruments | | Balance Sheet
Location | | June 30, 2021 | | December 31, 2020 |
| Assets | | | | | | |
| Foreign currency contracts | | Other current assets | | $ | 25.9 | | | $ | 7.3 | |
| | | | | | |
| Cross currency swap contracts | | Other assets | | $ | 6.2 | | | $ | 0.8 | |
| | | | | | |
| Liabilities | | | | | | |
| | | | | | |
| Foreign currency contracts | | Accounts payable and accrued liabilities | | $ | 7.9 | | | $ | 39.3 | |
| | | | | | |
| | | | | | |
| | | | | | |
| | | | | | |
| | | | | | |
| | | | | | |
The following table presents the effect of master-netting agreements and rights of offset on the consolidated condensed balance sheets (in millions):
| | | | | | | | | | | | | | | | | | | | | | | | | | | | | | | | | | | |
| | | | | | | | Gross Amounts
Not Offset in
the Consolidated
Balance Sheet | | |
| | | | Gross Amounts
Offset in the
Consolidated
Balance Sheet | | | | |
| | | | Net Amounts
Presented in the
Consolidated
Balance Sheet | | |
| June 30, 2021 | Gross
Amounts | | Financial
Instruments | | Cash
Collateral
Received | | Net
Amount |
| Derivative assets | | | | | | | | | | | |
| Foreign currency contracts | $ | 25.9 | | | $ | — | | | $ | 25.9 | | | $ | (5.0) | | | $ | — | | | $ | 20.9 | |
| Cross currency swap contracts | $ | 6.2 | | | $ | — | | | $ | 6.2 | | | $ | — | | | $ | — | | | $ | 6.2 | |
| Derivative liabilities | | | | | | | | | | | |
| Foreign currency contracts | $ | 7.9 | | | $ | — | | | $ | 7.9 | | | $ | (5.0) | | | $ | — | | | $ | 2.9 | |
| Cross currency swap contracts | $ | — | | | $ | — | | | $ | — | | | $ | — | | | $ | — | | | $ | — | |
| December 31, 2020 | | | | | | | | | | | |
| Derivative assets | | | | | | | | | | | |
| Foreign currency contracts | $ | 7.3 | | | $ | — | | | $ | 7.3 | | | $ | (6.1) | | | $ | — | | | $ | 1.2 | |
| Cross currency swap contracts | $ | 0.8 | | | $ | — | | | $ | 0.8 | | | $ | — | | | $ | — | | | $ | 0.8 | |
| Derivative liabilities | | | | | | | | | | | |
| Foreign currency contracts | $ | 39.3 | | | $ | — | | | $ | 39.3 | | | $ | (6.1) | | | $ | — | | | $ | 33.2 | |
The following tables present the effect of derivative and non-derivative hedging instruments on the consolidated condensed statements of operations and consolidated condensed statements of comprehensive income (loss) (in millions):
| | | | | | | | | | | | | | | | | | | | | | | | | | | | | | | | |
| | | Amount of Gain or (Loss)
Recognized in OCI
on Derivative | | | | Amount of Gain or (Loss)
Reclassified from
Accumulated OCI
into Income |
| | | Three Months Ended
June 30, | | Location of Gain or
(Loss) Reclassified from
Accumulated OCI
into Income | | Three Months Ended
June 30, |
| | | |
| | 2021 | | 2020 | | 2021 | | 2020 |
| Cash flow hedges | | | | | | | | | | |
| Foreign currency contracts | | $ | (3.9) | | | $ | (4.9) | | | Cost of sales | | $ | (8.3) | | | $ | 7.7 | |
| | | | | | Selling, general, and administrative expenses | | $ | (0.4) | | | $ | 0.9 | |
| | | | | | | | | | | | | | | | | | | | | | | | | | | | | | | | |
| | | | | | | | | | |
| | | Amount of Gain or (Loss)
Recognized in OCI
on Derivative | | | | Amount of Gain or (Loss)
Reclassified from
Accumulated OCI
into Income |
| | | Six Months Ended
June 30, | | Location of Gain or
(Loss) Reclassified from
Accumulated OCI
into Income | | Six Months Ended
June 30, |
| | | |
| | 2021 | | 2020 | | 2021 | | 2020 |
| Cash flow hedges | | | | | | | | | | |
| Foreign currency contracts | | $ | 24.3 | | | $ | 12.6 | | | Cost of sales | | $ | (13.8) | | | $ | 13.8 | |
| | | | | | Selling, general, and administrative expenses | | $ | (0.3) | | | $ | 1.7 | |
| | | | | | | | | | | | | | | | | | | | | | | | | | | | | | | | |
| | | Amount of Gain or (Loss)
Recognized in OCI
on Derivative
(Effective Portion) | | | | Amount of Gain or (Loss)
Recognized in Income on Derivative (Amount Excluded from
Effectiveness Testing) |
| | | Three Months Ended
June 30, | | Location of Gain or
(Loss) Recognized in Income on Derivative (Amount Excluded from Effectiveness Testing) | | Three Months Ended
June 30, |
| | | |
| | 2021 | | 2020 | | 2021 | | 2020 |
| Net investment hedges | | | | | | | | | | |
| Cross currency swap contracts | | $ | 3.6 | | | $ | (9.0) | | | Interest expense (income), net | | $ | 1.5 | | | $ | 1.6 | |
| | | | | | | | | | | | | | | | | | | | | | | | | | | | | | | | |
| | | | | | | | | | |
| | | Amount of Gain or (Loss)
Recognized in OCI
on Derivative
(Effective Portion) | | | | Amount of Gain or (Loss)
Recognized in Income on Derivative (Amount Excluded from
Effectiveness Testing) |
| | | Six Months Ended
June 30, | | Location of Gain or
(Loss) Reclassified from
Accumulated OCI
into Income | | Six Months Ended
June 30, |
| | | |
| | 2021 | | 2020 | | 2021 | | 2020 |
| Net investment hedges | | | | | | | | | | |
| Cross currency swap contracts | | $ | 5.4 | | | $ | 22.3 | | | Interest expense (income), net | | $ | 3.1 | | | $ | 3.3 | |
The cross currency swap contracts have an expiration date of June 15, 2028. At maturity of the cross currency swap contracts, the Company will deliver the notional amount of €257.2 million and will receive $300.0 million from the counterparties. The Company will receive semi-annual interest payments from the counterparties based on a fixed interest rate until maturity of the agreements.
| | | | | | | | | | | | | | | | | | | | |
| | | | | Amount of Gain or (Loss)
Recognized in Income on
Derivative |
| | | | | Three Months Ended
June 30, |
| | | Location of Gain or (Loss)
Recognized in Income on
Derivative | |
| | 2021 | | 2020 |
| Fair value hedges | | | | | | |
| Foreign currency contracts | | Other (income) expense, net | | $ | 1.5 | | | $ | (1.4) | |
| | | | | | |
| | | | | | | | | | | | | | | | | | | | |
| | | | | | |
| | | | | Amount of Gain or (Loss)
Recognized in Income on
Derivative |
| | | | | Six Months Ended
June 30, |
| | | Location of Gain or (Loss)
Recognized in Income on
Derivative | |
| | 2021 | | 2020 |
| Fair value hedges | | | | | | |
| Foreign currency contracts | | Other (income) expense, net | | $ | 7.8 | | | $ | 0.3 | |
| | | | | | |
| | | | | | | | | | | | | | | | | | | | |
| | | | | Amount of Gain or (Loss)
Recognized in Income on
Derivative |
| | | | | Three Months Ended
June 30, |
| | | Location of Gain or (Loss)
Recognized in Income on
Derivative | |
| | 2021 | | 2020 |
| Derivatives not designated as hedging instruments | | | | | | |
| Foreign currency contracts | | Other (income) expense, net | | $ | (4.3) | | | $ | (6.9) | |
| | | | | | | | | | | | | | | | | | | | |
| | | | | | |
| | | | | Amount of Gain or (Loss)
Recognized in Income on
Derivative |
| | | | | Six Months Ended
June 30, |
| | | Location of Gain or (Loss)
Recognized in Income on
Derivative | |
| | 2021 | | 2020 |
| Derivatives not designated as hedging instruments | | | | | | |
| Foreign currency contracts | | Other (income) expense, net | | $ | 10.9 | | | $ | 1.7 | |
The following tables present the effect of fair value and cash flow hedge accounting on the consolidated condensed statements of operations (in millions):
| | | | | | | | | | | | | | | | | | | | | | | | | | | | | | | | | | | | | | | |
| | Location and Amount of Gain or (Loss) Recognized in Income on Fair Value and Cash Flow Hedging Relationships |
| | Three Months Ended
June 30, 2021 | | Six Months Ended
June 30, 2021 |
| | Cost of sales | | Selling, general, and administrative expenses | | | | Other (Income) Expense, net | | Cost of sales | | Selling, general, and administrative expenses | | | | Other (Income) Expense, net |
| | | | | |
| Total amounts of income and expense line items presented in the consolidated condensed statements of operations in which the effects of fair value or cash flow hedges are recorded | $ | (334.3) | | | $ | (374.5) | | | | | $ | 4.4 | | | $ | (627.7) | | | $ | (705.3) | | | | | $ | 9.9 | |
| The effects of fair value and cash flow hedging: | | | | | | | | | | | | | | | |
Gain (loss) on fair value hedging relationships: | | | | | | | | | | | | | | | |
Foreign currency contracts: | | | | | | | | | | | | | | | |
Hedged items | $ | — | | | $ | — | | | | | $ | (0.7) | | | $ | — | | | $ | — | | | | | $ | (6.2) | |
Derivatives designated as hedging instruments | $ | — | | | $ | — | | | | | $ | 0.7 | | | $ | — | | | $ | — | | | | | $ | 6.2 | |
Amount excluded from effectiveness testing recognized in earnings based on an amortization approach | $ | — | | | $ | — | | | | | $ | 0.8 | | | $ | — | | | $ | — | | | | | $ | 1.6 | |
Gain (loss) on cash flow hedging relationships: | | | | | | | | | | | | | | | |
Foreign currency contracts: | | | | | | | | | | | | | | | |
Amount of gain (loss) reclassified from accumulated OCI into income | $ | (8.3) | | | $ | (0.4) | | | | | $ | — | | | $ | (13.8) | | | $ | (0.3) | | | | | $ | — | |
| | | | | | | | | | | | | | | | | | | | | | | | | | | | | | | | | | | | | | | |
| | Location and Amount of Gain or (Loss) Recognized in Income on Fair Value and Cash Flow Hedging Relationships |
| | Three Months Ended
June 30, 2020 | | Six Months Ended
June 30, 2020 |
| | Cost of sales | | Selling, general, and administrative expenses | | | | Other Expense (Income), net | | Cost of sales | | Selling, general, and administrative expenses | | | | Other Expense (Income), net |
| | | | | |
| Total amounts of income and expense line items presented in the consolidated condensed statements of operations in which the effects of fair value or cash flow hedges are recorded | $ | (238.2) | | | $ | (274.9) | | | | | $ | (0.3) | | | $ | (503.3) | | | $ | (582.7) | | | | | $ | 1.6 | |
| The effects of fair value and cash flow hedging: | | | | | | | | | | | | | | | |
Gain (loss) on fair value hedging relationships: | | | | | | | | | | | | | | | |
Foreign currency contracts: | | | | | | | | | | | | | | | |
Hedged items | $ | — | | | $ | — | | | | | $ | 2.2 | | | $ | — | | | $ | — | | | | | $ | 1.5 | |
Derivatives designated as hedging instruments | $ | — | | | $ | — | | | | | $ | (2.2) | | | $ | — | | | $ | — | | | | | $ | (1.5) | |
Amount excluded from effectiveness testing recognized in earnings based on an amortization approach | $ | — | | | $ | — | | | | | $ | 0.8 | | | $ | — | | | $ | — | | | | | $ | 1.8 | |
Gain (loss) on cash flow hedging relationships: | | | | | | | | | | | | | | | |
Foreign currency contracts: | | | | | | | | | | | | | | | |
Amount of gain (loss) reclassified from accumulated OCI into income | $ | 7.7 | | | $ | 0.9 | | | | | $ | — | | | $ | 13.8 | | | $ | 1.7 | | | | | $ | — | |
The Company expects that during the next twelve months it will reclassify to earnings a $11.7 million loss currently recorded in "Accumulated Other Comprehensive Loss."
6. STOCK-BASED COMPENSATION
Stock-based compensation expense related to awards issued under the Company's incentive compensation plans for the three and six months ended June 30, 2021 and 2020 was as follows (in millions):
| | | | | | | | | | | | | | | | | | | | | | | |
| | Three Months Ended
June 30, | | Six Months Ended
June 30, |
| | 2021 | | 2020 | | 2021 | | 2020 |
| Cost of sales | $ | 5.7 | | | $ | 4.7 | | | $ | 11.2 | | | $ | 9.3 | |
| Selling, general, and administrative expenses | 18.3 | | | 15.3 | | | 34.8 | | | 29.7 | |
| Research and development expenses | 6.3 | | | 4.8 | | | 12.5 | | | 9.7 | |
| Total stock-based compensation expense | 30.3 | | | 24.8 | | | 58.5 | | | 48.7 | |
| Income tax benefit | (4.9) | | | (4.1) | | | (8.8) | | | (7.6) | |
| Total stock-based compensation expense, net of tax | $ | 25.4 | | | $ | 20.7 | | | $ | 49.7 | | | $ | 41.1 | |
At June 30, 2021, the total remaining compensation cost related to nonvested stock options, restricted stock units, market-based restricted stock units, and employee stock purchase plan ("ESPP") subscription awards amounted to $200.7 million, which will be amortized on a straight-line basis over the weighted-average remaining requisite service period of 33 months.
During the six months ended June 30, 2021, the Company granted 1.5 million stock options at a weighted-average exercise price of $85.24, and 0.6 million restricted stock units at a weighted-average grant-date fair value of $92.77. During the six months ended June 30, 2021, the Company also granted 0.1 million market-based restricted stock units at a weighted-average grant-date fair value of $120.56 and issued an additional 0.1 million shares of common stock related to a previous year's grant of market-based restricted stock units since the payout percentage achieved at the end of the performance period was in excess of the targeted shares. The market-based restricted stock units vest based on a combination of certain service and market conditions. The actual number of shares issued will be determined based on the Company's total shareholder return relative to a selected industry peer group over a three-year performance period and may range from 0% to 175% of the targeted number of shares granted.
Fair Value Disclosures
The fair value of the market-based restricted stock units was determined using a Monte Carlo simulation model, which uses multiple input variables to determine the probability of satisfying the market condition requirements. The weighted-average assumptions used to determine the fair value of the market-based restricted stock units granted during the six months ended June 30, 2021 and 2020 included a risk-free interest rate of 0.4% and 0.2%, respectively, and an expected volatility rate
of 34.4% and 32.7%, respectively.
The following table includes the weighted-average grant-date fair values of stock options granted during the periods indicated and the related weighted-average assumptions used in the Black-Scholes option pricing model:
| | | | | | | | | | | | | | | | | | | | | | | |
Option Awards | Three Months Ended
June 30, | | Six Months Ended
June 30, |
| | 2021 | | 2020 | | 2021 | | 2020 |
| Average risk-free interest rate | 0.8 | % | | 0.3 | % | | 0.8 | % | | 0.3 | % |
| Expected dividend yield | None | | None | | None | | None |
| Expected volatility | 33.5 | % | | 33.5 | % | | 33.5 | % | | 33.4 | % |
| Expected term (years) | 5.0 | | 5.0 | | 5.0 | | 5.0 |
| Fair value, per option | $ | 28.60 | | | $ | 21.58 | | | $ | 28.54 | | | $ | 21.61 | |
The following table includes the weighted-average grant-date fair values for ESPP subscriptions granted during the periods indicated and the related weighted-average assumptions used in the Black-Scholes option pricing model:
| | | | | | | | | | | | | | | | | | | | | | | |
ESPP | Three Months Ended
June 30, | | Six Months Ended
June 30, |
| | 2021 | | 2020 | | 2021 | | 2020 |
| Average risk-free interest rate | 0.0 | % | | 0.1 | % | | 0.1 | % | | 1.4 | % |
| Expected dividend yield | None | | None | | None | | None |
| Expected volatility | 32.3 | % | | 37.5 | % | | 36.8 | % | | 32.6 | % |
| Expected term (years) | 0.6 | | 0.6 | | 0.6 | | 0.6 |
| Fair value, per share | $ | 26.03 | | | $ | 18.42 | | | $ | 22.65 | | | $ | 16.06 | |
7. ACCELERATED SHARE REPURCHASE
During 2021, the Company entered into an accelerated share repurchase ("ASR") agreement providing for the repurchase of the Company's common stock based on the volume-weighted average price ("VWAP") of the Company's common stock during the term of the agreement, less a discount. The following table summarizes the terms of the ASR agreement (dollars and shares in millions, except per share data):
| | | | | | | | | | | | | | | | | | | | | | | | | | | | | | | | | | | | | | | | | | | | |
| | | | | Initial Delivery | | Final Settlement |
| Agreement Date | | Amount
Paid | | Shares
Received | | Price per
Share | | Value of
Shares as %
of Contract
Value | | Settlement
Date | | Total Shares
Received | | Average Price
per Share |
| February 2021 | | $ | 250.0 | | | 2.4 | | | $ | 83.86 | | | 80 | % | | March 2021 | | 3.0 | | | $ | 84.51 | |
The ASR agreement was accounted for as two separate transactions: (1) the value of the initial delivery of shares was recorded as shares of common stock acquired in a treasury stock transaction on the acquisition date, and (2) the remaining amount of the purchase price paid was recorded as a forward contract indexed to the Company's own common stock and was recorded in "Additional Paid-in Capital" on the consolidated balance sheets. The initial delivery of shares resulted in an immediate reduction of the outstanding shares used to calculate the weighted-average common shares outstanding for basic and diluted earnings per share. The Company determined that the forward contract indexed to the Company's common stock met all the applicable criteria for equity classification and, therefore, was not accounted for as a derivative instrument.
8. COMMITMENTS AND CONTINGENCIES
The Company is investigating whether the allocation of certain grants and other payments initiated by certain employees of the Company in Japan violate certain provisions of the Foreign Corrupt Practices Act ("FCPA"). The Company has voluntarily notified the SEC and the U.S. Department of Justice ("DOJ") that it has engaged outside counsel to conduct this
investigation. Any determination that the Company’s operations or activities are not in compliance with existing laws, including the FCPA, could result in the imposition of fines, penalties, and equitable remedies. The Company cannot currently predict the outcome of the investigation or the potential impact on its financial statements.
The Company is or may be a party to, or may otherwise be responsible for, pending or threatened lawsuits including those related to products and services currently or formerly manufactured or performed, as applicable, by the Company, workplace and employment matters, matters involving real estate, Company operations or health care regulations, or governmental investigations (the "Lawsuits"). The Lawsuits raise difficult and complex factual and legal issues and are subject to many uncertainties, including, but not limited to, the facts and circumstances of each particular case or claim, the jurisdiction in which each suit is brought, and differences in applicable law. Management does not believe that any loss relating to the Lawsuits would have a material adverse effect on the Company's overall financial condition, results of operations or cash flows. However, the resolution of one or more of the Lawsuits in any reporting period, could have a material adverse impact on the Company's financial results for that period. The Company is not able to estimate the amount or range of any loss for legal contingencies related to the Lawsuits for which there is no reserve or additional loss for matters already reserved.
9. ACCUMULATED OTHER COMPREHENSIVE LOSS
The following tables summarize the activity for each component of "Accumulated Other Comprehensive Loss" (in millions):
| | | | | | | | | | | | | | | | | | | | | | | | | | | | | |
| | Foreign
Currency
Translation
Adjustments | | Unrealized Loss on Hedges | |
Unrealized Gain on Available-for-sale Investments | | Unrealized
Pension
Costs | | Total
Accumulated
Other
Comprehensive
Loss |
| December 31, 2020 | $ | (122.4) | | | $ | (27.7) | | | $ | 8.6 | | | $ | (19.6) | | | $ | (161.1) | |
| Other comprehensive (loss) gain before reclassifications | (30.2) | | | 34.8 | | | (6.1) | | | 0.3 | | | (1.2) | |
| Amounts reclassified from accumulated other comprehensive loss | (1.6) | | | (0.9) | | | 0.9 | | | — | | | (1.6) | |
| Deferred income tax (expense) benefit | (0.4) | | | (9.4) | | | 1.3 | | | — | | | (8.5) | |
| March 31, 2021 | (154.6) | | | (3.2) | | | 4.7 | | | (19.3) | | | (172.4) | |
| | | | | | | | | |
| Other comprehensive gain (loss) before reclassifications | 12.9 | | | (3.4) | | | (1.0) | | | (0.2) | | | 8.3 | |
| Amounts reclassified from accumulated other comprehensive loss | (1.5) | | | 7.2 | | | 1.1 | | | — | | | 6.8 | |
| Deferred income tax (expense) benefit | (0.9) | | | (1.4) | | | — | | | — | | | (2.3) | |
| June 30, 2021 | $ | (144.1) | | | $ | (0.8) | | | $ | 4.8 | | | $ | (19.5) | | | $ | (159.6) | |
| | | | | | | | | |
| | | | | | | | | |
| | | | | | | | | |
| | | | | | | | | |
| | | | | | | | | |
| | | | | | | | | |
| | | | | | | | | | | | | | | | | | | | | | | | | | | | | |
| | Foreign
Currency
Translation
Adjustments | | Unrealized Gain on Hedges | |
Unrealized Gain (Loss) on Available-for-sale Investments | | Unrealized
Pension
Costs | | Total
Accumulated
Other
Comprehensive
Loss |
| December 31, 2019 | $ | (154.8) | | | $ | 12.5 | | | $ | 1.7 | | | $ | (15.4) | | | $ | (156.0) | |
| Other comprehensive gain (loss) before reclassifications | 11.6 | | | 19.0 | | | (6.3) | | | (0.2) | | | 24.1 | |
| Amounts reclassified from accumulated other comprehensive loss | (1.7) | | | (8.6) | | | (0.1) | | | — | | | (10.4) | |
| Deferred income tax (expense) benefit | (7.6) | | | (3.8) | | | 1.7 | | | — | | | (9.7) | |
| March 31, 2020 | (152.5) | | | 19.1 | | | (3.0) | | | (15.6) | | | (152.0) | |
| | | | | | | | | |
| Other comprehensive gain (loss) before reclassifications | 1.2 | | | (3.7) | | | 14.8 | | | — | | | 12.3 | |
| Amounts reclassified from accumulated other comprehensive loss | (1.6) | | | (7.2) | | | 0.2 | | | — | | | (8.6) | |
| Deferred income tax benefit (expense) | 2.1 | | | 3.6 | | | (3.5) | | | — | | | 2.2 | |
| June 30, 2020 | $ | (150.8) | | | $ | 11.8 | | | $ | 8.5 | | | $ | (15.6) | | | $ | (146.1) | |
| | | | | | | | | |
| | | | | | | | | |
| | | | | | | | | |
| | | | | | | | | |
| | | | | | | | | |
| | | | | | | | | |
The following table provides information about amounts reclassified from "Accumulated Other Comprehensive Loss" (in millions):
| | | | | | | | | | | | | | | | | | | | | | | | | | | | | |
| | Three Months Ended
June 30, | | Six Months Ended
June 30, | | |
| | Affected Line on Consolidated Condensed
Statements of Operations |
Details about Accumulated Other Comprehensive Loss Components | 2021 | | 2020 | | 2021 | | 2020 | |
| Foreign currency translation adjustments | $ | 1.5 | | | $ | 1.6 | | | $ | 3.1 | | | $ | 3.3 | | | Other (income) expense, net |
| (0.4) | | | (0.4) | | | (0.8) | | | (0.8) | | | Provision for income taxes |
| $ | 1.1 | | | $ | 1.2 | | | $ | 2.3 | | | $ | 2.5 | | | Net of tax |
| (Loss) gain on hedges | $ | (8.3) | | | $ | 7.7 | | | $ | (13.8) | | | $ | 13.8 | | | Cost of sales |
| (0.4) | | | 0.9 | | | (0.3) | | | 1.7 | | | Selling, general, and administrative expenses |
| 1.5 | | | (1.4) | | | 7.8 | | | 0.3 | | | Other (income) expense, net |
| (7.2) | | | 7.2 | | | (6.3) | | | 15.8 | | | Total before tax |
| 1.9 | | | (2.1) | | | 2.6 | | | (4.0) | | | Provision for income taxes |
| $ | (5.3) | | | $ | 5.1 | | | $ | (3.7) | | | $ | 11.8 | | | Net of tax |
| Gain (loss) on available-for-sale investments | $ | (1.1) | | | $ | (0.2) | | | $ | (2.0) | | | $ | (0.1) | | | Other (income) expense, net |
| 0.3 | | | (0.1) | | | 0.5 | | | (0.3) | | | Provision for income taxes |
| $ | (0.8) | | | $ | (0.3) | | | $ | (1.5) | | | $ | (0.4) | | | Net of tax |
| | | | | | | | | |
| | | | | | | | | |
| | | | | | | | | |
10. EARNINGS PER SHARE
Basic earnings per share is computed by dividing net income (loss) by the weighted-average common shares outstanding during a period. Diluted earnings per share is computed based on the weighted-average common shares outstanding plus the effect of dilutive potential common shares outstanding during the period calculated using the treasury stock method. Dilutive potential common shares include employee equity share options, nonvested shares, and similar equity instruments granted by the Company. Potential common share equivalents have been excluded where their inclusion would be anti-dilutive.
The table below presents the computation of basic and diluted earnings per share (in millions, except for per share information):
| | | | | | | | | | | | | | | | | | | | | | | |
| | Three Months Ended
June 30, | | Six Months Ended
June 30, |
| | 2021 | | 2020 | | 2021 | | 2020 |
| Basic: | | | | | | | |
| Net income (loss) | $ | 489.5 | | | $ | (121.9) | | | $ | 827.7 | | | $ | 188.7 | |
| Weighted-average shares outstanding | 622.3 | | | 620.3 | | | 622.7 | | | 622.5 | |
| Basic earnings (loss) per share | $ | 0.79 | | | $ | (0.20) | | | $ | 1.33 | | | $ | 0.30 | |
| Diluted: | | | | | | | |
| Net income (loss) | $ | 489.5 | | | $ | (121.9) | | | $ | 827.7 | | | $ | 188.7 | |
| Weighted-average shares outstanding | 622.3 | | | 620.3 | | | 622.7 | | | 622.5 | |
| Dilutive effect of stock plans | 7.6 | | | — | | | 7.9 | | | 5.2 | |
| Dilutive weighted-average shares outstanding | 629.9 | | | 620.3 | | | 630.6 | | | 627.7 | |
| Diluted earnings (loss) per share | $ | 0.78 | | | $ | (0.20) | | | $ | 1.31 | | | $ | 0.30 | |
Stock options, restricted stock units, and market-based restricted stock units to purchase an aggregate of 2.3 million and 13.3 million shares for the three months ended June 30, 2021 and 2020, respectively, and 2.1 million and 7.7 million shares for the six months ended June 30, 2021 and 2020, respectively, were outstanding, but were not included in the computation of diluted earnings per share because the effect would have been anti-dilutive.
11. INCOME TAXES
The Company's effective income tax rates were 10.3% and 27.5% for the three months ended June 30, 2021 and 2020, respectively, and 11.5% and 3.9% for the six months ended June 30, 2021 and 2020, respectively. The fluctuation in the
effective rates between the three and six months ended June 30, 2021 and the three and six months ended June 30, 2020 is
primarily due to the impact of the litigation settlement agreement reached in 2020 with Abbott Laboratories and its direct and indirect subsidiaries to settle all outstanding patent disputes. In addition, the effective rates for the six months ended June 30, 2021 and 2020 were lower than the federal statutory rate of 21% primarily due to (1) the tax benefit from employee share-based compensation, (2) foreign earnings taxed at lower rates, and (3) Federal and California research and development credits. The effective rates include a tax benefit from employee share-based compensation of $26.3 million and $20.2 million for the three months ended June 30, 2021 and 2020, respectively, and $37.8 million and $30.6 million for the six months ended June 30, 2021 and 2020, respectively.
In the normal course of business, the Internal Revenue Service (“IRS”) and other taxing authorities are in different stages of examining various years of the Company's tax filings. During these audits the Company may receive proposed audit adjustments that could be material. Therefore, there is a possibility that an adverse outcome in these audits could have a material effect on the Company's results of operations and financial condition. The Company strives to resolve open matters with each tax authority at the examination level and could reach agreement with a tax authority at any time. While the Company has accrued for matters it believes are more likely than not to require settlement, the eventual outcome with a tax authority may result in a tax liability that is more or less than that reflected in the consolidated condensed financial statements. Furthermore, the Company may later decide to challenge any assessments, if made, and may exercise its right to appeal. The uncertain tax positions are reviewed quarterly and adjusted as events occur that affect potential liabilities for additional taxes, such as lapsing of applicable statutes of limitations, proposed assessments by tax authorities, negotiations between tax authorities, identification of new issues, and issuance of new legislation, regulations, or case law.
As of June 30, 2021 and December 31, 2020, the gross liability for income taxes associated with uncertain tax positions was $318.7 million and $281.8 million, respectively. The Company estimates that these liabilities would be reduced by $115.3 million and $95.1 million, respectively, from offsetting tax benefits associated with the correlative effects of potential transfer pricing adjustments, state income taxes, and timing adjustments. The net amounts of $203.4 million and $186.7 million, respectively, if not required, would favorably affect the Company's effective tax rate.
The Company previously executed an Advance Pricing Agreement ("APA") in 2018 between the United States and Switzerland governments for tax years 2009 through 2020 covering various, but not all, transfer pricing matters. The unagreed transfer pricing matters, namely Surgical Structural Heart and Transcatheter Aortic Valve Replacement (collectively “Surgical/TAVR”) intercompany royalty transactions, then reverted to IRS Examination for further consideration as part of the respective years' regular tax audits. In addition, the Company executed other bilateral APAs as follows: during 2017, an APA between the United States and Japan covering tax years 2015 through 2019; and during 2018, APAs between Japan and Singapore and between Switzerland and Japan covering tax years 2015 through 2019. The Company has filed to renew these APAs related to Japan for the years 2020 and forward. The execution of some or all of these APA renewals depends on many variables outside of the Company's control.
As of June 30, 2021, all material state, local, and foreign income tax matters have been concluded for years through 2015. During the quarter, the Company completed a Wisconsin state income tax audit for tax years 2010 through 2016 which resulted in a tax benefit of approximately $2.0 million. While not material, the Company continues to address matters in India for years from 2010.
The Company’s U.S. federal income tax returns through 2014 have been audited. The IRS began its examination of the 2015 and 2016 tax years during the fourth quarter of 2018 and later added the 2017 tax year to this audit cycle during the first quarter of 2019. The IRS audit field work for the 2015-2017 tax years was substantially completed during the fourth quarter of 2020, except for transfer pricing and related matters.
During the second quarter of 2021, the Company received a Notice of Proposed Adjustment (“NOPA”) from the IRS for the 2015-2017 tax years relating to transfer pricing involving certain Surgical/TAVR intercompany royalty transactions between the Company's U.S. and Switzerland subsidiaries. The NOPA proposes an increase to the Company's U.S. taxable income which could result in additional tax expense for this period of approximately $200 million. The Company has formally disagreed with the NOPA.
The Company's analysis of the NOPA is ongoing as it represents a significant change to previously agreed upon transfer pricing methodologies for these types of transactions. The Company anticipates receiving the Revenue Agent’s Report prior to
the end of the third quarter of 2021 and plans to submit a formal protest on the matter to the IRS Independent Office of Appeals. The Company continues to evaluate all possible remedies available to it, which could take several years to resolve. No payment of any amount related to the NOPA is required to be made, if at all, until all applicable proceedings have been completed. The Company believes the amounts previously accrued related to this uncertain tax position are sufficient and, accordingly, has not accrued any additional amount based on the NOPA received.
Certain Surgical/TAVR intercompany royalty transactions covering tax years 2015 through 2021 that were not resolved under the APA program remain subject to IRS examination, and those transactions and related tax positions remain uncertain as of June 30, 2021. The Company has considered this information, as well as information regarding the NOPA described above, in its evaluation of its uncertain tax positions. These unresolved transfer pricing matters, net of any correlative repatriation tax adjustment, may be significant to the Company’s consolidated financial statements. Based on the information currently available and numerous possible outcomes, the Company cannot reasonably estimate what, if any, changes in its existing uncertain tax positions may occur in the next 12 months and, therefore, has continued to record the gross uncertain tax positions as a long-term liability.
12. SEGMENT INFORMATION
Edwards Lifesciences conducts operations worldwide and is managed in the following geographical regions: United States, Europe, Japan, and Rest of World. All regions sell products that are used to treat advanced cardiovascular disease.
The Company's geographic segments are reported based on the financial information provided to the Chief Operating Decision Maker (the Chief Executive Officer). The Company evaluates the performance of its geographic segments based on net sales and operating income. The accounting policies of the segments are substantially the same as those described in Note 2 of the Company's consolidated financial statements included in its Annual Report on Form 10-K for the year ended December 31, 2020. Segment net sales and segment operating income are based on internally derived standard foreign exchange rates, which may differ from year to year, and do not include inter-segment profits. Because of the interdependence of the reportable segments, the operating profit as presented may not be representative of the geographical distribution that would occur if the segments were not interdependent. Net sales by geographic area are based on the location of the customer.
Certain items are maintained at the corporate level and are not allocated to the segments. The non-allocated items include net interest income, global marketing expenses, corporate research and development expenses, manufacturing variances, corporate headquarters costs, special gains and charges, stock-based compensation, foreign currency hedging activities, certain litigation costs, changes in the fair value of contingent consideration liabilities, and most of the Company's amortization expense. Although most of the Company's depreciation expense is included in segment operating income, due to the Company's methodology for cost build-up, it is impractical to determine the amount of depreciation expense included in each segment and, therefore, a portion is maintained at the corporate level. The Company neither discretely allocates assets to its operating segments, nor evaluates the operating segments using discrete asset information.
The table below presents information about Edwards Lifesciences' reportable segments (in millions):
| | | | | | | | | | | | | | | | | | | | | | | |
| | Three Months Ended
June 30, | | Six Months Ended
June 30, |
| | 2021 | | 2020 | | 2021 | | 2020 |
| Segment Net Sales | | | | | | | |
| United States | $ | 795.7 | | | $ | 516.2 | | | $ | 1,470.4 | | | $ | 1,183.6 | |
| Europe | 281.8 | | | 206.9 | | | 537.2 | | | 454.4 | |
| Japan | 130.7 | | | 105.3 | | | 258.4 | | | 215.1 | |
| Rest of World | 133.0 | | | 103.8 | | | 257.5 | | | 208.2 | |
| Total segment net sales | $ | 1,341.2 | | | $ | 932.2 | | | $ | 2,523.5 | | | $ | 2,061.3 | |
| Segment Operating Income | | | | | | | |
| United States | $ | 550.6 | | | $ | 345.4 | | | $ | 1,016.7 | | | $ | 810.2 | |
| Europe | 152.6 | | | 104.0 | | | 285.9 | | | 232.0 | |
| Japan | 87.0 | | | 69.0 | | | 174.6 | | | 140.7 | |
| Rest of World | 48.4 | | | 34.7 | | | 95.7 | | | 69.6 | |
| Total segment operating income | $ | 838.6 | | | $ | 553.1 | | | $ | 1,572.9 | | | $ | 1,252.5 | |
The table below presents reconciliations of segment net sales to consolidated net sales and segment operating income to consolidated pre-tax income (in millions):
| | | | | | | | | | | | | | | | | | | | | | | |
| | Three Months Ended
June 30, | | Six Months Ended
June 30, |
| | 2021 | | 2020 | | 2021 | | 2020 |
| Net Sales Reconciliation | | | | | | | |
| Segment net sales | $ | 1,341.2 | | | $ | 932.2 | | | $ | 2,523.5 | | | $ | 2,061.3 | |
| Foreign currency | 34.8 | | | (7.2) | | | 69.1 | | | (7.6) | |
| Consolidated net sales | $ | 1,376.0 | | | $ | 925.0 | | | $ | 2,592.6 | | | $ | 2,053.7 | |
| Pre-tax Income Reconciliation | | | | | | | |
| Segment operating income | $ | 838.6 | | | $ | 553.1 | | | $ | 1,572.9 | | | $ | 1,252.5 | |
| Unallocated amounts: | | | | | | | |
| Corporate items | (407.4) | | | (333.0) | | | (765.1) | | | (673.7) | |
| | | | | | | |
| Intellectual property litigation expenses, net | (2.4) | | | (379.9) | | | (8.8) | | | (392.4) | |
| Change in fair value of contingent consideration liabilities | 102.6 | | | (19.6) | | | 107.1 | | | (17.4) | |
| Foreign currency | 10.7 | | | 9.7 | | | 19.5 | | | 19.4 | |
| Consolidated operating income (loss) | 542.1 | | | (169.7) | | | 925.6 | | | 188.4 | |
| Non-operating income | 3.4 | | | 1.5 | | | 9.2 | | | 7.9 | |
| Consolidated pre-tax income (loss) | $ | 545.5 | | | $ | (168.2) | | | $ | 934.8 | | | $ | 196.3 | |
Enterprise-wide Information
(in millions)
The following enterprise-wide information is based on actual foreign exchange rates used in the Company's consolidated condensed financial statements.
| | | | | | | | | | | | | | | | | | | | | | | |
| | Three Months Ended
June 30, | | Six Months Ended
June 30, |
| | 2021 | | 2020 | | 2021 | | 2020 |
| Net Sales by Geographic Area | | | | | | | |
| United States | $ | 795.7 | | | $ | 516.2 | | | $ | 1,470.4 | | | $ | 1,183.6 | |
| Europe | 309.8 | | | 204.7 | | | 589.8 | | | 454.0 | |
| Japan | 131.8 | | | 106.8 | | | 264.1 | | | 216.8 | |
| Rest of World | 138.7 | | | 97.3 | | | 268.3 | | | 199.3 | |
| $ | 1,376.0 | | | $ | 925.0 | | | $ | 2,592.6 | | | $ | 2,053.7 | |
| Net Sales by Major Product Area | | | | | | | |
| Transcatheter Aortic Valve Replacement | $ | 901.5 | | | $ | 594.3 | | | $ | 1,693.2 | | | $ | 1,336.5 | |
| Transcatheter Mitral and Tricuspid Therapies | 22.1 | | | 6.1 | | | 38.4 | | | 16.6 | |
| Surgical Structural Heart | 237.4 | | | 160.9 | | | 450.4 | | | 354.3 | |
| Critical Care | 215.0 | | | 163.7 | | | 410.6 | | | 346.3 | |
| $ | 1,376.0 | | | $ | 925.0 | | | $ | 2,592.6 | | | $ | 2,053.7 | |
| | | | | | | | | | | |
| | June 30, 2021 | | December 31, 2020 |
| Long-lived Tangible Assets by Geographic Area | | | |
| United States | $ | 1,092.3 | | | $ | 1,084.3 | |
| Europe | 209.5 | | | 192.7 | |
| Japan | 15.8 | | | 20.4 | |
| Rest of World | 316.6 | | | 311.0 | |
| $ | 1,634.2 | | | $ | 1,608.4 | |
Item 2. Management's Discussion and Analysis of Financial Condition and Results of Operations
Overview
The following discussion and analysis contains forward-looking statements within the meaning of the federal securities laws, and should be read in conjunction with the disclosures we make concerning risks and other factors that may affect our business and operating results. See “Note Regarding Forward-Looking Statements” preceding Part I, Item 1 in this Quarterly Report on Form 10-Q.
We are the global leader in patient-focused medical innovations for structural heart disease, as well as critical care and surgical monitoring. Driven by a passion to help patients, we partner with the world's leading clinicians and researchers and invest in research and development to transform care for those impacted by structural heart disease or who require hemodynamic monitoring during surgery or in intensive care. We conduct operations worldwide and are managed in the following geographical regions: United States, Europe, Japan, and Rest of World. Our products are categorized into the following areas: Transcatheter Aortic Valve Replacement ("TAVR"), Transcatheter Mitral and Tricuspid Therapies ("TMTT"), Surgical Structural Heart ("Surgical"), and Critical Care.
Financial Highlights and COVID-19
The COVID-19 pandemic has adversely impacted, and may further adversely impact, nearly all aspects of our business and markets, including our workforce and the operations of our customers, suppliers, and business partners. Our priority has been to support our clinician partners, protect the well-being of our employees, and maintain continuous access to our life-saving technologies while offering front-line in-hospital support. Our manufacturing operations have continued to respond to impacts related to COVID-19, and we have been able to supply our technologies around the world. Across the organization, we are proactively managing inventory, assessing alternative logistics options, and closely monitoring the supply of components.
TAVR and Surgical procedure volumes varied greatly since the middle of March 2020 by geography, and even by hospital, as patients and their physicians analyzed the trade-off between aortic stenosis and their concern for COVID-19. In the last few weeks of the first quarter of 2020, procedure volumes related to our TAVR and Surgical products dropped significantly. In the second quarter of 2020, procedure volumes began to improve as we progressed through the quarter and we also started to progressively resume patient enrollment in clinical trials that were voluntarily paused or slowed at the end of the first quarter of 2020. In Critical Care, there was greater demand in Europe and the United States for our pressure monitoring products, but demand for other Critical Care products began to decrease at the end of the first quarter of 2020 due to COVID-19, and that trend continued through the second quarter of 2020.
During the first quarter of 2021, COVID-19 stressed the global healthcare system during the winter months. However, we saw strong recovery during the second quarter of 2021, as widespread vaccine adoption contributed to an increased number of patients. Our net sales for the first six months of 2021 were $2.6 billion, representing an increase of $538.9 million over the first six months of 2020, driven by sales growth of our TAVR products. United States TAVR procedures began to grow as
COVID-19 hospitalizations decreased and vaccinations increased. Surgical sales grew due to increased adoption of our premium high-value technologies around the world and rebounding surgical aortic treatment rates in the United States. We also saw an increased demand for our Critical Care capital products as hospital capital spending continued to show signs of recovery. However, slow vaccination progress outside the United States and new variants of COVID-19 provides uncertainty for the remainder of the year for our sales outside the United States.
Our gross profit increase in 2021 was driven by our sales growth and lower incremental costs associated with COVID-19. The increase in our diluted earnings per share in 2021 was driven by our sales growth and an after-tax charge of $306.9 million in the second quarter of 2020 to settle certain patent litigation related to transcatheter mitral and tricuspid repair products.
We are closely monitoring the impact of COVID-19 on all aspects of our business and geographies, including its impact on our customers, employees, suppliers, vendors, business partners and distribution channels. The extent to which the COVID-19 global pandemic and measures taken in response thereto impact our business, results of operations, and financial condition will depend on future developments, which are highly uncertain and are difficult to predict. These developments include, but are not limited to, the duration and spread of the outbreak (including new and more contagious variants of COVID-19), its severity, the actions to contain the virus or address its impact, the timing, distribution, public acceptance and efficacy of vaccines and other treatments, U.S. and foreign government actions to respond to the reduction in global economic activity, and how quickly and to what extent normal economic and operating conditions can resume. Even after the COVID-19 outbreak has subsided, we may continue to experience materially adverse impacts on our financial condition and results of operations.
Healthcare Environment, Opportunities, and Challenges
The medical technology industry is highly competitive and continues to evolve. Our success is measured both by the development of innovative products and the value we bring to our stakeholders. We are committed to developing new technologies and providing innovative patient care, and we are committed to defending our intellectual property in support of those developments. While some evidence collection was slowed during the COVID-19 pandemic, we and the clinical community are committed to continuing our trials and generating robust evidence. In the first six months of 2021, we invested 16.7% of our net sales in research and development.
Results of Operations
Net Sales Trends
(dollars in millions) | | | | | | | | | | | | | | | | | | | | | | | | | | | | | | | | | | | | | | | | | | | | | | | |
| | Three Months Ended
June 30, | | | | | | Six Months Ended
June 30, | | | | |
| | | | Percent Change | | | | Percent Change |
| | 2021 | | 2020 | | Change | | 2021 | | 2020 | | Change | |
| United States | $ | 795.7 | | | $ | 516.2 | | | $ | 279.5 | | | 54.1 | % | | $ | 1,470.4 | | | $ | 1,183.6 | | | $ | 286.8 | | | 24.2 | % |
| Europe | 309.8 | | | 204.7 | | | 105.1 | | | 51.1 | % | | 589.8 | | | 454.0 | | | 135.8 | | | 29.9 | % |
| Japan | 131.8 | | | 106.8 | | | 25.0 | | | 23.4 | % | | 264.1 | | | 216.8 | | | 47.3 | | | 21.8 | % |
| Rest of World | 138.7 | | | 97.3 | | | 41.4 | | | 42.8 | % | | 268.3 | | | 199.3 | | | 69.0 | | | 34.7 | % |
| International | 580.3 | | | 408.8 | | | 171.5 | | | 41.9 | % | | 1,122.2 | | | 870.1 | | | 252.1 | | | 29.0 | % |
| Total net sales | $ | 1,376.0 | | | $ | 925.0 | | | $ | 451.0 | | | 48.7 | % | | $ | 2,592.6 | | | $ | 2,053.7 | | | $ | 538.9 | | | 26.2 | % |
International net sales include the impact of foreign currency exchange rate fluctuations. The impact of foreign currency exchange rate fluctuations on net sales is not necessarily indicative of the impact on net income (loss) due to the corresponding effect of foreign currency exchange rate fluctuations on international manufacturing and operating costs, and our hedging activities.
Net Sales by Product Group
(dollars in millions)
| | | | | | | | | | | | | | | | | | | | | | | | | | | | | | | | | | | | | | | | | | | | | | | |
| | Three Months Ended
June 30, | | | | | | Six Months Ended
June 30, | | | | |
| | | | Percent Change | | | | Percent Change |
| | 2021 | | 2020 | | Change | | 2021 | | 2020 | | Change | |
| Transcatheter Aortic Valve Replacement | $ | 901.5 | | | $ | 594.3 | | | $ | 307.2 | | | 51.7 | % | | $ | 1,693.2 | | | $ | 1,336.5 | | | $ | 356.7 | | | 26.7 | % |
| Transcatheter Mitral and Tricuspid Therapies | 22.1 | | | 6.1 | | | 16.0 | | | 259.3 | % | | 38.4 | | | 16.6 | | | 21.8 | | | 131.8 | % |
| Surgical Structural Heart | 237.4 | | | 160.9 | | | 76.5 | | | 47.5 | % | | 450.4 | | | 354.3 | | | 96.1 | | | 27.1 | % |
| Critical Care | 215.0 | | | 163.7 | | | 51.3 | | | 31.3 | % | | 410.6 | | | 346.3 | | | 64.3 | | | 18.6 | % |
| Total net sales | $ | 1,376.0 | | | $ | 925.0 | | | $ | 451.0 | | | 48.7 | % | | $ | 2,592.6 | | | $ | 2,053.7 | | | $ | 538.9 | | | 26.2 | % |
Transcatheter Aortic Valve Replacement
Net sales of TAVR products increased for the three and six months ended June 30, 2021 driven by:
•higher procedure volumes in the first six months of 2021 due to improved COVID-19 conditions;
•higher sales of the Edwards SAPIEN platform in 2021 driven by continued strong adoption in the United States, Europe, and Japan; and
•foreign currency exchange rate fluctuations, which increased international net sales by $16.7 million and $34.7 million for the three and six months ended June 30, 2021, respectively, due primarily to the strengthening of the Euro against the United States dollar.
In April 2021, we (1) received approval for a U.S. pivotal trial for TAVR in moderate aortic stenosis patients, (2) received approval in Japan to begin treating low-risk patients with SAPIEN 3, and (3) received SAPIEN 3 CE Mark approval to begin treating patients with a previously repaired or replaced valve in the pulmonic position.
Transcatheter Mitral and Tricuspid Therapies
Net sales of TMTT products increased for the three and six months ended June 30, 2021 due primarily to (1) continued adoption of our PASCAL system and activation of more centers across Europe and (2) higher procedure volumes for PASCAL in the first six months of 2021 due improved COVID-19 conditions.
We are progressing in the enrollment of five pivotal trials across our differentiated portfolio to support therapies for patients suffering from mitral and tricuspid regurgitation. We have initiated use of the PASCAL Precision system in our currently enrolling CLASP trials. We have also begun treating patients with EVOQUE in the TRISCEND II randomized study. This study will evaluate the safety and effectiveness of the EVOQUE tricuspid valve replacement system for patients with severe tricuspid regurgitation. In addition, we continued to treat patients with our next generation transcatheter mitral replacement system, called EVOQUE Eos, through the MISCEND study. This study will evaluate the safety and performance of EVOQUE Eos, which is designed to advance the treatment of patients with mitral regurgitation with a low-profile valve delivered through a sub 30 french transfemoral delivery system. We also continued to treat patients through the ENCIRCLE trial for SAPIEN M3.
Surgical Structural Heart
Net sales of Surgical products increased for the three and six months ended June 30, 2021 due primarily to:
•increased sales of the INSPIRIS RESILIA aortic valve and the KONECT aortic valved conduit, primarily in the United States;
•higher procedure volumes for aortic tissue valves in the first six months of 2021 due to improved COVID-19 conditions; and
•foreign currency exchange rate fluctuations, which increased international net sales by $6.3 million and $12.7 million for the three and six months ended June 30, 2021, respectively, due primarily to the strengthening of the Euro against the United States dollar.
In January 2021, we received regulatory approval in Japan for our MITRIS valve, a new mitral valve incorporating RESILIA technology, which was launched in Japan during the second quarter of 2021.
Critical Care
Net sales of Critical Care products increased for the three and six months ended June 30, 2021 due primarily to:
•increased demand for our capital products, primarily Hemosphere monitors in Japan (and for the three months ended June 30, 2021 in the United States), as hospital capital spending continued to show signs of recovery;
•increased demand for our pressure monitoring products, primarily in the United States; and
•foreign currency exchange rate fluctuations, which increased international net sales by $5.1 million and $10.1 million for the three and six months ended June 30, 2021, respectively, due primarily to the strengthening of the Euro and multiple other currencies against the United States dollar.
In June 2021, we received U.S. Food and Drug Administration clearance for the Acumen Hypotension Prediction Index software with the Acumen IQ finger cuff. This is the first noninvasive solution that uses machine learning to alert clinicians of the likelihood a patient is trending toward hypotension, or low blood pressure.
Gross Profit
The increase in gross profit as a percentage of net sales for the three and six months ended June 30, 2021 was driven primarily by:
•a 1.4 percentage point and 0.7 percentage point increase for the three and six months ended June 30, 2021, respectively, in the United States due to an improved product mix, driven by TAVR products;
•lower incremental costs associated with COVID-19; and
•manufacturing efficiencies;
partially offset by:
•a 1.8 percentage point and 1.7 percentage point decrease for the three and six months ended June 30, 2021, respectively, due to the impact of foreign currency exchange rate fluctuations, including the settlement of foreign currency hedging contracts.
Selling, General, and Administrative ("SG&A") Expenses
SG&A expenses increased for the three and six months ended June 30, 2021 due primarily to (1) higher personnel-related costs, (2) increased commercial activities compared to the heavily COVID-19 impacted prior year, and (3) the impact of foreign currency exchange rate fluctuations, which increased expenses by $11.3 million and $20.2 million for the three and six months ended June 30, 2021, respectively, due to the weakening of the United States dollar against multiple currencies, primarily the
Euro.
Research and Development ("R&D") Expenses
R&D expenses increased for the three and six months ended June 30, 2021 primarily due to continued investments in our transcatheter innovations. In addition, beginning in the second quarter of 2020, spending on clinical trials was reduced as we temporarily paused certain mitral and tricuspid active pivotal clinical trials at the end of the first quarter of 2020 due to COVID-19.
Change in Fair Value of Contingent Consideration Liabilities
The change in fair value of contingent consideration liabilities resulted in income of $102.6 million and $107.1 million for the three and six months ended June 30, 2021, respectively, and expense of $19.6 million and $17.4 million for the three and six months ended June 30, 2020, respectively. The income in 2021 was primarily driven by changes in the projected probability and timing of milestone achievements and the projected timing of cash inflows. The expense in 2020 was primarily driven by credit spreads (which increased during the first quarter of 2020 and decreased in the second quarter of 2020), decreased discount rates and the accretion of interest due to the passage of time. The changes to the credit spread and discount rate assumptions in 2020 were primarily due to uncertainties related to COVID-19. For further information, see Note 4 to the "Consolidated Condensed Financial Statements."
Other (Income) Expense, net
(in millions)
| | | | | | | | | | | | | | | | | | | | | | | |
| | Three Months Ended
June 30, | | Six Months Ended
June 30, |
| | 2021 | | 2020 | | 2021 | | 2020 |
| Foreign exchange gains, net | $ | (2.7) | | | $ | — | | | $ | (4.4) | | | $ | (3.7) | |
| (Gain) loss on investments | (1.4) | | | (1.2) | | | (4.1) | | | 0.6 | |
| Other | (0.3) | | | 1.5 | | | (1.4) | | | 1.5 | |
| Other (income) expense, net | $ | (4.4) | | | $ | 0.3 | | | $ | (9.9) | | | $ | (1.6) | |
The net foreign exchange gains relate to the foreign currency fluctuations in our global trade and intercompany receivable and payable balances, partially offset by the gains and losses on derivative instruments intended as an economic hedge of those exposures.
The (gain) loss on investments primarily represents our net share of gains and losses in investments accounted for under the equity method, and realized gains and losses on investments in equity securities.
Provision for Income Taxes
The provision for income taxes consists of provisions for federal, state, and foreign income taxes. We operate in an international environment with significant operations in various locations outside the United States which have statutory tax rates typically lower than the United States tax rate. Accordingly, the consolidated income tax rate is a composite rate reflecting the earnings in the various locations and the applicable rates.
Our effective income tax rate was 10.3% and 27.5% for the three months ended June 30, 2021 and 2020, respectively, and 11.5% and 3.9% for the six months ended June 30, 2021 and 2020, respectively. The fluctuation in the effective rates between
the three and six months ended June 30, 2021 and the three and six months ended June 30, 2020 is primarily due to the impact of the litigation settlement agreement reached in 2020 with Abbott Laboratories and its direct and indirect subsidiaries to settle all outstanding patent disputes. In addition, the effective rates for the six months ended June 30, 2021 and 2020 were lower than the federal statutory rate of 21% primarily due to (1) the tax benefit from employee share-based compensation, (2) foreign earnings taxed at lower rates, and (3) Federal and California research and development credits.
In the normal course of business, the Internal Revenue Service (“IRS”) and other taxing authorities are in different stages of examining various years of our tax filings. During these audits we may receive proposed audit adjustments that could be material. Therefore, there is a possibility that an adverse outcome in these audits could have a material effect on our results of operations and financial condition. We strive to resolve open matters with each tax authority at the examination level and could reach agreement with a tax authority at any time. While we have accrued for matters we believe are more likely than not to require settlement, the eventual outcome with a tax authority may result in a tax liability that is more or less than that reflected in the consolidated condensed financial statements. Furthermore, we may later decide to challenge any assessments, if made, and may exercise our right to appeal. The uncertain tax positions are reviewed quarterly and adjusted as events occur that affect potential liabilities for additional taxes, such as lapsing of applicable statutes of limitations, proposed assessments by tax authorities, negotiations between tax authorities, identification of new issues, and issuance of new legislation, regulations, or case law.
We previously executed an Advance Pricing Agreement ("APA") in 2018 between the United States and Switzerland governments for tax years 2009 through 2020 covering various, but not all, transfer pricing matters. The unagreed transfer pricing matters, namely Surgical Structural Heart and Transcatheter Aortic Valve Replacement (collectively "Surgical/TAVR") intercompany royalty transactions, then reverted to IRS Examination for further consideration as part of the respective years' regular tax audits. In addition, we executed other bilateral APAs as follows: during 2017, an APA between the United States and Japan covering tax years 2015 through 2019; and during 2018, APAs between Japan and Singapore and between Switzerland and Japan covering tax years 2015 through 2019. We have filed to renew these APAs related to Japan for the years 2020 and forward. The execution of some or all these APA renewals depends on many variables outside of our control.
At June 30, 2021, all material state, local, and foreign income tax matters have been concluded for years through 2015. During the quarter, we completed a Wisconsin state income tax audit for tax years 2010 through 2016 which resulted in a tax benefit of approximately $2.0 million. While not material, we continue to address matters in India for years from 2010.
Our U.S. federal income tax returns through 2014 have been audited. The IRS began its examination of the 2015 and 2016 tax years during the fourth quarter of 2018 and later added the 2017 tax year to this audit cycle during the first quarter of 2019. The IRS audit field work for the 2015 through 2017 tax years was substantially completed during the fourth quarter of 2020, except for transfer pricing and related matters.
During the second quarter of 2021, we received a Notice of Proposed Adjustment (“NOPA”) from the IRS for the 2015-2017 tax years relating to transfer pricing involving certain Surgical/TAVR intercompany royalty transactions between our U.S. and Switzerland subsidiaries. The NOPA proposes an increase to our U.S. taxable income which could result in additional tax expense for this period of approximately $200 million. We have formally disagreed with the NOPA.
Our analysis of the NOPA is ongoing as it represents a significant change to previously agreed upon transfer pricing methodologies for these types of transactions. We anticipate receiving the Revenue Agent’s Report prior to the end of the third quarter of 2021 and plan to submit a formal protest on the matter to the IRS Independent Office of Appeals. We continue to evaluate all possible remedies available to us, which could take several years to resolve. No payment of any amount related to the NOPA is required to be made, if at all, until all applicable proceedings have been completed. We believe the amounts previously accrued related to this uncertain tax position are sufficient and, accordingly, have not accrued any additional amount based on the NOPA received.
Certain Surgical/TAVR intercompany royalty transactions covering tax years 2015 through 2021 that were not resolved under the APA program remain subject to IRS examination, and those transactions and related tax positions remain uncertain as of June 30, 2021. We have considered this information, as well as information regarding the NOPA described above, in our evaluation of our uncertain tax positions. These unresolved transfer pricing matters, net of any correlative repatriation tax adjustment, may be significant to our consolidated financial statements. Based on the information currently available and numerous possible outcomes, we cannot reasonably estimate what, if any, changes in our existing uncertain tax positions may occur in the next 12 months and, therefore, have continued to record the gross uncertain tax positions as a long-term liability.
Liquidity and Capital Resources
Our sources of cash liquidity include cash and cash equivalents, short-term investments, cash from operations, and amounts available under credit facilities, . We believe that these sources are sufficient to fund the current requirements of working capital, capital expenditures, and other financial commitments for the next twelve months. However, we periodically consider various financing alternatives and may, from time to time, seek to take advantage of favorable interest rate environments or other market conditions.
As of June 30, 2021, cash and cash equivalents and short-term investments held in the United States and outside the United States were $1.2 billion and $408.5 million, respectively.
We have a Five-Year Credit Agreement ("the Credit Agreement") which matures on April 28, 2023. The Credit Agreement provides up to an aggregate of $750.0 million in borrowings in multiple currencies. Subject to certain terms and conditions, we may increase the amount available under the Credit Agreement by up to an additional $250.0 million in the aggregate. As of June 30, 2021, there were no borrowings outstanding under the Credit Agreement.
In June 2018, we issued $600.0 million of 4.3% fixed-rate unsecured senior notes (the "2018 Notes") due June 15, 2028. As of June 30, 2021, the total carrying value of the 2018 Notes was $595.4 million.
From time to time, we repurchase shares of our common stock under share repurchase programs authorized by the Board of Directors. On May 4, 2021, the Board of Directors approved a new stock repurchase program providing for an additional $1.0 billion of repurchases of our common stock. We consider several factors in determining when to execute share repurchases, including, among other things, expected dilution from stock plans, cash capacity, and the market price of our common stock. During the six months ended June 30, 2021, under the Board authorized program, we repurchased a total of 4.7 million shares at an aggregate cost of $402.3 million, including pursuant to an accelerated share repurchase agreement we entered into during 2021 (see Note 7 to the "Consolidated Condensed Financial Statements") and as of June 30, 2021, we had remaining authority to purchase $1.2 billion of our common stock, which includes the additional stock repurchase program authorized by the Board in May 2021.
Certain of our business acquisitions involve contingent consideration arrangements. Payment of additional consideration in the future may be required, contingent upon the acquired company reaching certain performance milestones, such as attaining specified revenue levels, achieving product development targets, or obtaining regulatory approvals. For further information, see Note 4 to the "Consolidated Condensed Financial Statements."
In April 2021, we purchased an exclusive option to acquire a medical device company (the "investee") for up to approximately $390 million, depending on the paid-in capital at closing. Depending on the investee's achievement of certain milestones, we may be required to invest up to an additional $9.9 million in the investee's equity securities and up to an additional $21.8 million for the option to acquire the investee. Edwards also agreed to loan the investee up to $45 million under a secured promissory note. For further information, see Note 3 to the "Consolidated Condensed Financial Statements."
On July 12, 2020, we reached a settlement agreement with Abbott Laboratories to settle all outstanding patent disputes between the companies in cases related to transcatheter mitral and tricuspid repair products. The settlement agreement resulted in us recording an estimated $367.9 million pretax charge in June 2020 related to past damages. In addition, we will incur royalty expenses through May 2024 totaling an estimated $100 million. We made a one-time $100.0 million payment to Abbott in July 2020, and will make quarterly payments in future years.
At June 30, 2021, there had been no material changes in our significant contractual obligations and commercial commitments as disclosed in our Annual Report on Form 10-K for the year ended December 31, 2020, other than the aforementioned agreement with the investee.
Consolidated Cash Flows - For the six months ended June 30, 2021 and 2020:
Net cash flows provided by operating activities of $826.6 million for the six months ended June 30, 2021 increased $388.2 million over the same period last year primarily due to improved operating performance in 2021 and a higher bonus payout in 2020 associated with 2019 performance.
Net cash used in investing activities of $379.2 million for the six months ended June 30, 2021 consisted primarily of capital expenditures of $175.3 million and net purchases of investments of $204.8 million.
Net cash used in investing activities of $144.9 million for the six months ended June 30, 2020 consisted primarily of capital expenditures of $190.5 million, partially offset by net proceeds from investments of $77.3 million.
Net cash used in financing activities of $333.3 million for the six months ended June 30, 2021 consisted primarily of purchases of treasury stock of $414.5 million, partially offset by proceeds from stock plans of $85.8 million.
Net cash used in financing activities of $562.3 million for the six months ended June 30, 2020 consisted primarily of purchases of treasury stock of $623.8 million, partially offset by proceeds from stock plans of $67.3 million.
Critical Accounting Policies and Estimates
The consolidated condensed financial statements have been prepared in accordance with accounting principles generally accepted in the United States which require us to make estimates and assumptions that affect the reported amounts of assets and liabilities at the date of the consolidated condensed financial statements and revenues and expenses during the periods reported. Actual results could differ from those estimates. Information with respect to our critical accounting policies and estimates which we believe could have the most significant effect on our reported results and require subjective or complex judgments by management is contained on pages 33-35 in Item 7, "Management's Discussion and Analysis of Financial Condition and Results of Operations," of our Annual Report on Form 10-K for the year ended December 31, 2020. There have been no significant changes from the information discussed therein.
Item 3. Quantitative and Qualitative Disclosures About Market Risk
Interest Rate Risk, Foreign Currency Risk, Credit Risk, and Concentrations of Risk
For a complete discussion of our exposure to interest rate risk, foreign currency risk, credit risk, and concentrations of risk, refer to Item 7A "Quantitative and Qualitative Disclosures About Market Risk" in our Annual Report on Form 10-K for the year ended December 31, 2020. There have been no significant changes from the information discussed therein.
Investment Risk
We are exposed to investment risks related to changes in the underlying financial condition and credit capacity of certain of our investments. As of June 30, 2021, we had $1.2 billion of investments in debt securities of various companies, of which $932.6 million were long-term. In addition, we had $81.6 million of investments in equity instruments of public and private companies. Should these companies experience a decline in financial performance, financial condition, or credit capacity, or fail to meet certain development milestones, including as a result of the impact of COVID-19 on their business or operations or otherwise, a decline in the investments' value may occur, resulting in unrealized or realized losses.
Item 4. Controls and Procedures
Evaluation of Disclosure Controls and Procedures. Our management, including the Chief Executive Officer and the Chief Financial Officer, performed an evaluation of the effectiveness of the design and operation of our disclosure controls and procedures (as defined in Rules 13a-15(e) and 15d-15(e) under the Securities Exchange Act of 1934, as amended) as of June 30, 2021. Based on their evaluation, the Chief Executive Officer and Chief Financial Officer have concluded as of June 30, 2021 that our disclosure controls and procedures are designed at a reasonable assurance level and effective in providing reasonable assurance that the information we are required to disclose in the reports we file or submit under the Securities Exchange Act of 1934, as amended, is recorded, processed, summarized, and reported within the time periods specified in the Securities and Exchange Commission's rules and forms, and that such information is accumulated and communicated to our management, including the Chief Executive Officer and Chief Financial Officer, as appropriate, to allow timely decisions regarding required disclosure.
Changes in Internal Control Over Financial Reporting. There have been no changes in our internal controls over financial reporting during the quarter ended June 30, 2021 that have materially affected, or are reasonably likely to materially affect, our internal controls over financial reporting.
Part II. Other Information
Item 1. Legal Proceedings
The Company is investigating whether the allocation of certain grants and other payments initiated by certain employees of the Company in Japan violate certain provisions of the Foreign Corrupt Practices Act ("FCPA"). The Company has voluntarily notified the U.S. Securities and Exchange Commission ("SEC") and the U.S. Department of Justice ("DOJ") that it has engaged outside counsel to conduct this investigation. Any determination that the Company’s operations or activities are not in compliance with existing laws, including the FCPA, could result in the imposition of fines, penalties, and equitable remedies. The Company cannot currently predict the outcome of the investigation or the potential impact on its financial statements.
The Company is subject to various environmental laws and regulations both within and outside of the United States. The Company's operations, like those of other medical device companies, involve the use of substances regulated under environmental laws, primarily in manufacturing and sterilization processes. While it is difficult to quantify the potential impact of continuing compliance with environmental protection laws, management believes that such compliance will not have a material impact on the Company's financial results. The Company's threshold for disclosing material environmental legal proceedings involving a governmental authority where potential monetary exposure is involved is $1 million.
Item 1A. Risk Factors
A description of the risk factors associated with our business is contained in the “Risk Factors” section of our Annual Report on Form 10-K for our fiscal year ended December 31, 2020. There have been no material changes to our Risk Factors as previously reported.
Item 2. Unregistered Sales of Equity Securities and Use of Proceeds
Issuer Purchases of Equity Securities | | | | | | | | | | | | | | | | | | | | | | | | | | | | | | | | | | | |
| Period | | | | Total Number
of Shares
(or Units)
Purchased (a) | | Average
Price Paid
per Share
(or Unit) | | Total Number of
Shares (or Units)
Purchased as Part of Publicly Announced Plans or Programs | | Approximate
Dollar Value of
Shares that
May Yet Be
Purchased
Under the Plans
or Programs
(in millions) (b) | |
| April 1, 2021 through April 30, 2021 | | 708,905 | | | $ | 85.22 | | | 708,294 | | | $ | 262.1 | | |
| May 1, 2021 through May 31, 2021 | | 376,032 | | | 91.04 | | | 241,354 | | | 1,240.0 | | |
| June 1, 2021 through June 30, 2021 | | 182,678 | | | 94.28 | | | 182,678 | | | 1,222.7 | | |
| Total | | 1,267,615 | | | 88.25 | | | 1,132,326 | | | | |
| | | | | | | | | | | |
(a) The difference between the total number of shares (or units) purchased and the total number of shares (or units) purchased as part of publicly announced plans or programs is due to shares withheld by us to satisfy tax withholding obligations in connection with the vesting of restricted stock units issued to employees.
(b) On May 8, 2019, the Board of Directors approved a stock repurchase program authorizing us to purchase up to $1.0 billion of our common stock. On May 4, 2021, the Board of Directors approved a new stock repurchase program providing for an additional $1.0 billion of repurchases of our common stock. Repurchases under the programs may be made on the open market, including pursuant to a Rule 10b5-1 plan, and in privately negotiated transactions. These repurchase programs do not have an expiration date.
Item 6. Exhibits
The exhibits listed in the Exhibit Index below are filed, furnished, or incorporated by reference as part of this report on Form 10-Q.
| | | | | | | | | | | |
| Exhibit No. | | Description | |
| 3.1 | | | |
| 3.2 | | | |
| 3.3 | | | |
| 31.1 | | | |
| 31.2 | | | |
| 32 | | | |
| 101.INS | | XBRL Inline Instance Document - the instance document does not appear in the Interactive Data File because its XBRL tags are embedded within the Inline XBRL document |
| 101.SCH | | XBRL Taxonomy Extension Schema Document |
| 101.CAL | | XBRL Taxonomy Extension Calculation Linkbase Document |
| 101.DEF | | XBRL Taxonomy Extension Definition Linkbase Document |
| 101.LAB | | XBRL Taxonomy Extension Label Linkbase Document |
| 101.PRE | | XBRL Taxonomy Extension Presentation Linkbase Document |
| 104 | | | Cover Page Interactive Data File (formatted as Inline XBRL and contained in Exhibit 101) |
| | | |
|
SIGNATURES
Pursuant to the requirements of the Securities Exchange Act of 1934, the registrant has duly caused this report to be signed on its behalf by the undersigned thereunto duly authorized.
| | | | | | | | | | | |
| | EDWARDS LIFESCIENCES CORPORATION |
| | (Registrant) |
| Date: | July 30, 2021 | By: | /s/ SCOTT B. ULLEM |
| | | Scott B. Ullem Chief Financial Officer (Principal Financial Officer; Duly Authorized Officer) |
| Date: | July 30, 2021 | By: | /s/ ROBERT W.A. SELLERS |
| | | Robert W.A. Sellers Corporate Controller (Principal Accounting Officer) |