UNITED STATES
SECURITIES AND EXCHANGE COMMISSION
WASHINGTON, D.C. 20549
FORM 10-K
|
☒ |
ANNUAL REPORT UNDER SECTION 13 OR 15(d) OF THE SECURITIES EXCHANGE ACT OF 1934 |
FOR THE FISCAL YEAR ENDED DECEMBER 31, 2019
COMMISSION FILE NUMBER 001-38229
FIDELITY D & D BANCORP, INC.
COMMONWEALTH OF PENNSYLVANIA I.R.S. EMPLOYER IDENTIFICATION NO: 23-3017653
BLAKELY AND DRINKER STREETS
DUNMORE, PENNSYLVANIA 18512
TELEPHONE NUMBER (570) 342-8281
SECURITIES REGISTERED UNDER SECTION 12(b) OF THE ACT:
|
Title of each class |
|
Trading Symbol(s) |
|
Name of each exchange on which registered |
|
Common Stock, without par value |
|
FDBC |
|
The Nasdaq Stock Market, LLC |
SECURITIES REGISTERED UNDER SECTION 12(g) OF THE ACT:
None
Indicate by check mark if the registrant is a well-known seasoned issuer, as defined in Rule 405 of the Securities Act. Yes ☐ No ☒
Indicate by check mark if the registrant is not required to file reports pursuant to Section 13 or Section 15(d) of the Act. Yes ☐ No ☒
Indicate by check mark whether the registrant (1) has filed all reports required to be filed by Section 13 or 15(d) of the Securities Exchange Act of 1934 during the preceding 12 months (or for such shorter period that the registrant was required to file such reports), and (2) has been subject to such filing requirements for the past 90 days. Yes ☒ No ☐
Indicate by check mark whether the registrant has submitted electronically every Interactive Data File required to be submitted pursuant to Rule 405 of Regulation S-T (§ 232.405 of this chapter) during the preceding 12 months (or for such shorter period that the registrant was required to submit such files). Yes ☒ No ☐
Indicate by check mark whether the registrant is a large accelerated filer, an accelerated filer, a non-accelerated filer or a smaller reporting company. See definition of “large accelerated filer,” “accelerated filer,” “smaller reporting company” and “emerging growth company” in Rule 12b-2 of the Exchange Act.
|
Large accelerated filer ☐ |
Non-accelerated filer ☐ |
Accelerated filer ☒ |
|
Smaller reporting company ☒ |
Emerging growth company ☐ |
If an emerging growth company, indicate by check mark if the registrant has elected not to use the extended transition period for complying with any new or revised financial accounting standards provided pursuant to Section 13(a) of the Exchange Act. ☐
Indicate by check mark whether the registrant is a shell company (as defined in Rule 12b-2 of the Act). Yes ☐ No ☒
The aggregate market value of the voting common stock held by non-affiliates of the registrant was $189.3 million as of June 30, 2019, based on the closing price of $67.20. The number of shares of common stock outstanding as of February 29, 2020, was 3,797,646.
DOCUMENTS INCORPORATED BY REFERENCE
Portions of the Registrant’s definitive Proxy Statement to be used in connection with the 2020 Annual Meeting of Shareholders are incorporated herein by reference in partial response to Part III.
Fidelity D & D Bancorp, Inc.
2019 Annual Report on Form 10-K
Table of Contents
|
Part I. |
|
|
|
|
|
|
|
|
|
|
|
|
||
|
Item 1. |
|
|
3 | |||
|
Item 1A. |
|
|
5 | |||
|
Item 1B. |
|
|
14 | |||
|
Item 2. |
|
|
14 | |||
|
Item 3. |
|
|
15 | |||
|
Item 4. |
|
|
15 | |||
|
|
|
|
|
|
||
|
Part II. |
|
|
|
|
|
|
|
|
|
|
|
|
||
|
Item 5. |
|
|
15 | |||
|
Item 6. |
|
|
17 | |||
|
Item 7. |
|
Management’s Discussion and Analysis of Financial Condition and Results of Operation |
|
18 | ||
|
Item 7A. |
|
|
52 | |||
|
Item 8. |
|
|
53 | |||
|
Item 9. |
|
Changes in and Disagreements with Accountants on Accounting and Financial Disclosure |
|
99 | ||
|
Item 9A. |
|
|
99 | |||
|
Item 9B. |
|
|
99 | |||
|
|
|
|
|
|
||
|
Part III. |
|
|
|
|
|
|
|
|
|
|
|
|
||
|
Item 10. |
|
|
99 | |||
|
Item 11. |
|
|
99 | |||
|
Item 12. |
|
Security Ownership of Certain Beneficial Owners and Management and Related Stockholder Matters |
|
100 | ||
|
Item 13. |
|
Certain Relationships and Related Transactions, and Director Independence |
|
100 | ||
|
Item 14. |
|
|
100 | |||
|
|
|
|
|
|
||
|
Part IV. |
|
|
|
|
|
|
|
|
|
|
|
|
||
|
Item 15. |
|
|
100 | |||
|
|
|
|
|
|
||
|
Item 16. |
|
|
102 | |||
|
|
|
|
|
|
||
|
|
|
|
103 | |||
|
|
|
|
|
|
||
|
|
|
|
|
|
||
|
|
|
|
|
|
||
2
FIDELITY D & D BANCORP, INC.
PART I
Forward-Looking Statements
Certain of the matters discussed in this Annual Report on Form 10-K may constitute forward-looking statements for purposes of the Securities Act of 1933, as amended, and the Securities Exchange Act of 1934, as amended, and as such may involve known and unknown risks, uncertainties and other factors which may cause the actual results, performance or achievements of the Company to be materially different from future results, performance or achievements expressed or implied by such forward-looking statements. The words “expect,” “anticipate,” “intend,” “plan,” “believe,” “estimate,” and similar expressions are intended to identify such forward-looking statements.
The Company’s actual results may differ materially from the results anticipated in these forward-looking statements due to a variety of factors, including, without limitation:
|
§ |
the effects of economic conditions on current customers, including the effect of the economy on loan customers’ ability to repay loans; |
|
§ |
the costs and effects of litigation and of unexpected or adverse outcomes in such litigation; |
|
§ |
the impact of new or changes in existing laws and regulations, including the Tax Cuts and Jobs Act and Dodd-Frank Wall Street Reform and Consumer Protection Act of 2010 and the regulations promulgated there under; |
|
§ |
impacts of the capital and liquidity requirements of the Basel III standards and other regulatory pronouncements, regulations and rules; |
|
§ |
governmental monetary and fiscal policies, as well as legislative and regulatory changes; |
|
§ |
effects of short- and long-term federal budget and tax negotiations and their effect on economic and business conditions; |
|
§ |
the effect of changes in accounting policies and practices, as may be adopted by the regulatory agencies, as well as the Financial Accounting Standards Board and other accounting standard setters; |
|
§ |
the risks of changes in interest rates on the level and composition of deposits, loan demand, and the values of loan collateral, securities and interest rate protection agreements, as well as interest rate risks; |
|
§ |
the effects of competition from other commercial banks, thrifts, mortgage banking firms, consumer finance companies, credit unions, securities brokerage firms, insurance companies, money market and other mutual funds and other financial institutions operating in our market area and elsewhere, including institutions operating locally, regionally, nationally and internationally, together with such competitors offering banking products and services by mail, telephone, computer and the internet; |
|
§ |
technological changes; |
|
§ |
the interruption or breach in security of our information systems and other technological risks and attacks resulting in failures or disruptions in customer account management, general ledger processing and loan or deposit updates and potential impacts resulting therefrom including additional costs, reputational damage, regulatory penalties, and financial losses; |
|
§ |
acquisitions and integration of acquired businesses; |
|
§ |
the failure of assumptions underlying the establishment of reserves for loan losses and estimations of values of collateral and various financial assets and liabilities; |
|
§ |
volatilities in the securities markets; |
|
§ |
acts of war or terrorism; |
|
§ |
disruption of credit and equity markets; and |
|
§ |
the risk that our analyses of these risks and forces could be incorrect and/or that the strategies developed to address them could be unsuccessful. |
The Company cautions readers not to place undue reliance on forward-looking statements, which reflect analyses only as of the date of this document. The Company has no obligation to update any forward-looking statements to reflect events or circumstances after the date of this document.
Readers should review the risk factors described in this document and other documents that we file or furnish, from time- to-time, with the Securities and Exchange Commission, including quarterly reports filed on Form 10-Q and any current reports filed or furnished on Form 8-K.
Fidelity D & D Bancorp, Inc. (the Company) was incorporated in the Commonwealth of Pennsylvania, on August 10, 1999, and is a bank holding company, whose wholly-owned state chartered commercial bank is The Fidelity Deposit and Discount Bank (the Bank) (collectively, the Company). The Company is headquartered at Blakely and Drinker Streets in Dunmore, Pennsylvania.
The Bank has offered a full range of traditional banking services since it commenced operations in 1903. The Bank has a personal and corporate trust department and also provides alternative financial and insurance products with asset management services. A full list of services provided by the Bank is detailed in the section entitled “Products and Services” contained
3
within the 2019 Annual Report to Shareholders, incorporated by reference. The service area is comprised of the Borough of Dunmore and the surrounding communities within Lackawanna and Luzerne counties in Northeastern Pennsylvania. In 2019, the Company had 6.78% of the Scranton-Wilkes-Barre metropolitan statistical area’s total deposit market share ranking 7th in total deposits. The Company had 189 full-time equivalent employees on December 31, 2019, which includes exempt officers, exempt, non-exempt and part-time employees.
In December 2019, the Company announced an agreement and plan of reorganization to acquire MNB Corporation (“MNB”) in a transaction valued on December 6, 2019 at $78.5 million. Under the terms of the agreement, MNB shareholders will receive as consideration 1.039 shares of Fidelity common stock for each share of MNB common stock that they own as of the closing date. MNB is the holding company of Merchants Bank of Bangor (“Merchants Bank”) which operates 9 retail community banking offices in Eastern Pennsylvania. Subject to the terms and conditions of the agreement, MNB will merge with and into the Company and Merchants Bank will merger with and into the Bank. The merger which is subject to shareholder approval of the Company, MNB shareholder approval, regulatory approvals and other customary closing conditions, is currently expected to close in the second quarter of 2020.
The banking business is highly competitive, and the success and profitability of the Company depends principally on its ability to compete in its market area. Competition includes, among other sources: local community banks; savings banks; regional banks; national banks; credit unions; savings & loans; insurance companies; money market funds; mutual funds; small loan companies and other financial services companies. The Company has been able to compete effectively with other financial institutions by emphasizing customer service enhanced by local decision making. These efforts enable the Company to establish long-term customer relationships and build customer loyalty by providing products and services designed to address their specific needs.
The banking industry is affected by general economic conditions including the effects of inflation, recession, unemployment, real estate values, trends in national and global economies and other factors beyond the Company’s control. The Company’s success is dependent, to a significant degree, on economic conditions in Northeastern Pennsylvania, especially within Lackawanna and Luzerne counties which the Company defines as its primary market area. An economic recession or a delayed economic recovery over a prolonged period of time in the Company’s market could cause an increase in the level of the Company’s non-performing assets and loan losses, and thereby cause operating losses, impairment of liquidity and erosion of capital. There are no concentrations of loans or customers that, if lost, would have a material adverse effect on the continued business of the Company. There is no material concentration within a single industry or a group of related industries that is vulnerable to the risk of a near-term severe impact.
The Company’s profitability is significantly affected by general economic and competitive conditions, changes in market interest rates, government policies and actions of regulatory authorities. The Company’s loan portfolio is comprised principally of residential real estate, consumer, commercial and commercial real estate loans. The properties underlying the Company’s mortgages are concentrated in Northeastern Pennsylvania. Credit risk, which represents the possibility of the Company not recovering amounts due from its borrowers, is significantly related to local economic conditions in the areas where the properties are located as well as the Company’s underwriting standards. Economic conditions affect the market value of the underlying collateral as well as the levels of adequate cash flow and revenue generation from income-producing commercial properties.
During 2019, the national economy continued to improve with the unemployment rate dropping to 3.5% compared to 3.9% at the end of 2018. However, the unemployment rate in the Company’s local statistical market, Scranton-Wilkes-Barre, rose to 5.6% from 4.7% at the end of 2018. The local economy has been volatile in recent years and generally lags the national market trends. The Company’s credit function strives to mitigate the negative impact of economic conditions by maintaining strict underwriting principles for commercial and consumer lending and ensuring that home mortgage underwriting adheres to the standards of secondary market makers. In addition, the Company strives to accelerate the property foreclosure process thereby lessening the negative financial impact of foreclosed property ownership. Refer to Item 1A, “Risk Factors” for material risks and uncertainties that management believes affect the Company.
Federal and state banking laws contain numerous provisions that affect various aspects of the business and operations of the Company and the Bank. The Company is subject to, among others, the regulations of the Securities and Exchange Commission (the SEC) and the Federal Reserve Board (the FRB) and the Bank is subject to, among others, the regulations of the Pennsylvania Department of Banking and Securities, the Federal Deposit Insurance Corporation (the FDIC) and the rules promulgated by the Consumer Financial Protection Bureau (the CFPB) but continues to be examined and supervised by federal banking regulators for consumer compliance purposes. Refer to Part II, Item 7 “Supervision and Regulation” for descriptions of and references to applicable statutes and regulations which are not intended to be complete descriptions of these provisions or their effects on the Company or the Bank. They are summaries only and are qualified in their entirety by reference to such statutes and regulations. Applicable regulations relate to, among other things:
|
|
||
|
• operations |
• consolidation |
• disclosure |
|
• securities |
• reserves |
• community reinvestment |
|
• risk management |
• dividends |
• mergers |
|
• consumer compliance |
• branches |
• capital adequacy |
4
The Bank is examined periodically by the Pennsylvania Department of Banking and Securities and the FDIC.
The Company’s website address is http://www.bankatfidelity.com. The Company makes available through this website the annual reports on Form 10-K, quarterly reports on Form 10-Q and current reports on Form 8-K and amendments to those reports as soon as reasonably practical after filing with the SEC. You may read and copy any materials filed with the SEC at the SEC’s Public Reference Room at 100 F Street, NE, Washington, DC 20549. You may obtain information on the operation of the Public Reference Room by calling the SEC at 1-800-SEC-0330. The SEC also maintains an internet site that contains reports, proxy and information statements and other information about the Company at http://www.sec.gov.
The Company’s accounting policies and procedures are designed to comply with accounting principles generally accepted in the United States of America (GAAP). Refer to “Critical Accounting Policies,” which are incorporated by reference in Part II, Item 7.
An investment in the Company’s common stock is subject to risks inherent to the Company’s business. The material risks and uncertainties that management believes affect the Company are described below. Before making an investment decision, you should carefully consider the risks and uncertainties described below together with all of the other information included or incorporated by reference in this report. The risks and uncertainties described below are not the only ones facing the Company. Additional risks and uncertainties that management is not aware of or focused on or that management currently deems immaterial may also impair the Company’s business operations. This report is qualified in its entirety by these risk factors.
If any of the following risks actually occur, the Company’s financial condition and results of operations could be materially and adversely affected. If this were to happen, the value of the Company’s common stock could decline significantly, and you could lose all or part of your investment.
Risks Related to the Company’s Business
The Company’s business is subject to interest rate risk and variations in interest rates may negatively affect its financial performance.
Changes in the interest rate environment may reduce profits. The Company’s earnings and cash flows are largely dependent upon its net interest income. Net interest income is the difference between the interest earned on loans, securities and other interest-earning assets, and interest paid on deposits, borrowings and other interest-bearing liabilities. As prevailing interest rates change, net interest spreads are affected by the difference between the maturities and re-pricing characteristics of interest-earning assets and interest-bearing liabilities. In addition, loan volume and yields are affected by market interest rates on loans, and rising interest rates generally are associated with a lower volume of loan originations. An increase in the general level of interest rates may also adversely affect the ability of certain borrowers to pay the interest on and principal of their obligations. Accordingly, changes in levels of market interest rates could materially adversely affect the Company’s net interest spread, asset quality, loan origination volume and overall profitability.
The Company is subject to lending risk.
There are inherent risks associated with the Company’s lending activities. These risks include, among other things, the impact of changes in interest rates and changes in the economic conditions in the markets where the Company operates as well as those across the Commonwealth of Pennsylvania and the United States. Increases in interest rates and/or weakening economic conditions could adversely impact the ability of borrowers to repay outstanding loans or the value of the collateral securing these loans. The Company is also subject to various laws and regulations that affect its lending activities. Failure to comply with applicable laws and regulations could subject the Company to regulatory enforcement action that could result in the assessment of significant civil money penalties against the Company.
Commercial, commercial real estate and real estate construction loans are generally viewed as having more risk of default than residential real estate loans or consumer loans. These types of loans are also typically larger than residential real estate loans and consumer loans. Because these loans generally have larger balances than residential real estate loans and consumer loans, the deterioration of one or a few of these loans could cause a significant increase in non-performing loans. An increase in non-performing loans could result in a net loss of earnings from these loans, an increase in the provision for possible loan losses and an increase in loan charge-offs, all of which could have a material adverse effect on the Company’s financial condition and results of operations.
The Company’s allowance for possible loan losses may be insufficient.
The Company maintains an allowance for possible loan losses, which is a reserve established through a provision for possible loan losses charged to expense, that represents management’s best estimate of probable losses that have been incurred within the existing portfolio of loans. The allowance, in the judgment of management, is necessary to reserve for estimated loan losses and risks inherent in the loan portfolio. The level of the allowance reflects management’s continuing evaluation of industry concentrations; specific credit risks; loan loss experience; current loan portfolio quality; present economic, political and regulatory conditions and unidentified losses inherent in the current loan portfolio. The determination of the appropriate level of the allowance for possible loan losses inherently involves a high degree of subjectivity and requires the Company to
5
make significant estimates of current credit risks and future trends, all of which may undergo material changes. Changes in economic conditions affecting borrowers, new information regarding existing loans, identification of additional problem loans and other factors, both within and outside of the Company’s control, may require an increase in the allowance for possible loan losses. In addition, bank regulatory agencies periodically review the Company’s allowance for loan losses and may require an increase in the provision for possible loan losses or the recognition of further loan charge-offs, based on judgments different than those of management. Further, if charge-offs in future periods exceed the allowance for possible loan losses, the Company will need additional provisions to increase the allowance for possible loan losses. Any increases in the allowance for loan losses will result in a decrease in net income and capital and may have a material adverse effect on the Company’s financial condition and results of operations.
The FASB has recently issued an accounting standard update that will result in a significant change in how we recognize credit losses and may have a material impact on our financial condition or results of operations.
In June 2016, the Financial Accounting Standards Board (“FASB”) issued an accounting standard update (“ASU”) entitled “Financial Instruments-Credit Losses (Topic 326), Measurement of Credit Losses on Financial Instruments,” which replaces the current “incurred loss” model for recognizing credit losses with an “expected loss” model referred to as the Current Expected Credit Loss (“CECL”) model. Under the CECL model, banks will be required to present certain financial assets carried at amortized cost, such as loans held for investment and held-to-maturity debt securities, at the net amount expected to be collected. The measurement of expected credit losses is to be based on information about past events, including historical experience, current conditions, and reasonable and supportable forecasts that affect the collectability of the reported amount. This measurement will take place at the time the financial asset is first added to the balance sheet and periodically thereafter. This differs significantly from the “incurred loss” model required under current generally accepted accounting principles (“GAAP”), which delays recognition until it is probable a loss has been incurred.
Until recently, the new CECL standard was expected to become effective for the Company on January 1, 2020, and for interim periods within that year. In November 2019, FASB agreed to delay implementation of the new CECL standard for certain companies, including those companies that qualify as a smaller reporting company under SEC rules, until January 1, 2023. The Company currently expects to continue to qualify as a smaller reporting company, based upon the current SEC definition, and as a result will likely be able to defer implementation of the new CECL standard for a period of time. Nevertheless, the Company continues to evaluate the impact the CECL model will have on the accounting for credit losses, but the Company expects to recognize a one-time cumulative-effect adjustment to the allowance for loan losses as of the beginning of the first reporting period in which the new standard is effective, consistent with regulatory expectations set forth in interagency guidance issued at the end of 2016. The Company cannot yet determine the magnitude of any such one-time cumulative adjustment or of the overall impact of the new standard on its business, financial condition, and results of operations. Accordingly, it is possible the new standard may require an increase in the allowance for credit losses for the estimated life of the financial asset, including an allowance for debt securities. The amount of the change in the allowance for credit losses, if any, resulting from the new guidance will be impacted by the portfolio composition and asset quality at the adoption date, as well as economic conditions and forecasts at the time of adoption. Moreover, the CECL model may create more volatility in the level of the allowance for loan losses. If Fidelity is required to materially increase the level of its allowance for loan losses for any reason, such increase could adversely affect its business, financial condition and results of operations.
If we conclude that the decline in value of any of our investment securities is other-than-temporary, we will be required to write down the credit-related portion of the impairment of that security through a charge to earnings.
We review our investment securities portfolio at each quarter-end reporting period to determine whether the fair value is below the current carrying value. When the fair value of any of our investment securities has declined below its carrying value, we are required to assess whether the decline is other-than-temporary. If we conclude that the decline is other-than-temporary, we will be required to write down the credit-related portion of the impairment of that security through a charge to earnings.
The Basel III capital requirements may require us to maintain higher levels of capital, which could reduce our profitability.
Basel III targets higher levels of base capital, certain capital buffers and a migration toward common equity as the key source of regulatory capital. Although the new capital requirements are phased in over the next decade and may change substantially before final implementation, Basel III signals a growing effort by domestic and international bank regulatory agencies to require financial institutions, including depository institutions, to maintain higher levels of capital. The direction of the Basel III implementation activities or other regulatory viewpoints could require additional capital to support our business risk profile prior to final implementation of the Basel III standards. If the Company and the Bank are required to maintain higher levels of capital, the Company and the Bank may have fewer opportunities to invest capital into interest-earning assets, which could limit the profitable business operations available to the Company and the Bank and adversely impact our financial condition and results of operations.
The Company may need or be compelled to raise additional capital in the future, but that capital may not be available when it is needed and on terms favorable to current shareholders.
Federal banking regulators require the Company and Bank to maintain adequate levels of capital to support their operations.
6
These capital levels are determined and dictated by law, regulation and banking regulatory agencies. In addition, capital levels are also determined by the Company’s management and board of directors based on capital levels that they believe are necessary to support the Company’s business operations. The Company is evaluating its present and future capital requirements and needs, is developing a comprehensive capital plan and is analyzing capital raising alternatives, methods and options. Even if the Company succeeds in meeting the current regulatory capital requirements, the Company may need to raise additional capital in the near future to support possible loan losses during future periods or to meet future regulatory capital requirements.
Further, the Company’s regulators may require it to increase its capital levels. If the Company raises capital through the issuance of additional shares of its common stock or other securities, it may dilute the ownership interests of current investors and may dilute the per-share book value and earnings per share of its common stock. Furthermore, it may have an adverse impact on the Company’s stock price. New investors may also have rights, preferences and privileges senior to the Company’s current shareholders, which may adversely impact its current shareholders. The Company’s ability to raise additional capital will depend on conditions in the capital markets at that time, which are outside its control, and on its financial performance. Accordingly, the Company cannot assure you of its ability to raise additional capital on terms and time frames acceptable to it or to raise additional capital at all. If the Company cannot raise additional capital in sufficient amounts when needed, its ability to comply with regulatory capital requirements could be materially impaired. Additionally, the inability to raise capital in sufficient amounts may adversely affect the Company’s operations, financial condition and results of operations.
The Company is subject to environmental liability risk associated with lending activities.
A significant portion of the Company’s loan portfolio is secured by real property. During the ordinary course of business, the Company may foreclose on and take title to properties securing certain loans. In doing so, there is a risk that hazardous or toxic substances could be found on these properties. If hazardous or toxic substances are found, the Company may be liable for remediation costs, as well as for personal injury and property damage. Environmental laws may require the Company to incur substantial expense and may materially reduce the affected property’s value or limit the Company’s ability to use or sell the affected property. In addition, future laws or more stringent interpretations or enforcement policies with respect to existing laws may increase the Company’s exposure to environmental liability. Although the Company has policies and procedures to perform an environmental review before initiating any foreclosure action on real property, these reviews may not be sufficient to detect all potential environmental hazards. The remediation costs and any other financial liabilities associated with an environmental hazard could have a material adverse effect on the Company’s financial condition and results of operations.
The Company’s profitability depends significantly on economic conditions in the Commonwealth of Pennsylvania and the local region in which it conducts business.
The Company’s success depends primarily on the general economic conditions of the Commonwealth of Pennsylvania and the specific local markets in which the Company operates. Unlike larger national or other regional banks that are more geographically diversified, the Company provides banking and financial services to customers primarily in Lackawanna and Luzerne Counties in Northeastern Pennsylvania. The local economic conditions in these areas have a significant impact on the demand for the Company’s products and services as well as the ability of the Company’s customers to repay loans, the value of the collateral securing loans and the stability of the Company’s deposit funding sources. A significant decline in general economic conditions caused by inflation, recession, acts of terrorism, an outbreak of hostilities or other international or domestic occurrences, unemployment, changes in securities markets or other factors could impact these local economic conditions and, in turn, have a material adverse effect on the Company’s financial condition and results of operations.
There is no assurance that the Company will be able to successfully compete with others for business.
The Company competes for loans, deposits and investment dollars with numerous regional and national banks and other community banking institutions, as well as other kinds of financial institutions and enterprises, such as securities firms, insurance companies, savings associations, credit unions, mortgage brokers and private lenders. Many competitors have substantially greater resources than the Company does, and operate under less stringent regulatory environments. The differences in resources and regulations may make it more difficult for the Company to compete profitably, reduce the rates that it can earn on loans and on its investments, increase the rates it must offer on deposits and other funds, and adversely affect its overall financial condition and earnings.
The Company is subject to extensive government regulation and supervision.
The Company, primarily through the Bank, is subject to extensive federal and state regulation and supervision. Banking regulations are primarily intended to protect depositors’ funds, federal deposit insurance funds and the banking system as a whole, not shareholders. These regulations affect the Company’s lending practices, capital structure, investment practices, dividend policy and growth, among other things. Federal or commonwealth regulatory agencies continually review banking laws, regulations and policies for possible changes. Changes to statutes, regulations or regulatory policies, including changes in interpretation or implementation of statutes, regulations or policies, could affect the Company in substantial and unpredictable ways. Such changes could subject the Company to additional costs, limit the types of financial services and products the Company may offer and/or increase the ability of non-banks to offer competing financial services and products,
7
among other things. Failure to comply with laws, regulations or policies could result in sanctions by regulatory agencies, civil money penalties and/or reputation damage, which could have a material adverse effect on the Company’s business, financial condition and results of operations. While the Company has policies and procedures designed to prevent any such violations, there can be no assurance that such violations will not occur.
The Company’s controls and procedures may fail or be circumvented.
Management regularly reviews and updates the Company’s internal controls, disclosure controls and procedures, and corporate governance policies and procedures. Any system of controls, however well designed and operated, is based in part on certain assumptions and can provide only reasonable, not absolute, assurances that the objectives of the system are met. Any failure or circumvention of the Company’s controls and procedures or failure to comply with regulations related to controls and procedures could have a material adverse effect on the Company’s business, results of operations and financial condition.
New lines of business or new products and services may subject the Company to additional risks.
From time-to-time, the Company may implement new lines of business or offer new products and services within existing lines of business. There are substantial risks and uncertainties associated with these efforts, particularly in instances where the markets are not fully developed. In developing and marketing new lines of business and/or new products and services the Company may invest significant time and resources. Initial timetables for the introduction and development of new lines of business and/or new products or services may not be achieved and price and profitability targets may not prove feasible. External factors, such as compliance with regulations, competitive alternatives, and shifting market preferences, may also impact the successful implementation of a new line of business or a new product or service. Furthermore, any new line of business and/or new product or service could have a significant impact on the effectiveness of the Company’s system of internal controls. Failure to successfully manage these risks in the development and implementation of new lines of business or new products or services could have a material adverse effect on the Company’s business, results of operations and financial condition.
The Company’s future acquisitions could dilute your ownership and may cause it to become more susceptible to adverse economic events.
The Company may use its common stock to acquire other companies or make investments in banks and other complementary businesses in the future. The Company may issue additional shares of common stock to pay for future acquisitions, which would dilute your ownership interest in the Company. Future business acquisitions could be material to the Company, and the degree of success achieved in acquiring and integrating these businesses into the Company could have a material effect on the value of the Company’s common stock. In addition, any acquisition could require it to use substantial cash or other liquid assets or to incur debt. In those events, it could become more susceptible to economic downturns and competitive pressures.
The Company may not be able to attract and retain skilled people.
The Company’s success depends, in large part, on its ability to attract and retain key people. Competition for the best people in most activities engaged in by the Company can be intense and the Company may not be able to hire people or to retain them. The unexpected loss of services of one or more of the Company’s key personnel could have a material adverse impact on the Company’s business because of their skills, knowledge of the Company’s market, years of industry experience and the difficulty of promptly finding qualified replacement personnel.
The Company’s information systems may experience an interruption or breach in security.
The Company relies heavily on communications and information systems to conduct its business. Any failure, interruption or breach in security of these systems could result in failures or disruptions in the Company’s customer relationship management, general ledger, deposit, loan and other systems. The Company has policies and procedures designed to prevent or limit the effect of the failure, interruption or security breach of its information systems, however there can be no assurance that any such failures, interruptions or security breaches will not occur. The occurrence of any failures, interruptions or security breaches of the Company’s information systems could damage the Company’s reputation, result in a loss of customer business, subject the Company to additional regulatory scrutiny, or expose the Company to civil litigation and possible financial liability, any of which could have a material adverse effect on the Company’s financial condition and results of operations.
The Company continually encounters technological change.
The financial services industry is continually undergoing rapid technological change with frequent introductions of new technology-driven products and services. The effective use of technology increases efficiency and enables financial institutions to better serve customers and to reduce costs. The Company’s future success depends, in part, upon its ability to address the needs of its customers by using technology to provide products and services that will satisfy customer demands, as well as to create additional efficiencies in the Company’s operations. Many of the Company’s competitors have substantially greater resources to invest in technological improvements. The Company may not be able to effectively implement new technology-driven products and services or be successful in marketing these products and services to its customers. Failure to successfully keep pace with technological change affecting the financial services industry could have a
8
material adverse impact on the Company’s business and, in turn, the Company’s financial condition and results of operations.
The operations of our business, including our interaction with customers, are increasingly done via electronic means, and this has increased our risks related to cyber security.
We are exposed to the risk of cyber-attacks in the normal course of business. In general, cyber incidents can result from deliberate attacks or unintentional events. We have observed an increased level of attention in the industry focused on cyber-attacks that include, but are not limited to, gaining unauthorized access to digital systems for purposes of misappropriating assets or sensitive information, corrupting data, or causing operational disruption. To combat against these attacks, policies and procedures are in place to prevent or limit the effect of the possible security breach of our information systems and we have insurance against some cyber-risks and attacks. While we have not incurred any material losses related to cyber-attacks, nor are we aware of any specific or threatened cyber-incidents as of the date of this report, we may incur substantial costs and suffer other negative consequences if we fall victim to successful cyber-attacks. Such negative consequences could include remediation costs that may include liability for stolen assets or information and repairing system damage that may have been caused; deploying additional personnel and protection technologies, training employees, and engaging third party experts and consultants; lost revenues resulting from unauthorized use of proprietary information or the failure to retain or attract customers following an attack; litigation; and reputational damage adversely affecting customer or investor confidence.
The Company is subject to claims and litigation pertaining to fiduciary responsibility.
From time-to-time, customers make claims and take legal action pertaining to the Company’s performance of its fiduciary responsibilities. Whether customer claims and legal action related to the Company’s performance of its fiduciary responsibilities are founded or unfounded, if such claims and legal actions are not resolved in a manner favorable to the Company, they may result in significant financial liability and/or adversely affect the market perception of the Company and its products and services as well as impact customer demand for those products and services. Any financial liability or reputation damage could have a material adverse effect on the Company’s business, which, in turn, could have a material adverse effect on the Company’s financial condition and results of operations.
Pennsylvania Business Corporation Law and various anti-takeover provisions under our articles and bylaws could impede the takeover of the Company.
Various Pennsylvania laws affecting business corporations may have the effect of discouraging offers to acquire the Company, even if the acquisition would be advantageous to shareholders. In addition, we have various anti-takeover measures in place under our articles of incorporation and bylaws, including a supermajority vote requirement for mergers, a staggered board of directors, and the absence of cumulative voting. Any one or more of these measures may impede the takeover of the Company without the approval of our board of directors and may prevent our shareholders from taking part in a transaction in which they could realize a premium over the current market price of our common stock.
The Company is a holding company and relies on dividends from its banking subsidiary for substantially all of its revenue and its ability to make dividends, distributions, and other payments.
As a bank holding company, the Company’s ability to pay dividends depends primarily on its receipt of dividends from its subsidiary bank. Dividend payments from the bank are subject to legal and regulatory limitations, generally based on net profits and retained earnings, imposed by bank regulatory agencies. The ability of the bank to pay dividends is also subject to profitability, financial condition, regulatory capital requirements, capital expenditures and other cash flow requirements. There is no assurance that the bank will be able to pay dividends in the future or that the Company will generate cash flow to pay dividends in the future. The Company’s failure to pay dividends on its common stock may have a material adverse effect on the market price of its common stock.
The Company’s banking subsidiary may be required to pay higher FDIC insurance premiums or special assessments which may adversely affect its earnings.
The Company generally is unable to control the amount of premiums or special assessments that its subsidiary is required to pay for FDIC insurance. Any future changes in the calculation or assessment of FDIC insurance premiums may have a material adverse effect on our results of operations, financial condition, and our ability to continue to pay dividends on our common stock at the current rate or at all.
Severe weather, natural disasters, acts of war or terrorism, pandemics and other external events could significantly impact the Company’s business.
Severe weather, natural disasters, acts of war or terrorism, pandemics and other adverse external events could have a significant impact on the Company’s ability to conduct business. Such events could affect the stability of the Company’s deposit base, impair the ability of borrowers to repay outstanding loans, impair the value of collateral securing loans, cause significant property damage, result in loss of revenue and/or cause the Company to incur additional expenses. Severe weather or natural disasters, acts of war or terrorism, pandemics or other adverse external events may occur in the future. Although management has established disaster recovery policies and procedures, the occurrence of any such event could have a material adverse effect on the Company’s business, which, in turn, could have a material adverse effect on the Company’s financial condition and results of operations.
9
The increasing use of social media platforms presents new risks and challenges and our inability or failure to recognize, respond to and effectively manage the accelerated impact of social media could materially adversely impact our business.
There has been a marked increase in the use of social media platforms, including weblogs (blogs), social media websites, and other forms of Internet-based communications which allow individuals access to a broad audience of consumers and other interested persons. Social media practices in the banking industry are evolving, which creates uncertainty and risk of noncompliance with regulations applicable to our business. Consumers value readily available information concerning businesses and their goods and services and often act on such information without further investigation and without regard to its accuracy. Many social media platforms immediately publish the content their subscribers and participants post, often without filters or checks on accuracy of the content posted. Information posted on such platforms at any time may be adverse to our interests and/or may be inaccurate. The dissemination of information online could harm our business, prospects, financial condition, and results of operations, regardless of the information’s accuracy. The harm may be immediate without affording us an opportunity for redress or correction.
Other risks associated with the use of social media include improper disclosure of proprietary information, negative comments about our business, exposure of personally identifiable information, fraud, out-of-date information, and improper use by employees and customers. The inappropriate use of social media by our customers or employees could result in negative consequences including remediation costs including training for employees, additional regulatory scrutiny and possible regulatory penalties, litigation or negative publicity that could damage our reputation adversely affecting customer or investor confidence.
Federal income tax reform could have unforeseen effects on our financial condition and results of operations.
On December 22, 2017, the President of the United States signed into law H.R. 1, originally known as the “Tax Cuts and Jobs Act.” The Tax Cuts and Jobs Act includes a number of provisions, including the lowering of the U.S. corporate tax rate from 35 percent to 21 percent, effective January 1, 2018. There are also provisions that may partially offset the benefit of such rate reduction. Financial statement impacts include adjustments for, among other things, the re-measurement of deferred tax assets and liabilities. While there are benefits, there is also substantial uncertainty regarding the details of U.S. Tax Reform. The long-term intended and unintended consequences of Tax Cuts and Jobs Act on our business and on holders of our common shares is uncertain and could be adverse. The Company anticipates that the impact of Tax Cuts and Jobs Act may be material to our business, financial condition and results of operations.
Risks Associated with the Company’s Common Stock
The Company’s stock price can be volatile.
Stock price volatility may make it more difficult for you to resell your common stock when you want and at prices you find attractive. The Company’s stock price can fluctuate significantly in response to a variety of factors including, among other things:
Actual or anticipated variations in quarterly results of operations.
Recommendations by securities analysts.
Operating and stock price performance of other companies that investors deem comparable to the Company.
News reports relating to trends, concerns and other issues in the financial services industry.
Perceptions in the marketplace regarding the Company and/or its competitors.
New technology used, or services offered, by competitors.
Significant acquisitions or business combinations, strategic partnerships, joint ventures or capital commitments by or involving the Company or its competitors.
Failure to integrate acquisitions or realize anticipated benefits from acquisitions.
Changes in government regulations.
Geopolitical conditions such as acts or threats of terrorism or military conflicts.
General market fluctuations, industry factors and general economic and political conditions and events, such as economic slowdowns or recessions, interest rate changes or credit loss trends, could also cause the Company’s stock price to decrease regardless of operating results.
The trading volume in the Company’s common stock is less than that of other larger financial services companies.
The Company’s common stock is listed for trading on Nasdaq and the trading volume in its common stock is less than that of other larger financial services companies. A public trading market having the desired characteristics of depth, liquidity and orderliness depends on the presence in the marketplace of willing buyers and sellers of the Company’s common stock at any given time. This presence depends on the individual decisions of investors and general economic and market conditions over which the Company has no control. Given the lower trading volume of the Company’s common stock, significant sales of the Company’s common stock, or the expectation of these sales, could cause the Company’s stock price to fall.
10
Risks Associated with the Company’s Industry
Future governmental regulation and legislation could limit the Company’s future growth.
The Company is a registered bank holding company, and its subsidiary bank is a depository institution whose deposits are insured by the FDIC. As a result, the Company is subject to various regulations and examinations by various regulatory authorities. In general, statutes establish the corporate governance and eligible business activities for the Company, certain acquisition and merger restrictions, limitations on inter-company transactions such as loans and dividends, capital adequacy requirements, requirements for anti-money laundering programs and other compliance matters, among other regulations. The Company is extensively regulated under federal and state banking laws and regulations that are intended primarily for the protection of depositors, federal deposit insurance funds and the banking system as a whole. Compliance with these statutes and regulations is important to the Company’s ability to engage in new activities and consummate additional acquisitions.
In addition, the Company is subject to changes in federal and state tax laws as well as changes in banking and credit regulations, accounting principles and governmental economic and monetary policies. The Company cannot predict whether any of these changes may adversely and materially affect it. Federal and state banking regulators also possess broad powers to take supervisory actions as they deem appropriate. These supervisory actions may result in higher capital requirements, higher insurance
premiums and limitations on the Company’s activities that could have a material adverse effect on its business and profitability. While these statutes are generally designed to minimize potential loss to depositors and the FDIC insurance funds, they do not eliminate risk, and compliance with such statutes increases the Company’s expense, requires management’s attention and can be a disadvantage from a competitive standpoint with respect to non-regulated competitors.
The earnings of financial services companies are significantly affected by general business and economic conditions.
The Company’s operations and profitability are impacted by general business and economic conditions in the United States and abroad. These conditions include short-term and long-term interest rates, inflation, money supply, political issues, legislative and regulatory changes, fluctuations in both debt and equity capital markets, broad trends in industry and finance, and the strength of the U.S. economy and the local economies in which the Company operates, all of which are beyond the Company’s control. Deterioration in economic conditions could result in an increase in loan delinquencies and non-performing assets, decreases in loan collateral values and a decrease in demand for the Company’s products and services, among other things, any of which could have a material adverse impact on the Company’s financial condition and results of operations.
Financial services companies depend on the accuracy and completeness of information about customers and counterparties.
In deciding whether to extend credit or enter into other transactions, the Company may rely on information furnished by or on behalf of customers and counterparties, including financial statements, credit reports and other financial information. The Company may also rely on representations of those customers, counterparties or other third parties, such as independent auditors, as to the accuracy and completeness of that information. Reliance on inaccurate or misleading financial statements, credit reports or other financial information could have a material adverse impact on the Company’s business and, in turn, the Company’s financial condition and results of operations.
Consumers may decide not to use banks to complete their financial transactions.
Technology and other changes are allowing parties to complete financial transactions that historically have involved banks through alternative methods. For example, consumers can now maintain funds that would have historically been held as bank deposits in brokerage accounts or mutual funds. Consumers can also complete transactions such as paying bills and/or transferring funds directly without the assistance of banks. The process of eliminating banks as intermediaries, known as “disintermediation,” could result in the loss of fee income, as well as the loss of customer deposits and the related income generated from those deposits. The loss of these revenue streams and the lower cost deposits as a source of funds could have a material adverse effect on the Company’s financial condition and results of operations.
A protracted government shutdown or issues relating to debt and the deficit may adversely affect the Company.
Extended shutdowns of parts of the federal government could negatively impact the financial performance of certain customers and could impact customers’ future access to certain loan and guarantee programs. As a result, this could impact the Company’s business, financial condition and results of operations.
As a result of past difficulties of the federal government to reach agreement over federal debt and issues connected with the debt ceiling, certain rating agencies placed the United States government's long-term sovereign debt rating on their equivalent of negative watch and announced the possibility of a rating downgrade. The rating agencies, due to constraints related to the rating of the United States, also placed government-sponsored enterprises in which the Company invests and receives lines of credit on negative watch and a downgrade of the United States government's credit rating would trigger a similar downgrade in the credit rating of these government-sponsored enterprises. Furthermore, the credit rating of other entities, such as state and local governments, may also be downgraded should the United States government's credit rating be downgraded. The impact that a credit rating downgrade may have on the national and local economy could have an adverse effect on the Company’s financial condition and results of operations.
11
The regulatory environment for the financial services is being significantly impacted by financial regulatory reform initiatives in the United States and elsewhere, including Dodd-Frank and regulations promulgated to implement it.
Dodd-Frank, which was signed into law on July 21, 2010, comprehensively reforms the regulation of financial institutions, products and services. Dodd-Frank requires various federal regulatory agencies to implement numerous rules and regulations. Because the federal agencies are granted broad discretion in drafting these rules and regulations, many of the details and the impact of Dodd-Frank may not be known for many months or years.
While much of how the Dodd-Frank and other financial industry reforms will change our current business operations depends on the specific regulatory reforms and interpretations, many of which have yet to be released or finalized, it is clear that the reforms, both under Dodd-Frank and otherwise, will have a significant effect on our entire industry. Although Dodd-Frank and other reforms will affect a number of the areas in which we do business, it is not clear at this time the full extent of the adjustments that will be required and the extent to which we will be able to adjust our businesses in response to the requirements. Although it is difficult to predict the magnitude and extent of these effects at this stage, we believe compliance with Dodd-Frank and implementing its regulations and initiatives will negatively impact revenue and increase the cost of doing business, both in terms of transition expenses and on an ongoing basis, and it may also limit our ability to pursue certain business opportunities.
Risks related to the merger of MNB Corporation (MNB) into Fidelity
The combined company will incur significant transaction and merger-related costs in connection with the merger.
Fidelity expects to incur costs associated with combining the operations of the two companies. Fidelity is formulating detailed integration plans to deliver planned synergies. Additional unanticipated costs may be incurred in the integration of the businesses of Fidelity and MNB. Whether or not the merger is consummated, Fidelity will incur substantial expenses, such as legal, accounting, printing, contract termination fees, and financial advisory fees, in pursuing the merger. Although Fidelity expects that the elimination of duplicative costs, as well as the realization of other efficiencies related to the integration of the businesses, may offset incremental transaction and merger-related costs over time, the net benefit may not be achieved in the near term, or at all.
Some of the conditions to closing of the merger may result in delay or prevent completion of the merger, which may adversely affect the value of Fidelity’s and MNB’s securities.
Completion of the merger is conditioned upon the receipt of certain governmental consents and approvals, including consents and approvals required by the Federal Reserve Board, the FDIC, and the Pennsylvania Department of Banking and Securities. Failure to obtain these consents would prevent consummation of the merger. Even if the approvals are obtained, the effort involved may delay consummation of the merger. Governmental authorities may also impose conditions in connection with the merger that may adversely affect the combined company’s operations after the merger. However, Fidelity is not required to take any action or agree to any condition or restriction in connection with obtaining any approvals that would reasonably be expected to have a material adverse effect on Fidelity or the combined company.
The merger may distract Fidelity’s management team from its other responsibilities.
The merger could cause the management of Fidelity to focus their time and energies on matters related to the merger that otherwise would be directed to its business and operations. Any such distraction on the part of management, if significant, could affect management’s ability to service existing business and develop new business and adversely affect the combined company’s business and earnings following the merger.
If the merger is not completed, Fidelity and MNB will have incurred substantial expenses without realizing the expected benefits.
Fidelity will incur substantial expenses in connection with the merger. The completion of the merger depends on the satisfaction of specified conditions and the receipt of regulatory approvals. Fidelity cannot guarantee that these conditions will be met. If the merger is not completed, these expenses could have a material adverse impact on the financial condition of Fidelity because it would not have realized the expected benefits from the merger.
In addition, if the merger is not completed, Fidelity may experience negative reactions from the financial markets and from their respective customers and employees. Fidelity also could be subject to litigation related to any failure to complete the merger or to enforcement proceedings commenced against Fidelity to perform its obligations under the reorganization agreement. If the merger is not completed, Fidelity cannot assure its shareholders that the risks described above will not materialize and will not materially affect the business, financial results, and stock price of Fidelity.
Litigation against Fidelity or MNB, or the members of the Fidelity or MNB board of directors, could prevent or delay the completion of the merger.
While Fidelity and MNB believe that any claims that may be asserted by purported shareholder plaintiffs related to the merger would be without merit, the results of any such potential legal proceedings are difficult to predict and such legal proceedings could delay or prevent the merger from being completed in a timely manner. If litigation were to be commenced related to the merger, such litigation could affect the likelihood of obtaining the required approvals from Fidelity
12
shareholders and MNB shareholders. Moreover, any litigation could be time consuming and expensive, and could divert the attention of the management of Fidelity and MNB away from their regular business. Any lawsuit adversely resolved against Fidelity, MNB, or members of the Fidelity or MNB board of directors could have a material adverse effect on each party’s business, financial condition, and results of operations.
Post-merger integration and operations may fail to achieve expected results.
The success of the transaction depends heavily on a smooth post-merger integration and operations of the combined The Fidelity Deposit and Discount Bank. Benefits of the transaction to shareholders may not be realized if the post-merger integration and operations are not well executed or well received by each bank’s historical customers.
Fidelity may fail to realize the cost savings it expects to achieve from the merger.
The success of the merger will depend, in part, on Fidelity’s ability to realize the estimated cost savings from combining the businesses of Fidelity and MNB. While Fidelity believes that the cost savings estimates are achievable, it is possible that the potential cost savings could be more difficult to achieve than Fidelity anticipates. Fidelity’s cost savings estimates also depend on its ability to combine the businesses of Fidelity and MNB in a manner that permits those cost savings to be realized. If Fidelity’s estimates are incorrect or it is unable to combine the two companies successfully, the anticipated cost savings may not be realized fully or at all or may take longer to realize than expected.
Combining Fidelity and MNB may be more difficult, costly, or time-consuming than expected.
Fidelity and MNB have operated, and, until the completion of the merger, will continue to operate, independently. Following the completion of the merger, the combination process could result in the loss of key employees, the disruption of Fidelity’s ongoing business, and inconsistencies in standards, controls, procedures and policies that adversely affect Fidelity’s ability to maintain relationships with clients and employees or achieve the anticipated benefits of the merger. As with any merger of financial institutions, there also may be disruptions that cause Fidelity to lose customers or cause customers to withdraw their deposits from Fidelity, or other unintended consequences that could have a material adverse effect on Fidelity’s results of operations or financial condition.
13
ITEM 1B: UNRESOLVED STAFF COMMENTS
None
As of December 31, 2019, the Company operated 12 full-service banking offices, of which six were owned and six were leased. None of the lessors of the properties leased by the Company are affiliated with the Company and all of the properties are located in the Commonwealth of Pennsylvania. The Company is headquartered at its owner-occupied main branch located on the corner of Blakely and Drinker Streets in Dunmore, PA. We believe each of our facilities is suitable and adequate to meet our current operational needs.
The following table provides information with respect to the principal properties from which the Bank conducts business:
|
Location |
Owned / leased* |
Type of use |
Full service |
Drive-thru |
ATM |
|||||
|
Drinker & Blakely Streets, Dunmore, PA |
Owned |
Main Branch (1) (2) |
x |
x |
x |
|||||
|
|
||||||||||
|
111 Green Ridge St., Scranton, PA |
|
Leased |
|
Green Ridge Branch (2) |
|
x |
|
x |
|
x |
|
|
||||||||||
|
1311 Morgan Hwy., Clarks Summit, PA |
|
Leased |
|
Abington Branch |
|
x |
|
x |
|
x |
|
|
||||||||||
|
1232 Keystone Industrial Park Rd., Dunmore, PA |
Owned |
Keystone Industrial Park Branch |
x |
x |
x |
|||||
|
|
||||||||||
|
338 North Washington Ave., Scranton, PA |
Owned |
Financial Center Branch (3) |
x |
x |
||||||
|
|
||||||||||
|
4010 Birney Ave., Moosic, PA |
|
Owned |
|
Moosic Branch |
|
x |
|
x |
|
x |
|
|
||||||||||
|
225 Kennedy Blvd., Pittston, PA |
|
Leased |
|
Pittston Branch |
|
x |
|
x |
|
x |
|
|
||||||||||
|
1598 Main St., Peckville, PA |
|
Leased |
|
Peckville Branch |
|
x |
|
x |
|
x |
|
|
||||||||||
|
247 Wyoming Ave., Kingston, PA |
|
Owned |
|
Kingston Branch |
|
x |
|
x |
|
x |
|
|
||||||||||
|
400 S. Main St., Scranton, PA |
|
Owned |
|
West Scranton Branch (2) |
|
x |
|
x |
|
x |
|
|
||||||||||
|
2363 Memorial Hwy., Dallas, PA |
|
Leased |
|
Back Mountain Branch |
|
x |
|
x |
|
|
|
|
||||||||||
|
1 South Mountain Blvd., Mountain Top, PA |
|
Leased |
|
Mountain Top Branch |
|
x |
|
x |
|
x |
*All of the owned properties are free of encumbrances. At the Green Ridge branch office, Back Mountain branch office, Mountain Top branch office and Pittston branch office, the Company leases the land from an unrelated third party, however the buildings are the Company’s own capital improvement.
|
(1) |
Executive and administrative, commercial lending, trust and asset management services are located at the Main Branch. |
|
(2) |
This office has two automated teller machines (ATMs). |
|
(3) |
Executive, mortgage and consumer lending, finance, operations and a full-service call center are located in this building. |
The Company also operates a wealth management office in Minersville, PA under a short-term lease agreement.
As of December 31, 2019, the Bank maintained four free standing 24-hour ATMs located at the following locations:
|
· |
The Shoppes at Montage, 1035 Shoppes Blvd., Moosic, PA; |
|
· |
Mountain Plaza Shopping Mall, 307 Moosic St., Scranton, PA; |
|
· |
Antonio’s Pizza, 45 Luzerne St., West Pittston, PA; |
|
· |
Back Mountain, 32 Dallas Shopping Ctr., Dallas, PA. |
Foreclosed assets held-for-sale includes other real estate owned (ORE). The Company had seven ORE properties as of December 31, 2019, which stemmed from seven unrelated borrowers. Upon possession, foreclosed properties are recorded on the Company’s balance sheet at the lower of cost or fair value. For a further discussion of ORE properties, see “Foreclosed assets held-for-sale”, located in the comparison of financial condition section of managements’ discussion and analysis.
14
The nature of the Company’s business generates some litigation involving matters arising in the ordinary course of business. However, in the opinion of the Company after consulting with legal counsel, no legal proceedings are pending, which, if determined adversely to the Company or the Bank, would have a material effect on the Company’s undivided profits or financial condition or results of operations. No legal proceedings are pending other than ordinary routine litigation incidental to the business of the Company and the Bank. In addition, to management’s knowledge, no governmental authorities have initiated or contemplated any material legal actions against the Company or the Bank.
ITEM 4: MINE SAFETY DISCLOSURES
Not Applicable
PART II
ITEM 5: MARKET FOR REGISTRANT’S COMMON EQUITY, RELATED STOCKHOLDER MATTERS AND ISSUER PURCHASES OF EQUITY SECURITIES
The common stock of the Company is listed on Nasdaq and traded on The NASDAQ Global Market under the symbol “FDBC.” Shareholders requesting information about the Company’s common stock may contact:
Salvatore R. DeFrancesco, Jr., Treasurer
Fidelity D & D Bancorp, Inc.
Blakely and Drinker Streets
Dunmore, PA 18512
(570) 342-8281
The Company’s common stock began trading on the Nasdaq Global Market on October 6, 2017. Dividends are determined and declared by the Board of Directors of the Company. The Company expects to continue to pay cash dividends in the future; however, future dividends are dependent upon earnings, financial condition, capital strength and other factors of the Company. For a further discussion of regulatory capital requirements see Note 15, “Regulatory Matters,” contained within the notes to the consolidated financial statements, incorporated by reference in Part II, Item 8.
The Company offers a dividend reinvestment plan (DRP) for its shareholders. The DRP provides shareholders with a convenient and economical method of investing cash dividends payable on their common stock and the opportunity to make voluntary optional cash payments to purchase additional shares of the Company’s common stock. Participants pay no brokerage commissions or service charges when they acquire additional shares of common stock through the DRP. The administrator may purchase shares directly from the Company, in the open market, in negotiated transactions with third parties or using a combination of these methods.
The Company had approximately 1,295 shareholders at December 31, 2019 and 1,314 shareholders as of February 29, 2020. The number of shareholders is the actual number of individual shareholders of record. Each security depository is considered a single shareholder for purposes of determining the approximate number of shareholders.
15
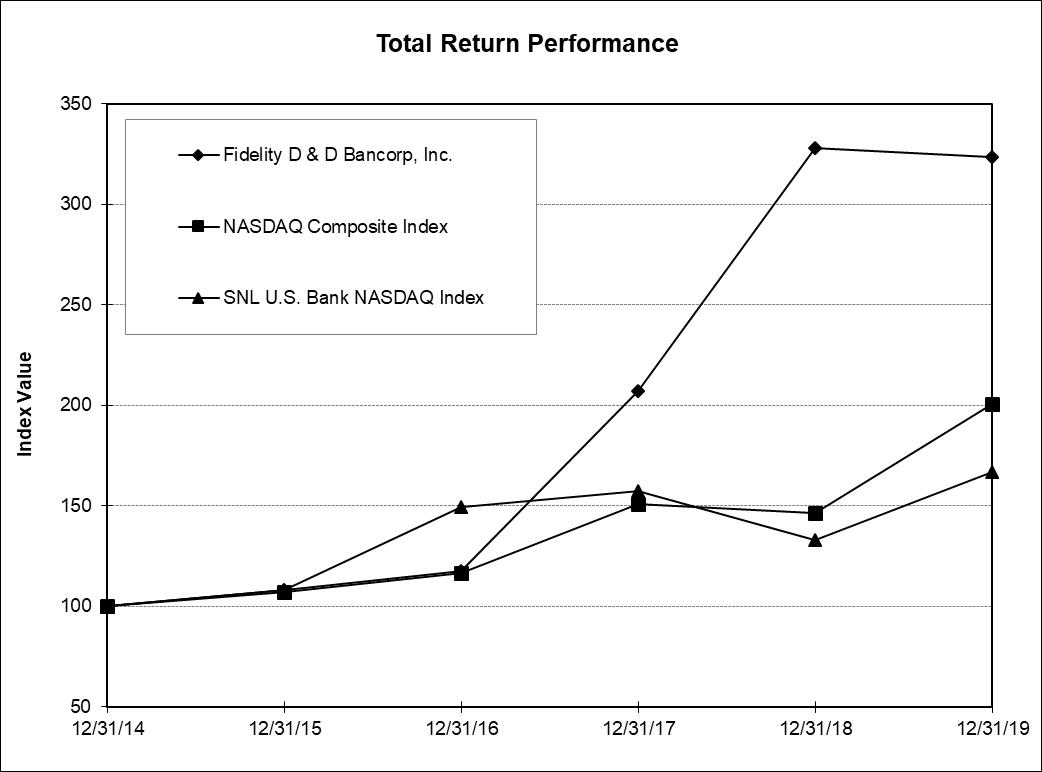
Performance graph
The following graph and table compare the cumulative total shareholder return on the Company’s common stock against the cumulative total return of the NASDAQ Composite and SNL U.S. Bank NASDAQ index (the SNL NASDAQ index) for the period of five fiscal years commencing January 1, 2015, and ending December 31, 2019. As of December 31, 2019, the SNL NASDAQ index consisted of 270 banks. A listing of the banks that comprise the SNL NASDAQ index can be found on the Company’s website at www.bankatfidelity.com and then on the bottom of the page clicking on, Investor Relations, Fidelity D & D Bancorp Stock, Stock Information, List of all companies in The SNL U.S. Bank NASDAQ index link at bottom of page. The graph illustrates the cumulative investment return to shareholders, based on the assumption that a $100 investment was made on December 31, 2014, in each of: the Company’s common stock, the NASDAQ Composite and the SNL NASDAQ index. All cumulative total returns are computed assuming the reinvestment of dividends into the applicable securities. The shareholder return shown on the graph and table below is not necessarily indicative of future performance:
|
|
Period Ending |
||||||
|
|
Index |
12/31/14 |
12/31/15 |
12/31/16 |
12/31/17 |
12/31/18 |
12/31/19 |
|
|
Fidelity D & D Bancorp, Inc. |
100.00 | 108.09 | 117.40 | 207.23 | 327.98 | 323.47 |
|
|
NASDAQ Composite Index |
100.00 | 106.96 | 116.45 | 150.96 | 146.67 | 200.49 |
|
|
SNL U.S. Bank NASDAQ Index |
100.00 | 107.95 | 149.68 | 157.58 | 132.82 | 166.75 |
|
|
|||||||
16
ITEM 6: SELECTED FINANCIAL DATA
Set forth below are our selected consolidated financial and other data. This financial data is derived in part from, and should be read in conjunction with the consolidated financial statements and notes thereto included in Part II, Item 8 of this report:
|
|
||||||||||
|
(dollars in thousands except per share data) |
||||||||||
|
|
||||||||||
|
Balance sheet data: |
2019 |
2018 |
2017 |
2016 |
2015 |
|||||
|
Total assets |
$ |
1,009,927 |
$ |
981,102 |
$ |
863,637 |
$ |
792,944 |
$ |
729,358 |
|
Total investment securities |
185,117 | 182,810 | 157,385 | 130,037 | 125,232 | |||||
|
Net loans and leases |
743,663 | 718,317 | 638,172 | 595,541 | 551,969 | |||||
|
Loans held-for-sale |
1,643 | 5,707 | 2,181 | 2,854 | 1,421 | |||||
|
Total deposits |
835,737 | 770,183 | 730,146 | 703,459 | 620,675 | |||||
|
Short-term borrowings |
37,839 | 76,366 | 18,502 | 4,223 | 28,204 | |||||
|
FHLB advances |
15,000 | 31,704 | 21,204 |
- |
- |
|||||
|
Total shareholders' equity |
106,835 | 93,557 | 87,383 | 80,631 | 76,351 | |||||
|
|
||||||||||
|
Operating data for the year ended: |
||||||||||
|
Total interest income |
$ |
39,269 |
$ |
35,330 |
$ |
31,064 |
$ |
27,495 |
$ |
26,014 |
|
Total interest expense |
7,554 | 4,873 | 3,223 | 2,358 | 2,529 | |||||
|
Net interest income |
31,715 | 30,457 | 27,841 | 25,137 | 23,485 | |||||
|
Provision for loan losses |
1,085 | 1,450 | 1,450 | 1,025 | 1,075 | |||||
|
Net interest income after provision for loan losses |
30,630 | 29,007 | 26,391 | 24,112 | 22,410 | |||||
|
Other income |
10,193 | 9,200 | 8,367 | 8,005 | 7,533 | |||||
|
Other operating expense |
26,921 | 25,072 | 24,836 | 21,655 | 21,022 | |||||
|
Income before income taxes |
13,902 | 13,135 | 9,922 | 10,462 | 8,921 | |||||
|
Provision for income taxes |
2,326 | 2,129 | 1,206 | 2,769 | 1,818 | |||||
|
Net income |
$ |
11,576 |
$ |
11,006 |
$ |
8,716 |
$ |
7,693 |
$ |
7,103 |
|
|
||||||||||
|
Per share data: |
||||||||||
|
Net income per share, basic |
$ |
3.06 |
$ |
2.93 |
$ |
2.35 |
$ |
2.09 |
$ |
1.94 |
|
Net income per share, diluted |
$ |
3.03 |
$ |
2.90 |
$ |
2.33 |
$ |
2.09 |
$ |
1.94 |
|
Dividends declared |
$ |
4,037 |
$ |
3,708 |
$ |
3,285 |
$ |
3,061 |
$ |
2,844 |
|
Dividends per share |
$ |
1.06 |
$ |
0.98 |
$ |
0.88 |
$ |
0.83 |
$ |
0.77 |
|
Book value per share |
$ |
28.25 |
$ |
24.89 |
$ |
23.40 |
$ |
21.91 |
$ |
20.83 |
|
Weighted-average shares outstanding |
3,779,582 | 3,752,704 | 3,711,490 | 3,679,507 | 3,658,687 | |||||
|
Shares outstanding |
3,781,500 | 3,759,426 | 3,734,478 | 3,680,707 | 3,665,107 | |||||
|
|
||||||||||
|
Ratios: |
||||||||||
|
Return on average assets |
1.18% | 1.20% | 1.03% | 1.02% | 1.00% | |||||
|
Return on average equity |
11.49% | 12.36% | 10.34% | 9.64% | 9.55% | |||||
|
Net interest margin (1) (2) |
3.52% | 3.59% | 3.66% | 3.68% | 3.68% | |||||
|
Efficiency ratio (1) |
63.11% | 62.10% | 66.25% | 63.20% | 65.49% | |||||
|
Expense ratio |
1.70% | 1.73% | 1.95% | 1.81% | 1.89% | |||||
|
Allowance for loan losses to loans |
1.29% | 1.34% | 1.42% | 1.55% | 1.70% | |||||
|
Dividend payout ratio |
34.88% | 33.69% | 37.69% | 39.79% | 40.04% | |||||
|
Equity to assets |
10.58% | 9.54% | 10.12% | 10.17% | 10.47% | |||||
|
Equity to deposits |
12.78% | 12.15% | 11.97% | 11.46% | 12.30% | |||||
(1) Non-GAAP disclosure – For a discussion on these ratios, see “Non-GAAP Financial Measures,” located in management’s discussion and analysis.
(2) Net interest margin is calculated using the fully-taxable equivalent (FTE) yield on tax-exempt securities and loans. See the “Non-GAAP Financial Measures” in management’s discussion and analysis for the FTE adjustments.
17
ITEM 7: MANAGEMENT’S DISCUSSION AND ANALYSIS OF FINANCIAL CONDITION AND RESULTS OF OPERATION
Critical accounting policies
The presentation of financial statements in conformity with U.S. GAAP requires management to make estimates and assumptions that affect many of the reported amounts and disclosures. Actual results could differ from these estimates.
A material estimate that is particularly susceptible to significant change relates to the determination of the allowance for loan losses. Management believes that the allowance for loan losses at December 31, 2019 is adequate and reasonable. Given the subjective nature of identifying and valuing loan losses, it is likely that well-informed individuals could make different assumptions and could, therefore, calculate a materially different allowance value. While management uses available information to recognize losses on loans, changes in economic conditions may necessitate revisions in the future. In addition, various regulatory agencies, as an integral part of their examination process, periodically review the Company’s allowance for loan losses. Such agencies may require the Company to recognize adjustments to the allowance based on their judgment of information available to them at the time of their examination.
Another material estimate is the calculation of fair values of the Company’s investment securities. Fair values of investment securities are determined by pricing provided by a third-party vendor, who is a provider of financial market data, analytics and related services to financial institutions. Based on experience, management is aware that estimated fair values of investment securities tend to vary among valuation services. Accordingly, when selling investment securities, price quotes may be obtained from more than one source. As described in Notes 1 and 4 of the consolidated financial statements, incorporated by reference in Part II, Item 8, all of the Company’s investment securities are classified as available-for-sale (AFS). AFS securities are carried at fair value on the consolidated balance sheets, with unrealized gains and losses, net of income tax, reported separately within shareholders’ equity as a component of accumulated other comprehensive income (loss) (AOCI).
The fair value of residential mortgage loans, classified as held-for-sale (HFS), is obtained from the Federal National Mortgage Association (FNMA) or the Federal Home Loan Bank (FHLB). Generally, the market to which the Company sells residential mortgages it originates for sale is restricted and price quotes from other sources are not typically obtained. On occasion, the Company may transfer loans from the loan portfolio to loans HFS. Under these circumstances, pricing may be obtained from other entities and the loans are transferred at the lower of cost or market value and simultaneously sold. For a further discussion on the accounting treatment of HFS loans, see the section entitled “Loans held-for-sale,” contained within this management’s discussion and analysis.
All significant accounting policies are contained in Note 1, “Nature of Operations and Summary of Significant Accounting Policies”, within the notes to consolidated financial statements and incorporated by reference in Part II, Item 8.
The following discussion and analysis presents the significant changes in the financial condition and in the results of operations of the Company as of December 31, 2019 and 2018 and for each of the years then ended. This discussion should be read in conjunction with the consolidated financial statements and notes thereto included in Part II, Item 8 of this report.
Non-GAAP Financial Measures
The following are non-GAAP financial measures which provide useful insight to the reader of the consolidated financial statements but should be supplemental to GAAP used to prepare the Company’s financial statements and should not be read in isolation or relied upon as a substitute for GAAP measures. In addition, the Company’s non-GAAP measures may not be comparable to non-GAAP measures of other companies. The Company’s tax rate used to calculate the fully-taxable equivalent (FTE) adjustment was 21% at December 31, 2019 and 2018 compared to 34% at December 31, 2017, 2016 and 2015.
The following table reconciles the non-GAAP financial measures of FTE net interest income:
|
|
||||||||||||||
|
(dollars in thousands) |
2019 |
2018 |
2017 |
2016 |
2015 |
|||||||||
|
|
||||||||||||||
|
Interest income (GAAP) |
$ |
39,269 |
$ |
35,330 |
$ |
31,064 |
$ |
27,495 |
$ |
26,014 | ||||
|
Adjustment to FTE |
750 | 718 | 1,281 | 1,124 | 1,084 | |||||||||
|
Interest income adjusted to FTE (Non-GAAP) |
40,019 | 36,048 | 32,345 | 28,619 | 27,098 | |||||||||
|
Interest expense |
7,554 | 4,873 | 3,223 | 2,358 | 2,529 | |||||||||
|
Net interest income adjusted to FTE (Non-GAAP) |
$ |
32,465 |
$ |
31,175 |
$ |
29,122 |
$ |
26,261 |
$ |
24,569 | ||||
|
|
||||||||||||||
18
The efficiency ratio is non-interest expenses as a percentage of FTE net interest income plus non-interest income. The following table reconciles the non-GAAP financial measures of the efficiency ratio to GAAP:
|
|
||||||||||||||
|
|
||||||||||||||
|
(dollars in thousands) |
2019 |
2018 |
2017 |
2016 |
2015 |
|||||||||
|
|
||||||||||||||
|
Efficiency Ratio (non-GAAP) |
||||||||||||||
|
Non-interest expenses (GAAP) |
$ |
26,921 |
$ |
25,072 |
$ |
24,836 |
$ |
21,655 |
$ |
21,022 | ||||
|
|
||||||||||||||
|
Net interest income (GAAP) |
31,715 | 30,457 | 27,841 | 25,137 | 23,485 | |||||||||
|
Plus: taxable equivalent adjustment |
750 | 718 | 1,281 | 1,124 | 1,084 | |||||||||
|
Non-interest income (GAAP) |
10,193 | 9,200 | 8,367 | 8,005 | 7,533 | |||||||||
|
Net interest income (FTE) plus non-interest income (non-GAAP) |
$ |
42,658 |
$ |
40,375 |
$ |
37,489 |
$ |
34,266 |
$ |
32,102 | ||||
|
Efficiency ratio (non-GAAP) |
63.11% | 62.10% | 66.25% | 63.20% | 65.49% | |||||||||
|
|
||||||||||||||
The following table provides a reconciliation of the Company’s earnings results under GAAP to comparative non-GAAP results excluding merger-related expenses:
|
|
|||||||||||||||||||||||
|
|
2019 |
2018 |
|||||||||||||||||||||
|
(dollars in thousands except per share data) |
Income before |
Provision for |
Net income |
Diluted earnings |
Income before |
Provision for |
Net income |
Diluted earnings |
|||||||||||||||
|
|
|||||||||||||||||||||||
|
Results of operations (GAAP) |
$ |
13,902 |
$ |
2,326 |
$ |
11,576 |
$ |
3.03 |
$ |
13,135 |
$ |
2,129 |
$ |
11,006 |
$ |
2.90 | |||||||
|
Add: Merger-related expenses |
440 | 29 | 411 |
- |
- |
- |
|||||||||||||||||
|
Adjusted earnings (non-GAAP) |
$ |
14,342 |
$ |
2,355 |
$ |
11,987 |
$ |
3.14 |
$ |
13,135 |
$ |
2,129 |
$ |
11,006 |
$ |
2.90 | |||||||
|
|
|||||||||||||||||||||||
Comparison of Financial Condition as of December 31, 2019
and 2018 and Results of Operations for each of the Years then Ended
Executive Summary
Nationally, the unemployment rate declined from 3.9% at December 31, 2018 to 3.5% at December 31, 2019. However, the unemployment rate in the Scranton-Wilkes-Barre Metropolitan Statistical Area (local) remained at a higher level than the national unemployment rate and increased year-over-year. According to the U.S. Bureau of Labor Statistics, the local unemployment rate at December 31, 2019 was 5.6%, an increase of 0.9 percentage points from 4.7% at December 31, 2018. During 2019, the labor force increased while the number of jobs decreased which caused the unemployment rate to grow. The median home values in the region increased 4.6% from a year ago, according to Zillow, an online database advertising firm providing access to its real estate search engines to various media outlets, and values are expected to grow 2.7% during 2020. In light of these expectations, we will continue to monitor the economic climate in our region and scrutinize growth prospects with credit quality as a principal consideration.
During 2019, the Company’s assets grew by 3% from deposit growth and retained net earnings, which were used to fund growth in the loan portfolio. In 2020, we expect to continue to grow most facets of loans with funding provided primarily by deposit growth. We expect to grow the investment portfolio weighted heavier in mortgage-backed securities with net growth in municipal securities as well. The cash flow from these securities will provide liquidity to reinvest. Short-term borrowings are expected to decrease while FHLB advances remain flat.
Non-performing assets represented 0.50% of total assets as of December 31, 2019, down from 0.64% at the prior year end. Non-performing assets to total assets was lower during 2019 mostly due to non-performing assets declining while total assets grew. For 2020, management expects to maintain non-performing assets to total assets at historically low levels despite a volatile economic environment.
Branch managers, relationship bankers, mortgage originators and our business service partners are all focused on developing a mutually profitable full banking relationship. We understand our market, offer products and services along with financial advice that is appropriate for our community, clients and prospects. The Company continues to focus on the trusted financial advisor model by utilizing the team approach of experienced bankers that are fully engaged and dedicated towards maintaining and growing profitable relationships.
19
We generated $11.6 million in net income in 2019, up $0.6 million, or 5%, from $11.0 million in 2018. In 2019, our larger and well diversified balance sheet contributed to the success of our earnings performance. Excluding the $0.4 million in merger-related acquisition expenses incurred in conjunction with the acquisition of MNB Corporation and Merchants Bank of Bangor as well as the corresponding tax impact at the marginal tax rate, adjusted net income (non-GAAP) for the year ended December 31, 2019, would have been $12.0 million, or $3.14 diluted earnings per share, respectively, which represents an increase of 9% compared to the year ended December 31, 2018. The 2020 focus is to manage net interest income through a declining rate cycle by managing interest expense to maintain a reasonable spread. Federal Open Market Committee (FOMC) officials began increasing interest rates at the end of 2015 in an attempt to return to a “normal” stance. After over three years of operating in a rising rate cycle, the FOMC dropped rates in July, September and October 2019 and again in March 2020 in an attempt to prevent a weakening in the economy. The pressure on deposit costs in the rising rate environment is still being felt as deposit pricing has lagged the recent rate cuts. From a financial condition and performance perspective, our mission for 2020 will be to continue to strengthen our capital position from strategic growth oriented objectives, implement creative marketing and revenue enhancing strategies, grow and cultivate more of our wealth management and business services and to manage credit risk at tolerable levels thereby maintaining overall asset quality.
In addition in December 2019, the Company announced an agreement to acquire MNB Corporation (“MNB”). The Company expects to complete a merger with MNB during the second quarter of 2020. The proposed merger would expand the Company’s full-service footprint into Northampton County, PA and the Lehigh Valley. Non-recurring costs to facilitate the anticipated merger and integrate systems in 2020 are currently estimated to be $2.4 million. The Company remains committed to selectively expanding branch banking and wealth management locations in Northeastern and Eastern Pennsylvania as opportunities arrive going forward.
For the near-term, we expect to continue to operate in a declining interest rate environment. The Company’s balance sheet is positioned to improve its net interest income performance, but reducing cost of funds may not keep pace with lowering yields that may compress net interest spread and margin. The Company also expects net interest margin to slightly decline for 2020. Expectations are for short-term rates to decline throughout 2020, which could cause deposit rate pricing to decrease. The Company will continue to manage the upward pressure on deposit rates from local competition through continued discipline in product pricing.
Financial Condition
Consolidated assets increased $28.8 million, or 3%, to $1,009.9 million as of December 31, 2019 from $981.1 million at December 31, 2018. The increase in assets occurred predominantly in the loan portfolio. The asset growth was funded by utilizing growth in deposits of $65.5 million and $7.4 million in retained earnings, net of dividends declared.
The following table is a comparison of condensed balance sheet data as of December 31:
|
|
|||||||||||||||||
|
(dollars in thousands) |
|||||||||||||||||
|
Assets: |
2019 |
% |
2018 |
% |
2017 |
% |
|||||||||||
|
Cash and cash equivalents |
$ |
15,663 | 1.6 |
% |
$ |
17,485 | 1.8 |
% |
$ |
15,825 | 1.9 |
% |
|||||
|
Investment securities |
185,117 | 18.3 | 182,810 | 18.6 | 157,385 | 18.2 | |||||||||||
|
Federal Home Loan Bank stock |
4,383 | 0.4 | 6,339 | 0.6 | 2,832 | 0.3 | |||||||||||
|
Loans and leases, net |
745,306 | 73.8 | 724,024 | 73.8 | 640,353 | 74.1 | |||||||||||
|
Bank premises and equipment |
21,557 | 2.1 | 18,920 | 1.9 | 16,898 | 2.0 | |||||||||||
|
Life insurance cash surrender value |
23,261 | 2.3 | 20,615 | 2.1 | 20,017 | 2.3 | |||||||||||
|
Other assets |
14,640 | 1.5 | 10,909 | 1.2 | 10,327 | 1.2 | |||||||||||
|
Total assets |
$ |
1,009,927 | 100.0 |
% |
$ |
981,102 | 100.0 |
% |
$ |
863,637 | 100.0 |
% |
|||||
|
|
|||||||||||||||||
|
Liabilities: |
|||||||||||||||||
|
Total deposits |
$ |
835,737 | 82.8 |
% |
$ |
770,183 | 78.5 |
% |
$ |
730,146 | 84.6 |
% |
|||||
|
Short-term borrowings |
37,839 | 3.7 | 76,366 | 7.8 | 18,502 | 2.1 | |||||||||||
|
FHLB advances |
15,000 | 1.5 | 31,704 | 3.2 | 21,204 | 2.5 | |||||||||||
|
Other liabilities |
14,516 | 1.4 | 9,292 | 1.0 | 6,402 | 0.7 | |||||||||||
|
Total liabilities |
903,092 | 89.4 | 887,545 | 90.5 | 776,254 | 89.9 | |||||||||||
|
Shareholders' equity |
106,835 | 10.6 | 93,557 | 9.5 | 87,383 | 10.1 | |||||||||||
|
Total liabilities and shareholders' equity |
$ |
1,009,927 | 100.0 |
% |
$ |
981,102 | 100.0 |
% |
$ |
863,637 | 100.0 |
% |
|||||
20
A comparison of net changes in selected balance sheet categories as of December 31, are as follows:
|
|
Earning |
Short-term |
FHLB |
|||||||||||||||||||||
|
(dollars in thousands) |
Assets |
% |
assets* |
% |
Deposits |
% |
borrowings |
% |
advances |
% |
||||||||||||||
|
|
||||||||||||||||||||||||
|
2019 |
$ |
28,825 | 3 |
$ |
21,878 | 2 |
$ |
65,554 | 9 |
$ |
(38,527) | (50) |
$ |
(16,704) | (53) | |||||||||
|
2018 |
117,465 | 14 | 112,078 | 14 | 40,037 | 5 | 57,864 | 313 | 10,500 | 50 | ||||||||||||||
|
2017 |
70,693 | 9 | 61,985 | 8 | 26,687 | 4 | 14,279 | 338 | 21,204 | 100 | ||||||||||||||
|
2016 |
63,586 | 9 | 64,736 | 10 | 82,784 | 13 | (23,981) | (85) |
- |
- |
||||||||||||||
|
2015 |
52,873 | 8 | 52,451 | 8 | 33,731 | 6 | 24,235 | 611 | (10,000) | (100) | ||||||||||||||
|
|
||||||||||||||||||||||||
* Earning assets include interest-bearing deposits with financial institutions, gross loans and leases, loans held-for-sale, available-for-sale securities and FHLB stock excluding loans placed on non-accrual status.
Funds Provided:
Deposits
The Company is a community based commercial depository financial institution, member FDIC, which offers a variety of deposit products with varying ranges of interest rates and terms. Generally, deposits are obtained from consumers, businesses and public entities within the communities that surround the Company’s 12 branch offices and all deposits are insured by the FDIC up to the full extent permitted by law. Deposit products consist of transaction accounts including: savings; clubs; interest-bearing checking; money market and non-interest bearing checking (DDA). The Company also offers short- and long-term time deposits or certificates of deposit (CDs). CDs are deposits with stated maturities which can range from seven days to ten years. Cash flow from deposits is influenced by economic conditions, changes in the interest rate environment, pricing and competition. To determine interest rates on its deposit products, the Company considers local competition, spreads to earning-asset yields, liquidity position and rates charged for alternative sources of funding such as short-term borrowings and FHLB advances.
The following table represents the components of total deposits as of December 31:
|
|
||||||||||
|
|
2019 |
2018 |
||||||||
|
(dollars in thousands) |
Amount |
% |
Amount |
% |
||||||
|
|
||||||||||
|
Interest-bearing checking |
$ |
242,171 | 29.0 |
% |
$ |
224,185 | 29.1 |
% |
||
|
Savings and clubs |
104,854 | 12.5 | 118,971 | 15.4 | ||||||
|
Money market |
180,478 | 21.6 | 116,010 | 15.1 | ||||||
|
Certificates of deposit |
116,211 | 13.9 | 116,286 | 15.1 | ||||||
|
Total interest-bearing |
643,714 | 77.0 | 575,452 | 74.7 | ||||||
|
Non-interest bearing |
192,023 | 23.0 | 194,731 | 25.3 | ||||||
|
Total deposits |
$ |
835,737 | 100.0 |
% |
$ |
770,183 | 100.0 |
% |
||
Total deposits increased $65.5 million, or 9%, from $770.2 million at December 31, 2018 to $835.7 million at December 31, 2019. Money market accounts contributed the most to the deposit growth increasing $64.5 million, primarily due to higher balances of existing accounts and shifts from other types of deposit accounts resulting from the relationship pricing strategy. Additionally, the Company added new money market accounts as a result of several money market promotions throughout 2019. Interest-bearing checking accounts also increased $18.0 million due to an increase in balances from existing business customers. The Company focuses on obtaining a full-banking relationship with existing customers as well as forming new customer relationships. During 2019, non-interest bearing checking and savings accounts declined due to customers’ preference for products with higher earnings potential. Savings and club accounts declined $14.1 million as personal savings accounts earning low interest rates became less desirable. Non-interest bearing checking was down $2.7 million as money shifted to interest-bearing checking and money market accounts. The Company will continue to execute on its relationship development strategy, explore the demographics within its marketplace and develop creative programs for its customers. For 2020, the Company will focus on deposit growth to fund asset growth and pay down short-term borrowings. Growth in deposits from new markets is expected from a full year with the Mountain Top branch. Seasonal public deposit fluctuations are expected to remain volatile and at times may partially offset this deposit growth.
Additionally, CDs decreased $0.1 million mostly due to short-term alternatives with similar rates. Demand for higher rate money market accounts and CDs may grow if short-term rates decline thereby increasing funding costs. The Company will continue to pursue strategies to grow and retain retail and business customers with an emphasis on deepening and broadening existing and creating new relationships.
The Company uses the Certificate of Deposit Account Registry Service (CDARS) reciprocal program and Insured Cash Sweep (ICS) reciprocal program to obtain FDIC insurance protection for customers who have large deposits that at times may exceed the FDIC maximum insured amount of $250,000. In the CDARS program, deposits with varying terms and
21
interest rates, originated in the Company’s own markets, are exchanged for deposits of other financial institutions that are members in the CDARS network. By placing the deposits in other participating institutions, the deposits of our customers are fully insured by the FDIC. In return for deposits placed with network institutions, the Company receives from network institutions deposits that are approximately equal in amount and are comprised of terms similar to those placed for our customers. Deposits the Company receives from other institutions are considered reciprocal deposits by regulatory definitions. The Company did not have any CDARs as of December 31, 2019 and 2018. As of December 31, 2019 and 2018, ICS reciprocal deposits represented $19.7 million and $4.7 million, or 2% and 1%, of total deposits which are included in interest-bearing checking accounts in the table above. The $15.0 million increase in ICS deposits is primarily due to public funds deposit transfers from other interest-bearing checking accounts to ICS accounts.
The maturity distribution of certificates of deposit at December 31, 2019 is as follows:
|
|
More than |
More than |
More |
|||||||||||
|
|
Three months |
three months |
six months to |
than twelve |
||||||||||
|
(dollars in thousands) |
or less |
to six months |
twelve months |
months |
Total |
|||||||||
|
CDs of $100,000 or more |
$ |
16,085 |
$ |
12,277 |
$ |
28,645 |
$ |
13,667 |
$ |
70,674 | ||||
|
CDs of less than $100,000 |
9,053 | 8,136 | 11,963 | 16,385 | 45,537 | |||||||||
|
Total CDs |
$ |
25,138 |
$ |
20,413 |
$ |
40,608 |
$ |
30,052 |
$ |
116,211 | ||||
Approximately 74% of the CDs, with a weighted-average interest rate of 1.97%, are scheduled to mature in 2020 and an additional 16%, with a weighted-average interest rate of 1.62%, are scheduled to mature in 2021. Renewing CDs may re-price to lower or higher market rates depending on the rate on the maturing CD, the pace and direction of interest rate movements, the shape of the yield curve, competition, the rate profile of the maturing accounts and depositor preference for alternative, non-term products. The Company plans to address repricing CDs in the ordinary course of business on a relationship basis and is prepared to match rates when prudent to maintain relationships. The Company does expect CD growth during 2020, and is developing CD promotional programs when the Company deems that it is economically feasible to do so or when demand exists. The Company currently expects the cost of deposit funds to fall due to the declining interest rate environment, but there is uncertainty about customer demand and local competition. As with all promotions, the Company will consider the needs of the customers and simultaneously be mindful of the liquidity levels, borrowing rates and the interest rate sensitivity exposure of the Company.
Short-term borrowings
Borrowings are used as a complement to deposit generation as an alternative funding source whereby the Company will borrow under advances from the FHLB of Pittsburgh and other correspondent banks for asset growth and liquidity needs.
The components of short-term borrowings are as follows:
|
|
As of December 31, |
||||
|
(dollars in thousands) |
2019 |
2018 |
|||
|
|
|||||
|
Overnight borrowings |
$ |
37,839 |
$ |
76,366 | |
|
|
|||||
Short-term borrowings may include overnight balances with FHLB line of credit and/or correspondent bank’s federal funds lines which the Company may require to fund daily liquidity needs such as deposit outflow, loan demand and operations. Short-term borrowings decreased $38.5 million during 2019 as a result of deposit growth. The Company expects short-term borrowings to continue to decrease in 2020.
Information with respect to the Company’s short-term borrowing’s maximum and average outstanding balances and interest rates are contained in Note 8, “Short-term Borrowings,” of the notes to consolidated financial statements incorporated by reference in Part II, Item 8.
FHLB advances
At December 31, 2019, the Company had $15.0 million in FHLB advances with a weighted average interest rate of 3.01%. During September 2018, the Company borrowed $15 million with maturity dates laddered out from 3 to 5 years in order to purchase securities. As of December 31, 2019, the Company had the ability to borrow an additional $202.8 million from the FHLB.
Funds Deployed:
Investment Securities
The Company’s investment policy is designed to complement its lending activities, provide monthly cash flow, manage interest rate sensitivity and generate a favorable return without incurring excessive interest rate and credit risk while managing liquidity at acceptable levels. In establishing investment strategies, the Company considers its business, growth strategies or restructuring plans, the economic environment, the interest rate sensitivity position, the types of securities in its
22
portfolio, permissible purchases, credit quality, maturity and re-pricing terms, call or average-life intervals and investment concentrations. The Company’s policy prescribes permissible investment categories that meet the policy standards and management is responsible for structuring and executing the specific investment purchases within these policy parameters. Management buys and sells investment securities from time-to-time depending on market conditions, business trends, liquidity needs, capital levels and structuring strategies. Investment security purchases provide a way to quickly invest excess liquidity in order to generate additional earnings. The Company generally earns a positive interest spread by assuming interest rate risk using deposits or borrowings to purchase securities with longer maturities.
At the time of purchase, management classifies investment securities into one of three categories: trading, available-for-sale (AFS) or held-to-maturity (HTM). To date, management has not purchased any securities for trading purposes. All of the securities the Company purchases are classified as AFS even though there is no immediate intent to sell them. The AFS designation affords management the flexibility to sell securities and position the balance sheet in response to capital levels, liquidity needs or changes in market conditions. Debt securities AFS are carried at fair value on the consolidated balance sheets with unrealized gains and losses, net of deferred income taxes, reported separately within shareholders’ equity as a component of accumulated other comprehensive income (AOCI). Beginning on January 1, 2018, equity securities were carried at fair value on the consolidated balance sheets with unrealized gains and losses, net of deferred income taxes, reported separately within the consolidated statements of income as a component of non-interest income. The Company sold all of its remaining equity securities during the first half of 2018. Securities designated as HTM are carried at amortized cost and represent debt securities that the Company has the ability and intent to hold until maturity.
As of December 31, 2019, the carrying value of investment securities amounted to $185.1 million, or 18% of total assets, compared to $182.8 million, or 19% of total assets, at December 31, 2018. On December 31, 2019, 67% of the carrying value of the investment portfolio was comprised of U.S. Government Sponsored Enterprise residential mortgage-backed securities (MBS – GSE residential or mortgage-backed securities) that amortize and provide monthly cash flow that the Company can use for reinvestment, loan demand, unexpected deposit outflow, facility expansion or operations.
Investment securities were comprised of AFS securities as of December 31, 2019 and 2018. The AFS securities were recorded with a net unrealized gain of $4.5 million and a net unrealized loss of $1.4 million as of December 31, 2019 and 2018, respectively. Of the net improvement in the unrealized gain position of $5.9 million, $3.8 million was net unrealized gains on mortgages-backed securities, $1.9 million was net unrealized gains on municipal securities and $0.2 million was net unrealized gains on agency securities. The direction and magnitude of the change in value of the Company’s investment portfolio is attributable to the direction and magnitude of the change in interest rates along the treasury yield curve. Generally, the values of debt securities move in the opposite direction of the changes in interest rates. As interest rates along the treasury yield curve decline, especially at the intermediate and long end, the values of debt securities tend to rise. Whether or not the value of the Company’s investment portfolio will continue to rise above its amortized cost will be largely dependent on the direction and magnitude of interest rate movements and the duration of the debt securities within the Company’s investment portfolio. When interest rates rise, the market values of the Company’s debt securities portfolio could be subject to market value declines.
As of December 31, 2019, the Company had $125.9 million in public deposits, or 15% of total deposits. Pennsylvania state law requires the Company to maintain pledged securities on these public deposits or otherwise obtain a FHLB letter of credit or FDIC insurance for these customers. As of December 31, 2019, the balance of pledged securities required for deposit accounts was $67.4 million, or 36% of total securities.
Quarterly, management performs a review of the investment portfolio to determine the causes of declines in the fair value of each security. The Company uses inputs provided by independent third parties to determine the fair value of its investment securities portfolio. Inputs provided by the third parties are reviewed and corroborated by management. Evaluations of the causes of the unrealized losses are performed to determine whether impairment exists and whether the impairment is temporary or other-than-temporary. Considerations such as the Company’s intent and ability to hold the securities until or sell prior to maturity, recoverability of the invested amounts over the intended holding period, the length of time and the severity in pricing decline below cost, the interest rate environment, the receipt of amounts contractually due and whether or not there is an active market for the securities, for example, are applied, along with an analysis of the financial condition of the issuer for management to make a realistic judgment of the probability that the Company will be unable to collect all amounts (principal and interest) due in determining whether a security is other-than-temporarily impaired. If a decline in value is deemed to be other-than-temporary, the amortized cost of the security is reduced by the credit impairment amount and a corresponding charge to current earnings is recognized. During the year ended December 31, 2019, the Company did not incur other-than-temporary impairment charges from its investment securities portfolio.
During 2019, the carrying value of total investments increased $2.3 million, or 1%. The Company attempts to maintain a well-diversified and proportionate investment portfolio that is structured to complement the strategic direction of the Company. Its growth typically supplements the lending activities but also considers the current and forecasted economic conditions, the Company’s liquidity needs and interest rate risk profile. The Company expects to grow the portfolio and increase its relative size with a preference toward mortgage-backed securities. If intermediate to long-term rates rise, the strategy is expected to provide a good source of cash flow to reinvest into higher yielding interest-sensitive assets.
23
A comparison of total investment securities as of December 31 follows:
|
|
||||||||||
|
|
2019 |
2018 |
||||||||
|
(dollars in thousands) |
Amount |
% |
Amount |
% |
||||||
|
|
||||||||||
|
MBS - GSE residential |
$ |
124,240 | 67.1 |
% |
$ |
124,318 | 68.0 |
% |
||
|
State & municipal subdivisions |
54,718 | 29.6 | 52,575 | 28.8 | ||||||
|
Agency - GSE |
6,159 | 3.3 | 5,917 | 3.2 | ||||||
|
Total |
$ |
185,117 | 100.0 |
% |
$ |
182,810 | 100.0 |
% |
||
As of December 31, 2019, there were no investments from any one issuer with an aggregate book value that exceeded 10% of the Company’s shareholders’ equity.
The distribution of debt securities by stated maturity and tax-equivalent yield at December 31, 2019 are as follows:
|
|
||||||||||||||||||||||||
|
|
More than |
More than |
More than |
|||||||||||||||||||||
|
|
One year or less |
one year to five years |
five years to ten years |
ten years |
Total |
|||||||||||||||||||
|
(dollars in thousands) |
$ |
% |
$ |
% |
$ |
% |
$ |
% |
$ |
% |
||||||||||||||
|
|
||||||||||||||||||||||||
|
MBS - GSE residential |
$ |
- |
- |
% |
$ |
367 | 4.35 |
% |
$ |
6,145 | 3.40 |
% |
$ |
117,728 | 3.35 |
% |
$ |
124,240 | 3.35 |
% |
||||
|
State & municipal subdivisions |
3,530 | 4.82 | 977 | 6.04 | 1,003 | 3.64 | 49,208 | 4.41 | 54,718 | 4.45 | ||||||||||||||
|
Agency - GSE |
- |
- |
6,159 | 2.70 |
- |
- |
- |
- |
6,159 | 2.70 | ||||||||||||||
|
Total debt securities |
$ |
3,530 | 4.82 |
% |
$ |
7,503 | 3.20 |
% |
$ |
7,148 | 3.44 |
% |
$ |
166,936 | 3.65 |
% |
$ |
185,117 | 3.65 |
% |
||||
|
|
||||||||||||||||||||||||
In the above table, the book yields on state & municipal subdivisions were adjusted to a tax-equivalent basis using the corporate federal tax rate of 21%. In addition, average yields on securities AFS are based on amortized cost and do not reflect unrealized gains or losses.
Federal Home Loan Bank Stock
Investment in FHLB stock is required for membership in the organization and is carried at cost since there is no market value available. The amount the Company is required to invest is dependent upon the relative size of outstanding borrowings the Company has with the FHLB of Pittsburgh. Excess stock is repurchased from the Company at par if the amount of borrowings decline to a predetermined level. In addition, the Company earns a return or dividend based on the amount invested. The dividends received from the FHLB totaled $343 thousand and $194 thousand for the years ended December 31, 2019 and 2018, respectively. The balance in FHLB stock was $4.4 million and $6.3 million as of December 31, 2019 and 2018, respectively.
Loans and leases
As of December 31, 2019, the Company had gross loans and leases totaling $754.3 million compared to $729.1 million at December 31, 2018 which represented an increase of $25.2 million, or 3%. The loan growth was primarily driven by residential real estate activity.
In 2020, management expects loan growth in all portfolios primarily driven by commercial real estate loans and residential real estate loans.
Our service team is experienced, knowledgeable and dedicated to servicing the community and our clients. We will continue to provide products and services that benefit our clients as well as the community which is very important to our success.
A comparison of loan originations, net of participations is as follows for the periods indicated:
|
|
2019 |
2018 |
|||
|
(dollars in thousands) |
Amount |
Amount |
|||
|
Loans: |
|||||
|
Commercial and industrial |
$ |
19,497 |
$ |
25,965 | |
|
Commercial real estate |
14,910 | 34,105 | |||
|
Consumer |
58,188 | 77,088 | |||
|
Residential real estate |
54,872 | 46,517 | |||
|
|
147,467 | 183,675 | |||
|
Lines of credit: |
|||||
|
Commercial |
60,893 | 61,035 | |||
|
Residential construction |
19,555 | 21,530 | |||
|
Home equity and other consumer |
12,228 | 17,892 | |||
|
|
92,676 | 100,457 | |||
|
Total originations closed |
$ |
240,143 |
$ |
284,132 | |
|
|
|||||
24
Commercial and industrial and commercial real estate
As of December 31, 2019, the commercial loan portfolio, which consisted of commercial and industrial (C&I) and commercial real estate (CRE) loans, increased $4.4 million, or 1%, compared to December 31, 2018. This increase was attributed to growth of $6.5 million in owner occupied CRE loans and $4.3 million in non-owner occupied CRE loans, partially offset by reductions of $4.3 million in C&I loans and $2.1 million in commercial construction loans. CRE loan growth activity can be attributed to new client acquisition and expansion of existing relationships.
Consumer
The consumer loan portfolio experienced a reduction, decreasing $2.4 million, or 1%, compared to December 31, 2018. This reduction in the consumer loan portfolio was attributed to a decline of $5.2 million in home equity lines of credit (HELOC), $0.7 million in direct finance leases and $0.7 million in consumer other loans, partially offset by growth of $3.9 million in home equity installment loans and $0.3 million in auto loans.
Demand for HELOCs decreased during 2019 because of homeowners’ preference for conventional mortgage loan products, which had longer terms and lower fixed rates. This trend drove the $5.2 million, or 10%, year-to-date reduction for the Company’s HELOC portfolio. The reduction in the HELOC portfolio was partially offset by a 12%, or $3.9 million, increase in the home equity installment portfolio which also offers long-term low fixed rates.
During 2020, management expects continued demand for fixed rate home equity installment loans to offset the decline in home equity lines of credit.
Residential
The residential loan portfolio grew $23.2 million, or 14%, during 2019. This growth was driven by a $21.2 million increase in residential real estate loans and a $2.0 million increase in residential construction loans. The Company’s mortgage loan modification program which offered refinancing to qualified customers predominantly caused the lift in residential real estate loans. Homeowners’ aforementioned preference for residential mortgage products supplemented the growth from the mortgage modification program. Management expects continued growth in residential loans for 2020.
A comparison of loans and related percentage of gross loans, at December 31, for the five previous periods is as follows:
|
|
2019 |
2018 |
2017 |
2016 |
2015 |
||||||||||||||||||||||||
|
(dollars in thousands) |
Amount |
% |
Amount |
% |
Amount |
% |
Amount |
% |
Amount |
% |
|||||||||||||||||||
|
|
|||||||||||||||||||||||||||||
|
Commercial and industrial |
$ |
122,594 | 16.2 |
% |
$ |
126,884 | 17.4 |
% |
$ |
113,601 | 17.5 |
% |
$ |
98,477 | 16.3 |
% |
$ |
102,653 | 18.3 |
% |
|||||||||
|
Commercial real estate: |
|||||||||||||||||||||||||||||
|
Non-owner occupied |
99,801 | 13.2 | 95,515 | 13.1 | 92,851 | 14.3 | 87,220 | 14.4 | 95,745 | 17.0 | |||||||||||||||||||
|
Owner occupied |
130,558 | 17.3 | 124,092 | 17.0 | 109,383 | 16.9 | 113,104 | 18.7 | 101,652 | 18.1 | |||||||||||||||||||
|
Construction |
4,654 | 0.6 | 6,761 | 0.9 | 6,228 | 1.0 | 3,987 | 0.7 | 4,481 | 0.8 | |||||||||||||||||||
|
Consumer: |
|||||||||||||||||||||||||||||
|
Home equity installment |
36,631 | 4.9 | 32,729 | 4.5 | 27,317 | 4.2 | 28,466 | 4.7 | 30,935 | 5.5 | |||||||||||||||||||
|
Home equity line of credit |
47,282 | 6.3 | 52,517 | 7.2 | 53,273 | 8.2 | 51,609 | 8.5 | 48,060 | 8.5 | |||||||||||||||||||
|
Auto |
105,870 | 14.0 | 105,576 | 14.5 | 79,340 | 12.3 | 53,885 | 8.9 | 27,835 | 5.0 | |||||||||||||||||||
|
Direct finance leases |
16,355 | 2.2 | 17,004 | 2.3 | 13,575 | 2.1 | 10,367 | 1.7 | 7,210 | 1.3 | |||||||||||||||||||
|
Other |
5,634 | 0.7 | 6,314 | 0.9 | 5,604 | 0.9 | 13,301 | 2.2 | 6,208 | 1.1 | |||||||||||||||||||
|
Residential: |
|||||||||||||||||||||||||||||
|
Real estate |
167,164 | 22.2 | 145,951 | 20.0 | 136,901 | 21.1 | 134,475 | 22.2 | 126,992 | 22.6 | |||||||||||||||||||
|
Construction |
17,770 | 2.4 | 15,749 | 2.2 | 9,931 | 1.5 | 10,496 | 1.7 | 10,060 | 1.8 | |||||||||||||||||||
|
Gross loans |
754,313 | 100.0 |
% |
729,092 | 100.0 |
% |
648,004 | 100.0 |
% |
605,387 | 100.0 |
% |
561,831 | 100.0 |
% |
||||||||||||||
|
Less: |
|||||||||||||||||||||||||||||
|
Allowance for loan losses |
(9,747) | (9,747) | (9,193) | (9,364) | (9,527) | ||||||||||||||||||||||||
|
Unearned lease revenue |
(903) | (1,028) | (639) | (482) | (335) | ||||||||||||||||||||||||
|
Net loans |
$ |
743,663 |
$ |
718,317 |
$ |
638,172 |
$ |
595,541 |
$ |
551,969 | |||||||||||||||||||
|
|
|||||||||||||||||||||||||||||
|
Loans held-for-sale |
$ |
1,643 |
$ |
5,707 |
$ |
2,181 |
$ |
2,854 |
$ |
1,421 | |||||||||||||||||||
25
The following table sets forth the maturity distribution of select components of the loan portfolio at December 31, 2019. Excluded from the table are residential real estate and consumer loans:
|
|
More than |
||||||||||
|
|
One year |
one year to |
More than |
||||||||
|
(dollars in thousands) |
or less |
five years |
five years |
Total |
|||||||
|
Commercial and industrial |
$ |
55,504 |
$ |
24,229 |
$ |
42,861 |
$ |
122,594 | |||
|
Commercial real estate |
83,735 | 114,242 | 32,382 | 230,359 | |||||||
|
Commercial real estate construction * |
4,654 |
- |
- |
4,654 | |||||||
|
Residential real estate construction * |
17,770 |
- |
- |
17,770 | |||||||
|
Total |
$ |
161,663 |
$ |
138,471 |
$ |
75,243 |
$ |
375,377 | |||
*In the table above, both residential and CRE construction loans are included in the one year or less category since, by their nature, these loans are converted into residential and CRE loans within one year from the date the real estate construction loan was consummated. Upon conversion, the residential and CRE loans would normally mature after five years.
The following table sets forth the total amount of C&I and CRE loans due after one year which have predetermined interest rates (fixed) and floating or adjustable interest rates (variable) as of December 31, 2019:
|
|
One to five |
More than |
||||||
|
(dollars in thousands) |
years |
five years |
Total |
|||||
|
|
||||||||
|
Fixed interest rate |
$ |
29,728 |
$ |
42,539 |
$ |
72,267 | ||
|
Variable interest rate |
108,743 | 32,704 | 141,447 | |||||
|
Total |
$ |
138,471 |
$ |
75,243 |
$ |
213,714 | ||
Non-refundable fees and costs associated with all loan originations are deferred. Using either the interest method or straight-line amortization, the deferral is released as credits or charges to loan interest income over the life of the loan.
There are no concentrations of loans or customers to a number of borrowers engaged in similar industries exceeding 10% of total loans that are not otherwise disclosed as a category in the tables above. There are no concentrations of loans that, if resulted in a loss, would have a material adverse effect on the business of the Company. The Company’s loan portfolio does not have a material concentration within a single industry or group of related industries or customers that is vulnerable to the risk of a near-term severe negative business impact. As of December 31, 2019, approximately 67% of the gross loan portfolio was secured by real estate compared to 66% at December 31, 2018 and 68% at December 31, 2017.
The Company considers its portfolio segmentation, including the real estate secured portfolio, to be normal and reasonably diversified. The banking industry is affected by general economic conditions including, among other things, the effects of real estate values. The Company ensures that its mortgage lending adheres to standards of secondary market compliance. Furthermore, the Company’s credit function strives to mitigate the negative impact of economic conditions by maintaining strict underwriting principles for all loan types.
Loans held-for-sale
Upon origination, most residential mortgages and certain Small Business Administration (SBA) guaranteed loans may be classified as held-for-sale (HFS). In the event of market rate increases, fixed-rate loans and loans not immediately scheduled to re-price would no longer produce yields consistent with the current market. In declining interest rate environments, the Company would be exposed to prepayment risk as rates on fixed-rate loans decrease, and customers look to refinance loans. Consideration is given to the Company’s current liquidity position and projected future liquidity needs. To better manage prepayment and interest rate risk, loans that meet these conditions may be classified as HFS. Occasionally, residential mortgage and/or other nonmortgage loans may be transferred from the loan portfolio to HFS. The carrying value of loans HFS is based on the lower of cost or estimated fair value. If the fair values of these loans decline below their original cost, the difference is written down and charged to current earnings. Subsequent appreciation in the portfolio is credited to current earnings but only to the extent of previous write-downs.
As of December 31, 2019 and 2018, loans HFS consisted of residential mortgages with carrying amounts of $1.6 million and $5.7 million, respectively, which approximated their fair values. During the year ended December 31, 2019, residential mortgage loans with principal balances of $52.4 million were sold into the secondary market and the Company recognized net gains of $0.8 million, compared to $32.1 million and $0.6 million, respectively, during the year ended December 31, 2018. During the year ended December 31, 2019, the Company also sold two SBA guaranteed loans with principal balances of $0.3 million and recognized a net gain on the sale of $34 thousand, compared to one SBA loan of $0.4 million and a net gain of $47 thousand, respectively, during the year ended December 31, 2018.
The Company retains mortgage servicing rights (MSRs) on loans sold into the secondary market. MSRs are retained so that the Company can foster personal relationships. At December 31, 2019 and 2018, the servicing portfolio balance of sold residential mortgage loans was $302.3 million and $304.9 million, respectively. At December 31, 2019 and 2018, the servicing portfolio balance of sold SBA loans was $5.3 million and $6.0 million, respectively.
26
Allowance for loan losses
Management evaluates the credit quality of the Company’s loan portfolio and performs a formal review of the adequacy of the allowance for loan losses (the allowance) on a quarterly basis. The allowance reflects management’s best estimate of the amount of credit losses in the loan portfolio. Management’s judgment is based on the evaluation of individual loans, past experience, the assessment of current economic conditions and other relevant factors including the amounts and timing of cash flows expected to be received on impaired loans. Those estimates may be susceptible to significant change. The provision for loan losses represents the amount necessary to maintain an appropriate allowance. Loan losses are charged directly against the allowance when loans are deemed to be uncollectible. Recoveries from previously charged-off loans are added to the allowance when received.
Management applies two primary components during the loan review process to determine proper allowance levels. The two components are a specific loan loss allocation for loans that are deemed impaired and a general loan loss allocation for those loans not specifically allocated. The methodology to analyze the adequacy of the allowance for loan losses is as follows:
|
· |
identification of specific impaired loans by loan category; |
|
· |
calculation of specific allowances where required for the impaired loans based on collateral and other objective and quantifiable evidence; |
|
· |
determination of loans with similar credit characteristics within each class of the loan portfolio segment and eliminating the impaired loans; |
|
· |
application of historical loss percentages (trailing twelve-quarter average) to pools to determine the allowance allocation; |
|
· |
application of qualitative factor adjustment percentages to historical losses for trends or changes in the loan portfolio, regulations, and/or current economic conditions. |
A key element of the methodology to determine the allowance is the Company’s credit risk evaluation process, which includes credit risk grading of individual commercial loans. Commercial loans are assigned credit risk grades based on the Company’s assessment of conditions that affect the borrower’s ability to meet its contractual obligations under the loan agreement. That process includes reviewing borrowers’ current financial information, historical payment experience, credit documentation, public information and other information specific to each individual borrower. Upon review, the commercial loan credit risk grade is revised or reaffirmed. The credit risk grades may be changed at any time management determines an upgrade or downgrade may be warranted. The credit risk grades for the commercial loan portfolio are taken into account in the reserve methodology and loss factors are applied based upon the credit risk grades. The loss factors applied are based upon the Company’s historical experience as well as what management believes to be best practices and within common industry standards. Historical experience reveals there is a direct correlation between the credit risk grades and loan charge-offs. The changes in allocations in the commercial loan portfolio from period-to-period are based upon the credit risk grading system and from periodic reviews of the loan portfolio.
Each quarter, management performs an assessment of the allowance for loan losses. The Company’s Special Assets Committee meets quarterly and the applicable lenders discuss each relationship under review and reach a consensus on the appropriate estimated loss amount, if applicable, based on current accounting guidance. The Special Assets Committee’s focus is on ensuring the pertinent facts are considered regarding not only loans considered for specific reserves, but also the collectability of loans that may be past due. The assessment process also includes the review of all loans on non-accrual status as well as a review of certain loans to which the lenders or the Credit Administration function have assigned a criticized or classified risk rating.
27
The following table sets forth the activity in the allowance for loan losses and certain key ratios for the periods indicated:
|
|
|||||||||||||||
|
|
|||||||||||||||
|
(dollars in thousands) |
2019 |
2018 |
2017 |
2016 |
2015 |
||||||||||
|
|
|||||||||||||||
|
Balance at beginning of period |
$ |
9,747 |
$ |
9,193 |
$ |
9,364 |
$ |
9,527 |
$ |
9,173 | |||||
|
|
|||||||||||||||
|
Charge-offs: |
|||||||||||||||
|
Commercial and industrial |
(184) | (196) | (143) | (224) | (25) | ||||||||||
|
Commercial real estate |
(597) | (268) | (635) | (592) | (432) | ||||||||||
|
Consumer |
(398) | (391) | (658) | (504) | (437) | ||||||||||
|
Residential |
(330) | (371) | (309) | (60) | (15) | ||||||||||
|
Total |
(1,509) | (1,226) | (1,745) | (1,380) | (909) | ||||||||||
|
|
|||||||||||||||
|
Recoveries: |
|||||||||||||||
|
Commercial and industrial |
32 | 77 | 10 | 55 | 47 | ||||||||||
|
Commercial real estate |
317 | 42 | 47 | 37 | 18 | ||||||||||
|
Consumer |
67 | 211 | 67 | 100 | 95 | ||||||||||
|
Residential |
8 |
- |
- |
- |
28 | ||||||||||
|
Total |
424 | 330 | 124 | 192 | 188 | ||||||||||
|
Net charge-offs |
(1,085) | (896) | (1,621) | (1,188) | (721) | ||||||||||
|
Provision for loan losses |
1,085 | 1,450 | 1,450 | 1,025 | 1,075 | ||||||||||
|
Balance at end of period |
$ |
9,747 |
$ |
9,747 |
$ |
9,193 |
$ |
9,364 |
$ |
9,527 | |||||
|
|
|||||||||||||||
|
Allowance for loan losses to total loans |
1.29 |
% |
1.34 |
% |
1.42 |
% |
1.55 |
% |
1.70 |
% |
|||||
|
Net charge-offs to average total loans outstanding |
0.15 |
% |
0.13 |
% |
0.25 |
% |
0.21 |
% |
0.13 |
% |
|||||
|
Average total loans |
$ |
732,152 |
$ |
687,853 |
$ |
639,477 |
$ |
575,756 |
$ |
539,090 | |||||
|
Loans 30 - 89 days past due and accruing |
$ |
1,366 |
$ |
5,938 |
$ |
2,893 |
$ |
2,241 |
$ |
3,707 | |||||
|
Loans 90 days or more past due and accruing |
$ |
- |
$ |
1 |
$ |
6 |
$ |
19 |
$ |
356 | |||||
|
Non-accrual loans |
$ |
3,674 |
$ |
4,298 |
$ |
3,441 |
$ |
7,370 |
$ |
9,003 | |||||
|
Allowance for loan losses to non-accrual loans |
2.65 |
x |
2.27 |
x |
2.67 |
x |
1.27 |
x |
1.06 |
x |
|||||
|
Allowance for loan losses to non-performing loans |
2.65 |
x |
2.27 |
x |
2.67 |
x |
1.27 |
x |
1.02 |
x |
|||||
|
|
|||||||||||||||
For the year ended December 31, 2019, the allowance remained unchanged from $9.7 million at December 31, 2018 as net charge-offs of $1.1 million were offset by provisioning of $1.1 million. Total loans, which represent gross loans less unearned lease revenue, increased by $25.3 million, or 3%, to $753.4 million at December 31, 2019 from $728.1 million at December 31, 2018. The allowance for loan losses decreased as a percentage of total loans to 1.29% at December 31, 2019 from 1.34% at December 31, 2018 due to loan growth and improved asset quality.
Management believes that the current balance in the allowance for loan losses is sufficient to meet the identified potential credit quality issues that may arise and other issues unidentified but inherent to the portfolio. Potential problem loans are those where there is known information that leads management to believe repayment of principal and/or interest is in jeopardy and the loans are currently neither on non-accrual status nor past due 90 days or more.
During the first quarter of 2019, management increased the qualitative factors associated with its consumer and residential portfolios related to changes in national and local economic and business conditions and developments that will ultimately affect the collectability of these portfolios. The justification for the increase in these qualitative factors was an economic summary report indicating a weakening consumer financial wherewithal. Based upon management’s judgement, this consumer weakness will cause estimated credit losses associated with the Company’s existing portfolio to differ from historical loss experience, which necessitated increasing the qualitative factors for the loan portfolios deemed most sensitive to this development, which are its consumer and residential portfolios.
During the second quarter of 2019, management decreased the qualitative factor for its home equity installment loans and residential construction loans. The reduction was due to a decreasing trend in delinquency for the home equity installment portfolio. Further, zero delinquency in the residential construction portfolio over the past several quarters with no expectation for future delinquency in this portfolio for the foreseeable future justified the decrease in this qualitative factor.
During the third quarter of 2019, management decreased the qualitative factor for its C&I loans because of an improving delinquency trend along with a history of low delinquency levels, attributed mainly to high quality municipal loans within the C&I portfolio. Management also reduced qualitative factors to reflect the positive impact the Federal Reserve’s decision to cut the federal funds rate 0.25% twice during the third quarter of 2019 will have on estimated credit losses for the following
28
portfolios: commercial & industrial, owner occupied commercial real estate, non-owner occupied commercial real estate, commercial construction, residential real estate, HELOC, consumer auto, and consumer other. Estimated credit losses are anticipated to decline for commercial and residential real estate secured loans as lower interest rates improve real estate valuations due to the inverse relationship between capitalization rates and the market values of real estate. Lower rates also reduce debt service requirements for variable rate loans in all portfolios, which is particularly impactful for the commercial construction, HELOC, and consumer other portfolios due to the high concentration of variable rate loans within these portfolios. Portfolios with a high concentration of fixed rate loans, such as residential real estate and consumer auto, are also likely to observe a positive change in estimated credit losses as new customers lock in lower rates than existing customers.
During the fourth quarter of 2019, management reduced the qualitive factors, based on recognition of historically low delinquency levels for the following portfolios: commercial real estate owner-occupied, commercial real estate non owner-occupied, C&I, residential real estate, HELOC, consumer auto, and consumer other. The qualitative factors for the C&I, residential construction, and home equity installment loans were not reduced as the improved delinquency for these portfolios was already accounted for in previous quarters’ adjustments. This low level of delinquency is viewed as a leading indicator for potential future losses, and, consequently, management believes this improved delinquency will cause the estimated credit losses associated with the Company’s existing portfolio to have a smaller divergence from historical loss experience than previously estimated in prior periods.
The allocation of net charge-offs among major categories of loans are as follows for the periods indicated:
|
|
% of Total |
% of Total |
|||||||||
|
|
Net |
Net |
|||||||||
|
(dollars in thousands) |
2019 |
Charge-offs |
2018 |
Charge-offs |
|||||||
|
|
|||||||||||
|
Net charge-offs |
|||||||||||
|
Commercial and industrial |
$ |
(152) | 14 |
% |
$ |
(119) | 13 |
% |
|||
|
Commercial real estate |
(280) | 26 | (226) | 25 | |||||||
|
Consumer |
(331) | 30 | (180) | 20 | |||||||
|
Residential |
(322) | 30 | (371) | 42 | |||||||
|
Total net charge-offs |
$ |
(1,085) | 100 |
% |
$ |
(896) | 100 |
% |
|||
|
|
|||||||||||
For the year ended December 31, 2019, net charge-offs against the allowance totaled $1.1 million compared with $0.9 million for the year ended December 31, 2018, representing a $0.2 million, or 21%, increase. This increase was primarily attributed to a $0.4 million charge-off to a single commercial borrower occurring in the first quarter of 2019. During the third quarter of 2019, the Company also charged-off an aggregate of $0.3 million in collection expenses incurred since 2016 on 14 residential loans sold to Fannie Mae but serviced by the Company. The Company is pursuing recovery of these costs. During the fourth quarter of 2019, the Company completed the resolution of one commercial borrower on non-accrual status, which lead to a recovery of $0.3 million as well as collection of $0.1 million in lost interest.
For a discussion on the provision for loan losses, see the “Provision for loan losses,” located in the results of operations section of management’s discussion and analysis contained herein.
The allowance for loan losses can generally absorb losses throughout the loan portfolio. However, in some instances an allocation is made for specific loans or groups of loans. Allocation of the allowance for loan losses for different categories of loans is based on the methodology used by the Company, as previously explained. The changes in the allocations from period-to-period are based upon quarter-end reviews of the loan portfolio.
Allocation of the allowance among major categories of loans for the periods indicated, as well as the percentage of loans in each category to total loans, is summarized in the following table. This table should not be interpreted as an indication that charge-offs in future periods will occur in these amounts or proportions, or that the allocation indicates future charge-off trends. When present, the portion of the allowance designated as unallocated is within the Company’s guidelines:
|
|
|||||||||||||||||||||||||||||
|
|
2019 |
2018 |
2017 |
2016 |
2015 |
||||||||||||||||||||||||
|
|
Category |
Category |
Category |
Category |
Category |
||||||||||||||||||||||||
|
|
% of |
% of |
% of |
% of |
% of |
||||||||||||||||||||||||
|
(dollars in thousands) |
Allowance |
Loans |
Allowance |
Loans |
Allowance |
Loans |
Allowance |
Loans |
Allowance |
Loans |
|||||||||||||||||||
|
Category |
|||||||||||||||||||||||||||||
|
Commercial real estate |
$ |
3,933 | 31 |
% |
$ |
3,901 | 31 |
% |
$ |
4,060 | 32 |
% |
$ |
4,808 | 34 |
% |
$ |
5,014 | 36 |
% |
|||||||||
|
Commercial and industrial |
1,484 | 16 | 1,432 | 18 | 1,374 | 17 | 1,131 | 16 | 1,336 | 18 | |||||||||||||||||||
|
Consumer |
2,013 | 28 | 2,548 | 29 | 2,063 | 28 | 1,788 | 26 | 1,533 | 21 | |||||||||||||||||||
|
Residential real estate |
2,278 | 25 | 1,844 | 22 | 1,608 | 23 | 1,357 | 24 | 1,407 | 25 | |||||||||||||||||||
|
Unallocated |
39 |
- |
22 |
- |
88 |
- |
112 |
- |
237 |
- |
|||||||||||||||||||
|
Total |
$ |
9,747 | 100 |
% |
$ |
9,747 | 100 |
% |
$ |
9,193 | 100 |
% |
$ |
9,196 | 100 |
% |
$ |
9,527 | 100 |
% |
|||||||||
29
The allocation of the allowance for the commercial loan portfolio, which is comprised of CRE and C&I loans, accounted for approximately 56% of the total allowance for loan losses at December 31, 2019, which represents a one percentage point increase from 55% of the total allowance for loan losses at December 31, 2018. The increase allocated to the commercial portfolio was attributed to loans risk rated as Special Mention and Substandard from the year earlier period.
The allocation of the allowance for the consumer loan portfolio, accounted for approximately 21% of the total allowance for loan losses at December 31, 2019, which represents a five-percentage point decrease from 26% of the total allowance for loan losses at December 31, 2018. This reduction in the allowance allocated to the consumer loan portfolio was mostly related to the payoff of a consumer installment troubled debt restructured (TDR) loan with a large specific impairment that occurred during the first quarter of 2019.
The allocation of the allowance for the residential real estate portfolio, accounted for approximately 23% of the total allowance for loan losses at December 31, 2019, which represents a four percentage point increase from 19% of the total allowance for loan losses at December 31, 2018. The increase in the allowance allocated to residential real estate portfolio was attributed to a higher growth in this portfolio relative to the overall loan portfolio as the residential real estate portfolio grew by $23.2 million, or 14%, to $184.9 million at December 31, 2019 from $161.7 million at December 31, 2018 compared to total loan growth of 3%.
The unallocated amount represents the portion of the allowance not specifically identified with a loan or groups of loans. The unallocated reserve was less than 1% of the total allowance for loan losses at December 31, 2019, unchanged from less than 1% of the total allowance for loan losses at December 31, 2018.
Non-performing assets
The Company defines non-performing assets as accruing loans past due 90 days or more, non-accrual loans, TDRs, other real estate owned (ORE) and repossessed assets.
The following table sets forth non-performing assets at December 31:
|
|
||||||||||||||
|
(dollars in thousands) |
2019 |
2018 |
2017 |
2016 |
2015 |
|||||||||
|
|
||||||||||||||
|
Loans past due 90 days or more and accruing |
$ |
- |
$ |
1 |
$ |
6 |
$ |
19 |
$ |
356 | ||||
|
Non-accrual loans * |
3,674 | 4,298 | 3,441 | 7,370 | 9,003 | |||||||||
|
Total non-performing loans |
3,674 | 4,299 | 3,447 | 7,389 | 9,359 | |||||||||
|
Troubled debt restructurings |
991 | 1,830 | 1,871 | 1,823 | 2,423 | |||||||||
|
Other real estate owned and repossessed assets |
369 | 190 | 973 | 1,306 | 1,074 | |||||||||
|
Total non-performing assets |
$ |
5,034 |
$ |
6,319 |
$ |
6,291 |
$ |
10,518 |
$ |
12,856 | ||||
|
|
||||||||||||||
|
Total loans, including loans held-for-sale |
$ |
755,053 |
$ |
733,771 |
$ |
649,546 |
$ |
607,759 |
$ |
562,917 | ||||
|
Total assets |
$ |
1,009,927 |
$ |
981,102 |
$ |
863,637 |
$ |
792,944 |
$ |
729,358 | ||||
|
Non-accrual loans to total loans |
0.49% | 0.59% | 0.53% | 1.21% | 1.60% | |||||||||
|
Non-performing loans to total loans |
0.49% | 0.59% | 0.53% | 1.22% | 1.66% | |||||||||
|
Non-performing assets to total assets |
0.50% | 0.64% | 0.73% | 1.33% | 1.76% | |||||||||
* In the table above, the amount includes non-accrual TDRs of $0.6 million, $1.7 million, $1.6 million and $1.5 million as of 2019, 2018, 2017 and 2016, respectively. There were no non-accrual TDRs as of December 31, 2015.
In the review of loans for both delinquency and collateral sufficiency, management concluded that there were several loans that lacked the ability to repay in accordance with contractual terms. The decision to place loans on non-accrual status is made on an individual basis after considering factors pertaining to each specific loan. Generally, commercial loans are placed on non-accrual status when management has determined that payment of all contractual principal and interest is in doubt or the loan is past due 90 days or more as to principal and interest, unless well-secured and in the process of collection. Consumer loans secured by residential real estate and residential mortgage loans are placed on non-accrual status at 120 days past due as to principal and interest, and unsecured consumer loans are charged-off when the loan is 90 days or more past due as to principal and interest. Uncollected interest income accrued on all loans placed on non-accrual is reversed and charged to interest income.
Non-performing assets represented 0.50% of total assets at December 31, 2019 compared with 0.64% at December 31, 2018. The non-performing assets ratio improved due to the net reduction in non-performing assets by $1.3 million, or 20%, to $5.0 million along with a $28.8 million , or 3%, increase in total assets to $1.0 billion. The improvement in non-performing assets resulted primarily from the payoff of two non-accruing TDRs to a single borrower totaling $0.7 million, a $0.4 million net reduction in a commercial non-accrual loans due to the sale of associated collateral, and $0.3 million in charge-offs for two commercial non-accruing TDRs to a single borrower.
30
From December 31, 2018 to December 31, 2019, non-accrual loans decreased by $0.6 million, or 15%, from $4.3 million to $3.7 million. At December 31, 2018, there were a total of 40 loans to 34 unrelated borrowers with balances that ranged from less than $1 thousand to $0.6 million. At December 31, 2019, there were a total of 44 loans to 34 unrelated borrowers with balances that ranged from less than $1 thousand to $0.5 million. The $0.6 million decline in non-accrual loans was attributed to payments received of $2.2 million, charge-offs of $0.8 million, transfers back to accrual of $0.1 million and transfers to ORE of $1.2 million. These decreases were partially offset by the addition of $3.5 million of loans to non-accrual status along with expenses added to balances of $0.2 million.
From December 31, 2018 to December 31, 2019, accruing loans that were over 90 days past due decreased from three loans totaling $1 thousand to no loans. The Company seeks payments from all past due customers through an aggressive customer communication process. A past due loan will be placed on non-accrual at the 90-day point when it is deemed that a customer is non-responsive and uncooperative to collection efforts.
The composition of non-performing loans as of December 31, 2019 is as follows:
|
|
|||||||||||||
|
|
|||||||||||||
|
|
Past due |
||||||||||||
|
|
Gross |
90 days or |
Non- |
Total non- |
% of |
||||||||
|
|
loan |
more and |
accrual |
performing |
gross |
||||||||
|
(dollars in thousands) |
balances |
still accruing |
loans |
loans |
loans |
||||||||
|
Commercial and industrial |
$ |
122,594 |
$ |
- |
$ |
336 |
$ |
336 | 0.27% | ||||
|
Commercial real estate: |
|||||||||||||
|
Non-owner occupied |
99,801 |
- |
510 | 510 | 0.51% | ||||||||
|
Owner occupied |
130,558 |
- |
1,447 | 1,447 | 1.11% | ||||||||
|
Construction |
4,654 |
- |
- |
- |
- |
||||||||
|
Consumer: |
|||||||||||||
|
Home equity installment |
36,631 |
- |
65 | 65 | 0.18% | ||||||||
|
Home equity line of credit |
47,282 |
- |
294 | 294 | 0.62% | ||||||||
|
Auto loans |
105,870 |
- |
16 | 16 | 0.02% | ||||||||
|
Direct finance leases * |
15,452 |
- |
- |
- |
- |
||||||||
|
Other |
5,634 |
- |
- |
- |
- |
||||||||
|
Residential: |
|||||||||||||
|
Real estate |
167,164 |
- |
1,006 | 1,006 | 0.60% | ||||||||
|
Construction |
17,770 |
- |
- |
- |
- |
||||||||
|
Loans held-for-sale |
1,643 |
- |
- |
- |
- |
||||||||
|
|
|||||||||||||
|
Total |
$ |
755,053 |
$ |
- |
$ |
3,674 |
$ |
3,674 | 0.49% | ||||
|
|
|||||||||||||
*Net of unearned lease revenue of $0.9 million.
Payments received from non-accrual loans are recognized on a cost recovery method. Payments are first applied to the outstanding principal balance, then to the recovery of any charged-off loan amounts. Any excess is treated as a recovery of interest income. If the non-accrual loans that were outstanding as of December 31, 2019 had been performing in accordance with their original terms, the Company would have recognized interest income with respect to such loans of $167 thousand.
The following tables set forth the activity in accruing and non-accruing TDRs as of the period indicated:
|
|
|||||||||||||||||
|
As of and for the year ended December 31, 2019 |
|||||||||||||||||
|
|
Accruing |
Non-accruing |
|||||||||||||||
|
|
Commercial |
Commercial |
Commercial |
Residential |
Consumer |
||||||||||||
|
(dollars in thousands) |
& industrial |
real estate |
real estate |
real estate |
installment |
Total |
|||||||||||
|
|
|||||||||||||||||
|
Troubled Debt Restructures: |
|||||||||||||||||
|
Beginning balance |
$ |
24 |
$ |
1,806 |
$ |
520 |
$ |
764 |
$ |
413 |
$ |
3,527 | |||||
|
Additions |
- |
32 | 57 |
- |
- |
89 | |||||||||||
|
Transfers |
- |
(645) | 421 | (430) |
- |
(654) | |||||||||||
|
Pay downs / payoffs |
(24) | (202) | (76) | (316) | (413) | (1,031) | |||||||||||
|
Charge offs |
- |
- |
(361) | (18) |
- |
(379) | |||||||||||
|
Ending balance |
$ |
- |
$ |
991 |
$ |
561 |
$ |
- |
$ |
- |
$ |
1,552 | |||||
|
Number of loans |
- |
6 | 2 |
- |
- |
8 | |||||||||||
31
|
|
||||||||||||||||||||
|
As of and for the year ended December 31, 2018 |
||||||||||||||||||||
|
|
Accruing |
Non-accruing |
||||||||||||||||||
|
|
Commercial |
Commercial |
Consumer |
Commercial |
Residential |
Consumer |
||||||||||||||
|
(dollars in thousands) |
& industrial |
real estate |
HELOC |
real estate |
real estate |
installment |
Total |
|||||||||||||
|
|
||||||||||||||||||||
|
Troubled Debt Restructures: |
||||||||||||||||||||
|
Beginning balance |
$ |
24 |
$ |
1,847 |
$ |
395 |
$ |
542 |
$ |
636 |
$ |
- |
$ |
3,444 | ||||||
|
Additions |
- |
- |
- |
- |
365 | 414 | 779 | |||||||||||||
|
Transfers |
- |
- |
(395) |
- |
- |
(395) | ||||||||||||||
|
Pay downs / payoffs |
- |
(41) |
- |
(22) |
- |
(1) | (64) | |||||||||||||
|
Charge offs |
- |
- |
- |
- |
(237) |
- |
(237) | |||||||||||||
|
Ending balance |
$ |
24 |
$ |
1,806 |
$ |
- |
$ |
520 |
$ |
764 | 413 |
$ |
3,527 | |||||||
|
Number of loans |
1 | 10 |
- |
1 | 2 | 1 | 15 | |||||||||||||
The Company, on a regular basis, reviews changes to loans to determine if they meet the definition of a TDR. TDRs arise when a borrower experiences financial difficulty and the Company grants a concession that it would not otherwise grant based on current underwriting standards in order to maximize the Company’s recovery.
From December 31, 2018 to December 31, 2019, TDRs decreased by $1.9 million, or 56%, from $3.5 million to $1.6 million. At December 31, 2018, there were a total of 15 TDRs by 11 unrelated borrowers with balances that ranged from $24 thousand to $0.5 million. At December 31, 2019, there were a total of 8 TDRs by 7 unrelated borrowers with balances that ranged from $80 thousand to $0.5 million. The $1.9 million decrease was driven by the payoff of two TDRs by a single borrower totaling $0.7 million, $0.3 million in additional paydowns/payoffs, charge-offs to a single borrower totaling $0.4 million, a $0.4 million transfer to ORE of a residential real estate TDR, and a $0.2 million transfer to ORE of commercial real estate TDR in 2019. These decreases were partially offset by expenses added to balances of TDRs of $0.1 million.
Loans modified in a TDR may or may not be placed on non-accrual status. At December 31, 2018, four TDRs totaling $1.7 million were on non-accrual. At December 31, 2019, two TDRs totaling $0.6 million were on non-accrual. During the first quarter of 2019, a non-accrual residential real estate TDR and a non-accrual consumer installment TDR, both to the same borrower totaling $0.7 million, were paid off. During the second quarter of 2019, a $0.4 million residential real estate TDR was moved to ORE.
If applicable, a TDR loan classified as non-accrual would require a minimum of six months of payments before consideration for a return to accrual status. The concessions granted consisted of temporary interest-only payments or a reduction in the rate of interest to a below-market rate for a contractual period of time. The Company believes concessions have been made in the best interests of the borrower and the Company. If loans characterized as a TDR perform according to the restructured terms for a satisfactory period of time, the TDR designation may be removed in a new calendar year if the loan yields a market rate of interest.
Foreclosed assets held-for-sale
From December 31, 2018 to December 31, 2019, foreclosed assets held-for-sale (ORE) increased from $190 thousand to $349 thousand, a $159 thousand increase. The following table sets forth the activity in the ORE component of foreclosed assets held-for-sale:
|
|
|||||||
|
|
2019 |
2018 |
|||||
|
(dollars in thousands) |
Amount |
# |
Amount |
# |
|||
|
|
|||||||
|
Balance at beginning of period |
$ |
190 | 6 |
$ |
973 | 11 | |
|
|
|||||||
|
Additions |
1,229 | 6 | 714 | 8 | |||
|
Pay downs |
(18) | (2) | |||||
|
Write downs |
(82) | (123) | |||||
|
Sold |
(970) | (5) | (1,372) | (13) | |||
|
Balance at end of period |
$ |
349 | 7 |
$ |
190 | 6 | |
As of December 31, 2019, ORE consisted of seven properties from seven unrelated borrowers totaling $349 thousand. Two of these properties ($256 thousand) were added in 2019; two of these properties ($42 thousand) were added in 2018; two of these properties ($10 thousand) were added in 2017; and one was added in 2014 ($42 thousand). Of the seven properties, one property, totaling $224 thousand, had a signed sales agreement and the other six properties are currently listed for sale.
32
As of December 31, 2019, the Company had two other repossessed assets held-for-sale, with a balance of $20 thousand. There was no other repossessed asset held-for-sale at December 31, 2018.
Cash surrender value of bank owned life insurance
The Company maintains bank owned life insurance (BOLI) for a chosen group of employees at the time of purchase, namely its officers, where the Company is the owner and sole beneficiary of the policies. BOLI is classified as a non-interest earning asset. Increases in the cash surrender value are recorded as components of non-interest income. The BOLI is profitable from the appreciation of the cash surrender values of the pool of insurance and its tax-free advantage to the Company. This profitability is used to offset a portion of current and future employee benefit costs. In March 2019, the Company invested $2.0 million in additional BOLI as a source of funding for additional life insurance benefits that provides for payments upon death for officers and employee benefit expenses related to the Company’s non-qualified SERP implemented for certain executive officers. The BOLI can be liquidated if necessary with associated tax costs. However, the Company intends to hold this pool of insurance, because it provides income that enhances the Company’s capital position. Therefore, the Company has not provided for deferred income taxes on the earnings from the increase in cash surrender value.
Premises and equipment
Net of depreciation, premises and equipment increased $2.7 million during 2019. Additions of $4.2 million were partially offset by $1.5 million of depreciation expense in 2019. The additions were primarily due to the construction of the Mountain Top branch. The Company is expected to begin the renovation of its main office first floor branch in 2020 which will increase construction in process by approximately $2.3 million with completion expected by the middle of 2021.
Other assets
During 2019, the $2.4 million, or 35%, decrease in other assets was due mostly to a $1.6 million higher net deferred tax liability, $0.4 million less in escrow receivable, a $0.3 million lower prepaid dealer reserve and the sale of a $0.2 million asset held-for-sale. These decreases were partially offset by $0.4 million higher prepaid expenses.
Results of Operation
Earnings Summary
The Company’s earnings depend primarily on net interest income. Net interest income is the difference between interest income and interest expense. Interest income is generated from yields earned on interest-earning assets, which consist principally of loans and investment securities. Interest expense is incurred from rates paid on interest-bearing liabilities, which consist of deposits and borrowings. Net interest income is determined by the Company’s interest rate spread (the difference between the yields earned on its interest-earning assets and the rates paid on its interest-bearing liabilities) and the relative amounts of interest-earning assets and interest-bearing liabilities. Interest rate spread is significantly impacted by: changes in interest rates and market yield curves and their related impact on cash flows; the composition and characteristics of interest-earning assets and interest-bearing liabilities; differences in the maturity and re-pricing characteristics of assets compared to the maturity and re-pricing characteristics of the liabilities that fund them and by the competition in the marketplace.
The Company’s earnings are also affected by the level of its non-interest income and expenses and by the provisions for loan losses and income taxes. Non-interest income mainly consists of: service charges on the Company’s loan and deposit products; interchange fees; trust and asset management service fees; increases in the cash surrender value of the bank owned life insurance and from net gains or losses from sales of loans and securities. Non-interest expense consists of: compensation and related employee benefit costs; occupancy; equipment; data processing; advertising and marketing; FDIC insurance premiums; professional fees; loan collection; net other real estate owned (ORE) expenses; supplies and other operating overhead.
Net interest income, net interest rate margin, net interest rate spread and the efficiency ratio are presented in the MD&A on a fully-taxable equivalent (FTE) basis. The Company believes this presentation to be the preferred industry measurement of net interest income as it provides a relevant comparison between taxable and non-taxable amounts.
Overview
For the year ended December 31, 2019, the Company generated net income of $11.6 million, or $3.03 per diluted share, compared to $11.0 million, or $2.90 per diluted share, for the year ended December 31, 2018. The $0.6 million, or 5%, increase in net income stemmed from $1.3 million more net interest income and $1.0 million in additional non-interest income which more than offset a $1.8 million rise in non-interest expenses.
For the year ended December 31, 2019, return on average assets (ROA) and return on average shareholders’ equity (ROE) were 1.18% and 11.49%, respectively, compared to 1.20% and 12.36% for the same period in 2018. The decrease in ROA and ROE was the result of net income growing at a slower pace than average assets and equity during 2019.
33
Net interest income and interest sensitive assets / liabilities
Net interest income (FTE) increased $1.3 million, or 4%, from $31.2 million for the year ended December 31, 2018 to $32.5 million for the year ended December 31, 2019, due to interest income increasing more rapidly than interest expense. Total average interest-earning assets increased $54.3 million and the yields earned on these assets rose 19 basis points resulting in $4.0 million of growth in FTE interest income. In the loan portfolio, the Company experienced average balance growth of $44.3 million combined with higher yields earned in all portfolios, which had the effect of producing $3.4 million of FTE interest income. In the investment portfolio, an increase in the average balances and yields of mortgage-backed securities was the biggest driver of interest income growth. The average balance of total securities grew $13.5 million producing $0.4 million in additional FTE interest income. On the liability side, total interest-bearing liabilities grew $50.5 million on average with a 34 basis point increase in rates paid on these interest-bearing liabilities. Growth in average interest-bearing deposits of $56.9 million, mostly money market accounts, and the 32 basis point higher rates paid on these deposits caused an increase of $2.4 million in interest expense. In addition, higher rates paid on average borrowings in 2019 compared to 2018 resulted in $0.3 million more interest expense.
The FTE net interest rate spread and margin decreased by 15 and 7 basis points, respectively, for the year ended December 31, 2019 compared to the year ended December 31, 2018. The rates paid on deposits and borrowings increased faster than the yields earned on loans and investments causing the decline in FTE net interest rate spread. The overall cost of funds, which includes the impact of non-interest bearing deposits, increased 28 basis points for the year ended December 31, 2019 compared to the same period in 2018. The primary reason for the increase was higher rates paid on larger average deposits which were used to fund asset growth.
For 2020, the Company expects to operate in a declining interest rate environment. A rate environment with falling interest rates positions the Company to reduce its interest income performance from new and maturing earning assets. Until there is a sustained period of yield curve steepening, with rates rising more sharply at the long end, the interest rate margin may experience compression. The FOMC completed gradually increasing the short-term federal funds rate at the end of 2018, and it effected the rates paid on funding sources. Currently, the FOMC began easing the federal funds rate during the second half of 2019 which is expected to eventually result in reduced rates paid on interest-bearing liabilities. On the asset side, the U.S. Prime interest rate, the benchmark rate that banks use as a base rate for adjustable rate loans, rose 100 basis points in 2018, but was cut 75 basis points in the second half of 2019. The focus for 2020 is to manage net interest income through a declining rate environment by managing interest-bearing deposit costs to maintain a reasonable spread. Interest income is projected to increase for 2020. Management expects to actively reduce the cost of funds to partially mitigate spread compression throughout this declining rate cycle. Continued growth in the loan portfolios complemented with investment security growth is expected to boost interest income, and when coupled with a proactive relationship approach to deposit cost setting strategies should help mitigate spread compression and contain the interest rate margin at acceptable levels.
The Company’s cost of interest-bearing liabilities was 1.12% for the year ended December 31, 2019, or 34 basis points higher than the cost for the year ended December 31, 2018. The increase in average interest-bearing deposits combined with higher rates paid on both deposits and borrowings contributed to the higher cost of interest-bearing liabilities. Interest rates along the treasury yield curve have been volatile with shorter-term rates rising faster than long-term rates producing an inverted yield curve in early 2019. Competition had been pressuring banks to increase deposit rates. We expect this trend to reverse as the FOMC reduces the federal funds rate leading to the short-to-intermediate portion of the yield curve to flatten, but the reduction in rates paid on deposits will lag the lower yields earned over the upcoming year. To help mitigate the impact of the imminent change to the economic landscape, the Company has successfully developed and will continue to strengthen its association with existing customers, develop new business relationships, generate new loan volumes, and retain and generate higher levels of average non-interest bearing deposit balances. Strategically deploying no- and low-cost deposits into interest earning-assets is an effective margin-preserving strategy that the Company expects to continue to pursue and expand to help stabilize net interest margin.
The Company’s Asset Liability Management (ALM) team meets regularly to discuss among other things, interest rate risk and when deemed necessary adjusts interest rates. ALM is actively addressing the Company's sensitivity to a declining rate environment to ensure interest rate risks are contained within acceptable levels. ALM also discusses revenue enhancing strategies to help combat the potential for a decline in net interest income. The Company’s marketing department, together with ALM, lenders and deposit gatherers, continue to develop prudent strategies that will grow the loan portfolio and accumulate low-cost deposits to improve net interest income performance.
The table that follows sets forth a comparison of average balances of assets and liabilities and their related net tax equivalent yields and rates for the years indicated. Within the table, interest income was FTE adjusted, using the corporate federal tax rate of 21% for both 2019 and 2018 and 34% for 2017, to recognize the income from tax-exempt interest-earning assets as if the interest was taxable. See “Non-GAAP Financial Measures” within this management’s discussion and analysis for the FTE adjustments. This treatment allows a uniform comparison among yields on interest-earning assets. Loans include loans held-for-sale (HFS) and non-accrual loans but exclude the allowance for loan losses. HELOC are included in the residential real estate category since they are secured by real estate. Net deferred loan cost amortization of $0.7 million in 2019, $0.7 million in 2018 and $0.5 million in 2017, respectively, are included in interest income from loans. Average balances are based on amortized cost and do not reflect net unrealized gains or losses. Net interest margin is calculated by dividing net
34
interest income-FTE by total average interest-earning assets. Cost of funds includes the effect of average non-interest bearing deposits as a funding source:
|
|
||||||||||||||||||||||||||
|
(dollars in thousands) |
2019 |
2018 |
2017 |
|||||||||||||||||||||||
|
|
Average |
Yield / |
Average |
Yield / |
Average |
Yield / |
||||||||||||||||||||
|
Assets |
balance |
Interest |
rate |
balance |
Interest |
rate |
balance |
Interest |
rate |
|||||||||||||||||
|
|
||||||||||||||||||||||||||
|
Interest-earning assets |
||||||||||||||||||||||||||
|
Interest-bearing deposits |
$ |
2,185 |
$ |
47 | 2.14 |
% |
$ |
6,134 |
$ |
104 | 1.70 |
% |
$ |
3,960 |
$ |
48 | 1.22 |
% |
||||||||
|
Restricted regulatory securities |
4,208 | 417 | 9.92 | 3,740 | 194 | 5.17 | 3,105 | 135 | 4.34 | |||||||||||||||||
|
Investments: |
||||||||||||||||||||||||||
|
Agency - GSE |
5,934 | 160 | 2.69 | 6,140 | 147 | 2.39 | 17,313 | 248 | 1.43 | |||||||||||||||||
|
MBS - GSE residential |
127,533 | 3,473 | 2.72 | 118,197 | 3,167 | 2.68 | 89,909 | 2,267 | 2.52 | |||||||||||||||||
|
State and municipal (nontaxable) |
49,988 | 2,195 | 4.39 | 45,420 | 2,055 | 4.53 | 41,528 | 2,278 | 5.49 | |||||||||||||||||
|
Other |
- |
- |
- |
189 | 13 | 6.85 | 295 | 30 | 10.12 | |||||||||||||||||
|
Total investments |
183,455 | 5,828 | 3.18 | 169,946 | 5,382 | 3.17 | 149,045 | 4,823 | 3.24 | |||||||||||||||||
|
Loans and leases: |
||||||||||||||||||||||||||
|
C&I and CRE (taxable) |
317,023 | 16,434 | 5.18 | 299,789 | 14,675 | 4.89 | 294,652 | 13,675 | 4.64 | |||||||||||||||||
|
C&I and CRE (nontaxable) |
34,056 | 1,363 | 4.00 | 32,224 | 1,213 | 3.76 | 30,894 | 1,304 | 4.22 | |||||||||||||||||
|
Consumer |
159,937 | 6,208 | 3.88 | 145,850 | 5,413 | 3.71 | 113,217 | 4,321 | 3.82 | |||||||||||||||||
|
Residential real estate |
221,136 | 9,722 | 4.40 | 209,990 | 9,067 | 4.32 | 200,714 | 8,039 | 4.01 | |||||||||||||||||
|
Total loans and leases |
732,152 | 33,727 | 4.61 | 687,853 | 30,368 | 4.41 | 639,477 | 27,339 | 4.28 | |||||||||||||||||
|
Total interest-earning assets |
922,000 | 40,019 | 4.34 |
% |
867,673 | 36,048 | 4.15 |
% |
795,587 | 32,345 | 4.07 |
% |
||||||||||||||
|
Non-interest earning assets |
62,552 | 50,269 | 48,760 | |||||||||||||||||||||||
|
Total assets |
$ |
984,552 |
$ |
917,942 |
$ |
844,347 | ||||||||||||||||||||
|
|
||||||||||||||||||||||||||
|
Liabilities and shareholders' equity |
||||||||||||||||||||||||||
|
|
||||||||||||||||||||||||||
|
Interest-bearing liabilities |
||||||||||||||||||||||||||
|
Deposits: |
||||||||||||||||||||||||||
|
Interest-bearing checking |
$ |
234,603 |
$ |
1,636 | 0.70 |
% |
$ |
210,277 |
$ |
1,182 | 0.56 |
% |
$ |
188,833 |
$ |
764 | 0.40 |
% |
||||||||
|
Savings and clubs |
111,687 | 139 | 0.12 | 131,050 | 221 | 0.17 | 126,877 | 176 | 0.14 | |||||||||||||||||
|
MMDA |
156,178 | 2,290 | 1.47 | 112,158 | 1,000 | 0.89 | 117,852 | 802 | 0.68 | |||||||||||||||||
|
Certificates of deposit |
119,150 | 2,111 | 1.77 | 111,278 | 1,408 | 1.27 | 102,561 | 1,008 | 0.98 | |||||||||||||||||
|
Total interest-bearing deposits |
621,618 | 6,176 | 0.99 | 564,763 | 3,811 | 0.67 | 536,123 | 2,750 | 0.51 | |||||||||||||||||
|
Repurchase agreements |
- |
- |
- |
9,666 | 16 | 0.16 | 10,274 | 21 | 0.20 | |||||||||||||||||
|
Overnight borrowings |
35,243 | 878 | 2.49 | 27,892 | 667 | 2.39 | 18,399 | 205 | 1.11 | |||||||||||||||||
|
FHLB advances |
18,074 | 500 | 2.77 | 22,109 | 379 | 1.71 | 19,778 | 247 | 1.25 | |||||||||||||||||
|
Total interest-bearing liabilities |
674,935 | 7,554 | 1.12 |
% |
624,430 | 4,873 | 0.78 |
% |
584,574 | 3,223 | 0.55 |
% |
||||||||||||||
|
Non-interest bearing deposits |
195,393 | 196,790 | 169,075 | |||||||||||||||||||||||
|
Non-interest bearing liabilities |
13,517 | 7,697 | 6,379 | |||||||||||||||||||||||
|
Total liabilities |
883,845 | 828,917 | 760,028 | |||||||||||||||||||||||
|
Shareholders' equity |
100,707 | 89,025 | 84,319 | |||||||||||||||||||||||
|
Total liabilities and shareholders' equity |
$ |
984,552 |
$ |
917,942 |
$ |
844,347 | ||||||||||||||||||||
|
Net interest income - FTE |
$ |
32,465 |
$ |
31,175 |
$ |
29,122 | ||||||||||||||||||||
|
|
||||||||||||||||||||||||||
|
Net interest spread |
3.22 |
% |
3.37 |
% |
3.52 |
% |
||||||||||||||||||||
|
Net interest margin |
3.52 |
% |
3.59 |
% |
3.66 |
% |
||||||||||||||||||||
|
Cost of funds |
0.87 |
% |
0.59 |
% |
0.43 |
% |
||||||||||||||||||||
Changes in net interest income are a function of both changes in interest rates and changes in volume of interest-earning assets and interest-bearing liabilities. The following table presents the extent to which changes in interest rates and changes in volumes of interest-earning assets and interest-bearing liabilities have affected the Company’s interest income and interest expense during the periods indicated. Information is provided in each category with respect to (1) the changes attributable to changes in volume (changes in volume multiplied by the prior period rate), (2) the changes attributable to changes in interest rates (changes in rates multiplied by prior period volume) and (3) the net change. The combined effect of changes in both
35
volume and rate has been allocated proportionately to the change due to volume and the change due to rate. Tax-exempt income was not converted to a tax-equivalent basis on the rate/volume analysis:
|
|
Years ended December 31, |
||||||||||||||||
|
(dollars in thousands) |
2019 compared to 2018 |
2018 compared to 2017 |
|||||||||||||||
|
|
Increase (decrease) due to |
||||||||||||||||
|
|
Volume |
Rate |
Total |
Volume |
Rate |
Total |
|||||||||||
|
Interest income: |
|||||||||||||||||
|
Interest-bearing deposits |
$ |
(79) |
$ |
22 |
$ |
(57) |
$ |
33 |
$ |
23 |
$ |
56 | |||||
|
Restricted regulatory securities |
26 | 197 | 223 | 30 | 29 | 59 | |||||||||||
|
Investments: |
|||||||||||||||||
|
Agency - GSE |
(5) | 18 | 13 | (213) | 112 | (101) | |||||||||||
|
MBS - GSE residential |
253 | 53 | 306 | 750 | 150 | 900 | |||||||||||
|
State and municipal |
158 | (21) | 137 | 137 | 8 | 145 | |||||||||||
|
Other |
(11) |
- |
(11) | (7) | (4) | (11) | |||||||||||
|
Total investments |
395 | 50 | 445 | 667 | 266 | 933 | |||||||||||
|
Loans and leases: |
|||||||||||||||||
|
Residential real estate |
488 | 167 | 655 | 387 | 642 | 1,029 | |||||||||||
|
C&I and CRE |
924 | 954 | 1,878 | 288 | 809 | 1,097 | |||||||||||
|
Consumer |
539 | 256 | 795 | 1,218 | (126) | 1,092 | |||||||||||
|
Total loans and leases |
1,951 | 1,377 | 3,328 | 1,893 | 1,325 | 3,218 | |||||||||||
|
Total interest income |
2,293 | 1,646 | 3,939 | 2,623 | 1,643 | 4,266 | |||||||||||
|
|
|||||||||||||||||
|
Interest expense: |
|||||||||||||||||
|
Deposits: |
|||||||||||||||||
|
Interest-bearing checking |
147 | 307 | 454 | 91 | 326 | 417 | |||||||||||
|
Savings and clubs |
(29) | (53) | (82) | 6 | 40 | 46 | |||||||||||
|
Money market |
488 | 802 | 1,290 | (40) | 238 | 198 | |||||||||||
|
Certificates of deposit |
105 | 598 | 703 | 90 | 310 | 400 | |||||||||||
|
Total deposits |
711 | 1,654 | 2,365 | 147 | 914 | 1,061 | |||||||||||
|
Repurchase agreements |
(16) |
- |
(16) | (1) | (4) | (5) | |||||||||||
|
Overnight borrowings |
182 | 29 | 211 | 143 | 319 | 462 | |||||||||||
|
FHLB advances |
(79) | 200 | 121 | 32 | 100 | 132 | |||||||||||
|
Total interest expense |
798 | 1,883 | 2,681 | 321 | 1,329 | 1,650 | |||||||||||
|
Net interest income |
$ |
1,495 |
$ |
(237) |
$ |
1,258 |
$ |
2,302 |
$ |
314 |
$ |
2,616 | |||||
Provision for loan losses
The provision for loan losses represents the necessary amount to charge against current earnings, the purpose of which is to increase the allowance for loan losses (the allowance) to a level that represents management’s best estimate of known and inherent losses in the Company’s loan portfolio. Loans determined to be uncollectible are charged off against the allowance. The required amount of the provision for loan losses, based upon the adequate level of the allowance, is subject to the ongoing analysis of the loan portfolio. The Company’s Special Assets Committee meets periodically to review problem loans. The committee is comprised of management, including credit administration officers, loan officers, loan workout officers and collection personnel. The committee reports quarterly to the Credit Administration Committee of the board of directors.
Management continuously reviews the risks inherent in the loan portfolio. Specific factors used to evaluate the adequacy of the loan loss provision during the formal process include:
•specific loans that could have loss potential;
•levels of and trends in delinquencies and non-accrual loans;
•levels of and trends in charge-offs and recoveries;
•trends in volume and terms of loans;
•changes in risk selection and underwriting standards;
•changes in lending policies and legal and regulatory requirements;
•experience, ability and depth of lending management;
•national and local economic trends and conditions; and
•changes in credit concentrations.
36
For the year ended December 31, 2019 and 2018, the Company recorded a provision for loan losses of $1.1 million and $1.5 million, respectively, a $0.4 million, or 25%, decrease. This decrease in the provision for loan losses from the year earlier period was due primarily to an easing in the Company’s loan growth along with continuing strong asset quality. The provision for loan losses derives from the reserve required from the allowance for loan losses calculation. The Company continued provisioning for the year ended December 31, 2019 in order to maintain an allowance level that management deemed adequate.
For a discussion on the allowance for loan losses, see “Allowance for loan losses,” located in the comparison of financial condition section of management’s discussion and analysis contained herein.
Other income
For the year ended December 31, 2019, non-interest income amounted to $10.2 million, a $1.0 million, or 11%, increase compared to $9.2 million recorded for the year ended December 31, 2018. Service charges on loans were $0.5 million higher in 2019 compared to 2018 primarily driven by more service charges on mortgage and commercial loans. Fees from financial services increased $0.2 million year-over-year. Interchange fees grew $0.2 million due to a higher volume of debit card transactions. Gains on the sale of loans were up $0.2 million partially offset by an increase in mortgage servicing right amortization of $0.1 million.
Other operating expenses
For the year ended December 31, 2019, total other operating expenses totaled $26.9 million, an increase of $1.8 million, or 7%, compared to $25.1 million for the year ended December 31, 2018. Merger related expenses totaled $0.5 million of this increase. Salaries and employee benefits contributed the most to the increase rising $1.1 million, or 8%, in 2019 compared to 2018. The basis of the increase includes $1.1 million increased salaries with eight more full-time equivalent employees, $0.1 million in commissions, $0.1 million in social security taxes, $0.1 million in 401k expenses, $0.1 million in stock-based compensation and $0.1 million in expenses from the post-retirement benefit plan. These increases in salaries and employee benefits were partially offset by $0.2 million less in employee bonuses and $0.2 million lower group insurance costs. Premises and equipment expenses were $0.3 million higher due to an increase in depreciation and equipment maintenance and rental expenses. Data processing and communications expense increased $0.3 million during 2019 compared to 2018 because of additional costs for data center services. Merger-related expenses were $0.4 million in from professional fees related to the proposed merger. Loan collection expenses increased $0.1 million. Automated transaction processing expenses increased $0.1 million. Partially offsetting these increases in expenses was a decrease of $0.1 million in the FDIC assessment due to a credit received in 2019 and $0.2 million less in other professional fees.
The ratios of non-interest expense less non-interest income to average assets, known as the expense ratio, at December 31, 2019 and 2018 were 1.70% and 1.73%, respectively. The expense ratio decreased because of increased levels of average assets. The efficiency ratio increased from 62.10% at December 31, 2018 to 63.11% at December 31, 2019 due to the increase in non-interest expenses in 2019. For more information on the calculation of the efficiency ratio, see “Non-GAAP Financial Measures” located within this management’s discussion and analysis.
Merger related expenses of $2.4 million are anticipated for 2020 for legal, investment banking, audit, data processing, regulatory filings, shareholder conversion and severance costs.
Provision for income taxes
The Company’s effective income tax rate approximated 16.7% in 2019 and 16.2% in 2018. The difference between the effective rate and the enacted statutory corporate rate of 21% is due mostly to the effect of tax-exempt income in relation to the level of pre-tax income. The provision for income taxes increased $0.2 million, or 9%, from $2.1 million at December 31, 2018 to $2.3 million at December 31, 2019. The increase was primarily due to higher income before taxes in 2019 supplemented by higher taxable income from merger facilitating non-deductible expenses of $0.3 million.
Comparison of Financial Condition as of December 31, 2018
and 2017 and Results of Operations for each of the Years then Ended
Executive Summary
Nationally, the unemployment rate declined from 4.1% at December 31, 2017 to 3.9% at December 31, 2018. However, the unemployment rate in the Scranton-Wilkes-Barre Metropolitan Statistical Area (local) remained at a higher level than the national unemployment rate. According to the U.S. Bureau of Labor Statistics, the local unemployment rate at December 31, 2018 was 4.8%, a decrease of 0.2 percentage points from 5.0% at December 31, 2017. This was a positive sign for our local economy as the labor force and the number of employed both increased which decreased the unemployment rate.
During 2018, the Company’s assets grew by 14% from deposit growth, borrowings and retained net earnings, which were used to fund growth in the loan and securities portfolios. Non-performing assets represented 0.64% of total assets as of December 31, 2018, down from 0.73% at the prior year end. Non-performing assets to total assets was lower during 2018 mostly due to non-performing assets remaining stable while total assets grew.
37
We generated $11.0 million in net income in 2018, up $2.3 million, or 26%, from $8.7 million in 2017. In 2018, our larger and better positioned balance sheet contributed to the success of our earnings performance.
Financial Condition
Consolidated assets increased $117.5 million, or 14%, to $981.1 million as of December 31, 2018 from $863.6 million at December 31, 2017. The increase in assets occurred predominantly in the loan and investment portfolios. The asset growth was funded by utilizing growth in deposits of $40.0 million, borrowings of $68.4 million and $7.7 million in retained earnings, net of dividends declared.
Funds Provided:
Deposits
Total deposits increased $40.0 million, or 5%, from $730.2 million at December 31, 2017 to $770.2 million at December 31, 2018. Interest-bearing and non-interest bearing checking accounts contributed the most to the growth with increases of $21.6 million and $16.1 million, respectively. The increase in interest-bearing checking accounts was due to the transfer of repurchase agreement accounts into checking accounts at the end of 2018 and growth throughout 2018 in business account balances. The Company focused on obtaining a full-banking relationship with existing customers as well as forming new customer relationships. During 2018, the Company received $11.2 million in non-interest bearing deposits from a new business relationship. The remainder of the growth in non-interest bearing checking resulted mostly from growth in business and personal accounts. Additionally, money market accounts grew $4.1 million primarily from personal account activity and CDs also increased $9.2 million during 2018. These increases were partially offset by a $11.0 million decrease in savings and clubs, of which $5.6 million was from one customer.
Customers’ interest in long-term time deposit products started to pick up in 2018 as interest rates rose. The Company’s portfolio of CDs increased mostly due to CD promotions and customers’ desire for higher-yielding deposit alternatives. During 2018, deposit customers began to move some money from savings and money market accounts to CDs.
As of December 31, 2018 and 2017, CDARS and ICS reciprocal deposits represented $4.7 million and $1.1 million, or less than 1%, of total deposits.
Short-term borrowings
At the end of 2018, the Company transferred all repurchase agreement accounts to interest-bearing checking accounts. Short-term borrowings increased $57.9 million during 2018 to fund loan growth.
FHLB advances
At December 31, 2018, the Company had $31.7 million in FHLB advances with a weighted average interest rate of 2.15%. During the first quarter of 2018, the Company paid off $2.5 million of FHLB advances and another $2.0 million was paid off during the third quarter of 2018. During September 2018, the Company borrowed $15 million with maturity dates laddered out from 3 to 5 years in order to purchase securities.
Funds Deployed:
Investment Securities
As of December 31, 2018, the carrying value of investment securities amounted to $182.8 million, or 19% of total assets, compared to $157.4 million, or 18% of total assets, at December 31, 2017.
Investment securities were comprised of AFS securities as of December 31, 2018 and December 31, 2017. The AFS securities were recorded with a net unrealized loss of $1.4 million and a net unrealized gain of $2.3 million as of December 31, 2018 and 2017. On January 1, 2018, $0.5 million of net unrealized gains on equity securities were reclassified from AOCI to retained earnings. Of the remaining net decline in the unrealized gain position of $3.1 million, $2.1 million was net unrealized losses on mortgages-backed securities and $1.0 million was net unrealized losses on municipal securities.
As of December 31, 2018, the Company had $118.9 million in public deposits, or 15% of total deposits. As of December 31, 2018, the balance of pledged securities required for deposit accounts was $82.6 million, or 45% of total securities.
During the year ended December 31, 2018, the Company did not incur other-than-temporary impairment charges from its investment securities portfolio.
During 2018, the carrying value of total investments increased $25.4 million, or 16%.
During the third quarter of 2018, the Company purchased approximately $15 million of securities, primarily MBS-GSE residential, funded by FHLB advances with maturity dates laddered out from 3 to 5 years matching a spread expected to produce a suitable after-tax return.
As of December 31, 2018, there were no investments from any one issuer with an aggregate book value that exceeded 10% of the Company’s shareholders’ equity.
38
The distribution of debt securities by stated maturity and tax-equivalent yield at December 31, 2017 were as follows:
|
|
More than |
More than |
More than |
|||||||||||||||||||||
|
|
One year or less |
one year to five years |
five years to ten years |
ten years |
Total |
|||||||||||||||||||
|
(dollars in thousands) |
$ |
% |
$ |
% |
$ |
% |
$ |
% |
$ |
% |
||||||||||||||
|
|
||||||||||||||||||||||||
|
MBS - GSE residential |
$ |
- |
- |
% |
$ |
150 | 5.85 |
% |
$ |
996 | 4.26 |
% |
$ |
123,172 | 3.38 |
% |
$ |
124,318 | 3.39 |
% |
||||
|
State & municipal subdivisions |
9,339 | 5.00 | 3,122 | 5.24 | 2,620 | 5.01 | 37,494 | 4.67 | 52,575 | 4.78 | ||||||||||||||
|
Agency - GSE |
- |
- |
4,945 | 2.69 | 972 | 2.72 |
- |
- |
5,917 | 2.70 | ||||||||||||||
|
Total debt securities |
$ |
9,339 | 5.00 |
% |
$ |
8,217 | 3.69 |
% |
$ |
4,588 | 4.36 |
% |
$ |
160,666 | 3.67 |
% |
$ |
182,810 | 3.76 |
% |
||||
In the above table, the book yields on state & municipal subdivisions were adjusted to a tax-equivalent basis using the corporate federal tax rate of 34%. In addition, average yields on securities AFS are based on amortized cost and do not reflect unrealized gains or losses.
Federal Home Loan Bank Stock
The dividends received from the FHLB totaled $194 thousand and $135 thousand for the years ended December 31, 2018 and 2017, respectively. The balance in FHLB stock was $6.3 million and $2.8 million as of December 31, 2018 and 2017, respectively.
Loans and leases
As of December 31, 2018, the Company had gross loans and leases totaling $718.0 million compared to $638.6 million at December 31, 2017 which represented an increase of $79.4 million, or 12%. From a percentage point of view, the auto and leases portfolio recognized the most growth at $28.0 million, or 34%, followed by commercial and industrial growth of $13.3 million, or 12%, and commercial real estate growth of $17.9 million, or 9%.
In 2018, the Company originated $26.0 million of commercial and industrial loans and $34.1 million of commercial real estate loans compared to $43.8 million and $23.9 million, respectively, net of loan participations in 2017. Also, during 2018, the Company originated $68.0 million of residential real estate loans compared to $63.2 million in 2017. Included in mortgage loans were $21.5 million of residential real estate construction lines in 2018 and $17.2 million in 2017. In 2018, the Company originated $77.1 million of consumer loans compared to $61.1 million in 2017. Of the consumer loan originations, $62.3 million were dealer loans in the auto and leases portfolio in 2018 compared to $50.1 million in 2017. In addition for 2018, the Company had originations of lines of credit in the amounts of $61.0 million for commercial borrowers and $17.9 million in home equity and other consumer lines of credit.
Commercial and industrial and commercial real estate
As of December 31, 2018, the commercial loan portfolio recognized net growth of $31.2 million, or 10%, compared to December 31, 2017. This growth was largely attributed to the commercial real estate category of $17.9 million, or 9%, with the owner occupied category increasing $14.7 million, or 13%.
Consumer
The consumer loan portfolio grew 20%, or $33.4 million, from $169.7 million at December 31, 2017 to $203.1 million at December 31, 2018. The growth was largely supported by a 34%, or $28.0 million, increase in auto loans and leases. A shift to fixed rate products due to a rising rate environment was realized as home equity line of credit balances slid by 1%, or $0.8 million. Offsetting this was fixed rate home equity installment loan growth of 20%, or $5.4 million.
Residential
The residential loan portfolio grew approximately $14.9 million, or 10%, from $146.8 million at December 31, 2017 to $161.7 million at December 31, 2018. Held-for-investment and construction real estate mortgages both demonstrated growth over the course of 2018. Held-for-investment residential loans grew $9.1 million from $136.9 million to $146.0 million and construction loan balances grew $5.8 million from $9.9 million to $15.7 million. Held-for-investment real estate made up approximately 90% of the total residential portfolio at December 31, 2018.
Loans held-for-sale
As of December 31, 2018 and 2017, loans HFS consisted of residential mortgages with carrying amounts of $5.7 million and $2.2 million, respectively, which approximated their fair values. During the year ended December 31, 2018, residential mortgage loans with principal balances of $32.1 million were sold into the secondary market and the Company recognized net gains of $0.6 million, compared to $40.7 million and $0.8 million, respectively, during the year ended December 31, 2017. During the year ended December 31, 2018, the Company also sold one SBA guaranteed loan with a principal balance of $0.4 million and recognized a net gain on the sale of $47 thousand, compared to $2.4 million and $100 thousand, respectively, during the year ended December 31, 2017.
At December 31, 2018 and 2017, the servicing portfolio balance of sold residential mortgage loans was $304.9 million and $299.3 million, respectively. At December 31, 2018 and 2017, the servicing portfolio balance of sold SBA loans was $5.5 million and $5.6 million, respectively.
39
Allowance for loan losses
The allowance for loan losses was $9.7 million at December 31, 2018 compared to $9.2 million at December 31, 2017. Relative to the loan portfolio, the allowance decreased from 1.44% of total loans at December 31, 2017 to 1.36% at December 31, 2018, as loan growth outpaced the higher allowance for loan losses. The actual allowance increased $0.5 million, or 6%, during 2018, while total loans increased $79.0 million, or 12%, over the same time period. The decline in the allowance relative to total loans was considered appropriate by management due to the strength of the Company’s asset quality.
During the first quarter of 2018, management reduced qualitative factors associated with owner occupied commercial real estate and home equity lines of credit due to lower levels of delinquency associated with these loan categories. During the fourth quarter of 2018, management reduced qualitative factors associated with auto loans and leases due to an improving trend in delinquency observed for this loan category. Otherwise, the qualitative factors remained unchanged for 2018.
Net charge-offs against the allowance totaled $0.9 million for the year ended December 31, 2018 compared with $1.6 million for the year ended December 31, 2017, representing a $0.7 million, or 45%, decrease. The decline in net charge-offs was attributed to total charge-offs decreasing $0.5 million for 2018 compared to 2017, and total recoveries increasing $0.2 million over the same period. The $0.7 million decrease in net charge-offs coupled with the $46.8 million increase in average total loans caused net charge-offs to average total loans outstanding to decline from 0.26% at December 31, 2017 to 0.13% at December 31, 2018.
For the year ended December 31, 2018, allowance levels rose by $0.5 million to $9.7 million compared to $9.2 million at December 31, 2017, while total loans increased by $79.0 million to $717.0 million from $638.0 million at December 31, 2017.
The allocation of the allowance for the commercial loan portfolio, which is comprised of commercial real estate and commercial & industrial loans, accounted for approximately 55% of the total allowance for loan losses at December 31, 2018, which represents a four percentage point decrease from 59% of the total allowance for loan losses at December 31, 2017. The decrease in the allowance allocated to the commercial loan portfolio was attributed to lower historical loss percentages applied to the commercial real estate portfolio as a result of the reduction in commercial real estate net charge-offs observed for 2018 versus 2017. The allowance also decreased when a previously impaired single commercial real estate loan that had a large specific impairment was reclassified to performing status during the fourth quarter of 2018.
The allocation of the allowance for the consumer loan portfolio, accounted for approximately 26% of the total allowance for loan losses at December 31, 2018, which represents a four percentage point increase from 22% of the total allowance for loan losses at December 30, 2017. This higher allocation to the consumer loan portfolio was mostly related to consumer loan growth, specifically in the Company’s auto portfolio, along with the addition of a consumer installment TDR loan with a large specific impairment in the first quarter of 2018.
The allocation of the allowance for the residential real estate portfolio, accounted for approximately 19% of the total allowance for loan losses at December 31, 2018, which represents a two percentage point increase from 17% of the total allowance for loan losses December 31, 2017. The increase in the allowance allocated to residential real estate was attributed to growth in this category of loans.
The unallocated amount represents the portion of the allowance not specifically identified with a loan or groups of loans. The unallocated reserve was less than 1% of the total allowance for loan losses at December 31, 2018, practically unchanged from 1% of the total allowance for loan losses at December 31, 2017.
Non-performing assets
At December 31, 2018, non-performing assets represented 0.64% of total assets compared with 0.73% at December 31, 2017. The improvement in the ratio of non-performing assets to total assets was attributed to total asset growth of $117.5 million, or 14%, during 2018 while non-performing assets remained essentially unchanged at $6.3 million at December 31, 2017 and December 31, 2018.
From December 31, 2017 to December 31, 2018, non-performing loans, which consists of accruing loans that were over 90 days past due as well as all non-accrual loans, increased from $3.4 million to $4.3 million, a $0.9 million, or 25%, increase. The rise in non-performing loans was the result of additions of $3.4 million and miscellaneous expenses totaling $0.1 million added to balances of respective non-accrual loans. These increases were partially offset by payments received of $0.9 million, charge-offs of $0.7 million, transfers back to accrual of $0.3 million and transfers to ORE of $0.7 million for all non-accrual loans.
From December 31, 2017 to December 31, 2018, the portion of accruing loans that were over 90 days past due decreased from one loan totaling $6 thousand to three loans totaling $1 thousand.
From December 31, 2017 to December 31, 2018, non-accrual loans increased by $0.9 million, or 25%, from $3.4 million to $4.3 million. At December 31, 2017, there were a total of 39 loans to 32 unrelated borrowers with balances that ranged from less than $1 thousand to $0.6 million. At December 31, 2018, there were a total of 40 loans to 34 unrelated borrowers with balances that ranged from less than $1 thousand to $0.6 million. The increase in non-accrual loans was primarily attributed
40
to two loans to a single borrower, totaling $0.7 million, being placed on non-accrual status during the third quarter of 2018 along with two loans to a single borrower, totaling $0.8 million, being placed on non-accrual status during the fourth quarter of 2018.
If the non-accrual loans that were outstanding as of December 31, 2018 had been performing in accordance with their original terms, the Company would have recognized interest income with respect to such loans of $303 thousand.
From December 31, 2017 to December 31, 2018, TDRs increased by $0.1 million from $3.4 million to $3.5 million. At December 31, 2017, there were a total of 14 TDRs to 10 unrelated borrowers with balances that ranged from $24 thousand to $0.6 million. At December 31, 2018, there were a total of 15 TDRs to 11 unrelated borrowers with balances that ranged from $24 thousand to $0.5 million. The increase was driven by the addition of 2 TDRs to a single borrower totaling $0.7 million in the first quarter of 2018. This increase was partially offset by the transfer to ORE of a consumer HELOC TDR with a balance of $0.4 million in the first quarter of 2018 along with a $0.2 million charge off of a residential real estate TDR in the fourth quarter of 2018.
Loans modified in a TDR may or may not be placed on non-accrual status. At December 31, 2017, three TDRs totaling $1.6 million were on non-accrual. At December 31, 2018, four TDRs totaling $1.7 million were on non-accrual. During the first quarter of 2018, one non-accrual consumer HELOC TDR was transferred to ORE. During the third quarter of 2018, two TDRs were placed on non-accrual status.
Foreclosed assets held-for-sale
From December 31, 2017 to December 31, 2018, foreclosed assets held-for-sale (ORE) decreased from $1.0 million to $0.2 million, a $0.8 million, or 80%, decrease. As of December 31, 2018, ORE consisted of six properties from six unrelated borrowers totaling $190 thousand. Three of these properties ($100 thousand) were added in 2018; two of these properties ($48 thousand) were added in 2017; and one was added in 2014 ($42 thousand). Of the six properties, one totaling $15 thousand had a signed sales agreement while the five remaining properties totaling $175 thousand were listed for sale.
As of December 31, 2018 and 2017, the Company had no other repossessed assets held-for-sale.
Cash surrender value of bank owned life insurance
In March 2017, the Company invested $8.0 million in additional BOLI as a source of funding for additional life insurance benefits that provides for payments upon death for officers and employee benefit expenses related to the Company’s non-qualified SERP implemented for certain executive officers.
Premises and equipment
Net of depreciation, premises and equipment increased $2.0 million during 2018. Additions of $3.6 million were partially offset by $1.3 million of depreciation expense and $0.3 million transferred to other assets held-for-sale in 2018. The additions were primarily due to the construction of the Back Mountain branch.
Other assets
During 2018, the $2.2 million, or 14%, increase in other assets was due mostly to $1.7 million in higher residual values associated with recording new automobile leases, net of lease disposals; a $0.6 million increase in the prepaid dealer reserve; $0.5 million higher prepaid expenses and $0.2 million added to other assets held-for-sale. These increases were partially offset by a $0.9 million higher net deferred tax liability.
Results of Operations
Overview
For the year ended December 31, 2018, the Company generated net income of $11.0 million, or $2.90 per diluted share, compared to $8.7 million, or $2.33 per diluted share, for the year ended December 31, 2017. The $2.3 million, or 26%, increase in net income stemmed from $2.6 million more net interest income and $0.8 million in additional non-interest income which more than offset a $0.2 million rise in non-interest expenses and $0.9 million higher provision for income taxes.
For the year ended December 31, 2018, return on average assets (ROA) and return on average shareholders’ equity (ROE) were 1.20% and 12.36%, respectively, compared to 1.03% and 10.34% for the same period in 2017. The increase in ROA and ROE was the result of net income growth during 2018.
Net interest income and interest sensitive assets / liabilities
Net interest income increased $2.6 million, or 9%, from $27.8 million for the year ended December 31, 2017 to $30.4 million for the year ended December 31, 2018, due to interest income increasing more rapidly than interest expense. Total average interest-earning assets increased $70.5 million and the yields earned on these assets rose nine basis points resulting in $3.7 million of growth in FTE interest income. In the loan portfolio, the Company experienced average balance growth of $46.8 million combined with higher yields earned in the commercial and residential portfolios, which had the effect of producing $3.0 million of FTE interest income. Although all loan portfolios showed more interest income, the consumer loan portfolio
41
increased due to average balance growth while the commercial and residential loan portfolios experienced increases due to both average volume growth and higher yields. In the investment portfolio, an increase in the average balances and yields of mortgage-backed securities was the biggest driver of interest income growth. The average balance of total securities grew $20.9 million producing $0.6 million in additional FTE interest income. On the liability side, total interest-bearing liabilities grew $39.9 million on average with a 23 basis point increase in rates paid on these interest-bearing liabilities. Growth in average interest-bearing deposits of $28.6 million, mostly interest-bearing checking accounts, and the 16 basis point higher rates paid on these deposits caused an increase of $1.1 million in interest expense. In addition, the Company had $11.2 million more average borrowings on which they paid higher rates in 2018 compared to 2017 which resulted in $0.6 million more interest expense.
The FTE net interest rate spread and margin decreased by fourteen and six basis points, respectively, for the year ended December 31, 2018 compared to the year ended December 31, 2017. The Company’s lower tax rate in 2018 caused FTE interest income from nontaxable interest-earning assets to decline. The negative impact of this lower FTE adjustment had the effect of reducing net interest rate spread by eight basis points and margin by seven basis points. The rates paid on interest-bearing liabilities rose faster than the yields earned on interest-earning assets causing a further decline in FTE net interest rate spread of 6 basis points. If not for the reduction in yields from the lower FTE adjustment, FTE net interest margin would have increased by one basis point due to the $27.7 million increase in average non-interest bearing deposits. The overall cost of funds, which includes the impact of non-interest bearing deposits, increased sixteen basis points for the year ended December 31, 2018 compared to the same period in 2017. The primary reason for the increase was higher rates paid on larger average borrowings which were used to fund asset growth along with an increase in average interest-bearing deposits and the rates paid thereon.
The Company’s cost of interest-bearing liabilities was 78 basis points for the year ended December 31, 2018, or 23 basis points higher than the cost for the year ended December 31, 2017. The increase in average borrowings and average interest-bearing deposits combined with higher rates paid on both contributed to the higher cost of interest-bearing liabilities. During 2017 and 2018, rates paid on interest-bearing deposits started to inch up from historic low levels. Interest rates along the treasury yield curve have been volatile with shorter-term rates rising faster than long-term rates producing a flatter yield curve during 2018.
Provision for loan losses
For the year ended December 31, 2018 and 2017, the Company recorded a provision for loan losses of $1.5 million. The provision for loan losses derives from the reserve required from the allowance for loan losses calculation. In response to the level of loan growth observed during 2018, the Company continued provisioning in order to maintain an allowance level that management deemed adequate. Management maintained a $1.5 million provision during 2018, despite a larger loan portfolio compared with 2017, because of strengthening asset quality.
Other income
For the year ended December 31, 2018, non-interest income amounted to $9.2 million, a $0.8 million, or 10%, increase compared to $8.4 million recorded for the year ended December 31, 2017. Interchange fees grew $0.3 million due to a higher volume of debit card transactions and an increase in merchant credit card income in 2018. Trust fees were $0.3 million higher due to more assets under management which added $0.2 million and a full year of fees earned from the assumption of the accounts of another bank during 2017 which added $0.1 million. Fees from financial services increased $0.2 million. Gains on the sale of securities were $0.2 million higher in 2018 due a $0.1 million loss on the sale of securities in 2017 and gains recognized on the sale of equity securities in 2018. Losses on the write-down, sale or disposal of premises and equipment were $0.1 million lower due to a $0.2 million loss on the abandonment of leasehold improvements in 2017. Partially offsetting these items was $0.2 million fewer gains on the sale of loans and $0.1 million less service charges on loans.
Other operating expenses
For the year ended December 31, 2018, total other operating expenses totaled $25.0 million, an increase of $0.2 million, or 1%, compared to $24.8 million for the year ended December 31, 2017. Salary and employee benefits contributed the most to the increase rising $0.6 million, or 5%, in 2018 compared to 2017. The basis of the increase includes $0.6 million increased salaries with six more full-time equivalent employees, $0.2 million in stock-based compensation and $0.1 million in expenses from the post-retirement benefit plan implemented in 2017. These increases in salaries and employee benefits were partially offset by $0.2 million less in employee bonuses from a one-time bonus paid in 2017 and $0.1 million lower group insurance costs. Data processing and communications expense increased $0.2 million during 2018 compared to 2017 because of additional costs for data center services. Partially offsetting these increases in expenses was a decrease in professional services of $0.3 million primarily from a NASDAQ entry fee and stock split expenses paid in 2017. Advertising and marketing also decreased $0.2 million resulting from a $0.5 million one-time donation to a charitable foundation in 2017 that was partially offset by $0.2 million higher advertising costs and $0.1 million more in tax credit donations. Loan collection expenses also declined $0.1 million. During the fourth quarter of 2017, the Company utilized tax strategies in response to the passage of the Tax Act that led to a $0.5 million donation, $0.2 million in certain employee bonuses and $0.1 million of early lease termination expenses.
42
The ratios of non-interest expense less non-interest income to average assets, known as the expense ratio, at December 31, 2018 and 2017 were 1.73% and 1.95%, respectively. The expense ratio decreased because of one-time expenses recorded during the year ended December 31, 2017 as part of tax strategies. The efficiency ratio also decreased from 66.25% at December 31, 2017 to 62.10% at December 31, 2018 due to these expenses in 2017.
Provision for income taxes
The Company’s effective income tax rate approximated 16.2% in 2018 and 12.2% in 2017. The difference between the effective rate and the enacted statutory corporate rate of 21% is due mostly to the effect of tax-exempt income in relation to the level of pre-tax income. On December 22, 2017, the Tax Act was signed into law and as a result the Company’s federal corporate tax rate was reduced from 34% to 21% effective January 1, 2018. The Company was required to re-measure its deferred tax assets and liabilities for the change in tax rate and recorded a $1.1 million adjustment that reduced the provision for income taxes at the end of 2017. The provision for income taxes increased $0.9 million, or 77%, from $1.2 million at December 31, 2017 to $2.1 million at December 31, 2018. If not for the tax rate change adjustment in 2017, the provision would have decreased because the higher income before taxes in 2018 was taxed at a lower tax rate.
Off-Balance Sheet Arrangements and Contractual Obligations
The Company is a party to financial instruments with off-balance sheet risk in the normal course of business in order to meet the financing needs of its customers and in connection with the overall interest rate management strategy. These instruments involve, to a varying degree, elements of credit, interest rate and liquidity risk. In accordance with GAAP, these instruments are either not recorded in the consolidated financial statements or are recorded in amounts that differ from the notional amounts. Such instruments primarily include lending commitments and lease obligations.
Lending commitments include commitments to originate loans and commitments to fund unused lines of credit. Commitments to extend credit are agreements to lend to a customer as long as there is no violation of any condition established in the contract. Commitments generally have fixed expiration dates or other termination clauses and may require payment of a fee. Since some of the commitments are expected to expire without being drawn upon, the total commitment amounts do not necessarily represent future cash requirements.
In addition to lending commitments, the Company has contractual obligations related to operating lease and capital lease commitments. Operating lease commitments are obligations under various non-cancelable operating leases on buildings and land used for office space and banking purposes. Capital lease commitments are obligations on equipment.
The following table presents, as of December 31, 2019, the Company’s significant determinable contractual obligations and significant commitments by payment date. The payment amounts represent those amounts contractually due to the recipient, excluding interest:
|
|
||||||||||||||
|
|
Over one |
Over three |
||||||||||||
|
|
One year |
year through |
years through |
Over |
||||||||||
|
(dollars in thousands) |
or less |
three years |
five years |
five years |
Total |
|||||||||
|
Contractual obligations: |
||||||||||||||
|
Certificates of deposit |
$ |
86,159 |
$ |
25,394 |
$ |
3,546 |
$ |
1,112 |
$ |
116,211 | ||||
|
FHLB advances |
- |
10,000 | 5,000 |
- |
15,000 | |||||||||
|
Short-term borrowings |
37,839 |
- |
- |
- |
37,839 | |||||||||
|
Operating leases |
397 | 810 | 824 | 8,069 | 10,100 | |||||||||
|
Capital leases |
82 | 164 | 56 |
- |
302 | |||||||||
|
Commitments: |
||||||||||||||
|
Letters of credit |
5,917 | 3 | 360 | 1,007 | 7,287 | |||||||||
|
Loan commitments (1) |
20,391 |
- |
- |
- |
20,391 | |||||||||
|
Total |
$ |
150,785 |
$ |
36,371 |
$ |
9,786 |
$ |
10,188 |
$ |
207,130 | ||||
|
(1) |
Available credit to borrowers in the amount of $123.2 million is excluded from the above table since, by its nature, the borrowers may not have the need for additional funding, and, therefore, the credit may or may not be disbursed by the Company. |
Related Party Transactions
Information with respect to related parties is contained in Note 16, “Related Party Transactions”, within the notes to the consolidated financial statements, and incorporated by reference in Part II, Item 8.
Impact of Accounting Standards and Interpretations
Information with respect to the impact of accounting standards is contained in Note 19, “Recent Accounting Pronouncements”, within the notes to the consolidated financial statements, and incorporated by reference in Part II, Item 8.
43
Impact of Inflation and Changing Prices
The consolidated financial statements and notes thereto presented herein have been prepared in accordance with U.S. GAAP, which requires the measurement of the Company’s financial condition and results of operations in terms of historical dollars without considering the changes in the relative purchasing power of money over time due to inflation. The impact of inflation is reflected in the increased cost of our operations. Unlike industrial businesses, most all of the Company’s assets and liabilities are monetary in nature. As a result, interest rates have a greater impact on our performance than do the effects of general levels of inflation as interest rates do not necessarily move in the same direction or, to the same extent, as the price of goods and services.
Capital Resources
The Company (on a consolidated basis) and the Bank are subject to various regulatory capital requirements administered by the federal banking agencies. Failure to meet minimum capital requirements can initiate certain mandatory and possible additional discretionary actions by regulators that, if undertaken, could have a direct material effect on the Company’s and the Bank’s financial statements. Under capital adequacy guidelines and the regulatory framework for prompt corrective action, the Company and the Bank must meet specific capital guidelines that involve quantitative measures of their assets, liabilities and certain off-balance-sheet items as calculated under regulatory accounting practices. The capital amounts and classification are also subject to qualitative judgments by the regulators about components, risk-weightings and other factors. Prompt corrective action provisions are not applicable to bank holding companies.
Under these guidelines, assets and certain off-balance sheet items are assigned to broad risk categories, each with appropriate weights. The resulting ratios represent capital as a percentage of total risk-weighted assets and certain off-balance sheet items. The guidelines require all banks and bank holding companies to maintain minimum ratios for capital adequacy purposes. Refer to the information with respect to capital requirements contained in Note 15, “Regulatory Matters”, within the notes to the consolidated financial statements, and incorporated by reference in Part II, Item 8.
During the year ended December 31, 2019, total shareholders' equity increased $13.3 million, or 14%, due principally from the $11.6 million in net income added into retained earnings. Capital was further enhanced by $0.2 million from investments in the Company’s common stock via the Employee Stock Purchase (ESPP), $1.0 million from stock-based compensation expense from the ESPP and restricted stock and SSARs and $4.7 million after tax improvement in the net unrealized gain position in the Company’s investment portfolio. These items were partially offset by $4.0 million of cash dividends declared on the Company’s common stock. The Company’s dividend payout ratio, defined as the rate at which current earnings are paid to shareholders, was 34.9% for the year ended December 31, 2019. The balance of earnings is retained to further strengthen the Company’s capital position. The Company’s sources (uses) of capital during the previous five years are indicated below:
|
|
Cash |
Other retained |
DRP |
Changes in |
||||||||||||||||
|
|
Net |
dividends |
earnings |
Earnings |
and ESPP |
AOCI and |
Capital |
|||||||||||||
|
(dollars in thousands) |
income |
declared |
adjustments |
retained |
infusion |
other changes |
retained |
|||||||||||||
|
2019 |
$ |
11,576 |
$ |
(4,037) |
$ |
(91) |
$ |
7,448 |
$ |
175 |
$ |
5,655 |
$ |
13,278 | ||||||
|
2018 |
11,006 | (3,708) | 421 | 7,719 | 460 | (2,005) | 6,174 | |||||||||||||
|
2017 |
8,716 | (3,285) | (308) | 5,123 | 457 | 1,172 | 6,752 | |||||||||||||
|
2016 |
7,693 | (3,061) |
- |
4,632 | 111 | (463) | 4,280 | |||||||||||||
|
2015 |
7,103 | (2,844) |
- |
4,259 | 102 | (229) | 4,132 | |||||||||||||
As of December 31, 2019, the Company reported a net unrealized gain position of $3.6 million, net of tax, from the securities AFS portfolio compared to a net unrealized loss of $1.1 million as of December 31, 2018. The improvement during 2019 was from $4.7 million in net unrealized gains on AFS securities, net of tax. Higher net unrealized gains on all types of securities contributed to the net unrealized gains in investment portfolio. Management believes that changes in fair value of the Company’s securities are due to changes in interest rates and not in the creditworthiness of the issuers. Generally, when U.S. Treasury rates rise, investment securities’ pricing declines and fair values of investment securities also decline. While volatility has existed in the yield curve within the past twelve months, a declining rate environment is expected and during the period of declining rates, the Company expects pricing in the bond portfolio to improve. There is no assurance that future realized and unrealized losses will not be recognized from the Company’s portfolio of investment securities. To help maintain a healthy capital position, the Company can issue stock to participants in the DRP and ESPP plans. The DRP affords the Company the option to acquire shares in open market purchases and/or issue shares directly from the Company to plan participants. During 2019, the Company acquired shares in the open market to fulfill the needs of the DRP. Both the DRP and the ESPP plans have been a consistent source of capital from the Company’s loyal employees and shareholders and their participation in these plans will continue to help strengthen the Company’s balance sheet.
See the section entitled “Supervision and Regulation”, below for a discussion on regulatory capital changes and other recent enactments, including a summary of the federal banking agencies final rules to implement the Basel III regulatory capital reforms and changes required by the Dodd-Frank Act.
44
Liquidity
Liquidity management ensures that adequate funds will be available to meet customers’ needs for borrowings, deposit withdrawals and maturities, facility expansion and normal operating expenses. Sources of liquidity are cash and cash equivalents, asset maturities and pay-downs within one year, loans HFS, investments AFS, growth of core deposits, utilization of borrowing capacities from the FHLB, correspondent banks, ICS and CDARs, the Discount Window of the Federal Reserve Bank of Philadelphia (FRB) and proceeds from the issuance of capital stock. Though regularly scheduled investment and loan payments are dependable sources of daily liquidity, sales of both loans HFS and investments AFS, deposit activity and investment and loan prepayments are significantly influenced by general economic conditions including the interest rate environment. During low and declining interest rate environments, prepayments from interest-sensitive assets tend to accelerate and provide significant liquidity that can be used to invest in other interest-earning assets but at lower market rates. Conversely, in periods of high or rising interest rates, prepayments from interest-sensitive assets tend to decelerate causing prepayment cash flows from mortgage loans and mortgage-backed securities to decrease. Rising interest rates may also cause deposit inflow but priced at higher market interest rates or could also cause deposit outflow due to higher rates offered by the Company’s competition for similar products. The Company closely monitors activity in the capital markets and takes appropriate action to ensure that the liquidity levels are adequate for funding, investing and operating activities.
The Company’s contingency funding plan (CFP) sets a framework for handling liquidity issues in the event circumstances arise which the Company deems to be less than normal. The Company established guidelines for identifying, measuring, monitoring and managing the resolution of potentially serious liquidity crises. The CFP outlines required monitoring tools, acceptable alternative funding sources and required actions during various liquidity scenarios. Thus, the Company has implemented a proactive means for the measurement and resolution for handling potentially significant adverse liquidity conditions. At least quarterly, the CFP monitoring tools, current liquidity position and monthly projected liquidity sources and uses are presented and reviewed by the Company’s Asset/Liability Committee. As of December 31, 2019, the Company had not experienced any adverse issues that would give rise to its inability to raise liquidity in an emergency situation.
During the year ended December 31, 2019, the Company utilized $1.8 million of cash. During the period, the Company’s operations provided approximately $25.8 million mostly from $32.9 million of net cash inflow from the components of net interest income and $10.4 million in proceeds of loans HFS over originations; partially offset by net non-interest expense/income related payments of $15.5 million and $2.0 million in estimated tax payments. Cash inflow from interest-earning assets, deposits, loan payments and the sale of securities were used to purchase investment securities and replace maturing and cash runoff of securities, fund the loan portfolio, pay down FHLB advances and overnight borrowings, purchase bank-owned life insurance, invest in bank premises and equipment and make net dividend payments. The Company received a large amount of public deposits over the past three years. The seasonal nature of deposits from municipalities and other public funding sources requires the Company to be prepared for the inherent volatility and the unpredictable timing of cash outflow from this customer base, including maintaining the requirements to pledge investment securities. During 2019, the Company made an effort to open new public accounts as ICS accounts and transfer some existing public accounts to ICS accounts in order to provide the customer with FDIC insurance and to free up the Company’s unencumbered securities to improve liquidity. Accordingly, the use of short-term overnight borrowings could be used to fulfill funding gap needs. The CFP is a tool to help the Company ensure that alternative funding sources are available to meet its liquidity needs.
As of December 31, 2019, the Company maintained $15.7 million in cash and cash equivalents and $186.8 million of investments AFS and loans HFS. Also as of December 31, 2019, the Company had approximately $202.8 million available to borrow from the FHLB, $21.0 million from correspondent banks, $94.3 million from the FRB and $152.2 million from the Promontory One-Way Buy program. The combined total of $672.8 million represented 67% of total assets at December 31, 2019. Management believes this level of liquidity to be strong and adequate to support current operations.
For a discussion on the Company’s significant determinable contractual obligations and significant commitments, see “Off-Balance Sheet Arrangements and Contractual Obligations,” above.
Management of interest rate risk and market risk analysis
The adequacy and effectiveness of an institution’s interest rate risk management process and the level of its exposures are critical factors in the regulatory evaluation of an institution’s sensitivity to changes in interest rates and capital adequacy. Management believes the Company’s interest rate risk measurement framework is sound and provides an effective means to measure, monitor, analyze, identify and control interest rate risk in the balance sheet.
The Company is subject to the interest rate risks inherent in its lending, investing and financing activities. Fluctuations of interest rates will impact interest income and interest expense along with affecting market values of all interest-earning assets and interest-bearing liabilities, except for those assets or liabilities with a short term remaining to maturity. Interest rate risk management is an integral part of the asset/liability management process. The Company has instituted certain procedures and policy guidelines to manage the interest rate risk position. Those internal policies enable the Company to react to changes in market rates to protect net interest income from significant fluctuations. The primary objective in managing interest rate risk is to minimize the adverse impact of changes in interest rates on net interest income along with creating an asset/liability structure that maximizes earnings.
45
Asset/Liability Management. One major objective of the Company when managing the rate sensitivity of its assets and liabilities is to stabilize net interest income. The management of and authority to assume interest rate risk is the responsibility of the Company’s Asset/Liability Committee (ALCO), which is comprised of senior management and members of the board of directors. ALCO meets quarterly to monitor the relationship of interest sensitive assets to interest sensitive liabilities. The process to review interest rate risk is a regular part of managing the Company. Consistent policies and practices of measuring and reporting interest rate risk exposure, particularly regarding the treatment of non-contractual assets and liabilities, are in effect. In addition, there is an annual process to review the interest rate risk policy with the board of directors which includes limits on the impact to earnings from shifts in interest rates.
Interest Rate Risk Measurement. Interest rate risk is monitored through the use of three complementary measures: static gap analysis, earnings at risk simulation and economic value at risk simulation. While each of the interest rate risk measurements has limitations, collectively, they represent a reasonably comprehensive view of the magnitude of interest rate risk in the Company and the distribution of risk along the yield curve, the level of risk through time and the amount of exposure to changes in certain interest rate relationships.
Static Gap. The ratio between assets and liabilities re-pricing in specific time intervals is referred to as an interest rate sensitivity gap. Interest rate sensitivity gaps can be managed to take advantage of the slope of the yield curve as well as forecasted changes in the level of interest rate changes.
To manage this interest rate sensitivity gap position, an asset/liability model commonly known as cumulative gap analysis is used to monitor the difference in the volume of the Company’s interest sensitive assets and liabilities that mature or re-price within given time intervals. A positive gap (asset sensitive) indicates that more assets will re-price during a given period compared to liabilities, while a negative gap (liability sensitive) indicates the opposite effect. The Company employs computerized net interest income simulation modeling to assist in quantifying interest rate risk exposure. This process measures and quantifies the impact on net interest income through varying interest rate changes and balance sheet compositions. The use of this model assists the ALCO to gauge the effects of the interest rate changes on interest-sensitive assets and liabilities in order to determine what impact these rate changes will have upon the net interest spread. At December 31, 2019, the Company maintained a one-year cumulative gap of positive (asset sensitive) $31.2 million, or 3%, of total assets. The effect of this positive gap position provided a mismatch of assets and liabilities which may expose the Company to interest rate risk during periods of falling interest rates. Conversely, in an increasing interest rate environment, net interest income could be positively impacted because more assets than liabilities will re-price upward during the one-year period.
Certain shortcomings are inherent in the method of analysis discussed above and presented in the next table. Although certain assets and liabilities may have similar maturities or periods of re-pricing, they may react in different degrees to changes in market interest rates. The interest rates on certain types of assets and liabilities may fluctuate in advance of changes in market interest rates, while interest rates on other types of assets and liabilities may lag behind changes in market interest rates. Certain assets, such as adjustable-rate mortgages, have features which restrict changes in interest rates on a short-term basis and over the life of the asset. In the event of a change in interest rates, prepayment and early withdrawal levels may deviate significantly from those assumed in calculating the table amounts. The ability of many borrowers to service their adjustable-rate debt may decrease in the event of an interest rate increase.
46
The following table reflects the re-pricing of the balance sheet or “gap” position at December 31, 2019:
|
|
||||||||||||||
|
|
More than three |
More than |
||||||||||||
|
|
Three months |
months to |
one year |
More than |
||||||||||
|
(dollars in thousands) |
or less |
twelve months |
to three years |
three years |
Total |
|||||||||
|
|
||||||||||||||
|
Cash and cash equivalents |
$ |
1,080 |
$ |
- |
$ |
- |
$ |
14,583 |
$ |
15,663 | ||||
|
Investment securities (1)(2) |
8,872 | 22,443 | 38,957 | 119,228 | 189,500 | |||||||||
|
Loans and leases(2) |
183,835 | 147,018 | 233,318 | 181,135 | 745,306 | |||||||||
|
Fixed and other assets |
- |
23,261 |
- |
36,197 | 59,458 | |||||||||
|
Total assets |
$ |
193,787 |
$ |
192,722 |
$ |
272,275 |
$ |
351,143 |
$ |
1,009,927 | ||||
|
Total cumulative assets |
$ |
193,787 |
$ |
386,509 |
$ |
658,784 |
$ |
1,009,927 | ||||||
|
|
||||||||||||||
|
Non-interest-bearing transaction deposits (3) |
$ |
- |
$ |
19,221 |
$ |
52,767 |
$ |
120,035 |
$ |
192,023 | ||||
|
Interest-bearing transaction deposits (3) |
212,079 |
- |
157,712 | 157,712 | 527,503 | |||||||||
|
Certificates of deposit |
25,138 | 61,021 | 25,394 | 4,658 | 116,211 | |||||||||
|
Short-term borrowings |
37,839 |
- |
- |
- |
37,839 | |||||||||
|
FHLB advances |
- |
- |
10,000 | 5,000 | 15,000 | |||||||||
|
Other liabilities |
- |
- |
- |
14,516 | 14,516 | |||||||||
|
Total liabilities |
$ |
275,056 |
$ |
80,242 |
$ |
245,873 |
$ |
301,921 |
$ |
903,092 | ||||
|
Total cumulative liabilities |
$ |
275,056 |
$ |
355,298 |
$ |
601,171 |
$ |
903,092 | ||||||
|
|
||||||||||||||
|
Interest sensitivity gap |
$ |
(81,269) |
$ |
112,480 |
$ |
26,402 |
$ |
49,222 | ||||||
|
Cumulative gap |
$ |
(81,269) |
$ |
31,211 |
$ |
57,613 |
$ |
106,835 | ||||||
|
|
||||||||||||||
|
Cumulative gap to total assets |
-8.0% |
3.1% | 5.7% | 10.6% | ||||||||||
|
(1) |
Includes FHLB stock and the net unrealized gains/losses on available-for-sale securities. |
|
(2) |
Investments and loans are included in the earlier of the period in which interest rates were next scheduled to adjust or the period in which they are due. In addition, loans were included in the periods in which they are scheduled to be repaid based on scheduled amortization. For amortizing loans and MBS – GSE residential, annual prepayment rates are assumed reflecting historical experience as well as management’s knowledge and experience of its loan products. |
|
(3) |
The Company’s demand and savings accounts were generally subject to immediate withdrawal. However, management considers a certain amount of such accounts to be core accounts having significantly longer effective maturities based on the retention experiences of such deposits in changing interest rate environments. The effective maturities presented are the recommended maturity distribution limits for non-maturing deposits based on historical deposit studies. |
Earnings at Risk and Economic Value at Risk Simulations. The Company recognizes that more sophisticated tools exist for measuring the interest rate risk in the balance sheet that extend beyond static re-pricing gap analysis. Although it will continue to measure its re-pricing gap position, the Company utilizes additional modeling for identifying and measuring the interest rate risk in the overall balance sheet. The ALCO is responsible for focusing on “earnings at risk” and “economic value at risk”, and how both relate to the risk-based capital position when analyzing the interest rate risk.
Earnings at Risk. An earnings at risk simulation measures the change in net interest income and net income should interest rates rise and fall. The simulation recognizes that not all assets and liabilities re-price one-for-one with market rates (e.g., savings rate). The ALCO looks at “earnings at risk” to determine income changes from a base case scenario under an increase and decrease of 200 basis points in interest rate simulation models.
Economic Value at Risk. An earnings at risk simulation measures the short-term risk in the balance sheet. Economic value (or portfolio equity) at risk measures the long-term risk by finding the net present value of the future cash flows from the Company’s existing assets and liabilities. The ALCO examines this ratio quarterly utilizing an increase and decrease of 200 basis points in interest rate simulation models. The ALCO recognizes that, in some instances, this ratio may contradict the “earnings at risk” ratio.
47
The following table illustrates the simulated impact of an immediate 200 basis points upward or downward movement in interest rates on net interest income, net income and the change in the economic value (portfolio equity). This analysis assumed that the adjusted interest-earning asset and interest-bearing liability levels at December 31, 2019 remained constant. The impact of the rate movements was developed by simulating the effect of the rate change over a twelve-month period from the December 31, 2019 levels:
|
|
||||
|
|
% change |
|||
|
|
Rates +200 |
Rates -200 |
||
|
Earnings at risk: |
||||
|
Net interest income |
2.3 |
% |
(2.0) |
% |
|
Net income |
5.8 | (4.8) | ||
|
Economic value at risk: |
||||
|
Economic value of equity |
5.4 | (36.8) | ||
|
Economic value of equity as a percent of total assets |
0.8 | (5.4) | ||
Economic value has the most meaning when viewed within the context of risk-based capital. Therefore, the economic value may normally change beyond the Company’s policy guideline for a short period of time as long as the risk-based capital ratio (after adjusting for the excess equity exposure) is greater than 10%. At December 31, 2019, the Company’s risk-based capital ratio was 15.76%.
The table below summarizes estimated changes in net interest income over a twelve-month period beginning January 1, 2020, under alternate interest rate scenarios using the income simulation model described above:
|
|
||||||||
|
|
Net interest |
$ |
% |
|||||
|
(dollars in thousands) |
income |
variance |
variance |
|||||
|
Simulated change in interest rates |
||||||||
|
+200 basis points |
$ |
33,798 |
$ |
759 | 2.3 |
% |
||
|
+100 basis points |
33,480 | 441 | 1.3 | |||||
|
Flat rate |
33,039 |
- |
- |
|||||
|
-100 basis points |
32,434 | (605) | (1.8) | |||||
|
-200 basis points |
32,374 | (665) | (2.0) | |||||
Simulation models require assumptions about certain categories of assets and liabilities. The models schedule existing assets and liabilities by their contractual maturity, estimated likely call date or earliest re-pricing opportunity. MBS – GSE residential securities and amortizing loans are scheduled based on their anticipated cash flow including estimated prepayments. For investment securities, the Company uses a third-party service to provide cash flow estimates in the various rate environments. Savings, money market and interest-bearing checking accounts do not have stated maturities or re-pricing terms and can be withdrawn or re-price at any time. This may impact the margin if more expensive alternative sources of deposits are required to fund loans or deposit runoff. Management projects the re-pricing characteristics of these accounts based on historical performance and assumptions that it believes reflect their rate sensitivity. The model reinvests all maturities, repayments and prepayments for each type of asset or liability into the same product for a new like term at current product interest rates. As a result, the mix of interest-earning assets and interest bearing-liabilities is held constant.
Supervision and Regulation
The following is a brief summary of the regulatory environment in which the Company and the Bank operate and is not designed to be a complete discussion of all statutes and regulations affecting such operations, including those statutes and regulations specifically mentioned herein. Changes in the laws and regulations applicable to the Company and the Bank can affect the operating environment in substantial and unpredictable ways. We cannot accurately predict whether legislation will ultimately be enacted, and if enacted, the ultimate effect that legislation or implementing regulations would have on our financial condition or results of operations. While banking regulations are material to the operations of the Company and the Bank, it should be noted that supervision, regulation and examination of the Company and the Bank are intended primarily for the protection of depositors, not shareholders.
Tax Cuts and Jobs Act of 2017
On December 22, 2017, the Tax Cuts and Jobs Act (the “Tax Act”) was signed into law. Among other changes, the Tax Act reduces the Company’s federal corporate income tax rate from 34% to 21% effective January 1, 2018. The Company anticipates that this tax rate change should reduce its federal income tax liability in future years beginning with 2018. However, the Company did recognize certain effects of the tax law changes in 2017. U.S. generally accepted accounting principles require companies to re-value their deferred tax assets and liabilities as of the date of enactment, with resulting tax
48
effects accounted for in the reporting period of enactment. Since the enactment took place in December 2017, the Company revalued its net deferred tax liabilities in the fourth quarter of 2017 resulting in a $1.1 million addition to earnings in 2017.
Sarbanes-Oxley Act of 2002
The Sarbanes-Oxley Act (SOX), also known as the “Public Company Accounting Reform and Investor Protection Act,” was established in 2002 and introduced major changes to the regulation of financial practice. SOX represents a comprehensive revision of laws affecting corporate governance, accounting obligations, and corporate reporting. SOX is applicable to all companies with equity or debt securities that are either registered, or file reports under the Securities Exchange Act of 1934. In particular, SOX establishes: (i) requirements for audit committees, including independence, expertise, and responsibilities; (ii) additional responsibilities regarding financial statements for the Principal Executive Officer and Principal Financial Officer of the reporting company; (iii) standards for auditors and regulation of audits; (iv) increased disclosure and reporting obligations for the reporting company and its directors and executive officers; and (v) increased civil and criminal penalties for violations of the securities laws.
Federal Deposit Insurance Corporation Improvement Act of 1991 (FDICIA)
The FDICIA established five different levels of capitalization of financial institutions, with “prompt corrective actions” and significant operational restrictions imposed on institutions that are capital deficient under the categories. The five categories are:
|
· |
well capitalized; |
|
· |
adequately capitalized; |
|
· |
undercapitalized; |
|
· |
significantly undercapitalized, and |
|
· |
critically undercapitalized. |
To be considered well capitalized, an institution must have a total risk-based capital ratio of at least 10%, a Tier 1 risk-based capital ratio of at least 8%, a leverage capital ratio of at least 5%, and must not be subject to any order or directive requiring the institution to improve its capital level. An institution falls within the adequately capitalized category if it has a total risk-based capital ratio of at least 8%, a Tier 1 risk-based capital ratio of at least 6%, and a leverage capital ratio of at least 4%. Institutions with lower capital levels are deemed to be undercapitalized, significantly undercapitalized or critically undercapitalized, depending on their actual capital levels. In addition, the appropriate federal regulatory agency may downgrade an institution to the next lower capital category upon a determination that the institution is in an unsafe or unsound condition, or is engaged in an unsafe or unsound practice. Institutions are required under the FDICIA to closely monitor their capital levels and to notify their appropriate regulatory agency of any basis for a change in capital category.
Regulatory oversight of an institution becomes more stringent with each lower capital category, with certain “prompt corrective actions” imposed depending on the level of capital deficiency.
Recent Legislation and Rulemaking
Regulatory Capital Changes
In July 2013, the federal banking agencies issued final rules to implement the Basel III regulatory capital reforms and changes required by the Dodd-Frank Act. The phase-in period for community banking organizations began on January 1, 2015, while larger institutions (generally those with assets of $250 billion or more) began compliance on January 1, 2014. The final rules call for the following capital requirements:
|
· |
A minimum ratio of common tier 1 capital to risk-weighted assets of 4.5%. |
|
· |
A minimum ratio of tier 1 capital to risk-weighted assets of 6%. |
|
· |
A minimum ratio of total capital to risk-weighted assets of 8% (no change from current rule). |
|
· |
A minimum leverage ratio of 4%. |
In addition, the final rules established a common equity tier 1 capital conservation buffer of 2.5% of risk-weighted assets applicable to all banking organizations. If a banking organization fails to hold capital above the minimum capital ratios and the capital conservation buffer, it will be subject to certain restrictions on capital distributions and discretionary bonus payments. The phase-in period for the capital conservation and countercyclical capital buffers for all banking organizations began on January 1, 2016.
Under the proposed rules, accumulated other comprehensive income (AOCI) would have been included in a banking organization’s common equity tier 1 capital. The final rules allow community banks to make a one-time election not to include these additional components of AOCI in regulatory capital and instead use the existing treatment under the general risk-based capital rules that excludes most AOCI components from regulatory capital. The Company made the opt-out election in the first call report or FR Y-9 series report that was filed after the financial institution became subject to the final rule.
The final rules permanently grandfather non-qualifying capital instruments (such as trust preferred securities and cumulative perpetual preferred stock) issued before May 19, 2010 for inclusion in the tier 1 capital of banking organizations with total
49
consolidated assets less than $15 billion as of December 31, 2009 and banking organizations that were mutual holding companies as of May 19, 2010.
The proposed rules would have modified the risk-weight framework applicable to residential mortgage exposures to require banking organizations to divide residential mortgage exposures into two categories in order to determine the applicable risk weight. In response to commenter concerns about the burden of calculating the risk weights and the potential negative effect on credit availability, the final rules do not adopt the proposed risk weights but retain the current risk weights for mortgage exposures under the general risk-based capital rules.
Consistent with the Dodd-Frank Act, the new rules replace the ratings-based approach to securitization exposures, which is based on external credit ratings, with the simplified supervisory formula approach in order to determine the appropriate risk weights for these exposures. Alternatively, banking organizations may use the existing gross-up approach to assign securitization exposures to a risk weight category or choose to assign such exposures a 1,250 percent risk weight.
Under the new rules, mortgage servicing assets (MSAs) and certain deferred tax assets (DTAs) are subject to stricter limitations than those applicable under the current general risk-based capital rule. The new rules also increase the risk weights for past-due loans, certain commercial real estate loans, and some equity exposures, and makes selected other changes in risk weights and credit conversion factors.
As noted above the phase-in period for the Company began on January 1, 2015. The new rules will not have a material impact on the Company’s capital, operations, liquidity and earnings.
JOBS Act
In 2012, the Jumpstart Our Business Startups Act (the “JOBS Act”) became law. The JOBS Act is aimed at facilitating capital raising by smaller companies and banks and bank holding companies by implementing the following changes:
|
· |
raising the threshold requiring registration under the Securities Exchange Act of 1934 (the "Exchange Act") for banks and bank holdings companies from 500 to 2,000 holders of record; |
|
· |
raising the threshold for triggering deregistration under the Exchange Act for banks and bank holding companies from 300 to 1,200 holders of record; |
|
· |
raising the limit for Regulation A offerings from $5 million to $50 million per year and exempting some Regulation A offerings from state blue sky laws; |
|
· |
permitting advertising and general solicitation in Rule 506 and Rule 144A offerings; |
|
· |
allowing private companies to use "crowdfunding" to raise up to $1 million in any 12-month period, subject to certain conditions; and |
|
· |
creating a new category of issuer, called an "Emerging Growth Company," for companies with less than $1 billion in annual gross revenue, which will benefit from certain changes that reduce the cost and burden of carrying out an equity IPO and complying with public company reporting obligations for up to five years. |
While the JOBS Act is not expected to have any immediate application to the Company, management will continue to monitor the implementation rules for potential effects which might benefit the Company.
Dodd-Frank Wall Street Reform and Consumer Protection Act.
In 2010, the Dodd-Frank Wall Street Reform and Consumer Protection Act (Dodd-Frank) became law. Dodd-Frank is intended to effect a fundamental restructuring of federal banking regulation. Among other things, Dodd-Frank creates a new Financial Stability Oversight Council to identify systemic risks in the financial system and gives federal regulators new authority to take control of and liquidate financial firms. Dodd-Frank additionally creates a new independent federal regulator to administer federal consumer protection laws. Dodd-Frank is expected to have a significant impact on our business operations as its provisions take effect. Overtime, it is expected that at a minimum they will increase our operating and compliance costs and could increase our interest expense. Among the provisions that are likely to affect us and the community banking industry are the following:
Holding Company Capital Requirements. Dodd-Frank requires the Federal Reserve to apply consolidated capital requirements to bank holding companies that are no less stringent than those currently applied to depository institutions. Under these standards, pooled trust preferred securities will be excluded from Tier 1 capital unless such securities were issued prior to May 19, 2010 by a bank holding company with less than $15 billion in assets. Dodd-Frank additionally requires that bank regulators issue countercyclical capital requirements so that the required amount of capital increases in times of economic expansion and decreases in times of economic contraction, consistent with safety and soundness.
Deposit Insurance. Dodd-Frank permanently increases the maximum deposit insurance amount for banks, savings institutions and credit unions to $250,000 per depositor, and extended unlimited deposit insurance to non-interest bearing transaction accounts through December 31, 2012. Dodd-Frank also broadens the base for FDIC insurance assessments. Assessments will now be based on the average consolidated total assets less tangible equity capital of a financial institution. Dodd-Frank requires the FDIC to increase the reserve ratio of the Deposit Insurance Fund from 1.15% to 1.35% of insured deposits by 2020 and eliminates the requirement that the FDIC pay dividends to insured depository institutions when the
50
reserve ratio exceeds certain thresholds. Dodd-Frank also eliminated the federal statutory prohibition against the payment of interest on business checking accounts.
Corporate Governance. Dodd-Frank requires publicly traded companies to give shareholders a non-binding vote on executive compensation at least every three years, a non-binding vote regarding the frequency of the vote on executive compensation at least every six years, and a non-binding vote on “golden parachute” payments in connection with approvals of mergers and acquisitions unless previously voted on by shareholders. The SEC has finalized the rules implementing these requirements. Additionally, Dodd-Frank directs the federal banking regulators to promulgate rules prohibiting excessive compensation paid to executives of depository institutions and their holding companies with assets in excess of $1.0 billion, regardless of whether the company is publicly traded. Dodd-Frank also gives the SEC authority to prohibit broker discretionary voting on elections of directors and executive compensation matters.
Prohibition Against Charter Conversions of Troubled Institutions. Dodd-Frank prohibits a depository institution from converting from a state to federal charter or vice versa while it is the subject of a cease and desist order or other formal enforcement action or a memorandum of understanding with respect to a significant supervisory matter unless the appropriate federal banking agency gives notice of the conversion to the federal or state authority that issued the enforcement action and that agency does not object within 30 days. The notice must include a plan to address the significant supervisory matter. The converting institution must also file a copy of the conversion application with its current federal regulator which must notify the resulting federal regulator of any ongoing supervisory or investigative proceedings that are likely to result in an enforcement action and provide access to all supervisory and investigative information relating thereto.
Interstate Branching. Dodd-Frank authorizes national and state banks to establish branches in other states to the same extent as a bank chartered by that state would be permitted. Previously, banks could only establish branches in other states if the host state expressly permitted out-of-state banks to establish branches in that state. Accordingly, banks will be able to enter new markets more freely.
Limits on Interstate Acquisitions and Mergers. Dodd-Frank precludes a bank holding company from engaging in an interstate acquisition – the acquisition of a bank outside its home state – unless the bank holding company is both well capitalized and well managed. Furthermore, a bank may not engage in an interstate merger with another bank headquartered in another state unless the surviving institution will be well capitalized and well managed. The previous standard in both cases was adequately capitalized and adequately managed.
Limits on Interchange Fees. Dodd-Frank amends the Electronic Fund Transfer Act to, among other things, give the Federal Reserve the authority to establish rules regarding interchange fees charged for electronic debit transactions by payment card issuers having assets over $10 billion and to enforce a new statutory requirement that such fees be reasonable and proportional to the actual cost of a transaction to the issuer. The interchange rules became effective on October 1, 2011.
Consumer Financial Protection Bureau. Dodd-Frank creates a new, independent federal agency called the Consumer Financial Protection Bureau (CFPB), which is granted broad rulemaking, supervisory and enforcement powers under various federal consumer financial protection laws, including the Equal Credit Opportunity Act, Truth in Lending Act, Real Estate Settlement Procedures Act, Fair Credit Reporting Act, Fair Debt Collection Act, the Consumer Financial Privacy provisions of the Gramm-Leach-Bliley Act and certain other statutes. The CFPB has examination and primary enforcement authority with respect to depository institutions with $10 billion or more in assets. Smaller institutions are subject to rules promulgated by the CFPB but continue to be examined and supervised by federal banking regulators for consumer compliance purposes. The CFPB has authority to prevent unfair, deceptive or abusive practices in connection with the offering of consumer financial products. Dodd-Frank authorizes the CFPB to establish certain minimum standards for the origination of residential mortgages including a determination of the borrower’s ability to repay. In addition, Dodd-Frank will allow borrowers to raise certain defenses to foreclosure if they receive any loan other than a “qualified mortgage” as defined by the CFPB. Dodd-Frank permits states to adopt consumer protection laws and standards that are more stringent than those adopted at the federal level and, in certain circumstances, permits state attorneys general to enforce compliance with both the state and federal laws and regulations.
In summary, the Dodd-Frank Act provides for sweeping financial regulatory reform and may have the effect of increasing the cost of doing business, limiting or expanding permissible activities and affect the competitive balance between banks and other financial intermediaries. While many of the provisions of the Dodd-Frank Act do not impact the existing business of the Company, the extension of FDIC insurance to all non-interest bearing deposit accounts and the repeal of prohibitions on the payment of interest on demand deposits, thereby permitting depository institutions to pay interest on business transaction and other accounts, will likely increase deposit funding costs paid by the Company in order to retain and grow deposits. In addition, the limitations imposed on the assessment of interchange fees have reduced the Company’s ability to set revenue pricing on debit and credit card transactions. Many aspects of the Dodd-Frank Act are subject to rulemaking and will take effect over several years, making it difficult to anticipate the overall financial impact on the Company, its customers or the financial industry as a whole. The Company will continue to monitor legislative developments and assess their potential impact on our business.
Department of Defense Military Lending Rule. In 2015, the U.S. Department of Defense issued a final rule which restricts pricing and terms of certain credit extended to active duty military personnel and their families. This rule, which was
51
implemented effective October 3, 2016, caps the interest rate on certain credit extensions to an annual percentage rate of 36% and restricts other fees. The rule requires financial institutions to verify whether customers are military personnel subject to the rule. The impact of this final rule, and any subsequent amendments thereto, on the Company’s lending activities and the Company’s statements of income or condition has had little or no impact; however, management will continue to monitor the implementation of the rule for any potential side effects on the Company’s business.
Future Federal and State Legislation and Rulemaking
From time-to-time, various types of federal and state legislation have been proposed that could result in additional regulations and restrictions on the business of the Company and the Bank. We cannot predict whether legislation will be adopted, or if adopted, how the new laws would affect our business. As a consequence, we are susceptible to legislation that may increase the cost of doing business. Management believes that the effect of any current legislative proposals on the liquidity, capital resources and the results of operations of the Company and the Bank will be minimal.
It is possible that there will be regulatory proposals which, if implemented, could have a material effect upon our liquidity, capital resources and results of operations. In addition, the general cost of compliance with numerous federal and state laws does have, and in the future may have, a negative impact on our results of operations. As with other banks, the status of the financial services industry can affect the Bank. Consolidations of institutions are expected to continue as the financial services industry seeks greater efficiencies and market share. Bank management believes that such consolidations may enhance the Bank’s competitive position as a community bank.
Future Outlook
The Company is highly impacted by local economic factors that could influence the performance and strength of our loan portfolios and results of operations. Though the national economy is improving, the local operating environment continues to be challenging and is expected to be challenging for the near term time horizon and lags national economic trends. A consensus of economists predicts a slight decline in interest rates in 2020. Uncertainty surrounding deposit costs due to a competitive environment in 2020 despite lower short-term market interest rates is the Company’s greatest interest rate risk. Earning-asset yields are expected to decline throughout the year stemming from the lower rate environment, primarily effecting the commercial and residential real estate portfolios followed by mortgage-backed securities. Jobs declined in December 2019 from a year earlier in the Scranton/Wilkes-Barre metropolitan statistical area. In 2020, we will be expanding our service area with the acquisition of MNB Corporation into the Allentown/Bethlehem/Easton metropolitan statistical area which has a lower unemployment rate at 4.6% at December 31, 2019. We believe expanding our market area gives us opportunity for growth and we will continue to monitor the economic climate in our region, scrutinize growth prospects and proactively observe existing credits for early warning signs of risk deterioration.
In addition to the challenging economic environment, regulatory oversight has changed significantly in recent years. As described in more detail in the “supervision and regulation” section above, the federal banking agencies issued final rules to implement the Basel III regulatory capital reforms and changes required by the Dodd-Frank Act. The rules revise the quantity and quality of required minimum risk-based and leverage capital requirements and revise the calculation of risk-weighted assets.
Management believes the Company is prepared to face the challenges ahead. We expect that there will be further improvement in asset quality. Our conservative approach to loan underwriting will help improve and keep non-performing asset levels at bay. The Company expects to overcome the relative flattening of the positively sloped yield curve by cautiously growing the balance sheet to enhance financial performance. We intend to grow all lending portfolios in both the business and retail sectors using growth in market-place low costing deposits to stabilize net interest margin and to enhance revenue performance.
ITEM 7A: QUANTITATIVE AND QUALITATIVE DISCLOSURES ABOUT MARKET RISK
The information required by 7A is set forth at Item 7, under “Liquidity” and “Management of interest rate risk and market risk analysis,” contained within management’s discussion and analysis of financial condition and results of operations and incorporated herein by reference.
|
|
52
ITEM 8: FINANCIAL STATEMENTS AND SUPPLEMENTARY DATA
Report of Independent Registered Public Accounting Firm
To the Shareholders and the Board of Directors of Fidelity D & D Bancorp, Inc. and Subsidiary
Opinion on the Internal Control Over Financial Reporting
We have audited Fidelity D & D Bancorp, Inc. and its Subsidiary’s (the Company) internal control over financial reporting as of December 31, 2019, based on criteria established in Internal Control — Integrated Framework issued by the Committee of Sponsoring Organizations of the Treadway Commission in 2013. In our opinion, the Company maintained, in all material respects, effective internal control over financial reporting as of December 31, 2019, based on criteria established in Internal Control — Integrated Framework issued by the Committee of Sponsoring Organizations of the Treadway Commission in 2013.
We have also audited, in accordance with the standards of the Public Company Accounting Oversight Board (United States) (PCAOB), the consolidated financial statements of the Company and our report dated March 13, 2020 expressed an unqualified opinion.
Basis for Opinion
The Company’s management is responsible for maintaining effective internal control over financial reporting and for its assessment of the effectiveness of internal control over financial reporting in the accompanying Management’s Report on Internal Control Over Financial Reporting. Our responsibility is to express an opinion on the Company’s internal control over financial reporting based on our audit. We are a public accounting firm registered with the PCAOB and are required to be independent with respect to the Company in accordance with U.S. federal securities laws and the applicable rules and regulations of the Securities and Exchange Commission and the PCAOB.
We conducted our audit in accordance with the standards of the PCAOB. Those standards require that we plan and perform the audit to obtain reasonable assurance about whether effective internal control over financial reporting was maintained in all material respects. Our audit included obtaining an understanding of internal control over financial reporting, assessing the risk that a material weakness exists, and testing and evaluating the design and operating effectiveness of internal control based on the assessed risk. Our audit also included performing such other procedures as we considered necessary in the circumstances. We believe that our audit provides a reasonable basis for our opinion.
Definition and Limitations of Internal Control Over Financial Reporting
A company's internal control over financial reporting is a process designed to provide reasonable assurance regarding the reliability of financial reporting and the preparation of financial statements for external purposes in accordance with generally accepted accounting principles. A company's internal control over financial reporting includes those policies and procedures that (1) pertain to the maintenance of records that, in reasonable detail, accurately and fairly reflect the transactions and dispositions of the assets of the company; (2) provide reasonable assurance that transactions are recorded as necessary to permit preparation of financial statements in accordance with generally accepted accounting principles, and that receipts and expenditures of the company are being made only in accordance with authorizations of management and directors of the company; and (3) provide reasonable assurance regarding prevention or timely detection of unauthorized acquisition, use or disposition of the company's assets that could have a material effect on the financial statements.
Because of its inherent limitations, internal control over financial reporting may not prevent or detect misstatements. Also, projections of any evaluation of effectiveness to future periods are subject to the risk that controls may become inadequate because of changes in conditions, or that the degree of compliance with the policies or procedures may deteriorate.
/s/ RSM US LLP
Blue Bell, Pennsylvania
March 13, 2020
53
Report of Independent Registered Public Accounting Firm
To the Shareholders and the Board of Directors of Fidelity D & D Bancorp, Inc. and Subsidiary
Opinion on the Financial Statements
We have audited the accompanying consolidated balance sheets of Fidelity D & D Bancorp, Inc. and its subsidiary (the Company) as of December 31, 2019 and 2018, the related consolidated statements of income, comprehensive income, shareholders' equity and cash flows for each of the three years in the period ended December 31, 2019, and the related notes to the consolidated financial statements (collectively, the financial statements). In our opinion, the financial statements present fairly, in all material respects, the financial position of the Company as of December 31, 2019 and 2018, and the results of its operations and its cash flows for each of the three years in the period ended December 31, 2019, in conformity with accounting principles generally accepted in the United States of America.
We have also audited, in accordance with the standards of the Public Company Accounting Oversight Board (United States) (PCAOB), the Company's internal control over financial reporting as of December 31, 2019, based on criteria established in Internal Control — Integrated Framework issued by the Committee of Sponsoring Organizations of the Treadway Commission in 2013, and our report dated March 13, 2020 expressed an unqualified opinion on the effectiveness of the Company's internal control over financial reporting.
Basis for Opinion
These financial statements are the responsibility of the Company’s management. Our responsibility is to express an opinion on the Company’s financial statements based on our audits. We are a public accounting firm registered with the PCAOB and are required to be independent with respect to the Company in accordance with U.S. federal securities laws and the applicable rules and regulations of the Securities and Exchange Commission and the PCAOB.
We conducted our audits in accordance with the standards of the PCAOB. Those standards require that we plan and perform the audits to obtain reasonable assurance about whether the financial statements are free of material misstatement, whether due to error or fraud. Our audits included performing procedures to assess the risks of material misstatement of the financial statements, whether due to error or fraud, and performing procedures that respond to those risks. Such procedures included examining, on a test basis, evidence regarding the amounts and disclosures in the financial statements. Our audits also included evaluating the accounting principles used and significant estimates made by management, as well as evaluating the overall presentation of the financial statements. We believe that our audits provide a reasonable basis for our opinion.
/s/ RSM US LLP
We have served as the Company's auditor since 2015.
Blue Bell, Pennsylvania
March 13, 2020
54
|
Fidelity D & D Bancorp, Inc. and Subsidiary |
||||||
|
Consolidated Balance Sheets |
||||||
|
|
As of December 31, |
|||||
|
(dollars in thousands) |
2019 |
2018 |
||||
|
Assets: |
||||||
|
Cash and due from banks |
$ |
14,583 |
$ |
16,025 | ||
|
Interest-bearing deposits with financial institutions |
1,080 | 1,460 | ||||
|
Total cash and cash equivalents |
15,663 | 17,485 | ||||
|
Available-for-sale securities |
185,117 | 182,810 | ||||
|
Federal Home Loan Bank stock |
4,383 | 6,339 | ||||
|
Loans and leases, net (allowance for loan losses of |
||||||
|
$9,747 in 2019; $9,747 in 2018) |
743,663 | 718,317 | ||||
|
Loans held-for-sale (fair value $1,660 in 2019, $5,789 in 2018) |
1,643 | 5,707 | ||||
|
Foreclosed assets held-for-sale |
369 | 190 | ||||
|
Bank premises and equipment, net |
21,557 | 18,920 | ||||
|
Leased property under finance leases, net |
280 | 333 | ||||
|
Right-of-use assets |
6,023 |
- |
||||
|
Cash surrender value of bank owned life insurance |
23,261 | 20,615 | ||||
|
Accrued interest receivable |
3,281 | 3,271 | ||||
|
Goodwill |
209 | 209 | ||||
|
Other assets |
4,478 | 6,906 | ||||
|
Total assets |
$ |
1,009,927 |
$ |
981,102 | ||
|
Liabilities: |
||||||
|
Deposits: |
||||||
|
Interest-bearing |
$ |
643,714 |
$ |
575,452 | ||
|
Non-interest-bearing |
192,023 | 194,731 | ||||
|
Total deposits |
835,737 | 770,183 | ||||
|
Accrued interest payable and other liabilities |
7,674 | 8,956 | ||||
|
Finance lease obligation |
286 | 336 | ||||
|
Operating lease liabilities |
6,556 |
- |
||||
|
Short-term borrowings |
37,839 | 76,366 | ||||
|
FHLB advances |
15,000 | 31,704 | ||||
|
Total liabilities |
903,092 | 887,545 | ||||
|
Shareholders' equity: |
||||||
|
Preferred stock authorized 5,000,000 shares with no par value; none issued |
- |
- |
||||
|
Capital stock, no par value (10,000,000 shares authorized; shares issued and outstanding; 3,781,500 in 2019; and 3,759,426 in 2018) |
30,848 | 29,715 | ||||
|
Retained earnings |
72,385 | 64,937 | ||||
|
Accumulated other comprehensive income (loss) |
3,602 | (1,095) | ||||
|
Total shareholders' equity |
106,835 | 93,557 | ||||
|
Total liabilities and shareholders' equity |
$ |
1,009,927 |
$ |
981,102 | ||
|
|
||||||
|
See notes to consolidated financial statements |
||||||
55
|
Fidelity D & D Bancorp, Inc. and Subsidiary |
|||||||||
|
Consolidated Statements of Income |
|||||||||
|
|
Years ended December 31, |
||||||||
|
(dollars in thousands except per share data) |
2019 |
2018 |
2017 |
||||||
|
Interest income: |
|||||||||
|
Loans and leases: |
|||||||||
|
Taxable |
$ |
32,364 |
$ |
29,155 |
$ |
26,035 | |||
|
Nontaxable |
1,077 | 958 | 860 | ||||||
|
Interest-bearing deposits with financial institutions |
47 | 104 | 48 | ||||||
|
Restricted regulatory securities |
417 | 194 | 135 | ||||||
|
Investment securities: |
|||||||||
|
U.S. government agency and corporations |
3,633 | 3,314 | 2,515 | ||||||
|
States and political subdivisions (nontaxable) |
1,731 | 1,594 | 1,449 | ||||||
|
Other securities |
- |
11 | 22 | ||||||
|
Total interest income |
39,269 | 35,330 | 31,064 | ||||||
|
Interest expense: |
|||||||||
|
Deposits |
6,176 | 3,811 | 2,750 | ||||||
|
Securities sold under repurchase agreements |
- |
16 | 21 | ||||||
|
Other short-term borrowings and other |
878 | 667 | 205 | ||||||
|
FHLB advances |
500 | 379 | 247 | ||||||
|
Total interest expense |
7,554 | 4,873 | 3,223 | ||||||
|
Net interest income |
31,715 | 30,457 | 27,841 | ||||||
|
Provision for loan losses |
1,085 | 1,450 | 1,450 | ||||||
|
Net interest income after provision for loan losses |
30,630 | 29,007 | 26,391 | ||||||
|
Other income: |
|||||||||
|
Service charges on deposit accounts |
2,286 | 2,244 | 2,227 | ||||||
|
Interchange fees |
2,208 | 2,051 | 1,756 | ||||||
|
Fees from trust fiduciary activities |
1,350 | 1,319 | 1,040 | ||||||
|
Fees from financial services |
946 | 759 | 596 | ||||||
|
Service charges on loans |
1,054 | 579 | 728 | ||||||
|
Fees and other revenue |
845 | 969 | 872 | ||||||
|
Earnings on bank-owned life insurance |
647 | 598 | 581 | ||||||
|
Gain (loss) on write-down, sale or disposal of: |
|||||||||
|
Loans |
856 | 645 | 878 | ||||||
|
Available-for-sale debt securities |
14 | 10 | (147) | ||||||
|
Equity securities |
- |
44 |
- |
||||||
|
Premises and equipment |
(13) | (18) | (164) | ||||||
|
Total other income |
10,193 | 9,200 | 8,367 | ||||||
|
Other expenses: |
|||||||||
|
Salaries and employee benefits |
14,761 | 13,678 | 13,072 | ||||||
|
Premises and equipment |
4,124 | 3,775 | 3,838 | ||||||
|
Advertising and marketing |
1,610 | 1,656 | 1,859 | ||||||
|
Professional services |
1,362 | 1,606 | 1,863 | ||||||
|
Data processing and communication |
1,765 | 1,470 | 1,233 | ||||||
|
Automated transaction processing |
877 | 784 | 735 | ||||||
|
Merger-related expenses |
440 |
- |
- |
||||||
|
Office supplies and postage |
413 | 399 | 460 | ||||||
|
FDIC assessment |
133 | 267 | 267 | ||||||
|
PA shares tax |
303 | 242 | 262 | ||||||
|
Loan collection |
264 | 132 | 224 | ||||||
|
Other real estate owned |
121 | 177 | 200 | ||||||
|
Other |
748 | 886 | 823 | ||||||
|
Total other expenses |
26,921 | 25,072 | 24,836 | ||||||
|
Income before income taxes |
13,902 | 13,135 | 9,922 | ||||||
|
Provision for income taxes |
2,326 | 2,129 | 1,206 | ||||||
|
Net income |
$ |
11,576 |
$ |
11,006 |
$ |
8,716 | |||
|
Per share data : |
|||||||||
|
Net income - basic |
$ |
3.06 |
$ |
2.93 |
$ |
2.35 | |||
|
Net income - diluted |
$ |
3.03 |
$ |
2.90 |
$ |
2.33 | |||
|
Dividends |
$ |
1.06 |
$ |
0.98 |
$ |
0.88 | |||
|
|
|||||||||
|
See notes to consolidated financial statements |
|||||||||
56
|
|
||||||||||
|
Fidelity D & D Bancorp, Inc. and Subsidiary |
||||||||||
|
Consolidated Statements of Comprehensive Income |
||||||||||
|
|
Years ended December 31, |
|||||||||
|
(dollars in thousands) |
2019 |
2018 |
2017 |
|||||||
|
|
||||||||||
|
Net income |
$ |
11,576 |
$ |
11,006 |
$ |
8,716 | ||||
|
|
||||||||||
|
Other comprehensive income (loss), before tax: |
||||||||||
|
Unrealized holding gain (loss) on available-for-sale debt securities |
5,960 | (3,127) | 44 | |||||||
|
Reclassification adjustment for net (gains) losses realized in income |
(14) | (10) | 147 | |||||||
|
Net unrealized gain (loss) |
5,946 | (3,137) | 191 | |||||||
|
Tax effect |
(1,249) | 659 | (65) | |||||||
|
Unrealized gain (loss), net of tax |
4,697 | (2,478) | 126 | |||||||
|
Other comprehensive income (loss), net of tax |
4,697 | (2,478) | 126 | |||||||
|
Total comprehensive income, net of tax |
$ |
16,273 |
$ |
8,528 |
$ |
8,842 | ||||
|
|
||||||||||
|
See notes to consolidated financial statements |
||||||||||
57
|
|
||||||||||||||
|
Fidelity D & D Bancorp, Inc. and Subsidiary |
||||||||||||||
|
Consolidated Statements of Changes in Shareholders' Equity |
||||||||||||||
|
For the years ended December 31, 2019, 2018 and 2017 |
||||||||||||||
|
|
Accumulated |
|||||||||||||
|
|
other |
|||||||||||||
|
|
Capital stock |
Retained |
comprehensive |
|||||||||||
|
(dollars in thousands) |
Shares |
Amount |
earnings |
income (loss) |
Total |
|||||||||
|
|
||||||||||||||
|
Balance, December 31, 2016 |
2,453,805 |
$ |
27,155 |
$ |
52,095 |
$ |
1,381 |
$ |
80,631 | |||||
|
Net income |
8,716 | 8,716 | ||||||||||||
|
Other comprehensive income |
126 | 126 | ||||||||||||
|
Effect of adopting ASU 2018-02 |
(297) | 297 |
- |
|||||||||||
|
Issuance of common stock through Employee Stock Purchase Plan |
4,085 | 126 | 126 | |||||||||||
|
Issuance of common stock through Dividend Reinvestment Plan |
7,744 | 331 | 331 | |||||||||||
|
Issuance of common stock from vested restricted share grants through stock compensation plans |
9,657 | |||||||||||||
|
Issuance of common stock through exercise of stock options |
16,000 | 416 | 416 | |||||||||||
|
Stock-based compensation expense |
333 | 333 | ||||||||||||
|
Issuance of common stock from stock split |
1,243,187 | |||||||||||||
|
Cash in lieu of fractional shares paid due to the stock split |
(11) | (11) | ||||||||||||
|
Cash dividends declared |
(3,285) | (3,285) | ||||||||||||
|
Balance, December 31, 2017 |
3,734,478 |
$ |
28,361 |
$ |
57,218 |
$ |
1,804 |
$ |
87,383 | |||||
|
Net income |
11,006 | 11,006 | ||||||||||||
|
Other comprehensive loss |
(2,478) | (2,478) | ||||||||||||
|
Effect of adopting ASU 2016-01 |
421 | (421) |
- |
|||||||||||
|
Issuance of common stock through Employee Stock Purchase Plan |
6,783 | 149 | 149 | |||||||||||
|
Issuance of common stock through Dividend Reinvestment Plan |
5,486 | 311 | 311 | |||||||||||
|
Issuance of common stock from vested restricted share grants through stock compensation plans |
9,994 | |||||||||||||
|
Issuance of common stock through exercise of stock options and SSARs |
2,685 | 14 | 14 | |||||||||||
|
Stock-based compensation expense |
880 | 880 | ||||||||||||
|
Cash dividends declared |
(3,708) | (3,708) | ||||||||||||
|
Balance, December 31, 2018 |
3,759,426 |
$ |
29,715 |
$ |
64,937 |
$ |
(1,095) |
$ |
93,557 | |||||
|
Net income |
11,576 | 11,576 | ||||||||||||
|
Other comprehensive income |
4,697 | 4,697 | ||||||||||||
|
Effect of adopting ASU 2016-02 |
(91) | (91) | ||||||||||||
|
Issuance of common stock through Employee Stock Purchase Plan |
4,535 | 175 | 175 | |||||||||||
|
Issuance of common stock from vested restricted share grants through stock compensation plans |
15,574 | |||||||||||||
|
Issuance of common stock through exercise of SSARs |
1,965 | |||||||||||||
|
Stock-based compensation expense |
958 | 958 | ||||||||||||
|
Cash dividends declared |
(4,037) | (4,037) | ||||||||||||
|
Balance, December 31, 2019 |
3,781,500 |
$ |
30,848 |
$ |
72,385 |
$ |
3,602 |
$ |
106,835 | |||||
|
|
||||||||||||||
|
See notes to consolidated financial statements |
||||||||||||||
58
|
|
|||||||||
|
Fidelity D & D Bancorp, Inc. and Subsidiary |
|||||||||
|
Consolidated Statements of Cash Flows |
|||||||||
|
|
Years ended December 31, |
||||||||
|
(dollars in thousands) |
2019 |
2018 |
2017 |
||||||
|
|
|||||||||
|
Cash flows from operating activities: |
|||||||||
|
Net income |
$ |
11,576 |
$ |
11,006 |
$ |
8,716 | |||
|
Adjustments to reconcile net income to net cash provided by |
|||||||||
|
operating activities: |
|||||||||
|
Depreciation, amortization and accretion |
3,301 | 3,029 | 3,113 | ||||||
|
Provision for loan losses |
1,085 | 1,450 | 1,450 | ||||||
|
Deferred income tax expense |
341 | 1,019 | (666) | ||||||
|
Stock-based compensation expense |
817 | 749 | 550 | ||||||
|
Excess tax benefit from exercise of stock options/SSARs |
23 | 28 | 96 | ||||||
|
Proceeds from sale of loans held-for-sale |
52,718 | 32,721 | 43,350 | ||||||
|
Originations of loans held-for-sale |
(42,328) | (34,858) | (38,624) | ||||||
|
Earnings from bank-owned life insurance |
(647) | (598) | (581) | ||||||
|
Net gain from sales of loans |
(856) | (645) | (878) | ||||||
|
Net (gain) loss from sales of investment securities |
(14) | (54) | 147 | ||||||
|
Net loss from sale and write-down of foreclosed assets held-for-sale |
44 | 90 | 79 | ||||||
|
Net loss from write-down and disposal of bank premises and equipment |
13 | 18 | 164 | ||||||
|
Operating lease payments |
81 |
- |
- |
||||||
|
Change in: |
|||||||||
|
Accrued interest receivable |
(10) | (486) | (536) | ||||||
|
Other assets |
420 | (2,503) | (3,989) | ||||||
|
Accrued interest payable and other liabilities |
(778) | 2,684 | 1,496 | ||||||
|
Net cash provided by operating activities |
25,786 | 13,650 | 13,887 | ||||||
|
|
|||||||||
|
Cash flows from investing activities: |
|||||||||
|
Available-for-sale securities: |
|||||||||
|
Proceeds from sales |
10,952 | 13,514 | 5,970 | ||||||
|
Proceeds from maturities, calls and principal pay-downs |
35,045 | 20,434 | 20,578 | ||||||
|
Purchases |
(43,384) | (63,571) | (55,016) | ||||||
|
Decrease (increase) in FHLB stock |
1,956 | (3,507) | (226) | ||||||
|
Net increase in loans and leases |
(36,912) | (81,887) | (44,584) | ||||||
|
Principal portion of lease payments received under direct finance leases |
3,170 |
- |
- |
||||||
|
Purchase of life insurance policies |
(2,000) |
- |
(8,000) | ||||||
|
Purchases of bank premises and equipment |
(4,128) | (3,572) | (921) | ||||||
|
Proceeds from sale of bank premises and equipment |
240 | 8 | 6 | ||||||
|
Proceeds from sale of foreclosed assets held-for-sale |
1,065 | 1,462 | 534 | ||||||
|
Net cash used in investing activities |
(33,996) | (117,119) | (69,842) | ||||||
|
|
|||||||||
|
Cash flows from financing activities: |
|||||||||
|
Net increase in deposits |
65,554 | 40,037 | 12,878 | ||||||
|
Net (decrease) increase in short-term borrowings |
(38,527) | 57,864 | 14,278 | ||||||
|
Proceeds from issuance of FHLB advances |
- |
15,000 | 25,704 | ||||||
|
Repayment of FHLB advances |
(16,704) | (4,500) | (4,500) | ||||||
|
Repayment of finance lease obligation |
(73) | (38) |
- |
||||||
|
Proceeds from employee stock purchase plan participants |
175 | 149 | 126 | ||||||
|
Exercise of stock options |
- |
14 | 416 | ||||||
|
Dividends paid |
(4,037) | (3,397) | (2,954) | ||||||
|
Cash paid in lieu of fractional shares |
- |
- |
(11) | ||||||
|
Net cash provided by financing activities |
6,388 | 105,129 | 45,937 | ||||||
|
Net (decrease) increase in cash and cash equivalents |
(1,822) | 1,660 | (10,018) | ||||||
|
Cash and cash equivalents, beginning |
17,485 | 15,825 | 25,843 | ||||||
|
|
|||||||||
|
Cash and cash equivalents, ending |
$ |
15,663 |
$ |
17,485 |
$ |
15,825 | |||
|
|
|||||||||
|
See notes to consolidated financial statements |
|||||||||
59
|
Fidelity D & D Bancorp, Inc. and Subsidiary |
|||||||||
|
Consolidated Statements of Cash Flows (continued) |
|||||||||
|
|
Years ended December 31, |
||||||||
|
(dollars in thousands) |
2019 |
2018 |
2017 |
||||||
|
Supplemental Disclosures of Cash Flow Information |
|||||||||
|
Cash payments for: |
|||||||||
|
Interest |
$ |
7,440 |
$ |
4,689 |
$ |
3,058 | |||
|
Income tax |
1,950 | 600 | 2,700 | ||||||
|
Supplemental Disclosures of Non-cash Investing Activities: |
|||||||||
|
Net change in unrealized gains on available-for-sale securities |
5,946 | (3,137) | 191 | ||||||
|
Transfers from loans to foreclosed assets held-for-sale |
1,288 | 781 | 280 | ||||||
|
Transfers from loans to loans held-for-sale |
6,038 | 1,204 | 3,821 | ||||||
|
Transfers from premises and equipment to other assets held-for-sale |
- |
253 |
- |
||||||
|
Right-of-use asset |
6,211 |
- |
- |
||||||
|
Lease liability |
6,710 |
- |
- |
||||||
|
|
|||||||||
|
Acquisition of West Scranton Branch from Wayne Bank |
March 17, 2017 |
||||||||
|
Non-cash assets acquired: |
|||||||||
|
Loans |
$ |
1,574 | |||||||
|
Bank premises and equipment |
264 | ||||||||
|
Goodwill |
209 | ||||||||
|
Accrued interest receivable and other assets |
4 | ||||||||
|
Total non-cash assets acquired |
$ |
2,051 | |||||||
|
Liabilities assumed: |
|||||||||
|
Deposits |
$ |
13,809 | |||||||
|
Accrued interest payable and other liabilities |
59 | ||||||||
|
Total liabilities assumed |
$ |
13,868 | |||||||
|
|
|||||||||
|
See notes to consolidated financial statements |
|||||||||
|
|
|||||||||
60
FIDELITY D & D BANCORP, INC.
AND SUBSIDIARY
NOTES TO CONSOLIDATED FINANCIAL STATEMENTS
1.NATURE OF OPERATIONS AND SUMMARY OF SIGNIFICANT ACCOUNTING POLICIES
PRINCIPLES OF CONSOLIDATION
The accompanying consolidated financial statements include the accounts of Fidelity D & D Bancorp, Inc. and its wholly-owned subsidiary, The Fidelity Deposit and Discount Bank (the Bank) (collectively, the Company). All significant inter-company balances and transactions have been eliminated in consolidation.
NATURE OF OPERATIONS
The Company provides a full range of banking, trust and financial services to individuals, small businesses and corporate customers. Its primary market areas are Lackawanna and Luzerne Counties, Pennsylvania. The Company's primary deposit products are demand deposits and interest-bearing time, money market and savings accounts. It offers a full array of loan products to meet the needs of retail and commercial customers. The Company is subject to regulation by the Federal Deposit Insurance Corporation (FDIC) and the Pennsylvania Department of Banking.
USE OF ESTIMATES
The preparation of financial statements in conformity with accounting principles generally accepted in the United States of America (GAAP) requires management to make estimates and assumptions that affect the reported amounts of assets and liabilities and disclosure of contingent assets and liabilities at the date of the financial statements and the reported amounts of revenues and expenses during the reporting period. Actual results could differ from those estimates.
Material estimates that are particularly susceptible to significant change relate to the determination of the allowance for loan losses, the valuation of investment securities, the determination and the amount of impairment in the securities portfolios, and the related realization of the deferred tax assets related to the allowance for loan losses, other-than-temporary impairment on and valuations of investment securities.
In connection with the determination of the allowance for loan losses, management generally obtains independent appraisals for significant properties, utilizes historical loss factors and applies judgement to determine qualitative factor adjustments. While management uses available information to recognize losses on loans, further reductions in the carrying amounts of loans may be necessary based on changes in economic conditions. In addition, regulatory agencies, as an integral part of their examination process, periodically review the estimated losses on loans. Such agencies may require the Company to recognize additional losses based on their judgments about information available to them at the time of their examination. Because of these factors, it is reasonably possible that the estimated losses on loans may change materially in the near-term. However, the amount of the change that is reasonably possible cannot be estimated.
The Company’s investment securities are comprised of a variety of financial instruments. The fair values of the securities are subject to various risks including changes in the interest rate environment and general economic conditions including illiquid conditions in the capital markets. Due to the increased level of these risks and their potential impact on the fair values of the securities, it is possible that the amounts reported in the accompanying financial statements could materially change in the near-term. Any credit-related impairment is included as a component of non-interest income in the consolidated income statements while non-credit-related impairment is charged to other comprehensive income, net of tax.
SIGNIFICANT GROUP CONCENTRATION OF CREDIT RISK
The Company originates commercial, consumer, and mortgage loans to customers primarily located in Lackawanna and Luzerne Counties of Pennsylvania. Although the Company has a diversified loan portfolio, a substantial portion of its debtors’ ability to honor their contracts is dependent on the economic sector in which the Company operates. The loan portfolio does not have any significant concentrations from one industry or customer.
HELD-TO-MATURITY SECURITIES
Debt securities, for which the Company has the positive intent and ability to hold to maturity, are reported at cost. Premiums and discounts are amortized or accreted, as a component of interest income over the life of the related security as an adjustment to yield using the interest method. The Company did not have any held-to-maturity securities at December 31, 2019 or 2018.
TRADING SECURITIES
Debt securities held principally for resale in the near-term, or trading securities, are recorded at their fair values. Unrealized gains and losses are included in other income. The Company did not have investment securities held for trading purposes during 2019 or 2018.
61
AVAILABLE-FOR-SALE SECURITIES
Available-for-sale (AFS) securities consist of debt and equity securities classified as neither held-to-maturity nor trading and are reported at fair value. Premiums and discounts are amortized or accreted as a component of interest income over the life of the related security as an adjustment to yield using the interest method. Unrealized holding gains and losses, including non-credit-related other-than-temporary impairment (OTTI), on AFS securities are reported as a separate component of shareholders’ equity, net of deferred income taxes, until realized. The net unrealized holding gains and losses are a component of accumulated other comprehensive income. Gains and losses from sales of securities AFS are determined using the specific identification method.
FEDERAL HOME LOAN BANK STOCK
The Company, is a member of the Federal Home Loan Bank system, and as such is required to maintain an investment in capital stock of the Federal Home Loan Bank of Pittsburgh (FHLB). The amount the Company is required to invest is dependent upon the relative size of outstanding borrowings the Company has with the FHLB. Based on redemption provisions of the FHLB, the stock has no quoted market value and is carried at cost.
LOANS
Loans that management has the intent and ability to hold for the foreseeable future or until maturity or payoff are stated at face value, net of unamortized loan fees and costs and the allowance for loan losses. Interest on residential real estate loans is recorded based on principal pay downs on an actual days basis. Commercial loan interest is accrued on the principal balance on an actual days basis. Interest on consumer loans is determined using the simple interest method.
Generally, loans are placed on non-accrual status when principal or interest is past due 90 days or more. When a loan is placed on non-accrual status, all interest previously accrued but not collected is charged against current earnings. Any payments received on non-accrual loans are applied, first to the outstanding loan amounts, then to the recovery of any charged-off loan amounts. Any excess is treated as a recovery of lost interest.
A modification of a loan constitutes a troubled debt restructuring (TDR) when a borrower is experiencing financial difficulty and the Company grants a concession that it would not otherwise grant based on current underwriting standards. Although concessions may be made when modifying a loan, forgiveness of principal is rarely granted.
MORTGAGE BANKING OPERATIONS AND MORTGAGE SERVICING RIGHTS
The Company sells one-to-four family residential mortgage loans on a servicing retained basis. On a loan sold where servicing was retained, the Company determines at the time of sale the value of the retained servicing rights, which represents the present value of the differential between the contractual servicing fee and adequate compensation, defined as the fee a sub-servicer would require to assume the role of servicer, after considering the estimated effects of prepayments. If material, a portion of the gain on the sale of the loan is recognized due to the value of the servicing rights, and a mortgage servicing asset is recorded.
Commitments to sell one-to-four family residential mortgage loans are made primarily during the period between the intent to proceed and the closing of the mortgage loan. The timing of making these sale commitments is dependent upon the timing of the borrower’s election to lock-in the mortgage interest rate and fees prior to loan closing. Most of these sales commitments are made on a best-efforts basis whereby the Company is only obligated to sell the mortgage if the mortgage loan is approved and closed by the Company. Commitments to fund mortgage loans (rate lock commitments) to be sold into the secondary market and forward commitments for the future delivery of these mortgage loans are accounted for as free standing derivatives. Fair values of these derivatives are estimated based on changes in mortgage interest rates from the date the interest rate on the loan is locked. The Company enters into forward commitments for the future delivery of mortgage loans when interest rate locks are entered into, in order to hedge the change in interest rates resulting from its commitments to fund the loans. Changes in the fair values of these derivatives are included in gains or losses on sales of loans. The fair value of these derivative instruments was not significant at December 31, 2019 and 2018.
Servicing assets are reported in other assets and amortized in proportion to and over the period during which estimated servicing income will be received. Servicing loans for others consists of collecting mortgage payments, maintaining escrow accounts, disbursing payments to investors, and processing foreclosures. Loan servicing income is recorded when earned and represents servicing fees from investors and certain charges collected from borrowers, such as late payment fees. The Company has fiduciary responsibility for related escrow and custodial funds.
Servicing assets are recognized as separate assets when rights are acquired through the sale of financial assets. For sales of mortgage loans originated by the Company, a portion of the cost of originating the loan is allocated to the servicing retained right based on fair value. Capitalized servicing rights are amortized into interest income in proportion to, and over the period of, the estimated future net servicing income of the underlying financial assets. Remaining servicing rights are charged against income upon payoff of the loan. Servicing fee income is recorded for fees earned for servicing loans. The fees are based on a contractual percentage of the outstanding principal and are recorded as income when earned.
62
LOANS HELD-FOR-SALE
Loans originated and intended for sale in the secondary market are carried at the lower of cost or estimated fair value in the aggregate. Net unrealized losses are recognized through a valuation allowance by charges to income. Unrealized gains are recognized but only to the extent of previous write-downs.
AUTOMOBILE LEASING
Financing of automobiles, provided to customers under lease arrangements of varying terms, are accounted for as direct finance leases. Interest on automobile direct finance leasing is determined using the interest method. Generally, the interest method is used to arrive at a level effective yield over the life of the lease. The lease residual and the lease receivable, net of unearned lease income, are recorded within loans and leases on the balance sheet.
ALLOWANCE FOR LOAN LOSSES
The allowance for loan losses is established through a provision for loan losses. The allowance represents an amount which, in management’s judgment, will be adequate to absorb losses on existing loans. Management’s judgment in determining the adequacy of the allowance is based on evaluations of the collectability of the loans. These evaluations take into consideration such factors as changes in the nature and volume of the loan portfolio, current economic conditions that may affect the borrower’s ability to pay, collateral value, overall portfolio quality and review of specific loans for impairment. Management applies two primary components during the estimation process to determine proper allowance levels; a specific loan loss allocation for loans that are deemed impaired and a general loan loss allocation for those loans not specifically allocated based on historical charge-off history and qualitative factor adjustments for trends or changes in the loan portfolio. Delinquencies, changes in lending policies and local economic conditions are some of the items used for the qualitative factor adjustments. Loans considered uncollectible are charged against the allowance. Recoveries on loans previously charged off are added to the allowance.
A loan is considered impaired when, based on current information and events, it is probable that the Company will be unable to collect the scheduled payments in accordance with the contractual terms of the loan. Factors considered in determining impairment include payment status, collateral value and the probability of collecting payments when due. The significance of payment delays and/or shortfalls is determined on a case by case basis. All circumstances surrounding the loan are taken into account. Such factors include the length of the delinquency, the underlying reasons and the borrower’s prior payment record. Impairment is measured on these loans on a loan-by-loan basis. Impaired loans include non-accrual loans, TDRs and other loans deemed to be impaired based on the aforementioned factors.
The risk characteristics of each of the identified portfolio segments are as follows:
Commercial and industrial loans (C&I): C&I loans are primarily based on the identified historic and/or the projected cash flows of the borrower and secondarily on the underlying collateral provided by the borrower. The cash flows of the borrower, however, do fluctuate based on changes in the Company’s internal and external environment including management, human and capital resources, economic conditions, competition and regulation. Most C&I loans are secured by business assets being financed such as equipment, accounts receivable, and/or inventory and generally incorporate a secured or unsecured personal guarantee. Unsecured loans may be made on a short-term basis. The ability of the borrower to collect amounts due from its customers and perform under the terms of its loan may be affected by its customers’ economic and financial condition.
Commercial real estate loans (CRE): Commercial real estate loans are made to finance the purchase of real estate, refinance existing obligations and/or to provide capital. These commercial real estate loans are generally secured by first lien security interests in the real estate as well as assignment of leases and rents. The real estate may include apartments, hotels, retail stores or plazas and healthcare facilities whether they are owner or non-owner occupied. These loans are typically originated in amounts of no more than 80% of the appraised value of the property. The ability of the borrower to collect amounts due from its customers and perform under the terms of its loan may be affected by its customers’ or lessees customers’ economic and financial condition.
Consumer loans: The Company offers home equity installment loans and lines of credit. Risks associated with loans secured by residential properties are generally lower than commercial real estate loans and include general economic risks, such as the strength of the job market, employment stability and the strength of the housing market. Since most loans are secured by a primary or secondary residence or an automobile, the borrower’s continued employment is considered the greatest risk to repayment. The Company also offers a variety of loans to individuals for personal and household purposes. These loans are generally considered to have greater risk than mortgages on real estate because they may be unsecured, or if they are secured, the value of the collateral may be difficult to assess and more likely to decrease in value than real estate.
Residential mortgage loans: Residential mortgages are secured by a first lien position of the borrower’s residential real estate. These loans have varying loan rates depending on the financial condition of the borrower and the loan to value ratio. Since most loans are secured by a primary or secondary residence, the borrower’s continued employment is considered the greatest risk to repayment. Residential mortgages have terms up to thirty years with amortizations varying from 10 to 30 years. The majority of the loans are underwritten according to FNMA and/or FHLB standards.
63
TRANSFER OF FINANCIAL ASSETS
Transfers of financial assets are accounted for as sales, when control over the assets has been surrendered. Control over transferred assets is deemed to be surrendered when: the assets have been isolated from the Company—put presumptively beyond the reach of the transferor and its creditors, even in bankruptcy or other receivership; the transferee obtains the right (free of conditions that constrain it from taking advantage of that right) to pledge or exchange the transferred assets; and the Company does not maintain effective control over the transferred assets through an agreement to repurchase them before their maturity or the ability to unilaterally cause the holder to return specific assets, other than through a cleanup call.
LOAN FEES AND COSTS
Nonrefundable loan origination fees and certain direct loan origination costs are recognized as a component of interest income over the life of the related loans as an adjustment to yield. The unamortized balance of the deferred fees and costs are included as components of the loan balances to which they relate.
BANK PREMISES AND EQUIPMENT
Land is carried at cost. Bank premises and equipment are stated at cost less accumulated depreciation. Depreciation is computed on the straight-line method over the estimated useful lives of the assets. Leasehold improvements are amortized over the shorter of the term of the lease or the estimated useful lives of the improved property. The Company leases several branches which are classified as operating leases. The Company also leases three stand-alone ATMs which are classified as operating leases and equipment which is classified as capital leases. In most circumstances, management expects that in the normal course of business, leases will be renewed or replaced by other leases. Rent expense is recognized on the straight-line method over the term of the lease.
BANK OWNED LIFE INSURANCE
The Company maintains bank owned life insurance (BOLI) for a selected group of employees, namely its officers where the Company is the owner and sole beneficiary of the policies. The earnings from the BOLI are recognized as a component of other income in the consolidated statements of income. The BOLI is an asset that can be liquidated, if necessary, with tax consequences. However, the Company intends to hold these policies and, accordingly, the Company has not provided for deferred income taxes on the earnings from the increase in the cash surrender value.
EMPLOYEE BENEFITS
The Company holds separate supplemental executive retirement (SERP) agreements for certain officers and an amount is credited to each participant’s SERP account monthly while they are actively employed by the bank until retirement. A deferred tax asset is provided for the non-deductible SERP expense. The Company also entered into separate split dollar life insurance arrangements with four executives providing post-retirement benefits and accrues monthly expense for this benefit. Monthly expenses for the SERP and post-retirement split dollar life benefit are recorded as components of salaries and employee benefit expense on the consolidated statements of income.
FORECLOSED ASSETS HELD-FOR-SALE
Foreclosed assets held-for-sale are carried at the lower of cost or fair value less cost to sell. Foreclosed assets held-for-sale is primarily other real estate owned, but also includes other repossessed assets. Losses from the acquisition of property in full and partial satisfaction of debt are treated as credit losses. Routine holding costs, gains and losses from sales, write-downs for subsequent declines in value and any rental income received are recognized net, as a component of other real estate owned expense in the consolidated statements of income. Gains or losses are recorded when the properties are sold.
IMPAIRMENT OF LONG-LIVED ASSETS
Long-lived assets, including bank premises and equipment, are reviewed for impairment whenever events or changes in circumstances indicate that the carrying amount of an asset may not be recoverable. If impairment is indicated by that review, the asset is written down to its estimated fair value through a charge to non-interest expense.
GOODWILL
Goodwill is recorded on the consolidated balance sheets as the excess of liabilities assumed over identifiable assets acquired on the acquisition date. Goodwill is recorded at its net carrying value which represents estimated fair value. The goodwill is deductible for tax purposes over a 15 year period.
Goodwill is reviewed for impairment annually as of November 30 and between annual tests when events and circumstances indicate that impairment may have occurred. Goodwill impairment exists when the carrying amount of a reporting unit exceeds its fair value. A qualitative test can be performed to determine whether it is more likely than not that the fair value of the Company is less than its carrying amount, including goodwill. In this qualitative assessment, the Company evaluates events and circumstances which include general banking industry conditions and trends, the overall financial performance of the Company, the performance of the Company’s common stock and key financial performance metrics of the Company. If the qualitative review indicates that it is not more likely than not that the carrying value exceeds its fair value, no further
64
evaluation needs to be performed. If the results of the qualitative review indicate it is more likely than not that the fair value is less than the carrying value, then the Company performs a quantitative impairment test. During 2019, the Company determined it is not more likely than not that the carrying value exceeds its carrying value therefore no quantitative analysis was necessary.
STOCK PLANS
The Company has two stock-based compensation plans. The Company accounts for these plans under the recognition and measurement accounting principles, which requires the cost of share-based payment transactions be recognized in the financial statements. The stock-based compensation accounting guidance requires that compensation cost for stock awards be calculated and recognized over the employees’ service period, generally defined as the vesting period. Compensation cost is recognized on a straight-line basis over the requisite service period. When granting stock-settled stock appreciation rights (SSARs), the Company uses Black-Scholes-Merton valuation model to determine fair value on the date of grant.
TRUST AND FINANCIAL SERVICE FEES
Trust and financial service fees are recorded on the cash basis, which is not materially different from the accrual basis.
ADVERTISING COSTS
Advertising costs are charged to expense as incurred.
LEGAL AND PROFESSIONAL EXPENSES
Generally, the Company recognizes legal and professional fees as incurred and are included as a component of professional services expense in the consolidated statements of income. Legal costs incurred that are associated with the collection of outstanding amounts due from delinquent borrowers are included as a component of loan collection expense in the consolidated statements of income. In the event of litigation proceedings brought about by an employee or third party against the Company, expenses for damages will be accrued if the likelihood of the outcome against the Company is probable, the amount can be reasonably estimated and the amount would have a material impact on the financial results of the Company.
INCOME TAXES
Deferred tax assets and liabilities are reflected at currently enacted income tax rates applicable to the period in which the deferred tax assets or liabilities are expected to be realized or settled. As changes in tax laws or rates are enacted, deferred tax assets and liabilities are adjusted through the provision for income taxes.
The benefit of a tax position is recognized on the financial statements in the period during which, based on all available evidence, management believes it is more-likely-than-not that the position will be sustained upon examination, including the resolution of appeals or litigation processes, if any. Tax positions taken are not offset or aggregated with other positions. Tax positions that meet the more-likely-than-not recognition threshold are measured as the largest amount of tax benefit that is more than 50% likely of being realized upon settlement with the applicable taxing authority. For tax positions not meeting the more likely than not threshold, no tax benefit is recorded. Under the more likely than not threshold guidelines, the Company believes no significant uncertain tax positions exist, either individually or in the aggregate, that would give rise to the non-recognition of an existing tax benefit. The Company had no material unrecognized tax benefits or accrued interest and penalties for the years ended December 31, 2019, 2018 or 2017, respectively.
COMPREHENSIVE INCOME (LOSS)
Accounting principles generally require that recognized revenue, expenses, gains and losses be included in net income. Although certain changes in assets and liabilities, such as unrealized gains and losses on available-for-sale securities, are reported as a separate component of the shareholders’ equity section of the consolidated balance sheets, such items, along with net income, are components of comprehensive income (loss).
CASH FLOWS
For purposes of reporting cash flows, cash and cash equivalents include cash on hand, amounts due from banks and interest-bearing deposits with financial institutions.
2.CASH
The Company is required by the Federal Reserve Bank to maintain average reserve balances based on a percentage of deposits. The amounts of those reserve requirements on December 31, 2019 and 2018 were $0.7 million and $1.4 million, respectively.
Deposits with any one financial institution are insured up to $250,000. From time-to-time, the Company may maintain cash and cash equivalents with certain other financial institutions in excess of the insured amount.
65
3.ACCUMULATED OTHER COMPREHENSIVE INCOME
The following tables illustrate the changes in accumulated other comprehensive income by component and the details about the components of accumulated other comprehensive income as of and for the periods indicated:
|
|
||
|
As of and for the year ended December 31, 2019 |
||
|
|
Unrealized gains |
|
|
|
(losses) on |
|
|
|
available-for-sale |
|
|
(dollars in thousands) |
debt securities |
|
|
Beginning balance |
$ |
(1,095) |
|
|
||
|
Other comprehensive income before reclassifications, net of tax |
4,708 | |
|
Amounts reclassified from accumulated other comprehensive income, net of tax |
(11) | |
|
Net current-period other comprehensive income |
4,697 | |
|
Ending balance |
$ |
3,602 |
|
As of and for the year ended December 31, 2018 |
||
|
|
Unrealized gains |
|
|
|
(losses) on |
|
|
|
available-for-sale |
|
|
(dollars in thousands) |
securities |
|
|
Beginning balance |
$ |
1,804 |
|
|
||
|
Other comprehensive loss before reclassifications, net of tax |
(2,470) | |
|
Amounts reclassified from accumulated other comprehensive income, net of tax |
(8) | |
|
Effect of adopting ASU 2016-01, net of tax* |
(421) | |
|
Net current-period other comprehensive loss |
(2,899) | |
|
Ending balance |
$ |
(1,095) |
|
|
||
*The Company adopted ASU 2016-01 on January 1, 2018. As a result, unrealized gains on equity securities were reclassified from accumulated other comprehensive income to retained earnings.
|
As of and for the year ended December 31, 2017 |
||
|
|
Unrealized gains |
|
|
|
(losses) on |
|
|
|
available-for-sale |
|
|
(dollars in thousands) |
securities |
|
|
Beginning balance |
$ |
1,381 |
|
|
||
|
Other comprehensive income before reclassifications, net of tax |
29 | |
|
Amounts reclassified from accumulated other comprehensive income, net of tax |
97 | |
|
Effect of adopting ASU 2018-02* |
297 | |
|
Net current-period other comprehensive income |
423 | |
|
Ending balance |
$ |
1,804 |
|
|
||
*The Company elected to reclassify from accumulated other comprehensive income to retained earnings stranded tax effects resulting from the Tax Cuts and Jobs Act at the end of 2017 according to ASU 2018-02. These stranded tax effects were related to the adjustment made to retained earnings at the end of 2017 to re-measure the deferred tax liability for unrealized gains on available for sale securities at the new tax rate effective January 1, 2018.
66
|
|
|||||||||||
|
Details about accumulated other |
|||||||||||
|
comprehensive income components |
Amount reclassified from accumulated |
Affected line item in the statement |
|||||||||
|
(dollars in thousands) |
other comprehensive income |
where net income is presented |
|||||||||
|
|
|||||||||||
|
|
|||||||||||
|
|
2019 |
2018 |
2017 |
||||||||
|
|
|||||||||||
|
Unrealized gains (losses) on AFS debt securities |
$ |
14 |
$ |
10 |
$ |
(147) |
Gain (loss) on sale of investment securities |
||||
|
Income tax effect |
(3) | (2) | 50 |
Provision for income taxes |
|||||||
|
Total reclassifications for the period |
$ |
11 |
$ |
8 |
$ |
(97) |
Net income |
||||
4.INVESTMENT SECURITIES
Agency – Government-sponsored enterprise (GSE) and Mortgage-backed securities (MBS) - GSE residential
Agency – GSE and MBS – GSE residential securities consist of short- to long-term notes issued by Federal Home Loan Mortgage Corporation (FHLMC), FNMA, FHLB and Government National Mortgage Association (GNMA). These securities have interest rates that are fixed and adjustable, have varying short to long-term maturity dates and have contractual cash flows guaranteed by the U.S. government or agencies of the U.S. government.
Obligations of states and political subdivisions
The municipal securities are bank qualified or bank eligible, general obligation and revenue bonds rated as investment grade by various credit rating agencies and have fixed rates of interest with mid- to long-term maturities. Fair values of these securities are highly driven by interest rates. Management performs ongoing credit quality reviews on these issues.
Amortized cost and fair value of investment securities as of the period indicated are as follows:
|
|
||||||||||||
|
|
Gross |
Gross |
||||||||||
|
|
Amortized |
unrealized |
unrealized |
Fair |
||||||||
|
(dollars in thousands) |
cost |
gains |
losses |
value |
||||||||
|
December 31, 2019 |
||||||||||||
|
Available-for-sale debt securities: |
||||||||||||
|
Agency - GSE |
$ |
5,941 |
$ |
218 |
$ |
- |
$ |
6,159 | ||||
|
Obligations of states and political subdivisions |
51,857 | 2,871 | (10) | 54,718 | ||||||||
|
MBS - GSE residential |
122,759 | 1,609 | (128) | 124,240 | ||||||||
|
|
||||||||||||
|
Total available-for-sale debt securities |
$ |
180,557 |
$ |
4,698 |
$ |
(138) |
$ |
185,117 | ||||
|
|
||||||||||||
|
|
||||||||||||
|
|
Gross |
Gross |
||||||||||
|
|
Amortized |
unrealized |
unrealized |
Fair |
||||||||
|
(dollars in thousands) |
cost |
gains |
losses |
value |
||||||||
|
December 31, 2018 |
||||||||||||
|
Available-for-sale debt securities: |
||||||||||||
|
Agency - GSE |
$ |
5,926 |
$ |
8 |
$ |
(17) |
$ |
5,917 | ||||
|
Obligations of states and political subdivisions |
51,603 | 1,259 | (287) | 52,575 | ||||||||
|
MBS - GSE residential |
126,667 | 266 | (2,615) | 124,318 | ||||||||
|
|
||||||||||||
|
Total available-for-sale debt securities |
$ |
184,196 |
$ |
1,533 |
$ |
(2,919) |
$ |
182,810 | ||||
|
|
||||||||||||
The Company adopted ASU 2016-01, Financial Instruments – Overall (Topic 825-10): Recognition and Measurement of Financial Assets and Financial Liabilities effective January 1, 2018. The Company sold all of its equity securities during the first half of 2018.
Some of the Company’s debt securities are pledged to secure trust funds, public deposits, short-term borrowings, FHLB advances, Federal Reserve Bank of Philadelphia Discount Window borrowings and certain other deposits as required by law.
67
The amortized cost and fair value of debt securities at December 31, 2019 by contractual maturity are shown below:
|
|
||||||
|
|
Amortized |
Fair |
||||
|
(dollars in thousands) |
cost |
value |
||||
|
Available-for-sale securities: |
||||||
|
Debt securities: |
||||||
|
Due in one year or less |
$ |
3,499 |
$ |
3,530 | ||
|
Due after one year through five years |
6,853 | 7,136 | ||||
|
Due after five years through ten years |
1,002 | 1,003 | ||||
|
Due after ten years |
46,444 | 49,208 | ||||
|
|
||||||
|
MBS - GSE residential |
122,759 | 124,240 | ||||
|
|
||||||
|
Total available-for-sale debt securities |
$ |
180,557 |
$ |
185,117 | ||
Actual maturities will differ from contractual maturities because issuers and borrowers may have the right to call or repay obligations with or without call or prepayment penalty. Agency – GSE and municipal securities are included based on their original stated maturity. MBS – GSE residential, which are based on weighted-average lives and subject to monthly principal pay-downs, are listed in total. Most of the securities have fixed rates or have predetermined scheduled rate changes and many have call features that allow the issuer to call the security at par before its stated maturity without penalty.
Gross realized gains and losses from sales, determined using specific identification, for the periods indicated were as follows:
|
|
December 31, |
|||||||
|
(dollars in thousands) |
2019 |
2018 |
2017 |
|||||
|
|
||||||||
|
Gross realized gain |
$ |
104 |
$ |
114 |
$ |
- |
||
|
Gross realized loss |
(90) | (60) | (147) | |||||
|
Net gain (loss) |
$ |
14 |
$ |
54 |
$ |
(147) | ||
|
|
||||||||
The following table presents the fair value and gross unrealized losses of investments aggregated by investment type, the length of time and the number of securities that have been in a continuous unrealized loss position as of the period indicated:
|
|
||||||||||||||||||
|
|
Less than 12 months |
More than 12 months |
Total |
|||||||||||||||
|
|
Fair |
Unrealized |
Fair |
Unrealized |
Fair |
Unrealized |
||||||||||||
|
(dollars in thousands) |
value |
losses |
value |
losses |
value |
losses |
||||||||||||
|
|
||||||||||||||||||
|
December 31, 2019 |
||||||||||||||||||
|
Obligations of states and political subdivisions |
$ |
2,867 |
$ |
(10) |
$ |
- |
$ |
- |
$ |
2,867 |
$ |
(10) | ||||||
|
MBS - GSE residential |
5,084 | (19) | 16,518 | (109) | 21,602 | (128) | ||||||||||||
|
Total |
$ |
7,951 |
$ |
(29) |
$ |
16,518 |
$ |
(109) |
$ |
24,469 |
$ |
(138) | ||||||
|
Number of securities |
5 | 12 | 17 | |||||||||||||||
|
|
||||||||||||||||||
|
December 31, 2018 |
||||||||||||||||||
|
Agency - GSE |
$ |
3,937 |
$ |
(17) |
$ |
- |
$ |
- |
$ |
3,937 |
$ |
(17) | ||||||
|
Obligations of states and political subdivisions |
6,123 | (91) | 8,447 | (196) | 14,570 | (287) | ||||||||||||
|
MBS - GSE residential |
25,612 | (353) | 74,864 | (2,262) | 100,476 | (2,615) | ||||||||||||
|
Total |
$ |
35,672 |
$ |
(461) |
$ |
83,311 |
$ |
(2,458) |
$ |
118,983 |
$ |
(2,919) | ||||||
|
Number of securities |
31 | 69 | 100 | |||||||||||||||
|
|
||||||||||||||||||
The Company had seventeen debt securities in an unrealized loss position at December 31, 2019, including fourteen mortgage-backed securities and three municipal securities. The severity of these unrealized losses based on their underlying cost basis was as follows at December 31, 2019: 0.59% for total MBS-GSE; and 0.34% for municipals. Of these securities, twelve mortgage-backed securities had been in an unrealized loss position in excess of 12 months. The changes in the prices on these securities in an unrealized loss position in excess of 12 months are the result of interest rate movement and management believes they are temporary in nature.
Management believes the cause of the unrealized losses is related to changes in interest rates, instability in the capital markets or the limited trading activity due to illiquid conditions in the debt market and is not directly related to credit quality.
68
Quarterly, management conducts a formal review of investment securities for the presence of other than temporary impairment (OTTI). The accounting guidance related to OTTI requires the Company to assess whether OTTI is present when the fair value of a debt security is less than its amortized cost as of the balance sheet date. Under those circumstances, OTTI is considered to have occurred if: (1) the entity has the intent to sell the security; (2) more likely than not the entity will be required to sell the security before recovery of its amortized cost basis; or (3) the present value of expected cash flows is not sufficient to recover the entire amortized cost. The accounting guidance requires that credit-related OTTI be recognized in earnings while non-credit-related OTTI on securities not expected to be sold be recognized in other comprehensive income (OCI). Non-credit-related OTTI is based on other factors affecting market value, including illiquidity.
The Company’s OTTI evaluation process also follows the guidance set forth in topics related to debt securities. The guidance set forth in the pronouncements require the Company to take into consideration current market conditions, fair value in relationship to cost, extent and nature of changes in fair value, issuer rating changes and trends, volatility of earnings, current analysts’ evaluations, all available information relevant to the collectability of debt securities, the ability and intent to hold investments until a recovery of fair value which may be to maturity and other factors when evaluating for the existence of OTTI. The guidance requires that credit-related OTTI be recognized as a realized loss through earnings when there has been an adverse change in the holder’s expected cash flows such that the full amount (principal and interest) will probably not be received. This requirement is consistent with the impairment model in the guidance for accounting for debt securities.
For all debt securities, as of December 31, 2019, the Company applied the criteria provided in the recognition and presentation guidance related to OTTI. That is, management has no intent to sell the securities and nor any conditions were identified by management that, more likely than not, would require the Company to sell the securities before recovery of their amortized cost basis. The results indicated there was no presence of OTTI in the Company’s security portfolio. In addition, management believes the change in fair value is attributable to changes in interest rates.
5.LOANS AND LEASES
The classifications of loans and leases at December 31, 2019 and 2018 are summarized as follows:
|
|
|||||
|
(dollars in thousands) |
2019 |
2018 |
|||
|
Commercial and industrial |
$ |
122,594 |
$ |
126,884 | |
|
Commercial real estate: |
|||||
|
Non-owner occupied |
99,801 | 95,515 | |||
|
Owner occupied |
130,558 | 124,092 | |||
|
Construction |
4,654 | 6,761 | |||
|
Consumer: |
|||||
|
Home equity installment |
36,631 | 32,729 | |||
|
Home equity line of credit |
47,282 | 52,517 | |||
|
Auto loans |
105,870 | 105,576 | |||
|
Direct finance leases |
16,355 | 17,004 | |||
|
Other |
5,634 | 6,314 | |||
|
Residential: |
|||||
|
Real estate |
167,164 | 145,951 | |||
|
Construction |
17,770 | 15,749 | |||
|
Total |
754,313 | 729,092 | |||
|
Less: |
|||||
|
Allowance for loan losses |
(9,747) | (9,747) | |||
|
Unearned lease revenue |
(903) | (1,028) | |||
|
Loans and leases, net |
$ |
743,663 |
$ |
718,317 | |
Net deferred loan costs of $3.0 million and $2.6 million have been included in the carrying values of loans at December 31, 2019 and 2018, respectively.
Direct finance leases include the lease receivable and the guaranteed lease residual. Unearned lease revenue represents the difference between the lessor’s investment in the property and the gross investment in the lease. Unearned revenue is accrued over the life of the lease using the effective interest method.
The Company services real estate loans for investors in the secondary mortgage market which are not included in the accompanying consolidated balance sheets. The approximate unpaid principal balance of mortgages serviced amounted to $302.3 million as of December 31, 2019 and $304.9 million as of December 31, 2018. Mortgage servicing rights amounted to $1.0 million and $1.1 million as of December 31, 2019 and 2018, respectively.
Management is responsible for conducting the Company’s credit risk evaluation process, which includes credit risk grading of individual commercial and industrial and commercial real estate loans. Commercial and industrial and commercial real
69
estate loans are assigned credit risk grades based on the Company’s assessment of conditions that affect the borrower’s ability to meet its contractual obligations under the loan agreement. That process includes reviewing borrowers’ current financial information, historical payment experience, credit documentation, public information and other information specific to each individual borrower. Upon review, the commercial loan credit risk grade is revised or reaffirmed as the case may be. The credit risk grades may be changed at any time management feels an upgrade or downgrade may be warranted. The Company utilizes an external independent loan review firm that reviews and validates the credit risk program on at least an annual basis. Results of these reviews are presented to management and the board of directors. The loan review process complements and reinforces the risk identification and assessment decisions made by lenders and credit personnel, as well as the Company’s policies and procedures.
Non-accrual loans
The decision to place loans on non-accrual status is made on an individual basis after considering factors pertaining to each specific loan. C&I and CRE loans are placed on non-accrual status when management has determined that payment of all contractual principal and interest is in doubt or the loan is past due 90 days or more as to principal and interest, unless well-secured and in the process of collection. Consumer loans secured by real estate and residential mortgage loans are placed on non-accrual status at 120 days past due as to principal and interest and unsecured consumer loans are charged-off when the loan is 90 days or more past due as to principal and interest. The Company considers all non-accrual loans to be impaired loans.
Non-accrual loans, segregated by class, at December 31, were as follows:
|
|
|||||
|
(dollars in thousands) |
2019 |
2018 |
|||
|
Commercial and industrial |
$ |
336 |
$ |
156 | |
|
Commercial real estate: |
|||||
|
Non-owner occupied |
510 | 472 | |||
|
Owner occupied |
1,447 | 1,634 | |||
|
Consumer: |
|||||
|
Home equity installment |
65 | 463 | |||
|
Home equity line of credit |
294 | 34 | |||
|
Auto loans |
16 | 25 | |||
|
Residential: |
|||||
|
Real estate |
1,006 | 1,514 | |||
|
Total |
$ |
3,674 |
$ |
4,298 | |
Troubled Debt Restructuring
A modification of a loan constitutes a troubled debt restructuring (TDR) when a borrower is experiencing financial difficulty and the modification constitutes a concession. The Company considers all TDRs to be impaired loans. The Company typically considers the following concessions when modifying a loan, which may include lowering interest rates below the market rate, temporary interest-only payment periods, term extensions at interest rates lower than the current market rate for new debt with similar risk and/or converting revolving credit lines to term loans. The Company typically does not forgive principal when granting a TDR modification. Of the TDRs outstanding as of December 31, 2019 and 2018, when modified, the concessions granted consisted of temporary interest-only payments, extensions of maturity date, or a reduction in the rate of interest to a below-market rate for a contractual period of time. Other than the TDRs that were placed on non-accrual status, the TDRs were performing in accordance with their modified terms.
The following presents by class, information related to loans modified in a TDR:
|
|
Loans modified as TDRs for the twelve months ended: |
|||||||||||||||
|
(dollars in thousands) |
December 31, 2019 |
December 31, 2018 |
||||||||||||||
|
|
||||||||||||||||
|
|
Recorded |
Increase in |
Recorded |
Increase in |
||||||||||||
|
|
Number |
investment |
allowance |
Number |
investment |
allowance |
||||||||||
|
|
of |
(as of |
(as of |
of |
(as of |
(as of |
||||||||||
|
|
contracts |
period end) |
period end) |
contracts |
period end) |
period end) |
||||||||||
|
Consumer home equity installment |
- |
$ |
- |
$ |
- |
1 |
$ |
413 |
$ |
356 | ||||||
|
Residential real estate |
- |
- |
- |
1 |
316 |
- |
||||||||||
|
Total |
- |
$ |
- |
$ |
- |
2 |
$ |
729 |
$ |
356 | ||||||
|
|
||||||||||||||||
In the above table, the period end balance is inclusive of all partial pay downs and charge-offs since the modification date. For all loans modified in a TDR, the pre-modification recorded investment was the same as the post-modification recorded investment.
Loans modified in a TDR are closely monitored for delinquency as an early indicator of possible future default. If loans modified in a TDR subsequently default, the Company evaluates the loan for possible further impairment.
70
The following presents by class, loans modified as a TDR that subsequently defaulted (i.e. 90 days or more past due following a modification) during the periods indicated:
|
Loans modified as a TDR within the previous twelve months that subsequently defaulted during the twelve months ended: |
|||||||||||
|
(dollars in thousands) |
December 31, 2019 |
December 31, 2018 |
|||||||||
|
|
|||||||||||
|
|
Number of |
Recorded |
Number of |
Recorded |
|||||||
|
|
contracts |
investment |
contracts |
investment |
|||||||
|
Consumer home equity installment |
- |
$ |
- |
1 |
$ |
413 | |||||
|
Residential real estate |
- |
- |
1 |
316 | |||||||
|
Total |
- |
$ |
- |
2 |
$ |
729 | |||||
|
|
|||||||||||
In the above table, the period end balances are inclusive of all partial pay downs and charge-offs since the modification date.
The allowance for loan losses (allowance) may be increased, adjustments may be made in the allocation of the allowance or partial charge-offs may be taken to further write-down the carrying value of the loan. An allowance for impaired loans that have been modified in a TDR is measured based on the present value of expected future cash flows discounted at the loan’s effective interest rate or the loan’s observable market price. If the loan is collateral dependent, the estimated fair value of the collateral is used to establish the allowance. As of December 31, 2019 and 2018, respectively, the allowance for impaired loans that have been modified in a TDR was $0.2 million and $0.8 million, respectively.
Past due loans
Loans are considered past due when the contractual principal and/or interest is not received by the due date. For loans reported 30-59 days past due, certain categories of loans are reported past due as and when the loan is in arrears for two payments or billing cycles. An aging analysis of past due loans, segregated by class of loans, as of the period indicated is as follows (dollars in thousands):
|
|
||||||||||||||||||||
|
|
Recorded |
|||||||||||||||||||
|
|
Past due |
investment past |
||||||||||||||||||
|
|
30 - 59 Days |
60 - 89 Days |
90 days |
Total |
Total |
due ≥ 90 days |
||||||||||||||
|
December 31, 2019 |
past due |
past due |
or more (1) |
past due |
Current |
loans (3) |
and accruing |
|||||||||||||
|
|
||||||||||||||||||||
|
Commercial and industrial |
$ |
33 |
$ |
171 |
$ |
336 |
$ |
540 |
$ |
122,054 |
$ |
122,594 |
$ |
- |
||||||
|
Commercial real estate: |
||||||||||||||||||||
|
Non-owner occupied |
- |
70 | 510 | 580 | 99,221 | 99,801 |
- |
|||||||||||||
|
Owner occupied |
180 | 89 | 1,447 | 1,716 | 128,842 | 130,558 |
- |
|||||||||||||
|
Construction |
- |
- |
- |
- |
4,654 | 4,654 |
- |
|||||||||||||
|
Consumer: |
||||||||||||||||||||
|
Home equity installment |
- |
5 | 65 | 70 | 36,561 | 36,631 |
- |
|||||||||||||
|
Home equity line of credit |
49 |
- |
294 | 343 | 46,939 | 47,282 |
- |
|||||||||||||
|
Auto loans |
316 | 46 | 16 | 378 | 105,492 | 105,870 |
- |
|||||||||||||
|
Direct finance leases |
59 | 79 |
- |
138 | 15,314 | 15,452 |
(2) |
- |
||||||||||||
|
Other |
15 | 1 |
- |
16 | 5,618 | 5,634 |
- |
|||||||||||||
|
Residential: |
||||||||||||||||||||
|
Real estate |
29 | 224 | 1,006 | 1,259 | 165,905 | 167,164 |
- |
|||||||||||||
|
Construction |
- |
- |
- |
- |
17,770 | 17,770 |
- |
|||||||||||||
|
Total |
$ |
681 |
$ |
685 |
$ |
3,674 |
$ |
5,040 |
$ |
748,370 |
$ |
753,410 |
$ |
- |
||||||
(1) Includes non-accrual loans. (2) Net of unearned lease revenue of $0.9 million. (3) Includes net deferred loan costs of $3.0 million.
71
|
|
||||||||||||||||||||
|
|
Recorded |
|||||||||||||||||||
|
|
Past due |
investment past |
||||||||||||||||||
|
|
30 - 59 Days |
60 - 89 Days |
90 days |
Total |
Total |
due ≥ 90 days |
||||||||||||||
|
December 31, 2018 |
past due |
past due |
or more (1) |
past due |
Current |
loans (3) |
and accruing |
|||||||||||||
|
|
||||||||||||||||||||
|
Commercial and industrial |
$ |
1,711 |
$ |
135 |
$ |
156 |
$ |
2,002 |
$ |
124,882 |
$ |
126,884 |
$ |
- |
||||||
|
Commercial real estate: |
||||||||||||||||||||
|
Non-owner occupied |
388 | 113 | 472 | 973 | 94,542 | 95,515 |
- |
|||||||||||||
|
Owner occupied |
263 | 513 | 1,634 | 2,410 | 121,682 | 124,092 |
- |
|||||||||||||
|
Construction |
- |
- |
- |
- |
6,761 | 6,761 |
- |
|||||||||||||
|
Consumer: |
||||||||||||||||||||
|
Home equity installment |
50 | 182 | 463 | 695 | 32,034 | 32,729 |
- |
|||||||||||||
|
Home equity line of credit |
725 | 175 | 34 | 934 | 51,583 | 52,517 |
- |
|||||||||||||
|
Auto loans |
262 | 86 | 25 | 373 | 105,203 | 105,576 |
- |
|||||||||||||
|
Direct finance leases |
116 |
- |
- |
116 | 15,860 | 15,976 |
(2) |
- |
||||||||||||
|
Other |
79 | 10 | 1 | 90 | 6,224 | 6,314 | 1 | |||||||||||||
|
Residential: |
||||||||||||||||||||
|
Real estate |
557 | 573 | 1,514 | 2,644 | 143,307 | 145,951 |
- |
|||||||||||||
|
Construction |
- |
- |
- |
- |
15,749 | 15,749 |
- |
|||||||||||||
|
Total |
$ |
4,151 |
$ |
1,787 |
$ |
4,299 |
$ |
10,237 |
$ |
717,827 |
$ |
728,064 |
$ |
1 | ||||||
(1) Includes non-accrual loans. (2) Net of unearned lease revenue of $1.0 million. (3) Includes net deferred loan costs of $2.6 million.
Impaired loans
A loan is considered impaired when, based on current information and events; it is probable that the Company will be unable to collect the payments in accordance with the contractual terms of the loan. Factors considered in determining impairment include payment status, collateral value and the probability of collecting payments when due. The significance of payment delays and/or shortfalls is determined on a case-by-case basis. All circumstances surrounding the loan are taken into account. Such factors include the length of the delinquency, the underlying reasons and the borrower’s prior payment record. Impairment is measured on these loans on a loan-by-loan basis. Impaired loans include non-accrual loans, TDRs and other loans deemed to be impaired based on the aforementioned factors.
At December 31, 2019, impaired loans totaled $4.7 million consisting of $1.0 million in accruing TDRs and $3.7 million in non-accrual loans. At December 31, 2018, impaired loans totaled $6.1 million consisting of $1.8 million in accruing TDRs and $4.3 million in non-accrual loans. As of December 31, 2019, the non-accrual loans included two TDRs to two unrelated borrowers totaling $0.6 million compared with four TDRs to three unrelated borrowers totaling $1.7 million as of December 31, 2018.
Impaired loans, segregated by class, as of the period indicated are detailed below:
|
|
||||||||||||||
|
|
Recorded |
Recorded |
||||||||||||
|
|
Unpaid |
investment |
investment |
Total |
||||||||||
|
|
principal |
with |
with no |
recorded |
Related |
|||||||||
|
(dollars in thousands) |
balance |
allowance |
allowance |
investment |
allowance |
|||||||||
|
December 31, 2019 |
||||||||||||||
|
Commercial and industrial |
$ |
336 |
$ |
336 |
$ |
- |
$ |
336 |
$ |
221 | ||||
|
Commercial real estate: |
||||||||||||||
|
Non-owner occupied |
1,047 | 333 | 591 | 924 | 232 | |||||||||
|
Owner occupied |
2,336 | 1,052 | 972 | 2,024 | 194 | |||||||||
|
Consumer: |
||||||||||||||
|
Home equity installment |
106 |
- |
65 | 65 |
- |
|||||||||
|
Home equity line of credit |
362 | 88 | 206 | 294 | 87 | |||||||||
|
Auto loans |
32 |
- |
16 | 16 |
- |
|||||||||
|
Residential: |
- |
|||||||||||||
|
Real estate |
1,053 | 678 | 328 | 1,006 | 174 | |||||||||
|
Total |
$ |
5,272 |
$ |
2,487 |
$ |
2,178 |
$ |
4,665 |
$ |
908 | ||||
72
|
|
||||||||||||||
|
|
Recorded |
Recorded |
||||||||||||
|
|
Unpaid |
investment |
investment |
Total |
||||||||||
|
|
principal |
with |
with no |
recorded |
Related |
|||||||||
|
(dollars in thousands) |
balance |
allowance |
allowance |
investment |
allowance |
|||||||||
|
December 31, 2018 |
||||||||||||||
|
Commercial and industrial |
$ |
251 |
$ |
156 |
$ |
24 |
$ |
180 |
$ |
41 | ||||
|
Commercial real estate: |
||||||||||||||
|
Non-owner occupied |
1,176 | 715 | 269 | 984 | 36 | |||||||||
|
Owner occupied |
3,266 | 1,473 | 1,455 | 2,928 | 559 | |||||||||
|
Consumer: |
||||||||||||||
|
Home equity installment |
496 | 414 | 49 | 463 | 356 | |||||||||
|
Home equity line of credit |
74 | 33 | 1 | 34 | 16 | |||||||||
|
Auto loans |
31 | 17 | 8 | 25 | 10 | |||||||||
|
Residential: |
||||||||||||||
|
Real estate |
2,091 | 29 | 1,485 | 1,514 | 2 | |||||||||
|
Total |
$ |
7,385 |
$ |
2,837 |
$ |
3,291 |
$ |
6,128 |
$ |
1,020 | ||||
The following table presents the average recorded investments in impaired loans and related amount of interest income recognized during the periods indicated below. The average balances are calculated based on the quarter-end balances of impaired loans. Payments received from non-accruing impaired loans are first applied against the outstanding principal balance, then to the recovery of any charged-off amounts. Any excess is treated as a recovery of interest income. Payments received from accruing impaired loans are applied to principal and interest, as contractually agreed upon.
|
|
|||||||||||||||||
|
|
December 31, 2019 |
December 31, 2018 |
|||||||||||||||
|
|
Cash basis |
Cash basis |
|||||||||||||||
|
|
Average |
Interest |
interest |
Average |
Interest |
interest |
|||||||||||
|
|
recorded |
income |
income |
recorded |
income |
income |
|||||||||||
|
(dollars in thousands) |
investment |
recognized |
recognized |
investment |
recognized |
recognized |
|||||||||||
|
|
|||||||||||||||||
|
Commercial and industrial |
$ |
226 |
$ |
1 |
$ |
- |
$ |
192 |
$ |
2 |
$ |
- |
|||||
|
Commercial real estate: |
|||||||||||||||||
|
Non-owner occupied |
914 | 185 |
- |
1,976 | 98 |
- |
|||||||||||
|
Owner occupied |
2,504 | 40 |
- |
2,578 | 77 |
- |
|||||||||||
|
Construction |
- |
- |
- |
107 | 205 |
- |
|||||||||||
|
Consumer: |
|||||||||||||||||
|
Home equity installment |
129 | 2 |
- |
373 | 5 |
- |
|||||||||||
|
Home equity line of credit |
184 |
- |
- |
140 | 10 |
- |
|||||||||||
|
Auto Loans |
39 |
- |
- |
31 | 3 |
- |
|||||||||||
|
Other |
- |
- |
- |
4 |
- |
- |
|||||||||||
|
Residential: |
|||||||||||||||||
|
Real estate |
1,212 | 19 |
- |
1,322 | 37 |
- |
|||||||||||
|
Total |
$ |
5,208 |
$ |
247 |
$ |
- |
$ |
6,723 |
$ |
437 |
$ |
- |
|||||
|
|
|||||||||||||||||
The average recorded investment for the year ended December 31, 2017 was $9.3 million. There was also interest income recognized of $482 thousand and cash basis interest income recognized of $0.
Credit Quality Indicators
Commercial and industrial and commercial real estate
The Company utilizes a loan grading system and assigns a credit risk grade to its loans in the C&I and CRE portfolios. The grading system provides a means to measure portfolio quality and aids in the monitoring of the credit quality of the overall loan portfolio. The credit risk grades are arrived at using a risk rating matrix to assign a grade to each of the loans in the C&I and CRE portfolios.
The following is a description of each risk rating category the Company uses to classify each of its C&I and CRE loans:
Pass
Loans in this category have an acceptable level of risk and are graded in a range of one to five. Secured loans generally have good collateral coverage. Current financial statements reflect acceptable balance sheet ratios, sales and earnings trends. Management is considered to be competent, and a reasonable succession plan is evident. Payment experience on the loans
73
has been good with minor or no delinquency experience. Loans with a grade of one are of the highest quality in the range. Those graded five are of marginally acceptable quality.
Special Mention
Loans in this category are graded a six and may be protected but are potentially weak. They constitute a credit risk to the Company, but have not yet reached the point of adverse classification. Some of the following conditions may exist: little or no collateral coverage; lack of current financial information; delinquency problems; highly leveraged; available financial information reflects poor balance sheet ratios and profit and loss statements reflect uncertain trends; and document exceptions. Cash flow may not be sufficient to support total debt service requirements.
Substandard
Loans in this category are graded a seven and have a well-defined weakness which may jeopardize the ultimate collectability of the debt. The collateral pledged may be lacking in quality or quantity. Financial statements may indicate insufficient cash flow to service the debt; and/or do not reflect a sound net worth. The payment history indicates chronic delinquency problems. Management is considered to be weak. There is a distinct possibility that the Company may sustain a loss. All loans on non-accrual are rated substandard. Other loans that are included in the substandard category can be accruing, as well as loans that are current or past due. Loans 90 days or more past due, unless otherwise fully supported, are classified substandard. Also, borrowers that are bankrupt or have loans categorized as TDRs can be graded substandard.
Doubtful
Loans in this category are graded an eight and have a better than 50% possibility of the Company sustaining a loss, but the loss cannot be determined because of specific reasonable factors which may strengthen credit in the near-term. Many of the weaknesses present in a substandard loan exist. Liquidation of collateral, if any, is likely. Any loan graded lower than an eight is considered to be uncollectible and charged-off.
Consumer and residential
The consumer and residential loan segments are regarded as homogeneous loan pools and as such are not risk rated. For these portfolios, the Company utilizes payment activity and history in assessing performance. Non-performing loans are comprised of non-accrual loans and loans past due 90 days or more and accruing. All loans not classified as non-performing are considered performing.
The following table presents loans including $3.0 million and $2.6 million of deferred costs, segregated by class, categorized into the appropriate credit quality indicator category as of December 31, 2019 and 2018, respectively:
Commercial credit exposure
Credit risk profile by creditworthiness category
|
|
||||||||||||||
|
|
||||||||||||||
|
|
December 31, 2019 |
|||||||||||||
|
(dollars in thousands) |
Pass |
Special mention |
Substandard |
Doubtful |
Total |
|||||||||
|
|
||||||||||||||
|
Commercial and industrial |
$ |
115,585 |
$ |
2,061 |
$ |
4,948 |
$ |
- |
$ |
122,594 | ||||
|
Commercial real estate - non-owner occupied |
92,016 | 1,360 | 6,425 |
- |
99,801 | |||||||||
|
Commercial real estate - owner occupied |
121,887 | 2,065 | 6,606 |
- |
130,558 | |||||||||
|
Commercial real estate - construction |
3,687 | 17 | 950 |
- |
4,654 | |||||||||
|
Total commercial |
$ |
333,175 |
$ |
5,503 |
$ |
18,929 |
$ |
- |
$ |
357,607 | ||||
Consumer & Mortgage lending credit exposure
Credit risk profile based on payment activity
|
|
||||||||||||||
|
|
December 31, 2019 |
|||||||||||||
|
(dollars in thousands) |
Performing |
Non-performing |
Total |
|||||||||||
|
|
||||||||||||||
|
Consumer |
||||||||||||||
|
Home equity installment |
$ |
36,566 |
$ |
65 |
$ |
36,631 | ||||||||
|
Home equity line of credit |
46,988 | 294 | 47,282 | |||||||||||
|
Auto loans |
105,854 | 16 | 105,870 | |||||||||||
|
Direct finance leases (1) |
15,452 |
- |
15,452 | |||||||||||
|
Other |
5,634 |
- |
5,634 | |||||||||||
|
Total consumer |
210,494 | 375 | 210,869 | |||||||||||
|
Residential |
||||||||||||||
|
Real estate |
166,158 | 1,006 | 167,164 | |||||||||||
|
Construction |
17,770 |
- |
17,770 | |||||||||||
|
Total residential |
183,928 | 1,006 | 184,934 | |||||||||||
|
Total consumer & residential |
$ |
394,422 |
$ |
1,381 |
$ |
395,803 | ||||||||
(1)Net of unearned lease revenue of $0.9 million.
74
Commercial credit exposure
Credit risk profile by creditworthiness category
|
|
December 31, 2018 |
|||||||||||||
|
(dollars in thousands) |
Pass |
Special mention |
Substandard |
Doubtful |
Total |
|||||||||
|
|
||||||||||||||
|
Commercial and industrial |
$ |
125,272 |
$ |
334 |
$ |
1,278 |
$ |
- |
$ |
126,884 | ||||
|
Commercial real estate - non-owner occupied |
90,373 | 938 | 4,204 |
- |
95,515 | |||||||||
|
Commercial real estate - owner occupied |
116,577 | 1,685 | 5,830 |
- |
124,092 | |||||||||
|
Commercial real estate - construction |
6,761 |
- |
- |
- |
6,761 | |||||||||
|
Total commercial |
$ |
338,983 |
$ |
2,957 |
$ |
11,312 |
$ |
- |
$ |
353,252 | ||||
Consumer & Mortgage lending credit exposure
Credit risk profile based on payment activity
|
|
December 31, 2018 |
|||||||||||||
|
(dollars in thousands) |
Performing |
Non-performing |
Total |
|||||||||||
|
|
||||||||||||||
|
Consumer |
||||||||||||||
|
Home equity installment |
$ |
32,266 |
$ |
463 |
$ |
32,729 | ||||||||
|
Home equity line of credit |
52,483 | 34 | 52,517 | |||||||||||
|
Auto loans |
105,551 | 25 | 105,576 | |||||||||||
|
Direct finance leases (2) |
15,976 |
- |
15,976 | |||||||||||
|
Other |
6,313 | 1 | 6,314 | |||||||||||
|
Total consumer |
212,589 | 523 | 213,112 | |||||||||||
|
Residential |
||||||||||||||
|
Real estate |
144,437 | 1,514 | 145,951 | |||||||||||
|
Construction |
15,749 |
- |
15,749 | |||||||||||
|
Total residential |
160,186 | 1,514 | 161,700 | |||||||||||
|
Total consumer & residential |
$ |
372,775 |
$ |
2,037 |
$ |
374,812 | ||||||||
(2) Net of unearned lease revenue of $1.0 million.
Allowance for loan losses
Management continually evaluates the credit quality of the Company’s loan portfolio and performs a formal review of the adequacy of the allowance on a quarterly basis. The allowance reflects management’s best estimate of the amount of credit losses in the loan portfolio. Management’s judgment is based on the evaluation of individual loans, past experience, the assessment of current economic conditions and other relevant factors including the amounts and timing of cash flows expected to be received on impaired loans. Those estimates may be susceptible to significant change. Loan losses are charged directly against the allowance when loans are deemed to be uncollectible. Recoveries from previously charged-off loans are added to the allowance when received.
Management applies two primary components during the loan review process to determine proper allowance levels. The two components are a specific loan loss allocation for loans that are deemed impaired and a general loan loss allocation for those loans not specifically allocated. The methodology to analyze the adequacy of the allowance for loan losses is as follows:
|
§ |
identification of specific impaired loans by loan category; |
|
§ |
identification of specific loans that are not impaired, but have an identified potential for loss; |
|
§ |
calculation of specific allowances where required for the impaired loans based on collateral and other objective and quantifiable evidence; |
|
§ |
determination of loans with similar credit characteristics within each class of the loan portfolio segment and eliminating the impaired loans; |
|
§ |
application of historical loss percentages (trailing twelve-quarter average) to pools to determine the allowance allocation; |
|
§ |
application of qualitative factor adjustment percentages to historical losses for trends or changes in the loan portfolio. |
|
§ |
Qualitative factor adjustments include: |
|
o |
levels of and trends in delinquencies and non-accrual loans; |
|
o |
levels of and trends in charge-offs and recoveries; |
|
o |
trends in volume and terms of loans; |
|
o |
changes in risk selection and underwriting standards; |
|
o |
changes in lending policies and legal and regulatory requirements; |
|
o |
experience, ability and depth of lending management; |
|
o |
national and local economic trends and conditions; and |
|
o |
changes in credit concentrations. |
Allocation of the allowance for different categories of loans is based on the methodology as explained above. A key element of the methodology to determine the allowance is the Company’s credit risk evaluation process, which includes credit risk
75
grading of individual C&I and CRE loans. C&I and CRE loans are assigned credit risk grades based on the Company’s assessment of conditions that affect the borrower’s ability to meet its contractual obligations under the loan agreement. That process includes reviewing borrowers’ current financial information, historical payment experience, credit documentation, public information and other information specific to each individual borrower. Upon review, the commercial loan credit risk grade is revised or reaffirmed as the case may be. The credit risk grades may be changed at any time management feels an upgrade or downgrade may be warranted. The credit risk grades for the C&I and CRE loan portfolios are taken into account in the reserve methodology and loss factors are applied based upon the credit risk grades. The loss factors applied are based upon the Company’s historical experience as well as what we believe to be best practices and common industry standards. Historical experience reveals there is a direct correlation between the credit risk grades and loan charge-offs. The changes in allocations in the C&I and CRE loan portfolio from period to period are based upon the credit risk grading system and from periodic reviews of the loan portfolio. An unallocated component is maintained to cover uncertainties that could affect management’s estimate of probable losses. The unallocated component of the allowance reflects the margin of imprecision inherent in the underlying assumptions used in the methodologies.
Each quarter, management performs an assessment of the allowance. The Company’s Special Assets Committee meets quarterly and the applicable lenders discuss each relationship under review and reach a consensus on the appropriate estimated loss amount, if applicable, based on current accounting guidance. The Special Assets Committee’s focus is on ensuring the pertinent facts are considered regarding not only loans considered for specific reserves, but also the collectability of loans that may be past due in payment. The assessment process also includes the review of all loans on a non-accruing basis as well as a review of certain loans to which the lenders or the Company’s Credit Administration function have assigned a criticized or classified risk rating.
The Company’s policy is to charge-off unsecured consumer loans when they become 90 days or more past due as to principal and interest. In the other portfolio segments, amounts are charged-off at the point in time when the Company deems the balance, or a portion thereof, to be uncollectible.
Information related to the change in the allowance for loan losses and the Company’s recorded investment in loans by portfolio segment as of the period indicated is as follows:
|
|
|||||||||||||||||
|
As of and for the year ended December 31, 2019 |
|||||||||||||||||
|
|
Commercial & |
Commercial |
Residential |
||||||||||||||
|
(dollars in thousands) |
industrial |
real estate |
Consumer |
real estate |
Unallocated |
Total |
|||||||||||
|
Allowance for Loan Losses: |
|||||||||||||||||
|
Beginning balance |
$ |
1,432 |
$ |
3,901 |
$ |
2,548 |
$ |
1,844 |
$ |
22 |
$ |
9,747 | |||||
|
Charge-offs |
(184) | (597) | (398) | (330) |
- |
(1,509) | |||||||||||
|
Recoveries |
32 | 317 | 67 | 8 |
- |
424 | |||||||||||
|
Provision |
204 | 312 | (204) | 756 | 17 | 1,085 | |||||||||||
|
Ending balance |
$ |
1,484 |
$ |
3,933 |
$ |
2,013 |
$ |
2,278 |
$ |
39 |
$ |
9,747 | |||||
|
Ending balance: individually evaluated for impairment |
$ |
221 |
$ |
426 |
$ |
87 |
$ |
174 |
$ |
- |
$ |
908 | |||||
|
Ending balance: collectively evaluated for impairment |
$ |
1,263 |
$ |
3,507 |
$ |
1,926 |
$ |
2,104 |
$ |
39 |
$ |
8,839 | |||||
|
Loans Receivables: |
|||||||||||||||||
|
Ending balance (2) |
$ |
122,594 |
$ |
235,013 |
$ |
210,869 |
(1) |
$ |
184,934 |
$ |
- |
$ |
753,410 | ||||
|
Ending balance: individually evaluated for impairment |
$ |
336 |
$ |
2,948 |
$ |
375 |
$ |
1,006 |
$ |
- |
$ |
4,665 | |||||
|
Ending balance: collectively evaluated for impairment |
$ |
122,258 |
$ |
232,065 |
$ |
210,494 |
$ |
183,928 |
$ |
- |
$ |
748,745 | |||||
(1) Net of unearned lease revenue of $0.9 million. (2) Includes $3.0 million of net deferred loan costs.
76
|
|
|||||||||||||||||
|
As of and for the year ended December 31, 2018 |
|||||||||||||||||
|
|
Commercial & |
Commercial |
Residential |
||||||||||||||
|
(dollars in thousands) |
industrial |
real estate |
Consumer |
real estate |
Unallocated |
Total |
|||||||||||
|
Allowance for Loan Losses: |
|||||||||||||||||
|
Beginning balance |
$ |
1,374 |
$ |
4,060 |
$ |
2,063 |
$ |
1,608 |
$ |
88 |
$ |
9,193 | |||||
|
Charge-offs |
(196) | (268) | (391) | (371) |
- |
(1,226) | |||||||||||
|
Recoveries |
77 | 42 | 211 |
- |
- |
330 | |||||||||||
|
Provision |
177 | 67 | 665 | 607 | (66) | 1,450 | |||||||||||
|
Ending balance |
$ |
1,432 |
$ |
3,901 |
$ |
2,548 |
$ |
1,844 |
$ |
22 |
$ |
9,747 | |||||
|
Ending balance: individually evaluated for impairment |
$ |
41 |
$ |
595 |
$ |
382 |
$ |
2 |
$ |
- |
$ |
1,020 | |||||
|
Ending balance: collectively evaluated for impairment |
$ |
1,391 |
$ |
3,306 |
$ |
2,166 |
$ |
1,842 |
$ |
22 |
$ |
8,727 | |||||
|
Loans Receivables: |
|||||||||||||||||
|
Ending balance (2) |
$ |
126,884 |
$ |
226,368 |
$ |
213,112 |
(1) |
$ |
161,700 |
$ |
- |
$ |
728,064 | ||||
|
Ending balance: individually evaluated for impairment |
$ |
180 |
$ |
3,912 |
$ |
522 |
$ |
1,514 |
$ |
- |
$ |
6,128 | |||||
|
Ending balance: collectively evaluated for impairment |
$ |
126,704 |
$ |
222,456 |
$ |
212,590 |
$ |
160,186 |
$ |
- |
$ |
721,936 | |||||
(1) Net of unearned lease revenue of $1.0 million. (2) Includes $2.6 million of net deferred loan costs.
|
As of and for the year ended December 31, 2017 |
|||||||||||||||||
|
|
Commercial & |
Commercial |
Residential |
||||||||||||||
|
(dollars in thousands) |
industrial |
real estate |
Consumer |
real estate |
Unallocated |
Total |
|||||||||||
|
Allowance for Loan Losses: |
|||||||||||||||||
|
Beginning balance |
$ |
1,075 |
$ |
4,706 |
$ |
1,834 |
$ |
1,622 |
$ |
127 |
$ |
9,364 | |||||
|
Charge-offs |
(143) | (635) | (658) | (309) |
- |
(1,745) | |||||||||||
|
Recoveries |
10 | 47 | 67 |
- |
- |
124 | |||||||||||
|
Provision |
432 | (58) | 820 | 295 | (39) | 1,450 | |||||||||||
|
Ending balance |
$ |
1,374 |
$ |
4,060 |
$ |
2,063 |
$ |
1,608 |
$ |
88 |
$ |
9,193 | |||||
Direct finance leases
On January 1, 2019, the Company adopted ASU 2016-02, Leases (Topic 842), and subsequent related updates to revise the accounting for leases. Additionally, the Company early adopted ASU 2019-01, Codification Improvements, as of January 1, 2019. See Footnote 19, “Recent accounting pronouncements,” for additional information about adoption of these standards. Lessor accounting was largely unchanged as a result of the standard. Upon adoption of the standard, the lease residual was reclassified from other assets to direct finance leases within loans and leases in the current period and all comparative periods. Additional disclosures required under the standard are included in this section and in Footnote 24, “Leases”.
The Company originates direct finance leases through two automobile dealerships. The carrying amount of the Company’s lease receivables, net of unearned income, was $4.7 million and $4.9 million as of December 31, 2019 and 2018, respectively. The residual value of the direct finance leases is fully guaranteed by the dealerships. Residual values amounted to $10.8 million and $11.1 million at December 31, 2019 and 2018, respectively, and are included in the carrying value of direct finance leases.
The undiscounted cash flows to be received on an annual basis for the direct finance leases are as follows:
|
|
||
|
(dollars in thousands) |
Amount |
|
|
|
||
|
2020 |
$ |
6,505 |
|
2021 |
5,072 | |
|
2022 |
3,379 | |
|
2023 |
1,299 | |
|
2024 |
100 | |
|
2025 and thereafter |
- |
|
|
Total future minimum lease payments receivable |
16,355 | |
|
Less: Unearned income |
(903) | |
|
Undiscounted cash flows to be received |
$ |
15,452 |
|
|
||
77
6.BANK PREMISES AND EQUIPMENT
Components of bank premises and equipment are summarized as follows:
|
|
As of December 31, |
||||
|
(dollars in thousands) |
2019 |
2018 |
|||
|
|
|||||
|
Land |
$ |
2,865 |
$ |
2,865 | |
|
Bank premises |
14,123 | 13,902 | |||
|
Furniture, fixtures and equipment |
12,523 | 11,075 | |||
|
Leasehold improvements |
9,372 | 7,263 | |||
|
Construction in process |
559 | 631 | |||
|
|
|||||
|
Total |
39,442 | 35,736 | |||
|
|
|||||
|
Less accumulated depreciation and amortization |
(17,885) | (16,816) | |||
|
|
|||||
|
Bank premises and equipment, net |
$ |
21,557 |
$ |
18,920 | |
Depreciation expense, which includes amortization of leasehold improvements, was $1.5 million, $1.3 million and $1.3 million for the years ended December 31, 2019, 2018 and 2017. The estimated useful life was 40 years for bank premises, 3 to 7 years for furniture and fixtures and for leasehold improvements was the term of the lease.
During the first quarter of 2014, the Company received through foreclosure the deed that secured the collateral for a non-owner occupied commercial real estate loan that was on non-accrual status. The loan, in the amount $1.0 million, was transferred from loans to foreclosed assets held-for-sale and then to bank premises. Currently the building has a tenant under a lease agreement expiring in 2021, but the Company expects to use the property for future facility expansion.
7.DEPOSITS
The scheduled maturities of certificates of deposit as of December 31, 2019 were as follows:
|
(dollars in thousands) |
Amount |
Percent |
|||
|
2020 |
$ |
86,159 | 74.1 |
% |
|
|
2021 |
18,026 | 15.5 | |||
|
2022 |
7,368 | 6.3 | |||
|
2023 |
1,145 | 1.0 | |||
|
2024 |
2,401 | 2.1 | |||
|
2025 and thereafter |
1,112 | 1.0 | |||
|
|
|||||
|
Total |
$ |
116,211 | 100.0 |
% |
|
Certificates of deposit of $100,000 or more aggregated $70.7 million and $66.9 million as of December 31, 2019 and 2018, respectively. Certificates of deposit of $250,000 or more aggregated $44.5 million and $38.4 million at December 31, 2019 and 2018, respectively.
As of December 31, 2019, investment securities with a combined fair value of $185.1 million and letters of credit with a notional value of $32.3 million were available to be pledged as qualifying collateral to secure public deposits and trust funds. The Company required $99.7 million of the qualifying collateral to secure such deposits as of December 31, 2019 and the balance of $117.7 million was available for other pledging needs.
8.SHORT-TERM BORROWINGS
The components of short-term borrowings are summarized as follows:
|
|
As of December 31, |
||||
|
(dollars in thousands) |
2019 |
2018 |
|||
|
|
|||||
|
Overnight borrowings |
$ |
37,839 |
$ |
76,366 | |
|
|
|||||
78
The maximum and average amounts of short-term borrowings outstanding and related interest rates as of the periods indicated are as follows:
|
|
Maximum |
Weighted- |
||||||||
|
|
outstanding |
average |
||||||||
|
|
at any |
Average |
rate during |
Rate at |
||||||
|
(dollars in thousands) |
month end |
outstanding |
the year |
year-end |
||||||
|
December 31, 2019 |
||||||||||
|
Overnight borrowings |
$ |
58,747 |
$ |
35,243 | 2.49 |
% |
1.81 |
% |
||
|
|
||||||||||
|
Total |
$ |
58,747 |
$ |
35,243 | ||||||
|
|
||||||||||
|
December 31, 2018 |
||||||||||
|
Overnight borrowings |
$ |
76,366 |
$ |
27,893 | 2.38 |
% |
2.62 |
% |
||
|
Repurchase agreements |
22,202 | 9,666 | 0.16 |
- |
||||||
|
|
||||||||||
|
Total |
$ |
98,568 |
$ |
37,559 | ||||||
|
|
||||||||||
|
December 31, 2017 |
||||||||||
|
Overnight borrowings |
$ |
46,737 |
$ |
18,399 | 1.09 |
% |
1.56 |
% |
||
|
Repurchase agreements |
17,179 | 10,274 | 0.20 | 0.18 | ||||||
|
Total |
$ |
63,916 |
$ |
28,673 | ||||||
Overnight borrowings may include Fed funds purchased from correspondent banks, open repurchase agreements with the FHLB and borrowings at the Discount Window from the Federal Reserve Bank of Philadelphia (FRB). Securities sold under agreements to repurchase, or repurchase agreements, are non-insured interest-bearing liabilities that have a perfected security interest in qualified investment securities of the Company. Repurchase agreements are reflected at the amount of cash received in connection with the transaction. The carrying value of the underlying qualified investment securities was approximately $12.2 million at December 31, 2017. During the fourth quarter of 2018, the Company transferred all of the repurchase agreement accounts to interest-bearing checking accounts.
FHLB borrowings are collateralized by a blanket lien on all commercial and residential real estate loans. At December 31, 2019, the Company had approximately $202.8 million available to borrow from the FHLB, $21.0 million from correspondent banks and approximately $94.3 million that it could borrow at the FRB.
9.FHLB ADVANCES
During the third quarter of 2018, the Company utilized $15.0 million in borrowings with the FHLB to purchase securities matching a spread expected to produce a suitable after-tax return.
The maturity and weighted-average interest rate of FHLB advances as of the periods indicated is as follows:
|
|
As of December 31, 2019 |
||||
|
(dollars in thousands) |
Amount |
Rate |
|||
|
|
|||||
|
2020 |
$ |
- |
- |
% |
|
|
2021 |
5,000 | 2.95 | |||
|
2022 |
5,000 | 2.99 | |||
|
2023 |
5,000 | 3.07 | |||
|
2024 |
- |
- |
|||
|
Total |
$ |
15,000 | 3.01 |
% |
|
|
|
|||||
10.STOCK PLANS
The Company has two stock-based compensation plans (the stock compensation plans) from which it can grant stock-based compensation awards and applies the fair value method of accounting for stock-based compensation provided under current accounting guidance. The guidelines require the cost of share-based payment transactions (including those with employees and non-employees) be recognized in the financial statements. The Company’s stock compensation plans were shareholder-approved and permit the grant of share-based compensation awards to its employees and directors. The Company believes that the stock-based compensation plans will advance the development, growth and financial condition of the Company by providing incentives through participation in the appreciation in the value of the Company’s common stock. In return, the Company hopes to secure, retain and motivate the employees and directors who are responsible for the operation and the management of the affairs of the Company by aligning the interest of its employees and directors with the interest of its shareholders. In the stock compensation plans, employees and directors are eligible to be awarded stock-based compensation
79
grants which can consist of stock options (qualified and non-qualified), stock appreciation rights (SARs) and restricted stock.
At the 2012 annual shareholders’ meeting, the Company’s shareholders approved and the Company adopted the 2012 Omnibus Stock Incentive Plan and the 2012 Director Stock Incentive Plan (collectively, the 2012 stock incentive plans). The 2012 stock incentive plans replaced both the expired 2000 Independent Directors Stock Option Plan and the 2000 Stock Incentive Plan (collectively, the 2000 stock incentive plans). Unless terminated by the Company’s board of directors, the 2012 stock incentive plans will expire on and no stock-based awards shall be granted after the year 2022.
In each of the 2012 stock incentive plans, the Company has reserved 750,000 shares of its no-par common stock for future issuance. The Company recognizes share-based compensation expense over the requisite service or vesting period. During 2015, the Company created a Long-Term Incentive Plan (LTIP) that awarded restricted stock and stock-settled stock appreciation rights (SSARs) to senior officers based on the attainment of performance goals. The service requirement is the participant’s continued employment throughout the LTIP with a three-year vesting period. The restricted stock has a two-year post vesting holding period requirement. The SSAR awards have a ten-year term from the date of each grant. The Company granted restricted stock and SSARs in February 2016 based on 2015 performance, in February 2017 based on 2016 performance and in February 2018 based on 2017 performance and 2015-2017 3-year cumulative performance. During the first quarter of 2019, the Company approved a 1 year LTIP and awarded restricted stock and SSARs to senior officers and managers in February 2019 based on 2018 performance.
The following table summarizes the weighted-average fair value and vesting of restricted stock grants awarded during 2019, 2018 and 2017 under the 2012 stock incentive plans:
|
|
||||||||||||||
|
|
2019 |
2018 |
2017 |
|||||||||||
|
|
Weighted- |
Weighted- |
Weighted- |
|||||||||||
|
|
average |
average |
average |
|||||||||||
|
|
Shares |
grant date |
Shares |
grant date |
Shares |
grant date |
||||||||
|
|
granted |
fair value |
granted |
fair value |
granted |
fair value |
||||||||
|
|
||||||||||||||
|
Director plan |
5,600 |
(3) |
$ |
54.69 | 8,400 |
(3) |
$ |
49.50 | 8,400 |
(2) |
$ |
26.17 | ||
|
Omnibus plan |
7,251 |
(3) |
54.69 | 10,800 |
(3) |
45.83 | 4,749 |
(3) |
23.93 | |||||
|
Omnibus plan |
50 |
(1) |
58.08 | 50 |
(1) |
49.50 | 75 |
(1) |
26.17 | |||||
|
Total |
12,901 |
$ |
54.70 | 19,250 |
$ |
47.44 | 13,224 |
$ |
25.36 | |||||
|
(1) |
Vest after 1 year (2) Vest over 2 years –50% each year (3) Vest over 3 years – 33% each year |
The fair value of the 5,600 and 7,251 shares granted on February 5, 2019 was calculated using the grant date stock price with a discount valuation. The Chaffe model was used to calculate the discount. Since the shares vest over three years and then have a further two-year holding period, the historical volatility of the five years prior to the issue date was used to estimate volatility. The five-year treasury yield was used as the interest rate. The Company does pay a dividend, but since the shareholder will receive the dividends during vesting and the post-vest restriction period, no dividend yield was used in the calculation as not to inflate the discount. The grant date stock price was $59.70 and the discount of 8.393% was calculated using an interest rate of 2.494% and a 5-year historical volatility of 19.411%.
A summary of the status of the Company’s non-vested restricted stock as of and changes during the period indicated are presented in the following table:
|
|
||||||||
|
|
2012 Stock incentive plans |
|||||||
|
|
Director |
Omnibus |
Total |
Weighted- average grant date fair value |
||||
|
Non-vested balance at December 31, 2016 |
8,400 | 13,562 | 21,962 |
$ |
20.31 | |||
|
Granted |
8,400 | 4,824 | 13,224 | 25.36 | ||||
|
Forfeited |
- |
- |
- |
|||||
|
Vested |
(8,400) | (6,082) | (14,482) | 20.47 | ||||
|
Non-vested balance at December 31, 2017 |
8,400 | 12,304 | 20,704 |
$ |
23.59 | |||
|
Granted |
8,400 | 10,850 | 19,250 | 47.44 | ||||
|
Forfeited |
- |
- |
- |
|||||
|
Vested |
(4,200) | (5,794) | (9,994) | 23.69 | ||||
|
Non-vested balance at December 31, 2018 |
12,600 | 17,360 | 29,960 |
$ |
38.99 | |||
|
Granted |
5,600 | 7,301 | 12,901 | 54.70 | ||||
|
Forfeited |
- |
(126) | (126) | 54.69 | ||||
|
Vested |
(7,000) | (8,574) | (15,574) | 33.81 | ||||
|
Non-vested balance at December 31, 2019 |
11,200 | 15,961 | 27,161 |
$ |
49.48 | |||
80
|
|
The Company granted 11,073 SSARs under the Omnibus Plan on February 5, 2019. The Company estimated the fair value of SSARs using the Black-Scholes-Merton valuation model on the grant date. The Company used the following assumptions: the risk-free interest rate is the rate equivalent to the expected term of the option interpolated from the U.S. Treasury Yield Curve on the valuation date and historical volatility is calculated by taking the standard deviation of historical returns using weekly and monthly data. The fair value of these SSARs was $16.79 per share, based on a risk-free interest rate of 2.692%, a dividend yield of 1.628% and a volatility of 23.732% using an expected term of ten years.
A summary of the status of the Company’s SSARs as of and changes during the period indicated are presented in the following table:
|
|
|||||||
|
|
Awards |
Weighted-average grant date fair value |
Weighted-average remaining contractual term (years) |
||||
|
Outstanding December 31, 2016 |
29,014 |
$ |
3.48 | 9.1 | |||
|
Granted |
24,346 | 5.06 | 10.0 | ||||
|
Exercised |
- |
- |
|||||
|
Forfeited |
- |
- |
|||||
|
Outstanding December 31, 2017 |
53,360 |
$ |
4.20 | 8.5 | |||
|
Granted |
38,941 | 13.73 | 10.0 | ||||
|
Exercised |
(3,051) | 4.03 | |||||
|
Forfeited |
- |
- |
|||||
|
Outstanding December 31, 2018 |
89,250 |
$ |
8.36 | 8.2 | |||
|
Granted |
11,073 | 16.79 | 10.0 | ||||
|
Exercised |
(3,059) | 3.48 | |||||
|
Forfeited |
- |
- |
|||||
|
Outstanding December 31, 2019 |
97,264 |
$ |
9.47 | 7.5 | |||
|
|
Of the SSARs outstanding at December 31, 2019, 52,112 vested and were exercisable. SSARs vest over a three year period – 33% per year.
During 2019, there were 3,059 SSARs exercised. The intrinsic value recorded for these SSARs was $10,631. The tax deduction realized from the exercise of these SSARs was $108,134 resulting in a tax benefit of $22,708. During 2018, there were 3,051 SSARs exercised. The intrinsic value recorded for these SSARs was $12,288. The tax deduction realized from the exercise of these SSARs was $122,969 resulting in a tax benefit of $25,823.
Share-based compensation expense is included as a component of salaries and employee benefits in the consolidated statements of income. The following tables illustrate stock-based compensation expense recognized on non-vested equity awards during the years ended December 31, 2019, 2018 and 2017 and the unrecognized stock-based compensation expense as of December 31, 2019:
|
|
||||||||
|
|
||||||||
|
(dollars in thousands) |
2019 |
2018 |
2017 |
|||||
|
Stock-based compensation expense: |
||||||||
|
Director stock incentive plan |
$ |
240 |
$ |
237 |
$ |
116 | ||
|
Omnibus stock incentive plan |
611 | 500 | 194 | |||||
|
Employee stock purchase plan |
107 | 143 | 23 | |||||
|
Total stock-based compensation expense |
$ |
958 |
$ |
880 |
$ |
333 | ||
In addition, during 2019, 2018 and 2017 the Company reversed accruals of ($0.1 million), ($0.1 million) and accrued $0.2 million in stock-based compensation expense for restricted stock and SSARs to be awarded under the Omnibus Plan.
|
|
As of |
|
|
(dollars in thousands) |
December 31, 2019 |
|
|
Unrecognized stock-based compensation expense: |
||
|
Director plan |
$ |
364 |
|
Omnibus plan |
781 | |
|
Total unrecognized stock-based compensation expense |
$ |
1,145 |
The unrecognized stock-based compensation expense as of December 31, 2019 will be recognized ratably over the periods ended January 2022 and January 2022 for the Director Plan and the Omnibus Plan, respectively.
81
Transactions under the Company’s stock option plans as of and changes during the periods indicated are presented in the following table:
|
|
|||||||
|
|
Options |
Weighted-average exercise price |
Weighted-average remaining contractual term (years) |
||||
|
Outstanding and exercisable, December 31, 2016 |
22,500 |
$ |
19.12 | 1.0 | |||
|
Granted |
- |
- |
|||||
|
Exercised |
(21,750) | 19.14 | |||||
|
Forfeited |
- |
- |
|||||
|
Outstanding and exercisable, December 31, 2017 |
750 |
$ |
18.50 | 0.2 | |||
|
Granted |
- |
- |
|||||
|
Exercised |
(750) | 18.50 | |||||
|
Forfeited |
- |
- |
|||||
|
Outstanding and exercisable, December 31, 2018 |
- |
$ |
- |
- |
|||
|
|
During the first quarter of 2018, there were 750 stock options exercised at a price of $18.50 per share. The intrinsic value of these stock options was $2,585. The tax deduction realized from the exercise of these options was $22,875 resulting in a tax benefit of $4,804. During 2017, there were 21,750 stock options exercised at a price of $19.14 per share. The intrinsic value of these stock options was $79,715. The tax deduction realized from the exercise of these options was $363,392 resulting in a tax benefit of $123,553. As of December 31, 2019, there were no stock options outstanding.
In addition to the 2012 stock incentive plans, the Company established the 2002 Employee Stock Purchase Plan (the ESPP) and reserved 165,000 shares of its un-issued capital stock for issuance under the plan. The ESPP was designed to promote broad-based employee ownership of the Company’s stock and to motivate employees to improve job performance and enhance the financial results of the Company. Under the ESPP, participation is voluntary whereby employees use automatic payroll withholdings to purchase the Company’s capital stock at a discounted price based on the fair market value of the capital stock as measured on either the commencement or termination dates, as defined. As of December 31, 2019, 81,019 shares have been issued under the ESPP. The ESPP is considered a compensatory plan and is required to comply with the provisions of current accounting guidance. The Company recognizes compensation expense on its ESPP on the date the shares are purchased, and it is included as a component of salaries and employee benefits in the consolidated statements of income.
The Company also established the dividend reinvestment plan (the DRP) for its shareholders. The DRP is designed to avail the Company’s stock at no transactional cost to its shareholders. Cash dividends paid to shareholders who are enrolled in the DRP plus voluntary cash deposits received can be used to purchase shares, directly from the Company, from shares that become available in the open market or in negotiated transactions with third parties. The Company has reserved 750,000 shares of its un-issued capital stock for issuance under the DRP. As of December 31, 2019, there were 591,730 shares available for future issuance.
11.INCOME TAXES
Pursuant to the accounting guidelines related to income taxes, the Company has evaluated its material tax positions as of December 31, 2019 and 2018. Under the “more-likely-than-not” threshold guidelines, the Company believes no significant uncertain tax positions exist, either individually or in the aggregate, that would give rise to the non-recognition of an existing tax benefit. In periods subsequent to December 31, 2019, determinations of potentially adverse material tax positions will be evaluated to determine whether an uncertain tax position may have previously existed or has been originated. In the event an adverse tax position is determined to exist, penalty and interest will be accrued, in accordance with the Internal Revenue Service (IRS) guidelines, and will be recorded as a component of other expenses in the Company’s consolidated statements of income.
As of December 31, 2019, there were no unrecognized tax benefits that, if recognized, would significantly affect the Company’s effective tax rate. Also, there were no penalties and interest recognized in the consolidated statements of income in 2019, 2018 and 2017 as a result of management’s evaluation of whether an uncertain tax position may exist nor does the Company foresee a change in its material tax positions that would give rise to the non-recognition of an existing tax benefit during the forthcoming twelve months. Tax returns filed with the IRS are subject to review by law under a three-year statute of limitations. The Company has not received notification from the IRS regarding adverse tax issues for the current year or from tax returns filed for tax years 2018, 2017 or 2016.
82
On December 22, 2017, the Tax Cuts and Jobs Act (the “Tax Act”) was signed into law. The bill reduced the Company’s federal corporate income tax rate from 34% to 21% effective January 1, 2018. An adjustment of $1.1 million was made in December 2017 to re-measure the net deferred tax liability at the new tax rate.
The following temporary differences gave rise to the net deferred tax liability, a component of other assets in the consolidated balance sheets, as of the periods indicated:
|
|
As of December 31, |
||||
|
(dollars in thousands) |
2019 |
2018 |
|||
|
Deferred tax assets: |
|||||
|
Allowance for loan losses |
$ |
2,047 |
$ |
2,047 | |
|
Net unrealized losses on available-for-sale securities |
- |
291 | |||
|
Deferred interest from non-accrual assets |
149 | 167 | |||
|
Operating lease liabilities |
1,377 |
- |
|||
|
Other |
556 | 697 | |||
|
Total |
4,129 | 3,202 | |||
|
|
|||||
|
Deferred tax liabilities: |
|||||
|
Net unrealized gains on available-for-sale securities |
(958) |
- |
|||
|
Loan fees and costs |
(1,248) | (1,151) | |||
|
Automobile leasing |
(3,463) | (3,393) | |||
|
Operating lease right-of-use assets |
(1,265) |
- |
|||
|
Depreciation |
(685) | (416) | |||
|
Mortgage loan servicing rights |
(211) | (241) | |||
|
Total |
(7,830) | (5,201) | |||
|
Deferred tax liability, net |
$ |
(3,701) |
$ |
(1,999) | |
The components of the total provision for income taxes for the years indicated are as follows:
|
|
Years ended December 31, |
|||||||
|
(dollars in thousands) |
2019 |
2018 |
2017 |
|||||
|
|
||||||||
|
Current |
$ |
1,985 |
$ |
1,110 |
$ |
1,872 | ||
|
Deferred |
341 | 1,019 | (666) | |||||
|
Total provision for income taxes |
$ |
2,326 |
$ |
2,129 |
$ |
1,206 | ||
The deferred tax liability at December 31, 2017 included a $1.1 million credit to the provision for income taxes for the effects of the Tax Cuts and Jobs Act.
The reconciliation between the expected statutory income tax and the actual provision for income taxes is as follows:
|
|
Years ended December 31, |
|||||||
|
|
||||||||
|
(dollars in thousands) |
2019 |
2018 |
2017 |
|||||
|
Expected provision at the statutory rate |
$ |
2,919 |
$ |
2,758 |
$ |
3,373 | ||
|
Tax-exempt income |
(592) | (567) | (845) | |||||
|
Bank owned life insurance |
(136) | (126) | (198) | |||||
|
Nondeductible interest expense |
37 | 18 | 19 | |||||
|
Nondeductible other expenses and other, net |
98 | 43 | (59) | |||||
|
Tax rate change adjustment |
- |
3 | (1,084) | |||||
|
Actual provision for income taxes |
$ |
2,326 |
$ |
2,129 |
$ |
1,206 | ||
12.RETIREMENT PLAN
The Company has a defined contribution profit sharing 401(k) plan covering substantially all of its employees. The plan is subject to the provisions of the Employee Retirement Income Security Act of 1974 (ERISA). Contributions to the plan approximated $0.5 million, $0.4 million and $0.4 million in 2019, 2018 and 2017.
13.FAIR VALUE MEASUREMENTS
The accounting guidelines establish a framework for measuring and disclosing information about fair value measurements. The guidelines of fair value reporting instituted a valuation hierarchy for disclosure of the inputs used to measure fair value. This hierarchy prioritizes the inputs into three broad levels as follows:
Level 1 - inputs are quoted prices (unadjusted) in active markets for identical assets or liabilities;
83
Level 2 - inputs are quoted prices for similar assets and liabilities in active markets; quoted prices for identical or similar assets or liabilities in markets that are not active; or inputs that are observable for the asset or liability, either directly or indirectly through market corroboration, for substantially the full term of the financial instrument;
Level 3 - inputs are unobservable and are based on the Company’s own assumptions to measure assets and liabilities at fair value. Level 3 pricing for securities may also include unobservable inputs based upon broker-traded transactions.
A financial asset or liability’s classification within the hierarchy is determined based on the lowest level input that is significant to the fair value measurement.
The Company uses fair value to measure certain assets and, if necessary, liabilities on a recurring basis when fair value is the primary measure for accounting. Thus, the Company uses fair value for AFS securities. Fair value is used on a non-recurring basis to measure certain assets when adjusting carrying values to market values, such as impaired loans, other real estate owned (ORE) and other repossessed assets.
The following table represents the carrying amount and estimated fair value of the Company’s financial instruments:
|
December 31, 2019 |
||||||||||||||
|
|
Quoted prices |
Significant |
Significant |
|||||||||||
|
|
in active |
other |
other |
|||||||||||
|
|
Carrying |
Estimated |
markets |
observable inputs |
unobservable inputs |
|||||||||
|
(dollars in thousands) |
amount |
fair value |
(Level 1) |
(Level 2) |
(Level 3) |
|||||||||
|
|
||||||||||||||
|
Financial assets: |
||||||||||||||
|
Cash and cash equivalents |
$ |
15,663 |
$ |
15,663 |
$ |
15,663 |
$ |
- |
$ |
- |
||||
|
Available-for-sale debt securities |
185,117 | 185,117 |
- |
185,117 |
- |
|||||||||
|
FHLB stock |
4,383 | 4,383 |
- |
4,383 |
- |
|||||||||
|
Loans and leases, net |
743,663 | 735,657 |
- |
- |
735,657 | |||||||||
|
Loans held-for-sale |
1,643 | 1,660 |
- |
1,660 |
- |
|||||||||
|
Accrued interest receivable |
3,281 | 3,281 |
- |
3,281 |
- |
|||||||||
|
Financial liabilities: |
||||||||||||||
|
Deposits with no stated maturities |
719,526 | 719,526 |
- |
719,526 |
- |
|||||||||
|
Time deposits |
116,211 | 115,993 |
- |
115,993 |
- |
|||||||||
|
Short-term borrowings |
37,839 | 37,839 |
- |
37,839 |
- |
|||||||||
|
FHLB advances |
15,000 | 15,430 |
- |
15,430 |
- |
|||||||||
|
Accrued interest payable |
644 | 644 |
- |
644 |
- |
|||||||||
|
|
||||||||||||||
|
|
||||||||||||||
|
December 31, 2018 |
||||||||||||||
|
|
Quoted prices |
Significant |
Significant |
|||||||||||
|
|
in active |
other |
other |
|||||||||||
|
|
Carrying |
Estimated |
markets |
observable inputs |
unobservable inputs |
|||||||||
|
(dollars in thousands) |
amount |
fair value |
(Level 1) |
(Level 2) |
(Level 3) |
|||||||||
|
|
||||||||||||||
|
Financial assets: |
||||||||||||||
|
Cash and cash equivalents |
$ |
17,485 |
$ |
17,485 |
$ |
17,485 |
$ |
- |
$ |
- |
||||
|
Available-for-sale debt securities |
182,810 | 182,810 |
- |
182,810 |
- |
|||||||||
|
FHLB stock |
6,339 | 6,339 |
- |
6,339 |
- |
|||||||||
|
Loans and leases, net |
718,317 | 697,729 |
- |
- |
697,729 | |||||||||
|
Loans held-for-sale |
5,707 | 5,789 |
- |
5,789 |
- |
|||||||||
|
Accrued interest receivable |
3,271 | 3,271 |
- |
3,271 |
- |
|||||||||
|
Financial liabilities: |
||||||||||||||
|
Deposits with no stated maturities |
653,897 | 653,897 |
- |
653,897 |
- |
|||||||||
|
Time deposits |
116,286 | 114,876 |
- |
114,876 |
- |
|||||||||
|
Short-term borrowings |
76,366 | 76,366 |
- |
76,366 |
- |
|||||||||
|
FHLB advances |
31,704 | 31,698 |
- |
31,698 |
- |
|||||||||
|
Accrued interest payable |
530 | 530 |
- |
530 |
- |
|||||||||
|
|
||||||||||||||
The carrying value of short-term financial instruments, as listed below, approximates their fair value. These instruments generally have limited credit exposure, no stated or short-term maturities, carry interest rates that approximate market and generally are recorded at amounts that are payable on demand:
|
· |
Cash and cash equivalents; |
84
|
· |
Non-interest bearing deposit accounts; |
|
· |
Savings, interest-bearing checking and money market accounts and |
|
· |
Short-term borrowings. |
Securities: Fair values on investment securities are determined by prices provided by a third-party vendor, who is a provider of financial market data, analytics and related services to financial institutions.
Loans and leases: The fair value of accruing loans is estimated by calculating the net present value of the future expected cash flows discounted using the exit price notion. The discount rate is based upon current offering rates, with an additional discount for expected potential charge-offs. Additionally, an environmental general credit risk adjustment is subtracted from the net present value to arrive at the total estimated fair value of the accruing loan portfolio.
The carrying value that fair value is compared to is net of the allowance for loan losses and since there is significant judgment included in evaluating credit quality, loans are classified within Level 3 of the fair value hierarchy.
Non-accrual loans: Loans which the Company has measured as non-accruing are generally based on the fair value of the loan’s collateral. Fair value is generally determined based upon independent third-party appraisals of the properties. These loans are classified within Level 3 of the fair value hierarchy. The fair value consists of loan balances less the valuation allowance.
Loans held-for-sale: The fair value of loans held-for-sale is estimated using rates currently offered for similar loans and is typically obtained from the Federal National Mortgage Association (FNMA) or the Federal Home Loan Bank of Pittsburgh (FHLB).
Certificates of deposit: The fair value of certificates of deposit is based on discounted cash flows using rates which approximate market rates for deposits of similar maturities.
FHLB advances: Fair value is estimated using the rates currently offered for similar borrowings.
The following tables illustrate the financial instruments measured at fair value on a recurring basis segregated by hierarchy fair value levels as of the periods indicated:
|
|
|||||||||||
|
|
Quoted prices |
||||||||||
|
|
in active |
Significant other |
Significant other |
||||||||
|
|
Total carrying value |
markets |
observable inputs |
unobservable inputs |
|||||||
|
(dollars in thousands) |
December 31, 2019 |
(Level 1) |
(Level 2) |
(Level 3) |
|||||||
|
Available-for-sale securities: |
|||||||||||
|
Agency - GSE |
$ |
6,159 |
$ |
- |
$ |
6,159 |
$ |
- |
|||
|
Obligations of states and political subdivisions |
54,718 |
- |
54,718 |
- |
|||||||
|
MBS - GSE residential |
124,240 |
- |
124,240 |
- |
|||||||
|
Total available-for-sale debt securities |
$ |
185,117 |
$ |
- |
$ |
185,117 |
$ |
- |
|||
|
|
|||||||||||
|
|
|||||||||||
|
|
Quoted prices |
||||||||||
|
|
in active |
Significant other |
Significant other |
||||||||
|
|
Total carrying value |
markets |
observable inputs |
unobservable inputs |
|||||||
|
(dollars in thousands) |
December 31, 2018 |
(Level 1) |
(Level 2) |
(Level 3) |
|||||||
|
Available-for-sale securities: |
|||||||||||
|
Agency - GSE |
$ |
5,917 |
$ |
- |
$ |
5,917 |
$ |
- |
|||
|
Obligations of states and political subdivisions |
52,575 |
- |
52,575 |
- |
|||||||
|
MBS - GSE residential |
124,318 |
- |
124,318 |
- |
|||||||
|
Total available-for-sale debt securities |
$ |
182,810 |
$ |
- |
$ |
182,810 |
$ |
- |
|||
|
|
|||||||||||
Debt securities in the AFS portfolio are measured at fair value using market quotations provided by a third-party vendor, who is a provider of financial market data, analytics and related services to financial institutions. Assets classified as Level 2 use valuation techniques that are common to bond valuations. That is, in active markets whereby bonds of similar characteristics frequently trade, quotes for similar assets are obtained. For the periods ending December 31, 2019 and December 31, 2018, there were no transfers to or from Level 1 and Level 2 fair value measurements for financial assets measured on a recurring basis.
85
There were no changes in Level 3 financial instruments measured at fair value on a recurring basis as of and for the periods ending December 31, 2019 and December 31, 2018, respectively.
The following table illustrates the financial instruments measured at fair value on a non-recurring basis segregated by hierarchy fair value levels as of the periods indicated:
|
|
|||||||||||
|
|
Quoted prices in |
Significant other |
Significant other |
||||||||
|
|
Total carrying value |
active markets |
observable inputs |
unobservable inputs |
|||||||
|
(dollars in thousands) |
at December 31, 2019 |
(Level 1) |
(Level 2) |
(Level 3) |
|||||||
|
|
|||||||||||
|
Impaired loans |
$ |
1,579 |
$ |
- |
$ |
- |
$ |
1,579 | |||
|
Other real estate owned |
350 |
- |
- |
350 | |||||||
|
Other repossessed assets |
20 |
- |
- |
20 | |||||||
|
Total |
$ |
1,949 |
$ |
- |
$ |
- |
$ |
1,949 | |||
|
|
|||||||||||
|
|
|||||||||||
|
|
Quoted prices in |
Significant other |
Significant other |
||||||||
|
|
Total carrying value |
active markets |
observable inputs |
unobservable inputs |
|||||||
|
(dollars in thousands) |
at December 31, 2018 |
(Level 1) |
(Level 2) |
(Level 3) |
|||||||
|
|
|||||||||||
|
Impaired loans |
$ |
1,817 |
$ |
- |
$ |
- |
$ |
1,817 | |||
|
Other real estate owned |
184 |
- |
- |
184 | |||||||
|
Total |
$ |
2,001 |
$ |
- |
$ |
- |
$ |
2,001 | |||
|
|
|||||||||||
From time-to-time, the Company may be required to record at fair value financial instruments on a non-recurring basis, such as impaired loans, ORE and other repossessed assets. These non-recurring fair value adjustments involve the application of lower-of-cost-or-market accounting on write downs of individual assets.
The following describes valuation methodologies used for financial instruments measured at fair value on a non-recurring basis. Impaired loans that are collateral dependent are written down to fair value through the establishment of specific reserves, a component of the allowance for loan losses, and as such are carried at the lower of net recorded investment or the estimated fair value. Estimates of fair value of the collateral are determined based on a variety of information, including available valuations from certified appraisers for similar assets, present value of discounted cash flows and inputs that are estimated based on commonly used and generally accepted industry liquidation advance rates and estimates and assumptions developed by management.
Valuation techniques for impaired loans are typically determined through independent appraisals of the underlying collateral or may be determined through present value of discounted cash flows. Both techniques include various Level 3 inputs which are not identifiable. The valuation technique may be adjusted by management for estimated liquidation expenses and qualitative factors such as economic conditions. If real estate is not the primary source of repayment, present value of discounted cash flows and estimates using generally accepted industry liquidation advance rates and other factors may be utilized to determine fair value.
At December 31, 2019 and 2018, the range of liquidation expenses and other valuation adjustments applied to impaired loans ranged from -21.56% to -84.98% and from -16.70% to -57.89%, respectively. The weighted average of liquidation expenses and other valuation adjustments applied to impaired loans amounted to -29.11% as of December 31, 2019 and -44.42% as of December 31, 2018, respectively. Due to the multitude of assumptions, many of which are subjective in nature, and the varying inputs and techniques used to determine fair value, the Company recognizes that valuations could differ across a wide spectrum of techniques employed. Accordingly, fair value estimates for impaired loans are classified as Level 3.
For ORE, fair value is generally determined through independent appraisals of the underlying properties which generally include various Level 3 inputs which are not identifiable. Appraisals form the basis for determining the net realizable value from these properties. Net realizable value is the result of the appraised value less certain costs or discounts associated with liquidation which occurs in the normal course of business. Management’s assumptions may include consideration of the location and occupancy of the property, along with current economic conditions. Subsequently, as these properties are actively marketed, the estimated fair values may be periodically adjusted through incremental subsequent write-downs. These write-downs usually reflect decreases in estimated values resulting from sales price observations as well as changing economic and market conditions. At December 31, 2019 and December 31, 2018, the discounts applied to the appraised values of ORE ranged from -26.94% and -89.48% and from -18.47% to -68.96%, respectively. As of December 31, 2019, and December 31, 2018, the weighted average of discount to the appraisal values of ORE amounted to -48.65% and -45.83%, respectively.
86
At December 31, 2019, other repossessed assets consisted of two automobiles, totaling $20 thousand. The Company refers to the National Automobile Dealers Association (NADA) guide to determine a vehicle’s fair value. There were no other repossessed assets at December 31, 2018.
Financial Instruments with Off-Balance Sheet Risk
The Company is a party to financial instruments with off-balance sheet risk in the normal course of business to meet the financing needs of its customers. These financial instruments include commitments to extend credit and standby letters of credit. Those instruments involve, to varying degrees, elements of credit risk in excess of the amount recognized in the balance sheet. The contract or notional amounts of those instruments reflect the extent of the Company’s involvement in particular classes of financial instruments. Because of the nature of these instruments, the fair values of these off-balance sheet items are not material.
The notional amount of the Company’s financial instruments with off-balance sheet risk was as follows:
|
|
December 31, |
||||
|
(dollars in thousands) |
2019 |
2018 |
|||
|
Off-balance sheet financial instruments: |
|||||
|
Commitments to extend credit |
$ |
143,558 |
$ |
144,710 | |
|
Standby letters of credit |
7,287 | 2,690 | |||
Commitments to Extend Credit and Standby Letters of Credit
The Company’s exposure to credit loss from nonperformance by the other party to the financial instruments for commitments to extend credit and standby letters of credit is represented by the contractual amount of those instruments. The Company uses the same credit policies in making commitments and conditional obligations as it does for on-balance sheet instruments.
Commitments to extend credit are legally binding agreements to lend to customers. Commitments generally have fixed expiration dates or other termination clauses and may require payment of fees. Since commitments may expire without being drawn upon, the total commitment amounts do not necessarily represent future liquidity requirements. The Company evaluates each customer’s credit-worthiness on a case-by-case basis. The amount of collateral obtained, if considered necessary by the Company on extension of credit, is based on management’s credit assessment of the customer.
Financial standby letters of credit are conditional commitments issued by the Company to guarantee performance of a customer to a third party. Those guarantees are issued primarily to support public and private borrowing arrangements, including commercial paper, bond financing, and similar transactions. The Company’s performance under the guarantee is required upon presentation by the beneficiary of the financial standby letter of credit. The credit risk involved in issuing letters of credit is essentially the same as that involved in extending loan facilities to customers. The Company was not required to recognize any liability in connection with the issuance of these financial standby letters of credit.
The following table summarizes outstanding financial letters of credit as of December 31, 2019:
|
|
More than |
||||||||||
|
|
Less than |
one year to |
Over five |
||||||||
|
(dollars in thousands) |
one year |
five years |
years |
Total |
|||||||
|
Secured by: |
|||||||||||
|
Collateral |
$ |
3,149 |
$ |
363 |
$ |
1,007 |
$ |
4,519 | |||
|
Bank lines of credit |
2,405 |
- |
- |
2,405 | |||||||
|
|
5,554 | 363 | 1,007 | 6,924 | |||||||
|
Unsecured |
363 |
- |
- |
363 | |||||||
|
Total |
$ |
5,917 |
$ |
363 |
$ |
1,007 |
$ |
7,287 | |||
The Company has not incurred losses on its commitments in 2019, 2018 or 2017.
Basic earnings per share (EPS) is computed by dividing net income available to common shareholders by the weighted-average number of common shares outstanding for the period. Diluted EPS is computed in the same manner as basic EPS but also reflects the potential dilution that could occur from the grant of stock-based compensation awards. The Company maintains two active share-based compensation plans that may generate additional potentially dilutive common shares. For granted and unexercised stock options and stock-settled stock appreciation rights (SSARs), dilution would occur if Company-issued stock options or SSARs were exercised and converted into common stock. As of the years ended December 31, 2019, 2018 and 2017, there were 32,091, 29,301 and 14,300 potentially dilutive shares related to issued and unexercised stock options and SSARs. For restricted stock, dilution would occur from the Company’s previously granted but unvested shares. There were 10,720, 13,893 and 9,619 potentially dilutive shares related to unvested restricted share grants as of the years ended December 31, 2019, 2018 and 2017, respectively.
87
In the computation of diluted EPS, the Company uses the treasury stock method to determine the dilutive effect of its granted but unexercised stock options and SSARs and unvested restricted stock. Under the treasury stock method, the assumed proceeds, as defined, received from shares issued in a hypothetical stock option exercise or restricted stock grant, are assumed to be used to purchase treasury stock. Proceeds include amounts received from the exercise of outstanding stock options and compensation cost for future service that the Company has not yet recognized in earnings. The Company does not consider awards from share-based grants in the computation of basic EPS.
The following table illustrates the data used in computing basic and diluted EPS for the years indicated:
|
|
||||||||
|
|
Years ended December 31, |
|||||||
|
|
2019 |
2018 |
2017 |
|||||
|
(dollars in thousands except per share data) |
||||||||
|
Basic EPS: |
||||||||
|
Net income available to common shareholders |
$ |
11,576 |
$ |
11,006 |
$ |
8,716 | ||
|
Weighted-average common shares outstanding |
3,779,582 | 3,752,704 | 3,711,490 | |||||
|
Basic EPS |
$ |
3.06 |
$ |
2.93 |
$ |
2.35 | ||
|
|
||||||||
|
Diluted EPS: |
||||||||
|
Net income available to common shareholders |
$ |
11,576 |
$ |
11,006 |
$ |
8,716 | ||
|
Weighted-average common shares outstanding |
3,779,582 | 3,752,704 | 3,711,490 | |||||
|
Potentially dilutive common shares |
42,811 | 43,194 | 23,919 | |||||
|
Weighted-average common and potentially dilutive shares outstanding |
3,822,393 | 3,795,898 | 3,735,409 | |||||
|
Diluted EPS |
$ |
3.03 |
$ |
2.90 |
$ |
2.33 | ||
15.REGULATORY MATTERS
The Company (on a consolidated basis) and the Bank are subject to various regulatory capital requirements administered by the federal banking agencies. Failure to meet minimum capital requirements can initiate certain mandatory and possible additional discretionary actions by regulators that, if undertaken, could have a direct material effect on the Company’s and the Bank’s financial statements. Under capital adequacy guidelines and the regulatory framework for prompt corrective action, the Company and the Bank must meet specific capital guidelines that involve quantitative measures of their assets, liabilities and certain off-balance-sheet items as calculated under regulatory accounting practices. The capital amounts and classification are also subject to qualitative judgments by the regulators about components, risk-weightings and other factors. Prompt corrective action provisions are not applicable to bank holding companies.
Under these guidelines, assets and certain off-balance sheet items are assigned to broad risk categories, each with appropriate weights. The resulting capital ratios represent capital as a percentage of total risk-weighted assets. The guidelines require all banks and bank holding companies to maintain a minimum ratio of total risk-based capital to total risk-weighted assets (Total Risk Adjusted Capital) of 8%, including Tier I common equity to total risk-weighted assets (Tier I Common Equity) of 4.5%, Tier I capital to total risk-weighted assets (Tier I Capital) of 6% and Tier I capital to average total assets (Leverage Ratio) of at least 4%. A capital conservation buffer, comprised of common equity Tier I capital, is also established above the regulatory minimum capital requirements rising up to 2.50% by 2019. As of December 31, 2019 and 2018, the Company and the Bank exceeded all capital adequacy requirements to which it was subject.
The following table reflects the actual and required capital and the related capital ratios as of the periods indicated. No amounts were deducted from capital for interest-rate risk in either 2019 or 2018.
88
|
|
||||||||||||||||||||
|
|
For capital adequacy |
To be well capitalized |
||||||||||||||||||
|
|
For capital |
purposes with capital |
under prompt corrective |
|||||||||||||||||
|
|
Actual |
adequacy purposes |
conservation buffer* |
action provisions |
||||||||||||||||
|
(dollars in thousands) |
Amount |
Ratio |
Amount |
Ratio |
Amount |
Ratio |
Amount |
Ratio |
||||||||||||
|
As of December 31, 2019: |
||||||||||||||||||||
|
|
||||||||||||||||||||
|
Total capital (to risk-weighted assets) |
||||||||||||||||||||
|
Consolidated |
$ |
111,910 | 15.8% |
≥ |
$ |
56,796 | 8.0% |
≥ |
$ |
74,545 | 10.5% |
N/A |
N/A |
|||||||
|
Bank |
$ |
112,188 | 15.8% |
≥ |
$ |
56,791 | 8.0% |
≥ |
$ |
74,538 | 10.5% |
≥ |
$ |
70,989 | 10.0% | |||||
|
|
||||||||||||||||||||
|
Tier 1 common equity (to risk-weighted assets) |
||||||||||||||||||||
|
Consolidated |
$ |
103,024 | 14.5% |
≥ |
$ |
31,948 | 4.5% |
≥ |
$ |
49,696 | 7.0% |
N/A |
N/A |
|||||||
|
Bank |
$ |
103,303 | 14.6% |
≥ |
$ |
31,945 | 4.5% |
≥ |
$ |
49,692 | 7.0% |
≥ |
$ |
46,143 | 6.5% | |||||
|
|
||||||||||||||||||||
|
Tier I capital (to risk-weighted assets) |
||||||||||||||||||||
|
Consolidated |
$ |
103,024 | 14.5% |
≥ |
$ |
42,597 | 6.0% |
≥ |
$ |
60,346 | 8.5% |
N/A |
N/A |
|||||||
|
Bank |
$ |
103,303 | 14.6% |
≥ |
$ |
42,593 | 6.0% |
≥ |
$ |
60,340 | 8.5% |
≥ |
$ |
56,791 | 8.0% | |||||
|
|
||||||||||||||||||||
|
Tier I capital (to average assets) |
||||||||||||||||||||
|
Consolidated |
$ |
103,024 | 10.4% |
≥ |
$ |
39,650 | 4.0% |
≥ |
$ |
39,650 | 4.0% |
N/A |
N/A |
|||||||
|
Bank |
$ |
103,303 | 10.3% |
≥ |
$ |
40,265 | 4.0% |
≥ |
$ |
40,265 | 4.0% |
≥ |
$ |
50,331 | 5.0% | |||||
|
|
||||||||||||||||||||
|
|
||||||||||||||||||||
|
As of December 31, 2018: |
||||||||||||||||||||
|
|
||||||||||||||||||||
|
Total capital (to risk-weighted assets) |
||||||||||||||||||||
|
Consolidated |
$ |
103,201 | 14.8% |
≥ |
$ |
55,975 | 8.0% |
≥ |
$ |
69,094 | 9.9% |
N/A |
N/A |
|||||||
|
Bank |
$ |
103,313 | 14.8% |
≥ |
$ |
55,970 | 8.0% |
≥ |
$ |
69,088 | 9.9% |
≥ |
$ |
69,962 | 10.0% | |||||
|
|
||||||||||||||||||||
|
Tier 1 common equity (to risk-weighted assets) |
||||||||||||||||||||
|
Consolidated |
$ |
94,442 | 13.5% |
≥ |
$ |
31,486 | 4.5% |
≥ |
$ |
44,605 | 6.4% |
N/A |
N/A |
|||||||
|
Bank |
$ |
94,554 | 13.5% |
≥ |
$ |
31,483 | 4.5% |
≥ |
$ |
44,601 | 6.4% |
≥ |
$ |
45,475 | 6.5% | |||||
|
|
||||||||||||||||||||
|
Tier I capital (to risk-weighted assets) |
||||||||||||||||||||
|
Consolidated |
$ |
94,442 | 13.5% |
≥ |
$ |
41,981 | 6.0% |
≥ |
$ |
55,100 | 7.9% |
N/A |
N/A |
|||||||
|
Bank |
$ |
94,554 | 13.5% |
≥ |
$ |
41,977 | 6.0% |
≥ |
$ |
55,095 | 7.9% |
≥ |
$ |
55,970 | 8.0% | |||||
|
|
||||||||||||||||||||
|
Tier I capital (to average assets) |
||||||||||||||||||||
|
Consolidated |
$ |
94,442 | 9.8% |
≥ |
$ |
38,593 | 4.0% |
≥ |
$ |
38,593 | 4.0% |
N/A |
N/A |
|||||||
|
Bank |
$ |
94,554 | 9.8% |
≥ |
$ |
38,591 | 4.0% |
≥ |
$ |
38,591 | 4.0% |
≥ |
$ |
48,238 | 5.0% | |||||
|
|
* The minimums under Basel III increased by 0.625% (the capital conservation buffer) annually until 2019.
The Company’s principal source of funds for dividend payments is dividends received from the Bank. Banking regulations and Pennsylvania law limit the amount of dividends that may be paid from the Bank to the Company without prior approval of regulatory agencies. Accordingly, at December 31, 2019, approximately $94.7 million was available for dividend distribution from the Bank to the Company in 2019.
89
16.RELATED PARTY TRANSACTIONS
During the ordinary course of business, loans are made to executive officers, directors, greater than 5% shareholders and associates of such persons. These transactions are executed on substantially the same terms and at the rates prevailing at the time for comparable transactions with others. These loans do not involve more than the normal risk of collectability or present other unfavorable features. A summary of loan activity with officers, directors, associates of such persons and shareholders who own more than 5% of the Company’s outstanding shares is as follows:
|
|
Years ended December 31, |
|||||||
|
(dollars in thousands) |
2019 |
2018 |
2017 |
|||||
|
Balance, beginning |
$ |
6,542 |
$ |
6,497 |
$ |
7,849 | ||
|
Additions |
1,864 | 1,314 | 1,111 | |||||
|
Collections |
(1,641) | (1,269) | (2,463) | |||||
|
|
||||||||
|
Balance, ending |
$ |
6,765 |
$ |
6,542 |
$ |
6,497 | ||
As of December 31, 2019, 2018 and 2017, deposits from executive officers and directors approximated $14.8 million, $14.4 million and $14.3 million, respectively.
17.QUARTERLY FINANCIAL INFORMATION (UNAUDITED)
The following is a summary of quarterly results of operations for the years indicated:
|
|
2019 |
|||||||||||||
|
|
First |
Second |
Third |
Fourth |
||||||||||
|
(dollars in thousands except per share data) |
quarter |
quarter |
quarter |
quarter |
Total |
|||||||||
|
Interest income |
$ |
9,655 |
$ |
9,657 |
$ |
10,008 |
$ |
9,949 |
$ |
39,269 | ||||
|
Interest expense |
(1,745) | (1,863) | (2,008) | (1,938) | (7,554) | |||||||||
|
|
||||||||||||||
|
Net interest income |
7,910 | 7,794 | 8,000 | 8,011 | 31,715 | |||||||||
|
Provision for loan losses |
(255) | (255) | (320) | (255) | (1,085) | |||||||||
|
Gain (loss) on sale of investment securities |
(4) |
- |
(2) | 20 | 14 | |||||||||
|
Other income |
2,461 | 2,489 | 2,634 | 2,595 | 10,179 | |||||||||
|
Other expenses |
(6,770) | (6,435) | (6,643) | (7,073) | (26,921) | |||||||||
|
Income before taxes |
3,342 | 3,593 | 3,669 | 3,298 | 13,902 | |||||||||
|
Provision for income taxes |
(540) | (591) | (611) | (584) | (2,326) | |||||||||
|
Net income |
$ |
2,802 |
$ |
3,002 |
$ |
3,058 |
$ |
2,714 |
$ |
11,576 | ||||
|
Net income per share - basic |
$ |
0.74 |
$ |
0.79 |
$ |
0.82 |
$ |
0.71 |
$ |
3.06 | ||||
|
Net income per share - diluted |
$ |
0.73 |
$ |
0.79 |
$ |
0.80 |
$ |
0.71 |
$ |
3.03 | ||||
|
|
2018 |
|||||||||||||
|
|
First |
Second |
Third |
Fourth |
||||||||||
|
(dollars in thousands except per share data) |
quarter |
quarter |
quarter |
quarter |
Total |
|||||||||
|
Interest income |
$ |
8,143 |
$ |
8,535 |
$ |
9,028 |
$ |
9,624 |
$ |
35,330 | ||||
|
Interest expense |
(884) | (1,012) | (1,317) | (1,660) | (4,873) | |||||||||
|
|
||||||||||||||
|
Net interest income |
7,259 | 7,523 | 7,711 | 7,964 | 30,457 | |||||||||
|
Provision for loan losses |
(300) | (425) | (400) | (325) | (1,450) | |||||||||
|
Gain (loss) on write-down/sale of investment securities |
(58) | 107 | 5 |
- |
54 | |||||||||
|
Other income |
2,341 | 2,264 | 2,278 | 2,263 | 9,146 | |||||||||
|
Other expenses |
(6,208) | (6,162) | (6,172) | (6,530) | (25,072) | |||||||||
|
Income before taxes |
3,034 | 3,307 | 3,422 | 3,372 | 13,135 | |||||||||
|
Provision for income taxes |
(506) | (539) | (559) | (525) | (2,129) | |||||||||
|
Net income |
$ |
2,528 |
$ |
2,768 |
$ |
2,863 |
$ |
2,847 |
$ |
11,006 | ||||
|
Net income per share - basic |
$ |
0.67 |
$ |
0.74 |
$ |
0.76 |
$ |
0.76 |
$ |
2.93 | ||||
|
Net income per share - diluted |
$ |
0.67 |
$ |
0.73 |
$ |
0.75 |
$ |
0.75 |
$ |
2.90 | ||||
90
|
|
2017 |
|||||||||||||
|
|
First |
Second |
Third |
Fourth |
||||||||||
|
(dollars in thousands except per share data) |
quarter |
quarter |
quarter |
quarter |
Total |
|||||||||
|
Interest income |
$ |
7,366 |
$ |
7,854 |
$ |
7,928 |
$ |
7,916 |
$ |
31,064 | ||||
|
Interest expense |
(688) | (787) | (882) | (866) | (3,223) | |||||||||
|
|
||||||||||||||
|
Net interest income |
6,678 | 7,067 | 7,046 | 7,050 | 27,841 | |||||||||
|
Provision for loan losses |
(325) | (225) | (375) | (525) | (1,450) | |||||||||
|
Loss on sale of investment securities |
- |
- |
- |
(147) | (147) | |||||||||
|
Other income |
2,105 | 2,131 | 2,248 | 2,029 | 8,513 | |||||||||
|
Other expenses |
(5,797) | (6,051) | (6,035) | (6,953) | (24,836) | |||||||||
|
Income before taxes |
2,661 | 2,922 | 2,884 | 1,455 | 9,922 | |||||||||
|
(Provision) credit for income taxes |
(681) | (739) | (658) | 872 | (1,206) | |||||||||
|
Net income |
$ |
1,980 |
$ |
2,183 |
$ |
2,226 |
$ |
2,327 |
$ |
8,716 | ||||
|
Net income per share - basic |
$ |
0.53 |
$ |
0.59 |
$ |
0.60 |
$ |
0.63 |
$ |
2.35 | ||||
|
Net income per share - diluted |
$ |
0.53 |
$ |
0.59 |
$ |
0.60 |
$ |
0.61 |
$ |
2.33 | ||||
18.CONTINGENCIES
The nature of the Company’s business generates litigation involving matters arising in the ordinary course of business. However, in the opinion of management of the Company after consulting with the Company’s legal counsel, no legal proceedings are pending, which, if determined adversely to the Company or the Bank, would have a material effect on the Company’s shareholders’ equity or results of operations. No legal proceedings are pending other than ordinary routine litigation incident to the business of the Company and the Bank. In addition, to management’s knowledge, no government authorities have initiated or contemplated any material legal actions against the Company or the Bank.
19.RECENT ACCOUNTING PRONOUNCEMENTS
In June 2016, the Financial Accounting Standards Board (FASB) issued Accounting Standard Update (ASU) 2016-13, Financial Instruments – Credit Losses (Topic 326) Measurement of Credit Losses on Financial Instruments (CECL). The amendments in this update require financial assets measured at amortized cost basis to be presented at the net amount expected to be collected, through an allowance for credit losses that is deducted from the amortized cost basis. Previously, when credit losses were measured under GAAP, an entity only considered past events and current conditions when measuring the incurred loss. The amendments in this update broaden the information that an entity must consider in developing its expected credit loss estimate for assets measured either collectively or individually. The measurement of expected credit losses is based on relevant information about past events, including historical experience, current conditions, and reasonable and supportable forecasts that affect the collectability of the reported amount. An entity must use judgement in determining the relevant information and estimation methods that are appropriate under the circumstances. The amendments in this update also require that credit losses on available-for-sale debt securities be presented as an allowance for credit losses rather than a writedown.
In November 2018, the FASB issued ASU 2018-19, Codification Improvements to Topic 326, which clarifies that receivables arising from operating leases are not within the scope of Topic 326. In December 2018, regulators issued a final rule related to regulatory capital (Regulatory Capital Rule: Implementation and Transition of the Current Expected Credit Losses Methodology for Allowances and Related Adjustments to the Regulatory Capital Rule and Conforming Amendments to Other Regulations) which is intended to provide regulatory capital relief for entities transitioning to CECL. In April 2019, the FASB issued ASU 2019-04, Codification Improvements to Topic 326, Financial Instruments – Credit Losses, Topic 815, Derivatives and Hedging and Topic 825, Financial Instruments. As it relates to CECL, this guidance amends certain provisions contained in ASU 2016-13, particularly in regards to the inclusion of accrued interest in the definition of amortized cost, as well as clarifying that extension and renewal options that are not unconditionally cancelable by the entity that are included in the original or modified contract should be considered in the entity’s determination of expected credit losses. The amendments in this update are effective for fiscal years, including interim periods within those fiscal years, beginning after December 15, 2019 for public companies. Early adoption is permitted beginning after December 15, 2018, including interim periods within those fiscal years. An entity will apply the amendments in this update through a cumulative-effect adjustment to retained earnings as of the beginning of the period of adoption (modified-retrospective approach). Upon adoption, the change in this accounting guidance could result in an increase in the Company's allowance for loan losses and require the Company to record loan losses more rapidly. The Company has engaged the services of a qualified third-party service provider to assist management in estimating credit allowances under this standard and is currently evaluating the impact of ASU 2016-13 on its consolidated financial statements.
On October 16, 2019, the FASB decided to move forward with finalizing its proposal to defer the effective date for ASU 2016-13 for smaller reporting companies to fiscal years beginning after December 31, 2022, including interim periods within
91
those fiscal periods. Since the Company currently meets the SEC definition of a smaller reporting company, the delay will be applicable to the Company.
In February 2016, the FASB issued ASU 2016-02, Leases (Topic 842) to increase transparency and comparability among organizations by recognizing lease assets and lease liabilities on the balance sheet and disclosing key information about leasing arrangements. ASU 2016-02 requires the recognition of a right-of-use asset and related lease liability by lessees for leases classified as operating leases under GAAP. The Company made an election to exclude leases less than 12 months from the provisions of this ASU. The Company also elected the “package of practical expedients” which allowed us not to reassess, under the new standard, lease classification, lease identification and initial direct costs. The Company had several lease agreements, such as branch locations, which were considered operating leases, and therefore not recognized on the Company’s consolidated balance sheets. The Company adopted this standard on January 1, 2019 and made an adjustment to add $4.1 million to the consolidated balance sheet as a right-of-use-asset, $4.6 million as a lease liability and reduced equity by ($0.1 million). There was not any significant effect on the consolidated statements of income. See Footnote 24, Leases, for more information regarding the adoption of this standard.
In July 2018, the FASB issued ASU 2018-10, Codification Improvements to Topic 842, Leases and ASU 2018-11, Leases (Topic 842) Targeted Improvements to clarify how to apply certain aspects of ASU 2016-02 and to simplify adoption and reduce costs. ASU 2018-11 allows companies the option to apply the provisions of the new lease standard prospectively as of the effective date, without adjusting comparative periods, and recognizes a cumulative-effect adjustment to the opening balance of retained earnings in the period of adoption. The Company used this additional transition method. The amendments in this update are effective upon adoption of Topic 842.
In December 2018, the FASB issued ASU 2018-20, Leases (Topic 842): Narrow-Scope Improvements for Lessors to assist stakeholders with implementation questions and issues on certain issues. The amendments in this update are effective upon adoption of Topic 842.
In March 2019, the FASB issued ASU 2019-01, Leases (Topic 842): Codification Improvements to clarify three issues brought to the FASB’s attention through interactions with stakeholders: Determining the fair value of the underlying assets by lessors that are not manufacturers or dealers; presentation on the statement of cash flows –sales-type and direct financing leases; and transition disclosures related to Topic 250, Accounting Changes and Error Corrections. The transition and effective date provisions for this update apply to issue 1 and 2. The amendments in this update are effective for the Company for fiscal years beginning after December 15, 2019 and interim periods within those fiscal years. Early adoption is permitted. The Company adopted this standard during the first quarter of 2019 and it did not have any significant effect on the Company’s financial statements.
20.PARENT COMPANY ONLY
The following is the condensed financial information for Fidelity D & D Bancorp, Inc. on a parent company only basis as of and for the years indicated:
|
Condensed Balance Sheets |
As of December 31, |
||||
|
(dollars in thousands) |
2019 |
2018 |
|||
|
Assets: |
|||||
|
Cash |
$ |
63 |
$ |
232 | |
|
Investment in subsidiary |
107,115 | 93,669 | |||
|
Other assets |
107 | 106 | |||
|
Total |
$ |
107,285 |
$ |
94,007 | |
|
|
|||||
|
Liabilities and shareholders' equity: |
|||||
|
Liabilities |
$ |
449 |
$ |
450 | |
|
Capital stock and retained earnings |
103,234 | 94,652 | |||
|
Accumulated other comprehensive income (loss) |
3,602 | (1,095) | |||
|
Total |
$ |
107,285 |
$ |
94,007 | |
92
|
Condensed Income Statements |
Years ended December 31, |
|||||||
|
(dollars in thousands) |
2019 |
2018 |
2017 |
|||||
|
Income: |
||||||||
|
Equity in undistributed earnings of subsidiary |
$ |
8,839 |
$ |
9,273 |
$ |
6,685 | ||
|
Dividends from subsidiary |
4,037 | 2,723 | 2,574 | |||||
|
Gain on sale of investment securities |
- |
44 |
- |
|||||
|
Other income |
- |
11 | 22 | |||||
|
Total income |
12,876 | 12,051 | 9,281 | |||||
|
Operating expenses |
1,598 | 1,269 | 1,094 | |||||
|
Income before taxes |
11,278 | 10,782 | 8,187 | |||||
|
Credit for income taxes |
298 | 224 | 529 | |||||
|
Net income |
$ |
11,576 |
$ |
11,006 |
$ |
8,716 | ||
|
Statements of Comprehensive Income |
Years ended December 31, |
|||||||
|
(dollars in thousands) |
2019 |
2018 |
2017 |
|||||
|
Bancorp net loss |
$ |
(1,300) |
$ |
(990) |
$ |
(542) | ||
|
Equity in net income of subsidiary |
12,876 | 11,996 | 9,258 | |||||
|
Net income |
11,576 | 11,006 | 8,716 | |||||
|
|
||||||||
|
Other comprehensive income (loss), before tax: |
||||||||
|
Unrealized holding gains on available-for-sale securities |
- |
- |
197 | |||||
|
Tax effect |
- |
- |
(67) | |||||
|
Unrealized gain, net of tax |
- |
- |
130 | |||||
|
Equity in other comprehensive income (loss) of subsidiary |
4,697 | (2,478) | (4) | |||||
|
Other comprehensive income (loss), net of tax |
4,697 | (2,478) | 126 | |||||
|
Total comprehensive income, net of tax |
$ |
16,273 |
$ |
8,528 |
$ |
8,842 | ||
|
Condensed Statements of Cash Flows |
Years ended December 31, |
|||||||
|
(dollars in thousands) |
2019 |
2018 |
2017 |
|||||
|
Cash flows from operating activities: |
||||||||
|
Net income |
$ |
11,576 |
$ |
11,006 |
$ |
8,716 | ||
|
Adjustments to reconcile net income to net cash used in operations: |
||||||||
|
Equity in earnings of subsidiary |
(12,876) | (11,996) | (9,258) | |||||
|
Stock-based compensation expense |
817 | 749 | 550 | |||||
|
Deferred income tax |
2 | (60) | (69) | |||||
|
Gain on sale of investment securities |
- |
(44) |
- |
|||||
|
Changes in other assets and liabilities, net |
137 | 12 | (26) | |||||
|
Net cash used in operating activities |
(344) | (333) | (87) | |||||
|
|
||||||||
|
Cash flows provided by investing activities: |
||||||||
|
Dividends received from subsidiary |
4,037 | 2,723 | 2,574 | |||||
|
Proceeds from sales of investment securities |
- |
871 |
- |
|||||
|
Net cash provided by investing activities |
4,037 | 3,594 | 2,574 | |||||
|
|
||||||||
|
Cash flows used in financing activities: |
||||||||
|
Dividends paid, net of dividend reinvestment |
(4,037) | (3,397) | (2,954) | |||||
|
Exercise of stock options |
- |
14 | 416 | |||||
|
Withholdings to purchase capital stock |
175 | 149 | 126 | |||||
|
Cash paid in lieu of fractional shares |
- |
- |
(11) | |||||
|
Net cash used in financing activities |
(3,862) | (3,234) | (2,423) | |||||
|
Net change in cash |
(169) | 27 | 64 | |||||
|
|
||||||||
|
Cash, beginning |
232 | 205 | 141 | |||||
|
|
||||||||
|
Cash, ending |
$ |
63 |
$ |
232 |
$ |
205 | ||
93
21.BUSINESS COMBINATION AND PENDING ACQUISITION
On March 17, 2017, the Company completed the acquisition of the West Scranton branch of Wayne Bank, the wholly owned banking subsidiary of Norwood Financial Corp., pursuant to the terms of the Branch Purchase and Deposit Assumption Agreement dated September 29, 2016. The Company purchased all of the deposit liabilities associated with the branch, certain loans, and the branch real estate, and immediately closed the branch and consolidated the acquired deposits and loans into its nearby West Scranton branch office. The Company expects this transaction to expand its customer base in West Scranton.
The transaction has been accounted for using the acquisition method of accounting. The acquired assets and assumed liabilities were recorded at book value which also represented estimated fair value at the date of acquisition. Management made significant estimates and exercised significant judgement in estimating fair value, but the fair value adjustments were deemed immaterial to the financial statements.
The Company recognized $41 thousand of acquisition-related costs during 2017. These costs were expensed as incurred and are presented in non-interest expenses on the consolidated statements of income. Costs incurred in 2017 consist principally of legal fees and other professional fees.
The following table summarizes the estimated fair value of the assets acquired and liabilities assumed at the date of acquisition:
|
|
||
|
(dollars in thousands) |
March 17, 2017 |
|
|
|
||
|
Cash and cash equivalents |
$ |
11,817 |
|
Loans |
1,574 | |
|
Bank premises and equipment |
264 | |
|
Goodwill |
209 | |
|
Accrued interest receivable and other assets |
4 | |
|
Total assets acquired |
$ |
13,868 |
|
|
||
|
Deposits |
$ |
13,809 |
|
Accrued interest payable and other liabilities |
59 | |
|
Total liabilities assumed |
$ |
13,868 |
|
|
||
The Company acquired $1.6 million in residential and consumer loans. None of the loans that were acquired had evidence of credit quality deterioration.
The Company recorded goodwill associated with the acquisition of the West Scranton branch of Wayne bank totaling $0.2 million. Goodwill is not amortized, but is periodically evaluated for impairment. The Company did not recognize any impairment during 2019 or 2018. For income tax purposes, goodwill will be deducted over a 15 year period.
Pending Acquisition
In December 2019, the Company announced an agreement and plan of reorganization to acquire MNB Corporation (“MNB”) in a transaction valued on December 6, 2019 at $78.5 million. Under the terms of the agreement, MNB shareholders will receive as consideration 1.039 shares of Fidelity common stock for each share of MNB common stock that they own as of the closing date. MNB is the holding company of Merchants Bank of Bangor (“Merchants Bank”) which operates 9 retail community banking offices in Northeastern and Eastern Pennsylvania. Subject to the terms and conditions of the agreement, MNB will merge with and into the Company and Merchants Bank will merger with and into the Bank. The merger which is subject to shareholder approval of the Company, MNB shareholder approval, regulatory approvals and other customary closing conditions, is currently expected to close in the second quarter of 2020. In 2019, the Corporation incurred merger-related expenses totaling $440 thousand related to the planned acquisition of MNB Corporation. Non-recurring costs to facilitate the anticipated merger and integrate systems in 2020 are currently estimated to be $2.4 million.
22.EMPLOYEE BENEFITS
Bank-Owned Life Insurance (BOLI)
The Company has purchased single premium BOLI policies on certain officers. The policies are recorded at their cash surrender values. Increases in cash surrender values are included in non-interest income in the consolidated statements of income. In March 2019, the Company purchased an additional $2.0 million of BOLI. The policies’ cash surrender value totaled $23.3 million and $20.6 million, respectively, as of December 31, 2019 and 2018 and is reflected as an asset on the consolidated balance sheets. For the years ended December 31, 2019 and 2018, the Company has recorded income of $647 thousand and $598 thousand, respectively.
94
Officer Life Insurance
In 2017, the Bank entered into separate split dollar life insurance arrangements (Split Dollar Agreements) with eleven officers. This plan provides each officer a specified death benefit should the officer die while in the Bank’s employ. The Bank paid the insurance premiums in March 2017 and the arrangements were effective in March 2017. In March 2019, the Bank entered into a new Split Dollar Agreement with one officer. The Bank owns the policies and all cash values thereunder. Upon death of the covered employee, the agreed-upon amount of death proceeds from the policies will be paid directly to the insured’s beneficiary. As of December 31, 2019, the policies had total death benefits of $23.3 million of which $4.1 million would have been paid to the officer’s beneficiaries and the remaining $19.2 million would have been paid to the Bank. In addition, four executive officers have the opportunity to retain a split dollar benefit equal to two times their highest base salary after separation from service if the vesting requirements are met. As of December 31, 2019 and 2018, the Company accrued expenses of $107 thousand and $63 thousand for the split dollar benefit.
Supplemental Executive Retirement plan (SERP)
On March 29, 2017, the Bank entered into separate supplemental executive retirement agreements (individually the “SERP Agreement”) with five officers, pursuant to which the Bank will credit an amount to a SERP account established on each participant’s behalf while they are actively employed by the Bank for each calendar month from March 1, 2017 until retirement. On March 20, 2019, the Bank entered into a SERP Agreement with one officer, pursuant to which the Bank will credit an amount to a SERP account established for the participant’s behalf while they are actively employed by the Bank for each calendar month from March 1, 2019 until normal retirement age. As of December 31, 2019 and 2018, the Company accrued expenses of $1.4 million and $0.9 million in connection with the SERP.
23.REVENUE RECOGNITION
As disclosed in Footnote 19, as of January 1, 2018, the Company adopted ASU 2014-09, Revenue from Contracts with Customers (Topic 606) and all subsequent ASUs that modified Topic 606. The Company has elected to use the modified retrospective approach with prior period financial statements unadjusted and presented with historical revenue recognition methods. The implementation of the new standard had no material impact on the measurement or recognition of revenue; as such, a cumulative effect adjustment to opening retained earnings was not deemed necessary.
The majority of the Company’s revenues are generated through interest earned on securities and loans, which is explicitly excluded from the scope of the guidance. In addition, certain non-interest income streams such as fees associated with mortgage servicing rights, loan service charges, life insurance earnings, rental income and gains/losses on the sale of loans and securities are not in the scope of the new guidance. The main types of contracts with customers that are in the scope of the new guidance are:
|
· |
Service charges on deposit accounts – Deposit service charges represent fees charged by the Company for the performance obligation of providing services to a customer’s deposit account. The transaction price for deposit services includes both fixed and variable amounts based on the Company’s fee schedules. Revenue is recognized and payment is received either at a point in time for transactional fees or on a monthly basis for non-transactional fees. |
|
· |
Interchange fees – Interchange fees represent fees charged by the Company for customers using debit cards. The contract is between the Company and the processor and the performance obligation is the ability of customers to use debit cards to make purchases at a point in time. The transaction price is a percentage of debit card usage and the processor pays the Company and revenue is recorded throughout the month as the performance obligations are being met. |
|
· |
Fees from trust fiduciary activities – Trust fees represent fees charged by the Company for the management, custody and/or administration of trusts. These are mostly monthly fees based on the market value of assets in the trust account at the prior month end. Payment is generally received a few weeks after month end through a direct charge to customers’ accounts. Estate fees are recognized and charged as the Company reaches each of six different stages of the estate administration process. |
|
· |
Fees from financial services – Financial service fees represent fees charged by the Company for the performance obligation of providing various services for an investment account. Revenue is recognized twice monthly for fees on sales transactions and on a monthly basis for advisory fees and quarterly for trail fees. |
|
· |
Gain/loss on ORE sales – Gain/loss on the sale of ORE is recognized at the closing date when the sales proceeds are received. In seller-financed ORE transactions, the contract is made subject to our normal underwriting standards and pricing. The Company does not have any obligation or right to repurchase any sales of ORE. |
Contract balances
A contract asset balance occurs when an entity performs a service for a customer before the customer pays consideration (resulting in a contract receivable) or before the payment is due (resulting in a contract asset). A contract liability balance is an entity’s obligation to transfer a service to a customer for which the entity already received payment (or payment is due) from the customer. The Company’s non-interest income streams are largely based on transactional activity, or standard month-end revenue accruals such as asset management fees based on month-end market values. Consideration is often
95
received immediately or shortly after the Company satisfies its performance obligation and revenue is recognized. The Company typically does not enter into long-term revenue contracts with customers, and therefore, does not experience significant contract balances. As of December 31, 2019 and 2018, the Company did not have any significant contract balances.
Remaining performance obligations
The Company’s performance obligations have an original expected duration of less than one year and follow the relevant guidance for recognizing revenue over time. There is no variable consideration subject to constraint that is not included in information about transaction price.
Contract acquisition costs
In connection with the adoption of Topic 606, an entity is required to capitalize and subsequently amortize into expense, certain incremental costs of obtaining a contract if these costs are expected to be recovered. The incremental costs of obtaining a contract are those costs that an entity incurs to obtain a contract with a customer that it would not have incurred if the contract had not been obtained (for example, sales commission). The Company utilizes the practical expedient which allows entities to immediately expense contract acquisition costs when the asset that would have resulted from capitalizing these costs would have been amortized in one year or less. Upon adoption of Topic 606, the Company did not capitalize any contract acquisition costs.
24.LEASES
ASU 2016-02 Leases (Topic 842) became effective for the Company on January 1, 2019. For all operating lease contracts where the Company is lessee, a right-of-use (ROU) asset and lease liability was recorded as of the effective date. The Company assumed all renewal terms will be exercised when calculating the ROU assets and lease liabilities. For leases existing at the transition date, any prepaid or deferred rent was added to the ROU asset to calculate the lease liability. The discount rate used to calculate the present value of future payments at the transition date was the Company’s incremental borrowing rate. The Company used the FHLB fixed rate borrowing rates on December 29, 2018 as the discount rate at transition. For all classes of underlying assets, the Company has elected not to record short-term leases (leases with a term of 12 months or less) on the balance sheet when the Company is lessee. Instead, the Company will recognize the lease payment on a straight-line basis over the lease term and variable lease payments in the period in which the obligation for those payments is incurred. For all asset classes, the Company has elected, as a lessee, not to separate nonlease components from lease components and instead to account for each separate lease component and nonlease components associated with that lease component as a single lease component.
Management determines if an arrangement is or contains a lease at contract inception. If an arrangement is determined to be or contains a lease, the Company recognizes a ROU asset and a lease liability when the asset is placed in service.
The Company’s operating leases, where the Company is lessee, include property, land and equipment. As of December 31, 2019, six of the Company’s branch properties were leased under operating leases. In four of the branch leases, the Company leases the land from an unrelated third party, and the buildings are the Company’s own capital improvement. The Company also leases three standalone ATMs under operating leases. Additionally, the Company has two equipment leases classified as finance leases.
The following is an analysis of the leased property under finance leases:
|
|
Asset Balance at |
||||
|
|
December 31, |
||||
|
(dollars in thousands) |
2019 |
2018 |
|||
|
|
|||||
|
Equipment |
$ |
397 |
$ |
375 | |
|
Less accumulated depreciation and amortization |
(117) | (42) | |||
|
Leased property under finance leases, net |
$ |
280 |
$ |
333 | |
|
|
|||||
96
The following is a schedule of future minimum lease payments under finance leases together with the present value of the net minimum lease payments as of December 31, 2019:
|
(dollars in thousands) |
Amount |
|
|
|
||
|
2020 |
$ |
82 |
|
2021 |
82 | |
|
2022 |
82 | |
|
2023 |
56 | |
|
2024 |
- |
|
|
2025 and thereafter |
- |
|
|
|
||
|
Total minimum lease payments (a) |
302 | |
|
|
||
|
Less amount representing interest (b) |
(16) | |
|
|
||
|
Present value of net minimum lease payments |
$ |
286 |
|
|
||
|
(a) |
The future minimum lease payments have not been reduced by estimated executory costs (such as taxes and maintenance) since this amount was deemed immaterial by management. |
|
(b) |
Amount necessary to reduce net minimum lease payments to present value calculated at the Company’s incremental borrowing rate upon lease inception. |
As of December 31, 2019, the Company leased its Green Ridge, Pittston, Peckville, Back Mountain, Mountaintop and Abington branches under the terms of operating leases. The Abington branch has variable lease payments which are calculated as a percentage of the national prime rate of interest which are expensed as incurred.
|
(dollars in thousands) |
December 31, 2019 |
|
|
Lease cost |
||
|
Finance lease cost: |
||
|
Amortization of right-of-use assets |
$ |
75 |
|
Interest on lease liabilities |
10 | |
|
Operating lease cost |
431 | |
|
Short-term lease cost |
18 | |
|
Variable lease cost |
(1) | |
|
Total lease cost |
$ |
533 |
|
|
||
|
Other information |
||
|
Cash paid for amounts included in the measurement of lease liabilities |
||
|
Operating cash flows from finance leases |
$ |
10 |
|
Operating cash flows from operating leases (Fixed payments) |
$ |
349 |
|
Operating cash flows from operating leases (Liability reduction) |
$ |
85 |
|
Financing cash flows from finance leases |
$ |
73 |
|
Right-of-use assets obtained in exchange for new finance lease liabilities |
$ |
6,189 |
|
Right-of-use assets obtained in exchange for new operating lease liabilities |
$ |
22 |
|
Weighted-average remaining lease term - finance leases |
3.67 yrs |
|
|
Weighted average remaining lease term - operating leases |
23.88 yrs |
|
|
Weighted-average discount rate - finance leases |
3.07% | |
|
Weighted-average discount rate - operating leases |
3.78% | |
|
|
During 2019, $498 thousand of the total lease cost is included in premises and equipment expense and $35 thousand is included in other expenses on the consolidated statements of income. Operating lease expense is recognized on a straight-line basis over the lease term. We recognized both the interest expense and amortization expense for finance leases in premises and equipment expense since the interest expense portion was immaterial.
97
The future minimum lease payments for the Company’s branch network and equipment under operating leases that have lease terms in excess of one year as of December 31, 2019 are as follows:
|
(dollars in thousands) |
Amount |
|
|
|
||
|
2020 |
$ |
397 |
|
2021 |
402 | |
|
2022 |
408 | |
|
2023 |
411 | |
|
2024 |
413 | |
|
2025 and thereafter |
8,069 | |
|
|
||
|
Total future minimum lease payments |
10,100 | |
|
|
||
|
Plus variable payment adjustment |
97 | |
|
|
||
|
Less amount representing interest |
(3,641) | |
|
|
||
|
Present value of net future minimum lease payments |
$ |
6,556 |
|
|
||
The Company leases seven properties, where the Company is lessor, under operating leases to unrelated parties. Four are residential properties surrounding the Main Branch that the Company leases on a month-to-month basis and are considered short-term leases. The undiscounted cash flows to be received on an annual basis for the remaining three properties under long-term operating leases are as follows:
|
(dollars in thousands) |
Amount |
|
|
|
||
|
2020 |
$ |
194 |
|
2021 |
189 | |
|
2022 |
60 | |
|
2023 |
48 | |
|
2024 |
51 | |
|
2025 and thereafter |
135 | |
|
|
||
|
Total lease payments to be received |
$ |
677 |
|
|
||
The Company also indirectly originates automobile leases classified as direct finance leases. See Footnote 5, “Loans and leases”, for more information about the Company’s direct finance leases.
Lease income recognized from direct finance leases was included in interest income from loans and leases on the consolidated statements of income. Lease income related to operating leases is included in fees and other revenue on the consolidated statements of income. The Company only receives a variable payment for taxes from one of its lessees, but the amount is immaterial and excluded from rental income. The amount of lease income recognized on the consolidated statements of income was as follows for the periods indicated:
|
|
For the years ended December 31, |
||||
|
(dollars in thousands) |
2019 |
2018 |
|||
|
Lease income - direct finance leases |
|||||
|
Interest income on lease receivables |
$ |
683 |
$ |
580 | |
|
|
|||||
|
Lease income - operating leases |
239 | 217 | |||
|
Total lease income |
$ |
922 |
$ |
797 | |
|
|
|||||
|
|
98
ITEM 9: CHANGES IN AND DISAGREEMENTS WITH ACCOUNTANTS ON ACCOUNTING AND FINANCIAL DISCLOSURE
None
ITEM 9A: CONTROLS AND PROCEDURES
As of the end of the period covered by this Annual Report on Form 10-K, an evaluation was carried out by the Company’s management, with the participation of its President and Chief Executive Officer and the Chief Financial Officer, of the effectiveness of the Company’s disclosure controls and procedures, as defined in Rule 13a-15(e) under the Securities Exchange Act of 1934. Based on such evaluation, the President and Chief Executive Officer and the Chief Financial Officer concluded that the Company’s disclosure controls and procedures are designed to ensure that information required to be disclosed in the reports the Company files or furnishes under the Securities Exchange Act of 1934 is recorded, processed, summarized and reported within the time periods specified in the SEC’s rules and regulations, and are effective. The Company made no changes in its internal controls over financial reporting or in other factors that materially affected, or are reasonably likely to materially affect, these controls during the last fiscal quarter ended December 31, 2019.
Management’s Report on Internal Control Over Financial Reporting
Management of the Company is responsible for establishing and maintaining adequate internal control over financial reporting. The Company’s internal control over financial reporting is a process designed under the supervision of the Company’s President and Chief Executive Officer and the Chief Financial Officer, and implemented in conjunction with management and other personnel, to provide reasonable assurance regarding the reliability of financial reporting and the preparation of the Company’s consolidated financial statements for external purposes in accordance with generally accepted accounting principles.
There are inherent limitations in the effectiveness of any internal control, including the possibility of human error and the circumvention or overriding of controls. Accordingly, even effective internal control can provide only reasonable assurance with respect to financial statement preparation. Further, because of changes in conditions, the effectiveness of internal control may vary over time.
Management assessed the effectiveness of the Company’s internal control over financial reporting as of December 31, 2019. This assessment was based on criteria for effective internal control over financial reporting described in “Internal Control – Integrated Framework,” (2013) issued by the Committee of Sponsoring Organizations of the Treadway Commission (COSO). Based on this assessment, management determined that, as of December 31, 2019, the Company maintained effective internal control over financial reporting.
RSM US LLP, the independent registered public accounting firm that audited our consolidated financial statements as of and for the year ended December 31, 2019 included in this report, has also audited the effectiveness of the Company’s internal control over financial reporting as of December 31, 2019. This report is included in Item 8 under the heading “Report of Independent Registered Public Accounting Firm.”
None
PART III
ITEM 10: DIRECTORS, EXECUTIVE OFFICERS AND CORPORATE GOVERNANCE
The information required in this item is incorporated by reference herein to the information presented in the Company’s definitive Proxy Statement for its 2020 Annual Meeting of Shareholders to be filed with the SEC.
Section 16(a) Beneficial Ownership Reporting Compliance
The information required in this item is incorporated by reference herein to the information presented in the Company’s definitive Proxy Statement for its 2020 Annual Meeting of Shareholders to be filed with the SEC.
Code of Ethics
Pursuant to Item 406 of Regulation S-K, the Company adopted a written code of ethics that applies to our directors, officers and employees, including our chief executive officer and chief financial officer, which is available on our website at http://www.bankatfidelity.com through the Investor Relations link and then under the headings “Other Information”, “Governance Documents.” In addition, copies of our code of ethics will be provided to shareholders upon written request to Fidelity D & D Bancorp, Inc., Blakely and Drinker Streets, Dunmore, PA 18512 at no charge.
ITEM 11: EXECUTIVE COMPENSATION
The information required in this item is incorporated by reference herein to the information presented in the Company’s definitive Proxy Statement for its 2020 annual meeting of shareholders to be filed with the SEC.
99
ITEM 12: SECURITY OWNERSHIP OF CERTAIN BENEFICIAL OWNERS AND MANAGEMENT AND RELATED STOCKHOLDER MATTERS
The information required in this item is incorporated by reference herein to the information presented in the Company’s definitive Proxy Statement for its 2020 annual meeting of shareholders to be filed with the SEC.
Securities authorized for issuance under equity compensation plans
The following table summarizes the Company’s equity compensation plans as of December 31, 2019 that have been approved and not approved by Fidelity D & D Bancorp, Inc. shareholders:
|
|
(a) |
(b) |
(c) |
|
|
Plan Category |
Number of securities to be issued upon exercise of outstanding options, warrants and rights |
Weighted-average exercise price of outstanding options, warrants and rights |
Number of securities remaining available for future issuance under equity compensation plans (excluding securities reflected in column (a)) |
|
|
Equity compensation plans approved by security holders: |
||||
|
2002 Employee Stock Purchase Plan |
3,885 |
$ |
56.45 | 84,480 |
|
2012 Omnibus Stock Incentive Plan |
15,961 |
$ |
47.65 | 705,463 |
|
2012 Omnibus Stock Incentive Plan |
37,538 |
$ |
38.20 | 705,463 |
|
2012 Director Stock Incentive Plan |
11,200 |
$ |
52.10 | 699,400 |
|
Equity compensation plans not approved by security holders - none |
- |
- |
- |
|
|
Total |
68,584 |
$ |
43.70 | 1,489,343 |
ITEM 13: CERTAIN RELATIONSHIPS AND RELATED TRANSACTIONS, AND DIRECTOR INDEPENDENCE
The information required in this item is set forth in Footnote No. 16 “Related Party Transactions”, of Part II, Item 8 “Financial Statements and Supplementary Data”, and the information required by Items 404 and 407(a) of Regulation S-K is incorporated by reference herein to the information presented in the Company’s definitive Proxy Statement for its 2020 annual meeting of shareholders to be filed with the SEC.
ITEM 14: PRINCIPAL ACCOUNTANT FEES AND SERVICES
The information required by this item is incorporated by reference herein, to the information presented in the Company’s definitive Proxy Statement for its 2020 annual meeting of shareholders to be filed with the SEC.
PART IV
ITEM 15: EXHIBITS AND FINANCIAL STATEMENT SCHEDULES
(a) (1) Financial Statements - The following financial statements are included by reference in Part II, Item 8 hereof:
|
|
Report of Independent Registered Public Accounting Firm |
|
|
Consolidated Balance Sheets |
|
|
Consolidated Statements of Income |
|
|
Consolidated Statements of Comprehensive Income |
|
|
Consolidated Statements of Changes in Shareholders’ Equity |
|
|
Consolidated Statements of Cash Flows |
|
|
Notes to Consolidated Financial Statements |
(2) Financial Statement Schedules
Financial Statement Schedules are omitted because the required information is either not applicable, the data is not significant or the required information is shown in the respective financial statements or in the notes thereto or elsewhere herein.
100
(3) Exhibits
The following exhibits are filed herewith or incorporated by reference as a part of this Form 10-K:
2.1 Agreement and Plan of Reorganization by and among Fidelity D & D Bancorp, Inc., The Fidelity Deposit and Discount Bank, MNB Corporation and Merchants Bank of Bangor dated as of December 9, 2019. Incorporated by reference to Annex A of the Registrant’s Registration Statement No. 333-236453 on Form S-4, filed with the Commission on February 14, 2020. (Schedules have been omitted pursuant to Item 601(b)(2) of Regulation S-K. Fidelity agrees to furnish supplementally to the SEC a copy of any omitted schedule upon request.)
101
13 Annual Report to Shareholders. Incorporated by reference to the 2019 Annual Report to Shareholders filed with the SEC on Form ARS.
21 Subsidiaries of the Registrant, filed herewith.
23 Consent of RSM US LLP, filed herewith.
31.1 Rule 13a-14(a) Certification of Principal Executive Officer, filed herewith.
31.2 Rule 13a-14(a) Certification of Principal Financial Officer, filed herewith.
101 Interactive data files: The following, from Fidelity D&D Bancorp, Inc.’s. Annual Report on Form 10-K for the year ended December 31, 2019, is formatted in XBRL (eXtensible Business Reporting Language): Consolidated Balance Sheets as of December 31, 2019 and 2018; Consolidated Statements of Income for the years ended December 31, 2019, 2018 and 2017; Consolidated Statements of Comprehensive Income for the years ended December 31, 2019, 2018 and 2017; Consolidated Statements of Changes in Shareholders’ Equity for the years ended December 31, 2019, 2018 and 2017; Consolidated Statements of Cash Flows for the years ended December 31, 2019, 2018 and 2017 and the Notes to the Consolidated Financial Statements.
(b)The exhibits required to be filed by this Item are listed under Item 15(a) 3, above.
(c)Not applicable.
_________________________
* Management contract or compensatory plan or arrangement.
None.
102
Pursuant to the requirements of Section 13 or 15(d) of the Securities and Exchange Act of 1934, the registrant has duly caused this report to be signed on its behalf by the undersigned, thereunto duly authorized.
|
|
FIDELITY D & D BANCORP, INC. |
|
|||
|
|
(Registrant) |
|
|||
|
|
|
|
|||
|
|
|
|
|||
|
Date: March 13, 2020 |
By: |
/s/ Daniel J. Santaniello |
|
||
|
|
|
Daniel J. Santaniello, |
|||
|
|
|
President and Chief Executive Officer |
|||
|
|
|
|
|||
|
|
|
|
|||
|
Date: March 13, 2020 |
By: |
/s/ Salvatore R. DeFrancesco, Jr. |
|
||
|
|
|
Salvatore R. DeFrancesco, Jr., |
|||
|
|
|
Treasurer and Chief Financial Officer |
|||
Pursuant to the requirements of the Securities and Exchange Act of 1934, this report has been signed below by the following person on behalf of the registrant and in the capacities and on the dates indicated.
|
|
DATE |
|
||
|
|
|
|
||
|
By: |
/s/ Daniel J. Santaniello |
|
March 13, 2020 |
|
|
|
Daniel J. Santaniello, President and Chief |
|
|
|
|
|
Executive Officer |
|
|
|
|
|
|
|
||
|
By: |
/s/ Salvatore R. DeFrancesco, Jr. |
|
March 13, 2020 |
|
|
|
Salvatore R. DeFrancesco, Jr., Treasurer |
|
|
|
|
|
and Chief Financial Officer |
|
|
|
|
|
|
|
||
|
By: |
/s/ Brian J. Cali |
|
March 13, 2020 |
|
|
|
Brian J. Cali, Chairman of the |
|
|
|
|
|
Board of Directors and Director |
|
|
|
|
|
|
|
|
|
|
By: |
/s/ John T. Cognetti |
|
March 13, 2020 |
|
|
|
John T. Cognetti, Secretary and Director |
|
|
|
|
|
|
|
|
|
|
By: |
/s/ David L. Tressler |
March 13, 2020 |
|
|
|
|
David L. Tressler, Director |
|
|
|
|
|
|
|
||
|
By: |
/s/ Michael J. McDonald |
|
March 13, 2020 |
|
|
|
Michael J. McDonald, Vice Chairman |
|
|
|
|
|
of the Board of Directors and Director |
|
|
|
|
|
|
|
||
|
By: |
/s/ Mary E. McDonald |
|
March 13, 2020 |
|
|
|
Mary E. McDonald, Assistant Secretary and Director |
|
|
|
|
|
|
|
||
|
By: |
/s/ Patrick J. Dempsey |
|
March 13, 2020 |
|
|
Patrick J. Dempsey, Director |
||||
|
|
|
|
|
|
|
By: |
/s/ Kristin Dempsey O’Donnell |
|
March 13, 2020 |
|
|
|
Kristin Dempsey O’Donnell, Director |
|||
|
|
|
|
|
|
|
By: |
/s/ Richard Lettieri |
|
March 13, 2020 |
|
|
|
Richard Lettieri, Director |
|||
|
|
||||
|
By: |
/s/ William Joyce, Sr. |
March 13, 2020 |
||
|
|
William Joyce, Sr., Director |
|||
|
|
||||
103