00001076872022FYfalse0.0156906http://fasb.org/us-gaap/2022#OtherAssetsNoncurrenthttp://fasb.org/us-gaap/2022#OtherAssetsNoncurrenthttp://fasb.org/us-gaap/2022#AccruedLiabilitiesCurrenthttp://fasb.org/us-gaap/2022#AccruedLiabilitiesCurrenthttp://fasb.org/us-gaap/2022#AccruedLiabilitiesCurrenthttp://fasb.org/us-gaap/2022#AccruedLiabilitiesCurrenthttp://fasb.org/us-gaap/2022#OtherLiabilitiesNoncurrenthttp://fasb.org/us-gaap/2022#OtherLiabilitiesNoncurrent00001076872021-08-292022-08-2700001076872022-02-26iso4217:USD00001076872022-10-13xbrli:shares00001076872020-08-302021-08-2800001076872019-09-012020-08-29iso4217:USDxbrli:shares00001076872022-08-2700001076872021-08-2800001076872020-08-2900001076872019-08-310000107687us-gaap:CommonStockMember2019-08-310000107687us-gaap:AdditionalPaidInCapitalMember2019-08-310000107687us-gaap:RetainedEarningsMember2019-08-310000107687us-gaap:AccumulatedOtherComprehensiveIncomeMember2019-08-310000107687us-gaap:TreasuryStockCommonMember2019-08-310000107687us-gaap:AdditionalPaidInCapitalMember2019-09-012020-08-290000107687us-gaap:TreasuryStockCommonMember2019-09-012020-08-290000107687us-gaap:RetainedEarningsMember2019-09-012020-08-290000107687us-gaap:AccumulatedOtherComprehensiveIncomeMember2019-09-012020-08-290000107687us-gaap:CommonStockMember2020-08-290000107687us-gaap:AdditionalPaidInCapitalMember2020-08-290000107687us-gaap:RetainedEarningsMember2020-08-290000107687us-gaap:AccumulatedOtherComprehensiveIncomeMember2020-08-290000107687us-gaap:TreasuryStockCommonMember2020-08-290000107687us-gaap:AdditionalPaidInCapitalMember2020-08-302021-08-280000107687us-gaap:TreasuryStockCommonMember2020-08-302021-08-280000107687us-gaap:RetainedEarningsMember2020-08-302021-08-280000107687us-gaap:AccumulatedOtherComprehensiveIncomeMember2020-08-302021-08-280000107687us-gaap:CommonStockMember2021-08-280000107687us-gaap:AdditionalPaidInCapitalMember2021-08-280000107687us-gaap:RetainedEarningsMember2021-08-280000107687us-gaap:AccumulatedOtherComprehensiveIncomeMember2021-08-280000107687us-gaap:TreasuryStockCommonMember2021-08-280000107687us-gaap:AdditionalPaidInCapitalMember2021-08-292022-08-270000107687us-gaap:TreasuryStockCommonMember2021-08-292022-08-270000107687us-gaap:RetainedEarningsMember2021-08-292022-08-270000107687us-gaap:AccumulatedOtherComprehensiveIncomeMember2021-08-292022-08-270000107687us-gaap:CommonStockMember2022-08-270000107687us-gaap:AdditionalPaidInCapitalMember2022-08-270000107687us-gaap:RetainedEarningsMember2022-08-270000107687us-gaap:AccumulatedOtherComprehensiveIncomeMember2022-08-270000107687us-gaap:TreasuryStockCommonMember2022-08-270000107687us-gaap:BuildingAndBuildingImprovementsMembersrt:MinimumMember2021-08-292022-08-270000107687us-gaap:BuildingAndBuildingImprovementsMembersrt:MaximumMember2021-08-292022-08-270000107687us-gaap:MachineryAndEquipmentMembersrt:MinimumMember2021-08-292022-08-270000107687us-gaap:MachineryAndEquipmentMembersrt:MaximumMember2021-08-292022-08-270000107687us-gaap:SoftwareAndSoftwareDevelopmentCostsMembersrt:MinimumMember2021-08-292022-08-270000107687us-gaap:SoftwareAndSoftwareDevelopmentCostsMembersrt:MaximumMember2021-08-292022-08-270000107687us-gaap:TransportationEquipmentMembersrt:MinimumMember2021-08-292022-08-270000107687us-gaap:TransportationEquipmentMembersrt:MaximumMember2021-08-292022-08-2700001076872022-05-292022-08-2700001076872020-05-300000107687srt:ScenarioForecastMemberus-gaap:AccountingStandardsUpdate202006Member2022-11-260000107687srt:ScenarioForecastMemberus-gaap:AccountingStandardsUpdate202006Member2022-08-282023-08-260000107687wgo:BarlettaBoatCompanyLLCAndThreeLimesLLCMember2021-08-31xbrli:pure0000107687wgo:BarlettaBoatCompanyLLCAndThreeLimesLLCMember2021-08-312021-08-310000107687wgo:BarlettaBoatCompanyLLCAndThreeLimesLLCMemberwgo:EarnoutPaidInStockMember2021-08-310000107687wgo:BarlettaBoatCompanyLLCAndThreeLimesLLCMemberwgo:EarnoutPaidInCashMember2021-08-310000107687wgo:BarlettaBoatCompanyLLCAndThreeLimesLLCMember2022-08-270000107687wgo:BarlettaBoatCompanyLLCAndThreeLimesLLCMemberus-gaap:OtherCurrentLiabilitiesMember2022-08-270000107687wgo:BarlettaBoatCompanyLLCAndThreeLimesLLCMemberus-gaap:OtherNoncurrentLiabilitiesMember2022-08-270000107687wgo:BarlettaBoatCompanyLLCAndThreeLimesLLCMemberus-gaap:CommonStockMember2022-02-272022-05-280000107687wgo:DealerNetworkMemberwgo:BarlettaBoatCompanyLLCAndThreeLimesLLCMember2021-08-312021-08-310000107687wgo:BarlettaBoatCompanyLLCAndThreeLimesLLCMemberus-gaap:OrderOrProductionBacklogMember2021-08-292022-08-270000107687wgo:BarlettaBoatCompanyLLCAndThreeLimesLLCMember2021-08-292021-11-270000107687wgo:BarlettaBoatCompanyLLCAndThreeLimesLLCMember2021-05-302021-08-280000107687wgo:NewmarCorporationDutchRealEstateCorp.NewWayTransportandNewServMember2019-11-080000107687wgo:NewmarCorporationDutchRealEstateCorp.NewWayTransportandNewServMember2019-11-082019-11-080000107687wgo:MotorhomeSegmentMemberwgo:NewmarCorporationDutchRealEstateCorp.NewWayTransportandNewServMember2019-09-012020-08-290000107687wgo:NewmarCorporationDutchRealEstateCorp.NewWayTransportandNewServMember2019-09-012020-08-290000107687wgo:AmortizationofIntangibles1YearorLessUsefulLifeMemberwgo:NewmarCorporationDutchRealEstateCorp.NewWayTransportandNewServMember2019-09-012020-08-290000107687wgo:NewmarCorporationDutchRealEstateCorp.NewWayTransportandNewServMemberwgo:IncreaseinAmortizationofIntangiblesMember2019-09-012020-08-290000107687wgo:NewmarCorporationDutchRealEstateCorp.NewWayTransportandNewServMemberwgo:ExpensesRelatedtoBusinessCombinationMember2019-09-012020-08-290000107687wgo:InteresttoReflectNewDebtStructureMemberwgo:NewmarCorporationDutchRealEstateCorp.NewWayTransportandNewServMember2019-09-012020-08-290000107687wgo:NewmarCorporationDutchRealEstateCorp.NewWayTransportandNewServMemberwgo:TaxesRelatedtotheAdjustmentstoTheProFormaMember2019-09-012020-08-29wgo:segment0000107687wgo:TowableSegmentMemberus-gaap:OperatingSegmentsMember2021-08-292022-08-270000107687wgo:TowableSegmentMemberus-gaap:OperatingSegmentsMember2020-08-302021-08-280000107687wgo:TowableSegmentMemberus-gaap:OperatingSegmentsMember2019-09-012020-08-290000107687wgo:MotorhomeSegmentMemberus-gaap:OperatingSegmentsMember2021-08-292022-08-270000107687wgo:MotorhomeSegmentMemberus-gaap:OperatingSegmentsMember2020-08-302021-08-280000107687wgo:MotorhomeSegmentMemberus-gaap:OperatingSegmentsMember2019-09-012020-08-290000107687wgo:MarineSegmentMemberus-gaap:OperatingSegmentsMember2021-08-292022-08-270000107687wgo:MarineSegmentMemberus-gaap:OperatingSegmentsMember2020-08-302021-08-280000107687wgo:MarineSegmentMemberus-gaap:OperatingSegmentsMember2019-09-012020-08-290000107687wgo:CorporateAndReconcilingItemsMember2021-08-292022-08-270000107687wgo:CorporateAndReconcilingItemsMember2020-08-302021-08-280000107687wgo:CorporateAndReconcilingItemsMember2019-09-012020-08-290000107687wgo:TowableSegmentMemberus-gaap:OperatingSegmentsMember2022-08-270000107687wgo:TowableSegmentMemberus-gaap:OperatingSegmentsMember2021-08-280000107687wgo:MotorhomeSegmentMemberus-gaap:OperatingSegmentsMember2022-08-270000107687wgo:MotorhomeSegmentMemberus-gaap:OperatingSegmentsMember2021-08-280000107687wgo:MarineSegmentMemberus-gaap:OperatingSegmentsMember2022-08-270000107687wgo:MarineSegmentMemberus-gaap:OperatingSegmentsMember2021-08-280000107687wgo:CorporateAndReconcilingItemsMember2022-08-270000107687wgo:CorporateAndReconcilingItemsMember2021-08-280000107687country:US2021-08-292022-08-270000107687country:US2020-08-302021-08-280000107687country:US2019-09-012020-08-290000107687us-gaap:NonUsMember2021-08-292022-08-270000107687us-gaap:NonUsMember2020-08-302021-08-280000107687us-gaap:NonUsMember2019-09-012020-08-290000107687us-gaap:FairValueMeasurementsRecurringMember2022-08-270000107687us-gaap:FairValueMeasurementsRecurringMemberus-gaap:FairValueInputsLevel1Member2022-08-270000107687us-gaap:FairValueInputsLevel2Memberus-gaap:FairValueMeasurementsRecurringMember2022-08-270000107687us-gaap:FairValueInputsLevel3Memberus-gaap:FairValueMeasurementsRecurringMember2022-08-270000107687us-gaap:FairValueMeasurementsRecurringMember2021-08-280000107687us-gaap:FairValueMeasurementsRecurringMemberus-gaap:FairValueInputsLevel1Member2021-08-280000107687us-gaap:FairValueInputsLevel2Memberus-gaap:FairValueMeasurementsRecurringMember2021-08-280000107687us-gaap:FairValueInputsLevel3Memberus-gaap:FairValueMeasurementsRecurringMember2021-08-280000107687us-gaap:FairValueMeasurementsNonrecurringMember2021-08-292022-08-270000107687us-gaap:FairValueMeasurementsNonrecurringMember2019-09-012020-08-290000107687us-gaap:FairValueMeasurementsNonrecurringMember2020-08-302021-08-280000107687us-gaap:LandMember2022-08-270000107687us-gaap:LandMember2021-08-280000107687us-gaap:BuildingAndBuildingImprovementsMember2022-08-270000107687us-gaap:BuildingAndBuildingImprovementsMember2021-08-280000107687us-gaap:MachineryAndEquipmentMember2022-08-270000107687us-gaap:MachineryAndEquipmentMember2021-08-280000107687us-gaap:SoftwareAndSoftwareDevelopmentCostsMember2022-08-270000107687us-gaap:SoftwareAndSoftwareDevelopmentCostsMember2021-08-280000107687us-gaap:TransportationEquipmentMember2022-08-270000107687us-gaap:TransportationEquipmentMember2021-08-280000107687us-gaap:ConstructionInProgressMember2022-08-270000107687us-gaap:ConstructionInProgressMember2021-08-280000107687wgo:TowableSegmentMember2020-08-290000107687wgo:MotorhomeSegmentMember2020-08-290000107687wgo:MarineSegmentMember2020-08-290000107687wgo:TowableSegmentMember2021-08-280000107687wgo:MotorhomeSegmentMember2021-08-280000107687wgo:MarineSegmentMember2021-08-280000107687wgo:TowableSegmentMember2021-08-292022-08-270000107687wgo:MotorhomeSegmentMember2021-08-292022-08-270000107687wgo:MarineSegmentMember2021-08-292022-08-270000107687wgo:TowableSegmentMember2022-08-270000107687wgo:MotorhomeSegmentMember2022-08-270000107687wgo:MarineSegmentMember2022-08-270000107687us-gaap:TradeNamesMember2022-08-270000107687wgo:DealerNetworkMember2022-08-270000107687us-gaap:OrderOrProductionBacklogMember2022-08-270000107687us-gaap:NoncompeteAgreementsMember2022-08-270000107687us-gaap:TradeNamesMember2021-08-280000107687wgo:DealerNetworkMember2021-08-280000107687us-gaap:OrderOrProductionBacklogMember2021-08-280000107687us-gaap:NoncompeteAgreementsMember2021-08-280000107687wgo:ABLCreditFacilityMember2022-07-140000107687wgo:ABLCreditFacilityMember2022-07-150000107687wgo:ABLCreditFacilityMemberus-gaap:LetterOfCreditMember2022-07-150000107687wgo:ABLCreditFacilityMembersrt:MinimumMemberus-gaap:LetterOfCreditMember2022-07-152022-07-150000107687wgo:ABLCreditFacilityMember2022-07-152022-07-150000107687wgo:ABLCreditFacilityMembersrt:MinimumMember2022-07-152022-07-150000107687wgo:ABLCreditFacilityMembersrt:MaximumMember2022-07-152022-07-150000107687wgo:SeniorSecuredNotesDue2028Memberus-gaap:SeniorNotesMember2020-07-080000107687wgo:SeniorSecuredNotesDue2028Memberus-gaap:SeniorNotesMember2020-07-082020-07-080000107687wgo:ConvertibleSeniorNotesDue2025Member2019-11-010000107687wgo:ConvertibleSeniorNotesDue2025Member2019-11-012019-11-010000107687wgo:ConvertibleSeniorNotesDue2025Membersrt:MinimumMember2019-11-012019-11-01wgo:day0000107687wgo:ConvertibleSeniorNotesDue2025Membersrt:MaximumMember2019-11-012019-11-010000107687wgo:ConvertibleNoteHedgeTransactionsMemberwgo:ConvertibleSeniorNotesDue2025Member2019-10-292019-10-300000107687us-gaap:WarrantMemberwgo:CallSpreadTransactionsMember2019-10-292019-10-300000107687wgo:CallSpreadTransactionsMember2019-10-292019-10-300000107687wgo:ConvertibleSeniorNotesDue2025Memberwgo:CallSpreadTransactionsMember2019-10-292019-10-300000107687wgo:ConvertibleSeniorNotesDue2025Memberwgo:CallSpreadTransactionsMember2019-11-012019-11-010000107687wgo:ConvertibleSeniorNotesDue2025Memberwgo:CallSpreadTransactionsMember2019-11-010000107687wgo:CallSpreadTransactionsMember2019-11-010000107687wgo:ABLCreditFacilityMember2022-08-270000107687wgo:ABLCreditFacilityMember2021-08-280000107687wgo:SeniorSecuredNotesDue2028Member2022-08-270000107687wgo:SeniorSecuredNotesDue2028Member2021-08-280000107687wgo:ConvertibleSeniorNotesDue2025Member2022-08-270000107687wgo:ConvertibleSeniorNotesDue2025Member2021-08-28utr:Rate0000107687wgo:RelatedPartyAmountMember2022-08-270000107687wgo:NonRelatedPartyAmountMember2022-08-270000107687wgo:KeyEmployeesMemberus-gaap:OtherPostretirementBenefitPlansDefinedBenefitMember2021-08-292022-08-270000107687wgo:KeyEmployeesMemberus-gaap:OtherPostretirementBenefitPlansDefinedBenefitMember2020-08-302021-08-280000107687wgo:KeyEmployeesMemberus-gaap:OtherPostretirementBenefitPlansDefinedBenefitMember2019-09-012020-08-290000107687us-gaap:SupplementalEmployeeRetirementPlanDefinedBenefitMemberwgo:OfficersAndManagersMember2021-08-292022-08-270000107687wgo:OfficersAndKeyEmployeesMemberwgo:ExecutiveDeferredCompensationPlan2007Member2021-08-292022-08-270000107687wgo:OfficersAndKeyEmployeesMemberwgo:ExecutiveDeferredCompensationPlan2007Member2022-08-270000107687wgo:OfficersAndKeyEmployeesMemberwgo:ExecutiveDeferredCompensationPlan2007Member2021-08-280000107687wgo:ObligationToRepurchaseFromDealersMember2022-08-270000107687wgo:ObligationToRepurchaseFromDealersMember2021-08-28wgo:recreationVehicle0000107687wgo:FifthWheelMemberwgo:TowableSegmentMemberus-gaap:OperatingSegmentsMember2021-08-292022-08-270000107687wgo:FifthWheelMemberwgo:TowableSegmentMemberus-gaap:OperatingSegmentsMember2020-08-302021-08-280000107687wgo:FifthWheelMemberwgo:TowableSegmentMemberus-gaap:OperatingSegmentsMember2019-09-012020-08-290000107687wgo:TravelTrailerMemberwgo:TowableSegmentMemberus-gaap:OperatingSegmentsMember2021-08-292022-08-270000107687wgo:TravelTrailerMemberwgo:TowableSegmentMemberus-gaap:OperatingSegmentsMember2020-08-302021-08-280000107687wgo:TravelTrailerMemberwgo:TowableSegmentMemberus-gaap:OperatingSegmentsMember2019-09-012020-08-290000107687us-gaap:ProductAndServiceOtherMemberwgo:TowableSegmentMemberus-gaap:OperatingSegmentsMember2021-08-292022-08-270000107687us-gaap:ProductAndServiceOtherMemberwgo:TowableSegmentMemberus-gaap:OperatingSegmentsMember2020-08-302021-08-280000107687us-gaap:ProductAndServiceOtherMemberwgo:TowableSegmentMemberus-gaap:OperatingSegmentsMember2019-09-012020-08-290000107687wgo:MotorhomeSegmentMemberwgo:ClassAMemberus-gaap:OperatingSegmentsMember2021-08-292022-08-270000107687wgo:MotorhomeSegmentMemberwgo:ClassAMemberus-gaap:OperatingSegmentsMember2020-08-302021-08-280000107687wgo:MotorhomeSegmentMemberwgo:ClassAMemberus-gaap:OperatingSegmentsMember2019-09-012020-08-290000107687wgo:MotorhomeSegmentMemberwgo:ClassBMemberus-gaap:OperatingSegmentsMember2021-08-292022-08-270000107687wgo:MotorhomeSegmentMemberwgo:ClassBMemberus-gaap:OperatingSegmentsMember2020-08-302021-08-280000107687wgo:MotorhomeSegmentMemberwgo:ClassBMemberus-gaap:OperatingSegmentsMember2019-09-012020-08-290000107687wgo:MotorhomeSegmentMemberwgo:ClassCAndOtherMemberus-gaap:OperatingSegmentsMember2021-08-292022-08-270000107687wgo:MotorhomeSegmentMemberwgo:ClassCAndOtherMemberus-gaap:OperatingSegmentsMember2020-08-302021-08-280000107687wgo:MotorhomeSegmentMemberwgo:ClassCAndOtherMemberus-gaap:OperatingSegmentsMember2019-09-012020-08-290000107687wgo:IncentiveCompensationPlan2019Member2018-12-110000107687us-gaap:EmployeeStockOptionMember2021-08-292022-08-270000107687us-gaap:PerformanceSharesMember2021-08-292022-08-270000107687srt:DirectorMemberwgo:TimeBasedShareAwardsMember2021-08-292022-08-270000107687us-gaap:EmployeeStockMember2021-08-292022-08-270000107687us-gaap:EmployeeStockMember2020-08-302021-08-280000107687us-gaap:EmployeeStockMember2022-08-270000107687us-gaap:EmployeeStockMember2021-08-280000107687wgo:TimeBasedShareAwardsMember2021-08-292022-08-270000107687wgo:TimeBasedShareAwardsMember2020-08-302021-08-280000107687wgo:TimeBasedShareAwardsMember2019-09-012020-08-290000107687us-gaap:PerformanceSharesMember2020-08-302021-08-280000107687us-gaap:PerformanceSharesMember2019-09-012020-08-290000107687us-gaap:EmployeeStockOptionMember2020-08-302021-08-280000107687us-gaap:EmployeeStockOptionMember2019-09-012020-08-290000107687wgo:OtherEquityAwardsMember2021-08-292022-08-270000107687wgo:OtherEquityAwardsMember2020-08-302021-08-280000107687wgo:OtherEquityAwardsMember2019-09-012020-08-290000107687wgo:TimeBasedShareAwardsMember2021-08-280000107687wgo:TimeBasedShareAwardsMember2022-08-270000107687us-gaap:PerformanceSharesMember2021-08-280000107687us-gaap:PerformanceSharesMember2022-08-270000107687wgo:FacilityRelocationMember2020-08-302021-08-280000107687us-gaap:AccumulatedDefinedBenefitPlansAdjustmentMember2021-08-280000107687us-gaap:AccumulatedDefinedBenefitPlansAdjustmentMember2020-08-290000107687us-gaap:AccumulatedDefinedBenefitPlansAdjustmentMember2021-08-292022-08-270000107687us-gaap:AccumulatedDefinedBenefitPlansAdjustmentMember2020-08-302021-08-280000107687us-gaap:AccumulatedDefinedBenefitPlansAdjustmentMember2022-08-270000107687us-gaap:ReclassificationOutOfAccumulatedOtherComprehensiveIncomeMemberus-gaap:AccumulatedDefinedBenefitPlansAdjustmentMember2021-08-292022-08-270000107687us-gaap:ReclassificationOutOfAccumulatedOtherComprehensiveIncomeMemberus-gaap:AccumulatedDefinedBenefitPlansAdjustmentMember2020-08-302021-08-280000107687us-gaap:ReclassificationOutOfAccumulatedOtherComprehensiveIncomeMemberus-gaap:AccumulatedDefinedBenefitPlansAdjustmentMember2019-09-012020-08-290000107687us-gaap:ReclassificationOutOfAccumulatedOtherComprehensiveIncomeMemberus-gaap:AccumulatedGainLossNetCashFlowHedgeParentMember2021-08-292022-08-270000107687us-gaap:ReclassificationOutOfAccumulatedOtherComprehensiveIncomeMemberus-gaap:AccumulatedGainLossNetCashFlowHedgeParentMember2020-08-302021-08-280000107687us-gaap:ReclassificationOutOfAccumulatedOtherComprehensiveIncomeMemberus-gaap:AccumulatedGainLossNetCashFlowHedgeParentMember2019-09-012020-08-290000107687us-gaap:ReclassificationOutOfAccumulatedOtherComprehensiveIncomeMember2021-08-292022-08-270000107687us-gaap:ReclassificationOutOfAccumulatedOtherComprehensiveIncomeMember2020-08-302021-08-280000107687us-gaap:ReclassificationOutOfAccumulatedOtherComprehensiveIncomeMember2019-09-012020-08-29
UNITED STATES
SECURITIES AND EXCHANGE COMMISSION
Washington, D.C. 20549
FORM 10-K
(Mark One)
☒ ANNUAL REPORT PURSUANT TO SECTION 13 OR 15(D) OF THE SECURITIES EXCHANGE ACT OF 1934
For the fiscal year ended August 27, 2022;
or
☐ TRANSITION REPORT PURSUANT TO SECTION 13 OR 15(D) OF THE SECURITIES EXCHANGE ACT OF 1934
For the transition period from ___________________ to _______________________
Commission File Number 001-06403
WINNEBAGO INDUSTRIES, INC.
(Exact name of registrant as specified in its charter) | | | | | | | | | | | | | | |
| Minnesota | | 42-0802678 |
| (State or other jurisdiction of | | (I.R.S. Employer Identification No.) |
| incorporation or organization) | | |
| | | | |
| 13200 Pioneer Trail | Eden Prairie | Minnesota | | 55347 |
| (Address of principal executive offices) | | (Zip Code) |
Registrant's telephone number, including area code: (952) 829-8600
Securities registered pursuant to Section 12(b) of the Act: | | | | | | | | |
| Title of each class | Trading Symbol(s) | Name of each exchange on which registered |
| Common Stock, $0.50 par value per share | WGO | New York Stock Exchange |
Securities registered pursuant to Section 12(g) of the Act: None
Indicate by check mark if the registrant is a well-known seasoned issuer, as defined in Rule 405 of the Securities Act. Yes ☒ No ☐
Indicate by check mark if the registrant is not required to file reports pursuant to Section 13 or Section 15(d) of the Act. Yes ☐ No ☒
Indicate by check mark whether the registrant (1) has filed all reports required to be filed by Section 13 or 15(d) of the Securities Exchange Act of 1934 during the preceding 12 months (or for such shorter period that the registrant was required to file such reports), and (2) has been subject to such filing requirements for the past 90 days. Yes ☒ No ☐
Indicate by check mark whether the registrant has submitted electronically every Interactive Data File required to be submitted pursuant to Rule 405 of Regulation S-T (§232.405 of this chapter) during the preceding 12 months (or for such shorter period that the registrant was required to submit such files). Yes ☒ No ☐
Indicate by check mark whether the registrant is a large accelerated filer, an accelerated filer, a non-accelerated filer, a smaller reporting company, or an emerging growth company. See the definitions of "large accelerated filer," "accelerated filer," "smaller reporting company," and "emerging growth company" in Rule 12b-2 of the Exchange Act.
Large Accelerated Filer ☒ Accelerated Filer ☐ Non-accelerated filer ☐ Smaller Reporting Company ☐ Emerging Growth Company ☐
If an emerging growth company, indicate by check mark if the registrant has elected not to use the extended transition period for complying with any new or revised financial accounting standards provided pursuant to Section 13(a) of the Exchange Act. ☐
Indicate by check mark whether the registrant has filed a report on and attestation to its management’s assessment of the effectiveness of its internal control over financial reporting under Section 404(b) of the Sarbanes-Oxley Act (15 U.S.C. 7262(b)) by the registered public accounting firm that prepared or issued its audit report. ☒
Indicate by check mark whether the registrant is a shell company (as defined in Rule 12b-2 of the Exchange Act). Yes ☐ No ☒
The aggregate market value of the registrant's common stock held by non-affiliates of the registrant was approximately $2,003,293,000 as of February 26, 2022, based upon the closing price of $63.00 as of February 25, 2022 as reported on the New York Stock Exchange.
As of October 13, 2022, 30,507,424 shares of the registrant's common stock, par value $0.50 per share, were outstanding.
DOCUMENTS INCORPORATED BY REFERENCE
Portions of the definitive Proxy Statement to be filed with the Securities and Exchange Commission within 120 days after the end of the fiscal year covered by this report for the registrant's 2022 Annual Meeting of Shareholders to be held on December 13, 2022 (the "2022 Proxy Statement") are incorporated by reference into Part III of this Annual Report on Form 10-K.
Winnebago Industries, Inc.
Fiscal 2022 Annual Report on Form 10-K
Table of Contents
WINNEBAGO INDUSTRIES, INC.
FORM 10-K
Report for the Fiscal Year Ended August 27, 2022
Safe Harbor Statement Under the Private Securities Litigation Reform Act
Certain of the matters discussed in this Annual Report on Form 10-K are "forward-looking statements" within the meaning of Section 27A of the Securities Act of 1933, as amended (“Securities Act”), and Section 21E of the Securities Exchange Act of 1934, as amended (“Exchange Act”), which involve risks and uncertainties. With the exception of historical information, the matters discussed in this Annual Report on Form 10-K are forward-looking statements and may be identified by the use of words such as "anticipate," "assume," "believe," "estimate," "expect," "guidance," "intend," "outlook," "plan," "project," and other words and terms of similar meaning. Such statements reflect our current views and estimates with respect to future market conditions, company performance and financial results, operational investments, business prospects, new strategies, the competitive environment, and other events. These statements are subject to certain risks and uncertainties that could cause actual results to differ materially from the potential results discussed in such forward-looking statements. Readers should review Item 1A, Risk Factors, in this Annual Report on Form 10-K for the fiscal year ended August 27, 2022, for a description of important factors that could cause our actual results to differ materially from those contemplated by the forward-looking statements made in this Annual Report on Form 10-K. Among the factors that could cause actual results and outcomes to differ materially from those contained in such forward-looking statements are the following:
•General economic uncertainty in key markets and a worsening of domestic and global economic conditions or low levels of economic growth.
•Uncertainty surrounding the COVID-19 pandemic.
•Availability of financing for RV and marine dealers.
•Ability to innovate and commercialize new products.
•Ability to manage our inventory to meet demand.
•Competition and new product introductions by competitors.
•Risk related to cyclicality and seasonality of our business.
•Risk related to independent dealers.
•Significant increase in repurchase obligations.
•Business or production disruptions.
•Inadequate inventory and distribution channel management.
•Ability to retain relationships with our suppliers.
•Increased material and component costs, including availability and price of fuel and other raw materials.
•Ability to integrate mergers and acquisitions.
•Ability to attract and retain qualified personnel and changes in market compensation rates.
•Exposure to warranty claims.
•Ability to protect our information technology systems from data security, cyberattacks, and network disruption risks and the ability to successfully upgrade and evolve our information technology systems.
•Ability to retain brand reputation and related exposure to product liability claims.
•Governmental regulation, including for climate change.
•Impairment of goodwill and trade names.
•Risks related to our Convertible and Senior Secured Notes, including our ability to satisfy our obligations under these notes.
Although we believe that the expectations reflected in the "forward-looking statements" are reasonable, we cannot guarantee future results, levels of activity, performance, or achievements. Undue reliance should not be placed on these "forward-looking statements," which speak only as of the date of this report. We undertake no obligation to publicly update or revise any "forward-looking statements," whether as a result of new information, future events, or otherwise, except as required by law or the rules of the New York Stock Exchange. We advise you to consult any further disclosures made on related subjects in future quarterly reports on Form 10-Q and current reports on Form 8-K that are filed or furnished with the U.S. Securities and Exchange Commission ("SEC").
PART I
Item 1. Business.
General
The use of terms "Winnebago Industries," "Winnebago," "we," "our," and "us" in this Annual Report on Form 10-K, unless the context otherwise requires, refer to Winnebago Industries, Inc. and its wholly-owned subsidiaries.
Winnebago Industries, Inc. is one of the leading North American manufacturers of recreation vehicles ("RV"s) and marine products with a diversified portfolio used primarily in leisure travel and outdoor recreational activities. We produce our towable units in Indiana; our motorhome units in Iowa and Indiana; and our marine units in Indiana and Florida. We distribute our RV and marine products primarily through independent dealers throughout the U.S. and Canada, who then retail the products to the end consumer. We also distribute our marine products internationally through independent dealers, who then retail the products to the end consumer.
Fiscal 2022 refers to the fiscal year ended August 27, 2022, Fiscal 2021 refers to the fiscal year ended August 28, 2021, and Fiscal 2020 refers to the fiscal year ended August 29, 2020. The financial statements presented are all 52-week fiscal periods.
Available Information
Our internet website, located at www.winnebagoind.com, provides additional information about us. On our website you can obtain, free of charge, this and prior year Annual Reports on Form 10-K, Quarterly Reports on Form 10-Q, Current Reports on Form 8-K, and all other recent filings with the SEC. Our recent press releases and important information regarding our corporate governance practices are also available on our website. Information contained on our website is not incorporated into this Annual Report on Form 10-K. The SEC also maintains an internet site that contains reports, proxy and information statements, and other information regarding issuers that file electronically with the SEC which can be accessed at http://www.sec.gov.
Principal Products
Our operations are organized into three reportable segments, Towable, Motorhome, and Marine, based on similarities within their markets, products, operations and distributions.
Towable
A towable is a non-motorized vehicle that is designed to be towed by automobiles, pickup trucks, SUVs, or vans and is used as temporary living quarters for recreational travel. The Recreation Vehicle Industry Association ("RVIA") classifies towables into four types: conventional travel trailers, fifth wheels, folding camper trailers, and truck campers. We manufacture and sell conventional travel trailers and fifth wheels under the Winnebago and Grand Design brand names, which are defined as follows:
| | | | | | | | | | | |
| Type | Description | Winnebago product offerings | Grand Design product offerings |
| Travel trailer | Towed by means of a hitch attached to the frame of the vehicle | HIKE, Micro Minnie, Minnie, and Voyage | Transcend, Imagine, Momentum, and Reflection |
| Fifth wheel | Constructed with a raised forward section that is connected to the vehicle with a special fifth wheel hitch | N/A | Reflection, Momentum, and Solitude |
Our travel trailer and fifth wheel towables are sold by dealers in the retail market with manufacturer's suggested retail prices ranging from approximately $33,000 to $154,000, depending on size and model, plus optional equipment and delivery charges.
Motorhome
A motorhome is a self-propelled mobile dwelling used primarily as temporary living quarters during vacation and camping trips, or to support active and mobile lifestyles. The RVIA classifies motorhomes into four types, all of which we manufacture and sell under the Winnebago and Newmar brand names, which are defined as follows:
| | | | | | | | | | | |
| Type | Description | Winnebago product offerings | Newmar product offerings |
| Class A | Built on a heavy truck chassis in both diesel and gas models with the ability to tow a small vehicle | Gas: Adventurer, Sunstar, and Vista | Gas: Bay Star and Bay Star Sport |
| Diesel: Forza and Journey | Diesel: Canyon Star, Dutch Star, Essex, King Aire, Kountry Star, London Aire, Mountain Aire, New Aire, and Ventana |
| Class B | Built by adding a taller roof and amenities to an existing van, which allows for easy maneuvering | Gas: Travato and Solis | N/A |
| Diesel: Era, Boldt, and Revel |
| Class C | Built on a medium truck chassis in both diesel and gas models with similar features and amenities to Class A models | Gas: Ekko, Spirit, and Minnie Winnie | Diesel: Super Star and Supreme Aire |
| Diesel: View and Navion |
| Accessibility Enhanced | Vehicle with a wheelchair lift to allow individuals with physical disabilities access to the motorhome | Gas: Roam AE | N/A |
| Diesel: Inspire AE |
Our Class A, B, C and accessibility enhanced motorhomes are sold by dealers in the retail market with manufacturer's suggested retail prices ranging from approximately $115,000 to $1,600,000, depending on size and model, plus optional equipment and delivery charges. Our motorhomes range in length from 18 to 45 feet.
Motorhome parts and service activities represent revenues generated by service work we perform for retail customers at our Forest City, Iowa and Nappanee, Indiana facilities as well as revenues from the sale of unit parts. Our competitive strategy is to provide proprietary manufactured parts through our dealer network, which we believe increases customer satisfaction and the value of our motorhomes.
Marine
We manufacture and sell premium quality boats under our Chris-Craft and Barletta brands in the recreational powerboat industry through an established network of independent authorized dealers. We acquired Barletta on August 31, 2021. Refer to Note 2 in the Notes to Consolidated Financial Statements, included in Item 8 of Part II in this Annual Report on Form 10-K for further detail regarding the acquisition.
| | | | | | | | |
| Type | Chris-Craft product offerings | Barletta product offerings |
| Boats | Launch, Launch GT, Calypso, Catalina | Lusso, Corsa, Cabrio |
Our boats are sold by dealers in the retail market with manufacturer's suggested retail prices ranging from approximately $63,000 to $782,000, depending on size and model, plus optional equipment and delivery charges.
Winnebago Specialty Vehicles
We also manufacture other specialty commercial vehicles custom designed for the buyer's specific needs and requirements, such as law enforcement command centers, mobile medical clinics, and mobile office space. These specialty commercial vehicles are manufactured in Forest City, Iowa and sold through our dealer network. In addition, we also provide commercial vehicles as bare shells to third-party upfitters for conversion at their facilities.
Production
We generally produce towable, motorhome, and marine products made to order for dealers. We have some ability to increase our capacity by scheduling overtime and/or hiring additional production employees or to decrease our capacity through the use of shortened work weeks and/or reducing head count. We have long been known as an industry leader in innovation as each year we introduce new or redesigned products. These changes generally include new floor plans, features, functionality, and sizes as well as design and decor modifications. Most of our raw materials such as steel, aluminum, fiberglass, and wood products are obtainable from numerous sources.
Our towables are produced at two assembly campuses located in Middlebury, Indiana. The majority of components are comprised of frames, appliances, and furniture, and are purchased from multiple suppliers.
Our motorhomes are produced in the states of Iowa and Indiana at five different campuses. Our motorhome business utilizes vertically integrated supply streams, with the principal exceptions being chassis, engines, generators, and appliances that we purchase from multiple suppliers. Certain parts, especially motorhome chassis, are available from a small group of suppliers.
Our marine products are produced in the states of Indiana and Florida at two different campuses. We manufacture certain components and purchase other components from suppliers and install them on the boat. Certain parts, especially motors, are available from a small group of suppliers.
Backlog
We strive to balance timely order fulfillment to our dealers with the lead times suppliers require to efficiently source materials and manage costs. Production facility constraints at peak periods also lead to fluctuations in backlog orders which we manage closely. A more detailed description of our Towable, Motorhome, and Marine order backlog is included in Item 7 of Part II in this Annual Report on Form 10-K.
Distribution and Financing
We distribute our RV and marine products primarily through independent dealers throughout the U.S. and Canada, who then retail the products to the end consumer. We also distribute our marine products internationally through independent dealers, who then retail the products to the end consumer. Foreign sales accounted for less than 10% of net revenues during each of the past three fiscal years.
As of August 27, 2022, our RV and marine dealer network in the U.S. and Canada included approximately 750 physical dealer locations, many of which carry more than one of our brands. None of our dealer organizations accounted for more than 10% of our net revenues during each of the past three fiscal years.
We have sales and service agreements with most dealers which are subject to annual review. Many of the dealers are also engaged in other areas of business, including the sale of automobiles, trailers, or boats, and most dealers carry one or more competitive lines of products. We continue to place high emphasis on the capability of our dealers to provide complete service for our products. Dealers are obligated to provide full service for owners of our products or, in lieu thereof, to secure such service from other authorized providers.
We advertise and promote our products through national trade magazines, product brochures, the Go RVing national advertising campaign sponsored by RVIA, our websites, social media, direct-mail advertising campaigns, various national promotional opportunities, and on a local basis through trade shows, television, radio, and newspapers, primarily in connection with area dealers.
Sales to dealers are made primarily on cash terms. Most dealers are financed on a "floorplan" basis under which a bank or finance company lends the dealer all, or substantially all, of the purchase price, collateralized by a security interest in the merchandise purchased. As is customary in the industries we serve, we typically enter into a repurchase agreement with a lending institution financing a dealer's purchase of our product upon the lending institution's request and after completion of a credit check of the dealer involved. Our repurchase agreements provide that, for up to 18 months after an RV unit is financed and up to 24 months after a marine unit is financed, in the event of default by the dealer on the agreement to pay the lending institution and repossession of the unit(s) by the lending institution, we will repurchase the financed merchandise from the lender at the amount then due, which is often less than dealer invoice. Our maximum exposure for repurchases can vary significantly, depending upon the level of dealer inventory, general economic conditions, demand for our products, dealer location, and access to and the cost of financing. See Note 12 in the Notes to Consolidated Financial Statements, included in Item 8 of Part II in this Annual Report on Form 10-K.
Competition
The RV and marine markets are highly competitive with many other manufacturers selling products which compete directly with our products. Some of our competitors are much larger than us, most notably in the towable RV market, which may provide these competitors additional purchasing power. The competition in our industries is based upon design, price, quality, features, and service of the products. We believe our principal competitive advantages are our brand strength, product differentiation, product quality, and our service after the sale. We also believe that our products have historically commanded a price premium as a result of these competitive advantages.
Seasonality
The primary use of RVs and marine products for leisure travel and outdoor recreation has historically led to a peak retail selling season concentrated in the spring and summer months and lower sales during fall and winter months. Our sales are generally influenced by this pattern in retail sales, but sales can also be impacted by the level of dealer inventory. As a result, our sales are historically lowest during our second fiscal quarter, which ends in February.
Governmental Regulations
We are subject to a variety of federal, state, local, and, to a limited extent, international laws and regulations, including the federal Motor Vehicle Act ("MVA"), under which the National Highway Traffic Safety Administration ("NHTSA") may require manufacturers to recall RVs that contain safety-related defects, and numerous state consumer protection laws and regulations relating to the operation of motor vehicles, including so-called "Lemon Laws." The Boat Safety Act of 1971 has similar safety-related recall requirements for marine units. In addition, marine units sold in the U.S. and Europe must meet the certification standards of the U.S. Coast Guard and the European Community, respectively.
We are also subject to regulations established by the Occupational Safety and Health Administration ("OSHA"). Our facilities are periodically inspected by federal and state agencies, such as OSHA. We are a member of RVIA, a voluntary association of RV manufacturers which promulgates RV safety standards. We place an RVIA seal on each of our RVs to certify that the RVIA standards have been met. We believe that our products and facilities comply in all material respects with the applicable vehicle safety, consumer protection, RVIA, and OSHA regulations and standards.
Our operations are subject to a variety of federal and state environmental laws and regulations relating to the use, generation, storage, treatment, emission, labeling, and disposal of hazardous materials and wastes, and noise pollution. We believe that we are currently in compliance with applicable environmental laws and regulations in all material aspects.
Trademarks
Our products are marketed under a variety of valuable trademarks. Some of the more important trademarks used in our business include Winnebago, Grand Design, Newmar, Chris-Craft, and Barletta. We protect these trademarks as appropriate through registrations in the United States and other jurisdictions. Depending on jurisdiction, trademarks are generally valid as long as they are in use or their registrations are properly maintained and they have not been found to have become generic. Registrations of trademarks can also generally be renewed indefinitely for as long as the trademarks are in use.
We continue our focus on developing and marketing innovative, proprietary products, many of which use proprietary expertise, trade secrets, and know-how. We consider the collective rights under our various patents, which expire from time to time, a valuable asset, but we do not believe that our businesses are materially dependent upon any single patent or group of related patents.
Human Capital Management
Our employees are our greatest strength and we are committed to providing a safe, inclusive, high-performance culture where our people thrive. We strive to recruit, develop, engage and protect our workforce. The following are key human capital measures and objectives that we currently focus on:
Employee Experience – Leadership and Culture Development
We believe our future success depends on our people. Attracting, engaging, retaining and developing diverse talent is a key priority. We strive to grow and develop all of our teams and bolster our talent pipeline. Our leadership expectations provide a shared understanding of the skills our teams develop through continuous learning opportunities and training. Our Code of Conduct and our human rights policy include shared values and guide relationships with our people and our stakeholders. To build and attract the next generation of leaders, we have developed external partnerships, introducing high school and first-generation college students to potential career opportunities in the RV and marine industries. To increase the pipeline of diverse talent in the outdoor industry, we provided founding support to the Leaders from The Future of Work Internship Program in partnership with nonprofit partner Camber Outdoors. This innovative, diversity, equity, and inclusive ("DEI") focused internship program engages Black, Latino, Asian American and Pacific Islander, and Native/Indigenous students in meaningful paid summer internships. We
also collaborate with regional education and workforce development partners to connect job seekers with on-the-job training and leadership development.
Team members respond regularly to an engagement survey, administered at least every two years, that evaluates our employees’ thoughts about their experience working at Winnebago Industries. Responses are reviewed by team leaders and used to help build specific action plans to continually improve our employee engagement, satisfaction, and retention. We engage employees through community volunteerism, team-building, and employee resource groups. We strive to continually improve our employee experience, develop and grow our teams, and create a culture of inclusion and belonging.
As of August 27, 2022, we employed approximately 7,445 persons, of which 28% and 72% were non-production and production workers, respectively. In addition, 14% and 86% were salaried and hourly employees, respectively. None of our employees are covered under a collective bargaining agreement. We believe our relations with our employees are good.
Commitment to Inclusion, Diversity, Equity, and Action ("IDEA")
We embrace the ideals of IDEA in our company. We believe in the value of building a company and community where every person feels welcome, is treated fairly, and has an equal opportunity to succeed while bringing their authentic self to work. “All In, Outdoors” is a deliberate approach to how we act and treat each other at Winnebago Industries, and a roadmap for creating a better sense of belonging in our workplace, our communities and the outdoors. We advance our strategy by listening and learning, including by establishing an IDEA Speaker series, where subject matter experts provide inspiration, tools, and resources to create an inclusive culture. We also instituted our Courageous Conversations program, which builds connections with employees through conversations that provide awareness and understanding around community and cultural sensitivities that can be difficult in the workplace. We launched our first employee resource group, the Women’s Inclusion Network ("WIN"), whose mission is to support the professional development of women by encouraging access to learning, mentoring, and networking. WIN’s goal is to increase women’s sense of belonging and the percentage of women in leadership roles within our businesses. We remain involved with CEO Action for Diversity & Inclusion, including supporting its inaugural mentoring program with mentors from our executive leadership team and mentees from WIN.
We are committed to increasing inclusion across our industry and beyond. At the leadership level, 24% of our officers and directors are women, and 9% are racially or ethnically diverse as of August 27, 2022. We continue to expand our partnerships with nonprofit organizations led by and for communities of color and women and organizations helping to diversify the talent pipeline including Camber Outdoors and the Society of Women Engineers.
We recognize the importance of having diverse perspectives on our Board of Directors and aspire to promote diversity as we build and refresh our Board of Directors. Our IDEA framework, which serves as a roadmap to guide us forward on our inclusion journey, includes the Board of Directors, leadership development, and engagement. During Women’s History month, we hosted a Women in the Workplace panel, which was composed of our two female directors and our female general counsel, for all employees. As of August 27, 2022, 20% of our Board of Directors were women, and 20% were racially or ethnically diverse.
We believe our company and our brands should reflect the diversity of outdoor enthusiasts. We also believe we thrive and are more successful when we empower, value, and respect our employees and our communities. We are committed to continuing to build a stronger, more inclusive culture and workplace.
Employee Well-being and Safety
We are committed to designing, operating, and maintaining safe and controlled working conditions, including a "zero-harm" culture for all employees. We have implemented actions to build an increasingly risk-informed perspective within our culture to reduce the occurrences of injuries and illness. All sites have established a baseline risk control score with the goal to achieve at least 95% sustainable level control by the end of 2024. Between Fiscal 2021 and Fiscal 2022, we improved our control levels by 20%, and are on track to meet our goal of 95% or greater across all businesses. We remained stable on our total recordable incidence rate ("TRIR") in Fiscal 2022 as compared to Fiscal 2021. Our experience and continuing focus on workplace safety enabled us to preserve business continuity and maintain our commitment to keeping our employees and visitors safe, during the continuing stages of the COVID-19 pandemic. With the mental, emotional, and physical well-being of our employees as a key focus, we have provided resources for employees to manage remote work and balance parental and other family responsibilities.
Information about our Executive Officers | | | | | | | | |
| Name | Office (Year First Elected an Officer) | Age |
| Michael J. Happe | President and Chief Executive Officer (2016) | 51 |
| Ashis N. Bhattacharya | Senior Vice President, Business Development, Advanced Technology (2016) | 60 |
| Stacy L. Bogart | Senior Vice President, General Counsel, Secretary and Corporate Responsibility; President, Winnebago Industries Foundation (2018) | 59 |
| Huw S. Bower | President, Winnebago Outdoors (2020) | 48 |
| Donald J. Clark | President of Grand Design RV (2016) | 62 |
| Bryan L. Hughes | Chief Financial Officer; Senior Vice President, Finance, IT and Strategic Planning (2017) | 53 |
| Casey J. Tubman | President of Newmar Corporation (2022) | 50 |
| Christopher D. West | Senior Vice President, Enterprise Operations (2016) | 50 |
| Bret A. Woodson | Senior Vice President, Human Resources and Corporate Relations (2015) | 52 |
Officers are elected annually by the Board of Directors and hold office until their successors are chosen and qualify or until their death or resignation. There are no family relationships between or among any of the Executive Officers or Directors of the Company.
Mr. Happe joined Winnebago Industries in January 2016 as President and Chief Executive Officer. Prior to joining Winnebago, he had been employed by The Toro Company, a provider of outdoor maintenance and beautification products, from 1997 to 2016. He served as Executive Officer and Group Vice President of Toro's Residential and Contractor businesses from March 2012 to December 2015. From August 2010 to March 2012, he served as Vice President, Residential and Landscape Contractor Businesses. Prior to that, he held a series of senior leadership positions throughout his career across a variety of Toro's domestic and international divisions.
Mr. Bhattacharya joined Winnebago Industries in June 2016 as Vice President, Strategic Planning and Development. He became Vice President, Business Development, Specialty Vehicles, and Advanced Technology in 2019 and Senior Vice President, Business Development, Advanced Technology, and Enterprise Marketing in September 2020. Prior to joining Winnebago, Mr. Bhattacharya served at Honeywell International, Inc., a software industrial company, as Vice President, Strategy, Alliances & Internet of Things for the Sensing and Productivity Solutions division from 2010 to 2016. Prior to that, he was employed with Moog, Motorola, and Bain & Company in a variety of roles.
Ms. Bogart joined Winnebago Industries in January 2018 as Vice President, General Counsel and Secretary and was appointed Senior Vice President, General Counsel, Secretary and Corporate Responsibility and President, Winnebago Industries Foundation in October 2020. Prior to joining Winnebago Industries, Ms. Bogart was Senior Vice President, General Counsel and Compliance Officer, Corporate Secretary at Polaris Industries Inc., a manufacturer and marketer of powersports products, where she joined in November 2009. Previously, Ms. Bogart was General Counsel of Liberty Diversified International; Assistant General Counsel and Assistant Secretary at The Toro Company; and a Senior Attorney for Honeywell International, Inc.
Mr. Bower joined Winnebago Industries in October 2020 as President, Winnebago Outdoors. Prior to joining Winnebago Industries, he was President of the Boat Group at Brunswick Corporation, a developer and manufacturer of marine/boating products, from April 2016 to September 2020. Mr. Bower has over 15 years of general management, brand leadership and executive experience in the marine industry.
Mr. Clark, President of Grand Design RV, became an officer of Winnebago Industries in November 2016 in accordance with the terms of the Grand Design acquisition. He co-founded Grand Design RV, LLC in 2012 and built the team at Grand Design RV. Mr. Clark has over 30 years of successful RV industry experience.
Mr. Hughes joined Winnebago Industries as Vice President, Chief Financial Officer of the Company in May 2017 and was appointed Senior Vice President, Finance, IT, and Strategic Planning and Chief Financial Officer in October 2020. Mr. Hughes joined Winnebago Industries from Ecolab, Inc., a water technologies and services company, where he served as Senior Vice President and Corporate Controller from 2014 to 2017, as Vice President of Finance from 2008 to 2014 and in various management positions from 1996 to 2008. Prior to his employment with Ecolab, Inc., he worked for Ernst & Young, a public accounting firm.
Mr. Tubman joined Winnebago Industries in August 2022 as President of Newmar Corporation. Mr. Tubman joined Winnebago Industries from Whirlpool Corporation, a multinational manufacturer of home appliances, where he served in a variety of leadership and executive roles for over 25 years. Most recently, he served as Vice President and Global Platform Leader from February 2022 to July 2022. He also served as Vice President of Product Marketing from January 2020 to February 2022, and Vice President and General Manager from October 2015 to January 2020.
Mr. West joined Winnebago Industries in September 2016 as Vice President, Operations and was appointed Senior Vice President, Enterprise Operations in October 2020. He previously was Vice President of Global Supply Chain for Joy Global, a worldwide
mining equipment manufacturer, from 2014 to 2016, and Operations Director from 2012 to 2014. Mr. West served as Director of Manufacturing for AGCO Corporation, an agricultural equipment manufacturer, from 2008 to 2012 and as Director of Operations and in other management positions for the Nordam Group, a manufacturer of aircraft interiors, from 1999 to 2009.
Mr. Woodson joined Winnebago Industries in January 2015 as Vice President, Administration and was appointed Senior Vice President, Human Resources and Corporate Relations in October 2020. Prior to joining Winnebago, Mr. Woodson was Vice President of Human Resources at Corbion N.V., a food and biochemicals company, from 2007 to 2014 and Director, Human Resources at Sara Lee Corporation from 1999 to 2007. Mr. Woodson has over 25 years of business and human resources experience.
Item 1A. Risk Factors.
Described below are certain risks that we believe apply to our business and the industry in which we operate. The following risk factors should be considered carefully in addition to the other information contained in this Annual Report on Form 10-K. The risks and uncertainties highlighted represent the most significant risk factors that we believe may adversely affect our business, financial condition, results of operations, cash flows, liquidity or access to sources of financing, and, consequently, the market value of our common stock. The risks and uncertainties discussed in this report are not exclusive and other risk factors that we may consider immaterial or do not anticipate may emerge as significant risks and uncertainties.
Macroeconomic Risks
Our business may be sensitive to economic conditions, including those that impact consumer spending.
Companies within the RV and marine industries are subject to volatility in operating results due primarily to general economic conditions because the purchase of a RV or marine product is often viewed as a consumer discretionary purchase. Demand for discretionary goods in general can fluctuate with recessionary conditions, slow or negative economic growth rates, negative consumer confidence, reduced consumer spending levels resulting from tax increases or other factors, prolonged high unemployment rates, higher commodity and component costs, fuel prices, inflationary or deflationary pressures, reduced credit availability or unfavorable credit terms for dealers and end-user customers, higher short-term interest rates, and general economic and political conditions and expectations. Specific factors affecting the RV and marine industries include:
•Overall consumer confidence and the level of discretionary consumer spending;
•Employment trends;
•Fuel prices;
•Inflationary pressures affecting disposable consumer income;
•Interest rate fluctuations;
•The adverse impact of global tensions on consumer spending and travel-related activities; and
•The adverse impact on margins due to increases in raw material costs, which we are unable to pass on to customers without negatively affecting sales.
The demand, supply, and operational challenges associated with the ongoing COVID-19 pandemic has had and may continue to have a material impact on our business, financial condition, results of operations and cash flows.
Our business, operations, and financial results have been, and may continue to be, impacted by the COVID-19 pandemic. Impacts on our business include, but are not limited to:
•Inability to meet our dealers’ and consumers’ demands due to disruptions in our manufacturing and supply arrangements caused by delays and disruptions in obtaining certain raw materials and other manufacturing components; and
•If the COVID-19 pandemic worsens or re-emerges, our labor force may be negatively impacted by COVID-19 infections, which would negatively impact our ability to produce and sell products.
These impacts may have a negative effect on our business, financial condition, results of operations and cash flows. While we have seen increased demand for our products resulting in part from the effects of the COVID-19 pandemic, there can be no assurance that we can maintain or continue to expand demand for products in a post-pandemic environment. The impact of the COVID-19 pandemic may also exacerbate other risks discussed in this Item 1A, Risk Factors, any of which could have a material adverse effect on us.
Credit market deterioration and volatility may restrict the ability of our dealers and retail customers to finance the purchase of our products.
Our business is affected by the availability and terms of the financing to dealers. Generally, RV and marine dealers finance their purchases of inventory with financing provided by lending institutions. One financial flooring institution held 33.7% of our total financed dealer inventory dollars that were outstanding at August 27, 2022. In the event that this lending institution limits or discontinues dealer financing, we could experience a material adverse effect on our results of operations.
Our business is also affected by the availability and terms of financing to retail purchasers. Retail buyers purchasing one of our products may elect to finance their purchase through the dealership or a financial institution of their choice. Substantial increases in interest rates or decreases in the general availability of credit for our dealers or for the retail purchaser may have an adverse impact upon our business and results of operations.
Industry Risks
If we are unable to continue to enhance existing products and develop and market new or enhanced products that respond to customer needs and preferences, we may experience a decrease in demand for our products and our business could suffer.
One of our growth strategies is to develop innovative, customer-valued products to generate revenue growth. We may not be able to compete as effectively with our competitors, and ultimately satisfy the needs and preferences of our customers, unless we can continue to enhance existing products and develop new innovative products for the markets in which we compete. Product development requires significant financial, technological, and other resources. Product improvements and new product introductions also require significant research, planning, design, development, engineering, and testing at the technological, product, and manufacturing process levels, and we may not be able to timely develop and introduce product improvements or new products. Our competitors' new products may beat our products to market, be higher quality or more reliable, be more effective with more features and/or less expensive than our products, obtain better market acceptance, or render our products obsolete. Any new products that we develop may not receive market acceptance or otherwise generate any meaningful net sales or profits for us relative to our expectations based on, among other things, existing and anticipated investments in manufacturing capacity and commitments to fund advertising, marketing, promotional programs, and research and development.
If we are unable to properly forecast future demand of our products, our production levels may not meet demands, which could negatively impact our operating results.
Our ability to manage our inventory levels to meet our customers' demand for our products is important for our business. For example, certain dealers are focused on the rental market which spikes over the summer vacation period while other dealers are focused on direct sales to the consumer at various price points. Our production levels and inventory management are based on demand estimates six to twelve months forward, taking into account supply lead times, production capacity, timing of shipments, and dealer inventory levels. If we overestimate or underestimate demand for any of our products during a given season, we may not maintain appropriate inventory levels, which could negatively impact our net sales or working capital, hinder our ability to meet customer demand, or cause us to incur excess and obsolete inventory charges.
The industries in which we operate are highly competitive. Failure to compete effectively against competitors could negatively impact our business and operating results.
The markets for RVs and marine products are very competitive. Competitive factors in the industries include price, design, value, quality, service, brand awareness, and reputation. There can be no assurance that existing or new competitors will not develop products that are superior to our products or that achieve better consumer acceptance, thereby adversely affecting our market share, sales volume, and profit margins. Some of our competitors are much larger than we are, and this size advantage provides these competitors with more financial resources and access to capital, additional purchasing power, and greater leverage with the dealer networks. In addition, competition could increase if new companies enter the market, existing competitors consolidate their operations, or if existing competitors expand their product lines or intensify efforts within existing product lines. Our current products, products under development, and our ability to develop new and improved products may be insufficient to enable us to compete effectively with our competitors. These competitive pressures may have a material adverse effect on our results of operations.
Our business is both cyclical and seasonal and is subject to fluctuations in sales and net income.
The RV and marine industries have been characterized by cycles of growth and contraction in consumer demand, reflecting prevailing economic and demographic conditions, which affect disposable income for leisure-time activities. Consequently, the results for any prior period may not be indicative of results for any future period.
Seasonal factors, over which we have no control, also have an effect on the demand for our products. Demand in the RV and marine industries generally declines over the winter season, while sales are generally highest during the spring and summer months. Also, unusually severe weather conditions in some markets may impact demand.
Our business depends on the performance of independent dealers.
We distribute our RV and marine products primarily through independent dealers across the U.S. and Canada, who then retail the products to the end consumer. We also distribute our marine products internationally through independent dealers, who then retail the products to the end consumer. We rely on our dealers to develop and implement effective strategies to create retail demand for our products. If our independent dealers are unsuccessful in doing so, it could have an adverse effect on our results of operations.
Our success is dependent on our ability to attract new dealers and maintain relationships with existing dealers. Our independent dealers maintain control over which products they carry and choose to sell, and they may promote other products, or terminate existing relationships if our products are not perceived as being desirable and profitable. Our results of operations can be adversely affected if we are unable to maintain and develop successful relationships with independent dealers.
The financial condition of independent dealers is affected in large part by conditions and events that are beyond our control. Significant deterioration in the financial condition of independent dealers could materially and adversely affect our results of operations.
If we are obligated to repurchase a substantially larger number of our products in the future than estimated due to dealer default, these purchases could result in adverse effects on our results of operations, financial condition, and cash flows.
In accordance with customary practice in our industries, upon request we enter into formal repurchase agreements with lending institutions financing a dealer's purchase of our products. In these repurchase agreements we agree, in the event of a default by an independent dealer in its obligation to a lender and repossession of the unit(s) by the lending institution, to repurchase units at declining prices over the term of the agreements, which can last up to 24 months. The difference between the gross repurchase price and the price at which the repurchased product can then be resold, which is typically at a discount to the gross repurchase price, represents a potential expense to us. In certain instances, we also repurchase inventory from our dealers due to state law or regulatory requirements that govern voluntary or involuntary terminations. If we are obligated to repurchase a substantially larger number of units in the future than we estimate, this would increase our costs and could have a material adverse effect on our results of operations, financial condition, and cash flows.
Operational Risks
Our operations are primarily centered in northern Iowa and northern Indiana. Any disruption or delay at our primary manufacturing facilities could adversely affect our business and operating results.
We currently manufacture most of our products in northern Iowa and northern Indiana. We also have a relatively small manufacturing operation on the Gulf Coast of Florida. These facilities may be affected by natural or man-made disasters and other external events. In the event that one of our manufacturing facilities was affected by a disaster or other event, we could be forced to shift production to one of our other manufacturing facilities or to cease operations. Although we maintain insurance for damage to our property and disruption of our business from casualties, such insurance may not be sufficient to cover all of our potential losses. Any disruption in our manufacturing capacity could have an adverse impact on our ability to produce sufficient inventory of our products or may require us to incur additional expenses in order to produce sufficient inventory, and therefore, may adversely affect our net sales and operating results. Any disruption or delay at our manufacturing facilities could impair our ability to meet the demands of our customers, and our customers may cancel orders or purchase products from our competitors, which could adversely affect our business and operating results.
Unanticipated changes to our distribution channel customers' inventory levels could negatively impact our operating results.
We sell many of our products through distribution channels and are subject to risks relating to their inventory management decisions and operational and sourcing practices. Our distribution channel customers carry inventories of our products as part of their ongoing operations and adjust those inventories based on their assessments of future needs. Such adjustments may impact our inventory management and working capital goals as well as operating results. If the inventory levels of our distribution channel customers are higher than they desire, they may postpone product purchases from us, which could cause our sales to be lower than the end-user retail demand for our products and negatively impact our inventory management and working capital goals as well as our operating results.
For some of the components used in production, we depend on a small group of suppliers and the loss of any of these suppliers could affect our ability to obtain components timely or at competitive prices, which would decrease our results of operations, financial condition, and cash flows.
Most of our RV and marine components are readily available from numerous sources. However, a few of our components are produced by a small group of suppliers. In the case of motorhome chassis, Mercedes-Benz (USA and Canada), Stellantis N.V., Freightliner Trucks, Ford Motor Company, and Spartan RV Chassis are our major suppliers. Our relationship with our chassis suppliers is similar to our other supplier relationships in that no specific contractual commitments are engaged in by either party. This means that we do not have minimum purchase requirements, and our chassis suppliers do not have minimum supply requirements. Our chassis suppliers also supply to our competitors. Historically, chassis suppliers resort to an industry-wide allocation system during periods when supply is restricted. These allocations have been based on the volume of chassis previously purchased, which could mean our larger competitors could receive more chassis in a time of scarcity. Sales of motorhomes rely on chassis supply and are affected by shortages from time to time. Decisions by our suppliers to decrease production, production delays or work stoppages by the employees of such suppliers, or price increases could have a material adverse effect on our ability to produce motorhomes and ultimately, on our results of operations, financial condition, and cash flows. In Fiscal 2022, one of our suppliers individually accounted for approximately 11% of our consolidated raw material purchases.
Increases in raw material, commodity, and transportation costs and shortages of certain raw materials could negatively impact our business.
We purchase raw materials such as steel, aluminum, and other commodities, and components, such as chassis, refrigerators, and televisions, for use in our products. In addition, we are a purchaser of components and parts containing various commodities, including steel, aluminum, copper, lead, rubber, lumber, and others that are integrated into our end products. Our profitability is affected by significant fluctuations in the prices of the raw materials and the components and parts we use in our products.
Additionally, there continues to be uncertainty with respect to the implementation of current trade regulations, future trade regulations and existing international trade agreements, which could continue to increase our cost of goods sold, both directly and as a result of price increases implemented by domestic suppliers, which we may not be able to pass on to our customers. The impact from these tariffs could also result in decreased demand for our products. All of these conditions could materially and adversely affect our results of operations and financial condition.
In addition, increases in other costs of doing business may also adversely affect our profit margins and businesses. For example, an increase in fuel costs may result in an increase in our transportation costs, which also could adversely affect our operating results and businesses. Historically, we have mitigated cost increases, in part, by collaborating with suppliers, reviewing alternative sourcing options, substituting materials, engaging in internal cost reduction efforts, and increasing prices on some of our products, all as appropriate. However, we may not be able to fully offset such increased costs in the future. Further, if our price increases are not accepted by our customers and the market, our net sales, profit margins, earnings, and market share could be adversely affected.
We have experienced, and continue to experience, disruption in our supply chain due to the reduced availability of certain raw materials used in the manufacturing of our products, including chassis which depend on semiconductor chips. The constraints limited our ability to increase production to meet demand during Fiscal 2022 and continuing in Fiscal 2023. While we continue to manage through these shortages and delays, if we cannot successfully manage these disruptions and/or these shortages and delays worsen, we may be unable to fulfill orders and deliver our products to our customers in a timely manner. This could materially and adversely affect our results of operations and financial condition.
Failure to effectively manage strategic acquisitions and alliances, joint ventures, or partnerships could have a negative impact on our business.
One of our growth strategies is to drive growth through targeted acquisitions and alliances, stronger customer relations, and new joint ventures and partnerships that contribute profitable growth while supplementing our existing brands and product portfolio. Our ability to grow through acquisitions depends, in part, on the availability of suitable candidates at acceptable prices, terms, and conditions, our ability to compete effectively for acquisition candidates, and the availability of capital and personnel to complete such acquisitions and run the acquired business effectively. Any acquisition, alliance, joint venture, or partnership could impair our business, financial condition, reputation, and operating results. The benefits of an acquisition, or new alliance, joint venture, or partnership may take more time than expected to develop or integrate into our operations, and we cannot guarantee that previous or future acquisitions, alliances, joint ventures, or partnerships will, in fact, produce any benefits. Such acquisitions, alliances, joint ventures, and partnerships may involve a number of risks, including:
•Diversion of management’s attention;
•Disruption to our existing operations and plans;
•Inability to effectively manage our expanded operations;
•Difficulties or delays in integrating and assimilating information and financial systems, operations, and products of an acquired business or other business venture or in realizing projected efficiencies, growth prospects, cost savings, and synergies;
•Inability to successfully integrate or develop a distribution channel for acquired product lines;
•Potential loss of key employees, customers, distributors, or dealers of the acquired businesses or adverse effects on existing business relationships with suppliers, customers, distributors, and dealers;
•Adverse impact on overall profitability, if our expanded operations do not achieve the financial results projected in our valuation model;
•Inaccurate assessment of additional post-acquisition or business venture investments, undisclosed, contingent or other liabilities or problems, unanticipated costs associated with an acquisition or other business venture, and an inability to recover or manage such liabilities and costs; and
•Incorrect estimates made in the accounting for acquisitions, occurrence of non-recurring charges, and write-off of significant amounts of goodwill or other assets that could adversely affect our operating results.
If we fail to identify, attract, and retain appropriately qualified employees, including employees in key positions, our operations and profitability may be harmed. Changes in market compensation rates may adversely affect our profitability.
Our ability to meet our strategic objectives and otherwise grow our business will depend to a significant extent on the continued contributions of our leadership team. Our future success will also depend in large part on our ability to identify, attract, and retain other highly qualified managerial, technical, sales and marketing, operations, and customer service personnel. Competition for these individuals in our manufacturing markets is intense and supply is limited. Since we operate in a competitive labor market, there is a risk that market increases in compensation could have an adverse effect on our business. We may not succeed in identifying, attracting, or retaining qualified personnel on a cost-effective basis. The loss or interruption of services of any of our key personnel, inability to identify, attract, or retain qualified personnel in the future, delays in hiring qualified personnel, or any employee work slowdowns, strikes, or similar actions could make it difficult for us to conduct and manage our business and meet key objectives, which could harm our business, financial condition, and operating results.
Significant product repair and/or replacement costs due to product warranty claims and product recalls could have a material adverse impact on our results of operations, financial condition, and cash flows.
We receive warranty claims from our dealers in the ordinary course of our business. Although we maintain reserves for such claims, which to date have been adequate, there can be no assurance that warranty expense levels will remain at current levels or that such reserves will continue to be adequate. A significant increase in warranty claims exceeding our current warranty expense levels could have a material adverse effect on our results of operations, financial condition, and cash flows.
In addition to the costs associated with the contractual warranty coverage provided on our products, we also occasionally incur costs as a result of additional service actions not covered by our warranties, including product recalls and customer satisfaction actions. Although we estimate and reserve for the cost of these service actions, there can be no assurance that expense levels will remain at current levels or such reserves will continue to be adequate.
Information Systems, Legal and Regulatory Risks
We may be subject to information technology system failures, network disruptions, and breaches in data security that could adversely affect our business. Failure to prevent or effectively respond to a breach or system failure could expose our customers', clients', or suppliers' confidential information, and expose us to substantial costs and reputational damage as well as litigation and enforcement actions.
We rely on our information systems and web applications to support our business operations, including but not limited to procurement, supply chain, manufacturing, distribution, warranty administration, invoicing, and collection of payments. We use information systems to record and report our operational results. Additionally, we rely upon information systems in our sales, marketing, human resources, and communication efforts. Due to our reliance on our information systems, our business processes may be negatively impacted in the event of substantial disruption of service. Further, we have security systems in place with the intent of maintaining the physical security of our facilities and protecting our customers', clients', and suppliers' confidential information and information related to identifiable individuals against unauthorized access through our information systems or by other electronic transmission or through the misdirection, theft, or loss of physical media. Misuse, leakage, falsification, or breach of security of information could result in a violation of privacy laws and damage our reputation which could, in turn, have a negative impact on our results. Because the technologies used to obtain unauthorized access are constantly changing and becoming increasingly more sophisticated and often are not recognized until launched against a target, we may be unable to anticipate these techniques or implement sufficient preventative measures. If we fail to maintain or protect our information systems and web applications effectively, we could experience adverse consequences that could have a material effect on our business. Amongst other things, the impact could include interruptions or delays in our ability to access information, data loss, processing inefficiencies, lost revenues or other costs resulting from shutdowns, unfavorable publicity, governmental inquiry and oversight, difficulty in marketing our services, allegations by our customers and clients that we have not performed our contractual obligations, litigation by affected parties, and possible financial obligations for damages related to the theft or misuse of such information.
Our continued success is dependent on positive perceptions of our brands which, if impaired, could adversely affect our results of operations or financial condition. In addition, if the frequency and size of product liability and other claims against us increase, our reputation and business may be harmed.
We believe that one of the strengths of our business is our brands, which are widely known around the world. We vigorously defend our brands and our other intellectual property rights against third parties on a global basis. We have, from time to time, had to bring claims against third parties to protect or prevent unauthorized use of our brand. If we are unable to protect and defend our brands or other intellectual property, it could have a material adverse effect on our results of operations or financial condition.
We are also subject, in the ordinary course of business, to litigation including a variety of warranty, "Lemon Law," and product liability claims typical in the RV and marine industries. Although we have an insurance policy covering product liability, we cannot be certain that our insurance coverage will be sufficient to cover all future claims against us, which may have a material adverse effect on our results of operations and financial condition. Any increase in the frequency and size of these claims, as compared to our experience in prior years, may cause the premium that we are required to pay for insurance to rise significantly. Product liability claims may also cause us to pay punitive damages, not all of which are covered by our insurance. In addition, if product liability claims rise to a level of frequency or size that are significantly higher than similar claims made against our competitors, our reputation and business may be harmed.
We are subject to certain government regulations that could have a material adverse impact on our business, including changing climate-related regulations that may require us to incur additional costs in order to be in compliance.
We are subject to numerous federal, state, and local regulations and the following summarizes some, but not all, of the laws and regulations that apply to us.
Federal Motor Vehicle Safety Standards govern the design, manufacture and sale of our RV products, which standards are promulgated by the NHTSA. NHTSA requires manufacturers to recall and repair vehicles which are non-compliant with a Federal Motor Vehicle Safety Standard or contain safety defects. In addition, the U.S. Coast Guard maintains certification standards for the manufacture of our marine products, and the safety of recreational boats in the U.S. is subject to federal regulation under the Boat Safety Act of 1971, which requires boat manufacturers to recall products for replacement of parts or components that have
demonstrated defects affecting safety. Any major recalls of our products, voluntary or involuntary, could have a material adverse effect on our results of operations, financial condition, and cash flows. While we believe we are in compliance with the foregoing laws and regulations as they currently exist, amendments to any of these regulations or the implementation of new regulations could significantly increase the cost of testing, manufacturing, purchasing, operating, or selling our products and could have a material adverse effect on our results of operations, financial condition, and cash flows. In addition, our failure to comply with present or future regulations could result in federal fines being imposed on us, potential civil and criminal liability, suspension of sales or production, or cessation of operations.
We are also subject to federal and numerous state consumer protection and unfair trade practice laws and regulations relating to the sale, transportation, and marketing of motor vehicles, including so-called "Lemon Laws." Federal and state laws and regulations also impose upon vehicle operators various restrictions on the weight, length, and width of motor vehicles, including motorhomes that may be operated in certain jurisdictions or on certain roadways. Certain jurisdictions also prohibit the sale of vehicles exceeding length restrictions.
Failure to comply with the New York Stock Exchange and SEC laws or regulations could also have an adverse impact on our business. Additionally, amendments to these regulations and the implementation of new regulations could increase the cost of our operations and therefore could have an adverse impact on our business.
We are subject to income and other tax laws and regulations in the U.S. and various foreign jurisdictions. In addition, we could be impacted by adjustments proposed by taxing authorities in connection with examinations, depending on their timing, nature and scope. Increases in tax rates, changes in tax laws or unfavorable resolution of tax matters could have a material impact on our financial results.
Finally, federal and state authorities also have various environmental control standards relating to air, water, noise pollution, greenhouse gases ("GHG"), and hazardous waste generation and disposal that affect us and our operations. Failure by us to comply with present or future laws and regulations could result in fines being imposed on us, potential civil and criminal liability, suspension of production or operations, alterations to the manufacturing process, or costly cleanup or capital expenditures, any or all of which could have a material adverse effect on our results of operations. In addition, foreign, federal, state, and local regulatory and legislative bodies have proposed various legislative and regulatory measures relating to climate change, regulating GHG emissions, and energy policies. If such legislation is enacted, we could incur increased energy, environmental, and other costs and capital expenditures to comply with the limitations. Climate change regulation combined with public sentiment could result in reduced demand for our products, higher fuel prices, or carbon taxes, all of which could materially adversely affect our business. Due to uncertainty in the regulatory and legislative processes, as well as the scope of such requirements and initiatives, we cannot currently determine the effect such legislation and regulation may have on our products and operations.
Financial Risks
An impairment in the carrying value of goodwill and trade names could negatively impact our consolidated results of operations.
Goodwill and indefinite-lived intangible assets, such as our trade names, are recorded at fair value at the time of acquisition and are not amortized but are reviewed for impairment at least annually or more frequently if impairment indicators arise. Our determination of whether goodwill impairment has occurred is based on a comparison of each of our reporting units’ fair value with its carrying value. Significant and unanticipated changes in circumstances, such as significant and long-term adverse changes in business climate, unanticipated competition, and/or changes in technology or markets, could require a provision for impairment in a future period that could negatively impact our results of operations.
The terms of our notes and other debt instruments could adversely affect our operating flexibility and pose risks of default.
We incurred substantial indebtedness to finance the acquisitions of Grand Design and Newmar Corporation ("Newmar"). Our asset based revolving credit facility ("ABL Credit Facility") and Senior Secured Notes (as described in Note 9 in the Notes to Consolidated Financial Statements, included in Item 8 of Part II in this Annual Report on Form 10-K) are secured by substantially all of our assets, including cash, inventory, accounts receivable, and certain machinery and equipment. We also issued unsecured Convertible Notes (as described in Note 9 in the Notes to Consolidated Financial Statements, included in Item 8 of Part II in this Annual Report on Form 10-K) to finance the acquisition of Newmar. If a default of payment occurs, the lenders in our ABL Credit Facility or holders of our Senior Secured and Convertible Notes may elect to declare all of their respective outstanding debt, together with accrued interest and other amounts payable thereunder, to be immediately due and payable. Under such circumstances, we may not have sufficient funds or other resources to satisfy all of our obligations. In addition, the limitations imposed on our ability to incur additional debt and to take other corporate actions might significantly impair our ability to obtain other financing.
Borrowing availability under the ABL Credit Facility is limited to the lesser of the facility total and the calculated borrowing base, which is based on stipulated loan percentages applied to our eligible trade accounts receivable and eligible inventories. Should the borrowing base decline, our ability to borrow to fund future operations and business transactions could be limited.
In addition, the Senior Secured Notes contain certain occurrence-based covenants that could restrict our ability to undertake certain types of transactions. If we enter into a transaction that falls under the occurrence-based covenants, we will calculate the ratios and covenant buckets we have available to us to ensure we are in compliance. Likewise, the indenture related to the Convertible Notes issued to help finance the acquisition of Newmar includes certain limited covenants that could impact our ability to operate our business.
In addition, our indebtedness could:
•Make us more vulnerable to general adverse economic, regulatory, and industry conditions;
•Limit our flexibility in planning for, or reacting to, changes and opportunities in the markets in which we compete;
•Place us at a competitive disadvantage compared to our competitors that have less debt or could require us to dedicate a substantial portion of our cash flow to service our debt; and
•Restrict us from making strategic acquisitions or exploiting other business opportunities.
Item 1B. Unresolved Staff Comments.
None.
Item 2. Properties.
The principal facilities used in our operations are in the following locations:
| | | | | | | | | | | |
| Segment | Location | Status | Primary Use |
| Towable | Bristol, Indiana | Leased | Manufacturing (1) |
| Towable | Elkhart, Indiana | Leased | Manufacturing (1) |
| Towable | Middlebury, Indiana | Owned | Manufacturing(1) and office space |
| Towable | Middlebury, Indiana | Leased | Manufacturing(1) and office space |
| Towable | White Pigeon, Michigan | Leased | Manufacturing (1) |
| Motorhome | Charles City, Iowa | Owned | Manufacturing (1) |
| Motorhome | Forest City, Iowa | Owned | Manufacturing(1) and non-production |
| Motorhome | Lake Mills, Iowa | Owned | Manufacturing (1) |
| Motorhome | Nappanee, Indiana | Owned | Manufacturing (1) |
| Motorhome | Nappanee, Indiana | Leased | Manufacturing(1) and office space |
| Motorhome | Waverly, Iowa | Owned | Manufacturing (1) |
| Marine | Bristol, Indiana | Owned | Manufacturing(1) and office space |
| Marine | Sarasota, Florida | Owned | Manufacturing(1) and office space |
| Corporate / All Other | Eden Prairie, Minnesota | Leased | Office space |
| Corporate / All Other | Forest City, Iowa | Owned | Manufacturing (1) |
(1) Manufacturing includes production, warehouse, maintenance, and service center facilities.
Most of our buildings are of steel or steel and concrete construction and are protected from fire with high-pressure sprinkler systems, dust collector systems, automatic fire doors, and alarm systems. All facilities are in good operating condition, suitable for their respective uses and adequate for current needs.
Under our Senior Secured Notes and ABL Credit Facility, we have encumbered substantially all of our real property for the benefit of the lenders under our credit facilities. For additional information, see Note 9 in the Notes to Consolidated Financial Statements, included in Item 8 of Part II in this Annual Report on Form 10-K. Also see Note 10 in the Notes to Consolidated Financial Statements included in Item 8 of Part II in this Annual Report on Form 10-K for more information regarding our leased facilities.
Item 3. Legal Proceedings.
For a description of our legal proceedings, see Note 12 in the Notes to Consolidated Financial Statements, included in Item 8 of Part II in this Annual Report on Form 10-K.
Item 4. Mine Safety Disclosures.
Not Applicable.
PART II
Item 5. Market for the Registrant's Common Equity, Related Shareholder Matters, and Issuer Purchases of Equity Securities.
Market Information
Our common stock is listed on the New York Stock Exchange under the ticker symbol of WGO. As of October 13, 2022, there were 2,120 shareholders of record.
Dividends
On August 17, 2022, our Board of Directors declared a quarterly cash dividend of $0.27 per share, totaling $8.2 million, to be paid on September 28, 2022 to common shareholders of record at the close of business on September 14, 2022. Dividends are generally declared each quarter, and the Board of Directors currently intends to continue to pay quarterly cash dividends; however, declaration of future dividends, if any, will be based on several factors including our financial performance, outlook, and liquidity.
Our outstanding notes, as further described in Note 9 in the Notes to Consolidated Financial Statements, included in Item 8 of Part II in this Annual Report on Form 10-K, contains restrictions that may limit our ability to pay dividends.
Issuer Purchases of Equity Securities
Our ABL Credit Facility contains restrictions that may limit our ability to make distributions or payments with respect to purchases of our common stock without consent from the lenders, except for limited purchases of our common stock from employees, in the event of a significant reduction in our EBITDA or in the event of a significant borrowing on our ABL Credit Facility. Our Senior Secured Notes also contain covenants that may limit our ability to make distributions or payments with respect to purchases of our common stock. See additional information on our ABL Credit Facility in Note 9 in the Notes to Consolidated Financial Statements, included in Item 8 of Part II in this Annual Report on Form 10-K.
On October 13, 2021, our Board of Directors authorized a share repurchase program in the amount of $200.0 million with no time restriction on the authorization, which took effect immediately and replaced the prior program.
On August 17, 2022, our Board of Directors authorized a share repurchase program in the amount of $350.0 million, also with no time restriction on the authorization, which replaces the previous authorization that was fully depleted in the fourth quarter of Fiscal 2022.
During Fiscal 2022, we repurchased 3,577,000 shares of our common stock at a cost of $209.7 million, and 62,000 shares of our common stock at a cost of $4.6 million to satisfy tax obligations on employee equity awards as they vested. We continually evaluate if share repurchases reflect a prudent use of our capital and, subject to compliance with our ABL Credit Facility and outstanding Senior Secured Notes, we may purchase shares in the future. As of August 27, 2022, we have $350.0 million remaining on our Board of Directors approved repurchase authorization.
Purchases of our common stock during each fiscal month of the fourth quarter of Fiscal 2022 are as follows:
| | | | | | | | | | | | | | | | | | | | | | | |
Period(1) | Total Number of Shares Purchased(2) | | Average Price Paid per Share | | Number of Shares Purchased as Part of Publicly Announced Plans or Programs(2) | | Approximate Dollar Value of Shares That May Yet Be Purchased Under the Plans or Programs(2)(3) |
| 05/29/22 - 07/02/22 | 273,442 | | | $ | 50.47 | | | 273,442 | | | $ | 66,200,000 | |
| 07/03/22 - 07/30/22 | 796,391 | | | $ | 54.87 | | | 796,391 | | | $ | 22,500,000 | |
| 07/31/22 - 08/27/22 | 364,299 | | | $ | 61.77 | | | 364,252 | | | $ | 350,000,000 | |
| Total | 1,434,132 | | | $ | 55.78 | | | 1,434,085 | | | $ | 350,000,000 | |
(1) Number of shares in the above table are shown in whole numbers.
(2) Shares not purchased as part of a publicly announced program were repurchased from employees who vested in Company shares and elected to pay their payroll tax via the value of shares delivered as opposed to cash.
(3) Pursuant to a $200.0 million share repurchase program authorized by our Board of Directors on October 13, 2021. No shares were repurchased pursuant to a $350.0 million share repurchase program authorized by our Board of Directors on August 17, 2022. There is no time restriction on this authorization.
Stock Performance Graph
The following graph compares our five-year cumulative total shareholder return (including reinvestment of dividends) with the cumulative total return on the Standard & Poor's 500 Index and a peer group. The peer group companies consisting of THOR Industries, Inc., Polaris, Inc., and Brunswick Corporation were selected by us as they also manufacture recreation products. It is assumed in the graph that $100 was invested in our common stock, in the Standard & Poor's 500 Index and in the stocks of the peer group companies on August 26, 2017 and that all dividends received within a quarter were reinvested in that quarter. In accordance with the guidelines of the SEC, the shareholder return for each entity in the peer group index has been weighted on the basis of market capitalization as of each annual measurement date set forth in the graph.
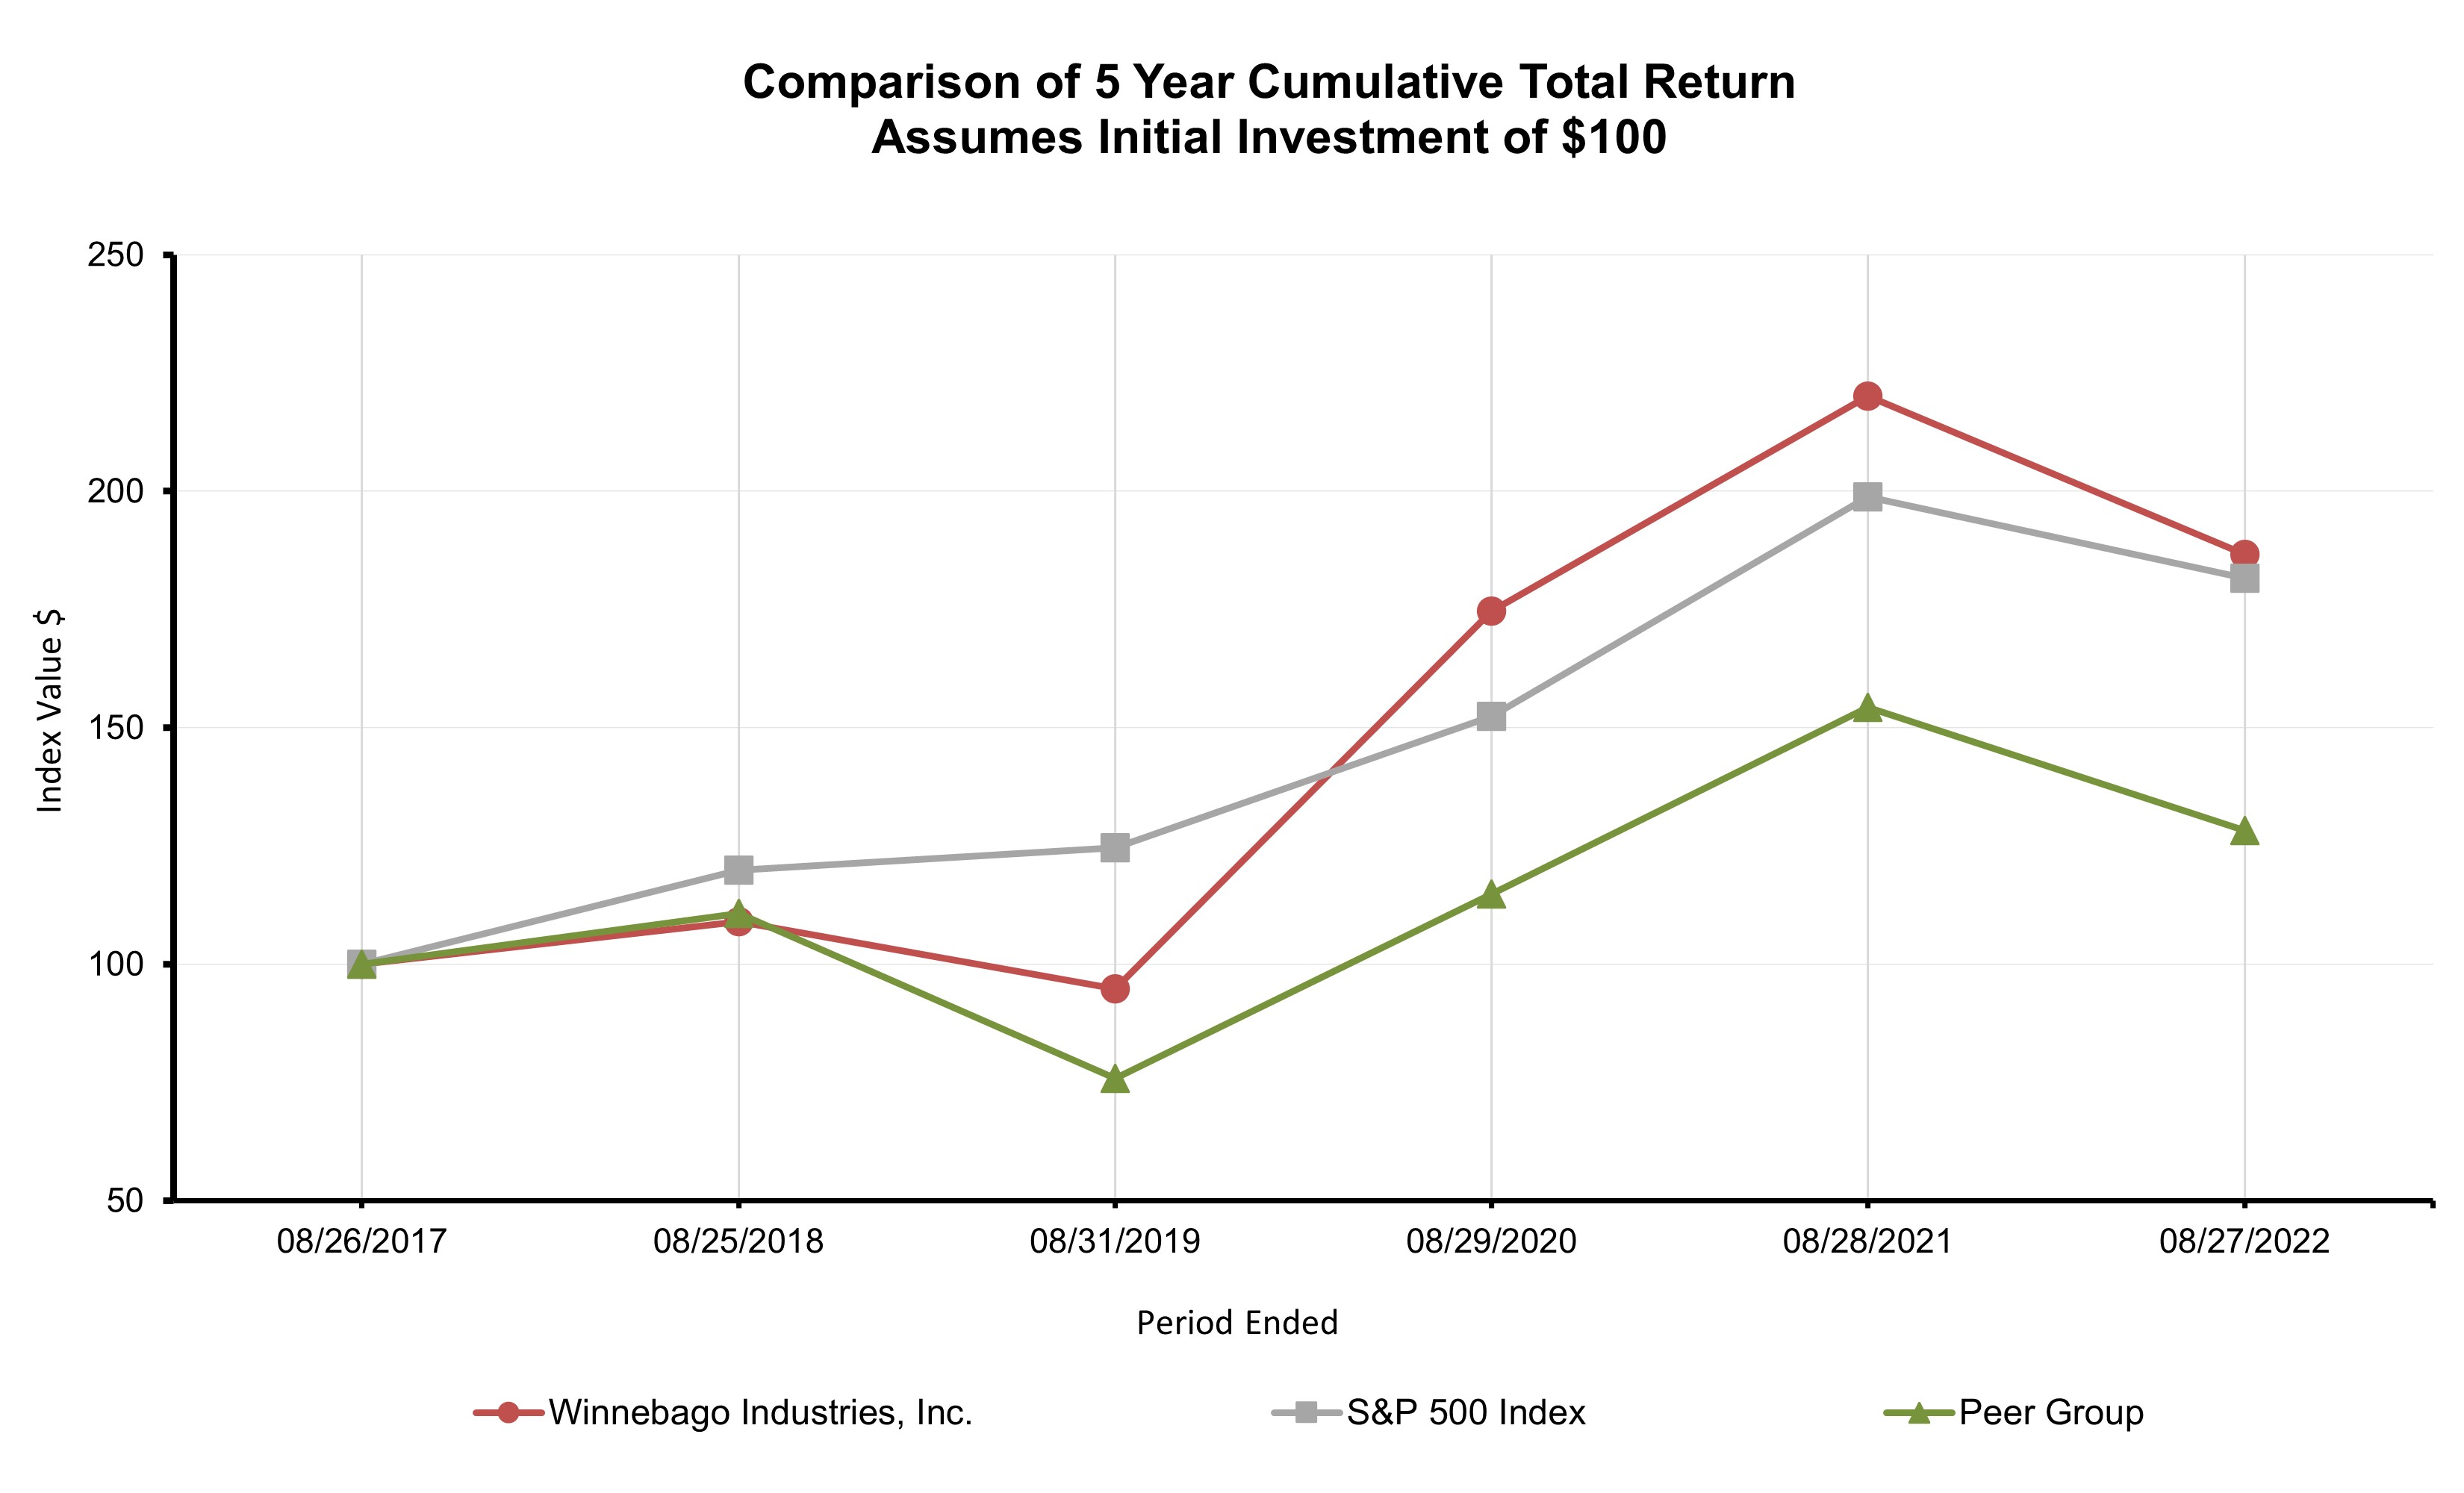
| | | | | | | | | | | | | | | | | | | | | | | | | | | | | | | | | | | |
| Base Period | | | | | | |
| Company/Index | August 26,
2017 | | August 25,
2018 | | August 31,
2019 | | August 29,
2020 | | August 28,
2021 | | August 27,
2022 |
| Winnebago Industries, Inc. | $ | 100.00 | | | $ | 108.95 | | | $ | 94.76 | | | $ | 174.59 | | | $ | 220.19 | | | $ | 186.60 | |
| S&P 500 Index | 100.00 | | | 119.94 | | | 124.66 | | | 152.32 | | | 198.76 | | | 181.53 | |
| Peer Group | 100.00 | | | 110.78 | | | 75.79 | | | 114.84 | | | 154.26 | | | 128.19 | |
Source: Zacks Investment Research, Inc.
Item 6. [Reserved].
Item 7. Management's Discussion and Analysis of Financial Condition and Results of Operations.
Management’s Discussion and Analysis of Financial Condition and Results of Operations (“MD&A”) is intended to provide a reader of our financial statements with a narrative from the perspective of management on our financial condition, results of operations, liquidity, and certain other factors that may affect our future results. Unless otherwise noted, transactions and other factors significantly impacting our financial condition, results of operations and liquidity are discussed in order of magnitude. Our MD&A is presented in five sections:
•Overview
•Results of Operations
•Analysis of Financial Condition, Liquidity, and Capital Resources
•Critical Accounting Policies and Estimates
•New Accounting Pronouncements
Our MD&A should be read in conjunction with the Consolidated Financial Statements and related Notes included in Item 8 of Part II in this Annual Report on Form 10-K.
The year-over-year comparisons in this MD&A are as of and for the fiscal years ended August 27, 2022 and August 28, 2021, unless stated otherwise. The discussion of Fiscal 2020 results and related year-over-year comparisons as of and for the fiscal years ended August 28, 2021 and August 29, 2020 are found in Item 7 of Part II of our Form 10-K for the fiscal year ended August 28, 2021.
Overview
Winnebago Industries, Inc. is one of the leading North American manufacturers of recreation vehicles ("RV"s) and marine products with a diversified portfolio used primarily in leisure travel and outdoor recreational activities. We produce our motorhome units in Iowa and Indiana; our towable units in Indiana; and our marine units in Indiana and Florida. We distribute our RV and marine products primarily through independent dealers across the U.S. and Canada, who then retail the products to the end consumer. We also distribute our marine products internationally through independent dealers, who then retail the products to the end consumer.
Macroeconomic Events
In February 2022, the United States announced targeted economic sanctions on Russia in response to the military conflict in Ukraine. As described in Part I, Item 1A — Risk Factors, in this Annual Report on Form 10-K, our business may be sensitive to economic conditions such as the adverse impact of global tensions, which could impact input costs, consumer spending, and fuel prices. As our operations are primarily in North America, we have no direct exposure to Russia and Ukraine. However, we are actively monitoring the broader economic impact of the crisis, especially the potential impact of rising commodity and fuel prices, and the potential decreased demand for our products.
COVID-19 Pandemic
The COVID-19 pandemic has resulted in strong retail demand by consumers of RVs as a safe travel option, and of marine products as a safe way to experience the outdoors. However, the pandemic has also caused global supply chain disruption. Our production has experienced certain supply shortages, particularly within our Motorhome and Marine segments, as well as material and component cost inflation. If these disruptions continue, or if there are additional disruptions in our supply chain, it could materially or adversely impact our operating results and financial condition. Despite certain supply shortages and inflationary cost input pressures, we continue to operate and adapt to these temporary supply chain disruptions. Refer to the COVID-19 related risk factor disclosed in Item 1A of Part I in this Annual Report on Form 10-K.
Acquisition of Barletta
On August 31, 2021, we completed our acquisition of all the equity interests of Barletta for $286.3 million funded with cash payments of $240.1 million, $25.0 million in common stock issued to the sellers (subject to a 12% discount), and contingent consideration from earnout provisions. For further discussion regarding the acquisition, refer to Note 2 in the Notes to Consolidated Financial Statements, included in Item 8 of Part II in this Annual Report on Form 10-K.
The acquisition of Barletta resulted in a newly created Marine reportable segment effective as of the first quarter of Fiscal 2022. The Marine reportable segment consists of the Barletta and Chris-Craft operating segments.
Non-GAAP Financial Measures
This MD&A includes financial information prepared in accordance with generally accepted accounting principles ("GAAP"), as well as certain adjusted or non-GAAP financial measures such as EBITDA and Adjusted EBITDA. EBITDA is defined as net income before interest expense, provision for income taxes, and depreciation and amortization expense. Adjusted EBITDA is defined as net income before interest expense, provision for income taxes, depreciation and amortization expense, and other pretax
adjustments made in order to present comparable results from period to period.
These non-GAAP financial measures, which are not calculated or presented in accordance with GAAP, have been provided as information supplemental and in addition to the financial measures presented in accordance with GAAP. Such non-GAAP financial measures should not be considered superior to, as a substitute for, or as an alternative to, and should be considered in conjunction with, the GAAP financial measures presented herein. The non-GAAP financial measures presented may differ from similar measures used by other companies.
Included in "Results of Operations - Fiscal 2022 Compared to Fiscal 2021" is a reconciliation of EBITDA and Adjusted EBITDA from net income, the nearest GAAP measure. We have included these non-GAAP performance measures as a comparable measure to illustrate the effect of non-recurring transactions that occurred during the reported periods and to improve comparability of our results from period to period. We believe Adjusted EBITDA provides meaningful supplemental information about our operating performance as this measure excludes amounts from net income that we do not consider part of our core operating results when assessing our performance. Examples of items excluded from Adjusted EBITDA include acquisition-related fair-value inventory step-up, acquisition-related costs, litigation reserves, restructuring expenses, gain or loss on sale of property, plant and equipment, contingent consideration fair value adjustment, and non-operating income or loss.
Management uses these non-GAAP financial measures (a) to evaluate our historical and prospective financial performance and trends as well as our performance relative to competitors and peers; (b) to measure operational profitability on a consistent basis; (c) in presentations to the members of our Board of Directors to enable our Board of Directors to have the same measurement basis of operating performance as used by management in its assessments of performance and in forecasting; (d) to evaluate potential acquisitions; and (e) to ensure compliance with covenants and restricted activities under the terms of our ABL Credit Facility and outstanding notes, as further described in Note 9 in the Notes to Consolidated Financial Statements, included in Item 8 of Part II in this Annual Report on Form 10-K. We believe these non-GAAP financial measures are frequently used by securities analysts, investors and other interested parties to evaluate companies in the industry.
Industry Trends
The RV and marine industries continue to experience shipping delays, and material and component cost inflation. In addition, both industries continue to experience supply chain disruptions and shortages, particularly within the Motorhome and Marine segments. While we continue to operate and adapt to these supply chain disruptions, they impacted our ability to increase production to meet existing demand during Fiscal 2022 and continuing in Fiscal 2023.
We believe field inventory for our Towable segment is returning to normalized levels to adequately serve end consumer demand, whereas field inventory for our Motorhome and Marine segments remains lower than desired by our dealer network, which indicates future strength in wholesale shipments. We continue to produce and ship in accordance with dealer demand as evidenced and requested by dealer orders.
RV industry retail sales have been softening compared to record high prior year levels; however, we still believe in the long-term health of consumer demand for RV and marine products. More people are pursuing outdoor activities, household penetration of RVs is increasing, and campers are more diverse than ever. According to statistics published by Kampgrounds of America, Inc., over 14 million households camped for the first time in 2020 and 2021, and combined with record levels of first-time buyers of RVs over the past two years, we believe a positive outlook exists for new product and upgrade-related sales. Despite these developments, current macroeconomic trends such as inflation, rising interest rates and low consumer sentiment, as well as global political tensions, contribute to reduced short-term consumer demand for large discretionary products such as RVs and Marine products, which could in turn impact our future revenue and profits.
Results of Operations - Fiscal 2022 Compared to Fiscal 2021
Consolidated Performance Summary
The following is an analysis of changes in key items included in the statements of operations for the fiscal year ended August 27, 2022 compared to the fiscal year ended August 28, 2021: | | | | | | | | | | | | | | | | | | | | | | | | | | | | | | | | | | | |
| (in thousands, except percent and per share data) | 2022 | | % of Revenues(1) | | 2021 | | % of Revenues(1) | | $ Change | | % Change |
| Net revenues | $ | 4,957,730 | | | 100.0 | % | | $ | 3,629,847 | | | 100.0 | % | | $ | 1,327,883 | | | 36.6 | % |
| Cost of goods sold | 4,028,393 | | | 81.3 | % | | 2,979,484 | | | 82.1 | % | | 1,048,909 | | | 35.2 | % |
| Gross profit | 929,337 | | | 18.7 | % | | 650,363 | | | 17.9 | % | | 278,974 | | | 42.9 | % |
| Selling, general, and administrative expenses ("SG&A") | 316,420 | | | 6.4 | % | | 228,581 | | | 6.3 | % | | 87,839 | | | 38.4 | % |
| Amortization | 29,419 | | | 0.6 | % | | 14,361 | | | 0.4 | % | | 15,058 | | | 104.9 | % |
| Total operating expenses | 345,839 | | | 7.0 | % | | 242,942 | | | 6.7 | % | | 102,897 | | | 42.4 | % |
| Operating income | 583,498 | | | 11.8 | % | | 407,421 | | | 11.2 | % | | 176,077 | | | 43.2 | % |
| Interest expense, net | 41,313 | | | 0.8 | % | | 40,365 | | | 1.1 | % | | 948 | | | 2.3 | % |
| Non-operating loss (income) | 27,463 | | | 0.6 | % | | (394) | | | — | % | | (27,857) | | | (7,070.3) | % |
| Income before income taxes | 514,722 | | | 10.4 | % | | 367,450 | | | 10.1 | % | | 147,272 | | | 40.1 | % |
| Provision for income taxes | 124,086 | | | 2.5 | % | | 85,579 | | | 2.4 | % | | 38,507 | | | 45.0 | % |
| Net income | $ | 390,636 | | | 7.9 | % | | $ | 281,871 | | | 7.8 | % | | $ | 108,765 | | | 38.6 | % |
| | | | | | | | | | | |
| Diluted earnings per share | $ | 11.84 | | | | | $ | 8.28 | | | | | $ | 3.56 | | | 43.0 | % |
| Diluted weighted average shares outstanding | 32,985 | | | | | 34,056 | | | | | (1,071) | | | (3.1) | % |
(1) Percentages may not add due to rounding differences.
Net revenues increased primarily due to incremental sales from the acquisition of Barletta, price increases, and unit growth.
Gross profit as a percentage of revenue increased primarily due to improved operating leverage on higher revenues and price increases, partially offset by higher material and component costs, and production inefficiencies caused by supply constraints.
Operating expenses increased primarily due to higher operating expenses to support increased sales, acquisition-related costs, incremental operating expenses and amortization associated with the acquisition of Barletta, and higher incentive-based compensation related to operating performance.
Non-operating loss increased predominantly due to the contingent consideration fair value adjustment related to the acquisition of Barletta.
Our effective tax rate increased primarily due to the impact of consistent tax credits compared to the prior year over increased income in the current year and a net unfavorable expense in the current year related to nondeductible compensation.
Net income and diluted earnings per share increased primarily due to leverage gained on higher revenues, partially offset by increased operating expenses and higher income tax expense.
Non-GAAP Reconciliation
The following table reconciles net income to consolidated EBITDA and Adjusted EBITDA for Fiscal 2022 and 2021: | | | | | | | | | | | |
| (in thousands) | 2022 | | 2021 |
| Net income | $ | 390,636 | | | $ | 281,871 | |
| Interest expense, net | 41,313 | | | 40,365 | |
| Provision for income taxes | 124,086 | | | 85,579 | |
| Depreciation | 24,238 | | | 18,201 | |
| Amortization | 29,419 | | | 14,361 | |
| EBITDA | 609,692 | | | 440,377 | |
| Acquisition-related costs | 5,222 | | | 725 | |
| Litigation reserves | 6,551 | | | — | |
Restructuring expenses (1) | — | | | 112 | |
| Gain on sale of property, plant and equipment | — | | | (4,753) | |
| Contingent consideration fair value adjustment | 29,382 | | | — | |
| Non-operating income | (1,919) | | | (394) | |
| Adjusted EBITDA | $ | 648,928 | | | $ | 436,067 | |
(1) Balance excludes depreciation expense classified as restructuring as the balance is already included in the EBITDA calculation.
Reportable Segment Performance Summary
Towable
The following is an analysis of key changes in our Towable segment for Fiscal 2022 and 2021: | | | | | | | | | | | | | | | | | | | | | | | | | | | | | | | | | | | |
| (in thousands, except ASP and units) | 2022 | | % of Revenues | | 2021 | | % of Revenues | | $ Change | | % Change |
| Net revenues | $ | 2,597,358 | | | | | $ | 2,009,959 | | | | | $ | 587,399 | | | 29.2 | % |
| Adjusted EBITDA | 383,622 | | | 14.8 | % | | 289,007 | | | 14.4 | % | | 94,615 | | | 32.7 | % |
| | | | | | | | | | | |
Average Selling Price ("ASP")(1) | 43,038 | | | | | 33,271 | | | | | 9,767 | | | 29.4 | % |
| | | | | | | | | | | |
| Unit deliveries | 2022 | | Product Mix(2) | | 2021 | | Product Mix(2) | | Unit Change | | % Change |
| Travel trailer | 40,739 | | | 68.1 | % | | 39,943 | | | 66.5 | % | | 796 | | | 2.0 | % |
| Fifth wheel | 19,125 | | | 31.9 | % | | 20,163 | | | 33.5 | % | | (1,038) | | | (5.1) | % |
| Total Towable | 59,864 | | | 100.0 | % | | 60,106 | | | 100.0 | % | | (242) | | | (0.4) | % |
| | | | | | | | | | | |
| August 27, 2022 | | | | August 28, 2021 | | | | Change | | % Change |
Backlog(3) | | | | | | | | | | | |
| Units | 14,588 | | | | | 46,590 | | | | | (32,002) | | | (68.7) | % |
Dollars | $ | 576,491 | | | | | $ | 1,704,393 | | | | | $ | (1,127,902) | | | (66.2) | % |
| Dealer Inventory | | | | | | | | | | | |
| Units | 22,797 | | | | | 10,126 | | | | | 12,671 | | | 125.1 | % |
(1) ASP excludes off-invoice dealer incentives.
(2) Percentages may not add due to rounding differences.
(3) Our backlog includes all accepted orders from dealers which generally have been requested to be shipped within the next six months. Orders in backlog can be cancelled or postponed at the option of the dealer at any time without penalty; therefore, backlog may not necessarily be an accurate measure of future sales.
Net revenues increased primarily due to price increases related to higher material and component costs.
Adjusted EBITDA increased primarily due to revenue growth, partially offset by higher operating expenses to support increasing sales.
Motorhome
The following is an analysis of key changes in our Motorhome segment for Fiscal 2022 and 2021: | | | | | | | | | | | | | | | | | | | | | | | | | | | | | | | | | | | |
| (in thousands, except ASP and units) | 2022 | | % of Revenues | | 2021 | | % of Revenues | | $ Change | | % Change |
| Net revenues | $ | 1,911,196 | | | | | $ | 1,539,084 | | | | | $ | 372,112 | | | 24.2 | % |
| Adjusted EBITDA | 237,992 | | | 12.5 | % | | 169,205 | | | 11.0 | % | | 68,787 | | | 40.7 | % |
| | | | | | | | | | | |
ASP(1) | 156,917 | | | | | 138,999 | | | | | 17,918 | | | 12.9 | % |
| | | | | | | | | | | |
| Unit deliveries | 2022 | | Product Mix(2) | | 2021 | | Product Mix(2) | | Unit Change | | % Change |
| Class A | 2,640 | | | 21.9 | % | | 2,957 | | | 27.1 | % | | (317) | | | (10.7) | % |
| Class B | 6,748 | | | 56.0 | % | | 5,431 | | | 49.8 | % | | 1,317 | | | 24.2 | % |
| Class C | 2,670 | | | 22.1 | % | | 2,521 | | | 23.1 | % | | 149 | | | 5.9 | % |
| Total Motorhome | 12,058 | | | 100.0 | % | | 10,909 | | | 100.0 | % | | 1,149 | | | 10.5 | % |
| | | | | | | | | | | |
| August 27, 2022 | | | | August 28, 2021 | | | | Change | | % Change |
Backlog(3) | | | | | | | | | | | |
| Units | 12,024 | | | | | 18,254 | | | | | (6,230) | | | (34.1) | % |
Dollars | $ | 1,687,571 | | | | | $ | 2,303,504 | | | | | $ | (615,933) | | | (26.7) | % |
| Dealer Inventory | | | | | | | | | | | |
| Units | 3,824 | | | | | 2,465 | | | | | 1,359 | | | 55.1 | % |
(1) ASP excludes off-invoice dealer incentives.
(2) Percentages may not add due to rounding differences.
(3) Our backlog includes all accepted orders from dealers which generally have been requested to be shipped within the next six months. Orders in backlog can be cancelled or postponed at the option of the dealer at any time without penalty; therefore, backlog may not necessarily be an accurate measure of future sales.
Net revenues increased primarily due to price increases related to higher material and component costs, and unit growth.
Adjusted EBITDA increased primarily due to revenue growth, partially offset by higher material and component costs, and operating expenses.
Marine
The following is an analysis of key changes in our Marine segment for Fiscal 2022 and 2021: | | | | | | | | | | | | | | | | | | | | | | | | | | | | | | | | | | | |
| (in thousands, except ASP and units) | 2022 | | % of Revenues | | 2021 | | % of Revenues | | $ Change | | % Change |
| Net revenues | $ | 425,269 | | | | | $ | 60,209 | | | | | $ | 365,060 | | | 606.3 | % |
| Adjusted EBITDA | 60,831 | | | 14.3 | % | | 5,177 | | | 8.6 | % | | 55,654 | | | 1,075.0 | % |
| | | | | | | | | | | |
ASP(1) | 75,023 | | | | | 202,450 | | | | | (127,427) | | | (62.9) | % |
| | | | | | | | | | | |
| Unit deliveries | 2022 | | | | 2021 | | | | Unit Change | | % Change |
| Boats | 5,692 | | | | | 296 | | | | | 5,396 | | | 1,823.0 | % |
| | | | | | | | | | | |
| August 27, 2022 | | | | August 28, 2021 | | | | Change | | % Change |
Backlog(2) | | | | | | | | | | | |
| Units | 3,595 | | | | | 531 | | | | | 3,064 | | | 577.0 | % |
| Dollars | $ | 314,718 | | | | | $ | 116,926 | | | | | $ | 197,792 | | | 169.2 | % |
| Dealer Inventory | | | | | | | | | | | |
| Units | 2,077 | | | | | 70 | | | | | 2,007 | | | 2,867.1 | % |
(1) ASP excludes off-invoice dealer incentives.
(2) Our backlog includes all accepted orders from dealers which generally have been requested to be shipped within the next six months. Orders in backlog generally can be cancelled or postponed at the option of the dealer at any time without penalty; therefore, backlog may not necessarily be an accurate measure of future sales.
Net revenues and Adjusted EBITDA increased primarily due to the acquisition of Barletta at the beginning of the first quarter of Fiscal 2022.
Analysis of Financial Condition, Liquidity, and Capital Resources
Cash Flows
The following table summarizes our cash flows from total operations for Fiscal 2022 and 2021: | | | | | | | | | | | |
| (in thousands) | 2022 | | 2021 |
| Total cash provided by (used in): | | | |
| Operating activities | $ | 400,622 | | | $ | 237,279 | |
| Investing activities | (315,670) | | | (33,009) | |
| Financing activities | (237,343) | | | (62,282) | |
| Net (decrease) increase in cash and cash equivalents | $ | (152,391) | | | $ | 141,988 | |
Operating Activities
Cash provided by operating activities increased in Fiscal 2022 compared to Fiscal 2021 due to higher profitability, a $36.6 million increase in accrued expenses and other liabilities, and a $27.2 million increase in accounts payable to support the growth in the business, partially offset by a $171.3 million increase in inventory to support operational activities during a period impacted by continued supply chain challenges.
Investing Activities
Cash used in investing activities increased in Fiscal 2022 compared to Fiscal 2021 primarily due to our acquisition of Barletta during the first quarter of Fiscal 2022.
Financing Activities
Cash used in financing activities increased in Fiscal 2022 compared to Fiscal 2021 primarily due to an increase in stock repurchases in Fiscal 2022.
Debt and Capital
We maintain an ABL Credit Facility subject to certain factors which may accelerate the maturity date. On July 15, 2022, our ABL Credit Facility was amended and restated to, among other things, increase the commitments thereunder to $350.0 million, from $192.5 million, and extend the maturity date to July 15, 2027 from October 22, 2024. As of August 27, 2022, we had $282.2 million in cash and cash equivalents and no borrowings against the ABL Credit Facility. We continue to evaluate the financial stability of the counterparties and counterparty risk for the Convertible Notes, the Senior Secured Notes, and the ABL Credit Facility.
On July 8, 2020, we closed our private offering (the "Senior Secured Notes Offering") of $300.0 million in aggregate principal amount of 6.25% Senior Secured Notes due 2028 (the "Senior Secured Notes"). Refer to Note 9 in the Notes to Consolidated Financial Statements, included in Item 8 of Part II in this Annual Report on Form 10-K for additional details.
On November 1, 2019, we issued $300.0 million in aggregate principal amount of 1.5% unsecured Convertible Senior Notes due 2025 ("Convertible Notes"), which were used to partially fund the Newmar acquisition. Refer to Note 9 in the Notes to Consolidated Financial Statements, included in Item 8 of Part II in this Annual Report on Form 10-K for additional details.
Our cash and cash equivalent balances consist of high quality, short-term money market instruments.
Other Financial Measures
Working capital as of August 27, 2022 and August 28, 2021 was $571.7 million and $651.6 million, respectively.
Capital Expenditures
We anticipate capital expenditures in Fiscal 2023 of approximately $75.0 million to $100.0 million. We will continue to support organic growth through capacity expansion in our facilities and make capital improvements as necessary. We believe cash on hand, funds generated from operations, and the borrowing capacity available under our ABL Credit Facility and other debt instruments will be sufficient to support our capital expenditures for the foreseeable future.
Share Repurchases and Dividends
We repurchase our common stock and pay dividends pursuant to programs approved by our Board of Directors. Our long-term capital allocation strategy is to first fund operations and investments in growth, maintain reasonable liquidity, maintain a leverage ratio that reflects a prudent capital structure in light of the cyclical industries we compete in, and then return excess cash over time to shareholders through dividends and share repurchases. Refer to Item 5 of Part II of this Annual Report on Form 10-K for discussion about our share repurchase program and dividend declared on August 17, 2022.
Cash Requirements
Our cash requirements within the next twelve months include accounts payable, accrued expenses, purchase commitments and other current liabilities.
Our cash requirements greater than twelve months from various contractual obligations and commitments include:
Debt Obligations and Interest Payments
Refer to Note 9 in the Notes to Consolidated Financial Statements, included in Item 8 of Part II in this Annual Report on Form 10-K for further detail of our debt and the timing of expected future principal and interest payments. Interest payments are based on fixed interest rates for the Senior Secured Notes and Convertible Notes.
Operating and Finance Leases
Refer to Note 10 in the Notes to Consolidated Financial Statements, included in Item 8 of Part II in this Annual Report on Form 10-K for further detail of our lease obligations and the timing of expected future payments.
Deferred Compensation Obligations
Refer to Note 11 in the Notes to Consolidated Financial Statements, included in Item 8 of Part II in this Annual Report on Form 10-K for further detail of our deferred compensation plans. We expect to pay $2.6 million in the next 12 months and $8.1 million beyond 12 months.
Contracted Services
Contracted services include agreements with third-party service providers for software, payroll services, equipment maintenance services, and audits for periods up to Fiscal 2025. We expect to pay $7.0 million beyond 12 months.
Contingent Repurchase Obligations
Refer to Note 12 in the Notes to Consolidated Financial Statements, included in Item 8 of Part II in this Annual Report on Form 10-K for further detail of our contingent repurchase commitment and estimated obligation, most of which we expect to expire within one year.
We expect to satisfy our short-term and long-term obligations through a combination of cash on hand, funds generated from operations, and the borrowing capacity available under our ABL Credit Facility and other debt instruments.
Critical Accounting Policies and Estimates
The consolidated financial statements are prepared in accordance with GAAP. In connection with the preparation of our financial statements, we are required to make assumptions and estimates about future events and apply judgments that affect the reported amounts of assets, liabilities, revenue, expenses, and the related disclosures. We base our assumptions, estimates, and judgments on historical experience, current trends, and other factors believed to be relevant at the time the consolidated financial statements are prepared. Because future events and their effects cannot be determined with certainty, actual results could differ from our assumptions and estimates, and such differences could be material.
Our significant accounting policies are discussed in Note 1 in the Notes to Consolidated Financial Statements, included in Item 8 of Part II in this Annual Report on Form 10-K. We believe that the following accounting policies and estimates are the most critical to aid in fully understanding and evaluating our reported financial results. These estimates require our most difficult, subjective, or complex judgments because they relate to matters that are inherently uncertain. We have reviewed these critical accounting policies and estimates and related disclosures with the Audit Committee of our Board of Directors.
We have not made any material changes during the past three fiscal years, nor do we believe there is a reasonable likelihood of a material future change to the accounting methodologies for the areas described below.
Accounting for Business Combinations
We account for business combinations under the acquisition method of accounting. This method requires the recording of acquired assets, including separately identifiable intangible assets, and assumed liabilities at their acquisition date fair values. The excess of the purchase price over the fair value of assets acquired and liabilities assumed is recorded as goodwill. Determining the fair value of assets acquired and liabilities assumed requires management’s judgment and often involves the use of significant estimates and assumptions, including assumptions with respect to future cash flows, discount rates, royalty rates and asset lives, among other items.
We used the income approach to value certain intangible assets. Under the income approach, an intangible asset’s fair value is equal to the present value of future economic benefits to be derived from ownership of the asset. We used the income approach known as the relief from royalty method to value the fair value of the trade names. The relief from royalty method is based on the hypothetical royalty stream that would be received if we were to license the trade name and was based on expected revenues. The fair value of the dealer network was estimated using an income approach known as the cost to recreate/cost savings method. This
method uses the replacement of the asset as an indicator of the fair value of the asset. The determination of the fair value of other assets acquired and liabilities assumed involves assessing factors such as the expected future cash flows associated with individual assets and liabilities and appropriate discount rates at the date of the acquisition.
Goodwill and Indefinite-lived Intangible Assets
We test goodwill and indefinite-lived intangible assets (trade names) for impairment at least annually in the fourth quarter and more frequently if events or circumstances occur that would indicate a reduction in fair value. Our test of impairment begins by either performing a qualitative evaluation or a quantitative test:
•Qualitative evaluation - Performed to determine whether it is more likely than not that the carrying value of goodwill or the trade name exceeds the fair value of the asset. During our qualitative assessment, we make significant estimates, assumptions, and judgments, including, but not limited to, the macroeconomic conditions, industry and market conditions, cost factors, overall financial performance of the Company and the reporting units, changes in our share price, and relevant company-specific events. If we determine that it is more likely than not that the carrying value of goodwill exceeds the fair value of goodwill, we perform the quantitative test to determine the amount of the impairment.
•Quantitative test - Used to calculate the fair value of goodwill or the trade name. If the carrying value of the reporting unit or trade name exceeds the fair value, the impairment is calculated as the difference between the carrying value and fair value. Our goodwill fair value model uses a blend of the income (discounted future cash flow) and market (guideline public company) approaches, which includes the use of significant unobservable inputs (Level 3 inputs). Our trade name fair value model uses the income (relief-from-royalty) approach, which includes the use of significant unobservable inputs (Level 3 inputs). During these valuations, we make significant estimates, assumptions, and judgments, including current and projected future levels of income based on management’s plans, business trends, market and economic conditions, and market-participant considerations.
Actual results may differ from assumed and estimated amounts. No impairments were recorded in Fiscal 2022, 2021, and 2020. For further information regarding goodwill and intangible assets, see Note 7 in the Notes to Consolidated Financial Statements, included in Item 8 of Part II in this Annual Report on Form 10-K.
Warranty
We provide certain service and warranty on our products. Estimated costs related to product warranty are accrued at the time of sale and are based upon past warranty claims and unit sales history. Estimates are adjusted as needed to reflect actual costs incurred as information becomes available.
In addition to the costs associated with the contractual warranty coverage provided on our products, we also occasionally incur costs as a result of additional service actions not covered by our warranties, including product recalls and customer satisfaction actions. Although we estimate and reserve for the cost of these service actions, there can be no assurance that expense levels will remain at current levels or such reserves will continue to be adequate.
A significant increase in dealership labor rates, the cost of parts, or the frequency of claims could have a material adverse impact on our operating results for the period or periods in which such claims or additional costs materialize. A hypothetical change of a 10% increase or decrease in our warranty liability as of August 27, 2022 would not have a material effect on our net income.
New Accounting Pronouncements
For a summary of new applicable accounting pronouncements, see Note 1 in the Notes to Consolidated Financial Statements, included in Item 8 of Part II in this Annual Report on Form 10-K.
Item 7A. Quantitative and Qualitative Disclosures About Market Risk.
The assets we maintain to fund deferred compensation have market risk, but we maintain a corresponding liability for these assets. The market risk is therefore borne by the participants in the deferred compensation program.
Interest Rate Risk
As of August 27, 2022, we have no interest rate swaps outstanding. The ABL Credit Facility is our only floating rate debt instrument, which remains undrawn as of August 27, 2022.
Item 8. Financial Statements and Supplementary Data.
MANAGEMENT'S REPORT ON INTERNAL CONTROL OVER FINANCIAL REPORTING
We, the management of Winnebago Industries, Inc. (the "Company") are responsible for establishing and maintaining effective internal control over financial reporting and for the assessment of the effectiveness of internal control over financial reporting. The Company's internal control over financial reporting is a process designed, as defined in Rule 13a-15(f) under the Securities Exchange Act of 1934, as amended, to provide reasonable assurance regarding the reliability of financial reporting and the preparation of financial statements for external purposes in accordance with generally accepted accounting principles.
The Company's internal control over financial reporting is supported by written policies and procedures that:
1.pertain to the maintenance of records that, in reasonable detail, accurately and fairly reflect the transactions and dispositions of the Company's assets;
2.provide reasonable assurance that transactions are recorded as necessary to permit preparation of financial statements in accordance with generally accepted accounting principles and that receipts and expenditures of the Company are being made only in accordance with authorizations of the Company's management and directors; and
3.provide reasonable assurance regarding prevention or timely detection of unauthorized acquisition, use or disposition of the Company's assets that could have a material effect on the financial statements.
In addition, the Audit Committee of the Board of Directors, consisting solely of independent directors, meets periodically with management of the Company, the internal auditors, and the independent registered public accounting firm to review internal accounting controls, audit results, and accounting principles and practices and annually selects the independent registered public accounting firm.
Because of its inherent limitations, internal control over financial reporting may not prevent or detect misstatements. Projections of any evaluation of effectiveness to future periods are subject to the risk that controls may become inadequate because of changes in conditions or that the degree of compliance with the policies or procedures may deteriorate.
In connection with the preparation of the Company's annual financial statements, management of the Company has undertaken an assessment of the effectiveness of the Company's internal control over financial reporting based on criteria established in Internal Control - Integrated Framework (2013) issued by the Committee of Sponsoring Organizations of the Treadway Commission ("COSO"). Management's assessment included an evaluation of the design of the Company's internal control over financial reporting and testing of the operational effectiveness of the Company's internal control over financial reporting.
Based on its assessment, management has concluded that the Company's internal control over financial reporting was effective as of August 27, 2022.
Deloitte & Touche LLP, the independent registered public accounting firm that audited the Company's financial statements included in this Annual Report on Form 10-K, has issued a report included herein, which expressed an unqualified opinion on the Company's internal control over financial reporting.
| | | | | | | | |
| /s/ Michael J. Happe | | /s/ Bryan L. Hughes |
| Michael J. Happe | | Bryan L. Hughes |
| President, Chief Executive Officer | | Senior Vice President, Chief Financial Officer |
| | |
| October 19, 2022 | | October 19, 2022 |
REPORT OF INDEPENDENT REGISTERED PUBLIC ACCOUNTING FIRM
To the shareholders and the Board of Directors of Winnebago Industries, Inc.
Opinion on the Financial Statements
We have audited the accompanying consolidated balance sheets of Winnebago Industries, Inc. and subsidiaries (the "Company") as of August 27, 2022, and August 28, 2021, the related consolidated statements of income and comprehensive income, changes in shareholders' equity, and cash flows, for each of the three years in the period ended August 27, 2022, and the related notes (collectively referred to as the "financial statements"). In our opinion, the financial statements present fairly, in all material respects, the financial position of the Company as of August 27, 2022, and August 28, 2021, and the results of its operations and its cash flows for each of the three years in the period ended August 27, 2022, in conformity with accounting principles generally accepted in the United States of America.
We have also audited, in accordance with the standards of the Public Company Accounting Oversight Board (United States) (PCAOB), the Company's internal control over financial reporting as of August 27, 2022, based on criteria established in Internal Control — Integrated Framework (2013) issued by the Committee of Sponsoring Organizations of the Treadway Commission and our report dated October 19, 2022, expressed an unqualified opinion on the Company's internal control over financial reporting.
Basis for Opinion
These financial statements are the responsibility of the Company's management. Our responsibility is to express an opinion on the Company's financial statements based on our audits. We are a public accounting firm registered with the PCAOB and are required to be independent with respect to the Company in accordance with the U.S. federal securities laws and the applicable rules and regulations of the Securities and Exchange Commission and the PCAOB.
We conducted our audits in accordance with the standards of the PCAOB. Those standards require that we plan and perform the audit to obtain reasonable assurance about whether the financial statements are free of material misstatement, whether due to error or fraud. Our audits included performing procedures to assess the risks of material misstatement of the financial statements, whether due to error or fraud, and performing procedures that respond to those risks. Such procedures included examining, on a test basis, evidence regarding the amounts and disclosures in the financial statements. Our audits also included evaluating the accounting principles used and significant estimates made by management, as well as evaluating the overall presentation of the financial statements. We believe that our audits provide a reasonable basis for our opinion.
Critical Audit Matters
The critical audit matters communicated below are matters arising from the current-period audit of the financial statements that were communicated or required to be communicated to the audit committee and that (1) relate to accounts or disclosures that are material to the financial statements and (2) involved our especially challenging, subjective, or complex judgments. The communication of critical audit matters does not alter in any way our opinion on the financial statements, taken as a whole, and we are not, by communicating the critical audit matters below, providing separate opinions on the critical audit matters or on the accounts or disclosures to which they relate.
Product Warranties – Grand Design – Refer to Note 8 to the financial statements.
Critical Audit Matter Description
The Company provides certain service and warranty on its products. Estimated costs related to product warranty are accrued at month-end based upon historical warranty claims and unit sales history. Estimates are adjusted as needed to reflect actual costs incurred as information becomes available. Grand Design RV, LLC (“Grand Design”) was founded in 2013 and acquired by the Company in November 2016 and makes up the majority of the Company’s $128 million product warranty accrual as of August 27, 2022.
We identified the product warranty accrual for Grand Design as a critical audit matter because of the significant judgments made by management to estimate costs related to product warranties at the time of sale. This required a high degree of auditor judgment and an increased extent of effort when performing audit procedures to evaluate the reasonableness of management’s estimates of future warranty claims based on historical claims paid, specifically due to Grand Design’s significant growth since inception, introduction of new product lines, relatively short history of warranty claims paid from which to develop product warranty estimates, and their direct connection to management’s incentive plans.
How the Critical Audit Matter Was Addressed in the Audit
Our audit procedures related to the product warranty for the Grand Design component included the following, among others:
•We evaluated the operating effectiveness of controls over management’s estimation of the product warranty accrual, including those over historical product warranty claim data and projected future product warranty claims.
•We evaluated the accuracy and relevance of the historical product warranty claims as an input to management’s product warranty accrual calculation.
•We evaluated the completeness of the warranty accrual estimate through inquiries of operational and executive management regarding knowledge of known product warranty claims or product issues and evaluated whether they were appropriately considered in the determination of the product warranty accrual.
•We evaluated management’s ability to accurately estimate the warranty accrual by comparing the product warranty accrual in prior years to the actual product warranty claims paid in subsequent years.
•We assessed management’s methodology and tested the valuation of the product warranty accrual by developing an expectation for the accrual based on the historical amounts recorded as a percentage of sales and compared our expectation to the amount recorded by management.
Business Combinations – Valuation of Barletta Boat Company, LLC – Refer to Note 2 to the financial statements.
Critical Audit Matter Description
On August 31, 2022, the Company completed the acquisition of 100% of Barletta Boat Company, LLC and Three Limes, LLC (collectively, “Barletta”) for consideration paid of $286.3 million. Under the acquisition method of accounting for business combinations, the purchase price was allocated to the assets acquired and liabilities assumed based on their respective fair values at the date of acquisition, including a trade name of $77 million, a dealer network of $20.4 million and contingent consideration of $24.2 million.
The fair value of the trade name was estimated using the relief-from-royalty method and required management to make significant estimates and assumptions related to future revenues and the selection of the royalty rate and discount rate. The fair value of the dealer network was estimated using the cost saving method and required management to make significant estimates and assumptions related to future cash flows and the selection of the discount rate. The fair value of the contingent consideration was valued using a probability-weighted scenario analysis of projected EBITDA and gross profit using a discount rate and required management to make significant assumptions related to the unobservable inputs and financial projections.
We identified the acquisition valuation of the indefinite-lived intangible assets and contingent consideration for Barletta as a critical audit matter because of the significant estimates and assumptions management made to the fair value of these assets and liabilities. This required a high degree of auditor judgment and an increased extent of effort, including the need to involve our fair value specialists, when performing audit procedures to evaluate the reasonableness of management’s valuation assumptions.
How the Critical Audit Matter Was Addressed in the Audit
Our audit procedures related to the acquisition valuation of the indefinite-lived intangible assets and contingent consideration for Barletta included the following, among others:
•We evaluated the design and operating effectiveness of controls over the valuation of the acquired intangible assets and contingent consideration, including management’s controls over forecasts of future revenues, gross profit and cash flows as well as the selection of the associated discount rates and royalty rate.
•We assessed the reasonableness of management’s forecast of future revenues, gross profit and cash flows by comparing the Company’s projections to historical results for Barletta and projected industry growth rates.
•With the assistance of our fair value specialists, we evaluated the reasonableness of the (1) valuation methodology and (2) the valuation assumptions used in the fair value analysis by:
◦Testing the source information underlying the determination of the discount and royalty rates.
◦Comparing the selected royalty rate to market data for comparable rates.
◦Testing the mathematical accuracy of the calculation of the discount and royalty rates.
◦Developing a range of independent estimates for the discount rates and comparing those to the discount rates selected by management.
◦Evaluating the reasonableness of the inputs used in the contingent consideration valuation, and other key judgments made by management as well as independently running the probability-weighted scenario analysis to calculate an independent estimate of fair value.
/s/ Deloitte & Touche LLP
Minneapolis, Minnesota
October 19, 2022
We have served as the Company's auditor since fiscal 1986.
REPORT OF INDEPENDENT REGISTERED PUBLIC ACCOUNTING FIRM
To the shareholders and the Board of Directors of Winnebago Industries, Inc.
Opinion on Internal Control over Financial Reporting
We have audited the internal control over financial reporting of Winnebago Industries, Inc. and subsidiaries (the “Company”) as of August 27, 2022, based on criteria established in Internal Control — Integrated Framework (2013) issued by the Committee of Sponsoring Organizations of the Treadway Commission (COSO). In our opinion, the Company maintained, in all material respects, effective internal control over financial reporting as of August 27, 2022, based on criteria established in Internal Control — Integrated Framework (2013) issued by COSO.
We have also audited, in accordance with the standards of the Public Company Accounting Oversight Board (United States) (PCAOB), the consolidated financial statements as of and for the year ended August 27, 2022, of the Company and our report dated October 19, 2022, expressed an unqualified opinion on those financial statements.
Basis for Opinion
The Company’s management is responsible for maintaining effective internal control over financial reporting and for its assessment of the effectiveness of internal control over financial reporting, included in the accompanying Management’s Report on Internal Control over Financial Reporting. Our responsibility is to express an opinion on the Company’s internal control over financial reporting based on our audit. We are a public accounting firm registered with the PCAOB and are required to be independent with respect to the Company in accordance with the U.S. federal securities laws and the applicable rules and regulations of the Securities and Exchange Commission and the PCAOB.
We conducted our audit in accordance with the standards of the PCAOB. Those standards require that we plan and perform the audit to obtain reasonable assurance about whether effective internal control over financial reporting was maintained in all material respects. Our audit included obtaining an understanding of internal control over financial reporting, assessing the risk that a material weakness exists, testing and evaluating the design and operating effectiveness of internal control based on the assessed risk, and performing such other procedures as we considered necessary in the circumstances. We believe that our audit provides a reasonable basis for our opinion.
Definition and Limitations of Internal Control over Financial Reporting
A company’s internal control over financial reporting is a process designed to provide reasonable assurance regarding the reliability of financial reporting and the preparation of financial statements for external purposes in accordance with generally accepted accounting principles. A company’s internal control over financial reporting includes those policies and procedures that (1) pertain to the maintenance of records that, in reasonable detail, accurately and fairly reflect the transactions and dispositions of the assets of the company; (2) provide reasonable assurance that transactions are recorded as necessary to permit preparation of financial statements in accordance with generally accepted accounting principles, and that receipts and expenditures of the company are being made only in accordance with authorizations of management and directors of the company; and (3) provide reasonable assurance regarding prevention or timely detection of unauthorized acquisition, use, or disposition of the company’s assets that could have a material effect on the financial statements.
Because of its inherent limitations, internal control over financial reporting may not prevent or detect misstatements. Also, projections of any evaluation of effectiveness to future periods are subject to the risk that controls may become inadequate because of changes in conditions, or that the degree of compliance with the policies or procedures may deteriorate.
/s/ Deloitte & Touche LLP
Minneapolis, Minnesota
October 19, 2022
Winnebago Industries, Inc.
Consolidated Statements of Income and Comprehensive Income
(in thousands, except per share data) | | | | | | | | | | | | | | | | | |
| For the fiscal year ended | August 27, 2022 | | August 28, 2021 | | August 29, 2020 |
| Net revenues | $ | 4,957,730 | | | $ | 3,629,847 | | | $ | 2,355,533 | |
| Cost of goods sold | 4,028,393 | | | 2,979,484 | | | 2,042,605 | |
| Gross profit | 929,337 | | | 650,363 | | | 312,928 | |
| Selling, general, and administrative expenses | 316,420 | | | 228,581 | | | 177,061 | |
| Amortization | 29,419 | | | 14,361 | | | 22,104 | |
| Total operating expenses | 345,839 | | | 242,942 | | | 199,165 | |
| Operating income | 583,498 | | | 407,421 | | | 113,763 | |
| Interest expense, net | 41,313 | | | 40,365 | | | 37,461 | |
| Non-operating loss (income) | 27,463 | | | (394) | | | (974) | |
| Income before income taxes | 514,722 | | | 367,450 | | | 77,276 | |
| Provision for income taxes | 124,086 | | | 85,579 | | | 15,834 | |
| Net income | $ | 390,636 | | | $ | 281,871 | | | $ | 61,442 | |
| | | | | |
| Earnings per common share: | | | | | |
| Basic | $ | 12.03 | | | $ | 8.41 | | | $ | 1.85 | |
| Diluted | $ | 11.84 | | | $ | 8.28 | | | $ | 1.84 | |
| | | | | |
| Weighted average common shares outstanding: | | | | | |
| Basic | 32,475 | | | 33,528 | | | 33,236 | |
| Diluted | 32,985 | | | 34,056 | | | 33,454 | |
| | | | | |
| Net income | $ | 390,636 | | | $ | 281,871 | | | $ | 61,442 | |
| Other comprehensive income (loss), net of tax: | | | | | |
Amortization of net actuarial loss (net of tax of $12, $12, and $12) | 37 | | | 35 | | | 33 | |
Interest rate swap activity (net of tax of $0, $0, and $22) | — | | | — | | | (68) | |
| Other comprehensive income (loss) | 37 | | | 35 | | | (35) | |
| Comprehensive income | $ | 390,673 | | | $ | 281,906 | | | $ | 61,407 | |
The accompanying Notes to Consolidated Financial Statements are an integral part of these consolidated financial statements.
Winnebago Industries, Inc.
Consolidated Balance Sheets
(in thousands, except per share data) | | | | | | | | | | | |
| August 27, 2022 | | August 28, 2021 |
| Assets | | | |
| Current assets | | | |
| Cash and cash equivalents | $ | 282,172 | | | $ | 434,563 | |
Receivables, less allowance for doubtful accounts ($567 and $307, respectively) | 254,124 | | | 253,808 | |
| Inventories, net | 525,769 | | | 341,473 | |
| Prepaid expenses and other current assets | 31,750 | | | 29,069 | |
| Total current assets | 1,093,815 | | | 1,058,913 | |
| Property, plant, and equipment, net | 276,219 | | | 191,427 | |
| Goodwill | 484,176 | | | 348,058 | |
| Other intangible assets, net | 472,388 | | | 390,407 | |
| Investment in life insurance | 28,624 | | | 28,821 | |
| Operating lease assets | 41,131 | | | 28,379 | |
| Other long-term assets | 20,304 | | | 16,562 | |
| Total assets | $ | 2,416,657 | | | $ | 2,062,567 | |
| | | |
| Liabilities and Shareholders' Equity | | | |
| Current liabilities | | | |
| Accounts payable | $ | 217,458 | | | $ | 180,030 | |
| Income taxes payable | 654 | | | 8,043 | |
| Accrued expenses: | | | |
| Accrued compensation | 71,646 | | | 67,541 | |
| Product warranties | 127,932 | | | 91,222 | |
| Self-insurance | 21,432 | | | 19,296 | |
| Promotional | 21,471 | | | 10,040 | |
| Accrued interest and dividends | 13,033 | | | 10,720 | |
| Other current liabilities | 48,471 | | | 20,384 | |
| Total current liabilities | 522,097 | | | 407,276 | |
| Non-current liabilities | | | |
| Long-term debt, net | 545,855 | | | 528,559 | |
| Deferred income taxes | 6,108 | | | 13,429 | |
| Unrecognized tax benefits | 5,744 | | | 6,483 | |
| Long-term operating lease liabilities | 40,426 | | | 26,745 | |
| Deferred compensation benefits, net of current portion | 8,145 | | | 9,550 | |
| Other long-term liabilities | 25,275 | | | 13,582 | |
| Total liabilities | 1,153,650 | | | 1,005,624 | |
| Contingent liabilities and commitments (Note 12) | | | |
| Shareholders' equity | | | |
Preferred stock, par value $0.01: 10,000 shares authorized; Zero shares issued and outstanding | — | | | — | |
Common stock, par value $0.50: 120,000 shares authorized; 51,776 shares issued | 25,888 | | | 25,888 | |
| Additional paid-in capital | 256,224 | | | 218,490 | |
| Retained earnings | 1,537,531 | | | 1,172,996 | |
| Accumulated other comprehensive loss | (454) | | | (491) | |
Treasury stock, at cost: 21,464 and 18,713 shares, respectively | (556,182) | | | (359,940) | |
| Total shareholders' equity | 1,263,007 | | | 1,056,943 | |
| Total liabilities and shareholders' equity | $ | 2,416,657 | | | $ | 2,062,567 | |
The accompanying Notes to Consolidated Financial Statements are an integral part of these consolidated financial statements.
Winnebago Industries, Inc.
Consolidated Statements of Cash Flows
(in thousands) | | | | | | | | | | | | | | | | | |
| For the fiscal year ended | August 27, 2022 | | August 28, 2021 | | August 29, 2020 |
| Operating Activities | | | | | |
| Net income | $ | 390,636 | | | $ | 281,871 | | | $ | 61,442 | |
| Adjustments to reconcile net income to net cash provided by operating activities | | | | | |
| Depreciation | 24,238 | | | 18,201 | | | 15,997 | |
| Amortization | 29,419 | | | 14,361 | | | 22,104 | |
| Non-cash interest expense, net | 15,074 | | | 13,928 | | | 10,727 | |
| Amortization of debt issuance costs | 2,477 | | | 2,465 | | | 7,379 | |
| Last in, first-out expense | 8,445 | | | 3,131 | | | (5,188) | |
| Stock-based compensation | 17,085 | | | 15,347 | | | 6,475 | |
| Deferred income taxes | (6,651) | | | (2,190) | | | (879) | |
| Deferred compensation expense | 524 | | | 1,087 | | | 1,070 | |
| Contingent consideration fair value adjustment | 29,382 | | | — | | | — | |
| Other, net | 1,850 | | | (4,665) | | | 1,335 | |
| Change in operating assets and liabilities, net of assets and liabilities acquired | | | | | |
| Receivables, net | 1,876 | | | (33,034) | | | (25,773) | |
| Inventories, net | (171,292) | | | (161,663) | | | 105,994 | |
| Prepaid expenses and other assets | 1,210 | | | (6,560) | | | (358) | |
| Accounts payable | 27,164 | | | 51,478 | | | 37,041 | |
| Income taxes and unrecognized tax benefits | (7,421) | | | (3,721) | | | 11,422 | |
| Accrued expenses and other liabilities | 36,606 | | | 47,243 | | | 21,646 | |
| Net cash provided by operating activities | 400,622 | | | 237,279 | | | 270,434 | |
| | | | | |
| Investing activities | | | | | |
| Purchases of property, plant, and equipment | (87,969) | | | (44,891) | | | (32,377) | |
| Acquisition of business, net of cash acquired | (228,159) | | | — | | | (260,965) | |
| Proceeds from the sale of property, plant, and equipment | 178 | | | 12,452 | | | — | |
| Other, net | 280 | | | (570) | | | 266 | |
| Net cash used in investing activities | (315,670) | | | (33,009) | | | (293,076) | |
| | | | | |
| Financing activities | | | | | |
| Borrowings on long-term debt | 4,735,580 | | | 3,627,627 | | | 2,786,824 | |
| Repayments on long-term debt | (4,735,580) | | | (3,627,627) | | | (2,446,824) | |
| Purchase of convertible bond hedge | — | | | — | | | (70,800) | |
| Proceeds from issuance of warrants | — | | | — | | | 42,210 | |
| Payments of cash dividends | (23,782) | | | (16,168) | | | (14,588) | |
| Payments for repurchases of common stock | (214,275) | | | (47,589) | | | (1,844) | |
| Payments of debt issuance costs | (1,240) | | | (224) | | | (18,030) | |
| Other, net | 1,954 | | | 1,699 | | | 838 | |
| Net cash (used in) provided by financing activities | (237,343) | | | (62,282) | | | 277,786 | |
| | | | | |
| Net (decrease)/increase in cash and cash equivalents | (152,391) | | | 141,988 | | | 255,144 | |
| Cash and cash equivalents at beginning of period | 434,563 | | | 292,575 | | | 37,431 | |
| Cash and cash equivalents at end of period | $ | 282,172 | | | $ | 434,563 | | | $ | 292,575 | |
| | | | | |
| | | | | | | | | | | | | | | | | |
| Supplemental Disclosures | | | | | |
| Income taxes paid, net | $ | 139,652 | | | $ | 88,698 | | | $ | 3,667 | |
| Interest paid | 23,779 | | | 24,119 | | | 17,253 | |
| | | | | |
| Non-cash investing and financing activities | | | | | |
| Issuance of common stock for acquisition of business | $ | 22,000 | | | $ | — | | | $ | 92,572 | |
| Issuance of common stock for settlement of earnout liability | 13,168 | | | — | | | — | |
| Capital expenditures in accounts payable | 6,843 | | | 3,760 | | | 178 | |
| Dividends declared not yet paid | 8,816 | | | 6,497 | | | 180 | |
| Increase in lease assets in exchange for lease liabilities: | | | | | |
| Operating leases | 17,236 | | | 2,626 | | | 1,179 | |
| Financing leases | 2,528 | | | 1,210 | | | 5,664 | |
The accompanying Notes to Consolidated Financial Statements are an integral part of these consolidated financial statements.
Winnebago Industries, Inc.
Consolidated Statements of Changes in Shareholders' Equity
(in thousands, except per share data) | | | | | | | | | | | | | | | | | | | | | | | | | | |
|
Common Shares | Additional Paid-In Capital | Retained Earnings | Accumulated Other Comprehensive Income (Loss) |
Treasury Stock | Total Shareholders' Equity |
| Number | Amount | Number | Amount |
Balance, August 31, 2019 | 51,776 | | 25,888 | | 91,185 | | 866,886 | | (491) | | (20,262) | | (351,256) | | 632,212 | |
| Stock-based compensation | — | | — | | 6,446 | | — | | — | | — | | 29 | | 6,475 | |
| Issuance of stock for employee benefit and stock-based awards, net | — | | — | | (1,813) | | — | | — | | 174 | | 3,013 | | 1,200 | |
| Issuance of stock for acquisition | — | | — | | 57,811 | | — | | — | | 2,000 | | 34,761 | | 92,572 | |
| Repurchase of common stock | — | | — | | — | | — | | — | | (45) | | (1,844) | | (1,844) | |
Common stock dividends declared; $0.45 per share | — | | — | | — | | (14,718) | | — | | — | | — | | (14,718) | |
| Total comprehensive income | — | | — | | — | | — | | (35) | | — | | — | | (35) | |
Equity component of convertible senior notes and offering costs, net of tax of $20,840 | — | | — | | 61,335 | | — | | — | | — | | — | | 61,335 | |
Convertible note hedge purchase, net of tax of $17,417 | — | | — | | (53,383) | | — | | — | | — | | — | | (53,383) | |
| Issuance of warrants | — | | — | | 42,210 | | — | | — | | — | | — | | 42,210 | |
| Net income | — | | — | | — | | 61,442 | | — | | — | | — | | 61,442 | |
Balance, August 29, 2020 | 51,776 | | 25,888 | | 203,791 | | 913,610 | | (526) | | (18,133) | | (315,297) | | 827,466 | |
| Stock-based compensation | — | | — | | 15,323 | | — | | — | | 1 | | 24 | | 15,347 | |
| Issuance of stock for employee benefit and stock-based awards, net | — | | — | | (624) | | — | | — | | 166 | | 2,922 | | 2,298 | |
| Repurchase of common stock | — | | — | | — | | — | | — | | (747) | | (47,589) | | (47,589) | |
Common stock dividends declared; $0.66 per share | — | | — | | — | | (22,485) | | — | | — | | — | | (22,485) | |
| Total comprehensive income | — | | — | | — | | — | | 35 | | — | | — | | 35 | |
| Net income | — | | — | | — | | 281,871 | | — | | — | | — | | 281,871 | |
Balance, August 28, 2021 | 51,776 | | 25,888 | | 218,490 | | 1,172,996 | | (491) | | (18,713) | | (359,940) | | 1,056,943 | |
| Stock-based compensation | — | | — | | 16,974 | | — | | — | | 4 | | 111 | | 17,085 | |
| Issuance of stock for employee benefit and stock-based awards, net | — | | — | | (2,461) | | — | | — | | 261 | | 5,293 | | 2,832 | |
| Issuance of stock for acquisition | — | | — | | 14,709 | | — | | — | | 379 | | 7,291 | | 22,000 | |
| Issuance of stock for settlement of earnout liability | — | | — | | 7,830 | | — | | — | | 244 | | 5,338 | | 13,168 | |
| Repurchase of common stock | — | | — | | — | | — | | — | | (3,639) | | (214,275) | | (214,275) | |
Common stock dividends declared; $0.81 per share | — | | — | | — | | (26,195) | | — | | — | | — | | (26,195) | |
| Other | — | | — | | 682 | | 94 | | — | | — | | — | | 776 | |
| Total comprehensive income | — | | — | | — | | — | | 37 | | — | | — | | 37 | |
| Net income | — | | — | | — | | 390,636 | | — | | — | | — | | 390,636 | |
Balance, August 27, 2022 | 51,776 | | 25,888 | | 256,224 | | 1,537,531 | | (454) | | (21,464) | | (556,182) | | 1,263,007 | |
The accompanying Notes to Consolidated Financial Statements are an integral part of these consolidated financial statements.
Winnebago Industries, Inc.
Notes to Consolidated Financial Statements
(All amounts in tables are in thousands, except share and per share data, unless otherwise designated)
Note 1. Basis of Presentation
Nature of Operations
Winnebago Industries, Inc. is one of the leading North American manufacturers of recreation vehicles ("RV"s) and marine products with a diversified portfolio used primarily in leisure travel and outdoor recreational activities. We produce our motorhome units in Iowa and Indiana; our towable units in Indiana; and our marine units in Indiana and Florida. We distribute our RV and marine products primarily through independent dealers throughout the U.S. and Canada, who then retail the products to the end consumer. We also distribute our marine products internationally through independent dealers, who then retail the products to the end consumer. Other products manufactured by us consist primarily of original equipment manufacturing parts for other manufacturers and commercial vehicles.
Consolidation
The consolidated financial statements include the accounts of Winnebago Industries, Inc. and its wholly-owned subsidiaries. Significant intercompany account balances and transactions have been eliminated. The use of the terms "Winnebago Industries," "Winnebago," "we," "our," and "us" in this Annual Report on Form 10-K, unless the context otherwise requires, refer to Winnebago Industries, Inc. and its wholly-owned subsidiaries.
Fiscal Period
We have a 5-4-4 quarterly accounting cycle with the fiscal year ending on the last Saturday in August. Fiscal 2022 refers to the fiscal year ended August 27, 2022, Fiscal 2021 refers to the fiscal year ended August 28, 2021, and Fiscal 2020 refers to the fiscal year ended August 29, 2020. The financial statements presented are all 52-week fiscal periods.
Use of Estimates
The preparation of financial statements in conformity with accounting principles generally accepted in the U.S. ("GAAP") requires management to make estimates and assumptions that affect the reported amounts of assets and liabilities and disclosure of contingent assets and liabilities at the date of the financial statements and the reported amounts of revenues and expenses during the reporting years. Actual results could differ from those estimates.
Cash and Cash Equivalents
Cash and cash equivalents represent cash, demand deposits and highly liquid investments with original maturities of three months or less that are not legally restricted. Cash equivalents are recorded at cost, which approximates fair value.
Receivables
Receivables consist principally of amounts due from our dealer network for RVs and boats sold.
We record an allowance using a model to reduce receivables by the expected credit loss and consider factors such as financial condition of the dealer, specific collection issues, current and expected economic conditions, and other factors that may impact our ability to collect. If there is a deterioration of a dealer's financial condition, if we become aware of additional information related to credit worthiness, or if future actual default rates on receivables differ from those currently anticipated, we may adjust the allowance for doubtful accounts, which would affect earnings in the period the adjustments are made.
Inventories
Generally, inventories are stated at the lower of cost or net realizable value determined under the First-in, First-out basis ("FIFO"), except for the Winnebago Motorhome operating segment which is determined using the Last-in, First-out ("LIFO") basis. Manufacturing cost includes materials, labor, and overhead. Unallocated overhead and abnormal costs are expensed as incurred.
Property and Equipment
Depreciation of property and equipment is computed using the straight-line method on the cost of the assets, less allowance for salvage value where appropriate, at rates based upon their estimated service lives as follows:
| | | | | |
| Asset Class | Asset Life |
| Buildings and improvements | 5-30 years |
| Machinery and equipment | 1-15 years |
| Software | 3-10 years |
| Transportation equipment | 3-6 years |
Goodwill and Indefinite-Lived Intangible Assets
Goodwill
Goodwill is tested for impairment at least annually, during the fourth quarter and whenever events occur or circumstances change that would indicate the carrying value may not be recoverable. Impairment testing for goodwill is performed at a reporting unit level and all goodwill is assigned to a reporting unit. Our reporting units are the same as the operating segments as defined in Note 3.
We have the option to first assess qualitative factors to determine whether the fair value of a reporting unit is “more likely than not” less than its carrying value. If it is more likely than not that an impairment has occurred, we then perform the quantitative goodwill impairment test. If we perform the quantitative test, the carrying value of the reporting unit is compared to an estimate of the reporting unit’s fair value to identify impairment. The estimate of the reporting unit’s fair value involves significant unobservable inputs (Level 3 inputs). The fair value is determined by a blend of the income approach (discounted future cash flow) and market approach (guideline public company) using current industry information. In determining the estimated future cash flow, we consider and apply certain estimates and judgments, including current and projected future levels of income based on management plans, business trends, prospects, market and economic conditions, and market-participant considerations. If the quantitative assessment of goodwill impairment fails, an impairment loss equal to the amount that a reporting unit's carrying value exceeds its fair value will be recognized.
During the fourth quarter of Fiscal 2022, we completed the annual goodwill impairment analysis. We elected to rely on a qualitative assessment for the Grand Design, Newmar, and Barletta reporting units, and performed a quantitative analysis for the Chris-Craft reporting unit. No impairment was identified for the years ended August 27, 2022, August 28, 2021, or August 29, 2020.
Trade names
We have indefinite-lived intangible assets for trade names related to Newmar within the Motorhome segment, Grand Design within the Towable segment, and Chris-Craft and Barletta within the Marine segment. Annually in the fourth quarter, or if conditions indicate an interim review is necessary, we test trade names for impairment. We have the option to first assess qualitative factors to determine whether the fair value of a trade name is “more likely than not” less than its carrying value. If it is more likely than not that an impairment has occurred, we then perform the quantitative impairment test. If we perform the quantitative test, the carrying value of the asset is compared to an estimate of its fair value to identify impairment. The fair value is determined by the relief-from-royalty method, which requires significant judgment. Actual results may differ from assumed and estimated amounts utilized in the analysis. If we conclude an impairment exists, the asset's carrying value will be written down to its fair value.
During the fourth quarter of Fiscal 2022, we completed the annual impairment analysis. We elected to rely on a qualitative assessment for the Grand Design, Newmar, and Barletta trade names, and performed a quantitative analysis for the Chris-Craft trade name. No impairment was identified for the years ended August 27, 2022, August 28, 2021, or August 29, 2020.
Long-Lived Assets
Long-lived assets, which include property, plant and equipment, definite-lived intangible assets subject to amortization, primarily the dealer network, and right-of-use assets are assessed for impairment whenever events or changes in circumstances such as asset utilization, physical change, legal factors or other matters indicate the carrying value of those assets may not be recoverable from future undiscounted cash flows. The impairment test involves comparing the carrying amount of the asset to the forecasted undiscounted future cash flows generated by that asset. These assumptions require significant judgment and actual results may differ from assumed and estimated amounts. In the event the carrying amount of the asset exceeds the undiscounted future cash flows generated by that asset and the carrying amount is not considered recoverable, an impairment exists. An impairment loss is measured as the excess of the asset’s carrying amount over its fair value and is recognized in the statement of income in the period that the impairment occurs. The reasonableness of the useful lives of the asset and other long-lived assets is regularly evaluated.
No impairment loss of any long-lived asset was identified for the years ended August 27, 2022, August 28, 2021, or August 29, 2020.
Self-Insurance
Generally, we self-insure a portion of health insurance, product liability claims, and workers' compensation. Under these plans, liabilities are recognized for claims incurred, including those incurred but not reported. We use third party administrators and actuaries who use historical claims experience and various state statutes to assist in the determination of the accrued liability balance. We have a $75.0 million insurance policy that includes a self-insured retention for product liability of $1.0 million per occurrence and $2.0 million in aggregate per policy year. Our self-insured health insurance policy includes an individual retention of $0.5 million per occurrence. We maintain excess liability insurance with outside insurance carriers to minimize the risks related to catastrophic claims in excess of self-insured positions for product liability, health insurance, and personal injury matters. Any material change in the aforementioned factors could have an adverse impact on operating results. Balances are included within self-insurance (accrued expenses) on the Consolidated Balance Sheets.
Income Taxes
In preparing these financial statements, we are required to estimate the income taxes in each of the jurisdictions in which we operate. This process involves estimating the current tax exposure together with assessing temporary differences resulting from differing treatment of items for tax and accounting purposes. These temporary differences result in deferred tax assets and liabilities, which are included on the Consolidated Balance Sheets. We then assess the likelihood that the deferred tax assets will be realized based on future taxable income and, to the extent that recovery is not likely, a valuation allowance is established. To the extent we establish a valuation allowance or change this allowance in a period, an expense or a benefit is included within the tax provision on the Consolidated Statements of Income and Comprehensive Income.
Legal
Litigation expense, including estimated defense costs, is recorded when probable and reasonably estimable.
Revenue Recognition
Our primary source of revenue is generated through the sale of non-motorized towable units, motorhome units, and marine units to our independent dealer network (customers). Unit revenue is recognized at a point-in-time when the performance obligation is satisfied and control of the promised goods or services is transferred to the customer, which generally occurs when the unit is shipped to or picked-up from the manufacturing facilities by the customer. Control refers to the ability of the customer to direct the use of, and obtain substantially all of, the remaining benefits from the goods or services. We recognize revenue based on an amount that reflects the transaction price consideration that we expect to receive in exchange for those goods or services. Our transaction price consideration is fixed, unless otherwise disclosed as variable consideration. The amount of consideration received and recorded to revenue can vary with changes in marketing incentives and discounts offered to customers. These marketing incentives and discounts are considered variable consideration. We adjust the estimate of revenue at the earlier of when the most likely amount of consideration expected to be received changes or when the consideration becomes fixed. Our payment terms are typically before or on delivery, and do not include a significant financing component.
Net revenue includes shipping and handling charges billed directly to customers, and we also generate income through the sale of certain parts and services, acting as the principal in these arrangements. We have made an accounting policy election to account for any shipping and handling costs that occur after the transfer of control as a fulfillment cost that is accrued when control is transferred. We also have made an accounting policy election to exclude from revenue sales and usage-based taxes collected.
Our contracts include some incidental items that are immaterial in the context of the contract. We have made an accounting policy election to not assess whether promised goods or services are performance obligations if they are immaterial in the context of the contract with the customer. Warranty obligations associated with the sale of a unit are assurance-type warranties that are a guarantee of the unit’s intended functionality and, therefore, do not represent a distinct performance obligation within the context of the contract. Contract costs incurred related to the sale of manufactured units are expensed at the point-in-time when the related revenue is recognized.
The revenue standard requirements are applied to a portfolio of contracts (or performance obligations) with similar characteristics for transactions where it is expected that the effects on the financial statements of applying the revenue recognition guidance to the portfolio would not differ materially from applying this guidance to the individual contracts (or performance obligations) within that portfolio.
Refer to Note 13 for additional information.
Advertising
Advertising costs, which consist primarily of trade shows and online content, were $23.3 million, $11.6 million, and $12.5 million in Fiscal 2022, 2021, and 2020, respectively. Advertising costs are included in selling, general, and administrative expenses and are expensed as incurred on the Consolidated Statements of Income and Comprehensive Income.
CARES Act
The Coronavirus Aid, Relief, and Economic Security ("CARES") Act was signed into law on March 27, 2020 to help alleviate the impact of the COVID-19 pandemic in the U.S. We took advantage of the employer payroll tax deferral offered by the CARES Act, which allowed us to defer the payment of employer payroll taxes for the period from March 27, 2020 to December 31, 2020. The deferred employer payroll tax liability was $8.1 million and $16.2 million as of August 27, 2022 and August 28, 2021, respectively. The deferred employer payroll tax liability paid in Fiscal 2022 was $8.1 million. We also took advantage of a tax credit granted to companies under the CARES Act who continued to pay their employees when operations were fully or partially suspended. The refundable tax credit available through the end of our third quarter of Fiscal 2020 reflected in cost of goods sold on the Consolidated Statements of Income and Comprehensive Income was approximately $4.0 million. The entire amount is expected to be received by the end of calendar year 2022. As of August 27, 2022, $0.8 million remains outstanding within other current assets on the Consolidated Balance Sheets.
Subsequent Events
We have evaluated events occurring between the end of the most recent fiscal year and the date the financial statements were issued.
On September 28, 2022, Hurricane Ian made landfall on the west coast of Florida near our marine facility in Sarasota. The facility sustained minimal damage, and we do not expect it to have a significant impact on the consolidated financial statements.
Recently Adopted Accounting Pronouncements
Accounting Standards Update ("ASU") Topic 740, Income Taxes: Simplifying the Accounting for Income Taxes, was adopted in the first quarter of Fiscal 2022. The new standard eliminates certain exceptions to Topic 740's general principles, improves consistent application and simplifies its application. We adopted the new guidance in the first quarter of Fiscal 2022, and there was not a material impact to our financial condition, results of operations or disclosures.
Recently Issued Accounting Pronouncements
In August 2020, the Financial Accounting Standards Board ("FASB") issued ASU 2020-06, Debt - Debt with Conversion and Other Options (Subtopic 470-20) and Derivatives and Hedging - Contracts in Entity's Own Equity (Subtopic 815-40) which reduces the number of models used to account for convertible instruments, amends diluted earnings per share ("EPS") calculations for convertible instruments, and amends the requirements for a contract (or embedded derivative) that is potentially settled in an entity's own shares to be classified in equity. Certain disclosure requirements were also added to increase transparency and decision-usefulness regarding a convertible instrument's terms and features. Additionally, the if-converted method must be used for including convertible instruments in diluted EPS as opposed to the treasury stock method. We adopted the new guidance in the first quarter of Fiscal 2023 using the modified retrospective approach, resulting in a decrease to additional paid-in capital of $62.0 million, an increase to long-term debt of $43.8 million, a decrease in the deferred income tax liability of $10.8 million, and an increase to beginning retained earnings of $29.0 million. The amended guidance is expected to lower non-cash interest expense in Fiscal 2023 by approximately $15.1 million (pre-tax) and increase the dilutive share count associated with the convertible instruments to approximately 4.7 million shares.
Note 2. Business Combinations
Barletta Boat Company, LLC
On August 31, 2021, we purchased 100% of the equity interests of Barletta Boat Company, LLC and Three Limes, LLC (collectively, "Barletta"), a manufacturer of high-quality, premium pontoon boats that are sold through a network of independent authorized dealers.
The acquisition of Barletta resulted in a newly created Marine reportable segment that includes the Barletta and Chris-Craft operating segments.
We acquired Barletta for a purchase price of $286.3 million, including cash payments of $240.1 million, $25.0 million in common stock issued to the sellers (subject to a discount noted below), and contingent consideration from earnout provisions. The common stock fair value included in the purchase price reflects a 12% discount, due to the lack of marketability as these are unregistered shares that have a one-year lockup restriction, which reduced the value of the common stock to $22.0 million. The contingent consideration includes both a potential stock payout as well as a potential cash payment based on achievement of certain financial performance metrics over the next few years. The maximum payout under the earnout is $50.0 million in cash and $15.0 million in stock if all metrics are achieved. The fair value of the earnout as of August 31, 2021 was $24.2 million. The fair value of the earnout as of August 27, 2022 was $39.8 million, of which $21.3 million is included in other current liabilities and $18.5 million is included in other long-term liabilities on the Consolidated Balance Sheets. In the third quarter of Fiscal 2022, we issued 0.2 million shares of common stock in connection with the settlement of the 2021 earnout period obligation.
The total purchase price was allocated to the acquired net tangible and intangible assets of Barletta, based on their preliminary fair values at the date of the acquisition. We finalized the allocation of the purchase price in the third quarter of fiscal 2022.
The following table summarizes the fair values assigned to the Barletta net assets acquired as of the date of acquisition:
| | | | | |
| (in thousands) | August 31, 2021 |
| Cash | $ | 11,903 | |
| Other current assets | 24,564 | |
| Property, plant, and equipment | 17,250 | |
| Goodwill | 136,118 | |
| Other intangible assets | 111,400 | |
| Total assets acquired | 301,235 | |
| Accounts payable | 7,181 | |
| Product warranties | 4,656 | |
| Other current liabilities | 3,146 | |
| Total liabilities assumed | 14,983 | |
| Total purchase price | $ | 286,252 | |
Goodwill from the Barletta acquisition is recognized in our newly created Marine segment. We expect that the full amount of goodwill will be deductible for tax purposes.
The intangible assets acquired include a trade name, dealer network, and backlog. The trade name has an indefinite life, while the dealer network is being amortized on a straight line basis over 12 years. The backlog, which was amortized over 10 months, is fully amortized as of August 27, 2022.
Total transaction costs related to the Barletta acquisition were $3.1 million, of which $2.4 million were expensed during the first quarter of Fiscal 2022 and $0.7 million were expensed during the fourth quarter of Fiscal 2021. Transaction costs are included in selling, general and administrative expenses in the accompanying Consolidated Statements of Income and Comprehensive Income.
Pro forma results of operations for this acquisition have not been presented as they were immaterial to the reported results.
Newmar Corporation
On November 8, 2019, pursuant to the terms of the Stock Purchase Agreement dated September 15, 2019 (the "Purchase Agreement"), Winnebago completed the acquisition of 100% of Newmar Corporation, Dutch Real Estate Corp., New-Way Transport, and New-Serv (collectively “Newmar”). Newmar is a leading manufacturer of Class A and Super C motorized recreation vehicles that are sold through an established network of independent authorized dealers throughout North America.
The following table summarizes the total consideration paid for Newmar, which was subject to purchase price adjustments of $3.3 million as stipulated in the Purchase Agreement:
| | | | | |
| (in thousands, except for share data) | November 8, 2019 |
| Cash | $ | 264,434 | |
Winnebago Industries shares: 2,000,000 at $46.29 | 92,572 | |
| Total | $ | 357,006 | |
The cash portion of the purchase price of the acquisition and certain transaction expenses were funded through the private placement of convertible senior notes (as further described in Note 9) and cash on hand. The stock consideration was discounted by 7.0% due to lack of marketability because of the one-year lock-up restrictions.
The results of Newmar's operations have been included in the Consolidated Financial Statements from the close of the acquisition within the Motorhome segment. The following table provides net revenues and operating loss from the Newmar operating segment included in the consolidated results following the November 8, 2019 closing date:
| | | | | |
| 2020 |
| Net revenues | $ | 388,383 | |
| Operating loss | (3,642) | |
The following unaudited pro forma information represents our results of operations as if the Fiscal 2020 acquisition of Newmar had occurred at the beginning of Fiscal 2020:
| | | | | |
| 2020 |
| Net revenues | $ | 2,508,792 | |
| Net income | 72,609 | |
| Earnings per share - basic | $ | 2.16 | |
| Earnings per share - diluted | $ | 2.11 | |
The unaudited pro forma data above includes the following significant non-recurring adjustments made to account for certain costs which would have changed if the acquisition of Newmar had occurred at the beginning of Fiscal 2020:
| | | | | |
| 2020 |
Amortization of intangibles (1 year or less useful life)(1) | $ | 13,610 | |
Increase in amortization of intangible assets(2) | (1,061) | |
Expenses related to business combination (transaction costs)(3) | 9,761 | |
Interest to reflect new debt structure(4) | (4,356) | |
Taxes related to the adjustments to the pro forma data and to the net income of Newmar(5) | (2,968) | |
(1) Includes amortization adjustments for the backlog intangible asset and the fair-value inventory adjustment.
(2) Includes amortization adjustments for the dealer network and non-compete intangible assets.
(3) Includes transaction costs related to the Newmar acquisition that were expensed in Fiscal 2020.
(4) Includes adjustments for cash and non-cash interest expense as well as deferred financing costs. Refer to Note 9 for additional information on our debt structure as a result of the acquisition.
(5) Calculated using our U.S. federal statutory rate of 21.0%.
Note 3. Business Segments
We have identified seven operating segments: 1) Grand Design towables, 2) Winnebago towables, 3) Winnebago motorhomes, 4) Newmar motorhomes, 5) Chris-Craft marine, 6) Barletta marine, and 7) Winnebago specialty vehicles. Financial performance is evaluated based on each operating segment's Adjusted Earnings Before Interest, Taxes, Depreciation and Amortization ("EBITDA"), as defined below, which excludes certain corporate administration expenses and non-operating income and expense.
The acquisition of Barletta resulted in a newly created Marine reportable segment effective for the first quarter of Fiscal 2022. The Marine reportable segment consists of the Barletta and Chris-Craft operating segments. Prior year amounts for Chris-Craft have been reclassified from Corporate / All Other category to the Marine segment.
Our three reportable segments are: Towable (an aggregation of the Grand Design towables and the Winnebago towables operating segments), Motorhome (an aggregation of the Winnebago motorhomes and Newmar motorhomes operating segments), and Marine (an aggregation of the Chris-Craft marine and Barletta marine operating segments). Towable is comprised of non-motorized products that are generally towed by another vehicle, along with other related manufactured products and services. Motorhome is comprised of products that include a motorized chassis, along with other related manufactured products and services. Marine is comprised of products that include boats, along with manufactured products and services.
The Corporate / All Other category includes the Winnebago specialty vehicles operating segments as well as certain corporate administration expenses related to the oversight of the enterprise, such as corporate leadership and administration costs.
Identifiable assets of the reportable segments exclude general corporate assets, which principally consist of cash and cash equivalents and certain deferred tax balances. The general corporate assets are included in the Corporate / All Other category.
Our Chief Executive Officer (the Chief Operating Decision Maker ("CODM")) regularly reviews consolidated financial results in their entirety and operating segment financial information through Adjusted EBITDA and has ultimate responsibility for enterprise decisions. Our CODM is responsible for allocating resources and assessing performance of the consolidated enterprise, reportable segments and between operating segments. Management of each operating segment has responsibility for operating decisions,
allocating resources and assessing performance within their respective operating segment. The accounting policies of all reportable segments are the same as those described in Note 1.
We monitor and evaluate operating performance of our reportable segments based on Adjusted EBITDA. We believe disclosing Adjusted EBITDA is useful to securities analysts, investors and other interested parties when evaluating companies in our industries. EBITDA is defined as net income before interest expense, provision for income taxes, and depreciation and amortization expense. Adjusted EBITDA is defined as net income before interest expense, provision for income taxes, depreciation and amortization expense, and other pretax adjustments made in order to present comparable results period over period. Examples of items excluded from Adjusted EBITDA include acquisition-related costs, litigation reserves, restructuring expenses, gain or loss on sale of property, plant and equipment, contingent consideration fair value adjustment, and non-operating income or loss.
Financial information by reportable segment is as follows: | | | | | | | | | | | | | | | | | |
| 2022 | | 2021 | | 2020 |
| Net Revenues | | | | | |
| Towable | $ | 2,597,358 | | | $ | 2,009,959 | | | $ | 1,227,567 | |
| Motorhome | 1,911,196 | | | 1,539,084 | | | 1,056,794 | |
| Marine | 425,269 | | | 60,209 | | | 51,812 | |
| Corporate / All Other | 23,907 | | | 20,595 | | | 19,360 | |
| Consolidated | $ | 4,957,730 | | | $ | 3,629,847 | | | $ | 2,355,533 | |
| | | | | |
| Adjusted EBITDA | | | | | |
| Towable | $ | 383,622 | | | $ | 289,007 | | | $ | 148,276 | |
| Motorhome | 237,992 | | | 169,205 | | | 32,949 | |
| Marine | 60,831 | | | 5,177 | | | (348) | |
| Corporate / All Other | (33,517) | | | (27,322) | | | (12,802) | |
| Consolidated | $ | 648,928 | | | $ | 436,067 | | | $ | 168,075 | |
| | | | | |
| Capital Expenditures | | | | | |
| Towable | $ | 45,703 | | | $ | 25,121 | | | $ | 13,389 | |
| Motorhome | 22,260 | | | 17,604 | | | 15,061 | |
| Marine | 16,367 | | | 2,166 | | | 3,927 | |
| Corporate / All Other | 3,639 | | | — | | | — | |
| Consolidated | $ | 87,969 | | | $ | 44,891 | | | $ | 32,377 | |
| | | | | | | | | | | |
| August 27, 2022 | | August 28, 2021 |
| Total Assets | | | |
| Towable | $ | 874,879 | | | $ | 790,257 | |
| Motorhome | 823,390 | | | 728,060 | |
| Marine | 416,146 | | | 102,901 | |
| Corporate / All Other | 302,242 | | | 441,349 | |
| Consolidated | $ | 2,416,657 | | | $ | 2,062,567 | |
Reconciliation of net income to consolidated Adjusted EBITDA is as follows: | | | | | | | | | | | | | | | | | |
| 2022 | | 2021 | | 2020 |
| Net income | $ | 390,636 | | | $ | 281,871 | | | $ | 61,442 | |
| Interest expense, net | 41,313 | | | 40,365 | | | 37,461 | |
| Provision for income taxes | 124,086 | | | 85,579 | | | 15,834 | |
| Depreciation | 24,238 | | | 18,201 | | | 15,997 | |
| Amortization | 29,419 | | | 14,361 | | | 22,104 | |
| EBITDA | 609,692 | | | 440,377 | | | 152,838 | |
| Acquisition-related fair-value inventory step-up | — | | | — | | | 4,810 | |
| Acquisition-related costs | 5,222 | | | 725 | | | 9,761 | |
| Litigation reserves | 6,551 | | | — | | | — | |
Restructuring expenses (1) | — | | | 112 | | | 1,640 | |
| Gain on sale of property, plant and equipment | — | | | (4,753) | | | — | |
| Contingent consideration fair value adjustment | 29,382 | | | — | | | — | |
| Non-operating income | (1,919) | | | (394) | | | (974) | |
| Adjusted EBITDA | $ | 648,928 | | | $ | 436,067 | | | $ | 168,075 | |
(1) Balance excludes depreciation expense classified as restructuring as the balance is already included in the EBITDA calculation.
Net revenues by geography are as follows: | | | | | | | | | | | | | | | | | |
| 2022 | | 2021 | | 2020 |
| United States | $ | 4,618,130 | | | $ | 3,410,588 | | | $ | 2,225,028 | |
| International | 339,600 | | | 219,259 | | | 130,505 | |
| Net revenues | $ | 4,957,730 | | | $ | 3,629,847 | | | $ | 2,355,533 | |
Note 4. Derivatives, Investments, and Fair Value Measurements
Assets and Liabilities that are Measured at Fair Value on a Recurring Basis
In determining the fair value of financial assets and liabilities, we utilize market data or other assumptions that we believe market participants would use in pricing the asset or liability in the principal or most advantageous market and adjusts for non-performance and/or other risks associated with us as well as counterparties, as appropriate. Assets and liabilities measured at fair value are classified using the following hierarchy, which is based upon the transparency of inputs to the valuation as of the measurement date:
Level 1 — Unadjusted quoted prices which are available in active markets for identical assets or liabilities accessible at the measurement date.
Level 2 — Inputs other than quoted prices included in Level 1 inputs that are observable for the asset or liability, either directly or indirectly, for substantially the full term of the asset or liability.
Level 3 — Unobservable inputs for the asset or liability used to measure fair value to the extent that observable inputs are not available, thereby allowing for situations in which there is little, if any, market activity for the asset or liability at the measurement date.
Assets and Liabilities that are Measured at Fair Value on a Recurring Basis
Financial assets and liabilities measured at fair value on a recurring basis are as follows: | | | | | | | | | | | | | | | | | | | | | | | |
| Fair Value at | | Fair Value Hierarchy |
| August 27, 2022 | | Level 1 | | Level 2 | | Level 3 |
| Assets that fund deferred compensation: | | | | | | | |
| Domestic equity funds | $ | 1,175 | | | $ | 1,175 | | | $ | — | | | $ | — | |
| International equity funds | 55 | | | 55 | | | — | | | — | |
| Fixed income funds | 181 | | | 181 | | | — | | | — | |
| Total assets at fair value | $ | 1,411 | | | $ | 1,411 | | | $ | — | | | $ | — | |
| | | | | | | |
| Contingent consideration | | | | | | | |
| Earnout liability | 39,812 | | | — | | | — | | | 39,812 | |
| Total liabilities at fair value | $ | 39,812 | | | $ | — | | | $ | — | | | $ | 39,812 | |
| | | | | | | | | | | | | | | | | | | | | | | |
| Fair Value at | | Fair Value Hierarchy |
| August 28, 2021 | | Level 1 | | Level 2 | | Level 3 |
| Assets that fund deferred compensation: | | | | | | | |
| Domestic equity funds | $ | 940 | | | $ | 940 | | | $ | — | | | $ | — | |
| International equity funds | 41 | | | 41 | | | — | | | — | |
| Fixed income funds | 46 | | | 46 | | | — | | | — | |
| Total assets at fair value | $ | 1,027 | | | $ | 1,027 | | | $ | — | | | $ | — | |
Assets that Fund Deferred Compensation
Our assets that fund deferred compensation are marketable equity securities measured at fair value using quoted market prices and primarily consist of equity-based mutual funds. These securities, used to fund the Executive Share Option Plan and the Executive Deferred Compensation Plan, are classified as Level 1 as they are traded in an active market for which closing stock prices are readily available. Refer to Note 11 for additional information regarding these plans.
The proportion of the assets that will fund options which expire within a year are included in prepaid expenses and other assets on the Consolidated Balance Sheets. The remaining assets are classified as non-current and are included in other long-term assets on the Consolidated Balance Sheets.
Contingent Consideration
Contingent consideration represents the earnout liability related to the Barletta acquisition and is valued using a probability-weighted scenario analysis of projected gross profit results and discounted at a risk-free rate. The contingent consideration is classified as Level 3. Actual gross profit results may differ significantly from those used in the estimate above, which may affect future payments. Changes in future payments will be reflected in future operating results as they occur.
The following table provides a reconciliation of the beginning and ending balances of the contingent consideration:
| | | | | | | | | | | |
| August 27,
2022 | | August 28,
2021 |
| Beginning fair value - contingent consideration | $ | — | | | $ | — | |
| Additions | 24,190 | | | — | |
| Fair value adjustments | 29,382 | | | — | |
| Settlements | (13,168) | | | — | |
| Other | (592) | | | — | |
| Ending fair value - contingent consideration | $ | 39,812 | | | $ | — | |
The fair value of the earnout liability that will be settled within a year is included in other current liabilities on the Consolidated Balance Sheets. The remaining earnout liability is included in other long-term liabilities on the Consolidated Balance Sheets.
Assets and Liabilities Measured at Fair Value on a Nonrecurring Basis
Certain financial instruments are measured at fair value on a nonrecurring basis. These assets primarily include goodwill, intangible assets, property, plant and equipment, and right-of-use lease assets. These assets were originally recognized at amounts equal to
the fair value determined at date of acquisition or purchase. If certain triggering events occur, or if an annual impairment test is required, we will evaluate the non-financial asset for impairment. If an impairment has occurred, the asset will be written down to its current estimated fair value. No impairments were recorded for non-financial assets in Fiscal 2022, 2021, and 2020.
Assets and Liabilities Not Measured at Fair Value
Certain financial instruments are not measured at fair value but are recorded at carrying amounts approximating fair value based on their short-term nature. These financial instruments include cash and cash equivalents, receivables, accounts payable, other payables, and long-term debt. If these instruments were measured at fair value in the financial statements, they would be classified as Level 1 in the fair value hierarchy. The fair value of our long-term debt was determined using current quoted prices in active
markets for our publicly traded debt obligations, which is classified as Level 1 in the fair value hierarchy. See Note 9 for information about the fair value of our long-term debt.
Note 5. Inventories
Inventories consist of the following: | | | | | | | | | | | |
| August 27, 2022 | | August 28, 2021 |
| Finished goods | $ | 59,340 | | | $ | 12,243 | |
| Work-in-process ("WIP") | 198,900 | | | 184,611 | |
| Raw materials | 314,938 | | | 183,583 | |
| Total | 573,178 | | | 380,437 | |
| Less: Excess of FIFO over LIFO cost | 47,409 | | | 38,964 | |
| Inventories, net | $ | 525,769 | | | $ | 341,473 | |
Inventory valuation methods consist of the following: | | | | | | | | | | | |
| August 27, 2022 | | August 28, 2021 |
| LIFO basis | $ | 212,245 | | | $ | 139,544 | |
| First-in, first-out basis | 360,933 | | | 240,893 | |
| Total | $ | 573,178 | | | $ | 380,437 | |
The above value of inventories, before reduction for the LIFO reserve, approximates replacement cost at the respective dates.
Note 6. Property, Plant, and Equipment
Property, plant, and equipment is stated at cost, net of accumulated depreciation and consists of the following: | | | | | | | | | | | |
| August 27, 2022 | | August 28, 2021 |
| Land | $ | 14,626 | | | $ | 9,111 | |
| Buildings and building improvements | 171,035 | | | 147,629 | |
| Machinery and equipment | 142,574 | | | 121,911 | |
| Software | 43,792 | | | 36,815 | |
| Transportation | 6,509 | | | 5,335 | |
| Construction in progress | 76,797 | | | 31,137 | |
| Property, plant, and equipment, gross | 455,333 | | | 351,938 | |
| Less: Accumulated depreciation | 179,114 | | | 160,511 | |
| Property, plant, and equipment, net | $ | 276,219 | | | $ | 191,427 | |
Depreciation expense was $24.2 million, $18.2 million, and $16.0 million for Fiscal 2022, 2021, and 2020, respectively.
Note 7. Goodwill and Intangible Assets
The changes in carrying value of goodwill by reportable segment, with no accumulated impairment losses, for Fiscal 2022, 2021, and 2020 are as follows: | | | | | | | | | | | | | | | | | | | | | | | |
| Towable | | Motorhome | | Marine | | Total |
Balances at August 29, 2020 (1) | $ | 244,684 | | | $ | 73,127 | | | $ | 30,247 | | | $ | 348,058 | |
| | | | | | | |
| Balances at August 28, 2021 | $ | 244,684 | | | $ | 73,127 | | | $ | 30,247 | | | $ | 348,058 | |
Acquisition of Barletta(2) | — | | | — | | | 136,118 | | | 136,118 | |
| Balances at August 27, 2022 | $ | 244,684 | | | $ | 73,127 | | | $ | 166,365 | | | $ | 484,176 | |
(1) There was no activity between the years ended August 29, 2020 and August 28, 2021.
(2) Refer to Note 2 for additional information on the acquisition of Barletta.
The valuation used to test goodwill for impairment is dependent upon a number of significant estimates and assumptions, including macroeconomic conditions, growth rates, competitive activities, cost containment, margin expansion and our business plans. We believe these estimates and assumptions are reasonable. However, future changes in the judgments, assumptions and estimates that are used in our goodwill impairment analysis, including discount and tax rates or future cash flow projections, could result in significantly different estimates of the fair values.
Other intangible assets, net of accumulated amortization, consist of the following: | | | | | | | | | | | | | | | | | |
| August 27, 2022 |
| Gross Carrying Amount | | Accumulated Amortization | | Net Carrying Value |
| Trade names | $ | 352,250 | | | | $ | 352,250 | |
| Dealer networks | 179,981 | | $ | 60,518 | | 119,463 | |
| Backlog | 42,327 | | 42,327 | | — | |
| Non-compete agreements | 6,647 | | 5,972 | | 675 | |
| Other intangible assets | 581,205 | | 108,817 | | 472,388 | |
| | | | | |
| August 28, 2021 |
| Gross Carrying Amount | | Accumulated Amortization | | Net Carrying Value |
| Trade names | $ | 275,250 | | | | $ | 275,250 | |
| Dealer networks | 159,581 | | $ | 45,652 | | 113,929 | |
| Backlog | 28,327 | | 28,327 | | — | |
| Non-compete agreements | 6,647 | | 5,419 | | 1,228 | |
| Other intangible assets | 469,805 | | 79,398 | | 390,407 | |
The weighted average remaining amortization period for finite-lived intangible assets as of August 27, 2022 was approximately eight years.
Estimated future amortization expense related to finite-lived intangible assets is as follows: | | | | | |
| Amortization |
| Fiscal 2023 | $ | 15,226 | |
| Fiscal 2024 | 15,124 | |
| Fiscal 2025 | 14,919 | |
| Fiscal 2026 | 14,865 | |
| Fiscal 2027 | 14,865 | |
| Thereafter | 45,139 | |
| Total amortization expense remaining | $ | 120,138 | |
Note 8. Product Warranties
We provide certain service and warranty on our products. From time to time, we also voluntarily incur costs for certain warranty-type expenses occurring after the normal warranty period expires to help protect the reputation of our products and maintain the goodwill of our customers. Estimated costs related to product warranty are accrued at the time of sale and are based upon historical warranty and service claims experience. Adjustments are made to accruals as claim data and cost experience becomes available.
In addition to the costs associated with the contractual warranty coverage provided on products, we also occasionally incur costs as a result of additional service actions not covered by warranties, including product recalls and customer satisfaction actions. Although we estimate and reserve for the cost of these service actions when probable and estimable, there can be no assurance that expense levels will remain at current levels or such reserves will continue to be adequate.
Changes in the product warranty liability are as follows: | | | | | | | | | | | | | | | | | |
| 2022 | | 2021 | | 2020 |
| Balance at beginning of year | $ | 91,222 | | | $ | 64,031 | | | $ | 44,436 | |
Business acquisitions(1) | 4,656 | | | — | | | 15,147 | |
| Provision | 119,286 | | | 89,951 | | | 61,898 | |
| Claims paid | (87,232) | | | (62,760) | | | (57,450) | |
| Balance at end of year | $ | 127,932 | | | $ | 91,222 | | | $ | 64,031 | |
(1) Refer to Note 2 for additional information regarding the acquisition of Barletta on August 31, 2021 and the acquisition of Newmar on November 8, 2019.
Note 9. Long-Term Debt
On July 15, 2022, we amended and restated our existing asset-backed revolving credit agreement ("ABL Credit Facility") to, among other things, increase the commitments available from $192.5 million to $350.0 million, and extend the maturity date from October 22, 2024 to July 15, 2027 (subject to certain factors which may accelerate the maturity date). The $350.0 million credit facility is on a revolving basis, subject to availability under a borrowing base consisting of eligible accounts receivable and eligible inventory. The ABL is available for issuance of letters of credit to a specified limit of $35.0 million. We pay a commitment fee of 0.25% based on the average daily amount of the facility available, but unused during the most recent quarter. We can elect to base the interest rate on various rates plus specific spreads depending on the borrowing amount outstanding. If drawn, interest on ABL borrowings is at a floating rate based upon our election, either term SOFR or REVSOFR30 (as defined in the credit agreement), plus, in each case, a credit spread adjustment of 0.10%, as well as an applicable spread between 1.25% and 1.75%, depending on the usage of the facility during the most recent quarter. Based on current usage, we would pay an applicable spread of 1.25%. In connection with the amendment, we capitalized $1.2 million of issuance costs that will be amortized over the five-year term of the agreement.
On July 8, 2020, we closed our private offering (the “Senior Secured Notes Offering”) of $300.0 million aggregate principal amount of 6.25% Senior Secured Notes due 2028 (the “Senior Secured Notes”). The Senior Secured Notes were issued in accordance with an Indenture dated as of July 8, 2020 (the “Indenture”). The Senior Secured Notes will mature on July 15, 2028 unless earlier redeemed or repurchased. Interest on the Senior Secured Notes accrues starting July 8, 2020 and is payable semi-annually in arrears on January 15 and July 15 of each year, which began on January 15, 2021. The Senior Secured Notes and the related guarantees are secured by (i) a first-priority lien on substantially all of our existing and future assets (other than certain collateral under our ABL facility) and (ii) a second-priority lien on our present and future receivables, inventory and other related assets and proceeds that secure the ABL facility on a first-priority basis.
The Indenture limits certain of our abilities (subject to certain exceptions and qualifications) to incur additional debt and provide additional guarantees; make restricted payments; create or permit certain liens; make certain asset sales; use the proceeds from the sale of assets and subsidiary stock; create or permit restrictions on the ability of our restricted subsidiaries to pay dividends or make other inter-company distributions; engage in certain transactions with affiliates; designate subsidiaries as unrestricted subsidiaries; and consolidate, merge or transfer all or substantially all of our assets and the assets of our restricted subsidiaries.
Debt issuance costs incurred and capitalized are amortized on a straight-line basis over the term of the associated debt agreement. If early principal payments are made on the Senior Secured Notes, a proportional amount of the unamortized debt issuance costs is expensed. As part of the Senior Secured Notes Offering, we capitalized $7.5 million in debt issuance costs that will be amortized over the eight-year term of the agreement.
Convertible Notes
On November 1, 2019, we issued $300.0 million in aggregate principal amount of 1.5% unsecured Convertible Senior Notes due 2025 (“Convertible Notes”). The net proceeds from the issuance of the Convertible Notes, after deducting the initial purchasers'
transaction fees and offering expense payable by us, were approximately $290.2 million. The Convertible Notes bear interest at the annual rate of 1.5%, payable on April 1 and October 1 of each year, beginning on April 1, 2020, and will mature on April 1, 2025, unless earlier converted or repurchased by us.
The Convertible Notes will be convertible into cash, shares of our common stock or a combination thereof, at our election, at an initial conversion rate of 15.6906 shares of common stock per $1,000 principal amount of Convertible Notes, which is equivalent to an initial conversion price of approximately $63.73 per share, as adjusted pursuant to the terms of the indenture governing the Convertible Notes. The Convertible Notes may be converted at any time on or after October 1, 2024, until the close of business on the second scheduled trading day immediately preceding the maturity date.
The conversion rate of the Convertible Notes may be adjusted in certain circumstances, including in connection with a conversion of the Convertible Notes made following certain fundamental changes and under other circumstances set forth in the indenture. It is our current intent to settle all conversions of the Convertible Notes in cash. Our ability to cash settle may be limited depending on the stock price at the time of conversion.
Prior to the close of business on the business day immediately preceding October 1, 2024, the Convertible Notes will be convertible only under the following circumstances:
1.during any calendar quarter commencing after December 31, 2019 if the closing sale price of the common stock is more than 130% of the applicable conversion price on each applicable trading day for at least 20 trading days (whether or not consecutive) during a period of 30 consecutive trading days ending on, and including, the last trading day of the immediately preceding calendar quarter;
2.during the five consecutive business day period after any five consecutive trading day period (the "measurement period") in which the trading price per $1 thousand principal amount of Convertible Notes for each trading day of the measurement period was less than 98% of the product of the last reported sale price of the common stock and the conversion rate for the Convertible Notes on each such trading day; or
3.upon the occurrence of certain specified corporate events set forth in the Convertible Notes Indenture.
We may not redeem the Convertible Notes at our option prior to the maturity date, and no sinking fund is provided for the Convertible Notes.
On October 29, 2019 and October 30, 2019, in connection with the offering of the Convertible Notes, we entered into privately negotiated Convertible Note hedge transactions (collectively, the “Hedge Transactions”) that cover, subject to customary anti-dilution adjustments, the number of shares of our common stock that initially underlie the Convertible Notes, and are expected generally to reduce the potential dilution and/or offset any cash payments we are required to make in excess of the principal amount due, as the case may be, upon conversion of the Convertible Notes in the event that the market price of our common stock is greater than the strike price of the Hedge Transactions, which was initially $63.73 per share (subject to adjustment under the terms of the Hedge Transactions), corresponding to the initial conversion price of the Convertible Notes.
On October 29, 2019 and October 30, 2019, we also entered into privately negotiated warrant transactions (collectively, the “Warrant Transactions” and, together with the Hedge Transactions, the “Call Spread Transactions”), whereby we sold warrants at a higher strike price relating to the same number of shares of our common stock that initially underlie the Convertible Notes, subject to customary anti-dilution adjustments. The initial strike price of the warrants is $96.20 per share (subject to adjustment under the terms of the Warrant Transactions), which is 100% above the last reported sale price of our common stock on October 29, 2019. The Warrant Transactions could have a dilutive effect to our shareholders to the extent that the market price per share of our common stock, as measured under the terms of the Warrant Transactions, exceeds the applicable strike price of the warrants.
We used $28.6 million of the net proceeds from the issuance of the Convertible Notes to pay the cost of the Call Spread Transactions.
The Hedge Transactions and the Warrant Transactions are separate transactions, in each case, and are not part of the terms of the Convertible Notes and will not affect any holder’s rights under the Convertible Notes. Holders of the Convertible Notes will not have any rights with respect to the Call Spread Transactions.
Accounting Treatment of the Convertible Notes and Related Hedge Transactions and Warrant Transactions
The net cost incurred in connection with the Call Spread Transactions was $11.2 million. These transactions are classified as equity and are not remeasured each reporting period. We bifurcated the proceeds from the offering of the Convertible Notes between liability and equity components. On the date of issuance, the liability and equity components were calculated to be approximately $215.0 million and $85.0 million, respectively. The initial $215.0 million liability component was determined based on the fair value of similar debt instruments excluding the conversion feature assuming a hypothetical interest rate of 8.0%. The initial $85.0 million ($64.1 million net of tax) equity component represents the difference between the fair value of the initial $215.0
million in debt and the $300.0 million of gross proceeds. The related initial debt discount of $85.0 million is being amortized over the life of the Convertible Notes as non-cash interest expense using the effective interest method.
In connection with the above-noted transactions, we incurred approximately $9.8 million of offering-related costs. These offering fees were allocated to the liability and equity components in proportion to the allocation of proceeds and accounted for as debt and equity issuance costs, respectively. We allocated $7.0 million of debt issuance costs to the liability component, which were capitalized as deferred financing costs within long-term debt, net on the Consolidated Balance Sheets. These costs are being amortized as interest expense over the term of the debt using the effective interest method. The remaining $2.8 million of transaction costs allocated to the equity component were recorded as a reduction of the equity component.
Long-term debt consists of the following: | | | | | | | | | | | |
| August 27, 2022 | | August 28, 2021 |
| ABL Credit Facility | $ | — | | | $ | — | |
| Senior Secured Notes | 300,000 | | | 300,000 | |
| Convertible Notes | 300,000 | | | 300,000 | |
| Long-term debt, gross | 600,000 | | | 600,000 | |
| Convertible Notes unamortized interest discount | (45,292) | | | (60,366) | |
| Debt issuance cost, net | (8,853) | | | (11,075) | |
| Long-term debt, net | 545,855 | | | 528,559 | |
As of August 27, 2022 and August 28, 2021, the fair value of long-term debt, gross, was $634.2 million and $726.6 million, respectively. We are in compliance with all of our debt covenants as of August 27, 2022.
Aggregate contractual maturities of debt in future fiscal years are as follows: | | | | | |
| Amount |
| Fiscal 2023 | $ | — | |
| Fiscal 2024 | — | |
| Fiscal 2025 | 300,000 | |
| Fiscal 2026 | — | |
| Fiscal 2027 | — | |
| Thereafter | 300,000 | |
| Total Long-term debt, gross | $ | 600,000 | |
Note 10. Leases
Our leases primarily include operating leases for equipment and real estate, including office space and manufacturing space. Financing leases are primarily for real estate and solar energy producing equipment. For any lease with an initial term in excess of 12 months, the related lease assets and liabilities are recognized on the Consolidated Balance Sheets as either operating or finance leases at the inception of an agreement when it is determined that a lease exists. We have lease agreements that contain both lease and non-lease components, and have elected to combine lease and non-lease components for all classes of assets. Leases with an initial term of 12 months or less are not recorded on the Consolidated Balance Sheets. We recognize lease expense for these leases on a straight-line basis over the lease term. When the terms of multiple lease agreements are materially consistent, we have elected the portfolio approach for our asset and liability calculations.
Lease assets represent the right to use an underlying asset for the lease term, and lease liabilities represent the obligation to make lease payments arising from the lease. These assets and liabilities are recognized based on the present value of future payments over the lease term at commencement date. We generally use a collateralized incremental borrowing rate based on the information available at commencement date, including lease term, in determining the present value of future payments. The assumed lease terms generally do not include options to extend or terminate the lease unless it is reasonably certain that the option will be exercised.
Some of our real estate operating leases require payment of real estate taxes, common area maintenance, and insurance. In addition, some of the leases are subject to annual changes in the consumer price index. These components comprise the majority of our variable lease cost and are excluded from the present value of the lease obligations. Fixed payments may contain predetermined fixed rent escalations. For operating leases, we recognize the related rent expense on a straight-line basis from the commencement date to the end of the lease term.
The supplemental balance sheet information related to our leases is as follows:
| | | | | | | | | | | |
| Classification | August 27, 2022 | August 28, 2021 |
| Assets | | | |
| Operating leases | Operating lease assets | $ | 41,131 | | $ | 28,379 | |
| Finance leases | Other long-term assets | 6,672 | | 4,971 | |
| Total lease assets | | $ | 47,803 | | $ | 33,350 | |
| | | |
| Liabilities | | | |
| Current: Operating leases | Other current liabilities | $ | 4,715 | | $ | 2,596 | |
| Current: Finance leases | Other current liabilities | 974 | | 700 | |
| Non-Current: Operating leases | Long-term operating lease liabilities | 40,426 | | 26,745 | |
| Non-Current: Finance leases | Other long-term liabilities | 6,690 | | 5,313 | |
| Total lease liabilities | | $ | 52,805 | | $ | 35,354 | |
| | | |
Operating lease costs incurred are as follows: | | | | | | | | | | | |
| | Year Ended | Year Ended |
| Classification | August 27, 2022 | August 28, 2021 |
Operating lease expense(1) | Costs of goods sold and SG&A | $ | 9,550 | | $ | 5,785 | |
| Finance lease cost: | | | |
| Depreciation of lease assets | Costs of goods sold and SG&A | 825 | | 609 | |
| Interest on lease liabilities | Interest expense, net | 432 | | 327 | |
| Total lease cost | | $ | 10,807 | | $ | 6,721 | |
(1) Operating lease expense includes short-term leases and variable lease payments, which are immaterial.
Our future lease commitments as of August 27, 2022 included the following related party and non-related party leases: | | | | | | | | | | | | | | |
| Operating Leases as of August 27, 2022 | Financing Leases |
| Related Party Amount | Non-Related Party Amount | Total | Non-Related Party Amount |
| Fiscal 2023 | $ | 1,500 | | $ | 5,463 | | $ | 6,963 | | $ | 1,392 | |
| Fiscal 2024 | 1,800 | | 5,352 | | 7,152 | | 1,382 | |
| Fiscal 2025 | 1,800 | | 5,065 | | 6,865 | | 1,404 | |
| Fiscal 2026 | 1,800 | | 4,930 | | 6,730 | | 1,426 | |
| Fiscal 2027 | 1,800 | | 4,952 | | 6,752 | | 1,448 | |
| Thereafter | 4,200 | | 18,031 | | 22,231 | | 2,153 | |
| Total future undiscounted lease payments | 12,900 | | 43,793 | | 56,693 | | 9,205 | |
| Less: Interest | 2,568 | | 8,984 | | 11,552 | | 1,541 | |
| Total reported lease liabilities | $ | 10,332 | | $ | 34,809 | | $ | 45,141 | | $ | 7,664 | |
Additional information related to our leases is as follows:
| | | | | | | | |
| August 27, 2022 | August 28, 2021 |
| Cash paid for amounts included in the measurement of lease liabilities | | |
| Operating cash flows from operating leases | $ | 3,666 | | $ | 2,589 | |
| Operating cash flows from financing leases | 432 | | 327 | |
| Financing cash flows from financing leases | 877 | | 572 | |
| Weighted average remaining lease term: | | |
| Operating leases | 8.1 | 8.1 |
| Finance leases | 6.0 | 6.8 |
| Weighted average discount rate: | | |
| Operating leases | 5.8 | % | 6.2 | % |
| Finance leases | 5.9 | % | 6.3 | % |
Note 11. Employee and Retiree Benefits
Deferred compensation benefits are as follows: | | | | | | | | | | | |
| August 27, 2022 | | August 28, 2021 |
| Non-qualified deferred compensation | $ | 7,937 | | | $ | 9,731 | |
| Supplemental executive retirement plan | 1,371 | | | 1,615 | |
| Executive deferred compensation plan | 1,414 | | | 1,029 | |
| Total deferred compensation benefits | 10,722 | | | 12,375 | |
Less current portion(1) | 2,577 | | | 2,825 | |
| Deferred compensation benefits, net of current portion | $ | 8,145 | | | $ | 9,550 | |
(1) Included in accrued compensation on the Consolidated Balance Sheets.
Deferred Compensation Benefits
Non-Qualified Deferred Compensation
We have a non-qualified deferred compensation program which permitted key employees to annually elect to defer a portion of their compensation until their retirement. The plan has been closed to any additional deferrals since January 2001. The retirement benefit to be provided is based upon the amount of compensation deferred and the age of the individual at the time of the contracted deferral. An individual generally vests at age 55 and 5 years of participation under the plan. For deferrals prior to December 1992, vesting occurs at the later of age 55 and 5 years of service from first deferral or 20 years of service. Deferred compensation expense was $0.6 million, $0.8 million, and $0.9 million in Fiscal 2022, 2021, and 2020, respectively.
Supplemental Executive Retirement Plan ("SERP")
The primary purpose of this plan was to provide our officers and managers with supplemental retirement income for a period of 15 years after retirement. We have not offered this plan on a continuing basis to members of management since 1998. The plan was funded with individual whole life insurance policies (split dollar program) owned by the named insured officer or manager. We initially paid the life insurance premiums on the life of the individual, and the individual would receive life insurance and supplemental cash payments during the 15 years following retirement. In October 2008, the plan was amended as a result of changes in the tax and accounting regulations and rising administrative costs. Under the redesigned SERP, the underlying life insurance policies previously owned by the insured individual became company-owned life insurance ("COLI") by a release of all interests by the participant and assignment to Winnebago Industries as a prerequisite to participate in the SERP and transition from the Split Dollar Program. This program remains closed to new employee participation.
To assist in funding the deferred compensation and SERP liabilities, we have invested in COLI policies. The cash surrender value of these policies is presented in investment in life insurance in the Consolidated Balance Sheets and consists of the following: | | | | | | | | | | | |
| August 27, 2022 | | August 28, 2021 |
| Cash value | $ | 67,201 | | | $ | 66,544 | |
| Borrowings | (38,577) | | | (37,723) | |
| Investment in life insurance | $ | 28,624 | | | $ | 28,821 | |
Executive Deferred Compensation Plan
In December 2006, we adopted the Winnebago Industries, Inc. Executive Deferred Compensation Plan (the "Executive Deferred Compensation Plan"). Under the Executive Deferred Compensation Plan, corporate officers and certain key employees may annually choose to defer up to 50% of their salary and up to 100% of their cash incentive awards. The assets are presented as other long-term assets in the Consolidated Balance Sheets. Such assets on August 27, 2022 and August 28, 2021 were $1.4 million and $1.0 million, respectively.
Profit Sharing Plan
We have a qualified profit sharing and contributory 401(k) plan for eligible employees. The plan provides matching contributions made by Winnebago Industries and discretionary contributions as approved by the Board of Directors. Matching contributions to the plan for Fiscal 2022, 2021, and 2020 were $12.0 million, $5.6 million, and $3.4 million, respectively. Discretionary contributions of $12.1 million and $6.1 million were approved in Fiscal 2022 and 2021. No discretionary contributions were approved for Fiscal 2020.
Note 12. Contingent Liabilities and Commitments
Repurchase Commitments
Generally, manufacturers in the same industries as us enter into repurchase agreements with lending institutions which have provided wholesale floorplan financing to dealers. Most dealers are financed on a "floorplan" basis under which a bank or finance company lends the dealer all, or substantially all, of the purchase price, collateralized by a security interest in the units purchased.
Our repurchase agreements generally provide that, in the event of default by the dealer on the agreement to pay the lending institution, we will repurchase the financed merchandise. The terms of these agreements, which generally can last up to 24 months, provide that our liability will be the lesser of remaining principal owed by the dealer to the lending institution, or dealer invoice less periodic reductions based on the time since the date of the original invoice. Our liability cannot exceed 100% of the dealer invoice. In certain instances, we also repurchase inventory from dealers due to state law or regulatory requirements that govern voluntary or involuntary relationship terminations. Although laws vary from state to state, some states have laws in place that require manufacturers of recreational vehicles or boats to repurchase current inventory if a dealership exits the business. The total contingent liability on all repurchase agreements was approximately $1,783.7 million and $552.1 million as of August 27, 2022 and August 28, 2021, respectively.
Our loss reserve for repurchase commitments contains uncertainties because the calculation requires management to make assumptions and apply judgment regarding a number of factors. Our risk of loss related to these repurchase commitments is significantly reduced by the potential resale value of any products that are subject to repurchase and is spread over numerous dealers and lenders. The aggregate contingent liability related to our repurchase agreements represents all financed dealer inventory at the period-end reporting date subject to a repurchase agreement, net of the greater of periodic reductions per the agreement or dealer principal payments. Based on these repurchase agreements and our historical loss experience, an associated loss reserve is established which is included in other current liabilities on the Consolidated Balance Sheets. Our repurchase accrual was $1.4 million and $0.9 million as of August 27, 2022 and August 28, 2021, respectively. Repurchase risk is affected by the credit worthiness of our dealer network. We do not believe there is a reasonable likelihood that there will be a material change in the estimates or assumptions used to establish the loss reserve for repurchase commitments.
A summary of the activity for repurchased units is as follows: | | | | | | | | | | | | | | | | | |
| (in thousands, except for units) | 2022 | | 2021 | | 2020 |
| Inventory repurchased: | | | | | |
| Units | 4 | | | 10 | | | 107 | |
| Dollars | $ | 99 | | | $ | 349 | | | $ | 2,592 | |
| Inventory resold: | | | | | |
| Units | 9 | | | 10 | | | 118 | |
| Cash collected | $ | 217 | | | $ | 321 | | | $ | 2,540 | |
| Loss recognized | $ | 27 | | | $ | 29 | | | $ | 252 | |
| Units in ending inventory | — | | | 5 | | | 5 | |
Litigation
We are involved in various legal proceedings which are considered ordinary and routine litigation incidental to the business, some of which are covered in whole or in part by insurance. While we believe the ultimate disposition of litigation will not have a material adverse effect on our financial position, results of operations or liquidity, the possibility exists that such litigation may have an impact on our results for a particular reporting period in which litigation effects become probable and reasonably estimable. Though we do not believe there is a reasonable likelihood that there will be a material change related to these matters, litigation is subject to inherent uncertainties and our view of these matters may change in the future.
Note 13. Revenue Recognition
All operating revenue is generated from contracts with customers. Our primary revenue source is generated through the sale of manufactured non-motorized towable units, motorhome units and marine units to our independent dealer network (our customers). The following table disaggregates revenue by reportable segment and product category: | | | | | | | | | | | | | | | | | | | |
| 2022 | | 2021 | | 2020 | | |
| Net Revenues | | | | | | | |
| Towable: | | | | | | | |
| Fifth Wheel | $ | 1,260,871 | | | $ | 1,024,355 | | | $ | 690,452 | | | |
| Travel Trailer | 1,296,591 | | | 959,716 | | | 519,282 | | | |
Other(1) | 39,896 | | | 25,888 | | | 17,833 | | | |
| Total Towable | 2,597,358 | | | 2,009,959 | | | 1,227,567 | | | |
| Motorhome: | | | | | | | |
| Class A | 786,740 | | | 690,146 | | | 479,120 | | | |
| Class B | 718,039 | | | 532,200 | | | 332,961 | | | |
Class C and Other(1) | 406,417 | | | 316,738 | | | 244,713 | | | |
| Total Motorhome | 1,911,196 | | | 1,539,084 | | | 1,056,794 | | | |
| Marine: | 425,269 | | | 60,209 | | | 51,812 | | | |
Corporate / All Other(2): | 23,907 | | | 20,595 | | | 19,360 | | | |
| Consolidated | $ | 4,957,730 | | | $ | 3,629,847 | | | $ | 2,355,533 | | | |
(1) Relates to parts, accessories, and services.
(2) Relates to specialty vehicle units, parts, accessories, and services.
We do not have material contract assets or liabilities.
Concentration of Risk
No single dealer organization accounted for more than 10% of net revenues for Fiscal 2022, 2021, and 2020.
Note 14. Stock-Based Compensation Plans
On December 11, 2018, our shareholders approved the Winnebago Industries, Inc. 2019 Omnibus Incentive Plan ("2019 Plan") as detailed in our Proxy Statement for the 2018 Annual Meeting of Shareholders. The 2019 Plan allows us to grant or issue non-qualified stock options, incentive stock options, restricted share units, and other equity compensation to key employees and to non-employee directors. The 2019 Plan replaces the 2014 Omnibus Equity, Performance Award, and Incentive Compensation Plan (as amended, the "2014 Plan"). The number of shares of our common stock that may be awarded and issued under the 2019 Plan is
4.1 million shares, plus the shares subject to any awards outstanding under the 2014 Plan and our predecessor plan, the 2004 Incentive Compensation Plan (the “2004 Plan”), on December 11, 2018 that subsequently expire, are forfeited or canceled, or are settled for cash. Until such time, awards under the 2014 Plan and the 2004 Plan, respectively, that were outstanding on December 11, 2018 will continue to be subject to the terms of the 2014 Plan or 2004 Plan, as applicable. Shares remaining available for future awards under the 2014 Plan were not carried over into the 2019 Plan.
Our outstanding options have a 10-year term. Options issued to employees generally vest over a three-year period in equal annual installments on the annual anniversary dates following the grant date. Share awards generally vest based either upon continued employment ("time-based") or upon attainment of specified goals. Outstanding share awards that are not time-based vest at the end of a three-year incentive period based upon the achievement of company performance goals ("performance-based"). Generally, time-based share awards vest in the same manner as options, except for time-based share awards to directors which vest one year from the grant date.
Beginning with our annual grant of restricted stock units in October 2018, dividend equivalents are attached to restricted stock units equal to dividends payable on the same number of shares of our common stock during the applicable period. Dividend equivalents, settled in cash, accrue on restricted stock unit awards during the vesting period. No dividend equivalents are paid on any restricted stock units that are forfeited prior to the vesting date.
Our Employee Stock Purchase Plan ("ESPP") permits employees to purchase Winnebago Industries, Inc. common stock at a 15% discount from the market price at the end of semi-annual purchase periods and is compensatory. In Fiscal 2022 and 2021, 42,000 shares and 24,000 shares, respectively, were purchased through the ESPP. Plan participants had accumulated $0.4 million for each period ended August 27, 2022 and August 28, 2021 to purchase our common stock pursuant to this plan.
Compensation expense associated with share-based awards is recognized on a straight-line basis over the required service period and forfeitures are recorded when they occur. Total stock-based compensation expense for the past three fiscal years consisted of the following components: | | | | | | | | | | | | | | | | | |
| 2022 | | 2021 | | 2020 |
| Share awards: | | | | | |
| Time-based | $ | 7,540 | | | $ | 5,737 | | | $ | 4,287 | |
| Performance-based | 7,412 | | | 7,920 | | | 796 | |
| Stock options | 1,000 | | | 1,019 | | | 990 | |
Other(1) | 1,133 | | | 671 | | | 402 | |
| Total stock-based compensation expense | $ | 17,085 | | | $ | 15,347 | | | $ | 6,475 | |
(1) Includes stock-based compensation expense related to Board of Directors stock award expense and ESPP expense. Directors may elect to defer all or part of their annual retainer into a deferred compensation plan. The plan allows them to defer into either money units or stock units.
Restricted Stock Units - Time-Based
The fair value of time-based restricted stock units is determined based on the closing market price of our stock on the date of grant. A summary of the status of nonvested time-based restricted stock units at August 27, 2022, and changes during Fiscal 2022, is as follows: | | | | | | | | | | | |
| Shares(1) | | Weighted Average Fair Value |
| Outstanding at August 28, 2021 | 330,819 | | | $ | 44.35 | |
| Granted | 147,236 | | | $ | 73.64 | |
| Vested | (111,832) | | | $ | 45.53 | |
| Forfeited/canceled | (37,385) | | | $ | 55.05 | |
| Outstanding at August 27, 2022 | 328,838 | | | $ | 55.85 | |
(1) Number of shares in the above table are shown in whole numbers.
As of August 27, 2022, there was $8.4 million of unrecognized compensation expense related to nonvested time-based restricted stock units that are expected to be recognized over a weighted average period of 0.8 years. The total fair value of restricted stock units vested during Fiscal 2022, 2021, and 2020 was $8.0 million, $5.2 million, and $3.3 million, respectively.
Restricted Stock Units - Performance-Based
The fair value of performance-based restricted stock units is determined based on the closing market price of our stock on the date of grant. A summary of the status of our nonvested performance-based restricted stock units at August 27, 2022, and changes during Fiscal 2022, is as follows: | | | | | | | | | | | |
| Shares(1) | | Weighted Average Fair Value |
| Outstanding at August 28, 2021 | 227,751 | | | $ | 45.81 | |
| Granted | 88,557 | | | $ | 68.59 | |
| Vested | (76,413) | | | $ | 40.46 | |
| Forfeited/canceled | (41,689) | | | $ | 43.93 | |
| Outstanding at August 27, 2022 | 198,206 | | | $ | 58.45 | |
(1) Number of shares in the above table are shown in whole numbers.
As of August 27, 2022, there was $3.9 million of unrecognized compensation expense related to nonvested performance-based restricted stock units that are expected to be recognized over a weighted average period of 0.9 years. The total fair value of performance-based restricted stock units vested during Fiscal 2022, Fiscal 2021, and Fiscal 2020 was $5.8 million, $1.4 million, and $2.4 million respectively.
Stock Options
A summary of stock option activity for Fiscal 2022 is as follows: | | | | | | | | | | | | | | | | | | | | | | | |
| Stock Options(1) | | Weighted Average Exercise Price Per Share | | Weighted Average Remaining Contractual Term (in years) | | Aggregate Intrinsic Value |
| Outstanding at August 28, 2021 | 317,903 | | | $ | 40.41 | | | | | |
| Granted | 44,040 | | | $ | 75.59 | | | | | |
| Exercised | (30,113) | | | $ | 36.24 | | | | | |
| Forfeited/canceled | (9,723) | | | $ | 60.27 | | | | | |
| Outstanding at August 27, 2022 | 322,107 | | | $ | 44.75 | | | 6.5 | | $ | 5,886 | |
| Vested and expected to vest at August 27, 2022 | 322,107 | | | $ | 44.75 | | | 6.5 | | $ | 5,886 | |
| Exercisable at August 27, 2022 | 232,549 | | | $ | 37.77 | | | 5.8 | | $ | 5,454 | |
(1) Number of shares in the above table are shown in whole numbers.
As of August 27, 2022, there was $1.3 million of unrecognized compensation expense related to stock options that is expected to be recognized over a weighted average period of 0.8 years.
The fair value of each stock option is estimated on the date of grant using the Black-Scholes option-pricing model with the following assumptions:
| | | | | | | | | | | | | | | | | |
Valuation Assumptions(1) | 2022 | | 2021 | | 2020 |
| Expected dividend yield | 1.0 | % | | 0.8 | % | | 0.9 | % |
Risk-free interest rate(2) | 1.1 | % | | 0.3 | % | | 1.7 | % |
Expected life of stock options (in years)(3) | 5 | | 5 | | 5 |
Expected stock price volatility(4) | 48.5 | % | | 48.6 | % | | 41.2 | % |
| Weighted average fair value of options granted | $ | 30.47 | | | $ | 21.65 | | | $ | 17.18 | |
(1) Forfeitures are recorded when they occur.
(2) Based on U.S. Treasury constant maturity interest rate whose term is consistent with the expected life of the stock options.
(3) Estimated based on historical experience.
(4) Based on historical experience over a term consistent with the expected life of the stock options.
Note 15. Restructuring
In Fiscal 2020, our Class A diesel production included in the Motorhome reportable segment, was moved from Junction City, OR to Forest City, IA. In Fiscal 2021, the property was sold for net proceeds of $12.4 million with a resulting gain of $4.8 million. The gain on sale is included within selling, general, and administrative expenses on the Consolidated Statements of Income and Comprehensive Income for Fiscal 2021. Total restructuring expense related to the relocation for Fiscal 2021 was immaterial to the consolidated financial statements. There were no restructuring charges in Fiscal 2022.
Note 16. Income Taxes
Income tax expense consisted of the following: | | | | | | | | | | | | | | | | | |
| 2022 | | 2021 | | 2020 |
| Current | | | | | |
| Federal | $ | 105,863 | | | $ | 71,579 | | | $ | 14,318 | |
| State | 24,868 | | | 16,179 | | | 2,806 | |
| Total | 130,731 | | | 87,758 | | | 17,124 | |
| Deferred | | | | | |
| Federal | (5,553) | | | 737 | | | (790) | |
| State | (1,092) | | | (2,916) | | | (500) | |
| Total | (6,645) | | | (2,179) | | | (1,290) | |
| Provision for income taxes | $ | 124,086 | | | $ | 85,579 | | | $ | 15,834 | |
A reconciliation of the U.S. statutory income tax rate to our effective income tax rate is as follows: | | | | | | | | | | | | | | | | | |
| 2022 | | 2021 | | 2020 |
| U.S. federal statutory rate | 21.0 | % | | 21.0 | % | | 21.0 | % |
| State taxes, net of federal benefit | 3.5 | % | | 3.3 | % | | 1.9 | % |
| Income tax credits | (0.5) | % | | (0.6) | % | | (2.5) | % |
| Nondeductible compensation | 0.9 | % | | 0.5 | % | | 0.9 | % |
| Tax-free and dividend income | (0.1) | % | | (0.1) | % | | (0.6) | % |
| Uncertain tax position settlements and adjustments | (0.1) | % | | (0.1) | % | | 0.1 | % |
| Other items | (0.6) | % | | (0.7) | % | | (0.3) | % |
| Effective tax provision rate | 24.1 | % | | 23.3 | % | | 20.5 | % |
Our effective tax rate increased to 24.1% in Fiscal 2022 compared to 23.3% in Fiscal 2021 primarily due to consistent tax credits year-over-year over increased income in the current year and a net unfavorable expense in the current year related to nondeductible compensation.
On August 16, 2022, the Inflation Reduction Act (“IRA”) was signed into law in the United States. Among other provisions, the IRA includes a 15% corporate minimum tax rate applied to certain large corporations and a 1% excise tax on corporate stock repurchases made after December 31, 2022. We do not expect the IRA to have a material impact on our consolidated financial statements.
The tax effects of temporary differences that give rise to deferred income taxes were as follows: | | | | | | | | | | | |
| August 27, 2022 | | August 28, 2021 |
| Warranty reserves | $ | 30,690 | | | $ | 22,450 | |
| Deferred compensation | 2,978 | | | 5,224 | |
| Self-insurance reserve | 4,884 | | | 4,336 | |
| Stock-based compensation | 5,534 | | | 4,607 | |
| Leases | 12,868 | | | 8,422 | |
Other(1) | 9,108 | | | 7,170 | |
| Total deferred tax assets | 66,062 | | | 52,209 | |
| Convertible notes | 1,993 | | | 2,608 | |
| Intangibles | 39,493 | | | 39,940 | |
| Depreciation | 19,036 | | | 15,161 | |
| Leases | 11,648 | | | 7,929 | |
| Total deferred tax liabilities | 72,170 | | | 65,638 | |
| Total deferred income tax liabilities, net | $ | 6,108 | | | $ | 13,429 | |
(1) Other includes $113 and $400 related to state net operating losses as of August 27, 2022 and August 28, 2021, respectively. These net operating losses are subject to various expiration periods from 5 years to no expiration. We have evaluated all the positive and negative evidence and consider it more likely than not that these carryforwards can be realized before expiration.
Changes in the unrecognized tax benefits are as follows:
| | | | | | | | | | | | | | | | | |
| 2022 | | 2021 | | 2020 |
| Balance at beginning of year | $ | 5,537 | | | $ | 5,830 | | | $ | 2,822 | |
| Gross increases-tax positions in a prior year | — | | | — | | | 2,486 | |
| Gross decreases-tax positions in a prior year | (1,156) | | | (872) | | | — | |
| Gross increases-current year tax positions | 610 | | | 579 | | | 522 | |
| Balance at end of year | 4,991 | | | 5,537 | | | 5,830 | |
| Accrued interest and penalties | 753 | | | 946 | | | 681 | |
| Total unrecognized tax benefits | $ | 5,744 | | | $ | 6,483 | | | $ | 6,511 | |
The amount of unrecognized tax benefits is not expected to change materially within the next 12 months. If the remaining uncertain tax positions are ultimately resolved favorably, $5.3 million of unrecognized tax benefits would have a favorable impact on our effective tax rate. It is our policy to recognize interest and penalties accrued relative to unrecognized tax benefits in income tax expense.
We file a U.S. Federal tax return, as well as returns in various international and state jurisdictions. Although certain years are no longer subject to examination by the Internal Revenue Service ("IRS") and various state taxing authorities, net operating loss carryforwards generated in those years may still be adjusted upon examination by the IRS or state taxing authorities. As of August 27, 2022, our federal returns from Fiscal 2019 to present are subject to review by the IRS. With limited exception, state returns from Fiscal 2018 to present continue to be subject to review by state taxing jurisdictions. Several years may lapse before an uncertain tax position is audited and finally resolved and it is difficult to predict the outcome of such audits. We believe we have adequately reserved for our exposure to potential additional payments for uncertain tax positions in our liability for unrecognized tax benefits.
Note 17. Earnings per Share
Basic and diluted earnings per share are calculated as follows: | | | | | | | | | | | | | | | | | |
| (in thousands, except per share data) | 2022 | | 2021 | | 2020 |
| Net income | $ | 390,636 | | | $ | 281,871 | | | $ | 61,442 | |
| | | | | |
| Weighted average common shares outstanding | 32,475 | | | 33,528 | | | 33,236 | |
| Dilutive impact of stock compensation awards | 510 | | | 375 | | | 218 | |
| Dilutive impact of convertible notes | — | | | 153 | | | — | |
| Weighted average common shares outstanding, assuming dilution | 32,985 | | | 34,056 | | | 33,454 | |
| | | | | |
| Anti-dilutive securities excluded from weighted average diluted common shares outstanding | 159 | | | 49 | | | 39 | |
| | | | | |
| Basic earnings per common share | $ | 12.03 | | | $ | 8.41 | | | $ | 1.85 | |
| Diluted earnings per common share | $ | 11.84 | | | $ | 8.28 | | | $ | 1.84 | |
Under the treasury stock method, shares associated with certain anti-dilutive securities have been excluded from the diluted weighted average shares outstanding calculation because the exercise of those options would lead to a net reduction in common shares outstanding or anti-dilution.
Note 18. Accumulated Other Comprehensive Loss
Changes in Accumulated Other Comprehensive Income ("AOCI") by component, net of tax, were: | | | | | | | | | | | |
| Defined Benefit Pension Items |
| 2022 | | 2021 |
| Balance at beginning of year | $ | (491) | | | $ | (526) | |
| OCI before reclassifications | — | | | — | |
| Amounts reclassified from AOCI | 37 | | | 35 | |
| Net current-year OCI | 37 | | | 35 | |
| Balance at end of year | $ | (454) | | | $ | (491) | |
Reclassifications out of AOCI, net of tax, were: | | | | | | | | | | | | | | | | | | | | |
| Location on Consolidated Statements of Income and Comprehensive Income | 2022 | | 2021 | | 2020 |
| Amortization of net actuarial loss | SG&A | $ | 37 | | | $ | 35 | | | $ | 33 | |
| Interest rate contract | Interest expense | — | | | — | | | 432 | |
| Total reclassifications | | $ | 37 | | | $ | 35 | | | $ | 465 | |
Item 9. Changes in and Disagreements with Accountants on Accounting and Financial Disclosure.
None.
Item 9A. Controls and Procedures.
Evaluation of Disclosure Controls and Procedures
Our management, under the supervision and with the participation of our Chief Executive Officer and Chief Financial Officer, evaluated the effectiveness of the design and operation of our disclosure controls and procedures (as defined in Rule 13a-15(e) under the Securities Exchange Act of 1934, as amended (the "Exchange Act")), as of the end of the period covered by this report (the "Evaluation Date"). Based on this evaluation, the Chief Executive Officer and Chief Financial Officer concluded that our disclosure controls and procedures were effective as of the Evaluation Date.
Evaluation of Internal Control Over Financial Reporting
Management's report on internal control over financial reporting as of August 27, 2022 is included within Item 8 of Part II in this Annual Report on Form 10-K and is incorporated herein by reference. The report of Deloitte & Touche LLP on the effectiveness of internal control over financial reporting is included within Item 8 of Part II in this Annual Report on Form 10-K and is incorporated herein by reference.
Changes in Internal Control Over Financial Reporting
There were no significant changes in internal control over financial reporting during the quarter ended August 27, 2022 that have materially affected, or are reasonably likely to materially affect, our internal control over financial reporting.
Item 9B. Other Information.
None.
Item 9C. Disclosure Regarding Foreign Jurisdictions that Prevent Inspections.
None.
PART III
Item 10. Directors, Executive Officers, and Corporate Governance.
Reference is made to the table entitled "Information about our Executive Officers" in Part I of this report and to the information included under the captions Corporate Governance and Election of Directors, in our Proxy Statement for the Annual Meeting of Shareholders scheduled to be held December 13, 2022, which information is incorporated by reference herein.
We have adopted a written code of ethics, the "Code of Conduct" (the "Code"), which is applicable to each of our employees, including our Chief Executive Officer and Chief Financial Officer (such two officers, collectively, the "Senior Officers"). In accordance with the rules and regulations of the SEC, a copy of the Code is posted on our website at www.winnebagoind.com in the "Company" section under "Investor Relations - Corporate Governance."
We intend to disclose any changes in or waivers from the Code applicable to any Senior Officer on our website at www.winnebagoind.com or by filing a Form 8-K.
Item 11. Executive Compensation.
Reference is made to the information included under the captions Director Compensation and Executive Compensation in our Proxy Statement for the Annual Meeting of Shareholders scheduled to be held December 13, 2022, which information is incorporated by reference herein.
Item 12. Security Ownership of Certain Beneficial Owners and Management and Related Shareholder Matters.
Reference is made to the share ownership information and table entitled Security Ownership of Certain Beneficial Owners and Management and the information included under the caption Equity Compensation Plan Information included in our Proxy Statement for the Annual Meeting of Shareholders scheduled to be held December 13, 2022, which information is incorporated by reference herein.
Item 13. Certain Relationships and Related Transactions, and Director Independence.
Reference is made to the information included under the caption Corporate Governance in our Proxy Statement for the Annual Meeting of Shareholders scheduled to be held December 13, 2022, which information is incorporated by reference herein.
Item 14. Principal Accounting Fees and Services.
Information about fees and services billed to us by our principal accountant, Deloitte & Touche LLP (PCAOB ID No. 34) is included under the caption Independent Registered Public Accountant's Fees and Services in our Proxy Statement for the Annual Meeting of Shareholders scheduled to be held December 13, 2022, and that information is incorporated by reference herein.
PART IV
Item 15. Exhibits and Financial Statement Schedules.
1.The consolidated financial statements are set forth within Item 8 of Part II in this Annual Report on Form 10-K.
2.Financial Statement Schedules: Winnebago Industries, Inc. and Subsidiaries
All schedules are omitted because of the absence of the conditions under which they are required or because the information required is shown in the consolidated financial statements or the notes thereto.
3.Exhibit Index | | | | | | | | | | | | | | | | | | | | | | | | | | | | | |
| Exhibit No. | | | Incorporated by Reference | | Filed Herewith |
| Exhibit Description | | Form | | Exhibit | | Filing Date | |
| 2a. | Stock Purchase Agreement dated as of September 15, 2019, by and among Winnebago Industries, Inc., Octavius Corporation, Newmar Corporation, Dutch Real Estate Corp., New-Way Transport Corp., New-Serv, Inc., the shareholders of Newmar Corporation, Dutch Real Estate Corp., New-Way Transport Corp. and New-Serv, Inc. and Matthew Miller, as Sellers Agent. | | 8-K | | 2.1 | | 09/16/2019 | | |
| 2b. | Equity Purchase Agreement dated July 19, 2021, by and among Winnebago Industries, Inc., Falcon Family, Inc., Ronald J. Fenech, William C. Fenech, Donald Clark, and Donald Clark Family, LLC, and William C. Fenech in his capacity as Representative. | | 8-K | | 10.1 | | 7/20/2021 | | |
| 3a. | | | 8-K | | 3.1 | | 01/05/2022 | | |
| 3b. | | | 8-K | | 3.2 | | 01/05/2022 | | |
| 4a. | | | | | | | | | X |
| 4b. | | | 8-K | | 4.1 | | 11/04/2019 | | |
| 4c. | | | 8-K | | 4.2 | | 11/04/2019 | | |
| 4d. | | | 8-K | | 4.1 | | 07/09/2020 | | |
| 4e. | | | 8-K | | 4.2 | | 07/09/2020 | | |
| 10a. | | | 10-K | | 10.B | | 11/22/1995 | | |
| 10b. | | | 10-Q | | 10.I | | 04/09/2001 | | |
| 10c. | | | 10-K | | 10.BB | | 10/25/2011 | | |
| 10d. | | | 10-Q | | 10.1 | | 07/01/2011 | | |
| | | | | | | | | | | | | | | | | | | | | | | | | | | | | |
| Exhibit No. | | | Incorporated by Reference | | Filed Herewith |
| Exhibit Description | | Form | | Exhibit | | Filing Date | |
| 10e. | | | 8-K | | 10.1 | | 12/06/2013 | | |
| 10f. | | | DEF 14A | | A | | 10/31/2018 | | |
| 10g. | | | 10-Q | | 10.1 | | 06/28/2013 | | |
| 10h. | | | 10-K | | 10.C | | 11/22/1995 | | |
| 10i. | | | 10-Q | | 10.b | | 12/20/2018 | | |
| 10j. | | | | | | | | | X |
| 10k. | | | | | | | | | X |
| 10l. | | | 10-Q | | 10.c | | 12/20/2018 | | |
| 10m. | | | | | | | | | X |
| 10n. | | | | | | | | | X |
| 10o. | | | 10-Q | | 10.d | | 12/20/2018 | | |
| 10p. | | | 10-Q | | 10.e | | 12/20/2018 | | |
| 10q. | | | | | | | | | X |
| | | | | | | | | | | | | | | | | | | | | | | | | | | | | |
| Exhibit No. | | | Incorporated by Reference | | Filed Herewith |
| Exhibit Description | | Form | | Exhibit | | Filing Date | |
| 10r. | | | | | | | | | X |
| 10s. | | | 10-Q | | 10.f | | 12/20/2018 | | |
| 10t. | | | 10-K | | 10.Z | | 10/27/2009 | | |
| 10u. | | | 10-K | | 10q | | 10/21/2020 | | |
| 10v. | | | 10-K | | 10r | | 10/21/2020 | | |
| 10w. | | | 10-K | | 10s | | 10/21/2020 | | |
| 10x. | | | 10-K | | 10t | | 10/20/2021 | | |
| 10y. | | | | | | | | | X |
| 10z. | | | 8-K | | 10.1 | | 10/05/2016 | | |
| 10aa. | Non-Solicitation and Confidentiality Agreement by and among Octavius Corporation, Winnebago Industries, Inc., Grand Design, RV, LLC, Summit Partners Growth Equity Fund VIII-B, L.P., Summit Partners Growth Equity Fund VIII-A, L.P., Summit Partners Entrepreneur Advisors Fund I, L.P., Summit Investors I, LLC, Summit Investors I (UK), L.P., and SP GE VIII-B GD RV Holdings, L.P. | | 8-K | | 10.2 | | 10/05/2016 | | |
| 10ab. | Registration Rights Agreement by and among Winnebago Industries, Inc., Summit Partners Growth Equity Fund VIII-A, L.P., Summit Partners Growth Equity Fund VIII-B, L.P., Summit Partners Entrepreneur Advisors Fund I, L.P., Summit Investors I, LLC, Summit Investors I (UK), L.P. and SP GE VIII-B GD RV Holdings, L.P., Donald Clark, Ronald Fenech, and William Fenech. | | 8-K | | 10.3 | | 10/05/2016 | | |
| 10ac. | | | 8-K | | 10.1 | | 06/24/2019 | | |
| 10ad. | | | 8-K | | 10.2 | | 06/24/2019 | | |
| 10ae. | | | 8-K | | 10.1 | | 09/16/2019 | | |
| 10af. | | | 8-K | | 10.1 | | 10/23/2019 | | |
| 10ag. | | | 8-K | | 10.1 | | 11/04/2019 | | |
| 10ah. | | | 8-K | | 10.2 | | 11/04/2019 | | |
| 10ai. | | | 8-K | | 10.3 | | 11/04/2019 | | |
| | | | | | | | | | | | | | | | | | | | | | | | | | | | | |
| Exhibit No. | | | Incorporated by Reference | | Filed Herewith |
| Exhibit Description | | Form | | Exhibit | | Filing Date | |
| 10aj. | | | 8-K | | 10.4 | | 11/04/2019 | | |
| 10ak. | | | 8-K | | 10.5 | | 11/04/2019 | | |
| 10al. | | | 8-K | | 10.6 | | 11/04/2019 | | |
| 10am. | | | 8-K | | 10.7 | | 11/04/2019 | | |
| 10an. | | | 8-K | | 10.8 | | 11/04/2019 | | |
| 10ao. | | | 8-K | | 10.9 | | 11/04/2019 | | |
| 10ap. | | | 10-Q | | 10.2 | | 12/20/2019 | | |
| 10aq. | | | 10-Q | | 10.14 | | 12/20/2019 | | |
| 10ar. | | | 10-Q | | 10.15 | | 12/20/2019 | | |
| 10as. | Amendment No. 2 to Amended and Restated Credit Agreement, dated as of July 8, 2020, among Winnebago Industries, Inc., Winnebago of Indiana, LLC, Grand Design RV, LLC, Newmar Corporation, the other loan parties thereto from time to time, the lenders party thereto from time to time and JPMorgan Chase Bank, N.A., as administrative agent | | 8-K | | 10.1 | | 7/9/2020 | | |
| 10at. | | | 8-K | | 10.2 | | 7/9/2020 | | |
| 10au. | | | 8-K | | 10.1 | | 12/17/2021 | | |
| 10av. | | | 8-K | | 10.2 | | 12/17/2021 | | |
| 10aw. | | | 8-K | | 10.1 | | 7/19/2022 | | |
| 21 | | | | | | | | | X |
| 23 | | | | | | | | | X |
| 31.1 | | | | | | | | | X |
| 31.2 | | | | | | | | | X |
| 32.1 | | | | | | | | | X |
| 32.2 | | | | | | | | | X |
| | | | | | | | | | | | | | | | | | | | | | | | | | | | | |
| Exhibit No. | | | Incorporated by Reference | | Filed Herewith |
| Exhibit Description | | Form | | Exhibit | | Filing Date | |
| 101.INS | XBRL Instance Document - the instance document does not appear in the Interactive Data File because its XBRL tags are embedded within the Inline XBRL document (furnished herewith). | | | | | | | | |
| 101.SCH | Inline XBRL Taxonomy Extension Schema Document | | | | | | | | |
| 101.CAL | Inline XBRL Taxonomy Extension Calculation Linkbase Document | | | | | | | | |
| 101.DEF | Inline XBRL Taxonomy Extension Definitions Linkbase Document | | | | | | | | |
| 101.LAB | Inline XBRL Taxonomy Extension Label Linkbase Document | | | | | | | | |
| 101.PRE | Inline XBRL Taxonomy Extension Presentation Linkbase Document | | | | | | | | |
| 104 | The cover page from the Winnebago Industries, Inc. Annual Report on Form 10-K for the fiscal year ended August 27, 2022, formatted in Inline XBRL (included as Exhibit 101). | | | | | | | | |
* Management contract or compensation plan or arrangement.
Item 16. Form 10-K Summary.
None.
SIGNATURES
Pursuant to the requirements of Section 13 or 15(d) of the Securities Exchange Act of 1934, the Registrant has duly caused this report to be signed on its behalf by the undersigned, thereunto duly authorized. | | | | | | | | |
| WINNEBAGO INDUSTRIES, INC. |
| | |
| By | /s/ Michael J. Happe |
| | Michael J. Happe |
| | |
| | President, Chief Executive Officer |
| | (Principal Executive Officer) |
Date: October 19, 2022
Pursuant to the requirements of the Securities Exchange Act of 1934, this report has been signed below on October 19, 2022, by the following persons on behalf of the Registrant and in the capacities indicated. | | | | | | | | |
| Signature | | Capacity |
| | |
| /s/ Michael J. Happe | | |
| Michael J. Happe | | Chief Executive Officer, President
(Principal Executive Officer) |
| | |
| /s/ Bryan L. Hughes | | |
| Bryan L. Hughes | | Chief Financial Officer and Senior Vice President
(Principal Financial and Accounting Officer) |
| | |
| /s/ Sara E. Armbruster | | |
| Sara E. Armbruster | | Director |
| | |
| /s/ Christopher J. Braun | | |
| Christopher J. Braun | | Director |
| | |
| /s/ Kevin E. Bryant | | |
| Kevin E. Bryant | | Director |
| | |
| /s/ Robert M. Chiusano | | |
| Robert M. Chiusano | | Director |
| | |
| /s/ William C. Fisher | | |
| William C. Fisher | | Director |
| | |
| /s/ David W. Miles | | |
| David W. Miles | | Director |
| | |
| /s/ Richard D. Moss | | |
| Richard D. Moss | | Director |
| | |
| /s/ John M. Murabito | | |
| John M. Murabito | | Director |
| | |
| /s/ Jacqueline D. Woods | | |
| Jacqueline D. Woods | | Director |
| | |
| | |
| | |