Exhibit 99.1

Annual Report 2022
March 8, 2023

Thomson Reuters Annual Report 2022
Information in this annual report is provided as of March 1, 2023, unless otherwise indicated.
Certain statements in this annual report are forward-looking. These forward-looking statements are based on certain assumptions and reflect our current expectations. As a result, forward-looking statements are subject to a number of risks and uncertainties that could cause actual results or events to differ materially from current expectations. Some of the factors that could cause actual results to differ materially from current expectations are discussed in the “Risk Factors” section of this annual report as well as in materials that we from time to time file with, or furnish to, the Canadian securities regulatory authorities and the U.S. Securities and Exchange Commission. There is no assurance that any forward-looking statements will materialize. You are cautioned not to place undue reliance on forward-looking statements, which reflect expectations only as of the date of this annual report. Except as may be required by applicable law, we disclaim any intention or obligation to update or revise any forward-looking statements.
The following terms in this annual report have the following meanings, unless otherwise indicated:
Term |
Definition | |
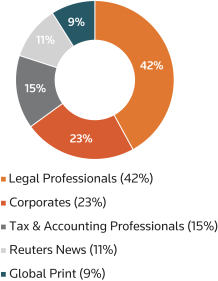
“Big 3” segments |
Our combined Legal Professionals, Corporates and Tax & Accounting Professionals segments | |
Blackstone’s consortium |
The Blackstone Group and its subsidiaries, and private equity funds affiliated with Blackstone | |
bp |
Basis points – one basis point is equal to 1/100th of 1%, “100bp” is equivalent to 1% | |
Change Program |
A two-year initiative, completed in December 2022, that focused on transforming our company from a holding company to an operating company and from a content provider into a content-driven technology company | |
constant currency |
A non-IFRS measure derived by applying the same foreign currency exchange rates to the financial results of the current and equivalent prior-year period | |
COVID-19 |
A novel strain of coronavirus that was characterized a pandemic by the World Health Organization in March 2020 | |
EPS |
Earnings per share | |
F&R |
Our former Financial & Risk business, which was renamed Refinitiv and is now the Data & Analytics business of LSEG | |
IFRS |
International Financial Reporting Standards | |
| LSEG | London Stock Exchange Group plc | |
n/a |
Not applicable | |
n/m |
Not meaningful | |
organic or organically |
A non-IFRS measure that represents changes in revenues of our existing businesses at constant currency. The metric excludes the distortive impacts of acquisitions and dispositions from not owning the business in both comparable periods | |
Refinitiv |
Our former F&R business, which is now the Data & Analytics business of LSEG. We owned 45% of Refinitiv from October 1, 2018 through January 29, 2021 | |
YPL |
York Parent Limited, the entity that owns LSEG shares, which is jointly owned by our company and the Blackstone consortium. A group of current LSEG and former members of Refinitiv senior management also owns part of YPL. References to YPL also include its subsidiaries. YPL was previously known as Refinitiv Holdings Limited prior to the sale of Refinitiv to LSEG on January 29, 2021. | |
$ and US$ |
U.S. dollars | |
Non-IFRS
financial measures are defined and reconciled to the most directly comparable IFRS measures in the “Management’s Discussion and Analysis” section of this annual report. For information regarding our disclosure requirements under applicable Canadian and U.S. laws and regulations, please see the “Cross Reference Tables” section of this annual report.
Information contained on our website or any other websites identified in this annual report is not part of this annual report. All website addresses listed in this annual report are intended to be inactive, textual references only. The Thomson Reuters logo and our other trademarks, trade names and service names mentioned in this annual report are the property of Thomson Reuters.
Front cover photo credit: REUTERS/Yves Herman.