000106915712/312021Q3falsehttp://fasb.org/us-gaap/2021-01-31#AccountingStandardsUpdate201613Member00010691572021-01-012021-09-30xbrli:shares00010691572021-10-31iso4217:USD00010691572021-09-3000010691572020-12-31iso4217:USDxbrli:shares00010691572021-07-012021-09-3000010691572020-07-012020-09-3000010691572020-01-012020-09-300001069157us-gaap:CommonStockMember2020-06-300001069157us-gaap:CommonStockIncludingAdditionalPaidInCapitalMember2020-06-300001069157us-gaap:RetainedEarningsMember2020-06-300001069157us-gaap:TreasuryStockMember2020-06-300001069157us-gaap:AccumulatedOtherComprehensiveIncomeMember2020-06-3000010691572020-06-300001069157us-gaap:RetainedEarningsMember2020-07-012020-09-300001069157us-gaap:AccumulatedOtherComprehensiveIncomeMember2020-07-012020-09-300001069157us-gaap:CommonStockMember2020-07-012020-09-300001069157us-gaap:CommonStockIncludingAdditionalPaidInCapitalMember2020-07-012020-09-300001069157us-gaap:TreasuryStockMember2020-07-012020-09-300001069157ewbc:StockCompensationPlansAndAgreementsMemberus-gaap:CommonStockMember2020-07-012020-09-300001069157ewbc:StockCompensationPlansAndAgreementsMemberus-gaap:TreasuryStockMember2020-07-012020-09-300001069157us-gaap:CommonStockMember2020-09-300001069157us-gaap:CommonStockIncludingAdditionalPaidInCapitalMember2020-09-300001069157us-gaap:RetainedEarningsMember2020-09-300001069157us-gaap:TreasuryStockMember2020-09-300001069157us-gaap:AccumulatedOtherComprehensiveIncomeMember2020-09-3000010691572020-09-300001069157us-gaap:CommonStockMember2021-06-300001069157us-gaap:CommonStockIncludingAdditionalPaidInCapitalMember2021-06-300001069157us-gaap:RetainedEarningsMember2021-06-300001069157us-gaap:TreasuryStockMember2021-06-300001069157us-gaap:AccumulatedOtherComprehensiveIncomeMember2021-06-3000010691572021-06-300001069157us-gaap:RetainedEarningsMember2021-07-012021-09-300001069157us-gaap:AccumulatedOtherComprehensiveIncomeMember2021-07-012021-09-300001069157us-gaap:CommonStockMember2021-07-012021-09-300001069157us-gaap:CommonStockIncludingAdditionalPaidInCapitalMember2021-07-012021-09-300001069157us-gaap:TreasuryStockMember2021-07-012021-09-300001069157ewbc:StockCompensationPlansAndAgreementsMemberus-gaap:CommonStockMember2021-07-012021-09-300001069157ewbc:StockCompensationPlansAndAgreementsMemberus-gaap:TreasuryStockMember2021-07-012021-09-300001069157us-gaap:CommonStockMember2021-09-300001069157us-gaap:CommonStockIncludingAdditionalPaidInCapitalMember2021-09-300001069157us-gaap:RetainedEarningsMember2021-09-300001069157us-gaap:TreasuryStockMember2021-09-300001069157us-gaap:AccumulatedOtherComprehensiveIncomeMember2021-09-300001069157us-gaap:CommonStockMember2019-12-310001069157us-gaap:CommonStockIncludingAdditionalPaidInCapitalMember2019-12-310001069157us-gaap:RetainedEarningsMember2019-12-310001069157us-gaap:TreasuryStockMember2019-12-310001069157us-gaap:AccumulatedOtherComprehensiveIncomeMember2019-12-3100010691572019-12-3100010691572019-01-012019-12-310001069157us-gaap:RetainedEarningsMembersrt:CumulativeEffectPeriodOfAdoptionAdjustmentMember2019-12-310001069157srt:CumulativeEffectPeriodOfAdoptionAdjustmentMember2019-12-310001069157us-gaap:RetainedEarningsMember2020-01-012020-09-300001069157us-gaap:AccumulatedOtherComprehensiveIncomeMember2020-01-012020-09-300001069157us-gaap:CommonStockMember2020-01-012020-09-300001069157us-gaap:CommonStockIncludingAdditionalPaidInCapitalMember2020-01-012020-09-300001069157us-gaap:TreasuryStockMember2020-01-012020-09-300001069157ewbc:StockCompensationPlansAndAgreementsMemberus-gaap:CommonStockMember2020-01-012020-09-300001069157ewbc:StockCompensationPlansAndAgreementsMemberus-gaap:TreasuryStockMember2020-01-012020-09-300001069157ewbc:StockCompensationPlansAndAgreementsMember2020-01-012020-09-300001069157us-gaap:CommonStockMemberewbc:StockRepurchaseProgramMember2020-01-012020-09-300001069157ewbc:StockRepurchaseProgramMemberus-gaap:TreasuryStockMember2020-01-012020-09-300001069157ewbc:StockRepurchaseProgramMember2020-01-012020-09-300001069157us-gaap:CommonStockMember2020-12-310001069157us-gaap:CommonStockIncludingAdditionalPaidInCapitalMember2020-12-310001069157us-gaap:RetainedEarningsMember2020-12-310001069157us-gaap:TreasuryStockMember2020-12-310001069157us-gaap:AccumulatedOtherComprehensiveIncomeMember2020-12-310001069157us-gaap:RetainedEarningsMember2021-01-012021-09-300001069157us-gaap:AccumulatedOtherComprehensiveIncomeMember2021-01-012021-09-300001069157us-gaap:CommonStockMember2021-01-012021-09-300001069157us-gaap:CommonStockIncludingAdditionalPaidInCapitalMember2021-01-012021-09-300001069157us-gaap:TreasuryStockMember2021-01-012021-09-300001069157ewbc:StockCompensationPlansAndAgreementsMemberus-gaap:CommonStockMember2021-01-012021-09-300001069157ewbc:StockCompensationPlansAndAgreementsMemberus-gaap:TreasuryStockMember2021-01-012021-09-30ewbc:trust0001069157us-gaap:USTreasurySecuritiesMemberus-gaap:FairValueInputsLevel1Memberus-gaap:FairValueMeasurementsRecurringMember2021-09-300001069157us-gaap:USTreasurySecuritiesMemberus-gaap:FairValueInputsLevel2Memberus-gaap:FairValueMeasurementsRecurringMember2021-09-300001069157us-gaap:USTreasurySecuritiesMemberus-gaap:FairValueInputsLevel3Memberus-gaap:FairValueMeasurementsRecurringMember2021-09-300001069157us-gaap:USTreasurySecuritiesMemberus-gaap:FairValueMeasurementsRecurringMember2021-09-300001069157us-gaap:USGovernmentSponsoredEnterprisesDebtSecuritiesMemberus-gaap:FairValueInputsLevel1Memberus-gaap:FairValueMeasurementsRecurringMember2021-09-300001069157us-gaap:FairValueInputsLevel2Memberus-gaap:USGovernmentSponsoredEnterprisesDebtSecuritiesMemberus-gaap:FairValueMeasurementsRecurringMember2021-09-300001069157us-gaap:FairValueInputsLevel3Memberus-gaap:USGovernmentSponsoredEnterprisesDebtSecuritiesMemberus-gaap:FairValueMeasurementsRecurringMember2021-09-300001069157us-gaap:USGovernmentSponsoredEnterprisesDebtSecuritiesMemberus-gaap:FairValueMeasurementsRecurringMember2021-09-300001069157ewbc:CommercialMortgageBackedSecuritiesIssuedByUSGovernmentAgenciesAndGovernmentSponsoredEnterpriseMemberus-gaap:FairValueInputsLevel1Memberus-gaap:FairValueMeasurementsRecurringMember2021-09-300001069157us-gaap:FairValueInputsLevel2Memberewbc:CommercialMortgageBackedSecuritiesIssuedByUSGovernmentAgenciesAndGovernmentSponsoredEnterpriseMemberus-gaap:FairValueMeasurementsRecurringMember2021-09-300001069157ewbc:CommercialMortgageBackedSecuritiesIssuedByUSGovernmentAgenciesAndGovernmentSponsoredEnterpriseMemberus-gaap:FairValueInputsLevel3Memberus-gaap:FairValueMeasurementsRecurringMember2021-09-300001069157ewbc:CommercialMortgageBackedSecuritiesIssuedByUSGovernmentAgenciesAndGovernmentSponsoredEnterpriseMemberus-gaap:FairValueMeasurementsRecurringMember2021-09-300001069157ewbc:ResidentialMortgageBackedSecuritiesIssuedByUSGovernmentAgenciesAndGovernmentSponsoredEnterpriseMemberus-gaap:FairValueInputsLevel1Memberus-gaap:FairValueMeasurementsRecurringMember2021-09-300001069157us-gaap:FairValueInputsLevel2Memberewbc:ResidentialMortgageBackedSecuritiesIssuedByUSGovernmentAgenciesAndGovernmentSponsoredEnterpriseMemberus-gaap:FairValueMeasurementsRecurringMember2021-09-300001069157us-gaap:FairValueInputsLevel3Memberewbc:ResidentialMortgageBackedSecuritiesIssuedByUSGovernmentAgenciesAndGovernmentSponsoredEnterpriseMemberus-gaap:FairValueMeasurementsRecurringMember2021-09-300001069157ewbc:ResidentialMortgageBackedSecuritiesIssuedByUSGovernmentAgenciesAndGovernmentSponsoredEnterpriseMemberus-gaap:FairValueMeasurementsRecurringMember2021-09-300001069157us-gaap:USStatesAndPoliticalSubdivisionsMemberus-gaap:FairValueInputsLevel1Memberus-gaap:FairValueMeasurementsRecurringMember2021-09-300001069157us-gaap:USStatesAndPoliticalSubdivisionsMemberus-gaap:FairValueInputsLevel2Memberus-gaap:FairValueMeasurementsRecurringMember2021-09-300001069157us-gaap:USStatesAndPoliticalSubdivisionsMemberus-gaap:FairValueInputsLevel3Memberus-gaap:FairValueMeasurementsRecurringMember2021-09-300001069157us-gaap:USStatesAndPoliticalSubdivisionsMemberus-gaap:FairValueMeasurementsRecurringMember2021-09-300001069157us-gaap:CommercialMortgageBackedSecuritiesMemberus-gaap:FairValueInputsLevel1Memberus-gaap:FairValueMeasurementsRecurringMember2021-09-300001069157us-gaap:CommercialMortgageBackedSecuritiesMemberus-gaap:FairValueInputsLevel2Memberus-gaap:FairValueMeasurementsRecurringMember2021-09-300001069157us-gaap:CommercialMortgageBackedSecuritiesMemberus-gaap:FairValueInputsLevel3Memberus-gaap:FairValueMeasurementsRecurringMember2021-09-300001069157us-gaap:CommercialMortgageBackedSecuritiesMemberus-gaap:FairValueMeasurementsRecurringMember2021-09-300001069157us-gaap:ResidentialMortgageBackedSecuritiesMemberus-gaap:FairValueInputsLevel1Memberus-gaap:FairValueMeasurementsRecurringMember2021-09-300001069157us-gaap:ResidentialMortgageBackedSecuritiesMemberus-gaap:FairValueInputsLevel2Memberus-gaap:FairValueMeasurementsRecurringMember2021-09-300001069157us-gaap:ResidentialMortgageBackedSecuritiesMemberus-gaap:FairValueInputsLevel3Memberus-gaap:FairValueMeasurementsRecurringMember2021-09-300001069157us-gaap:ResidentialMortgageBackedSecuritiesMemberus-gaap:FairValueMeasurementsRecurringMember2021-09-300001069157us-gaap:CorporateDebtSecuritiesMemberus-gaap:FairValueInputsLevel1Memberus-gaap:FairValueMeasurementsRecurringMember2021-09-300001069157us-gaap:CorporateDebtSecuritiesMemberus-gaap:FairValueInputsLevel2Memberus-gaap:FairValueMeasurementsRecurringMember2021-09-300001069157us-gaap:CorporateDebtSecuritiesMemberus-gaap:FairValueInputsLevel3Memberus-gaap:FairValueMeasurementsRecurringMember2021-09-300001069157us-gaap:CorporateDebtSecuritiesMemberus-gaap:FairValueMeasurementsRecurringMember2021-09-300001069157ewbc:ForeignGovernmentBondsMemberus-gaap:FairValueInputsLevel1Memberus-gaap:FairValueMeasurementsRecurringMember2021-09-300001069157us-gaap:FairValueInputsLevel2Memberewbc:ForeignGovernmentBondsMemberus-gaap:FairValueMeasurementsRecurringMember2021-09-300001069157us-gaap:FairValueInputsLevel3Memberewbc:ForeignGovernmentBondsMemberus-gaap:FairValueMeasurementsRecurringMember2021-09-300001069157ewbc:ForeignGovernmentBondsMemberus-gaap:FairValueMeasurementsRecurringMember2021-09-300001069157us-gaap:FairValueInputsLevel1Memberus-gaap:AssetBackedSecuritiesMemberus-gaap:FairValueMeasurementsRecurringMember2021-09-300001069157us-gaap:FairValueInputsLevel2Memberus-gaap:AssetBackedSecuritiesMemberus-gaap:FairValueMeasurementsRecurringMember2021-09-300001069157us-gaap:FairValueInputsLevel3Memberus-gaap:AssetBackedSecuritiesMemberus-gaap:FairValueMeasurementsRecurringMember2021-09-300001069157us-gaap:AssetBackedSecuritiesMemberus-gaap:FairValueMeasurementsRecurringMember2021-09-300001069157us-gaap:CollateralizedLoanObligationsMemberus-gaap:FairValueInputsLevel1Memberus-gaap:FairValueMeasurementsRecurringMember2021-09-300001069157us-gaap:CollateralizedLoanObligationsMemberus-gaap:FairValueInputsLevel2Memberus-gaap:FairValueMeasurementsRecurringMember2021-09-300001069157us-gaap:CollateralizedLoanObligationsMemberus-gaap:FairValueInputsLevel3Memberus-gaap:FairValueMeasurementsRecurringMember2021-09-300001069157us-gaap:CollateralizedLoanObligationsMemberus-gaap:FairValueMeasurementsRecurringMember2021-09-300001069157us-gaap:FairValueInputsLevel1Memberus-gaap:FairValueMeasurementsRecurringMember2021-09-300001069157us-gaap:FairValueInputsLevel2Memberus-gaap:FairValueMeasurementsRecurringMember2021-09-300001069157us-gaap:FairValueInputsLevel3Memberus-gaap:FairValueMeasurementsRecurringMember2021-09-300001069157us-gaap:FairValueMeasurementsRecurringMember2021-09-300001069157us-gaap:FairValueInputsLevel1Memberus-gaap:InterestRateContractMemberus-gaap:FairValueMeasurementsRecurringMember2021-09-300001069157us-gaap:FairValueInputsLevel2Memberus-gaap:InterestRateContractMemberus-gaap:FairValueMeasurementsRecurringMember2021-09-300001069157us-gaap:FairValueInputsLevel3Memberus-gaap:InterestRateContractMemberus-gaap:FairValueMeasurementsRecurringMember2021-09-300001069157us-gaap:InterestRateContractMemberus-gaap:FairValueMeasurementsRecurringMember2021-09-300001069157us-gaap:FairValueInputsLevel1Memberus-gaap:FairValueMeasurementsRecurringMemberus-gaap:ForeignExchangeContractMember2021-09-300001069157us-gaap:FairValueInputsLevel2Memberus-gaap:FairValueMeasurementsRecurringMemberus-gaap:ForeignExchangeContractMember2021-09-300001069157us-gaap:FairValueInputsLevel3Memberus-gaap:FairValueMeasurementsRecurringMemberus-gaap:ForeignExchangeContractMember2021-09-300001069157us-gaap:FairValueMeasurementsRecurringMemberus-gaap:ForeignExchangeContractMember2021-09-300001069157us-gaap:FairValueInputsLevel1Memberus-gaap:FairValueMeasurementsRecurringMemberus-gaap:CreditRiskContractMember2021-09-300001069157us-gaap:FairValueInputsLevel2Memberus-gaap:FairValueMeasurementsRecurringMemberus-gaap:CreditRiskContractMember2021-09-300001069157us-gaap:FairValueInputsLevel3Memberus-gaap:FairValueMeasurementsRecurringMemberus-gaap:CreditRiskContractMember2021-09-300001069157us-gaap:FairValueMeasurementsRecurringMemberus-gaap:CreditRiskContractMember2021-09-300001069157us-gaap:EquityContractMemberus-gaap:FairValueInputsLevel1Memberus-gaap:FairValueMeasurementsRecurringMember2021-09-300001069157us-gaap:FairValueInputsLevel2Memberus-gaap:EquityContractMemberus-gaap:FairValueMeasurementsRecurringMember2021-09-300001069157us-gaap:EquityContractMemberus-gaap:FairValueInputsLevel3Memberus-gaap:FairValueMeasurementsRecurringMember2021-09-300001069157us-gaap:EquityContractMemberus-gaap:FairValueMeasurementsRecurringMember2021-09-300001069157us-gaap:CommodityContractMemberus-gaap:FairValueInputsLevel1Memberus-gaap:FairValueMeasurementsRecurringMember2021-09-300001069157us-gaap:CommodityContractMemberus-gaap:FairValueInputsLevel2Memberus-gaap:FairValueMeasurementsRecurringMember2021-09-300001069157us-gaap:CommodityContractMemberus-gaap:FairValueInputsLevel3Memberus-gaap:FairValueMeasurementsRecurringMember2021-09-300001069157us-gaap:CommodityContractMemberus-gaap:FairValueMeasurementsRecurringMember2021-09-300001069157us-gaap:USTreasurySecuritiesMemberus-gaap:FairValueInputsLevel1Memberus-gaap:FairValueMeasurementsRecurringMember2020-12-310001069157us-gaap:USTreasurySecuritiesMemberus-gaap:FairValueInputsLevel2Memberus-gaap:FairValueMeasurementsRecurringMember2020-12-310001069157us-gaap:USTreasurySecuritiesMemberus-gaap:FairValueInputsLevel3Memberus-gaap:FairValueMeasurementsRecurringMember2020-12-310001069157us-gaap:USTreasurySecuritiesMemberus-gaap:FairValueMeasurementsRecurringMember2020-12-310001069157us-gaap:USGovernmentSponsoredEnterprisesDebtSecuritiesMemberus-gaap:FairValueInputsLevel1Memberus-gaap:FairValueMeasurementsRecurringMember2020-12-310001069157us-gaap:FairValueInputsLevel2Memberus-gaap:USGovernmentSponsoredEnterprisesDebtSecuritiesMemberus-gaap:FairValueMeasurementsRecurringMember2020-12-310001069157us-gaap:FairValueInputsLevel3Memberus-gaap:USGovernmentSponsoredEnterprisesDebtSecuritiesMemberus-gaap:FairValueMeasurementsRecurringMember2020-12-310001069157us-gaap:USGovernmentSponsoredEnterprisesDebtSecuritiesMemberus-gaap:FairValueMeasurementsRecurringMember2020-12-310001069157ewbc:CommercialMortgageBackedSecuritiesIssuedByUSGovernmentAgenciesAndGovernmentSponsoredEnterpriseMemberus-gaap:FairValueInputsLevel1Memberus-gaap:FairValueMeasurementsRecurringMember2020-12-310001069157us-gaap:FairValueInputsLevel2Memberewbc:CommercialMortgageBackedSecuritiesIssuedByUSGovernmentAgenciesAndGovernmentSponsoredEnterpriseMemberus-gaap:FairValueMeasurementsRecurringMember2020-12-310001069157ewbc:CommercialMortgageBackedSecuritiesIssuedByUSGovernmentAgenciesAndGovernmentSponsoredEnterpriseMemberus-gaap:FairValueInputsLevel3Memberus-gaap:FairValueMeasurementsRecurringMember2020-12-310001069157ewbc:CommercialMortgageBackedSecuritiesIssuedByUSGovernmentAgenciesAndGovernmentSponsoredEnterpriseMemberus-gaap:FairValueMeasurementsRecurringMember2020-12-310001069157ewbc:ResidentialMortgageBackedSecuritiesIssuedByUSGovernmentAgenciesAndGovernmentSponsoredEnterpriseMemberus-gaap:FairValueInputsLevel1Memberus-gaap:FairValueMeasurementsRecurringMember2020-12-310001069157us-gaap:FairValueInputsLevel2Memberewbc:ResidentialMortgageBackedSecuritiesIssuedByUSGovernmentAgenciesAndGovernmentSponsoredEnterpriseMemberus-gaap:FairValueMeasurementsRecurringMember2020-12-310001069157us-gaap:FairValueInputsLevel3Memberewbc:ResidentialMortgageBackedSecuritiesIssuedByUSGovernmentAgenciesAndGovernmentSponsoredEnterpriseMemberus-gaap:FairValueMeasurementsRecurringMember2020-12-310001069157ewbc:ResidentialMortgageBackedSecuritiesIssuedByUSGovernmentAgenciesAndGovernmentSponsoredEnterpriseMemberus-gaap:FairValueMeasurementsRecurringMember2020-12-310001069157us-gaap:USStatesAndPoliticalSubdivisionsMemberus-gaap:FairValueInputsLevel1Memberus-gaap:FairValueMeasurementsRecurringMember2020-12-310001069157us-gaap:USStatesAndPoliticalSubdivisionsMemberus-gaap:FairValueInputsLevel2Memberus-gaap:FairValueMeasurementsRecurringMember2020-12-310001069157us-gaap:USStatesAndPoliticalSubdivisionsMemberus-gaap:FairValueInputsLevel3Memberus-gaap:FairValueMeasurementsRecurringMember2020-12-310001069157us-gaap:USStatesAndPoliticalSubdivisionsMemberus-gaap:FairValueMeasurementsRecurringMember2020-12-310001069157us-gaap:CommercialMortgageBackedSecuritiesMemberus-gaap:FairValueInputsLevel1Memberus-gaap:FairValueMeasurementsRecurringMember2020-12-310001069157us-gaap:CommercialMortgageBackedSecuritiesMemberus-gaap:FairValueInputsLevel2Memberus-gaap:FairValueMeasurementsRecurringMember2020-12-310001069157us-gaap:CommercialMortgageBackedSecuritiesMemberus-gaap:FairValueInputsLevel3Memberus-gaap:FairValueMeasurementsRecurringMember2020-12-310001069157us-gaap:CommercialMortgageBackedSecuritiesMemberus-gaap:FairValueMeasurementsRecurringMember2020-12-310001069157us-gaap:ResidentialMortgageBackedSecuritiesMemberus-gaap:FairValueInputsLevel1Memberus-gaap:FairValueMeasurementsRecurringMember2020-12-310001069157us-gaap:ResidentialMortgageBackedSecuritiesMemberus-gaap:FairValueInputsLevel2Memberus-gaap:FairValueMeasurementsRecurringMember2020-12-310001069157us-gaap:ResidentialMortgageBackedSecuritiesMemberus-gaap:FairValueInputsLevel3Memberus-gaap:FairValueMeasurementsRecurringMember2020-12-310001069157us-gaap:ResidentialMortgageBackedSecuritiesMemberus-gaap:FairValueMeasurementsRecurringMember2020-12-310001069157us-gaap:CorporateDebtSecuritiesMemberus-gaap:FairValueInputsLevel1Memberus-gaap:FairValueMeasurementsRecurringMember2020-12-310001069157us-gaap:CorporateDebtSecuritiesMemberus-gaap:FairValueInputsLevel2Memberus-gaap:FairValueMeasurementsRecurringMember2020-12-310001069157us-gaap:CorporateDebtSecuritiesMemberus-gaap:FairValueInputsLevel3Memberus-gaap:FairValueMeasurementsRecurringMember2020-12-310001069157us-gaap:CorporateDebtSecuritiesMemberus-gaap:FairValueMeasurementsRecurringMember2020-12-310001069157ewbc:ForeignGovernmentBondsMemberus-gaap:FairValueInputsLevel1Memberus-gaap:FairValueMeasurementsRecurringMember2020-12-310001069157us-gaap:FairValueInputsLevel2Memberewbc:ForeignGovernmentBondsMemberus-gaap:FairValueMeasurementsRecurringMember2020-12-310001069157us-gaap:FairValueInputsLevel3Memberewbc:ForeignGovernmentBondsMemberus-gaap:FairValueMeasurementsRecurringMember2020-12-310001069157ewbc:ForeignGovernmentBondsMemberus-gaap:FairValueMeasurementsRecurringMember2020-12-310001069157us-gaap:FairValueInputsLevel1Memberus-gaap:AssetBackedSecuritiesMemberus-gaap:FairValueMeasurementsRecurringMember2020-12-310001069157us-gaap:FairValueInputsLevel2Memberus-gaap:AssetBackedSecuritiesMemberus-gaap:FairValueMeasurementsRecurringMember2020-12-310001069157us-gaap:FairValueInputsLevel3Memberus-gaap:AssetBackedSecuritiesMemberus-gaap:FairValueMeasurementsRecurringMember2020-12-310001069157us-gaap:AssetBackedSecuritiesMemberus-gaap:FairValueMeasurementsRecurringMember2020-12-310001069157us-gaap:CollateralizedLoanObligationsMemberus-gaap:FairValueInputsLevel1Memberus-gaap:FairValueMeasurementsRecurringMember2020-12-310001069157us-gaap:CollateralizedLoanObligationsMemberus-gaap:FairValueInputsLevel2Memberus-gaap:FairValueMeasurementsRecurringMember2020-12-310001069157us-gaap:CollateralizedLoanObligationsMemberus-gaap:FairValueInputsLevel3Memberus-gaap:FairValueMeasurementsRecurringMember2020-12-310001069157us-gaap:CollateralizedLoanObligationsMemberus-gaap:FairValueMeasurementsRecurringMember2020-12-310001069157us-gaap:FairValueInputsLevel1Memberus-gaap:FairValueMeasurementsRecurringMember2020-12-310001069157us-gaap:FairValueInputsLevel2Memberus-gaap:FairValueMeasurementsRecurringMember2020-12-310001069157us-gaap:FairValueInputsLevel3Memberus-gaap:FairValueMeasurementsRecurringMember2020-12-310001069157us-gaap:FairValueMeasurementsRecurringMember2020-12-310001069157us-gaap:FairValueInputsLevel1Memberus-gaap:InterestRateContractMemberus-gaap:FairValueMeasurementsRecurringMember2020-12-310001069157us-gaap:FairValueInputsLevel2Memberus-gaap:InterestRateContractMemberus-gaap:FairValueMeasurementsRecurringMember2020-12-310001069157us-gaap:FairValueInputsLevel3Memberus-gaap:InterestRateContractMemberus-gaap:FairValueMeasurementsRecurringMember2020-12-310001069157us-gaap:InterestRateContractMemberus-gaap:FairValueMeasurementsRecurringMember2020-12-310001069157us-gaap:FairValueInputsLevel1Memberus-gaap:FairValueMeasurementsRecurringMemberus-gaap:ForeignExchangeContractMember2020-12-310001069157us-gaap:FairValueInputsLevel2Memberus-gaap:FairValueMeasurementsRecurringMemberus-gaap:ForeignExchangeContractMember2020-12-310001069157us-gaap:FairValueInputsLevel3Memberus-gaap:FairValueMeasurementsRecurringMemberus-gaap:ForeignExchangeContractMember2020-12-310001069157us-gaap:FairValueMeasurementsRecurringMemberus-gaap:ForeignExchangeContractMember2020-12-310001069157us-gaap:FairValueInputsLevel1Memberus-gaap:FairValueMeasurementsRecurringMemberus-gaap:CreditRiskContractMember2020-12-310001069157us-gaap:FairValueInputsLevel2Memberus-gaap:FairValueMeasurementsRecurringMemberus-gaap:CreditRiskContractMember2020-12-310001069157us-gaap:FairValueInputsLevel3Memberus-gaap:FairValueMeasurementsRecurringMemberus-gaap:CreditRiskContractMember2020-12-310001069157us-gaap:FairValueMeasurementsRecurringMemberus-gaap:CreditRiskContractMember2020-12-310001069157us-gaap:EquityContractMemberus-gaap:FairValueInputsLevel1Memberus-gaap:FairValueMeasurementsRecurringMember2020-12-310001069157us-gaap:FairValueInputsLevel2Memberus-gaap:EquityContractMemberus-gaap:FairValueMeasurementsRecurringMember2020-12-310001069157us-gaap:EquityContractMemberus-gaap:FairValueInputsLevel3Memberus-gaap:FairValueMeasurementsRecurringMember2020-12-310001069157us-gaap:EquityContractMemberus-gaap:FairValueMeasurementsRecurringMember2020-12-310001069157us-gaap:CommodityContractMemberus-gaap:FairValueInputsLevel1Memberus-gaap:FairValueMeasurementsRecurringMember2020-12-310001069157us-gaap:CommodityContractMemberus-gaap:FairValueInputsLevel2Memberus-gaap:FairValueMeasurementsRecurringMember2020-12-310001069157us-gaap:CommodityContractMemberus-gaap:FairValueInputsLevel3Memberus-gaap:FairValueMeasurementsRecurringMember2020-12-310001069157us-gaap:CommodityContractMemberus-gaap:FairValueMeasurementsRecurringMember2020-12-310001069157us-gaap:FairValueMeasurementsRecurringMember2021-01-012021-09-300001069157us-gaap:EquityContractMemberus-gaap:FairValueInputsLevel3Memberus-gaap:FairValueMeasurementsRecurringMember2021-06-300001069157us-gaap:EquityContractMemberus-gaap:FairValueInputsLevel3Memberus-gaap:FairValueMeasurementsRecurringMember2020-06-300001069157us-gaap:EquityContractMemberus-gaap:FairValueInputsLevel3Memberus-gaap:FairValueMeasurementsRecurringMember2019-12-310001069157us-gaap:EquityContractMemberus-gaap:FairValueInputsLevel3Memberus-gaap:FairValueMeasurementsRecurringMember2021-07-012021-09-300001069157us-gaap:EquityContractMemberus-gaap:FairValueInputsLevel3Memberus-gaap:FairValueMeasurementsRecurringMember2020-07-012020-09-300001069157us-gaap:EquityContractMemberus-gaap:FairValueInputsLevel3Memberus-gaap:FairValueMeasurementsRecurringMember2021-01-012021-09-300001069157us-gaap:EquityContractMemberus-gaap:FairValueInputsLevel3Memberus-gaap:FairValueMeasurementsRecurringMember2020-01-012020-09-300001069157us-gaap:EquityContractMemberus-gaap:FairValueInputsLevel3Memberus-gaap:FairValueMeasurementsRecurringMember2020-09-300001069157us-gaap:EquityContractMemberewbc:LendingfeesMember2021-07-012021-09-300001069157us-gaap:EquityContractMemberewbc:LendingfeesMember2020-07-012020-09-300001069157us-gaap:EquityContractMemberewbc:LendingfeesMember2021-01-012021-09-300001069157us-gaap:EquityContractMemberewbc:LendingfeesMember2020-01-012020-09-30xbrli:pure0001069157us-gaap:MeasurementInputPriceVolatilityMembersrt:MinimumMemberus-gaap:EquityContractMemberus-gaap:FairValueInputsLevel3Memberewbc:BlackScholesOptionPricingModelMemberus-gaap:FairValueMeasurementsRecurringMember2021-09-300001069157us-gaap:MeasurementInputPriceVolatilityMemberus-gaap:EquityContractMemberus-gaap:FairValueInputsLevel3Memberewbc:BlackScholesOptionPricingModelMembersrt:MaximumMemberus-gaap:FairValueMeasurementsRecurringMember2021-09-300001069157us-gaap:MeasurementInputPriceVolatilityMemberus-gaap:EquityContractMemberus-gaap:FairValueInputsLevel3Memberewbc:BlackScholesOptionPricingModelMemberus-gaap:FairValueMeasurementsRecurringMembersrt:WeightedAverageMember2021-09-300001069157us-gaap:MeasurementInputDiscountForLackOfMarketabilityMemberus-gaap:EquityContractMemberus-gaap:FairValueInputsLevel3Memberus-gaap:FairValueMeasurementsRecurringMember2021-09-300001069157us-gaap:MeasurementInputDiscountForLackOfMarketabilityMemberus-gaap:EquityContractMemberus-gaap:FairValueInputsLevel3Memberus-gaap:FairValueMeasurementsRecurringMembersrt:WeightedAverageMember2021-09-300001069157us-gaap:MeasurementInputPriceVolatilityMembersrt:MinimumMemberus-gaap:EquityContractMemberus-gaap:FairValueInputsLevel3Memberewbc:BlackScholesOptionPricingModelMemberus-gaap:FairValueMeasurementsRecurringMember2020-12-310001069157us-gaap:MeasurementInputPriceVolatilityMemberus-gaap:EquityContractMemberus-gaap:FairValueInputsLevel3Memberewbc:BlackScholesOptionPricingModelMembersrt:MaximumMemberus-gaap:FairValueMeasurementsRecurringMember2020-12-310001069157us-gaap:MeasurementInputPriceVolatilityMemberus-gaap:EquityContractMemberus-gaap:FairValueInputsLevel3Memberewbc:BlackScholesOptionPricingModelMemberus-gaap:FairValueMeasurementsRecurringMembersrt:WeightedAverageMember2020-12-310001069157us-gaap:MeasurementInputDiscountForLackOfMarketabilityMemberus-gaap:EquityContractMemberus-gaap:FairValueInputsLevel3Memberus-gaap:FairValueMeasurementsRecurringMember2020-12-310001069157us-gaap:MeasurementInputDiscountForLackOfMarketabilityMemberus-gaap:EquityContractMemberus-gaap:FairValueInputsLevel3Memberus-gaap:FairValueMeasurementsRecurringMembersrt:WeightedAverageMember2020-12-310001069157us-gaap:FairValueMeasurementsNonrecurringMember2021-01-012021-09-300001069157us-gaap:CommercialPortfolioSegmentMemberewbc:CommercialAndIndustrialLoanMemberus-gaap:FairValueInputsLevel1Memberus-gaap:FairValueMeasurementsNonrecurringMember2021-09-300001069157us-gaap:CommercialPortfolioSegmentMemberewbc:CommercialAndIndustrialLoanMemberus-gaap:FairValueInputsLevel2Memberus-gaap:FairValueMeasurementsNonrecurringMember2021-09-300001069157us-gaap:CommercialPortfolioSegmentMemberewbc:CommercialAndIndustrialLoanMemberus-gaap:FairValueInputsLevel3Memberus-gaap:FairValueMeasurementsNonrecurringMember2021-09-300001069157us-gaap:CommercialPortfolioSegmentMemberewbc:CommercialAndIndustrialLoanMemberus-gaap:FairValueMeasurementsNonrecurringMember2021-09-300001069157us-gaap:CommercialRealEstateMemberus-gaap:CommercialPortfolioSegmentMemberus-gaap:FairValueInputsLevel1Memberus-gaap:FairValueMeasurementsNonrecurringMember2021-09-300001069157us-gaap:CommercialRealEstateMemberus-gaap:CommercialPortfolioSegmentMemberus-gaap:FairValueInputsLevel2Memberus-gaap:FairValueMeasurementsNonrecurringMember2021-09-300001069157us-gaap:CommercialRealEstateMemberus-gaap:CommercialPortfolioSegmentMemberus-gaap:FairValueInputsLevel3Memberus-gaap:FairValueMeasurementsNonrecurringMember2021-09-300001069157us-gaap:CommercialRealEstateMemberus-gaap:CommercialPortfolioSegmentMemberus-gaap:FairValueMeasurementsNonrecurringMember2021-09-300001069157ewbc:MultifamilyResidentialMemberus-gaap:CommercialPortfolioSegmentMemberus-gaap:FairValueInputsLevel1Memberus-gaap:FairValueMeasurementsNonrecurringMember2021-09-300001069157ewbc:MultifamilyResidentialMemberus-gaap:CommercialPortfolioSegmentMemberus-gaap:FairValueInputsLevel2Memberus-gaap:FairValueMeasurementsNonrecurringMember2021-09-300001069157ewbc:MultifamilyResidentialMemberus-gaap:CommercialPortfolioSegmentMemberus-gaap:FairValueInputsLevel3Memberus-gaap:FairValueMeasurementsNonrecurringMember2021-09-300001069157ewbc:MultifamilyResidentialMemberus-gaap:CommercialPortfolioSegmentMemberus-gaap:FairValueMeasurementsNonrecurringMember2021-09-300001069157us-gaap:CommercialPortfolioSegmentMemberus-gaap:FairValueInputsLevel1Memberus-gaap:FairValueMeasurementsNonrecurringMember2021-09-300001069157us-gaap:CommercialPortfolioSegmentMemberus-gaap:FairValueInputsLevel2Memberus-gaap:FairValueMeasurementsNonrecurringMember2021-09-300001069157us-gaap:CommercialPortfolioSegmentMemberus-gaap:FairValueInputsLevel3Memberus-gaap:FairValueMeasurementsNonrecurringMember2021-09-300001069157us-gaap:CommercialPortfolioSegmentMemberus-gaap:FairValueMeasurementsNonrecurringMember2021-09-300001069157us-gaap:ConsumerPortfolioSegmentMemberus-gaap:FairValueInputsLevel1Memberus-gaap:HomeEquityMemberus-gaap:FairValueMeasurementsNonrecurringMember2021-09-300001069157us-gaap:ConsumerPortfolioSegmentMemberus-gaap:FairValueInputsLevel2Memberus-gaap:HomeEquityMemberus-gaap:FairValueMeasurementsNonrecurringMember2021-09-300001069157us-gaap:ConsumerPortfolioSegmentMemberus-gaap:FairValueInputsLevel3Memberus-gaap:HomeEquityMemberus-gaap:FairValueMeasurementsNonrecurringMember2021-09-300001069157us-gaap:ConsumerPortfolioSegmentMemberus-gaap:HomeEquityMemberus-gaap:FairValueMeasurementsNonrecurringMember2021-09-300001069157us-gaap:ConsumerPortfolioSegmentMemberus-gaap:FairValueInputsLevel1Memberus-gaap:FairValueMeasurementsNonrecurringMember2021-09-300001069157us-gaap:ConsumerPortfolioSegmentMemberus-gaap:FairValueInputsLevel2Memberus-gaap:FairValueMeasurementsNonrecurringMember2021-09-300001069157us-gaap:ConsumerPortfolioSegmentMemberus-gaap:FairValueInputsLevel3Memberus-gaap:FairValueMeasurementsNonrecurringMember2021-09-300001069157us-gaap:ConsumerPortfolioSegmentMemberus-gaap:FairValueMeasurementsNonrecurringMember2021-09-300001069157us-gaap:FairValueInputsLevel1Memberus-gaap:FairValueMeasurementsNonrecurringMember2021-09-300001069157us-gaap:FairValueInputsLevel2Memberus-gaap:FairValueMeasurementsNonrecurringMember2021-09-300001069157us-gaap:FairValueInputsLevel3Memberus-gaap:FairValueMeasurementsNonrecurringMember2021-09-300001069157us-gaap:FairValueMeasurementsNonrecurringMember2021-09-300001069157ewbc:OtherNonperformingAssetsMemberus-gaap:FairValueInputsLevel1Memberus-gaap:FairValueMeasurementsNonrecurringMember2021-09-300001069157ewbc:OtherNonperformingAssetsMemberus-gaap:FairValueInputsLevel2Memberus-gaap:FairValueMeasurementsNonrecurringMember2021-09-300001069157ewbc:OtherNonperformingAssetsMemberus-gaap:FairValueInputsLevel3Memberus-gaap:FairValueMeasurementsNonrecurringMember2021-09-300001069157ewbc:OtherNonperformingAssetsMemberus-gaap:FairValueMeasurementsNonrecurringMember2021-09-300001069157us-gaap:CommercialPortfolioSegmentMemberewbc:CommercialAndIndustrialLoanMemberus-gaap:FairValueInputsLevel1Memberus-gaap:FairValueMeasurementsNonrecurringMember2020-12-310001069157us-gaap:CommercialPortfolioSegmentMemberewbc:CommercialAndIndustrialLoanMemberus-gaap:FairValueInputsLevel2Memberus-gaap:FairValueMeasurementsNonrecurringMember2020-12-310001069157us-gaap:CommercialPortfolioSegmentMemberewbc:CommercialAndIndustrialLoanMemberus-gaap:FairValueInputsLevel3Memberus-gaap:FairValueMeasurementsNonrecurringMember2020-12-310001069157us-gaap:CommercialPortfolioSegmentMemberewbc:CommercialAndIndustrialLoanMemberus-gaap:FairValueMeasurementsNonrecurringMember2020-12-310001069157us-gaap:CommercialRealEstateMemberus-gaap:CommercialPortfolioSegmentMemberus-gaap:FairValueInputsLevel1Memberus-gaap:FairValueMeasurementsNonrecurringMember2020-12-310001069157us-gaap:CommercialRealEstateMemberus-gaap:CommercialPortfolioSegmentMemberus-gaap:FairValueInputsLevel2Memberus-gaap:FairValueMeasurementsNonrecurringMember2020-12-310001069157us-gaap:CommercialRealEstateMemberus-gaap:CommercialPortfolioSegmentMemberus-gaap:FairValueInputsLevel3Memberus-gaap:FairValueMeasurementsNonrecurringMember2020-12-310001069157us-gaap:CommercialRealEstateMemberus-gaap:CommercialPortfolioSegmentMemberus-gaap:FairValueMeasurementsNonrecurringMember2020-12-310001069157us-gaap:CommercialPortfolioSegmentMemberus-gaap:FairValueInputsLevel1Memberus-gaap:FairValueMeasurementsNonrecurringMember2020-12-310001069157us-gaap:CommercialPortfolioSegmentMemberus-gaap:FairValueInputsLevel2Memberus-gaap:FairValueMeasurementsNonrecurringMember2020-12-310001069157us-gaap:CommercialPortfolioSegmentMemberus-gaap:FairValueInputsLevel3Memberus-gaap:FairValueMeasurementsNonrecurringMember2020-12-310001069157us-gaap:CommercialPortfolioSegmentMemberus-gaap:FairValueMeasurementsNonrecurringMember2020-12-310001069157us-gaap:ConsumerPortfolioSegmentMemberus-gaap:FairValueInputsLevel1Memberus-gaap:HomeEquityMemberus-gaap:FairValueMeasurementsNonrecurringMember2020-12-310001069157us-gaap:ConsumerPortfolioSegmentMemberus-gaap:FairValueInputsLevel2Memberus-gaap:HomeEquityMemberus-gaap:FairValueMeasurementsNonrecurringMember2020-12-310001069157us-gaap:ConsumerPortfolioSegmentMemberus-gaap:FairValueInputsLevel3Memberus-gaap:HomeEquityMemberus-gaap:FairValueMeasurementsNonrecurringMember2020-12-310001069157us-gaap:ConsumerPortfolioSegmentMemberus-gaap:HomeEquityMemberus-gaap:FairValueMeasurementsNonrecurringMember2020-12-310001069157us-gaap:ConsumerPortfolioSegmentMemberewbc:OtherConsumerMemberus-gaap:FairValueInputsLevel1Memberus-gaap:FairValueMeasurementsNonrecurringMember2020-12-310001069157us-gaap:ConsumerPortfolioSegmentMemberus-gaap:FairValueInputsLevel2Memberewbc:OtherConsumerMemberus-gaap:FairValueMeasurementsNonrecurringMember2020-12-310001069157us-gaap:ConsumerPortfolioSegmentMemberewbc:OtherConsumerMemberus-gaap:FairValueInputsLevel3Memberus-gaap:FairValueMeasurementsNonrecurringMember2020-12-310001069157us-gaap:ConsumerPortfolioSegmentMemberewbc:OtherConsumerMemberus-gaap:FairValueMeasurementsNonrecurringMember2020-12-310001069157us-gaap:ConsumerPortfolioSegmentMemberus-gaap:FairValueInputsLevel1Memberus-gaap:FairValueMeasurementsNonrecurringMember2020-12-310001069157us-gaap:ConsumerPortfolioSegmentMemberus-gaap:FairValueInputsLevel2Memberus-gaap:FairValueMeasurementsNonrecurringMember2020-12-310001069157us-gaap:ConsumerPortfolioSegmentMemberus-gaap:FairValueInputsLevel3Memberus-gaap:FairValueMeasurementsNonrecurringMember2020-12-310001069157us-gaap:ConsumerPortfolioSegmentMemberus-gaap:FairValueMeasurementsNonrecurringMember2020-12-310001069157us-gaap:FairValueInputsLevel1Memberus-gaap:FairValueMeasurementsNonrecurringMember2020-12-310001069157us-gaap:FairValueInputsLevel2Memberus-gaap:FairValueMeasurementsNonrecurringMember2020-12-310001069157us-gaap:FairValueInputsLevel3Memberus-gaap:FairValueMeasurementsNonrecurringMember2020-12-310001069157us-gaap:FairValueMeasurementsNonrecurringMember2020-12-310001069157ewbc:InvestmentsInTaxCreditAndOtherInvestmentsNetMemberus-gaap:FairValueInputsLevel1Memberus-gaap:FairValueMeasurementsNonrecurringMember2020-12-310001069157ewbc:InvestmentsInTaxCreditAndOtherInvestmentsNetMemberus-gaap:FairValueInputsLevel2Memberus-gaap:FairValueMeasurementsNonrecurringMember2020-12-310001069157ewbc:InvestmentsInTaxCreditAndOtherInvestmentsNetMemberus-gaap:FairValueInputsLevel3Memberus-gaap:FairValueMeasurementsNonrecurringMember2020-12-310001069157ewbc:InvestmentsInTaxCreditAndOtherInvestmentsNetMemberus-gaap:FairValueMeasurementsNonrecurringMember2020-12-310001069157ewbc:OtherRealEstateOwnedMemberus-gaap:FairValueInputsLevel1Memberus-gaap:FairValueMeasurementsNonrecurringMember2020-12-310001069157us-gaap:FairValueInputsLevel2Memberewbc:OtherRealEstateOwnedMemberus-gaap:FairValueMeasurementsNonrecurringMember2020-12-310001069157ewbc:OtherRealEstateOwnedMemberus-gaap:FairValueInputsLevel3Memberus-gaap:FairValueMeasurementsNonrecurringMember2020-12-310001069157ewbc:OtherRealEstateOwnedMemberus-gaap:FairValueMeasurementsNonrecurringMember2020-12-310001069157us-gaap:LoansReceivableMemberus-gaap:CommercialPortfolioSegmentMemberewbc:CommercialAndIndustrialLoanMemberus-gaap:FairValueMeasurementsNonrecurringMember2021-07-012021-09-300001069157us-gaap:LoansReceivableMemberus-gaap:CommercialPortfolioSegmentMemberewbc:CommercialAndIndustrialLoanMemberus-gaap:FairValueMeasurementsNonrecurringMember2020-07-012020-09-300001069157us-gaap:LoansReceivableMemberus-gaap:CommercialPortfolioSegmentMemberewbc:CommercialAndIndustrialLoanMemberus-gaap:FairValueMeasurementsNonrecurringMember2021-01-012021-09-300001069157us-gaap:LoansReceivableMemberus-gaap:CommercialPortfolioSegmentMemberewbc:CommercialAndIndustrialLoanMemberus-gaap:FairValueMeasurementsNonrecurringMember2020-01-012020-09-300001069157us-gaap:LoansReceivableMemberus-gaap:CommercialRealEstateMemberus-gaap:CommercialPortfolioSegmentMemberus-gaap:FairValueMeasurementsNonrecurringMember2021-07-012021-09-300001069157us-gaap:LoansReceivableMemberus-gaap:CommercialRealEstateMemberus-gaap:CommercialPortfolioSegmentMemberus-gaap:FairValueMeasurementsNonrecurringMember2020-07-012020-09-300001069157us-gaap:LoansReceivableMemberus-gaap:CommercialRealEstateMemberus-gaap:CommercialPortfolioSegmentMemberus-gaap:FairValueMeasurementsNonrecurringMember2021-01-012021-09-300001069157us-gaap:LoansReceivableMemberus-gaap:CommercialRealEstateMemberus-gaap:CommercialPortfolioSegmentMemberus-gaap:FairValueMeasurementsNonrecurringMember2020-01-012020-09-300001069157us-gaap:LoansReceivableMemberewbc:MultifamilyResidentialMemberus-gaap:CommercialPortfolioSegmentMemberus-gaap:FairValueMeasurementsNonrecurringMember2021-07-012021-09-300001069157us-gaap:LoansReceivableMemberewbc:MultifamilyResidentialMemberus-gaap:CommercialPortfolioSegmentMemberus-gaap:FairValueMeasurementsNonrecurringMember2020-07-012020-09-300001069157us-gaap:LoansReceivableMemberewbc:MultifamilyResidentialMemberus-gaap:CommercialPortfolioSegmentMemberus-gaap:FairValueMeasurementsNonrecurringMember2021-01-012021-09-300001069157us-gaap:LoansReceivableMemberewbc:MultifamilyResidentialMemberus-gaap:CommercialPortfolioSegmentMemberus-gaap:FairValueMeasurementsNonrecurringMember2020-01-012020-09-300001069157us-gaap:LoansReceivableMemberus-gaap:CommercialPortfolioSegmentMemberus-gaap:FairValueMeasurementsNonrecurringMember2021-07-012021-09-300001069157us-gaap:LoansReceivableMemberus-gaap:CommercialPortfolioSegmentMemberus-gaap:FairValueMeasurementsNonrecurringMember2020-07-012020-09-300001069157us-gaap:LoansReceivableMemberus-gaap:CommercialPortfolioSegmentMemberus-gaap:FairValueMeasurementsNonrecurringMember2021-01-012021-09-300001069157us-gaap:LoansReceivableMemberus-gaap:CommercialPortfolioSegmentMemberus-gaap:FairValueMeasurementsNonrecurringMember2020-01-012020-09-300001069157us-gaap:LoansReceivableMemberus-gaap:ConsumerPortfolioSegmentMemberus-gaap:HomeEquityMemberus-gaap:FairValueMeasurementsNonrecurringMember2021-07-012021-09-300001069157us-gaap:LoansReceivableMemberus-gaap:ConsumerPortfolioSegmentMemberus-gaap:HomeEquityMemberus-gaap:FairValueMeasurementsNonrecurringMember2020-07-012020-09-300001069157us-gaap:LoansReceivableMemberus-gaap:ConsumerPortfolioSegmentMemberus-gaap:HomeEquityMemberus-gaap:FairValueMeasurementsNonrecurringMember2021-01-012021-09-300001069157us-gaap:LoansReceivableMemberus-gaap:ConsumerPortfolioSegmentMemberus-gaap:HomeEquityMemberus-gaap:FairValueMeasurementsNonrecurringMember2020-01-012020-09-300001069157us-gaap:LoansReceivableMemberus-gaap:ConsumerPortfolioSegmentMemberewbc:OtherConsumerMemberus-gaap:FairValueMeasurementsNonrecurringMember2021-07-012021-09-300001069157us-gaap:LoansReceivableMemberus-gaap:ConsumerPortfolioSegmentMemberewbc:OtherConsumerMemberus-gaap:FairValueMeasurementsNonrecurringMember2020-07-012020-09-300001069157us-gaap:LoansReceivableMemberus-gaap:ConsumerPortfolioSegmentMemberewbc:OtherConsumerMemberus-gaap:FairValueMeasurementsNonrecurringMember2021-01-012021-09-300001069157us-gaap:LoansReceivableMemberus-gaap:ConsumerPortfolioSegmentMemberewbc:OtherConsumerMemberus-gaap:FairValueMeasurementsNonrecurringMember2020-01-012020-09-300001069157us-gaap:LoansReceivableMemberus-gaap:ConsumerPortfolioSegmentMemberus-gaap:FairValueMeasurementsNonrecurringMember2021-07-012021-09-300001069157us-gaap:LoansReceivableMemberus-gaap:ConsumerPortfolioSegmentMemberus-gaap:FairValueMeasurementsNonrecurringMember2020-07-012020-09-300001069157us-gaap:LoansReceivableMemberus-gaap:ConsumerPortfolioSegmentMemberus-gaap:FairValueMeasurementsNonrecurringMember2021-01-012021-09-300001069157us-gaap:LoansReceivableMemberus-gaap:ConsumerPortfolioSegmentMemberus-gaap:FairValueMeasurementsNonrecurringMember2020-01-012020-09-300001069157us-gaap:LoansReceivableMemberus-gaap:FairValueMeasurementsNonrecurringMember2021-07-012021-09-300001069157us-gaap:LoansReceivableMemberus-gaap:FairValueMeasurementsNonrecurringMember2020-07-012020-09-300001069157us-gaap:LoansReceivableMemberus-gaap:FairValueMeasurementsNonrecurringMember2021-01-012021-09-300001069157us-gaap:LoansReceivableMemberus-gaap:FairValueMeasurementsNonrecurringMember2020-01-012020-09-300001069157ewbc:InvestmentsInTaxCreditAndOtherInvestmentsNetMemberus-gaap:FairValueMeasurementsNonrecurringMember2021-07-012021-09-300001069157ewbc:InvestmentsInTaxCreditAndOtherInvestmentsNetMemberus-gaap:FairValueMeasurementsNonrecurringMember2020-07-012020-09-300001069157ewbc:InvestmentsInTaxCreditAndOtherInvestmentsNetMemberus-gaap:FairValueMeasurementsNonrecurringMember2021-01-012021-09-300001069157ewbc:InvestmentsInTaxCreditAndOtherInvestmentsNetMemberus-gaap:FairValueMeasurementsNonrecurringMember2020-01-012020-09-300001069157ewbc:OtherNonperformingAssetsMemberus-gaap:FairValueMeasurementsNonrecurringMember2021-07-012021-09-300001069157ewbc:OtherNonperformingAssetsMemberus-gaap:FairValueMeasurementsNonrecurringMember2020-07-012020-09-300001069157ewbc:OtherNonperformingAssetsMemberus-gaap:FairValueMeasurementsNonrecurringMember2021-01-012021-09-300001069157ewbc:OtherNonperformingAssetsMemberus-gaap:FairValueMeasurementsNonrecurringMember2020-01-012020-09-300001069157us-gaap:FairValueInputsLevel3Memberus-gaap:IncomeApproachValuationTechniqueMemberus-gaap:FairValueMeasurementsNonrecurringMember2021-09-300001069157srt:MinimumMemberus-gaap:FairValueInputsLevel3Memberus-gaap:IncomeApproachValuationTechniqueMemberus-gaap:FairValueMeasurementsNonrecurringMemberus-gaap:MeasurementInputDiscountRateMember2021-09-300001069157us-gaap:FairValueInputsLevel3Memberus-gaap:IncomeApproachValuationTechniqueMemberus-gaap:FairValueMeasurementsNonrecurringMemberus-gaap:MeasurementInputDiscountRateMembersrt:MaximumMember2021-09-300001069157us-gaap:FairValueInputsLevel3Memberus-gaap:IncomeApproachValuationTechniqueMemberus-gaap:FairValueMeasurementsNonrecurringMemberus-gaap:MeasurementInputDiscountRateMembersrt:WeightedAverageMember2021-09-300001069157ewbc:ValuationTechniqueFairValueOfCollateralDiscountMemberus-gaap:FairValueInputsLevel3Memberus-gaap:FairValueMeasurementsNonrecurringMember2021-09-300001069157ewbc:ValuationTechniqueFairValueOfCollateralDiscountMembersrt:MinimumMemberus-gaap:FairValueInputsLevel3Memberus-gaap:FairValueMeasurementsNonrecurringMemberus-gaap:MeasurementInputDiscountRateMember2021-09-300001069157ewbc:ValuationTechniqueFairValueOfCollateralDiscountMemberus-gaap:FairValueInputsLevel3Memberus-gaap:FairValueMeasurementsNonrecurringMemberus-gaap:MeasurementInputDiscountRateMembersrt:MaximumMember2021-09-300001069157ewbc:ValuationTechniqueFairValueOfCollateralDiscountMemberus-gaap:FairValueInputsLevel3Memberus-gaap:FairValueMeasurementsNonrecurringMemberus-gaap:MeasurementInputDiscountRateMembersrt:WeightedAverageMember2021-09-300001069157ewbc:ValuationTechniqueFairValueOfCollateralContractValueMemberus-gaap:FairValueInputsLevel3Memberus-gaap:FairValueMeasurementsNonrecurringMember2021-09-300001069157ewbc:ValuationTechniqueFairValueOfValuationTechniqueFairValueOfPropertySellingCostMemberus-gaap:FairValueInputsLevel3Memberus-gaap:FairValueMeasurementsNonrecurringMember2021-09-300001069157ewbc:ValuationTechniqueFairValueOfValuationTechniqueFairValueOfPropertySellingCostMemberus-gaap:FairValueInputsLevel3Memberus-gaap:MeasurementInputCostToSellMemberus-gaap:FairValueMeasurementsNonrecurringMember2021-09-300001069157ewbc:ValuationTechniqueFairValueOfValuationTechniqueFairValueOfPropertySellingCostMemberus-gaap:FairValueInputsLevel3Memberus-gaap:MeasurementInputCostToSellMemberus-gaap:FairValueMeasurementsNonrecurringMembersrt:WeightedAverageMember2021-09-300001069157ewbc:OtherNonperformingAssetsMemberewbc:ValuationTechniqueFairValueOfCollateralContractValueMemberus-gaap:FairValueInputsLevel3Memberus-gaap:FairValueMeasurementsNonrecurringMember2021-09-300001069157us-gaap:FairValueInputsLevel3Memberus-gaap:IncomeApproachValuationTechniqueMemberus-gaap:FairValueMeasurementsNonrecurringMember2020-12-310001069157srt:MinimumMemberus-gaap:FairValueInputsLevel3Memberus-gaap:IncomeApproachValuationTechniqueMemberus-gaap:FairValueMeasurementsNonrecurringMemberus-gaap:MeasurementInputDiscountRateMember2020-12-310001069157us-gaap:FairValueInputsLevel3Memberus-gaap:IncomeApproachValuationTechniqueMemberus-gaap:FairValueMeasurementsNonrecurringMemberus-gaap:MeasurementInputDiscountRateMembersrt:MaximumMember2020-12-310001069157us-gaap:FairValueInputsLevel3Memberus-gaap:IncomeApproachValuationTechniqueMemberus-gaap:FairValueMeasurementsNonrecurringMemberus-gaap:MeasurementInputDiscountRateMembersrt:WeightedAverageMember2020-12-310001069157ewbc:ValuationTechniqueFairValueOfCollateralDiscountMemberus-gaap:FairValueInputsLevel3Memberus-gaap:FairValueMeasurementsNonrecurringMember2020-12-310001069157ewbc:ValuationTechniqueFairValueOfCollateralDiscountMembersrt:MinimumMemberus-gaap:FairValueInputsLevel3Memberus-gaap:FairValueMeasurementsNonrecurringMemberus-gaap:MeasurementInputDiscountRateMember2020-12-310001069157ewbc:ValuationTechniqueFairValueOfCollateralDiscountMemberus-gaap:FairValueInputsLevel3Memberus-gaap:FairValueMeasurementsNonrecurringMemberus-gaap:MeasurementInputDiscountRateMembersrt:MaximumMember2020-12-310001069157ewbc:ValuationTechniqueFairValueOfCollateralDiscountMemberus-gaap:FairValueInputsLevel3Memberus-gaap:FairValueMeasurementsNonrecurringMemberus-gaap:MeasurementInputDiscountRateMembersrt:WeightedAverageMember2020-12-310001069157ewbc:ValuationTechniqueFairValueOfCollateralContractValueMemberus-gaap:FairValueInputsLevel3Memberus-gaap:FairValueMeasurementsNonrecurringMember2020-12-310001069157ewbc:ValuationTechniqueFairValueOfValuationTechniqueFairValueOfPropertySellingCostMemberus-gaap:FairValueInputsLevel3Memberus-gaap:FairValueMeasurementsNonrecurringMember2020-12-310001069157ewbc:ValuationTechniqueFairValueOfValuationTechniqueFairValueOfPropertySellingCostMembersrt:MinimumMemberus-gaap:FairValueInputsLevel3Memberus-gaap:MeasurementInputCostToSellMemberus-gaap:FairValueMeasurementsNonrecurringMember2020-12-310001069157ewbc:ValuationTechniqueFairValueOfValuationTechniqueFairValueOfPropertySellingCostMemberus-gaap:FairValueInputsLevel3Memberus-gaap:MeasurementInputCostToSellMemberus-gaap:FairValueMeasurementsNonrecurringMembersrt:MaximumMember2020-12-310001069157ewbc:ValuationTechniqueFairValueOfValuationTechniqueFairValueOfPropertySellingCostMemberus-gaap:FairValueInputsLevel3Memberus-gaap:MeasurementInputCostToSellMemberus-gaap:FairValueMeasurementsNonrecurringMembersrt:WeightedAverageMember2020-12-310001069157ewbc:InvestmentsInTaxCreditAndOtherInvestmentsNetMemberus-gaap:FairValueInputsLevel3Memberus-gaap:FairValueMeasurementsNonrecurringMemberewbc:ValuationTechniqueIndividualAnalysisMember2020-12-310001069157ewbc:ValuationTechniqueFairValueOfValuationTechniqueFairValueOfPropertySellingCostMemberewbc:OtherRealEstateOwnedMemberus-gaap:FairValueInputsLevel3Memberus-gaap:FairValueMeasurementsNonrecurringMember2020-12-310001069157ewbc:ValuationTechniqueFairValueOfValuationTechniqueFairValueOfPropertySellingCostMemberus-gaap:FairValueInputsLevel3Memberus-gaap:MeasurementInputCostToSellMemberus-gaap:FairValueMeasurementsNonrecurringMember2020-12-310001069157us-gaap:CarryingReportedAmountFairValueDisclosureMember2021-09-300001069157us-gaap:EstimateOfFairValueFairValueDisclosureMemberus-gaap:FairValueInputsLevel1Member2021-09-300001069157us-gaap:FairValueInputsLevel2Memberus-gaap:EstimateOfFairValueFairValueDisclosureMember2021-09-300001069157us-gaap:EstimateOfFairValueFairValueDisclosureMemberus-gaap:FairValueInputsLevel3Member2021-09-300001069157us-gaap:EstimateOfFairValueFairValueDisclosureMember2021-09-300001069157us-gaap:CarryingReportedAmountFairValueDisclosureMember2020-12-310001069157us-gaap:EstimateOfFairValueFairValueDisclosureMemberus-gaap:FairValueInputsLevel1Member2020-12-310001069157us-gaap:FairValueInputsLevel2Memberus-gaap:EstimateOfFairValueFairValueDisclosureMember2020-12-310001069157us-gaap:EstimateOfFairValueFairValueDisclosureMemberus-gaap:FairValueInputsLevel3Member2020-12-310001069157us-gaap:EstimateOfFairValueFairValueDisclosureMember2020-12-310001069157ewbc:SecuritiesPurchasedUnderResaleAgreementsMember2021-07-012021-09-300001069157ewbc:SecuritiesPurchasedUnderResaleAgreementsMember2020-07-012020-09-300001069157ewbc:SecuritiesPurchasedUnderResaleAgreementsMember2021-01-012021-09-300001069157ewbc:SecuritiesPurchasedUnderResaleAgreementsMember2020-01-012020-09-300001069157ewbc:LoansPurchasedUnderResaleAgreementsMember2021-07-012021-09-300001069157ewbc:LoansPurchasedUnderResaleAgreementsMember2021-01-012021-09-300001069157us-gaap:USTreasurySecuritiesMember2021-09-300001069157us-gaap:USGovernmentSponsoredEnterprisesDebtSecuritiesMember2021-09-300001069157ewbc:CommercialMortgageBackedSecuritiesIssuedByUSGovernmentAgenciesAndGovernmentSponsoredEnterpriseMember2021-09-300001069157ewbc:ResidentialMortgageBackedSecuritiesIssuedByUSGovernmentAgenciesAndGovernmentSponsoredEnterpriseMember2021-09-300001069157us-gaap:USStatesAndPoliticalSubdivisionsMember2021-09-300001069157us-gaap:CommercialMortgageBackedSecuritiesMember2021-09-300001069157us-gaap:ResidentialMortgageBackedSecuritiesMember2021-09-300001069157us-gaap:CorporateDebtSecuritiesMember2021-09-300001069157ewbc:ForeignGovernmentBondsMember2021-09-300001069157us-gaap:AssetBackedSecuritiesMember2021-09-300001069157us-gaap:CollateralizedLoanObligationsMember2021-09-300001069157us-gaap:USTreasurySecuritiesMember2020-12-310001069157us-gaap:USGovernmentSponsoredEnterprisesDebtSecuritiesMember2020-12-310001069157ewbc:CommercialMortgageBackedSecuritiesIssuedByUSGovernmentAgenciesAndGovernmentSponsoredEnterpriseMember2020-12-310001069157ewbc:ResidentialMortgageBackedSecuritiesIssuedByUSGovernmentAgenciesAndGovernmentSponsoredEnterpriseMember2020-12-310001069157us-gaap:USStatesAndPoliticalSubdivisionsMember2020-12-310001069157us-gaap:CommercialMortgageBackedSecuritiesMember2020-12-310001069157us-gaap:ResidentialMortgageBackedSecuritiesMember2020-12-310001069157us-gaap:CorporateDebtSecuritiesMember2020-12-310001069157ewbc:ForeignGovernmentBondsMember2020-12-310001069157us-gaap:AssetBackedSecuritiesMember2020-12-310001069157us-gaap:CollateralizedLoanObligationsMember2020-12-310001069157us-gaap:AvailableforsaleSecuritiesMember2021-09-300001069157us-gaap:AvailableforsaleSecuritiesMember2020-12-31ewbc:security0001069157ewbc:MortgageBackedSecuritiesIssuedByUSGovernmentAgenciesAndGovernmentSponsoredEnterpriseMember2021-09-3000010691572020-01-012020-12-310001069157ewbc:MortgageBackedSecuritiesIssuedByUSGovernmentAgenciesAndGovernmentSponsoredEnterpriseMember2020-12-310001069157us-gaap:AvailableforsaleSecuritiesMember2021-07-012021-09-300001069157us-gaap:AvailableforsaleSecuritiesMember2021-01-012021-09-300001069157us-gaap:AvailableforsaleSecuritiesMember2020-07-012020-09-300001069157us-gaap:AvailableforsaleSecuritiesMember2020-01-012020-09-300001069157us-gaap:DesignatedAsHedgingInstrumentMemberus-gaap:InterestRateContractMemberus-gaap:CashFlowHedgingMember2021-09-300001069157us-gaap:DesignatedAsHedgingInstrumentMemberus-gaap:InterestRateContractMemberus-gaap:CashFlowHedgingMember2020-12-310001069157us-gaap:NetInvestmentHedgingMemberus-gaap:DesignatedAsHedgingInstrumentMemberus-gaap:ForeignExchangeContractMember2021-09-300001069157us-gaap:NetInvestmentHedgingMemberus-gaap:DesignatedAsHedgingInstrumentMemberus-gaap:ForeignExchangeContractMember2020-12-310001069157us-gaap:DesignatedAsHedgingInstrumentMember2021-09-300001069157us-gaap:DesignatedAsHedgingInstrumentMember2020-12-310001069157us-gaap:NondesignatedMemberus-gaap:InterestRateContractMember2021-09-300001069157us-gaap:NondesignatedMemberus-gaap:InterestRateContractMember2020-12-310001069157us-gaap:NondesignatedMemberus-gaap:ForeignExchangeContractMember2021-09-300001069157us-gaap:NondesignatedMemberus-gaap:ForeignExchangeContractMember2020-12-310001069157us-gaap:NondesignatedMemberus-gaap:CreditRiskContractMember2021-09-300001069157us-gaap:NondesignatedMemberus-gaap:CreditRiskContractMember2020-12-310001069157us-gaap:EquityContractMemberus-gaap:NondesignatedMember2021-09-300001069157us-gaap:EquityContractMemberus-gaap:NondesignatedMember2020-12-310001069157us-gaap:CommodityContractMemberus-gaap:NondesignatedMember2021-09-300001069157us-gaap:CommodityContractMemberus-gaap:NondesignatedMember2020-12-310001069157us-gaap:NondesignatedMember2021-09-300001069157us-gaap:NondesignatedMember2020-12-31ewbc:company0001069157ewbc:EquityPublicCompaniesMemberus-gaap:NondesignatedMember2021-09-300001069157ewbc:EquityPrivateCompaniesMemberus-gaap:NondesignatedMember2021-09-300001069157ewbc:EquityPublicCompaniesMemberus-gaap:NondesignatedMember2020-12-310001069157ewbc:EquityPrivateCompaniesMemberus-gaap:NondesignatedMember2020-12-31utr:Boe0001069157srt:CrudeOilMemberewbc:CustomerCounterpartyMember2021-01-012021-09-30utr:MMBTU0001069157ewbc:CustomerCounterpartyMembersrt:NaturalGasReservesMember2021-01-012021-09-300001069157srt:CrudeOilMemberewbc:CustomerCounterpartyMember2020-01-012020-12-310001069157ewbc:CustomerCounterpartyMembersrt:NaturalGasReservesMember2020-01-012020-12-310001069157us-gaap:FairValueHedgingMemberus-gaap:DesignatedAsHedgingInstrumentMemberus-gaap:InterestRateContractMember2021-09-300001069157us-gaap:FairValueHedgingMemberus-gaap:DesignatedAsHedgingInstrumentMemberus-gaap:InterestRateContractMember2020-12-310001069157us-gaap:FairValueHedgingMemberus-gaap:InterestRateSwapMemberus-gaap:DesignatedAsHedgingInstrumentMemberus-gaap:InterestExpenseMember2021-01-012021-09-300001069157us-gaap:FairValueHedgingMemberus-gaap:DepositsMemberus-gaap:DesignatedAsHedgingInstrumentMemberus-gaap:InterestExpenseMember2021-07-012021-09-300001069157us-gaap:FairValueHedgingMemberus-gaap:InterestRateSwapMemberus-gaap:DesignatedAsHedgingInstrumentMemberus-gaap:InterestExpenseMember2021-07-012021-09-300001069157us-gaap:FairValueHedgingMemberus-gaap:DepositsMemberus-gaap:DesignatedAsHedgingInstrumentMemberus-gaap:InterestExpenseMember2021-01-012021-09-300001069157us-gaap:FairValueHedgingMemberus-gaap:InterestRateSwapMemberus-gaap:DesignatedAsHedgingInstrumentMemberus-gaap:InterestExpenseMember2020-07-012020-09-300001069157us-gaap:FairValueHedgingMemberus-gaap:InterestRateSwapMemberus-gaap:DesignatedAsHedgingInstrumentMemberus-gaap:InterestExpenseMember2020-01-012020-09-300001069157us-gaap:FairValueHedgingMemberus-gaap:DesignatedAsHedgingInstrumentMemberus-gaap:InterestExpenseMember2020-07-012020-09-300001069157us-gaap:FairValueHedgingMemberus-gaap:DesignatedAsHedgingInstrumentMemberus-gaap:InterestExpenseMember2020-01-012020-09-300001069157us-gaap:DesignatedAsHedgingInstrumentMemberus-gaap:InterestRateContractMemberus-gaap:CashFlowHedgingMember2021-07-012021-09-300001069157us-gaap:DesignatedAsHedgingInstrumentMemberus-gaap:InterestRateContractMemberus-gaap:CashFlowHedgingMember2020-07-012020-09-300001069157us-gaap:DesignatedAsHedgingInstrumentMemberus-gaap:InterestRateContractMemberus-gaap:CashFlowHedgingMember2021-01-012021-09-300001069157us-gaap:DesignatedAsHedgingInstrumentMemberus-gaap:InterestRateContractMemberus-gaap:CashFlowHedgingMember2020-01-012020-09-300001069157us-gaap:NetInvestmentHedgingMemberus-gaap:DesignatedAsHedgingInstrumentMemberus-gaap:ForeignExchangeContractMember2021-07-012021-09-300001069157us-gaap:NetInvestmentHedgingMemberus-gaap:DesignatedAsHedgingInstrumentMemberus-gaap:ForeignExchangeContractMember2020-07-012020-09-300001069157us-gaap:NetInvestmentHedgingMemberus-gaap:DesignatedAsHedgingInstrumentMemberus-gaap:ForeignExchangeContractMember2021-01-012021-09-300001069157us-gaap:NetInvestmentHedgingMemberus-gaap:DesignatedAsHedgingInstrumentMemberus-gaap:ForeignExchangeContractMember2020-01-012020-09-300001069157us-gaap:InterestRateContractMemberewbc:WrittenOptionMemberewbc:CustomerCounterpartyMemberus-gaap:NondesignatedMember2021-09-300001069157us-gaap:InterestRateContractMemberewbc:PurchasedOptionsMemberus-gaap:NondesignatedMemberewbc:FinancialCounterpartyMember2021-09-300001069157us-gaap:InterestRateContractMemberewbc:CustomerCounterpartyMemberus-gaap:NondesignatedMemberewbc:SoldCollarsandCorridorsMember2021-09-300001069157us-gaap:InterestRateContractMemberewbc:CollarsandCorridorsMemberus-gaap:NondesignatedMemberewbc:FinancialCounterpartyMember2021-09-300001069157us-gaap:InterestRateContractMemberus-gaap:SwapMemberewbc:CustomerCounterpartyMemberus-gaap:NondesignatedMember2021-09-300001069157us-gaap:InterestRateContractMemberus-gaap:SwapMemberus-gaap:NondesignatedMemberewbc:FinancialCounterpartyMember2021-09-300001069157us-gaap:InterestRateContractMemberewbc:CustomerCounterpartyMemberus-gaap:NondesignatedMemberus-gaap:InterestRateContractMember2021-09-300001069157us-gaap:InterestRateContractMemberus-gaap:NondesignatedMemberewbc:FinancialCounterpartyMemberus-gaap:InterestRateContractMember2021-09-300001069157us-gaap:InterestRateContractMemberewbc:WrittenOptionMemberewbc:CustomerCounterpartyMemberus-gaap:NondesignatedMember2020-12-310001069157us-gaap:InterestRateContractMemberewbc:PurchasedOptionsMemberus-gaap:NondesignatedMemberewbc:FinancialCounterpartyMember2020-12-310001069157us-gaap:InterestRateContractMemberewbc:CustomerCounterpartyMemberus-gaap:NondesignatedMemberewbc:SoldCollarsandCorridorsMember2020-12-310001069157us-gaap:InterestRateContractMemberewbc:CollarsandCorridorsMemberus-gaap:NondesignatedMemberewbc:FinancialCounterpartyMember2020-12-310001069157us-gaap:InterestRateContractMemberus-gaap:SwapMemberewbc:CustomerCounterpartyMemberus-gaap:NondesignatedMember2020-12-310001069157us-gaap:InterestRateContractMemberus-gaap:SwapMemberus-gaap:NondesignatedMemberewbc:FinancialCounterpartyMember2020-12-310001069157us-gaap:InterestRateContractMemberewbc:CustomerCounterpartyMemberus-gaap:NondesignatedMemberus-gaap:InterestRateContractMember2020-12-310001069157us-gaap:InterestRateContractMemberus-gaap:NondesignatedMemberewbc:FinancialCounterpartyMemberus-gaap:InterestRateContractMember2020-12-310001069157us-gaap:NondesignatedMemberewbc:FinancialCounterpartyMemberus-gaap:InterestRateContractMember2021-09-300001069157ewbc:LondonClearingHouseMemberus-gaap:NondesignatedMemberus-gaap:InterestRateContractMember2021-09-300001069157us-gaap:NondesignatedMemberewbc:FinancialCounterpartyMemberus-gaap:InterestRateContractMember2020-12-310001069157ewbc:LondonClearingHouseMemberus-gaap:NondesignatedMemberus-gaap:InterestRateContractMember2020-12-310001069157us-gaap:NondesignatedMembersrt:MaximumMemberus-gaap:ForeignExchangeContractMember2020-01-012020-12-310001069157us-gaap:NondesignatedMembersrt:MaximumMemberus-gaap:ForeignExchangeContractMember2021-01-012021-09-300001069157ewbc:CustomerCounterpartyMemberus-gaap:ForeignExchangeContractMemberus-gaap:NondesignatedMemberewbc:ForwardsandSpotsMember2021-09-300001069157us-gaap:ForeignExchangeContractMemberus-gaap:NondesignatedMemberewbc:ForwardsandSpotsMemberewbc:FinancialCounterpartyMember2021-09-300001069157us-gaap:SwapMemberewbc:CustomerCounterpartyMemberus-gaap:ForeignExchangeContractMemberus-gaap:NondesignatedMember2021-09-300001069157us-gaap:SwapMemberus-gaap:ForeignExchangeContractMemberus-gaap:NondesignatedMemberewbc:FinancialCounterpartyMember2021-09-300001069157ewbc:WrittenOptionMemberewbc:CustomerCounterpartyMemberus-gaap:ForeignExchangeContractMemberus-gaap:NondesignatedMember2021-09-300001069157us-gaap:ForeignExchangeContractMemberewbc:PurchasedOptionsMemberus-gaap:NondesignatedMemberewbc:FinancialCounterpartyMember2021-09-300001069157ewbc:CustomerCounterpartyMemberus-gaap:ForeignExchangeContractMemberus-gaap:NondesignatedMemberewbc:CollarsMember2021-09-300001069157us-gaap:ForeignExchangeContractMemberus-gaap:NondesignatedMemberewbc:CollarsMemberewbc:FinancialCounterpartyMember2021-09-300001069157ewbc:CustomerCounterpartyMemberus-gaap:ForeignExchangeContractMemberus-gaap:NondesignatedMemberus-gaap:ForeignExchangeContractMember2021-09-300001069157us-gaap:ForeignExchangeContractMemberus-gaap:NondesignatedMemberewbc:FinancialCounterpartyMemberus-gaap:ForeignExchangeContractMember2021-09-300001069157ewbc:CustomerCounterpartyMemberus-gaap:ForeignExchangeContractMemberus-gaap:NondesignatedMemberewbc:ForwardsandSpotsMember2020-12-310001069157us-gaap:ForeignExchangeContractMemberus-gaap:NondesignatedMemberewbc:ForwardsandSpotsMemberewbc:FinancialCounterpartyMember2020-12-310001069157us-gaap:SwapMemberewbc:CustomerCounterpartyMemberus-gaap:ForeignExchangeContractMemberus-gaap:NondesignatedMember2020-12-310001069157us-gaap:SwapMemberus-gaap:ForeignExchangeContractMemberus-gaap:NondesignatedMemberewbc:FinancialCounterpartyMember2020-12-310001069157ewbc:WrittenOptionMemberewbc:CustomerCounterpartyMemberus-gaap:ForeignExchangeContractMemberus-gaap:NondesignatedMember2020-12-310001069157us-gaap:ForeignExchangeContractMemberewbc:PurchasedOptionsMemberus-gaap:NondesignatedMemberewbc:FinancialCounterpartyMember2020-12-310001069157ewbc:CustomerCounterpartyMemberus-gaap:ForeignExchangeContractMemberus-gaap:NondesignatedMemberus-gaap:ForeignExchangeContractMember2020-12-310001069157us-gaap:ForeignExchangeContractMemberus-gaap:NondesignatedMemberewbc:FinancialCounterpartyMemberus-gaap:ForeignExchangeContractMember2020-12-310001069157us-gaap:NondesignatedMemberus-gaap:ShortMemberus-gaap:CreditRiskContractMember2021-09-300001069157us-gaap:NondesignatedMemberus-gaap:ShortMemberus-gaap:CreditRiskContractMember2020-12-310001069157us-gaap:NondesignatedMemberus-gaap:ShortMemberus-gaap:CreditRiskContractMember2021-01-012021-09-300001069157us-gaap:NondesignatedMemberus-gaap:ShortMemberus-gaap:CreditRiskContractMember2020-01-012020-12-310001069157us-gaap:CreditRiskContractMemberus-gaap:NondesignatedMemberus-gaap:ShortMemberus-gaap:OtherCreditDerivativesMember2021-09-300001069157us-gaap:CreditRiskContractMemberus-gaap:NondesignatedMemberus-gaap:ShortMemberus-gaap:OtherCreditDerivativesMember2020-12-310001069157us-gaap:LongMemberus-gaap:CreditRiskContractMemberus-gaap:NondesignatedMemberus-gaap:OtherCreditDerivativesMember2021-09-300001069157us-gaap:LongMemberus-gaap:CreditRiskContractMemberus-gaap:NondesignatedMemberus-gaap:OtherCreditDerivativesMember2020-12-310001069157us-gaap:CreditRiskContractMemberus-gaap:NondesignatedMemberus-gaap:OtherCreditDerivativesMember2021-09-300001069157us-gaap:CreditRiskContractMemberus-gaap:NondesignatedMemberus-gaap:OtherCreditDerivativesMember2020-12-310001069157ewbc:WrittenOptionMembersrt:CrudeOilMemberus-gaap:CommodityContractMemberewbc:CustomerCounterpartyMemberus-gaap:NondesignatedMember2021-01-012021-09-300001069157ewbc:WrittenOptionMembersrt:CrudeOilMemberus-gaap:CommodityContractMemberewbc:CustomerCounterpartyMemberus-gaap:NondesignatedMember2021-09-300001069157srt:CrudeOilMemberus-gaap:CommodityContractMemberewbc:PurchasedOptionsMemberus-gaap:NondesignatedMemberewbc:FinancialCounterpartyMember2021-01-012021-09-300001069157srt:CrudeOilMemberus-gaap:CommodityContractMemberewbc:PurchasedOptionsMemberus-gaap:NondesignatedMemberewbc:FinancialCounterpartyMember2021-09-300001069157srt:CrudeOilMemberus-gaap:CommodityContractMemberewbc:CustomerCounterpartyMemberus-gaap:NondesignatedMemberewbc:CollarsMember2021-01-012021-09-300001069157srt:CrudeOilMemberus-gaap:CommodityContractMemberewbc:CustomerCounterpartyMemberus-gaap:NondesignatedMemberewbc:CollarsMember2021-09-300001069157srt:CrudeOilMemberus-gaap:CommodityContractMemberus-gaap:NondesignatedMemberewbc:CollarsMemberewbc:FinancialCounterpartyMember2021-01-012021-09-300001069157srt:CrudeOilMemberus-gaap:CommodityContractMemberus-gaap:NondesignatedMemberewbc:CollarsMemberewbc:FinancialCounterpartyMember2021-09-300001069157srt:CrudeOilMemberus-gaap:SwapMemberus-gaap:CommodityContractMemberewbc:CustomerCounterpartyMemberus-gaap:NondesignatedMember2021-01-012021-09-300001069157srt:CrudeOilMemberus-gaap:SwapMemberus-gaap:CommodityContractMemberewbc:CustomerCounterpartyMemberus-gaap:NondesignatedMember2021-09-300001069157srt:CrudeOilMemberus-gaap:SwapMemberus-gaap:CommodityContractMemberus-gaap:NondesignatedMemberewbc:FinancialCounterpartyMember2021-01-012021-09-300001069157srt:CrudeOilMemberus-gaap:SwapMemberus-gaap:CommodityContractMemberus-gaap:NondesignatedMemberewbc:FinancialCounterpartyMember2021-09-300001069157us-gaap:CommodityContractMembersrt:CrudeOilMemberus-gaap:CommodityContractMemberewbc:CustomerCounterpartyMemberus-gaap:NondesignatedMember2021-01-012021-09-300001069157us-gaap:CommodityContractMembersrt:CrudeOilMemberus-gaap:CommodityContractMemberewbc:CustomerCounterpartyMemberus-gaap:NondesignatedMember2021-09-300001069157us-gaap:CommodityContractMembersrt:CrudeOilMemberus-gaap:CommodityContractMemberus-gaap:NondesignatedMemberewbc:FinancialCounterpartyMember2021-01-012021-09-300001069157us-gaap:CommodityContractMembersrt:CrudeOilMemberus-gaap:CommodityContractMemberus-gaap:NondesignatedMemberewbc:FinancialCounterpartyMember2021-09-300001069157ewbc:WrittenOptionMemberus-gaap:CommodityContractMemberewbc:CustomerCounterpartyMemberus-gaap:NondesignatedMembersrt:NaturalGasReservesMember2021-01-012021-09-300001069157ewbc:WrittenOptionMemberus-gaap:CommodityContractMemberewbc:CustomerCounterpartyMemberus-gaap:NondesignatedMembersrt:NaturalGasReservesMember2021-09-300001069157us-gaap:CommodityContractMemberewbc:PurchasedOptionsMemberus-gaap:NondesignatedMemberewbc:FinancialCounterpartyMembersrt:NaturalGasReservesMember2021-01-012021-09-300001069157us-gaap:CommodityContractMemberewbc:PurchasedOptionsMemberus-gaap:NondesignatedMemberewbc:FinancialCounterpartyMembersrt:NaturalGasReservesMember2021-09-300001069157us-gaap:CommodityContractMemberewbc:CustomerCounterpartyMemberus-gaap:NondesignatedMemberewbc:CollarsMembersrt:NaturalGasReservesMember2021-01-012021-09-300001069157us-gaap:CommodityContractMemberewbc:CustomerCounterpartyMemberus-gaap:NondesignatedMemberewbc:CollarsMembersrt:NaturalGasReservesMember2021-09-300001069157us-gaap:CommodityContractMemberus-gaap:NondesignatedMemberewbc:CollarsMemberewbc:FinancialCounterpartyMembersrt:NaturalGasReservesMember2021-01-012021-09-300001069157us-gaap:CommodityContractMemberus-gaap:NondesignatedMemberewbc:CollarsMemberewbc:FinancialCounterpartyMembersrt:NaturalGasReservesMember2021-09-300001069157us-gaap:SwapMemberus-gaap:CommodityContractMemberewbc:CustomerCounterpartyMemberus-gaap:NondesignatedMembersrt:NaturalGasReservesMember2021-01-012021-09-300001069157us-gaap:SwapMemberus-gaap:CommodityContractMemberewbc:CustomerCounterpartyMemberus-gaap:NondesignatedMembersrt:NaturalGasReservesMember2021-09-300001069157us-gaap:SwapMemberus-gaap:CommodityContractMemberus-gaap:NondesignatedMemberewbc:FinancialCounterpartyMembersrt:NaturalGasReservesMember2021-01-012021-09-300001069157us-gaap:SwapMemberus-gaap:CommodityContractMemberus-gaap:NondesignatedMemberewbc:FinancialCounterpartyMembersrt:NaturalGasReservesMember2021-09-300001069157us-gaap:CommodityContractMemberus-gaap:CommodityContractMemberewbc:CustomerCounterpartyMemberus-gaap:NondesignatedMembersrt:NaturalGasReservesMember2021-01-012021-09-300001069157us-gaap:CommodityContractMemberus-gaap:CommodityContractMemberewbc:CustomerCounterpartyMemberus-gaap:NondesignatedMembersrt:NaturalGasReservesMember2021-09-300001069157us-gaap:CommodityContractMemberus-gaap:CommodityContractMemberus-gaap:NondesignatedMemberewbc:FinancialCounterpartyMembersrt:NaturalGasReservesMember2021-01-012021-09-300001069157us-gaap:CommodityContractMemberus-gaap:CommodityContractMemberus-gaap:NondesignatedMemberewbc:FinancialCounterpartyMembersrt:NaturalGasReservesMember2021-09-300001069157us-gaap:CommodityContractMemberus-gaap:CommodityContractMemberewbc:CustomerCounterpartyMemberus-gaap:NondesignatedMember2021-09-300001069157us-gaap:CommodityContractMemberus-gaap:CommodityContractMemberus-gaap:NondesignatedMemberewbc:FinancialCounterpartyMember2021-09-300001069157srt:CrudeOilMemberus-gaap:CommodityContractMemberewbc:CustomerCounterpartyMemberus-gaap:NondesignatedMemberewbc:CollarsMember2020-01-012020-12-310001069157srt:CrudeOilMemberus-gaap:CommodityContractMemberewbc:CustomerCounterpartyMemberus-gaap:NondesignatedMemberewbc:CollarsMember2020-12-310001069157srt:CrudeOilMemberus-gaap:CommodityContractMemberus-gaap:NondesignatedMemberewbc:CollarsMemberewbc:FinancialCounterpartyMember2020-01-012020-12-310001069157srt:CrudeOilMemberus-gaap:CommodityContractMemberus-gaap:NondesignatedMemberewbc:CollarsMemberewbc:FinancialCounterpartyMember2020-12-310001069157srt:CrudeOilMemberus-gaap:SwapMemberus-gaap:CommodityContractMemberewbc:CustomerCounterpartyMemberus-gaap:NondesignatedMember2020-01-012020-12-310001069157srt:CrudeOilMemberus-gaap:SwapMemberus-gaap:CommodityContractMemberewbc:CustomerCounterpartyMemberus-gaap:NondesignatedMember2020-12-310001069157srt:CrudeOilMemberus-gaap:SwapMemberus-gaap:CommodityContractMemberus-gaap:NondesignatedMemberewbc:FinancialCounterpartyMember2020-01-012020-12-310001069157srt:CrudeOilMemberus-gaap:SwapMemberus-gaap:CommodityContractMemberus-gaap:NondesignatedMemberewbc:FinancialCounterpartyMember2020-12-310001069157us-gaap:CommodityContractMembersrt:CrudeOilMemberus-gaap:CommodityContractMemberewbc:CustomerCounterpartyMemberus-gaap:NondesignatedMember2020-01-012020-12-310001069157us-gaap:CommodityContractMembersrt:CrudeOilMemberus-gaap:CommodityContractMemberewbc:CustomerCounterpartyMemberus-gaap:NondesignatedMember2020-12-310001069157us-gaap:CommodityContractMembersrt:CrudeOilMemberus-gaap:CommodityContractMemberus-gaap:NondesignatedMemberewbc:FinancialCounterpartyMember2020-01-012020-12-310001069157us-gaap:CommodityContractMembersrt:CrudeOilMemberus-gaap:CommodityContractMemberus-gaap:NondesignatedMemberewbc:FinancialCounterpartyMember2020-12-310001069157ewbc:WrittenOptionMemberus-gaap:CommodityContractMemberewbc:CustomerCounterpartyMemberus-gaap:NondesignatedMembersrt:NaturalGasReservesMember2020-01-012020-12-310001069157ewbc:WrittenOptionMemberus-gaap:CommodityContractMemberewbc:CustomerCounterpartyMemberus-gaap:NondesignatedMembersrt:NaturalGasReservesMember2020-12-310001069157us-gaap:CommodityContractMemberewbc:PurchasedOptionsMemberus-gaap:NondesignatedMemberewbc:FinancialCounterpartyMembersrt:NaturalGasReservesMember2020-01-012020-12-310001069157us-gaap:CommodityContractMemberewbc:PurchasedOptionsMemberus-gaap:NondesignatedMemberewbc:FinancialCounterpartyMembersrt:NaturalGasReservesMember2020-12-310001069157us-gaap:CommodityContractMemberewbc:CustomerCounterpartyMemberus-gaap:NondesignatedMemberewbc:CollarsMembersrt:NaturalGasReservesMember2020-01-012020-12-310001069157us-gaap:CommodityContractMemberewbc:CustomerCounterpartyMemberus-gaap:NondesignatedMemberewbc:CollarsMembersrt:NaturalGasReservesMember2020-12-310001069157us-gaap:CommodityContractMemberus-gaap:NondesignatedMemberewbc:CollarsMemberewbc:FinancialCounterpartyMembersrt:NaturalGasReservesMember2020-01-012020-12-310001069157us-gaap:CommodityContractMemberus-gaap:NondesignatedMemberewbc:CollarsMemberewbc:FinancialCounterpartyMembersrt:NaturalGasReservesMember2020-12-310001069157us-gaap:SwapMemberus-gaap:CommodityContractMemberewbc:CustomerCounterpartyMemberus-gaap:NondesignatedMembersrt:NaturalGasReservesMember2020-01-012020-12-310001069157us-gaap:SwapMemberus-gaap:CommodityContractMemberewbc:CustomerCounterpartyMemberus-gaap:NondesignatedMembersrt:NaturalGasReservesMember2020-12-310001069157us-gaap:SwapMemberus-gaap:CommodityContractMemberus-gaap:NondesignatedMemberewbc:FinancialCounterpartyMembersrt:NaturalGasReservesMember2020-01-012020-12-310001069157us-gaap:SwapMemberus-gaap:CommodityContractMemberus-gaap:NondesignatedMemberewbc:FinancialCounterpartyMembersrt:NaturalGasReservesMember2020-12-310001069157us-gaap:CommodityContractMemberus-gaap:CommodityContractMemberewbc:CustomerCounterpartyMemberus-gaap:NondesignatedMembersrt:NaturalGasReservesMember2020-01-012020-12-310001069157us-gaap:CommodityContractMemberus-gaap:CommodityContractMemberewbc:CustomerCounterpartyMemberus-gaap:NondesignatedMembersrt:NaturalGasReservesMember2020-12-310001069157us-gaap:CommodityContractMemberus-gaap:CommodityContractMemberus-gaap:NondesignatedMemberewbc:FinancialCounterpartyMembersrt:NaturalGasReservesMember2020-01-012020-12-310001069157us-gaap:CommodityContractMemberus-gaap:CommodityContractMemberus-gaap:NondesignatedMemberewbc:FinancialCounterpartyMembersrt:NaturalGasReservesMember2020-12-310001069157us-gaap:CommodityContractMemberus-gaap:CommodityContractMemberewbc:CustomerCounterpartyMemberus-gaap:NondesignatedMember2020-12-310001069157us-gaap:CommodityContractMemberus-gaap:CommodityContractMemberus-gaap:NondesignatedMemberewbc:FinancialCounterpartyMember2020-12-310001069157us-gaap:CommodityContractMembersrt:OilReservesMemberewbc:ChicagoMercantileExchangeCMEMemberus-gaap:NondesignatedMember2021-01-012021-09-300001069157us-gaap:CommodityContractMemberewbc:ChicagoMercantileExchangeCMEMemberus-gaap:NondesignatedMembersrt:NaturalGasReservesMember2021-01-012021-09-300001069157us-gaap:CommodityContractMemberewbc:ChicagoMercantileExchangeCMEMemberus-gaap:NondesignatedMember2021-09-300001069157us-gaap:CommodityContractMembersrt:OilReservesMemberewbc:ChicagoMercantileExchangeCMEMemberus-gaap:NondesignatedMember2020-01-012020-12-310001069157us-gaap:CommodityContractMemberewbc:ChicagoMercantileExchangeCMEMemberus-gaap:NondesignatedMembersrt:NaturalGasReservesMember2020-01-012020-12-310001069157us-gaap:CommodityContractMemberewbc:ChicagoMercantileExchangeCMEMemberus-gaap:NondesignatedMember2020-12-310001069157us-gaap:NondesignatedMemberewbc:InterestratecontractsandotherderivativeincomeMemberus-gaap:InterestRateContractMember2021-07-012021-09-300001069157us-gaap:NondesignatedMemberewbc:InterestratecontractsandotherderivativeincomeMemberus-gaap:InterestRateContractMember2020-07-012020-09-300001069157us-gaap:NondesignatedMemberewbc:InterestratecontractsandotherderivativeincomeMemberus-gaap:InterestRateContractMember2021-01-012021-09-300001069157us-gaap:NondesignatedMemberewbc:InterestratecontractsandotherderivativeincomeMemberus-gaap:InterestRateContractMember2020-01-012020-09-300001069157us-gaap:ForeignCurrencyGainLossMemberus-gaap:NondesignatedMemberus-gaap:ForeignExchangeContractMember2021-07-012021-09-300001069157us-gaap:ForeignCurrencyGainLossMemberus-gaap:NondesignatedMemberus-gaap:ForeignExchangeContractMember2020-07-012020-09-300001069157us-gaap:ForeignCurrencyGainLossMemberus-gaap:NondesignatedMemberus-gaap:ForeignExchangeContractMember2021-01-012021-09-300001069157us-gaap:ForeignCurrencyGainLossMemberus-gaap:NondesignatedMemberus-gaap:ForeignExchangeContractMember2020-01-012020-09-300001069157us-gaap:NondesignatedMemberewbc:InterestratecontractsandotherderivativeincomeMemberus-gaap:CreditRiskContractMember2021-07-012021-09-300001069157us-gaap:NondesignatedMemberewbc:InterestratecontractsandotherderivativeincomeMemberus-gaap:CreditRiskContractMember2020-07-012020-09-300001069157us-gaap:NondesignatedMemberewbc:InterestratecontractsandotherderivativeincomeMemberus-gaap:CreditRiskContractMember2021-01-012021-09-300001069157us-gaap:NondesignatedMemberewbc:InterestratecontractsandotherderivativeincomeMemberus-gaap:CreditRiskContractMember2020-01-012020-09-300001069157us-gaap:EquityContractMemberus-gaap:NondesignatedMemberewbc:LendingfeesMember2021-07-012021-09-300001069157us-gaap:EquityContractMemberus-gaap:NondesignatedMemberewbc:LendingfeesMember2020-07-012020-09-300001069157us-gaap:EquityContractMemberus-gaap:NondesignatedMemberewbc:LendingfeesMember2021-01-012021-09-300001069157us-gaap:EquityContractMemberus-gaap:NondesignatedMemberewbc:LendingfeesMember2020-01-012020-09-300001069157us-gaap:CommodityContractMemberus-gaap:NondesignatedMemberewbc:InterestratecontractsandotherderivativeincomeMember2021-07-012021-09-300001069157us-gaap:CommodityContractMemberus-gaap:NondesignatedMemberewbc:InterestratecontractsandotherderivativeincomeMember2020-07-012020-09-300001069157us-gaap:CommodityContractMemberus-gaap:NondesignatedMemberewbc:InterestratecontractsandotherderivativeincomeMember2021-01-012021-09-300001069157us-gaap:CommodityContractMemberus-gaap:NondesignatedMemberewbc:InterestratecontractsandotherderivativeincomeMember2020-01-012020-09-300001069157us-gaap:NondesignatedMember2021-07-012021-09-300001069157us-gaap:NondesignatedMember2020-07-012020-09-300001069157us-gaap:NondesignatedMember2021-01-012021-09-300001069157us-gaap:NondesignatedMember2020-01-012020-09-300001069157ewbc:CreditRiskRelatedContingentFeaturesMember2021-09-300001069157ewbc:CreditRiskRelatedContingentFeaturesMember2020-12-310001069157us-gaap:CommercialPortfolioSegmentMemberewbc:CommercialAndIndustrialLoanMember2021-09-300001069157us-gaap:CommercialPortfolioSegmentMemberewbc:CommercialAndIndustrialLoanMember2020-12-310001069157us-gaap:CommercialRealEstateMemberus-gaap:CommercialPortfolioSegmentMember2021-09-300001069157us-gaap:CommercialRealEstateMemberus-gaap:CommercialPortfolioSegmentMember2020-12-310001069157us-gaap:CommercialPortfolioSegmentMemberus-gaap:RealEstateLoanMembersrt:MultifamilyMember2021-09-300001069157us-gaap:CommercialPortfolioSegmentMemberus-gaap:RealEstateLoanMembersrt:MultifamilyMember2020-12-310001069157us-gaap:CommercialPortfolioSegmentMemberewbc:ConstructionAndLandLoanMember2021-09-300001069157us-gaap:CommercialPortfolioSegmentMemberewbc:ConstructionAndLandLoanMember2020-12-310001069157us-gaap:CommercialPortfolioSegmentMemberewbc:TotalCommercialRealEstateMember2021-09-300001069157us-gaap:CommercialPortfolioSegmentMemberewbc:TotalCommercialRealEstateMember2020-12-310001069157us-gaap:CommercialPortfolioSegmentMember2021-09-300001069157us-gaap:CommercialPortfolioSegmentMember2020-12-310001069157us-gaap:ConsumerPortfolioSegmentMembersrt:SingleFamilyMemberus-gaap:RealEstateLoanMember2021-09-300001069157us-gaap:ConsumerPortfolioSegmentMembersrt:SingleFamilyMemberus-gaap:RealEstateLoanMember2020-12-310001069157us-gaap:ConsumerPortfolioSegmentMemberus-gaap:HomeEquityMember2021-09-300001069157us-gaap:ConsumerPortfolioSegmentMemberus-gaap:HomeEquityMember2020-12-310001069157us-gaap:ConsumerPortfolioSegmentMemberewbc:TotalResidentialMortgageMember2021-09-300001069157us-gaap:ConsumerPortfolioSegmentMemberewbc:TotalResidentialMortgageMember2020-12-310001069157us-gaap:ConsumerPortfolioSegmentMemberewbc:OtherConsumerMember2021-09-300001069157us-gaap:ConsumerPortfolioSegmentMemberewbc:OtherConsumerMember2020-12-310001069157us-gaap:ConsumerPortfolioSegmentMember2021-09-300001069157us-gaap:ConsumerPortfolioSegmentMember2020-12-310001069157ewbc:CommercialAndIndustrialLoanMemberewbc:CARESActPaycheckProtectionProgramMember2021-09-300001069157ewbc:CommercialAndIndustrialLoanMemberewbc:CARESActPaycheckProtectionProgramMember2020-12-310001069157ewbc:CARESActPaycheckProtectionProgramMember2021-09-300001069157ewbc:CARESActPaycheckProtectionProgramMember2020-12-310001069157us-gaap:CommercialPortfolioSegmentMemberewbc:CommercialAndIndustrialLoanMemberus-gaap:PassMember2021-09-300001069157us-gaap:CommercialPortfolioSegmentMemberewbc:CommercialAndIndustrialLoanMemberewbc:CriticizedAccrualMember2021-09-300001069157us-gaap:CommercialPortfolioSegmentMemberewbc:CommercialAndIndustrialLoanMemberewbc:CriticizedNonaccrualMember2021-09-300001069157us-gaap:CommercialRealEstateMemberus-gaap:CommercialPortfolioSegmentMemberus-gaap:PassMember2021-09-300001069157us-gaap:CommercialRealEstateMemberus-gaap:CommercialPortfolioSegmentMemberewbc:CriticizedAccrualMember2021-09-300001069157us-gaap:CommercialRealEstateMemberus-gaap:CommercialPortfolioSegmentMemberewbc:CriticizedNonaccrualMember2021-09-300001069157us-gaap:CommercialPortfolioSegmentMemberus-gaap:PassMemberus-gaap:RealEstateLoanMembersrt:MultifamilyMember2021-09-300001069157us-gaap:CommercialPortfolioSegmentMemberewbc:CriticizedAccrualMemberus-gaap:RealEstateLoanMembersrt:MultifamilyMember2021-09-300001069157us-gaap:CommercialPortfolioSegmentMemberewbc:CriticizedNonaccrualMemberus-gaap:RealEstateLoanMembersrt:MultifamilyMember2021-09-300001069157us-gaap:CommercialPortfolioSegmentMemberus-gaap:PassMemberewbc:ConstructionAndLandLoanMember2021-09-300001069157us-gaap:CommercialPortfolioSegmentMemberewbc:ConstructionAndLandLoanMemberewbc:CriticizedAccrualMember2021-09-300001069157us-gaap:CommercialPortfolioSegmentMemberewbc:ConstructionAndLandLoanMemberewbc:CriticizedNonaccrualMember2021-09-300001069157us-gaap:ConsumerPortfolioSegmentMembersrt:SingleFamilyMemberus-gaap:PassMemberus-gaap:RealEstateLoanMember2021-09-300001069157us-gaap:ConsumerPortfolioSegmentMembersrt:SingleFamilyMemberewbc:CriticizedAccrualMemberus-gaap:RealEstateLoanMember2021-09-300001069157us-gaap:ConsumerPortfolioSegmentMembersrt:SingleFamilyMemberewbc:CriticizedNonaccrualMemberus-gaap:RealEstateLoanMember2021-09-300001069157us-gaap:ConsumerPortfolioSegmentMemberus-gaap:PassMemberus-gaap:HomeEquityMember2021-09-300001069157us-gaap:ConsumerPortfolioSegmentMemberus-gaap:HomeEquityMemberewbc:CriticizedAccrualMember2021-09-300001069157us-gaap:ConsumerPortfolioSegmentMemberus-gaap:HomeEquityMemberewbc:CriticizedNonaccrualMember2021-09-300001069157us-gaap:ConsumerPortfolioSegmentMemberewbc:OtherConsumerMemberus-gaap:PassMember2021-09-300001069157us-gaap:ConsumerPortfolioSegmentMemberewbc:OtherConsumerMemberewbc:CriticizedAccrualMember2021-09-300001069157us-gaap:ConsumerPortfolioSegmentMemberewbc:OtherConsumerMemberewbc:CriticizedNonaccrualMember2021-09-300001069157us-gaap:CommercialPortfolioSegmentMemberewbc:CommercialAndIndustrialLoanMemberus-gaap:PassMember2020-12-310001069157us-gaap:CommercialPortfolioSegmentMemberewbc:CommercialAndIndustrialLoanMemberewbc:CriticizedAccrualMember2020-12-310001069157us-gaap:CommercialPortfolioSegmentMemberewbc:CommercialAndIndustrialLoanMemberewbc:CriticizedNonaccrualMember2020-12-310001069157us-gaap:CommercialRealEstateMemberus-gaap:CommercialPortfolioSegmentMemberus-gaap:PassMember2020-12-310001069157us-gaap:CommercialRealEstateMemberus-gaap:CommercialPortfolioSegmentMemberewbc:CriticizedAccrualMember2020-12-310001069157us-gaap:CommercialRealEstateMemberus-gaap:CommercialPortfolioSegmentMemberewbc:CriticizedNonaccrualMember2020-12-310001069157us-gaap:CommercialPortfolioSegmentMemberus-gaap:PassMemberus-gaap:RealEstateLoanMembersrt:MultifamilyMember2020-12-310001069157us-gaap:CommercialPortfolioSegmentMemberewbc:CriticizedAccrualMemberus-gaap:RealEstateLoanMembersrt:MultifamilyMember2020-12-310001069157us-gaap:CommercialPortfolioSegmentMemberewbc:CriticizedNonaccrualMemberus-gaap:RealEstateLoanMembersrt:MultifamilyMember2020-12-310001069157us-gaap:CommercialPortfolioSegmentMemberus-gaap:PassMemberewbc:ConstructionAndLandLoanMember2020-12-310001069157us-gaap:CommercialPortfolioSegmentMemberewbc:ConstructionAndLandLoanMemberewbc:CriticizedAccrualMember2020-12-310001069157us-gaap:CommercialPortfolioSegmentMemberewbc:ConstructionAndLandLoanMemberewbc:CriticizedNonaccrualMember2020-12-310001069157us-gaap:ConsumerPortfolioSegmentMembersrt:SingleFamilyMemberus-gaap:PassMemberus-gaap:RealEstateLoanMember2020-12-310001069157us-gaap:ConsumerPortfolioSegmentMembersrt:SingleFamilyMemberewbc:CriticizedAccrualMemberus-gaap:RealEstateLoanMember2020-12-310001069157us-gaap:ConsumerPortfolioSegmentMembersrt:SingleFamilyMemberewbc:CriticizedNonaccrualMemberus-gaap:RealEstateLoanMember2020-12-310001069157us-gaap:ConsumerPortfolioSegmentMemberus-gaap:PassMemberus-gaap:HomeEquityMember2020-12-310001069157us-gaap:ConsumerPortfolioSegmentMemberus-gaap:HomeEquityMemberewbc:CriticizedAccrualMember2020-12-310001069157us-gaap:ConsumerPortfolioSegmentMemberus-gaap:HomeEquityMemberewbc:CriticizedNonaccrualMember2020-12-310001069157us-gaap:ConsumerPortfolioSegmentMemberewbc:OtherConsumerMemberus-gaap:PassMember2020-12-310001069157us-gaap:ConsumerPortfolioSegmentMemberewbc:OtherConsumerMemberewbc:CriticizedAccrualMember2020-12-310001069157us-gaap:ConsumerPortfolioSegmentMemberewbc:OtherConsumerMemberewbc:CriticizedNonaccrualMember2020-12-310001069157us-gaap:FederalHousingAdministrationLoanMember2021-09-300001069157us-gaap:FederalHousingAdministrationLoanMember2020-12-310001069157us-gaap:HomeEquityMember2021-07-012021-09-300001069157us-gaap:HomeEquityMember2021-01-012021-09-300001069157us-gaap:HomeEquityMember2020-07-012020-09-300001069157us-gaap:HomeEquityMember2020-01-012020-09-30ewbc:loan0001069157ewbc:CommercialAndIndustrialLoanMember2021-07-012021-09-300001069157ewbc:CommercialAndIndustrialLoanMember2021-01-012021-09-300001069157ewbc:CommercialAndIndustrialLoanMember2020-01-012020-09-300001069157ewbc:CommercialAndIndustrialLoanMember2020-07-012020-09-300001069157us-gaap:CommercialRealEstateMember2021-07-012021-09-300001069157us-gaap:CommercialRealEstateMember2021-01-012021-09-300001069157us-gaap:CommercialRealEstateMember2020-07-012020-09-300001069157us-gaap:CommercialRealEstateMember2020-01-012020-09-300001069157us-gaap:CommercialPortfolioSegmentMemberewbc:CommercialAndIndustrialLoanMemberus-gaap:FinancialAssetNotPastDueMember2021-09-300001069157us-gaap:CommercialPortfolioSegmentMemberewbc:CommercialAndIndustrialLoanMemberus-gaap:FinancingReceivables30To59DaysPastDueMember2021-09-300001069157us-gaap:CommercialPortfolioSegmentMemberewbc:CommercialAndIndustrialLoanMemberus-gaap:FinancingReceivables60To89DaysPastDueMember2021-09-300001069157us-gaap:CommercialPortfolioSegmentMemberewbc:CommercialAndIndustrialLoanMemberus-gaap:FinancialAssetPastDueMember2021-09-300001069157us-gaap:CommercialRealEstateMemberus-gaap:CommercialPortfolioSegmentMemberus-gaap:FinancialAssetNotPastDueMember2021-09-300001069157us-gaap:CommercialRealEstateMemberus-gaap:CommercialPortfolioSegmentMemberus-gaap:FinancingReceivables30To59DaysPastDueMember2021-09-300001069157us-gaap:CommercialRealEstateMemberus-gaap:CommercialPortfolioSegmentMemberus-gaap:FinancingReceivables60To89DaysPastDueMember2021-09-300001069157us-gaap:CommercialRealEstateMemberus-gaap:CommercialPortfolioSegmentMemberus-gaap:FinancialAssetPastDueMember2021-09-300001069157us-gaap:CommercialPortfolioSegmentMemberus-gaap:FinancialAssetNotPastDueMemberus-gaap:RealEstateLoanMembersrt:MultifamilyMember2021-09-300001069157us-gaap:CommercialPortfolioSegmentMemberus-gaap:FinancingReceivables30To59DaysPastDueMemberus-gaap:RealEstateLoanMembersrt:MultifamilyMember2021-09-300001069157us-gaap:CommercialPortfolioSegmentMemberus-gaap:FinancingReceivables60To89DaysPastDueMemberus-gaap:RealEstateLoanMembersrt:MultifamilyMember2021-09-300001069157us-gaap:CommercialPortfolioSegmentMemberus-gaap:FinancialAssetPastDueMemberus-gaap:RealEstateLoanMembersrt:MultifamilyMember2021-09-300001069157us-gaap:CommercialPortfolioSegmentMemberus-gaap:FinancialAssetNotPastDueMemberewbc:ConstructionAndLandLoanMember2021-09-300001069157us-gaap:CommercialPortfolioSegmentMemberus-gaap:FinancingReceivables30To59DaysPastDueMemberewbc:ConstructionAndLandLoanMember2021-09-300001069157us-gaap:CommercialPortfolioSegmentMemberus-gaap:FinancingReceivables60To89DaysPastDueMemberewbc:ConstructionAndLandLoanMember2021-09-300001069157us-gaap:CommercialPortfolioSegmentMemberus-gaap:FinancialAssetPastDueMemberewbc:ConstructionAndLandLoanMember2021-09-300001069157us-gaap:CommercialPortfolioSegmentMemberus-gaap:FinancialAssetNotPastDueMemberewbc:TotalCommercialRealEstateMember2021-09-300001069157us-gaap:CommercialPortfolioSegmentMemberus-gaap:FinancingReceivables30To59DaysPastDueMemberewbc:TotalCommercialRealEstateMember2021-09-300001069157us-gaap:CommercialPortfolioSegmentMemberus-gaap:FinancingReceivables60To89DaysPastDueMemberewbc:TotalCommercialRealEstateMember2021-09-300001069157us-gaap:CommercialPortfolioSegmentMemberewbc:TotalCommercialRealEstateMemberus-gaap:FinancialAssetPastDueMember2021-09-300001069157us-gaap:CommercialPortfolioSegmentMemberus-gaap:FinancialAssetNotPastDueMember2021-09-300001069157us-gaap:CommercialPortfolioSegmentMemberus-gaap:FinancingReceivables30To59DaysPastDueMember2021-09-300001069157us-gaap:CommercialPortfolioSegmentMemberus-gaap:FinancingReceivables60To89DaysPastDueMember2021-09-300001069157us-gaap:CommercialPortfolioSegmentMemberus-gaap:FinancialAssetPastDueMember2021-09-300001069157us-gaap:ConsumerPortfolioSegmentMemberus-gaap:FinancialAssetNotPastDueMembersrt:SingleFamilyMemberus-gaap:RealEstateLoanMember2021-09-300001069157us-gaap:ConsumerPortfolioSegmentMemberus-gaap:FinancingReceivables30To59DaysPastDueMembersrt:SingleFamilyMemberus-gaap:RealEstateLoanMember2021-09-300001069157us-gaap:ConsumerPortfolioSegmentMembersrt:SingleFamilyMemberus-gaap:FinancingReceivables60To89DaysPastDueMemberus-gaap:RealEstateLoanMember2021-09-300001069157us-gaap:ConsumerPortfolioSegmentMembersrt:SingleFamilyMemberus-gaap:FinancialAssetPastDueMemberus-gaap:RealEstateLoanMember2021-09-300001069157us-gaap:ConsumerPortfolioSegmentMemberus-gaap:FinancialAssetNotPastDueMemberus-gaap:HomeEquityMember2021-09-300001069157us-gaap:ConsumerPortfolioSegmentMemberus-gaap:FinancingReceivables30To59DaysPastDueMemberus-gaap:HomeEquityMember2021-09-300001069157us-gaap:ConsumerPortfolioSegmentMemberus-gaap:FinancingReceivables60To89DaysPastDueMemberus-gaap:HomeEquityMember2021-09-300001069157us-gaap:ConsumerPortfolioSegmentMemberus-gaap:HomeEquityMemberus-gaap:FinancialAssetPastDueMember2021-09-300001069157us-gaap:ConsumerPortfolioSegmentMemberewbc:TotalResidentialMortgageMemberus-gaap:FinancialAssetNotPastDueMember2021-09-300001069157us-gaap:ConsumerPortfolioSegmentMemberewbc:TotalResidentialMortgageMemberus-gaap:FinancingReceivables30To59DaysPastDueMember2021-09-300001069157us-gaap:ConsumerPortfolioSegmentMemberewbc:TotalResidentialMortgageMemberus-gaap:FinancingReceivables60To89DaysPastDueMember2021-09-300001069157us-gaap:ConsumerPortfolioSegmentMemberewbc:TotalResidentialMortgageMemberus-gaap:FinancialAssetPastDueMember2021-09-300001069157us-gaap:ConsumerPortfolioSegmentMemberus-gaap:FinancialAssetNotPastDueMemberewbc:OtherConsumerMember2021-09-300001069157us-gaap:ConsumerPortfolioSegmentMemberus-gaap:FinancingReceivables30To59DaysPastDueMemberewbc:OtherConsumerMember2021-09-300001069157us-gaap:ConsumerPortfolioSegmentMemberewbc:OtherConsumerMemberus-gaap:FinancingReceivables60To89DaysPastDueMember2021-09-300001069157us-gaap:ConsumerPortfolioSegmentMemberewbc:OtherConsumerMemberus-gaap:FinancialAssetPastDueMember2021-09-300001069157us-gaap:ConsumerPortfolioSegmentMemberus-gaap:FinancialAssetNotPastDueMember2021-09-300001069157us-gaap:ConsumerPortfolioSegmentMemberus-gaap:FinancingReceivables30To59DaysPastDueMember2021-09-300001069157us-gaap:ConsumerPortfolioSegmentMemberus-gaap:FinancingReceivables60To89DaysPastDueMember2021-09-300001069157us-gaap:ConsumerPortfolioSegmentMemberus-gaap:FinancialAssetPastDueMember2021-09-300001069157us-gaap:FinancialAssetNotPastDueMember2021-09-300001069157us-gaap:FinancingReceivables30To59DaysPastDueMember2021-09-300001069157us-gaap:FinancingReceivables60To89DaysPastDueMember2021-09-300001069157us-gaap:FinancialAssetPastDueMember2021-09-300001069157us-gaap:CommercialPortfolioSegmentMemberewbc:CommercialAndIndustrialLoanMemberus-gaap:FinancialAssetNotPastDueMember2020-12-310001069157us-gaap:CommercialPortfolioSegmentMemberewbc:CommercialAndIndustrialLoanMemberus-gaap:FinancingReceivables30To59DaysPastDueMember2020-12-310001069157us-gaap:CommercialPortfolioSegmentMemberewbc:CommercialAndIndustrialLoanMemberus-gaap:FinancingReceivables60To89DaysPastDueMember2020-12-310001069157us-gaap:CommercialPortfolioSegmentMemberewbc:CommercialAndIndustrialLoanMemberus-gaap:FinancialAssetPastDueMember2020-12-310001069157us-gaap:CommercialRealEstateMemberus-gaap:CommercialPortfolioSegmentMemberus-gaap:FinancialAssetNotPastDueMember2020-12-310001069157us-gaap:CommercialRealEstateMemberus-gaap:CommercialPortfolioSegmentMemberus-gaap:FinancingReceivables30To59DaysPastDueMember2020-12-310001069157us-gaap:CommercialRealEstateMemberus-gaap:CommercialPortfolioSegmentMemberus-gaap:FinancingReceivables60To89DaysPastDueMember2020-12-310001069157us-gaap:CommercialRealEstateMemberus-gaap:CommercialPortfolioSegmentMemberus-gaap:FinancialAssetPastDueMember2020-12-310001069157us-gaap:CommercialPortfolioSegmentMemberus-gaap:FinancialAssetNotPastDueMemberus-gaap:RealEstateLoanMembersrt:MultifamilyMember2020-12-310001069157us-gaap:CommercialPortfolioSegmentMemberus-gaap:FinancingReceivables30To59DaysPastDueMemberus-gaap:RealEstateLoanMembersrt:MultifamilyMember2020-12-310001069157us-gaap:CommercialPortfolioSegmentMemberus-gaap:FinancingReceivables60To89DaysPastDueMemberus-gaap:RealEstateLoanMembersrt:MultifamilyMember2020-12-310001069157us-gaap:CommercialPortfolioSegmentMemberus-gaap:FinancialAssetPastDueMemberus-gaap:RealEstateLoanMembersrt:MultifamilyMember2020-12-310001069157us-gaap:CommercialPortfolioSegmentMemberus-gaap:FinancialAssetNotPastDueMemberewbc:ConstructionAndLandLoanMember2020-12-310001069157us-gaap:CommercialPortfolioSegmentMemberus-gaap:FinancingReceivables30To59DaysPastDueMemberewbc:ConstructionAndLandLoanMember2020-12-310001069157us-gaap:CommercialPortfolioSegmentMemberus-gaap:FinancingReceivables60To89DaysPastDueMemberewbc:ConstructionAndLandLoanMember2020-12-310001069157us-gaap:CommercialPortfolioSegmentMemberus-gaap:FinancialAssetPastDueMemberewbc:ConstructionAndLandLoanMember2020-12-310001069157us-gaap:CommercialPortfolioSegmentMemberus-gaap:FinancialAssetNotPastDueMemberewbc:TotalCommercialRealEstateMember2020-12-310001069157us-gaap:CommercialPortfolioSegmentMemberus-gaap:FinancingReceivables30To59DaysPastDueMemberewbc:TotalCommercialRealEstateMember2020-12-310001069157us-gaap:CommercialPortfolioSegmentMemberus-gaap:FinancingReceivables60To89DaysPastDueMemberewbc:TotalCommercialRealEstateMember2020-12-310001069157us-gaap:CommercialPortfolioSegmentMemberewbc:TotalCommercialRealEstateMemberus-gaap:FinancialAssetPastDueMember2020-12-310001069157us-gaap:CommercialPortfolioSegmentMemberus-gaap:FinancialAssetNotPastDueMember2020-12-310001069157us-gaap:CommercialPortfolioSegmentMemberus-gaap:FinancingReceivables30To59DaysPastDueMember2020-12-310001069157us-gaap:CommercialPortfolioSegmentMemberus-gaap:FinancingReceivables60To89DaysPastDueMember2020-12-310001069157us-gaap:CommercialPortfolioSegmentMemberus-gaap:FinancialAssetPastDueMember2020-12-310001069157us-gaap:ConsumerPortfolioSegmentMemberus-gaap:FinancialAssetNotPastDueMembersrt:SingleFamilyMemberus-gaap:RealEstateLoanMember2020-12-310001069157us-gaap:ConsumerPortfolioSegmentMemberus-gaap:FinancingReceivables30To59DaysPastDueMembersrt:SingleFamilyMemberus-gaap:RealEstateLoanMember2020-12-310001069157us-gaap:ConsumerPortfolioSegmentMembersrt:SingleFamilyMemberus-gaap:FinancingReceivables60To89DaysPastDueMemberus-gaap:RealEstateLoanMember2020-12-310001069157us-gaap:ConsumerPortfolioSegmentMembersrt:SingleFamilyMemberus-gaap:FinancialAssetPastDueMemberus-gaap:RealEstateLoanMember2020-12-310001069157us-gaap:ConsumerPortfolioSegmentMemberus-gaap:FinancialAssetNotPastDueMemberus-gaap:HomeEquityMember2020-12-310001069157us-gaap:ConsumerPortfolioSegmentMemberus-gaap:FinancingReceivables30To59DaysPastDueMemberus-gaap:HomeEquityMember2020-12-310001069157us-gaap:ConsumerPortfolioSegmentMemberus-gaap:FinancingReceivables60To89DaysPastDueMemberus-gaap:HomeEquityMember2020-12-310001069157us-gaap:ConsumerPortfolioSegmentMemberus-gaap:HomeEquityMemberus-gaap:FinancialAssetPastDueMember2020-12-310001069157us-gaap:ConsumerPortfolioSegmentMemberewbc:TotalResidentialMortgageMemberus-gaap:FinancialAssetNotPastDueMember2020-12-310001069157us-gaap:ConsumerPortfolioSegmentMemberewbc:TotalResidentialMortgageMemberus-gaap:FinancingReceivables30To59DaysPastDueMember2020-12-310001069157us-gaap:ConsumerPortfolioSegmentMemberewbc:TotalResidentialMortgageMemberus-gaap:FinancingReceivables60To89DaysPastDueMember2020-12-310001069157us-gaap:ConsumerPortfolioSegmentMemberewbc:TotalResidentialMortgageMemberus-gaap:FinancialAssetPastDueMember2020-12-310001069157us-gaap:ConsumerPortfolioSegmentMemberus-gaap:FinancialAssetNotPastDueMemberewbc:OtherConsumerMember2020-12-310001069157us-gaap:ConsumerPortfolioSegmentMemberus-gaap:FinancingReceivables30To59DaysPastDueMemberewbc:OtherConsumerMember2020-12-310001069157us-gaap:ConsumerPortfolioSegmentMemberewbc:OtherConsumerMemberus-gaap:FinancingReceivables60To89DaysPastDueMember2020-12-310001069157us-gaap:ConsumerPortfolioSegmentMemberewbc:OtherConsumerMemberus-gaap:FinancialAssetPastDueMember2020-12-310001069157us-gaap:ConsumerPortfolioSegmentMemberus-gaap:FinancialAssetNotPastDueMember2020-12-310001069157us-gaap:ConsumerPortfolioSegmentMemberus-gaap:FinancingReceivables30To59DaysPastDueMember2020-12-310001069157us-gaap:ConsumerPortfolioSegmentMemberus-gaap:FinancingReceivables60To89DaysPastDueMember2020-12-310001069157us-gaap:ConsumerPortfolioSegmentMemberus-gaap:FinancialAssetPastDueMember2020-12-310001069157us-gaap:FinancialAssetNotPastDueMember2020-12-310001069157us-gaap:FinancingReceivables30To59DaysPastDueMember2020-12-310001069157us-gaap:FinancingReceivables60To89DaysPastDueMember2020-12-310001069157us-gaap:FinancialAssetPastDueMember2020-12-310001069157us-gaap:ResidentialRealEstateMember2021-09-300001069157us-gaap:ResidentialRealEstateMember2020-12-310001069157us-gaap:CommercialPortfolioSegmentMemberewbc:CommercialAndIndustrialLoanMember2021-07-012021-09-300001069157us-gaap:CommercialPortfolioSegmentMemberewbc:CommercialAndIndustrialLoanMember2020-07-012020-09-300001069157us-gaap:CommercialRealEstateMemberus-gaap:CommercialPortfolioSegmentMember2021-07-012021-09-300001069157us-gaap:CommercialRealEstateMemberus-gaap:CommercialPortfolioSegmentMember2020-07-012020-09-300001069157us-gaap:CommercialPortfolioSegmentMemberus-gaap:RealEstateLoanMembersrt:MultifamilyMember2021-07-012021-09-300001069157us-gaap:CommercialPortfolioSegmentMemberus-gaap:RealEstateLoanMembersrt:MultifamilyMember2020-07-012020-09-300001069157us-gaap:CommercialPortfolioSegmentMemberewbc:TotalCommercialRealEstateMember2021-07-012021-09-300001069157us-gaap:CommercialPortfolioSegmentMemberewbc:TotalCommercialRealEstateMember2020-07-012020-09-300001069157us-gaap:CommercialPortfolioSegmentMember2021-07-012021-09-300001069157us-gaap:CommercialPortfolioSegmentMember2020-07-012020-09-300001069157us-gaap:CommercialPortfolioSegmentMemberewbc:CommercialAndIndustrialLoanMember2021-01-012021-09-300001069157us-gaap:CommercialPortfolioSegmentMemberewbc:CommercialAndIndustrialLoanMember2020-01-012020-09-300001069157us-gaap:CommercialRealEstateMemberus-gaap:CommercialPortfolioSegmentMember2021-01-012021-09-300001069157us-gaap:CommercialRealEstateMemberus-gaap:CommercialPortfolioSegmentMember2020-01-012020-09-300001069157us-gaap:CommercialPortfolioSegmentMemberus-gaap:RealEstateLoanMembersrt:MultifamilyMember2021-01-012021-09-300001069157us-gaap:CommercialPortfolioSegmentMemberus-gaap:RealEstateLoanMembersrt:MultifamilyMember2020-01-012020-09-300001069157us-gaap:CommercialPortfolioSegmentMemberewbc:TotalCommercialRealEstateMember2021-01-012021-09-300001069157us-gaap:CommercialPortfolioSegmentMemberewbc:TotalCommercialRealEstateMember2020-01-012020-09-300001069157us-gaap:CommercialPortfolioSegmentMember2021-01-012021-09-300001069157us-gaap:CommercialPortfolioSegmentMember2020-01-012020-09-300001069157us-gaap:CommercialPortfolioSegmentMemberewbc:CommercialAndIndustrialLoanMemberewbc:PrincipalForbearancePaymentsTermExtensionsPrincipalDefermentsMember2021-07-012021-09-300001069157ewbc:PrincipalAndInterestDefermentsOrReductionsMemberus-gaap:CommercialPortfolioSegmentMemberewbc:CommercialAndIndustrialLoanMember2021-07-012021-09-300001069157us-gaap:CommercialPortfolioSegmentMemberewbc:CommercialAndIndustrialLoanMemberewbc:InterestDefermentsMember2021-07-012021-09-300001069157us-gaap:CommercialPortfolioSegmentMemberewbc:CommercialAndIndustrialLoanMemberus-gaap:ContractualInterestRateReductionMember2021-07-012021-09-300001069157us-gaap:CommercialPortfolioSegmentMemberewbc:CommercialAndIndustrialLoanMemberewbc:PrincipalForbearancePaymentsTermExtensionsPrincipalDefermentsMember2020-07-012020-09-300001069157ewbc:PrincipalAndInterestDefermentsOrReductionsMemberus-gaap:CommercialPortfolioSegmentMemberewbc:CommercialAndIndustrialLoanMember2020-07-012020-09-300001069157us-gaap:CommercialPortfolioSegmentMemberewbc:CommercialAndIndustrialLoanMemberewbc:InterestDefermentsMember2020-07-012020-09-300001069157us-gaap:CommercialPortfolioSegmentMemberewbc:CommercialAndIndustrialLoanMemberus-gaap:ContractualInterestRateReductionMember2020-07-012020-09-300001069157us-gaap:CommercialRealEstateMemberus-gaap:CommercialPortfolioSegmentMemberewbc:PrincipalForbearancePaymentsTermExtensionsPrincipalDefermentsMember2021-07-012021-09-300001069157us-gaap:CommercialRealEstateMemberewbc:PrincipalAndInterestDefermentsOrReductionsMemberus-gaap:CommercialPortfolioSegmentMember2021-07-012021-09-300001069157us-gaap:CommercialRealEstateMemberus-gaap:CommercialPortfolioSegmentMemberewbc:InterestDefermentsMember2021-07-012021-09-300001069157us-gaap:CommercialRealEstateMemberus-gaap:CommercialPortfolioSegmentMemberus-gaap:ContractualInterestRateReductionMember2021-07-012021-09-300001069157us-gaap:CommercialRealEstateMemberus-gaap:CommercialPortfolioSegmentMemberewbc:PrincipalForbearancePaymentsTermExtensionsPrincipalDefermentsMember2020-07-012020-09-300001069157us-gaap:CommercialRealEstateMemberewbc:PrincipalAndInterestDefermentsOrReductionsMemberus-gaap:CommercialPortfolioSegmentMember2020-07-012020-09-300001069157us-gaap:CommercialRealEstateMemberus-gaap:CommercialPortfolioSegmentMemberewbc:InterestDefermentsMember2020-07-012020-09-300001069157us-gaap:CommercialRealEstateMemberus-gaap:CommercialPortfolioSegmentMemberus-gaap:ContractualInterestRateReductionMember2020-07-012020-09-300001069157us-gaap:CommercialPortfolioSegmentMemberewbc:PrincipalForbearancePaymentsTermExtensionsPrincipalDefermentsMemberus-gaap:RealEstateLoanMembersrt:MultifamilyMember2021-07-012021-09-300001069157ewbc:PrincipalAndInterestDefermentsOrReductionsMemberus-gaap:CommercialPortfolioSegmentMemberus-gaap:RealEstateLoanMembersrt:MultifamilyMember2021-07-012021-09-300001069157us-gaap:CommercialPortfolioSegmentMemberewbc:InterestDefermentsMemberus-gaap:RealEstateLoanMembersrt:MultifamilyMember2021-07-012021-09-300001069157us-gaap:CommercialPortfolioSegmentMemberus-gaap:ContractualInterestRateReductionMemberus-gaap:RealEstateLoanMembersrt:MultifamilyMember2021-07-012021-09-300001069157us-gaap:CommercialPortfolioSegmentMemberewbc:PrincipalForbearancePaymentsTermExtensionsPrincipalDefermentsMemberus-gaap:RealEstateLoanMembersrt:MultifamilyMember2020-07-012020-09-300001069157ewbc:PrincipalAndInterestDefermentsOrReductionsMemberus-gaap:CommercialPortfolioSegmentMemberus-gaap:RealEstateLoanMembersrt:MultifamilyMember2020-07-012020-09-300001069157us-gaap:CommercialPortfolioSegmentMemberewbc:InterestDefermentsMemberus-gaap:RealEstateLoanMembersrt:MultifamilyMember2020-07-012020-09-300001069157us-gaap:CommercialPortfolioSegmentMemberus-gaap:ContractualInterestRateReductionMemberus-gaap:RealEstateLoanMembersrt:MultifamilyMember2020-07-012020-09-300001069157us-gaap:CommercialPortfolioSegmentMemberewbc:PrincipalForbearancePaymentsTermExtensionsPrincipalDefermentsMemberewbc:TotalCommercialRealEstateMember2021-07-012021-09-300001069157ewbc:PrincipalAndInterestDefermentsOrReductionsMemberus-gaap:CommercialPortfolioSegmentMemberewbc:TotalCommercialRealEstateMember2021-07-012021-09-300001069157us-gaap:CommercialPortfolioSegmentMemberewbc:InterestDefermentsMemberewbc:TotalCommercialRealEstateMember2021-07-012021-09-300001069157us-gaap:CommercialPortfolioSegmentMemberus-gaap:ContractualInterestRateReductionMemberewbc:TotalCommercialRealEstateMember2021-07-012021-09-300001069157us-gaap:CommercialPortfolioSegmentMemberewbc:PrincipalForbearancePaymentsTermExtensionsPrincipalDefermentsMemberewbc:TotalCommercialRealEstateMember2020-07-012020-09-300001069157ewbc:PrincipalAndInterestDefermentsOrReductionsMemberus-gaap:CommercialPortfolioSegmentMemberewbc:TotalCommercialRealEstateMember2020-07-012020-09-300001069157us-gaap:CommercialPortfolioSegmentMemberewbc:InterestDefermentsMemberewbc:TotalCommercialRealEstateMember2020-07-012020-09-300001069157us-gaap:CommercialPortfolioSegmentMemberus-gaap:ContractualInterestRateReductionMemberewbc:TotalCommercialRealEstateMember2020-07-012020-09-300001069157us-gaap:CommercialPortfolioSegmentMemberewbc:PrincipalForbearancePaymentsTermExtensionsPrincipalDefermentsMember2021-07-012021-09-300001069157ewbc:PrincipalAndInterestDefermentsOrReductionsMemberus-gaap:CommercialPortfolioSegmentMember2021-07-012021-09-300001069157us-gaap:CommercialPortfolioSegmentMemberewbc:InterestDefermentsMember2021-07-012021-09-300001069157us-gaap:CommercialPortfolioSegmentMemberus-gaap:ContractualInterestRateReductionMember2021-07-012021-09-300001069157us-gaap:CommercialPortfolioSegmentMemberewbc:PrincipalForbearancePaymentsTermExtensionsPrincipalDefermentsMember2020-07-012020-09-300001069157ewbc:PrincipalAndInterestDefermentsOrReductionsMemberus-gaap:CommercialPortfolioSegmentMember2020-07-012020-09-300001069157us-gaap:CommercialPortfolioSegmentMemberewbc:InterestDefermentsMember2020-07-012020-09-300001069157us-gaap:CommercialPortfolioSegmentMemberus-gaap:ContractualInterestRateReductionMember2020-07-012020-09-300001069157ewbc:PrincipalForbearancePaymentsTermExtensionsPrincipalDefermentsMember2021-07-012021-09-300001069157ewbc:PrincipalAndInterestDefermentsOrReductionsMember2021-07-012021-09-300001069157ewbc:InterestDefermentsMember2021-07-012021-09-300001069157us-gaap:ContractualInterestRateReductionMember2021-07-012021-09-300001069157ewbc:PrincipalForbearancePaymentsTermExtensionsPrincipalDefermentsMember2020-07-012020-09-300001069157ewbc:PrincipalAndInterestDefermentsOrReductionsMember2020-07-012020-09-300001069157ewbc:InterestDefermentsMember2020-07-012020-09-300001069157us-gaap:ContractualInterestRateReductionMember2020-07-012020-09-300001069157us-gaap:CommercialPortfolioSegmentMemberewbc:CommercialAndIndustrialLoanMemberewbc:PrincipalForbearancePaymentsTermExtensionsPrincipalDefermentsMember2021-01-012021-09-300001069157ewbc:PrincipalAndInterestDefermentsOrReductionsMemberus-gaap:CommercialPortfolioSegmentMemberewbc:CommercialAndIndustrialLoanMember2021-01-012021-09-300001069157us-gaap:CommercialPortfolioSegmentMemberewbc:CommercialAndIndustrialLoanMemberewbc:InterestDefermentsMember2021-01-012021-09-300001069157us-gaap:CommercialPortfolioSegmentMemberewbc:CommercialAndIndustrialLoanMemberus-gaap:ContractualInterestRateReductionMember2021-01-012021-09-300001069157us-gaap:CommercialPortfolioSegmentMemberewbc:CommercialAndIndustrialLoanMemberewbc:PrincipalForbearancePaymentsTermExtensionsPrincipalDefermentsMember2020-01-012020-09-300001069157ewbc:PrincipalAndInterestDefermentsOrReductionsMemberus-gaap:CommercialPortfolioSegmentMemberewbc:CommercialAndIndustrialLoanMember2020-01-012020-09-300001069157us-gaap:CommercialPortfolioSegmentMemberewbc:CommercialAndIndustrialLoanMemberewbc:InterestDefermentsMember2020-01-012020-09-300001069157us-gaap:CommercialPortfolioSegmentMemberewbc:CommercialAndIndustrialLoanMemberus-gaap:ContractualInterestRateReductionMember2020-01-012020-09-300001069157us-gaap:CommercialRealEstateMemberus-gaap:CommercialPortfolioSegmentMemberewbc:PrincipalForbearancePaymentsTermExtensionsPrincipalDefermentsMember2021-01-012021-09-300001069157us-gaap:CommercialRealEstateMemberewbc:PrincipalAndInterestDefermentsOrReductionsMemberus-gaap:CommercialPortfolioSegmentMember2021-01-012021-09-300001069157us-gaap:CommercialRealEstateMemberus-gaap:CommercialPortfolioSegmentMemberewbc:InterestDefermentsMember2021-01-012021-09-300001069157us-gaap:CommercialRealEstateMemberus-gaap:CommercialPortfolioSegmentMemberus-gaap:ContractualInterestRateReductionMember2021-01-012021-09-300001069157us-gaap:CommercialRealEstateMemberus-gaap:CommercialPortfolioSegmentMemberewbc:PrincipalForbearancePaymentsTermExtensionsPrincipalDefermentsMember2020-01-012020-09-300001069157us-gaap:CommercialRealEstateMemberewbc:PrincipalAndInterestDefermentsOrReductionsMemberus-gaap:CommercialPortfolioSegmentMember2020-01-012020-09-300001069157us-gaap:CommercialRealEstateMemberus-gaap:CommercialPortfolioSegmentMemberewbc:InterestDefermentsMember2020-01-012020-09-300001069157us-gaap:CommercialRealEstateMemberus-gaap:CommercialPortfolioSegmentMemberus-gaap:ContractualInterestRateReductionMember2020-01-012020-09-300001069157us-gaap:CommercialPortfolioSegmentMemberewbc:PrincipalForbearancePaymentsTermExtensionsPrincipalDefermentsMemberus-gaap:RealEstateLoanMembersrt:MultifamilyMember2021-01-012021-09-300001069157ewbc:PrincipalAndInterestDefermentsOrReductionsMemberus-gaap:CommercialPortfolioSegmentMemberus-gaap:RealEstateLoanMembersrt:MultifamilyMember2021-01-012021-09-300001069157us-gaap:CommercialPortfolioSegmentMemberewbc:InterestDefermentsMemberus-gaap:RealEstateLoanMembersrt:MultifamilyMember2021-01-012021-09-300001069157us-gaap:CommercialPortfolioSegmentMemberus-gaap:ContractualInterestRateReductionMemberus-gaap:RealEstateLoanMembersrt:MultifamilyMember2021-01-012021-09-300001069157us-gaap:CommercialPortfolioSegmentMemberewbc:PrincipalForbearancePaymentsTermExtensionsPrincipalDefermentsMemberus-gaap:RealEstateLoanMembersrt:MultifamilyMember2020-01-012020-09-300001069157ewbc:PrincipalAndInterestDefermentsOrReductionsMemberus-gaap:CommercialPortfolioSegmentMemberus-gaap:RealEstateLoanMembersrt:MultifamilyMember2020-01-012020-09-300001069157us-gaap:CommercialPortfolioSegmentMemberewbc:InterestDefermentsMemberus-gaap:RealEstateLoanMembersrt:MultifamilyMember2020-01-012020-09-300001069157us-gaap:CommercialPortfolioSegmentMemberus-gaap:ContractualInterestRateReductionMemberus-gaap:RealEstateLoanMembersrt:MultifamilyMember2020-01-012020-09-300001069157us-gaap:CommercialPortfolioSegmentMemberewbc:PrincipalForbearancePaymentsTermExtensionsPrincipalDefermentsMemberewbc:TotalCommercialRealEstateMember2021-01-012021-09-300001069157ewbc:PrincipalAndInterestDefermentsOrReductionsMemberus-gaap:CommercialPortfolioSegmentMemberewbc:TotalCommercialRealEstateMember2021-01-012021-09-300001069157us-gaap:CommercialPortfolioSegmentMemberewbc:InterestDefermentsMemberewbc:TotalCommercialRealEstateMember2021-01-012021-09-300001069157us-gaap:CommercialPortfolioSegmentMemberus-gaap:ContractualInterestRateReductionMemberewbc:TotalCommercialRealEstateMember2021-01-012021-09-300001069157us-gaap:CommercialPortfolioSegmentMemberewbc:PrincipalForbearancePaymentsTermExtensionsPrincipalDefermentsMemberewbc:TotalCommercialRealEstateMember2020-01-012020-09-300001069157ewbc:PrincipalAndInterestDefermentsOrReductionsMemberus-gaap:CommercialPortfolioSegmentMemberewbc:TotalCommercialRealEstateMember2020-01-012020-09-300001069157us-gaap:CommercialPortfolioSegmentMemberewbc:InterestDefermentsMemberewbc:TotalCommercialRealEstateMember2020-01-012020-09-300001069157us-gaap:CommercialPortfolioSegmentMemberus-gaap:ContractualInterestRateReductionMemberewbc:TotalCommercialRealEstateMember2020-01-012020-09-300001069157us-gaap:CommercialPortfolioSegmentMemberewbc:PrincipalForbearancePaymentsTermExtensionsPrincipalDefermentsMember2021-01-012021-09-300001069157ewbc:PrincipalAndInterestDefermentsOrReductionsMemberus-gaap:CommercialPortfolioSegmentMember2021-01-012021-09-300001069157us-gaap:CommercialPortfolioSegmentMemberewbc:InterestDefermentsMember2021-01-012021-09-300001069157us-gaap:ContractualInterestRateReductionMember2021-01-012021-09-300001069157us-gaap:CommercialPortfolioSegmentMemberewbc:PrincipalForbearancePaymentsTermExtensionsPrincipalDefermentsMember2020-01-012020-09-300001069157ewbc:PrincipalAndInterestDefermentsOrReductionsMemberus-gaap:CommercialPortfolioSegmentMember2020-01-012020-09-300001069157us-gaap:CommercialPortfolioSegmentMemberewbc:InterestDefermentsMember2020-01-012020-09-300001069157us-gaap:ContractualInterestRateReductionMember2020-01-012020-09-300001069157ewbc:PrincipalForbearancePaymentsTermExtensionsPrincipalDefermentsMember2021-01-012021-09-300001069157ewbc:PrincipalAndInterestDefermentsOrReductionsMember2021-01-012021-09-300001069157ewbc:InterestDefermentsMember2021-01-012021-09-300001069157ewbc:PrincipalForbearancePaymentsTermExtensionsPrincipalDefermentsMember2020-01-012020-09-300001069157ewbc:PrincipalAndInterestDefermentsOrReductionsMember2020-01-012020-09-300001069157ewbc:InterestDefermentsMember2020-01-012020-09-300001069157us-gaap:CommercialPortfolioSegmentMemberewbc:CommercialAndIndustrialLoanMember2021-06-300001069157us-gaap:CommercialRealEstateMemberus-gaap:CommercialPortfolioSegmentMember2021-06-300001069157us-gaap:CommercialPortfolioSegmentMemberus-gaap:RealEstateLoanMembersrt:MultifamilyMember2021-06-300001069157us-gaap:CommercialPortfolioSegmentMemberewbc:ConstructionAndLandLoanMember2021-06-300001069157us-gaap:ConsumerPortfolioSegmentMembersrt:SingleFamilyMemberus-gaap:RealEstateLoanMember2021-06-300001069157us-gaap:ConsumerPortfolioSegmentMemberus-gaap:HomeEquityMember2021-06-300001069157us-gaap:ConsumerPortfolioSegmentMemberewbc:OtherConsumerMember2021-06-300001069157us-gaap:CommercialPortfolioSegmentMemberewbc:ConstructionAndLandLoanMember2021-07-012021-09-300001069157us-gaap:ConsumerPortfolioSegmentMembersrt:SingleFamilyMemberus-gaap:RealEstateLoanMember2021-07-012021-09-300001069157us-gaap:ConsumerPortfolioSegmentMemberus-gaap:HomeEquityMember2021-07-012021-09-300001069157us-gaap:ConsumerPortfolioSegmentMemberewbc:OtherConsumerMember2021-07-012021-09-300001069157us-gaap:CommercialPortfolioSegmentMemberewbc:CommercialAndIndustrialLoanMember2020-06-300001069157us-gaap:CommercialRealEstateMemberus-gaap:CommercialPortfolioSegmentMember2020-06-300001069157us-gaap:CommercialPortfolioSegmentMemberus-gaap:RealEstateLoanMembersrt:MultifamilyMember2020-06-300001069157us-gaap:CommercialPortfolioSegmentMemberewbc:ConstructionAndLandLoanMember2020-06-300001069157us-gaap:ConsumerPortfolioSegmentMembersrt:SingleFamilyMemberus-gaap:RealEstateLoanMember2020-06-300001069157us-gaap:ConsumerPortfolioSegmentMemberus-gaap:HomeEquityMember2020-06-300001069157us-gaap:ConsumerPortfolioSegmentMemberewbc:OtherConsumerMember2020-06-300001069157us-gaap:CommercialPortfolioSegmentMemberewbc:ConstructionAndLandLoanMember2020-07-012020-09-300001069157us-gaap:ConsumerPortfolioSegmentMembersrt:SingleFamilyMemberus-gaap:RealEstateLoanMember2020-07-012020-09-300001069157us-gaap:ConsumerPortfolioSegmentMemberus-gaap:HomeEquityMember2020-07-012020-09-300001069157us-gaap:ConsumerPortfolioSegmentMemberewbc:OtherConsumerMember2020-07-012020-09-300001069157us-gaap:CommercialPortfolioSegmentMemberewbc:CommercialAndIndustrialLoanMember2020-09-300001069157us-gaap:CommercialRealEstateMemberus-gaap:CommercialPortfolioSegmentMember2020-09-300001069157us-gaap:CommercialPortfolioSegmentMemberus-gaap:RealEstateLoanMembersrt:MultifamilyMember2020-09-300001069157us-gaap:CommercialPortfolioSegmentMemberewbc:ConstructionAndLandLoanMember2020-09-300001069157us-gaap:ConsumerPortfolioSegmentMembersrt:SingleFamilyMemberus-gaap:RealEstateLoanMember2020-09-300001069157us-gaap:ConsumerPortfolioSegmentMemberus-gaap:HomeEquityMember2020-09-300001069157us-gaap:ConsumerPortfolioSegmentMemberewbc:OtherConsumerMember2020-09-300001069157us-gaap:CommercialPortfolioSegmentMemberewbc:ConstructionAndLandLoanMember2021-01-012021-09-300001069157us-gaap:ConsumerPortfolioSegmentMembersrt:SingleFamilyMemberus-gaap:RealEstateLoanMember2021-01-012021-09-300001069157us-gaap:ConsumerPortfolioSegmentMemberus-gaap:HomeEquityMember2021-01-012021-09-300001069157us-gaap:ConsumerPortfolioSegmentMemberewbc:OtherConsumerMember2021-01-012021-09-300001069157us-gaap:CommercialPortfolioSegmentMemberewbc:CommercialAndIndustrialLoanMember2019-12-310001069157us-gaap:CommercialRealEstateMemberus-gaap:CommercialPortfolioSegmentMember2019-12-310001069157us-gaap:CommercialPortfolioSegmentMemberus-gaap:RealEstateLoanMembersrt:MultifamilyMember2019-12-310001069157us-gaap:CommercialPortfolioSegmentMemberewbc:ConstructionAndLandLoanMember2019-12-310001069157us-gaap:ConsumerPortfolioSegmentMembersrt:SingleFamilyMemberus-gaap:RealEstateLoanMember2019-12-310001069157us-gaap:ConsumerPortfolioSegmentMemberus-gaap:HomeEquityMember2019-12-310001069157us-gaap:ConsumerPortfolioSegmentMemberewbc:OtherConsumerMember2019-12-310001069157us-gaap:CommercialPortfolioSegmentMemberewbc:CommercialAndIndustrialLoanMemberus-gaap:AccountingStandardsUpdate201613Membersrt:CumulativeEffectPeriodOfAdoptionAdjustmentMember2019-12-310001069157us-gaap:CommercialRealEstateMemberus-gaap:CommercialPortfolioSegmentMemberus-gaap:AccountingStandardsUpdate201613Membersrt:CumulativeEffectPeriodOfAdoptionAdjustmentMember2019-12-310001069157us-gaap:CommercialPortfolioSegmentMemberus-gaap:AccountingStandardsUpdate201613Memberus-gaap:RealEstateLoanMembersrt:MultifamilyMembersrt:CumulativeEffectPeriodOfAdoptionAdjustmentMember2019-12-310001069157us-gaap:CommercialPortfolioSegmentMemberus-gaap:AccountingStandardsUpdate201613Memberewbc:ConstructionAndLandLoanMembersrt:CumulativeEffectPeriodOfAdoptionAdjustmentMember2019-12-310001069157us-gaap:ConsumerPortfolioSegmentMembersrt:SingleFamilyMemberus-gaap:AccountingStandardsUpdate201613Memberus-gaap:RealEstateLoanMembersrt:CumulativeEffectPeriodOfAdoptionAdjustmentMember2019-12-310001069157us-gaap:ConsumerPortfolioSegmentMemberus-gaap:HomeEquityMemberus-gaap:AccountingStandardsUpdate201613Membersrt:CumulativeEffectPeriodOfAdoptionAdjustmentMember2019-12-310001069157us-gaap:ConsumerPortfolioSegmentMemberewbc:OtherConsumerMemberus-gaap:AccountingStandardsUpdate201613Membersrt:CumulativeEffectPeriodOfAdoptionAdjustmentMember2019-12-310001069157us-gaap:AccountingStandardsUpdate201613Membersrt:CumulativeEffectPeriodOfAdoptionAdjustmentMember2019-12-310001069157us-gaap:CommercialPortfolioSegmentMemberewbc:CommercialAndIndustrialLoanMemberus-gaap:AccountingStandardsUpdate201613Membersrt:CumulativeEffectPeriodOfAdoptionAdjustedBalanceMember2019-12-310001069157us-gaap:CommercialRealEstateMemberus-gaap:CommercialPortfolioSegmentMemberus-gaap:AccountingStandardsUpdate201613Membersrt:CumulativeEffectPeriodOfAdoptionAdjustedBalanceMember2019-12-310001069157us-gaap:CommercialPortfolioSegmentMemberus-gaap:AccountingStandardsUpdate201613Membersrt:CumulativeEffectPeriodOfAdoptionAdjustedBalanceMemberus-gaap:RealEstateLoanMembersrt:MultifamilyMember2019-12-310001069157us-gaap:CommercialPortfolioSegmentMemberus-gaap:AccountingStandardsUpdate201613Membersrt:CumulativeEffectPeriodOfAdoptionAdjustedBalanceMemberewbc:ConstructionAndLandLoanMember2019-12-310001069157us-gaap:ConsumerPortfolioSegmentMembersrt:SingleFamilyMemberus-gaap:AccountingStandardsUpdate201613Membersrt:CumulativeEffectPeriodOfAdoptionAdjustedBalanceMemberus-gaap:RealEstateLoanMember2019-12-310001069157us-gaap:ConsumerPortfolioSegmentMemberus-gaap:HomeEquityMemberus-gaap:AccountingStandardsUpdate201613Membersrt:CumulativeEffectPeriodOfAdoptionAdjustedBalanceMember2019-12-310001069157us-gaap:ConsumerPortfolioSegmentMemberewbc:OtherConsumerMemberus-gaap:AccountingStandardsUpdate201613Membersrt:CumulativeEffectPeriodOfAdoptionAdjustedBalanceMember2019-12-310001069157us-gaap:AccountingStandardsUpdate201613Membersrt:CumulativeEffectPeriodOfAdoptionAdjustedBalanceMember2019-12-310001069157us-gaap:CommercialPortfolioSegmentMemberewbc:ConstructionAndLandLoanMember2020-01-012020-09-300001069157us-gaap:ConsumerPortfolioSegmentMembersrt:SingleFamilyMemberus-gaap:RealEstateLoanMember2020-01-012020-09-300001069157us-gaap:ConsumerPortfolioSegmentMemberus-gaap:HomeEquityMember2020-01-012020-09-300001069157us-gaap:ConsumerPortfolioSegmentMemberewbc:OtherConsumerMember2020-01-012020-09-300001069157us-gaap:UnfundedLoanCommitmentMember2021-06-300001069157us-gaap:UnfundedLoanCommitmentMember2020-06-300001069157us-gaap:UnfundedLoanCommitmentMember2020-12-310001069157us-gaap:UnfundedLoanCommitmentMember2019-12-310001069157srt:CumulativeEffectPeriodOfAdoptionAdjustmentMember2021-06-300001069157srt:CumulativeEffectPeriodOfAdoptionAdjustmentMember2020-06-300001069157srt:CumulativeEffectPeriodOfAdoptionAdjustmentMember2020-12-310001069157us-gaap:UnfundedLoanCommitmentMember2021-07-012021-09-300001069157us-gaap:UnfundedLoanCommitmentMember2020-07-012020-09-300001069157us-gaap:UnfundedLoanCommitmentMember2021-01-012021-09-300001069157us-gaap:UnfundedLoanCommitmentMember2020-01-012020-09-300001069157us-gaap:UnfundedLoanCommitmentMember2021-09-300001069157us-gaap:UnfundedLoanCommitmentMember2020-09-300001069157ewbc:CommercialandConsumerPortfolioSegmentMember2021-01-012021-09-300001069157ewbc:SingleFamilyResidentialMemberus-gaap:RealEstateLoanMember2020-12-310001069157ewbc:CommercialAndIndustrialLoanMemberewbc:LoansReceivableOriginatedMember2021-07-012021-09-300001069157ewbc:CommercialAndIndustrialLoanMemberewbc:LoansReceivableOriginatedMember2021-01-012021-09-300001069157ewbc:CommercialAndIndustrialLoanMembersrt:SingleFamilyMemberewbc:LoansReceivableOriginatedMember2020-07-012020-09-300001069157ewbc:CommercialAndIndustrialLoanMembersrt:SingleFamilyMemberewbc:LoansReceivableOriginatedMember2020-01-012020-09-300001069157ewbc:LoansSoldInSecondaryMarketMemberewbc:LoansReceivablePurchasedMember2021-07-012021-09-300001069157ewbc:LoansSoldInSecondaryMarketMemberewbc:LoansReceivablePurchasedMember2021-01-012021-09-300001069157ewbc:LoansSoldInSecondaryMarketMemberewbc:LoansReceivablePurchasedMember2020-07-012020-09-300001069157ewbc:LoansSoldInSecondaryMarketMemberewbc:LoansReceivablePurchasedMember2020-01-012020-09-300001069157ewbc:InvestmentsInTaxCreditAndOtherInvestmentsNetMember2021-09-300001069157ewbc:InvestmentsInTaxCreditAndOtherInvestmentsNetMember2020-12-310001069157ewbc:InvestmentsInTaxCreditAndOtherInvestmentsNetAndOtherAssetsMember2021-09-300001069157ewbc:InvestmentsInTaxCreditAndOtherInvestmentsNetAndOtherAssetsMember2020-12-310001069157ewbc:InvestmentInTaxCreditAndOtherInvestmentsMember2021-07-012021-09-300001069157ewbc:InvestmentInTaxCreditAndOtherInvestmentsMember2020-07-012020-09-300001069157ewbc:InvestmentInTaxCreditAndOtherInvestmentsMultipleCreditMember2021-01-012021-09-300001069157ewbc:InvestmentInTaxCreditAndOtherInvestmentsMultipleCreditMember2020-01-012020-09-300001069157ewbc:InvestmentInTaxCreditAndOtherInvestmentsOTTISingleCreditMember2020-01-012020-09-300001069157us-gaap:AvailableforsaleSecuritiesMemberus-gaap:CollateralizedLoanObligationsMember2021-09-300001069157us-gaap:AvailableforsaleSecuritiesMemberus-gaap:CollateralizedLoanObligationsMember2020-12-310001069157us-gaap:CoreDepositsMember2021-09-300001069157us-gaap:CoreDepositsMember2020-12-310001069157us-gaap:CoreDepositsMember2021-01-012021-09-300001069157us-gaap:CoreDepositsMember2020-01-012020-09-300001069157us-gaap:CoreDepositsMember2021-07-012021-09-300001069157us-gaap:CoreDepositsMember2020-07-012020-09-300001069157us-gaap:LoanOriginationCommitmentsMember2021-09-300001069157us-gaap:LoanOriginationCommitmentsMember2020-12-310001069157us-gaap:LetterOfCreditMember2021-09-300001069157us-gaap:LetterOfCreditMember2020-12-310001069157us-gaap:CommitmentsToExtendCreditMember2021-09-300001069157us-gaap:CommitmentsToExtendCreditMember2020-12-310001069157us-gaap:StandbyLettersOfCreditMember2021-09-300001069157ewbc:CommercialLettersOfCreditMember2021-09-300001069157us-gaap:StandbyLettersOfCreditMember2020-12-310001069157ewbc:CommercialLettersOfCreditMember2020-12-310001069157ewbc:LoansSoldorSecuritizedWithRecourseMemberewbc:SingleFamilyResidentialMemberus-gaap:GuaranteeObligationsMember2021-09-300001069157ewbc:LoansSoldorSecuritizedWithRecourseMemberewbc:SingleFamilyResidentialMemberus-gaap:GuaranteeObligationsMember2020-12-310001069157ewbc:LoansSoldorSecuritizedWithRecourseMemberewbc:MultifamilyResidentialMemberus-gaap:GuaranteeObligationsMember2021-09-300001069157ewbc:LoansSoldorSecuritizedWithRecourseMemberewbc:MultifamilyResidentialMemberus-gaap:GuaranteeObligationsMember2020-12-310001069157ewbc:LoansSoldorSecuritizedWithRecourseMemberus-gaap:GuaranteeObligationsMember2021-09-300001069157ewbc:LoansSoldorSecuritizedWithRecourseMemberus-gaap:GuaranteeObligationsMember2020-12-310001069157ewbc:LoansSoldorSecuritizedWithRecourseMemberus-gaap:GuaranteeObligationsMemberewbc:SingleFamilyResidentialAndMultiFamilyResidentialMember2021-09-300001069157ewbc:LoansSoldorSecuritizedWithRecourseMemberus-gaap:GuaranteeObligationsMemberewbc:SingleFamilyResidentialAndMultiFamilyResidentialMember2020-12-310001069157ewbc:AccruedExpensesAndOtherLiabilitiesMember2021-09-300001069157ewbc:AccruedExpensesAndOtherLiabilitiesMember2020-12-310001069157us-gaap:RestrictedStockUnitsRSUMemberewbc:CliffVestingMember2021-01-012021-09-300001069157srt:MinimumMemberewbc:PerformanceBasedRestrictedStockSettledinStockMember2021-01-012021-09-300001069157ewbc:PerformanceBasedRestrictedStockSettledinStockMembersrt:MaximumMember2021-01-012021-09-300001069157ewbc:CliffVestingMemberewbc:PerformanceBasedRestrictedStockSettledinStockMember2021-01-012021-09-300001069157ewbc:TimeBasedRestrictedStockSettledinStockMember2020-12-310001069157ewbc:PerformanceBasedRestrictedStockSettledinStockMember2020-12-310001069157ewbc:TimeBasedRestrictedStockSettledinStockMember2021-01-012021-09-300001069157ewbc:PerformanceBasedRestrictedStockSettledinStockMember2021-01-012021-09-300001069157ewbc:TimeBasedRestrictedStockSettledinStockMember2021-09-300001069157ewbc:PerformanceBasedRestrictedStockSettledinStockMember2021-09-300001069157ewbc:TimeBasedRestrictedStockSettledinCashMember2020-12-310001069157ewbc:TimeBasedRestrictedStockSettledinCashMember2021-01-012021-09-300001069157ewbc:TimeBasedRestrictedStockSettledinCashMember2021-09-300001069157us-gaap:RestrictedStockUnitsRSUMember2021-07-012021-09-300001069157us-gaap:RestrictedStockUnitsRSUMember2021-01-012021-09-300001069157us-gaap:RestrictedStockUnitsRSUMember2020-07-012020-09-300001069157us-gaap:RestrictedStockUnitsRSUMember2020-01-012020-09-300001069157us-gaap:AccumulatedNetUnrealizedInvestmentGainLossMember2020-06-300001069157us-gaap:AccumulatedNetGainLossFromDesignatedOrQualifyingCashFlowHedgesMember2020-06-300001069157us-gaap:AccumulatedTranslationAdjustmentMember2020-06-300001069157us-gaap:AccumulatedNetUnrealizedInvestmentGainLossMember2020-07-012020-09-300001069157us-gaap:AccumulatedNetGainLossFromDesignatedOrQualifyingCashFlowHedgesMember2020-07-012020-09-300001069157us-gaap:AccumulatedTranslationAdjustmentMember2020-07-012020-09-300001069157us-gaap:AccumulatedNetUnrealizedInvestmentGainLossMember2020-09-300001069157us-gaap:AccumulatedNetGainLossFromDesignatedOrQualifyingCashFlowHedgesMember2020-09-300001069157us-gaap:AccumulatedTranslationAdjustmentMember2020-09-300001069157us-gaap:AccumulatedNetUnrealizedInvestmentGainLossMember2021-06-300001069157us-gaap:AccumulatedNetGainLossFromDesignatedOrQualifyingCashFlowHedgesMember2021-06-300001069157us-gaap:AccumulatedTranslationAdjustmentMember2021-06-300001069157us-gaap:AccumulatedNetUnrealizedInvestmentGainLossMember2021-07-012021-09-300001069157us-gaap:AccumulatedNetGainLossFromDesignatedOrQualifyingCashFlowHedgesMember2021-07-012021-09-300001069157us-gaap:AccumulatedTranslationAdjustmentMember2021-07-012021-09-300001069157us-gaap:AccumulatedNetUnrealizedInvestmentGainLossMember2021-09-300001069157us-gaap:AccumulatedNetGainLossFromDesignatedOrQualifyingCashFlowHedgesMember2021-09-300001069157us-gaap:AccumulatedTranslationAdjustmentMember2021-09-300001069157us-gaap:AccumulatedNetUnrealizedInvestmentGainLossMember2019-12-310001069157us-gaap:AccumulatedNetGainLossFromDesignatedOrQualifyingCashFlowHedgesMember2019-12-310001069157us-gaap:AccumulatedTranslationAdjustmentMember2019-12-310001069157us-gaap:AccumulatedNetUnrealizedInvestmentGainLossMember2020-01-012020-09-300001069157us-gaap:AccumulatedNetGainLossFromDesignatedOrQualifyingCashFlowHedgesMember2020-01-012020-09-300001069157us-gaap:AccumulatedTranslationAdjustmentMember2020-01-012020-09-300001069157us-gaap:AccumulatedNetUnrealizedInvestmentGainLossMember2020-12-310001069157us-gaap:AccumulatedNetGainLossFromDesignatedOrQualifyingCashFlowHedgesMember2020-12-310001069157us-gaap:AccumulatedTranslationAdjustmentMember2020-12-310001069157us-gaap:AccumulatedNetUnrealizedInvestmentGainLossMember2021-01-012021-09-300001069157us-gaap:AccumulatedNetGainLossFromDesignatedOrQualifyingCashFlowHedgesMember2021-01-012021-09-300001069157us-gaap:AccumulatedTranslationAdjustmentMember2021-01-012021-09-30ewbc:segment0001069157ewbc:ConsumerandBusinessBankingMember2021-07-012021-09-300001069157ewbc:CommercialBankingMember2021-07-012021-09-300001069157us-gaap:AllOtherSegmentsMember2021-07-012021-09-300001069157ewbc:ConsumerandBusinessBankingMember2021-09-300001069157ewbc:CommercialBankingMember2021-09-300001069157us-gaap:AllOtherSegmentsMember2021-09-300001069157ewbc:ConsumerandBusinessBankingMember2020-07-012020-09-300001069157ewbc:CommercialBankingMember2020-07-012020-09-300001069157us-gaap:AllOtherSegmentsMember2020-07-012020-09-300001069157ewbc:ConsumerandBusinessBankingMember2020-09-300001069157ewbc:CommercialBankingMember2020-09-300001069157us-gaap:AllOtherSegmentsMember2020-09-300001069157ewbc:ConsumerandBusinessBankingMember2021-01-012021-09-300001069157ewbc:CommercialBankingMember2021-01-012021-09-300001069157us-gaap:AllOtherSegmentsMember2021-01-012021-09-300001069157ewbc:ConsumerandBusinessBankingMember2020-01-012020-09-300001069157ewbc:CommercialBankingMember2020-01-012020-09-300001069157us-gaap:AllOtherSegmentsMember2020-01-012020-09-300001069157us-gaap:SubsequentEventMember2021-10-21
UNITED STATES
SECURITIES AND EXCHANGE COMMISSION
Washington, D.C. 20549
FORM 10-Q
☒ QUARTERLY REPORT PURSUANT TO SECTION 13 OR 15(d) OF
THE SECURITIES EXCHANGE ACT OF 1934
For the quarterly period ended September 30, 2021
OR
☐ TRANSITION REPORT PURSUANT TO SECTION 13 OR 15(d) OF
THE SECURITIES EXCHANGE ACT OF 1934
For the transition period from to
Commission file number 000-24939
EAST WEST BANCORP, INC.
(Exact name of registrant as specified in its charter)
Delaware
(State or other jurisdiction of incorporation or organization)
95-4703316
(I.R.S. Employer Identification No.)
135 North Los Robles Ave., 7th Floor, Pasadena, California 91101
(Address of principal executive offices) (Zip Code)
Registrant’s telephone number, including area code:
(626) 768-6000
Securities registered pursuant to Section 12(b) of the Act:
| | | | | | | | | | | | | | | | | | | |
| Title of each class | | Trading
Symbol(s) | | Name of each exchange
on which registered | |
| Common Stock, par value $0.001 per share | | EWBC | | The Nasdaq Global Select Market | |
Indicate by check mark whether the registrant (1) has filed all reports required to be filed by Section 13 or 15(d) of the Securities Exchange Act of 1934 during the preceding 12 months (or for such shorter period that the registrant was required to file such reports), and (2) has been subject to such filing requirements for the past 90 days.
Yes ☒ No ☐
Indicate by check mark whether the registrant has submitted electronically every Interactive Data File required to be submitted pursuant to Rule 405 of Regulation S-T (§232.405 of this chapter) during the preceding 12 months (or for such shorter period that the registrant was required to submit such files).
Yes ☒ No ☐
Indicate by check mark whether the registrant is a large accelerated filer, an accelerated filer, a non-accelerated filer, a smaller reporting company, or an emerging growth company. See the definitions of “large accelerated filer,” “accelerated filer,” “smaller reporting company,” and “emerging growth company” in Rule 12b-2 of the Exchange Act.
| | | | | | | | | | | | | | |
| Large accelerated filer | ☒ | | Accelerated filer | ☐ |
| Non-accelerated filer | ☐ | | Smaller reporting company | ☐ |
| | Emerging growth company | ☐ |
If an emerging growth company, indicate by check mark if the registrant has elected not to use the extended transition period for complying with any new or revised financial accounting standards provided pursuant to Section 13(a) of the Exchange Act. ☐
Indicate by check mark whether the registrant is a shell company (as defined in Rule 12b-2 of the Exchange Act).
Yes ☐ No ☒
Number of shares outstanding of the issuer’s common stock on the latest practicable date: 141,907,491 shares as of October 31, 2021.
TABLE OF CONTENTS
PART I — FINANCIAL INFORMATION
ITEM 1. CONSOLIDATED FINANCIAL STATEMENTS
EAST WEST BANCORP, INC. AND SUBSIDIARIES
CONSOLIDATED BALANCE SHEET
($ in thousands, except shares)
(Unaudited)
| | | | | | | | | | | | | | |
|
| | September 30,
2021 | | December 31,
2020 |
| | (Unaudited) | | |
| ASSETS | | | | |
| Cash and due from banks | | $ | 594,631 | | | $ | 592,117 | |
| Interest-bearing cash with banks | | 4,258,270 | | | 3,425,854 | |
| Cash and cash equivalents | | 4,852,901 | | | 4,017,971 | |
| Interest-bearing deposits with banks | | 855,162 | | | 809,728 | |
| Assets purchased under resale agreements (“resale agreements”) | | 2,596,142 | | | 1,460,000 | |
| Securities: | | | | |
Available-for-sale (“AFS”) debt securities, at fair value (amortized cost of $9,783,180 in 2021 and $5,470,523 in 2020; includes assets pledged as collateral of $859,901 in 2021 and $588,484 in 2020) | | 9,713,006 | | | 5,544,658 | |
| Restricted equity securities, at cost | | 77,200 | | | 83,046 | |
| Loans held-for-sale | | — | | | 1,788 | |
Loans held-for-investment (net of allowance for loan losses of $560,404 in 2021 and $619,983 in 2020; includes assets pledged as collateral of $24,551,177 in 2021 and $23,263,517 in 2020) | | 39,921,301 | | | 37,770,972 | |
| Investments in qualified affordable housing partnerships, net | | 297,367 | | | 213,555 | |
| Investments in tax credit and other investments, net | | 367,428 | | | 266,525 | |
Premises and equipment (net of accumulated depreciation of $136,796 in 2021 and $127,884 in 2020) | | 96,956 | | | 103,251 | |
| Goodwill | | 465,697 | | | 465,697 | |
| Operating lease right-of-use assets | | 99,785 | | | 95,460 | |
| Other assets | | 1,616,165 | | | 1,324,262 | |
| TOTAL | | $ | 60,959,110 | | | $ | 52,156,913 | |
| LIABILITIES | | | | |
| Deposits: | | | | |
| Noninterest-bearing | | $ | 23,175,471 | | | $ | 16,298,301 | |
| Interest-bearing | | 30,180,719 | | | 28,564,451 | |
| Total deposits | | 53,356,190 | | | 44,862,752 | |
| Short-term borrowings | | — | | | 21,009 | |
| | | | |
| Federal Home Loan Bank (“FHLB”) advances | | 248,898 | | | 652,612 | |
| Assets sold under repurchase agreements (“repurchase agreements”) | | 300,000 | | | 300,000 | |
| Long-term debt and finance lease liabilities | | 151,795 | | | 151,739 | |
| Operating lease liabilities | | 107,107 | | | 102,830 | |
| Accrued expenses and other liabilities | | 1,104,919 | | | 796,796 | |
| Total liabilities | | 55,268,909 | | | 46,887,738 | |
| COMMITMENTS AND CONTINGENCIES (Note 9) | | | | |
| STOCKHOLDERS’ EQUITY | | | | |
Common stock, $0.001 par value, 200,000,000 shares authorized; 167,764,049 and 167,240,600 shares issued in 2021 and 2020, respectively | | 168 | | | 167 | |
| Additional paid-in capital | | 1,883,871 | | | 1,858,352 | |
| Retained earnings | | 4,513,321 | | | 4,000,414 | |
Treasury stock, at cost 25,880,318 shares in 2021 and 25,675,371 shares in 2020 | | (649,591) | | | (634,083) | |
| Accumulated other comprehensive (loss) income (“AOCI”), net of tax | | (57,568) | | | 44,325 | |
| Total stockholders’ equity | | 5,690,201 | | | 5,269,175 | |
| TOTAL | | $ | 60,959,110 | | | $ | 52,156,913 | |
|
See accompanying Notes to Consolidated Financial Statements.
3
EAST WEST BANCORP, INC. AND SUBSIDIARIES
CONSOLIDATED STATEMENT OF INCOME
($ and shares in thousands, except per share data)
(Unaudited)
| | | | | | | | | | | | | | | | | | | | | | | | | | | | |
|
| | Three Months Ended
September 30, | | Nine Months Ended
September 30, | | |
| | 2021 | | 2020 | | 2021 | | 2020 | | |
| INTEREST AND DIVIDEND INCOME | | | | | | | | | | |
| Loans receivable, including fees | | $ | 363,503 | | | $ | 336,542 | | | $ | 1,057,964 | | | $ | 1,115,804 | | | |
| AFS debt securities | | 37,826 | | | 18,493 | | | 101,616 | | | 59,639 | | | |
| | | | | | | | | | |
| Resale agreements | | 8,957 | | | 5,295 | | | 23,077 | | | 16,434 | | | |
| Restricted equity securities | | 500 | | | 353 | | | 1,588 | | | 1,100 | | | |
| Interest-bearing cash and deposits with banks | | 4,521 | | | 5,045 | | | 11,781 | | | 20,717 | | | |
| Total interest and dividend income | | 415,307 | | | 365,728 | | | 1,196,026 | | | 1,213,694 | | | |
| INTEREST EXPENSE | | | | | | | | | | |
| Deposits | | 15,970 | | | 33,798 | | | 55,790 | | | 156,600 | | | |
Short-term borrowings | | — | | | 407 | | | 42 | | | 1,228 | | | |
| FHLB advances | | 857 | | | 3,146 | | | 6,025 | | | 10,655 | | | |
| Repurchase agreements | | 2,012 | | | 2,155 | | | 5,981 | | | 9,686 | | | |
| Long-term debt and finance lease liabilities | | 762 | | | 2,092 | | | 2,314 | | | 4,913 | | | |
| Total interest expense | | 19,601 | | | 41,598 | | | 70,152 | | | 183,082 | | | |
| Net interest income before provision for credit losses | | 395,706 | | | 324,130 | | | 1,125,874 | | | 1,030,612 | | | |
| (Reversal of) provision for credit losses | | (10,000) | | | 10,000 | | | (25,000) | | | 186,313 | | | |
| Net interest income after provision for credit losses | | 405,706 | | | 314,130 | | | 1,150,874 | | | 844,299 | | | |
| NONINTEREST INCOME | | | | | | | | | | |
| Lending fees | | 17,516 | | | 18,736 | | | 56,965 | | | 56,455 | | | |
| Deposit account fees | | 18,508 | | | 12,573 | | | 51,233 | | | 33,892 | | | |
| Interest rate contracts and other derivative income | | 7,156 | | | 5,538 | | | 20,981 | | | 18,718 | | | |
| Foreign exchange income | | 13,101 | | | 3,310 | | | 35,634 | | | 15,691 | | | |
| Wealth management fees | | 5,598 | | | 4,553 | | | 20,460 | | | 12,997 | | | |
| Net gains on sales of loans | | 3,329 | | | 361 | | | 6,601 | | | 1,443 | | | |
| Gains on sales of AFS debt securities | | 354 | | | 698 | | | 1,178 | | | 11,867 | | | |
| | | | | | | | | | |
| | | | | | | | | | |
| Other investment income | | 5,349 | | | 5,239 | | | 13,870 | | | 6,652 | | | |
| Other income | | 2,198 | | | 3,495 | | | 7,484 | | | 8,000 | | | |
| Total noninterest income | | 73,109 | | | 54,503 | | | 214,406 | | | 165,715 | | | |
| NONINTEREST EXPENSE | | | | | | | | | | |
| Compensation and employee benefits | | 105,751 | | | 99,756 | | | 318,985 | | | 298,671 | | | |
| Occupancy and equipment expense | | 15,851 | | | 16,648 | | | 47,150 | | | 49,941 | | | |
| Deposit insurance premiums and regulatory assessments | | 4,641 | | | 4,006 | | | 12,791 | | | 11,133 | | | |
| Deposit account expense | | 4,136 | | | 3,113 | | | 11,845 | | | 10,029 | | | |
| Data processing | | 3,575 | | | 3,590 | | | 12,088 | | | 11,896 | | | |
| Computer software expense | | 8,426 | | | 8,539 | | | 23,106 | | | 22,006 | | | |
| Consulting expense | | 1,635 | | | 1,224 | | | 4,978 | | | 3,854 | | | |
| Legal expense | | 2,363 | | | 1,366 | | | 5,840 | | | 6,093 | | | |
| Other operating expense | | 20,998 | | | 17,122 | | | 58,544 | | | 57,489 | | | |
| Amortization of tax credit and other investments | | 38,008 | | | 17,209 | | | 90,657 | | | 57,819 | | | |
| Repurchase agreements’ extinguishment cost | | — | | | — | | | — | | | 8,740 | | | |
| Total noninterest expense | | 205,384 | | | 172,573 | | | 585,984 | | | 537,671 | | | |
| INCOME BEFORE INCOME TAXES | | 273,431 | | | 196,060 | | | 779,296 | | | 472,343 | | | |
| INCOME TAX EXPENSE | | 47,982 | | | 36,523 | | | 124,111 | | | 68,630 | | | |
| NET INCOME | | $ | 225,449 | | | $ | 159,537 | | | $ | 655,185 | | | $ | 403,713 | | | |
| EARNINGS PER SHARE (“EPS”) | | | | | | | | | | |
| BASIC | | $ | 1.59 | | | $ | 1.13 | | | $ | 4.62 | | | $ | 2.83 | | | |
| DILUTED | | $ | 1.57 | | | $ | 1.12 | | | $ | 4.58 | | | $ | 2.82 | | | |
| WEIGHTED-AVERAGE NUMBER OF SHARES OUTSTANDING | | | | | | | | | | |
| BASIC | | 141,880 | | | 141,498 | | | 141,799 | | | 142,595 | | | |
| DILUTED | | 143,143 | | | 142,043 | | | 143,051 | | | 143,082 | | | |
|
See accompanying Notes to Consolidated Financial Statements.
4
EAST WEST BANCORP, INC. AND SUBSIDIARIES
CONSOLIDATED STATEMENT OF COMPREHENSIVE INCOME
($ in thousands)
(Unaudited)
| | | | | | | | | | | | | | | | | | | | | | | | | | | | |
|
| | Three Months Ended
September 30, | | Nine Months Ended
September 30, | | |
| | 2021 | | 2020 | | 2021 | | 2020 | | |
| Net income | | $ | 225,449 | | | $ | 159,537 | | | $ | 655,185 | | | $ | 403,713 | | | |
| Other comprehensive income (loss), net of tax: | | | | | | | | | | |
| Net changes in unrealized (losses) gains on AFS debt securities | | (41,178) | | | 4,634 | | | (101,577) | | | 49,903 | | | |
| Net changes in unrealized gains (losses) on cash flow hedges | | 51 | | | 87 | | | 551 | | | (1,246) | | | |
| Foreign currency translation adjustments | | (1,752) | | | 5,459 | | | (867) | | | 3,065 | | | |
| Other comprehensive (loss) income | | (42,879) | | | 10,180 | | | (101,893) | | | 51,722 | | | |
| COMPREHENSIVE INCOME | | $ | 182,570 | | | $ | 169,717 | | | $ | 553,292 | | | $ | 455,435 | | | |
|
See accompanying Notes to Consolidated Financial Statements.
5
EAST WEST BANCORP, INC. AND SUBSIDIARIES
CONSOLIDATED STATEMENT OF CHANGES IN STOCKHOLDERS’ EQUITY
($ in thousands, except shares)
(Unaudited)
| | | | | | | | | | | | | | | | | | | | | | | | | | | | | | | | | | | | | | |
|
| | Common Stock and
Additional Paid-in Capital | | Retained Earnings | | Treasury Stock | | AOCI,
Net of Tax | | Total
Stockholders’ Equity |
| | Shares | | Amount | | | | |
| BALANCE, JULY 1, 2020 | | 141,486,397 | | | $ | 1,841,915 | | | $ | 3,755,649 | | | $ | (633,455) | | | $ | 23,134 | | | $ | 4,987,243 | |
| | | | | | | | | | | | |
| Net income | | — | | | — | | | 159,537 | | | — | | | — | | | 159,537 | |
| Other comprehensive income | | — | | | — | | | — | | | — | | | 10,180 | | | 10,180 | |
| | | | | | | | | | | | |
| | | | | | | | | | | | |
| | | | | | | | | | | | |
| Issuance of common stock pursuant to various stock compensation plans and agreements | | 21,968 | | | 8,648 | | | — | | | — | | | — | | | 8,648 | |
| Repurchase of common stock pursuant to various stock compensation plans and agreements | | (935) | | | — | | | — | | | (31) | | | — | | | (31) | |
| | | | | | | | | | | | |
Cash dividends on common stock ($0.275 per share) | | — | | | — | | | (39,471) | | | — | | | — | | | (39,471) | |
| BALANCE, SEPTEMBER 30, 2020 | | 141,507,430 | | | $ | 1,850,563 | | | $ | 3,875,715 | | | $ | (633,486) | | | $ | 33,314 | | | $ | 5,126,106 | |
| BALANCE, JULY 1, 2021 | | 141,877,505 | | | $ | 1,876,247 | | | $ | 4,335,327 | | | $ | (649,337) | | | $ | (14,689) | | | $ | 5,547,548 | |
| | | | | | | | | | | | |
| Net income | | — | | | — | | | 225,449 | | | — | | | — | | | 225,449 | |
| Other comprehensive loss | | — | | | — | | | — | | | — | | | (42,879) | | | (42,879) | |
| | | | | | | | | | | | |
| | | | | | | | | | | | |
| | | | | | | | | | | | |
| Issuance of common stock pursuant to various stock compensation plans and agreements | | 9,643 | | | 7,792 | | | — | | | — | | | — | | | 7,792 | |
| Repurchase of common stock pursuant to various stock compensation plans and agreements | | (3,417) | | | — | | | — | | | (254) | | | — | | | (254) | |
| | | | | | | | | | | | |
Cash dividends on common stock ($0.330 per share) | | — | | | — | | | (47,455) | | | — | | | — | | | (47,455) | |
| BALANCE, SEPTEMBER 30, 2021 | | 141,883,731 | | | $ | 1,884,039 | | | $ | 4,513,321 | | | $ | (649,591) | | | $ | (57,568) | | | $ | 5,690,201 | |
| | | | | | | | | | | | |
| | | | | | | | | | | | | | | | | | | | | | | | | | | | | | | | | | | | | | |
|
| | Common Stock and
Additional Paid-in Capital | | Retained Earnings | | Treasury Stock | | AOCI,
Net of Tax | | Total
Stockholders’ Equity |
| | Shares | | Amount | | | | |
| BALANCE, JANUARY 1, 2020 | | 145,625,385 | | | $ | 1,826,512 | | | $ | 3,689,377 | | | $ | (479,864) | | | $ | (18,408) | | | $ | 5,017,617 | |
Cumulative-effect of change in accounting principle related to credit losses (1) | | — | | | — | | | (97,967) | | | — | | | — | | | (97,967) | |
| Net income | | — | | | — | | | 403,713 | | | — | | | — | | | 403,713 | |
| Other comprehensive income | | — | | | — | | | — | | | — | | | 51,722 | | | 51,722 | |
| | | | | | | | | | | | |
| | | | | | | | | | | | |
| | | | | | | | | | | | |
| Issuance of common stock pursuant to various stock compensation plans and agreements | | 543,287 | | | 24,051 | | | — | | | — | | | — | | | 24,051 | |
| Repurchase of common stock pursuant to various stock compensation plans and agreements | | (189,560) | | | — | | | — | | | (7,656) | | | — | | | (7,656) | |
| Repurchase of common stock pursuant to the Stock Repurchase Program | | (4,471,682) | | | — | | | — | | | (145,966) | | | — | | | (145,966) | |
Cash dividends on common stock ($0.825 per share) | | — | | | — | | | (119,408) | | | — | | | — | | | (119,408) | |
| BALANCE, SEPTEMBER 30, 2020 | | 141,507,430 | | | $ | 1,850,563 | | | $ | 3,875,715 | | | $ | (633,486) | | | $ | 33,314 | | | $ | 5,126,106 | |
| BALANCE, JANUARY 1, 2021 | | 141,565,229 | | | $ | 1,858,519 | | | $ | 4,000,414 | | | $ | (634,083) | | | $ | 44,325 | | | $ | 5,269,175 | |
| | | | | | | | | | | | |
| Net income | | — | | | — | | | 655,185 | | | — | | | — | | | 655,185 | |
| Other comprehensive loss | | — | | | — | | | — | | | — | | | (101,893) | | | (101,893) | |
| | | | | | | | | | | | |
| | | | | | | | | | | | |
| | | | | | | | | | | | |
| Issuance of common stock pursuant to various stock compensation plans and agreements | | 523,449 | | | 25,520 | | | — | | | — | | | — | | | 25,520 | |
| Repurchase of common stock pursuant to various stock compensation plans and agreements | | (204,947) | | | — | | | — | | | (15,508) | | | — | | | (15,508) | |
| | | | | | | | | | | | |
Cash dividends on common stock ($0.990 per share) | | — | | | — | | | (142,278) | | | — | | | — | | | (142,278) | |
| BALANCE, SEPTEMBER 30, 2021 | | 141,883,731 | | | $ | 1,884,039 | | | $ | 4,513,321 | | | $ | (649,591) | | | $ | (57,568) | | | $ | 5,690,201 | |
| | | | | | | | | | | | |
(1)Represents the impact of the adoption of Accounting Standards Update (“ASU”) 2016-13, Financial Instruments — Credit Losses (Topic 326) on January 1, 2020.
See accompanying Notes to Consolidated Financial Statements.
6
EAST WEST BANCORP, INC. AND SUBSIDIARIES
CONSOLIDATED STATEMENT OF CASH FLOWS
($ in thousands)
(Unaudited)
| | | | | | | | | | | | | | | | |
|
| | Nine Months Ended September 30, | | |
| | 2021 | | 2020 | | |
| CASH FLOWS FROM OPERATING ACTIVITIES | | | | | | |
| Net income | | $ | 655,185 | | | $ | 403,713 | | | |
| Adjustments to reconcile net income to net cash provided by operating activities: | | | | | | |
| Depreciation and amortization | | 116,371 | | | 96,089 | | | |
| Amortization of premiums and accretion of discount, net | | 17,392 | | | (17,974) | | | |
| Stock compensation costs | | 24,047 | | | 22,201 | | | |
| Deferred income tax benefit (expense) | | 787 | | | (91) | | | |
| (Reversal of) provision for credit losses | | (25,000) | | | 186,313 | | | |
| Net gains on sales of loans | | (6,601) | | | (1,443) | | | |
| Gains on sales of AFS debt securities | | (1,178) | | | (11,867) | | | |
| | | | | | |
| | | | | | |
| Impairment on other real estate owned ("OREO") and other foreclosed assets | | 4,843 | | | — | | | |
| Net gains on sales of OREO and other foreclosed assets | | (1,954) | | | — | | | |
| Loans held-for-sale: | | | | | | |
| Originations and purchases | | (9,323) | | | (53,911) | | | |
| Proceeds from sales and paydowns/payoffs of loans originally classified as held-for-sale | | 11,337 | | | 50,339 | | | |
| | | | | | |
| | | | | | |
| Proceeds from distributions received from equity method investees | | 7,624 | | | 4,934 | | | |
| Net change in accrued interest receivable and other assets | | (78,649) | | | (467,077) | | | |
| Net change in accrued expenses and other liabilities | | 30,179 | | | 220,343 | | | |
| Other net operating activities | | 771 | | | 529 | | | |
| Total adjustments | | 90,646 | | | 28,385 | | | |
| Net cash provided by operating activities | | 745,831 | | | 432,098 | | | |
| CASH FLOWS FROM INVESTING ACTIVITIES | | | | | | |
| Net (increase) decrease in: | | | | | | |
| Investments in qualified affordable housing partnerships, tax credit and other investments | | (141,882) | | | (102,190) | | | |
| Interest-bearing deposits with banks | | 4,576 | | | (503,187) | | | |
| Resale agreements: | | | | | | |
| Proceeds from paydowns and maturities | | 698,274 | | | 400,000 | | | |
| Purchases | | (1,834,416) | | | (500,000) | | | |
| AFS debt securities: | | | | | | |
| Proceeds from sales | | 236,967 | | | 494,877 | | | |
| Proceeds from repayments, maturities and redemptions | | 1,346,839 | | | 1,532,411 | | | |
| Purchases | | (5,884,389) | | | (3,167,863) | | | |
| Loans held-for-investment: | | | | | | |
| Proceeds from sales of loans originally classified as held-for-investment | | 416,426 | | | 254,035 | | | |
| Purchases | | (746,395) | | | (163,861) | | | |
| Other changes in loans held-for-investment, net | | (1,798,011) | | | (2,764,867) | | | |
| | | | | | |
| | | | | | |
| | | | | | |
| | | | | | |
| | | | | | |
| Proceeds from sales of OREO and other foreclosed assets | | 28,560 | | | — | | | |
| | | | | | |
| | | | | | |
| Purchase of bank-owned life insurance | | (150,000) | | | — | | | |
| Proceeds from distributions received from equity method investees | | 5,626 | | | 2,601 | | | |
| Other net investing activities | | (61) | | | (2,223) | | | |
| Net cash used in investing activities | | (7,817,886) | | | (4,520,267) | | | |
| | | | | | |
| | | | | | |
| | | | | | |
| | | | | | |
| | | | | | |
| | | | | | |
| | | | | | |
| | | | | | |
| | | | | | |
| | | | | | |
| | | | | | |
| | | | | | |
| | | | | | |
| | | | | | |
| | | | | | |
| | | | | | |
| | | | | | |
| | | | | | |
| | | | | | |
| | | | | | |
| | | | | | |
| | | | | | |
| | | | | | |
| | | | | | |
| | | | | | |
See accompanying Notes to Consolidated Financial Statements.
7
EAST WEST BANCORP, INC. AND SUBSIDIARIES
CONSOLIDATED STATEMENT OF CASH FLOWS
($ in thousands)
(Unaudited)
(Continued)
| | | | | | | | | | | | | | | | |
|
| | Nine Months Ended September 30, | | |
| | 2021 | | 2020 | | |
| | | | | | |
| | | | | | |
| | | | | | |
| | | | | | |
| | | | | | |
| | | | | | |
| | | | | | |
| | | | | | |
| | | | | | |
| | | | | | |
| | | | | | |
| | | | | | |
| | | | | | |
| | | | | | |
| | | | | | |
| | | | | | |
| | | | | | |
| | | | | | |
| | | | | | |
| | | | | | |
| | | | | | |
| | | | | | |
| | | | | | |
| | | | | | |
| | | | | | |
| | | | | | |
| | | | | | |
| | | | | | |
| | | | | | |
| | | | | | |
| | | | | | |
| | | | | | |
| | | | | | |
| | | | | | |
| | | | | | |
| | | | | | |
| | | | | | |
| | | | | | |
| | | | | | |
| | | | | | |
| | | | | | |
| | | | | | |
| | | | | | |
| | | | | | |
| | | | | | |
| | | | | | |
| | | | | | |
| | | | | | |
| | | | | | |
| | | | | | |
| | | | | | |
| | | | | | |
| CASH FLOWS FROM FINANCING ACTIVITIES | | | | | | |
| Net increase in deposits | | 8,486,734 | | | 4,337,096 | | | |
| Net (decrease) increase in short-term borrowings | | (21,143) | | | 30,916 | | | |
| | | | | | |
| FHLB advances: | | | | | | |
| Proceeds | | — | | | 10,200 | | | |
| Repayment | | (405,000) | | | (100,200) | | | |
| Repurchase agreements: | | | | | | |
| Proceeds from repurchase agreements | | — | | | 48,063 | | | |
| Repayment of repurchase agreements | | — | | | (150,000) | | | |
| Repurchase agreements’ extinguishment cost | | — | | | (8,740) | | | |
| Long-term debt and lease liabilities: | | | | | | |
| Proceeds from long-term debt | | — | | | 1,437,269 | | | |
| Repayment of long-term debt and lease liabilities | | (909) | | | (10,609) | | | |
| Common stock: | | | | | | |
| Repurchase of common stocks pursuant to the Stock Repurchase Program | | — | | | (145,966) | | | |
| Proceeds from issuance pursuant to various stock compensation plans and agreements | | 1,180 | | | 1,170 | | | |
| Stocks tendered for payment of withholding taxes | | (15,508) | | | (7,656) | | | |
| Cash dividends paid | | (141,911) | | | (119,185) | | | |
| Net cash provided by financing activities | | 7,903,443 | | | 5,322,358 | | | |
| Effect of exchange rate changes on cash and cash equivalents | | 3,542 | | | 11,603 | | | |
| NET INCREASE IN CASH AND CASH EQUIVALENTS | | 834,930 | | | 1,245,792 | | | |
| CASH AND CASH EQUIVALENTS, BEGINNING OF PERIOD | | 4,017,971 | | | 3,261,149 | | | |
| CASH AND CASH EQUIVALENTS, END OF PERIOD | | $ | 4,852,901 | | | $ | 4,506,941 | | | |
| | | | | | |
| SUPPLEMENTAL CASH FLOW INFORMATION | | | | | | |
| Cash paid during the period for: | | | | | | |
| Interest | | $ | 70,833 | | | $ | 188,657 | | | |
| Income taxes, net | | $ | 137,452 | | | $ | 82,114 | | | |
| Noncash investing and financing activities: | | | | | | |
| | | | | | |
| Loans transferred from held-for-investment to held-for-sale | | $ | 411,416 | | | $ | 253,302 | | | |
| | | | | | |
| | | | | | |
| | | | | | |
| | | | | | |
| Loans transferred to OREO and other foreclosed assets | | $ | 49,122 | | | $ | 19,504 | | | |
|
See accompanying Notes to Consolidated Financial Statements.
8
EAST WEST BANCORP, INC. AND SUBSIDIARIES
NOTES TO CONSOLIDATED FINANCIAL STATEMENTS
(Unaudited)
Note 1 — Basis of Presentation and Current Accounting Developments
East West Bancorp, Inc. (referred to herein on an unconsolidated basis as “East West” and on a consolidated basis as the “Company”) is a registered bank holding company that offers a full range of banking services to individuals and businesses through its subsidiary bank, East West Bank (“East West Bank” or the “Bank”) and its subsidiaries. The unaudited interim Consolidated Financial Statements in this Quarterly Report on Form 10-Q (“this Form 10-Q”) include the accounts of East West, East West Bank and East West’s subsidiaries. Intercompany transactions and accounts have been eliminated in consolidation. As of September 30, 2021, East West also has six wholly-owned subsidiaries that are statutory business trusts (the “Trusts”). In accordance with Financial Accounting Standards Board (“FASB”) Accounting Standards Codification (“ASC”) Topic 810, Consolidation, the Trusts are not included on the Consolidated Financial Statements.
The unaudited interim Consolidated Financial Statements are presented in accordance with United States (“U.S.”) generally accepted accounting principles (“GAAP”), applicable guidelines prescribed by regulatory authorities and general practices in the banking industry. While the unaudited interim Consolidated Financial Statements reflect all adjustments that, in the opinion of management, are necessary for fair presentation, they primarily serve to update the most recently filed annual report on Form 10-K, and may not include all the information and notes necessary to constitute a complete set of financial statements. Accordingly, they should be read in conjunction with the audited Consolidated Financial Statements and notes thereto included in the Company’s Annual Report on Form 10-K for the year ended December 31, 2020, filed with the U.S. Securities and Exchange Commission on February 26, 2021 (the “Company’s 2020 Form 10-K”). In addition, certain items on the Consolidated Financial Statements and notes for the prior periods have been reclassified to conform to the current period presentation.
The preparation of the Consolidated Financial Statements in conformity with U.S. GAAP requires management to make estimates and assumptions that affect the reported amounts of assets and liabilities as of the date of the Consolidated Financial Statements, income and expenses during the reporting period, and the related disclosures. Although our current estimates contemplate current conditions and how we expect them to change in the future, it is reasonably possible that actual results could be materially different from those estimates. Hence, the current period’s results of operations are not necessarily indicative of results that may be expected for any future interim period or for the year as a whole. Events subsequent to the Consolidated Balance Sheet date have been evaluated through the date the Consolidated Financial Statements are issued for inclusion in the accompanying Consolidated Financial Statements.
New Accounting Pronouncements Adopted | | | | | | | | | | | |
| Standard | Required Date of Adoption | Description | Effect on Financial Statements |
| Standards Adopted in 2021 |
ASU 2020-08, Codification Improvements to Subtopic 310-20, Receivables— Nonrefundable Fees and Other Costs
| January 1, 2021
Early adoption is
not permitted.
| The amendments in this ASU updates ASU 2017-08, Receivables — Nonrefundable Fees and Other Costs (Subtopic 310-20): Premium Amortization on Purchased Callable Debt Securities, by clarifying that an entity should reevaluate whether a callable debt security is within the scope of paragraph 310-20-35-33 for each reporting period. If the security contained additional future call dates, an entity should consider whether the amortized cost basis exceeded the amount repayable by the issuer at the next call date. If so, the excess should be amortized to the next call date. This ASU also clarifies if there is no remaining premium or if there are no further call dates, the entity shall reset the effective yield using the payment terms of the debt security.
The amendments of this guidance should be applied on a prospective basis as of the beginning of the period of adoption for existing or newly purchased callable debt securities. | The Company adopted this guidance on
a prospective basis in January 2021.
The adoption of this guidance did not
have an impact on the Company’s
Consolidated Financial Statements.
|
| | | |
| | | |
| | | |
| | | |
| | | |
| | | |
| | | | | | | | | | | |
| Standard | Required Date of Adoption | Description | Effect on Financial Statements |
| Standards Adopted in 2021 (continued) |
| | | |
ASU 2020-04, Reference Rate Reform (Topic 848): Facilitation of the Effects of Reference Rate Reform on Financial Reporting and subsequent related ASU 2021-01, Reference Rate Reform (Topic 848): Scope
| Effective for all entities from the dates of issuance through December 31, 2022. | In March 2020, the FASB issued an ASU related to contracts or hedging relationships that reference London Interbank Offered Rate (“LIBOR”) or other reference rates that are expected to be discontinued due to reference rate reform. This ASU provides temporary optional expedients and exceptions regarding the accounting requirements related to the modification of certain contracts, hedging relationships and other transactions that are affected by the reference rate reform. The guidance permits the Company to make a one-time election to sell and/or transfer qualifying held-to-maturity securities, and not to apply modification accounting or remeasure lease payments in lease contracts if the changes to the contract are related to the discontinuation of the reference rate. If certain criteria are met, the amendments also allow exceptions to the de-designation criteria of the hedging relationships and the assessment of hedge effectiveness during the transition period. This one-time election may be made at any time after March 12, 2020, but no later than December 31, 2022. In January 2021, the FASB issued ASU 2021-01 as subsequent amendments, which expanded the scope of Topic 848 to include all affected derivatives and clarified certain optional expedients and exceptions regarding the hedge accounting for derivative contracts affected by the discounting transition.
The amendments of this guidance could be elected retrospectively or prospectively to new modifications made on or after the date of issuance of this ASU, January 7, 2021. | The Company adopted this guidance on a prospective basis in January 2021. At the time of adoption, the guidance did not have a material impact on the Company’s Consolidated Financial Statements. The Company will continue to track the exposure as of each reporting period and to assess the impact as the reference rate transition occurs through the cessation of LIBOR. |
| | | |
| | | |
ASU 2019-12, Income Taxes (Topic 740): Simplifying the Accounting for Income Taxes | January 1, 2021
Early adoption is permitted on January 1, 2020. | This ASU simplifies the accounting for income taxes by removing certain exceptions to the existing guidance. This includes removing exceptions to: 1) the incremental approach for intraperiod tax allocation, 2) the requirement to recognize a deferred tax liability for equity method investments when a foreign subsidiary becomes an equity method investment, 3) the ability not to recognize a deferred tax liability when a foreign equity method investment becomes a subsidiary, and 4) the general methodology for calculating income taxes in an interim period when a year-to-date loss exceeds the anticipated loss for the year.
In addition, this ASU simplifies the accounting for income taxes related to franchise taxes, the tax basis of goodwill and the method for recognizing an enacted change in tax laws. This ASU also specifies that an entity is not required to allocate the consolidated amount of tax expense to a legal entity that is not subject to tax in its separate financial statements. This ASU also makes improvements in the accounting for income taxes related to employee stock ownership plans and equity method investments in qualified affordable housing projects.
This guidance should be applied on either a retrospective, modified retrospective or prospective basis depending on the amendments. | The Company adopted this guidance in January 2021 using the transition guidance prescribed by this ASU. At the time of adoption, this guidance did not have a material impact on the Company’s Consolidated Financial Statements. |
| | | |
| | | |
Note 2 — Fair Value Measurement and Fair Value of Financial Instruments
Fair Value Determination
Fair value is defined as the price that would be received to sell an asset or the price that would be paid to transfer a liability in an orderly transaction between market participants at the measurement date. In determining the fair value of financial instruments, the Company uses various methods including market and income approaches. Based on these approaches, the Company utilizes certain assumptions that market participants would use in pricing an asset or a liability. These inputs can be readily observable, market corroborated or generally unobservable. The Company utilizes valuation techniques that maximize the use of observable inputs and minimize the use of unobservable inputs. The fair value hierarchy described below is based on the quality and reliability of the information used to determine fair value. The fair value hierarchy gives the highest priority to quoted prices available in active markets and the lowest priority to prices derived from data lacking transparency. The fair value of the Company’s assets and liabilities is classified and disclosed in one of the following three categories:
•Level 1 — Valuation is based on quoted prices for identical instruments traded in active markets.
•Level 2 — Valuation is based on quoted prices for similar instruments traded in active markets; quoted prices for identical or similar instruments traded in markets that are not active; and model-derived valuations whose inputs are observable and can be corroborated by market data.
•Level 3 — Valuation is based on significant unobservable inputs for determining the fair value of assets or liabilities. These significant unobservable inputs reflect assumptions that market participants may use in pricing the assets or liabilities.
The classification of assets and liabilities within the hierarchy is based on whether inputs to the valuation methodology used are observable or unobservable, and the significance of those inputs in the fair value measurement. The Company’s assets and liabilities are classified in their entirety based on the lowest level of input that is significant to their fair value measurements.
Assets and Liabilities Measured at Fair Value on a Recurring Basis
The following section describes the valuation methodologies used by the Company to measure financial assets and liabilities on a recurring basis, as well as the general classification of these instruments within the fair value hierarchy.
Available-for-Sale Debt Securities — The fair value of AFS debt securities is generally determined by independent external pricing service providers who have experience in valuing these securities or by taking the average quoted market prices obtained from independent external brokers. The valuations provided by the third-party pricing service providers are based on observable market inputs, which include benchmark yields, reported trades, issuer spreads, benchmark securities, bids, offers, prepayment expectation and reference data obtained from market research publications. Inputs used by the third-party pricing service providers in valuing collateralized mortgage obligations and other securitization structures also include new issue data, monthly payment information, whole loan collateral performance, tranche evaluation and “To Be Announced” prices. In valuing securities issued by state and political subdivisions, inputs used by third-party pricing service providers also include material event notices.
On a monthly basis, the Company validates the valuations provided by third-party pricing service providers to ensure that the fair value determination is consistent with the applicable accounting guidance and the financial instruments are properly classified in the fair value hierarchy. To perform this validation, the Company compares fair values provided by the third-party pricing service providers to prices from other available independent sources for the same securities. When significant variances in prices are identified, the Company further compares inputs used by different sources to ascertain the reliability of these sources. On a quarterly basis, the Company reviews the documentation received from the third-party pricing service providers regarding the valuation inputs and methodology used for each category of securities.
When available, the Company uses quoted market prices to determine the fair value of AFS debt securities that are classified as Level 1. Level 1 AFS debt securities consist of U.S. Treasury securities. When pricing is unavailable from third-party pricing service providers for certain securities, the Company requests market quotes from various independent external brokers and utilizes the average quoted market prices. In addition, the Company obtains market quotes from other official published sources. As these valuations are based on observable inputs in the current marketplace, they are classified as Level 2. The Company periodically communicates with the independent external brokers to validate their pricing methodology. Information such as pricing sources, pricing assumptions, data inputs, and valuation techniques are reviewed periodically.
Equity Securities — Equity securities consisted of mutual funds as of both September 30, 2021 and December 31, 2020. The Company invested in these mutual funds for Community Reinvestment Act (“CRA”) purposes. The Company uses net asset value (“NAV”) information to determine the fair value of these equity securities. When NAV is available periodically and the equity securities can be put back to the transfer agents at the publicly available NAV, the fair value of the equity securities is classified as Level 1. When NAV is available periodically but the equity securities may not be readily marketable at its periodic NAV in the secondary market, the fair value of these equity securities is classified as Level 2.
Interest Rate Contracts — The Company enters into interest rate swap and option contracts that are not designated as hedging instruments with its borrowers to lock in attractive intermediate and long-term interest rates, resulting in the customer obtaining a synthetic fixed-rate loan. To economically hedge against the interest rate risks in the products offered to its customers, the Company enters into mirrored offsetting interest rate contracts with third-party financial institutions. The Company also enters into interest rate swap contracts with institutional counterparties to hedge against certain variable interest rate borrowings. These interest rate swap contracts with institutional counterparties were designated as cash flow hedges. The fair value of the interest rate swaps is determined using the market standard methodology of netting the discounted future fixed cash payments (or receipts) and the discounted expected variable cash receipts (or payments). The fair value of the interest rate options, which consist of floors and caps, is determined using the market standard methodology of discounting the future expected cash receipts that would occur if variable interest rates fall below (rise above) the strike rate of the floors (caps). In addition, to comply with the provisions of ASC 820, Fair Value Measurement, the Company incorporates credit valuation adjustments to appropriately reflect both its own nonperformance risk and the respective counterparty’s nonperformance risk in the fair value measurements of its derivatives. The credit valuation adjustments associated with the Company’s derivatives utilize model-derived credit spreads, which are Level 3 inputs. Considering the observable nature of all other significant inputs utilized, the Company classifies these derivative instruments as Level 2.
Foreign Exchange Contracts — The Company enters into foreign exchange contracts to accommodate the business needs of its customers. For a majority of the foreign exchange contracts entered with its customers, the Company entered into offsetting foreign exchange contracts with third-party financial institutions to manage its exposure. The Company also utilizes foreign exchange contracts that are not designated as hedging instruments to mitigate the economic effect of fluctuations in certain foreign currency on-balance sheet assets and liabilities, primarily foreign currency denominated deposits that it offers to its customers. The fair value of foreign exchange contracts is determined at each reporting period based on changes in the foreign exchange rates. These are over-the-counter contracts where quoted market prices are not readily available. Valuation is measured using conventional valuation methodologies with observable market data. Due to the short-term nature of the majority of these contracts, the counterparties’ credit risks are considered nominal and result in no adjustments to the valuation of the foreign exchange contracts. Due to the observable nature of the inputs used in deriving the fair value of these contracts, the valuation of foreign exchange contracts are classified as Level 2. As of September 30, 2021 and December 31, 2020, the Bank held foreign currency non-deliverable forward contracts to hedge its net investment in its China subsidiary, East West Bank (China) Limited, a non-U.S. dollar (“USD”) functional currency subsidiary in China. These foreign currency non-deliverable forward contracts were designated as net investment hedges. The fair value of foreign currency non-deliverable forward contracts is determined by comparing the contracted foreign exchange rate to the current market foreign exchange rate. Key inputs of the current market exchange rate include spot rates and forward rates of the contractual currencies. Foreign exchange forward curves are used to determine which forward rate pertains to a specific maturity. Due to the observable nature of the inputs used in deriving the estimated fair value, these instruments are classified as Level 2.
Credit Contracts — The Company may periodically enter into credit risk participation agreements (“RPAs”) to manage the credit exposure on interest rate contracts associated with the syndicated loans. The Company may enter into protection sold or protection purchased RPAs with institutional counterparties. The fair value of RPAs is calculated by determining the total expected asset or liability exposure of the derivatives to the borrowers and applying the borrowers’ credit spread to that exposure. Total expected exposure incorporates both the current and potential future exposure of the derivatives, derived from using observable inputs, such as yield curves and volatilities. The majority of the inputs used to value the RPAs are observable; accordingly, RPAs are classified as Level 2.
Equity Contracts — As part of the loan origination process, the Company periodically obtains warrants to purchase preferred and/or common stock of technology and life sciences companies to which it provides loans. As of September 30, 2021 and December 31, 2020, the warrants included on the Consolidated Financial Statements were from both public and private companies. The Company values these warrants based on the Black-Scholes option pricing model. For warrants from public companies, the model uses the underlying stock price, stated strike price, warrant expiration date, risk-free interest rate based on a duration-matched U.S. Treasury rate, and market-observable company-specific option volatility as inputs to value the warrants. Due to the observable nature of the inputs used in deriving the estimated fair value, warrants from public companies are classified as Level 2. For warrants from private companies, the model uses inputs such as the offering price observed in the most recent round of funding, stated strike price, warrant expiration date, risk-free interest rate based on duration-matched U.S. Treasury rate and option volatility. The Company applies proxy volatilities based on the industry sectors of the private companies. The model values are then adjusted for a general lack of liquidity due to the private nature of the underlying companies. Since both option volatility and liquidity discount assumptions are subject to management’s judgment, measurement uncertainty is inherent in the valuation of private companies’ warrants. Due to the unobservable nature of the option volatility and liquidity discount assumptions used in deriving the estimated fair value, warrants from private companies are classified as Level 3. On a quarterly basis, the changes in the fair value of warrants from private companies are reviewed for reasonableness, and a measurement of uncertainty analysis on the option volatility and liquidity discount assumptions is performed.
Commodity Contracts — The Company enters into energy commodity contracts in the form of swaps and options with its oil and gas loan customers to allow them to hedge against the risk of fluctuation in energy commodity prices. The fair value of the commodity option contracts is determined using the Black-Scholes model and assumptions that include expectations of future commodity price and volatility. The future commodity contract price is derived from observable inputs such as the market price of the commodity. Commodity swaps are structured as an exchange of fixed cash flows for floating cash flows. The fair value of the commodity swaps is determined using the market standard methodology of netting the discounted future fixed cash payments (or receipts) and the discounted expected variable cash receipts (or payments) based on the market prices of the commodity. The fixed cash flows are predetermined based on the known volumes and fixed price as specified in the swap agreement. The floating cash flows are correlated with the change of forward commodity prices, which is derived from market corroborated futures settlement prices. As a result, the Company classifies these derivative instruments as Level 2 due to the observable nature of the significant inputs utilized.
The following tables present financial assets and liabilities that are measured at fair value on a recurring basis as of September 30, 2021 and December 31, 2020:
| | | | | | | | | | | | | | | | | | | | | | | | | | |
|
| ($ in thousands) | | Assets and Liabilities Measured at Fair Value on a Recurring Basis
as of September 30, 2021 |
| Quoted Prices in
Active Markets
for Identical
Assets
(Level 1) | | Significant
Other
Observable
Inputs
(Level 2) | | Significant
Unobservable
Inputs
(Level 3) | | Total
Fair Value |
| AFS debt securities: | | | | | | | | |
| U.S. Treasury securities | | $ | 941,724 | | | $ | — | | | $ | — | | | $ | 941,724 | |
| U.S. government agency and U.S. government-sponsored enterprise debt securities | | — | | | 1,363,109 | | | — | | | 1,363,109 | |
| U.S. government agency and U.S. government-sponsored enterprise mortgage-backed securities: | | | | | | | | |
| Commercial mortgage-backed securities | | — | | | 1,274,467 | | | — | | | 1,274,467 | |
| Residential mortgage-backed securities | | — | | | 2,791,064 | | | — | | | 2,791,064 | |
| Municipal securities | | — | | | 501,489 | | | — | | | 501,489 | |
| Non-agency mortgage-backed securities: | | | | | | | | |
| Commercial mortgage-backed securities | | — | | | 464,770 | | | — | | | 464,770 | |
| Residential mortgage-backed securities | | — | | | 901,256 | | | — | | | 901,256 | |
| Corporate debt securities | | — | | | 618,671 | | | — | | | 618,671 | |
| Foreign government bonds | | — | | | 254,848 | | | — | | | 254,848 | |
| Asset-backed securities | | — | | | 76,799 | | | — | | | 76,799 | |
| Collateralized loan obligations (“CLOs”) | | — | | | 524,809 | | | — | | | 524,809 | |
Total AFS debt securities | | $ | 941,724 | | | $ | 8,771,282 | | | $ | — | | | $ | 9,713,006 | |
| | | | | | | | |
Investments in tax credit and other investments: | | | | | | | | |
Equity securities (1) | | $ | 22,289 | | | $ | 4,496 | | | $ | — | | | $ | 26,785 | |
Total investments in tax credit and other investments | | $ | 22,289 | | | $ | 4,496 | | | $ | — | | | $ | 26,785 | |
| | | | | | | | |
| Derivative assets: | | | | | | | | |
| Interest rate contracts | | $ | — | | | $ | 298,831 | | | $ | — | | | $ | 298,831 | |
| Foreign exchange contracts | | — | | | 31,875 | | | — | | | 31,875 | |
| Credit contracts | | — | | | 15 | | | — | | | 15 | |
| Equity contracts | | — | | | 6 | | | 220 | | | 226 | |
| Commodity contracts | | — | | | 363,063 | | | — | | | 363,063 | |
| Gross derivative assets | | $ | — | | | $ | 693,790 | | | $ | 220 | | | $ | 694,010 | |
Netting adjustments (2) | | $ | — | | | $ | (165,483) | | | $ | — | | | $ | (165,483) | |
| Net derivative assets | | $ | — | | | $ | 528,307 | | | $ | 220 | | | $ | 528,527 | |
| | | | | | | | |
| Derivative liabilities: | | | | | | | | |
| Interest rate contracts | | $ | — | | | $ | 213,328 | | | $ | — | | | $ | 213,328 | |
| Foreign exchange contracts | | — | | | 24,313 | | | — | | | 24,313 | |
| Credit contracts | | — | | | 120 | | | — | | | 120 | |
| Commodity contracts | | — | | | 324,027 | | | — | | | 324,027 | |
| Gross derivative liabilities | | $ | — | | | $ | 561,788 | | | $ | — | | | $ | 561,788 | |
Netting adjustments (2) | | $ | — | | | $ | (342,619) | | | $ | — | | | $ | (342,619) | |
| Net derivative liabilities | | $ | — | | | $ | 219,169 | | | $ | — | | | $ | 219,169 | |
|
| | | | | | | | | | | | | | | | | | | | | | | | | | |
|
| ($ in thousands) | | Assets and Liabilities Measured at Fair Value on a Recurring Basis
as of December 31, 2020 |
| Quoted Prices in
Active Markets
for Identical
Assets
(Level 1) | | Significant
Other
Observable
Inputs
(Level 2) | | Significant
Unobservable
Inputs
(Level 3) | | Total
Fair Value |
| AFS debt securities: | | | | | | | | |
| U.S. Treasury securities | | $ | 50,761 | | | $ | — | | | $ | — | | | $ | 50,761 | |
| U.S. government agency and U.S. government-sponsored enterprise debt securities | | — | | | 814,319 | | | — | | | 814,319 | |
| U.S. government agency and U.S. government-sponsored enterprise mortgage-backed securities: | | | | | | | | |
| Commercial mortgage-backed securities | | — | | | 1,153,770 | | | — | | | 1,153,770 | |
| Residential mortgage-backed securities | | — | | | 1,660,894 | | | — | | | 1,660,894 | |
| Municipal securities | | — | | | 396,073 | | | — | | | 396,073 | |
| Non-agency mortgage-backed securities: | | | | | | | | |
| Commercial mortgage-backed securities | | — | | | 239,842 | | | — | | | 239,842 | |
| Residential mortgage-backed securities | | — | | | 289,775 | | | — | | | 289,775 | |
| Corporate debt securities | | — | | | 405,968 | | | — | | | 405,968 | |
| Foreign government bonds | | — | | | 182,531 | | | — | | | 182,531 | |
| Asset-backed securities | | — | | | 63,231 | | | — | | | 63,231 | |
| CLOs | | — | | | 287,494 | | | — | | | 287,494 | |
Total AFS debt securities | | $ | 50,761 | | | $ | 5,493,897 | | | $ | — | | | $ | 5,544,658 | |
| | | | | | | | |
Investments in tax credit and other investments: | | | | | | | | |
Equity securities (1) | | $ | 22,548 | | | $ | 8,724 | | | $ | — | | | $ | 31,272 | |
Total investments in tax credit and other investments | | $ | 22,548 | | | $ | 8,724 | | | $ | — | | | $ | 31,272 | |
| | | | | | | | |
| Derivative assets: | | | | | | | | |
| Interest rate contracts | | $ | — | | | $ | 489,132 | | | $ | — | | | $ | 489,132 | |
| Foreign exchange contracts | | — | | | 30,300 | | | — | | | 30,300 | |
| Credit contracts | | — | | | 13 | | | — | | | 13 | |
| Equity contracts | | — | | | 585 | | | 273 | | | 858 | |
| Commodity contracts | | — | | | 82,451 | | | — | | | 82,451 | |
| Gross derivative assets | | $ | — | | | $ | 602,481 | | | $ | 273 | | | $ | 602,754 | |
Netting adjustments (2) | | $ | — | | | $ | (101,512) | | | $ | — | | | $ | (101,512) | |
| Net derivative assets | | $ | — | | | $ | 500,969 | | | $ | 273 | | | $ | 501,242 | |
| | | | | | | | |
| Derivative liabilities: | | | | | | | | |
| Interest rate contracts | | $ | — | | | $ | 317,698 | | | $ | — | | | $ | 317,698 | |
| Foreign exchange contracts | | — | | | 22,759 | | | — | | | 22,759 | |
| Credit contracts | | — | | | 206 | | | — | | | 206 | |
| Commodity contracts | | — | | | 84,165 | | | — | | | 84,165 | |
| Gross derivative liabilities | | $ | — | | | $ | 424,828 | | | $ | — | | | $ | 424,828 | |
Netting adjustments (2) | | $ | — | | | $ | (184,697) | | | $ | — | | | $ | (184,697) | |
| Net derivative liabilities | | $ | — | | | $ | 240,131 | | | $ | — | | | $ | 240,131 | |
|
(1)Equity securities consist of mutual funds with readily determinable fair values. The Company invested in these mutual funds for CRA purposes.
(2)Represents balance sheet netting of derivative assets and liabilities and related cash collateral under master netting agreements or similar agreements. See Note 5 — Derivatives to the Consolidated Financial Statements in this Form 10-Q for additional information.
For the three and nine months ended September 30, 2021 and 2020, Level 3 fair value measurements that were measured on a recurring basis consisted of warrants issued by private companies. The following table provides a reconciliation of the beginning and ending balances of these equity contracts for the three and nine months ended September 30, 2021 and 2020:
| | | | | | | | | | | | | | | | | | | | | | | | | | |
|
| ($ in thousands) | | Three Months Ended September 30, | | Nine Months Ended September 30, |
| 2021 | | 2020 | | 2021 | | 2020 |
| Equity Contracts | | | | | | | | |
| Beginning balance | | $ | 223 | | | $ | 316 | | | $ | 273 | | | $ | 421 | |
| | | | | | | | |
Total (losses) gains included in earnings (1) | | (9) | | | (6) | | | 37 | | | 8,262 | |
| | | | | | | | |
| | | | | | | | |
| | | | | | | | |
| | | | | | | | |
| Issuances | | 12 | | | — | | | 12 | | | — | |
| | | | | | | | |
| | | | | | | | |
| Settlements | | — | | | — | | | (96) | | | — | |
Transfers out of Level 3 (2) | | (6) | | | — | | | (6) | | | (8,373) | |
| Ending balance | | $ | 220 | | | $ | 310 | | | $ | 220 | | | $ | 310 | |
|
(1)Include both realized and unrealized gain (losses) recorded in Lending fees on the Consolidated Statement of Income. The unrealized (losses) gains were $(9) thousand and $(6) thousand for the three months ended September 30, 2021 and 2020, respectively, and $(38) thousand and $8.3 million for the nine months ended September 30, 2021 and 2020, respectively.
(2)During the three and nine months ended September 30, 2021, the Company transferred $6 thousand of equity contracts measured on a recurring basis out of Level 3 into Level 2 after the corresponding issuer of the equity contracts, which was previously a private company, completed its initial public offering and became a public company. In comparison, zero and $8.4 million were transferred out of Level 3 for the same reason during the three and nine months ended September 30, 2020, respectively.
The following table presents quantitative information about the significant unobservable inputs used in the valuation of Level 3 fair value measurements as of September 30, 2021 and December 31, 2020, respectively. The significant unobservable inputs presented in the table below are those that the Company considers significant to the fair value of the Level 3 assets. The Company considers unobservable inputs to be significant if, by their exclusion, the fair value of the Level 3 assets would be impacted by a predetermined percentage change.
| | | | | | | | | | | | | | | | | | | | | | | | | | | | | | | | |
|
| ($ in thousands) | | Fair Value
Measurements
(Level 3) | | Valuation
Technique | | Unobservable
Inputs | | Range of Inputs | | Weighted- Average of Inputs (1) |
| September 30, 2021 | | | | | | | | | | |
| Derivative assets: | | | | | | | | | | |
| Equity contracts | | $ | 220 | | | Black-Scholes option pricing model | | Equity volatility | | 45% — 54% | | 49% |
| | | | | | Liquidity discount | | 47% | | 47% |
| December 31, 2020 | | | | | | | | | | |
| Derivative assets: | | | | | | | | | | |
| Equity contracts | | $ | 273 | | | Black-Scholes option pricing model | | Equity volatility | | 46% — 61% | | 53% |
| | | | | | Liquidity discount | | 47% | | 47% |
|
(1)Weighted-average of inputs is calculated based on the fair value of equity contracts as of September 30, 2021 and December 31, 2020.
Assets and Liabilities Measured at Fair Value on a Nonrecurring Basis
Assets measured at fair value on a nonrecurring basis include certain individually evaluated loans held-for-investment, investments in qualified affordable housing partnerships, tax credit and other investments, OREO, loans held-for-sale, and other nonperforming assets. Nonrecurring fair value adjustments result from impairment on certain individually evaluated loans held-for-investment and investments in qualified affordable housing partnerships, tax credit and other investments, from write-downs of OREO and other nonperforming assets, or from the application of lower of cost or fair value on loans held-for-sale.
Individually Evaluated Loans Held-For-Investment — Individually evaluated loans held-for-investment are classified as Level 3 assets. The following two methods are used to derive the fair value of individually evaluated loans held-for-investment:
•Discounted cash flow valuation techniques that consist of developing an expected stream of cash flows over the life of the loans, and then calculating the present value of the loans by discounting the expected cash flows at a designated discount rate.
•When the repayment of an individually evaluated loan is dependent on the sale of the collateral, the fair value of the loan is determined based on the fair value of the underlying collateral, which may take the form of real estate, inventory, equipment, contracts or guarantees. The fair value of the underlying collateral is generally based on third-party appraisals, or an internal valuation if a third-party appraisal is not required by regulations, or unavailable. An internal valuation utilizes one or more valuation techniques such as the income, market and/or cost approaches.
Investments in Qualified Affordable Housing Partnerships, Tax Credit and Other Investments — The Company conducts due diligence on its investments in qualified affordable housing partnerships, tax credit and other investments prior to the initial investment date and through the placed-in-service date. After these investments are either acquired or placed into service, the Company continues its periodic monitoring process to ensure book values are realizable and that there is no significant tax credit recapture risk. This monitoring process includes the quarterly review of the financial statements, the annual review of tax returns of the investment entity, the annual review of the financial statements of the guarantor (if any) and a comparison of the actual performance of the investment against the financial projections prepared at the time when the investment was made. The Company assesses its tax credit and other investments for possible other-than-temporary impairment (“OTTI”) on an annual basis or when events or circumstances suggest that the carrying amount of the investments may not be realizable. These circumstances can include, but are not limited to the following factors:
•expected future cash flows that are less than the carrying amount of the investment;
•changes in the economic, market or technological environment that could adversely affect the investee’s operations; and
•other factors that raise doubt about the investee’s ability to continue as a going concern, such as negative cash flows from operations and the continuing prospects of the underlying operations of the investment.
All available evidence is considered in assessing whether a decline in value is other-than-temporary. Generally, none of the aforementioned factors are individually conclusive and the relative importance placed on individual facts may vary depending on the situation. In accordance with ASC 323-10-35-32, an impairment charge would only be recognized in earnings for a decline in value that is determined to be other-than-temporary.
Other Real Estate Owned — The Company’s OREO represents properties acquired through foreclosure, or through full or partial satisfaction of loans held-for-investment. These OREO properties are recorded at estimated fair value less the costs to sell at the time of foreclosure and at the lower of cost or estimated fair value less the costs to sell subsequent to acquisition. On a monthly basis, the current fair market value of each OREO property is reviewed to ensure that the current carrying value is appropriate. OREO properties are classified as Level 3.
Other Nonperforming Assets — Other nonperforming assets are recorded at fair value upon transfers from loans to foreclosed assets. Subsequently, foreclosed assets are recorded at the lower of carrying value or fair value. Fair value is based on independent market prices, appraised values of the collateral or management’s estimates of the foreclosed asset. The Company records an impairment when the foreclosed asset’s fair value declines below its carrying value. Other nonperforming assets are classified as Level 3.
The following tables present the carrying amounts of assets that were still held and had fair value adjustments measured on a nonrecurring basis as of September 30, 2021 and December 31, 2020:
| | | | | | | | | | | | | | | | | | | | | | | | | | |
|
| ($ in thousands) | | Assets Measured at Fair Value on a Nonrecurring Basis
as of September 30, 2021 |
| Quoted Prices in
Active Markets
for Identical
Assets
(Level 1) | | Significant
Other
Observable
Inputs
(Level 2) | | Significant
Unobservable
Inputs
(Level 3) | | Fair Value
Measurements |
| Loans held-for-investment: | | | | | | | | |
| Commercial: | | | | | | | | |
| Commercial and industrial (“C&I”) | | $ | — | | | $ | — | | | $ | 123,233 | | | $ | 123,233 | |
| Commercial real estate (“CRE”): | | | | | | | | |
| CRE | | — | | | — | | | 9,400 | | | 9,400 | |
| Multifamily residential | | — | | | — | | | 2,958 | | | 2,958 | |
| | | | | | | | |
| | | | | | | | |
| Total commercial | | — | | | — | | | 135,591 | | | 135,591 | |
| Consumer: | | | | | | | | |
| Residential mortgage: | | | | | | | | |
| | | | | | | | |
| Home equity lines of credit (“HELOCs”) | | — | | | — | | | 2,739 | | | 2,739 | |
| | | | | | | | |
| | | | | | | | |
| Total consumer | | — | | | — | | | 2,739 | | | 2,739 | |
| Total loans held-for-investment | | $ | — | | | $ | — | | | $ | 138,330 | | | $ | 138,330 | |
| | | | | | | | |
| | | | | | | | |
| Other nonperforming assets | | $ | — | | | $ | — | | | $ | 699 | | | $ | 699 | |
| | | | | | | | |
| | | | | | | | | | | | | | | | | | | | | | | | | | |
|
| ($ in thousands) | | Assets Measured at Fair Value on a Nonrecurring Basis
as of December 31, 2020 |
| Quoted Prices in
Active Markets
for Identical
Assets
(Level 1) | | Significant
Other
Observable
Inputs
(Level 2) | | Significant
Unobservable
Inputs
(Level 3) | | Fair Value
Measurements |
| Loans held-for-investment: | | | | | | | | |
| Commercial: | | | | | | | | |
| C&I | | $ | — | | | $ | — | | | $ | 143,331 | | | $ | 143,331 | |
| CRE: | | | | | | | | |
| CRE | | — | | | — | | | 42,894 | | | 42,894 | |
| | | | | | | | |
| | | | | | | | |
| | | | | | | | |
| Total commercial | | — | | | — | | | 186,225 | | | 186,225 | |
| Consumer: | | | | | | | | |
| Residential mortgage: | | | | | | | | |
| | | | | | | | |
| HELOCs | | — | | | — | | | 1,146 | | | 1,146 | |
| | | | | | | | |
| Other consumer | | — | | | — | | | 2,491 | | | 2,491 | |
| Total consumer | | — | | | — | | | 3,637 | | | 3,637 | |
| Total loans held-for-investment | | $ | — | | | $ | — | | | $ | 189,862 | | | $ | 189,862 | |
Investments in tax credit and other investments, net | | $ | — | | | $ | — | | | $ | 3,140 | | | $ | 3,140 | |
OREO (1) | | $ | — | | | $ | — | | | $ | 15,824 | | | $ | 15,824 | |
| | | | | | | | |
| | | | | | | | |
(1)Amounts are included in Other assets on the Consolidated Balance Sheet and represent the carrying value of OREO properties that were written down subsequent to their initial classification as OREO.
The following table presents the (decrease) increase in fair value of certain assets held at the end of the respective reporting periods, for which a nonrecurring fair value adjustment was recognized during the periods presented:
| | | | | | | | | | | | | | | | | | | | | | | | | | |
|
| ($ in thousands) | | Three Months Ended September 30, | | Nine Months Ended September 30, |
| 2021 | | 2020 | | 2021 | | 2020 |
Loans held-for-investment (1): | | | | | | | | |
| Commercial: | | | | | | | | |
| C&I | | $ | (4,977) | | | $ | (24,928) | | | $ | (13,590) | | | $ | (38,855) | |
| CRE: | | | | | | | | |
| CRE | | (106) | | | (15) | | | (7,186) | | | (292) | |
| Multifamily residential | | 16 | | | — | | | — | | | — | |
| | | | | | | | |
| | | | | | | | |
| Total commercial | | (5,067) | | | (24,943) | | | (20,776) | | | (39,147) | |
| Consumer: | | | | | | | | |
| Residential mortgage: | | | | | | | | |
| | | | | | | | |
| HELOCs | | 3 | | | 3 | | | (6) | | | (178) | |
| | | | | | | | |
| Other consumer | | — | | | — | | | (2,491) | | | 2,491 | |
| Total consumer | | 3 | | | 3 | | | (2,497) | | | 2,313 | |
| Total loans held-for-investment | | $ | (5,064) | | | $ | (24,940) | | | $ | (23,273) | | | $ | (36,834) | |
| Investments in tax credit and other investments, net | | $ | — | | | $ | — | | | $ | 877 | | | $ | (583) | |
| | | | | | | | |
| Other nonperforming assets | | $ | (43) | | | $ | — | | | $ | (3,933) | | | $ | — | |
|
(1) Excludes loans fully charged off.
The following table presents the quantitative information about the significant unobservable inputs used in the valuation of Level 3 fair value measurements that are measured on a nonrecurring basis as of September 30, 2021 and December 31, 2020:
| | | | | | | | | | | | | | | | | | | | | | | | | | | | | | | | |
|
| ($ in thousands) | | Fair Value
Measurements
(Level 3) | | Valuation
Techniques | | Unobservable
Inputs | | Range of
Inputs | | Weighted- Average of Inputs (1) |
| September 30, 2021 | | | | | | | | | | |
| Loans held-for-investment | | $ | 89,442 | | | Discounted cash flows | | Discount | | 4% — 15% | | 7% |
| | $ | 32,636 | | | Fair value of collateral | | Discount | | 15% — 81% | | 40% |
| | $ | 1,000 | | | Fair value of collateral | | Contract value | | NM | | NM |
| | $ | 15,252 | | | Fair value of property | | Selling cost | | 8% | | 8% |
| | | | | | | | | | |
| Other nonperforming assets | | $ | 699 | | | Fair value of collateral | | Contract value | | NM | | NM |
| | | | | | | | | | |
| | | | | | | | | | |
| December 31, 2020 | | | | | | | | | | |
| Loans held-for-investment | | $ | 104,783 | | | Discounted cash flows | | Discount | | 3% — 15% | | 11% |
| | | | | | | | | | |
| | $ | 22,207 | | | Fair value of collateral | | Discount | | 10% — 26% | | 15% |
| | $ | 15,879 | | | Fair value of collateral | | Contract value | | NM | | NM |
| | $ | 46,993 | | | Fair value of property | | Selling cost | | 7% — 26% | | 10% |
Investments in tax credit and other investments, net | | $ | 3,140 | | | Individual analysis of each investment | | Expected future tax benefits and distributions | | NM | | NM |
| OREO | | $ | 15,824 | | | Fair value of property | | Selling cost | | 8% | | 8% |
| | | | | | | | | | |
|
NM — Not meaningful.
(1)Weighted-average of inputs is based on the relative fair value of the respective assets as of September 30, 2021 and December 31, 2020.
Disclosures about Fair Value of Financial Instruments
The following tables present the fair value estimates for financial instruments as of September 30, 2021 and December 31, 2020, excluding financial instruments recorded at fair value on a recurring basis as they are included in the tables presented elsewhere in this Note. The carrying amounts in the following tables are recorded on the Consolidated Balance Sheet under the indicated captions, except for accrued interest receivable and mortgage servicing rights included in Other assets, and accrued interest payable included in Accrued expenses and other liabilities. These financial assets and liabilities are measured at amortized cost basis on the Company’s Consolidated Balance Sheet.
| | | | | | | | | | | | | | | | | | | | | | | | | | | | | | | | |
|
| ($ in thousands) | | September 30, 2021 |
| Carrying
Amount | | Level 1 | | Level 2 | | Level 3 | | Estimated
Fair Value |
| Financial assets: | | | | | | | | | | |
| Cash and cash equivalents | | $ | 4,852,901 | | | $ | 4,852,901 | | | $ | — | | | $ | — | | | $ | 4,852,901 | |
| Interest-bearing deposits with banks | | $ | 855,162 | | | $ | — | | | $ | 855,162 | | | $ | — | | | $ | 855,162 | |
| Resale agreements | | $ | 2,596,142 | | | $ | — | | | $ | 2,580,845 | | | $ | — | | | $ | 2,580,845 | |
| | | | | | | | | | |
| Restricted equity securities, at cost | | $ | 77,200 | | | $ | — | | | $ | 77,200 | | | $ | — | | | $ | 77,200 | |
| Loans held-for-sale | | $ | — | | | $ | — | | | $ | — | | | $ | — | | | $ | — | |
| Loans held-for-investment, net | | $ | 39,921,301 | | | $ | — | | | $ | — | | | $ | 39,953,031 | | | $ | 39,953,031 | |
| Mortgage servicing rights | | $ | 5,620 | | | $ | — | | | $ | — | | | $ | 8,858 | | | $ | 8,858 | |
| Accrued interest receivable | | $ | 151,826 | | | $ | — | | | $ | 151,826 | | | $ | — | | | $ | 151,826 | |
| Financial liabilities: | | | | | | | | | | |
| Demand, checking, savings and money market deposits | | $ | 45,117,548 | | | $ | — | | | $ | 45,117,548 | | | $ | — | | | $ | 45,117,548 | |
| Time deposits | | $ | 8,238,642 | | | $ | — | | | $ | 8,248,717 | | | $ | — | | | $ | 8,248,717 | |
| | | | | | | | | | |
| | | | | | | | | | |
| FHLB advances | | $ | 248,898 | | | $ | — | | | $ | 250,635 | | | $ | — | | | $ | 250,635 | |
| Repurchase agreements | | $ | 300,000 | | | $ | — | | | $ | 312,264 | | | $ | — | | | $ | 312,264 | |
| Long-term debt | | $ | 147,586 | | | $ | — | | | $ | 149,625 | | | $ | — | | | $ | 149,625 | |
| Accrued interest payable | | $ | 11,275 | | | $ | — | | | $ | 11,275 | | | $ | — | | | $ | 11,275 | |
|
| | | | | | | | | | | | | | | | | | | | | | | | | | | | | | | | |
|
| ($ in thousands) | | December 31, 2020 |
| Carrying
Amount | | Level 1 | | Level 2 | | Level 3 | | Estimated
Fair Value |
| Financial assets: | | | | | | | | | | |
| Cash and cash equivalents | | $ | 4,017,971 | | | $ | 4,017,971 | | | $ | — | | | $ | — | | | $ | 4,017,971 | |
| Interest-bearing deposits with banks | | $ | 809,728 | | | $ | — | | | $ | 809,728 | | | $ | — | | | $ | 809,728 | |
| Resale agreements | | $ | 1,460,000 | | | $ | — | | | $ | 1,464,635 | | | $ | — | | | $ | 1,464,635 | |
| | | | | | | | | | |
| Restricted equity securities, at cost | | $ | 83,046 | | | $ | — | | | $ | 83,046 | | | $ | — | | | $ | 83,046 | |
| Loans held-for-sale | | $ | 1,788 | | | $ | — | | | $ | 1,788 | | | $ | — | | | $ | 1,788 | |
| Loans held-for-investment, net | | $ | 37,770,972 | | | $ | — | | | $ | — | | | $ | 37,803,940 | | | $ | 37,803,940 | |
| | | | | | | | | | |
| Mortgage servicing rights | | $ | 5,522 | | | $ | — | | | $ | — | | | $ | 8,435 | | | $ | 8,435 | |
| Accrued interest receivable | | $ | 150,140 | | | $ | — | | | $ | 150,140 | | | $ | — | | | $ | 150,140 | |
| Financial liabilities: | | | | | | | | | | |
| | | | | | | | | | |
| Demand, checking, savings and money market deposits | | $ | 35,862,403 | | | $ | — | | | $ | 35,862,403 | | | $ | — | | | $ | 35,862,403 | |
| Time deposits | | $ | 9,000,349 | | | $ | — | | | $ | 9,016,884 | | | $ | — | | | $ | 9,016,884 | |
| Short-term borrowings | | $ | 21,009 | | | $ | — | | | $ | 21,009 | | | $ | — | | | $ | 21,009 | |
| FHLB advances | | $ | 652,612 | | | $ | — | | | $ | 659,631 | | | $ | — | | | $ | 659,631 | |
| Repurchase agreements | | $ | 300,000 | | | $ | — | | | $ | 317,850 | | | $ | — | | | $ | 317,850 | |
| Long-term debt | | $ | 147,376 | | | $ | — | | | $ | 150,131 | | | $ | — | | | $ | 150,131 | |
| Accrued interest payable | | $ | 11,956 | | | $ | — | | | $ | 11,956 | | | $ | — | | | $ | 11,956 | |
|
Note 3 — Assets Purchased under Resale Agreements and Sold under Repurchase Agreements
Assets Purchased under Resale Agreements
In resale agreements, the Company is exposed to credit risk for both counterparties and the underlying collateral. The Company manages credit exposure from certain transactions by entering into master netting agreements and collateral arrangements with counterparties. The relevant agreements allow for the efficient closeout of the transaction, liquidation and set-off of collateral against the net amount owed by the counterparty following a default. It is also the Company’s policy to take possession, where possible, of the assets underlying resale agreements. As a result of the Company’s credit risk mitigation practices with respect to resale agreements as described above, the Company did not hold any reserves for credit impairment with respect to these agreements as of both September 30, 2021 and December 31, 2020.
Securities Purchased under Resale Agreements — Total securities purchased under resale agreements were $1.34 billion and $1.16 billion as of September 30, 2021 and December 31, 2020, respectively. The weighted-average yields were 1.50% and 1.72% for the three months ended September 30, 2021 and 2020, respectively; and 1.53% and 2.09% for the nine months ended September 30, 2021 and 2020, respectively.
Loans Purchased under Resale Agreements — The Company participated in resale agreements collateralized with loans with multiple counterparties starting in the fourth quarter of 2020. Total loans purchased under resale agreements were $1.26 billion and $300.0 million as of September 30, 2021 and December 31, 2020, respectively. The weighted-average yields were 1.48% and 1.57% for the three and nine months ended September 30, 2021, respectively.
Assets Sold under Repurchase Agreements — As of September 30, 2021 and December 31, 2020, securities sold under the repurchase agreements consisted of U.S. Treasury securities and U.S. government agency and U.S. government-sponsored enterprise mortgage-backed securities. Gross repurchase agreements were $300.0 million as of both September 30, 2021 and December 31, 2020. The weighted-average interest rates were 2.57% and 2.70% for the three months ended September 30, 2021 and 2020, respectively, and 2.62% and 3.64% for the nine months ended September 30, 2021 and 2020, respectively. As of September 30, 2021, all repurchase agreements will mature in 2023.
Balance Sheet Offsetting
The Company’s resale and repurchase agreements are transacted under legally enforceable master netting agreements that, in the event of default by the counterparty, provide the Company the right to liquidate securities held and to offset receivables and payables with the same counterparty. The Company nets resale and repurchase transactions with the same counterparty on the Consolidated Balance Sheet when it has a legally enforceable master netting agreement and the transactions are eligible for netting under ASC 210-20-45-11, Balance Sheet Offsetting Repurchase and Reverse Repurchase Agreements. Collateral received includes securities and loans that are not recognized on the Consolidated Balance Sheet. Collateral pledged consists of securities that are not netted on the Consolidated Balance Sheet against the related collateralized liability. Securities received or pledged as collateral in resale and repurchase agreements with other financial institutions may also be sold or re-pledged by the secured party, and are usually delivered to and held by the third-party trustees.
The following tables present the resale and repurchase agreements included on the Consolidated Balance Sheet as of September 30, 2021 and December 31, 2020:
| | | | | | | | | | | | | | | | | | | | | | | | | | | | | | | | |
|
| ($ in thousands) | | September 30, 2021 |
| | | | | | | | | | |
| Assets | | Gross
Amounts
of Recognized
Assets | | Gross Amounts
Offset on the
Consolidated
Balance Sheet | | Net Amounts of
Assets Presented
on the Consolidated
Balance Sheet | | Gross Amounts Not Offset on the
Consolidated Balance Sheet | | Net
Amount |
| | | | |
| | | | Collateral Received | |
| Resale agreements | | $ | 2,596,142 | | | $ | — | | | $ | 2,596,142 | | | $ | (2,580,187) | | (1) | $ | 15,955 | |
| | | | | | | | | | |
| Liabilities | | Gross
Amounts
of Recognized
Liabilities | | Gross Amounts
Offset on the
Consolidated
Balance Sheet | | Net Amounts of
Liabilities Presented
on the Consolidated
Balance Sheet | | Gross Amounts Not Offset on the
Consolidated Balance Sheet | | Net
Amount |
| | | | |
| | | | Collateral Pledged | |
| Repurchase agreements | | $ | 300,000 | | | $ | — | | | $ | 300,000 | | | $ | (300,000) | | (2) | $ | — | |
|
| | | | | | | | | | | | | | | | | | | | | | | | | | | | | | | | |
|
| ($ in thousands) | | December 31, 2020 |
| | | | | | | | | | |
| | Gross
Amounts
of Recognized
Assets | | Gross Amounts
Offset on the
Consolidated
Balance Sheet | | Net Amounts of
Assets Presented
on the Consolidated
Balance Sheet | | Gross Amounts Not Offset on the
Consolidated Balance Sheet | | |
| Assets | | | | | | Net
Amount |
| | | | Collateral Received | |
| Resale agreements | | $ | 1,460,000 | | | $ | — | | | $ | 1,460,000 | | | $ | (1,458,700) | | (1) | $ | 1,300 | |
| | | | | | | | | | |
| Liabilities | | Gross
Amounts
of Recognized
Liabilities | | Gross Amounts
Offset on the
Consolidated
Balance Sheet | | Net Amounts of
Liabilities Presented
on the Consolidated
Balance Sheet | | Gross Amounts Not Offset on the
Consolidated Balance Sheet | | |
| | | | | Net
Amount |
| | | | Collateral Pledged | |
| Repurchase agreements | | $ | 300,000 | | | $ | — | | | $ | 300,000 | | | $ | (300,000) | | (2) | $ | — | |
|
(1)Represents the fair value of securities and loans the Company has received under resale agreements, limited to the amount of the recognized asset due from each counterparty for presentation purposes. The application of collateral cannot reduce the net position below zero. Therefore, excess collateral, if any, is not reflected above.
(2)Represents the fair value of securities the Company has pledged under repurchase agreements, limited to the amount of the recognized liability due to each counterparty for presentation purpose. The application of collateral cannot reduce the net position below zero. Therefore, excess collateral, if any, is not reflected above.
In addition to the amounts included in the tables above, the Company also has balance sheet netting related to derivatives. Refer to Note 5 — Derivatives to the Consolidated Financial Statements in this Form 10-Q for additional information.
Note 4 — Securities
The following tables present the amortized cost, gross unrealized gains and losses and fair value by major categories of AFS debt securities as of September 30, 2021 and December 31, 2020:
| | | | | | | | | | | | | | | | | | | | | | | | | | | | |
|
| ($ in thousands) | | September 30, 2021 |
| Amortized
Cost | | | | Gross
Unrealized
Gains | | Gross
Unrealized
Losses | | Fair
Value |
| AFS debt securities: | | | | | | | | | | |
| U.S. Treasury securities | | $ | 950,260 | | | | | $ | 233 | | | $ | (8,769) | | | $ | 941,724 | |
| U.S. government agency and U.S. government-sponsored enterprise debt securities | | 1,386,236 | | | | | 4,401 | | | (27,528) | | | 1,363,109 | |
| U.S. government agency and U.S. government-sponsored enterprise mortgage-backed securities: | | | | | | | | | | |
| Commercial mortgage-backed securities | | 1,277,989 | | | | | 19,063 | | | (22,585) | | | 1,274,467 | |
| Residential mortgage-backed securities | | 2,814,111 | | | | | 13,875 | | | (36,922) | | | 2,791,064 | |
| Municipal securities | | 500,907 | | | | | 8,194 | | | (7,612) | | | 501,489 | |
| Non-agency mortgage-backed securities: | | | | | | | | | | |
| Commercial mortgage-backed securities | | 463,358 | | | | | 4,704 | | | (3,292) | | | 464,770 | |
| Residential mortgage-backed securities | | 902,002 | | | | | 2,490 | | | (3,236) | | | 901,256 | |
| Corporate debt securities | | 626,531 | | | | | 9,445 | | | (17,305) | | | 618,671 | |
| Foreign government bonds | | 258,119 | | | | | 657 | | | (3,928) | | | 254,848 | |
| Asset-backed securities | | 76,417 | | | | | 437 | | | (55) | | | 76,799 | |
| CLOs | | 527,250 | | | | | 5 | | | (2,446) | | | 524,809 | |
| Total AFS debt securities | | $ | 9,783,180 | | | | | $ | 63,504 | | | $ | (133,678) | | | $ | 9,713,006 | |
|
| | | | | | | | | | | | | | | | | | | | | | | | | | | | |
|
| ($ in thousands) | | December 31, 2020 |
| Amortized
Cost | | | | Gross
Unrealized
Gains | | Gross
Unrealized
Losses | | Fair
Value |
| AFS debt securities: | | | | | | | | | | |
| U.S. Treasury securities | | $ | 50,310 | | | | | $ | 451 | | | $ | — | | | $ | 50,761 | |
| U.S. government agency and U.S. government-sponsored enterprise debt securities | | 806,814 | | | | | 8,765 | | | (1,260) | | | 814,319 | |
| U.S. government agency and U.S. government-sponsored enterprise mortgage-backed securities: | | | | | | | | | | |
| Commercial mortgage-backed securities | | 1,125,174 | | | | | 34,306 | | | (5,710) | | | 1,153,770 | |
| Residential mortgage-backed securities | | 1,634,553 | | | | | 27,952 | | | (1,611) | | | 1,660,894 | |
| Municipal securities | | 382,573 | | | | | 13,588 | | | (88) | | | 396,073 | |
| Non-agency mortgage-backed securities: | | | | | | | | | | |
| Commercial mortgage-backed securities | | 234,965 | | | | | 6,107 | | | (1,230) | | | 239,842 | |
| Residential mortgage-backed securities | | 288,520 | | | | | 1,761 | | | (506) | | | 289,775 | |
| Corporate debt securities | | 406,323 | | | | | 3,493 | | | (3,848) | | | 405,968 | |
| Foreign government bonds | | 183,828 | | | | | 163 | | | (1,460) | | | 182,531 | |
| Asset-backed securities | | 63,463 | | | | | 10 | | | (242) | | | 63,231 | |
| CLOs | | 294,000 | | | | | — | | | (6,506) | | | 287,494 | |
| Total AFS debt securities | | $ | 5,470,523 | | | | | $ | 96,596 | | | $ | (22,461) | | | $ | 5,544,658 | |
|
The amortized cost of AFS debt securities excludes accrued interest receivables, which are a component of Other assets on the Consolidated Balance Sheet. The accrued interest receivables for AFS debt securities were $27.0 million and $22.3 million as of September 30, 2021 and December 31, 2020, respectively. For the Company’s accounting policy related to AFS debt securities’ accrued interest receivables, see Note 1 — Summary of Significant Accounting Policies — Significant Accounting Policies — Allowance for Credit Losses on Available-for-Sale Debt Securities to the Consolidated Financial Statements in the Company’s 2020 Form 10-K.
Unrealized Losses
The following tables present the fair value and the associated gross unrealized losses of the Company’s AFS debt securities, aggregated by investment category and the length of time that the securities have been in a continuous unrealized loss position as of September 30, 2021 and December 31, 2020.
| | | | | | | | | | | | | | | | | | | | | | | | | | | | | | | | | | | | | | |
|
| ($ in thousands) | | September 30, 2021 |
| Less Than 12 Months | | 12 Months or More | | Total |
| Fair
Value | | Gross
Unrealized
Losses | | Fair
Value | | Gross
Unrealized
Losses | | Fair
Value | | Gross
Unrealized
Losses |
| AFS debt securities: | | | | | | | | | | | | |
| U.S. Treasury securities | | $ | 768,909 | | | $ | (8,769) | | | $ | — | | | $ | — | | | $ | 768,909 | | | $ | (8,769) | |
| U.S. government agency and U.S. government- sponsored enterprise debt securities | | 1,008,979 | | | (21,747) | | | 144,196 | | | (5,781) | | | 1,153,175 | | | (27,528) | |
| U.S. government agency and U.S. government-sponsored enterprise mortgage-backed securities: | | | | | | | | | | | | |
| Commercial mortgage-backed securities | | 603,554 | | | (17,164) | | | 107,752 | | | (5,421) | | | 711,306 | | | (22,585) | |
| Residential mortgage-backed securities | | 1,904,559 | | | (35,792) | | | 17,591 | | | (1,130) | | | 1,922,150 | | | (36,922) | |
| Municipal securities | | 249,055 | | | (7,612) | | | — | | | — | | | 249,055 | | | (7,612) | |
| Non-agency mortgage-backed securities: | | | | | | | | | | | | |
| Commercial mortgage-backed securities | | 151,915 | | | (2,158) | | | 40,233 | | | (1,134) | | | 192,148 | | | (3,292) | |
| Residential mortgage-backed securities | | 561,635 | | | (3,233) | | | 8,145 | | | (3) | | | 569,780 | | | (3,236) | |
| Corporate debt securities | | 207,861 | | | (6,139) | | | 178,833 | | | (11,166) | | | 386,694 | | | (17,305) | |
| Foreign government bonds | | 54,228 | | | (3,514) | | | 84,977 | | | (414) | | | 139,205 | | | (3,928) | |
| Asset-backed securities | | 21,631 | | | (55) | | | — | | | — | | | 21,631 | | | (55) | |
| CLOs | | 183,192 | | | (58) | | | 291,612 | | | (2,388) | | | 474,804 | | | (2,446) | |
| Total AFS debt securities | | $ | 5,715,518 | | | $ | (106,241) | | | $ | 873,339 | | | $ | (27,437) | | | $ | 6,588,857 | | | $ | (133,678) | |
|
| | | | | | | | | | | | | | | | | | | | | | | | | | | | | | | | | | | | | | |
|
| ($ in thousands) | | December 31, 2020 |
| Less Than 12 Months | | 12 Months or More | | Total |
| Fair
Value | | Gross
Unrealized
Losses | | Fair
Value | | Gross
Unrealized
Losses | | Fair
Value | | Gross
Unrealized
Losses |
| AFS debt securities: | | | | | | | | | | | | |
| U.S. Treasury securities | | $ | 352,521 | | | $ | (1,260) | | | $ | — | | | $ | — | | | $ | 352,521 | | | $ | (1,260) | |
| | | | | | | | | | | | |
| U.S. government agency and U.S. government-sponsored enterprise mortgage-backed securities: | | | | | | | | | | | | |
| Commercial mortgage-backed securities | | 292,596 | | | (5,656) | | | 3,543 | | | (54) | | | 296,139 | | | (5,710) | |
| Residential mortgage-backed securities | | 342,561 | | | (1,611) | | | — | | | — | | | 342,561 | | | (1,611) | |
| Municipal securities | | 24,529 | | | (88) | | | — | | | — | | | 24,529 | | | (88) | |
| Non-agency mortgage-backed securities: | | | | | | | | | | | | |
| Commercial mortgage-backed securities | | 58,738 | | | (1,230) | | | 7,920 | | | — | | | 66,658 | | | (1,230) | |
| Residential mortgage-backed securities | | 90,156 | | | (506) | | | — | | | — | | | 90,156 | | | (506) | |
| Corporate debt securities | | 251,674 | | | (3,645) | | | 9,798 | | | (203) | | | 261,472 | | | (3,848) | |
| Foreign government bonds | | 106,828 | | | (1,460) | | | — | | | — | | | 106,828 | | | (1,460) | |
| Asset-backed securities | | — | | | — | | | 34,104 | | | (242) | | | 34,104 | | | (242) | |
| CLOs | | — | | | — | | | 287,494 | | | (6,506) | | | 287,494 | | | (6,506) | |
| Total AFS debt securities | | $ | 1,519,603 | | | $ | (15,456) | | | $ | 342,859 | | | $ | (7,005) | | | $ | 1,862,462 | | | $ | (22,461) | |
|
As of September 30, 2021, the Company had a total of 359 AFS debt securities in a gross unrealized loss position with no credit impairment, consisting primarily of 150 U.S. government agency and U.S. government-sponsored enterprise mortgage-backed securities, 48 U.S. government agency and U.S. government-sponsored enterprise debt securities, and 22 corporate debt securities. In comparison, as of December 31, 2020, the Company had a total of 104 AFS debt securities in a gross unrealized loss position with no credit impairment, consisting primarily of 46 U.S. government agency and U.S. government-sponsored enterprise mortgage-backed securities and 17 corporate debt securities.
Allowance for Credit Losses
Each reporting period, the Company assesses each AFS debt security that is in an unrealized loss position to determine whether the decline in fair value below the amortized cost basis resulted from a credit loss or other factors. For a discussion of the factors and criteria the Company uses in analyzing securities for impairment related to credit losses, see Note 1 — Summary of Significant Accounting Policies — Significant Accounting Policies — Allowance for Credit Losses on Available-for-Sale Debt Securities to the Consolidated Financial Statements in the Company’s 2020 Form 10-K.
The gross unrealized losses presented in the above tables were primarily attributable to interest rate movement and widened liquidity spreads. Securities that were in unrealized loss positions as of September 30, 2021 were mainly comprised of the following:
•U.S. government agency and U.S. government-sponsored enterprise mortgage-backed securities — The market value decline as of September 30, 2021 was primarily due to interest rate movement. These securities (issued by Ginnie Mae, Fannie Mae, and Freddie Mac) are guaranteed or sponsored by agencies of the U.S. government, and the credit profiles are strong (rated Aaa, AA+ and AAA by Moody’s Investors Service (“Moody’s”), Standard and Poor's (“S&P”) and Fitch Ratings (“Fitch”), respectively). The Company expects to receive all contractual cash flows on time and believes the risk of credit losses on these securities is remote.
•U.S. government agency and U.S. government-sponsored enterprise debt securities — The market value decline as of September 30, 2021 was primarily due to interest rate movement. The securities consisted of the debt securities issued by:
–Federal Farm Credit Bank, Fannie Mae, Freddie Mac, and U.S. International Development Finance Corporation (rated Aaa, AA+ and AAA by Moody’s, S&P and Fitch, respectively).
–FHLB (rated Aaa and AA+ by Moody’s and S&P, respectively).
These securities are guaranteed or issued by entities sponsored by the U.S. government and the credit profiles are strong. The Company expects to receive all contractual cash flows on time and believes the risk of credit losses on these securities is remote.
•Corporate debt securities — The market value decline as of September 30, 2021 was primarily due to interest rate movement and spread widening. Since credit profiles of these securities are strong (rated BBB- or higher by Moody’s, S&P, Fitch, and Kroll Bond Rating Agency), and the contractual payments from these securities have been and are expected to be received on time, the Company believes that the risk of credit losses on these securities is remote.
The impact of the Coronavirus Disease 2019 (“COVID-19”) pandemic has been greatly mitigated by the government’s aggressive monetary policy and economic stimulus plans, including benchmark rate cuts, and various relief measures that contributed to the gradual and steady recovery of the market to pre-pandemic levels. Overall, the Company believes that the credit support levels of the AFS debt securities are strong and, based on current assessments and macroeconomic forecasts, expects that full contractual cash flows will be received, even if near-term credit performance could suffer from future unpredictable impacts of the COVID-19 pandemic, including new and more contagious variants.
As of September 30, 2021 and December 31, 2020, the Company had the intent to hold the AFS debt securities with unrealized losses through the anticipated recovery period and it was more-likely-than-not that the Company will not have to sell these securities before the recovery of their amortized cost. The issuers of these securities have not, to the Company’s knowledge, established any cause for default on these securities. As a result, the Company expects to recover the entire amortized cost basis of these securities. Accordingly, there was no allowance for credit losses as of September 30, 2021 and December 31, 2020 provided against these securities. In addition, there was no provision for credit losses recognized for the three and nine months ended September 30, 2021 and 2020.
Realized Gains and Losses
The following table presents the gross realized gains and tax expense related to the sales of AFS debt securities for the three and nine months ended September 30, 2021 and 2020:
| | | | | | | | | | | | | | | | | | | | | | | | | | |
|
| ($ in thousands) | | Three Months Ended September 30, | | Nine Months Ended September 30, |
| 2021 | | 2020 | | 2021 | | 2020 |
| | | | | | | | |
| Gross realized gains | | $ | 354 | | | $ | 698 | | | $ | 1,178 | | | $ | 11,867 | |
| Related tax expense | | $ | 104 | | | $ | 206 | | | $ | 348 | | | $ | 3,508 | |
|
Contractual Maturities of Available-for-Sale Debt Securities
The following table presents the contractual maturities of AFS debt securities as of September 30, 2021. Expected maturities will differ from contractual maturities on certain securities as the issuers and borrowers of the underlying collateral may have the right to call or prepay obligations with or without prepayment penalties.
| | | | | | | | | | | | | | |
|
| ($ in thousands) | | Amortized Cost | | Fair Value |
| Due within one year | | $ | 1,522,146 | | | $ | 1,486,148 | |
| Due after one year through five years | | 845,850 | | | 848,562 | |
| Due after five years through ten years | | 1,618,344 | | | 1,618,061 | |
| Due after ten years | | 5,796,840 | | | 5,760,235 | |
| Total AFS debt securities | | $ | 9,783,180 | | | $ | 9,713,006 | |
|
As of September 30, 2021 and December 31, 2020, AFS debt securities with fair values of $859.9 million and $588.5 million, respectively, were pledged to secure public deposits, repurchase agreements and for other purposes required or permitted by law.
Restricted Equity Securities
The following table presents the restricted equity securities on the Consolidated Balance Sheet as of September 30, 2021 and December 31, 2020:
| | | | | | | | | | | | | | |
|
| ($ in thousands) | | September 30, 2021 | | December 31, 2020 |
| Federal Reserve Bank of San Francisco (“FRBSF”) stock | | $ | 59,950 | | | $ | 59,249 | |
| FHLB stock | | 17,250 | | | 23,797 | |
| Total restricted equity securities | | $ | 77,200 | | | $ | 83,046 | |
|
Note 5 — Derivatives
The Company uses derivatives to manage exposure to market risk, primarily interest rate and foreign currency risk, as well as to assist customers with their risk management objectives. The Company’s goal is to manage interest rate sensitivity and volatility so that movements in interest rates do not significantly affect earnings or capital. The Company also uses foreign exchange contracts to manage the foreign exchange rate risk associated with certain foreign currency-denominated assets and liabilities, as well as the Bank’s investment in East West Bank (China) Limited. The Company recognizes all derivatives on the Consolidated Balance Sheet at fair value. While the Company designates certain derivatives as hedging instruments in a qualifying hedge accounting relationship, other derivatives serve as economic hedges. For additional information on the Company’s derivatives and hedging activities, see Note 1 — Summary of Significant Accounting Policies — Significant Accounting Policies — Derivatives to the Consolidated Financial Statements of the Company’s 2020 Form 10-K.
The following table presents the total notional amounts and gross fair values of the Company’s derivatives, as well as the balance sheet netting adjustments on an aggregate basis as of September 30, 2021 and December 31, 2020. The derivative assets and liabilities are presented on a gross basis prior to the application of bilateral collateral and master netting agreements, but after the variation margin payments with central clearing organizations have been applied as settlement, as applicable. Total derivative assets and liabilities are adjusted to take into consideration the effects of legally enforceable master netting agreements and cash collateral received or paid as of September 30, 2021 and December 31, 2020. The resulting net derivative asset and liability fair values are included in Other assets and Accrued expenses and other liabilities, respectively, on the Consolidated Balance Sheet.
| | | | | | | | | | | | | | | | | | | | | | | | | | | | | | | | | | | | | | |
|
| ($ in thousands) | | September 30, 2021 | | December 31, 2020 |
| Notional
Amount | | Fair Value | | Notional
Amount | | Fair Value |
| | Derivative
Assets | | Derivative
Liabilities | | | Derivative
Assets | | Derivative
Liabilities |
Derivatives designated as hedging instruments: | | | | | | | | | | | | |
| | | | | | | | | | | | |
| | | | | | | | | | | | |
Cash flow hedges: | | | | | | | | | | | | |
Interest rate contracts | | $ | 275,000 | | | $ | — | | | $ | 1,149 | | | $ | 275,000 | | | $ | — | | | $ | 1,864 | |
Net investment hedges: | | | | | | | | | | | | |
Foreign exchange contracts | | 85,316 | | | 158 | | | — | | | 84,269 | | | — | | | 235 | |
Total derivatives designated as hedging instruments | | $ | 360,316 | | | $ | 158 | | | $ | 1,149 | | | $ | 359,269 | | | $ | — | | | $ | 2,099 | |
Derivatives not designated as hedging instruments: | | | | | | | | | | | | |
Interest rate contracts | | $ | 17,743,446 | | | $ | 298,831 | | | $ | 212,179 | | | $ | 18,155,678 | | | $ | 489,132 | | | $ | 315,834 | |
| Foreign exchange contracts | | 3,047,846 | | | 31,717 | | | 24,313 | | | 3,108,488 | | | 30,300 | | | 22,524 | |
| Credit contracts | | 83,693 | | | 15 | | | 120 | | | 76,992 | | | 13 | | | 206 | |
Equity contracts | | — | | (1) | 226 | | | — | | | — | | (1) | 858 | | | — | |
Commodity contracts | | — | | (2) | 363,063 | | | 324,027 | | | — | | (2) | 82,451 | | | 84,165 | |
| Total derivatives not designated as hedging instruments | | $ | 20,874,985 | | | $ | 693,852 | | | $ | 560,639 | | | $ | 21,341,158 | | | $ | 602,754 | | | $ | 422,729 | |
| Gross derivative assets/liabilities | | | | $ | 694,010 | | | $ | 561,788 | | | | | $ | 602,754 | | | $ | 424,828 | |
| Less: Master netting agreements | | | | (102,515) | | | (102,515) | | | | | (93,063) | | | (93,063) | |
| Less: Cash collateral received/paid | | | | (62,968) | | | (240,104) | | | | | (8,449) | | | (91,634) | |
| Net derivative assets/liabilities | | | | $ | 528,527 | | | $ | 219,169 | | | | | $ | 501,242 | | | $ | 240,131 | |
|
(1)The Company held equity contracts in one public company and 12 private companies as of September 30, 2021. In comparison, the Company held equity contracts in two public companies and 17 private companies as of December 31, 2020.
(2)The notional amount of the Company’s commodity contracts entered with its customers totaled 8,557 thousand barrels of crude oil and 95,273 thousand units of natural gas, measured in million British thermal units (“MMBTUs”), as of September 30, 2021. In comparison, the notional amount of the Company’s commodity contracts entered with its customers totaled 6,321 thousand barrels of crude oil and 109,635 thousand MMBTUs of natural gas as of December 31, 2020. The Company simultaneously entered into the offsetting commodity contracts with mirrored terms with third-party financial institutions.
Derivatives Designated as Hedging Instruments
Fair Value Hedges — The Company entered into interest rate swaps designated as fair value hedges to hedge changes in the fair value of certain certificates of deposit due to changes in the benchmark interest rate. The interest rate swaps involved the exchange of variable-rate payments over the life of the agreements without exchanging the underlying notional amounts. During the fourth quarter of 2020, both the hedging interest rate swaps and hedged certificates of deposit were called.
As of both September 30, 2021 and December 31, 2020, there were no fair value hedges or hedged certificates of deposit outstanding. There were no gains or losses recognized on the Consolidated Statement of Income related to the derivatives designated as fair value hedges for both the three and nine months ended September 30, 2021. In comparison, the net gains recognized on interest rate swaps were $154 thousand and $3.2 million for the three and nine months ended September 30, 2020, respectively, and a net gain of $112 thousand and a net loss of $1.6 million were recognized on certificates of deposit for the three and nine months ended September 30, 2020, respectively, which were recorded in interest expense on the Consolidated Statement of Income.
Cash Flow Hedges — The Company entered into interest rate swaps that were designated and qualified as cash flow hedges to limit the exposure to the variability in interest payments on certain floating rate borrowings. For cash flow hedges, the entire change in the fair value of the hedging instruments is recognized in AOCI and reclassified to earnings in the same period when the hedged cash flows impact earnings. Reclassified gains and losses on interest rate swaps are recorded in the same line item as the interest payments of the hedged long-term borrowings within Interest expense in the Consolidated Statements of Income. Considering the interest rates, yield curve and notional amounts as of September 30, 2021, the Company expected to reclassify an estimated $625 thousand of after-tax net losses on derivative instruments designated as cash flow hedges from AOCI into earnings during the next 12 months.
The following table presents the pre-tax changes in AOCI from cash flow hedges for the three and nine months ended September 30, 2021 and 2020. The after-tax impact of cash flow hedges on AOCI is discussed in Note 12 — Accumulated Other Comprehensive Income (Loss) to the Consolidated Financial Statements in this Form-10-Q.
| | | | | | | | | | | | | | | | | | | | | | | | | | |
|
| ($ in thousands) | | Three Months Ended September 30, | | Nine Months Ended September 30, |
| 2021 | | 2020 | | 2021 | | 2020 |
| (Losses) gains recognized in AOCI | | $ | (170) | | | $ | 34 | | | $ | 150 | | | $ | (1,449) | |
| (Losses) gains reclassified from AOCI to interest expense | | $ | (241) | | | $ | (87) | | | $ | (619) | | | $ | 290 | |
|
Net Investment Hedges — ASC 830-20, Foreign Currency Matters — Foreign Currency Transactions and ASC 815, Derivatives and Hedging, allow hedging of the foreign currency risk of a net investment in a foreign operation. The Company enters into foreign currency forward contracts to hedge a portion of the Bank’s investment in East West Bank (China) Limited, a non-USD functional currency subsidiary in China. The hedging instruments designated as net investment hedges involve hedging the risk of changes in the USD equivalent value of a designated monetary amount of the Bank’s net investment in East West Bank (China) Limited, against the risk of adverse changes in the foreign currency exchange rate of the Chinese Renminbi (“RMB”). The Company may de-designate the net investment hedges when the Company expects the hedge will cease to be effective.
The following table presents the after-tax (losses) gains recognized in AOCI on net investment hedges for the three and nine months ended September 30, 2021 and 2020:
| | | | | | | | | | | | | | | | | | | | | | | | | | | | | | | | |
|
| ($ in thousands) | | Three Months Ended September 30, | | Nine Months Ended September 30, | | | | |
| 2021 | | 2020 | | 2021 | | 2020 | | | | | | |
| Losses recognized in AOCI | | $ | (318) | | | $ | (2,627) | | | $ | (1,860) | | | $ | (2,000) | | | | | | | |
| | | | | | | | | | | | | | |
|
Derivatives Not Designated as Hedging Instruments
Interest Rate Contracts — The Company enters into interest rate contracts, which include interest rate swaps and options with its customers to allow the customers to hedge against the risk of rising interest rates on their variable rate loans. To economically hedge against the interest rate risks in the products offered to its customers, the Company enters into mirrored offsetting interest rate contracts with third-party financial institutions, including central clearing organizations.
The following tables present the notional amounts and the gross fair values of interest rate derivative contracts outstanding as of September 30, 2021 and December 31, 2020:
| | | | | | | | | | | | | | | | | | | | | | | | | | | | | | | | | | | | | | | | | | | | |
|
| ($ in thousands) | | September 30, 2021 |
| Customer Counterparty | | ($ in thousands) | | Financial Counterparty |
| Notional
Amount | | Fair Value | | | Notional
Amount | | Fair Value |
| | Assets | | Liabilities | | | | Assets | | Liabilities |
Written options | | $ | 1,103,453 | | | $ | — | | | $ | 751 | | | Purchased options | | $ | 1,103,453 | | | $ | 757 | | | $ | — | |
Sold collars and corridors | | 179,605 | | | 2,083 | | | 198 | | | Collars and corridors | | 179,605 | | | 199 | | | 2,093 | |
| Swaps | | 7,573,811 | | | 276,902 | | | 31,316 | | | Swaps | | 7,603,519 | | | 18,890 | | | 177,821 | |
Total | | $ | 8,856,869 | | | $ | 278,985 | | | $ | 32,265 | | | Total | | $ | 8,886,577 | | | $ | 19,846 | | | $ | 179,914 | |
|
| | | | | | | | | | | | | | | | | | | | | | | | | | | | | | | | | | | | | | | | | | | | |
|
| ($ in thousands) | | December 31, 2020 |
| Customer Counterparty | | ($ in thousands) | | Financial Counterparty |
| Notional
Amount | | Fair Value | | | Notional
Amount | | Fair Value |
| | Assets | | Liabilities | | | | Assets | | Liabilities |
Written options | | $ | 957,393 | | | $ | — | | | $ | 115 | | | Purchased options | | $ | 957,393 | | | $ | 101 | | | $ | 15 | |
Sold collars and corridors | | 518,477 | | | 7,673 | | | — | | | Collars and corridors | | 518,477 | | | — | | | 7,717 | |
| Swaps | | 7,586,414 | | | 479,634 | | | 1,364 | | | Swaps | | 7,617,524 | | | 1,724 | | | 306,623 | |
Total | | $ | 9,062,284 | | | $ | 487,307 | | | $ | 1,479 | | | Total | | $ | 9,093,394 | | | $ | 1,825 | | | $ | 314,355 | |
|
Included in the total notional amount of $8.89 billion of interest rate contracts entered into with financial counterparties as of September 30, 2021, was a notional amount of $2.86 billion of interest rate swaps that cleared through London Clearing House (“LCH”). Applying variation margin payments as settlement to LCH cleared derivative transactions resulted in a reduction in derivative asset fair value of $16.0 million and liability fair value of $104.6 million as of September 30, 2021. In comparison, included in the total notional amount of $9.09 billion of interest rate contracts entered into with financial counterparties as of December 31, 2020 was a notional amount of $2.98 billion of interest rate swaps that cleared through LCH. Applying variation margin payments as settlement to LCH cleared derivative transactions resulted in a reduction in derivative asset fair values of $1.3 million and liability fair values of $187.4 million as of December 31, 2020.
Foreign Exchange Contracts — The Company enters into foreign exchange contracts with its customers, consisting of forwards, spot, swap and option contracts to accommodate the business needs of its customers. The Company enters into offsetting foreign exchange contracts with third-party financial institutions to manage its foreign exchange exposure with its customers, and enters into bilateral collateral and master netting agreements with certain customer counterparties to manage its credit exposure. The Company also utilizes foreign exchange contracts to mitigate the economic effect of currency fluctuations on certain foreign currency-denominated on-balance sheet assets and liabilities, primarily foreign currency-denominated deposits offered to its customers. A majority of the foreign exchange contracts had original maturities of one year or less as of both September 30, 2021 and December 31, 2020.
The following tables present the notional amounts and the gross fair values of foreign exchange derivative contracts outstanding as of September 30, 2021 and December 31, 2020:
| | | | | | | | | | | | | | | | | | | | | | | | | | | | | | | | | | | | | | | | | | | | |
|
| ($ in thousands) | | September 30, 2021 |
| Customer Counterparty | | ($ in thousands) | | Financial Counterparty |
| Notional
Amount | | Fair Value | | | Notional
Amount | | Fair Value |
| | Assets | | Liabilities | | | | Assets | | Liabilities |
| Forwards and spot | | $ | 1,573,945 | | | $ | 18,558 | | | $ | 20,340 | | | Forwards and spot | | $ | 249,814 | | | $ | 1,913 | | | $ | 1,653 | |
| Swaps | | 66,696 | | | 321 | | | 76 | | | Swaps | | 814,355 | | | 10,885 | | | 2,204 | |
| Written options | | 169,434 | | | 22 | | | 10 | | | Purchased options | | 169,434 | | | 10 | | | 22 | |
| Collars | | 2,084 | | | — | | | 8 | | | Collars | | 2,084 | | | 8 | | | — | |
| Total | | $ | 1,812,159 | | | $ | 18,901 | | | $ | 20,434 | | | Total | | $ | 1,235,687 | | | $ | 12,816 | | | $ | 3,879 | |
|
| | | | | | | | | | | | | | | | | | | | | | | | | | | | | | | | | | | | | | | | | | | | |
|
| ($ in thousands) | | December 31, 2020 |
| Customer Counterparty | | ($ in thousands) | | Financial Counterparty |
| Notional
Amount | | Fair Value | | | Notional
Amount | | Fair Value |
| | Assets | | Liabilities | | | | Assets | | Liabilities |
| Forwards and spot | | $ | 1,522,888 | | | $ | 17,575 | | | $ | 17,928 | | | Forwards and spot | | $ | 145,197 | | | $ | 1,230 | | | $ | 273 | |
| Swaps | | 13,590 | | | 872 | | | 91 | | | Swaps | | 1,191,355 | | | 10,049 | | | 3,658 | |
| Written options | | 117,729 | | | — | | | 574 | | | Purchased options | | 117,729 | | | 574 | | | — | |
| | | | | | | | | | | | | | |
| Total | | $ | 1,654,207 | | | $ | 18,447 | | | $ | 18,593 | | | Total | | $ | 1,454,281 | | | $ | 11,853 | | | $ | 3,931 | |
|
Credit Contracts — The Company may periodically enter into RPAs with institutional counterparties to manage the credit exposure of the interest rate contracts associated with the syndicated loans. The Company may enter into protection sold or protection purchased RPAs. The purchaser of credit protection that enters into an interest rate contract with the borrower, may in turn enter into an RPA with a seller of protection, under which the seller of protection receives a fee to accept a portion of the credit risk. A seller of credit protection is required to make payments to the buyer if a borrower defaults on the related interest rate contract. Credit risk on RPAs is managed by monitoring the credit worthiness of the borrowers and institutional counterparties, which is part of the normal credit review and monitoring process. Assuming the underlying borrower referenced in the interest rate contracts defaulted as of September 30, 2021 and December 31, 2020, the maximum exposure of protection sold RPAs would be $4.5 million and $6.0 million, respectively. As of September 30, 2021 and December 31, 2020, the weighted-average remaining maturities of the outstanding protection sold RPAs were 3.4 years and 3.5 years, respectively.
The notional amount of the RPAs reflects the Company’s pro-rata share of the derivative instrument. The following table presents the notional amounts and the gross fair values of RPAs sold and purchased outstanding as of September 30, 2021 and December 31, 2020:
| | | | | | | | | | | | | | | | | | | | | | | | | | | | | | | | | | | | | | |
|
| ($ in thousands) | | September 30, 2021 | | December 31, 2020 |
| Notional
Amount | | Fair Value | | Notional
Amount | | Fair Value |
| | Assets | | Liabilities | | | Assets | | Liabilities |
| RPAs - protection sold | | $ | 72,979 | | | $ | — | | | $ | 120 | | | $ | 66,278 | | | $ | — | | | $ | 206 | |
| RPAs - protection purchased | | 10,714 | | | 15 | | | — | | | 10,714 | | | 13 | | | — | |
| Total RPAs | | $ | 83,693 | | | $ | 15 | | | $ | 120 | | | $ | 76,992 | | | $ | 13 | | | $ | 206 | |
|
Equity Contracts — Periodically, as part of the Company’s loan origination process, the Company obtains warrants to purchase preferred and/or common stock of technology and life sciences companies to which it provides loans. Warrants grant the Company the right to buy a certain class of the underlying company’s equity at a certain price before expiration. The Company held warrants in one public company and 12 private companies as of September 30, 2021, and held warrants in two public companies and 17 private companies as of December 31, 2020. The total fair value of the warrants held in both public and private companies was $226 thousand and $858 thousand as of September 30, 2021 and December 31, 2020, respectively.
Commodity Contracts — The Company enters into energy commodity contracts in the form of swaps and options with its commercial loan customers to allow them to hedge against the risk of energy commodity price fluctuation. To economically hedge against the risk of commodity price fluctuation in the products offered to its customers, the Company enters into offsetting commodity contracts with third-party financial institutions to manage the exposure.
The following tables present the notional amounts and fair values of the commodity derivative positions outstanding as of September 30, 2021 and December 31, 2020:
| | | | | | | | | | | | | | | | | | | | | | | | | | | | | | | | | | | | | | | | | | | | | | | | | | | | | | | | |
|
($ and units in thousands) | | September 30, 2021 |
| Customer Counterparty | | ($ and units in thousands) | | Financial Counterparty |
| Notional
Unit | | Fair Value | | | Notional
Unit | | Fair Value |
| | Assets | | Liabilities | | | | Assets | | Liabilities |
| Crude oil: | | | | | | | | | | Crude oil: | | | | | | | | |
| Written options | | 212 | | | Barrels | | $ | 302 | | | $ | 1 | | | Purchased options | | 212 | | | Barrels | | $ | — | | | $ | 278 | |
Collars | | 3,070 | | | Barrels | | 35,941 | | | — | | | Collars | | 3,126 | | | Barrels | | — | | | 35,575 | |
Swaps | | 5,275 | | | Barrels | | 82,563 | | | 2 | | | Swaps | | 8,219 | | | Barrels | | 30,604 | | | 98,712 | |
Total | | 8,557 | | | | | $ | 118,806 | | | $ | 3 | | | Total | | 11,557 | | | | | $ | 30,604 | | | $ | 134,565 | |
| | | | | | | | | | | | | | | | | | |
Natural gas: | | | | | | | | | | Natural gas: | | | | | | | | |
| Written options | | 2,668 | | | MMBTUs | | $ | — | | | $ | — | | | Purchased options | | 2,668 | | | MMBTUs | | $ | — | | | $ | — | |
Collars | | 25,224 | | | MMBTUs | | 30,542 | | | 62 | | | Collars | | 29,242 | | | MMBTUs | | 5,236 | | | 32,005 | |
Swaps | | 67,381 | | | MMBTUs | | 106,653 | | | 14,756 | | | Swaps | | 127,419 | | | MMBTUs | | 71,222 | | | 142,636 | |
Total | | 95,273 | | | | | $ | 137,195 | | | $ | 14,818 | | | Total | | 159,329 | | | | | $ | 76,458 | | | $ | 174,641 | |
| | | | | | | | | | | | | | | | | | |
| Total | | | | | | $ | 256,001 | | | $ | 14,821 | | | Total | | | | | | $ | 107,062 | | | $ | 309,206 | |
|
| | | | | | | | | | | | | | | | | | | | | | | | | | | | | | | | | | | | | | | | | | | | | | | | | | | | | | | | |
|
($ and units in thousands) | | December 31, 2020 |
| Customer Counterparty | | ($ and units in thousands) | | Financial Counterparty |
| Notional
Unit | | Fair Value | | | Notional
Unit | | Fair Value |
| | Assets | | Liabilities | | | | Assets | | Liabilities |
| Crude oil: | | | | | | | | | | Crude oil: | | | | | | | | |
| | | | | | | | | | | | | | | | | | |
Collars | | 2,022 | | | Barrels | | $ | 2,344 | | | $ | 2,193 | | | Collars | | 2,022 | | | Barrels | | $ | 2,217 | | | $ | 2,402 | |
Swaps | | 4,299 | | | Barrels | | 9,282 | | | 14,283 | | | Swaps | | 4,299 | | | Barrels | | 8,220 | | | 7,135 | |
Total | | 6,321 | | | | | $ | 11,626 | | | $ | 16,476 | | | Total | | 6,321 | | | | | $ | 10,437 | | | $ | 9,537 | |
| | | | | | | | | | | | | | | | | | |
Natural gas: | | | | | | | | | | Natural gas: | | | | | | | | |
Written options | | 597 | | | MMBTUs | | $ | — | | | $ | 59 | | | Purchased options | | 597 | | | MMBTUs | | $ | 59 | | | $ | — | |
Collars | | 12,733 | | | MMBTUs | | 1,063 | | | 205 | | | Collars | | 16,293 | | | MMBTUs | | 205 | | | 813 | |
Swaps | | 96,305 | | | MMBTUs | | 32,074 | | | 27,238 | | | Swaps | | 103,973 | | | MMBTUs | | 26,988 | | | 29,837 | |
Total | | 109,635 | | | | | $ | 33,137 | | | $ | 27,502 | | | Total | | 120,863 | | | | | $ | 27,252 | | | $ | 30,650 | |
| | | | | | | | | | | | | | | | | | |
| Total | | | | | | $ | 44,763 | | | $ | 43,978 | | | Total | | | | | | $ | 37,689 | | | $ | 40,187 | |
|
As of September 30, 2021, the notional quantities that cleared through the Chicago Mercantile Exchange (“CME”) totaled 1,070 thousand barrels of crude oil and 15,740 thousand MMBTUs of natural gas. Applying the variation margin payments as settlement to CME-cleared derivative transactions resulted in reductions to the gross derivative asset fair value of $8.8 million and to the liability fair value of $41.2 million as of September 30, 2021, to a net fair value liability of $7.5 million. In comparison, the notional quantities that cleared through CME totaled 1,275 thousand barrels of crude oil and 29,733 thousand MMBTUs of natural gas as of December 31, 2020. Applying the variation margin payments as settlement to CME-cleared derivative transactions resulted in a reduction to the gross derivative asset fair value of $7.9 million and to the liability fair value of $3.7 million, as of December 31, 2020, to a net fair value of zero.
The following table presents the net gains (losses) recognized on the Company’s Consolidated Statement of Income related to derivatives not designated as hedging instruments for the three and nine months ended September 30, 2021 and 2020:
| | | | | | | | | | | | | | | | | | | | | | | | | | | | | | | | |
|
| ($ in thousands) | | Classification on
Consolidated
Statement of Income | | Three Months Ended September 30, | | Nine Months Ended September 30, |
| | 2021 | | 2020 | | 2021 | | 2020 |
Derivatives not designated as hedging instruments: | | | | | | | | | | |
Interest rate contracts | | Interest rate contracts and other derivative income | | $ | 2,467 | | | $ | (3,013) | | | $ | 11,030 | | | $ | (15,385) | |
Foreign exchange contracts | | Foreign exchange income | | 11,820 | | | 5,255 | | | 34,035 | | | 14,317 | |
| Credit contracts | | Interest rate contracts and other derivative income | | (20) | | | 26 | | | 175 | | | (72) | |
| Equity contracts | | Lending fees | | 3 | | | 3,592 | | | 388 | | | 11,971 | |
| Commodity contracts | | Interest rate contracts and other derivative income | | 32 | | | 34 | | | 13 | | | (13) | |
| Net gains | | | | $ | 14,302 | | | $ | 5,894 | | | $ | 45,641 | | | $ | 10,818 | |
|
Credit Risk-Related Contingent Features — Certain of the Company’s over-the-counter derivative contracts contain early termination provisions that may require the Company to settle any outstanding balances upon the occurrence of a specified credit risk-related event. Such event primarily relates to a downgrade in the credit rating of East West Bank to below investment grade. As of September 30, 2021, the aggregate fair value amounts of all derivative instruments with credit risk-related contingent features that were in a net liability position totaled $82.4 million, in which $81.1 million of collateral was posted to cover these positions. As of December 31, 2020, the aggregate fair value amounts of all derivative instruments with credit risk-related contingent features that were in a net liability position totaled $107.4 million, in which $106.8 million of collateral was posted to cover these positions. In the event that the credit rating of East West Bank had been downgraded to below investment grade, a minimal additional collateral would have been required to be posted as of September 30, 2021 and December 31, 2020.
Offsetting of Derivatives
The following tables present the gross derivative fair values, the balance sheet netting adjustments and the resulting net fair values recorded on the Consolidated Balance Sheet, as well as the cash and noncash collateral associated with master netting arrangements. The gross amounts of derivative assets and liabilities are presented after the application of variation margin payments as settlements with central counterparties, where applicable. The collateral amounts in the following tables are limited to the outstanding balances of the related asset or liability, after the application of netting; therefore, instances of overcollateralization are not shown:
| | | | | | | | | | | | | | | | | | | | | | | | | | | | | | | | | | | | | | |
|
| ($ in thousands) | | As of September 30, 2021 |
| | | | | | | | | | |
| | Gross Amounts Recognized (1) | | Gross Amounts Offset on the
Consolidated Balance Sheet | | Net Amounts
Presented
on the
Consolidated
Balance Sheet | | Gross Amounts Not Offset on the
Consolidated Balance Sheet | | Net Amount |
| | Master Netting Arrangements | | Cash Collateral Received (3) | | | Security Collateral Received (5) | |
| Derivative assets | | $ | 694,010 | | | $ | (102,515) | | | $ | (62,968) | | | $ | 528,527 | | | $ | — | | | $ | 528,527 | |
| | Gross Amounts Recognized (2) | | Gross Amounts Offset on the
Consolidated Balance Sheet | | Net Amounts
Presented
on the
Consolidated
Balance Sheet | | Gross Amounts Not Offset on the
Consolidated Balance Sheet | | Net Amount |
| | Master Netting Arrangements | | Cash Collateral Pledged (4) | | | Security Collateral Pledged (5) | |
| Derivative liabilities | | $ | 561,788 | | | $ | (102,515) | | | $ | (240,104) | | | $ | 219,169 | | | $ | (157,315) | | | $ | 61,854 | |
|
| | | | | | | | | | | | | | | | | | | | | | | | | | | | | | | | | | | | | | |
|
| ($ in thousands) | | As of December 31, 2020 |
| | | | | | | | | | |
| | Gross Amounts Recognized (1) | | Gross Amounts Offset on the
Consolidated Balance Sheet | | Net Amounts
Presented
on the
Consolidated
Balance Sheet | | Gross Amounts Not Offset on the
Consolidated Balance Sheet | | Net
Amount |
| | Master Netting Arrangements | | Cash Collateral Received (3) | | | Security Collateral Received (5) | |
| Derivative assets | | $ | 602,754 | | | $ | (93,063) | | | $ | (8,449) | | | $ | 501,242 | | | $ | (35) | | | $ | 501,207 | |
| | Gross Amounts Recognized (2) | | Gross Amounts Offset on the Consolidated Balance Sheet | | Net Amounts
Presented
on the
Consolidated
Balance Sheet | | Gross Amounts Not Offset on the
Consolidated Balance Sheet | | Net
Amount |
| | Master Netting Arrangements | | Cash Collateral Pledged (4) | | | Security Collateral Pledged (5) | |
Derivative liabilities | | $ | 424,828 | | | $ | (93,063) | | | $ | (91,634) | | | $ | 240,131 | | | $ | (221,150) | | | $ | 18,981 | |
|
(1)Included $1.2 million and $1.1 million of gross fair value assets with counterparties that were not subject to enforceable master netting arrangements or similar agreements as of September 30, 2021 and December 31, 2020, respectively.
(2)Included $1.4 million and $220 thousand of gross fair value liabilities with counterparties that were not subject to enforceable master netting arrangements or similar agreements as of September 30, 2021 and December 31, 2020, respectively.
(3)Gross cash collateral received under master netting arrangements or similar agreements were $67.1 million and $15.8 million as of September 30, 2021 and December 31, 2020, respectively. Of the gross cash collateral received, $63.0 million and $8.4 million were used to offset against derivative assets as of September 30, 2021 and December 31, 2020, respectively.
(4)Gross cash collateral pledged under master netting arrangements or similar agreements were $240.1 million and $91.6 million as of September 30, 2021 and December 31, 2020, respectively. Of the gross cash collateral pledged, $240.1 million and $91.6 million were used to offset against derivative liabilities as of September 30, 2021 and December 31, 2020, respectively.
(5)Represents the fair value of security collateral received and pledged limited to derivative assets and liabilities that are subject to enforceable master netting arrangements or similar agreements. U.S. GAAP does not permit the netting of noncash collateral on the Consolidated Balance Sheet but requires disclosure of such amounts.
In addition to the amounts included in the tables above, the Company also has balance sheet netting related to resale and repurchase agreements. Refer to Note 3 — Assets Purchased under Resale Agreements and Sold under Repurchase Agreements to the Consolidated Financial Statements in this Form 10-Q for additional information. Refer to Note 2 — Fair Value Measurement and Fair Value of Financial Instruments to the Consolidated Financial Statements in this Form 10-Q for fair value measurement disclosures on derivatives.
Note 6 — Loans Receivable and Allowance for Credit Losses
The following table presents the composition of the Company’s loans held-for-investment as of September 30, 2021 and December 31, 2020:
| | | | | | | | | | | | | | |
|
| ($ in thousands) | | September 30, 2021 | | December 31, 2020 |
| Commercial: | | | | |
C&I (1) | | $ | 13,831,649 | | | $ | 13,631,726 | |
| CRE: | | | | |
| CRE | | 11,818,065 | | | 11,174,611 | |
| Multifamily residential | | 3,340,378 | | | 3,033,998 | |
| Construction and land | | 376,921 | | | 599,692 | |
| Total CRE | | 15,535,364 | | | 14,808,301 | |
| Total commercial | | 29,367,013 | | | 28,440,027 | |
| Consumer: | | | | |
| Residential mortgage: | | | | |
| Single-family residential | | 9,021,801 | | | 8,185,953 | |
| HELOCs | | 1,963,622 | | | 1,601,716 | |
| Total residential mortgage | | 10,985,423 | | | 9,787,669 | |
| Other consumer | | 129,269 | | | 163,259 | |
| Total consumer | | 11,114,692 | | | 9,950,928 | |
Total loans held-for-investment (2) | | $ | 40,481,705 | | | $ | 38,390,955 | |
| Allowance for loan losses | | (560,404) | | | (619,983) | |
Loans held-for-investment, net (2) | | $ | 39,921,301 | | | $ | 37,770,972 | |
|
(1)Includes Paycheck Protection Program (“PPP”) loans of $807.3 million and $1.57 billion as of September 30, 2021 and December 31, 2020, respectively.
(2)Includes net deferred loan fees, unearned fees, unamortized premiums and unaccreted discounts of $(54.3) million and $(58.8) million as of September 30, 2021 and December 31, 2020, respectively. Net origination fees related to PPP loans were $(13.5) million and $(12.7) million as of September 30, 2021 and December 31, 2020, respectively.
Loans held-for-investment accrued interest receivable was $102.7 million and $107.5 million as of September 30, 2021 and December 31, 2020, respectively, and is presented in Other assets on the Consolidated Balance Sheet. For the Company’s accounting policy on accrued interest receivable related to loans held-for-investment, see Note 1 — Summary of Significant Accounting Policies — Significant Accounting Policies to the Consolidated Financial Statements of the Company’s 2020 Form 10-K.
Loans totaling $24.55 billion and $23.26 billion as of September 30, 2021 and December 31, 2020, respectively, were pledged to secure borrowings and provide additional borrowing capacity from the FRBSF and the FHLB.
Credit Quality Indicators
All loans are subject to the Company’s credit review and monitoring process. For the commercial portfolio, loans are risk rated based on an analysis of the borrower’s current payment performance or delinquency, repayment sources, financial and liquidity factors, including industry and geographic considerations. For a majority of the consumer portfolio, payment performance or delinquency is the driving indicator for the risk ratings. The Company utilizes internal credit risk ratings to assign each individual loan a risk rating of one through ten. Loans risk rated one through five are assigned an internal risk rating category of “Pass.” Loans risk rated one are typically loans fully secured by cash. Pass loans have sufficient sources of repayment to repay the loan in full, in accordance with all terms and conditions. Loans assigned a risk rating of six have potential weaknesses that warrant closer attention by management; these are assigned an internal risk rating category of “Special Mention.” Loans assigned a risk rating of seven or eight have well-defined weaknesses that may jeopardize the full and timely repayment of the loan; these are assigned an internal risk rating category of “Substandard.” Loans assigned a risk rating of nine have insufficient sources of repayment and a high probability of loss; these are assigned an internal risk rating category of “Doubtful.” Loans assigned a risk rating of ten are uncollectible and of such little value that they are no longer considered bankable assets; these are assigned an internal risk rating category of “Loss.” Exposures categorized as criticized consist of special mention, substandard, doubtful and loss categories. The Company reviews the internal risk ratings of its loan portfolio on a regular basis, and adjusts the ratings based on changes in the borrowers’ financial status and the collectability of the loans.
The following tables summarize the Company’s loans held-for-investment as of September 30, 2021 and December 31, 2020, presented by loan portfolio segments, internal risk ratings and vintage year. The vintage year is the year of origination, renewal or major modification.
| | | | | | | | | | | | | | | | | | | | | | | | | | | | | | | | | | | | | | | | | | | | | | | | | | | | | | | | |
|
| ($ in thousands) | | September 30, 2021 |
| Term Loans | | Revolving Loans
Amortized Cost Basis | | Revolving Loans Converted to Term Loans Amortized Cost Basis | | Total |
| | | |
| | | |
| Amortized Cost Basis by Origination Year | | | |
| 2021 | | 2020 | | 2019 | | 2018 | | 2017 | | Prior | | | |
| Commercial: | | | | | | | | | | | | | | | | | | |
| C&I: | | | | | | | | | | | | | | | | | | |
| Pass | | $ | 3,136,513 | | | $ | 1,454,547 | | | $ | 787,238 | | | $ | 279,254 | | | $ | 175,669 | | | $ | 244,616 | | | $ | 7,069,657 | | | $ | 29,053 | | | $ | 13,176,547 | |
| Criticized (accrual) | | 75,943 | | | 168,029 | | | 110,500 | | | 13,700 | | | 1,475 | | | 4,489 | | | 183,809 | | | — | | | 557,945 | |
| Criticized (nonaccrual) | | 5,171 | | | 338 | | | 17,889 | | | 20,148 | | | 12,538 | | | 1,356 | | | 39,717 | | | — | | | 97,157 | |
| | | | | | | | | | | | | | | | | | |
| | | | | | | | | | | | | | | | | | |
| Total C&I | | 3,217,627 | | | 1,622,914 | | | 915,627 | | | 313,102 | | | 189,682 | | | 250,461 | | | 7,293,183 | | | 29,053 | | | 13,831,649 | |
| CRE: | | | | | | | | | | | | | | | | | | |
| CRE: | | | | | | | | | | | | | | | | | | |
| Pass | | 1,956,957 | | | 2,181,275 | | | 2,288,701 | | | 1,965,724 | | | 1,181,060 | | | 1,869,183 | | | 148,077 | | | 6,427 | | | 11,597,404 | |
| Criticized (accrual) | | 77,286 | | | 8,095 | | | 9,206 | | | 31,093 | | | 25,136 | | | 55,609 | | | — | | | — | | | 206,425 | |
| Criticized (nonaccrual) | | 4,425 | | | — | | | — | | | 4,648 | | | 4,752 | | | 411 | | | — | | | — | | | 14,236 | |
| | | | | | | | | | | | | | | | | | |
| | | | | | | | | | | | | | | | | | |
| Subtotal CRE | | 2,038,668 | | | 2,189,370 | | | 2,297,907 | | | 2,001,465 | | | 1,210,948 | | | 1,925,203 | | | 148,077 | | | 6,427 | | | 11,818,065 | |
Multifamily residential: | | | | | | | | | | | | | | | | | | |
| Pass | | 611,439 | | | 752,178 | | | 692,580 | | | 432,959 | | | 316,412 | | | 451,180 | | | 19,420 | | | — | | | 3,276,168 | |
| Criticized (accrual) | | — | | | — | | | 725 | | | 23,512 | | | 7,121 | | | 31,729 | | | — | | | — | | | 63,087 | |
| Criticized (nonaccrual) | | — | | | — | | | — | | | — | | | — | | | 1,123 | | | — | | | — | | | 1,123 | |
| | | | | | | | | | | | | | | | | | |
| | | | | | | | | | | | | | | | | | |
| Subtotal multifamily residential | | 611,439 | | | 752,178 | | | 693,305 | | | 456,471 | | | 323,533 | | | 484,032 | | | 19,420 | | | — | | | 3,340,378 | |
| Construction and land: | | | | | | | | | | | | | | | | | | |
| Pass | | 102,619 | | | 99,857 | | | 111,607 | | | 16,986 | | | — | | | 1,252 | | | — | | | — | | | 332,321 | |
| Criticized (accrual) | | 3,398 | | | — | | | — | | | 22,156 | | | — | | | 19,046 | | | — | | | — | | | 44,600 | |
| Criticized (nonaccrual) | | — | | | — | | | — | | | — | | | — | | | — | | | — | | | — | | | — | |
| Subtotal construction and land | | 106,017 | | | 99,857 | | | 111,607 | | | 39,142 | | | — | | | 20,298 | | | — | | | — | | | 376,921 | |
| Total CRE | | 2,756,124 | | | 3,041,405 | | | 3,102,819 | | | 2,497,078 | | | 1,534,481 | | | 2,429,533 | | | 167,497 | | | 6,427 | | | 15,535,364 | |
Total commercial | | 5,973,751 | | | 4,664,319 | | | 4,018,446 | | | 2,810,180 | | | 1,724,163 | | | 2,679,994 | | | 7,460,680 | | | 35,480 | | | 29,367,013 | |
| Consumer: | | | | | | | | | | | | | | | | | | |
| Residential mortgage: | | | | | | | | | | | | | | | | | | |
| Single-family residential: | | | | | | | | | | | | | | | | | | |
Pass (1) | | 2,131,943 | | | 2,214,125 | | | 1,465,612 | | | 1,169,483 | | | 825,120 | | | 1,203,031 | | | — | | | — | | | 9,009,314 | |
| Criticized (accrual) | | — | | | — | | | 374 | | | 490 | | | 1,633 | | | 1,214 | | | — | | | — | | | 3,711 | |
Criticized (nonaccrual) (1) | | — | | | 397 | | | 2,178 | | | 1,712 | | | 1,168 | | | 3,321 | | | — | | | — | | | 8,776 | |
| Subtotal single-family residential | | 2,131,943 | | | 2,214,522 | | | 1,468,164 | | | 1,171,685 | | | 827,921 | | | 1,207,566 | | | — | | | — | | | 9,021,801 | |
| HELOCs: | | | | | | | | | | | | | | | | | | |
| Pass | | 20 | | | 1,799 | | | 258 | | | 1,295 | | | 3,343 | | | 12,578 | | | 1,710,540 | | | 223,057 | | | 1,952,890 | |
| Criticized (accrual) | | 7 | | | — | | | — | | | 200 | | | — | | | 222 | | | 2 | | | 1,570 | | | 2,001 | |
| Criticized (nonaccrual) | | — | | | — | | | 151 | | | 188 | | | 3,523 | | | 1,579 | | | — | | | 3,290 | | | 8,731 | |
| Subtotal HELOCs | | 27 | | | 1,799 | | | 409 | | | 1,683 | | | 6,866 | | | 14,379 | | | 1,710,542 | | | 227,917 | | | 1,963,622 | |
Total residential mortgage | | 2,131,970 | | | 2,216,321 | | | 1,468,573 | | | 1,173,368 | | | 834,787 | | | 1,221,945 | | | 1,710,542 | | | 227,917 | | | 10,985,423 | |
| Other consumer: | | | | | | | | | | | | | | | | | | |
| Pass | | 16,737 | | | 5,382 | | | — | | | — | | | 1,741 | | | 51,529 | | | 51,389 | | | — | | | 126,778 | |
| Criticized (accrual) | | — | | | — | | | — | | | — | | | — | | | — | | | — | | | — | | | — | |
| Criticized (nonaccrual) | | — | | | — | | | — | | | — | | | 2,491 | | | — | | | — | | | — | | | 2,491 | |
Total other consumer | | 16,737 | | | 5,382 | | | — | | | — | | | 4,232 | | | 51,529 | | | 51,389 | | | — | | | 129,269 | |
| Total consumer | | 2,148,707 | | | 2,221,703 | | | 1,468,573 | | | 1,173,368 | | | 839,019 | | | 1,273,474 | | | 1,761,931 | | | 227,917 | | | 11,114,692 | |
Total | | $ | 8,122,458 | | | $ | 6,886,022 | | | $ | 5,487,019 | | | $ | 3,983,548 | | | $ | 2,563,182 | | | $ | 3,953,468 | | | $ | 9,222,611 | | | $ | 263,397 | | | $ | 40,481,705 | |
|
| | | | | | | | | | | | | | | | | | | | | | | | | | | | | | | | | | | | | | | | | | | | | | | | | | | | | | | | |
|
| ($ in thousands) | | December 31, 2020 |
| Term Loans | | Revolving Loans
Amortized Cost Basis | | Revolving Loans Converted to Term Loans Amortized Cost Basis | | Total |
| | | |
| | | |
| Amortized Cost Basis by Origination Year | | | |
| 2020 | | 2019 | | 2018 | | 2017 | | 2016 | | Prior | | | |
| Commercial: | | | | | | | | | | | | | | | | | | |
| C&I: | | | | | | | | | | | | | | | | | | |
| Pass | | $ | 3,912,147 | | | $ | 1,477,740 | | | $ | 483,725 | | | $ | 245,594 | | | $ | 69,482 | | | $ | 245,615 | | | $ | 6,431,003 | | | $ | 29,487 | | | $ | 12,894,793 | |
| Criticized (accrual) | | 120,183 | | | 74,601 | | | 56,785 | | | 19,426 | | | 1,487 | | | 5,872 | | | 324,640 | | | — | | | 602,994 | |
| Criticized (nonaccrual) | | 2,125 | | | 25,267 | | | 22,240 | | | 18,787 | | | 4,964 | | | 1,592 | | | 58,964 | | | — | | | 133,939 | |
| | | | | | | | | | | | | | | | | | |
| | | | | | | | | | | | | | | | | | |
| Total C&I | | 4,034,455 | | | 1,577,608 | | | 562,750 | | | 283,807 | | | 75,933 | | | 253,079 | | | 6,814,607 | | | 29,487 | | | 13,631,726 | |
| CRE: | | | | | | | | | | | | | | | | | | |
| CRE: | | | | | | | | | | | | | | | | | | |
| Pass | | 2,296,649 | | | 2,402,136 | | | 2,310,748 | | | 1,328,251 | | | 732,694 | | | 1,529,681 | | | 173,267 | | | 19,064 | | | 10,792,490 | |
| Criticized (accrual) | | 47,459 | | | 63,654 | | | 43,447 | | | 98,259 | | | 2,094 | | | 80,662 | | | — | | | — | | | 335,575 | |
| Criticized (nonaccrual) | | — | | | — | | | 42,067 | | | 1,115 | | | — | | | 3,364 | | | — | | | — | | | 46,546 | |
| | | | | | | | | | | | | | | | | | |
| | | | | | | | | | | | | | | | | | |
| Subtotal CRE | | 2,344,108 | | | 2,465,790 | | | 2,396,262 | | | 1,427,625 | | | 734,788 | | | 1,613,707 | | | 173,267 | | | 19,064 | | | 11,174,611 | |
Multifamily residential: | | | | | | | | | | | | | | | | | | |
| Pass | | 783,671 | | | 783,589 | | | 479,959 | | | 411,945 | | | 181,213 | | | 348,751 | | | 5,895 | | | — | | | 2,995,023 | |
| Criticized (accrual) | | — | | | 735 | | | 22,330 | | | 6,101 | | | 264 | | | 5,877 | | | — | | | — | | | 35,307 | |
| Criticized (nonaccrual) | | — | | | — | | | 1,475 | | | — | | | — | | | 2,193 | | | — | | | — | | | 3,668 | |
| | | | | | | | | | | | | | | | | | |
| | | | | | | | | | | | | | | | | | |
| Subtotal multifamily residential | | 783,671 | | | 784,324 | | | 503,764 | | | 418,046 | | | 181,477 | | | 356,821 | | | 5,895 | | | — | | | 3,033,998 | |
| Construction and land: | | | | | | | | | | | | | | | | | | |
| Pass | | 224,924 | | | 172,707 | | | 156,712 | | | — | | | 20,897 | | | 1,028 | | | — | | | — | | | 576,268 | |
| Criticized (accrual) | | 3,524 | | | — | | | — | | | — | | | — | | | 19,900 | | | — | | | — | | | 23,424 | |
| Criticized (nonaccrual) | | — | | | — | | | — | | | — | | | — | | | — | | | — | | | — | | | — | |
| Subtotal construction and land | | 228,448 | | | 172,707 | | | 156,712 | | | — | | | 20,897 | | | 20,928 | | | — | | | — | | | 599,692 | |
| Total CRE | | 3,356,227 | | | 3,422,821 | | | 3,056,738 | | | 1,845,671 | | | 937,162 | | | 1,991,456 | | | 179,162 | | | 19,064 | | | 14,808,301 | |
Total commercial | | 7,390,682 | | | 5,000,429 | | | 3,619,488 | | | 2,129,478 | | | 1,013,095 | | | 2,244,535 | | | 6,993,769 | | | 48,551 | | | 28,440,027 | |
| Consumer: | | | | | | | | | | | | | | | | | | |
| Residential mortgage: | | | | | | | | | | | | | | | | | | |
| Single-family residential: | | | | | | | | | | | | | | | | | | |
Pass (1) | | 2,385,853 | | | 1,813,200 | | | 1,501,660 | | | 1,021,707 | | | 523,170 | | | 921,714 | | | — | | | — | | | 8,167,304 | |
| Criticized (accrual) | | — | | | 1,429 | | | — | | | — | | | 119 | | | 1,034 | | | — | | | — | | | 2,582 | |
Criticized (nonaccrual) (1) | | — | | | 226 | | | 812 | | | 1,789 | | | 1,994 | | | 11,246 | | | — | | | — | | | 16,067 | |
| Subtotal single-family residential | | 2,385,853 | | | 1,814,855 | | | 1,502,472 | | | 1,023,496 | | | 525,283 | | | 933,994 | | | — | | | — | | | 8,185,953 | |
| HELOCs: | | | | | | | | | | | | | | | | | | |
| Pass | | 1,131 | | | 880 | | | 2,879 | | | 5,363 | | | 8,433 | | | 13,475 | | | 1,328,919 | | | 225,810 | | | 1,586,890 | |
| Criticized (accrual) | | — | | | — | | | 200 | | | — | | | 996 | | | — | | | 1,328 | | | 606 | | | 3,130 | |
| Criticized (nonaccrual) | | — | | | 151 | | | 285 | | | 4,617 | | | 164 | | | 1,962 | | | — | | | 4,517 | | | 11,696 | |
| Subtotal HELOCs | | 1,131 | | | 1,031 | | | 3,364 | | | 9,980 | | | 9,593 | | | 15,437 | | | 1,330,247 | | | 230,933 | | | 1,601,716 | |
Total residential mortgage | | 2,386,984 | | | 1,815,886 | | | 1,505,836 | | | 1,033,476 | | | 534,876 | | | 949,431 | | | 1,330,247 | | | 230,933 | | | 9,787,669 | |
| Other consumer: | | | | | | | | | | | | | | | | | | |
| Pass | | 9,531 | | | — | | | — | | | 1,830 | | | — | | | 83,255 | | | 66,136 | | | — | | | 160,752 | |
| Criticized (accrual) | | 16 | | | — | | | — | | | — | | | — | | | — | | | — | | | — | | | 16 | |
| Criticized (nonaccrual) | | — | | | — | | | — | | | 2,491 | | | — | | | — | | | — | | | — | | | 2,491 | |
Total other consumer | | 9,547 | | | — | | | — | | | 4,321 | | | — | | | 83,255 | | | 66,136 | | | — | | | 163,259 | |
| Total consumer | | 2,396,531 | | | 1,815,886 | | | 1,505,836 | | | 1,037,797 | | | 534,876 | | | 1,032,686 | | | 1,396,383 | | | 230,933 | | | 9,950,928 | |
Total | | $ | 9,787,213 | | | $ | 6,816,315 | | | $ | 5,125,324 | | | $ | 3,167,275 | | | $ | 1,547,971 | | | $ | 3,277,221 | | | $ | 8,390,152 | | | $ | 279,484 | | | $ | 38,390,955 | |
|
(1)As of September 30, 2021 and December 31, 2020, $647 thousand and $747 thousand of nonaccrual loans whose payments were guaranteed by the Federal Housing Administration, respectively, were classified with a “Pass” rating.
Revolving loans converted to term loans presented in the table above are excluded from the term loans by vintage year columns. During the three and nine months ended September 30, 2021, HELOCs totaling $4.1 million and $62.7 million, respectively, were converted to term loans. In comparison, during the three and nine months ended September 30, 2020, HELOCs totaling $59.8 million and $118.2 million, respectively, were converted to term loans. During the three and nine months ended September 30, 2021, one C&I revolving loan of $82 thousand was converted to a term loan. In comparison, during the three and nine months ended September 30, 2020, one C&I revolving loan of $250 thousand was converted to a term loan. One CRE revolving loan of $1.4 million was converted to a term loan during the three months ended September 30, 2021. Three CRE revolving loans totaling $6.4 million were converted to term loans during the nine months ended September 30, 2021. In comparison, there were no conversions of CRE revolving loans to term loans during both the three and nine months ended September 30, 2020.
Nonaccrual and Past Due Loans
Loans that are 90 or more days past due are generally placed on nonaccrual status, unless the loan is well-collateralized and in the process of collection. Loans that are less than 90 days past due but have identified deficiencies, such as when the full collection of principal or interest becomes uncertain, are also placed on nonaccrual status. Payment deferral activities instituted in response to the COVID-19 pandemic could delay the recognition of delinquencies for customers who otherwise would have moved into nonaccrual status. The following tables present the aging analysis of total loans held-for-investment as of September 30, 2021 and December 31, 2020:
| | | | | | | | | | | | | | | | | | | | | | | | | | | | | | | | | | | | | | | | | | | | | | |
|
| ($ in thousands) | | September 30, 2021 |
| Current Accruing Loans (1) | | Accruing
Loans
30-59 Days
Past Due | | Accruing
Loans
60-89 Days
Past Due | | | | | | Total
Accruing
Past Due
Loans | | | | | | Total
Nonaccrual
Loans | | Total
Loans |
| Commercial: | | | | | | | | | | | | | | | | | | | | |
| C&I | | $ | 13,717,788 | | | $ | 6,597 | | | $ | 10,107 | | | | | | | $ | 16,704 | | | | | | | $ | 97,157 | | | $ | 13,831,649 | |
| CRE: | | | | | | | | | | | | | | | | | | | | |
| CRE | | 11,803,236 | | | 438 | | | 155 | | | | | | | 593 | | | | | | | 14,236 | | | 11,818,065 | |
| Multifamily residential | | 3,337,341 | | | 1,914 | | | — | | | | | | | 1,914 | | | | | | | 1,123 | | | 3,340,378 | |
| Construction and land | | 376,921 | | | — | | | — | | | | | | | — | | | | | | | — | | | 376,921 | |
| Total CRE | | 15,517,498 | | | 2,352 | | | 155 | | | | | | | 2,507 | | | | | | | 15,359 | | | 15,535,364 | |
| Total commercial | | 29,235,286 | | | 8,949 | | | 10,262 | | | | | | | 19,211 | | | | | | | 112,516 | | | 29,367,013 | |
| Consumer: | | | | | | | | | | | | | | | | | | | | |
| Residential mortgage: | | | | | | | | | | | | | | | | | | | | |
| Single-family residential | | 8,995,226 | | | 13,442 | | | 3,711 | | | | | | | 17,153 | | | | | | | 9,422 | | | 9,021,801 | |
| HELOCs | | 1,950,594 | | | 2,298 | | | 1,999 | | | | | | | 4,297 | | | | | | | 8,731 | | | 1,963,622 | |
| Total residential mortgage | | 10,945,820 | | | 15,740 | | | 5,710 | | | | | | | 21,450 | | | | | | | 18,153 | | | 10,985,423 | |
| Other consumer | | 126,594 | | | 180 | | | 4 | | | | | | | 184 | | | | | | | 2,491 | | | 129,269 | |
| Total consumer | | 11,072,414 | | | 15,920 | | | 5,714 | | | | | | | 21,634 | | | | | | | 20,644 | | | 11,114,692 | |
| Total | | $ | 40,307,700 | | | $ | 24,869 | | | $ | 15,976 | | | | | | | $ | 40,845 | | | | | | | $ | 133,160 | | | $ | 40,481,705 | |
|
| | | | | | | | | | | | | | | | | | | | | | | | | | | | | | | | | | | | | | | | | | | | |
|
| ($ in thousands) | | December 31, 2020 |
| Current Accruing Loans (1) | | Accruing
Loans
30-59 Days
Past Due | | Accruing
Loans
60-89 Days
Past Due | | | | Total
Accruing
Past Due
Loans | | | | | | Total
Nonaccrual
Loans | | Total
Loans |
| Commercial: | | | | | | | | | | | | | | | | | | |
| C&I | | $ | 13,488,070 | | | $ | 8,993 | | | $ | 724 | | | | | $ | 9,717 | | | | | | | $ | 133,939 | | | $ | 13,631,726 | |
| CRE: | | | | | | | | | | | | | | | | | | |
| CRE | | 11,127,690 | | | 375 | | | — | | | | | 375 | | | | | | | 46,546 | | | 11,174,611 | |
| Multifamily residential | | 3,028,512 | | | 1,818 | | | — | | | | | 1,818 | | | | | | | 3,668 | | | 3,033,998 | |
| Construction and land | | 579,792 | | | 19,900 | | | — | | | | | 19,900 | | | | | | | — | | | 599,692 | |
| Total CRE | | 14,735,994 | | | 22,093 | | | — | | | | | 22,093 | | | | | | | 50,214 | | | 14,808,301 | |
| Total commercial | | 28,224,064 | | | 31,086 | | | 724 | | | | | 31,810 | | | | | | | 184,153 | | | 28,440,027 | |
| Consumer: | | | | | | | | | | | | | | | | | | |
| Residential mortgage: | | | | | | | | | | | | | | | | | | |
| Single-family residential | | 8,156,645 | | | 9,911 | | | 2,583 | | | | | 12,494 | | | | | | | 16,814 | | | 8,185,953 | |
| HELOCs | | 1,583,968 | | | 2,922 | | | 3,130 | | | | | 6,052 | | | | | | | 11,696 | | | 1,601,716 | |
Total residential mortgage | | 9,740,613 | | | 12,833 | | | 5,713 | | | | | 18,546 | | | | | | | 28,510 | | | 9,787,669 | |
| Other consumer | | 160,534 | | | 217 | | | 17 | | | | | 234 | | | | | | | 2,491 | | | 163,259 | |
| Total consumer | | 9,901,147 | | | 13,050 | | | 5,730 | | | | | 18,780 | | | | | | | 31,001 | | | 9,950,928 | |
| Total | | $ | 38,125,211 | | | $ | 44,136 | | | $ | 6,454 | | | | | $ | 50,590 | | | | | | | $ | 215,154 | | | $ | 38,390,955 | |
|
(1)As of September 30, 2021 and December 31, 2020, loans in payment deferral programs offered in response to the COVID-19 pandemic that are performing according to their modified terms are generally not considered delinquent, and are included in the “Current Accruing Loans” column.
The following table presents the amortized cost of loans on nonaccrual status for which there was no related allowance for loan losses as of both September 30, 2021 and December 31, 2020. Nonaccrual loans may not have an allowance for credit losses if the loss expectation is zero because the loan balances are supported by the collateral value.
| | | | | | | | | | | | | | | | |
|
| ($ in thousands) | | | September 30, 2021 | | | December 31, 2020 |
| | | | | | |
| Commercial: | | | | | | |
| C&I | | | $ | 15,270 | | | | $ | 62,040 | |
| CRE: | | | | | | |
| CRE | | | 13,826 | | | | 45,537 | |
| Multifamily residential | | | — | | | | 2,519 | |
| | | | | | |
| Total CRE | | | 13,826 | | | | 48,056 | |
| Total commercial | | | 29,096 | | | | 110,096 | |
| Consumer: | | | | | | |
| Residential mortgage: | | | | | | |
| Single-family residential | | | 1,534 | | | | 6,013 | |
| HELOCs | | | 5,608 | | | | 8,076 | |
| Total residential mortgage | | | 7,142 | | | | 14,089 | |
| Other consumer | | | — | | | | 2,491 | |
| Total consumer | | | 7,142 | | | | 16,580 | |
| Total nonaccrual loans with no related allowance for loan losses | | | $ | 36,238 | | | | $ | 126,676 | |
|
Foreclosed Assets
Foreclosed assets, consisting of OREO and other nonperforming assets, are included in Other assets on the Consolidated Balance Sheet. The Company had $39.5 million in foreclosed assets as of September 30, 2021, compared with $19.7 million as of December 31, 2020. The Company commences the foreclosure process on consumer mortgage loans after a borrower becomes more than 120 days delinquent in accordance with the Consumer Financial Protection Bureau guidelines. The carrying value of consumer real estate loans that were in the process of active or suspended foreclosure was $8.7 million and $4.1 million as of September 30, 2021 and December 31, 2020, respectively. The Company suspended certain mortgage foreclosure activities in connection with its actions to support its customers during the COVID-19 pandemic. In addition, certain other foreclosures are awaiting for the end of government-mandated foreclosure moratoriums in certain states.
Troubled Debt Restructurings
Troubled debt restructurings (“TDRs”) are individually evaluated, and the type of restructuring is selected based on the loan type and the circumstances of the borrower’s financial difficulties. A TDR is a modification of the terms of a loan when the Company, for economic or legal reasons related to the borrower’s financial difficulties, grants a concession to the borrower that it would not have otherwise considered. Since March 2020, the Company has implemented various commercial and consumer loan modification programs to provide its borrowers relief from the economic impacts of the COVID-19 pandemic. These COVID-related modifications are generally not classified as TDRs due to the relief under the Coronavirus Aid, Relief, and Economic Security Act (“CARES Act”) and the Interagency Statement on Loan Modifications and Reporting for Financial Institutions Working with Customers Affected by the Coronavirus (Revised), and therefore are not included in the discussion below. Assistance provided in response to the COVID-19 pandemic could delay the recognition of delinquencies, nonaccrual status, and net charge-offs for those borrowers who would have otherwise moved into past due or nonaccrual status. See Note 1 — Summary of Significant Accounting Policies — Significant Accounting Policies to the Consolidated Financial Statements of the Company’s 2020 Form 10-K.
The following tables present the additions to TDRs for the three and nine months ended September 30, 2021 and 2020:
| | | | | | | | | | | | | | | | | | | | | | | | | | | | | | | | | | | | | | | | | | | | | | | | | | |
|
| ($ in thousands) | | Loans Modified as TDRs During the Three Months Ended September 30, |
| 2021 | | 2020 |
| Number
of
Loans | | Pre-
Modification
Outstanding
Recorded
Investment | | Post- Modification Outstanding Recorded Investment (1) | | Financial Impact (2) | | Number
of
Loans | | Pre-
Modification
Outstanding
Recorded
Investment | | Post- Modification Outstanding Recorded Investment (1) | | Financial Impact (2) |
| Commercial: | | | | | | | | | | | | | | | | |
| C&I | | 7 | | $ | 26,248 | | | $ | 27,111 | | | $ | 5,688 | | | 6 | | $ | 43,378 | | | $ | 35,568 | | | $ | 12,108 | |
| CRE: | | | | | | | | | | | | | | | | |
| CRE | | — | | — | | | — | | | — | | | 2 | | 21,429 | | | 21,242 | | | 21 | |
| Multifamily residential | | 1 | | 1,101 | | | 1,118 | | | — | | | 1 | | 1,220 | | | 1,226 | | | — | |
| | | | | | | | | | | | | | | | |
| Total CRE | | 1 | | 1,101 | | | 1,118 | | | — | | | 3 | | 22,649 | | | 22,468 | | | 21 | |
| Total commercial | | 8 | | 27,349 | | | 28,229 | | | 5,688 | | | 9 | | 66,027 | | | 58,036 | | | 12,129 | |
| | | | | | | | | | | | | | | | |
| | | | | | | | | | | | | | | | |
| | | | | | | | | | | | | | | | |
| | | | | | | | | | | | | | | | |
| | | | | | | | | | | | | | | | |
| | | | | | | | | | | | | | | | |
| | | | | | | | | | | | | | | | |
| Total | | 8 | | $ | 27,349 | | | $ | 28,229 | | | $ | 5,688 | | | 9 | | $ | 66,027 | | | $ | 58,036 | | | $ | 12,129 | |
|
| | | | | | | | | | | | | | | | | | | | | | | | | | | | | | | | | | | | | | | | | | | | | | | | | | |
|
| ($ in thousands) | | Loans Modified as TDRs During the Nine Months Ended September 30, |
| 2021 | | 2020 |
| Number
of
Loans | | Pre-
Modification
Outstanding
Recorded
Investment | | Post- Modification Outstanding Recorded Investment (1) | | Financial Impact (2) | | Number
of
Loans | | Pre-
Modification
Outstanding
Recorded
Investment | | Post- Modification Outstanding Recorded Investment (1) | | Financial Impact (2) |
| Commercial: | | | | | | | | | | | | | | | | |
| C&I | | 11 | | $ | 46,144 | | | $ | 45,954 | | | $ | 7,662 | | | 11 | | $ | 93,235 | | | $ | 79,713 | | | $ | 12,507 | |
| CRE: | | | | | | | | | | | | | | | | |
| CRE | | — | | — | | | — | | | — | | | 2 | | 21,429 | | | 21,242 | | | 21 | |
| Multifamily residential | | 1 | | 1,101 | | | 1,118 | | | — | | | 1 | | 1,220 | | | 1,226 | | | — | |
| | | | | | | | | | | | | | | | |
| Total CRE | | 1 | | 1,101 | | | 1,118 | | | — | | | 3 | | 22,649 | | | 22,468 | | | 21 | |
| Total commercial | | 12 | | 47,245 | | | 47,072 | | | 7,662 | | | 14 | | 115,884 | | | 102,181 | | | 12,528 | |
| | | | | | | | | | | | | | | | |
| | | | | | | | | | | | | | | | |
| | | | | | | | | | | | | | | | |
| | | | | | | | | | | | | | | | |
| | | | | | | | | | | | | | | | |
| | | | | | | | | | | | | | | | |
| | | | | | | | | | | | | | | | |
| Total | | 12 | | $ | 47,245 | | | $ | 47,072 | | | $ | 7,662 | | | 14 | | $ | 115,884 | | | $ | 102,181 | | | $ | 12,528 | |
|
(1)Includes subsequent payments after modification and reflects the balance as of September 30, 2021 and 2020.
(2)Includes charge-offs and specific reserves recorded since the modification date.
The following tables present the TDR post-modification outstanding balances for the three and nine months ended September 30, 2021 and 2020 by modification type:
| | | | | | | | | | | | | | | | | | | | | | | | | | | | | | | | | | | | | | | | | | | | | | | | | | | | | | | | | | | | | | | | | | |
|
| ($ in thousands) | | Modification Type During the Three Months Ended September 30, |
| 2021 | | 2020 |
| Principal (1) | | Principal
and Interest | | Interest
Deferments | | | | Interest Rate Reduction | | Total | | Principal (1) | | Principal and Interest (2) | | Interest
Deferments | | Interest Rate Reduction | | | | Total |
| Commercial: | | | | | | | | | | | | | | | | | | | | | | | | |
| C&I | | $ | 27,111 | | | $ | — | | | $ | — | | | | | $ | — | | | $ | 27,111 | | | $ | 19,025 | | | $ | — | | | $ | 16,543 | | | $ | — | | | | | $ | 35,568 | |
| CRE: | | | | | | | | | | | | | | | | | | | | | | | | |
| CRE | | — | | | — | | | — | | | | | — | | | — | | | 21,242 | | | — | | | — | | | — | | | | | 21,242 | |
| Multifamily residential | | 1,118 | | | — | | | — | | | | | — | | | 1,118 | | | 1,226 | | | — | | | — | | | — | | | | | 1,226 | |
| | | | | | | | | | | | | | | | | | | | | | | | |
| Total CRE | | 1,118 | | | — | | | — | | | | | | | 1,118 | | | 22,468 | | | — | | | — | | | — | | | | | 22,468 | |
| Total commercial | | 28,229 | | | — | | | — | | | | | — | | | 28,229 | | | 41,493 | | | — | | | 16,543 | | | — | | | | | 58,036 | |
| | | | | | | | | | | | | | | | | | | | | | | | |
| | | | | | | | | | | | | | | | | | | | | | | | |
| | | | | | | | | | | | | | | | | | | | | | | | |
| | | | | | | | | | | | | | | | | | | | | | | | |
| | | | | | | | | | | | | | | | | | | | | | | | |
| | | | | | | | | | | | | | | | | | | | | | | | |
| | | | | | | | | | | | | | | | | | | | | | | | |
| Total | | $ | 28,229 | | | $ | — | | | $ | — | | | | | $ | — | | | $ | 28,229 | | | $ | 41,493 | | | $ | — | | | $ | 16,543 | | | $ | — | | | | | $ | 58,036 | |
|
| | | | | | | | | | | | | | | | | | | | | | | | | | | | | | | | | | | | | | | | | | | | | | | | | | | | | | | | | | | | | | | | | | |
|
| ($ in thousands) | | Modification Type During the Nine Months Ended September 30, |
| 2021 | | 2020 |
| Principal (1) | | Principal
and Interest | | Interest
Deferments | | | | Interest Rate Reduction | | Total | | Principal (1) | | Principal and Interest (2) | | Interest
Deferments | | Interest Rate Reduction | | | | Total |
| Commercial: | | | | | | | | | | | | | | | | | | | | | | | | |
| C&I | | $ | 28,780 | | | $ | — | | | $ | — | | | | | $ | 17,174 | | | $ | 45,954 | | | $ | 36,043 | | | $ | 10,819 | | | $ | 32,851 | | | $ | — | | | | | $ | 79,713 | |
| CRE: | | | | | | | | | | | | | | | | | | | | | | | | |
| CRE | | — | | | — | | | — | | | | | — | | | — | | | 21,242 | | | — | | | — | | | — | | | | | 21,242 | |
| Multifamily residential | | 1,118 | | | — | | | — | | | | | — | | | 1,118 | | | 1,226 | | | — | | | — | | | — | | | | | 1,226 | |
| | | | | | | | | | | | | | | | | | | | | | | | |
| Total CRE | | 1,118 | | | — | | | — | | | | | — | | | 1,118 | | | 22,468 | | | — | | | — | | | — | | | | | 22,468 | |
| Total commercial | | 29,898 | | | — | | | — | | | | | 17,174 | | | 47,072 | | | 58,511 | | | 10,819 | | | 32,851 | | | — | | | | | 102,181 | |
| | | | | | | | | | | | | | | | | | | | | | | | |
| | | | | | | | | | | | | | | | | | | | | | | | |
| | | | | | | | | | | | | | | | | | | | | | | | |
| | | | | | | | | | | | | | | | | | | | | | | | |
| | | | | | | | | | | | | | | | | | | | | | | | |
| | | | | | | | | | | | | | | | | | | | | | | | |
| | | | | | | | | | | | | | | | | | | | | | | | |
| Total | | $ | 29,898 | | | $ | — | | | $ | — | | | | | $ | 17,174 | | | $ | 47,072 | | | $ | 58,511 | | | $ | 10,819 | | | $ | 32,851 | | | $ | — | | | | | $ | 102,181 | |
|
(1)Includes forbearance payments, term extensions and principal deferments that modify the terms of the loan from principal and interest payments to interest payments only.
(2)Include principal and interest deferments or reductions.
After a loan is modified as a TDR, the Company continues to monitor its performance under its most recent restructured terms. A TDR may become delinquent and result in payment default (generally 90 days past due) subsequent to restructuring. The following table presents the information on loans that entered into payment default during the three and nine months ended September 30, 2021 and 2020 that were modified in as TDRs during the 12 months preceding payment default:
| | | | | | | | | | | | | | | | | | | | | | | | | | | | | | | | | | | | | | | | | | | | | | | | | | | | | | |
| | | | |
| ($ in thousands) | | Loans Modified as TDRs that Subsequently Defaulted |
| Three Months Ended September 30, | | Nine Months Ended September 30, |
| 2021 | | 2020 | | 2021 | | 2020 | | | | |
| Loan Count | | Recorded
Investment | | Loan Count | | Recorded
Investment | | Loan Count | | Recorded
Investment | | Loan Count | | Recorded
Investment | | | | |
| Commercial: | | | | | | | | | | | | | | | | | | | | |
| C&I | | — | | | $ | — | | | — | | | $ | — | | | 1 | | | $ | 11,431 | | | 1 | | | $ | 16,309 | | | | | |
| | | | | | | | | | | | | | | | | | | | |
| | | | | | | | | | | | | | | | | | | | |
| | | | | | | | | | | | | | | | | | | | |
| | | | | | | | | | | | | | | | | | | | |
| | | | | | | | | | | | | | | | | | | | |
| | | | | | | | | | | | | | | | | | | | |
| | | | | | | | | | | | | | | | | | | | |
| | | | | | | | | | | | | | | | | | | | |
| | | | | | | | | | | | | | | | | | | | |
| | | | | | | | | | | | | | | | | | | | |
| | | | | | | | | | | | | | | | | | | | |
| | | | | | | | | | | | | | | | | | | | |
| | | | | | | | | | | | | | | | | | | | |
| Total | | — | | | $ | — | | | — | | | $ | — | | | 1 | | | $ | 11,431 | | | 1 | | | $ | 16,309 | | | | | |
| | | | |
As of September 30, 2021 and December 31, 2020, the remaining commitments to lend additional funds to borrowers whose terms of their outstanding owed balances were modified as TDRs was $6.8 million and $3.0 million, respectively.
Allowance for Credit Losses
The Company has an allowance framework under ASU 2016-13 for all financial assets measured at amortized cost and certain off-balance sheet credit exposures. The measurement of the allowance for credit losses is based on management’s best estimate of lifetime expected credit losses inherent in the Company’s relevant financial assets.
The allowance for credit losses is deducted from the amortized cost basis of a financial asset or a group of financial assets so that the balance sheet reflects the net amount the Company expects to collect. Amortized cost is the principal balance outstanding, net of purchase premiums and discounts, deferred fees and costs, and escrow advances. Subsequent changes in expected credit losses are recognized in net income as a provision for, or a reversal of, credit loss expense.
The allowance for credit losses estimation involves procedures to consider the unique risk characteristics of the portfolio segments. The majority of the Company’s credit exposures share risk characteristics with other similar exposures and are collectively evaluated. The collectively evaluated loans cover performing risk-rated loans and unfunded credit commitments. If an exposure does not share risk characteristics with other exposures, the Company generally estimates expected credit losses on an individual basis. These individually assessed loans include TDR and nonaccrual loans.
Allowance for Collectively Evaluated Loans
The allowance for collectively evaluated loans consists of a quantitative component that assesses the different risk factors considered in our models and a qualitative component that considers risk factors external to the models. Each of these components are described below.
•Quantitative Component — The allowance for loan losses is estimated using quantitative methods that consider a variety of factors such as historical loss experience, the current credit quality of the portfolio, and an economic outlook over the life of the loan. The Company incorporates forward-looking information using macroeconomic scenarios applied over the forecasted life of the loans. The forward-looking information is limited to the reasonable and supportable period. These macroeconomic scenarios include variables that are considered key drivers of increases and decreases in credit losses. The Company utilizes a probability-weighted, multiple-scenario forecast approach. These scenarios may consist of a base forecast representing management's view of the most likely outcome, and downside or upside scenarios reflecting possible worsening or improving economic conditions. The quantitative models incorporate a probability-weighted calculation of these macroeconomic scenarios over a reasonable and supportable forecast period. If the life of the loans extends beyond the reasonable and supportable forecast period, the Company will consider historical experience or long-run macroeconomic trends over the remaining lives of the loans to estimate the allowance for loan losses.
For both the three and nine months ended September 30, 2021 and 2020, there were no changes to the reasonable and supportable forecast period, except to the C&I segment, which changed from eight to 11 quarters, and no changes to the reversion to historical loss experience method. The change in the reasonable and supportable period for the C&I segment was due to model enhancement, including updates to certain macroeconomic variable inputs. There was no change to the overall model methodology.
The following table provides key credit risk characteristics and macroeconomic variables that the Company uses to estimate the expected credit losses by portfolio segment:
| | | | | | | | | | | | | | |
| | | | |
| Portfolio Segment | | Risk Characteristics | | Macroeconomic Variables |
| C&I | | Age (1), size and spread at origination, and internal risk rating | | Volatility Index (“VIX”) and BBB yield to 10-year U.S. Treasury spread (“BBB Spread”) (1) |
| CRE, Multifamily residential, and Construction and land | | Delinquency status, maturity date, collateral value, property type, and geographic location | | Unemployment rate, Gross Domestic Product (“GDP”), and U.S. Treasury rates |
| Single-family residential and HELOCs | | FICO score, delinquency status, maturity date, collateral value, and geographic location | | Unemployment rate, GDP, and home price index |
| Other consumer | | Historical loss experience | | Immaterial (2) |
| | | | |
(1)Due to model enhancements, risk characteristic related to “time-to-maturity” was changed to “age”; while macroeconomic variables related to “unemployment rate and two- and ten-year U.S. Treasury spread” were changed to “VIX and BBB Spread” during the three months ended September 30, 2021.
(2)Macroeconomic variables are included in the qualitative estimate.
Allowance for Loan Losses for the Commercial Loan Portfolio
The Company’s C&I loan lifetime loss rate model estimates credit losses by estimating a loss rate expected over the life of a loan. This loss rate is applied to the amortized cost basis, excluding accrued interest receivable, to determine expected credit losses. The lifetime loss rate model’s reasonable and supportable period spans eleven quarters, thereafter immediately reverting to the historical average loss rate, expressed through the loan-level lifetime loss rate.
For CRE, multifamily residential, and construction and land loans, projected probability of defaults (“PDs”) and loss given defaults (“LGDs”) are applied to the estimated exposure at default, considering the term and payment structure of the loan, to generate estimates of expected loss at the loan level. The forecast of future economic conditions returns to long-run historical economic trends after the reasonable and supportable period.
In order to estimate the life of a loan under both models, the contractual term of the loan is adjusted for estimated prepayments based on historical prepayment experience.
Allowance for Loan Losses for the Consumer Loan Portfolio
For single-family residential and HELOC loans, projected PDs and LGDs are applied to the estimated exposure at default, considering the term and payment structure of the loan, to generate estimates of expected loss at the loan level. The forecast of future economic conditions returns to long-run historical economic trends after the reasonable and supportable period. In order to estimate the life of a loan for the single-family residential and HELOC portfolio, the contractual term of the loan is adjusted for estimated prepayments based on historical prepayment experience. For other consumer loans, the Company uses a loss rate approach.
•Qualitative Component — The Company also considers the following qualitative factors in the determination of the collectively evaluated allowance, if these factors have not already been captured by the quantitative model. Such qualitative factors may include, but are not limited to:
–Loan growth trends;
–The volume and severity of past due financial assets, and the volume and severity of adversely classified financial assets;
–The Company’s lending policies and procedures, including changes in lending strategies, underwriting standards, collection, write-off and recovery practices;
–Knowledge of a borrower’s operations;
–The quality of the Company’s credit review system;
–The experience, ability and depth of the Company’s management, lending associates and other relevant associates;
–The effect of other external factors such as the regulatory and legal environments and changes in technology;
–Actual and expected changes in international, national, regional, and local economic and business conditions in which the Company operates; and
–Risk factors in certain industry sectors not captured by the quantitative models.
The magnitude of the impact of these factors on the Company’s qualitative assessment of the allowance for credit losses changes from period to period according to changes made by management in its assessment of these factors. The extent to which these factors change may be dependent on whether they are already reflected in quantitative loss estimates during the current period and the extent to which changes in these factors diverge from period to period.
While the Company’s allowance methodologies strive to reflect all relevant credit risk factors, there continues to be uncertainty associated with, but not limited to, potential imprecision in the estimation process due to the inherent time lag of obtaining information and normal variations between expected and actual outcomes. The Company may hold additional qualitative reserves that are designed to provide coverage for losses attributable to such risk.
Allowance for Individually Evaluated Loans
When a loan no longer shares similar risk characteristics with other loans, such as in the case of certain nonaccrual or TDR loans, the Company estimates the allowance for loan losses on an individual loan basis. The allowance for loan losses for individually evaluated loans is measured as the difference between the recorded value of the loans and their fair value. For loans evaluated individually, the Company uses one of three different asset valuation measurement methods: (1) the fair value of collateral less costs to sell; (2) the present value of expected future cash flows; and (3) the loan's observable market price. If an individually evaluated loan is determined to be collateral dependent, the Company applies the fair value of the collateral less costs to sell method. If an individually evaluated loan is determined not to be collateral dependent, the Company uses the present value of future cash flows or the observable market value of the loan.
•Collateral-Dependent Loans — The allowance of a collateral-dependent loan is limited to the difference between the recorded value and fair value of the collateral less cost of disposal or sale. As of September 30, 2021, collateral-dependent commercial and consumer loans totaled $45.4 million and $10.4 million, respectively. In comparison, collateral-dependent commercial and consumer loans totaled $97.2 million and $17.3 million, respectively, as of December 31, 2020. The Company's commercial collateral-dependent loans were secured by real estate or other collateral. The Company's consumer collateral-dependent loans were all residential mortgage loans, secured by the underlying real estate. As of both September 30, 2021 and December 31, 2020, the collateral value of the properties securing each of these collateral-dependent loans, net of selling costs, exceeded the recorded value of the individual loans.
The following tables summarize the activity in the allowance for loan losses by portfolio segments for the three and nine months ended September 30, 2021 and 2020:
| | | | | | | | | | | | | | | | | | | | | | | | | | | | | | | | | | | | | | | | | | | | | | | | | | |
|
| ($ in thousands) | | Three Months Ended September 30, 2021 |
| Commercial | | Consumer | | Total |
| C&I | | CRE | | Residential Mortgage | | Other
Consumer | |
| | CRE | | Multifamily
Residential | | Construction
and Land | | Single-
Family
Residential | | HELOCs | | |
Allowance for loan losses, beginning of period | | $ | 362,528 | | | $ | 161,962 | | | $ | 21,925 | | | $ | 15,643 | | | $ | 16,530 | | | $ | 2,938 | | | $ | 4,198 | | | $ | 585,724 | |
| (Reversal of) provision for credit losses on loans | (a) | (23,365) | | | 2,129 | | | (2,660) | | | 9,058 | | | 2,537 | | | 435 | | | 130 | | | (11,736) | |
| Gross charge-offs | | (1,154) | | | (14,229) | | | — | | | (2,674) | | | (912) | | | — | | | (10) | | | (18,979) | |
| Gross recoveries | | 4,203 | | | 187 | | | 652 | | | 267 | | | 137 | | | 19 | | | — | | | 5,465 | |
| Total net recoveries (charge-offs) | | 3,049 | | | (14,042) | | | 652 | | | (2,407) | | | (775) | | | 19 | | | (10) | | | (13,514) | |
| Foreign currency translation adjustment | | (70) | | | — | | | — | | | — | | | — | | | — | | | — | | | (70) | |
| Allowance for loan losses, end of period | | $ | 342,142 | | | $ | 150,049 | | | $ | 19,917 | | | $ | 22,294 | | | $ | 18,292 | | | $ | 3,392 | | | $ | 4,318 | | | $ | 560,404 | |
| | | | | | | | | | | | | | | | |
| | | | | | | | | | | | | | | | |
| | | | | | | | | | | | | | | | |
| | | | | | | | | | | | | | | | |
| | | | | | | | | | | | | | | | |
| | | | | | | | | | | | | | | | |
| | | | | | | | | | | | | | | | | | | | | | | | | | | | | | | | | | | | | | | | | | | | | | | | | | |
|
| ($ in thousands) | | Three Months Ended September 30, 2020 |
| Commercial | | Consumer | | Total |
| C&I | | CRE | | Residential Mortgage | | Other
Consumer | |
| | CRE | | Multifamily
Residential | | Construction
and Land | | Single-
Family
Residential | | HELOCs | | |
Allowance for loan losses, beginning of period | | $ | 380,723 | | | $ | 176,040 | | | $ | 25,058 | | | $ | 18,551 | | | $ | 25,314 | | | $ | 3,867 | | | $ | 2,518 | | | $ | 632,071 | |
| | | | | | | | | | | | | | | | |
Provision for (reversal of) credit losses on loans | (a) | 31,691 | | | (8,301) | | | (1,916) | | | (8,180) | | | (2,692) | | | (637) | | | (76) | | | 9,889 | |
| | | | | | | | | | | | | | | | |
| Gross charge-offs | | (25,111) | | | (1,414) | | | — | | | — | | | — | | | — | | | (124) | | | (26,649) | |
| Gross recoveries | | 1,218 | | | 485 | | | 665 | | | 30 | | | — | | | 43 | | | — | | | 2,441 | |
| Total net (charge-offs) recoveries | | (23,893) | | | (929) | | | 665 | | | 30 | | | — | | | 43 | | | (124) | | | (24,208) | |
| Foreign currency translation adjustment | | 500 | | | — | | | — | | | — | | | — | | | — | | | — | | | 500 | |
| Allowance for loan losses, end of period | | $ | 389,021 | | | $ | 166,810 | | | $ | 23,807 | | | $ | 10,401 | | | $ | 22,622 | | | $ | 3,273 | | | $ | 2,318 | | | $ | 618,252 | |
| | | | | | | | | | | | | | | | |
| | | | | | | | | | | | | | | | |
| | | | | | | | | | | | | | | | |
| | | | | | | | | | | | | | | | |
| | | | | | | | | | | | | | | | |
| | | | | | | | | | | | | | | | |
| | | | | | | | | | | | | | | | |
| | | | | | | | | | | | | | | | | | | | | | | | | | | | | | | | | | | | | | | | | | | | | | | | | | |
|
| ($ in thousands) | | Nine Months Ended September 30, 2021 |
| Commercial | | Consumer | | Total |
| C&I | | CRE | | Residential Mortgage | | Other
Consumer | |
| | CRE | | Multifamily
Residential | | Construction
and Land | | Single-
Family
Residential | | HELOCs | | |
Allowance for loan losses, beginning of period | | $ | 398,040 | | | $ | 163,791 | | | $ | 27,573 | | | $ | 10,239 | | | $ | 15,520 | | | $ | 2,690 | | | $ | 2,130 | | | $ | 619,983 | |
| (Reversal of) provision for credit losses on loans | (a) | (42,112) | | | 11,227 | | | (9,436) | | | 14,407 | | | 3,522 | | | 707 | | | 2,226 | | | (19,459) | |
| Gross charge-offs | | (20,162) | | | (25,558) | | | (130) | | | (2,954) | | | (1,046) | | | (45) | | | (43) | | | (49,938) | |
| Gross recoveries | | 6,301 | | | 589 | | | 1,910 | | | 602 | | | 296 | | | 40 | | | 5 | | | 9,743 | |
| Total net (charge-offs) recoveries | | (13,861) | | | (24,969) | | | 1,780 | | | (2,352) | | | (750) | | | (5) | | | (38) | | | (40,195) | |
| Foreign currency translation adjustment | | 75 | | | — | | | — | | | — | | | — | | | — | | | — | | | 75 | |
| Allowance for loan losses, end of period | | $ | 342,142 | | | $ | 150,049 | | | $ | 19,917 | | | $ | 22,294 | | | $ | 18,292 | | | $ | 3,392 | | | $ | 4,318 | | | $ | 560,404 | |
| | | | | | | | | | | | | | | | |
| | | | | | | | | | | | | | | | |
| | | | | | | | | | | | | | | | |
| | | | | | | | | | | | | | | | |
| | | | | | | | | | | | | | | | |
| | | | | | | | | | | | | | | | |
| | | | | | | | | | | | | | | | | | | | | | | | | | | | | | | | | | | | | | | | | | | | | | | | | | |
|
| ($ in thousands) | | Nine Months Ended September 30, 2020 |
| Commercial | | Consumer | | Total |
| C&I | | CRE | | Residential Mortgage | | Other
Consumer | |
| | CRE | | Multifamily
Residential | | Construction
and Land | | Single-
Family
Residential | | HELOCs | | |
Allowance for loan losses, beginning of period | | $ | 238,376 | | | $ | 40,509 | | | $ | 22,826 | | | $ | 19,404 | | | $ | 28,527 | | | $ | 5,265 | | | $ | 3,380 | | | $ | 358,287 | |
| Impact of ASU 2016-13 adoption | | 74,237 | | | 72,169 | | | (8,112) | | | (9,889) | | | (3,670) | | | (1,798) | | | 2,221 | | | 125,158 | |
| Allowance for loan losses, January 1, 2020 | | 312,613 | | | 112,678 | | | 14,714 | | | 9,515 | | | 24,857 | | | 3,467 | | | 5,601 | | | 483,445 | |
Provision for (reversal of) credit losses on loans | (a) | 130,171 | | | 46,449 | | | 7,273 | | | 828 | | | (2,659) | | | (20) | | | (3,197) | | | 178,845 | |
| | | | | | | | | | | | | | | | |
| Gross charge-offs | | (57,466) | | | (2,688) | | | — | | | — | | | — | | | (221) | | | (180) | | | (60,555) | |
| Gross recoveries | | 3,395 | | | 10,371 | | | 1,820 | | | 58 | | | 424 | | | 47 | | | 94 | | | 16,209 | |
| Total net (charge-offs) recoveries | | (54,071) | | | 7,683 | | | 1,820 | | | 58 | | | 424 | | | (174) | | | (86) | | | (44,346) | |
| Foreign currency translation adjustment | | 308 | | | — | | | — | | | — | | | — | | | — | | | — | | | 308 | |
| Allowance for loan losses, end of period | | $ | 389,021 | | | $ | 166,810 | | | $ | 23,807 | | | $ | 10,401 | | | $ | 22,622 | | | $ | 3,273 | | | $ | 2,318 | | | $ | 618,252 | |
| | | | | | | | | | | | | | | | |
| | | | | | | | | | | | | | | | |
| | | | | | | | | | | | | | | | |
| | | | | | | | | | | | | | | | |
| | | | | | | | | | | | | | | | |
| | | | | | | | | | | | | | | | |
| | | | | | | | | | | | | | | | |
The following table summarizes the activities in the allowance for unfunded credit commitments for the three and nine months ended September 30, 2021 and 2020:
| | | | | | | | | | | | | | | | | | | | | | | | | | |
| | | | |
| ($ in thousands) | | Three Months Ended
September 30, | | Nine Months Ended
September 30, |
| 2021 | | 2020 | | 2021 | | 2020 |
| Unfunded credit facilities | | | | | | | | |
| Allowance for unfunded credit commitments, beginning of period | | $ | 26,300 | | | $ | 28,972 | | | $ | 33,577 | | | $ | 11,158 | |
| Impact of ASU 2016-13 adoption | | — | | | — | | | — | | | 10,457 | |
| Provision for (reversal of) credit losses on unfunded credit commitments | (b) | 1,736 | | | 111 | | | (5,541) | | | 7,468 | |
| Allowance for unfunded credit commitments, end of period | | $ | 28,036 | | | $ | 29,083 | | | $ | 28,036 | | | $ | 29,083 | |
| | | | | | | | |
| (Reversal of) provision for credit losses | (a) + (b) | $ | (10,000) | | | $ | 10,000 | | | $ | (25,000) | | | $ | 186,313 | |
| | | | |
The allowance for credit losses as of September 30, 2021, was $588.4 million, a decrease of $65.2 million compared with $653.6 million as of December 31, 2020. The change in the allowance for credit losses was comprised of a net decrease of $59.6 million in the allowance for loan losses and a $5.6 million decrease in the allowance for unfunded credit commitments. An improved macroeconomic outlook resulted in the overall decrease in the required allowance for credit losses as of September 30, 2021, leading to a $10.0 million and $25.0 million reversal of credit losses for the three and nine months ended September 30, 2021, respectively.
The allowance for unfunded credit commitments is maintained at a level that management believes to be sufficient to absorb estimated expected credit losses related to unfunded credit facilities. See Note 9 — Commitments and Contingencies to the Consolidated Financial Statements in this Form 10-Q for additional information related to unfunded credit commitments.
Loans Held-for-Sale
As of September 30, 2021, the Company had no loans held-for-sale. As of December 31, 2020, loans held-for-sale of $1.8 million consisted of single-family residential loans. Refer to Note 1 — Summary of Significant Accounting Policies — Significant Accounting Policies — Loans Held-for-Sale to the Consolidated Financial Statements of the Company’s 2020 Form 10-K for additional details related to the Company’s loans held-for-sale.
Loan Transfers, Sales and Purchases
The Company purchases and sells loans in the secondary market in the ordinary course of business. Purchased loans may be transferred from held-for-investment to held-for-sale, and write-downs to allowance for loan losses are recorded, when appropriate. The following tables provide information about the carrying value of loans transferred, loans sold and purchased for the held-for-investment portfolio, during the three and nine months ended September 30, 2021 and 2020:
| | | | | | | | | | | | | | | | | | | | | | | | | | | | | | | | | | | | | |
|
| ($ in thousands) | | Three Months Ended September 30, 2021 |
| Commercial | | Consumer | | | | | | Total |
| C&I | | CRE | | Residential Mortgage | | | | | |
| | CRE | | | Construction
and Land | | Single-Family
Residential | | | | | |
Loans transferred from held-for-investment to held-for-sale (1) | | $ | 117,196 | | | $ | 24,120 | | | | $ | 17,226 | | | $ | 5,238 | | | | | | | $ | 163,780 | |
| | | | | | | | | | | | | | | |
Sales (2)(3)(4) | | $ | 118,851 | | | $ | 24,120 | | | | $ | 19,900 | | | $ | 6,959 | | | | | | | $ | 169,830 | |
Purchases (5) | | $ | 65,354 | | | $ | — | | | | $ | — | | | $ | 137,937 | | | | | | | $ | 203,291 | |
|
| | | | | | | | | | | | | | | | | | | | | | | | | | | | | | | | | |
|
| ($ in thousands) | | Three Months Ended September 30, 2020 |
| Commercial | | Consumer | | | | | | Total |
| C&I | | | CRE | | | | Residential Mortgage | | | | | |
| | | Multifamily
Residential | | | | Single-Family
Residential | | | | |
Loans transferred from held-for-investment to held-for-sale (1) | | $ | 89,394 | | | | $ | — | | | | | $ | — | | | | | | | $ | 89,394 | |
| | | | | | | | | | | | | | | |
Sales (2)(3)(4) | | $ | 92,237 | | | | $ | — | | | | | $ | 31,847 | | | | | | | $ | 124,084 | |
Purchases (5) | | $ | — | | | | $ | 838 | | | | | $ | 17,294 | | | | | | | $ | 18,132 | |
|
| | | | | | | | | | | | | | | | | | | | | | | | | | | | | | | | | | | | | | | | | | |
|
| ($ in thousands) | | Nine Months Ended September 30, 2021 |
| Commercial | | Consumer | | | | | | |
| | | CRE | | Residential Mortgage | | | | | | |
| C&I | | CRE | | Multifamily
Residential | | Construction
and Land | | Single-Family
Residential | | | | | | Total |
Loans transferred from held-for-investment to held-for-sale (1) | | $ | 327,781 | | | $ | 61,171 | | | $ | — | | | $ | 17,226 | | | $ | 5,238 | | | | | | | $ | 411,416 | |
| | | | | | | | | | | | | | | | |
Sales (2)(3)(4) | | $ | 329,233 | | | $ | 61,171 | | | $ | — | | | $ | 19,900 | | | $ | 17,123 | | | | | | | $ | 427,427 | |
Purchases (5) | | $ | 310,447 | | | $ | — | | | $ | 370 | | | $ | — | | | $ | 434,900 | | | | | | | $ | 745,717 | |
|
| | | | | | | | | | | | | | | | | | | | | | | | | | | | | | | | | | | | | | |
|
| ($ in thousands) | | Nine Months Ended September 30, 2020 |
| Commercial | | Consumer | | | | | | |
| | | CRE | | Residential Mortgage | | | | | | |
| C&I | | CRE | | Multifamily
Residential | | | | Single-Family
Residential | | | | | Total |
Loans transferred from held-for-investment to held-for-sale (1) | | $ | 246,052 | | | $ | 7,250 | | | $ | — | | | | | $ | — | | | | | | | $ | 253,302 | |
| | | | | | | | | | | | | | | | |
Sales (2)(3)(4) | | $ | 248,895 | | | $ | 7,250 | | | $ | — | | | | | $ | 50,197 | | | | | | | $ | 306,342 | |
Purchases (5) | | $ | 143,086 | | | $ | — | | | $ | 2,358 | | | | | $ | 18,378 | | | | | | | $ | 163,822 | |
|
(1)Includes write-downs of $3.6 million and $4.9 million to the allowance for loan losses related to loans transferred from held-for-investment to held-for-sale for the three and nine months ended September 30, 2021, respectively. There were $2.8 million of write-downs for each of the three and nine months ended September 30, 2020.
(2)Includes originated loans sold of $143.3 million and $341.9 million for the three and nine months ended September 30, 2021, respectively, and $112.3 million and $294.6 million for the three and nine months ended September 30, 2020, respectively. Originated loans sold consisted primarily of C&I and CRE loans during the three and nine months ended September 30, 2021. In comparison, originated loans sold consisted primarily of C&I and single-family residential loans for the three and nine months ended September 30, 2020.
(3)Includes $26.5 million and $85.5 million of purchased loans sold in the secondary market for the three and nine months ended September 30, 2021, respectively. There were $11.8 million of purchased loans sold in the secondary market for each of the three and nine months ended September 30, 2020.
(4)Net gains on sales of loans were $3.3 million and $6.6 million for the three and nine months ended September 30, 2021, respectively, and $361 thousand and $1.4 million for the three and nine months ended September 30, 2020, respectively.
(5)C&I loan purchases were comprised primarily of syndicated C&I term loans.
Note 7 — Investments in Qualified Affordable Housing Partnerships, Tax Credit and Other Investments, Net and Variable Interest Entities
The CRA encourages banks to meet the credit needs of their communities, particularly low- and moderate-income individuals and neighborhoods. The Company invests in certain affordable housing projects in the form of ownership interests in limited partnerships or limited liability companies that qualify for CRA consideration and tax credits. These entities are formed to develop and operate apartment complexes designed as high-quality affordable housing for lower income tenants throughout the U.S. To fully utilize the available tax credits, each of these entities must meet the regulatory affordable housing requirements for a minimum 15-year compliance period. In addition to affordable housing projects, the Company also invests in small business investment companies and new market tax credit projects that qualify for CRA consideration, as well as projects that qualify for renewable energy and historic tax credits. Investments in renewable energy tax credits help promote the development of renewable energy sources, and the investments in historic tax credits promote the rehabilitation of historic buildings and economic revitalization of the surrounding areas.
Investments in Qualified Affordable Housing Partnerships, Net
The Company records its investments in qualified affordable housing partnerships using the proportional amortization method if the investments meet certain criteria. Under the proportional amortization method, the Company amortizes the initial cost of the investment in proportion to the tax credits and other tax benefits received, and recognizes the amortization in Income tax expense on the Consolidated Statement of Income.
The following table presents the Company’s investments in qualified affordable housing partnerships, net, and related unfunded commitments as of September 30, 2021 and December 31, 2020:
| | | | | | | | | | | | | | |
|
| ($ in thousands) | | September 30, 2021 | | December 31, 2020 |
| Investments in qualified affordable housing partnerships, net | | $ | 297,367 | | | $ | 213,555 | |
| Accrued expenses and other liabilities — Unfunded commitments | | $ | 148,171 | | | $ | 77,444 | |
|
The following table presents additional information related to the Company’s investments in qualified affordable housing partnerships, net, for the three and nine months ended September 30, 2021 and 2020:
| | | | | | | | | | | | | | | | | | | | | | | | | | |
|
| ($ in thousands) | | Three Months Ended September 30, | | Nine Months Ended September 30, |
| 2021 | | 2020 | | 2021 | | 2020 |
| Tax credits and other tax benefits recognized | | $ | 7,503 | | | $ | 11,402 | | | $ | 28,583 | | | $ | 34,205 | |
Amortization expense included in income tax expense | | $ | 9,147 | | | $ | 8,975 | | | $ | 25,595 | | | $ | 26,507 | |
|
Investments in Tax Credit and Other Investments, Net
Depending on the ownership percentage and the influence the Company has on the investments in tax credit and other investments, the Company applies the equity or cost method of accounting, or the measurement alternative as elected under ASU 2016-01 for equity investments without readily determinable fair value.
The following table presents the Company’s investments in tax credit and other investments, net, and related unfunded commitments as of September 30, 2021 and December 31, 2020:
| | | | | | | | | | | | | | |
|
| ($ in thousands) | | September 30, 2021 | | December 31, 2020 |
| Investments in tax credit and other investments, net | | $ | 367,428 | | | $ | 266,525 | |
| Accrued expenses and other liabilities — Unfunded commitments | | $ | 194,796 | | | $ | 105,282 | |
|
The following table presents additional information related to the Company’s investments in tax credit and other investments, net, for the three and nine months ended September 30, 2021 and 2020:
| | | | | | | | | | | | | | | | | | | | | | | | | | |
|
| ($ in thousands) | | Three Months Ended September 30, | | Nine Months Ended September 30, |
| 2021 | | 2020 | | 2021 | | 2020 |
| Amortization of tax credit and other investments | | 38,008 | | | 17,209 | | | 90,657 | | | 57,819 | |
|
The Company held equity securities that are mutual funds with readily determinable fair values of $26.8 million and $31.3 million, as of September 30, 2021 and December 31, 2020, respectively. The Company invested in these mutual funds for CRA purposes. These equity securities were measured at fair value with changes in fair value recorded in net income. The Company recorded unrealized losses of $88 thousand and $515 thousand related to these equity securities for the three and nine months ended September 30, 2021, respectively, and unrealized gains of $55 thousand and $813 thousand, respectively, for the same periods in 2020. Equity securities with readily determinable fair value were included in Investments in tax credit and other investments, net on the Consolidated Balance Sheet.
The Company held equity securities without readily determinable fair values totaling $29.3 million and $23.7 million as of September 30, 2021 and December 31, 2020, respectively, which were measured using the measurement alternative at cost less impairment and adjusted for observable price changes. For the three and nine months ended September 30, 2021 and 2020, there were no adjustments made to these securities. Equity securities without readily determinable fair values were included in Investments in tax credit and other investments, net and Other assets on the Consolidated Balance Sheet.
Tax credit and other investments are evaluated for possible OTTI on an annual basis or when events or changes in circumstances suggest that the carrying amount of the tax credit investments may not be realizable. OTTI charges and impairment recoveries are recorded within Amortization of tax credit and other investments on the Consolidated Statement of Income. Refer to Note 2 — Fair Value Measurement and Fair Value of Financial Instruments to the Consolidated Financial Statements in this Form 10-Q for a discussion on the Company’s impairment evaluation and monitoring process of tax credit investments. For the three months ended September 30, 2021 and 2020, the Company recorded no adjustments related to these tax credit and other investments. For the nine months ended September 30, 2021, the Company recorded $1.3 million of impairment recoveries. In comparison, the Company recorded impairment recoveries of $259 thousand and OTTI charges of $733 thousand for the nine months ended September 30, 2020.
Variable Interest Entities
The Company invests in unconsolidated limited partnerships and similar entities that construct, own and operate affordable housing, historic rehabilitation, and wind and solar energy projects, of which the majority of such investments are variable interest entities (“VIEs”). As a limited partner in these partnerships, these investments are designed to generate a return primarily through the realization of federal tax credits and tax benefits. An unrelated third party is typically the general partner or managing member who has control over the significant activities of such investments. While the Company’s interest in some of the investments may exceed 50% of the outstanding equity interests, the Company does not consolidate these structures due to the general partner’s or managing member’s ability to manage the entity, which is indicative of the general partner’s or managing member’s power over the entity. The Company’s expected maximum exposure to loss in connection with these partnerships consists of the unamortized investment balance and any tax credits claimed that may become subject to recapture.
Special purpose entities formed in connection with securitization transactions are generally considered VIEs. A CLO is a VIE that manages a pool of assets consisting primarily of broadly syndicated corporate loans, where multiple tranches of notes are issued to investors. The Company served as the collateral manager of a CLO that closed in 2019 and subsequently sold its portfolio management contract in 2020 but retained the top three investment grade-rated tranches, which had a carrying amount of $291.6 million and $287.5 million as of September 30, 2021 and December 31, 2020, respectively.
Note 8 — Goodwill and Other Intangible Assets
Goodwill
Total goodwill was $465.7 million as of both September 30, 2021 and December 31, 2020. The Company’s annual goodwill impairment testing is performed as of December 31 of each year, or more frequently as events occur or circumstances change that would more-likely-than-not reduce the fair value of a reporting unit below its carrying value. Additional information pertaining to the Company’s accounting policy for goodwill is summarized in Note 1 — Summary of Significant Accounting Policies — Significant Accounting Policies — Goodwill and Other Intangible Assets to the Consolidated Financial Statements of the Company’s 2020 Form 10-K. The Company completed its annual goodwill impairment testing as of December 31, 2020, and determined there was no goodwill impairment. As of September 30, 2021, the Company reviewed the macroeconomic conditions, including the impacts of the COVID-19 pandemic on its business performance and market capitalization, and concluded that goodwill was not impaired.
Core Deposit Intangibles
The following table presents the gross carrying amount of core deposit intangible assets and accumulated amortization as of September 30, 2021 and December 31, 2020:
| | | | | | | | | | | | | | |
|
| ($ in thousands) | | September 30, 2021 | | December 31, 2020 |
Gross balance (1) | | $ | 86,099 | | | $ | 86,099 | |
Accumulated amortization (1) | | (81,869) | | | (79,722) | |
Net carrying balance (1) | | $ | 4,230 | | | $ | 6,377 | |
|
(1)Excludes fully amortized core deposit intangible assets.
There were no impairment write-downs on core deposit intangibles during the three and nine months ended September 30, 2021 and 2020.
Amortization Expense
The Company amortizes the core deposit intangibles based on the projected useful lives of the related deposits. The amortization expense related to the core deposit intangible assets was $706 thousand and $927 thousand for the three months ended September 30, 2021 and 2020, respectively, and $2.1 million and $2.8 million for the nine months ended September 30, 2021 and 2020, respectively.
The following table presents the estimated future amortization expense of core deposit intangibles as of September 30, 2021:
| | | | | | | | |
|
| ($ in thousands) | | Amount |
| Remainder of 2021 | | $ | 602 | |
| 2022 | | 1,865 | |
| 2023 | | 1,199 | |
| 2024 | | 553 | |
| 2025 | | 11 | |
| | |
| Total | | $ | 4,230 | |
|
Note 9 — Commitments and Contingencies
Commitments to Extend Credit — In the normal course of business, the Company provides customers with loan commitments on predetermined terms. These outstanding commitments to extend credit are not reflected in the accompanying Consolidated Financial Statements. While the Company does not anticipate losses as a result of these transactions, commitments to extend credit are included in determining the appropriate level of the allowance for unfunded credit commitments, and outstanding commercial and standby letters of credit (“SBLCs”).
The following table presents the Company’s credit-related commitments as of September 30, 2021 and December 31, 2020:
| | | | | | | | | | | | | | | | | | | | | | | | | | | | | | | | | | | | | | |
|
| | September 30, 2021 | | December 31, 2020 |
| ($ in thousands) | | Expire in One Year or Less | | Expire After One Year Through Three Years | | Expire After Three Years Through
Five Years | | Expire After Five Years | | Total | | Total |
| Loan commitments | | $ | 3,043,712 | | | $ | 127,951 | | | $ | 2,678,519 | | | $ | 654,213 | | | $ | 6,504,395 | | | $ | 5,690,847 | |
| Commercial letters of credit and SBLCs | | 983,663 | | | 475,826 | | | 142,714 | | | 590,644 | | | 2,192,847 | | | 2,240,813 | |
| Total | | $ | 4,027,375 | | | $ | 603,777 | | | $ | 2,821,233 | | | $ | 1,244,857 | | | $ | 8,697,242 | | | $ | 7,931,660 | |
|
| | | | |
| | | | | | | | | | | | |
| | | | | | | | | | | | |
| | | | | | | | | | | | |
Loan commitments are agreements to lend to customers provided there are no violations of any conditions established in the agreement. Commitments generally have fixed expiration dates or other termination clauses and may require maintenance of compensatory balances. Since many of the commitments are expected to expire without being drawn upon, the total commitment amounts do not necessarily represent future funding requirements.
Commercial letters of credit are issued to facilitate domestic and foreign trade transactions, while SBLCs are generally contingent upon the failure of the customers to perform according to the terms of the underlying contract with the third party. As a result, the total contractual amounts do not necessarily represent future funding requirements. The Company’s historical experience is that SBLCs typically expire without being funded. Additionally, in many cases, the Company holds collateral in various forms against these SBLCs. As part of its risk management activities, the Company monitors the creditworthiness of customers in conjunction with its SBLC exposure. Customers are obligated to reimburse the Company for any payment made on the customers’ behalf. If the customers fail to pay, the Company would, as applicable, liquidate the collateral and/or offset existing accounts. As of September 30, 2021, total letters of credit of $2.19 billion consisted of SBLCs of $2.15 billion and commercial letters of credit of $43.6 million. As of December 31, 2020, total letters of credit of $2.24 billion consisted of SBLCs of $2.12 billion and commercial letters of credit of $124.9 million. As of both September 30, 2021 and December 31, 2020, substantially all SBLCs were rated as “Pass” by the Bank’s internal credit risk rating system.
The Company applies the same credit underwriting criteria to extend loans, commitments and conditional obligations to customers. Each customer’s creditworthiness is evaluated on a case-by-case basis. Collateral and financial guarantees may be obtained based on management’s assessment of a customer’s credit risk. Collateral may include cash, accounts receivable, inventory, property, plant and equipment, and income-producing commercial property.
Estimated exposure to loss from these commitments is included in the allowance for unfunded credit commitments and amounted to $28.0 million and $33.5 million as of September 30, 2021 and December 31, 2020, respectively.
Guarantees — From time to time, the Company sells or securitizes single-family and multifamily residential loans with recourse in the ordinary course of business. The Company is obligated to repurchase up to the recourse percentage of the loans if the loans default. The following table presents the carrying amounts of loans sold or securitized with recourse and the maximum potential future payments as of September 30, 2021 and December 31, 2020:
| | | | | | | | | | | | | | | | | | | | | | | | | | | | | | | | | | | | | | | | | | | | | | | | | | | | | | | | | | |
| | | | | | |
| | | | Maximum Potential Future Payments | | Carrying Value | | | | | | |
| | | | September 30, 2021 | | December 31, 2020 | | September 30, 2021 | | December 31, 2020 | | | | | | |
| ($ in thousands) | | | | Expire in One Year or Less | | Expire After One Year Through Three Years | | Expire After Three Years Through
Five Years | | Expire After Five Years | | Total | | Total | | Total | | Total | | | | | | |
| Single-family residential loans sold or securitized with recourse | | | | $ | 48 | | | $ | 341 | | | $ | 95 | | | $ | 7,840 | | | $ | 8,324 | | | $ | 10,526 | | | $ | 8,324 | | | $ | 10,526 | | | | | | | |
| Multi-family residential loans sold or securitized with recourse | | | | — | | | 192 | | | — | | | 14,996 | | | 15,188 | | | 15,672 | | | 23,889 | | | 26,619 | | | | | | | |
| Total | | | | $ | 48 | | | $ | 533 | | | $ | 95 | | | $ | 22,836 | | | $ | 23,512 | | | $ | 26,198 | | | $ | 32,213 | | | $ | 37,145 | | | | | | | |
| | | | | | |
| | | | | | | | | | | | |
| | | | | | | | | | | | | | | | | | | | | | | | |
| | | | | | | | | | | | | | | | | | | | | | | | |
| | | | | | | | | | | | | | | | | | | | | | | | |
The Company’s recourse reserve related to these guarantees is included in the allowance for unfunded credit commitments and totaled $45 thousand and $88 thousand as of September 30, 2021 and December 31, 2020, respectively. The allowance for unfunded credit commitments is included in Accrued expenses and other liabilities on the Consolidated Balance Sheet. The Company continues to experience minimal losses from the single-family and multifamily residential loan portfolios sold or securitized with recourse.
Litigation — The Company is a party to various legal actions arising in the ordinary course of its business. In accordance with ASC 450, Contingencies, the Company accrues reserves for outstanding lawsuits, claims and proceedings when a loss contingency is probable and can be reasonably estimated. The Company estimates the amount of loss contingencies using current available information from legal proceedings, advice from legal counsel and available insurance coverage. Due to the inherent subjectivity of the assessments and unpredictability of the outcomes of the legal proceedings, any amounts accrued or included in this aggregate amount may not represent the ultimate loss to the Company from the legal proceedings in question. Thus, the Company’s exposure and ultimate losses may be higher, and possibly significantly more, than the amounts accrued.
Other Commitments — The Company has commitments to invest in qualified affordable housing partnerships, tax credit and other investments as discussed in Note 7 — Investments in Qualified Affordable Housing Partnerships, Tax Credit and Other Investments, Net and Variable Interest Entities to the Consolidated Financial Statements in this Form 10-Q. As of September 30, 2021 and December 31, 2020, these commitments were $343.0 million and $182.7 million, respectively. These commitments are included in Accrued expenses and other liabilities on the Consolidated Balance Sheet.
Note 10 — Stock Compensation Plans
Pursuant to the Company’s 2016 Stock Incentive Plan, as amended, the Company may issue stocks, stock options, restricted stock, restricted stock units (“RSUs”), stock purchase warrants, stock appreciation rights, phantom stock and dividend equivalents to eligible employees, non-employee directors, consultants, and other service providers of the Company and its subsidiaries. The Company has granted RSUs as its primary incentive awards. Stock options have not been issued since 2011 and no stock options were outstanding as of both September 30, 2021 and December 31, 2020.
The following table presents a summary of the total share-based compensation expense and the related net tax benefits (deficiencies) associated with the Company’s various employee share-based compensation plans for the three and nine months ended September 30, 2021 and 2020:
| | | | | | | | | | | | | | | | | | | | | | | | | | |
|
| ($ in thousands) | | Three Months Ended September 30, | | Nine Months Ended September 30, |
| 2021 | | 2020 | | 2021 | | 2020 |
| Stock compensation costs | | $ | 8,022 | | | $ | 7,921 | | | $ | 24,047 | | | $ | 22,201 | |
| Related net tax benefits (deficiencies) for stock compensation plans | | $ | 42 | | | $ | (14) | | | $ | 1,699 | | | $ | (1,589) | |
|
Restricted Stock Units — RSUs are granted under the Company’s long-term incentive plan at no cost to the recipient. RSUs generally cliff vest after three years of continued employment from the date of the grant, and are authorized to settle predominantly in shares of the Company’s common stock. Certain RSUs are settled in cash. Dividends are accrued during the vesting period and paid at the time of vesting. While a portion of RSUs are time-based vesting awards, others vest subject to the attainment of specified performance goals, referred to as “performance-based RSUs.” Performance-based RSUs are granted annually upon approval by the Company’s Compensation Committee based on the performance in the year prior to the grant date of the award. The number of awards that vest can range from zero to a maximum of 200% of the granted number of awards based on the Company’s achievement of specified performance criteria over a performance period of three years.
Compensation costs are calculated using the quoted market price of the Company’s common stock at the grant date. Compensation costs for certain time-based awards that will be settled in cash are adjusted to fair value based on changes in the share price of the Company’s common stock up to the settlement date. For performance-based RSUs, the compensation costs are based on grant date fair value which considers both performance and market conditions, and is subject to subsequent adjustments based on the Company’s outcome in meeting the performance criteria at the end of the performance period. Compensation costs of both time-based and performance-based awards are estimated based on awards ultimately expected to vest, and are recognized net of estimated forfeitures on a straight-line basis from the grant date until the vesting date of each grant. For accounting on stock-based compensation plans, see Note 1 — Summary of Significant Accounting Policies — Significant Accounting Policies — Stock-Based Compensation to the Consolidated Financial Statements of the Company’s 2020 Form 10-K for additional information.
The following table presents a summary of the activities for the Company’s time-based and performance-based RSUs that will be settled in shares for the nine months ended September 30, 2021. The number of performance-based RSUs stated below reflects the number of awards granted on the grant date.
| | | | | | | | | | | | | | | | | | | | | | | | | | | | | | | | | | |
|
| | | | |
| | | | | | | | | | |
| | | | | | Time-Based RSUs | | Performance-Based RSUs |
| | | | | | | | | Shares | | Weighted-Average
Grant Date
Fair Value | | Shares | | Weighted-Average
Grant Date
Fair Value |
| Outstanding, January 1, 2021 | | | | | | | | | | 1,345,524 | | | $ | 50.22 | | | 398,057 | | | $ | 53.66 | |
| Granted | | | | | | | | | | 396,002 | | | 71.47 | | | 91,960 | | | 77.67 | |
| Vested | | | | | | | | | | (295,156) | | | 67.13 | | | (120,286) | | | 70.13 | |
| Forfeited | | | | | | | | | | (106,245) | | | 55.65 | | | — | | | — | |
| Outstanding, September 30, 2021 | | | | | | | | | | 1,340,125 | | | $ | 52.35 | | | 369,731 | | | $ | 54.28 | |
|
The following table presents a summary of the activities for the Company’s time-based RSUs that will be vested in cash for the nine months ended September 30, 2021:
| | | | | | | | | | |
|
| | | | |
| | | | Shares |
| Outstanding, January 1, 2021 | | | | 21,802 | |
| Granted | | | | 15,803 | |
| Vested | | | | — | |
| Forfeited | | | | (9,106) | |
| Outstanding, September 30, 2021 | | | | 28,499 | |
|
As of September 30, 2021, there were $28.3 million and $16.6 million of total unrecognized compensation costs related to unvested time-based and performance-based RSUs, respectively. Both of these costs are expected to be recognized over a weighted-average period of 1.92 years.
Note 11 — Stockholders’ Equity and Earnings Per Share
The following table presents the basic and diluted EPS calculations for the three and nine months ended September 30, 2021 and 2020. For more information on the calculation of EPS, see Note 1 — Summary of Significant Accounting Policies — Significant Accounting Policies — Earnings Per Share to the Consolidated Financial Statements of the Company’s 2020 Form 10-K.
| | | | | | | | | | | | | | | | | | | | | | | | | | | | | |
|
| ($ and shares in thousands, except per share data) | | Three Months Ended September 30, | | Nine Months Ended September 30, | | | |
| 2021 | | 2020 | | 2021 | | 2020 | | | |
| Basic: | | | | | | | | | | | |
| Net income | | $ | 225,449 | | | $ | 159,537 | | | $ | 655,185 | | | $ | 403,713 | | | | |
| Basic weighted-average number of shares outstanding | | 141,880 | | | 141,498 | | | 141,799 | | | 142,595 | | | | |
| Basic EPS | | $ | 1.59 | | | $ | 1.13 | | | $ | 4.62 | | | $ | 2.83 | | | | |
| Diluted: | | | | | | | | | | | |
| Net income | | $ | 225,449 | | | $ | 159,537 | | | $ | 655,185 | | | $ | 403,713 | | | | |
| Basic weighted-average number of shares outstanding | | 141,880 | | | 141,498 | | | 141,799 | | | 142,595 | | | | |
Diluted potential common shares (1) | | 1,263 | | | 545 | | | 1,252 | | | 487 | | | | |
Diluted weighted-average number of shares outstanding (1) | | 143,143 | | | 142,043 | | | 143,051 | | | 143,082 | | | | |
| Diluted EPS | | $ | 1.57 | | | $ | 1.12 | | | $ | 4.58 | | | $ | 2.82 | | | | |
|
(1)Includes dilutive shares from RSUs for the three and nine months ended September 30, 2021 and 2020.
For the three and nine months ended September 30, 2021, two thousand and six thousand weighted-average shares of anti-dilutive RSUs, respectively, were excluded from the diluted EPS computation. In comparison, 124 thousand and 123 thousand weighted-average shares of anti-dilutive RSUs, respectively, were excluded from the diluted EPS computation for the three and nine months ended September 30, 2020.
Stock Repurchase Program — In 2020, the Company’s Board of Directors authorized a stock repurchase program to buy back up to $500.0 million of the Company’s common stock, and the Company repurchased 4,471,682 shares at an average price of $32.64 per share, for a total cost of $146.0 million. In comparison, the Company did not repurchase any shares during the three and nine months ended September 30, 2021.
Note 12 — Accumulated Other Comprehensive Income (Loss)
The following table presents the changes in the components of AOCI balances for the three and nine months ended September 30, 2021 and 2020:
| | | | | | | | | | | | | | | | | | | | | | | | | | |
|
| ($ in thousands) | | AFS
Debt
Securities | | Cash
Flow
Hedges | | Foreign Currency Translation Adjustments (1) | | Total |
| Balance, July 1, 2020 | | $ | 42,850 | | | $ | (1,333) | | | $ | (18,383) | | | $ | 23,134 | |
| Net unrealized gains arising during the period | | 5,126 | | | 25 | | | 5,459 | | | 10,610 | |
| Amounts reclassified from AOCI | | (492) | | | 62 | | | — | | | (430) | |
| Changes, net of tax | | 4,634 | | | 87 | | | 5,459 | | | 10,180 | |
Balance, September 30, 2020 | | $ | 47,484 | | | $ | (1,246) | | | $ | (12,924) | | | $ | 33,314 | |
| | | | | | | | |
| Balance, July 1, 2021 | | $ | (8,152) | | | $ | (730) | | | $ | (5,807) | | | $ | (14,689) | |
| Net unrealized losses arising during the period | | (40,928) | | | (121) | | | (1,752) | | | (42,801) | |
| Amounts reclassified from AOCI | | (250) | | | 172 | | | — | | | (78) | |
| Changes, net of tax | | (41,178) | | | 51 | | | (1,752) | | | (42,879) | |
Balance, September 30, 2021 | | $ | (49,330) | | | $ | (679) | | | $ | (7,559) | | | $ | (57,568) | |
|
| | | | | | | | | | | | | | | | | | | | | | | | | | |
|
| ($ in thousands) | | AFS
Debt
Securities | | Cash
Flow
Hedges | | Foreign Currency Translation Adjustments (1) | | Total |
| Balance, January 1, 2020 | | $ | (2,419) | | | $ | — | | | $ | (15,989) | | | $ | (18,408) | |
| Net unrealized gains (losses) arising during the period | | 58,262 | | | (1,038) | | | 3,065 | | | 60,289 | |
| Amounts reclassified from AOCI | | (8,359) | | | (208) | | | — | | | (8,567) | |
| Changes, net of tax | | 49,903 | | | (1,246) | | | 3,065 | | | 51,722 | |
Balance, September 30, 2020 | | $ | 47,484 | | | $ | (1,246) | | | $ | (12,924) | | | $ | 33,314 | |
| | | | | | | | |
| Balance, January 1, 2021 | | $ | 52,247 | | | $ | (1,230) | | | $ | (6,692) | | | $ | 44,325 | |
| Net unrealized (losses) gains arising during the period | | (100,747) | | | 108 | | | (867) | | | (101,506) | |
| Amounts reclassified from AOCI | | (830) | | | 443 | | | — | | | (387) | |
| Changes, net of tax | | (101,577) | | | 551 | | | (867) | | | (101,893) | |
Balance, September 30, 2021 | | $ | (49,330) | | | $ | (679) | | | $ | (7,559) | | | $ | (57,568) | |
|
(1)Represents foreign currency translation adjustments related to the Company’s net investment in non-U.S. operations, including related hedges. The functional currency and reporting currency of the Company’s foreign subsidiary was RMB and USD, respectively.
The following table presents the components of other comprehensive income (loss), reclassifications to net income and the related tax effects for the three and nine months ended September 30, 2021 and 2020:
| | | | | | | | | | | | | | | | | | | | | | | | | | | | | | | | | | | | | | |
|
| ($ in thousands) | | Three Months Ended September 30, |
| 2021 | | 2020 |
| Before-Tax | | Tax Effect | | Net-of-Tax | | Before-Tax | | Tax Effect | | Net-of-Tax |
| AFS debt securities: | | | | | | | | | | | | |
| Net unrealized (losses) gains arising during the period | | $ | (58,138) | | | $ | 17,210 | | | $ | (40,928) | | | $ | 7,304 | | | $ | (2,178) | | | $ | 5,126 | |
Net realized (gains) reclassified into net income (1) | | (354) | | | 104 | | | (250) | | | (698) | | | 206 | | | (492) | |
| Net change | | (58,492) | | | 17,314 | | | (41,178) | | | 6,606 | | | (1,972) | | | 4,634 | |
| Cash flow hedges: | | | | | | | | | | | | |
| Net unrealized (losses) gains arising during the period | | (170) | | | 49 | | | (121) | | | 34 | | | (9) | | | 25 | |
Net realized losses reclassified into net income (2) | | 241 | | | (69) | | | 172 | | | 87 | | | (25) | | | 62 | |
| Net change | | 71 | | | (20) | | | 51 | | | 121 | | | (34) | | | 87 | |
| Foreign currency translation adjustments, net of hedges: | | | | | | | | | | | | |
| Net unrealized (losses) gains arising during the period | | (1,878) | | | 126 | | | (1,752) | | | 4,419 | | | 1,040 | | | 5,459 | |
| Net change | | (1,878) | | | 126 | | | (1,752) | | | 4,419 | | | 1,040 | | | 5,459 | |
| Other comprehensive (loss) income | | $ | (60,299) | | | $ | 17,420 | | | $ | (42,879) | | | $ | 11,146 | | | $ | (966) | | | $ | 10,180 | |
|
| | | | | | | | | | | | | | | | | | | | | | | | | | | | | | | | | | | | | | |
|
| ($ in thousands) | | Nine Months Ended September 30, |
| 2021 | | 2020 |
| Before-Tax | | Tax Effect | | Net-of-Tax | | Before-Tax | | Tax Effect | | Net-of-Tax |
| AFS debt securities: | | | | | | | | | | | | |
| Net unrealized (losses) gains arising during the period | | $ | (143,131) | | | $ | 42,384 | | | $ | (100,747) | | | $ | 82,767 | | | $ | (24,505) | | | $ | 58,262 | |
Net realized (gains) reclassified into net income (1) | | (1,178) | | | 348 | | | (830) | | | (11,867) | | | 3,508 | | | (8,359) | |
| Net change | | (144,309) | | | 42,732 | | | (101,577) | | | 70,900 | | | (20,997) | | | 49,903 | |
| Cash flow hedges: | | | | | | | | | | | | |
| Net unrealized gains (losses) arising during the period | | 150 | | | (42) | | | $ | 108 | | | (1,449) | | | 411 | | | (1,038) | |
Net realized losses (gains) reclassified into net income (2) | | 619 | | | (176) | | | 443 | | | (290) | | | 82 | | | (208) | |
| Net change | | 769 | | | (218) | | | 551 | | | (1,739) | | | 493 | | | (1,246) | |
| Foreign currency translation adjustments, net of hedges: | | | | | | | | | | | | |
| Net unrealized (losses) gains arising during the period | | (1,603) | | | 736 | | | (867) | | | 2,274 | | | 791 | | | 3,065 | |
| Net change | | (1,603) | | | 736 | | | (867) | | | 2,274 | | | 791 | | | 3,065 | |
| Other comprehensive (loss) income | | $ | (145,143) | | | $ | 43,250 | | | $ | (101,893) | | | $ | 71,435 | | | $ | (19,713) | | | $ | 51,722 | |
|
(1)For the three and nine months ended September 30, 2021 and 2020, pre-tax amounts were reported in Gains on sales of AFS debt securities on the Consolidated Statement of Income.
(2)For the three and nine months ended September 30, 2021 and 2020, pre-tax amounts were reported in Interest expense on the Consolidated Statement of Income.
Note 13 — Business Segments
The Company organizes its operations into three reportable operating segments: (1) Consumer and Business Banking; (2) Commercial Banking; and (3) Other. These segments are defined by the type of customers served, and the related products and services provided. The segments reflect how financial information is currently evaluated by management. Operating segment results are based on the Company’s internal management reporting process, which reflects assignments and allocations of certain balance sheet and income statement items. The information presented is not indicative of how the segments would perform if they operated as independent entities due to the interrelationships among the segments.
The Consumer and Business Banking segment primarily provides financial products and services to consumer and commercial customers through the Company’s domestic branch network and digital banking platform. This segment offers consumer and commercial deposits, mortgage and home equity loans, and other products and services. It also originates commercial loans for small- and medium-sized enterprises through the Company’s branch network. Other products and services provided by this segment include wealth management, treasury management and foreign exchange services.
The Commercial Banking segment primarily generates commercial loans and deposits. Commercial loan products include commercial business loans and lines of credit, trade finance loans and letters of credit, CRE loans, construction and land loans, affordable housing loans and letters of credit, asset-based lending and equipment financing. Commercial deposit products and other financial services include treasury management, foreign exchange services and interest rate and commodity risk hedging.
The remaining centralized functions, including the corporate treasury activities of the Company and eliminations of inter-segment amounts, have been aggregated and included in the Other segment, which provides broad administrative support to the two core segments, namely the Consumer and Business Banking and the Commercial Banking segments.
The Company utilizes an internal reporting process to measure the performance of the three operating segments within the Company. The internal reporting process derives operating segment results by utilizing allocation methodologies for revenues and expenses. Net interest income of each segment represents the difference between actual interest earned on assets and interest incurred on liabilities of the segment, adjusted for funding charges or credits through the Company’s internal funds transfer pricing (“FTP”) process. Noninterest income and noninterest expense directly attributable to a business segment are assigned to that segment. Indirect costs, including technology-related costs and corporate overhead, are allocated based on a segment’s estimated usage using factors including but not limited to, full-time equivalent employees, net interest income, and loan and deposit volume. Charge-offs are recorded to the segment directly associated with the respective loans charged off, and provision for credit losses is recorded to the segments based on the related loans for which allowances are evaluated. The Company’s internal reporting process utilizes a full-allocation methodology. Under this methodology, corporate and indirect expenses incurred by the Other segment are allocated to the Consumer and Business Banking and the Commercial Banking segments, except certain corporate treasury-related expenses and insignificant unallocated expenses.
The corporate treasury function within the Other segment is responsible for the Company’s liquidity and interest rate management. The Company’s internal FTP process is also managed by the corporate treasury function within the Other segment. The process is formulated with the goal of encouraging loan and deposit growth that is consistent with the Company’s overall profitability objectives, as well as to provide a reasonable and consistent basis for the measurement of its business segments’ net interest margins and profitability. The FTP process charges a cost to fund loans (“FTP charges for loans”) and allocates credits for funds provided from deposits (“FTP credits for deposits”) using internal FTP rates. FTP charges for loans are determined based on a matched cost of funds, which is tied to the pricing and term characteristics of the loans. FTP credits for deposits are based on matched funding credit rates, which are tied to the implied or stated maturity of the deposits. FTP credits for deposits reflect the long-term value generated by the deposits. The net spread between the total internal FTP charges and credits is recorded as part of net interest income in the Other segment. The FTP process transfers the corporate interest rate risk exposure to the treasury function within the Other segment, where such exposures are centrally managed. The Company’s internal FTP assumptions and methodologies are reviewed at least annually to ensure that the process is reflective of current market conditions.
The following tables present the operating results and other key financial measures for the individual operating segments as of and for the three and nine months ended September 30, 2021 and 2020:
| | | | | | | | | | | | | | | | | | | | | | | | | | |
|
| ($ in thousands) | | Consumer and
Business
Banking | | Commercial
Banking | | Other | | Total |
| Three Months Ended September 30, 2021 | | | | | | | | |
| | | | | | | | |
| | | | | | | | |
| | | | | | | | |
| | | | | | | | |
| | | | | | | | |
| | | | | | | | |
| Net interest income before provision for (reversal of) credit losses | | $ | 176,678 | | | $ | 189,791 | | | $ | 29,237 | | | $ | 395,706 | |
| Provision for (reversal of) credit losses | | 1,293 | | | (11,293) | | | — | | | (10,000) | |
| Noninterest income | | 22,446 | | | 42,925 | | | 7,738 | | | 73,109 | |
| Noninterest expense | | 90,575 | | | 66,688 | | | 48,121 | | | 205,384 | |
| Segment income (loss) before income taxes | | 107,256 | | | 177,321 | | | (11,146) | | | 273,431 | |
| | | | | | | | |
| Segment net income | | $ | 76,825 | | | $ | 126,767 | | | $ | 21,857 | | | $ | 225,449 | |
| As of September 30, 2021 | | | | | | | | |
| | | | | | | | |
| Segment assets | | $ | 14,687,023 | | | $ | 27,861,690 | | | $ | 18,410,397 | | | $ | 60,959,110 | |
|
| | | | | | | | | | | | | | | | | | | | | | | | | | |
|
| ($ in thousands) | | Consumer and
Business
Banking | | Commercial
Banking | | Other | | Total |
| Three Months Ended September 30, 2020 | | | | | | | | |
| | | | | | | | |
| | | | | | | | |
| | | | | | | | |
| | | | | | | | |
| | | | | | | | |
| | | | | | | | |
| Net interest income before provision for (reversal of) credit losses | | $ | 120,969 | | | $ | 162,884 | | | $ | 40,277 | | | $ | 324,130 | |
| (Reversal of) provision for credit losses | | (3,470) | | | 13,470 | | | — | | | 10,000 | |
| Noninterest income | | 17,426 | | | 28,984 | | | 8,093 | | | 54,503 | |
| Noninterest expense | | 81,419 | | | 61,863 | | | 29,291 | | | 172,573 | |
| Segment income before income taxes | | 60,446 | | | 116,535 | | | 19,079 | | | 196,060 | |
| | | | | | | | |
| Segment net income | | $ | 43,310 | | | $ | 83,340 | | | $ | 32,887 | | | $ | 159,537 | |
| As of September 30, 2020 | | | | | | | | |
| | | | | | | | |
| Segment assets | | $ | 12,838,625 | | | $ | 26,526,173 | | | $ | 11,006,679 | | | $ | 50,371,477 | |
|
| | | | | | | | | | | | | | | | | | | | | | | | | | |
|
| ($ in thousands) | | Consumer and
Business
Banking | | Commercial
Banking | | Other | | Total |
| Nine Months Ended September 30, 2021 | | | | | | | | |
| | | | | | | | |
| | | | | | | | |
| | | | | | | | |
| | | | | | | | |
| | | | | | | | |
| | | | | | | | |
| Net interest income before reversal of credit losses | | $ | 500,352 | | | $ | 559,579 | | | $ | 65,943 | | | $ | 1,125,874 | |
| (Reversal of) credit losses | | (598) | | | (24,402) | | | — | | | (25,000) | |
| Noninterest income | | 67,728 | | | 125,487 | | | 21,191 | | | 214,406 | |
| Noninterest expense | | 267,511 | | | 200,109 | | | 118,364 | | | 585,984 | |
| Segment income (loss) before income taxes | | 301,167 | | | 509,359 | | | (31,230) | | | 779,296 | |
| | | | | | | | |
| Segment net income | | $ | 215,720 | | | $ | 364,632 | | | $ | 74,833 | | | $ | 655,185 | |
| As of September 30, 2021 | | | | | | | | |
| | | | | | | | |
| Segment assets | | $ | 14,687,023 | | | $ | 27,861,690 | | | $ | 18,410,397 | | | $ | 60,959,110 | |
|
| | | | | | | | | | | | | | | | | | | | | | | | | | |
|
| ($ in thousands) | | Consumer and
Business
Banking | | Commercial
Banking | | Other | | Total |
| Nine Months Ended September 30, 2020 | | | | | | | | |
| | | | | | | | |
| | | | | | | | |
| | | | | | | | |
| | | | | | | | |
| | | | | | | | |
| | | | | | | | |
Net interest income before provision for credit losses | | $ | 398,486 | | | $ | 530,181 | | | $ | 101,945 | | | $ | 1,030,612 | |
| Provision for credit losses | | 9,908 | | | 176,405 | | | — | | | 186,313 | |
| Noninterest income | | 47,771 | | | 95,327 | | | 22,617 | | | 165,715 | |
| Noninterest expense | | 248,547 | | | 196,889 | | | 92,235 | | | 537,671 | |
| Segment income before income taxes | | 187,802 | | | 252,214 | | | 32,327 | | | 472,343 | |
| | | | | | | | |
| Segment net income | | $ | 134,563 | | | $ | 180,649 | | | $ | 88,501 | | | $ | 403,713 | |
| As of September 30, 2020 | | | | | | | | |
| | | | | | | | |
| Segment assets | | $ | 12,838,625 | | | $ | 26,526,173 | | | $ | 11,006,679 | | | $ | 50,371,477 | |
|
Note 14 — Subsequent Events
On October 21, 2021, the Company’s Board of Directors declared fourth quarter 2021 cash dividends for the Company’s common stock. The common stock cash dividend of $0.33 per share is payable on November 15, 2021 to stockholders of record as of November 1, 2021.
ITEM 2. MANAGEMENT’S DISCUSSION AND ANALYSIS OF FINANCIAL CONDITION AND RESULTS OF OPERATIONS
Overview
The following discussion provides information about the results of operations, financial condition, liquidity and capital resources of East West Bancorp, Inc. (referred to herein on an unconsolidated basis as “East West” and on a consolidated basis as the “Company,” “we” or “EWBC”), and its subsidiaries, including its subsidiary bank, East West Bank and its subsidiaries (referred to herein as “East West Bank” or the “Bank”). This information is intended to facilitate the understanding and assessment of significant changes and trends related to the Company’s results of operations and financial condition. This discussion and analysis should be read in conjunction with the Consolidated Financial Statements and the accompanying notes presented elsewhere in this report, and the Company’s Annual Report on Form 10-K for the year ended December 31, 2020, filed with the United States (“U.S.”) Securities and Exchange Commission (“SEC”) on February 26, 2021 (the “Company’s 2020 Form 10-K”).
Company Overview
East West is a bank holding company incorporated in Delaware on August 26, 1998 and is registered under the Bank Holding Company Act. The Company commenced business on December 30, 1998 when, pursuant to a reorganization, it acquired all of the voting stock of the Bank, which became its principal asset. The Bank is an independent commercial bank headquartered in California that has a focus on the financial service needs of the Asian-American community. Through over 120 locations in the U.S. and China, the Company provides a full range of consumer and commercial products and services through the following business segments: Consumer and Business Banking and Commercial Banking, with the remaining operations recorded in Other. The Company’s principal activity is lending to and accepting deposits from businesses and individuals. The primary source of revenue is net interest income, which is principally derived from the difference between interest earned on loans and debt securities and interest paid on deposits and other funding sources. As of September 30, 2021, the Company had $60.96 billion in assets and approximately 3,100 full-time equivalent employees. For additional information on products and services provided by the Bank, see Item 1. Business — Banking Services of the Company’s 2020 Form 10-K.
Corporate Strategy
We are committed to enhancing long-term shareholder value by growing loans, deposits and revenue, improving profitability, and investing for the future, while managing risks, expenses and capital. Our business model is built on customer loyalty and engagement, understanding our customers’ financial goals, and meeting our customers’ financial needs through our diverse products and services. The Company’s approach focuses on seeking out and deepening client relationships that meet our risk/return parameters. This guides our decision-making across every aspect of our operations: the products we develop, the expertise we cultivate, and the infrastructure we build to help our customers conduct their businesses. We expect our relationship-focused business model to continue to generate organic growth from existing customers and to expand our targeted customer bases. We continually invest in technology to improve the customer user experience, strengthen critical business infrastructure, and streamline core processes, while appropriately managing operating expenses. Our risk management activities are focused on ensuring that the Company identifies and manages risks to maintain safety and soundness while maximizing profitability.
Coronavirus Disease 2019 Global Pandemic
The Coronavirus Disease 2019 (“COVID-19”) pandemic has created a historic public health crisis and caused unprecedented disruptions to global economies. Since the beginning of the COVID-19 pandemic, the U.S. government has taken various steps to combat the disease and enacted a number of monetary and fiscal policies to provide fiscal stimulus and relief. Although the COVID-19 pandemic continues to present public health challenges, including the emergence of new variants, great progress has been made and continues to be made in virus containment and vaccination efforts. While these responses have largely mitigated the impact from the COVID-19 pandemic and propelled the U.S. economy to recovery, the resurgence of the pandemic, the adoption and long-term effectiveness of the vaccines, and other factors including the continuing impact on global supply chains may slow down such progress. As a result, we are unable to quantify all the specific impacts, and the extent to which the COVID-19 pandemic may negatively affect our business, financial condition and results of operations, regulatory capital, and liquidity ratios for the remainder of 2021. The Company has been, and may continue to be, impacted by the pandemic.
Throughout the COVID-19 pandemic, the Company has been focusing on serving our customers and communities and maintaining the well-being of our employees.
On March 11, 2021, President Biden signed the American Rescue Plan Act of 2021 (“ARPA”) to provide additional relief for individuals and businesses affected by the COVID-19 pandemic, including additional funding for the Paycheck Protection Program (“PPP”). The PPP Extension Act of 2021, enacted on March 30, 2021, extended the PPP through May 31, 2021. The Company has been a participating lender in the PPP since 2020. As of September 30, 2021, the Company had approximately 3,600 PPP loans outstanding with balances totaling $807.3 million, which were recorded in the commercial and industrial (“C&I”) loan portfolio. During the first nine months of 2021, the Company submitted and received Small Business Administration (“SBA”) approval for the forgiveness of approximately 7,800 PPP loans, totaling $1.64 billion.
The Company also participated in the Board of Governors of the Federal Reserve System’s (the “Federal Reserve”) Main Street Lending Program (“MSLP”) and funded $233.6 million in MSLP loans as of December 31, 2020. As part of the MSLP, the related Main Street special purpose vehicle purchased 95% participations in the loans originated. The portion retained by the Company totaled $9.9 million and $9.5 million as of September 30, 2021 and December 31, 2020, respectively. The MSLP was terminated on January 8, 2021.
In response to the COVID-19 pandemic, the Company has implemented protocols and processes to execute its business continuity plans to protect its employees and support its customers. As state and local governments have relaxed restrictions on temporary business closures, we have started phasing in the return of our U.S.-based corporate associates to the office. The Company continues to monitor the external environment and make changes to its safety protocols as appropriate. For additional information on the PPP and other U.S. government facilities, programs and loan modification relief as established by the Coronavirus Aid, Relief, and Economic Security Act (“CARES Act”), and our response to the COVID-19 pandemic, refer to Overview — Coronavirus Disease 2019 Global Pandemic section in the Company’s 2020 Form 10-K.
Further discussion of the potential impacts on our business due to the COVID-19 pandemic is provided in Item 1A — Risk Factors of the Company’s 2020 Form 10-K.
Selected Financial Data
| | | | | | | | | | | | | | | | | | | | | | | | | | | | | | | | | | | |
| | | | | | | |
($ and shares in thousands, except per share, ratio and headcount data) | | Three Months Ended | | Nine Months Ended | | | |
| September 30,
2021 | | June 30,
2021 | | September 30,
2020 | | September 30,
2021 | | September 30,
2020 | | | |
| Summary of operations: | | | | | | | | | | | | | |
Net interest income before provision for credit losses (1) | | $ | 395,706 | | | $ | 376,473 | | | $ | 324,130 | | | $ | 1,125,874 | | | $ | 1,030,612 | | | | |
| Noninterest income | | 73,109 | | | 68,431 | | | 54,503 | | | 214,406 | | | 165,715 | | | | |
| Total revenue | | 468,815 | | | 444,904 | | | 378,633 | | | 1,340,280 | | | 1,196,327 | | | | |
| (Reversal of) provision for credit losses | | (10,000) | | | (15,000) | | | 10,000 | | | (25,000) | | | 186,313 | | | | |
| | | | | | | | | | | | | |
| | | | | | | | | | | | | |
| Noninterest expense | | 205,384 | | | 189,523 | | | 172,573 | | | 585,984 | | | 537,671 | | | | |
| Income before income taxes | | 273,431 | | | 270,381 | | | 196,060 | | | 779,296 | | | 472,343 | | | | |
| Income tax expense | | 47,982 | | | 45,639 | | | 36,523 | | | 124,111 | | | 68,630 | | | | |
| | | | | | | | | | | | | |
Net income (1) | | $ | 225,449 | | | $ | 224,742 | | | $ | 159,537 | | | $ | 655,185 | | | $ | 403,713 | | | | |
| | | | | | | | | | | | | |
| Per common share: | | | | | | | | | | | | | |
| Basic earnings | | $ | 1.59 | | | $ | 1.58 | | | $ | 1.13 | | | $ | 4.62 | | | $ | 2.83 | | | | |
| Diluted earnings | | $ | 1.57 | | | $ | 1.57 | | | $ | 1.12 | | | $ | 4.58 | | | $ | 2.82 | | | | |
| Dividends declared | | $ | 0.330 | | | $ | 0.330 | | | $ | 0.275 | | | $ | 0.990 | | | $ | 0.825 | | | | |
| Book value | | $ | 40.10 | | | $ | 39.10 | | | $ | 36.22 | | | $ | 40.10 | | | $ | 36.22 | | | | |
| | | | | | | | | | | | | |
Non-Generally Accepted Accounting Principles (“GAAP”) tangible common equity (2) | | $ | 36.75 | | | $ | 35.75 | | | $ | 32.85 | | | $ | 36.75 | | | $ | 32.85 | | | | |
| Weighted-average number of shares outstanding: | | | | | | | | | | | | | |
| Basic | | 141,880 | | | 141,868 | | | 141,498 | | | 141,799 | | | 142,595 | | | | |
| Diluted | | 143,143 | | | 143,040 | | | 142,043 | | | 143,051 | | | 143,082 | | | | |
| Common shares outstanding at period-end | | 141,884 | | | 141,878 | | | 141,507 | | | 141,884 | | | 141,507 | | | | |
| | | | | | | | | | | | | |
| Performance metrics: | | | | | | | | | | | | | |
| Return on average assets (“ROA”) | | 1.46 | % | | 1.56 | % | | 1.26 | % | | 1.50 | % | | 1.13 | % | | | |
| Return on average equity (“ROE”) | | 15.75 | % | | 16.61 | % | | 12.50 | % | | 15.98 | % | | 10.73 | % | | | |
Return on average non-GAAP tangible equity (2) | | 17.25 | % | | 18.28 | % | | 13.88 | % | | 17.56 | % | | 11.95 | % | | | |
| Total average equity to total average assets | | 9.26 | % | | 9.39 | % | | 10.11 | % | | 9.41 | % | | 10.53 | % | | | |
| Common dividend payout ratio | | 21.05 | % | | 21.11 | % | | 24.74 | % | | 21.72 | % | | 29.58 | % | | | |
| Net interest margin | | 2.70 | % | | 2.75 | % | | 2.72 | % | | 2.72 | % | | 3.05 | % | | | |
Efficiency ratio (3) | | 43.81 | % | | 42.60 | % | | 45.58 | % | | 43.72 | % | | 44.94 | % | | | |
Non-GAAP efficiency ratio (2) | | 35.55 | % | | 36.30 | % | | 40.79 | % | | 36.80 | % | | 39.14 | % | | | |
| At period end: | | | | | | | | | | | | | |
| Total assets | | $ | 60,959,110 | | | $ | 59,854,876 | | | $ | 50,371,477 | | | | | | | | |
| Interest-earning assets | | $ | 57,981,485 | | | $ | 57,050,261 | | | $ | 47,972,639 | | | | | | | | |
Total loans (4) | | $ | 40,481,705 | | | $ | 40,073,318 | | | $ | 37,441,277 | | | | | | | | |
| Available-for-sale (“AFS”) debt securities | | $ | 9,713,006 | | | $ | 8,399,460 | | | $ | 4,539,160 | | | | | | | | |
| Total deposits | | $ | 53,356,190 | | | $ | 52,582,575 | | | $ | 41,680,555 | | | | | | | | |
Long-term debt | | $ | 147,586 | | | $ | 147,515 | | | $ 1,574.765 (5) | | | | | | | |
| Federal Home Loan Bank (“FHLB”) advances | | $ | 248,898 | | | $ | 248,464 | | | $ | 657,185 | | | | | | | | |
| Stockholders’ equity | | $ | 5,690,201 | | | $ | 5,547,548 | | | $ | 5,126,106 | | | | | | | | |
| | | | | | | | | | | | | |
Non-GAAP tangible common equity (2) | | $ | 5,214,655 | | | $ | 5,071,542 | | | $ | 4,648,040 | | | | | | | | |
| Head count (full-time equivalent) | | 3,085 | | | 3,161 | | | 3,208 | | | | | | | | |
| | | | | | | | | | | | | |
| | | | | | | | | | | | | |
| | | | | | | | | | | | | |
| | | | | | | | | | | | | |
| | | | | | | | | | | | | |
| | | | | | | | | | | | | |
| | | | | | | | | | | | | |
| | | | | | | | | | | | | |
| | | | | | | | | | | | | |
| | | | | | | | | | | | | |
| | | | | | | | | | | | | |
| | | | | | | | | | | | | |
| | | | | | | | | | | | | |
| | | | | | | | | | | | | |
| | | | | | | | | | | | | |
| | | | | | | | | | | | | |
| | | | | | | | | | | | | |
| EWBC capital ratios: | | | | | | | | | | | | | |
| | | | | | | | | | | | | |
| | | | | | | | | | | | | |
| Common Equity Tier 1 (“CET1”) capital | | 12.8 | % | | 12.8 | % | | 12.8 | % | | | | | | | |
| Tier 1 capital | | 12.8 | % | | 12.8 | % | | 12.8 | % | | | | | | | |
| Total capital | | 14.2 | % | | 14.3 | % | | 14.5 | % | | | | | | | |
| Tier 1 leverage capital | | 8.8 | % | | 9.1 | % | | 9.8 | % | | | | | | | |
Total stockholders’ equity to total assets | | 9.3 | % | | 9.3 | % | | 10.2 | % | | | | | | | |
| | | | | | | | | | | | | |
Non-GAAP tangible common equity to tangible assets (2) | | 8.6 | % | | 8.5 | % | | 9.3 | % | | | | | | | |
| | | | | | | |
(1)Includes $15.2 million, $15.4 million and $7.8 million of interest income related to PPP loans for the second and third quarter of 2021, and third quarter of 2020, respectively, and $45.6 million and $29.1 million for the first nine months of 2021 and 2020, respectively.
(2)For a discussion of non-GAAP tangible common equity per share, return on average non-GAAP tangible equity, non-GAAP efficiency ratio, non-GAAP tangible common equity and non-GAAP tangible common equity to tangible assets, refer to Item 2. Management’s Discussion and Analysis of Financial Condition and Results of Operations (“MD&A”) — Reconciliation of GAAP to Non-GAAP Financial Measures in this Quarterly Report on Form 10-Q (“this Form 10-Q”).
(3)The efficiency ratio is noninterest expense divided by total revenue.
(4)Includes $807.3 million, $1.43 billion and $1.77 billion of PPP loans as of September 30, 2021, June 30, 2021 and September 30, 2020, respectively.
(5)Includes $1.43 billion of advances from the Federal Reserve Paycheck Protection Program Liquidity Facility (“PPPLF”) as of September 30, 2020.
Financial Review
The Company’s net income for the third quarter 2021 was $225.4 million or $1.57 per diluted share, compared with third quarter 2020 net income of $159.5 million or $1.12 per diluted share, an increase of $65.9 million or 41%. Net income for the first nine months of 2021 was $655.2 million or $4.58 per diluted share, compared with the first nine months of 2020 net income of $403.7 million or $2.82 per diluted share, an increase of $251.5 million or 62%. The increases in both periods were due to higher net interest income and noninterest income, reversals of provision for credit losses in the second and third quarter of 2021, partially offset by higher noninterest expense and income tax expense.
Noteworthy items about the Company’s performance for the third quarter and first nine months of 2021 included:
• As of September 30, 2021, total assets were $60.96 billion, an increase of $8.80 billion or 17% from $52.16 billion as of December 31, 2020.
• Total loans were $40.48 billion as of September 30, 2021, an increase of $2.09 billion or 5% from $38.39 billion as of December 31, 2020. Total loan growth was well-diversified across the Company’s major loan portfolios, including residential mortgage, commercial real estate (“CRE”) and C&I.
• Total deposits were $53.36 billion as of September 30, 2021, an increase of $8.50 billion or 19% from $44.86 billion as of December 31, 2020. Total deposits’ growth was primarily driven by growth in noninterest-bearing demand deposits and money market accounts.
• Asset quality metrics improved. As of September 30, 2021, criticized loans totaled $1.01 billion or 2.50% of loans held-for-investment, a decrease of $207.2 million or 17%, compared with $1.22 billion or 3.17% of loans held-for-investment as of December 31, 2020. Nonperforming assets were $172.6 million or 0.28% of total assets as of September 30, 2021, a decrease of $62.3 million or 26%, compared with $234.9 million or 0.45% of total assets as of December 31, 2020.
• The Company recorded a reversal of provision for credit losses in 2021, primarily due to an improved macroeconomic outlook. During the third quarter and first nine months of 2021, the Company recorded a reversal of credit losses of $10.0 million and $25.0 million, respectively, compared with a provision for credit losses of $10.0 million and $186.3 million for the same periods in 2020, respectively.
• Profitability expanded in 2021. Third quarter 2021 ROA was 1.46%, compared with 1.26% for the third quarter of 2020. First nine months of 2021 ROA was 1.50%, compared with 1.13% for the first nine months of 2020. Third quarter 2021 ROE was 15.75%, compared with 12.50% for the third quarter of 2020. First nine months of 2021 ROE was 15.98%, compared with 10.73% for the first nine months of 2020.
Results of Operations
Net Interest Income
The Company’s primary source of revenue is net interest income, which is the interest income earned on interest-earning assets less interest expense paid on interest-bearing liabilities. Net interest margin is the ratio of net interest income to average interest-earning assets. Net interest income and net interest margin are impacted by several factors, including changes in average balances and the composition of interest-earning assets and funding sources, market interest rate fluctuations and the slope of the yield curve, repricing characteristics and maturity of interest-earning assets and interest-bearing liabilities, volume of noninterest-bearing sources of funds, and asset quality.
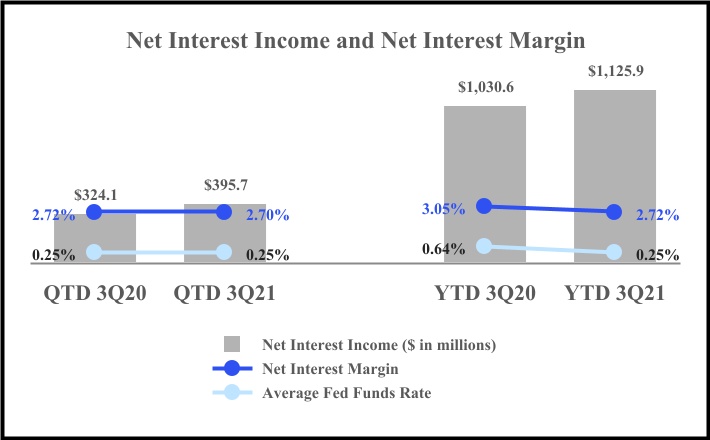
Third quarter 2021 net interest income before provision for credit losses was $395.7 million, an increase of $71.6 million or 22%, compared with third quarter 2020 net interest income of $324.1 million. Third quarter 2021 net interest margin was 2.70%, a decrease of two basis points (“bps”) from 2.72% for the third quarter of 2020. The change in net interest income and net interest margin primarily reflected higher interest income from loans and AFS debt securities due to volume growth, and a lower cost of time and money market deposits. Net interest income for the first nine months of 2021 was $1.13 billion, an increase of $95.3 million or 9%, compared with $1.03 billion for the first nine months of 2020. Net interest margin was 2.72% for the first nine months of 2021, a decrease of 33 bps from 3.05% for the first nine months of 2020. The changes in net interest income and net interest margin primarily benefited from a lower cost of time and money market deposits, higher interest income from AFS debt securities due to volume growth, partially offset by lower interest income on loans due to yield compression. The increase in average interest-bearing cash and deposits with banks, which earned an average yield of 0.25% and 0.26% for the third quarter and first nine months of 2021, respectively, also contributed to net interest margin compression.
Average interest-earning assets were $58.24 billion for the third quarter of 2021, an increase of $10.81 billion or 23% from $47.43 billion for the third quarter of 2020. For the first nine months of 2021, the average interest-earning assets were $55.35 billion, an increase of $10.27 billion or 23% from $45.08 billion for the first nine months of 2020. The year-over-year increases in average interest-earning assets for both periods reflect growth in the average balances of AFS debt securities, loans, and interest-bearing cash and deposits with banks.
The yield on average interest-earning assets for the third quarter of 2021 was 2.83%, a decrease of 24 bps from 3.07% for the third quarter of 2020, primarily reflecting an increase in lower yielding AFS debt securities and interest-bearing cash and deposits with banks in the earnings asset mix. The yield on average interest-earning assets for the first nine months of 2021 was 2.89%, a decrease of 71 bps from 3.60% for the first nine months of 2020, primarily reflecting compression in average loan yields.
Average loan yield was 3.61% for the third quarter of 2021, an increase of one bp from 3.60% for the third quarter of 2020. Average loan yield for the first nine months of 2021 was 3.59%, a decrease of 49 bps from 4.08% for the first nine months of 2020. Excluding the impacts of PPP loans, the adjusted average loan yield was 3.56% and 3.70% for the third quarters of 2021 and 2020, respectively, and 3.58% and 4.10% for the first nine months of 2021 and 2020, respectively. For additional details, see the reconciliations of non-GAAP measures presented under Item 2. MD&A — Reconciliation of GAAP to Non-GAAP Financial Measures in this Form 10-Q. Approximately 65% of loans held-for-investment were variable-rate or hybrid loans in their adjustable rate period as of both September 30, 2021 and 2020.
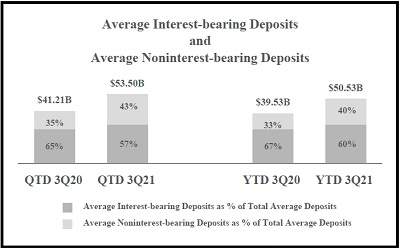
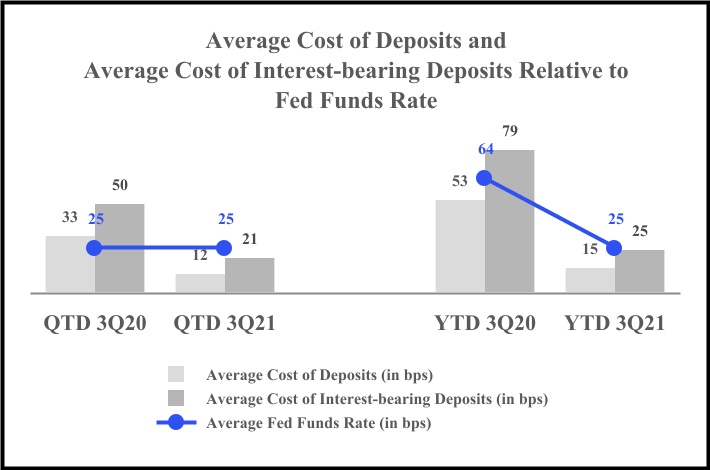
Deposits are an important source of funds and impact both net interest income and net interest margin. The average cost of deposits was 0.12% for the third quarter of 2021, a 21 bp decrease from 0.33% for the third quarter of 2020. The average cost of deposits was 0.15% for the first nine months of 2021, a 38 bp decrease from 0.53% for the same period in 2020. The year-over-year decreases reflected a lower interest rate environment in 2021, as well as the year-over-year run-off of higher rate time deposits. The higher proportion of noninterest-bearing demand deposits, which comprised 43% and 40% of average total deposits for the third quarter and first nine months of 2021, compared with 35% and 33% for the same periods of 2020, respectively, also contributed to the decrease in the average cost of deposits. The average cost of interest-bearing deposits was 0.21% for the third quarter of 2021, a 29 bp decrease from 0.50% for the third quarter of 2020. The average cost of interest-bearing deposits was 0.25% for the first nine months of 2021, a 54 bp decrease from 0.79% for the same period in 2020.
The average cost of funds was 0.14% for the third quarter of 2021, a decrease of 24 bps from 0.38% for the third quarter of 2020. For the first nine months of 2021, the average cost of funds was 0.18%, a decrease of 41 bps from 0.59% for the first nine months of 2020. The decrease in the average cost of funds reflected the lower cost of deposits, as well as decreases in other sources of funding due to changes in the interest rate environment. Other sources of funding included FHLB advances, assets sold under repurchase agreements (“repurchase agreements”), long-term debt and short-term borrowings.
The Company utilizes various tools to manage interest rate risk. Refer to the Interest Rate Risk Management section of Item 2. MD&A — Risk Management — Market Risk Management in this Form 10-Q.
The following table presents the interest spread, net interest margin, average balances, interest income and expense, and the average yield/rate by asset and liability component for the third quarters of 2021 and 2020:
| | | | | | | | | | | | | | | | | | | | | | | | | | | | | | | | | | | | | | |
|
| ($ in thousands) | | Three Months Ended September 30, |
| 2021 | | 2020 |
| Average
Balance | | Interest | | Average Yield/Rate (1) | | Average
Balance | | Interest | | Average Yield/Rate (1) |
| ASSETS | | | | | | | | | | | | |
| Interest-earning assets: | | | | | | | | | | | | |
Interest-bearing cash and deposits with banks | | $ | 7,036,823 | | | $ | 4,521 | | | 0.25 | % | | $ | 4,904,394 | | | $ | 5,045 | | | 0.41 | % |
| Assets purchased under resale agreements (“resale agreements”) | | 2,382,741 | | | 8,957 | | | 1.49 | % | | 1,225,217 | | | 5,295 | | | 1.72 | % |
AFS debt securities (2)(3) | | 8,782,682 | | | 37,826 | | | 1.71 | % | | 4,059,456 | | | 18,493 | | | 1.81 | % |
Loans (4)(5) | | 39,960,151 | | | 363,503 | | | 3.61 | % | | 37,160,445 | | | 336,542 | | | 3.60 | % |
| Restricted equity securities | | 77,083 | | | 500 | | | 2.57 | % | | 79,074 | | | 353 | | | 1.78 | % |
Total interest-earning assets | | $ | 58,239,480 | | | $ | 415,307 | | | 2.83 | % | | $ | 47,428,586 | | | $ | 365,728 | | | 3.07 | % |
| Noninterest-earning assets: | | | | | | | | | | | | |
| Cash and due from banks | | 627,640 | | | | | | | 522,699 | | | | | |
| Allowance for loan losses | | (584,827) | | | | | | | (632,216) | | | | | |
| Other assets | | 3,077,240 | | | | | | | 2,928,190 | | | | | |
| Total assets | | $ | 61,359,533 | | | | | | | $ | 50,247,259 | | | | | |
| LIABILITIES AND STOCKHOLDERS’ EQUITY | | | | | | | | | | | | |
| Interest-bearing liabilities: | | | | | | | | | | | | |
| Checking deposits | | $ | 6,646,515 | | | $ | 3,186 | | | 0.19 | % | | $ | 5,663,873 | | | $ | 4,345 | | | 0.31 | % |
| Money market deposits | | 12,604,827 | | | 3,446 | | | 0.11 | % | | 9,981,704 | | | 6,837 | | | 0.27 | % |
| Savings deposits | | 2,792,702 | | | 1,943 | | | 0.28 | % | | 2,259,788 | | | 1,481 | | | 0.26 | % |
| Time deposits | | 8,283,265 | | | 7,395 | | | 0.35 | % | | 9,008,907 | | | 21,135 | | | 0.93 | % |
Short-term borrowings | | 620 | | | — | | | — | % | | 84,858 | | | 407 | | | 1.91 | % |
| FHLB advances | | 248,614 | | | 857 | | | 1.37 | % | | 656,906 | | | 3,146 | | | 1.91 | % |
| Repurchase agreements | | 310,997 | | | 2,012 | | | 2.57 | % | | 317,097 | | | 2,155 | | | 2.70 | % |
| Long-term debt and finance lease liabilities | | 151,870 | | | 762 | | | 1.99 | % | | 1,579,623 | | (6) | 2,092 | | | 0.53 | % |
Total interest-bearing liabilities | | $ | 31,039,410 | | | $ | 19,601 | | | 0.25 | % | | $ | 29,552,756 | | | $ | 41,598 | | | 0.56 | % |
| Noninterest-bearing liabilities and stockholders’ equity: | | | | | | | | | | | | |
| Demand deposits | | 23,169,323 | | | | | | | 14,296,475 | | | | | |
| Accrued expenses and other liabilities | | 1,470,494 | | | | | | | 1,318,677 | | | | | |
| Stockholders’ equity | | 5,680,306 | | | | | | | 5,079,351 | | | | | |
Total liabilities and stockholders’ equity | | $ | 61,359,533 | | | | | | | $ | 50,247,259 | | | | | |
| Interest rate spread | | | | | | 2.58 | % | | | | | | 2.51 | % |
Net interest income and net interest margin | | | | $ | 395,706 | | | 2.70 | % | | | | $ | 324,130 | | | 2.72 | % |
|
(1)Annualized.
(2)Yields on tax-exempt securities are not presented on a tax-equivalent basis.
(3)Includes the amortization of premiums on debt securities of $22.6 million and $8.1 million for the third quarters of 2021 and 2020, respectively.
(4)Average balances include nonperforming loans and loans held-for-sale.
(5)Loans include the accretion of net deferred loan fees, unearned fees and amortization of premiums, which totaled $17.0 million and $7.7 million for the third quarters of 2021 and 2020, respectively.
(6)Includes average PPPLF balances, which were repaid in full during the fourth quarter of 2020.
The following table presents the interest spread, net interest margin, average balances, interest income and expense, and the average yield/rate by asset and liability component for first nine months of 2021 and 2020:
| | | | | | | | | | | | | | | | | | | | | | | | | | | | | | | | | | | | | | |
|
| ($ in thousands) | | Nine Months Ended September 30, |
| 2021 | | 2020 |
| Average
Balance | | Interest | | Average Yield/Rate (1) | | Average
Balance | | Interest | | Average Yield/Rate (1) |
| ASSETS | | | | | | | | | | | | |
| Interest-earning assets: | | | | | | | | | | | | |
Interest-bearing cash and deposits with banks | | $ | 6,078,982 | | | $ | 11,781 | | | 0.26 | % | | $ | 3,775,242 | | | $ | 20,717 | | | 0.73 | % |
Resale agreements (2) | | 1,994,776 | | | 23,077 | | | 1.55 | % | | 1,048,923 | | | 16,434 | | | 2.09 | % |
AFS debt securities (3)(4) | | 7,755,029 | | | 101,616 | | | 1.75 | % | | 3,685,837 | | | 59,639 | | | 2.16 | % |
Loans (5)(6) | | 39,441,751 | | | 1,057,964 | | | 3.59 | % | | 36,487,859 | | | 1,115,804 | | | 4.08 | % |
| Restricted equity securities | | 80,107 | | | 1,588 | | | 2.65 | % | | 78,873 | | | 1,100 | | | 1.86 | % |
Total interest-earning assets | | $ | 55,350,645 | | | $ | 1,196,026 | | | 2.89 | % | | $ | 45,076,734 | | | $ | 1,213,694 | | | 3.60 | % |
| Noninterest-earning assets: | | | | | | | | | | | | |
| Cash and due from banks | | 602,830 | | | | | | | 510,750 | | | | | |
| Allowance for loan losses | | (603,523) | | | | | | | (563,912) | | | | | |
| Other assets | | 2,913,050 | | | | | | | 2,729,458 | | | | | |
| Total assets | | $ | 58,263,002 | | | | | | | $ | 47,753,030 | | | | | |
| LIABILITIES AND STOCKHOLDERS’ EQUITY | | | | | | | | | | | | |
| Interest-bearing liabilities: | | | | | | | | | | | | |
| Checking deposits | | $ | 6,571,231 | | | $ | 11,177 | | | 0.23 | % | | $ | 5,119,568 | | | $ | 19,995 | | | 0.52 | % |
| Money market deposits | | 12,262,173 | | | 11,869 | | | 0.13 | % | | 9,630,918 | | | 37,178 | | | 0.52 | % |
| Savings deposits | | 2,715,114 | | | 5,762 | | | 0.28 | % | | 2,162,365 | | | 4,743 | | | 0.29 | % |
| Time deposits | | 8,635,250 | | | 26,982 | | | 0.42 | % | | 9,633,582 | | | 94,684 | | | 1.31 | % |
Short-term borrowings | | 1,871 | | | 42 | | | 3.00 | % | | 128,846 | | | 1,228 | | | 1.27 | % |
| FHLB advances | | 457,273 | | | 6,025 | | | 1.76 | % | | 667,935 | | | 10,655 | | | 2.13 | % |
Repurchase agreements (2) | | 304,745 | | | 5,981 | | | 2.62 | % | | 355,923 | | | 9,686 | | | 3.64 | % |
| Long-term debt and finance lease liabilities | | 152,018 | | | 2,314 | | | 2.04 | % | | 807,599 | | (7) | 4,913 | | | 0.81 | % |
Total interest-bearing liabilities | | $ | 31,099,675 | | | $ | 70,152 | | | 0.30 | % | | $ | 28,506,736 | | | $ | 183,082 | | | 0.86 | % |
| Noninterest-bearing liabilities and stockholders’ equity: | | | | | | | | | | | | |
| Demand deposits | | 20,345,370 | | | | | | | 12,987,813 | | | | | |
| Accrued expenses and other liabilities | | 1,335,252 | | | | | | | 1,230,359 | | | | | |
| Stockholders’ equity | | 5,482,705 | | | | | | | 5,028,122 | | | | | |
Total liabilities and stockholders’ equity | | $ | 58,263,002 | | | | | | | $ | 47,753,030 | | | | | |
| Interest rate spread | | | | | | 2.59 | % | | | | | | 2.74 | % |
Net interest income and net interest margin | | | | $ | 1,125,874 | | | 2.72 | % | | | | $ | 1,030,612 | | | 3.05 | % |
|
(1)Annualized.
(2)Average balances of resale and repurchase agreements for the nine months ended September 30, 2020 have been reported net, pursuant to Accounting Standards Codification (“ASC”) 210-20-45-11, Balance Sheet Offsetting: Repurchase and Reverse Repurchase Agreements. The weighted-average yields of gross resale and gross repurchase agreements for the nine months ended September 30, 2020 were 2.09% and 3.48%, respectively.
(3)Yields on tax-exempt securities are not presented on a tax-equivalent basis.
(4)Includes the amortization of premiums on debt securities of $62.7 million and $17.3 million for first nine months of 2021 and 2020, respectively.
(5)Average balances include nonperforming loans and loans held-for-sale.
(6)Loans include the accretion of net deferred loan fees, unearned fees and amortization of premiums, which totaled $46.8 million and $36.8 million for first nine months of 2021 and 2020, respectively.
(7)Includes average PPPLF balances, which were repaid in full during the fourth quarter of 2020.
The following table summarizes the extent to which changes in (1) interest rate, and (2) volume of average interest-earning assets and average interest-bearing liabilities affected the Company’s net interest income for the periods presented. The total change for each category of interest-earning assets and interest-bearing liabilities is segmented into changes attributable to variations in volume and yield/rate. Changes that are not solely due to either volume or yield/rate are allocated proportionally based on the absolute value of the change related to average volume and average rate.
| | | | | | | | | | | | | | | | | | | | | | | | | | | | | | | | | | | | | | | | | | | | | | | | | | |
|
| ($ in thousands) | | Three Months Ended September 30, | | Nine Months Ended September 30, | | | | | | | | |
| 2021 vs. 2020 | | 2021 vs. 2020 | | | | |
| Total
Change | | Changes Due to | | Total
Change | | Changes Due to | | | | | | | | |
| | Volume | | Yield/Rate | | | Volume | | Yield/Rate | | | | | | | | | | |
| Interest-earning assets: | | | | | | | | | | | | | | | | | | | | | | | | |
Interest-bearing cash and deposits with banks | | $ | (524) | | | $ | 1,763 | | | $ | (2,287) | | | $ | (8,936) | | | $ | 8,656 | | | $ | (17,592) | | | | | | | | | | | | | |
| Resale agreements | | 3,662 | | | 4,446 | | | (784) | | | 6,643 | | | 11,798 | | | (5,155) | | | | | | | | | | | | | |
| AFS debt securities | | 19,333 | | | 20,448 | | | (1,115) | | | 41,977 | | | 55,098 | | | (13,121) | | | | | | | | | | | | | |
| Loans | | 26,961 | | | 26,369 | | | 592 | | | (57,840) | | | 85,446 | | | (143,286) | | | | | | | | | | | | | |
| Restricted equity securities | | 147 | | | (9) | | | 156 | | | 488 | | | 17 | | | 471 | | | | | | | | | | | | | |
| Total interest and dividend income | | $ | 49,579 | | | $ | 53,017 | | | $ | (3,438) | | | $ | (17,668) | | | $ | 161,015 | | | $ | (178,683) | | | | | | | | | | | | | |
| Interest-bearing liabilities: | | | | | | | | | | | | | | | | | | | | | | | | |
| Checking deposits | | $ | (1,159) | | | $ | 670 | | | $ | (1,829) | | | $ | (8,818) | | | $ | 4,589 | | | $ | (13,407) | | | | | | | | | | | | | |
| Money market deposits | | (3,391) | | | 1,478 | | | (4,869) | | | (25,309) | | | 8,107 | | | (33,416) | | | | | | | | | | | | | |
| Savings deposits | | 462 | | | 370 | | | 92 | | | 1,019 | | | 1,173 | | | (154) | | | | | | | | | | | | | |
| Time deposits | | (13,740) | | | (1,579) | | | (12,161) | | | (67,702) | | | (8,933) | | | (58,769) | | | | | | | | | | | | | |
Short-term borrowings | | (407) | | | (203) | | | (204) | | | (1,186) | | | (1,900) | | | 714 | | | | | | | | | | | | | |
| FHLB advances | | (2,289) | | | (1,574) | | | (715) | | | (4,630) | | | (2,988) | | | (1,642) | | | | | | | | | | | | | |
| Repurchase agreements | | (143) | | | (39) | | | (104) | | | (3,705) | | | (1,263) | | | (2,442) | | | | | | | | | | | | | |
Long-term debt and finance lease liabilities | | (1,330) | | | (3,188) | | | 1,858 | | | (2,599) | | | (6,087) | | | 3,488 | | | | | | | | | | | | | |
| Total interest expense | | $ | (21,997) | | | $ | (4,065) | | | $ | (17,932) | | | $ | (112,930) | | | $ | (7,302) | | | $ | (105,628) | | | | | | | | | | | | | |
| Change in net interest income | | $ | 71,576 | | | $ | 57,082 | | | $ | 14,494 | | | $ | 95,262 | | | $ | 168,317 | | | $ | (73,055) | | | | | | | | | | | | | |
|
Noninterest Income
The following table presents the components of noninterest income for the third quarters and first nine months of 2021 and 2020:
| | | | | | | | | | | | | | | | | | | | | | | | | | | | | | | | | | | | | | | | |
|
| ($ in thousands) | | Three Months Ended September 30, | | Nine Months Ended September 30, |
| 2021 | | 2020 | | | | % Change | | 2021 | | 2020 | | % Change |
| Lending fees | | $ | 17,516 | | | $ | 18,736 | | | | | (7) | % | | $ | 56,965 | | | $ | 56,455 | | | 1 | % |
Deposit account fees | | 18,508 | | | 12,573 | | | | | 47 | % | | 51,233 | | | 33,892 | | | 51 | % |
| Interest rate contracts and other derivative income | | 7,156 | | | 5,538 | | | | | 29 | % | | 20,981 | | | 18,718 | | | 12 | % |
| Foreign exchange income | | 13,101 | | | 3,310 | | | | | 296 | % | | 35,634 | | | 15,691 | | | 127 | % |
| Wealth management fees | | 5,598 | | | 4,553 | | | | | 23 | % | | 20,460 | | | 12,997 | | | 57 | % |
| Net gains on sales of loans | | 3,329 | | | 361 | | | | | 822 | % | | 6,601 | | | 1,443 | | | 357 | % |
Gains on sales of AFS debt securities | | 354 | | | 698 | | | | | (49) | % | | 1,178 | | | 11,867 | | | (90) | % |
| | | | | | | | | | | | | | |
| | | | | | | | | | | | | | |
| Other investment income | | 5,349 | | | 5,239 | | | | | 2 | % | | 13,870 | | | 6,652 | | | 109 | % |
| Other income | | 2,198 | | | 3,495 | | | | | (37) | % | | 7,484 | | | 8,000 | | | (6) | % |
Total noninterest income | | $ | 73,109 | | | $ | 54,503 | | | | | 34 | % | | $ | 214,406 | | | $ | 165,715 | | | 29 | % |
|
Noninterest income comprised 16% of total revenue for both the third quarter and first nine months of 2021, compared with 14% for the same periods in 2020. Third quarter 2021 noninterest income was $73.1 million, an increase of $18.6 million or 34%, compared with $54.5 million for the same period in 2020. This increase was primarily due to increases in foreign exchange income and deposit account fees. Noninterest income for the first nine months of 2021 was $214.4 million, an increase of $48.7 million or 29%, compared with $165.7 million for the same period in 2020. This increase was primarily due to increases in foreign exchange income, deposit account fees, wealth management fees, other investment income, and gains on sales of loans, partially offset by a decrease in gains on sales of AFS debt securities.
Deposit account fees increased $5.9 million or 47% to $18.5 million for the third quarter of 2021, and increased $17.3 million or 51% to $51.2 million for the first nine months of 2021, compared with the same periods in 2020. These increases primarily reflected an increase in treasury management service fees resulting from commercial deposit growth.
Foreign exchange income increased $9.8 million or 296% to $13.1 million for the third quarter of 2021, and increased $19.9 million or 127% to $35.6 million for the first nine months of 2021, compared with the same periods in 2020. These increases reflected new customer acquisitions and growth in customer-driven transactions, favorable revaluation of foreign currency transactions, as well as remeasurement of certain foreign currency-denominated balance sheet items.
Wealth management fees increased $1.0 million or 23% to $5.6 million for the third quarter of 2021, and increased $7.5 million or 57% to $20.5 million for the first nine months of 2021, compared with the same periods in 2020. These increases were primarily due to growth in customer-driven transactions.
Net gains on sales of loans increased $3.0 million or 822% to $3.3 million for the third quarter of 2021, and increased $5.2 million or 357% to $6.6 million for the first nine months of 2021, compared with the same periods in 2020. These increases were primarily due to a higher volume of SBA loan sold.
Gains on sales of AFS debt securities decreased $344 thousand or 49% to $354 thousand for the third quarter of 2021, compared with the same period in 2020. Gains on sales of AFS debt securities decreased $10.7 million or 90% to $1.2 million for the first nine months of 2021, compared with the same period in 2020. The decrease for the first nine months of 2021, compared with the same period in 2020, was primarily due to a lower volume of AFS debt securities sold.
Other investment income increased $110 thousand or 2% to $5.3 million for the third quarter of 2021, and increased $7.2 million or 109% to $13.9 million for the first nine months of 2021, compared with the same periods in 2020. These increases primarily reflected higher earnings from equity method investments.
Noninterest Expense
The following table presents the components of noninterest expense for the third quarters and first nine months of 2021 and 2020:
| | | | | | | | | | | | | | | | | | | | | | | | | | | | | | | | | | | | | | | | |
|
| ($ in thousands) | | Three Months Ended September 30, | | Nine Months Ended September 30, |
| 2021 | | 2020 | | | | % Change | | 2021 | | 2020 | | % Change |
| Compensation and employee benefits | | $ | 105,751 | | | $ | 99,756 | | | | | 6 | % | | $ | 318,985 | | | $ | 298,671 | | | 7 | % |
| Occupancy and equipment expense | | 15,851 | | | 16,648 | | | | | (5) | % | | 47,150 | | | 49,941 | | | (6) | % |
| Deposit insurance premiums and regulatory assessments | | 4,641 | | | 4,006 | | | | | 16 | % | | 12,791 | | | 11,133 | | | 15 | % |
| Deposit account expense | | 4,136 | | | 3,113 | | | | | 33 | % | | 11,845 | | | 10,029 | | | 18 | % |
| Data processing | | 3,575 | | | 3,590 | | | | | 0 | % | | 12,088 | | | 11,896 | | | 2 | % |
| Computer software expense | | 8,426 | | | 8,539 | | | | | (1) | % | | 23,106 | | | 22,006 | | | 5 | % |
| Consulting expense | | 1,635 | | | 1,224 | | | | | 34 | % | | 4,978 | | | 3,854 | | | 29 | % |
| Legal expense | | 2,363 | | | 1,366 | | | | | 73 | % | | 5,840 | | | 6,093 | | | (4) | % |
| Other operating expense | | 20,998 | | | 17,122 | | | | | 23 | % | | 58,544 | | | 57,489 | | | 2 | % |
| Amortization of tax credit and other investments | | 38,008 | | | 17,209 | | | | | 121 | % | | 90,657 | | | 57,819 | | | 57 | % |
| Repurchase agreements’ extinguishment cost | | — | | | — | | | | | — | % | | — | | | 8,740 | | | (100) | % |
| | | | | | | | | | | | | | |
| Total noninterest expense | | $ | 205,384 | | | $ | 172,573 | | | | | 19 | % | | $ | 585,984 | | | $ | 537,671 | | | 9 | % |
| Efficiency ratio | | 43.81 | % | | 45.58 | % | | | | | | 43.72 | % | | 44.94 | % | | |
|
Third quarter 2021 noninterest expense was $205.4 million, an increase of $32.8 million or 19%, compared with $172.6 million for the same period in 2020. This increase was primarily due to higher amortization of tax credit and other investments, compensation and employee benefits, and other operating expense. First nine months of 2021 noninterest expense was $586.0 million, an increase of $48.3 million or 9%, compared with $537.7 million for the same period in 2020. The increase primarily reflected higher amortization of tax credit and other investments, and compensation and employee benefits.
Compensation and employee benefits increased $6.0 million or 6% to $105.8 million for the third quarter of 2021, and increased $20.3 million or 7% to $319.0 million for the first nine months of 2021, compared with the same periods in 2020. These increases were primarily due to higher bonus accruals.
The increase in other operating expense of $3.9 million or 23% to $21.0 million for the third quarter of 2021, compared with the same period in 2020, was primarily due to higher charitable contributions. Other operating expense was $58.5 million and $57.5 million for the first nine months of 2021 and 2020, respectively.
Amortization of tax credit and other investments increased $20.8 million or 121% to $38.0 million for the third quarter of 2021, and increased $32.9 million or 57% to $90.7 million for the first nine months of 2021, compared with the same periods in 2020. These increases were primarily due to the timing of the tax credit recognition in each period, based on when new tax credit projects were put into service.
During the second quarter of 2020, the Company prepaid $150.0 million of repurchase agreements and incurred a debt extinguishment cost of $8.7 million. No such expense was incurred in either the third quarter or first nine months of 2021.
Efficiency ratio, calculated as noninterest expense divided by total revenue, was 43.81% and 45.58% for the third quarters of 2021 and 2020, respectively, and 43.72% and 44.94% for the first nine months of 2021 and 2020, respectively. Non-GAAP efficiency ratio, adjusted for the amortization of tax credit and other investments and the amortization of core deposit intangibles, improved 524 bps to 35.55% for the third quarter of 2021, and improved 234 bps to 36.80% for the first nine months of 2021, compared with the same periods in 2020. For additional details, see the reconciliations of non-GAAP measures presented under Item 2. MD&A — Reconciliation of GAAP to Non-GAAP Financial Measures in this Form 10-Q.
Income Taxes
| | | | | | | | | | | | | | | | | | | | | | | | | | | | | | | | | | | | | | | | | | | | |
|
| ($ in thousands) | | Three Months Ended September 30, | | | | Nine Months Ended September 30, |
| 2021 | | 2020 | | % Change | | | | | | | | 2021 | | 2020 | | % Change |
Income before income taxes | | $ | 273,431 | | | $ | 196,060 | | | 39 | % | | | | | | | | $ | 779,296 | | | $ | 472,343 | | | 65 | % |
| Income tax expense | | $ | 47,982 | | | $ | 36,523 | | | 31 | % | | | | | | | | $ | 124,111 | | | $ | 68,630 | | | 81 | % |
| Effective tax rate | | 17.5 | % | | 18.6 | % | | | | | | | | | | 15.9 | % | | 14.5 | % | | |
|
Third quarter 2021 income tax expense was $48.0 million and the effective tax rate was 17.5%, compared with third quarter 2020 income tax expense of $36.5 million and effective tax rate of 18.6%. The decrease in effective tax rate for the third quarter of 2021, compared with the same period in 2020 was primarily due to the relative impact of tax credit investments on income tax expense. For the first nine months of 2021, income tax expense was $124.1 million and the effective tax rate was 15.9%, compared with income tax expense of $68.6 million and effective tax rate of 14.5% for the same period in 2020. The year-over-year increase in effective tax rate was predominantly driven by a higher level of income before income taxes, as well as the relative impact of tax credit investments on income tax expense in each period.
Operating Segment Results
The Company organizes its operations into three reportable operating segments: (1) Consumer and Business Banking; (2) Commercial Banking; and (3) Other. These segments are defined by the type of customers served, and the related products and services provided. The segments reflect how financial information is currently evaluated by management. For additional description of the Company’s internal management reporting process, including the segment cost allocation methodology, see Note 13 — Business Segments to the Consolidated Financial Statements in this Form 10-Q.
Segment net interest income represents the difference between actual interest earned on assets and interest incurred on liabilities of the segment, adjusted for funding charges or credits through the Company’s internal funds transfer pricing (“FTP”) process.
The following tables present the results by operating segment for the periods indicated:
| | | | | | | | | | | | | | | | | | | | | | | | | | | | | | | | | | | | | | |
|
| ($ in thousands) | | Three Months Ended September 30, |
| Consumer and Business Banking | | Commercial Banking | | Other |
| 2021 | | 2020 | | 2021 | | 2020 | | 2021 | | 2020 |
| Total revenue | | $ | 199,124 | | | $ | 138,395 | | | $ | 232,716 | | | $ | 191,868 | | | $ | 36,975 | | | $ | 48,370 | |
| Provision for (reversal of) credit losses | | 1,293 | | | (3,470) | | | (11,293) | | | 13,470 | | | — | | | — | |
| | | | | | | | | | | | |
| | | | | | | | | | | | |
| | | | | | | | | | | | |
| | | | | | | | | | | | |
| | | | | | | | | | | | |
| | | | | | | | | | | | |
| | | | | | | | | | | | |
| | | | | | | | | | | | |
| | | | | | | | | | | | |
| | | | | | | | | | | | |
| | | | | | | | | | | | |
| | | | | | | | | | | | |
| | | | | | | | | | | | |
| | | | | | | | | | | | |
| | | | | | | | | | | | |
| | | | | | | | | | | | |
| | | | | | | | | | | | |
| | | | | | | | | | | | |
| | | | | | | | | | | | |
| | | | | | | | | | | | |
| | | | | | | | | | | | |
| | | | | | | | | | | | |
| | | | | | | | | | | | |
| Noninterest expense | | 90,575 | | | 81,419 | | | 66,688 | | | 61,863 | | | 48,121 | | | 29,291 | |
| Segment income (loss) before income taxes | | 107,256 | | | 60,446 | | | 177,321 | | | 116,535 | | | (11,146) | | | 19,079 | |
| | | | | | | | | | | | |
| Segment net income | | $ | 76,825 | | | $ | 43,310 | | | $ | 126,767 | | | $ | 83,340 | | | $ | 21,857 | | | $ | 32,887 | |
|
| | | | | | | | | | | | | | | | | | | | | | | | | | | | | | | | | | | | | | |
|
| ($ in thousands) | | Nine Months Ended September 30, |
| Consumer and Business Banking | | Commercial Banking | | Other |
| 2021 | | 2020 | | 2021 | | 2020 | | 2021 | | 2020 |
| Total revenue | | $ | 568,080 | | | $ | 446,257 | | | $ | 685,066 | | | $ | 625,508 | | | $ | 87,134 | | | $ | 124,562 | |
| (Reversal of) provision for credit losses | | (598) | | | 9,908 | | | (24,402) | | | 176,405 | | | — | | | — | |
| | | | | | | | | | | | |
| | | | | | | | | | | | |
| | | | | | | | | | | | |
| | | | | | | | | | | | |
| | | | | | | | | | | | |
| | | | | | | | | | | | |
| | | | | | | | | | | | |
| | | | | | | | | | | | |
| | | | | | | | | | | | |
| | | | | | | | | | | | |
| | | | | | | | | | | | |
| | | | | | | | | | | | |
| | | | | | | | | | | | |
| | | | | | | | | | | | |
| | | | | | | | | | | | |
| | | | | | | | | | | | |
| | | | | | | | | | | | |
| | | | | | | | | | | | |
| | | | | | | | | | | | |
| | | | | | | | | | | | |
| | | | | | | | | | | | |
| | | | | | | | | | | | |
| | | | | | | | | | | | |
| Noninterest expense | | 267,511 | | | 248,547 | | | 200,109 | | | 196,889 | | | 118,364 | | | 92,235 | |
| Segment income (loss) before income taxes | | 301,167 | | | 187,802 | | | 509,359 | | | 252,214 | | | (31,230) | | | 32,327 | |
| | | | | | | | | | | | |
| Segment net income | | $ | 215,720 | | | $ | 134,563 | | | $ | 364,632 | | | $ | 180,649 | | | $ | 74,833 | | | $ | 88,501 | |
|
Consumer and Business Banking
The Consumer and Business Banking segment primarily provides financial products and services to consumer and commercial customers through the Company’s domestic branch network and digital banking platform. This segment offers consumer and commercial deposits, mortgage and home equity loans, and other products and services. It also originates commercial loans for small- and medium-sized enterprises. Other products and services provided by this segment include wealth management, treasury management, and foreign exchange services.
The following tables present additional financial information for the Consumer and Business Banking segment for the periods indicated:
| | | | | | | | | | | | | | | | | | | | | | | | | | |
|
| ($ in thousands) | | Three Months Ended September 30, |
| | | | | Change from 2020 |
| 2021 | | 2020 | | $ | | % |
| Net interest income before provision for credit losses | | $ | 176,678 | | | $ | 120,969 | | | $ | 55,709 | | | 46 | % |
| Noninterest income | | 22,446 | | | 17,426 | | | 5,020 | | | 29 | % |
| Total revenue | | 199,124 | | | 138,395 | | | 60,729 | | | 44 | % |
| Provision for (reversal of) credit losses | | 1,293 | | | (3,470) | | | 4,763 | | | (137) | % |
| Noninterest expense | | 90,575 | | | 81,419 | | | 9,156 | | | 11 | % |
| Segment income before income taxes | | 107,256 | | | 60,446 | | | 46,810 | | | 77 | % |
| Income tax expense | | 30,431 | | | 17,136 | | | 13,295 | | | 78 | % |
| Segment net income | | $ | 76,825 | | | $ | 43,310 | | | $ | 33,515 | | | 77 | % |
| Average loans | | $ | 14,186,630 | | | $ | 12,267,993 | | | $ | 1,918,637 | | | 16 | % |
| Average deposits | | $ | 32,516,678 | | | $ | 27,596,090 | | | $ | 4,920,588 | | | 18 | % |
|
| | | | | | | | | | | | | | | | | | | | | | | | | | |
|
| ($ in thousands) | | Nine Months Ended September 30, |
| | | | | Change from 2020 |
| 2021 | | 2020 | | $ | | % |
| Net interest income before provision for credit losses | | $ | 500,352 | | | $ | 398,486 | | | $ | 101,866 | | | 26 | % |
| Noninterest income | | 67,728 | | | 47,771 | | | 19,957 | | | 42 | % |
| Total revenue | | 568,080 | | | 446,257 | | | 121,823 | | | 27 | % |
| (Reversal of) provision for credit losses | | (598) | | | 9,908 | | | (10,506) | | | (106) | % |
| Noninterest expense | | 267,511 | | | 248,547 | | | 18,964 | | | 8 | % |
| Segment income before income taxes | | 301,167 | | | 187,802 | | | 113,365 | | | 60 | % |
| Income tax expense | | 85,447 | | | 53,239 | | | 32,208 | | | 60 | % |
| Segment net income | | $ | 215,720 | | | $ | 134,563 | | | $ | 81,157 | | | 60 | % |
| Average loans | | $ | 13,787,675 | | | $ | 11,851,089 | | | $ | 1,936,586 | | | 16 | % |
| Average deposits | | $ | 31,304,335 | | | $ | 26,734,437 | | | $ | 4,569,898 | | | 17 | % |
|
For the third quarter of 2021, segment net income increased $33.5 million or 77% year-over-year to $76.8 million, driven by revenue growth, partially offset by increases in income tax expense, noninterest expense, and the provision for credit losses. Net interest income before provision for credit losses increased $55.7 million or 46% to $176.7 million, driven by lower interest expense, primarily due to lower interest rates and growth in noninterest-bearing demand deposits; and higher interest income, primarily due to growth in residential mortgage loans. Noninterest income increased $5.0 million or 29% to $22.4 million, primarily due to higher foreign exchange income and deposit account fees, reflecting growth in customer-driven transactions. Noninterest expense increased $9.2 million or 11% to $90.6 million, primarily due to higher allocated corporate overhead, and compensation and employee benefits.
For the first nine months of 2021, segment net income increased $81.2 million or 60% year-over-year to $215.7 million, due to revenue growth and a lower provision for credit losses, partially offset by higher income tax expense and noninterest expense. Net interest income before provision for credit losses increased $101.9 million or 26% to $500.4 million, driven by higher interest income, primarily due to growth in residential mortgage loans; and lower interest expense, primarily due to growth in noninterest-bearing demand deposits and lower interest rates. Noninterest income increased $20.0 million or 42% to $67.7 million, primarily due to higher foreign exchange income, deposit account fees, and wealth management fees, partially offset by lower interest rate contracts and other derivative income. Noninterest expense increased $19.0 million or 8% to $267.5 million, primarily from increased compensation and employee benefits, and allocated corporate overhead.
Commercial Banking
The Commercial Banking segment primarily offers commercial loan and deposit products. Commercial loan products include commercial business loans and lines of credit, trade finance loans and letters of credit, CRE loans, construction and land lending, affordable housing loans and letters of credit, asset-based lending, and equipment financing. Commercial deposit products and other financial services include treasury management, foreign exchange services, and interest rate and commodity risk hedging.
The following tables present additional financial information for the Commercial Banking segment for the periods indicated:
| | | | | | | | | | | | | | | | | | | | | | | | | | |
|
| ($ in thousands) | | Three Months Ended September 30, |
| | | | | Change from 2020 |
| 2021 | | 2020 | | $ | | % |
| Net interest income before provision for credit losses | | $ | 189,791 | | | $ | 162,884 | | | $ | 26,907 | | | 17 | % |
| Noninterest income | | 42,925 | | | 28,984 | | | 13,941 | | | 48 | % |
| Total revenue | | 232,716 | | | 191,868 | | | 40,848 | | | 21 | % |
| (Reversal of) provision for credit losses | | (11,293) | | | 13,470 | | | (24,763) | | | (184) | % |
| Noninterest expense | | 66,688 | | | 61,863 | | | 4,825 | | | 8 | % |
| Segment income before income taxes | | 177,321 | | | 116,535 | | | 60,786 | | | 52 | % |
| Income tax expense | | 50,554 | | | 33,195 | | | 17,359 | | | 52 | % |
| Segment net income | | $ | 126,767 | | | $ | 83,340 | | | $ | 43,427 | | | 52 | % |
| Average loans | | $ | 25,773,521 | | | $ | 24,892,452 | | | $ | 881,069 | | | 4 | % |
| Average deposits | | $ | 18,275,884 | | | $ | 10,766,677 | | | $ | 7,509,207 | | | 70 | % |
|
| | | | | | | | | | | | | | | | | | | | | | | | | | |
|
| ($ in thousands) | | Nine Months Ended September 30, |
| | | | | Change from 2020 |
| 2021 | | 2020 | | $ | | % |
| Net interest income before provision for credit losses | | $ | 559,579 | | | $ | 530,181 | | | $ | 29,398 | | | 6 | % |
| Noninterest income | | 125,487 | | | 95,327 | | | 30,160 | | | 32 | % |
| Total revenue | | 685,066 | | | 625,508 | | | 59,558 | | | 10 | % |
| (Reversal of) provision for credit losses | | (24,402) | | | 176,405 | | | (200,807) | | | (114) | % |
| Noninterest expense | | 200,109 | | | 196,889 | | | 3,220 | | | 2 | % |
| Segment income before income taxes | | 509,359 | | | 252,214 | | | 257,145 | | | 102 | % |
| Income tax expense | | 144,727 | | | 71,565 | | | 73,162 | | | 102 | % |
| Segment net income | | $ | 364,632 | | | $ | 180,649 | | | $ | 183,983 | | | 102 | % |
| Average loans | | $ | 25,654,076 | | | $ | 24,636,770 | | | $ | 1,017,306 | | | 4 | % |
| Average deposits | | $ | 16,611,906 | | | $ | 10,197,018 | | | $ | 6,414,888 | | | 63 | % |
|
For the third quarter of 2021, segment net income increased $43.4 million or 52% year-over-year to $126.8 million, driven by revenue growth and a lower provision for credit losses, partially offset by higher income tax expense and noninterest expense. Net interest income before provision for credit losses increased $26.9 million or 17% to $189.8 million, driven by higher interest income, due to more PPP loan-related income and growth in commercial loans; and lower interest expense due to growth in noninterest-bearing demand deposits. Noninterest income increased $13.9 million or 48% to $42.9 million, reflecting higher foreign exchange income, deposit account fees, gains on sales of loans, and interest rate contracts and other derivative income. Noninterest expense increased $4.8 million or 8% to $66.7 million, primarily due to higher compensation and employee benefits.
For the first nine months of 2021, segment net income increased $184.0 million or 102% year-over-year to $364.6 million, reflecting a lower provision for credit losses and revenue growth, partially offset by higher income tax expense and noninterest expense. Net interest income before provision for credit losses increased $29.4 million or 6% to $559.6 million, driven by lower interest expense, due to lower interest rates and growth in noninterest-bearing demand deposits; partially offset by lower interest income, due to compression in commercial loan yields. Noninterest income increased $30.2 million or 32% to $125.5 million, reflecting higher foreign exchange income, deposit account fees, interest rate contracts and other derivative income, and gains on sales of loans. Noninterest expense increased $3.2 million or 2% to $200.1 million, due to increases in compensation and employee benefits, and deposit related expenses, partially offset by a decrease in loan related expense.
Other
Centralized functions, including the corporate treasury activities of the Company and eliminations of inter-segment amounts, have been aggregated and included in the Other segment, which provides broad administrative support to the two core segments, namely the Consumer and Business Banking and the Commercial Banking segments.
The following tables present additional financial information for the Other segment for the periods indicated:
| | | | | | | | | | | | | | | | | | | | | | | | | | |
|
| ($ in thousands) | | Three Months Ended September 30, |
| | | | | Change from 2020 |
| 2021 | | 2020 | | $ | | % |
| Net interest income before provision for credit losses | | $ | 29,237 | | | $ | 40,277 | | | $ | (11,040) | | | (27) | % |
| Noninterest income | | 7,738 | | | 8,093 | | | (355) | | | (4) | % |
| Total revenue | | 36,975 | | | 48,370 | | | (11,395) | | | (24) | % |
| | | | | | | | |
| Noninterest expense | | 48,121 | | | 29,291 | | | 18,830 | | | 64 | % |
| Segment (loss) income before income taxes | | (11,146) | | | 19,079 | | | (30,225) | | | (158) | % |
| Income tax benefit | | (33,003) | | | (13,808) | | | (19,195) | | | 139 | % |
| Segment net income | | $ | 21,857 | | | $ | 32,887 | | | $ | (11,030) | | | (34) | % |
| | | | | | | | |
| Average deposits | | $ | 2,704,070 | | | $ | 2,847,980 | | | $ | (143,910) | | | (5) | % |
|
| | | | | | | | | | | | | | | | | | | | | | | | | | |
|
| ($ in thousands) | | Nine Months Ended September 30, |
| | | | | Change from 2020 |
| 2021 | | 2020 | | $ | | % |
| Net interest income before provision for credit losses | | $ | 65,943 | | | $ | 101,945 | | | $ | (36,002) | | | (35) | % |
| Noninterest income | | 21,191 | | | 22,617 | | | (1,426) | | | (6) | % |
| Total revenue | | 87,134 | | | 124,562 | | | (37,428) | | | (30) | % |
| | | | | | | | |
| Noninterest expense | | 118,364 | | | 92,235 | | | 26,129 | | | 28 | % |
| Segment (loss) income before income taxes | | (31,230) | | | 32,327 | | | (63,557) | | | (197) | % |
| Income tax benefit | | (106,063) | | | (56,174) | | | (49,889) | | | 89 | % |
| Segment net income | | $ | 74,833 | | | $ | 88,501 | | | $ | (13,668) | | | (15) | % |
| | | | | | | | |
| Average deposits | | $ | 2,612,897 | | | $ | 2,602,791 | | | $ | 10,106 | | | 0 | % |
|
Segment net income decreased $11.0 million or 34% year-over-year to $21.9 million for the third quarter of 2021. Net interest income before provision for credit losses decreased $11.0 million or 27% to $29.2 million. The decrease was primarily driven by lower FTP spread income absorbed by the Other segment, partially offset by growth in interest income from investments due to a higher volume of AFS debt securities. Noninterest expense increased $18.8 million or 64% to $48.1 million, primarily due to higher amortization of tax credits and other investments.
Segment net income decreased $13.7 million or 15% year-over-year to $74.8 million for the first nine months of 2021. Net interest income before provision for credit losses decreased $36.0 million or 35% to $65.9 million. The decrease was primarily driven by lower FTP spread income absorbed by the Other segment, partially offset by growth in interest income from investments due to a higher volume of AFS debt securities. Noninterest expense increased $26.1 million or 28% to $118.4 million, primarily driven by higher amortization of tax credits and other investments.
Balance Sheet Analysis
Debt Securities
The Company maintains a portfolio of high quality and liquid debt securities with moderate durations to minimize overall interest rate and liquidity risks. The Company’s debt securities provide:
•interest income for earnings and yield enhancement;
•availability for funding needs arising during the normal course of business;
•the ability to execute interest rate risk management strategies in response to changes in economic or market conditions; and
•collateral to support pledging agreements as required and/or to enhance the Company’s borrowing capacity.
Available-for-Sale Debt Securities
Debt securities classified as AFS are carried at their fair value with the corresponding changes in fair value recorded in Accumulated other comprehensive income (loss), net of tax, as a component of Stockholders’ equity on the Consolidated Balance Sheet.
The following table presents the distribution of the Company’s AFS debt securities portfolio by fair value and percentage of portfolio as of September 30, 2021 and December 31, 2020, and by credit ratings as of September 30, 2021:
| | | | | | | | | | | | | | | | | | | | | | | | | | | | | | | | | | | | | | | | | | | | | | | | | | | | | | | | | | | |
| |
| ($ in thousands) | | September 30, 2021 | | December 31, 2020 | | | | | | Ratings as of September 30, 2021 (2) | |
| Fair
Value | | | % of Total | | Fair
Value | | | % of Total | | | | | | AAA/AA | | A | | BBB | | | | No Rating | |
| AFS debt securities: | | | | | | | | | | | | | | | | | | | | | | | | | |
| U.S. Treasury securities | | $ | 941,724 | | | | 10 | % | | $ | 50,761 | | | | 1 | % | | | | | | 100 | % | | — | % | | — | % | | | | — | % | |
| U.S. government agency and U.S. government-sponsored enterprise debt securities | | 1,363,109 | | | | 14 | % | | 814,319 | | | | 15 | % | | | | | | 100 | % | | — | % | | — | % | | | | — | % | |
| U.S. government agency and U.S. government-sponsored enterprise mortgage-backed securities | | 4,065,531 | | | | 42 | % | | 2,814,664 | | | | 51 | % | | | | | | 100 | % | | — | % | | — | % | | | | — | % | |
Municipal securities (1) | | 501,489 | | | | 5 | % | | 396,073 | | | | 7 | % | | | | | | 94 | % | | 3 | % | | — | % | | | | 3 | % | |
Non-agency mortgage-backed securities (1) | | 1,366,026 | | | | 14 | % | | 529,617 | | | | 10 | % | | | | | | 88 | % | | — | % | | — | % | | | | 12 | % | |
Corporate debt securities (1) | | 618,671 | | | | 6 | % | | 405,968 | | | | 7 | % | | | | | | — | % | | 23 | % | | 77 | % | | | | — | % | |
Foreign government bonds (1) | | 254,848 | | | | 3 | % | | 182,531 | | | | 3 | % | | | | | | 46 | % | | 54 | % | | — | % | | | | — | % | |
Asset-backed securities (1) | | 76,799 | | | | 1 | % | | 63,231 | | | | 1 | % | | | | | | 100 | % | | — | % | | — | % | | | | — | % | |
Collateralized loan obligations (CLOs) (1) | | 524,809 | | | | 5 | % | | 287,494 | | | | 5 | % | | | | | | 95 | % | | 5 | % | | — | % | | | | — | % | |
| Total AFS debt securities | | $ | 9,713,006 | | | | 100 | % | | $ | 5,544,658 | | | | 100 | % | | | | | | 90 | % | | 3 | % | | 5 | % | | | | 2 | % | |
| |
(1)There were no securities of a single non-federal governmental agency issuer that exceeded 10% of stockholder’s equity as of both September 30, 2021 and December 31, 2020.
(2)Primarily based upon the lowest of the credit ratings issued by Standard and Poor's (“S&P”), Moody’s Investors Service (“Moody’s”) or Fitch Ratings (“Fitch”). Rating percentages are allocated based on fair value.
The fair value of AFS debt securities totaled $9.71 billion as of September 30, 2021, an increase of $4.17 billion or 75% from $5.54 billion as of December 31, 2020. The largest changes came from U.S. government agency and U.S. government-sponsored enterprise mortgage-backed securities, which increased $1.25 billion, followed by U.S. Treasury securities, which increased $891.0 million, and non-agency mortgage-backed securities, which increased $836.4 million.
The Company’s AFS debt securities portfolio had an effective duration, defined as the sensitivity of the value of the portfolio to interest rate changes, of 5.3 as of September 30, 2021. This increased from 4.2 as of December 31, 2020, primarily due to the steepening of the yield curve. As of September 30, 2021, 90% of the carrying value of the Company’s debt securities portfolio was rated “AA-,” “Aa3” or higher by nationally recognized credit rating agencies, compared with 88% as of December 31, 2020. Credit ratings of BBB- or higher by S&P and Fitch, or Baa3 or higher by Moody’s, are considered investment grade.
The Company’s AFS debt securities are carried at fair value with non-credit related unrealized gains and losses, net of tax, reported in Other comprehensive income (loss) on the Consolidated Statement of Comprehensive Income. Pre-tax net unrealized losses on AFS debt securities were $70.2 million as of September 30, 2021, compared with pre-tax net unrealized gains on AFS debt securities of $74.1 million as of December 31, 2020. This change was primarily due to interest rate movement and the widening of liquidity spreads. As of September 30, 2021, the Company had no intention to sell securities with unrealized losses and believed it is more-likely-than-not that it would not be required to sell such securities before recovery of their amortized costs.
Of the securities with gross unrealized losses, substantially all were rated investment grade as of both September 30, 2021 and December 31, 2020, based upon the lowest of the credit ratings issued by S&P, Moody’s, or Fitch. The Company believes that the gross unrealized losses were due to non-credit related factors, and were primarily attributable to yield curve movement. The impact of the COVID-19 pandemic has been reduced by the government’s aggressive monetary policy, including benchmark rate cuts and various relief measures that contributed to the gradual and steady recovery of the market to pre-pandemic levels. The Company believes that the credit support levels of its AFS debt securities are strong and, based on current assessments and macroeconomic forecasts, expects that full contractual cash flows will be received.
The Company assesses individual security for credit losses for each reporting period. If a credit loss is identified, the Company records an impairment related to credit losses through the allowance for credit losses with a corresponding Provision for credit losses on the Consolidated Statement of Income. There were no credit losses recognized in earnings for both the third quarters and first nine months of 2021 and 2020. For a description of the policies, methodologies and judgments used to determine the allowance for credit losses, see Item 7. MD&A — Critical Accounting Policies and Estimates of the Company’s 2020 Form 10-K and Note 1 — Summary of Significant Accounting Policies — Allowance for Credit Losses on Available-for-Sale Debt Securities to the Consolidated Financial Statements of the Company’s 2020 Form 10-K.
The following table presents the weighted-average yields and contractual maturity distribution, excluding periodic principal payments, of the Company’s AFS debt securities as of September 30, 2021 and December 31, 2020. Actual maturities of certain securities can differ from contractual maturities as the borrowers have the right to prepay obligations with or without prepayment penalties. In addition, factors such as prepayments and interest rates may affect the yields on the carrying values of these securities.
| | | | | | | | | | | | | | | | | | | | | | | | | | | | | | | | | | | | | | |
|
| ($ in thousands) | | September 30, 2021 | | December 31, 2020 |
| Amortized
Cost | | Fair
Value | | Yield (1) | | Amortized
Cost | | Fair
Value | | Yield (1) |
AFS debt securities: | | | | | | | | | | | | |
| U.S. Treasury securities: | | | | | | | | | | | | |
Maturing in one year or less | | $ | 25,015 | | | $ | 25,040 | | | 1.27 | % | | $ | 50,310 | | | $ | 50,761 | | | 1.26 | % |
Maturing after one year through five years | | 25,662 | | | 25,466 | | | 0.82 | % | | — | | | — | | | — | % |
Maturing after five years through ten years | | 899,583 | | | 891,218 | | | 0.96 | % | | — | | | — | | | — | % |
| | | | | | | | | | | | |
Total | | 950,260 | | | 941,724 | | | 0.97 | % | | 50,310 | | | 50,761 | | | 1.26 | % |
U.S. government agency and U.S. government- sponsored enterprise debt securities: | | | | | | | | | | | | |
Maturing in one year or less | | 1,210,105 | | | 1,185,286 | | | 1.74 | % | | 640,153 | | | 640,366 | | | 1.78 | % |
Maturing after one year through five years | | 60,608 | | | 60,750 | | | 2.20 | % | | 118,053 | | | 122,012 | | | 2.38 | % |
Maturing after five years through ten years | | 32,372 | | | 32,138 | | | 1.70 | % | | 11,091 | | | 11,697 | | | 2.54 | % |
Maturing after ten years | | 83,151 | | | 84,935 | | | 2.53 | % | | 37,517 | | | 40,244 | | | 2.74 | % |
Total | | 1,386,236 | | | 1,363,109 | | | 1.81 | % | | 806,814 | | | 814,319 | | | 1.92 | % |
U.S. government agency and U.S. government- sponsored enterprise mortgage-backed securities: | | | | | | | | | | | | |
Maturing in one year or less | | 10,438 | | | 10,489 | | | 2.77 | % | | 4,185 | | | 4,232 | | | 3.46 | % |
Maturing after one year through five years | | 18,439 | | | 19,360 | | | 2.78 | % | | 21,566 | | | 22,668 | | | 2.72 | % |
Maturing after five years through ten years | | 305,909 | | | 310,107 | | | 2.32 | % | | 216,332 | | | 222,905 | | | 2.17 | % |
Maturing after ten years | | 3,757,314 | | | 3,725,575 | | | 1.73 | % | | 2,517,644 | | | 2,564,859 | | | 2.11 | % |
Total | | 4,092,100 | | | 4,065,531 | | | 1.78 | % | | 2,759,727 | | | 2,814,664 | | | 2.12 | % |
Municipal securities (2): | | | | | | | | | | | | |
Maturing in one year or less | | 11,641 | | | 11,775 | | | 2.71 | % | | 18,663 | | | 18,868 | | | 3.04 | % |
Maturing after one year through five years | | 37,766 | | | 38,769 | | | 2.65 | % | | 36,000 | | | 37,716 | | | 2.89 | % |
Maturing after five years through ten years | | 238,245 | | | 242,526 | | | 2.21 | % | | 230,851 | | | 239,883 | | | 2.07 | % |
Maturing after ten years | | 213,255 | | | 208,419 | | | 1.99 | % | | 97,059 | | | 99,606 | | | 2.08 | % |
Total | | 500,907 | | | 501,489 | | | 2.16 | % | | 382,573 | | | 396,073 | | | 2.20 | % |
| Non-agency mortgage-backed securities: | | | | | | | | | | | | |
Maturing in one year or less | | 7,920 | | | 7,914 | | | 1.84 | % | | 7,920 | | | 7,920 | | | 0.63 | % |
Maturing after one year through five years | | 164,752 | | | 165,184 | | | 3.10 | % | | 49,704 | | | 49,870 | | | 3.80 | % |
Maturing after five years through ten years | | 53,235 | | | 53,230 | | | 1.15 | % | | 21,332 | | | 21,376 | | | 1.50 | % |
Maturing after ten years | | 1,139,453 | | | 1,139,698 | | | 1.91 | % | | 444,529 | | | 450,451 | | | 2.48 | % |
Total | | 1,365,360 | | | 1,366,026 | | | 2.03 | % | | 523,485 | | | 529,617 | | | 2.48 | % |
| Corporate debt securities: | | | | | | | | | | | | |
Maturing in one year or less | | 180,028 | | | 172,157 | | | 1.80 | % | | 126,250 | | | 124,846 | | | 1.71 | % |
Maturing after one year through five years | | 407,503 | | | 407,906 | | | 3.26 | % | | 276,073 | | | 277,103 | | | 3.56 | % |
Maturing after five years through ten years | | 39,000 | | | 38,608 | | | 2.56 | % | | 4,000 | | | 4,019 | | | 4.50 | % |
| | | | | | | | | | | | |
Total | | 626,531 | | | 618,671 | | | 2.80 | % | | 406,323 | | | 405,968 | | | 2.99 | % |
| Foreign government bonds: | | | | | | | | | | | | |
Maturing in one year or less | | 76,999 | | | 73,487 | | | 1.21 | % | | 45,681 | | | 45,655 | | | 0.85 | % |
Maturing after one year through five years | | 131,120 | | | 131,127 | | | 2.40 | % | | 138,147 | | | 136,876 | | | 2.41 | % |
Maturing after five years through ten years | | 50,000 | | | 50,234 | | | 0.42 | % | | — | | | — | | | — | % |
Total | | 258,119 | | | 254,848 | | | 1.66 | % | | 183,828 | | | 182,531 | | | 2.02 | % |
| Asset-backed securities: | | | | | | | | | | | | |
Maturing after ten years | | 76,417 | | | 76,799 | | | 0.77 | % | | 63,463 | | | 63,231 | | | 0.85 | % |
| | | | | | | | | | | | |
| CLOs: | | | | | | | | | | | | |
Maturing after ten years | | 527,250 | | | 524,809 | | | 1.06 | % | | 294,000 | | | 287,494 | | | 1.34 | % |
Total AFS debt securities | | $ | 9,783,180 | | | $ | 9,713,006 | | | 1.77 | % | | $ | 5,470,523 | | | $ | 5,544,658 | | | 2.13 | % |
| | | | | | | | | | | | |
| Total aggregated by maturities: | | | | | | | | | | | | |
Maturing in one year or less | | $ | 1,522,146 | | | $ | 1,486,148 | | | 1.73 | % | | $ | 893,162 | | | $ | 892,648 | | | 1.72 | % |
Maturing after one year through five years | | 845,850 | | | 848,562 | | | 2.91 | % | | 639,543 | | | 646,245 | | | 3.05 | % |
Maturing after five years through ten years | | 1,618,344 | | | 1,618,061 | | | 1.45 | % | | 483,606 | | | 499,880 | | | 2.12 | % |
Maturing after ten years | | 5,796,840 | | | 5,760,235 | | | 1.71 | % | | 3,454,212 | | | 3,505,885 | | | 2.08 | % |
| Total AFS debt securities | | $ | 9,783,180 | | | $ | 9,713,006 | | | 1.77 | % | | $ | 5,470,523 | | | $ | 5,544,658 | | | 2.13 | % |
|
(1)Weighted-average yields are computed based on amortized cost balances.
(2)Yields on tax-exempt securities are not presented on a tax-equivalent basis.
Loan Portfolio
The Company offers a broad range of financial products designed to meet the credit needs of its borrowers. The Company’s loan portfolio segments include commercial loans, which consist of C&I, CRE, multifamily residential, and construction and land loans; and consumer loans, which consist of single-family residential, home equity lines of credit (“HELOCs”), and other consumer loans. Total net loans were $39.92 billion as of September 30, 2021, an increase of $2.15 billion or 6% from $37.77 billion as of December 31, 2020. This was primarily driven by well-diversified growth across our key loan portfolios including $1.20 billion or 12% in residential mortgage loans, $727.1 million or 5% in total CRE loans, and $199.9 million or 1% in C&I loans. The composition of the loan portfolio was largely similar as of September 30, 2021 and December 31, 2020.
The following table presents the composition of the Company’s total loan portfolio by loan type as of September 30, 2021 and December 31, 2020:
| | | | | | | | | | | | | | | | | | | | | | | | | | | | | | |
|
| ($ in thousands) | | September 30, 2021 | | December 31, 2020 | | |
| Amount | | % | | Amount | | % | | | | |
| Commercial: | | | | | | | | | | | | |
C&I (1) | | $ | 13,831,649 | | | 35 | % | | $ | 13,631,726 | | | 36 | % | | | | |
| CRE: | | | | | | | | | | | | |
| CRE | | 11,818,065 | | | 29 | % | | 11,174,611 | | | 29 | % | | | | |
| Multifamily residential | | 3,340,378 | | | 8 | % | | 3,033,998 | | | 8 | % | | | | |
| Construction and land | | 376,921 | | | 1 | % | | 599,692 | | | 2 | % | | | | |
| Total CRE | | 15,535,364 | | | 38 | % | | 14,808,301 | | | 39 | % | | | | |
| Total commercial | | 29,367,013 | | | 73 | % | | 28,440,027 | | | 75 | % | | | | |
| Consumer: | | | | | | | | | | | | |
| Residential mortgage: | | | | | | | | | | | | |
| Single-family residential | | 9,021,801 | | | 22 | % | | 8,185,953 | | | 21 | % | | | | |
| HELOCs | | 1,963,622 | | | 5 | % | | 1,601,716 | | | 4 | % | | | | |
| Total residential mortgage | | 10,985,423 | | | 27 | % | | 9,787,669 | | | 25 | % | | | | |
| Other consumer | | 129,269 | | | 0 | % | | 163,259 | | | 0 | % | | | | |
| Total consumer | | 11,114,692 | | | 27 | % | | 9,950,928 | | | 25 | % | | | | |
Total loans held-for-investment (2) | | 40,481,705 | | | 100 | % | | 38,390,955 | | | 100 | % | | | | |
Allowance for loan losses | | (560,404) | | | | | (619,983) | | | | | | | |
Loans held-for-sale (3) | | — | | | | | 1,788 | | | | | | | |
| Total loans, net | | $ | 39,921,301 | | | | | $ | 37,772,760 | | | | | | | |
|
(1)Includes $807.3 million and $1.57 billion of PPP loans as of September 30, 2021 and December 31, 2020, respectively.
(2)Includes net deferred loan fees, unearned fees, unamortized premiums and unaccreted discounts of $(54.3) million and $(58.8) million as of September 30, 2021 and December 31, 2020, respectively. Net origination fees related to PPP loans were $(13.5) million and $(12.7) million as of September 30, 2021 and December 31, 2020, respectively.
(3)Consists of single-family residential loans as of December 31, 2020.
Actions to Support Customers during the COVID-19 Pandemic
In response to the COVID-19 pandemic, the Company assisted customers by offering SBA PPP loans in 2020 and 2021 to help struggling businesses in our communities pay their employees and sustain their businesses. The SBA stopped accepting new loan applications on May 31, 2021. For more information on PPP loans, refer to Item 7. MD&A — Overview — Regulatory Developments Relating to the COVID-19 Pandemic — Paycheck Protection Program of the Company’s Form 10-K and Note 1 — Summary of Significant Accounting Policies — Significant Accounting Policies — Paycheck Protection Program to the Consolidated Financial Statements of the Company’s 2020 Form 10-K.
In addition, the Company also provides payment relief through various loan modification programs. For a summary of the loans that the Company has modified in response to the COVID-19 pandemic, refer to Item 2. MD&A — Risk Management — Credit Risk Management in this Form 10-Q.
Commercial
The commercial loan portfolio made up 73% and 75% of total loans as of September 30, 2021 and December 31, 2020, respectively. The Company actively monitors this portfolio for elevated levels of credit risk and reviews credit exposures for sensitivity to changing economic conditions.
Commercial — Commercial and Industrial Loans. Total C&I loan commitments (loans outstanding plus unfunded credit commitments, excluding issued letters of credit) were $19.70 billion and $18.69 billion as of September 30, 2021 and December 31, 2020, respectively, an increase of 5% year-to-date. Total C&I loans were $13.83 billion or 35% of total loans held-for-investment as of September 30, 2021, which grew by $199.9 million or 1% from $13.63 billion or 36% of total loans held-for-investment as of December 31, 2020. The C&I loan portfolio includes loans and financing for businesses in a wide spectrum of industries, including asset-based lending, equipment financing, project-based finance, revolving lines of credit, SBA lending, structured finance, term loans and trade finance. The C&I loan portfolio also includes PPP loans. Additionally, the Company has a portfolio of broadly syndicated C&I loans, which represent revolving or term loan facilities that are marketed and sold primarily to institutional investors, that totaled $962.7 million and $892.1 million as of September 30, 2021 and December 31, 2020, respectively. The majority of the C&I loans have variable interest rates.
The C&I portfolio is well-diversified by industry. The Company monitors concentrations within the C&I loan portfolio by customer exposure and industry classification, setting diversification targets and exposure limits by industry or loan product. The following charts illustrate the industry mix within our C&I portfolio as of September 30, 2021 and December 31, 2020.
Commercial — Commercial Real Estate Loans. Total CRE loans outstanding was $15.54 billion or 38% of total loans held-for-investment as of September 30, 2021, which grew by $727.1 million or 5% from $14.81 billion or 39% of total loans held-for-investment as of December 31, 2020. The total CRE loan portfolio consists of income-producing CRE, multifamily residential, and construction and land loans. Year-to-date growth in total CRE loans was driven by growth in income-producing CRE and multifamily residential loans, partially offset by declines in construction and land loans.
The Company’s total CRE portfolio is granular and diversified by property type. The average CRE loan balance was $2.4 million as of both September 30, 2021 and December 31, 2020. The following table summarizes the Company’s total CRE loan portfolio by property type as of September 30, 2021 and December 31, 2020:
| | | | | | | | | | | | | | | | | | | | | | | | | | |
|
| ($ in thousands) | | September 30, 2021 | | December 31, 2020 |
| Amount | | % | | Amount | | % |
| Property types: | | | | | | | | |
| Retail | | $ | 3,570,761 | | | 23 | % | | $ | 3,466,141 | | | 23 | % |
| Multifamily | | 3,340,378 | | | 21 | % | | 3,033,998 | | | 20 | % |
| Offices | | 2,850,289 | | | 18 | % | | 2,747,082 | | | 19 | % |
| Industrial | | 2,738,653 | | | 18 | % | | 2,407,594 | | | 16 | % |
| Hospitality | | 1,959,192 | | | 13 | % | | 1,888,797 | | | 13 | % |
| Construction and land | | 376,921 | | | 2 | % | | 599,692 | | | 4 | % |
| Other | | 699,170 | | | 5 | % | | 664,997 | | | 5 | % |
| Total CRE loans | | $ | 15,535,364 | | | 100 | % | | $ | 14,808,301 | | | 100 | % |
|
The weighted-average loan-to-value (“LTV”) ratio of the total CRE portfolio was 51% as of both September 30, 2021 and December 31, 2020. The low weighted-average LTV ratio was consistent by CRE property type. Approximately 90% of total CRE loans had an LTV ratio of 65% or lower as of September 30, 2021, compared with 89% as of December 31, 2020. The consistency of the Company’s low LTV underwriting standards has historically resulted in lower credit losses for income-producing CRE and multifamily residential loans.
The following tables provide a summary of the Company’s income-producing CRE, multifamily residential, and construction and land loans by geography as of September 30, 2021 and December 31, 2020. The distribution of the CRE loan portfolio reflects the Company’s geographical footprint, which is primarily concentrated in California:
| | | | | | | | | | | | | | | | | | | | | | | | | | | | | | | | | | | | | | | | | | | | | | | | | | |
|
| ($ in thousands) | | September 30, 2021 |
| CRE | | % | | Multifamily
Residential | | % | | Construction
and Land | | % | | Total CRE | | % |
Geographic markets: | | | | | | | | | | | | | | | | |
Southern California | | $ | 6,273,314 | | | | | $ | 1,977,190 | | | | | $ | 174,483 | | | | | $ | 8,424,987 | | | |
Northern California | | 2,575,357 | | | | | 704,213 | | | | | 117,616 | | | | | 3,397,186 | | | |
| California | | 8,848,671 | | | 75 | % | | 2,681,403 | | | 80 | % | | 292,099 | | | 76 | % | | 11,822,173 | | | 76 | % |
| New York | | 659,068 | | | 6 | % | | 151,393 | | | 5 | % | | 73,076 | | | 19 | % | | 883,537 | | | 6 | % |
| Texas | | 977,865 | | | 8 | % | | 244,963 | | | 7 | % | | 1,907 | | | 1 | % | | 1,224,735 | | | 8 | % |
| Washington | | 383,806 | | | 3 | % | | 98,440 | | | 3 | % | | — | | | — | % | | 482,246 | | | 3 | % |
| Arizona | | 114,522 | | | 1 | % | | 30,280 | | | 1 | % | | — | | | — | % | | 144,802 | | | 1 | % |
| Nevada | | 116,132 | | | 1 | % | | 101,033 | | | 3 | % | | — | | | — | % | | 217,165 | | | 1 | % |
| Other markets | | 718,001 | | | 6 | % | | 32,866 | | | 1 | % | | 9,839 | | | 4 | % | | 760,706 | | | 5 | % |
| Total loans | | $ | 11,818,065 | | | 100 | % | | $ | 3,340,378 | | | 100 | % | | $ | 376,921 | | | 100 | % | | $ | 15,535,364 | | | 100 | % |
|
| | | | | | | | | | | | | | | | | | | | | | | | | | | | | | | | | | | | | | | | | | | | | | | | | | |
|
| ($ in thousands) | | December 31, 2020 |
| CRE | | % | | Multifamily
Residential | | % | | Construction
and Land | | % | | Total CRE | | % |
Geographic markets: | | | | | | | | | | | | | | | | |
Southern California | | $ | 5,884,691 | | | | | $ | 1,867,646 | | | | | $ | 249,282 | | | | | $ | 8,001,619 | | | |
Northern California | | 2,476,510 | | | | | 674,813 | | | | | 197,195 | | | | | 3,348,518 | | | |
| California | | 8,361,201 | | | 75 | % | | 2,542,459 | | | 84 | % | | 446,477 | | | 74 | % | | 11,350,137 | | | 77 | % |
| New York | | 696,712 | | | 6 | % | | 137,114 | | | 4 | % | | 93,806 | | | 16 | % | | 927,632 | | | 6 | % |
| Texas | | 864,639 | | | 8 | % | | 116,367 | | | 4 | % | | 2,581 | | | 0 | % | | 983,587 | | | 7 | % |
| Washington | | 341,374 | | | 3 | % | | 91,824 | | | 3 | % | | 22,724 | | | 4 | % | | 455,922 | | | 3 | % |
| Arizona | | 147,187 | | | 1 | % | | 12,406 | | | 0 | % | | — | | | — | % | | 159,593 | | | 1 | % |
| Nevada | | 88,959 | | | 1 | % | | 86,644 | | | 3 | % | | 22,384 | | | 4 | % | | 197,987 | | | 1 | % |
| Other markets | | 674,539 | | | 6 | % | | 47,184 | | | 2 | % | | 11,720 | | | 2 | % | | 733,443 | | | 5 | % |
| Total loans | | $ | 11,174,611 | | | 100 | % | | $ | 3,033,998 | | | 100 | % | | $ | 599,692 | | | 100 | % | | $ | 14,808,301 | | | 100 | % |
|
Since 76% and 77% of total CRE loans were concentrated in California as of September 30, 2021 and December 31, 2020, respectively, changes in California’s economy and real estate values could have a significant impact on the collectability of these loans and the required level of allowance for loan losses. For additional information related to the risk of real estate markets in California, see Item 1A. Risk Factors — Risks Related to Geopolitical Uncertainties to the Company’s 2020 Form 10-K.
Commercial — Income-Producing Commercial Real Estate Loans. The Company provides financing to experienced real estate investors and developers who have moderate levels of leverage, many of whom are long-time customers of the Bank. Income-producing CRE loans totaled $11.82 billion as of September 30, 2021, compared with $11.17 billion as of December 31, 2020, and accounted for 29% of total loans held-for-investment as of both dates. Interest rates on CRE loans may be fixed, variable or hybrid. Loans are underwritten with conservative standards for cash flows, debt service coverage and LTV.
Owner-occupied properties comprised 20% of the income-producing CRE loans as of both September 30, 2021 and December 31, 2020. The remainder were non-owner-occupied properties, where 50% or more of the debt service for the loan is typically provided by rental income from an unaffiliated third party.
Commercial — Multifamily Residential Loans. The multifamily residential loan portfolio is largely made up of loans secured by residential properties with five or more units. Multifamily residential loans totaled $3.34 billion as of September 30, 2021, compared with $3.03 billion as of December 31, 2020, and accounted for 8% of total loans held-for-investment as of both dates. The Company offers a variety of first lien mortgages, including fixed- and variable-rate loans, as well as hybrid loans with interest rates that adjust annually after an initial fixed-rate period of three to ten years.
Commercial — Construction and Land Loans. Construction and land loans provide financing for a portfolio of projects diversified by real estate property type. These loans totaled $376.9 million or 1% of total loans held-for-investment as of September 30, 2021, compared with $599.7 million or 2% of total loans held-for-investment as of December 31, 2020. Construction loans exposure consisted of $332.7 million in loans outstanding and $306.9 million in unfunded commitments as of September 30, 2021, compared with $554.7 million in loans outstanding and $288.2 million in unfunded commitments as of December 31, 2020. Land loans totaled $44.2 million as of September 30, 2021, compared with $45.0 million as December 31, 2020.
Consumer
The primary consumer portfolios for the Company were single-family residential mortgages and HELOCs, which are summarized by geography as of September 30, 2021 and December 31, 2020:
| | | | | | | | | | | | | | | | | | | | | | | | | | | | | | | | | | | | | | |
|
| ($ in thousands) | | September 30, 2021 |
| Single-Family
Residential | | % | | HELOCs | | % | | Total Residential
Mortgage | | % |
| Geographic markets: | | | | | | | | | | | | |
| Southern California | | $ | 3,531,157 | | | | | $ | 882,500 | | | | | $ | 4,413,657 | | | |
| Northern California | | 1,029,914 | | | | | 465,579 | | | | | 1,495,493 | | | |
| California | | 4,561,071 | | | 50 | % | | 1,348,079 | | | 69 | % | | 5,909,150 | | | 53 | % |
| New York | | 3,000,065 | | | 33 | % | | 280,822 | | | 14 | % | | 3,280,887 | | | 30 | % |
| Washington | | 552,507 | | | 6 | % | | 214,112 | | | 11 | % | | 766,619 | | | 7 | % |
| Massachusetts | | 260,730 | | | 3 | % | | 59,570 | | | 3 | % | | 320,300 | | | 3 | % |
| Texas | | 226,814 | | | 3 | % | | — | | | — | % | | 226,814 | | | 2 | % |
| Georgia | | 281,109 | | | 3 | % | | 22,279 | | | 1 | % | | 303,388 | | | 3 | % |
| Other markets | | 139,505 | | | 2 | % | | 38,760 | | | 2 | % | | 178,265 | | | 2 | % |
| Total | | $ | 9,021,801 | | | 100 | % | | $ | 1,963,622 | | | 100 | % | | $ | 10,985,423 | | | 100 | % |
| Lien priority: | | | | | | | | | | | | |
| First mortgage | | $ | 9,021,801 | | | 100 | % | | $ | 1,725,535 | | | 88 | % | | $ | 10,747,336 | | | 98 | % |
| Junior lien mortgage | | — | | | — | % | | 238,087 | | | 12 | % | | 238,087 | | | 2 | % |
| Total | | $ | 9,021,801 | | | 100 | % | | $ | 1,963,622 | | | 100 | % | | $ | 10,985,423 | | | 100 | % |
|
| | | | | | | | | | | | | | | | | | | | | | | | | | | | | | | | | | | | | | |
|
| ($ in thousands) | | December 31, 2020 |
| Single-Family
Residential | | % | | HELOCs | | % | | Total Residential
Mortgage | | % |
| Geographic markets: | | | | | | | | | | | | |
| Southern California | | $ | 3,462,067 | | | | | $ | 728,733 | | | | | $ | 4,190,800 | | | |
| Northern California | | 1,059,832 | | | | | 354,014 | | | | | 1,413,846 | | | |
| California | | 4,521,899 | | | 55 | % | | 1,082,747 | | | 68 | % | | 5,604,646 | | | 57 | % |
| New York | | 2,277,722 | | | 28 | % | | 244,425 | | | 15 | % | | 2,522,147 | | | 26 | % |
| Washington | | 597,231 | | | 7 | % | | 180,765 | | | 11 | % | | 777,996 | | | 8 | % |
| Massachusetts | | 259,368 | | | 3 | % | | 44,633 | | | 3 | % | | 304,001 | | | 3 | % |
| Texas | | 209,737 | | | 3 | % | | — | | | — | % | | 209,737 | | | 2 | % |
| | | | | | | | | | | | |
| Other markets | | 319,996 | | | 4 | % | | 49,146 | | | 3 | % | | 369,142 | | | 4 | % |
| Total | | $ | 8,185,953 | | | 100 | % | | $ | 1,601,716 | | | 100 | % | | $ | 9,787,669 | | | 100 | % |
| Lien priority: | | | | | | | | | | | | |
| First mortgage | | $ | 8,185,953 | | | 100 | % | | $ | 1,372,270 | | | 86 | % | | $ | 9,558,223 | | | 98 | % |
| Junior lien mortgage | | — | | | — | % | | 229,446 | | | 14 | % | | 229,446 | | | 2 | % |
| Total | | $ | 8,185,953 | | | 100 | % | | $ | 1,601,716 | | | 100 | % | | $ | 9,787,669 | | | 100 | % |
|
Consumer — Single-Family Residential Mortgages. Single-family residential loans totaled $9.02 billion or 22% of total loans held-for-investment as of September 30, 2021, compared with $8.19 billion or 21% of total loans held-for-investment as of December 31, 2020. Year-to-date single-family residential mortgages grew by $835.8 million or 10%, primarily driven by net growth in New York. The Company was in a first lien position for all of its single-family residential loans as of both September 30, 2021 and December 31, 2020. Many of these loans are reduced documentation loans, for which a substantial down payment is required, resulting in a low LTV ratio at origination, typically 65% or less. These loans have historically experienced low delinquency and loss rates. The Company offers a variety of single-family residential first lien mortgage loan programs, including fixed- and variable-rate loans, as well as hybrid loans with interest rates that adjust annually after an initial fixed-rate period.
Consumer — Home Equity Lines of Credit. Total HELOC commitments were $2.23 billion as of September 30, 2021, which grew by $478.3 million or 27% from $1.75 billion as of December 31, 2020. Unfunded HELOC commitments are unconditionally cancellable. HELOCs outstanding totaled $1.96 billion or 5% of total loans held-for-investment as of September 30, 2021, compared with $1.60 billion or 4% of total loans held-for-investment as of December 31, 2020. Year-to-date HELOCs increased by $361.9 million or 23%, primarily driven by growth in California. The Company was in a first lien position for 88% and 86% of total HELOCs as of September 30, 2021 and December 31, 2020, respectively. Many of these loans are reduced documentation loans, for which a substantial down payment is required, resulting in a low LTV ratio at origination, typically 60% or less. These loans have historically experienced low delinquency and loss rates. Substantially all of the Company’s HELOCs were variable-rate loans.
All commercial and consumer loans originated by the Company are subject to the Company’s underwriting guidelines and loan origination standards. Management believes that the Company’s underwriting criteria and procedures adequately consider the unique risks associated with these products. The Company conducts a variety of quality control procedures and periodic audits, including the review of lending and legal requirements, to ensure that the Company is compliant with these requirements.
Loans Held-for-Sale
As of September 30, 2021, the Company had no loans held-for-sale. In comparison, as of December 31, 2020, loans held-for-sale of $1.8 million consisted of single-family residential loans. At the time of commitment to originate or purchase a loan, a loan is determined to be held-for-investment if it is the Company’s intent to hold the loan to maturity or for the foreseeable future, subject to periodic reviews under the Company’s evaluation processes, including liquidity and credit risk management. If the Company subsequently changes its intent to hold certain loans, those loans are transferred from held-for-investment to held-for-sale at the lower of cost or fair value.
Sales of Originated Loans and Purchased Loans
All loans originated by the Company are underwritten pursuant to the Company’s policies and procedures. Although the Company’s primary focus is on directly originated loans, in certain circumstances, the Company also purchases loans and participates in loans with other banks. In the normal course of business, the Company also participates out interests in directly originated commercial loans to other financial institutions and sells loans.
The following tables provide information on loan sales during the third quarters and first nine months of 2021 and 2020. Refer to Note 6 — Loans Receivable and Allowance for Credit Losses to the Consolidated Financial Statements in this Form 10-Q for additional information on loan purchases and transfers.
| | | | | | | | | | | | | | | | | | | | | | | | | | | | | | | | | | | | | |
|
| ($ in thousands) | | Three Months Ended September 30, 2021 |
| Commercial | | Consumer | | | | | Total |
| C&I | | Total CRE | | Residential Mortgage | | | | |
| | CRE | | | | Construction
and Land | | Single-Family Residential | | | |
| | | | | | | | | | | | | | | |
| | | | | | | | | | | | | | | |
| | | | | | | | | | | | | | | |
| Loans sold: | | | | | | | | | | | | | | | |
| Originated loans: | | | | | | | | | | | | | | | |
| Amount | | $ | 92,372 | | | $ | 24,120 | | | | | $ | 19,900 | | | $ | 6,959 | | | | | | $ | 143,351 | |
| Net gains | | $ | 161 | | | $ | 3,107 | | | | | $ | — | | | $ | 46 | | | | | | $ | 3,314 | |
| | | | | | | | | | | | | | | |
| Purchased loans: | | | | | | | | | | | | | | | |
| Amount | | $ | 26,479 | | | $ | — | | | | | $ | — | | | $ | — | | | | | | $ | 26,479 | |
| Net gains | | $ | 15 | | | $ | — | | | | | $ | — | | | $ | — | | | | | | $ | 15 | |
| | | | | | | | | | | | | | | |
|
| | | | | | | | | | | | | | | | | | | | | | | | | | | | | | |
|
| ($ in thousands) | | Three Months Ended September 30, 2020 |
| Commercial | | | | | | | | Consumer | | Total |
| C&I | | | | | | | | Residential Mortgage | | | |
| | | | | | | | Single-Family Residential | | | | |
| | | | | | | | | | | | | | | | |
| | | | | | | | | | | | | | | | |
| | | | | | | | | | | | | | | | |
| Loans sold: | | | | | | | | | | | | | | | | |
| Originated loans: | | | | | | | | | | | | | | | | |
| Amount | | $ | 80,457 | | | | | | | | | $ | 31,847 | | | | | | | $ | 112,304 | |
| Net gains | | $ | — | | | | | | | | | $ | 361 | | | | | | | $ | 361 | |
| | | | | | | | | | | | | | | | |
| Purchased loans: | | | | | | | | | | | | | | | | |
Amount (1) | | $ | 11,780 | | | | | | | | | $ | — | | | | | | | $ | 11,780 | |
| | | | | | | | | | | | | | | | |
| | | | | | | | | | | | | | | | |
|
| | | | | | | | | | | | | | | | | | | | | | | | | | | | | | | | | | | | | |
|
| ($ in thousands) | | Nine Months Ended September 30, 2021 |
| Commercial | | Consumer | | | | | Total |
| C&I | | Total CRE | | Residential Mortgage | | | | |
| | CRE | | | | Construction
and Land | | Single-Family Residential | | | |
| | | | | | | | | | | | | | | |
| | | | | | | | | | | | | | | |
| | | | | | | | | | | | | | | |
| Loans sold: | | | | | | | | | | | | | | | |
| Originated loans: | | | | | | | | | | | | | | | |
| Amount | | $ | 243,729 | | | $ | 61,171 | | | | | $ | 19,900 | | | $ | 17,123 | | | | | | $ | 341,923 | |
| Net gains | | $ | 557 | | | $ | 5,609 | | | | | $ | — | | | $ | 326 | | | | | | $ | 6,492 | |
| | | | | | | | | | | | | | | |
| Purchased loans: | | | | | | | | | | | | | | | |
| Amount | | $ | 85,504 | | | $ | — | | | | | $ | — | | | $ | — | | | | | | $ | 85,504 | |
| Net gains | | $ | 109 | | | $ | — | | | | | $ | — | | | $ | — | | | | | | $ | 109 | |
| | | | | | | | | | | | | | | |
|
| | | | | | | | | | | | | | | | | | | | | | | | | | | | | | | | | | |
|
| ($ in thousands) | | Nine Months Ended September 30, 2020 |
| Commercial | | Consumer | | Total |
| C&I | | Total CRE | | Residential Mortgage | | | |
| | CRE | | | | | | Single-Family Residential | | | | |
| | | | | | | | | | | | | | | | |
| | | | | | | | | | | | | | | | |
| | | | | | | | | | | | | | | | |
| Loans sold: | | | | | | | | | | | | | | | | |
| Originated loans: | | | | | | | | | | | | | | | | |
| Amount | | $ | 237,115 | | | $ | 7,250 | | | | | | | $ | 50,197 | | | | | | | $ | 294,562 | |
| Net gains | | $ | 235 | | | $ | 665 | | | | | | | $ | 543 | | | | | | | $ | 1,443 | |
| | | | | | | | | | | | | | | | |
| Purchased loans: | | | | | | | | | | | | | | | | |
Amount (1) | | $ | 11,780 | | | $ | — | | | | | | | $ | — | | | | | | | $ | 11,780 | |
| | | | | | | | | | | | | | | | |
| | | | | | | | | | | | | | | | |
|
(1)Net gains on sales of purchased loans were insignificant or none.
Foreign Outstandings
The Company’s overseas offices, which include the branch in Hong Kong and the subsidiary bank in China, are subject to the general risks inherent in conducting business in foreign countries, such as regulatory risk and economic and political uncertainties. In addition, the Company’s financial assets held in the Hong Kong branch and the subsidiary bank in China may be affected by fluctuations in currency exchange rates or other factors. The Company’s international operation risk exposure is largely concentrated in these locations. The following table presents the major financial assets held in the Company’s overseas offices as of September 30, 2021 and December 31, 2020:
| | | | | | | | | | | | | | | | | | | | | | | | | | |
|
| ($ in thousands) | | September 30, 2021 | | December 31, 2020 |
| Amount | | % of Total
Consolidated
Assets | | Amount | | % of Total
Consolidated
Assets |
| Hong Kong branch: | | | | | | | | |
| Cash and cash equivalents | | $ | 624,855 | | | 1 | % | | $ | 647,883 | | | 1 | % |
| | | | | | | | |
AFS debt securities, at fair value (1) | | $ | 266,163 | | | 0 | % | | $ | 66,170 | | | 0 | % |
Loans held-for-investment (2) | | $ | 843,787 | | | 1 | % | | $ | 704,415 | | | 1 | % |
| Total assets | | $ | 1,747,329 | | | 3 | % | | $ | 1,426,479 | | | 3 | % |
| Subsidiary bank in China: | | | | | | | | |
| Cash and cash equivalents | | $ | 499,078 | | | 1 | % | | $ | 611,088 | | | 1 | % |
| Interest-bearing deposits with banks | | $ | 119,913 | | | 0 | % | | $ | 74,079 | | | 0 | % |
AFS debt securities (3) | | $ | 138,864 | | | 0 | % | | $ | 152,219 | | | 0 | % |
Loans held-for-investment (2) | | $ | 897,511 | | | 1 | % | | $ | 796,153 | | | 2 | % |
| Total assets | | $ | 1,639,312 | | | 3 | % | | $ | 1,634,896 | | | 3 | % |
|
(1)Comprised of U.S. Treasury securities, corporate debt securities and foreign government bonds as of September 30, 2021; comprised of U.S. Treasury securities and foreign government bonds as of December 31, 2020.
(2)Primarily comprised of C&I loans as of both September 30, 2021 and December 31, 2020.
(3)Comprised of foreign government bonds as of both September 30, 2021 and December 31, 2020.
The following table presents the total revenue generated by the Company’s overseas offices for the third quarters and first nine months of 2021 and 2020:
| | | | | | | | | | | | | | | | | | | | | | | | | | | | | | | | | | | | | | | | | | | | | | | | | | |
|
| ($ in thousands) | | Three Months Ended September 30, | | Nine Months Ended September 30, |
| 2021 | | 2020 | | 2021 | | 2020 |
| Amount | | % of Total
Consolidated
Revenue | | Amount | | % of Total
Consolidated
Revenue | | Amount | | % of Total
Consolidated
Revenue | | Amount | | % of Total
Consolidated
Revenue |
Hong Kong branch: | | | | | | | | | | | | | | | | |
| Total revenue | | $ | 5,912 | | | 1 | % | | $ | 4,967 | | | 1 | % | | $ | 18,252 | | | 1 | % | | $ | 19,157 | | | 2 | % |
Subsidiary bank in China: | | | | | | | | | | | | | | | | |
| Total revenue | | $ | 7,592 | | | 2 | % | | $ | 3,859 | | | 1 | % | | $ | 20,271 | | | 2 | % | | $ | 16,644 | | | 1 | % |
|
Capital
The Company maintains a strong capital base to support its anticipated asset growth, operating needs and credit risks, and to ensure that the Company and the Bank are in compliance with applicable regulatory capital requirements. The Company regularly conducts capital planning, at a minimum on an annual basis, to optimize the use of available capital, to appropriately plan for future capital needs, and to allocate capital to existing and future business activities. Furthermore, the Company performs capital stress tests as part of its capital planning process. The stress tests enable the Company to assess the impact of adverse changes in the economy and interest rates on its capital base.
In March 2020, the Company’s Board of Directors authorized the repurchase of up to $500.0 million of the Company’s common stock. This $500.0 million repurchase authorization was inclusive of the Company’s $100.0 million stock repurchase authorization previously outstanding. The Company determines the timing and amount of stock repurchases, based on its assessment of various factors, including prevailing market conditions, alternate uses of capital, liquidity and the economic environment. During the first quarter of 2020, the Company repurchased 4,471,682 shares at an average price of $32.64 per share for a total cost of $146.0 million. The Company did not repurchase any shares during the remainder of 2020 or in the first nine months of 2021. As of September 30, 2021, the total remaining available capital authorized for repurchase was $354.0 million.
The Company’s stockholders’ equity was $5.69 billion as of September 30, 2021, an increase of $421.0 million or 8% from $5.27 billion as of December 31, 2020. The increase in the Company’s stockholders’ equity was primarily due to net income of $655.2 million for the first nine months of 2021, partially offset by cash dividends declared of $142.3 million and an increase in other comprehensive loss of $101.9 million during the first nine months of 2021. For other factors that contributed to the changes in stockholders’ equity, refer to Item 1. Consolidated Financial Statements — Consolidated Statement of Changes in Stockholders’ Equity in this Form 10-Q.
Book value was $40.10 per common share as of September 30, 2021, an increase of 8% from $37.22 per common share as of December 31, 2020. The Company paid a quarterly cash dividends of $0.33 and $0.275 per common share for the third quarters of 2021 and 2020, respectively. In October 2021, the Company’s Board of Directors declared fourth quarter 2021 cash dividends of $0.33 per common share. The dividend is payable on November 15, 2021 to stockholders of record as of November 1, 2021.
Deposits and Other Sources of Funds
Deposits are the Company’s primary source of funding, the cost of which has a significant impact on the Company’s net interest income and net interest margin. Additional funding is provided by short- and long-term borrowings, and long-term debt. See Item 2. MD&A — Risk Management — Liquidity Risk Management — Liquidity in this Form 10-Q for a discussion of the Company’s liquidity management. The following table summarizes the Company’s sources of funds as of September 30, 2021 and December 31, 2020:
| | | | | | | | | | | | | | | | | | | | | | | | | | | | | | | | | | | | | | |
|
| ($ in thousands) | | September 30, 2021 | | December 31, 2020 | | Change |
| Amount | | % | | Amount | | % | | $ | | % |
| Deposits | | | | | | | | | | | | |
| | | | | | | | | | | | |
| Noninterest-bearing demand | | $ | 23,175,471 | | | 44 | % | | $ | 16,298,301 | | | 36 | % | | $ | 6,877,170 | | | 42 | % |
| Interest-bearing checking | | 6,530,601 | | | 12 | % | | 6,142,193 | | | 14 | % | | 388,408 | | | 6 | % |
| Money market | | 12,555,879 | | | 24 | % | | 10,740,667 | | | 24 | % | | 1,815,212 | | | 17 | % |
| Savings | | 2,855,597 | | | 5 | % | | 2,681,242 | | | 6 | % | | 174,355 | | | 7 | % |
| | | | | | | | | | | | |
| | | | | | | | | | | | |
| | | | | | | | | | | | |
| | | | | | | | | | | | |
| Time deposits | | 8,238,642 | | | 15 | % | | 9,000,349 | | | 20 | % | | (761,707) | | | (8) | % |
| Total deposits | | $ | 53,356,190 | | | 100 | % | | $ | 44,862,752 | | | 100 | % | | $ | 8,493,438 | | | 19 | % |
| Other Funds | | | | | | | | | | | | |
| Short-term borrowings | | $ | — | | | | | $ | 21,009 | | | | | $ | (21,009) | | | (100) | % |
| | | | | | | | | | | | |
| FHLB advances | | 248,898 | | | | | 652,612 | | | | | (403,714) | | | (62) | % |
| Repurchase agreements | | 300,000 | | | | | 300,000 | | | | | — | | | — | % |
| Long-term debt | | 147,586 | | | | | 147,376 | | | | | 210 | | | 0 | % |
| Total other funds | | $ | 696,484 | | | | | $ | 1,120,997 | | | | | $ | (424,513) | | | (38) | % |
| Total sources of funds | | $ | 54,052,674 | | | | | $ | 45,983,749 | | | | | $ | 8,068,925 | | | 18 | % |
|
Deposits
The Company offers a wide variety of deposit products to consumer and commercial customers. To provide a stable and low-cost source of funding and liquidity, the Company’s strategy is to grow and retain relationship-based deposits.
Total deposits were $53.36 billion as of September 30, 2021, an increase of $8.49 billion or 19% from $44.86 billion as of December 31, 2020. Deposit growth was attributable to strong growth in non-maturity deposits partially offset by a reduction in higher-cost time deposits, from both commercial and consumer customers. The strongest growth was in noninterest-bearing demand deposits, which grew by $6.88 billion or 42% from December 31, 2020. Noninterest-bearing demand deposits were $23.18 billion or 44% of total deposits as of September 30, 2021, up from $16.30 billion or 36% of total deposits as of December 31, 2020. Additional information regarding the impact of deposits on net interest income, with a comparison of average deposit balances and rates, is provided in Item 2. MD&A — Results of Operations — Net Interest Income in this Form 10-Q.
Other Sources of Funding
There were no short-term borrowings as of September 30, 2021. Short-term borrowings of $21.0 million as of December 31, 2020 consisted of borrowings entered into by the Company’s subsidiary, East West Bank (China) Limited.
FHLB advances were $248.9 million as of September 30, 2021, a decrease of $403.7 million from $652.6 million as of December 31, 2020. As of September 30, 2021, FHLB advances had floating interest rates ranging from 0.52% to 0.56% and remaining maturities between five months and 1.1 years.
Gross repurchase agreements totaled $300.0 million as of both September 30, 2021 and December 31, 2020. Resale and repurchase agreements are reported net, pursuant to ASC 210-20-45-11, Balance Sheet Offsetting: Repurchase and Reverse Repurchase Agreements. As of both September 30, 2021 and December 31, 2020, the Company did not have any gross resale agreements that were eligible for netting. As of September 30, 2021, gross repurchase agreements had interest rates ranging from 2.35% to 2.40%, with original terms between 4.0 years and 8.5 years and remaining maturities between 1.8 years and 1.9 years.
Repurchase agreements are accounted for as collateralized financing transactions and recorded as liabilities based on the values at which the assets are sold. As of September 30, 2021, the collateral for the repurchase agreements was comprised of U.S. Treasury securities, and U.S. government agency and U.S. government-sponsored enterprise mortgage-backed securities. To ensure the market value of the underlying collateral remains sufficient, the Company monitors the fair value of collateral pledged relative to the principal amounts borrowed under the repurchase agreements. The Company manages liquidity risks related to the repurchase agreements by sourcing funds from a diverse group of counterparties, and entering into repurchase agreements with longer durations, when appropriate. For additional details, see Note 3 — Assets Purchased under Resale Agreements and Sold under Repurchase Agreements to the Consolidated Financial Statements in this Form 10-Q.
The Company uses long-term debt to provide funding to acquire interest-earning assets, and to enhance liquidity and regulatory capital adequacy. Long-term debt totaled $147.6 million and $147.4 million as of September 30, 2021 and December 31, 2020, respectively. Long-term debt consists of junior subordinated debt, which qualifies as Tier 2 capital for regulatory capital purposes. The junior subordinated debt was issued in connection with the Company’s various pooled trust preferred securities offerings, as well as with common stock issued by the six wholly-owned subsidiaries of the Company in conjunction with these offerings. The junior subordinated debt had a weighted-average interest rate of 1.74% and 2.41% for the first nine months of 2021 and 2020, respectively, with remaining maturities ranging between 13.2 years and 16.0 years as of September 30, 2021.
Regulatory Capital and Ratios
The federal banking agencies have risk-based capital adequacy requirements intended to ensure that banking organizations maintain capital that is commensurate with the degree of risk associated with a banking organization’s operations. The Company and the Bank are subject to regulatory capital adequacy requirements. The Bank is a member bank of the Federal Reserve System and is primarily regulated by the Federal Reserve and the California Department of Financial Protection and Innovation (“DFPI”). The Company and the Bank are required to comply with the Basel III Capital Rules adopted by the federal banking agencies. Both the Company and the Bank are standardized approach institutions under Basel III Capital Rules. See Item 1. Business — Supervision and Regulation — Regulatory Capital Requirements and — Recent Regulatory Capital-Related Development of the Company’s 2020 Form 10-K for additional details.
The Company adopted Accounting Standards Update (“ASU”) 2016-13 on January 1, 2020. The Company has elected the phase-in option provided by the regulatory guidance, which delays the estimated impact of Current Expected Credit Losses (“CECL”) on regulatory capital for two years and phases the impact over three years. As a result, the effects of CECL on the Company’s and the Bank’s regulatory capital will be delayed through the year 2021, after which the effects will be phased-in over a three-year period from January 1, 2022 through December 31, 2024. In April 2020, in recognition of the CARES Act requirements, and to facilitate the use of the PPPLF, the U.S. banking agencies issued an interim final rule that banking organizations may exclude from leverage and risk-based capital requirements any eligible assets sold or pledged to the Federal Reserve on a non-recourse basis as part of the PPPLF. In addition, under the CARES Act, loans originated by a banking organization under the PPP (whether or not sold or pledged in the PPPLF) will be risk-weighted at zero percent for regulatory capital purposes. Accordingly, the September 30, 2021 capital ratios exclude the impact of the increased allowance for loan losses due to CECL, and PPP loans are risk-weighted at zero percent. As of September 30, 2021, the Company did not have any PPPLF outstanding. Accordingly, there were no PPP loans pledged as collateral. The PPPLF ceased extending credit on July 30, 2021.
The following table presents the Company’s and the Bank’s capital ratios as of September 30, 2021 and December 31, 2020 under the Basel III Capital Rules, and those required by regulatory agencies for capital adequacy and well-capitalized classification purposes:
| | | | | | | | | | | | | | | | | | | | | | | | | | | | | | | | | | | | | | | | | | | | | | |
|
| | Basel III Capital Rules | | |
| September 30, 2021 | | December 31, 2020 | | Minimum
Regulatory
Requirements | | Fully Phased-in Minimum Regulatory Requirements (2) | | Well-
Capitalized
Requirements | | |
| Company | | East West
Bank | | Company | | East West
Bank | | | | |
| Risk-based capital ratios: | | | | | | | | | | | | | | | | |
CET1 capital (1) | | 12.8 | % | | 12.3 | % | | 12.7 | % | | 12.1 | % | | 4.5 | % | | 7.0 | % | | 6.5 | % | | |
| Tier 1 capital | | 12.8 | % | | 12.3 | % | | 12.7 | % | | 12.1 | % | | 6.0 | % | | 8.5 | % | | 8.0 | % | | |
| Total capital | | 14.2 | % | | 13.3 | % | | 14.3 | % | | 13.4 | % | | 8.0 | % | | 10.5 | % | | 10.0 | % | | |
Tier 1 leverage (1) | | 8.8 | % | | 8.5 | % | | 9.4 | % | | 9.0 | % | | 4.0 | % | | 4.0 | % | | 5.0 | % | | |
|
(1)The CET1 capital and Tier 1 leverage components of the “well-capitalized” requirements apply only to the Bank since there is no CET1 or Tier 1 leverage ratio component in the regulatory definition of a well-capitalized bank-holding company. In addition, the Tier 1 risk-based capital ratio requirement for the Company to be considered well-capitalized is 6.0%.
(2)As of January 1, 2019, the 2.5% capital conservation buffer above the minimum risk-based capital ratios was required in order to avoid limitations on distributions, including dividend payments and certain discretionary bonus payments to executive officers.
The Company is committed to maintaining strong capital levels to assure the Company’s investors, customers and regulators that the Company and the Bank are financially sound. As of September 30, 2021 and December 31, 2020, both the Company and the Bank continued to exceed all “well-capitalized” capital requirements and the fully phased-in required minimum capital requirements under the Basel III Capital Rules. Total risk-weighted assets were $42.13 billion as of September 30, 2021, an increase of $3.72 billion or 10% from $38.41 billion as of December 31, 2020. The increase in the risk-weighted assets was primarily due to loan growth and increased AFS debt securities.
Other Matters
London Interbank Offered Rate Transition
On March 5, 2021, the United Kingdom’s Financial Conduct Authority (“FCA”) confirmed that the one-week and two-month U.S. dollar (“USD”) London Interbank Offered Rate (“LIBOR”) settings will permanently cease following the LIBOR publication on December 31, 2021, and that the overnight, one-month, three-month, six-month and 12-month USD LIBOR settings will permanently cease following the LIBOR publication on June 30, 2023. The federal banking agencies have continued to encourage banks to cease entering into new contracts that use USD LIBOR as a reference rate as soon as practicable and in any event by December 31, 2021. The Alternative Reference Rates Committee (“ARRC”) has proposed the Secured Overnight Financing Rate (“SOFR”) as its preferred alternative to LIBOR, although the adoption of SOFR remains voluntary. The ARRC has also formally recommended the CME Group’s forward-looking SOFR term rates. The ARRC supports the use of SOFR term rates for business loan activity and continues to recommend using forms of overnight and averages of SOFR where possible. On October 6, 2021, the ARRC released a summary of its spread-adjusted fallback recommendations for contracts referencing USD LIBOR.
A majority of the Company’s LIBOR-based loans, derivatives, debt securities, resale agreements, junior subordinated debt and repurchase agreements are indexed to LIBOR tenors that will cease to be published after June 30, 2023. The volume of the Company’s LIBOR-based products that mature after June 30, 2023 is significant and, if not sufficiently planned for, the discontinuation of LIBOR could result in financial, operational, legal, reputational or compliance risks to the Company.
The transition is anticipated to span several reporting periods through mid-2023 with the confirmed LIBOR cessation dates. The Company created a cross-functional team to manage the communication of the Company’s transition plans with both internal and external stakeholders and to ensure that the Company appropriately updates its business processes, analytical tools, information systems and contract language to minimize disruptions during and after the LIBOR transition. The Company has taken steps to transition LIBOR contracts maturing after the LIBOR cessation dates to alternative rates. Beginning in the fourth quarter of 2021, the Company will no longer extend new LIBOR-based loans as a primary offering to customers. The Company will offer new variable rate loans based on alternative reference rates. For additional information related to the potential impact surrounding the transition from LIBOR on the Company’s business, see Item 1A. Risk Factors in the Company’s 2020 Form 10-K.
Off-Balance Sheet Arrangements
In the ordinary course of the Company’s business, the Company may enter into or be a party to transactions that are not recorded on the Consolidated Balance Sheet and are considered to be off-balance sheet arrangements. Off-balance sheet arrangements are any contractual arrangements to which a nonconsolidated entity is a party and under which the Company has: (1) any obligation under a guarantee contract; (2) a retained or contingent interest in assets transferred to an unconsolidated entity or similar arrangement that serves as credit, liquidity or market risk support to that entity for such assets; (3) any obligation under certain derivative instruments; or (4) any obligation under a material variable interest held by the Company in a nonconsolidated entity that provides financing, liquidity, market risk or credit risk support to the Company, or engages in leasing, hedging or research and development services with the Company.
Commitments to Extend Credit
As a financial service provider, the Company routinely enters into commitments to extend credit such as loan commitments, commercial letters of credit for foreign and domestic trade, standby letters of credit (“SBLCs”) and financial guarantees to meet the financing needs of its customers. Many of these commitments to extend credit may expire without being drawn upon. The credit policies used in underwriting loans to customers are also used to extend these commitments. Under some of these contractual agreements, the Company may also have liabilities contingent upon the occurrence of certain events. The Company’s liquidity sources have been, and are expected to be, sufficient to meet the cash requirements of its lending activities.
Guarantees
In the ordinary course of business, the Company periodically enters into various guarantee agreements in which the Company sells or securitizes loans with recourse. Under these guarantee arrangements, the Company is contingently obligated to repurchase the recourse component of the loans when the loans default.
Further information and discussion about the Company’s loan commitments, commercial letters of credit, SBLCs, guarantees, and significant contractual arrangements under which the Company may be held contingently liable is included in Note 9 — Commitments and Contingencies to the Consolidated Financial Statements in this Form 10-Q. In addition, the Company has commitments and obligations under post-retirement benefit plans as described in Note 14 — Employee Benefit Plans to the Consolidated Financial Statements of the Company’s 2020 Form 10-K, and has contractual obligations for future payments on debts, borrowings and lease obligations as detailed in Item 7. MD&A — Off-Balance Sheet Arrangements and Contractual Obligations of the Company’s 2020 Form 10-K.
Risk Management
Overview
In conducting its businesses, the Company is exposed to a variety of risks, some of which are inherent to the financial services industry and others of which are more specific to the Company’s businesses. The Company operates under a Board-approved Enterprise Risk Management (“ERM”) framework, which outlines the company-wide approach to risk management and oversight, and describes the structures and practices employed to manage the current and emerging risks inherent to the Company. The Company’s ERM program incorporates risk management throughout the organization in identifying, managing, monitoring, and reporting risks. It identifies the Company’s major risk categories as credit risk; liquidity risk; capital risk; market risk; operational risk; compliance and regulatory risks; legal risks; strategic risks; and reputational risks.
The Risk Oversight Committee of the Board of Directors monitors the ERM program through stated risk categories and provides oversight of the Company’s risk appetite and control environment. The Risk Oversight Committee provides focused oversight of the Company’s identified enterprise risk categories on behalf of the full Board of Directors. Under the direction of the Risk Oversight Committee, management committees apply targeted strategies to reduce the risks to which the Company’s operations are exposed.
The Company’s ERM program is executed along the three lines of defense model, which provides for a consistent and standardized risk management control environment across the enterprise. The first line of defense is comprised of production, operational, and support units. The second line of defense is comprised of various risk management and control functions charged with monitoring and managing specific major risk categories and/or risk subcategories. The third line of defense is comprised of the Internal Audit function and Independent Asset Review. Internal Audit provides assurance and evaluates the effectiveness of risk management, control and governance processes as established by the Company. Internal Audit has organizational independence and objectivity, reporting directly to the Board’s Audit Committee. Further discussion and analysis of each major risk area are included in the following sub-sections of Risk Management.
Credit Risk Management
Credit risk is the risk that a borrower or counterparty will fail to perform according to the terms and conditions of a loan or investment and expose the Company to loss. Credit risk exists with many of the Company’s assets and exposures such as loans and certain derivatives. The majority of the Company’s credit risk is associated with lending activities.
The Risk Oversight Committee has primary responsibility for overseeing enterprise risk categories including credit risk. The Risk Oversight Committee monitors management’s assessment of asset quality and credit risk trends, credit quality administration and underwriting standards, as well as portfolio credit risk management strategies and processes, such as diversification and concentration limits, all of which enable management to control credit risk. At the management level, the Credit Risk Management Committee has primary oversight responsibility for credit risk. The Senior Credit Supervision function manages credit policy and provides the resources to manage the line of business transactional credit risk, assuring that all exposure is risk-rated according to the requirements of the credit risk rating policy. The Senior Credit Supervision function evaluates and reports the overall credit risk exposure to senior management and the Risk Oversight Committee. The Independent Asset Review function reports directly to the Board’s Risk Oversight Committee and supports a strong credit risk management culture by providing an independent and objective assessment of underwriting and asset quality of the loan portfolio. A key focus of the Company’s credit risk management is adherence to a well-controlled underwriting process.
The Company assesses the overall credit quality performance of the loan held-for-investment portfolio through an integrated analysis of specific performance ratios. This approach forms the basis of the discussion in the sections immediately following: Credit Quality, Nonperforming Assets, Troubled Debt Restructurings (“TDRs”) and Allowance for Credit Losses.
Credit Quality
The Company utilizes a credit risk rating system to assist in monitoring credit quality. Loans are evaluated using the Company’s internal credit risk rating of one through ten. Loans risk rated one through five are assigned an internal risk rating category of “Pass.” Loans assigned with a credit risk rating of six have potential weaknesses that warrant closer attention by management and are assigned an internal risk rating category of “Special mention.” Loans assigned a credit risk rating of seven or eight have well-defined weaknesses that may jeopardize the full and timely repayment of the loan; these are assigned an internal risk rating category of “Substandard.” Loans assigned a credit risk rating of nine have insufficient sources of repayment and a high probability of loss; these are assigned an internal risk rating category of “Doubtful.” Loans assigned a credit risk rating of ten are uncollectible and of such little value that they are no longer considered bankable assets; these are assigned an internal risk rating category of “Loss.” Exposures categorized as criticized consist of “Special mention,” “Substandard,” “Doubtful” and “Loss” categories. Exposures categorized as classified consist of “Substandard,” “Doubtful” and “Loss” categories. For more information on credit quality indicators, refer to Note 6 — Loans Receivable and Allowance for Credit Losses to the Consolidated Financial Statements in this Form 10-Q.
The following table presents the Company’s criticized loans as of September 30, 2021 and December 31, 2020:
| | | | | | | | | | | | | | | | | | | | | | | | | | |
|
| ($ in thousands) | | | | | | Change |
| September 30, 2021 | | December 31, 2020 | | $ | | % |
| Criticized loans | | | | | | | | |
| | | | | | | | |
| | | | | | | | |
| | | | | | | | |
| | | | | | | | |
| | | | | | | | |
| | | | | | | | |
| | | | | | | | |
| | | | | | | | |
| | | | | | | | |
| | | | | | | | |
| | | | | | | | |
| | | | | | | | |
| | | | | | | | |
| | | | | | | | |
| | | | | | | | |
| | | | | | | | |
| | | | | | | | |
| | | | | | | | |
| | | | | | | | |
| | | | | | | | |
| | | | | | | | |
| | | | | | | | |
| | | | | | | | |
| | | | | | | | |
| | | | | | | | |
| | | | | | | | |
| | | | | | | | |
| | | | | | | | |
| | | | | | | | |
| | | | | | | | |
| | | | | | | | |
| | | | | | | | |
| | | | | | | | |
| | | | | | | | |
| | | | | | | | |
| | | | | | | | |
| Special mention loans | | $ | 448,497 | | | $ | 564,555 | | | $ | (116,058) | | | (21) | % |
| Classified loans | | 561,787 | | | 652,880 | | | (91,093) | | | (14) | % |
| Total criticized loans | | $ | 1,010,284 | | | $ | 1,217,435 | | | $ | (207,151) | | | (17 | %) |
| | | | | | | | |
| Special mention loans to loans held-for-investment | | 1.11 | % | | 1.47 | % | | | | |
| Classified loans to loans held-for-investment | | 1.39 | % | | 1.70 | % | | | | |
| Criticized loans to loans held-for-investment | | 2.50 | % | | 3.17 | % | | | | |
|
Nonperforming Assets
Nonperforming assets are comprised of nonaccrual loans, other real estate owned (“OREO”) and other nonperforming assets. Other nonperforming assets and OREO are repossessed assets and properties, respectively, acquired through foreclosure, or through full or partial satisfaction of loans held-for-investment. Loans are generally placed on nonaccrual status when they become 90 days past due or when the full collection of principal or interest becomes uncertain regardless of the length of past due status. Collectability is generally assessed based on economic and business conditions, the borrower’s financial condition, and the adequacy of collateral, if any. For additional details regarding the Company’s nonaccrual loan policy, see Note 1 — Summary of Significant Accounting Policies — Significant Accounting Policies — Loans Held-for-Investment to the Consolidated Financial Statements of the Company’s 2020 Form 10-K.
The following table presents information regarding nonperforming assets as of the periods indicated:
| | | | | | | | | | | | | | | | | | | | | | | | | | |
|
| ($ in thousands) | | | | | | Change |
| September 30, 2021 | | December 31, 2020 | | $ | | % |
| Commercial: | | | | | | | | |
| C&I | | $ | 97,157 | | | $ | 133,939 | | | $ | (36,782) | | | (27) | % |
| CRE: | | | | | | | | |
| CRE | | 14,236 | | | 46,546 | | | (32,310) | | | (69) | % |
| Multifamily residential | | 1,123 | | | 3,668 | | | (2,545) | | | (69) | % |
| | | | | | | | |
| Total CRE | | 15,359 | | | 50,214 | | | (34,855) | | | (69) | % |
| Consumer: | | | | | | | | |
| Residential mortgage: | | | | | | | | |
| Single-family residential | | 9,422 | | | 16,814 | | | (7,392) | | | (44) | % |
| HELOCs | | 8,731 | | | 11,696 | | | (2,965) | | | (25) | % |
| Total residential mortgage | | 18,153 | | | 28,510 | | | (10,357) | | | (36) | % |
| Other consumer | | 2,491 | | | 2,491 | | | — | | | 0 | % |
| Total nonaccrual loans | | 133,160 | | | 215,154 | | | (81,994) | | | (38) | % |
| OREO, net | | 28,800 | | | 15,824 | | | 12,976 | | | 82 | % |
| Other nonperforming assets | | 10,681 | | | 3,890 | | | 6,791 | | | 175 | % |
| Total nonperforming assets | | $ | 172,641 | | | $ | 234,868 | | | $ | (62,227) | | | (26) | % |
Nonperforming assets to total assets | | 0.28 | % | | 0.45 | % | | | | |
Nonaccrual loans to loans held-for-investment | | 0.33 | % | | 0.56 | % | | | | |
| Allowance for loan losses to nonaccrual loans | | 420.85 | % | | 288.16 | % | | | | |
| | | | | | | | |
| TDRs included in nonperforming loans | | $ | 77,583 | | | $ | 71,924 | | | | | |
|
Nonaccrual loans decreased $82.0 million or 38% from $215.2 million as of December 31, 2020 to $133.2 million as of September 30, 2021. This decrease was predominantly due to resolutions of C&I oil and gas exposures and CRE loans.
As of September 30, 2021, C&I comprised 73% and CRE comprised 12% of total nonaccrual loans. As of December 31, 2020, C&I and total CRE loans comprised 62% and 23% of total nonaccrual loans, respectively. As of September 30, 2021, $101.9 million or 77% of nonaccrual loans were less than 90 days delinquent. In comparison, $106.4 million or 49% of nonaccrual loans were less than 90 days delinquent as of December 31, 2020.
OREO was $28.8 million as of September 30, 2021, an increase of $13.0 million or 82% from $15.8 million as of December 31, 2020. The increase was due to an addition of a CRE office property totaling $28.8 million, which the Company took possession of during the third quarter of 2021, offset by a sale of a retail CRE property.
Other nonperforming assets totaled $10.7 million and $3.9 million as of September 30, 2021 and December 31, 2020, respectively, a net increase of $6.8 million or 175%, due to transfers from oil and gas loans to foreclosed assets, partially offset by sales and write-downs of oil and gas foreclosed assets.
The following table presents the accruing loans past due by portfolio segment as of September 30, 2021 and December 31, 2020:
| | | | | | | | | | | | | | | | | | | | | | | | | | | | | | | | | | | | | | | | |
|
| ($ in thousands) | | | | Total Accruing Past Due Loans (1) | | Change | | Percentage of
Total Respective Loan Portfolios |
| | | September 30,
2021 | | December 31,
2020 | | $ | | % | | September 30,
2021 | | December 31,
2020 |
Commercial: | | | | | | | | | | | | | | |
| C&I | | | | $ | 16,704 | | | $ | 9,717 | | | $ | 6,987 | | | 72 | % | | 0.12 | % | | 0.07 | % |
| CRE: | | | | | | | | | | | | | | |
| CRE | | | | 593 | | | 375 | | | 218 | | | 58 | % | | 0.01 | % | | 0.00 | % |
Multifamily residential | | | | 1,914 | | | 1,818 | | | 96 | | | 5 | % | | 0.06 | % | | 0.06 | % |
Construction and land | | | | — | | | 19,900 | | | (19,900) | | | (100 | %) | | 0.00 | % | | 3.32 | % |
Total CRE | | | | 2,507 | | | 22,093 | | | (19,586) | | | (89 | %) | | 0.02 | % | | 0.15 | % |
Total commercial | | | | 19,211 | | | 31,810 | | | (12,599) | | | (40 | %) | | 0.07 | % | | 0.11 | % |
| Consumer: | | | | | | | | | | | | | | |
Residential mortgage: | | | | | | | | | | | | | | |
Single-family residential | | | | 17,153 | | | 12,494 | | | 4,659 | | | 37 | % | | 0.19 | % | | 0.15 | % |
| HELOCs | | | | 4,297 | | | 6,052 | | | (1,755) | | | (29 | %) | | 0.22 | % | | 0.38 | % |
Total residential mortgage | | | | 21,450 | | | 18,546 | | | 2,904 | | | 16 | % | | 0.20 | % | | 0.19 | % |
| Other consumer | | | | 184 | | | 234 | | | (50) | | | (21 | %) | | 0.14 | % | | 0.14 | % |
Total consumer | | | | 21,634 | | | 18,780 | | | 2,854 | | | 15 | % | | 0.19 | % | | 0.19 | % |
Total | | | | $ | 40,845 | | | $ | 50,590 | | | $ | (9,745) | | | (19 | %) | | 0.10 | % | | 0.13 | % |
|
(1)There were no accruing loans past due 90 days or more as of both September 30, 2021 and December 31, 2020.
Troubled Debt Restructurings
TDRs are loans for which contractual terms have been modified by the Company for economic or legal reasons related to a borrower’s financial difficulties, and for which a concession to the borrower was granted that the Company would not otherwise consider. The following table presents the performing and nonperforming TDRs by portfolio segment as of September 30, 2021 and December 31, 2020. The allowance for loan losses for TDRs was $12.3 million as of September 30, 2021 and $10.3 million as of December 31, 2020.
| | | | | | | | | | | | | | | | | | | | | | | | | | | | | | | | | | | | | | | | | | | | |
|
| ($ in thousands) | | September 30, 2021 | | December 31, 2020 | | | | | | |
| Performing
TDRs | | Nonperforming
TDRs | | Total | | Performing
TDRs | | Nonperforming
TDRs | | Total | | | | | | |
| Commercial: | | | | | | | | | | | | | | | | | | |
| C&I | | $ | 65,998 | | | $ | 75,415 | | | $ | 141,413 | | | $ | 85,767 | | | $ | 68,451 | | | $ | 154,218 | | | | | | | |
| CRE: | | | | | | | | | | | | | | | | | | |
| CRE | | 23,544 | | | — | | | 23,544 | | | 24,851 | | | — | | | 24,851 | | | | | | | |
| Multifamily residential | | 5,302 | | | 204 | | | 5,506 | | | 3,310 | | | 1,448 | | | 4,758 | | | | | | | |
| Construction and land | | — | | | — | | | — | | | 19,900 | | | — | | | 19,900 | | | | | | | |
| Total CRE | | 28,846 | | | 204 | | | 29,050 | | | 48,061 | | | 1,448 | | | 49,509 | | | | | | | |
| Consumer: | | | | | | | | | | | | | | | | | | |
| Residential mortgage: | | | | | | | | | | | | | | | | | | |
| Single-family residential | | 6,640 | | | 1,113 | | | 7,753 | | | 6,748 | | | 1,169 | | | 7,917 | | | | | | | |
| HELOCs | | 2,579 | | | 851 | | | 3,430 | | | 2,631 | | | 856 | | | 3,487 | | | | | | | |
| Total residential mortgage | | 9,219 | | | 1,964 | | | 11,183 | | | 9,379 | | | 2,025 | | | 11,404 | | | | | | | |
| | | | | | | | | | | | | | | | | | |
| Total TDRs | | $ | 104,063 | | | $ | 77,583 | | | $ | 181,646 | | | $ | 143,207 | | | $ | 71,924 | | | $ | 215,131 | | | | | | | |
| | | | | | |
As of September 30, 2021, performing TDRs were $104.1 million, a decrease of $39.1 million or 27% from $143.2 million as of December 31, 2020. This decrease mainly reflected payoffs of performing C&I and construction TDRs, partially offset by the transfers of C&I TDRs from nonperforming to performing status. Over 95% and 85% of the performing TDRs were current as of September 30, 2021 and December 31, 2020, respectively.
Nonperforming TDRs were $77.6 million as of September 30, 2021, an increase of $5.7 million or 8% from $71.9 million as of December 31, 2020. This increase mainly reflected newly designated nonperforming C&I TDR loans, partially offset by paydowns, payoffs and transfers of certain C&I TDRs from nonperforming to performing status.
Existing TDRs that were subsequently modified in response to the COVID-19 pandemic continue to be classified as TDRs. As of September 30, 2021, there were no TDRs that were provided subsequent modifications related to the COVID-19 pandemic. As of December 31, 2020, there were four TDRs totaling $11.8 million that were provided subsequent modifications related to the COVID-19 pandemic.
Loan Modifications Due to COVID-19 Pandemic
Since late March 2020, under various forbearance programs, the Company has granted a range of commercial and consumer loan accommodations, predominantly in the form of payment deferrals, to provide relief to borrowers experiencing financial hardship due to the COVID-19 pandemic. Section 4013 of the CARES Act, as amended by the Consolidated Appropriations Act, 2021 (“CAA”), permits a financial institution to elect to temporarily suspend TDR accounting under ASC Subtopic 310-40 in certain circumstances. To be eligible under Section 4013 of the CARES Act, as modified by the CAA, a loan modification must be (1) related to the COVID-19 pandemic; (2) executed on a loan that was not more than 30 days past due as of December 31, 2019; and (3) executed between March 1, 2020, and the earlier of (a) 60 days after the date of termination of the federal National Emergency or (b) January 1, 2022. The federal banking regulators, in consultation with the Financial Accounting Standards Board (“FASB”), issued the Interagency Statement on Loan Modifications and Reporting for Financial Institutions Working with Customer Affected by the Coronavirus (Revised) (the “Interagency Statement”) on April 7, 2020 confirming that, for loans not subject to Section 4013 of the CARES Act, short-term modifications (i.e., six months or less) made on a good faith basis in response to the COVID-19 pandemic to borrowers who were current as of the implementation date of a loan modification, or modifications granted under government mandated modification programs, are not considered as TDRs under ASC Subtopic 310-40. See additional information in Note 1 — Summary of Significant Accounting Policies — Significant Accounting Policies — Troubled Debt Restructurings to the Consolidated Financial Statements of the Company’s 2020 Form 10-K.
The delinquency aging of loans modified related to the COVID-19 pandemic is frozen at the time of the modification. As a result, the recognition of delinquent loans, nonaccrual status and loan net charge-offs may be delayed for certain borrowers who are enrolled in these loan modification programs, which would have otherwise moved into past due or nonaccrual status. Interest income continues to be recognized over the accommodation periods.
The following table provides a summary of the COVID-19 pandemic-related loan modifications that remained under their modified terms as of September 30, 2021 and December 31, 2020. These amounts represent loan modifications that meet the criteria under Section 4013 of the CARES Act, as amended by the CAA, or the Interagency Statement and therefore are not considered as TDRs. These amounts also exclude loan modifications related to the COVID-19 pandemic made on existing TDRs. A loan is counted once in the table regardless of the number of accommodations the borrower has received.
| | | | | | | | | | | | | | | | | | | | | | | | | | | | | | | | | | | | | | |
|
| ($ in thousands) | | September 30, 2021 | | December 31, 2020 |
| | | | | | | | | |
| Number of Loans | | Outstanding Balance | | % of Balance
to Respective Loan Portfolio | | Number of Loans | | Outstanding Balance | | % of Balance
to Respective Loan Portfolio |
| Payment deferral and forbearance | | | | | | | | | | | | |
| Commercial: | | | | | | | | | | | | |
| C&I | | 8 | | $ | 11,156 | | | 0 | % | | 16 | | $ | 54,215 | | | 0 | % |
| CRE: | | | | | | | | | | | | |
| CRE | | 39 | | 465,282 | | 4 | % | | 63 | | 597,972 | | 5 | % |
| Multifamily residential | | 6 | | 113,506 | | 3 | % | | 4 | | 17,111 | | 1 | % |
| Construction and land | | 1 | | 54,077 | | 14 | % | | 3 | | 66,629 | | 11 | % |
| Total CRE | | 46 | | 632,865 | | | 4 | % | | 70 | | 681,712 | | | 5 | % |
| Total commercial | | 54 | | 644,021 | | | 2 | % | | 86 | | 735,927 | | | 3 | % |
| Consumer: | | | | | | | | | | | | |
| Residential mortgage: | | | | | | | | | | | | |
| Single-family residential | | 198 | | 80,456 | | 1 | % | | 498 | | 207,797 | | 3 | % |
| HELOCs | | 42 | | 22,510 | | 1 | % | | 102 | | 39,469 | | 2 | % |
| Total residential mortgage | | 240 | | 102,966 | | | 1 | % | | 600 | | 247,266 | | | 3 | % |
| Total consumer | | 240 | | 102,966 | | | 1 | % | | 600 | | 247,266 | | | 2 | % |
| Total payment deferral and forbearance | | 294 | | $ | 746,987 | | | 2 | % | | 686 | | $ | 983,193 | | | 3 | % |
|
The above table excludes loan modifications related to the COVID-19 pandemic that did not meet the criteria provided under Section 4013 of the CARES Act, as amended by the CAA, or the Interagency Statement, and that were evaluated and deemed to not be classified as TDRs. The determination to not consider a modification a TDR was made on the premise that the amount of the delayed restructured payments was insignificant relative to the unpaid principal or the collateral value of the loan, resulting in an insignificant shortfall in the contractual amount due from the borrower, or an insignificant delay in the timing of the restructured payment period relative to the payment frequency under the loan’s original contractual maturity or expected duration.
The COVID-19 pandemic-related loan modifications primarily consisted of payment deferrals six months or less in duration, in the form of either principal payment deferrals, where the borrower was still paying interest, or full principal and interest payment deferrals. Other forbearance programs consisted of interest rate concessions. The deferred payments for commercial loans are either repaid at contractual maturity or spread over the remaining contractual term of the loan. The deferred payments for consumer loans are repaid under defined payment plans between six to 72 months after the deferral period ends, or the loan term is extended beyond the contractual maturity by the number of payments deferred.
As of September 30, 2021, the Company had $747.0 million of loans under payment deferral and forbearance programs, a decrease of $236.2 million or 24% from $983.2 million as of December 31, 2020. The loans on deferral as of September 30, 2021 and December 31, 2020, largely consisted of CRE and residential mortgage loans. The year-to-date decrease in loans on deferral reflected the lifting of COVID-19 related business shutdowns and restrictions on travel and restaurant dining. The increase of CRE COVID-19 related loan deferrals that were making at least partial payments from 73% as of December 31, 2020 to 92% as of September 30, 2021 also signaled improvements in the economy. Loans that have exited the modification program were predominantly current as of September 30, 2021. The Company monitors the delinquency status of loans exiting relief programs on an ongoing basis. The impacts of the COVID-19 loan modifications were considered in the determination of the allowance for credit loss.
Allowance for Credit Losses
The Company’s measurement of the allowance for credit losses is based on management’s best estimate of lifetime expected credit losses inherent in the Company’s relevant financial assets. The allowance for credit losses estimate uses various models and estimation techniques based on historical loss experience, current borrower characteristics, current conditions, reasonable and supportable forecasts, and other relevant factors. In the case of loans and securities, allowance for credit losses are contra-asset valuation accounts that are deducted from the amortized cost basis of these assets to present the net amount expected to be collected. In the case of unfunded credit commitments, the allowance for credit losses is a liability account that is reported as a component of Accrued expenses and other liabilities in our Consolidated Balance Sheet.
In addition to the allowance for loan losses, the Company maintains an allowance for unfunded credit commitments. The Company has three general areas for which it provides the allowance for unfunded credit commitments: 1) recourse obligations for loans sold, 2) letters of credit, and 3) unfunded lending commitments. The Company’s methodology for determining the allowance calculation for unfunded lending commitments uses the lifetime loss rates of the on-balance sheet commitment. Recourse obligations for loans sold and letters of credit use the weighted loss rates for the applicable segment of the individual credit.
The Company is committed to maintaining the allowance for credit losses at a level that is commensurate with the estimated inherent losses in the loan portfolio, including unfunded credit facilities. While the Company believes that the allowance for credit losses as of September 30, 2021 was appropriate to absorb losses inherent in the loan portfolio and in unfunded credit commitments based on the information available, future allowance levels may increase or decrease based on a variety of factors, including but not limited to, accounting standard and regulatory changes, loan growth, portfolio performance and general economic conditions. For a description of the policies, methodologies and judgments used to determine the allowance for credit losses, see Item 7. MD&A — Critical Accounting Policies and Estimates of the Company’s 2020 Form 10-K and Note 1 — Summary of Significant Accounting Policies to the Consolidated Financial Statements of the Company’s 2020 Form 10-K, and Note 6 — Loans Receivable and Allowance for Credit Losses to the Consolidated Financial Statements in this Form 10-Q.
The following table presents an allocation of the allowance for loan losses by loan portfolio segments and unfunded credit commitments as of September 30, 2021 and December 31, 2020:
| | | | | | | | | | | | | | | | | | | | | | | | | | |
|
| ($ in thousands) | | September 30, 2021 | | December 31, 2020 |
| Allowance
Allocation | | % of Loan Type to Total Loans | | Allowance
Allocation | | % of Loan Type to Total Loans |
| Allowance for loan losses | | | | | | | | |
| Commercial: | | | | | | | | |
| C&I | | $ | 342,142 | | | 35 | % | | $ | 398,040 | | | 36 | % |
| CRE: | | | | | | | | |
| CRE | | 150,049 | | | 29 | % | | 163,791 | | | 29 | % |
Multifamily residential | | 19,917 | | | 8 | % | | 27,573 | | | 8 | % |
Construction and land | | 22,294 | | | 1 | % | | 10,239 | | | 2 | % |
| Total CRE | | 192,260 | | | 38 | % | | 201,603 | | | 39 | % |
| Total commercial | | 534,402 | | | 73 | % | | 599,643 | | | 75 | % |
| Consumer: | | | | | | | | |
| Residential mortgage: | | | | | | | | |
Single-family residential | | 18,292 | | | 22 | % | | 15,520 | | | 21 | % |
| HELOCs | | 3,392 | | | 5 | % | | 2,690 | | | 4 | % |
Total residential mortgage | | 21,684 | | | 27 | % | | 18,210 | | | 25 | % |
| Other consumer | | 4,318 | | | 0 | % | | 2,130 | | | 0 | % |
| Total consumer | | 26,002 | | | 27 | % | | 20,340 | | | 25 | % |
| Total allowance for loan losses | | $ | 560,404 | | | 100 | % | | $ | 619,983 | | | 100 | % |
| Allowance for unfunded credit commitments | | $ | 28,036 | | | | | $ | 33,577 | | | |
| Total allowance for credit losses | | $ | 588,440 | | | | | $ | 653,560 | | | |
| | | | | | | | |
| Loans held-for-investment | | $ | 40,481,705 | | | | | $ | 38,390,955 | | | |
| Allowance for loan losses to loans held-for-investment | | 1.38 | % | | | | 1.61 | % | | |
| | | | | | | | |
| | Three Months Ended September 30, | | Nine Months Ended September 30, |
| | 2021 | | 2020 | | 2021 | | 2020 |
| Average loans held-for-investment | | $ | 39,959,972 | | | $ | 37,157,095 | | | $ | 39,441,410 | | | $ | 36,485,980 | |
| | | | | | | | |
| | | | | | | | |
| Annualized net charge-offs to average loans held-for-investment | | 0.13 | % | | 0.26 | % | | 0.14 | % | | 0.16 | % |
| | | | | | | | |
| | | | | | | | |
| | | | | | | | |
| | | | | | | | |
|
The allowance for loan losses was $560.4 million as of September 30, 2021, a decrease of $59.6 million from $620.0 million as of December 31, 2020, primarily driven by a reduction in the allowance against the C&I loan portfolio. The change in the allowance reflects year-to-date improvement in the macroeconomic forecast, partially offset by loan growth.
The Company considers multiple economic scenarios to develop the estimate of the allowance for loans. The scenarios may consist of a base forecast representing management's view of the most likely outcome and downside or upside scenarios reflecting possible worsening or improving economic conditions. The base forecast assumed an end to the worst of the COVID-19 pandemic and continuing improvement in the economic outlook, with annual GDP growth estimated at 6.0% and 4.3% for 2021 and 2022, respectively, and the projected unemployment rate declining to 3.4% by the end of 2022. The downside scenario assumed a pullback in the expected economic recovery due to rising concerns with COVID-19 variants and a rise in unemployment. The upside scenario assumed a more optimistic view for the economic recovery, including higher GDP growth through next year and a faster return to full employment.
As of September 30, 2021 and December 31, 2020, PPP loans outstanding were $807.3 million and $1.57 billion, respectively. Since PPP loans are 100% guaranteed by the SBA, there were no allowance for loan losses provided for these loans as of September 30, 2021 and December 31, 2020.
Third quarter 2021 net charge-offs were $13.5 million or annualized 0.13% of average loans-held-for-investment, compared with $24.2 million or annualized 0.26% of average loans held-for-investment for the same period of 2020. In the first nine months of 2021, net charge-offs were $40.2 million or annualized 0.14% of average loans held-for-investment, compared with $44.3 million or annualized 0.16% of average loans held-for-investment for the first nine months of 2020. The year-over-year decreases for both periods were primarily due to a decrease in C&I charge-offs, partially offset by higher CRE charge-offs. The recognition of certain loan charge-offs could be delayed due to payment deferral activities instituted in response to the COVID-19 pandemic.
The following tables summarize activities in the allowance for loan losses for loans by portfolio segments for the third quarters and first nine months of 2021 and 2020:
| | | | | | | | | | | | | | | | | | | | | | | | | | | | | | | | | | | | | | | | | | | | | | | | | | |
|
| ($ in thousands) | | Three Months Ended September 30, 2021 |
| Commercial | | Consumer | | Total |
| C&I | | CRE | | Residential Mortgage | | Other
Consumer | |
| | CRE | | Multifamily
Residential | | Construction
and Land | | Single-
Family
Residential | | HELOCs | | |
Allowance for loan losses, beginning of period | | $ | 362,528 | | | $ | 161,962 | | | $ | 21,925 | | | $ | 15,643 | | | $ | 16,530 | | | $ | 2,938 | | | $ | 4,198 | | | $ | 585,724 | |
| (Reversal of) provision for credit losses on loans | (a) | (23,365) | | | 2,129 | | | (2,660) | | | 9,058 | | | 2,537 | | | 435 | | | 130 | | | (11,736) | |
| Gross charge-offs | | (1,154) | | | (14,229) | | | — | | | (2,674) | | | (912) | | | — | | | (10) | | | (18,979) | |
| Gross recoveries | | 4,203 | | | 187 | | | 652 | | | 267 | | | 137 | | | 19 | | | — | | | 5,465 | |
| Total net recoveries (charge-offs) | | 3,049 | | | (14,042) | | | 652 | | | (2,407) | | | (775) | | | 19 | | | (10) | | | (13,514) | |
| Foreign currency translation adjustment | | (70) | | | — | | | — | | | — | | | — | | | — | | | — | | | (70) | |
Allowance for loan losses, end of period | | $ | 342,142 | | | $ | 150,049 | | | $ | 19,917 | | | $ | 22,294 | | | $ | 18,292 | | | $ | 3,392 | | | $ | 4,318 | | | $ | 560,404 | |
| | | | | | | | | | | | | | | | |
| | | | | | | | | | | | | | | | |
| | | | | | | | | | | | | | | | |
| | | | | | | | | | | | | | | | |
| | | | | | | | | | | | | | | | |
| | | | | | | | | | | | | | | | |
| | | | | | | | | | | | | | | | | | | | | | | | | | | | | | | | | | | | | | | | | | | | | | | | | | |
|
| ($ in thousands) | | Three Months Ended September 30, 2020 |
| Commercial | | Consumer | | Total |
| C&I | | CRE | | Residential Mortgage | | Other
Consumer | |
| | CRE | | Multifamily
Residential | | Construction
and Land | | Single-
Family
Residential | | HELOCs | | |
Allowance for loan losses, beginning of period | | $ | 380,723 | | | $ | 176,040 | | | $ | 25,058 | | | $ | 18,551 | | | $ | 25,314 | | | $ | 3,867 | | | $ | 2,518 | | | $ | 632,071 | |
| | | | | | | | | | | | | | | | |
Provision for (reversal of) credit losses on loans | (a) | 31,691 | | | (8,301) | | | (1,916) | | | (8,180) | | | (2,692) | | | (637) | | | (76) | | | 9,889 | |
| | | | | | | | | | | | | | | | |
| Gross charge-offs | | (25,111) | | | (1,414) | | | — | | | — | | | — | | | — | | | (124) | | | (26,649) | |
| Gross recoveries | | 1,218 | | | 485 | | | 665 | | | 30 | | | — | | | 43 | | | — | | | 2,441 | |
| Total net (charge-offs) recoveries | | (23,893) | | | (929) | | | 665 | | | 30 | | | — | | | 43 | | | (124) | | | (24,208) | |
| Foreign currency translation adjustment | | 500 | | | — | | | — | | | — | | | — | | | — | | | — | | | 500 | |
Allowance for loan losses, end of period | | $ | 389,021 | | | $ | 166,810 | | | $ | 23,807 | | | $ | 10,401 | | | $ | 22,622 | | | $ | 3,273 | | | $ | 2,318 | | | $ | 618,252 | |
| | | | | | | | | | | | | | | | |
| | | | | | | | | | | | | | | | |
| | | | | | | | | | | | | | | | |
| | | | | | | | | | | | | | | | |
| | | | | | | | | | | | | | | | |
| | | | | | | | | | | | | | | | |
| | | | | | | | | | | | | | | | |
| | | | | | | | | | | | | | | | | | | | | | | | | | | | | | | | | | | | | | | | | | | | | | | | | | |
|
| ($ in thousands) | | Nine Months Ended September 30, 2021 |
| Commercial | | Consumer | | Total |
| C&I | | CRE | | Residential Mortgage | | Other
Consumer | |
| | CRE | | Multifamily
Residential | | Construction
and Land | | Single-
Family
Residential | | HELOCs | | |
Allowance for loan losses, beginning of period | | $ | 398,040 | | | $ | 163,791 | | | $ | 27,573 | | | $ | 10,239 | | | $ | 15,520 | | | $ | 2,690 | | | $ | 2,130 | | | $ | 619,983 | |
| (Reversal of) provision for credit losses on loans | (a) | (42,112) | | | 11,227 | | | (9,436) | | | 14,407 | | | 3,522 | | | 707 | | | 2,226 | | | (19,459) | |
| Gross charge-offs | | (20,162) | | | (25,558) | | | (130) | | | (2,954) | | | (1,046) | | | (45) | | | (43) | | | (49,938) | |
| Gross recoveries | | 6,301 | | | 589 | | | 1,910 | | | 602 | | | 296 | | | 40 | | | 5 | | | 9,743 | |
| Total net (charge-offs) recoveries | | (13,861) | | | (24,969) | | | 1,780 | | | (2,352) | | | (750) | | | (5) | | | (38) | | | (40,195) | |
| Foreign currency translation adjustment | | 75 | | | — | | | — | | | — | | | — | | | — | | | — | | | 75 | |
Allowance for loan losses, end of period | | $ | 342,142 | | | $ | 150,049 | | | $ | 19,917 | | | $ | 22,294 | | | $ | 18,292 | | | $ | 3,392 | | | $ | 4,318 | | | $ | 560,404 | |
| | | | | | | | | | | | | | | | |
| | | | | | | | | | | | | | | | |
| | | | | | | | | | | | | | | | |
| | | | | | | | | | | | | | | | |
| | | | | | | | | | | | | | | | |
| | | | | | | | | | | | | | | | |
| | | | | | | | | | | | | | | | | | | | | | | | | | | | | | | | | | | | | | | | | | | | | | | | | | |
|
| ($ in thousands) | | Nine Months Ended September 30, 2020 |
| Commercial | | Consumer | | Total |
| C&I | | CRE | | Residential Mortgage | | Other
Consumer | |
| | CRE | | Multifamily
Residential | | Construction
and Land | | Single-
Family
Residential | | HELOCs | | |
Allowance for loan losses, beginning of period | | $ | 238,376 | | | $ | 40,509 | | | $ | 22,826 | | | $ | 19,404 | | | $ | 28,527 | | | $ | 5,265 | | | $ | 3,380 | | | $ | 358,287 | |
| Impact of ASU 2016-13 adoption | | 74,237 | | | 72,169 | | | (8,112) | | | (9,889) | | | (3,670) | | | (1,798) | | | 2,221 | | | 125,158 | |
| Allowance for loan losses, January 1, 2020 | | 312,613 | | | 112,678 | | | 14,714 | | | 9,515 | | | 24,857 | | | 3,467 | | | 5,601 | | | 483,445 | |
Provision for (reversal of) credit losses on loans | (a) | 130,171 | | | 46,449 | | | 7,273 | | | 828 | | | (2,659) | | | (20) | | | (3,197) | | | 178,845 | |
| | | | | | | | | | | | | | | | |
| Gross charge-offs | | (57,466) | | | (2,688) | | | — | | | — | | | — | | | (221) | | | (180) | | | (60,555) | |
| Gross recoveries | | 3,395 | | | 10,371 | | | 1,820 | | | 58 | | | 424 | | | 47 | | | 94 | | | 16,209 | |
| Total net (charge-offs) recoveries | | (54,071) | | | 7,683 | | | 1,820 | | | 58 | | | 424 | | | (174) | | | (86) | | | (44,346) | |
| Foreign currency translation adjustment | | 308 | | | — | | | — | | | — | | | — | | | — | | | — | | | 308 | |
Allowance for loan losses, end of period | | $ | 389,021 | | | $ | 166,810 | | | $ | 23,807 | | | $ | 10,401 | | | $ | 22,622 | | | $ | 3,273 | | | $ | 2,318 | | | $ | 618,252 | |
| | | | | | | | | | | | | | | | |
| | | | | | | | | | | | | | | | |
| | | | | | | | | | | | | | | | |
| | | | | | | | | | | | | | | | |
| | | | | | | | | | | | | | | | |
| | | | | | | | | | | | | | | | |
| | | | | | | | | | | | | | | | |
The following table summarizes activity in the allowance for unfunded credit commitments for the third quarters and first nine months of 2021 and 2020:
| | | | | | | | | | | | | | | | | | | | | | | | | | |
|
| ($ in thousands) | | Three Months Ended September 30, | | Nine Months Ended September 30, |
| 2021 | | 2020 | | 2021 | | 2020 |
| Unfunded credit facilities | | | | | | | | |
| Allowance for unfunded credit commitments, beginning of period | | $ | 26,300 | | | $ | 28,972 | | | $ | 33,577 | | | $ | 11,158 | |
| Impact of ASU 2016-13 adoption | | — | | | — | | | — | | | 10,457 | |
| Provision for (reversal of) credit losses on unfunded credit commitments | (b) | 1,736 | | | 111 | | | (5,541) | | | 7,468 | |
| Allowance for unfunded credit commitments, end of period | | $ | 28,036 | | | $ | 29,083 | | | $ | 28,036 | | | $ | 29,083 | |
| | | | | | | | |
| (Reversal of) provision for credit losses | (a) + (b) | $ | (10,000) | | | $ | 10,000 | | | $ | (25,000) | | | $ | 186,313 | |
|
| | | | | | | | |
| | | | | | | | |
The allowance for unfunded credit commitments was $28.0 million as of September 30, 2021, compared with $33.6 million as of December 31, 2020.
Liquidity Risk Management
Liquidity
Liquidity is a financial institution’s capacity to meet its deposit and obligations to other counterparties as they come due, or to obtain adequate funding at a reasonable cost to meet those obligations. The objective of liquidity management is to manage the potential mismatch of asset and liability cash flows. Maintaining an adequate level of liquidity depends on the institution’s ability to efficiently meet both expected and unexpected cash and collateral needs without adversely affecting daily operations or the financial condition of the institution. To achieve this objective, the Company analyzes its liquidity risk, maintains readily available liquid assets, and utilizes diverse funding sources including its stable core deposit base.
The Board of Directors’ Risk Oversight Committee has primary oversight responsibility over liquidity risk management. At the management level, the Company’s Asset/Liability Committee (“ALCO”) establishes the liquidity guidelines that govern the day-to-day active management of the Company’s liquidity position by requiring sufficient asset-based liquidity to cover potential funding requirements and avoid over-dependence on volatile, less reliable funding markets. These guidelines are established and monitored for both the Bank and East West on a stand-alone basis to ensure that the Company can serve as a source of financial strength for its subsidiaries. The ALCO regularly monitors the Company’s liquidity status and related management processes, providing regular reports to the Board of Directors. The Company believes its liquidity management practices have been effective under normal operating and stressed market conditions.
Liquidity Risk — Liquidity Sources. The Company’s primary source of funding is from deposits generated by its banking business, which are relatively stable and low-cost. Total deposits amounted to $53.36 billion as of September 30, 2021, compared with $44.86 billion as of December 31, 2020. The Company’s loan-to-deposit ratio was 76% as of September 30, 2021, compared with 86% as of December 31, 2020.
In addition to deposits, the Company has access to various sources of wholesale funding, as well as borrowing capacity with the FHLB and Federal Reserve Bank of San Francisco (“FRBSF”) to sustain an adequate liquid asset portfolio, meet daily cash demands and allow management flexibility to execute its business strategy. Economic conditions and the stability of capital markets impact the Company’s access to and the cost of wholesale financing. The Company’s access to capital markets is also affected by the ratings received from various credit rating agencies. See Item 2 — MD&A — Balance Sheet Analysis — Deposits and Other Sources of Funds in this Form 10-Q for further detail related to the Company’s funding sources.
The Company maintains liquidity in the form of cash and cash equivalents, interest-bearing deposits with banks, short-term resale agreements and unencumbered high-quality and liquid AFS debt securities. The following table presents the Company’s liquid assets as of September 30, 2021 and December 31, 2020:
| | | | | | | | | | | | | | | | | | | | | | | | | | | | | | | | | | | | | | |
|
| ($ in thousands) | | September 30, 2021 | | December 31, 2020 |
| Encumbered | | Unencumbered | | Total | | Encumbered | | Unencumbered | | Total |
| Cash and cash equivalents | | $ | — | | | $ | 4,852,901 | | | $ | 4,852,901 | | | $ | — | | | $ | 4,017,971 | | | $ | 4,017,971 | |
| Interest-bearing deposits with banks | | — | | | 855,162 | | | 855,162 | | | — | | | 809,728 | | | 809,728 | |
| Short-term resale agreements | | — | | | 1,961,142 | | | 1,961,142 | | | — | | | 900,000 | | | 900,000 | |
| U.S. Treasury, and U.S. government agency and U.S. government-sponsored enterprise debt securities | | 378,213 | | | 1,926,620 | | | 2,304,833 | | | 91,637 | | | 773,443 | | | 865,080 | |
| U.S. government agency and U.S. government-sponsored enterprise mortgage-backed securities | | 481,425 | | | 3,584,106 | | | 4,065,531 | | | 494,132 | | | 2,320,532 | | | 2,814,664 | |
| Foreign government bonds | | — | | | 254,848 | | | 254,848 | | | — | | | 182,531 | | | 182,531 | |
| Municipal securities | | — | | | 501,489 | | | 501,489 | | | 1,033 | | | 395,040 | | | 396,073 | |
| Non-agency mortgage-backed securities, asset-backed securities and CLOs | | 261 | | | 1,967,373 | | | 1,967,634 | | | 434 | | | 879,908 | | | 880,342 | |
| Corporate debt securities | | — | | | 618,671 | | | 618,671 | | | 1,249 | | | 404,719 | | | 405,968 | |
| Total | | $ | 859,899 | | | $ | 16,522,312 | | | $ | 17,382,211 | | | $ | 588,485 | | | $ | 10,683,872 | | | $ | 11,272,357 | |
|
Unencumbered liquid assets totaled $16.52 billion as of September 30, 2021, compared with $10.68 billion as of December 31, 2020. AFS debt securities, included as part of liquidity sources, consist of high quality and liquid securities with moderate durations to minimize overall interest rate and liquidity risks. The Company believes these AFS debt securities provide quick sources of liquidity to obtain financing, regardless of market conditions, through sale or pledging.
As a means to generate incremental liquidity, the Company maintains available borrowing capacity under secured borrowing lines with the FHLB and FRBSF, unsecured federal funds lines of credit with various correspondent banks, and several master repurchase agreements with major brokerage companies. As of September 30, 2021, the Company had available borrowing capacity of $22.40 billion, including $9.67 billion with the FHLB and $3.88 billion with the FRBSF. The Company believes that its liquidity sources are sufficient to meet all reasonably foreseeable short-term needs. Unencumbered loans and/or debt securities were pledged to the FHLB and the FRBSF discount window as collateral. The Company has established operational procedures to enable borrowing against these assets, including regular monitoring of the total pool of loans and debt securities eligible as collateral. Eligibility of collateral is defined in guidelines from the FHLB and FRBSF and is subject to change at their discretion. The Bank’s unsecured federal funds lines of credit with correspondent banks, subject to availability, totaled $1.01 billion as of September 30, 2021. Estimated borrowing capacity from unpledged AFS debt securities totaled $7.84 billion as of September 30, 2021.
Liquidity Risk — Liquidity for East West. In addition to bank level liquidity management, the Company manages liquidity at the parent company level for various operating needs including payment of dividends, repurchases of common stock, principal and interest payments on its borrowings, acquisitions and additional investments in its subsidiaries. East West’s primary source of liquidity is from cash dividends distributed by its subsidiary, East West Bank. The Bank is subject to various statutory and regulatory restrictions on its ability to pay dividends as discussed in Item 1. Business — Supervision and Regulation — Dividends and Other Transfers of Funds of the Company’s 2020 Form 10-K. East West held $344.4 million and $439.1 million in cash and cash equivalents as of September 30, 2021 and December 31, 2020, respectively. As of September 30, 2021, management believes that East West has sufficient cash and cash equivalents to service its operating needs.
Liquidity Risk — Liquidity Stress Testing. Liquidity stress testing is performed at the Company level, as well as at the foreign subsidiary and foreign branch levels. Stress tests and scenario analyses are intended to quantify the potential impact of a liquidity event on the financial and liquidity position of the entity. Scenario analyses include assumptions about significant changes in key funding sources, market triggers, and potential uses of funding and economic conditions in certain countries. In addition, Company specific events are incorporated into the stress testing. Liquidity stress tests are conducted to ascertain potential mismatches between liquidity sources and uses over a variety of time horizons, both immediate and longer term, and over a variety of stressed conditions. Given the range of potential stresses, the Company maintains contingency funding plans on a consolidated basis and for individual entities.
As of September 30, 2021, the Company was not aware of any material commitments for capital expenditures in the foreseeable future and believes it has adequate liquidity resources to conduct operations and meet other needs in the ordinary course of business. Given the uncertainty and the rapidly changing market and economic conditions related to the COVID-19 pandemic, the Company will continue to actively evaluate the nature and extent of the impact on its business and financial position. For more information of how the COVID-19 pandemic may impact our liquidity, see Item 1A. Risk Factors — Risks Related to the COVID-19 Pandemic of the Company’s 2020 Form 10-K.
Consolidated Cash Flows Analysis
The following table presents a summary of the Company’s Consolidated Statement of Cash Flows for the periods indicated. While this information may be helpful to highlight business strategies and certain macroeconomic trends, the cash flow analysis may not be as relevant when analyzing changes in the Company’s net earnings and assets. The Company believes that in addition to this traditional cash flow analysis, the discussion related to liquidity in Item 2. MD&A — Risk Management — Liquidity Risk Management — Liquidity in this Form 10-Q may provide a useful context in evaluating the Company’s liquidity position and related activity.
| | | | | | | | | | | | | | |
|
| ($ in thousands) | | Nine Months Ended September 30, |
| 2021 | | 2020 |
| Net cash provided by operating activities | | $ | 745,831 | | | $ | 432,098 | |
| Net cash used in investing activities | | (7,817,886) | | | (4,520,267) | |
| Net cash provided by financing activities | | 7,903,443 | | | 5,322,358 | |
| Effect of exchange rate changes on cash and cash equivalents | | 3,542 | | | 11,603 | |
| Net increase in cash and cash equivalents | | 834,930 | | | 1,245,792 | |
| Cash and cash equivalents, beginning of period | | 4,017,971 | | | 3,261,149 | |
| Cash and cash equivalents, end of period | | $ | 4,852,901 | | | $ | 4,506,941 | |
| | | | |
Operating Activities — During the first nine months of 2021, net cash provided by operating activities mainly reflected inflow of $655.2 million from net income, plus net income adjusted for certain noncash items of $128.7 million, and a $30.2 million increase in accrued expenses and other liabilities, partially offset by a $78.6 million increase in accrued interest receivable and other assets. In comparison, during the same period in 2020, net cash provided by operating activities mainly reflected inflow of $403.7 million from net income, net income adjusted for certain noncash items of $273.2 million and a $220.3 million increase in accrued expenses and other liabilities, partially offset by a $467.1 million increase in accrued interest receivable and other assets.
Investing Activities — During the first nine months of 2021, cash used in investing activities primarily reflected $4.30 billion of net AFS debt securities purchases (net of sales, maturities and redemptions), $2.13 billion in cash used for growth in the loan portfolio, and $1.14 billion in net resale agreements purchases (net of paydowns and maturities). During the same period in 2020, net cash used in investing activities primarily reflected cash outflows of $2.67 billion from loans held-for-investment, $1.14 billion of net AFS debt securities purchases (net of sales, maturities and redemptions), and $503.2 million in cash used for interest-bearing deposits with banks.
Financing Activities — During the first nine months of 2021, net cash provided by financing activities primarily reflected a net increase of $8.49 billion in deposits, partially offset by $405.0 million in repayment of FHLB advances, and $141.9 million in cash dividends paid. During the same period in 2020, net cash provided by financing activities primarily reflected net increases of $4.34 billion in deposits and $1.43 billion in PPPLF advances, partially offset by $146.0 million in shares repurchased and $119.2 million in cash dividends paid.
Market Risk Management
Market risk is the risk that the Company’s financial condition may change resulting from adverse movements in market rates or prices including interest rates, foreign exchange rates, interest rate contracts, investment securities prices, credit spreads and related risk resulting from mismatches in rate sensitive assets and liabilities. In the event of market stress, the risk could have a material impact on our results of operations and financial condition.
The Board’s Risk Oversight Committee has primary oversight responsibility over market risk management. At the management level, the ALCO establishes and monitors compliance with the policies and risk limits pertaining to market risk management activities. Corporate Treasury supports the ALCO in measuring, monitoring and managing interest rate risk as well as all other market risks.
Interest Rate Risk Management
Interest rate risk results primarily from the Company’s traditional banking activities of gathering deposits and extending loans, which are the primary areas of market risk for the Company. Economic and financial conditions, movements in interest rates, and consumer preferences impact the level of noninterest-bearing funding sources at the Company, as well as affect the difference between the interest the Company earns on interest-earning assets and pays on interest-bearing liabilities. In addition, changes in interest rates can influence the rate of principal prepayments on loans and the speed of deposit withdrawals. Due to the pricing term mismatches and the embedded options inherent in certain products, changes in market interest rates not only affect expected near-term earnings, but also the economic value of these interest-earning assets and interest-bearing liabilities. Other market risks include foreign currency exchange risk and equity price risk. These risks are not considered significant to the Company, and no separate quantitative information concerning these risks is presented herein.
With oversight by the Company’s Board of Directors, the ALCO coordinates the overall management of the Company’s interest rate risk. The ALCO meets regularly and is responsible for reviewing the Company’s open market positions and establishing policies to monitor and limit exposure to market risk. Management of interest rate risk is carried out primarily through strategies involving the Company’s debt securities portfolio, loan portfolio, available funding channels and capital market activities. In addition, the Company’s policies permit the use of derivative instruments to assist in managing interest rate risk.
The interest rate risk exposure is measured and monitored through various risk management tools, which include a simulation model that performs interest rate sensitivity analyses under multiple interest rate scenarios. The model incorporates the Company’s cash instruments, loans, debt securities, resale agreements, deposits, borrowings and repurchase agreements, as well as financial instruments from the Company’s foreign operations. The Company uses both a static balance sheet and a forward growth balance sheet to perform these analyses. The simulated interest rate scenarios include a non-parallel shift in the yield curve (“rate shock”) and a gradual non-parallel shift in the yield curve (“rate ramp”). In addition, the Company also performs simulations using alternative interest rate scenarios, including various permutations of the yield curve flattening, steepening or inverting. Results of these various simulations are used to formulate and gauge strategies to achieve a desired risk profile within the Company’s capital and liquidity guidelines.
The net interest income simulation model is based on the actual maturity and repricing characteristics of the Company’s interest-rate sensitive assets, liabilities and related derivative contracts. It also incorporates various assumptions, which management believes to be reasonable but may have a significant impact on results. These assumptions include, but are not limited to, the timing and magnitude of changes in interest rates, the yield curve evolution and shape, the correlation between various interest rate indices, financial instrument future repricing characteristics and spread relative to benchmark rates, and the effect of interest rate floors and caps. The modeled results are highly sensitive to deposit decay and deposit beta assumptions, which are derived from a regression analysis of the Company’s historical deposit data. Deposit beta commonly refers to the correlation of the changes in interest rates paid on deposits to changes in benchmark interest rates. The model is also sensitive to the loan and investment prepayment assumptions, based on an independent model and the Company’s historical prepayment data, which consider anticipated prepayments under different interest rate environments.
Simulation results are highly dependent on input assumptions. To the extent actual behavior is different from the assumptions in the models, there could be a material change in interest rate sensitivity. The assumptions applied in the model are documented and supported for reasonableness, and periodically back-tested to assess their effectiveness. The Company makes appropriate calibrations to the model as needed, continually refining the model, methodology and results. Changes to key model assumptions are reviewed by the ALCO. Scenario results do not reflect strategies that management could employ to limit the impact of changing interest rate expectations.
Since the federal funds rate range was lowered to near zero in March 2020 and the Federal Reserve has committed its resources to support the U.S. economy, it is not expected that rates will decline further, nor is it expected that rates will enter into the negative territory. Consequently, the simulation results for the downward interest rate scenarios as of September 30, 2021 are not provided.
Twelve-Month Net Interest Income Simulation
Net interest income simulation modeling looks at interest rate risk through earnings. It projects the changes in interest rate sensitive asset and liability cash flows, expressed in terms of net interest income, over a specified time horizon for defined interest rates scenarios. Net interest income simulations generate insight into the impact of market rates changes on earnings and guide risk management decisions. The Company assesses interest rate risk by comparing net interest income using different interest rate scenarios.
The federal funds target rate range was 0.25% as of both September 30, 2021 and December 31, 2020. After lowering the range to between 0.00% and 0.25% in March 2020, the Federal Open Market Committee (“FOMC”) pledged to maintain monetary support for the economy. In the September 2021 meeting, the FOMC held the federal funds target rate at between 0.00% and 0.25%. The FOMC statement repeated language that inflation was transitory, but also acknowledged the inflation was elevated. In November 2021 meeting, the FOMC voted to continue to hold the federal funds target rate at between 0.00% and 0.25% and to begin tapering its asset purchases in mid-November. The Bank anticipates the first rate hike will take place in 2022.
The following table presents the Company’s net interest income sensitivity related to an instantaneous and sustained non-parallel shift in market interest rates of 100 and 200 bps in upward direction as of September 30, 2021 and December 31, 2020.
| | | | | | | | | | | | | | | | | | |
|
Change in Interest Rates
(in bps) | | Net Interest Income Volatility (1) | | |
| September 30, 2021 | | December 31, 2020 | | | | |
| +200 | | 16.3 | % | | 12.6 | % | | | | |
| +100 | | 7.8 | % | | 5.6 | % | | | | |
| -100 | | NM | | NM | | | | |
| -200 | | NM | | NM | | | | |
|
NM — Not meaningful.
(1)The percentage change represents net interest income over 12 months in a stable interest rate environment versus net interest income in the various rate scenarios.
The Company’s net interest income profile as of September 30, 2021 reflects an asset sensitive position. Net interest income is expected to increase if interest rates rise and to decrease if interest rates decline. The potential impact of rate decreases is partially reduced due to the current low rate environment with the federal funds rate floored and the federal funds rate range between 0.00% and 0.25%. The Company is naturally asset sensitive due to the large share of variable rate loans in its loan portfolio, which are primarily linked to Prime and LIBOR indices. The Company’s interest income is vulnerable to changes in short-term interest rates. However, given the current low level of interest rates, the potential for further rate decreases is limited, which reduces the Bank’s exposure to risks associated with falling rates. The Company’s deposit portfolio is primarily comprised of non-maturity deposits, which are not directly tied to short-term interest rate indices, but are, nevertheless, sensitive to changes in short-term interest rates.
The Company’s estimated twelve-month net interest income sensitivity as of September 30, 2021 was slightly higher as compared with the sensitivity as of December 31, 2020 under both higher rate scenarios. This reflects both an increased rate sensitivity in the Company’s assets and an increase in noninterest bearing deposits.
While an instantaneous and sustained non-parallel shift in market interest rates was used in the simulation model described in the preceding paragraphs, the Company believes that any shift in interest rates would likely be more gradual and would therefore, have a more modest impact. The rate ramp table below shows the net income volatility under a gradual non-parallel shift of the yield curve upward direction, in even quarterly increments over the first 12 months, followed by rates held constant thereafter:
| | | | | | | | | | | | | | |
|
Change in Interest Rates
(in bps) | | Net Interest Income Volatility (1) |
| September 30, 2021 | | December 31, 2020 |
| +200 Rate Ramp | | 7.1 | % | | 4.9 | % |
| +100 Rate Ramp | | 3.0 | % | | 2.2 | % |
| -100 Rate Ramp | | NM | | NM |
| -200 Rate Ramp | | NM | | NM |
|
NM — Not meaningful.
(1)The percentage change represents net interest income under a gradual non-parallel shift in even quarterly increments over 12 months.
The Company believes that the rate ramp table, shown above, when evaluated together with the results of the rate shock simulation, presents a more meaningful indication of the potential impact of rising interest rates to the Company’s twelve-month net interest income. During the third quarter of 2021, the Company’s modeled asset sensitivity increased under simulations for the up 200 and up 100 bps ramp scenarios.
Economic Value of Equity at Risk
Economic value of equity (“EVE”) is a cash flow calculation that takes the present value of all asset cash flows and subtracts the present value of all liability cash flows. This calculation is used for asset/liability management and measures changes in the economic value of the bank. The fair market values of a bank's assets and liabilities are directly linked to interest rates. The economic value approach provides a comparatively broader scope than the net income volatility approach since it captures all anticipated cash flows.
EVE simulation reflects the effect of interest rate shifts on the value of the Company and is used to assess the degree of interest rate risk exposure. In contrast to the earnings perspective, the economic perspective identifies risks arising from repricing or maturity gaps over the life of the balance sheet. Changes in economic value indicate anticipated changes in the value of the Bank’s future cash flows. Thus, the economic perspective can provide a leading indicator of the Bank’s future earnings and capital values. The economic value method also reflects sensitivity across the full maturity spectrum of the Bank’s assets and liabilities.
The following table presents the Company’s EVE sensitivity related to an instantaneous and sustained non-parallel shift in market interest rates of 100 and 200 bps in an upward direction as of September 30, 2021 and December 31, 2020:
| | | | | | | | | | | | | | |
| | | | |
Change in Interest Rates
(in bps) | | EVE Volatility (1) |
| September 30, 2021 | | December 31, 2020 |
| +200 | | 4.5 | % | | 9.6 | % |
| +100 | | 2.6 | % | | 4.8 | % |
| -100 | | NM | | NM |
| -200 | | NM | | NM |
| | | | |
NM — Not meaningful.
(1)The percentage change represents net portfolio value of the Company in a stable interest rate environment versus net portfolio value in the various rate scenarios.
The Company’s EVE sensitivity for the upward interest rate scenarios decreased as of September 30, 2021, compared with the results as of December 31, 2020. The changes in EVE sensitivity during this period were primarily due to changes in the level and shape of the yield curve and changes in balance sheet mix.
The Company’s EVE profile as of September 30, 2021 reflects an asset sensitive EVE position under the higher interest rate scenarios. Given the uncertainty of the magnitude, timing and direction of future interest rate movements, and the shape of the yield curve, actual results may vary from those predicted by the Company’s model.
Derivatives
It is the Company’s policy not to speculate on the future direction of interest rates, foreign currency exchange rates and commodity prices. However, the Company will periodically enter into derivative transactions in order to reduce its exposure to market risks, primarily interest rate risk and foreign currency risk. The Company believes that these derivative transactions, when properly structured and managed, may provide a hedge against inherent risk in certain assets and liabilities and against risk in specific transactions. Hedging transactions may be implemented using a variety of derivative instruments such as swaps, forwards and options. Prior to entering into any hedging activities, the Company analyzes the costs and benefits of the hedge in comparison to alternative strategies. In addition, the Company enters into derivative transactions in order to assist customers with their risk management objectives, such as managing exposure to fluctuations in interest rates, foreign currencies and commodity prices. To economically hedge against the derivative contracts entered into with the Company’s customers, the Company enters into mirrored derivative contracts with third-party financial institutions. The exposures from derivative transactions are collateralized by cash and/or eligible securities based on limits as set forth in the respective agreements entered between the Company and counterparty financial institutions.
The Company is subject to credit risk associated with the counterparties to the derivative contracts. This counterparty credit risk is a multi-dimensional form of risk, affected by both the exposure and credit quality of the counterparty, both of which are sensitive to market-induced changes. The Company’s Credit Risk Management Committee provides oversight of credit risks and the Company has guidelines in place to manage counterparty concentration, tenor limits and collateral. The Company manages the credit risk of its derivative positions by diversifying its positions among various counterparties, by entering into legally enforceable master netting arrangements and by requiring collateral arrangements, where possible. The Company may also transfer counterparty credit risk-related to interest rate swaps to institutional third parties through the use of credit risk participation agreements. Certain derivative contracts are required to be centrally cleared through clearinghouses to further mitigate counterparty credit risk. The Company incorporates credit value adjustments and other market standard methodologies to appropriately reflect its own nonperformance risk and the respective counterparty’s nonperformance risk in the fair value measurements of its derivatives.
The following table summarizes certain information about the derivative financial instruments utilized by the Company in its management of interest rate risk and foreign currency risk as of September 30, 2021 and December 31, 2020:
| | | | | | | | | | | | | | | | | | | | | | | | | | |
|
| | September 30, 2021 | | December 31, 2020 |
| ($ in thousands) | | Interest Rate Contracts | | Foreign Exchange Contracts | | Interest Rate Contracts | | Foreign Exchange Contracts |
| Derivatives designated as hedging instruments: | | Cash Flow Hedges | | Net Investment Hedges | | Cash Flow Hedges | | Net Investment Hedges |
| Notional amounts: | | $ | 275,000 | | | $ | 85,316 | | | $ | 275,000 | | | $ | 84,269 | |
| Fair value: | | | | | | | | |
| Recognized as an asset | | — | | | 158 | | | — | | | — | |
| Recognized as a liability | | 1,149 | | | — | | | 1,864 | | | 235 | |
| Net fair value | | $ | (1,149) | | | $ | 158 | | | $ | (1,864) | | | $ | (235) | |
| Weighted-average interest rates: | | | | | | | | |
| Pay fixed (receive floating) | | 0.351%
(3-month USD-LIBOR) | | NM | | 0.483%
(3-month USD-LIBOR) | | NM |
Weighted-average remaining term to maturity (in months): | | 16.9 | | | 2.7 | | | 25.8 | | | 2.6 | |
| Derivatives not designated as hedging instruments: | | Interest Rate Contracts | | Foreign Exchange Contracts | | Interest Rate Contracts | | Foreign Exchange Contracts |
| Notional amounts: | | $ | 17,743,446 | | | $ | 3,047,846 | | | $ | 18,155,678 | | | $ | 3,108,488 | |
| Fair value: | | | | | | | | |
| Recognized as an asset | | 298,831 | | 31,717 | | 489,132 | | 30,300 |
| Recognized as a liability | | 212,179 | | 24,313 | | 315,834 | | 22,524 |
| Net fair value | | $ | 86,652 | | | $ | 7,404 | | | $ | 173,298 | | | $ | 7,776 | |
|
NM — Not meaningful.
Derivatives Designated as Hedging Instruments — Interest rate and foreign exchange derivative contracts are utilized in our asset and liability management activities and serve as an efficient tool to manage the Company’s interest rate risk and foreign exchange risk. We use derivatives to hedge the risk of variable cash flows that the Company is exposed to from its variable interest rate borrowings, including repurchase agreements and FHLB advances. The Company also uses derivatives to hedge the risk of changes in the USD equivalent value of a designated monetary amount of the Company’s net investment in East West Bank (China) Limited. For both cash flow and net investment hedges, the change in the fair value of the hedging instruments is recognized in Accumulated other comprehensive (loss) income, net of tax, on the Consolidated Balance Sheet.
The fluctuation in foreign currency translation of the hedged exposure is expected to be offset by changes in the fair value of the forwards. As of September 30, 2021, the outstanding foreign currency forwards effectively hedged approximately 50% of the Chinese Renminbi exposure in East West Bank (China) Limited.
Changes to the composition of the Company’s derivatives designated as hedging instruments reflect actions taken for interest rate risk and foreign exchange rate risk management. The decisions to reposition our derivatives portfolio are based on the current assessment of economic and financial conditions, including the interest rate and foreign currency environments, balance sheet composition and trends, and the relative mix of our cash and derivative positions.
Derivatives Not Designated as Hedging Instruments — The Company enters into interest rate, foreign exchange and energy commodity contracts to support the business needs of its customers. When derivative transactions are executed with its customers, the derivative contracts are offset by paired trades with third-party financial institutions. The Company may enter into derivative contracts that are either exchange-traded, centrally cleared through a clearinghouse or over-the-counter.
The Company offers various interest rate derivative contracts to its customers. For the interest rate contracts entered into with its customers, the Company managed its interest rate risk by entering into offsetting interest rate contracts with third-party financial institutions including with central clearing organizations. Certain derivative contracts entered with central clearing organizations are settled-to-market daily to the extent the central clearing organizations’ rulebooks legally characterize the variation margin as settlement. Derivative contracts allow borrowers to lock in attractive intermediate and long-term fixed rate financing while not increasing the interest rate risk to the Company. These transactions are not linked to any specific Company assets or liabilities on the Consolidated Balance Sheet, or to forecasted transactions in a hedging relationship, and are therefore classified as economic hedges. The contracts are marked-to-market at each reporting period. The changes in fair values of the derivative contracts traded with third-party financial institutions are expected to be largely comparable to the changes in fair values of the derivative transactions executed with customers throughout the terms of these contracts, except for the credit valuation adjustment component. The Company records credit valuation adjustments on derivatives to properly reflect the variances of credit worthiness between the Company and the counterparties, considering the effects of enforceable master netting agreements and collateral arrangements.
The Company enters into foreign exchange contracts with its customers, consisting of forward, spot, swap and option contracts to accommodate the business needs of its customers. For the foreign exchange contracts entered into with its customers, the Company managed its foreign exchange and credit exposures by entering into offsetting foreign exchange contracts with third-party financial institutions and/or entering into bilateral collateral and master netting agreements with customer counterparties. The changes in the fair values entered with third-party financial institutions are expected to be largely comparable to the changes in fair values of the foreign exchange transactions executed with customers throughout the terms of these contracts. As of September 30, 2021, the Company anticipates performance by all counterparties and has not experienced nonperformance by any of its counterparties, and therefore did not incur any related losses. The Company also utilizes foreign exchange contracts that are not designated as hedging instruments to mitigate the economic effect of fluctuations in certain foreign currency on-balance sheet items, primarily foreign currency denominated deposits offered to its customers. The Company’s policies permit taking proprietary currency positions within approved limits, in compliance with exemptions to proprietary trading restrictions provided under Section 619 of the Dodd-Frank Wall Street Reform and Consumer Protection Act, or the Volcker Rule. The Company does not speculate in the foreign exchange markets, and actively manages its foreign exchange exposures within prescribed risk limits and defined controls.
The Company enters into energy commodity contracts with its customers to allow them to hedge against the risk of fluctuation in energy commodity prices. To economically hedge against the risk of fluctuation in commodity prices in the products offered to its customers, the Company enters into offsetting commodity contracts with third-party financial institutions, including with central clearing organizations. Certain derivative contracts entered into with central clearing organizations are settled-to-market daily, to the extent the central clearing organizations’ rulebooks legally characterize the variation margin as settlement. The changes in fair values of the energy commodity contracts traded with third-party financial institutions are expected to be largely comparable to the changes in fair values of the energy commodity transactions executed with customers throughout the terms of these contracts.
Additional information on the Company’s derivatives is presented in Note 1 — Summary of Significant Accounting Policies — Significant Accounting Policies — Derivatives to the Consolidated Financial Statements of the Company’s 2020 Form 10-K and Note 2 — Fair Value Measurement and Fair Value of Financial Instruments and Note 5 — Derivatives to the Consolidated Financial Statements in this Form 10-Q.
Impact of Inflation
The primary impact of inflation on our operations is reflected in increased operating costs and in the effect that inflation may have on both short- and long-term interest rates. Since almost all the assets and liabilities of a financial institution are monetary in nature, interest rates generally have a more significant impact on a financial institution's performance than inflation. While inflation expectations do affect interest rates, interest rates do not necessarily move in the same direction, or to the same extent, as the prices of goods and services.
Critical Accounting Policies and Estimates
The Company’s significant accounting policies (Note 1 — Summary of Significant Accounting Policies to the Consolidated Financial Statements of the Company’s 2020 Form 10-K) are fundamental to understanding our results of operations and financial condition. Some accounting policies, by their nature, are inherently subject to estimation techniques, valuation assumptions and other subjective assessments and may require significant judgments in applying complex accounting principles to individual transactions, where actual results could differ materially from the Company’s estimates. The Company has procedures and processes in place to facilitate making these judgments. In addition, certain accounting policies are more likely than others to have a critical effect on the Company’s Consolidated Financial Statements, and may apply to areas of relatively greater business importance. The following accounting policies are critical to the Company’s Consolidated Financial Statements:
•fair value of financial instruments;
•allowance for loan losses and unfunded credit commitments;
•goodwill impairment; and
•income taxes.
Recently Issued Accounting Standards
For a detailed discussion and disclosure on new accounting pronouncements adopted, see Note 1 — Basis of Presentation and Current Accounting Developments to the Consolidated Financial Statements in this Form 10-Q.
Reconciliation of GAAP to Non-GAAP Financial Measures
To supplement the Company’s unaudited interim Consolidated Financial Statements presented in accordance with U.S. GAAP, the Company uses certain non-GAAP measures of financial performance. Non-GAAP financial measures are not prepared in accordance with, or as an alternative to U.S. GAAP. Generally, a non-GAAP financial measure is a numerical measure of a company’s performance that either excludes or includes amounts that are not normally excluded or included in the most directly comparable measure calculated and presented in accordance with U.S. GAAP. A non-GAAP financial measure may also be a financial metric that is not required by U.S. GAAP or other applicable requirements. The Company believes these non-GAAP financial measures, when taken together with the corresponding U.S. GAAP financial measures, provide meaningful supplemental information regarding its performance, and allow comparability to prior periods. These non-GAAP financial measures may be different from non-GAAP financial measures used by other companies, limiting their usefulness for comparison purposes.
The following tables present the reconciliations of U.S. GAAP to non-GAAP financial measures for the periods presented:
| | | | | | | | | | | | | | | | | | | | | | | | | | | | | | | | | | | | | |
| | |
| ($ in thousands) | | | Three Months Ended | | Nine Months Ended | | |
| September 30, 2021 | | June 30,
2021 | | September 30, 2020 | | September 30, 2021 | | September 30, 2020 | | |
| Net interest income before provision for credit losses | (a) | | $ | 395,706 | | | $ | 376,473 | | | $ | 324,130 | | | $ | 1,125,874 | | | $ | 1,030,612 | | | |
Total noninterest income (1) | | | 73,109 | | | 68,431 | | | 54,503 | | | 214,406 | | | 165,715 | | | |
| Total revenue | (b) | | $ | 468,815 | | | $ | 444,904 | | | $ | 378,633 | | | $ | 1,340,280 | | | $ | 1,196,327 | | | |
| | | | | | | | | | | | | |
| | | | | | | | | | | | | |
| | | | | | | | | | | | | |
| | | | | | | | | | | | | |
| | | | | | | | | | | | | |
Total noninterest expense (1) | (c) | | $ | 205,384 | | | $ | 189,523 | | | $ | 172,573 | | | $ | 585,984 | | | $ | 537,671 | | | |
Less: Amortization of tax credit and other investments (1) | | | (38,008) | | | (27,291) | | | (17,209) | | | (90,657) | | | (57,819) | | | |
| Amortization of core deposit intangibles | | | (705) | | | (710) | | | (927) | | | (2,147) | | | (2,811) | | | |
| Repurchase agreements’ extinguishment cost | | | — | | | — | | | — | | | — | | | (8,740) | | | |
| Non-GAAP noninterest expense | (d) | | $ | 166,671 | | | $ | 161,522 | | | $ | 154,437 | | | $ | 493,180 | | | $ | 468,301 | | | |
| | | | | | | | | | | | | |
| Efficiency ratio | (c)/(b) | | 43.81 | % | | 42.60 | % | | 45.58 | % | | 43.72 | % | | 44.94 | % | | |
| Non-GAAP efficiency ratio | (d)/(b) | | 35.55 | % | | 36.30 | % | | 40.79 | % | | 36.80 | % | | 39.14 | % | | |
| | | | | | |
(1)Starting fourth quarter of 2020, the Company reclassified certain income/losses from equity-method investments from Amortization of tax credit and other investments to Other investment income, with no effect on net income. Prior-period amounts have been revised to conform with the current presentation.
| | | | | | | | | | | | | | | | | | | | | | | |
| | |
($ and shares in thousands, except per share data) | | | September 30, 2021 | | June 30, 2021 | | September 30, 2020 |
| Stockholders’ equity | (a) | | $ | 5,690,201 | | | $ | 5,547,548 | | | $ | 5,126,106 | |
Less: Goodwill | | | (465,697) | | | (465,697) | | | (465,697) | |
Other intangible assets (1) | | | (9,849) | | | (10,309) | | | (12,369) | |
| Non-GAAP tangible common equity | (b) | | $ | 5,214,655 | | | $ | 5,071,542 | | | $ | 4,648,040 | |
| | | | | | | |
| Total assets | (c) | | $ | 60,959,110 | | | $ | 59,854,876 | | | $ | 50,371,477 | |
| Less: Goodwill | | | (465,697) | | | (465,697) | | | (465,697) | |
Other intangible assets (1) | | | (9,849) | | | (10,309) | | | (12,369) | |
| Non-GAAP tangible assets | (d) | | $ | 60,483,564 | | | $ | 59,378,870 | | | $ | 49,893,411 | |
| | | | | | | |
| Total stockholders’ equity to total assets | (a)/(c) | | 9.33 | % | | 9.27 | % | | 10.18 | % |
| Non-GAAP tangible common equity to tangible assets | (b)/(d) | | 8.62 | % | | 8.54 | % | | 9.32 | % |
| | | | | | | |
| Number of common shares at period-end | (e) | | 141,884 | | | 141,878 | | | 141,507 | |
Non-GAAP tangible common equity per share | (b)/(e) | | $ | 36.75 | | | $ | 35.75 | | | $ | 32.85 | |
| | |
(1)Includes core deposit intangibles and mortgage servicing assets.
| | | | | | | | | | | | | | | | | | | | | | | | | | | | | | | | | | | |
| | | | |
| ($ in thousands) | | | Three Months Ended | | Nine Months Ended |
| September 30, 2021 | | June 30, 2021 | | September 30, 2020 | | September 30, 2021 | | September 30, 2020 |
| Net income | | | $ | 225,449 | | | $ | 224,742 | | | $ | 159,537 | | | $ | 655,185 | | | $ | 403,713 | |
| Add: Amortization of core deposit intangibles | | | 705 | | | 710 | | | 927 | | | 2,147 | | | 2,811 | |
| Amortization of mortgage servicing assets | | | 430 | | | 420 | | | 450 | | | 1,264 | | | 1,492 | |
Tax effect of adjustments (1) | | | (322) | | | (321) | | | (390) | | | (968) | | | (1,220) | |
| Non-GAAP tangible net income | (a) | | $ | 226,262 | | | $ | 225,551 | | | $ | 160,524 | | | $ | 657,628 | | | $ | 406,796 | |
| | | | | | | | | | | |
| | | | | | | | | | | |
| | | | | | | | | | | |
| | | | | | | | | | | |
| | | | | | | | | | | |
| | | | | | | | | | | |
| Average stockholders’ equity | | | $ | 5,680,306 | | | $ | 5,425,952 | | | $ | 5,079,351 | | | $ | 5,482,705 | | | $ | 5,028,122 | |
| Less: Average goodwill | | | (465,697) | | | (465,697) | | | (465,697) | | | (465,697) | | | (465,697) | |
Average other intangible assets (2) | | | (10,135) | | | (10,827) | | | (13,083) | | | (10,847) | | | (14,302) | |
| Average non-GAAP tangible equity | (b) | | $ | 5,204,474 | | | $ | 4,949,428 | | | $ | 4,600,571 | | | $ | 5,006,161 | | | $ | 4,548,123 | |
| | | | | | | | | | | |
Return on average non-GAAP tangible equity (3) | (a)/(b) | | 17.25 | % | | 18.28 | % | | 13.88 | % | | 17.56 | % | | 11.95 | % |
| | | | |
(1)Applied statutory rate of 28.37% for the third quarter and first nine months of 2021, and the second quarter of 2021. Applied statutory tax rate of 28.35% for the third quarter and first nine months of 2020.
(2)Includes core deposit intangibles and mortgage servicing assets.
(3)Annualized.
| | | | | | | | | | | | | | | | | | | | | | | | | | | | | | | | | | | | | | |
| | | | | | | | | | | | |
| | | Three Months Ended | | Nine Months Ended |
Yield on Average Loans
($ in thousand) | | September 30,
2021 | | June 30,
2021 | | September 30,
2020 | | September 30,
2021 | | September 30,
2020 |
| Interest income on loans | | (a) | | $ | 363,503 | | | $ | 352,453 | | | $ | 336,542 | | | $ | 1,057,964 | | | $ | 1,115,804 | |
| Less: Interest income on PPP loans | | | | (15,212) | | | (15,377) | | | (7,778) | | | (45,606) | | | (29,067) | |
| Adjusted interest income on loans | | (b) | | $ | 348,291 | | | $ | 337,076 | | | $ | 328,764 | | | $ | 1,012,358 | | | $ | 1,086,737 | |
| | | | | | | | | | | | |
| Average loans | | (c) | | $ | 39,960,151 | | | $ | 39,622,270 | | | $ | 37,160,445 | | | $ | 39,441,751 | | | $ | 36,487,859 | |
| Less: Average PPP loans | | | | (1,111,404) | | | (1,870,385) | | | (1,764,411) | | | (1,634,617) | | | (1,078,985) | |
| Adjusted average loans | | (d) | | $ | 38,848,747 | | | $ | 37,751,885 | | | $ | 35,396,034 | | | $ | 37,807,134 | | | $ | 35,408,874 | |
| | | | | | | | | | | | |
Average loan yield (1) | | (a)/(c) | | 3.61 | % | | 3.57 | % | | 3.60 | % | | 3.59 | % | | 4.08 | % |
Adjusted average loan yield (1) | | (b)/(d) | | 3.56 | % | | 3.58 | % | | 3.70 | % | | 3.58 | % | | 4.10 | % |
| | | | | | | | | | | | |
(1)Annualized.
Forward-Looking Statements
Certain matters discussed in this Form 10-Q contain forward-looking statements that are intended to be covered by the safe harbor for such statements provided by the Private Securities Litigation Reform Act of 1995. In addition, the Company may make forward-looking statements in other documents that it files with, or furnishes to, the SEC and management may make forward-looking statements to analysts, investors, media members and others. Forward-looking statements are statements that are not historical facts, and are based on current expectations, estimates and projections about the Company’s industry, management’s beliefs and certain assumptions made by management, many of which, by their nature, are inherently uncertain and beyond the Company’s control, such as the future impacts of the COVID-19 pandemic. These statements relate to the Company’s financial condition, results of operations, plans, objectives, future performance and/or business. They usually can be identified by the use of forward-looking language, such as “likely result in,” “expects,” “anticipates,” “estimates,” “forecasts,” “projects,” “intends to,” “assumes,” “believes,” “plans,” “trend,” “objective,” “target,” “continues,” “remains,” “will,” “would,” “should,” “could,” “may,” “might,” “can,” or similar expressions, and the negative thereof. You should not place undue reliance on these statements, as they are subject to risks and uncertainties, including, but not limited to, those described in the documents incorporated by reference. When considering these forward-looking statements, you should keep in mind these risks and uncertainties, as well as any cautionary statements the Company may make. Moreover, you should treat these statements as speaking only as of the date they are made and based only on information then actually known to the Company.
There are a number of important factors that could cause future results to differ materially from historical performance and these forward-looking statements. Factors that might cause such differences, some of which are beyond the Company’s control, include, but are not limited to:
•changes in the U.S. economy, including an economic slowdown, inflation, deflation, housing prices, employment levels, rate of growth and general business conditions;
•changes in local, regional and global business, economic and political conditions and geopolitical events;
•the economic, financial, reputational and other impacts of the ongoing COVID-19 global pandemic and variants thereof and any other pandemic, epidemic or health-related crisis, as well as a deterioration of asset quality and an increase in credit losses due to the COVID-19 global pandemic;
•changes in laws or the regulatory environment including regulatory reform initiatives and policies of the U.S. Department of Treasury, the Federal Reserve, the Federal Deposit Insurance Corporation, the Office of the Comptroller of the Currency, the SEC, the Consumer Financial Protection Bureau, and the DFPI;
•the changes and effects thereof in trade, monetary and fiscal policies and laws, including the ongoing trade dispute between the U.S. and the People’s Republic of China;
•changes in the commercial and consumer real estate markets;
•changes in consumer or commercial spending, and savings and borrowing habits, patterns and behaviors;
•fluctuations in the Company’s stock price;
•changes in income tax laws and regulations;
•the Company’s ability to compete effectively against financial institutions in its banking markets and other entities, including as a result of emerging technologies;
•the soundness of other financial institutions;
•success and timing of the Company’s business strategies;
•the Company’s ability to retain key officers and employees;
•impact on the Company’s funding costs, net interest income and net interest margin from changes in key variable market interest rates, competition, regulatory requirements and the Company’s product mix;
•changes in the Company’s costs of operation, compliance and expansion;
•the Company’s ability to adopt and successfully integrate new technologies into its business in a strategic manner;
•impact of the benchmark interest rate reform in the U.S. including the transition away from USD LIBOR to alternative reference rates;
•impact of communications or technology disruption, failure in, or breach of, the Company’s operational or security systems or infrastructure, or those of third parties with which the Company does business, including as a result of cyber-attacks, and other similar matters which could result in, among other things, confidential and/or proprietary information being disclosed or misused and materially impact the Company’s ability to provide services to its clients;
•adequacy of the Company’s risk management framework, disclosure controls and procedures and internal control over financial reporting;
•future credit quality and performance, including the Company’s expectations regarding future credit losses and allowance levels;
•impact of adverse changes to the Company’s credit ratings from major credit rating agencies;
•impact of adverse judgments or settlements in litigation;
•impact on the Company’s operations due to political developments, disease pandemics, wars, civil unrest, terrorism or other hostilities that may disrupt or increase volatility in securities or otherwise affect business and economic conditions;
•heightened regulatory and governmental oversight and scrutiny of the Company’s business practices, including dealings with consumers;
•impact of reputational risk from negative publicity, fines and penalties and other negative consequences from regulatory violations, legal actions and the Company’s interactions with business partners, counterparties, service providers and other third parties;
•impact of regulatory enforcement actions;
•changes in accounting standards as may be required by the FASB or other regulatory agencies and their impact on critical accounting policies and assumptions;
•impact of other potential federal tax changes and spending cuts;
•the Company’s capital requirements and its ability to generate capital internally or raise capital on favorable terms;
•impact on the Company’s liquidity due to changes in the Company’s ability to pay dividends and repurchase common stock and to receive dividends from its subsidiaries;
•any future strategic acquisitions or divestitures;
•changes in the equity and debt securities markets;
•fluctuations in foreign currency exchange rates;
•impact of increased focus on social, environmental and sustainability matters, which may affect the Company’s operations as well as those of its customers and the economy more broadly;
•significant turbulence or disruption in the capital or financial markets, which could result in, among other things, a reduction in the availability of funding or increases in funding costs, declines in asset values and/or recognition of allowance for credit losses on securities held in the Company’s AFS debt securities portfolio; and
•impact of climate change, natural or man-made disasters or calamities, such as wildfires, droughts and earthquakes, all of which are particularly common in California, or other events that may directly or indirectly result in a negative impact on the Company’s financial performance.
For a more detailed discussion of some of the factors that might cause such differences, see the Company’s 2020 Form 10-K under the heading Item 1A. Risk Factors and the information set forth under Item 1A. Risk Factors in this Form 10-Q. The Company does not undertake, and specifically disclaims, any obligation to update or revise any forward-looking statements to reflect the occurrence of events or circumstances after the date of such statements except as required by law.
ITEM 3. QUANTITATIVE AND QUALITATIVE DISCLOSURES ABOUT MARKET RISK
For quantitative and qualitative disclosures regarding market risk in the Company’s portfolio, see Note 5 — Derivatives to the Consolidated Financial Statements in this Form 10-Q and Item 2. MD&A — Risk Management — Market Risk Management in this Form 10-Q.
ITEM 4. CONTROLS AND PROCEDURES
Disclosure Controls and Procedures
As of September 30, 2021, pursuant to Rule 13a-15(b) of the Securities Exchange Act of 1934, as amended (the “Exchange Act”), the Company conducted an evaluation, under the supervision and with the participation of the Company’s management, including the Chief Executive Officer and Chief Financial Officer, of the effectiveness of the Company’s disclosure controls and procedures (as defined in Rule 13a-15(e) of the Exchange Act). Based upon that evaluation, the Company’s Chief Executive Officer and Chief Financial Officer concluded that the Company’s disclosure controls and procedures were effective as of September 30, 2021.
The Company’s disclosure controls and procedures are designed to ensure that information required to be disclosed by the Company in the reports that the Company files or submits under the Exchange Act is recorded, processed, summarized, and reported within the time periods specified in the rules and forms of the SEC. The Company’s disclosure controls and procedures include, without limitation, controls and procedures designed to ensure that information required to be disclosed by the Company in the reports that the Company files under the Exchange Act is accumulated and communicated to the Company’s management, including the Chief Executive Officer and Chief Financial Officer, as appropriate, to allow timely decisions regarding required disclosure.
Change in Internal Control over Financial Reporting
There were no changes in the Company’s internal control over financial reporting (as defined in Rule 13a-15(f) of the Exchange Act) during the quarter ended September 30, 2021, that have materially affected or are reasonably likely to materially affect the Company’s internal control over financial reporting.
PART II — OTHER INFORMATION
ITEM 1. LEGAL PROCEEDINGS
See Note 9 — Commitments and Contingencies — Litigation to the Consolidated Financial Statements in Part I of this Form 10-Q, incorporated herein by reference.
ITEM 1A. RISK FACTORS
The Company’s 2020 Form 10-K contains disclosure regarding the risks and uncertainties related to the Company’s business under the heading Item 1A. Risk Factors. There has been no material change to the Company’s risk factors as presented in the Company’s 2020 Form 10-K.
ITEM 2. UNREGISTERED SALES OF EQUITY SECURITIES AND USE OF PROCEEDS
There were no unregistered sales of equity securities or repurchase activities during the three months ended September 30, 2021.
ITEM 6. EXHIBITS
The following exhibit index lists Exhibits filed, or in the case of Exhibits 32.1 and 32.2 furnished, with this report:
| | | | | | | | |
| Exhibit No. | | Exhibit Description |
| | |
| 3.1 | | |
| | |
| 3.1.1 | | |
| | |
| 3.1.2 | | |
| | |
| 3.1.3 | | |
| | |
| 3.2 | | |
| | |
| | |
| | |
| | |
| | |
| | |
| | |
| 10.1 | | |
| | |
| | |
| | |
| | |
| | |
| 31.1 | | |
| | |
| 31.2 | | |
| | |
| 32.1 | | |
| | |
| 32.2 | | |
| | |
| 101.INS | | The instance document does not appear in the interactive data file because its XBRL tags are embedded within the inline XBRL document. |
| | |
| 101.SCH | | Inline XBRL Taxonomy Extension Schema Document. Filed herewith. |
| | |
| 101.CAL | | Inline XBRL Taxonomy Extension Calculation Linkbase Document. Filed herewith. |
| | |
| 101.DEF | | Inline XBRL Taxonomy Extension Definition Linkbase Document. Filed herewith. |
| | |
| 101.LAB | | Inline XBRL Taxonomy Extension Label Linkbase Document. Filed herewith. |
| | |
| 101.PRE | | Inline XBRL Taxonomy Extension Presentation Linkbase Document. Filed herewith. |
| | |
| 104 | | Cover Page Interactive Data (formatted as Inline XBRL and contained in Exhibit 101 filed herewith). Filed herewith. |
| | |
|
| | |
|
GLOSSARY OF ACRONYMS
| | | | | | | | | | | |
| AFS | Available-for-sale | HELOC | Home equity line of credit |
| ALCO | Asset/Liability Committee | LCH | London Clearing House |
| AOCI | Accumulated other comprehensive (loss) income | LGD | Loss given default |
| ARPA | American Rescue Plan Act of 2021 | LIBOR | London Interbank Offered Rate |
| ARRC | Alternative Reference Rates Committee | LTV | Loan-to-value |
| ASC | Accounting Standards Codification | MD&A | Management’s Discussion and Analysis of Financial Condition and Results of Operations |
| ASU | Accounting Standards Update | MMBTU | Million British thermal unit |
| C&I | Commercial and industrial | MSLP | Main Street Lending Program |
| CAA | Consolidated Appropriations Act, 2021 | NAV | Net asset value |
| CARES Act | Coronavirus Aid, Relief, and Economic Security Act | OREO | Other real estate owned |
| CECL | Current expected credit losses | OTTI | Other-than-temporary impairment |
| CET1 | Common Equity Tier 1 | PD | Probability of default |
| CLO | Collateralized loan obligation | PPP | Paycheck Protection Program |
| CME | Chicago Mercantile Exchange | PPPLF | Paycheck Protection Program Liquidity Facility |
| COVID-19 | Coronavirus Disease 2019 | RMB | Chinese Renminbi |
| CRA | Community Reinvestment Act | ROA | Return on average assets |
| CRE | Commercial real estate | ROE | Return on average equity |
| DFPI | California Department of Financial Protection and Innovation | RPA | Credit risk participation agreement |
| EPS | Earnings per share | RSU | Restricted stock unit |
| ERM | Enterprise risk management | S&P | Standard and Poor's |
| EVE | Economic value of equity | SBA | Small Business Administration |
| FASB | Financial Accounting Standards Board | SBLC | Standby letter of credit |
| FCA | Financial Conduct Authority | SEC | U.S. Securities and Exchange Commission |
| FHLB | Federal Home Loan Bank | SOFR | Secured Overnight Financing Rate |
| FOMC | Federal Open Market Committee | TDR | Troubled debt restructuring |
| FRBSF | Federal Reserve Bank of San Francisco | U.S. | United States |
| FTP | Funds transfer pricing | USD | U.S. dollar |
| GAAP | Generally accepted accounting principles | VIE | Variable interest entity |
| GDP | Gross Domestic Product | | |
SIGNATURE
Pursuant to the requirements of the Securities Exchange Act of 1934, the registrant has duly caused this report to be signed on its behalf by the undersigned thereunto duly authorized.
| | | | | | | | | | | | | | |
| Dated: | November 8, 2021 | |
| | |
| | EAST WEST BANCORP, INC.
(Registrant) |
| | |
| | By | /s/ IRENE H. OH | |
| | | Irene H. Oh |
| | | Executive Vice President and
Chief Financial Officer |