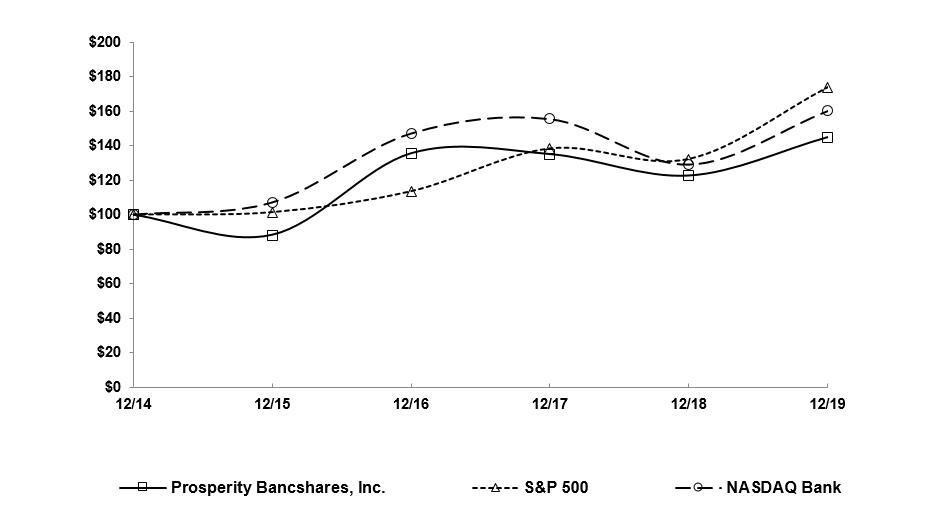
 *$100 invested on 12/31/14 in stock or index, including reinvestment of dividends. Fiscal year ended December 31.
UNITED STATES
SECURITIES AND EXCHANGE COMMISSION
Washington, D.C. 20549
FORM
(Mark One)
|
|
ANNUAL REPORT PURSUANT TO SECTION 13 OR 15(d) OF THE SECURITIES EXCHANGE ACT OF 1934 |
For The Fiscal Year Ended
OR
|
|
TRANSITION REPORT PURSUANT TO SECTION 13 OR 15(d) OF THE SECURITIES EXCHANGE ACT OF 1934 |
For the transition period from to
Commission File Number
PROSPERITY BANCSHARES, INC.®
(Exact name of registrant as specified in its charter)
|
TEXAS |
|
|
|
(State or other jurisdiction of incorporation or organization) |
|
(I.R.S. Employer Identification No.) |
|
|
|
|
|
|
|
|
|
(Address of principal executive offices) |
|
(Zip Code) |
Registrant’s Telephone Number, Including Area Code: (
Securities registered pursuant to Section 12(b) of the Act:
|
Title of each class |
|
Trading Symbol(s) |
|
Name of each exchange on which registered |
|
|
|
|
|
|
Securities registered pursuant to Section 12(g) of the Act: None
Indicate by check mark if the registrant is a well-known seasoned issuer, as defined in Rule 405 of the Securities Act.
Indicate by check mark if the registrant is not required to file reports pursuant to Section 13 or Section 15(d) of the Act. Yes ☐
Indicate by check mark whether the registrant (1) has filed all reports required to be filed by Section 13 or 15(d) of the Securities Exchange Act of 1934 during the preceding 12 months (or for such shorter period that the registrant was required to file such reports), and (2) has been subject to such filing requirements for the past 90 days.
Indicate by check mark whether the registrant has submitted electronically every Interactive Data File required to be submitted pursuant to Rule 405 of Regulation S-T (§232.405 of this chapter) during the preceding 12 months (or for such shorter period that the registrant was required to submit such files).
Indicate by check mark whether the registrant is a large accelerated filer, an accelerated filer, a non-accelerated filer, a smaller reporting company or an emerging growth company. See the definitions of “large accelerated filer,” “accelerated filer,” “smaller reporting company” and “emerging growth company” in Rule 12b-2 of the Exchange Act.
|
Large Accelerated Filer |
|
☒ |
|
Accelerated Filer |
|
☐ |
|
|
|
|
|
|||
|
Non-accelerated Filer |
|
☐ |
|
Smaller Reporting Company |
|
|
|
|
|
|
|
|
|
|
|
|
|
|
|
Emerging Growth Company |
|
|
If an emerging growth company, indicate by check mark if the registrant has elected not to use the extended transition period for complying with any new or revised financial accounting standards provided pursuant to Section 13(a) of the Exchange Act. ☐
Indicate by check mark whether the registrant is a shell company (as defined in Rule 12b-2 of the Exchange Act). Yes
The aggregate market value of the shares of common stock held by non-affiliates as of June 28, 2019, based on the closing price of the common stock on the New York Stock Exchange on June 28, 2019 was approximately $
As of February 24, 2020, the number of outstanding shares of common stock was
Documents Incorporated by Reference:
Portions of the Company’s Proxy Statement relating to the 2020 Annual Meeting of Shareholders, which will be filed within 120 days after December 31, 2019, are incorporated by reference into Part III, Items 10-14 of this Annual Report on Form 10-K.
PROSPERITY BANCSHARES, INC.®
2019 ANNUAL REPORT ON FORM 10-K
TABLE OF CONTENTS
|
|
|
|
|
|
|
Item 1. |
|
|
1 |
|
|
|
|
|
1 |
|
|
|
|
|
2 |
|
|
|
|
|
2 |
|
|
|
|
|
2 |
|
|
|
|
|
2 |
|
|
|
|
|
3 |
|
|
|
|
|
4 |
|
|
|
|
|
4 |
|
|
Item 1A. |
|
|
12 |
|
|
Item 1B. |
|
|
23 |
|
|
Item 2. |
|
|
23 |
|
|
Item 3. |
|
|
23 |
|
|
Item 4. |
|
|
23 |
|
|
|
|
|
|
|
|
Item 5. |
|
|
24 |
|
|
Item 6. |
|
|
27 |
|
|
Item 7. |
|
Management’s Discussion and Analysis of Financial Condition and Results of Operations |
|
29 |
|
|
|
|
30 |
|
|
|
|
|
31 |
|
|
|
|
|
31 |
|
|
|
|
|
33 |
|
|
|
|
|
38 |
|
|
Item 7A. |
|
|
59 |
|
|
Item 8. |
|
|
59 |
|
|
Item 9. |
|
Changes in and Disagreements with Accountants on Accounting and Financial Disclosure |
|
60 |
|
Item 9A. |
|
|
60 |
|
|
Item 9B. |
|
|
63 |
|
|
|
|
|
|
|
|
Item 10. |
|
|
63 |
|
|
Item 11. |
|
|
63 |
|
|
Item 12. |
|
Security Ownership of Certain Beneficial Owners and Management and Related Shareholder Matters |
|
63 |
|
Item 13. |
|
Certain Relationships and Related Transactions and Director Independence |
|
63 |
|
Item 14. |
|
|
63 |
|
|
|
|
|
|
|
|
Item 15. |
|
|
64 |
|
|
|
67 |
|||
PART I
|
ITEM 1. |
BUSINESS |
General
Prosperity Bancshares, Inc.®, a Texas corporation (the “Company”), was formed in 1983 as a vehicle to acquire the former Allied Bank in Edna, Texas, which was chartered in 1949 as The First National Bank of Edna and is now known as Prosperity Bank. The Company is a registered financial holding company that derives substantially all of its revenues and income from the operation of its bank subsidiary, Prosperity Bank® (“Prosperity Bank®” or the “Bank”). The Bank provides a wide array of financial products and services to businesses and consumers throughout Texas and Oklahoma. As of December 31, 2019, the Bank operated 285 full service banking locations: 65 in the Houston area, including The Woodlands; 30 in the South Texas area, including Corpus Christi and Victoria; 33 in the Dallas/Fort Worth area; 22 in the East Texas area; 29 in the Central Texas area, including Austin and San Antonio; 34 in the West Texas area, including Lubbock, Midland-Odessa and Abilene; 16 in the Bryan/College Station area; 6 in the Central Oklahoma area; 8 in the Tulsa, Oklahoma area and 42 in the Dallas/Fort Worth area currently doing business as LegacyTexas Bank. The Company’s principal executive office is located at Prosperity Bank Plaza, 4295 San Felipe in Houston, Texas and its telephone number is (281) 269-7199. The Company’s website address is www.prosperitybankusa.com.
The Company’s market consists of the communities served by its banking centers. The diverse nature of the economies in each local market served by the Company provides the Company with a varied customer base and allows the Company to spread its lending risk throughout a number of different industries including professional service firms and their principals, manufacturing, tourism, recreation, petrochemicals, farming and ranching. The Company’s market areas outside of Houston, Dallas, Corpus Christi, San Antonio, Lubbock, Austin, Tulsa and Oklahoma City are dominated by either small community banks or branches of larger regional banks. Management believes that the Company, through its responsive customer service and community banking philosophy, combined with the sophistication of a larger regional bank holding company, has a competitive advantage in its market areas and excellent growth opportunities through acquisitions, new banking center locations and additional business development.
Operating under a community banking philosophy, the Company seeks to develop broad customer relationships based on service and convenience while maintaining its prudent approach to lending and sound asset quality. The Company has grown through a combination of internal growth, the acquisition of community banks and branches of banks and the opening of new banking centers. As a result of its stable customer relationships, the Company is able to maintain a low cost of funds. Utilizing that and employing stringent cost controls, the Company has been profitable in every year of its existence, including the periods of adverse economic conditions in Texas and Oklahoma.
In addition to internal growth, the Company completed the following acquisitions within the last ten years (through December 31, 2019):
|
Acquired Entity |
|
Acquired Bank |
|
Completion Date |
|
Number of Banking Centers Acquired (1) |
|
|
|
|
U.S. Bank (3 branches) |
|
N/A |
|
2010 |
|
|
3 |
|
|
|
First Bank (19 branches) |
|
N/A |
|
2010 |
|
|
15 |
|
|
|
Texas Bankers, Inc. |
|
Bank of Texas |
|
2012 |
|
|
2 |
|
|
|
The Bank Arlington |
|
The Bank Arlington |
|
2012 |
|
|
1 |
|
|
|
American State Financial Corporation |
|
American State Bank |
|
2012 |
|
|
37 |
|
|
|
Community National Bank |
|
Community National Bank |
|
2012 |
|
|
1 |
|
|
|
East Texas Financial Services, Inc. |
|
Firstbank |
|
2013 |
|
|
4 |
|
|
|
Coppermark Bancshares, Inc. |
|
Coppermark Bank |
|
2013 |
|
|
6 |
|
|
|
FVNB Corp. |
|
First Victoria National Bank |
|
2013 |
|
|
20 |
|
|
|
F&M Bancorporation Inc. |
|
The F&M Bank & Trust Company |
|
2014 |
|
|
11 |
|
|
|
Tradition Bancshares, Inc. |
|
Tradition Bank |
|
2016 |
|
|
7 |
|
|
|
LegacyTexas Financial Group, Inc. |
|
LegacyTexas Bank |
|
2019 |
|
|
42 |
|
|
(1) The number of banking centers added does not include any locations of the acquired entity that were closed and consolidated with existing banking centers of the Company upon consummation of the transaction or closed after consummation of the transaction.
1
Acquisition
Merger with LegacyTexas Financial Group, Inc.—On November 1, 2019, LegacyTexas Financial Group, Inc. (“LegacyTexas”), merged with Prosperity Bancshares and LegacyTexas Bank merged with Prosperity Bank (collectively, the “Merger”). LegacyTexas was headquartered in Plano, Texas and operated 42 locations in 19 North Texas cities in and around the Dallas-Fort Worth area. As of September 30, 2019, LegacyTexas, on a consolidated basis, reported total assets of $10.5 billion, total gross loans of $9.1 billion, total deposits of $6.5 billion and shareholders’ equity of $1.2 billion.
Pursuant to the terms of the merger agreement, Prosperity issued 26,228,148 shares of Prosperity common stock with a closing price of $69.02 per share plus $318.0 million in cash, made up of $308.6 million in cash and $9.4 million cash in taxes withheld, for all outstanding shares of LegacyTexas. This resulted in goodwill of $1.32 billion as of December 31, 2019. Additionally, Prosperity recognized $60.1 million of core deposit intangibles as of December 31, 2019. The goodwill balance as of December 31, 2019 does not include all subsequent fair value adjustments that are still being finalized.
Available Information
The Company’s website address is www.prosperitybankusa.com. The Company makes available free of charge on or through its website its Annual Report on Form 10-K, quarterly reports on Form 10-Q, current reports on Form 8-K and all amendments to those reports filed or furnished pursuant to Section 13(a) or 15(d) of the Securities Exchange Act of 1934, as amended (“Exchange Act”), as soon as reasonably practicable after such material is electronically filed with or furnished to the Securities and Exchange Commission. Information contained on the Company’s website is not incorporated by reference into this Annual Report on Form 10-K and is not part of this or any other report.
Officers and Associates
The Company’s directors and officers are important to the Company’s success and play a key role in the Company’s business development efforts by actively participating in civic and public service activities in the communities served by the Company.
The Company has invested heavily in its officers and associates by recruiting talented officers in its market areas and providing them with economic incentives. The senior management team has substantial experience in the Company’s market areas and the surrounding communities in which the Company has a presence. Most banking center locations are overseen by a local president or manager with knowledge of the community and lending expertise in the specific industries found in the community. The Company operates each banking center as a separate profit center, maintaining separate data with respect to each banking center’s net interest income, efficiency ratio, deposit growth, loan growth and overall profitability. Banking center presidents and managers are accountable for performance in these areas and compensated accordingly.
As of December 31, 2019, the Company and the Bank had 3,901 full-time equivalent associates, 1,188 of whom were officers of the Bank. The Company provides medical and hospitalization insurance to its full-time associates. The Company considers its relations with associates to be good. Neither the Company nor the Bank is a party to any collective bargaining agreement.
Banking Activities
The Company, through the Bank, offers a variety of traditional loan and deposit products to its customers, which consist primarily of consumers and businesses throughout Texas and Oklahoma. At December 31, 2019, the Bank maintained approximately 741,100 separate deposit accounts including certificates of deposit and 73,200 separate loan accounts. At December 31, 2019, noninterest-bearing demand deposits were 32.1% of the Bank’s total deposits. For the year ended December 31, 2019, the Company’s average cost of funds was 0.70% and the Company’s average cost of deposits (excluding all borrowings) was 0.61%.
The Company has been an active real estate lender, with commercial real estate (including farmland and multifamily residential), 1-4 family residential (including home equity) and construction, land development and other land loans comprising 37.4%, 23.3% and 11.0%, respectively, of the Company’s total loans as of December 31, 2019. The Company is active in commercial and industrial lending, with commercial loans comprising 17.0% of the Company’s total loans as of December 31, 2019. The Company also offers agricultural loans, loans for automobiles and other consumer durables, home equity loans, debit and credit cards, internet banking and other cash management services, mobile banking, trust and wealth management, retail brokerage services, mortgage banking services and automated telephone banking. The Company offers businesses a broad array of loan products including term loans, lines of credit and loans for working capital, business expansion and the purchase of equipment and machinery; land development and interim construction loans for builders; and owner-occupied and non-owner occupied commercial real estate loans. Additionally, with the Merger, the Company acquired a Warehouse Purchase Program that allows mortgage banking company customers to close one- to four-family real estate loans in their own name and manage their cash flow needs until the loans are sold to investors.
2
By offering certificates of deposit, interest checking accounts, savings accounts and overdraft protection at competitive rates, the Company gives its depositors a full range of traditional deposit products.
As of December 31, 2019, the Company maintains a trust department with total assets of $2.4 billion, including managed assets of $1.9 billion. The trust department provides trust services in the Company’s various market areas.
Business Strategies
The Company’s main objective is to increase deposits and loans through internal growth, as well as through acquisition opportunities, while maintaining efficiency, individualized customer service and maximizing profitability. To achieve this objective, the Company has employed the following strategic goals:
Continue Community Banking Emphasis. Although the Company has significantly grown in the last several years, it intends to continue operating as a community banking organization focused on meeting the specific needs of consumers and businesses in its market areas. The Company provides a high degree of responsiveness combined with a wide variety of banking products and services. The Company staffs its banking centers with experienced bankers who possess lending expertise in the specific industries found in the given community, and gives them authority within general parameters to make certain pricing and credit decisions, avoiding the bureaucratic structure of larger banks. Each banking center has its own listed local business telephone number. Customers are served by a local banker with decision making authority. Additionally, with the Merger, the Company acquired specialty, commercial lending lines of business staffed by bankers with lending expertise in their respective markets—commercial middle market, energy, mortgage warehouse and insurance lending.
Expand Market Share Through Internal Growth and a Disciplined Acquisition Strategy. The Company intends to continue seeking opportunities, both inside and outside its existing markets, to expand either by acquiring existing banks or branches of banks or by establishing new banking centers. All of the Company’s acquisitions have been accretive to earnings within 12 months after acquisition date and generally have supplied the Company with relatively low-cost deposits which have been used to fund the Company’s lending and investing activities. However, future acquisitions, if any, may not be accretive to earnings within any particular time period. Factors used by the Company to evaluate expansion opportunities include (1) the similarity in management and operating philosophies, (2) whether the acquisition will be accretive to earnings and enhance shareholder value, (3) whether the acquisition will strategically expand the Company’s geographic footprint and (4) the opportunity to enhance the Company’s market presence in existing market areas.
Increase Loan Volume and Diversify Loan Portfolio. While maintaining its prudent approach to lending, the Company has emphasized both new and existing loan products, focusing on increasing its commercial real estate, residential real estate and commercial loan portfolios. Additionally, on November 1, 2019, the merger with LegacyTexas was completed, which increased the Company’s loan portfolio. During 2019, the Company’s total loans increased from $10.37 billion to $18.85 billion or 81.7%. Commercial and industrial loans increased 116.1% and represented 17.0% of the total loan portfolio as of December 31, 2019. Commercial real estate loans (including multifamily residential) increased 85.3% and represented 34.9% of the total portfolio as of December 31, 2019. One-to four family residential loans increased 59.1% and represented 20.6% of the total loan portfolio as of December 31, 2019. Construction, land development and other land loans increased 27.2%, and represented 11.0% of the total loan portfolio as of December 31, 2019. Warehouse Purchase Program loans, a newly acquired product, represented 8.2% of the total loan portfolio as of December 31, 2019.
Maintain Sound Asset Quality. The Company continues to maintain the sound asset quality that has been representative of its historical loan portfolio. As the Company continues to diversify and increase its lending activities and acquire loans in acquisitions, it may face higher risks of nonpayment and increased risks in the event of prolonged economic downturns. The Company intends to continue to employ the strict underwriting guidelines and comprehensive loan review process that have contributed to its low incidence of nonperforming assets and its minimal charge-offs in relation to its size. Nonperforming assets were 0.33% of total loans and other real estate at December 31, 2019. Nonperforming assets were 0.36% of total loans, excluding Warehouse Purchase Program loans, and other real estate at December 31, 2019.
Continue Focus on Efficiency. The Company plans to maintain its stringent cost control practices and policies. The Company has invested significantly in the infrastructure required to centralize many of its critical operations, such as data processing and loan and deposit processing. For its banking centers, which the Company operates as independent profit centers, the Company supplies complete support in the areas of loan review, loan and deposit processing, internal audit, compliance and training. Management believes that this centralized infrastructure can accommodate additional growth while enabling the Company to minimize operational costs through economies of scale.
Enhance Cross-Selling. The Company uses incentives and friendly competition to encourage cross-selling efforts and increase cross-selling results among its associates. Officers and associates have access to each customer’s existing and related account
3
relationships and are better able to inform customers of additional products when customers visit or call the various banking centers or use their drive-in facilities. In addition, the Company includes product information in monthly statements and other mailings.
Competition
The banking business is highly competitive, and the profitability of the Company depends principally on its ability to compete in its market areas. The Company competes with other commercial banks, savings banks, savings and loan associations, credit unions, finance companies, mutual funds, insurance companies, brokerage and investment banking firms, asset-based nonbank lenders and certain other nonfinancial entities, including retail stores that may maintain their own credit programs and certain governmental organizations that may offer more favorable financing than the Company. The Company believes it has been able to compete effectively with other financial institutions by emphasizing customer service, technology and responsive decision-making with respect to loans, by establishing long-term customer relationships and building customer loyalty and by providing products and services designed to address the specific needs of its customers.
Supervision and Regulation
The supervision and regulation of bank holding companies and their subsidiaries is intended primarily for the protection of depositors, the Deposit Insurance Fund (“DIF”) of the FDIC and the banking system as a whole, and not for the protection of the bank holding company’s shareholders or creditors. The banking agencies have broad enforcement power over bank holding companies and banks including the power to impose substantial fines and other penalties for violations of laws and regulations.
The following description summarizes some of the laws to which the Company and the Bank are subject. References in this Annual Report on Form 10-K to applicable statutes and regulations are brief summaries thereof, do not purport to be complete, and are qualified in their entirety by reference to such statutes and regulations.
The Company
The Company is a financial holding company pursuant to the Gramm-Leach-Bliley Act and a bank holding company registered under the Bank Holding Company Act of 1956, as amended (“BHCA”). Accordingly, the Company is subject to supervision, regulation and examination by the Board of Governors of the Federal Reserve System (“Federal Reserve Board”). The Gramm-Leach-Bliley Act, the BHCA and other federal laws subject financial and bank holding companies to particular restrictions on the types of activities in which they may engage, and to a range of supervisory requirements and activities, including regulatory enforcement actions for violations of laws and regulations. Further, since the Company has securities registered with the Securities and Exchange Commission and traded on the New York Stock Exchange, it is also subject to the supervision and regulation of these organizations.
Regulatory Restrictions on Dividends and Repurchases. The Company is regarded as a legal entity separate and distinct from the Bank. The principal source of the Company’s revenues is dividends received from the Bank. As described in more detail below, federal and state law places limitations on the amount that banks may pay in dividends, which the Bank must adhere to when paying dividends to the Company. It is the policy of the Federal Reserve Board that bank holding companies should pay cash dividends on common stock only out of income available over the past year and only if the prospective rate of earnings retention is consistent with the organization’s expected capital needs and financial condition. The Federal Reserve Board’s policy provides that bank holding companies should not maintain a level of cash dividends that undermines the bank holding company’s ability to serve as a source of strength to its banking subsidiaries. The Federal Reserve Board is authorized to limit or prohibit the payment of dividends if, in the Federal Reserve Board’s opinion, the payment of dividends would constitute an unsafe or unsound practice in light of a bank holding company’s financial condition. In addition, the Federal Reserve Board has indicated that each bank holding company should carefully review its dividend policy, and has discouraged payment ratios that are at maximum allowable levels, which is the maximum dividend amount that may be issued and allow the company to still maintain its target Tier 1 capital ratio, unless both asset quality and capital are very strong.
In July 2019, the federal bank regulators adopted final rules (the “Capital Simplifications Rules”) that, among other things, eliminated the standalone prior approval requirement in the Basel III Capital Rules for any repurchase of common stock. In certain circumstances, the Company’s repurchases of its common stock may be subject to a prior approval or notice requirement under other regulations, policies or supervisory expectations of the Federal Reserve Board. Any redemption or repurchase of preferred stock or subordinated debt remains subject to the prior approval of the Federal Reserve Board.
Source of Strength. Federal Reserve Board policy and federal law require a bank holding company to act as a source of financial strength to each of its banking subsidiaries. Under this requirement, the Company is expected to commit resources to support the Bank, including support at times when the Company may not be in a financial position to provide such resources. Any capital loans by a bank holding company to any of its subsidiary banks are subordinate in right of payment to deposits and to certain other indebtedness of such subsidiary banks. As discussed below, a bank holding company, in certain circumstances, could be required to guarantee the capital plan of an undercapitalized banking subsidiary.
4
In the event of a bank holding company’s bankruptcy under Chapter 11 of the U.S. Bankruptcy Code, the trustee will be deemed to have assumed and is required to cure immediately any deficit under any commitment by the debtor holding company to any of the federal banking agencies to maintain the capital of an insured depository institution. Any claim for breach of such obligation will generally have priority over most other unsecured claims.
Scope of Permissible Activities. Under the BHCA, bank holding companies generally may not acquire a direct or indirect interest in or control of more than 5% of the voting shares of any company that is not a bank or bank holding company and may not engage in activities other than those of banking, managing or controlling banks or furnishing services to or performing services for its subsidiaries, except that it may engage in, directly or indirectly, certain activities that the Federal Reserve Board has determined to be so closely related to banking or managing and controlling banks as to be a proper incident thereto. In approving acquisitions or the addition of activities, the Federal Reserve Board considers, among other things, whether the acquisition or the additional activities can reasonably be expected to produce benefits to the public, such as greater convenience, increased competition, or gains in efficiency, that outweigh such possible adverse effects as undue concentration of resources, decreased or unfair competition, conflicts of interest or unsound banking practices.
Notwithstanding the foregoing, the Gramm-Leach-Bliley Act eliminated the barriers to affiliations among banks, securities firms, insurance companies and other financial service providers and permits bank holding companies to become financial holding companies and thereby affiliate with securities firms and insurance companies and engage in other activities that are financial in nature. The Gramm-Leach-Bliley Act defines “financial in nature” to include securities underwriting, dealing and market making; sponsoring mutual funds and investment companies; insurance underwriting and agency; merchant banking activities; and activities that the Federal Reserve Board has determined to be closely related to banking. Generally, no regulatory approval will be required for a financial holding company, such as the Company, to acquire a company, other than a bank or savings association, engaged in activities that are financial in nature or incidental to activities that are financial in nature as determined by the Federal Reserve Board.
The Company’s financial holding company status depends upon it maintaining its status as “well capitalized” and “well managed” under applicable Federal Reserve Board regulations. If a financial holding company ceases to meet these requirements, the Federal Reserve Board may impose corrective capital and/or managerial requirements on the financial holding company and place limitations on its ability to conduct the broader financial activities permissible for financial holding companies. Until the financial holding company returns to compliance, it may not acquire a company engaged in such financial activities without prior approval of the Federal Reserve Board. In addition, the Federal Reserve Board may require divestiture of the holding company’s depository institutions and/or its non-bank subsidiaries if the deficiencies persist.
While the Federal Reserve Board is the “umbrella” regulator for financial holding companies and has the power to examine banking organizations engaged in new activities, regulation and supervision of activities which are financial in nature or determined to be incidental to such financial activities will be handled along functional lines. Accordingly, activities of subsidiaries of a financial holding company will be regulated by the agency or authorities with the most experience regulating that activity as it is conducted in a financial holding company.
Safe and Sound Banking Practices. Bank holding companies are not permitted to engage in unsafe and unsound banking practices. The Federal Reserve Board’s Regulation Y, for example, generally requires a holding company to give the Federal Reserve Board prior notice of any redemption or repurchase of its own equity securities if the consideration to be paid, together with the consideration paid for any repurchases or redemptions in the preceding year, is equal to 10% or more of the company’s consolidated net worth. The Federal Reserve Board may oppose the transaction if it believes that the transaction would constitute an unsafe or unsound practice or would violate any law or regulation. Depending upon the circumstances, the Federal Reserve Board could take the position that paying a dividend would constitute an unsafe or unsound banking practice.
The Federal Reserve Board has broad authority to prohibit activities of bank holding companies and their nonbanking subsidiaries which represent unsafe and unsound banking practices or which constitute violations of laws or regulations, and can assess civil money penalties for certain activities conducted on a knowing and reckless basis if those activities caused a substantial loss to a depository institution. The penalties can be in excess of $1.0 million for each day the activity continues.
Anti-Tying Restrictions. Bank holding companies and their affiliates are prohibited from tying the provision of certain services, such as extensions of credit, to other services offered by a holding company or its affiliates.
Basel III Capital Adequacy Requirements. In July 2013, the Federal Reserve Board and the FDIC published the Basel III Capital Rules establishing a new comprehensive capital framework for U.S. banking organizations. The rules implemented the Basel Committee’s December 2010 framework known as “Basel III” for strengthening international capital standards as well as certain provisions of the Dodd-Frank Act. The Basel III Capital Rules define the components of capital and address other issues affecting the numerator in banking institutions’ regulatory capital ratio calculations and also address risk weights and other issues affecting the denominator.
5
Since being fully phased in on January 1, 2019, the Basel III Capital Rules require the Company to maintain an additional capital conservation buffer, composed entirely of Common Equity Tier 1 (“CET1”), of 2.5%, effectively resulting in minimum ratios of (1) CET1 to risk-weighted assets of 7.0%, (2) Tier 1 capital to risk-weighted assets of 8.5%, (3) total capital (that is, Tier 1 plus Tier 2) to risk-weighted assets of 10.5% and (4) Tier 1 capital to average quarterly assets as reported on consolidated financial statements (known as the “leverage ratio”) of 4.0%. As of December 31, 2019, the Company’s ratio of CET1 to risk-weighted assets was 12.30%, Tier 1 capital to risk-weighted assets was 12.30%, total capital to risk-weighted assets was 12.70% and Tier 1 capital to average quarterly assets was 10.42%.
Banking institutions that fail to meet the effective minimum ratios once the capital conservation buffer is taken into account, as detailed above, will be subject to constraints on capital distributions, including dividends and share repurchases, and certain discretionary executive compensation. The severity of the constraints depends on the amount of the shortfall and the institution’s “eligible retained income” (that is, four quarter trailing net income, net of distributions and tax effects not reflected in net income).
With respect to the Bank, the Basel III Capital Rules also revised the “prompt corrective action” regulations as discussed below under “The Bank—Corrective Measures for Capital Deficiencies.”
The Basel III Capital Rules prescribe a standardized approach for risk weightings that expands the risk-weighting categories from the general risk-based capital rules to a larger and more risk-sensitive number of categories, depending on the nature of the assets, generally ranging from 0% for U.S. government and agency securities, to 600% for certain equity exposures, and resulting in higher risk weights for a variety of asset categories.
The federal banking agencies’ risk-based and leverage capital ratios are minimum supervisory ratios generally applicable to banking organizations that meet certain specified criteria. Banking organizations not meeting these criteria are expected to operate with capital positions well above the minimum ratios. The federal bank regulatory agencies may set capital requirements for a particular banking organization that are higher than the minimum ratios when circumstances warrant. Federal Reserve Board guidelines also provide that banking organizations experiencing internal growth or making acquisitions will be expected to maintain strong capital positions substantially above the minimum supervisory levels, without significant reliance on intangible assets.
Liquidity Requirements. The Basel III liquidity framework requires banks and bank holding companies to measure their liquidity against specific liquidity tests. One test, referred to as the liquidity coverage ratio (“LCR”), is designed to ensure that a banking entity maintains an adequate level of unencumbered high-quality liquid assets equal to the entity’s expected net cash outflow for a 30-day time horizon (or, if greater, 25% of its expected total cash outflow) under an acute liquidity stress scenario. The other test, referred to as the net stable funding ratio (“NSFR”), is designed to promote more medium- and long-term funding of the assets and activities of banking entities over a one-year time horizon. Neither the LCR rule nor the proposed NSFR rule apply to the Company and the Bank.
Imposition of Liability for Undercapitalized Subsidiaries. Bank regulators are required to take “prompt corrective action” to resolve problems associated with insured depository institutions whose capital declines below certain levels. In the event an institution becomes “undercapitalized,” it must submit a capital restoration plan. The capital restoration plan will not be accepted by the regulators unless each company having control of the undercapitalized institution guarantees the subsidiary’s compliance with the capital restoration plan up to a certain specified amount. Any such guarantee from a depository institution’s holding company is entitled to a priority of payment in bankruptcy.
The aggregate liability of the holding company of an undercapitalized bank is limited to the lesser of 5% of the institution’s assets at the time it became undercapitalized or the amount necessary to cause the institution to be “adequately capitalized.” The bank regulators have greater power in situations where an institution becomes “significantly” or “critically” undercapitalized or fails to submit a capital restoration plan. For example, a bank holding company controlling such an institution can be required to obtain prior Federal Reserve Board approval of proposed dividends, or might be required to consent to a consolidation or to divest the troubled institution or other affiliates.
Acquisitions by Bank Holding Companies. The BHCA requires every bank holding company to obtain the prior approval of the Federal Reserve Board before it may acquire all or substantially all of the assets of any bank, or ownership or control of any voting shares of any bank, if after such acquisition it would own or control, directly or indirectly, 5% or more of the voting shares of such bank. In approving bank acquisitions by bank holding companies, the Federal Reserve Board is required to consider, among other things, the financial and managerial resources and future prospects of the bank holding company and the banks concerned, the convenience and needs of the communities to be served and various competitive factors.
Control Acquisitions. The Change in Bank Control Act prohibits a person or group of persons from acquiring “control” of a bank holding company unless the Federal Reserve Board has been notified and has not objected to the transaction. Under a rebuttable presumption established by the Federal Reserve Board, the acquisition of 10% or more of a class of voting stock of a bank holding
6
company with a class of securities registered under Section 12 of the Exchange Act, such as the Company, would, under the circumstances set forth in the presumption, constitute acquisition of control of the Company. In addition, a person may not acquire 25% (5% in the case of an acquiror that is a bank holding company) or more of a bank holding company’s or bank’s voting securities, or otherwise obtain control or a controlling influence over a bank holding company or bank without the approval of the Federal Reserve Board.
In January 2020, the Federal Reserve Board approved a final rule that clarifies the framework for when a company controls a bank holding company or bank under the BHCA. In particular, the final rule sets forth tiered presumptions of control in the Federal Reserve Board’s regulations. Under the BHCA, a company controls a bank holding company if it controls 25 percent or more of any class of voting securities of the bank holding company. A company that controls less than 5 percent of any class of voting securities of a bank holding company is presumed not to control the bank holding company. In instances in which a company owns at least 5 percent but less than 25 percent, the Federal Reserve Board considers the full facts and circumstances of the relationship between the company and the bank holding company to determine whether the company controls the bank holding company. As part of its determination as to control, the Federal Reserve Board considers, among other things, level of ownership of voting and non-voting securities, board representation, business relationships, senior management interlocks, contractual limits on major operational or policy decisions, proxies on issues, threats to dispose of securities, and management agreements. The rule also provides several additional examples of presumptions of control and noncontrol, along with various ancillary provisions such as definitions of terms used in the presumptions. The changes in the final rule become effective April 1, 2020.
The Volcker Rule. The Volcker Rule under the Dodd-Frank Act prohibits banks and their affiliates from engaging in proprietary trading and investing in and sponsoring certain hedge funds and private equity funds. Since neither the Company nor the Bank engages in the types of trading or investing covered by the Volcker Rule, the Volcker Rule does not currently have any effect on the operations of the Company or the Bank.
The Bank
The Bank is a Texas-chartered banking association, the deposits of which are insured by the DIF of the FDIC. The Bank is not a member of the Federal Reserve System, therefore the Bank is subject to supervision and regulation by the FDIC and the Texas Department of Banking. Such supervision and regulation subject the Bank to special restrictions, requirements, potential enforcement actions and periodic examination by the FDIC and the Texas Department of Banking. Because the Federal Reserve Board regulates the Company, the Federal Reserve Board also has supervisory authority which affects the Bank. Further, because the Bank has total assets of over $10 billion, the Bank is also subject to supervision and regulation by the Consumer Financial Protection Bureau (“CFPB”). The CFPB regulates the offering and provision of consumer financial products and services under the federal consumer financial laws.
Equivalence to National Bank Powers. The Texas Constitution, as amended in 1986, provides that a Texas-chartered bank has the same rights and privileges that are or may be granted to national banks domiciled in Texas. To the extent that the Texas laws and regulations may have allowed state-chartered banks to engage in a broader range of activities than national banks, the Federal Deposit Insurance Corporation Improvement Act (“FDICIA”) has operated to limit this authority. FDICIA provides that no state bank or subsidiary thereof may engage as principal in any activity not permitted for national banks, unless the institution complies with applicable capital requirements and the FDIC determines that the activity poses no significant risk to the DIF. In general, statutory restrictions on the activities of banks are aimed at protecting the safety and soundness of depository institutions.
Financial Modernization. Under the Gramm-Leach-Bliley Act, a national bank may establish a financial subsidiary and engage, subject to limitations on investment, in activities that are financial in nature, other than insurance underwriting as principal, insurance company portfolio investment, real estate development, real estate investment, annuity issuance and merchant banking activities. To do so, a bank must be well capitalized, well managed and have a CRA rating of satisfactory or better. Subsidiary banks of a financial holding company or national banks with financial subsidiaries must remain well capitalized and well managed in order to continue to engage in activities that are financial in nature without regulatory actions or restrictions, which could include divestiture of the financial-in-nature subsidiary or subsidiaries. In addition, a financial holding company or a bank may not acquire a company that is engaged in activities that are financial in nature unless each of the subsidiary banks of the financial holding company or the bank has a CRA rating of satisfactory or better.
Although the powers of state chartered banks are not specifically addressed in the Gramm-Leach-Bliley Act, Texas-chartered banks such as the Bank, will have the same if not greater powers as national banks through the parity provision contained in the Texas Constitution.
Branching. Pursuant to the Dodd-Frank Act, banks are permitted to engage in de novo interstate branching if the laws of the state where the new branch is to be established would permit the establishment of the branch if it were chartered by such state, subject to applicable regulatory review and approval requirements. The Dodd-Frank Act also modified certain regulatory requirements for
7
interstate mergers and acquisitions, including that the acquiring bank must be well capitalized and well managed. Texas law provides that a Texas-chartered bank can establish a branch anywhere in Texas or any other state, subject to federal law requirements, provided that the branch is approved in advance by the Texas Department of Banking. The branch must also be approved by the FDIC, which considers a number of factors, including financial history, capital adequacy, earnings prospects, character of management, needs of the community and consistency with corporate powers.
Restrictions on Transactions with Affiliates and Insiders. Transactions between the Bank and its nonbanking affiliates, including the Company, are subject to Section 23A and Section 23B of the Federal Reserve Act. In general, Section 23A imposes limits on the amount of such transactions to 10% of the Bank’s capital stock and surplus and requires that such transactions be secured by designated amounts of specified collateral. It also limits the amount of advances to third parties which are collateralized by the securities or obligations of the Company or its subsidiaries. Section 23B generally requires that certain transactions between the Bank and its affiliates be on terms substantially the same, or at least as favorable to the Bank, as those prevailing at the time for comparable transactions with or involving other nonaffiliated persons.
Loans to directors, executive officers, principal shareholders and their related interests (collectively referred to herein as “insiders”) are subject to restrictions contained in the Federal Reserve Act and Regulation O, which apply to all insured institutions and their subsidiaries and holding companies. Insiders are subject to enforcement actions for knowingly accepting loans in violation of applicable restrictions.
Restrictions on Distribution of Subsidiary Bank Dividends and Assets. Dividends paid by the Bank have provided a substantial part of the Company’s operating funds and for the foreseeable future it is anticipated that dividends paid by the Bank to the Company will continue to be the Company’s principal source of operating funds. Capital adequacy requirements serve to limit the amount of dividends that may be paid by the Bank. Under federal law, the Bank cannot pay a dividend if, after paying the dividend, the Bank will be “undercapitalized.” The FDIC may declare a dividend payment to be unsafe and unsound even though the Bank would continue to meet its capital requirements after the dividend. The Bank is also subject to limitations on the payment of dividends under Texas law. Because the Company is a legal entity separate and distinct from its subsidiaries, its right to participate in the distribution of assets of any subsidiary upon the subsidiary’s liquidation or reorganization will be subject to the prior claims of the subsidiary’s creditors. In the event of a liquidation or other resolution of an insured depository institution, the claims of depositors and other general or subordinated creditors are entitled to a priority of payment over the claims of holders of any obligation of the institution to its shareholders, including any depository institution holding company (such as the Company) or any shareholder or creditor thereof.
Consumer Financial Protection. The Bank is subject to a number of federal and state consumer protection laws that extensively govern its relationship with its customers. These laws include the Equal Credit Opportunity Act, the Fair Credit Reporting Act, the Truth in Lending Act, the Truth in Savings Act, the Electronic Fund Transfer Act, the Expedited Funds Availability Act, the Home Mortgage Disclosure Act, the Fair Housing Act, the Real Estate Settlement Procedures Act, the Fair Debt Collection Practices Act, the Service Members Civil Relief Act and these laws’ respective state-law counterparts, as well as state usury laws and laws regarding unfair and deceptive acts and practices. These and other federal laws, among other things, require disclosures of the cost of credit and terms of deposit accounts, provide substantive consumer rights, prohibit discrimination in credit transactions, regulate the use of credit report information, provide financial privacy protections, prohibit unfair, deceptive and abusive practices, restrict the Bank’s ability to raise interest rates and subject the Bank to substantial regulatory oversight. Violations of applicable consumer protection laws can result in significant potential liability from litigation brought by customers, including actual damages, restitution and attorneys’ fees. Federal bank regulators, state attorneys general and state and local consumer protection agencies may also seek to enforce consumer protection requirements and obtain these and other remedies, including regulatory sanctions, customer rescission rights and civil money penalties in each jurisdiction in which the Bank operates. Failure to comply with consumer protection requirements may also result in the Bank’s failure to obtain any required regulatory approval for merger or other acquisition transactions the Bank may wish to pursue or its prohibition from engaging in such transactions even if approval is not required.
The Dodd-Frank Act established the CFPB, which has supervisory, examination and enforcement authority over depository institutions with total assets of $10 billion or greater and other providers of consumer financial products or services. The CFPB has broad rulemaking authority for a wide range of federal consumer financial laws, including, among other things, the authority to prohibit “unfair, deceptive or abusive” acts and practices. The CFPB can issue cease-and-desist orders against banks and other entities that violate federal consumer financial laws and may also institute a civil action against an entity in violation of federal consumer financial laws in order to impose a civil penalty or injunction.
Customer Information Security. The federal banking agencies have adopted guidelines for safeguarding confidential, personal, nonpublic customer information. These guidelines require each financial institution, under the supervision and ongoing oversight of its board of directors or an appropriate committee thereof, to create, implement and maintain a comprehensive written information security program designed to ensure the security and confidentiality of customer information, protect against any anticipated threats or hazard to the security or integrity of such information and protect against unauthorized access to or use of such information that could result in substantial harm or inconvenience to any customer. The Bank has adopted a customer information security program to comply with these requirements.
8
Examinations. The FDIC periodically examines and evaluates state non-member banks, like the Bank. The Texas Department of Banking also conducts examinations of Texas-chartered banks, but may accept the results of a federal examination in lieu of conducting an independent examination. Additionally, the FDIC and Texas Department of Banking may elect to conduct a joint examination. Because the Bank has total assets of over $10 billion, the CFPB also has examination authority with respect to the Bank’s compliance with federal consumer protection laws.
Capital Adequacy Requirements. The FDIC has adopted regulations establishing minimum requirements for the capital adequacy of insured institutions. The FDIC may establish higher minimum requirements if, for example, a bank has previously received special attention or has a high susceptibility to interest rate risk.
The FDIC’s risk-based capital guidelines generally require state banks to have minimum ratios of CET1 to risk-weighted assets of 4.5%, Tier 1 capital to total risk-weighted assets of 6.0% and total capital to total risk-weighted assets of 8.0%. The capital categories have the same definitions for the Bank as for the Company. As of December 31, 2019, the Bank’s ratio of CET1 to risk-weighted assets was 12.49%, Tier 1 capital to total risk-weighted assets was 12.49% and its ratio of total capital to total risk-weighted assets was 12.89%.
The FDIC’s leverage guidelines require state banks to maintain Tier 1 capital of no less than 4.0% of average total assets. As of December 31, 2019, the Bank’s ratio of Tier 1 capital to average quarterly assets (leverage ratio) was 10.58%.
Corrective Measures for Capital Deficiencies. The federal banking regulators are required to take “prompt corrective action” with respect to capital-deficient institutions. Agency regulations define, for each capital category, the levels at which institutions are “well-capitalized,” “adequately capitalized,” “undercapitalized,” “significantly undercapitalized” and “critically undercapitalized.”
|
|
• |
A bank is “well capitalized” if it has a total risk-based capital ratio of 10.0% or higher; a CET1 capital ratio of 6.5% or higher; a Tier 1 risk-based capital ratio of 8.0% or higher; a leverage ratio of 5.0% or higher; and is not subject to any written agreement, order or directive requiring it to maintain a specific capital level for any capital measure. |
|
|
• |
A bank is “adequately capitalized” if it has a total risk-based capital ratio of 8.0% or higher; a CET1 capital ratio of 4.5% or higher; a Tier 1 risk-based capital ratio of 6.0% or higher; a leverage ratio of 4.0% or higher; and does not meet the criteria for a well capitalized bank. |
|
|
• |
A bank is “undercapitalized” if it has a total risk-based capital ratio of less than 8.0%; a CET1 capital ratio less than 4.5%; a Tier 1 risk-based capital ratio of less than 6.0% or a leverage ratio of less than 4.0%. |
|
|
• |
A bank is “significantly undercapitalized” if it has a total risk-based capital ratio of less than 6.0%; a CET1 capital ratio less than 3.0%; a Tier 1 risk-based capital ratio of less than 4.0% or a leverage ratio of less than 3.0%. |
|
|
• |
A bank is “critically undercapitalized” if it has a tangible equity ratio to total assets that is equal to or less than 2.0%. |
At December 31, 2019, the Bank was classified as “well-capitalized” for purposes of the FDIC’s prompt corrective action regulations in effect as of such date.
In addition to requiring undercapitalized institutions to submit a capital restoration plan, agency regulations contain broad restrictions on certain activities of undercapitalized institutions including asset growth, acquisitions, branch establishment and expansion into new lines of business. With certain exceptions, an insured depository institution is prohibited from making capital distributions, including dividends, and is prohibited from paying management fees to control persons if the institution would be undercapitalized after any such distribution or payment.
As an institution’s capital decreases, the FDIC’s enforcement powers become more severe. A significantly undercapitalized institution is subject to mandated capital raising activities, restrictions on interest rates paid and transactions with affiliates, removal of management and other restrictions. The FDIC has only very limited discretion in dealing with a critically undercapitalized institution and is virtually required to appoint a receiver or conservator.
Banks with risk-based capital and leverage ratios below the required minimums may also be subject to certain administrative actions, including the termination of deposit insurance upon notice and hearing, or a temporary suspension of insurance without a hearing in the event the institution has no tangible capital.
Deposit Insurance Assessments. The deposits of the Bank are insured up to applicable limits by the DIF, and the Bank must pay deposit insurance assessments to the FDIC for such deposit insurance protection. A depository institution’s DIF assessment is calculated by multiplying its assessment rate by the assessment base, which is defined as the average consolidated total assets less the average tangible equity of the depository institution. The initial base assessment rate is based on its capital level and CAMELS ratings,
9
certain financial measures to assess an institution’s ability to withstand asset related stress and funding related stress and, in some cases, additional discretionary adjustments by the FDIC to reflect additional risk factors.
Interchange Fees. Under the Durbin Amendment to the Dodd-Frank Act, the Federal Reserve Board adopted rules establishing standards for assessing whether the interchange fees that may be charged with respect to certain electronic debit transactions are “reasonable and proportional” to the costs incurred by issuers for processing such transactions. Interchange fees, or “swipe” fees, are charges that merchants pay to the Bank and other card-issuing banks for processing electronic payment transactions. Federal Reserve Board rules applicable to financial institutions that have assets of $10 billion or more provide that the maximum permissible interchange fee for an electronic debit transaction is the sum of 21 cents per transaction and 5 basis points multiplied by the value of the transaction. An upward adjustment of no more than 1 cent to an issuer’s debit card interchange fee is allowed if the card issuer develops and implements policies and procedures reasonably designed to achieve certain fraud-prevention standards. The Federal Reserve Board also has rules governing routing and exclusivity that require issuers to offer at least two unaffiliated networks for routing transactions on each debit or prepaid product.
Concentrated Commercial Real Estate Lending Regulations. The federal banking agencies, including the FDIC, have promulgated guidance governing financial institutions with concentrations in commercial real estate lending. The guidance provides that a bank has a concentration in commercial real estate lending if (1) total reported loans for construction, land development and other land represent 100% or more of total capital or (2) total reported loans secured by multifamily and non-farm residential properties and loans for construction, land development and other land represent 300% or more of total capital and the bank’s commercial real estate loan portfolio has increased 50% or more during the prior 36 months. Owner occupied loans are excluded from this second category. If a concentration is present, management must employ heightened risk management practices that address the following key elements: board and management oversight and strategic planning, portfolio management, development of underwriting standards, risk assessment and monitoring through market analysis and stress testing, and maintenance of increased capital levels as needed to support the level of commercial real estate lending.
Community Reinvestment Act. The Community Reinvestment Act of 1977 (“CRA”) and the regulations issued thereunder are intended to encourage banks to help meet the credit needs of their communities, including low and moderate income neighborhoods, consistent with the safe and sound operations of the banks. These regulations also provide for regulatory assessment of a bank’s CRA record when considering applications to establish branches, merger applications and applications to acquire the assets and assume the liabilities of another bank. The Financial Institutions Reform, Recovery, and Enforcement Act (“FIRREA”) requires federal banking agencies to make public a rating of a bank’s performance under the CRA. In the case of a financial holding company or a bank holding company, the CRA performance records of the banks involved in the transaction are reviewed in connection with the filing of an application to acquire ownership or control of shares or assets of a bank or to merge with any other bank holding company. An unsatisfactory record can substantially delay or block the transaction.
In December 2019, the FDIC and the Office of the Comptroller of the Currency (“OCC”) jointly proposed rules that would significantly change existing CRA regulations. The proposed rules are intended to increase bank activity in low- and moderate-income communities where there is significant need for credit, more responsible lending, greater access to banking services, and improvements to critical infrastructure. The proposals change four key areas: (i) clarifying what activities qualify for CRA credit; (ii) updating where activities count for CRA credit; (iii) providing a more transparent and objective method for measuring CRA performance; and (iv) revising CRA-related data collection, record keeping, and reporting. However, the Federal Reserve Board has not joined the proposed rulemaking.
Anti-Money Laundering and Anti-Terrorism Legislation. A major focus of governmental policy on financial institutions in recent years has been aimed at combating money laundering and terrorist financing. The USA PATRIOT Act of 2001 (the “USA Patriot Act”) substantially broadened the scope of United States anti-money laundering laws and regulations by imposing significant new compliance and due diligence obligations, creating new crimes and penalties and expanding the extra-territorial jurisdiction of the United States. The United States Treasury Department has issued, and in some cases proposed, a number of regulations that apply various requirements of the USA Patriot Act to financial institutions. These regulations impose obligations on financial institutions to maintain appropriate policies, procedures and controls to detect, prevent and report money laundering and terrorist financing and to verify the identity of their customers. The regulations also impose specific due diligence requirements on financial institutions that maintain correspondent or private banking relationships with non-U.S. financial institutions or persons. Failure of a financial institution to maintain and implement adequate programs to combat money laundering and terrorist financing, or to comply with all of the relevant laws or regulations, could have serious financial, legal and reputational consequences for the institution and could block or substantially delay a merger or other acquisition transaction.
Office of Foreign Assets Control Regulation. The United States has imposed economic sanctions that affect transactions with designated foreign countries, nationals and others. These are typically known as the “OFAC” rules based on their administration by the U.S. Treasury Department Office of Foreign Assets Control (“OFAC”). The OFAC-administered sanctions targeting countries take many different forms. Generally, however, they contain one or more of the following elements: (1) restrictions on trade with or
10
investment in a sanctioned country, including prohibitions against direct or indirect imports from and exports to a sanctioned country and prohibitions on “U.S. persons” engaging in financial transactions relating to making investments in, or providing investment-related advice or assistance to, a sanctioned country; and (2) a blocking of assets in which the government or specially designated nationals of the sanctioned country have an interest, by prohibiting transfers of property subject to U.S. jurisdiction (including property in the possession or control of U.S. persons). Blocked assets (e.g., property and bank deposits) cannot be paid out, withdrawn, set off or transferred in any manner without a license from OFAC. Failure to comply with these sanctions could have serious financial, legal and reputational consequences, including substantial delay or blocking of a merger or other acquisition transaction.
Incentive Compensation. In June 2010, the Federal Reserve Board, OCC and FDIC issued comprehensive final guidance on incentive compensation policies intended to ensure that the incentive compensation policies of banking organizations do not undermine the safety and soundness of such organizations by encouraging excessive risk-taking. The guidance, which covers all employees that have the ability to materially affect the risk profile of an organization, either individually or as part of a group, is based upon the key principles that a banking organization’s incentive compensation arrangements should (1) provide incentives that do not encourage risk-taking beyond the organization’s ability to effectively identify and manage risks, (2) be compatible with effective internal controls and risk management and (3) be supported by strong corporate governance, including active and effective oversight by the organization’s Board of Directors.
These three principles are incorporated into the proposed revised rules on incentive-based payment arrangements at specified covered institutions released in May 2016 by a number of federal agencies, including the Federal Reserve Board, FDIC and SEC. The proposed revised rules would establish general qualitative requirements applicable to all covered institutions, including the Company and the Bank, that have at least $1 billion in total assets, which would include (1) prohibiting incentive arrangements that encourage inappropriate risks by providing excessive compensation; (2) prohibiting incentive arrangements that encourage inappropriate risks that could lead to a material financial loss; (3) establishing requirements for performance measures to appropriately balance risk and reward; (4) requiring Board of Director oversight of incentive arrangements; and (5) mandating appropriate record-keeping. Under the proposed rule, larger financial institutions with total consolidated assets of at least $50 billion would also be subject to additional requirements.
The Federal Reserve Board and FDIC review, as part of the regular, risk-focused examination process, the incentive compensation arrangements of banking organizations, such as the Company, that are not “large, complex banking organizations.” These reviews are tailored to each organization based on the scope and complexity of the organization’s activities and the prevalence of incentive compensation arrangements. The findings of this supervisory initiative will be included in reports of examination. Deficiencies will be incorporated into the organization’s supervisory ratings, which can affect the organization’s ability to make acquisitions and take other actions. Enforcement actions may be taken against a banking organization if its incentive compensation arrangements, or related risk-management control or governance processes, pose a risk to the organization’s safety and soundness and the organization is not taking prompt and effective measures to correct the deficiencies.
Cybersecurity. In March 2015, federal regulators issued two related statements regarding cybersecurity. One statement indicates that financial institutions should design multiple layers of security controls to establish lines of defense and to ensure that their risk management processes also address the risk posed by compromised customer credentials, including security measures to reliably authenticate customers accessing internet-based services of the financial institution. The other statement indicates that a financial institution’s management is expected to maintain sufficient business continuity planning processes to ensure the rapid recovery, resumption and maintenance of the institution’s operations after a cyber-attack involving destructive malware. A financial institution is also expected to develop appropriate processes to enable recovery of data and business operations and address rebuilding network capabilities and restoring data if the institution or its critical service providers fall victim to this type of cyber-attack. Financial institutions that fail to observe the regulatory guidance could be subject to various regulatory sanctions, including financial penalties. In January 2020, the OCC and the FDIC issued a joint statement on heightened cybersecurity risk to remind financial institutions of sound cybersecurity risk management principles. The principles set forth in the joint statement elaborate on the standards described in the Interagency Guidelines Establishing Information Security Standards and in resources provided by the federal regulators, such as the joint statement on destructive malware issued in March 2015.
In February 2018, the SEC published interpretive guidance to assist public companies in preparing disclosures about cybersecurity risks and incidents. These SEC guidelines, and any other regulatory guidance, are in addition to notification and disclosure requirements under state and federal banking law and regulations.
Legislative and Regulatory Initiatives
From time to time, various legislative and regulatory initiatives are introduced in Congress and state legislatures, as well as by regulatory agencies. Such initiatives may include proposals to expand or contract the powers of bank holding companies and depository institutions or proposals to substantially change the financial institution regulatory system. Such legislation could change
11
banking statutes and the operating environment of the Company in substantial and unpredictable ways. If enacted, such legislation could increase or decrease the cost of doing business, limit or expand permissible activities or affect the competitive balance among banks, savings associations, credit unions, and other financial institutions. The Company cannot predict whether any such legislation will be enacted, and, if enacted, the effect that it, or any implementing regulations, would have on the financial condition or results of operations of the Company. A change in statutes, regulations or regulatory policies applicable to the Company or the Bank could have a material effect on the Company’s business, financial condition and results of operations.
Effect on Economic Environment
The policies of regulatory authorities, including the monetary policy of the Federal Reserve Board, have a significant effect on the operating results of bank holding companies and their subsidiaries. Among the means available to the Federal Reserve Board to affect the money supply are open market operations in U.S. government securities, changes in the discount rate on member bank borrowings and changes in reserve requirements against member bank deposits. These means are used in varying combinations to influence overall growth and distribution of bank loans, investments and deposits; and their use may affect interest rates charged on loans or paid for deposits.
Federal Reserve Board monetary policies have materially affected the operating results of commercial banks in the past and are expected to continue to do so in the future. The nature of future monetary policies and the effect of such policies on the business and earnings of the Company and its subsidiaries cannot be predicted.
|
ITEM 1A. |
RISK FACTORS |
An investment in the Company’s common stock involves risks. The following is a description of the material risks and uncertainties that the Company believes affect its business and an investment in the common stock. Additional risks and uncertainties that the Company is unaware of, or that it currently deems immaterial, also may become important factors that affect the Company and its business. If any of the risks described in this Annual Report on Form 10-K were to occur, the Company’s financial condition, results of operations and cash flows could be materially and adversely affected. If this were to happen, the value of the common stock could decline significantly and all or part of an investment could be lost.
Risks Associated with the Company’s Business
The Company’s business is subject to interest rate risk, and fluctuations in interest rates may adversely affect its financial condition and results of operations.
The majority of the Company’s assets are monetary in nature, and, as a result, the Company is subject to significant risk from changes in interest rates. Changes in interest rates can impact the Company’s net interest income as well as the valuation of its assets and liabilities. The Company’s earnings are significantly dependent on its net interest income. Net interest income is the difference between the interest income earned on loans, investments and other interest-earning assets and the interest expense paid on deposits, borrowings and other interest-bearing liabilities.
Changes in monetary policy, including changes in interest rates, could influence the interest the Company receives on loans and securities and the amount of interest it pays on deposits and borrowings, and could also affect (1) the Company’s ability to originate loans and obtain deposits, (2) the fair value of the Company’s financial assets and liabilities and (3) the average duration of the Company’s mortgage-backed securities portfolio. If the interest rates paid on deposits and other borrowings increase at a faster rate than the interest rates received on loans and other investments, the Company’s net interest income, and therefore earnings, could be adversely affected. Earnings also could be adversely affected if the interest rates received on loans and other investments decrease more quickly than the interest rates paid on deposits and other borrowings. Further, the Company’s assets and liabilities may react differently to changes in overall market rates or conditions because there may be mismatches between the repricing or maturity characteristics of the assets and liabilities. Any substantial, unexpected, prolonged change in market interest rates could have a material adverse effect on the Company’s business, financial condition and results of operations.
12
The Company’s business depends on its ability to successfully manage credit risk.
The Company’s business depends on its ability to successfully measure and manage credit risk. As a lender, the Company is exposed to the risk that the principal of, or interest on, a loan will not be repaid timely or at all or that the value of any collateral supporting a loan will be insufficient to cover the Company’s outstanding exposure. In addition, the Company is exposed to risks with respect to the period of time over which the loan may be repaid, risks relating to proper loan underwriting, risks resulting from changes in economic and industry conditions, and risks inherent in dealing with individual loans and borrowers. The creditworthiness of a borrower is affected by many factors including local market conditions and general economic conditions. If the overall economic climate in the United States, generally, or the Company’s market areas, specifically, experiences material disruption, the Company’s borrowers may experience difficulties in repaying their loans, the collateral the Company holds may decrease in value or become illiquid, and the level of nonperforming loans, charge-offs and delinquencies could rise and require significant additional provisions for credit losses. Additional factors related to the credit quality of commercial loans include the quality of the management of the business and the borrower’s ability both to properly evaluate changes in the supply and demand characteristics affecting their market for products and services and to effectively respond to those changes. Additional factors related to the credit quality of commercial real estate loans include tenant vacancy rates and the quality of management of the property.
The Company’s risk management practices, such as monitoring the concentration of the Company’s loans within specific industries and the Company’s credit approval, review and administrative practices, may not adequately reduce credit risk, and the Company’s credit administration personnel, policies and procedures may not adequately adapt to changes in economic or any other conditions affecting customers and the quality of the loan portfolio. Many of the Company’s loans are made to businesses that are less able to withstand competitive, economic and financial pressures than larger borrowers. Consequently, the Company may have significant exposure if any of these borrowers becomes unable to pay their loan obligations as a result of economic or market conditions, or personal circumstances, such as divorce or death. A failure to effectively measure and limit the credit risk associated with the Company’s loan portfolio may result in loan defaults, foreclosures and additional charge-offs, and may necessitate that the Company significantly increase its allowance for credit losses, each of which could adversely affect the Company’s net income. As a result, the Company’s inability to successfully manage credit risk could have a material adverse effect on the Company’s business, financial condition and results of operations.
The Company’s allowance for credit losses may not be sufficient to cover actual credit losses, which could adversely affect its earnings.
As a lender, the Company is exposed to the risk that its loan customers may not repay their loans according to the terms of these loans and the collateral securing the payment of these loans may be insufficient to fully compensate the Company for the outstanding balance of the loan plus the costs to dispose of the collateral. The Company maintains an allowance for credit losses in an attempt to cover estimated losses inherent in its loan portfolio. Additional credit losses will likely occur in the future and may occur at a rate greater than the Company has experienced to date. The determination of the appropriate level of the allowance inherently involves a high degree of subjectivity and requires the Company to make significant estimates of current credit risks, future trends and general economic conditions, all of which may undergo material changes. If the Company’s assumptions prove to be incorrect or if it experiences significant credit losses in future periods, its current allowance may not be sufficient to cover actual credit losses and adjustments may be necessary to allow for different economic conditions or adverse developments in its loan portfolio. A material addition to the allowance could cause net income, and possibly capital, to decrease.
In addition, federal and state regulators periodically review the Company’s allowance for credit losses and may require the Company to increase its provision for credit losses or recognize further charge-offs, based on judgments different than those of the Company’s management. An increase in the Company’s allowance for credit losses or charge-offs as required by these regulatory agencies could have a material adverse effect on the Company’s operating results and financial condition.
The Financial Accounting Standards Board’s new accounting standard, ASU 2016-13, which established allowances for credit losses became effective for the Company on January 1, 2020. This methodology, known as CECL, reflects the expected credit losses over the lives of financial assets starting when such assets are first acquired. Under this methodology, credit losses will be measured based on past events, current conditions and reasonable and supportable forecasts that affect the collectability of financial assets. The standard is expected to result in increases to allowance levels generally and will require the application of the revised methodology to existing financial assets through a one-time adjustment to retained earnings upon initial effectiveness. See “Notes to Consolidated Financial Statements—Note 1—Nature of Operations and Summary of Significant Accounting and Reporting Policies—New Accounting Pronouncements” for additional information about the standard.
13
The Company’s profitability depends significantly on local economic conditions.
The Company’s success depends primarily on the general economic conditions of the primary markets in Texas and Oklahoma in which it operates and where its loans are concentrated. The local economic conditions in Texas and Oklahoma have a significant impact on the Company’s commercial, real estate and construction, land development and other land loans; the ability of its borrowers to repay their loans; and the value of the collateral securing these loans. Accordingly, if the population or income growth in the Company’s market areas is slower than projected, income levels, deposits and housing starts could be adversely affected and could result in a reduction of the Company’s expansion, growth and profitability. In addition, due to the large number of oil and gas companies in the Company’s market areas, the volatility in oil prices may negatively impact economic conditions in these areas. If the Company’s market areas experience a downturn or a recession for a prolonged period of time, the Company could experience significant increases in nonperforming loans, which could lead to operating losses, impaired liquidity and eroding capital. A significant decline in general economic conditions, caused by inflation, an increase or decline in commodity prices, recession, weather extremes, acts of terrorism, outbreaks of hostilities or other international or domestic calamities, unemployment or other factors could impact these local economic conditions and could negatively affect the Company’s financial condition, results of operations and cash flows.
If the Company is not able to continue its historical levels of growth, it may not be able to maintain its historical earnings trends.
To achieve its past levels of growth, the Company has focused on both internal growth and acquisitions. The Company may not be able to sustain its historical rate of growth or may not be able to grow at all. More specifically, the Company may not be able to obtain the financing necessary to fund additional growth and may not be able to find suitable acquisition candidates. Various factors, such as economic conditions, competition and heightened regulatory scrutiny, may impede or prohibit the opening of new banking centers and the completion of acquisitions. Further, the Company may be unable to attract and retain experienced bankers, which could adversely affect its internal growth. If the Company is not able to continue its historical levels of growth, it may not be able to maintain its historical earnings trends.
If the Company is unable to manage its growth effectively, its operations and profitability could be negatively affected.
The Company faces a variety of risks and difficulties pursuing its growth strategy, including:
|
|
• |
finding suitable markets for expansion; |
|
|
• |
finding suitable candidates for acquisition; |
|
|
• |
attracting funding to support additional growth; |
|
|
• |
maintaining asset quality; |
|
|
• |
attracting and retaining qualified management; |
|
|
• |
managing execution risks; |
|
|
• |
maintaining adequate regulatory capital; and |
|
|
• |
scaling technology platforms. |
In addition, in order to manage its growth and maintain adequate information and reporting systems within its organization, the Company must identify, hire and retain additional qualified associates, particularly in the accounting and operational areas of its business.
If the Company does not manage its growth effectively, its business, financial condition, results of operations and future prospects could be negatively affected, and the Company may not be able to continue to implement its business strategy and successfully conduct its operations.
If the Company is unable to identify and acquire other financial institutions and successfully integrate its acquired businesses, its business and earnings may be negatively affected.
The market for acquisitions remains highly competitive, and the Company may be unable to find acquisition candidates in the future that fit its acquisition and growth strategy. To the extent that the Company is unable to find suitable acquisition candidates, an important component of its growth strategy may be lost.
Acquisitions of financial institutions, such as LegacyTexas, involve operational risks and uncertainties and acquired companies may have unforeseen liabilities, exposure to asset quality problems, key employee and customer retention problems and other
14
problems that could negatively affect the Company’s organization. The Company may not be able to complete future acquisitions; and, if completed, the Company may not be able to successfully integrate the operations, management, products and services of the entities that it acquires and eliminate redundancies. The integration process could result in the loss of key employees or disruption of the combined entity’s ongoing business or inconsistencies in standards, controls, procedures and policies that adversely affect the Company’s ability to maintain relationships with customers and employees or achieve the anticipated benefits of the transaction. The integration process may also require significant time and attention from the Company’s management that they would otherwise direct at servicing existing business and developing new business. The Company’s inability to find suitable acquisition candidates or failure to successfully integrate the entities it acquires into its existing operations may increase its operating costs significantly and adversely affect its business and earnings.
Acquisitions may be delayed, impeded, or prohibited due to regulatory issues.
Acquisitions by financial institutions are subject to approval by a variety of federal and state regulatory agencies. The process for obtaining these required regulatory approvals has become substantially more difficult in recent years. Regulatory approvals could be delayed, impeded, restrictively conditioned or denied due to existing or new regulatory issues the Company has, or may have, with regulatory agencies, including, without limitation, issues related to Bank Secrecy Act compliance, Community Reinvestment Act issues, fair lending laws, fair housing laws, consumer protection laws, unfair, deceptive, or abusive acts or practices regulations and other similar laws and regulations. The Company may fail to pursue, evaluate or complete strategic and competitively significant acquisition opportunities as a result of its inability, or perceived or anticipated inability, to obtain regulatory approvals in a timely manner, under reasonable conditions or at all. Difficulties associated with potential acquisitions that may result from these factors could have a material adverse effect on the Company’s business, financial condition and results of operations.
Negative publicity could damage the Company’s reputation and business.
Reputation risk, or the risk to earnings and capital from negative public opinion, is inherent in the Company’s business. Negative public opinion could adversely affect the Company’s ability to keep and attract customers and expose it to adverse legal and regulatory consequences. Negative public opinion could result from the Company’s actual or alleged conduct in any number of activities, including lending practices, corporate governance, regulatory compliance, mergers and acquisitions, and disclosure, sharing or inadequate protection of customer information, and from actions taken by government regulators and community organizations in response to that conduct. Negative public opinion could also result from adverse news or publicity that impairs the reputation of the financial services industry generally.
The Company’s dependence on loans secured by real estate subjects it to risks relating to fluctuations in the real estate market that could adversely affect its financial condition, results of operations and cash flows.
Approximately 71.7% of the Company’s total loans as of December 31, 2019 consisted of loans included in the real estate loan portfolio, with 37.4% in commercial real estate (including farmland and multifamily residential), 23.3% in residential real estate (including home equity) and 11.0% in construction, land development and other land loans. The real estate collateral in each case provides an alternate source of repayment in the event of default by the borrower and may deteriorate in value during the time the credit is extended. A weakening of the real estate market in the Company’s primary market areas could have an adverse effect on the demand for new loans, the ability of borrowers to repay outstanding loans, the value of real estate and other collateral securing the loans and the value of real estate owned by the Company. If real estate values decline, it is also more likely that the Company would be required to increase its allowance for credit losses, which could adversely affect its financial condition, results of operations and cash flows.
The Company’s commercial real estate and commercial loans expose it to increased credit risks, and these risks will increase if the Company succeeds in increasing these types of loans.
The Company, while maintaining its conservative approach to lending, has emphasized both new and existing loan products, focusing on managing its commercial real estate (including farmland and multifamily residential) and commercial loan portfolios, and intends to continue to increase its lending activities and acquire loans in possible future acquisitions. As a result, commercial real estate and commercial loans as a proportion of its portfolio could increase. As of December 31, 2019, commercial real estate (including farmland and multifamily residential) and commercial loans totaled $10.3 billion. In general, commercial real estate loans and commercial loans yield higher returns and often generate a deposit relationship, but also pose greater credit risks than do owner-occupied residential real estate loans. These types of loans are also typically larger than residential real estate loans. Accordingly, the deterioration of one or several of these loans could cause a significant increase in nonperforming loans, which could result in a loss of earnings from these loans and an increase in the provision for credit losses and net charge-offs.
15
The Company makes both secured and some unsecured commercial loans. Unsecured loans generally involve a higher degree of risk of loss than do secured loans because, without collateral, repayment is wholly dependent upon the success of the borrowers’ businesses. Secured commercial loans are generally collateralized by accounts receivable, inventory, equipment or other assets owned by the borrower and include a personal guaranty of the business owner. Compared to real estate, that type of collateral is more difficult to monitor, its value is harder to ascertain, it may depreciate more rapidly and it may not be as readily saleable if repossessed. Further, commercial loans generally will be serviced primarily from the operation of the business, which may not be successful, while commercial real estate loans generally will be serviced from income on the properties securing the loans. As the Company’s various commercial loan portfolios increase, the corresponding risks and potential for losses from these loans will also increase.
The Company may be adversely affected by weaknesses in the commercial real estate market.
As of December 31, 2019, commercial real estate loans (including multifamily residential) comprised approximately 34.9% of the Company’s loan portfolio. Commercial real estate loans generally involve a greater degree of credit risk than residential real estate loans because they typically have larger balances and are more affected by adverse conditions in the economy. Because payments on loans secured by commercial real estate often depend upon the successful operation and management of the properties and the businesses which operate from within them, repayment of such loans may be affected by factors outside the borrower’s control, such as adverse conditions in the real estate market or the economy or changes in government regulations. The Company’s failure to have adequate risk management policies, procedures and controls could adversely affect its ability to increase this portfolio going forward and could result in an increased rate of delinquencies in, and increased losses from, this portfolio, which, accordingly, could have a material adverse effect on the Company’s business, financial condition and results of operations.
The Company’s Warehouse Purchase Program balances can fluctuate widely.
Because Warehouse Purchase Program balances are contingent upon residential mortgage lending activity, changes in the residential real estate market nationwide can lead to wide fluctuations of balances in this product, materially impacting both interest and non-interest income. Additionally, Warehouse Purchase Program period-end balances are generally higher than the average balance during the period due to increased mortgage activity that occurs at the end of a month, which can significantly impact the Company’s reported capital ratios.
The Company’s loan portfolio, and specifically its energy lending portfolio, could be impacted by declines in the prices of oil and natural gas, as well as other factors.
Loans to oil and gas production and service companies, which are reported as commercial and industrial loans, totaled $698.3 million at December 31, 2019, representing approximately 4.0% of total loans, excluding Warehouse Purchase Program loans. As a result, the factors that impact the energy sector may have a greater effect on the Company than on more broadly diversified financial institutions. Companies with exposure to the energy sector, whether directly or indirectly, are subject to volatile fluctuations in price and supply of oil and gas. Many factors affect the supply of and demand for crude oil and natural gas and, therefore, influence prices of these commodities, including:
|
|
• |
domestic and foreign supply of oil and natural gas, including increased availability of non-traditional energy resources such as shale oil and gas; |
|
|
• |
prices, and expectations about future prices, of oil and natural gas; |
|
|
• |
domestic and worldwide economic conditions, and the resulting global demand for oil and natural gas; |
|
|
• |
the price and quantity of imports of foreign oil and natural gas including the ability of OPEC to set and maintain production levels for oil, and decisions by OPEC and non-OPEC producers to change production levels; |
|
|
• |
sanctions imposed by the U.S., the European Union, or other governments against oil producing countries; |
|
|
• |
the cost of exploring for, developing, producing and delivering oil and natural gas; |
|
|
• |
the level of excess production capacity, available pipeline, storage and other transportation capacity; |
|
|
• |
lead times associated with acquiring equipment and products and availability of qualified personnel; |
|
|
• |
the expected rates of decline in production from existing and prospective wells; |
|
|
• |
the discovery rates of new oil and gas reserves; |
|
|
• |
federal, state and local regulation of exploration and drilling activities and oil and gas exports; |
16
|
|
• |
legislative and regulatory interest within, federal, state and local governments to stop, significantly limit or regulate hydraulic fracturing (fracking) activities; |
|
|
• |
weather conditions, including hurricanes, that can affect oil and natural gas operations over a wide area and severe winter weather that can interfere with oil and gas development and production operations; |
|
|
• |
political instability and social unrest in oil and natural gas producing countries; |
|
|
• |
advances in exploration, development and production technologies or in technologies affecting energy consumption (such as fracking); |
|
|
• |
the price and availability of alternative fuel and energy sources; |
|
|
• |
uncertainty in capital and commodities markets; and |
|
|
• |
changes in the value of the U.S. dollar relative to other major global currencies. |
Further, the economy in Texas as a whole could be negatively impacted if there are a high number of jobs lost related to a decline in oil production in the state, or if the impact of lower oil prices negatively affects other industries. A decline in the Texas economy related to oil production decline could impact the Company’s loan portfolios outside of the energy portfolio, if borrowers experience unemployment or loss of income and are unable to make payments on their loans.
Failure to compete effectively for customers could adversely affect the Company’s growth and profitability, which could have a material adverse effect on the Company’s business, financial condition and results of operations.
The Company faces substantial competition in all areas of its operations from a variety of different competitors, many of which are larger and may have more financial resources. These competitors primarily include national, regional, and community banks within the various markets where the Company operates. The Company also faces competition from many other types of financial institutions, including savings and loans, credit unions, finance companies, brokerage firms, insurance companies and other financial intermediaries. The financial services industry could become even more competitive as a result of legislative, regulatory and technological changes and continued consolidation. Also, technology and other changes have lowered barriers to entry and made it possible for non-banks to offer products and services functionally equivalent to those provided by banks. The process of eliminating banks as intermediaries, known as “disintermediation,” could result in the loss of fee income, as well as the loss of customer deposits and the related income generated from those deposits. Further, many of the Company’s competitors have fewer regulatory constraints and may have lower cost structures. Additionally, due to their size, many competitors may be able to achieve economies of scale and, as a result, may offer a broader range of products and services as well as better pricing for those products and services than the Company can. Failure to compete effectively for deposit, loan and other banking customers in the Company’s market areas could adversely affect the Company’s growth and profitability, which, in turn, could have a material adverse effect on the Company’s business, financial condition and results of operations.
Liquidity risk could impair the Company’s ability to fund operations and jeopardize its financial condition.
Liquidity is essential to the Company’s business. An inability to raise funds through deposits, borrowings, the sale of loans and other sources could have a substantial negative effect on its liquidity. The Company’s access to funding sources in amounts adequate to finance its activities or on terms which are acceptable to it could be impaired by factors that affect the Company specifically or the financial services industry or economy in general. Factors that could detrimentally impact the Company’s access to liquidity sources include a decrease in the level of its business activity as a result of a downturn in the markets in which its loans are concentrated or adverse regulatory action against it. The Company’s ability to borrow could also be impaired by factors that are not specific to it, such as a disruption in the financial markets or negative views and expectations about the prospects for the financial services industry in light of the recent turmoil faced by banking organizations and the continued deterioration in credit markets.
The Company relies on customer deposits as a significant source of funding, and its deposits may decrease in the future.
The Company relies on customer deposits as a significant source of funding. Competition among U.S. banks for customer deposits is intense, and may increase the cost of deposits or prevent new deposits, and may otherwise negatively affect the Company’s ability to grow its deposit base. The Company’s deposit accounts may decrease in the future, and any such decrease could have an adverse impact on its sources of funding, which impact could be material. Any changes the Company makes to the rates offered on its deposit products to remain competitive with other financial institutions may adversely affect its profitability and liquidity. The demand for the deposit products the Company offers may also be reduced due to a variety of factors such as demographic patterns, changes in customer preferences, reductions in consumers’ disposable income, regulatory actions that decrease customer access to particular products or the availability of competing products.
17
If the goodwill that the Company recorded in connection with a business acquisition becomes impaired, it could require charges to earnings.
Goodwill represents the amount by which the acquisition cost exceeds the fair value of net assets the Company acquired in the purchase of another financial institution. The Company reviews goodwill for impairment at least annually, or more frequently if events or changes in circumstances indicate the carrying value of the asset might be impaired.
The Company determines impairment by comparing the implied fair value of the reporting unit goodwill with the carrying amount of that goodwill. If the carrying amount of the reporting unit goodwill exceeds the implied fair value of that goodwill, an impairment loss is recognized in an amount equal to that excess. Any such adjustments are reflected in the Company’s results of operations in the periods in which they become known. At December 31, 2019, the Company’s goodwill totaled $3.22 billion. Although the Company has not recorded any such impairment charges since it initially recorded the goodwill, the Company’s future evaluations of goodwill could result in findings of impairment and related write-downs, which may have a material adverse effect on its financial condition and results of operations.
The Company’s accounting estimates and risk management processes rely on analytical and forecasting models and tools that may prove to be inaccurate.
The processes the Company uses to estimate its probable credit losses and to measure the fair value of financial instruments, as well as the processes used to estimate the effects of changing interest rates and other market measures on the Company’s financial condition and results of operations, depend upon the use of analytical and forecasting models and tools. These models and tools reflect assumptions that may not be accurate, particularly in times of market stress or other unforeseen circumstances. Even if these assumptions are accurate, the models and tools may prove to be inadequate or inaccurate because of other flaws in their design or their implementation. Any such failure in the Company’s analytical or forecasting models and tools could have a material adverse effect on the Company’s business, financial condition and results of operations.
The Company may be adversely affected by the soundness of other financial institutions.
Financial services institutions are interrelated as a result of trading, clearing, counterparty or other relationships. The Company has exposure to many different industries and counterparties, and routinely executes transactions with counterparties in the financial services industry, including commercial banks, brokers and dealers, investment banks and other institutional clients. Many of these transactions expose the Company to credit risk in the event of a default by a counterparty or client. In addition, the Company’s credit risk may be exacerbated when the collateral held by the Company cannot be realized upon or is liquidated at prices not sufficient to recover the full amount of the credit or derivative exposure due to the Company. Any such losses could have a material adverse effect on the Company’s financial condition, results of operations and cash flows.
The Company may need to raise additional capital in the future and such capital may not be available when needed on acceptable terms or at all.
The Company may need to raise additional capital in the future to provide it with sufficient capital resources and liquidity to meet regulatory capital requirements or its commitments and business needs. In addition, the Company may elect to raise additional capital to support its business or to finance acquisitions, if any. If needed, the Company’s ability to raise additional capital will depend on many things, including conditions in the capital markets at that time, which are outside its control, and its financial performance.
Such capital may not be available to the Company on acceptable terms or at all. Any occurrence that may limit the Company’s access to the capital markets, such as a decline in the confidence of investors, depositors of the Bank or counterparties participating in the capital markets, may adversely affect the Company’s capital costs and its ability to raise capital and, in turn, its liquidity. Moreover, if the Company needs to raise capital in the future, it may have to do so when many other financial institutions are also seeking to raise capital and would have to compete with those institutions for investors. An inability to raise additional capital on acceptable terms when needed could have a material adverse effect on the Company’s business, financial condition and results of operations.
New lines of business or new products and services may subject the Company to additional risks.
From time to time, the Company may implement or acquire new lines of business or offer new products and services within existing lines of business. There are substantial risks and uncertainties associated with these efforts, particularly in instances where the markets are not fully developed. In developing and marketing new lines of business and/or new products and services, the Company may invest significant time and resources. Initial timetables for the introduction and development of new lines of business and/or new products or services may not be achieved and price and profitability targets may not prove feasible. External factors, such as compliance with regulations, competitive alternatives and shifting market preferences, may also impact the successful implementation
18
of a new line of business or a new product or service. Furthermore, any new line of business and/or new product or service could have a significant impact on the effectiveness of the Company’s system of internal controls. Failure to successfully manage these risks in the development and implementation of new lines of business or new products or services could have a material adverse effect on the Company’s business, financial condition and results of operations.
An interruption in or breach in security of the Company’s information systems may result in a loss of customer business and have an adverse effect on the Company’s results of operations, financial condition and cash flows.
The Company relies heavily on communications and information systems to conduct its business. Any failure, interruption or breach in security of these systems, whether caused by physical damage, hackers, viruses or other malware, could jeopardize the security of information stored in and transmitted through the Company’s computer systems and network infrastructure as well as result in failures or disruptions in the Company’s customer relationship management, general ledger, deposits, servicing or loan origination systems. While the Company maintains specific “cyber” insurance coverage, which the Company expects would apply in the event of various breach scenarios, the amount of coverage may not be adequate in any particular case. In addition, cyber threat scenarios are inherently difficult to predict and can take many forms, some of which may not be covered under the Company’s cyber insurance coverage. Although the Company, with the help of third-party service providers, has and intends to continue to implement security technology and operational procedures to prevent such damage, these security measures may not entirely mitigate these risks. In addition, increases in cyber threats and the sophistication of bad actors, advances in computer capabilities, new discoveries in the field of cryptography or other developments could result in a compromise or breach of the algorithms the Company and its third-party service providers use to protect client transaction data. The occurrence of any such failures, interruptions or security breaches could damage the Company’s reputation, result in a loss of customer business, subject the Company to additional regulatory scrutiny or expose the Company to civil litigation and possible financial liability, any of which could have a material adverse effect on the Company’s results of operations, financial condition and cash flows.
The Company is subject to certain risks in connection with its use of technology.
The financial services industry is undergoing rapid technological changes with frequent introductions of new technology-driven products and services. The Company’s future success depends in part upon its ability to address the needs of its customers by using technology to provide products and services that will satisfy customer demands for convenience as well as create additional efficiencies in its operations. Many of the Company’s competitors have substantially greater resources to invest in technological improvements. The Company may not be able to effectively implement new technology-driven products and services or be successful in marketing these products and services to its customers, which may negatively affect the Company’s results of operations, financial condition and cash flows. Further, as technology advances, the ability to initiate transactions and access data has become more widely distributed among mobile devices, personal computers, automated teller machines, remote deposit capture sites and similar access points. These technological advances increase cybersecurity risk. While the Company maintains programs intended to prevent or limit the effects of cybersecurity risk, there is no assurance that unauthorized transactions or unauthorized access to customer information will not occur. The financial, reputational and regulatory impact of unauthorized transactions or unauthorized access to customer information could be significant.
The Company’s operations rely on external vendors, which may fail to provide adequate services.
The Company relies on certain external vendors to provide products and services necessary to maintain its day-to-day operations. These third parties provide key components of the Company’s business operations such as data processing, recording and monitoring transactions, online banking interfaces and services, internet connections and network access. While the Company has selected these third-party vendors carefully, it does not control their actions. Any complications caused by these third parties, including those resulting from disruptions in communication services provided by a vendor, failure of a vendor to handle current or higher volumes, cyber-attacks and security breaches at a vendor, failure of a vendor to provide services for any reason or poor performance of services could adversely affect the Company’s ability to deliver products and services to its customers and otherwise conduct its business. Financial or operational difficulties of a third-party vendor could also hurt the Company’s operations if those difficulties interfere with the vendor’s ability to provide services. Furthermore, the Company’s vendors could also be sources of operational and information security risk, including from breakdowns or failures of their own systems or capacity constraints, and reputational risk. Replacing these third-party vendors could also create significant delay and expense. Problems caused by external vendors could be disruptive to the Company’s operations, which could have a material adverse impact on the Company’s business and, in turn, the Company’s financial condition and results of operations.
The Company’s business may be adversely affected by consolidations of technology vendors.
The Company relies on certain external vendors for core products and services. Consolidations among core vendors may have the effect of decreasing price competition that may lead to higher vendor costs and may also increase systemic risk from vendors that could affect the Company’s operations.
19
The Company’s business may be adversely affected by security breaches at third parties.
The Company’s customers interact with their own and other third-party systems, which pose operational risks to the Company. The Company may be adversely affected by data breaches at retailers and other third parties who maintain data relating to the Company’s customers that involve the theft of customer data, including the theft of customers’ debit card, credit card, wire transfer and other identifying and/or access information used to make purchases or payments at such retailers and to other third parties. Despite third-party security risks that are beyond the Company’s control, the Company offers its customers protection against fraud and attendant losses for unauthorized use of debit and credit cards in order to stay competitive in the marketplace. Offering such protection to customers exposes the Company to significant expenses and potential losses related to reimbursing the Company’s customers for fraud losses, reissuing the compromised cards and increased monitoring for suspicious activity. In the event of a data breach at one or more retailers of considerable magnitude, the Company’s business, financial condition and results of operations may be adversely affected.
The Company is subject to claims and litigation pertaining to intellectual property.
Banking and other financial services companies, such as the Company, rely on technology companies to provide information technology products and services necessary to support their day-to-day operations. Technology companies frequently enter into litigation based on allegations of patent infringement or other violations of intellectual property rights. In addition, patent holding companies seek to monetize patents they have purchased or otherwise obtained. Competitors of the Company’s vendors, or other individuals or companies, have from time to time claimed to hold intellectual property sold to the Company by its vendors. Such claims may increase in the future as the financial services sector becomes more reliant on information technology vendors. The plaintiffs in these actions frequently seek injunctions and substantial damages.
Regardless of the scope or validity of such patents or other intellectual property rights, or the merits of any claims by potential or actual litigants, the Company may have to engage in protracted litigation. Such litigation is often expensive, time-consuming, disruptive to the Company’s operations and distracting to management. If the Company were found to have infringed one or more patents or other intellectual property rights, it may be required to pay substantial damages or royalties to a third-party. In certain cases, the Company may consider entering into licensing agreements for disputed intellectual property, although no assurance can be given that such licenses can be obtained on acceptable terms or that litigation will not occur. These licenses may also significantly increase the Company’s operating expenses. If legal matters related to intellectual property claims were resolved against the Company or settled, the Company could be required to make payments in amounts that could have a material adverse effect on its business, financial condition and results of operations.
The Company is subject to claims and litigation pertaining to fiduciary responsibility.
From time to time, customers make claims and take legal action pertaining to the Company’s performance of its fiduciary responsibilities. Whether customer claims and legal action related to the Company’s performance of its fiduciary responsibilities are founded or unfounded, if such claims and legal actions are not resolved in a manner favorable to the Company, they may result in significant financial liability, adversely affect the market perception of the Company and its products and services and/or impact customer demand for those products and services. Any financial liability or reputation damage could have a material adverse effect on the Company’s business, financial condition and results of operations.
The Company operates in a highly regulated environment and, as a result, is subject to extensive regulation and supervision.
The Company and the Bank are subject to extensive federal and state regulation and supervision. Banking regulations are primarily intended to protect depositors’ funds, federal deposit insurance funds and the banking system as a whole, not the Company’s shareholders. These regulations affect the Company’s lending practices, capital structure, investment practices, dividend policy and growth, among other things. Congress and federal regulatory agencies continually review banking laws, regulations and policies for possible changes. Any change in applicable regulations or federal or state legislation could have a substantial impact on the Company, the Bank and their respective operations.
The Dodd-Frank Act, enacted in July 2010, instituted major changes to the banking and financial institutions regulatory regimes in light of the performance of and government intervention in the financial services sector during the several years prior to the implementation of such Act. Additional legislation and regulations or regulatory policies and other changes in interpretation or implementation of statutes, regulations or policies, could significantly affect the Company’s powers, authority and operations, or the powers, authority and operations of the Bank in substantial and unpredictable ways. Further, regulators have significant discretion and power to prevent or remedy unsafe or unsound practices or violations of laws by banks and bank holding companies in the performance of their supervisory and enforcement duties. Government authorities, including the bank regulatory agencies, are pursuing aggressive enforcement actions with respect to compliance and other legal matters involving financial activities, which heightens the risks associated with actual and perceived compliance failures. The exercise of this regulatory discretion and power could have a negative impact on the Company. Further, failure to comply with laws, regulations or policies could result in sanctions
20
by regulatory agencies, civil money penalties and/or reputation damage. In some instances, directives issued to enforce such actions may be confidential and thus, in those instances, the Company would not be permitted to publicly disclose these actions. Any of the foregoing could have a material adverse effect on the Company’s business, financial condition and results of operations.
The Company’s risk management framework may not be effective in identifying, managing or mitigating risks and/or losses to it.
The Company has implemented a risk management framework to identify and manage its risk exposure, which is reviewed and overseen by the Company’s Risk Committee. This framework consists of various processes, systems and strategies, and is designed to manage the types of risk to which the Company is subject, including, among others, credit, market, liquidity, operational, financial, interest rate, legal and regulatory, compliance, strategic, reputation, fiduciary and general economic risks. The Company’s framework also includes financial or other modeling methodologies, which involves management assumptions and judgment. In addition, under this framework, the Company has developed a risk appetite statement to detail its risk tolerance levels at an enterprise-wide level. This risk management framework may not be effective under all circumstances, and it may not adequately identify, manage or mitigate all or any risk or loss to the Company. If this framework is not effective, the Company may be subject to potentially adverse regulatory consequences and could suffer unexpected losses and its financial condition or results of operations could be materially adversely affected.
The Company is subject to losses resulting from fraudulent and negligent acts on the part of loan applicants, correspondents or other third parties.
The Company relies heavily upon information supplied by third parties, including the information contained in credit applications, property appraisals, title information, equipment pricing and valuation and employment and income documentation, in deciding which loans the Company will originate, as well as the terms of those loans. If any of the information upon which the Company relies is misrepresented, either fraudulently or inadvertently, and the misrepresentation is not detected prior to asset funding, the value of the asset may be significantly lower than expected, or the Company may fund a loan that it would not have funded or on terms it would not have extended. Whether a misrepresentation is made by the applicant or another third party, the Company generally bears the risk of loss associated with the misrepresentation. A loan subject to a material misrepresentation is typically unsellable or subject to repurchase if it is sold prior to detection of the misrepresentation. The sources of the misrepresentations are often difficult to locate, and it is often difficult to recover any of the monetary losses the Company may suffer.
The Company is subject to environmental liability risk associated with lending activities.
A significant portion of the Company’s loan portfolio is secured by real property. During the ordinary course of business, the Company may foreclose on and take title to properties securing certain loans, and there is a risk that hazardous or toxic substances could be found on these properties. If hazardous or toxic substances are found, the Company may be liable for remediation costs, as well as for personal injury and property damage. Environmental laws may require the Company to incur substantial expenses and may materially reduce the affected property’s value or limit the Company’s ability to use or sell the affected property. In addition, future laws or more stringent interpretations or enforcement policies with respect to existing laws may increase the Company’s exposure to environmental liability. Although the Company has policies and procedures to perform an environmental review before initiating any foreclosure action on real property, these reviews may not be sufficient to detect all potential environmental hazards. The remediation costs and any other financial liabilities associated with an environmental hazard could have a material adverse effect on the Company’s financial condition and results of operations.
Risks Associated with the Company’s Common Stock
The Company’s corporate organizational documents and the provisions of Texas law to which it is subject may delay or prevent a change in control of the Company that a shareholder may favor.
The Company’s amended and restated articles of incorporation and amended and restated bylaws contain various provisions which may delay, discourage or prevent an attempted acquisition or change of control of the Company. These provisions include:
|
|
• |
a Board of Directors classified into three classes of directors with the directors of each class having staggered three-year terms; |
|
|
• |
a provision that any special meeting of the Company’s shareholders may be called only by the chairman of the board and chief executive officer, the president, a majority of the Board of Directors or the holders of at least 50% of the Company’s shares entitled to vote at the meeting; and |
|
|
• |
a provision establishing certain advance notice procedures for nomination of candidates for election as directors and for shareholder proposals to be considered at an annual or special meeting of shareholders. |
21
The Company’s articles of incorporation provide for noncumulative voting for directors and authorize the Board of Directors to issue shares of its preferred stock without shareholder approval and upon such terms as the Board of Directors may determine. The issuance of the Company’s preferred stock could have the effect of making it more difficult for a third party to acquire, or of discouraging a third party from acquiring, a controlling interest in the Company. In addition, certain provisions of Texas law, including a provision which restricts certain business combinations between a Texas corporation and certain affiliated shareholders, may delay, discourage or prevent an attempted acquisition or change in control of the Company.
There are restrictions on the Company’s ability to pay dividends.
Holders of the Company’s common stock are only entitled to receive such dividends as the Company’s Board of Directors may declare out of funds legally available for such payments. Although the Company has historically declared cash dividends on its common stock, it is not required to do so and there can be no assurance that the Company will pay dividends in the future. Any declaration and payment of dividends on common stock will depend upon the Company’s earnings and financial condition, liquidity and capital requirements, the general economic and regulatory climate, the Company’s ability to service any equity or debt obligations senior to the common stock and other factors deemed relevant by the Board of Directors.
The Company’s principal source of funds to pay dividends on the shares of common stock is cash dividends that the Company receives from the Bank. Various banking laws applicable to the Bank limit the payment of dividends and other distributions by the Bank to the Company, and may therefore limit the Company’s ability to pay dividends on its common stock.
There may be extreme fluctuations in the Company’s stock price.
The trading price for the Company’s common stock may fluctuate significantly in response to a variety of factors outside the Company’s control, including, among other things:
|
|
• |
actual or anticipated variations in quarterly results of operations; |
|
|
• |
recommendations by securities analysts; |
|
|
• |
failure to meet analysts’ revenue or earnings estimates; |
|
|
• |
operating and stock price performance of other companies that investors deem comparable to the Company; |
|
|
• |
news reports relating to trends, concerns and other issues in the financial services industry; |
|
|
• |
perceptions in the marketplace regarding the Company and/or its competitors; |
|
|
• |
new technology used, or services offered, by competitors; |
|
|
• |
cybersecurity breaches; |
|
|
• |
actions by institutional shareholders; |
|
|
• |
significant acquisitions or business combinations, strategic partnerships, joint ventures or capital commitments by or involving the Company or its competitors; |
|
|
• |
failure to integrate acquisitions or realize anticipated benefits from acquisitions; |
|
|
• |
changes in government regulations; |
|
|
• |
geopolitical conditions such as acts or threats of terrorism or military conflicts; |
|
|
• |
general market conditions, including real or anticipated changes in the strength of the Texas and Oklahoma economies; and |
|
|
• |
industry factors and general economic and political conditions and events, such as economic slowdowns or recessions, interest rate changes, oil price volatility or credit losses. |
22
|
ITEM 1B. |
UNRESOLVED STAFF COMMENTS |
None.
|
ITEM 2. |
PROPERTIES |
As of December 31, 2019, the Company conducted business at 285 full-service banking centers. The Company’s principal executive office is located at Prosperity Bank Plaza, 4295 San Felipe, Houston, Texas. The Company also owns or leases other facilities in which its banking centers are located as listed below by geographical market area. The Company also owns or leases various corporate and operations offices, including an administrative office for the Warehouse Purchase Program located in Littleton, Colorado. The expiration dates of the leases range from 2020 to 2034 and do not include renewal periods which may be available at the Company’s option.
The following table sets forth specific information regarding the banking centers located in each of the Company’s geographical market areas at December 31, 2019:
|
Geographical Area |
|
Number of Banking Centers |
|
|
Number of Leased Banking Centers |
|
|
Deposits at December 31, 2019 |
|
|||
|
|
|
|
|
|
|
|
|
|
|
(dollars in thousands) |
|
|
|
Bryan/College Station area |
|
|
16 |
|
|
|
— |
|
|
$ |
1,242,932 |
|
|
Houston area |
|
|
65 |
|
|
|
13 |
|
|
|
6,018,147 |
|
|
Central Texas area |
|
|
29 |
|
|
|
2 |
|
|
|
1,644,527 |
|
|
Dallas/Fort Worth area(1) |
|
|
75 |
|
|
|
26 |
|
|
|
7,811,391 |
|
|
East Texas area |
|
|
22 |
|
|
|
— |
|
|
|
822,766 |
|
|
West Texas area |
|
|
34 |
|
|
|
6 |
|
|
|
2,432,594 |
|
|
South Texas area |
|
|
30 |
|
|
|
3 |
|
|
|
2,760,836 |
|
|
Central Oklahoma area |
|
|
6 |
|
|
|
1 |
|
|
|
622,790 |
|
|
Tulsa Oklahoma area |
|
|
8 |
|
|
|
2 |
|
|
|
843,749 |
|
|
|
|
|
285 |
|
|
|
53 |
|
|
$ |
24,199,732 |
|
|
(1) |
Includes 42 banking centers, of which 20 are leased, with $6.13 billion of deposits doing business as LegacyTexas Bank as of December 31, 2019. |
|
ITEM 3. |
LEGAL PROCEEDINGS |
The Company and the Bank are defendants, from time to time, in legal actions arising from transactions conducted in the ordinary course of business. The Company and the Bank believe, after consultations with legal counsel, that the ultimate liability, if any, arising from such actions will not have a material adverse effect on their financial statements.
|
ITEM 4. |
MINE SAFETY DISCLOSURES |
Not applicable.
23
PART II.
|
ITEM 5. |
MARKET FOR REGISTRANT’S COMMON EQUITY, RELATED SHAREHOLDER MATTERS AND ISSUER PURCHASES OF EQUITY SECURITIES |
Common Stock Information
The Company’s common stock is listed on the New York Stock Exchange under the symbol “PB.” As of February 24, 2020, there were 94,743,519 shares outstanding and 4,695 shareholders of record. The number of beneficial owners is unknown to the Company at this time.
Dividends
Holders of common stock are entitled to receive dividends when, as and if declared by the Company’s Board of Directors out of funds legally available therefor. Although the Company has declared dividends on its common stock since 1994, and paid quarterly dividends aggregating $1.69 per share for 2019 and $1.49 per share for 2018, the Company could discontinue payment of dividends in the future. Future dividends on the common stock will depend upon the Company’s earnings and financial condition, liquidity and capital requirements, the general economic and regulatory climate, the Company’s ability to service any equity or debt obligations senior to the common stock and other factors deemed relevant by the Board of Directors of the Company.
As a holding company, the Company is ultimately dependent upon its subsidiaries to provide funding for its operating expenses, debt service and dividends. Various banking laws applicable to the Bank limit the payment of dividends and other distributions by the Bank to the Company and may therefore limit the Company’s ability to pay dividends on its common stock. Regulatory authorities could impose administratively stricter limitations on the ability of the Bank to pay dividends to the Company if such limits were deemed appropriate to preserve certain capital adequacy requirements.
In addition, the Federal Reserve Board has indicated that bank holding companies should carefully review their dividend policy in relation to the organization’s overall asset quality, level of current and prospective earnings and level, composition and quality of capital. The guidance provides that the Company should inform and consult with the Federal Reserve Board prior to declaring and paying a dividend that exceeds earnings for the period for which the dividend is being paid or that could result in an adverse change to the Company’s capital structure.
The cash dividends declared per share by quarter (and paid on the first business day of the subsequent quarter) for the Company’s last two fiscal years were as follows:
|
|
|
2019 |
|
|
2018 |
|
||
|
Fourth Quarter |
|
$ |
0.46 |
|
|
$ |
0.41 |
|
|
Third Quarter |
|
|
0.41 |
|
|
|
0.36 |
|
|
Second Quarter |
|
|
0.41 |
|
|
|
0.36 |
|
|
First Quarter |
|
|
0.41 |
|
|
|
0.36 |
|
Recent Sales of Unregistered Securities
None.
Securities Authorized for Issuance under Equity Compensation Plans
As of December 31, 2019, the Company had restricted stock issued under its 2012 stock incentive plan, which was approved by the Company’s shareholders. The following table provides information as of December 31, 2019 regarding the Company’s equity compensation plans under which the Company’s equity securities are authorized for issuance:
|
|
|
Number of securities to be issued upon exercise of outstanding options, warrants and rights |
|
|
Weighted-average exercise price of outstanding options, warrants and rights |
|
|
Number of securities remaining available for future issuance under equity compensation plans (excluding securities reflected in column (a)) |
|
|
|||
|
Plan Category |
|
(a) |
|
|
(b) |
|
|
(c) |
|
|
|||
|
Equity compensation plans approved by security holders |
|
|
— |
|
|
$ |
— |
|
|
|
386,375 |
|
(1) |
|
Equity compensation plans not approved by security holders |
|
|
— |
|
|
|
— |
|
|
|
— |
|
|
|
|
|
|
— |
|
|
$ |
— |
|
|
|
386,375 |
|
|
|
(1) |
All of these awards are available under the Company’s 2012 Stock Incentive Plan. The Company’s other stock award plans have expired, and no new awards may be issued thereunder. |
24
Purchases of Equity Securities by the Issuer and Affiliated Purchasers
On January 19, 2018, the Company announced a stock repurchase program that authorized the repurchase of up to 5%, or approximately 3.47 million shares, of the Company’s outstanding common stock over a two-year period, which expired on January 16, 2020. No repurchases were made during the fourth quarter of 2019. The Company repurchased 1.473 million shares of its common stock at an average weighted price of $64.10 per share during the year ended December 31, 2019. On January 29, 2020, the Company announced a stock repurchase program that authorized the repurchase of up to 5%, or approximately 4.74 million shares, of the Company’s outstanding common stock over a one-year period expiring on January 28, 2021, at the discretion of management. Under the stock repurchase program, the Company may repurchase shares from time to time at prevailing market prices, through open-market purchases or privately negotiated transactions, depending upon market conditions. See “Management’s Discussion and Analysis of Financial Condition and Results of Operations—Financial Condition—Share Repurchases” for additional information.
25
Performance Graph
The following Performance Graph compares the cumulative total shareholder return on the Company’s common stock for the period beginning at the close of trading on December 31, 2014 to December 31, 2019, with the cumulative total return of the S&P 500 Total Return Index and the Nasdaq Bank Index for the same period. Dividend reinvestment has been assumed. The Performance Graph assumes $100 invested on December 31, 2014 in the Company’s common stock, the S&P 500 Total Return Index and the Nasdaq Bank Index. The historical stock price performance for the Company’s common stock shown on the graph below is not necessarily indicative of future stock performance.
COMPARISON OF 5 YEAR CUMULATIVE TOTAL RETURN*
Among Prosperity Bancshares, Inc., the S&P 500 Index, and the NASDAQ Bank Index
*$100 invested on 12/31/14 in stock or index, including reinvestment of dividends. Fiscal year ended December 31.
|
|
|
12/14 |
|
|
12/15 |
|
|
12/16 |
|
|
12/17 |
|
|
12/18 |
|
|
12/19 |
|
||||||
|
Prosperity Bancshares, Inc. |
|
$ |
100.00 |
|
|
$ |
88.30 |
|
|
$ |
135.56 |
|
|
$ |
135.07 |
|
|
$ |
122.65 |
|
|
$ |
144.95 |
|
|
S&P 500 |
|
|
100.00 |
|
|
|
101.38 |
|
|
|
113.51 |
|
|
|
138.29 |
|
|
|
132.23 |
|
|
|
173.86 |
|
|
NASDAQ Bank |
|
|
100.00 |
|
|
|
107.08 |
|
|
|
147.27 |
|
|
|
155.68 |
|
|
|
129.17 |
|
|
|
160.44 |
|
Copyright© 2020 Standard & Poor's, a division of S&P Global. All rights reserved.
26
|
ITEM 6. |
SELECTED CONSOLIDATED FINANCIAL DATA |
The following selected consolidated financial data of the Company for, and as of the end of, each of the years in the five-year period ended December 31, 2019, is derived from and should be read in conjunction with the Company’s consolidated financial statements and the notes thereto appearing elsewhere in this Annual Report on Form 10-K.
|
|
|
As of and for the Years Ended December 31, |
|
|||||||||||||||||
|
|
|
2019(1) |
|
|
2018 |
|
|
2017 |
|
|
2016(1) |
|
|
2015 |
|
|||||
|
|
|
(In thousands, except per share data) |
|
|||||||||||||||||
|
Income Statement Data: |
|
|
|
|
|
|
|
|
|
|
|
|
|
|
|
|
|
|
|
|
|
Interest income |
|
$ |
832,938 |
|
|
$ |
727,209 |
|
|
$ |
677,355 |
|
|
$ |
675,779 |
|
|
$ |
669,701 |
|
|
Interest expense |
|
|
137,169 |
|
|
|
97,616 |
|
|
|
60,492 |
|
|
|
43,159 |
|
|
|
39,191 |
|
|
Net interest income |
|
|
695,769 |
|
|
|
629,593 |
|
|
|
616,863 |
|
|
|
632,620 |
|
|
|
630,510 |
|
|
Provision for credit losses |
|
|
4,300 |
|
|
|
16,350 |
|
|
|
14,325 |
|
|
|
24,000 |
|
|
|
7,560 |
|
|
Net interest income after provision for credit losses |
|
|
691,469 |
|
|
|
613,243 |
|
|
|
602,538 |
|
|
|
608,620 |
|
|
|
622,950 |
|
|
Noninterest income |
|
|
124,281 |
|
|
|
116,012 |
|
|
|
116,633 |
|
|
|
118,425 |
|
|
|
120,781 |
|
|
Noninterest expense |
|
|
396,542 |
|
|
|
326,220 |
|
|
|
313,101 |
|
|
|
318,387 |
|
|
|
313,536 |
|
|
Income before taxes |
|
|
419,208 |
|
|
|
403,035 |
|
|
|
406,070 |
|
|
|
408,658 |
|
|
|
430,195 |
|
|
Provision for income taxes |
|
|
86,656 |
|
|
|
81,223 |
|
|
|
133,905 |
|
|
|
134,192 |
|
|
|
143,549 |
|
|
Net income |
|
$ |
332,552 |
|
|
$ |
321,812 |
|
|
$ |
272,165 |
|
|
$ |
274,466 |
|
|
$ |
286,646 |
|
|
Per Share Data: |
|
|
|
|
|
|
|
|
|
|
|
|
|
|
|
|
|
|
|
|
|
Basic earnings per share |
|
$ |
4.52 |
|
(2) |
$ |
4.61 |
|
|
$ |
3.92 |
|
|
$ |
3.94 |
|
|
$ |
4.09 |
|
|
Diluted earnings per share |
|
|
4.52 |
|
(2) |
|
4.61 |
|
|
|
3.92 |
|
|
|
3.94 |
|
|
|
4.09 |
|
|
Book value per share |
|
|
63.02 |
|
|
|
58.02 |
|
|
|
55.03 |
|
|
|
52.41 |
|
|
|
49.45 |
|
|
Cash dividends declared per share |
|
|
1.6900 |
|
|
|
1.4900 |
|
|
|
1.3800 |
|
|
|
1.2400 |
|
|
|
1.1175 |
|
|
Dividend payout ratio |
|
|
38.76 |
% |
|
|
32.33 |
% |
|
|
35.23 |
% |
|
|
31.42 |
% |
|
|
27.30 |
% |
|
Weighted average shares outstanding (basic) |
|
|
73,524 |
|
|
|
69,821 |
|
|
|
69,484 |
|
|
|
69,674 |
|
|
|
70,033 |
|
|
Weighted average shares outstanding (diluted) |
|
|
73,524 |
|
|
|
69,821 |
|
|
|
69,484 |
|
|
|
69,680 |
|
|
|
70,049 |
|
|
Shares outstanding at end of period |
|
|
94,746 |
|
|
|
69,847 |
|
|
|
69,491 |
|
|
|
69,491 |
|
|
|
70,022 |
|
|
Balance Sheet Data (at period end): |
|
|
|
|
|
|
|
|
|
|
|
|
|
|
|
|
|
|
|
|
|
Total assets |
|
$ |
32,185,708 |
|
|
$ |
22,693,402 |
|
|
$ |
22,587,292 |
|
|
$ |
22,331,072 |
|
|
$ |
22,037,216 |
|
|
Securities |
|
|
8,570,056 |
|
|
|
9,408,966 |
|
|
|
9,672,116 |
|
|
|
9,726,086 |
|
|
|
9,502,427 |
|
|
Loans |
|
|
18,845,346 |
|
|
|
10,370,313 |
|
|
|
10,020,773 |
|
|
|
9,622,060 |
|
|
|
9,438,589 |
|
|
Allowance for credit losses |
|
|
87,469 |
|
|
|
86,440 |
|
|
|
84,041 |
|
|
|
85,326 |
|
|
|
81,384 |
|
|
Total goodwill and intangibles |
|
|
3,310,075 |
|
|
|
1,933,728 |
|
|
|
1,939,687 |
|
|
|
1,946,629 |
|
|
|
1,918,244 |
|
|
Other real estate owned |
|
|
6,936 |
|
|
|
1,805 |
|
|
|
11,152 |
|
|
|
15,463 |
|
|
|
2,963 |
|
|
Total deposits |
|
|
24,199,732 |
|
|
|
17,256,558 |
|
|
|
17,821,460 |
|
|
|
17,307,302 |
|
|
|
17,681,119 |
|
|
Federal funds purchased and other borrowings |
|
|
1,303,730 |
|
|
|
1,031,126 |
|
|
|
505,223 |
|
|
|
990,781 |
|
|
|
491,399 |
|
|
Subordinated notes |
|
|
125,804 |
|
|
|
— |
|
|
|
— |
|
|
|
— |
|
|
|
— |
|
|
Total shareholders’ equity |
|
|
5,970,835 |
|
|
|
4,052,824 |
|
|
|
3,824,154 |
|
|
|
3,642,311 |
|
|
|
3,462,910 |
|
(Table continued on the next page)
27
|
|
|
As of and for the Years Ended December 31, |
|
|||||||||||||||||
|
|
|
2019(1) |
|
|
2018 |
|
|
2017 |
|
|
2016(1) |
|
|
2015 |
|
|||||
|
|
|
(In thousands, except per share data) |
|
|||||||||||||||||
|
Average Balance Sheet Data: |
|
|
|
|
|
|
|
|
|
|
|
|
|
|
|
|
|
|
|
|
|
Total assets |
|
$ |
24,087,707 |
|
|
$ |
22,632,745 |
|
|
$ |
22,340,201 |
|
|
$ |
21,880,762 |
|
|
$ |
21,618,604 |
|
|
Securities |
|
|
8,958,182 |
|
|
|
9,664,404 |
|
|
|
9,681,763 |
|
|
|
9,401,669 |
|
|
|
9,541,443 |
|
|
Loans |
|
|
11,972,093 |
|
|
|
10,141,625 |
|
|
|
9,822,225 |
|
|
|
9,629,714 |
|
|
|
9,200,765 |
|
|
Allowance for credit losses |
|
|
86,616 |
|
|
|
84,511 |
|
|
|
84,410 |
|
|
|
84,189 |
|
|
|
80,894 |
|
|
Total goodwill and intangibles |
|
|
2,122,153 |
|
|
|
1,936,639 |
|
|
|
1,942,999 |
|
|
|
1,947,979 |
|
|
|
1,934,099 |
|
|
Total deposits |
|
|
18,180,430 |
|
|
|
17,106,500 |
|
|
|
17,015,372 |
|
|
|
17,348,387 |
|
|
|
17,157,864 |
|
|
Junior subordinated debentures |
|
|
1,502 |
|
|
|
— |
|
|
|
— |
|
|
|
2,081 |
|
|
|
29,443 |
|
|
Subordinated notes |
|
|
20,489 |
|
|
|
— |
|
|
|
— |
|
|
|
— |
|
|
|
— |
|
|
Total shareholders’ equity |
|
|
4,458,521 |
|
|
|
3,947,833 |
|
|
|
3,750,727 |
|
|
|
3,566,931 |
|
|
|
3,368,788 |
|
|
Performance Ratios: |
|
|
|
|
|
|
|
|
|
|
|
|
|
|
|
|
|
|
|
|
|
Return on average assets |
|
|
1.38 |
% |
(2) |
|
1.42 |
% |
|
|
1.22 |
% |
|
|
1.25 |
% |
|
|
1.33 |
% |
|
Return on average common equity |
|
|
7.46 |
% |
(2) |
|
8.15 |
% |
|
|
7.26 |
% |
|
|
7.69 |
% |
|
|
8.51 |
% |
|
Net interest margin (tax equivalent) |
|
|
3.32 |
% |
|
|
3.18 |
% |
|
|
3.19 |
% |
|
|
3.35 |
% |
|
|
3.38 |
% |
|
Efficiency ratio(3) |
|
|
48.25 |
% |
|
|
43.71 |
% |
|
|
42.76 |
% |
|
|
42.50 |
% |
|
|
41.87 |
% |
|
Asset Quality Ratios(4): |
|
|
|
|
|
|
|
|
|
|
|
|
|
|
|
|
|
|
|
|
|
Nonperforming assets to total loans and other real estate |
|
|
0.33 |
% |
|
|
0.18 |
% |
|
|
0.37 |
% |
|
|
0.50 |
% |
|
|
0.46 |
% |
|
Nonperforming assets to total loans, excluding Warehouse Purchase Program loans, and other real estate |
|
|
0.36 |
% |
|
|
0.18 |
% |
|
|
0.37 |
% |
|
|
0.50 |
% |
|
|
0.46 |
% |
|
Net charge-offs to average loans |
|
|
0.03 |
% |
|
|
0.14 |
% |
|
|
0.16 |
% |
|
|
0.21 |
% |
|
|
0.08 |
% |
|
Allowance for credit losses to total loans |
|
|
0.46 |
% |
|
|
0.83 |
% |
|
|
0.84 |
% |
|
|
0.89 |
% |
|
|
0.86 |
% |
|
Allowance for credit losses to total loans, excluding Warehouse Purchase Program Loans |
|
|
0.51 |
% |
|
|
0.83 |
% |
|
|
0.84 |
% |
|
|
0.89 |
% |
|
|
0.86 |
% |
|
Allowance for credit losses to nonperforming loans(5) |
|
|
157.1 |
% |
|
|
504.0 |
% |
|
|
319.9 |
% |
|
|
261.8 |
% |
|
|
201.8 |
% |
|
Capital Ratios(4): |
|
|
|
|
|
|
|
|
|
|
|
|
|
|
|
|
|
|
|
|
|
Leverage ratio (7) |
|
|
10.42 |
% |
|
|
10.23 |
% |
|
|
9.31 |
% |
|
|
8.68 |
% |
|
|
7.97 |
% |
|
Average shareholders’ equity to average total assets |
|
|
18.51 |
% |
|
|
17.44 |
% |
|
|
16.79 |
% |
|
|
16.30 |
% |
|
|
15.58 |
% |
|
CET1 capital ratio(6)(7) |
|
|
12.30 |
% |
|
|
16.32 |
% |
|
|
15.08 |
% |
|
|
14.48 |
% |
|
|
13.55 |
% |
|
Tier 1 risk-based capital ratio (7) |
|
|
12.30 |
% |
|
|
16.32 |
% |
|
|
15.08 |
% |
|
|
14.48 |
% |
|
|
13.55 |
% |
|
Total risk-based capital ratio (7) |
|
|
12.70 |
% |
|
|
16.99 |
% |
|
|
15.74 |
% |
|
|
15.20 |
% |
|
|
14.25 |
% |
|
(1) |
The Company completed one acquisition during each of the twelve-month periods ended December 31, 2019 and December 31, 2016. |
|
(2) |
Reflects the impact of merger related expenses of $46.4 million in 2019 related to the LegacyTexas merger. |
|
(3) |
Represents a non-GAAP financial measure. Calculated by dividing total noninterest expense, excluding credit loss provision, by net interest income plus noninterest income, excluding net gains and losses on the sale of securities and assets. Additionally, taxes are not part of this calculation. See “Management’s Discussion and Analysis of Financial Consolidation and Results of Operations—Results of Operations—Efficiency Ratio” on page 36 for calculation methodology and details. |
|
(4) |
At period end, except for net charge-offs to average loans and average shareholders’ equity to average total assets, which are for periods ended at such dates. |
|
(5) |
Nonperforming loans consist of nonaccrual loans, loans contractually past due 90 days or more and any other loan management deems to be nonperforming. |
|
(6) |
CET1 capital ratio is required under the Basel III Capital Rules effective January 1, 2015. |
|
(7) |
Calculated pursuant to the phase-in provisions of the Basel III Capital Rules. |
28
|
ITEM 7. |
MANAGEMENT’S DISCUSSION AND ANALYSIS OF FINANCIAL CONDITION AND RESULTS OF OPERATIONS |
Special Cautionary Notice Regarding Forward-Looking Statements
Statements and financial discussion and analysis contained in this Annual Report on Form 10-K that are not statements of historical fact constitute forward-looking statements made pursuant to the safe harbor provisions of the Private Securities Litigation Reform Act of 1995. These forward-looking statements are based on assumptions and involve a number of risks and uncertainties, many of which are beyond the Company’s control. Forward-looking statements can be identified by words such as “believes,” “intends,” “expects,” “plans,” “will” and similar references to future periods. Many possible events or factors could affect the future financial results and performance of the Company and could cause such results or performance to differ materially from those expressed in the forward-looking statements. These possible events or factors include, but are not limited to:
|
|
• |
changes in the strength of the United States economy in general and the strength of the local economies in which the Company conducts operations resulting in, among other things, a deterioration in credit quality or reduced demand for credit, including the result and effect on the Company’s loan portfolio and allowance for credit losses; |
|
|
• |
volatility in interest rates and market prices, which could reduce the Company’s net interest margins, asset valuations and expense expectations; |
|
|
• |
changes in the levels of loan prepayments and the resulting effects on the value of the Company’s loan portfolio; |
|
|
• |
changes in local economic and business conditions, including fluctuations in the price of oil, natural gas and other commodities, which adversely affect the Company’s customers and their ability to transact profitable business with the company, including the ability of the Company’s borrowers to repay their loans according to their terms or a change in the value of the related collateral; |
|
|
• |
increased competition for deposits and loans adversely affecting rates and terms; |
|
|
• |
the expected cost savings, synergies and other financial and operational benefits from the LegacyTexas merger might not be realized within the expected time frames or at all, and costs or difficulties relating to the integration of LegacyTexas might be greater than expected; |
|
|
• |
the timing, impact and other uncertainties of any future acquisitions, including the Company’s ability to identify suitable future acquisition candidates, the success or failure in the integration of their operations, and the ability to enter new markets successfully and capitalize on growth opportunities; |
|
|
• |
the possible impairment of goodwill associated with an acquisition and possible adverse short-term effects on the results of operations; |
|
|
• |
increased credit risk in the Company’s assets and increased operating risk caused by a material change in commercial, consumer and/or real estate loans as a percentage of the total loan portfolio; |
|
|
• |
the concentration of the Company’s loan portfolio in loans collateralized by residential and commercial real estate; |
|
|
• |
the failure of assumptions underlying the establishment of and provisions made to the allowance for credit losses, including such assumptions related to potential, pending or recent acquisitions; |
|
|
• |
changes in the availability of funds resulting in increased costs or reduced liquidity; |
|
|
• |
a deterioration or downgrade in the credit quality and credit agency ratings of the securities in the Company’s securities portfolio; |
|
|
• |
increased asset levels and changes in the composition of assets and the resulting impact on the Company’s capital levels and regulatory capital ratios; |
|
|
• |
the Company’s ability to acquire, operate and maintain cost effective and efficient systems without incurring unexpectedly difficult or expensive but necessary technological changes; |
|
|
• |
the loss of senior management or operating personnel and the potential inability to hire qualified personnel at reasonable compensation levels; |
|
|
• |
government intervention in the U.S. financial system; |
|
|
• |
changes in statutes and government regulations or their interpretations applicable to financial holding companies and the Company’s present and future banking and other subsidiaries, including changes in tax requirements and tax rates; |
29
|
|
• |
the effect of changes in accounting policies and practices, as may be adopted by the regulatory agencies, as well as the Public Company Accounting Oversight Board, the Financial Accounting Standards Board and other accounting standard setters; |
|
|
• |
poor performance by external vendors; |
|
|
• |
the cost and effects of a failure, interruption, or breach of security of the Company’s systems; |
|
|
• |
the failure of analytical and forecasting models and tools used by the Company to estimate probable credit losses and to measure the fair value of financial instruments; |
|
|
• |
additional risks from new lines of businesses or new products and services; |
|
|
• |
claims or litigation related to intellectual property or fiduciary responsibilities; |
|
|
• |
the failure of the Company’s enterprise risk management framework to identify or address risks adequately; |
|
|
• |
a failure in or breach of operational or security systems of the Company’s infrastructure, or those of its third-party vendors and other service providers, including as a result of cyber attacks; |
|
|
• |
potential risk of environmental liability associated with lending activities; |
|
|
• |
acts of terrorism, an outbreak of hostilities or other international or domestic calamities, weather or other acts of God and other matters beyond the Company’s control; and |
|
|
• |
other risks and uncertainties described in this Annual Report on Form 10-K or in the Company’s other reports and documents filed with the Securities and Exchange Commission. |
A forward-looking statement may include a statement of the assumptions or bases underlying the forward-looking statement. The Company believes it has chosen these assumptions or bases in good faith and that they are reasonable. However, the Company cautions that assumptions or bases almost always vary from actual results, and the differences between assumptions or bases and actual results can be material. Therefore, the Company cautions against placing undue reliance on its forward-looking statements. The forward-looking statements speak only as of the date the statements are made. The Company undertakes no obligation to publicly update or otherwise revise any forward-looking statements, whether as a result of new information, future events or otherwise.
Management’s Discussion and Analysis of Financial Condition and Results of Operations analyzes the major elements of the Company’s balance sheets and statements of income. This section should be read in conjunction with the Company’s consolidated financial statements and accompanying notes and other detailed information appearing elsewhere in this Annual Report on Form 10‑K.
Overview
The Company generates the majority of its revenues from interest income on loans, service charges and fees on customer accounts and income from investment in securities. The Company also earns revenues from various additional products and services it provides, including trust services, mortgage lending, brokerage, credit card and independent sales organization sponsorship operations. The Company’s revenues are partially offset by interest expense paid on deposits and other borrowings and noninterest expenses such as administrative and occupancy expenses. Net interest income is the difference between interest income on earning assets such as loans and securities and interest expense on liabilities such as deposits and borrowings which are used to fund those assets. Net interest income is the Company’s largest source of revenue. The level of interest rates and the volume and mix of earning assets and interest-bearing liabilities impact net interest income and margin.
Three principal components of the Company’s growth strategy are internal growth, efficient operations and acquisitions, including strategic merger transactions. The Company focuses on continual internal growth. Each banking center is operated as a separate profit center, maintaining separate data with respect to its net interest income, efficiency ratio, deposit growth, loan growth and overall profitability. The Company also focuses on maintaining efficiency and stringent cost control practices and policies. The Company has centralized many of its critical operations, such as data processing and loan and deposit processing. Management believes that this centralized infrastructure can accommodate substantial additional growth while enabling the Company to minimize operational costs through certain economies of scale. The Company also intends to continue to seek expansion opportunities.
Net income was $332.6 million, $321.8 million and $272.2 million for the years ended December 31, 2019, 2018 and 2017, respectively, and diluted earnings per share were $4.52, $4.61 and $3.92, respectively, for these same periods. The change in net income during 2019 was principally due to an increase in interest income partially offset by an increase in interest expense and merger related expenses of $46.4 million. The change in net income during 2018 was principally due to lower corporate tax rates and an
30
increase in interest income, partially offset by an increase in interest expense. The Company posted returns on average assets of 1.38%, 1.42% and 1.22% and returns on average common equity of 7.46%, 8.15% and 7.26% for the years ended December 31, 2019, 2018 and 2017, respectively. The Company’s efficiency ratio was 48.25% in 2019, 43.71% in 2018 and 42.76% in 2017. The efficiency ratio is calculated by dividing total noninterest expense (excluding credit loss provisions) by the sum of net interest income and noninterest income. Because the ratio is a measure of revenues and expenses resulting from the Company’s lending activities and fee-based banking services, net gains and losses on the sale of assets and securities are not included. Additionally, taxes are not part of this calculation.
Total assets at December 31, 2019 and 2018 were $32.19 billion and $22.69 billion, respectively. Total deposits were $24.20 billion at December 31, 2019, an increase of $6.94 billion or 40.2% compared with $17.26 billion at December 31, 2018. Total loans were $18.85 billion at December 31, 2019, an increase of $8.48 billion or 81.7% compared with $10.37 billion at December 31, 2018. At December 31, 2019, the Company had $55.7 million in nonperforming loans, and its allowance for credit losses was $87.5 million compared with $17.2 million in nonperforming loans and an allowance for credit losses of $86.4 million at December 31, 2018. Shareholders’ equity was $5.97 billion and $4.05 billion at December 31, 2019 and 2018, respectively.
Recent Acquisition
Merger with LegacyTexas Financial Group, Inc.—On November 1, 2019, LegacyTexas Financial Group, Inc. (“LegacyTexas”), merged with Prosperity Bancshares and LegacyTexas Bank merged with Prosperity Bank (collectively, the “Merger”). LegacyTexas was headquartered in Plano, Texas and operated 42 locations in 19 North Texas cities in and around the Dallas-Fort Worth area. As of September 30, 2019, LegacyTexas, on a consolidated basis, reported total assets of $10.5 billion, total gross loans of $9.1 billion, total deposits of $6.5 billion and shareholders’ equity of $1.2 billion.
Pursuant to the terms of the merger agreement, Prosperity issued 26,228,148 shares of Prosperity common stock with a closing price of $69.02 per share plus $318.0 million in cash, made up of $308.6 million in cash and $9.4 million cash in taxes withheld, for all outstanding shares of LegacyTexas. This resulted in goodwill of $1.32 billion as of December 31, 2019. Additionally, Prosperity recognized $60.1 million of core deposit intangibles as of December 31, 2019. The goodwill balance as of December 31, 2019 does not include all subsequent fair value adjustments that are still being finalized.
Critical Accounting Policies
The Company’s significant accounting policies are integral to understanding the results reported. The Company’s accounting policies are described in detail in Note 1 to the consolidated financial statements, appearing elsewhere is this Annual Report on Form 10-K. The Company believes that of its significant accounting policies, the following may involve a higher degree of judgment and complexity:
Business Combinations—Generally, acquisitions are accounted for under the acquisition method of accounting in accordance with Financial Accounting Standards Board (“FASB”) Accounting Standards Codification (“ASC”) 805, Business Combinations. A business combination occurs when the Company acquires net assets that constitute a business and obtains control over that business. Business combinations are effected through the transfer of consideration consisting of cash and/or common stock and are accounted for using the acquisition method. Accordingly, the assets and liabilities of the acquired business are recorded at their respective fair values at the acquisition date. Determining the fair value of assets and liabilities, especially the loan portfolio, is a process involving significant judgment regarding methods and assumptions used to calculate estimated fair values. Fair values are subject to refinement for up to one year after the closing date of the acquisition as information relative to closing date fair values becomes available. The results of operations of an acquired entity are included in the Company’s consolidated results from acquisition date, and prior periods are not restated. The fair value of acquired loans incorporates assumptions regarding future credit losses and therefore no allowance for loan losses related to the acquired loans is recorded on the acquisition date.
Allowance for Credit Losses—The allowance for credit losses is established through charges to earnings in the form of a provision for credit losses. The Company’s allowance for credit losses consists of two elements: (1) specific valuation allowances based on probable losses on impaired loans; and (2) a general valuation allowance based on historical loan loss experience, general economic conditions and other qualitative risk factors both internal and external to the Company. Management has established an allowance for credit losses which it believes is adequate for estimated losses in the Company’s loan portfolio. Based on an evaluation of the portfolio, management presents a quarterly review of the allowance for credit losses to the Bank’s Board of Directors, indicating any change in the allowance since the last review and any recommendations as to adjustments in the allowance. In making its evaluation, management considers factors such as historical loan loss experience, the amount of nonperforming assets and related collateral, the volume, growth and composition of the portfolio, current economic conditions that may affect the borrower’s ability to pay and the value of collateral, the evaluation of the portfolio through its internal loan review process and other relevant factors. Portions of the allowance may be allocated for specific credits; however, the entire allowance is available for any credit that, in
31
management’s judgment, should be charged off. Charge-offs occur when loans are deemed to be uncollectible. For further discussion of the methodology used in the determination of the allowance for credit losses, see “Accounting for Acquired Loans and the Allowance for Acquired Credit Losses”, “Financial Condition—Allowance for Credit Losses” sections below and Note 1 to the consolidated financial statements.
Accounting for Acquired Loans and the Allowance for Acquired Credit Losses—The Company accounts for its acquisitions using the acquisition method of accounting. Accordingly, the assets, including loans, and liabilities of the acquired entity were recorded at their fair values at the acquisition date. No allowance for credit losses related to the acquired loans is recorded on the acquisition date, as the fair value of the acquired loans incorporates assumptions regarding credit risk. These fair value estimates associated with acquired loans, and based on a discounted cash flow model, include estimates related to market interest rates and undiscounted projections of future cash flows that incorporate expectations of prepayments and the amount and timing of principal, interest and other cash flows, as well as any shortfalls thereof.
At period-end after acquisition, the fair-valued acquired loans from each acquisition are reassessed to determine whether an addition to the allowance for credit losses is appropriate due to further credit quality deterioration. For further discussion of the methodology used in the determination of the allowance for credit losses for acquired loans, see “Financial Condition—Allowance for Credit Losses” below. For further discussion of the Company’s acquisition and loan accounting, see Note 1 to the consolidated financial statements.
Goodwill and Intangible Assets—Goodwill and intangible assets that have indefinite useful lives are subject to an impairment test at least annually, or more often, if events or circumstances indicate that it is more likely than not that the fair value of the Company’s reporting unit is below the carrying value of its equity. Under Accounting Standards Codification (“ASC”) Topic 350-20, “Intangibles—Goodwill and Other—Goodwill,” companies have the option to first assess qualitative factors to determine whether it is more likely than not that the fair value of a reporting unit is less than its carrying amount as a basis for determining the need to perform step one of the annual test for goodwill impairment. An entity has an unconditional option to bypass the qualitative assessment described in the following paragraph for any reporting unit in any period and proceed directly to performing the first step of the goodwill impairment test. An entity may resume performing the qualitative assessment in any subsequent period. The Company currently utilizes a qualitative assessment for its annual goodwill impairment analysis.
If the Company bypasses the qualitative assessment, a two-step goodwill impairment test is performed. The two-step process begins with an estimation of the fair value of the Company’s reporting unit compared with its carrying value. If the carrying amount exceeds the fair value of the reporting unit, a second test is completed comparing the implied fair value of the reporting unit’s goodwill to its carrying value to measure the amount of impairment.
The Company had no intangible assets with indefinite useful lives at December 31, 2019. Core deposit intangible assets that are subject to amortization are being amortized on a non-pro rata basis over the years expected to be benefited, which the Company believes is between ten and fifteen years. These core deposit intangible assets are reviewed for impairment if circumstances indicate their value may not be recoverable based on a comparison of fair value to carrying value. Based on the Company’s annual goodwill impairment test as of September 30, 2019, management does not believe any of its goodwill is impaired as of December 31, 2019, because the fair value of the Company’s equity exceeded its carrying value. While the Company believes no impairment existed at December 31, 2019, under accounting standards applicable at that date, different conditions or assumptions, or changes in cash flows or profitability, if significantly negative or unfavorable, could have a material adverse effect on the outcome of the Company’s impairment evaluation and financial condition or future results of operations.
Other-Than-Temporarily Impaired Securities—When the fair value of a security is below its amortized cost, and depending on the length of time the condition exists and the extent the fair market value is below amortized cost, additional analysis is performed to determine whether an other-than-temporary impairment exists. Available for sale and held to maturity securities are analyzed quarterly for possible other-than-temporary impairment. The analysis considers (1) the length of time and the extent to which the fair value has been less than cost, (2) the financial condition and near-term prospects of the issuer, (3) whether the market decline was affected by macroeconomic conditions and (4) whether the entity has the intent to sell the debt security or more likely than not will be required to sell the debt security before its anticipated recovery. Often, the information available to conduct these assessments is limited and rapidly changing, making estimates of fair value subject to judgment. If actual information or conditions are different than estimated, the extent of the impairment of the security may be different than previously estimated, which could have a material effect on the Company’s results of operations and financial condition.
Fair Values of Financial Instruments—The Company determines the fair market values of financial instruments based on the fair value hierarchy established which requires an entity to maximize the use of observable inputs and minimize the use of unobservable inputs when measuring fair value. There are three levels of inputs that may be used to measure fair value. Level 1 inputs include quoted active market prices, where available. If such quoted market prices are not available, Level 2 inputs are used. These
32
inputs are based upon internally developed analytical tools that primarily use observable, market-based parameters. Level 3 inputs are unobservable inputs which are typically based on an entity’s own assumptions, as there is little, if any, related market activity. The Company’s assessment of the significance of a particular input to the fair value measurement in its entirety requires judgment and considers factors specific to the asset or liability.
Tax Cuts and Jobs Act
The Tax Cuts and Jobs Act was enacted on December 22, 2017 and made widespread changes to the U.S. tax code effective January 1, 2018. Under ASC Topic 740 “Income Taxes,” the Company was required to recalculate its deferred tax assets and liabilities to account for the future impact of lower corporate tax rates and lost deductions on these assets and liabilities. The recalculation resulted in a one-time non-cash charge of $1.4 million recorded to income tax expense for the year ended December 31, 2017.
Results of Operations
Net Interest Income
The Company’s operating results depend primarily on its net interest income, which is the difference between interest income on interest-earning assets, including securities and loans, and interest expense incurred on interest-bearing liabilities, including deposits and other borrowed funds. Interest rate fluctuations, as well as changes in the amount and type of earning assets and liabilities, combine to affect net interest income. The Company’s net interest income is affected by changes in the amount and mix of interest-earning assets and interest-bearing liabilities, referred to as a “volume change.” It is also affected by changes in yields earned on interest-earning assets and rates paid on interest-bearing deposits and other borrowed funds, referred to as a “rate change.”
2019 versus 2018. Net interest income before the provision for credit losses for 2019 was $695.8 million compared with $629.6 million for 2018, an increase of $66.2 million or 10.5%. This change was primarily due to the increase in loan discount accretion of $14.136 million related to the Merger. Interest income was $832.9 million in 2019, an increase of $105.7 million or 14.5% compared with 2018. Interest income on loans was $621.4 million for 2019, an increase of $117.5 million or 23.3% compared with 2018, which was primarily due to the increase in loan discount accretion of $14.1 million. The Company had $277.5 million of total outstanding discounts on purchased loans, of which $145.8 million was accretable at December 31, 2019. Interest income on securities was $209.8 million during 2019, a decrease of $12.1 million or 5.5% compared with 2018 due primarily to a decrease in the securities balance, partially offset by higher yields. Average interest-bearing liabilities increased $528.5 million or 4.1% during 2019 compared with 2018. The average rate on interest-bearing liabilities increased from 0.75% to 1.02% during the same time period, resulting in an increase in interest expense of $39.6 million. The total cost of funds increased to 0.70% during 2019 from 0.52% during 2018.
Net interest margin, defined as net interest income divided by average interest-earning assets, was 3.32% on a tax equivalent basis for 2019, an increase of 14 basis points compared with 3.18% for 2018.
2018 versus 2017. Net interest income before the provision for credit losses for 2018 was $629.6 million compared with $616.9 million for 2017, an increase of $12.7 million or 2.1%. The increase in net interest income was primarily due to higher yields on interest-earning assets and an increase in average loans, partially offset by higher rates on deposits and other borrowings. Additionally, net interest income was impacted by a decrease in loan discount accretion. Interest income was $727.2 million in 2018, an increase of $49.9 million or 7.4% compared with 2017. Interest income on loans was $504.0 million for 2018, an increase of $35.6 million or 7.6% compared with 2017. This was primarily due to higher loan yields and an increase in average loans of $319.4 million or 3.3%, partially offset by a decrease in loan discount accretion of $8.0 million. The Company had $17.7 million of total outstanding discounts on purchased loans, of which $16.4 million was accretable at December 31, 2018. Interest income on securities was $221.9 million during 2018, an increase of $13.7 million or 6.6% compared with 2017 due primarily to higher yields on securities. Average interest-bearing liabilities decreased $194.0 million or 1.5% during 2018 compared with 2017. The average rate on interest-bearing liabilities increased from 0.46% to 0.75% during the same time period, resulting in an increase in interest expense of $37.1 million. The total cost of funds increased to 0.52% during 2018 from 0.33% during 2017.
Net interest margin, defined as net interest income divided by average interest-earning assets was 3.18% on a tax equivalent basis for 2018, a decrease of 1 basis point compared with 3.19% for 2017.
33
The following table presents, for the periods indicated, the total dollar amount of average balances, interest income from average interest-earning assets and the resultant yields, as well as the interest expense on average interest-bearing liabilities, expressed both in dollars and rates. Except as indicated in the footnotes, no tax-equivalent adjustments were made and all average balances are daily average balances. Any nonaccruing loans have been included in the table as loans carrying a zero yield.
|
|
|
Years Ended December 31, |
|
|||||||||||||||||||||||||||||||||
|
|
|
2019 |
|
|
2018 |
|
|
2017 |
|
|||||||||||||||||||||||||||
|
|
|
Average Outstanding Balance(1) |
|
|
Interest Earned/ Paid |
|
|
Average Yield/ Rate |
|
|
Average Outstanding Balance |
|
|
Interest Earned/ Paid |
|
|
Average Yield/ Rate |
|
|
Average Outstanding Balance |
|
|
Interest Earned/ Paid |
|
|
Average Yield/ Rate |
|
|||||||||
|
|
|
(Dollars in thousands) |
|
|||||||||||||||||||||||||||||||||
|
Assets |
|
|
|
|
|
|
|
|
|
|
|
|
|
|
|
|
|
|
|
|
|
|
|
|
|
|
|
|
|
|
|
|
|
|
|
|
|
Interest-earning assets: |
|
|
|
|
|
|
|
|
|
|
|
|
|
|
|
|
|
|
|
|
|
|
|
|
|
|
|
|
|
|
|
|
|
|
|
|
|
Loans held for sale |
|
$ |
32,065 |
|
|
$ |
1,457 |
|
|
|
4.54 |
% |
|
$ |
29,427 |
|
|
$ |
1,476 |
|
|
|
5.02 |
% |
|
$ |
26,048 |
|
|
$ |
1,293 |
|
|
|
4.96 |
% |
|
Loans held for investment |
|
|
11,688,754 |
|
|
|
610,112 |
|
|
|
5.22 |
% |
|
|
10,112,198 |
|
|
|
502,487 |
|
|
|
4.97 |
% |
|
|
9,796,177 |
|
|
|
467,045 |
|
|
|
4.77 |
% |
|
Loans held for investment - Warehouse Purchase Program |
|
|
251,274 |
|
|
|
9,874 |
|
|
|
3.93 |
% |
|
|
— |
|
|
|
— |
|
|
|
— |
|
|
|
— |
|
|
|
— |
|
|
|
— |
|
|
Total loans |
|
|
11,972,093 |
|
|
|
621,443 |
|
|
|
5.19 |
% |
|
|
10,141,625 |
|
|
|
503,963 |
|
|
|
4.97 |
% |
|
|
9,822,225 |
|
|
|
468,338 |
|
|
|
4.77 |
% |
|
Investment securities |
|
|
8,958,182 |
|
|
|
209,812 |
|
|
|
2.34 |
% |
|
|
9,664,404 |
|
|
|
221,909 |
|
|
|
2.30 |
% |
|
|
9,681,763 |
|
|
|
208,189 |
|
|
|
2.15 |
% |
|
Federal funds sold and other earning assets |
|
|
129,622 |
|
|
|
1,683 |
|
|
|
1.30 |
% |
|
|
82,521 |
|
|
|
1,337 |
|
|
|
1.62 |
% |
|
|
83,324 |
|
|
|
828 |
|
|
|
0.99 |
% |
|
Total interest-earning assets |
|
|
21,059,897 |
|
|
|
832,938 |
|
|
|
3.96 |
% |
|
|
19,888,550 |
|
|
|
727,209 |
|
|
|
3.66 |
% |
|
|
19,587,312 |
|
|
|
677,355 |
|
|
|
3.46 |
% |
|
Allowance for credit losses |
|
|
(86,616 |
) |
|
|
|
|
|
|
|
|
|
|
(84,511 |
) |
|
|
|
|
|
|
|
|
|
|
(84,410 |
) |
|
|
|
|
|
|
|
|
|
Noninterest-earning assets |
|
|
3,114,426 |
|
|
|
|
|
|
|
|
|
|
|
2,828,706 |
|
|
|
|
|
|
|
|
|
|
|
2,837,299 |
|
|
|
|
|
|
|
|
|
|
Total assets |
|
$ |
24,087,707 |
|
|
|
|
|
|
|
|
|
|
$ |
22,632,745 |
|
|
|
|
|
|
|
|
|
|
$ |
22,340,201 |
|
|
|
|
|
|
|
|
|
|
Liabilities and Shareholders' Equity |
|
|
|
|
|
|
|
|
|
|
|
|
|
|
|
|
|
|
|
|
|
|
|
|
|
|
|
|
|
|
|
|
|
|
|
|
|
Interest-bearing liabilities: |
|
|
|
|
|
|
|
|
|
|
|
|
|
|
|
|
|
|
|
|
|
|
|
|
|
|
|
|
|
|
|
|
|
|
|
|
|
Interest-bearing demand deposits |
|
$ |
3,917,413 |
|
|
$ |
23,982 |
|
|
|
0.61 |
% |
|
$ |
3,937,479 |
|
|
$ |
20,072 |
|
|
|
0.51 |
% |
|
$ |
3,816,996 |
|
|
$ |
11,703 |
|
|
|
0.31 |
% |
|
Savings and money market deposits |
|
|
5,941,929 |
|
|
|
50,681 |
|
|
|
0.85 |
% |
|
|
5,417,014 |
|
|
|
30,999 |
|
|
|
0.57 |
% |
|
|
5,561,853 |
|
|
|
18,705 |
|
|
|
0.34 |
% |
|
Certificates and other time deposits |
|
|
2,314,174 |
|
|
|
36,725 |
|
|
|
1.59 |
% |
|
|
2,101,287 |
|
|
|
20,313 |
|
|
|
0.97 |
% |
|
|
2,289,296 |
|
|
|
15,904 |
|
|
|
0.69 |
% |
|
Federal funds purchased and other borrowings |
|
|
971,409 |
|
|
|
21,323 |
|
|
|
2.20 |
% |
|
|
1,189,459 |
|
|
|
24,241 |
|
|
|
2.04 |
% |
|
|
1,142,897 |
|
|
|
12,908 |
|
|
|
1.13 |
% |
|
Securities sold under repurchase agreements |
|
|
307,277 |
|
|
|
3,383 |
|
|
|
1.10 |
% |
|
|
300,429 |
|
|
|
1,991 |
|
|
|
0.66 |
% |
|
|
328,652 |
|
|
|
1,272 |
|
|
|
0.39 |
% |
|
Subordinated notes and junior subordinated debentures |
|
|
21,991 |
|
|
|
1,075 |
|
|
|
4.89 |
% |
|
|
— |
|
|
|
— |
|
|
|
— |
|
|
|
— |
|
|
|
— |
|
|
|
— |
|
|
Total interest-bearing liabilities |
|
|
13,474,193 |
|
|
|
137,169 |
|
|
|
1.02 |
% |
|
|
12,945,668 |
|
|
|
97,616 |
|
|
|
0.75 |
% |
|
|
13,139,694 |
|
|
|
60,492 |
|
|
|
0.46 |
% |
|
Noninterest-bearing liabilities: |
|
|
|
|
|
|
|
|
|
|
|
|
|
|
|
|
|
|
|
|
|
|
|
|
|
|
|
|
|
|
|
|
|
|
|
|
|
Noninterest-bearing demand deposits |
|
|
6,006,914 |
|
|
|
|
|
|
|
|
|
|
|
5,650,720 |
|
|
|
|
|
|
|
|
|
|
|
5,347,227 |
|
|
|
|
|
|
|
|
|
|
Other liabilities |
|
|
148,079 |
|
|
|
|
|
|
|
|
|
|
|
88,524 |
|
|
|
|
|
|
|
|
|
|
|
102,553 |
|
|
|
|
|
|
|
|
|
|
Total liabilities |
|
|
19,629,186 |
|
|
|
|
|
|
|
|
|
|
|
18,684,912 |
|
|
|
|
|
|
|
|
|
|
|
18,589,474 |
|
|
|
|
|
|
|
|
|
|
Shareholders' equity |
|
|
4,458,521 |
|
|
|
|
|
|
|
|
|
|
|
3,947,833 |
|
|
|
|
|
|
|
|
|
|
|
3,750,727 |
|
|
|
|
|
|
|
|
|
|
Total liabilities and shareholders' equity |
|
$ |
24,087,707 |
|
|
|
|
|
|
|
|
|
|
$ |
22,632,745 |
|
|
|
|
|
|
|
|
|
|
$ |
22,340,201 |
|
|
|
|
|
|
|
|
|
|
Net interest rate spread |
|
|
|
|
|
|
|
|
|
|
2.94 |
% |
|
|
|
|
|
|
|
|
|
|
2.91 |
% |
|
|
|
|
|
|
|
|
|
|
3.00 |
% |
|
Net interest income and margin (2) |
|
|
|
|
|
$ |
695,769 |
|
|
|
3.30 |
% |
|
|
|
|
|
$ |
629,593 |
|
|
|
3.17 |
% |
|
|
|
|
|
$ |
616,863 |
|
|
|
3.15 |
% |
|
Net interest income and margin (tax equivalent) (3) |
|
|
|
|
|
$ |
698,918 |
|
|
|
3.32 |
% |
|
|
|
|
|
$ |
633,208 |
|
|
|
3.18 |
% |
|
|
|
|
|
$ |
624,707 |
|
|
|
3.19 |
% |
(1) The average outstanding balance includes two months of LegacyTexas average balances.
(2) The net interest margin is equal to net interest income divided by average interest-earning assets.
(3) In order to make pretax income and resultant yields on tax-exempt investments and loans comparable to those on taxable investments and loans, a tax equivalent adjustment has been computed using a federal income tax rate of 21% for the years ended December 31, 2019 and 2018 and 35% for year ended December 31, 2017 and other applicable effective tax rates.
34
The following table presents information regarding the dollar amount of changes in interest income and interest expense for the periods indicated for each major component of interest-earning assets and interest-bearing liabilities and distinguishes between the changes attributable to changes in volume and changes in interest rates. Changes in interest income and interest expense related to purchase accounting adjustments are allocated to rate. For purposes of this table, changes attributable to both rate and volume which cannot be segregated have been allocated to rate.
|
|
|
Years Ended December 31, |
|
|||||||||||||||||||||
|
|
|
2019 vs. 2018 |
|
|
2018 vs. 2017 |
|
||||||||||||||||||
|
|
|
Increase (Decrease) Due to Change in |
|
|
|
|
|
|
Increase (Decrease) Due to Change in |
|
|
|
|
|
||||||||||
|
|
|
Volume |
|
|
Rate |
|
|
Total |
|
|
Volume |
|
|
Rate |
|
|
Total |
|
||||||
|
|
|
(Dollars in thousands) |
|
|||||||||||||||||||||
|
Interest-earning assets: |
|
|
|
|
|
|
|
|
|
|
|
|
|
|
|
|
|
|
|
|
|
|
|
|
|
Loans held for sale |
|
$ |
132 |
|
|
$ |
(151 |
) |
|
$ |
(19 |
) |
|
$ |
168 |
|
|
$ |
15 |
|
|
$ |
183 |
|
|
Loans held for investment |
|
|
78,341 |
|
|
|
29,284 |
|
|
|
107,625 |
|
|
|
15,062 |
|
|
|
20,381 |
|
|
|
35,442 |
|
|
Loans held for investment - Warehouse Purchase Program |
|
|
9,874 |
|
|
|
— |
|
|
|
9,874 |
|
|
|
— |
|
|
|
— |
|
|
|
— |
|
|
Securities |
|
|
(16,216 |
) |
|
|
4,119 |
|
|
|
(12,097 |
) |
|
|
(373 |
) |
|
|
14,093 |
|
|
|
13,720 |
|
|
Federal funds sold and other temporary investments |
|
|
763 |
|
|
|
(417 |
) |
|
|
346 |
|
|
|
(8 |
) |
|
|
517 |
|
|
|
509 |
|
|
Total increase (decrease) in interest income |
|
|
72,894 |
|
|
|
32,835 |
|
|
|
105,729 |
|
|
|
14,848 |
|
|
|
35,006 |
|
|
|
49,854 |
|
|
Interest-bearing liabilities: |
|
|
|
|
|
|
|
|
|
|
|
|
|
|
|
|
|
|
|
|
|
|
|
|
|
Interest-bearing demand deposits |
|
|
(102 |
) |
|
|
4,012 |
|
|
|
3,910 |
|
|
|
369 |
|
|
|
8,000 |
|
|
|
8,369 |
|
|
Savings and money market accounts |
|
|
3,004 |
|
|
|
16,678 |
|
|
|
19,682 |
|
|
|
(487 |
) |
|
|
12,781 |
|
|
|
12,294 |
|
|
Certificates of deposit |
|
|
2,058 |
|
|
|
14,354 |
|
|
|
16,412 |
|
|
|
(1,306 |
) |
|
|
5,715 |
|
|
|
4,409 |
|
|
Other borrowings |
|
|
(4,444 |
) |
|
|
1,526 |
|
|
|
(2,918 |
) |
|
|
526 |
|
|
|
10,807 |
|
|
|
11,333 |
|
|
Securities sold under repurchase agreements |
|
|
45 |
|
|
|
1,347 |
|
|
|
1,392 |
|
|
|
(109 |
) |
|
|
828 |
|
|
|
719 |
|
|
Subordinated notes and junior subordinated debentures |
|
|
1,075 |
|
|
|
— |
|
|
|
1,075 |
|
|
|
— |
|
|
|
— |
|
|
|
— |
|
|
Total increase (decrease) in interest expense |
|
|
1,636 |
|
|
|
37,917 |
|
|
|
39,553 |
|
|
|
(1,007 |
) |
|
|
38,131 |
|
|
|
37,124 |
|
|
Increase (decrease) in net interest income |
|
$ |
71,258 |
|
|
$ |
(5,082 |
) |
|
$ |
66,176 |
|
|
$ |
15,855 |
|
|
$ |
(3,125 |
) |
|
$ |
12,730 |
|
Provision for Credit Losses
The Company’s provision for credit losses is established through charges to income in the form of the provision in order to bring the Company’s allowance for credit losses to a level deemed appropriate by management based on the factors discussed under “Financial Condition—Allowance for Credit Losses.” The allowance for credit losses at December 31, 2019 was $87.5 million, representing 0.46% of total loans and 0.51% of total loans, excluding Warehouse Purchase Program loans, as of such date. Acquired loans were recorded at fair value based on a discounted cash flow valuation methodology that considers, among other things, interest rates, projected default rates, loss given defaults and recovery rates, with no carryover of any existing allowance for credit losses. The provision for credit losses for the years ended December 31, 2019, 2018 and 2017 was $4.3 million, $16.4 million and $14.3 million, respectively. Net charge-offs for the years ended December 31, 2019, 2018 and 2017 were $3.3 million, $14.0 million and $15.6 million, respectively.
Noninterest Income
The Company’s primary sources of recurring noninterest income are nonsufficient funds (“NSF”) fees, credit, debit and ATM card income, and service charges on deposit accounts. Additionally, the Company generates recurring noninterest income from its various additional products and services, including trust services, mortgage lending, brokerage and independent sales organization sponsorship operations. Noninterest income does not include loan origination fees, which are recognized over the life of the related loan as an adjustment to yield using the interest method. For the year ended December 31, 2019, noninterest income totaled $124.3 million, an increase of $8.3 million or 7.1% compared with 2018. This increase was primarily due to two months of fees, service charges and mortgage income from LegacyTexas.
For the year ended December 31, 2018, noninterest income totaled $116.0 million, a decrease of $621 thousand or 0.5% compared with 2017. The decrease was primarily due to the gain on sale of securities during 2017, partially offset by a lower net loss on sale of assets during 2018.
35
The following table presents, for the periods indicated, the major categories of noninterest income:
|
|
|
Years Ended December 31, |
|
|||||||||
|
|
|
2019 |
|
|
2018 |
|
|
2017 |
|
|||
|
|
|
(Dollars in thousands) |
|
|||||||||
|
Nonsufficient funds fees |
|
$ |
34,614 |
|
|
$ |
33,163 |
|
|
$ |
32,354 |
|
|
Credit card, debit card and ATM card income |
|
|
26,867 |
|
|
|
25,046 |
|
|
|
24,425 |
|
|
Service charges on deposit accounts |
|
|
20,604 |
|
|
|
20,652 |
|
|
|
21,327 |
|
|
Trust income |
|
|
10,227 |
|
|
|
10,178 |
|
|
|
9,200 |
|
|
Mortgage income |
|
|
5,006 |
|
|
|
3,355 |
|
|
|
4,053 |
|
|
Brokerage income |
|
|
2,361 |
|
|
|
2,617 |
|
|
|
1,950 |
|
|
Bank owned life insurance income |
|
|
5,426 |
|
|
|
5,284 |
|
|
|
5,430 |
|
|
Net (loss) gain on sale or write-offs of assets |
|
|
(1,813 |
) |
|
|
(755 |
) |
|
|
(1,921 |
) |
|
Net (loss) gain on sale of securities |
|
|
— |
|
|
|
(13 |
) |
|
|
3,270 |
|
|
Other |
|
|
20,989 |
|
|
|
16,485 |
|
|
|
16,545 |
|
|
Total noninterest income |
|
$ |
124,281 |
|
|
$ |
116,012 |
|
|
$ |
116,633 |
|
Noninterest Expense
For the year ended December 31, 2019, noninterest expense totaled $396.5 million, an increase of $70.3 million or 21.6% compared with 2018. The change was primarily due to the $46.4 million of merger related expenses and additional expenses related to two months of operations of the LegacyTexas banking centers and lending function.
For the year ended December 31, 2018, noninterest expense totaled $326.2 million, an increase of $13.1 million or 4.2% compared with 2017. This increase was primarily due to higher salaries and benefits.
The following table presents, for the periods indicated, the major categories of noninterest expense:
|
|
|
Years Ended December 31, |
|
|||||||||
|
|
|
2019 |
|
|
2018 |
|
|
2017 |
|
|||
|
|
|
(Dollars in thousands) |
|
|||||||||
|
Salaries and employee benefits(1) |
|
$ |
226,348 |
|
|
$ |
207,517 |
|
|
$ |
192,409 |
|
|
Non-staff expenses: |
|
|
|
|
|
|
|
|
|
|
|
|
|
Net occupancy and equipment |
|
|
23,985 |
|
|
|
22,760 |
|
|
|
22,402 |
|
|
Credit and debit card, data processing and software amortization |
|
|
23,624 |
|
|
|
17,790 |
|
|
|
17,230 |
|
|
Regulatory assessments and FDIC insurance |
|
|
8,608 |
|
|
|
13,261 |
|
|
|
14,311 |
|
|
Core deposit intangibles amortization |
|
|
6,537 |
|
|
|
5,959 |
|
|
|
6,942 |
|
|
Depreciation |
|
|
13,713 |
|
|
|
12,365 |
|
|
|
12,215 |
|
|
Communications(2) |
|
|
9,679 |
|
|
|
10,032 |
|
|
|
10,592 |
|
|
Other real estate expense(3) |
|
|
(67 |
) |
|
|
722 |
|
|
|
3,271 |
|
|
Merger related expenses |
|
|
46,402 |
|
|
|
— |
|
|
|
— |
|
|
Other |
|
|
37,713 |
|
|
|
35,814 |
|
|
|
33,729 |
|
|
Total noninterest expense |
|
$ |
396,542 |
|
|
$ |
326,220 |
|
|
$ |
313,101 |
|
|
(1) |
Total salaries and employee benefits include $10.6 million, $10.5 million and $6.9 million in 2019, 2018 and 2017, respectively, in stock-based compensation expense. |
|
(2) |
Communications expense includes telephone, data circuits, postage, and courier expenses. |
|
(3) |
Other real estate expense is net of rental income and gains and losses on sales of real estate. |
Salaries and Employee Benefits. Salaries and employee benefits were $226.3 million for the year ended December 31, 2019, an increase of $18.8 million or 9.1% compared with 2018. This change was primarily due to additional expenses related to two months of LegacyTexas salaries and employee benefits. Salaries and employee benefits were $207.5 million for the year ended December 31, 2018, an increase of $15.1 million or 7.9% compared with 2017. This change was primarily due to an increase in compensation for all associates following the enactment of the Tax Cuts and Jobs Act and an increase in stock-based compensation expense. The number of full-time equivalent associates employed by the Company were 3,901, 3,036 and 3,017 at December 31, 2019, 2018 and 2017, respectively. Total salaries and benefits for the year ended December 31, 2019 include $10.6 million in stock‑based compensation expense compared with $10.5 million and $6.9 million recorded for the years ended December 31, 2018 and 2017, respectively.
36
Net Occupancy and Equipment: Net occupancy and equipment expense was $24.0 million for the year ended December 31, 2019, an increase of $1.2 million or 5.4%, compared with 2018. Net occupancy and equipment expense was $22.8 million for the year ended December 31, 2018, an increase of $358 thousand or 1.6%, compared with 2017.
Credit and Debit Card, Data Processing and Software Amortization. Credit and debit card, data processing and software amortization expenses were $23.6 million for the year ended December 31, 2019, an increase of $5.8 million or 32.8% compared with 2018. This change was primarily due to additional expenses related to two months of operations related to the LegacyTexas banking centers and lending function. Credit and debit card, data processing and software amortization expenses were $17.8 million for the year ended December 31, 2018, an increase of $560 thousand or 3.3% compared with 2017.
Regulatory Assessments and FDIC Insurance. Regulatory assessments and FDIC insurance assessments were $8.6 million for the year ended December 31, 2019, a decrease of $4.7 million or 35.1%, compared with $13.3 million for the year ended December 31, 2018. This decrease was primarily due to the elimination of the FDIC temporary surcharge in 2018. Regulatory assessments and FDIC insurance assessments were $13.3 million for the year ended December 31, 2018, a decrease of $1.1 million or 7.3%, compared with $14.3 million for the year ended December 31, 2017. This decrease was primarily due to the elimination of the FDIC temporary surcharge imposed on large banks by the Dodd‑Frank Act.
Core Deposit Intangibles Amortization. Core deposit intangibles (“CDI”) amortization was $6.5 million for the year ended December 31, 2019, an increase of $578 thousand or 9.7% compared with $6.0 million for the year ended December 31, 2018. This change was primarily due to the Merger. CDI amortization was $6.0 million for the year ended December 31, 2018, a decrease of $983 thousand or 14.2% compared with $6.9 million for the year ended December 31, 2017. This change was primarily due to certain intangible assets that fully amortized during 2018.
Other Real Estate. Other real estate expense was $(67) thousand for the year ended December 31, 2019, a decrease of $789 thousand or 109.3%, compared with $722 thousand for the year ended December 31, 2018. This change was primarily due to gains on the sale of other real estate properties during 2019. Other real estate expense was $722 thousand for the year ended December 31, 2018, a decrease of $2.5 million or 77.9%, compared with $3.3 million for the year ended December 31, 2017. This change was primarily due to the write-down of other real estate during 2017.
Merger Related Expenses. Merger related expenses were $46.4 million for the year ended December 31, 2019, related to the Merger that was completed on November 1, 2019.
Efficiency Ratio
The Company’s efficiency ratio is a supplemental financial measure utilized in management’s internal evaluation of the Company and is not calculated based on GAAP. A GAAP-based efficiency ratio is calculated by dividing total noninterest expense, excluding credit loss provisions, by net interest income plus total noninterest income, as shown in the Consolidated Statements of Income. The Company’s efficiency ratio, as calculated and used by the Company, excludes from noninterest income the net gains and losses on the sale of securities and assets, which can vary widely from period to period. Taxes are not included in either calculation. An increase in the efficiency ratio indicates that more resources are being utilized to generate the same volume of income, while a decrease would indicate a more efficient allocation of resources. The Company’s efficiency ratio calculated pursuant to GAAP was 48.36% for the year ended December 31, 2019 compared with 43.75% for the year ended December 31, 2018 and 42.69% for the year ended December 31, 2017. The efficiency ratio, excluding net gains and losses on the sale of securities and assets, was 48.25% for the year ended December 31, 2019, compared with 43.71% for the year ended December 31, 2018 and 42.76% for the year ended December 31, 2017.
Income Taxes
The amount of federal and state income tax expense is influenced by the amount of pre-tax income, the amount of tax-exempt income and the amount of other nondeductible expenses. As a result of the Tax Cuts and Jobs Act enacted in December 2017, the Company recorded a one-time non-cash charge of $1.4 million to income tax expense to account for the future impact of lower corporate tax rates and lost deductions on deferred tax assets and liabilities as of December 31, 2017.
Income tax expense was $86.7 million for the year ended December 31, 2019, an increase of $5.4 million or 6.7% compared with $81.2 million for the year ended December 31, 2018. The increase was primarily due to two months of operations related to the LegacyTexas banking centers and lending function. Income tax expense was $81.2 million for the year ended December 31, 2018, a decrease of $52.7 million or 39.3% compared with $133.9 million for the year ended December 31, 2017. The decrease was primarily attributable to the reduction in corporate tax rates by the Tax Cuts and Jobs Act. The effective tax rate for the years ended December 31, 2019, 2018 and 2017 was 20.7%, 20.2% and 33.0%, respectively. The effective income tax rates differed from the U.S.
37
statutory rate of 21% during 2019 and 2018 and 35% during 2017 primarily due to the effect of tax-exempt income from loans and securities.
Impact of Inflation
The Company’s consolidated financial statements and related notes included in this Annual Report on Form 10-K have been prepared in accordance with GAAP. These require the measurement of financial position and operating results in terms of historical dollars, without considering changes in the relative value of money over time due to inflation or recession.
Unlike many industrial companies, substantially all of the Company’s assets and liabilities are monetary in nature. As a result, interest rates have a more significant impact on the Company’s performance than the effects of general levels of inflation. Interest rates may not necessarily move in the same direction or in the same magnitude as the prices of goods and services. However, noninterest expenses do reflect general levels of inflation.
Financial Condition
Loan Portfolio
At December 31, 2019, total loans were $18.85 billion, an increase of $8.48 billion or 81.7%, compared with $10.37 billion at December 31, 2018. Loans at December 31, 2019 included $81.0 million of loans held for sale and $1.55 billion of Warehouse Purchase Program loans. At December 31, 2019, total loans were 77.9% of deposits and 58.6% of total assets. At December 31, 2018, total loans were $10.37 billion, an increase of $349.5 million or 3.5%, compared with $10.02 billion at December 31, 2017. Loans at December 31, 2018 included $29.4 million of loans held for sale.
The following table summarizes the Company’s total loan portfolio by type of loan as of the dates indicated:
|
|
|
December 31, |
|
|||||||||||||||||||||||||||||||||||||
|
|
|
2019 |
|
|
2018 |
|
|
2017 |
|
|
2016 |
|
|
2015 |
|
|||||||||||||||||||||||||
|
|
|
Amount |
|
|
Percent |
|
|
Amount |
|
|
Percent |
|
|
Amount |
|
|
Percent |
|
|
Amount |
|
|
Percent |
|
|
Amount |
|
|
Percent |
|
||||||||||
|
|
|
(Dollars in thousands) |
|
|||||||||||||||||||||||||||||||||||||
|
Commercial and industrial |
|
$ |
3,205,595 |
|
|
|
17.0 |
% |
|
$ |
1,483,571 |
|
|
|
14.3 |
% |
|
$ |
1,479,910 |
|
|
|
14.8 |
% |
|
$ |
1,539,439 |
|
|
|
16.0 |
% |
|
$ |
1,692,246 |
|
|
|
17.9 |
% |
|
Warehouse purchase program |
|
|
1,552,762 |
|
|
|
8.2 |
% |
|
|
— |
|
|
|
— |
|
|
|
— |
|
|
|
— |
|
|
|
— |
|
|
|
— |
|
|
|
— |
|
|
|
— |
|
|
Real estate: |
|
|
|
|
|
|
|
|
|
|
|
|
|
|
|
|
|
|
|
|
|
|
|
|
|
|
|
|
|
|
|
|
|
|
|
|
|
|
|
|
|
Construction, land development and other land loans |
|
|
2,064,167 |
|
|
|
11.0 |
% |
|
|
1,622,289 |
|
|
|
15.7 |
% |
|
|
1,509,137 |
|
|
|
15.1 |
% |
|
|
1,263,923 |
|
|
|
13.1 |
% |
|
|
1,073,198 |
|
|
|
11.4 |
% |
|
1-4 family residential (1) |
|
|
3,880,382 |
|
|
|
20.6 |
% |
|
|
2,438,949 |
|
|
|
23.5 |
% |
|
|
2,454,548 |
|
|
|
24.5 |
% |
|
|
2,439,348 |
|
|
|
25.3 |
% |
|
|
2,360,798 |
|
|
|
25.0 |
% |
|
Home equity |
|
|
507,029 |
|
|
|
2.6 |
% |
|
|
267,960 |
|
|
|
2.6 |
% |
|
|
285,312 |
|
|
|
2.8 |
% |
|
|
278,483 |
|
|
|
2.9 |
% |
|
|
279,867 |
|
|
|
2.9 |
% |
|
Commercial real estate (including multifamily residential) (2) |
|
|
6,556,285 |
|
|
|
34.9 |
% |
|
|
3,538,557 |
|
|
|
34.1 |
% |
|
|
3,315,627 |
|
|
|
33.1 |
% |
|
|
3,162,109 |
|
|
|
32.9 |
% |
|
|
3,131,083 |
|
|
|
33.2 |
% |
|
Farmland |
|
|
495,558 |
|
|
|
2.7 |
% |
|
|
545,373 |
|
|
|
5.3 |
% |
|
|
502,841 |
|
|
|
5.0 |
% |
|
|
484,588 |
|
|
|
5.0 |
% |
|
|
434,349 |
|
|
|
4.6 |
% |
|
Agriculture |
|
|
185,297 |
|
|
|
0.9 |
% |
|
|
184,128 |
|
|
|
1.7 |
% |
|
|
187,277 |
|
|
|
1.9 |
% |
|
|
187,748 |
|
|
|
2.0 |
% |
|
|
214,469 |
|
|
|
2.3 |
% |
|
Consumer |
|
|
211,522 |
|
|
|
1.1 |
% |
|
|
120,851 |
|
|
|
1.2 |
% |
|
|
116,393 |
|
|
|
1.1 |
% |
|
|
130,703 |
|
|
|
1.4 |
% |
|
|
142,363 |
|
|
|
1.5 |
% |
|
Other |
|
|
186,749 |
|
|
|
1.0 |
% |
|
|
168,635 |
|
|
|
1.6 |
% |
|
|
169,728 |
|
|
|
1.7 |
% |
|
|
135,719 |
|
|
|
1.4 |
% |
|
|
110,216 |
|
|
|
1.2 |
% |
|
Total loans (3) |
|
$ |
18,845,346 |
|
|
|
100.0 |
% |
|
$ |
10,370,313 |
|
|
|
100.0 |
% |
|
$ |
10,020,773 |
|
|
|
100.0 |
% |
|
$ |
9,622,060 |
|
|
|
100.0 |
% |
|
$ |
9,438,589 |
|
|
|
100.0 |
% |
|
(1) |
Includes loans held for sale of $81.0 million, $29.4 million, $31.4 million, $27.0 million and $23.9 million at December 31, 2019, 2018, 2017, 2016 and 2015, respectively. |
|
(2) |
Commercial real estate loans include approximately $1.91 billion, $1.52 billion, $1.52 billion, $1.46 billion and $1.42 billion of owner-occupied loans for the years ended December 31, 2019, 2018, 2017, 2016 and 2015, respectively. |
|
(3) |
Includes fair value discounts on acquired loans of $277.5 million, $17.7 million, $34.7 million, $59.4 million and $94.7 million at December 31, 2019, 2018, 2017, 2016 and 2015, respectively. |
38
The Company separates its loan portfolio into two general categories of loans: (1) loans originated by Prosperity Bank and made pursuant to the Company’s loan policy and procedures in effect at the time the loan was made are referred to as “originated loans” and (2) “acquired loans,” which are loans acquired in a business combination. Those acquired loans that are renewed or substantially modified after the date of the business combination, thereby subjecting them to the Company’s allowance for credit losses methodology, are referred to as “re-underwritten acquired loans.” If a renewal or substantial modification of an acquired loan is underwritten by the Company with a new credit analysis, the loan may no longer be categorized as an acquired loan. For example, acquired loans to one borrower may be combined into a new loan with a new loan number and categorized as an originated loan. Acquired loans with a fair value discount or premium at the date of the business combination that remained at the reporting date are referred to as “fair-valued acquired loans.” All fair-valued acquired loans are further categorized into “Non-PCI loans” and “PCI loans” (purchased credit-impaired loans). Acquired loans with evidence of credit quality deterioration at acquisition for which it is probable that the Company would not be able to collect all contractual amounts due are PCI loans.
The following tables summarize the Company’s originated and acquired loan portfolios broken out into originated loans, re-underwritten acquired loans, Non-PCI loans and PCI loans as of the dates indicated.
|
|
|
December 31, 2019 |
|
|||||||||||||||||
|
|
|
|
|
|
|
Acquired Loans |
|
|
|
|
|
|||||||||
|
|
|
Originated Loans |
|
|
Re-Underwritten Acquired Loans |
|
|
Non-PCI Loans |
|
|
PCI Loans |
|
|
Total Loans |
|
|||||
|
|
|
(dollars in thousands) |
|
|||||||||||||||||
|
Residential mortgage loans held for sale |
|
$ |
80,959 |
|
|
$ |
— |
|
|
$ |
— |
|
|
$ |
— |
|
|
$ |
80,959 |
|
|
Commercial and industrial |
|
|
1,443,202 |
|
|
|
315,557 |
|
|
|
1,312,876 |
|
|
|
133,960 |
|
|
|
3,205,595 |
|
|
Warehouse purchase program |
|
|
1,552,762 |
|
|
|
— |
|
|
|
— |
|
|
|
— |
|
|
|
1,552,762 |
|
|
Real estate: |
|
|
|
|
|
|
|
|
|
|
|
|
|
|
|
|
|
|
|
|
|
Construction, land development and other land loans |
|
|
1,762,326 |
|
|
|
33,675 |
|
|
|
260,911 |
|
|
|
7,255 |
|
|
|
2,064,167 |
|
|
1-4 family residential (including home equity) |
|
|
2,640,228 |
|
|
|
126,588 |
|
|
|
1,533,809 |
|
|
|
5,827 |
|
|
|
4,306,452 |
|
|
Commercial real estate (including multi-family residential) |
|
|
3,300,663 |
|
|
|
381,326 |
|
|
|
2,779,681 |
|
|
|
94,615 |
|
|
|
6,556,285 |
|
|
Farmland |
|
|
432,584 |
|
|
|
11,873 |
|
|
|
49,293 |
|
|
|
1,808 |
|
|
|
495,558 |
|
|
Agriculture |
|
|
137,448 |
|
|
|
44,481 |
|
|
|
3,368 |
|
|
|
— |
|
|
|
185,297 |
|
|
Consumer and other |
|
|
311,985 |
|
|
|
33,814 |
|
|
|
52,472 |
|
|
|
— |
|
|
|
398,271 |
|
|
Total loans held for investment |
|
|
11,581,198 |
|
|
|
947,314 |
|
|
|
5,992,410 |
|
|
|
243,465 |
|
|
|
18,764,387 |
|
|
Total |
|
$ |
11,662,157 |
|
|
$ |
947,314 |
|
|
$ |
5,992,410 |
|
|
$ |
243,465 |
|
|
$ |
18,845,346 |
|
|
|
|
December 31, 2018 |
|
|||||||||||||||||
|
|
|
|
|
|
|
Acquired Loans |
|
|
|
|
|
|||||||||
|
|
|
Originated Loans |
|
|
Re-Underwritten Acquired Loans |
|
|
Non-PCI Loans |
|
|
PCI Loans |
|
|
Total Loans |
|
|||||
|
|
|
(dollars in thousands) |
|
|||||||||||||||||
|
Residential mortgage loans held for sale |
|
$ |
29,367 |
|
|
$ |
— |
|
|
$ |
— |
|
|
$ |
— |
|
|
$ |
29,367 |
|
|
Commercial and industrial |
|
|
1,281,069 |
|
|
|
170,221 |
|
|
|
32,130 |
|
|
|
151 |
|
|
|
1,483,571 |
|
|
Real estate: |
|
|
|
|
|
|
|
|
|
|
|
|
|
|
|
|
|
|
|
|
|
Construction, land development and other land loans |
|
|
1,595,052 |
|
|
|
11,101 |
|
|
|
15,644 |
|
|
|
492 |
|
|
|
1,622,289 |
|
|
1-4 family residential (including home equity) |
|
|
2,446,160 |
|
|
|
73,809 |
|
|
|
153,456 |
|
|
|
4,117 |
|
|
|
2,677,542 |
|
|
Commercial real estate (including multi-family residential) |
|
|
3,003,176 |
|
|
|
276,849 |
|
|
|
255,066 |
|
|
|
3,466 |
|
|
|
3,538,557 |
|
|
Farmland |
|
|
485,101 |
|
|
|
13,431 |
|
|
|
46,479 |
|
|
|
362 |
|
|
|
545,373 |
|
|
Agriculture |
|
|
139,849 |
|
|
|
44,208 |
|
|
|
71 |
|
|
|
— |
|
|
|
184,128 |
|
|
Consumer and other |
|
|
257,484 |
|
|
|
22,841 |
|
|
|
9,161 |
|
|
|
— |
|
|
|
289,486 |
|
|
Total loans held for investment |
|
|
9,207,891 |
|
|
|
612,460 |
|
|
|
512,007 |
|
|
|
8,588 |
|
|
|
10,340,946 |
|
|
Total |
|
$ |
9,237,258 |
|
|
$ |
612,460 |
|
|
$ |
512,007 |
|
|
$ |
8,588 |
|
|
$ |
10,370,313 |
|
39
The Company offers a broad range of short to medium-term commercial loans, primarily collateralized, to businesses for working capital (including inventory and receivables), business expansion (including acquisitions of real estate and improvements) and the purchase of equipment and machinery. Historically, the Company has originated loans for its own account, including loans in the 1-4 family residential category, and has not securitized its loans. However, the Company does originate longer-term residential mortgage loans for sale into the secondary market. The purpose of a particular loan generally determines its structure.
Loans to borrowers with aggregate debt relationships over $1.0 million and below $5.0 million are evaluated and acted upon on a daily basis by two of the company-wide loan concurrence officers. Loans to borrowers with aggregate debt relationships above $5.0 million are evaluated and acted upon by an officers’ loan committee that meets weekly.
Commercial and Industrial Loans. In nearly all cases, the Company’s commercial loans are made in the Company’s market areas and are underwritten on the basis of the borrower’s ability to service the debt from income. Working capital loans are primarily collateralized by short-term assets whereas term loans are primarily collateralized by long-term assets. As a general practice, term loans are secured by any available real estate, equipment or other assets owned by the borrower. Both working capital and term loans are typically supported by a personal guaranty of a principal. In general, commercial loans involve more credit risk than residential mortgage loans and commercial mortgage loans and, therefore, usually yield a higher return. The increased risk in commercial loans is due to the type of collateral securing these loans as well as the expectation that commercial loans generally will be serviced principally from the operations of the business, and those operations may not be successful. Historical trends have shown these types of loans to have higher delinquencies than mortgage loans. As a result of these additional complexities, variables and risks, commercial loans require more thorough underwriting and servicing than other types of loans.
Included in commercial loans are (1) commitments to oil and gas producers largely secured by proven, developed and producing reserves and (2) commitments to service, equipment and midstream companies secured mainly by accounts receivable, inventory and equipment. Mineral reserve values supporting commitments to producers are normally re-determined semi-annually using reserve studies prepared by a third-party or the Company’s oil and gas engineer. Accounts receivable and inventory borrowing bases for service companies are typically re-determined monthly. Funding requests by both producers and service companies are monitored relative to the most recently determined borrowing base. As of December 31, 2019, the Company had $401.5 million in funded commitments outstanding to oil and gas production companies and $203.1 million in unfunded commitments, for a total of $604.6 million. This compares with funded commitments to oil and gas production companies of $114.2 million and $128.6 million in unfunded commitments, for a total of $242.8 million as of December 31, 2018. Total unfunded commitments to producers include letters of credit issued in lieu of oil well plugging bonds. As of December 31, 2019, the Company had outstanding $296.8 million in funded commitments to service companies and $139.1 million in unfunded commitments for a total of $435.9 million. This compares with funded commitments to service companies of $258.3 million and $109.9 million in unfunded commitments, for a total of $368.2 million as of December 31, 2018.
Commercial Real Estate. The Company makes commercial real estate loans collateralized by owner-occupied and nonowner-occupied real estate to finance the purchase of real estate. The Company’s commercial real estate loans are collateralized by first liens on real estate, typically have variable interest rates (or five year or less fixed rates) and amortize over a 15- to 25-year period. Payments on loans secured by nonowner-occupied properties are often dependent on the successful operation or management of the properties. Accordingly, repayment of these loans may be subject to adverse conditions in the real estate market or the economy to a greater extent than other types of loans. The Company seeks to minimize these risks in a variety of ways, including giving careful consideration to the property’s operating history, future operating projections, current and projected occupancy, location and physical condition, in connection with underwriting these loans. The underwriting analysis also includes credit verification, analysis of global cash flow, appraisals and a review of the financial condition of the borrower and guarantor.
1-4 Family Residential Loans. The Company’s lending activities also include the origination of 1-4 family residential mortgage loans (including home equity loans) collateralized by owner-occupied and nonowner-occupied residential properties located in the Company’s market areas. The Company offers a variety of mortgage loan portfolio products which generally are amortized over five to 30 years. Loans collateralized by 1-4 family residential real estate generally have been originated in amounts of no more than 89% of appraised value. The Company requires mortgage title insurance, as well as hazard, wind and/or flood insurance as appropriate. The Company prefers to retain residential mortgage loans for its own account rather than selling them into the secondary market. By doing so, the Company incurs interest rate risk as well as the risks associated with non-payments on such loans. The Company’s mortgage department also offers a variety of mortgage loan products which are generally amortized over 30 years, including FHA and VA loans, which are sold to secondary market investors.
40
Construction, Land Development and Other Land Loans. The Company makes loans to finance the construction of residential and nonresidential properties. Construction loans generally are collateralized by first liens on real estate and have floating interest rates. The Company conducts periodic inspections, either directly or through an agent, prior to approval of periodic draws on these loans. Underwriting guidelines similar to those described above are also used in the Company’s construction lending activities, with heightened analysis of construction and/or development costs. Construction loans involve additional risks attributable to the fact that loan funds are advanced upon the security of a project under construction, and the project is of uncertain value prior to its completion. Because of uncertainties inherent in estimating construction costs, the market value of the completed project and the effects of governmental regulation on real property, it can be difficult to accurately evaluate the total funds required to complete a project and the related loan to value ratio. As a result of these uncertainties, construction lending often involves the disbursement of substantial funds with repayment dependent, in part, on the success of the ultimate project rather than the ability of a borrower or guarantor to repay the loan. If the Company is forced to foreclose on a project prior to completion, the Company may not be able to recover all of the unpaid portion of the loan. In addition, the Company may be required to fund additional amounts to complete a project and may have to hold the property for an indeterminate period of time. Although the Company has underwriting procedures designed to identify what it believes to be acceptable levels of risks in construction lending, these procedures may not prevent losses from the risks described above.
Warehouse Purchase Program. The Company acquired the Warehouse Purchase Program as part of the merger with LegacyTexas. The Warehouse Purchase Program allows unaffiliated mortgage originators (“Clients”) to close 1-4 family real estate loans in their own name and manage their cash flow needs until the loans are sold to investors. The Company's Clients are strategically targeted for their experienced management teams and analyzed for the expected profitability of each Client’s business model over the long term. The Clients, located across the U.S., and originate mortgage loans primarily through traditional retail and/or wholesale business models and use underwriting standards consistent with the United States government-sponsored enterprises, “Agencies” such as Fannie Mae, the private investors to which the mortgage loans are ultimately sold and the mortgage insurers.
At December 31, 2019, the Bank had 37 mortgage banking company customers with aggregate uncommitted facilities (“Facilities”) of $2.21 billion and an actual aggregate outstanding balance of $1.55 billion; and the Clients’ individual Facilities ranged in size from $2.0 million to $150.0 million. A Facility is often supported by a payment guaranty of the Client’s owners holding significant ownership positions, along with non-interest-bearing compensating balance deposits in line with the Facility amount. Typical covenants include minimum tangible net worth, maximum leverage and minimum liquidity. As loans age, the Company requires loan curtailments to reduce the Company’s risk if an individual mortgage loan is not timely purchased by an investor. The average mortgage loan being purchased by the Company reflects a blend of Agency and private investor underwriting guidelines. At December 31, 2019 the Company’s mortgage warehouse portfolio had an average loan-to-value ratio (LTV) of 77%, an average credit score of 722 and an average loan size of $292,000. The Company’s purchases under these Facilities are priced using a combined base rate and a risk premium set for both product type (Prime, Jumbo, etc.) and age of the loan.
Although not subject to any legally binding commitments, when the Company makes a purchase decision, it acquires a 100% participation interest in the mortgage loans originated by its Clients. Individual mortgage loans are warehoused in the Company’s portfolio only for a short duration, usually averaging less than 30 days. When instructed by a Client that a warehoused loan has been sold to an investor, the Company delivers the note to the investor that pays the Company which in turn remits the net sales proceeds to the Client.
Agriculture Loans. The Company provides agriculture loans for short-term livestock and crop production, including rice, cotton, milo and corn, farm equipment financing and agriculture real estate financing. The Company evaluates agriculture borrowers primarily based on their historical profitability, level of experience in their particular industry segment, overall financial capacity and the availability of secondary collateral to withstand economic and natural variations common to the industry. Because agriculture loans present a higher level of risk associated with events caused by nature, the Company routinely makes on-site visits and inspections in order to identify and monitor such risks.
Consumer Loans. Consumer loans made by the Company include direct “A”-credit automobile loans, recreational vehicle loans, boat loans, home improvement loans, personal loans (collateralized and uncollateralized) and deposit account collateralized loans. The terms of these loans typically range from 12 to 180 months and vary based upon the nature of collateral and size of loan. Generally, consumer loans entail greater risk than do real estate secured loans, particularly in the case of consumer loans that are unsecured or collateralized by rapidly depreciating assets such as automobiles. In such cases, any repossessed collateral for a defaulted consumer loan may not provide an adequate source of repayment for the outstanding loan balance. The remaining deficiency often does not warrant further substantial collection efforts against the borrower beyond obtaining a deficiency judgment. In addition, consumer loan collections are dependent on the borrower’s continuing financial stability, and thus are more likely to be adversely affected by job loss, divorce, illness, personal bankruptcy or death. Furthermore, the application of various federal and state laws may limit the amount which can be recovered on such loans.
41
Loan Maturities. The contractual maturity ranges of the Company’s loan portfolio by type of loan and the amount of such loans with predetermined interest rates and floating rates in each maturity range as of December 31, 2019 are summarized in the following table. Contractual maturities are based on contractual amounts outstanding and do not include loan purchase discounts of $277.5 million, loans held for sale of $81.0 million or Warehouse Purchase Program loans of $1.55 billion at December 31, 2019:
|
|
|
One Year or Less |
|
|
After One Year Through Five Years |
|
|
After Five Years |
|
|
Total |
|
||||
|
|
|
(Dollars in thousands) |
|
|||||||||||||
|
Commercial and industrial |
|
$ |
951,809 |
|
|
$ |
1,686,113 |
|
|
$ |
540,196 |
|
|
$ |
3,178,118 |
|
|
Real estate: |
|
|
|
|
|
|
|
|
|
|
|
|
|
|
|
|
|
Construction, land development and other land loans |
|
|
616,454 |
|
|
|
421,713 |
|
|
|
1,030,086 |
|
|
|
2,068,253 |
|
|
1-4 family residential (includes home equity) |
|
|
47,061 |
|
|
|
154,040 |
|
|
|
4,098,261 |
|
|
|
4,299,362 |
|
|
Commercial (includes multi-family residential) |
|
|
600,362 |
|
|
|
1,884,035 |
|
|
|
4,167,429 |
|
|
|
6,651,826 |
|
|
Agriculture (includes farmland) |
|
|
151,814 |
|
|
|
70,674 |
|
|
|
460,840 |
|
|
|
683,329 |
|
|
Consumer and other |
|
|
135,151 |
|
|
|
273,591 |
|
|
|
199,446 |
|
|
|
608,188 |
|
|
Total |
|
$ |
2,502,651 |
|
|
$ |
4,490,167 |
|
|
$ |
10,496,257 |
|
|
$ |
17,489,075 |
|
|
Loans with a predetermined interest rate |
|
$ |
799,447 |
|
|
$ |
2,289,916 |
|
|
$ |
4,163,284 |
|
|
$ |
7,252,646 |
|
|
Loans with a floating interest rate |
|
|
1,703,204 |
|
|
|
2,200,251 |
|
|
|
6,332,973 |
|
|
|
10,236,429 |
|
|
Total |
|
$ |
2,502,651 |
|
|
$ |
4,490,167 |
|
|
$ |
10,496,257 |
|
|
$ |
17,489,075 |
|
Nonperforming Assets
Nonperforming assets include loans on nonaccrual status, accruing loans 90 days or more past due, repossessed assets and real estate which has been acquired through foreclosure and is awaiting disposition. Nonperforming assets do not include PCI loans unless the timing and amount of projected cash flows can no longer be reasonably estimated. PCI loans become subject to the Company’s allowance for credit losses methodology when a deterioration in projected cash flows is identified.
The Company has several procedures in place to assist it in maintaining the overall quality of its loan portfolio. The Company has established underwriting guidelines to be followed by its officers, and the Company also monitors its delinquency levels for any negative or adverse trends. Nevertheless, the Company’s loan portfolio could become subject to increasing pressures from deteriorating borrower credit due to general economic conditions.
As part of the on-going monitoring of the Company’s loan portfolio and the methodology for calculating the allowance for credit losses, management grades each loan from 1 to 9. For certain loans in risk grades 7 to 9, a specific reserve may be required when calculating the allowance for credit losses.
The Company generally places a loan on nonaccrual status and ceases accruing interest when the payment of principal or interest is delinquent for 90 days, or earlier in some cases, unless the loan is in the process of collection and the underlying collateral fully supports the carrying value of the loan.
With respect to potential problem loans, an evaluation of the borrower’s overall financial condition is made, together with an appraisal for loans collateralized by real estate, to determine the need, if any, for possible write-downs or appropriate additions to the allowance for credit losses.
42
The following table presents information regarding past due loans and nonperforming assets at the dates indicated. There were no past due loans or nonperforming assets related to the Warehouse Purchase Program loans at December 31, 2019.
|
|
|
December 31, |
|
|||||||||||||||||
|
|
|
|
2019 |
|
|
|
2018 |
|
|
|
2017 |
|
|
|
2016 |
|
|
|
2015 |
|
|
|
|
(Dollars in thousands) |
|
|||||||||||||||||
|
Nonaccrual loans (1)(2) |
|
$ |
55,243 |
|
|
$ |
13,147 |
|
|
$ |
25,264 |
|
|
$ |
31,642 |
|
|
$ |
39,711 |
|
|
Accruing loans 90 or more days past due |
|
|
441 |
|
|
|
4,004 |
|
|
|
1,004 |
|
|
|
956 |
|
|
|
614 |
|
|
Total nonperforming loans |
|
|
55,684 |
|
|
|
17,151 |
|
|
|
26,268 |
|
|
|
32,598 |
|
|
|
40,325 |
|
|
Repossessed assets |
|
|
323 |
|
|
|
- |
|
|
|
35 |
|
|
|
241 |
|
|
|
171 |
|
|
Other real estate |
|
|
6,936 |
|
|
|
1,805 |
|
|
|
11,152 |
|
|
|
15,463 |
|
|
|
2,963 |
|
|
Total nonperforming assets |
|
$ |
62,943 |
|
|
$ |
18,956 |
|
|
$ |
37,455 |
|
|
$ |
48,302 |
|
|
$ |
43,459 |
|
|
Nonperforming assets to total loans and other real estate |
|
|
0.33 |
% |
|
|
0.18 |
% |
|
|
0.37 |
% |
|
|
0.50 |
% |
|
|
0.46 |
% |
|
Nonperforming assets to total loans, excluding Warehouse Purchase Program loans, and other real estate |
|
|
0.36 |
% |
|
|
0.18 |
% |
|
|
0.37 |
% |
|
|
0.50 |
% |
|
|
0.46 |
% |
|
(1) |
Includes troubled debt restructurings of $13.6 million, $51 thousand, $53 thousand, $97 thousand and $681 thousand for the years ended December 31, 2019, 2018, 2017, 2016 and 2015, respectively. |
|
(2) |
There were no non-performing or troubled debt restructurings of warehouse lines of credit or Warehouse Purchase Program loans for the periods presented. |
The following tables present information regarding past due loans and nonperforming assets differentiated among originated loans, re-underwritten acquired loans, Non-PCI loans and PCI loans at the dates indicated:
|
|
|
December 31, 2019 |
|
|||||||||||||||||
|
|
|
|
|
|
|
Acquired Loans |
|
|
|
|
|
|||||||||
|
|
|
Originated Loans |
|
|
Re-Underwritten Acquired Loans |
|
|
Non-PCI Loans |
|
|
PCI Loans |
|
|
Total Loans |
|
|||||
|
|
|
(Dollars in thousands) |
|
|||||||||||||||||
|
Nonaccrual loans |
|
$ |
43,612 |
|
|
$ |
2,423 |
|
|
$ |
7,011 |
|
|
$ |
2,197 |
|
|
$ |
55,243 |
|
|
Accruing loans 90 or more days past due |
|
|
441 |
|
|
|
— |
|
|
|
— |
|
|
|
— |
|
|
|
441 |
|
|
Total nonperforming loans |
|
|
44,053 |
|
|
|
2,423 |
|
|
|
7,011 |
|
|
|
2,197 |
|
|
|
55,684 |
|
|
Repossessed assets |
|
|
— |
|
|
|
— |
|
|
|
323 |
|
|
|
— |
|
|
|
323 |
|
|
Other real estate |
|
|
718 |
|
|
|
— |
|
|
|
6,218 |
|
|
|
— |
|
|
|
6,936 |
|
|
Total nonperforming assets |
|
$ |
44,771 |
|
|
$ |
2,423 |
|
|
$ |
13,552 |
|
|
$ |
2,197 |
|
|
$ |
62,943 |
|
|
Nonperforming assets to total loans and other real estate by category |
|
|
0.38 |
% |
|
|
0.26 |
% |
|
|
0.23 |
% |
|
|
0.90 |
% |
|
|
0.33 |
% |
|
Nonperforming assets to total loans, excluding Warehouse Purchase Program loans, and other real estate by category |
|
|
0.44 |
% |
|
|
0.26 |
% |
|
|
0.23 |
% |
|
|
0.90 |
% |
|
|
0.36 |
% |
|
|
|
December 31, 2018 |
|
|||||||||||||||||
|
|
|
|
|
|
|
Acquired Loans |
|
|
|
|
|
|||||||||
|
|
|
Originated Loans |
|
|
Re-Underwritten Acquired Loans |
|
|
Non-PCI Loans |
|
|
PCI Loans |
|
|
Total Loans |
|
|||||
|
|
|
(Dollars in thousands) |
|
|||||||||||||||||
|
Nonaccrual loans |
|
$ |
9,177 |
|
|
$ |
1,737 |
|
|
$ |
2,214 |
|
|
$ |
19 |
|
|
$ |
13,147 |
|
|
Accruing loans 90 or more days past due |
|
|
3,783 |
|
|
|
221 |
|
|
|
— |
|
|
|
— |
|
|
|
4,004 |
|
|
Total nonperforming loans |
|
|
12,960 |
|
|
|
1,958 |
|
|
|
2,214 |
|
|
|
19 |
|
|
|
17,151 |
|
|
Repossessed assets |
|
|
— |
|
|
|
— |
|
|
|
— |
|
|
|
— |
|
|
|
— |
|
|
Other real estate |
|
|
1,315 |
|
|
|
455 |
|
|
|
35 |
|
|
|
— |
|
|
|
1,805 |
|
|
Total nonperforming assets |
|
$ |
14,275 |
|
|
$ |
2,413 |
|
|
$ |
2,249 |
|
|
$ |
19 |
|
|
$ |
18,956 |
|
|
Nonperforming assets to total loans and other real estate by category |
|
|
0.15 |
% |
|
|
0.39 |
% |
|
|
0.44 |
% |
|
|
0.22 |
% |
|
|
0.18 |
% |
The Company had $62.9 million in nonperforming assets at December 31, 2019 compared with $19.0 million at December 31, 2018 and $37.5 million at December 31, 2017. The nonperforming assets consisted of 232 separate credits or other real estate properties at December 31, 2019, compared with 83 at December 31, 2018 and 99 at December 31, 2017.
43
If interest on nonaccrual loans had been accrued under the original loan terms, approximately $2.9 million, $1.7 million and $2.7 million would have been recorded as income for the years ended December 31, 2019, 2018 and 2017, respectively. The Company had $55.2 million, $13.1 million and $25.3 million in nonaccrual loans at December 31, 2019, 2018 and 2017, respectively.
At December 31, 2019, of the total nonperforming assets, $44.8 million resulted from originated loans, $2.4 million resulted from re-underwritten acquired loans, $13.6 million resulted from Non-PCI loans and $2.2 million resulted from PCI loans. At December 31, 2018, of the total nonperforming assets, $14.3 million resulted from originated loans, $2.4 million resulted from re-underwritten acquired loans, $2.2 million resulted from Non-PCI loans and $19 thousand resulted from PCI loans. A PCI loan becomes impaired when there is a deterioration in projected cash flows after acquisition.
Nonperforming assets were 0.33% of total loans and other real estate at December 31, 2019 compared with 0.18% of total loans and other real estate at December 31, 2018. The allowance for credit losses as a percentage of total nonperforming loans was 157.1% at December 31, 2019 and 504.0% at December 31, 2018.
Allowance for Credit Losses
The following table presents, as of and for the periods indicated, an analysis of the allowance for credit losses and other related data:
|
|
|
Years Ended December 31, |
|
|||||||||||||||||
|
|
|
2019 |
|
|
2018 |
|
|
2017 |
|
|
2016 |
|
|
2015 |
|
|||||
|
|
|
(Dollars in thousands) |
|
|||||||||||||||||
|
Average loans outstanding |
|
$ |
11,972,093 |
|
|
$ |
10,141,625 |
|
|
$ |
9,822,225 |
|
|
$ |
9,629,714 |
|
|
$ |
9,200,765 |
|
|
Gross loans outstanding at end of period |
|
$ |
18,845,346 |
|
|
$ |
10,370,313 |
|
|
$ |
10,020,773 |
|
|
$ |
9,622,060 |
|
|
$ |
9,438,589 |
|
|
Allowance for credit losses at beginning of period |
|
$ |
86,440 |
|
|
$ |
84,041 |
|
|
$ |
85,326 |
|
|
$ |
81,384 |
|
|
$ |
80,762 |
|
|
Provision for credit losses |
|
|
4,300 |
|
|
|
16,350 |
|
|
|
14,325 |
|
|
|
24,000 |
|
|
|
7,560 |
|
|
Charge-offs: |
|
|
|
|
|
|
|
|
|
|
|
|
|
|
|
|
|
|
|
|
|
Commercial and industrial |
|
|
(3,073 |
) |
|
|
(11,296 |
) |
|
|
(14,836 |
) |
|
|
(14,371 |
) |
|
|
(7,696 |
) |
|
Real estate and agriculture |
|
|
(723 |
) |
|
|
(2,291 |
) |
|
|
(446 |
) |
|
|
(7,796 |
) |
|
|
(1,150 |
) |
|
Consumer and other |
|
|
(4,061 |
) |
|
|
(4,186 |
) |
|
|
(3,652 |
) |
|
|
(5,346 |
) |
|
|
(3,304 |
) |
|
Recoveries: |
|
|
|
|
|
|
|
|
|
|
|
|
|
|
|
|
|
|
|
|
|
Commercial and industrial |
|
|
2,189 |
|
|
|
2,261 |
|
|
|
1,763 |
|
|
|
2,812 |
|
|
|
3,322 |
|
|
Real estate and agriculture |
|
|
1,430 |
|
|
|
410 |
|
|
|
506 |
|
|
|
3,516 |
|
|
|
600 |
|
|
Consumer and other |
|
|
967 |
|
|
|
1,151 |
|
|
|
1,055 |
|
|
|
1,127 |
|
|
|
1,290 |
|
|
Net charge-offs(1) |
|
|
(3,271 |
) |
|
|
(13,951 |
) |
|
|
(15,610 |
) |
|
|
(20,058 |
) |
|
|
(6,938 |
) |
|
Allowance for credit losses at end of period |
|
$ |
87,469 |
|
|
$ |
86,440 |
|
|
$ |
84,041 |
|
|
$ |
85,326 |
|
|
$ |
81,384 |
|
|
Ratio of allowance to end of period loans |
|
|
0.46 |
% |
|
|
0.83 |
% |
|
|
0.84 |
% |
|
|
0.89 |
% |
|
|
0.86 |
% |
|
Ratio of allowance to end of period loans, excluding Warehouse Purchase Program loans |
|
|
0.51 |
% |
|
|
0.83 |
% |
|
|
0.84 |
% |
|
|
0.89 |
% |
|
|
0.86 |
% |
|
Ratio of net charge-offs to average loans |
|
|
0.03 |
% |
|
|
0.14 |
% |
|
|
0.16 |
% |
|
|
0.21 |
% |
|
|
0.08 |
% |
|
Ratio of allowance to end of period nonperforming loans |
|
|
157.1 |
% |
|
|
504.0 |
% |
|
|
319.9 |
% |
|
|
261.8 |
% |
|
|
201.8 |
% |
|
(1) |
There was no net charge-off activity on Warehouse Purchase Program loans during the periods presented. |
The allowance for credit losses is established through charges to earnings in the form of a provision for credit losses. The amount of the allowance for credit losses is affected by the following: (1) charge-offs of loans that occur when loans are deemed uncollectible and decrease the allowance, (2) recoveries on loans previously charged off that increase the allowance and (3) provisions for credit losses charged to earnings that increase the allowance. Based on an evaluation of the loan portfolio and consideration of the factors listed below, management presents a quarterly review of the allowance for credit losses to the Bank’s Board of Directors, indicating any change in the allowance since the last review and any recommendations as to adjustments in the allowance. Although management believes it uses the best information available to make determinations with respect to the allowance for credit losses, further adjustments may be necessary if economic conditions differ from the assumptions used in making the initial determinations.
The Company’s allowance for credit losses consists of two components: a specific valuation allowance based on probable losses on specifically identified loans and a general valuation allowance based on historical loan loss experience, general economic conditions and other qualitative risk factors both internal and external to the Company.
44
In setting the specific valuation allowance, the Company follows a loan review program to evaluate the credit risk in the total loan portfolio and assigns risk grades to each loan. Through this loan review process, the Company maintains an internal list of impaired loans which, along with the delinquency list of loans, helps management assess the overall quality of the loan portfolio and the adequacy of the allowance for credit losses. All loans that have been identified as impaired are reviewed on a quarterly basis in order to determine whether a specific reserve is required. For certain impaired loans, the Company allocates a specific loan loss reserve primarily based on the value of the collateral securing the impaired loan. The specific reserves are determined on an individual loan basis. Loans for which specific reserves are provided are excluded from the general valuation allowance described below.
In connection with this review of the loan portfolio, the Company considers risk elements attributable to particular loan types or categories in assessing the quality of individual loans. Some of the risk elements include:
|
|
• |
for 1-4 family residential mortgage loans, the borrower’s ability to repay the loan, including a consideration of the debt to income ratio and employment and income stability, the loan to value ratio, and the age, condition and marketability of collateral; |
|
|
• |
for commercial mortgage loans and multifamily residential loans, the debt service coverage ratio (income from the property in excess of operating expenses compared to loan payment requirements), operating results of the owner in the case of owner-occupied properties, the loan to value ratio, the age and condition of the collateral and the volatility of income, property value and future operating results typical of properties of that type; |
|
|
• |
for construction, land development and other land loans, the perceived feasibility of the project including the ability to sell developed lots or improvements constructed for resale or the ability to lease property constructed for lease, the quality and nature of contracts for presale or prelease, if any, experience and ability of the developer and loan to value ratio; |
|
|
• |
for commercial and industrial loans, the operating results of the commercial, industrial or professional enterprise, the borrower’s business, professional and financial ability and expertise, the specific risks and volatility of income and operating results typical for businesses in that category and the value, nature and marketability of collateral; |
|
|
• |
for the Warehouse Purchase Program, the capitalization and liquidity of the mortgage banking client, the operating experience, the Client’s satisfactory underwriting of purchased loans and the consistent timeliness by Client of loan resale to investors; |
|
|
• |
for agriculture real estate loans, the experience and financial capability of the borrower, projected debt service coverage of the operations of the borrower and loan to value ratio; and |
|
|
• |
for non-real estate agriculture loans, the operating results, experience and financial capability of the borrower, historical and expected market conditions and the value, nature and marketability of collateral. |
In addition, for each category, the Company considers secondary sources of income and the financial strength and credit history of the borrower and any guarantors.
In determining the amount of the general valuation allowance, management considers factors such as historical loan loss experience, concentration risk of specific loan types, the volume, growth and composition of the Company’s loan portfolio, current economic conditions that may affect the borrower’s ability to pay and the value of collateral, the evaluation of the Company’s loan portfolio through its internal loan review process, general economic conditions, other qualitative risk factors both internal and external to the Company and other relevant factors. Based on a review of these factors for each loan type, the Company applies an estimated percentage to the outstanding balance of each loan type, excluding any loan that has a specific reserve allocated to it. The Company uses this information to establish the amount of the general valuation allowance.
A change in the allowance for credit losses can be attributable to several factors, most notably (1) specific reserves identified for impaired loans, (2) historical credit loss information, (3) changes in environmental factors and (4) growth in the balance of originated loans and the re-categorization of fair-valued acquired loans to re-underwritten acquired loans, which subjects such loans to the allowance methodology.
Changes in the Company’s asset quality are reflected in the allowance in several ways. Specific reserves that are calculated on a loan-by-loan basis and the qualitative assessment of all other loans reflect current changes in the credit quality of the loan portfolio. Historical credit losses, on the other hand, are based on a three-year look back period, which are then applied to estimate current credit losses inherent in the loan portfolio. A deterioration in the credit quality of the loan portfolio in the current period would increase the historical credit loss factor to be applied in future periods, just as an improvement in credit quality would decrease the historical credit loss factor.
45
The allowance for credit losses is further determined by the size of the loan portfolio subject to the allowance methodology and environmental factors that include Company-specific risk indicators and general economic conditions, both of which are constantly changing. The Company evaluates the economic and portfolio-specific factors on a quarterly basis to determine a qualitative component of the general valuation allowance. The factors include economic metrics, business conditions, delinquency trends, credit concentrations, nature and volume of the portfolio and other adjustments for items not covered by specific reserves and historical loss experience. Management’s assessment of qualitative factors is a statistically based approach to determine the inherent probable loss associated with such factors. Based on the Company’s actual historical loan loss experience relative to economic and loan portfolio-specific factors at the time the losses occurred, management is able to identify the probable level of incurred losses as of the date of measurement. The correlation of historical loss experience with current economic conditions provides an estimate of inherent and probable losses that has not been previously factored into the general valuation allowance by the determination of specific reserves and recent historical losses. Additionally, the Company considers qualitative factors not easily quantified and the possibility of model imprecision.
Utilizing the aggregation of specific reserves, historical loss experience and a qualitative component, management is able to determine the valuation allowance to reflect the full inherent probable loss.
In determining the allowance for credit losses, management also considers the type of loan (originated or re-underwritten acquired) and the credit quality of the loan. The Company distinguishes between originated loans and re-underwritten acquired loans, which are accounted for under the contractual yield method, and fair-valued acquired loans consisting of Non-PCI loans and PCI loans, which are accounted for as purchased loans.
Loans acquired in business combinations are initially recorded at fair value, which includes an estimate of inherent credit losses expected to be realized over the remaining lives of the loans, and therefore no corresponding allowance for credit losses is recorded for these loans at acquisition. When a fair-valued acquired loan is renewed at its maturity date, the loan is re-categorized as a re-underwritten acquired loan. When a fair-valued acquired loan is modified after acquisition, the loan is independently evaluated subsequent to the modification decision to determine whether the modification was substantial, and therefore requires that the loan be re-categorized as a re-underwritten acquired loan. This determination is based on a discounted cash-flow analysis. Generally, when a change in discounted cash-flow of greater than 10% is identified, the fair-valued acquired loan becomes categorized as a re-underwritten acquired loan. If and when a fair-valued acquired loan becomes a re-underwritten acquired loan, the re-underwritten acquired loan is evaluated at the time of renewal or modification in accordance with the Company’s allowance for credit losses methodology described above.
Non-PCI loans that were not deemed impaired subsequent to the acquisition date are considered non-impaired and are evaluated as part of the general valuation allowance. Non-PCI loans that have not become impaired subsequent to acquisition are segregated into a pool for each acquisition for allowance calculation purposes. For each pool, the Company estimates a hypothetical allowance for credit losses also referred to as an “indicated reserve” that is calculated in accordance with GAAP requirements. The Company uses the acquired bank’s past loss history adjusted for qualitative factors to establish the indicated reserve. The indicated reserve for each pool of Non-PCI loans is compared with the remaining discount for the respective pool to test for credit quality deterioration and the possible need for a loan loss provision. To the extent the remaining discount of the pool is greater than the indicated reserve, no additional allowance is necessary. If the remaining discount of the pool is less than the indicated reserve, the difference results in an increase to the allowance recorded through a provision for credit losses.
Non-PCI loans that have deteriorated to an impaired status subsequent to acquisition are evaluated for a specific reserve on a quarterly basis which, when identified, is added to the allowance for credit losses. The Company reviews impaired Non-PCI loans on a loan-by-loan basis and determines the specific reserve based on the difference between the recorded investment in the loan and one of three factors: expected future cash flows, observable market price or fair value of the collateral. Because essentially all of the Company’s impaired Non-PCI loans have been collateral-dependent, the amount of the specific reserve historically has been determined by comparing the fair value of the collateral securing the Non-PCI loan with the recorded investment in such loan. In the future, the Company will continue to analyze impaired Non-PCI loans on a loan-by-loan basis and may use an alternative measurement method to determine the specific reserve, as appropriate and in accordance with applicable accounting standards.
PCI loans are individually monitored on a quarterly basis to assess for deterioration subsequent to acquisition and are only subject to the Company’s allowance methodology when a deterioration in projected cash flows is identified. If a deterioration in cash flows is identified, an additional provision for credit losses is made. PCI loans were recorded at their acquisition date fair values, which were based on expected cash flows and included estimates of expected future credit losses. The Company’s estimates of loan fair values at the acquisition date may be adjusted for a period of up to one year as the Company continues to evaluate its estimate of expected future cash flows at the acquisition date. If the Company determines that losses arose after the acquisition date, the additional losses will be reflected as a provision for credit losses. An allowance for credit losses is not calculated for PCI loans that have not experienced deterioration subsequent to the acquisition date. See “Critical Accounting Policies” above for more information.
46
As described in the section captioned “Critical Accounting Policies” above, the Company’s determination of the allowance for credit losses involves a high degree of judgment and complexity. The Company’s analysis of qualitative, or environmental, factors on pools of loans with common risk characteristics, in combination with the quantitative historical loss information and specific reserves, provides the Company with an estimate of inherent losses. The allowance must reflect changes in the balance of loans subject to the allowance methodology, as well as the estimated imminent losses associated with those loans. In the Company’s case, the $1.0 million increase in the allowance for credit losses for the year ended December 31, 2019 was primarily attributable to an increase in total loans, partially offset by a decrease in specific reserves.
The following table shows the allocation of the allowance for credit losses among various categories of loans and certain other information as of the dates indicated. The allocation is made for analytical purposes and is not necessarily indicative of the categories in which future losses may occur. The total allowance is available to absorb losses from any loan category.
|
|
|
December 31, |
|
|||||||||||||||||||||||||||||||||||||
|
|
|
2019 |
|
|
2018 |
|
|
2017 |
|
|
2016 |
|
|
2015 |
|
|||||||||||||||||||||||||
|
|
|
Amount |
|
|
Percent of Loans to Total Loans(1) |
|
|
Amount |
|
|
Percent of Loans to Total Loans(1) |
|
|
Amount |
|
|
Percent of Loans to Total Loans(1) |
|
|
Amount |
|
|
Percent of Loans to Total Loans(1) |
|
|
Amount |
|
|
Percent of Loans to Total Loans(1) |
|
||||||||||
|
|
|
(Dollars in thousands) |
|
|||||||||||||||||||||||||||||||||||||
|
Balance of allowance for credit losses applicable to: |
|
|
|
|
|
|
|
|
|
|
|
|
|
|
|
|
|
|
|
|
|
|
|
|
|
|
|
|
|
|
|
|
|
|
|
|
|
|
|
|
|
Commercial and industrial |
|
$ |
40,445 |
|
|
|
18.5 |
% |
|
$ |
40,223 |
|
|
|
14.3 |
% |
|
$ |
38,810 |
|
|
|
14.8 |
% |
|
$ |
35,836 |
|
|
|
16.0 |
% |
|
$ |
33,409 |
|
|
|
17.9 |
% |
|
Real estate |
|
|
42,263 |
|
|
|
75.2 |
% |
|
|
40,937 |
|
|
|
75.9 |
% |
|
|
39,933 |
|
|
|
75.5 |
% |
|
|
43,811 |
|
|
|
74.2 |
% |
|
|
42,769 |
|
|
|
72.5 |
% |
|
Agriculture and agriculture real estate |
|
|
2,971 |
|
|
|
4.0 |
% |
|
|
3,693 |
|
|
|
7.0 |
% |
|
|
3,772 |
|
|
|
6.9 |
% |
|
|
4,073 |
|
|
|
7.0 |
% |
|
|
3,845 |
|
|
|
6.9 |
% |
|
Consumer and other |
|
|
1,790 |
|
|
|
2.3 |
% |
|
|
1,587 |
|
|
|
2.8 |
% |
|
|
1,526 |
|
|
|
2.8 |
% |
|
|
1,606 |
|
|
|
2.8 |
% |
|
|
1,361 |
|
|
|
2.7 |
% |
|
Total allowance for credit losses |
|
$ |
87,469 |
|
|
|
100.0 |
% |
|
$ |
86,440 |
|
|
|
100.0 |
% |
|
$ |
84,041 |
|
|
|
100.0 |
% |
|
$ |
85,326 |
|
|
|
100.0 |
% |
|
$ |
81,384 |
|
|
|
100.0 |
% |
(1) Loans outstanding as a percentage of total loans, excluding Warehouse Purchase Program loans.
The Company further disaggregates its allowance for credit losses to distinguish between the portion of the allowance attributed to originated loans and the portion attributed to acquired loans.
47
The following tables present, as of and for the periods indicated, information regarding the allowance for credit losses differentiated between originated loans and acquired loans, which includes re-underwritten acquired loans, Non-PCI loans and PCI loans. Reported net charge-offs may include those from Non-PCI loans and PCI loans, but only if the total charge-off required is greater than the remaining discount.
|
|
|
As of and for the Year Ended December 31, 2019 |
|
|||||||||
|
|
|
Originated Loans |
|
|
Acquired Loans |
|
|
Total |
|
|||
|
|
|
(Dollars in thousands) |
|
|||||||||
|
Average loans outstanding |
|
$ |
9,707,594 |
|
|
$ |
2,264,499 |
|
|
$ |
11,972,093 |
|
|
Gross loans outstanding at end of period |
|
$ |
11,662,157 |
|
|
$ |
7,183,189 |
|
|
$ |
18,845,346 |
|
|
Allowance for credit losses at beginning of period |
|
$ |
78,956 |
|
|
$ |
7,484 |
|
|
$ |
86,440 |
|
|
Provision for credit losses |
|
|
1,678 |
|
|
|
2,622 |
|
|
|
4,300 |
|
|
Charge-offs: |
|
|
|
|
|
|
|
|
|
|
|
|
|
Commercial and industrial |
|
|
(2,619 |
) |
|
|
(454 |
) |
|
|
(3,073 |
) |
|
Real estate and agriculture |
|
|
(679 |
) |
|
|
(44 |
) |
|
|
(723 |
) |
|
Consumer and other |
|
|
(3,891 |
) |
|
|
(170 |
) |
|
|
(4,061 |
) |
|
Recoveries: |
|
|
|
|
|
|
|
|
|
|
|
|
|
Commercial and industrial |
|
|
1,267 |
|
|
|
922 |
|
|
|
2,189 |
|
|
Real estate and agriculture |
|
|
1,412 |
|
|
|
18 |
|
|
|
1,430 |
|
|
Consumer and other |
|
|
889 |
|
|
|
78 |
|
|
|
967 |
|
|
Net charge-offs(1) |
|
|
(3,621 |
) |
|
|
350 |
|
|
|
(3,271 |
) |
|
Allowance for credit losses at end of period |
|
$ |
77,013 |
|
|
$ |
10,456 |
|
|
$ |
87,469 |
|
|
Ratio of allowance to end of period loans |
|
|
0.66 |
% |
|
|
0.15 |
% |
|
|
0.46 |
% |
|
Ratio of allowance to end of period loans, excluding Warehouse Purchase Program |
|
|
0.76 |
% |
|
|
0.15 |
% |
|
|
0.51 |
% |
|
Ratio of net charge-offs to average loans |
|
|
0.04 |
% |
|
|
0.02 |
% |
|
|
0.03 |
% |
|
Ratio of allowance to end of period nonperforming loans |
|
|
174.8 |
% |
|
|
89.9 |
% |
|
|
157.1 |
% |
|
(1) |
There was no net charge-off activity on Warehouse Purchase Program loans during the periods presented. |
|
|
|
As of and for the Year Ended December 31, 2018 |
|
|||||||||
|
|
|
Originated Loans |
|
|
Acquired Loans |
|
|
Total |
|
|||
|
|
|
(Dollars in thousands) |
|
|||||||||
|
Average loans outstanding |
|
$ |
8,857,557 |
|
|
$ |
1,284,068 |
|
|
$ |
10,141,625 |
|
|
Gross loans outstanding at end of period |
|
$ |
9,237,258 |
|
|
$ |
1,133,055 |
|
|
$ |
10,370,313 |
|
|
Allowance for credit losses at beginning of period |
|
$ |
73,407 |
|
|
$ |
10,634 |
|
|
$ |
84,041 |
|
|
Provision for credit losses |
|
|
17,942 |
|
|
|
(1,592 |
) |
|
|
16,350 |
|
|
Charge-offs: |
|
|
|
|
|
|
|
|
|
|
|
|
|
Commercial and industrial |
|
|
(9,912 |
) |
|
|
(1,384 |
) |
|
|
(11,296 |
) |
|
Real estate and agriculture |
|
|
(1,852 |
) |
|
|
(439 |
) |
|
|
(2,291 |
) |
|
Consumer and other |
|
|
(4,122 |
) |
|
|
(64 |
) |
|
|
(4,186 |
) |
|
Recoveries: |
|
|
|
|
|
|
|
|
|
|
|
|
|
Commercial and industrial |
|
|
1,967 |
|
|
|
294 |
|
|
|
2,261 |
|
|
Real estate and agriculture |
|
|
384 |
|
|
|
26 |
|
|
|
410 |
|
|
Consumer and other |
|
|
1,142 |
|
|
|
9 |
|
|
|
1,151 |
|
|
Net charge-offs |
|
|
(12,393 |
) |
|
|
(1,558 |
) |
|
|
(13,951 |
) |
|
Allowance for credit losses at end of period |
|
$ |
78,956 |
|
|
$ |
7,484 |
|
|
$ |
86,440 |
|
|
Ratio of allowance to end of period loans |
|
|
0.85 |
% |
|
|
0.66 |
% |
|
|
0.83 |
% |
|
Ratio of net charge-offs to average loans |
|
|
0.14 |
% |
|
|
0.12 |
% |
|
|
0.14 |
% |
|
Ratio of allowance to end of period nonperforming loans |
|
|
609.2 |
% |
|
|
178.6 |
% |
|
|
504.0 |
% |
The Company had gross charge-offs on originated loans of $7.2 million during the year ended December 31, 2019 compared with $15.9 million during the year ended December 31, 2018. Partially offsetting these charge-offs were recoveries on originated loans of $3.6 million for the year ended December 31, 2019 compared with $3.5 million for the year ended December 31, 2018. Total
48
charge-offs for the year ended December 31, 2019 were $7.9 million, partially offset by total recoveries of $4.6 million. Total charge-offs for the year ended December 31, 2018 were $17.8 million, partially offset by total recoveries of $3.8 million.
The following tables show the allocation of the allowance for credit losses among various categories of loans disaggregated between originated loans, re-underwritten acquired loans, Non-PCI loans and PCI loans at the dates indicated. The allocation is made for analytical purposes and is not necessarily indicative of the categories in which future losses may occur. The total allowance is available to absorb losses from any loan category, regardless of whether allocated to an originated loan or an acquired loan.
|
|
|
December 31, 2019 |
|
|||||||||||||||||||||
|
|
|
|
|
|
|
Acquired Loans |
|
|
|
|
|
|
|
|
|
|||||||||
|
|
|
Originated Loans |
|
|
Re-Underwritten Acquired Loans |
|
|
Non-PCI Loans |
|
|
PCI Loans |
|
|
Total Allowance |
|
|
Percent of Loans to Total Loans(1) |
|
||||||
|
|
|
(Dollars in thousands) |
|
|||||||||||||||||||||
|
Balance of allowance for credit losses applicable to: |
|
|
|
|
|
|
|
|
|
|
|
|
|
|
|
|
|
|
|
|
|
|
|
|
|
Commercial and industrial |
|
$ |
32,723 |
|
|
$ |
7,722 |
|
|
$ |
— |
|
|
$ |
— |
|
|
$ |
40,445 |
|
|
|
18.5 |
% |
|
Real estate |
|
|
40,241 |
|
|
|
2,022 |
|
|
|
— |
|
|
|
— |
|
|
|
42,263 |
|
|
|
75.2 |
% |
|
Agriculture and agriculture real estate |
|
|
2,292 |
|
|
|
679 |
|
|
|
— |
|
|
|
— |
|
|
|
2,971 |
|
|
|
4.0 |
% |
|
Consumer and other |
|
|
1,757 |
|
|
|
33 |
|
|
|
— |
|
|
|
— |
|
|
|
1,790 |
|
|
|
2.3 |
% |
|
Total allowance for credit losses |
|
$ |
77,013 |
|
|
$ |
10,456 |
|
|
$ |
— |
|
|
$ |
— |
|
|
$ |
87,469 |
|
|
|
100.0 |
% |
|
|
(1) |
Loans outstanding as a percentage of total loans, excluding Warehouse Purchase Program loans. |
|
|
|
December 31, 2018 |
|
|||||||||||||||||||||
|
|
|
|
|
|
|
Acquired Loans |
|
|
|
|
|
|
|
|
|
|||||||||
|
|
|
Originated Loans |
|
|
Re-Underwritten Acquired Loans |
|
|
Non-PCI Loans |
|
|
PCI Loans |
|
|
Total Allowance |
|
|
Percent of Loans to Total Loans |
|
||||||
|
|
|
(Dollars in thousands) |
|
|||||||||||||||||||||
|
Balance of allowance for credit losses applicable to: |
|
|
|
|
|
|
|
|
|
|
|
|
|
|
|
|
|
|
|
|
|
|
|
|
|
Commercial and industrial |
|
$ |
35,088 |
|
|
$ |
5,135 |
|
|
$ |
— |
|
|
$ |
— |
|
|
$ |
40,223 |
|
|
|
14.3 |
% |
|
Real estate |
|
|
39,475 |
|
|
|
1,453 |
|
|
|
9 |
|
|
|
— |
|
|
|
40,937 |
|
|
|
75.9 |
% |
|
Agriculture and agriculture real estate |
|
|
2,828 |
|
|
|
865 |
|
|
|
— |
|
|
|
— |
|
|
|
3,693 |
|
|
|
7.0 |
% |
|
Consumer and other |
|
|
1,565 |
|
|
|
22 |
|
|
|
— |
|
|
|
— |
|
|
|
1,587 |
|
|
|
2.8 |
% |
|
Total allowance for credit losses |
|
$ |
78,956 |
|
|
$ |
7,475 |
|
|
$ |
9 |
|
|
$ |
— |
|
|
$ |
86,440 |
|
|
|
100.0 |
% |
At December 31, 2019, the allowance for credit losses totaled $87.5 million or 0.46% of total loans. At December 31, 2018, the allowance for credit losses totaled $86.4 million or 0.83% of total loans, and at December 31, 2017, the allowance totaled $84.0 million or 0.84% of total loans.
At December 31, 2019, $77.0 million of the allowance was attributable to originated loans compared with $79.0 million of the allowance at December 31, 2018, a decrease of $1.9 million or 2.5%. The decrease in the allowance attributable to originated loans was primarily due to the increase in the allowance attributable to re-underwritten acquired loans.
At December 31, 2019, $10.5 million of the allowance was attributable to re-underwritten acquired loans compared with $7.5 million of the allowance at December 31, 2018, an increase of $3.0 million or 39.9%. This change was primarily due to the Merger.
At December 31, 2019, none of the allowance was attributable to Non-PCI loans compared with $9 thousand of the allowance at December 31, 2018, a decrease of $9 thousand or 100.0%. This change was primarily attributable to a decrease in specific reserves identified for loans with deteriorated credit quality.
At December 31, 2019 and 2018, there was no allowance for credit losses attributable to PCI loans.
At December 31, 2019, the Company had $277.5 million of total outstanding discounts on Non-PCI and PCI loans, of which $145.8 million was accretable. At December 31, 2018, the Company had $17.7 million of total outstanding discounts on Non-PCI and PCI loans, of which $16.4 million was accretable.
49
The Company believes that the allowance for credit losses at December 31, 2019 is adequate to cover estimated losses in the loan portfolio as of such date. Nevertheless, the Company could sustain losses in future periods that could be substantial in relation to the size of the allowance at December 31, 2019.
Securities
The Company uses its securities portfolio to manage interest rate risk and as a source of income and liquidity for cash requirements. At December 31, 2019, the carrying amount of investment securities totaled $8.57 billion, a decrease of $838.9 million or 8.9% compared with $9.41 billion at December 31, 2018. At December 31, 2019, securities represented 26.6% of total assets compared with 41.5% of total assets at December 31, 2018.
At the date of purchase, the Company is required to classify debt and equity securities into one of three categories: held to maturity, trading or available for sale. At each reporting date, the appropriateness of the classification is reassessed. Investments in debt securities are classified as held to maturity and measured at amortized cost in the financial statements only if management has the positive intent and ability to hold those securities to maturity. Securities that are bought and held principally for the purpose of selling them in the near term are classified as trading and measured at fair value in the financial statements with unrealized gains and losses included in earnings. Investments not classified as either held to maturity or trading are classified as available for sale and measured at fair value in the financial statements with unrealized gains and losses reported, net of tax, in a separate component of shareholders’ equity until realized.
The following table summarizes the carrying value by classification of securities as of the dates shown:
|
|
|
December 31, |
|
|||||||||||||||||||||
|
|
|
2019 |
|
|
2018 |
|
|
2017 |
|
|||||||||||||||
|
|
|
Amortized Cost |
|
|
Fair Value |
|
|
Amortized Cost |
|
|
Fair Value |
|
|
Amortized Cost |
|
|
Fair Value |
|
||||||
|
|
|
(Dollars in thousands) |
|
|||||||||||||||||||||
|
Available for Sale |
|
|
|
|
|
|
|
|
|
|
|
|
|
|
|
|
|
|
|
|
|
|
|
|
|
States and political subdivisions |
|
$ |
470 |
|
|
$ |
471 |
|
|
$ |
1,159 |
|
|
$ |
1,166 |
|
|
$ |
1,817 |
|
|
$ |
1,820 |
|
|
Collateralized mortgage obligations |
|
|
235,222 |
|
|
|
235,773 |
|
|
|
12,724 |
|
|
|
12,756 |
|
|
|
99,996 |
|
|
|
100,061 |
|
|
Mortgage-backed securities |
|
|
51,209 |
|
|
|
51,419 |
|
|
|
69,880 |
|
|
|
70,233 |
|
|
|
103,612 |
|
|
|
103,489 |
|
|
Other securities |
|
|
— |
|
|
|
— |
|
|
|
— |
|
|
|
— |
|
|
|
12,588 |
|
|
|
12,500 |
|
|
Total |
|
$ |
286,901 |
|
|
$ |
287,663 |
|
|
$ |
83,763 |
|
|
$ |
84,155 |
|
|
$ |
218,013 |
|
|
$ |
217,870 |
|
|
Held to Maturity |
|
|
|
|
|
|
|
|
|
|
|
|
|
|
|
|
|
|
|
|
|
|
|
|
|
U.S. Treasury securities and obligations of U.S. Government agencies |
|
$ |
13,933 |
|
|
$ |
13,991 |
|
|
$ |
25,778 |
|
|
$ |
25,678 |
|
|
$ |
32,235 |
|
|
$ |
32,380 |
|
|
States and political subdivisions |
|
|
238,347 |
|
|
|
245,790 |
|
|
|
253,198 |
|
|
|
255,861 |
|
|
|
328,666 |
|
|
|
332,122 |
|
|
Collateralized mortgage obligations |
|
|
203,470 |
|
|
|
204,212 |
|
|
|
509 |
|
|
|
508 |
|
|
|
653 |
|
|
|
650 |
|
|
Mortgage-backed securities |
|
|
7,826,643 |
|
|
|
7,839,858 |
|
|
|
9,045,326 |
|
|
|
8,799,189 |
|
|
|
9,092,692 |
|
|
|
8,958,330 |
|
|
Total |
|
$ |
8,282,393 |
|
|
$ |
8,303,851 |
|
|
$ |
9,324,811 |
|
|
$ |
9,081,236 |
|
|
$ |
9,454,246 |
|
|
$ |
9,323,482 |
|
Certain investment securities are valued at less than their historical cost. Management evaluates securities for other-than-temporary impairment (“OTTI”) at least on a quarterly basis, and more frequently when economic or market conditions warrant such an evaluation.
In determining OTTI, management considers many factors, including: (1) the length of time and the extent to which the fair value has been less than cost, (2) the financial condition and near-term prospects of the issuer, (3) whether the market decline was affected by macroeconomic conditions and (4) whether the entity has the intent to sell the debt security or more likely than not will be required to sell the debt security before its anticipated recovery. The assessment of whether an other-than-temporary decline exists involves a high degree of subjectivity and judgment and is based on the information available to management at the time of such determination.
Management has the ability and intent to hold the securities classified as held-to-maturity until they mature, at which time the Company will receive full value for the securities. Furthermore, as of December 31, 2019, management does not have the intent to sell any of the securities classified as available for sale before a recovery of cost. In addition, management believes it is more likely than not that the Company will not have to sell any of its investment securities before a recovery of cost. As of December 31, 2019, management believes any impairment in the Company’s securities is temporary and no impairment loss has been realized in the
50
Company’s consolidated statement of income. The Company recorded no other-than-temporary impairment charges in 2019, 2018 or 2017.
The following table summarizes the contractual maturity of securities and their weighted average yields as of December 31, 2019. The contractual maturity of a mortgage-backed security is the date at which the last underlying mortgage matures. The weighted average life of the Company’s securities portfolio is 3.42 years, with a modified duration of 3.16 at December 31, 2019. Available for sale securities are shown at fair value and held to maturity securities are shown at amortized cost. For purposes of the table below, tax-exempt states and political subdivisions are calculated on a tax equivalent basis.
|
|
|
December 31, 2019 |
|
|||||||||||||||||||||||||||||||||||||
|
|
|
Within One Year |
|
|
After One Year but Within Five Years |
|
|
After Five Years but Within Ten Years |
|
|
After Ten Years |
|
|
Total |
|
|||||||||||||||||||||||||
|
|
|
Amount |
|
|
Yield |
|
|
Amount |
|
|
Yield |
|
|
Amount |
|
|
Yield |
|
|
Amount |
|
|
Yield |
|
|
Total |
|
|
Yield |
|
||||||||||
|
|
|
(Dollars in thousands) |
|
|||||||||||||||||||||||||||||||||||||
|
U.S. Treasury securities and obligations of U.S. government agencies |
|
$ |
13,933 |
|
|
|
2.44 |
% |
|
$ |
— |
|
|
|
— |
|
|
$ |
— |
|
|
|
— |
|
|
$ |
— |
|
|
|
— |
|
|
$ |
13,933 |
|
|
|
2.44 |
% |
|
States and political subdivisions |
|
|
28,369 |
|
|
|
3.32 |
% |
|
|
129,910 |
|
|
|
3.67 |
% |
|
|
74,802 |
|
|
|
3.26 |
% |
|
|
5,737 |
|
|
|
3.78 |
% |
|
|
238,818 |
|
|
|
3.50 |
% |
|
Collateralized mortgage obligations |
|
|
260 |
|
|
|
4.50 |
% |
|
|
237 |
|
|
|
0.98 |
% |
|
|
65,680 |
|
|
|
2.24 |
% |
|
|
373,068 |
|
|
|
2.28 |
% |
|
|
439,245 |
|
|
|
2.28 |
% |
|
Mortgage-backed securities |
|
|
14,421 |
|
|
|
4.25 |
% |
|
|
274,343 |
|
|
|
2.38 |
% |
|
|
2,875,739 |
|
|
|
2.17 |
% |
|
|
4,713,558 |
|
|
|
2.39 |
% |
|
|
7,878,061 |
|
|
|
2.31 |
% |
|
Total |
|
$ |
56,983 |
|
|
|
2.89 |
% |
|
$ |
404,490 |
|
|
|
2.80 |
% |
|
$ |
3,016,221 |
|
|
|
2.20 |
% |
|
$ |
5,092,363 |
|
|
|
2.38 |
% |
|
$ |
8,570,057 |
|
|
|
2.34 |
% |
The contractual maturity of mortgage-backed securities and collateralized mortgage obligations is not a reliable indicator of their expected life because borrowers have the right to prepay their obligations at any time. Mortgage-backed securities monthly pay downs cause the average lives of the securities to be much different than their stated lives. During a period of increasing interest rates, fixed rate mortgage-backed securities do not tend to experience heavy prepayments of principal, and consequently, the average life of this security will be lengthened. If interest rates begin to fall, prepayments may increase, thereby shortening the estimated life of this security.
At December 31, 2019 and 2018, the Company did not own securities of any one issuer (other than the U.S. government and its agencies) for which aggregate adjusted cost exceeded 10% of the consolidated shareholders’ equity at such respective dates.
The average tax equivalent yield of the securities portfolio was 2.34% as of December 31, 2019 compared with 2.40% and 2.24% as of December 31, 2018 and 2017, respectively. This decrease was primarily due to the investment in lower yielding securities. Additionally, the average tax equivalent yield was negatively impacted by a lower tax rate in 2018. The average tax equivalent yield on the securities portfolio was based on a 21% tax rate in 2019 and 2018 and a 35% tax rate in 2017.
The average yield excluding the tax equivalent adjustment was 2.34% for the year ended December 31, 2019 compared with 2.30% for the year ended December 31, 2018 and 2.15% for the year ended December 31, 2017. The change in the average securities portfolio over the comparable periods was primarily due to maturities of securities during the year ended December 31, 2019.
Mortgage-backed securities are securities that have been developed by pooling a number of real estate mortgages and which are principally issued by federal agencies such as Government National Mortgage Association (“Ginnie Mae”), Fannie Mae and Freddie Mac. These securities are deemed to have high credit ratings, and minimum regular monthly cash flows of principal and interest are guaranteed by the issuing agencies.
Unlike U.S. Treasury and U.S. government agency securities, which have a lump sum payment at maturity, mortgage-backed securities provide cash flows from regular principal and interest payments and principal prepayments throughout the lives of the securities. Premiums and discounts on mortgage-backed securities are amortized over the expected life of the security and may be impacted by prepayments. As such, mortgage-backed securities which are purchased at a premium will generally suffer decreasing net yields as interest rates drop because home owners tend to refinance their mortgages resulting in prepayments and an acceleration of premium amortization. Securities purchased at a discount will obtain higher net yields in a decreasing interest rate environment as prepayments result in an acceleration of discount accretion. At December 31, 2019, 59.8% of the mortgage-backed securities held by the Company had contractual final maturities of more than ten years with a weighted average life of 3.81 years.
51
Collateralized mortgage obligations (“CMOs”) are bonds that are backed by pools of mortgages. The pools can be Ginnie Mae, Fannie Mae or Freddie Mac pools or they can be private-label pools. CMOs are designed so that the mortgage collateral will generate a cash flow sufficient to provide for the timely repayment of the bonds. So long as the collateral cash flow is adequate to meet scheduled bond payments, the mortgage collateral pool can be structured to accommodate various desired bond repayment schedules. This is accomplished by dividing the bonds into classes to which payments on the underlying mortgage pools are allocated in different order. The bond’s cash flow, for example, can be dedicated to one class of bondholders at a time, thereby increasing call protection to bondholders. In private-label CMOs, losses on underlying mortgages are directed to the most junior of all classes and then to the classes above in order of increasing seniority, which means that the senior classes have enough credit protection to be given the highest credit rating by the rating agencies.
Deposits
The Company’s lending and investing activities are primarily funded by deposits. The Company offers a variety of deposit accounts having a wide range of interest rates and terms including demand, savings, money market and time accounts. The Company relies primarily on competitive pricing policies and customer service to attract and retain these deposits.
Total deposits at December 31, 2019 were $24.20 billion, an increase of $6.94 billion or 40.2% compared with $17.26 billion at December 31, 2018. Total deposits at December 31, 2018 were $17.26 million, a decrease of $564.9 million or 3.2% compared with $17.82 billion at December 31, 2017. Noninterest-bearing deposits at December 31, 2019 were $7.76 billion compared with $5.67 billion at December 31, 2018, an increase of $2.10 billion or 37.0%. Noninterest-bearing deposits at December 31, 2018 were $5.67 billion compared with $5.62 billion at December 31, 2017, an increase of $42.8 million or 0.8%. Interest-bearing deposits at December 31, 2019 were $16.44 billion, an increase of $4.85 billion or 41.8% compared with $11.59 billion at December 31, 2018. Interest-bearing deposits at December 31, 2018 were $11.59 billion, a decrease of $607.7 million or 5.0% compared with $12.20 billion at December 31, 2017. The increases in 2019 were primarily related to the Merger.
The daily average balances and weighted average rates paid on deposits for each of the years ended December 31, 2019, 2018 and 2017 are presented below:
|
|
|
Years Ended December 31, |
|
|||||||||||||||||||||
|
|
|
2019 |
|
|
2018 |
|
|
2017 |
|
|||||||||||||||
|
|
|
Average Balance |
|
|
Average Rate |
|
|
Average Balance |
|
|
Average Rate |
|
|
Average Balance |
|
|
Average Rate |
|
||||||
|
|
|
(Dollars in thousands) |
|
|||||||||||||||||||||
|
Interest-bearing checking |
|
$ |
3,917,413 |
|
|
|
0.61 |
% |
|
$ |
3,937,479 |
|
|
|
0.51 |
% |
|
$ |
3,816,996 |
|
|
|
0.31 |
% |
|
Regular savings |
|
|
2,269,507 |
|
|
|
0.44 |
|
|
|
2,298,270 |
|
|
|
0.38 |
|
|
|
2,224,936 |
|
|
|
0.29 |
|
|
Money market savings |
|
|
3,672,422 |
|
|
|
1.10 |
|
|
|
3,118,744 |
|
|
|
0.72 |
|
|
|
3,336,917 |
|
|
|
0.36 |
|
|
Time deposits |
|
|
2,314,174 |
|
|
|
1.59 |
|
|
|
2,101,287 |
|
|
|
0.97 |
|
|
|
2,289,296 |
|
|
|
0.69 |
|
|
Total interest-bearing deposits |
|
|
12,173,516 |
|
|
|
0.92 |
|
|
|
11,455,780 |
|
|
|
0.62 |
|
|
|
11,668,145 |
|
|
|
0.40 |
|
|
Noninterest-bearing deposits |
|
|
6,006,914 |
|
|
|
— |
|
|
|
5,650,720 |
|
|
|
— |
|
|
|
5,347,227 |
|
|
|
— |
|
|
Total deposits |
|
$ |
18,180,430 |
|
|
|
0.61 |
% |
|
$ |
17,106,500 |
|
|
|
0.42 |
% |
|
$ |
17,015,372 |
|
|
|
0.27 |
% |
The Company’s ratio of average noninterest-bearing deposits to average total deposits for the years ended December 31, 2019, 2018 and 2017 was 33.0%, 33.0% and 31.4%, respectively.
The following table sets forth the amount of the Company’s certificates of deposit that are $100,000 or greater by time remaining until maturity at December 31, 2019 (dollars in thousands):
|
Three months or less |
|
$ |
519,585 |
|
|
|
21.2 |
% |
|
Over three through six months |
|
|
514,535 |
|
|
|
21.0 |
|
|
Over six through 12 months |
|
|
873,375 |
|
|
|
35.6 |
|
|
Over 12 months |
|
|
546,393 |
|
|
|
22.2 |
|
|
Total |
|
$ |
2,453,888 |
|
|
|
100.0 |
% |
52
Other Borrowings
The Company utilizes borrowings to supplement deposits to fund its lending and investment activities. Borrowings consist of funds from the Federal Home Loan Bank (“FHLB”), securities sold under repurchase agreements and subordinated notes.
The following table presents the Company’s borrowings at December 31, 2019 and 2018:
|
|
|
FHLB Advances |
|
|
FHLB Long-Term Notes Payable |
|
|
Securities Sold Under Repurchase Agreements |
|
|
Subordinated Notes |
|
||||
|
|
|
(Dollars in thousands) |
|
|||||||||||||
|
December 31, 2019 |
|
|
|
|
|
|
|
|
|
|
|
|
|
|
|
|
|
Amount outstanding at year-end |
|
$ |
1,300,000 |
|
|
$ |
3,730 |
|
|
$ |
377,294 |
|
|
$ |
125,804 |
|
|
Weighted average interest rate at year-end |
|
|
1.49 |
% |
|
|
5.37 |
% |
|
|
0.70 |
% |
|
|
5.50 |
% |
|
Maximum month-end balance during the year |
|
$ |
1,900,000 |
|
|
$ |
3,837 |
|
|
$ |
385,222 |
|
|
$ |
125,804 |
|
|
Average balance outstanding during the year |
|
$ |
969,836 |
|
|
$ |
1,573 |
|
|
$ |
307,277 |
|
|
$ |
21,991 |
|
|
Weighted average interest rate during the year |
|
|
2.18 |
% |
|
|
1.49 |
% |
|
|
1.10 |
% |
|
|
4.89 |
% |
|
December 31, 2018 |
|
|
|
|
|
|
|
|
|
|
|
|
|
|
|
|
|
Amount outstanding at year-end |
|
$ |
1,030,000 |
|
|
$ |
1,126 |
|
|
$ |
284,720 |
|
|
$ |
— |
|
|
Weighted average interest rate at year-end |
|
|
2.65 |
% |
|
|
4.77 |
% |
|
|
0.93 |
% |
|
|
— |
|
|
Maximum month-end balance during the year |
|
$ |
1,500,000 |
|
|
$ |
5,176 |
|
|
$ |
339,576 |
|
|
$ |
— |
|
|
Average balance outstanding during the year |
|
$ |
1,186,191 |
|
|
$ |
3,268 |
|
|
$ |
300,429 |
|
|
$ |
— |
|
|
Weighted average interest rate during the year |
|
|
2.03 |
% |
|
|
5.60 |
% |
|
|
0.66 |
% |
|
|
— |
|
FHLB advances and long-term notes payable—The Company has an available line of credit with the FHLB of Dallas, which allows the Company to borrow on a collateralized basis. The Company’s FHLB advances are typically considered short-term borrowings and are used to manage liquidity as needed. Maturing advances are replaced by drawing on available cash, making additional borrowings or through increased customer deposits. At December 31, 2019, the Company had total funds of $6.72 billion available under this line. FHLB advances were $1.30 billion at December 31, 2019, with a weighted average interest rate of 1.49%. Long-term notes payable were $3.7 million at December 31, 2019, with a weighted average interest rate of 5.37%. The maturity dates on the FHLB notes payable range from the years 2019 to 2027 and have interest rates ranging from 4.54% to 5.99%.
Securities sold under repurchase agreements with Company customers—At December 31, 2019, the Company had $377.3 million in securities sold under repurchase agreements compared with $284.7 million at December 31, 2018, with weighted average rates paid of 1.10% and 0.93% for the years ended December 31, 2019 and 2018, respectively. Repurchase agreements are generally settled on the following business day; however, approximately $5.4 million of repurchase agreements outstanding at December 31, 2019 have maturity dates ranging from 6 to 24 months. All securities sold under repurchase agreements are collateralized by certain pledged securities.
Subordinated notes—On November 1, 2019, in connection with the Merger, the Company assumed the obligations related to a $75.0 million and a $50.0 million of Fixed-to-Floating Rate Subordinated Note (collectively, the “Notes”) that mature on December 1, 2025 (the “Maturity Date”). The Notes, which qualify as Tier 2 capital for regulatory purposes, have an interest rate of 5.50% per annum, payable semi-annually on each December 1 and June 1 through December 1, 2020. From and including December 1, 2020 through maturity or earlier redemption, the interest rate will reset quarterly to an interest rate per annum equal to the then current three-month LIBOR rate plus 3.89%, payable on March 1, June 1, September 1, and December 1 of each year through the maturity date or earlier redemption. The Company may, at its option, beginning on December 1, 2020 and on any scheduled interest payment date thereafter, redeem the Notes, in whole or in part, at a redemption price equal to 100% of the principal amount of the Notes to be redeemed plus accrued and unpaid interest to, but excluding, the date of redemption. Any partial redemption will be made pro rata among all of the holders. The Notes are subordinated in right of payment to all of the Company’s senior indebtedness and effectively subordinated to all existing and future debt and all other liabilities of the Company’s subsidiaries.
Junior Subordinated Debentures On November 1, 2019, in connection with the Merger, the Company assumed $15.0 million in junior subordinated debentures, which were redeemed in December 2019. Accordingly, as of December 31, 2019, 2018 and 2017, the Company had no junior subordinated debentures outstanding.
53
Interest Rate Sensitivity and Market Risk
The Company’s asset liability and funds management policy provides management with the guidelines for effective funds management, and the Company has established a measurement system for monitoring its net interest rate sensitivity position. The Company manages its sensitivity position within established guidelines.
As a financial institution, the Company’s primary component of market risk is interest rate volatility. Fluctuations in interest rates ultimately will impact both (1) the level of income and expense recorded on most of the Company’s assets and liabilities and (2) the market value of all interest-earning assets and interest-bearing liabilities, other than those which have a short term to maturity. Interest rate risk is the potential of economic losses due to future interest rate changes. These economic losses can be reflected as a loss of future net interest income, a loss of current fair market values, or both. The objective is to measure the effect on net interest income and to adjust the balance sheet to minimize the inherent risk while maximizing income.
The Company primarily manages its exposure to interest rates by structuring its balance sheet in the ordinary course of business. The Company does not employ material amounts of instruments such as leveraged derivatives, interest rate swaps, financial options, financial future contracts or forward delivery contracts for the purpose of reducing interest rate risk. Based upon the nature of the Company’s operations, with the exception of how commodity prices may impact the Company’s borrowers’ ability to repay loans, the Company is not subject to foreign exchange or commodity price risk. The Company is not involved in trading assets for its own account.
The Company’s exposure to interest rate risk is managed by the Asset Liability Committee (“ALCO”), which consists of senior officers of the Company, in accordance with policies approved by the Company’s Board of Directors. The ALCO formulates strategies based on appropriate levels of interest rate risk. In determining the appropriate level of interest rate risk, the ALCO considers the impact on earnings and capital of the current outlook on interest rates, potential changes in interest rates, regional economies, liquidity, business strategies and other factors. The ALCO meets regularly to review, among other things, the sensitivity of assets and liabilities to interest rate changes, the book and market values of assets and liabilities, unrealized gains and losses, purchase and sale activities, commitments to originate loans and the maturities of investments and borrowings. Additionally, the ALCO reviews liquidity, cash flow flexibility, maturities of deposits and consumer and commercial deposit activity. Management uses two methodologies to manage interest rate risk: (1) an analysis of relationships between interest-earning assets and interest-bearing liabilities; and (2) an interest rate shock simulation model. The Company has traditionally managed its business to reduce its overall exposure to changes in interest rates.
The Company uses an interest rate risk simulation model and shock analysis to test the interest rate sensitivity of net interest income and the balance sheet. Contractual maturities and repricing opportunities of loans are incorporated in the model as are prepayment assumptions, maturity data and call options within the investment portfolio. Assumptions based on past experience are incorporated into the model for nonmaturity deposit accounts. The assumptions used are inherently uncertain, and, as a result, the model cannot precisely measure future net interest income or precisely predict the impact of fluctuations in market interest rates on net interest income. Actual results will differ from the model’s simulated results due to timing, magnitude and frequency of interest rate changes as well as changes in market conditions and the application and timing of various management strategies.
The Company utilizes static balance sheet rate shocks to estimate the potential impact on net interest income of changes in interest rates under various rate scenarios. This analysis estimates a percentage of change in the metric from the stable rate base scenario versus alternative scenarios of rising and falling market interest rates by instantaneously shocking a static balance sheet.
The following table summarizes the simulated change in net interest income at the 12-month horizon, considering the balance sheet composition as of December 31, 2019:
|
Change in Interest |
|
Percent Change in |
|
|
Rates (Basis Points) |
|
Net Interest Income |
|
|
+200 |
|
7.3% |
|
|
+100 |
|
4.2% |
|
|
Base |
|
0.0% |
|
|
-100 |
|
(2.8)% |
|
The results are significantly influenced by the behavior of demand, money market and savings deposits and the overall balance sheet composition during such rate fluctuations. The Company has found that, historically, interest rates on these deposits change more slowly than changes in the discount and federal funds rates. This assumption is incorporated into the simulation model and is generally not fully reflected in a gap analysis. The assumptions incorporated into the model are inherently uncertain and, as a result, the model cannot precisely measure future net interest income or precisely predict the impact of fluctuations in market interest rates on
54
net interest income. Actual results will differ from the model’s simulated results due to timing, magnitude and frequency of interest rate changes as well as changes in market conditions and the application and timing of various strategies.
Liquidity
Liquidity involves the Company’s ability to raise funds to support asset growth and acquisitions or reduce assets to meet deposit withdrawals and other payment obligations, to maintain reserve requirements and otherwise to operate the Company on an ongoing basis and manage unexpected events. During 2019 and 2018, the Company’s liquidity needs have primarily been met by growth in core deposits, security and loan maturities, amortizing investment and loan portfolios and advances from the FHLB of Dallas. Although access to purchased funds from correspondent banks is available and has been utilized on occasion to take advantage of investment opportunities, the Company does not generally rely on this external funding source.
The following table illustrates, during the years presented, the mix of the Company’s funding sources and the average assets in which those funds are invested as a percentage of the Company’s average total assets for the periods indicated. Average assets totaled $24.09 billion for 2019 compared with $22.63 billion for 2018.
|
|
|
2019 |
|
|
2018 |
|
||
|
Source of Funds: |
|
|
|
|
|
|
|
|
|
Deposits: |
|
|
|
|
|
|
|
|
|
Noninterest-bearing |
|
|
24.94 |
% |
|
|
24.97 |
% |
|
Interest-bearing |
|
|
50.54 |
|
|
|
50.62 |
|
|
Securities sold under repurchase agreements |
|
|
1.28 |
|
|
|
1.33 |
|
|
Other borrowings |
|
|
4.03 |
|
|
|
5.25 |
|
|
Subordinated notes |
|
|
0.09 |
|
|
|
— |
|
|
Other noninterest-bearing liabilities |
|
|
0.61 |
|
|
|
0.39 |
|
|
Shareholders’ equity |
|
|
18.51 |
|
|
|
17.44 |
|
|
Total |
|
|
100.00 |
% |
|
|
100.00 |
% |
|
Uses of Funds: |
|
|
|
|
|
|
|
|
|
Loans |
|
|
49.70 |
% |
|
|
44.81 |
% |
|
Securities |
|
|
37.19 |
|
|
|
42.70 |
|
|
Federal funds sold and other interest-earning assets |
|
|
0.54 |
|
|
|
0.36 |
|
|
Other noninterest-earning assets |
|
|
12.57 |
|
|
|
12.13 |
|
|
Total |
|
|
100.00 |
% |
|
|
100.00 |
% |
|
Average noninterest-bearing deposits to average deposits |
|
|
33.04 |
% |
|
|
33.03 |
% |
|
Average loans to average deposits |
|
|
65.85 |
% |
|
|
59.29 |
% |
The Company’s largest source of funds is deposits and its largest uses of funds are securities and loans. The Company does not expect a change in the source or use of its funds in the foreseeable future. The Company’s average deposits increased 6.3% for the year ended December 31, 2019 compared with the year ended December 31, 2018. The Company’s average loans increased 18.0% for the year ended December 31, 2019 compared with the year ended December 31, 2018. The Company predominantly invests excess deposits in government-backed securities until the funds are needed to fund loan growth. The Company’s securities portfolio has a weighted average life of 3.42 years and a modified duration of 3.16 at December 31, 2019.
As of December 31, 2019, the Company had outstanding $4.38 billion in commitments to extend credit, $127.9 million in commitments associated with outstanding standby letters of credit and $657.2 million in commitments associated with unused capacity on Warehouse Purchase Program loans. Since commitments associated with letters of credit and commitments to extend credit may expire unused, the total outstanding may not necessarily reflect the actual future cash funding requirements.
As of December 31, 2019, the Company had no exposure to future cash requirements associated with known uncertainties or capital expenditures of a material nature.
As of December 31, 2019, the Company had cash and cash equivalents of $574.1 million compared with $411.1 million at December 31, 2018.
55
Share Repurchases
In January 2018, the Company’s Board of Directors authorized a stock repurchase program under which the Company could repurchase up to 5%, or approximately 3.47 million shares, of its outstanding common stock over a two-year period, which expired on January 16, 2020. No repurchases were made during the fourth quarter of 2019. The Company repurchased 1.473 million shares of its common stock at an average weighted price of $64.10 per share during the year ended December 31, 2019. On January 29, 2020, the Company announced a stock repurchase program that authorized the repurchase of up to 5%, or approximately 4.74 million shares, of the Company’s outstanding common stock over a one-year period expiring on January 28, 2021,at the discretion of management. Under the stock repurchase program, the Company could repurchase shares from time to time at prevailing market prices, through open-market purchases or privately negotiated transactions, depending upon market conditions.
Contractual Obligations
The following table summarizes the Company’s contractual obligations and other commitments to make future payments as of December 31, 2019 (other than deposit obligations and securities sold under repurchase agreements). The Company’s future cash payments associated with its contractual obligations pursuant to its subordinated notes and FHLB advances and notes payable as of December 31, 2019 are summarized below. The future interest payments were calculated using the current rate in effect at December 31, 2019. Payments for subordinated notes payable include interest of $42.5 million that will be due over the future periods. Payments for FHLB notes payable include interest of $106 thousand that will be due over the future periods.
|
|
|
1 year or less |
|
|
More than 1 year but less than 3 years |
|
|
3 years or more but less than 5 years |
|
|
5 years or more |
|
|
Total |
|
|||||
|
|
|
(Dollars in thousands) |
|
|||||||||||||||||
|
Subordinated notes |
|
$ |
6,875 |
|
|
$ |
13,750 |
|
|
$ |
13,750 |
|
|
$ |
133,193 |
|
|
$ |
167,568 |
|
|
Federal Home Loan Bank advances and notes payable |
|
|
1,301,569 |
|
|
|
1,642 |
|
|
|
596 |
|
|
|
29 |
|
|
|
1,303,836 |
|
|
Total |
|
$ |
1,308,444 |
|
|
$ |
15,392 |
|
|
$ |
14,346 |
|
|
$ |
133,222 |
|
|
$ |
1,471,404 |
|
Off-Balance Sheet Items
In the normal course of business, the Company enters into various transactions that, in accordance with GAAP, are not included in its consolidated balance sheets. The Company enters into these transactions to meet the financing needs of its customers. These transactions include commitments to extend credit and standby letters of credit, which involve, to varying degrees, elements of credit risk and interest rate risk in excess of the amounts recognized in the consolidated balance sheets.
The Company’s commitments associated with outstanding standby letters of credit, unused capacity on Warehouse Purchase Program loans and commitments to extend credit expiring by period as of December 31, 2019 are summarized below. Since commitments associated with letters of credit and commitments to extend credit may expire unused, the amounts shown do not necessarily reflect the actual future cash funding requirements.
|
|
|
1 year or less |
|
|
More than 1 year but less than 3 years |
|
|
3 years or more but less than 5 years |
|
|
5 years or more |
|
|
Total |
|
|||||
|
|
|
(Dollars in thousands) |
|
|||||||||||||||||
|
Standby letters of credit |
|
$ |
120,079 |
|
|
$ |
5,058 |
|
|
$ |
2,790 |
|
|
$ |
— |
|
|
$ |
127,927 |
|
|
Unused capacity on Warehouse Purchase Program loans |
|
|
657,238 |
|
|
|
— |
|
|
|
— |
|
|
|
— |
|
|
|
657,238 |
|
|
Commitments to extend credit |
|
|
1,984,382 |
|
|
|
961,339 |
|
|
|
248,203 |
|
|
|
1,186,766 |
|
|
|
4,380,690 |
|
|
Total |
|
$ |
2,761,699 |
|
|
$ |
966,397 |
|
|
$ |
250,993 |
|
|
$ |
1,186,766 |
|
|
$ |
5,165,855 |
|
Standby Letters of Credit. Standby letters of credit are written conditional commitments issued by the Company to guarantee the payment by or performance of a customer to a third party. If the customer does not perform in accordance with the terms of the agreement with the third party, the Company would be required to fund the commitment. The maximum potential amount of future payments the Company could be required to make is represented by the contractual amount of the commitment. If the commitment is funded, the Company would be entitled to seek recovery from the customer. The Company’s policies generally require that standby letter of credit arrangements contain security and debt covenants similar to those contained in loan agreements.
Unused Capacity on Warehouse Purchase Program Loans. For Warehouse Purchase Program loans, the Company has established a maximum purchase facility amount, but reserves the right, at any time, to refuse to buy any mortgage loans offered for sale by its mortgage banking company customers for any reason.
56
Commitments to Extend Credit. The Company enters into contractual commitments to extend credit, normally with fixed expiration dates or termination clauses, at specified rates and for specific purposes. Substantially all of the Company’s commitments to extend credit are contingent upon customers maintaining specific credit standards at the time of loan funding. The Company minimizes its exposure to loss under these commitments by subjecting them to credit approval and monitoring procedures. Management assesses the credit risk associated with certain commitments to extend credit in determining the level of the allowance for credit losses.
Capital Resources
Capital management consists of providing equity to support the Company’s current and future operations. The Company is subject to capital adequacy requirements imposed by the Federal Reserve Board, and the Bank is subject to capital adequacy requirements imposed by the FDIC. Both the Federal Reserve Board and the FDIC have adopted risk-based capital requirements for assessing bank holding company and bank capital adequacy. These standards define capital and establish minimum capital requirements in relation to assets and off-balance sheet exposure, adjusted for credit risk.
In July 2013, the Federal Reserve Board and the FDIC published the Basel III Capital Rules establishing a new comprehensive capital framework for U.S. banking organizations. The Basel III Capital Rules, among other things, (1) introduced a new capital measure called “Common Equity Tier 1” (“CET1”), (2) specified that Tier 1 capital consists of CET1 and “Additional Tier 1 capital” instruments meeting specified requirements, (3) defined CET1 narrowly by requiring that most deductions/ adjustments to regulatory capital measures be made to CET1 and not to the other components of capital and (4) expanded the scope of the deductions/ adjustments as compared to existing regulations.
The Basel III Capital Rules require a “capital conservation buffer,” composed entirely of CET1, in addition to the minimum risk-weighted asset capital ratios. The implementation of the capital conservation buffer began on January 1, 2016 at the 0.625% level and was phased in over a four-year period (increasing by that amount on each subsequent January 1, until it reached 2.5% on January 1, 2019).
Since being fully phased in on January 1, 2019, the Basel III Capital Rules require the Company to maintain an additional capital conservation buffer, composed entirely of CET1, of 2.5%, effectively resulting in minimum ratios of (1) CET1 to risk-weighted assets of 7.0%, (2) Tier 1 capital to risk-weighted assets of 8.5%, (3) total capital (that is, Tier 1 plus Tier 2) to risk-weighted assets of 10.5% and (4) Tier 1 capital to average quarterly assets as reported on consolidated financial statements ( known as the “leverage ratio”) of 4.0%. The Bank is subject to capital adequacy guidelines of the FDIC that are substantially similar to the Federal Reserve Board’s guidelines. Also pursuant to FDICIA, the FDIC has promulgated regulations setting the levels at which an insured institution such as the Bank would be considered “well-capitalized,” “adequately capitalized,” “undercapitalized,” “significantly undercapitalized” and “critically undercapitalized.” Under the FDIC’s regulations, the Bank is classified “well-capitalized” for purposes of prompt corrective action.
Banking institutions that fail to meet the effective minimum ratios once the capital conservation buffer is taken into account, as detailed above, will be subject to constraints on capital distributions, including dividends and share repurchases, and certain discretionary executive compensation. The severity of the constraints depends on the amount of the shortfall and the institution’s “eligible retained income” (that is, four-quarter trailing net income, net of distributions and tax effects not reflected in net income).
As of December 31, 2019, the Company’s ratio of CET1 to risk-weighted assets was 12.30%, Tier 1 capital to risk-weighted assets was 12.30%, total capital to risk-weighted assets was 12.70% and Tier 1 capital to average quarterly assets was 10.42%.
It is important to note that Warehouse Purchase Program loan volumes can increase significantly on the last day of the month, potentially leading to a significant difference between the ending and average balance of Warehouse Purchase Program loans for a given period. At December 31, 2019, Warehouse Purchase Program loans totaled $1.55 billion, compared to an average balance of $251.3 million. Because the capital ratios above are calculated using ending risk-weighted assets and Warehouse Purchase Program loans are risk-weighted at 100%, the end-of-period increase in these balances can significantly impact the Company’s reported capital ratios.
Total shareholders’ equity increased to $5.97 billion at December 31, 2019, compared with $4.05 billion at December 31, 2018, an increase of $1.92 billion or 47.3%. This increase was primarily the result of the $1.80 billion common stock issued in connection with the Merger and net income of $332.6 million, partially offset by dividends paid on common stock of $128.9 million and the common stock repurchases totaling $94.5 million.
57
The following table provides a comparison of the Company’s and the Bank’s leverage and risk-weighted capital ratios as of December 31, 2019 to the minimum and well-capitalized regulatory standards:
|
|
|
Minimum Required For Capital Adequacy Purposes |
|
|
|
Minimum Required Plus Capital Conservation Buffer for 2019 |
|
|
To Be Categorized As Well Capitalized Under Prompt Corrective Action Provisions |
|
|
Actual Ratio at December 31, 2019 |
|
||||
|
The Company |
|
|
|
|
|
|
|
|
|
|
|
|
|
|
|
|
|
|
CET1 capital ratio |
|
|
4.50 |
% |
|
|
|
7.000 |
% |
|
|
N/A |
|
|
|
12.30 |
% |
|
Tier 1 risk-based capital ratio |
|
|
6.00 |
% |
|
|
|
8.500 |
% |
|
|
N/A |
|
|
|
12.30 |
% |
|
Total risk-based capital ratio |
|
|
8.00 |
% |
|
|
|
10.500 |
% |
|
|
N/A |
|
|
|
12.70 |
% |
|
Leverage ratio |
|
|
4.00 |
% |
(1) |
|
|
4.000 |
% |
|
|
N/A |
|
|
|
10.42 |
% |
|
The Bank |
|
|
|
|
|
|
|
|
|
|
|
|
|
|
|
|
|
|
CET1 capital ratio |
|
|
4.50 |
% |
|
|
|
7.000 |
% |
|
|
6.50 |
% |
|
|
12.49 |
% |
|
Tier 1 risk-based capital ratio |
|
|
6.00 |
% |
|
|
|
8.500 |
% |
|
|
8.00 |
% |
|
|
12.49 |
% |
|
Total risk-based capital ratio |
|
|
8.00 |
% |
|
|
|
10.500 |
% |
|
|
10.00 |
% |
|
|
12.89 |
% |
|
Leverage ratio |
|
|
4.00 |
% |
(2) |
|
|
4.000 |
% |
|
|
5.00 |
% |
|
|
10.58 |
% |
|
(1) |
The Federal Reserve Board may require the Company to maintain a leverage ratio above the required minimum. |
|
(2) |
The FDIC may require the Bank to maintain a leverage ratio above the required minimum. |
58
|
ITEM 7A. |
QUANTITATIVE AND QUALITATIVE DISCLOSURES ABOUT MARKET RISK |
For information regarding the market risk of the Company’s financial instruments, see Item 7. Management’s Discussion and Analysis of Financial Condition and Results of Operation—Financial Condition—Interest Rate Sensitivity and Market Risk. The Company’s principal market risk exposure is to changes in interest rates.
|
ITEM 8. |
FINANCIAL STATEMENTS AND SUPPLEMENTARY DATA |
The financial statements, the report thereon, the notes thereto and supplementary data commence at page 67 of this Annual Report on Form 10-K.
The following table presents certain unaudited consolidated quarterly financial information concerning the Company’s results of operations for each of the two years indicated below. The information should be read in conjunction with the historical consolidated financial statements of the Company and the notes thereto appearing elsewhere in this Annual Report on Form 10-K.
CONSOLIDATED QUARTERLY FINANCIAL DATA OF THE COMPANY
|
|
|
Quarter Ended 2019 |
|
|||||||||||||
|
|
|
December 31 |
|
|
September 30 |
|
|
June 30 |
|
|
March 31 |
|
||||
|
|
|
(Dollars in thousands, except per share data) |
|
|||||||||||||
|
|
|
(unaudited) |
|
|||||||||||||
|
Interest income |
|
$ |
272,858 |
|
|
$ |
186,178 |
|
|
$ |
187,787 |
|
|
$ |
186,115 |
|
|
Interest expense |
|
|
40,828 |
|
|
|
32,188 |
|
|
|
32,949 |
|
|
|
31,204 |
|
|
Net interest income |
|
|
232,030 |
|
|
|
153,990 |
|
|
|
154,838 |
|
|
|
154,911 |
|
|
Provision for credit losses |
|
|
1,700 |
|
|
|
1,100 |
|
|
|
800 |
|
|
|
700 |
|
|
Net interest income after provision |
|
|
230,330 |
|
|
|
152,890 |
|
|
|
154,038 |
|
|
|
154,211 |
|
|
Noninterest income |
|
|
35,506 |
|
|
|
30,673 |
|
|
|
29,958 |
|
|
|
28,144 |
|
|
Noninterest expense |
|
|
156,451 |
|
|
|
80,699 |
|
|
|
80,821 |
|
|
|
78,571 |
|
|
Income before income taxes |
|
|
109,385 |
|
|
|
102,864 |
|
|
|
103,175 |
|
|
|
103,784 |
|
|
Provision for income taxes |
|
|
23,251 |
|
|
|
21,106 |
|
|
|
20,917 |
|
|
|
21,382 |
|
|
Net income |
|
$ |
86,134 |
|
|
$ |
81,758 |
|
|
$ |
82,258 |
|
|
$ |
82,402 |
|
|
Earnings per share(1): |
|
|
|
|
|
|
|
|
|
|
|
|
|
|
|
|
|
Basic |
|
$ |
1.01 |
|
|
$ |
1.19 |
|
|
$ |
1.18 |
|
|
$ |
1.18 |
|
|
Diluted |
|
$ |
1.01 |
|
|
$ |
1.19 |
|
|
$ |
1.18 |
|
|
$ |
1.18 |
|
|
|
|
Quarter Ended 2018 |
|
|||||||||||||
|
|
|
December 31 |
|
|
September 30 |
|
|
June 30 |
|
|
March 31 |
|
||||
|
|
|
(Dollars in thousands, except per share data) |
|
|||||||||||||
|
|
|
(unaudited) |
|
|||||||||||||
|
Interest income |
|
$ |
187,194 |
|
|
$ |
184,676 |
|
|
$ |
184,321 |
|
|
$ |
171,018 |
|
|
Interest expense |
|
|
29,946 |
|
|
|
27,357 |
|
|
|
22,518 |
|
|
|
17,795 |
|
|
Net interest income |
|
|
157,248 |
|
|
|
157,319 |
|
|
|
161,803 |
|
|
|
153,223 |
|
|
Provision for credit losses |
|
|
1,000 |
|
|
|
2,350 |
|
|
|
4,000 |
|
|
|
9,000 |
|
|
Net interest income after provision |
|
|
156,248 |
|
|
|
154,969 |
|
|
|
157,803 |
|
|
|
144,223 |
|
|
Noninterest income |
|
|
29,079 |
|
|
|
30,624 |
|
|
|
28,371 |
|
|
|
27,938 |
|
|
Noninterest expense |
|
|
80,804 |
|
|
|
81,760 |
|
|
|
83,602 |
|
|
|
80,054 |
|
|
Income before income taxes |
|
|
104,523 |
|
|
|
103,833 |
|
|
|
102,572 |
|
|
|
92,107 |
|
|
Provision for income taxes |
|
|
21,192 |
|
|
|
21,310 |
|
|
|
20,975 |
|
|
|
17,746 |
|
|
Net income |
|
$ |
83,331 |
|
|
$ |
82,523 |
|
|
$ |
81,597 |
|
|
$ |
74,361 |
|
|
Earnings per share(1): |
|
|
|
|
|
|
|
|
|
|
|
|
|
|
|
|
|
Basic |
|
$ |
1.19 |
|
|
$ |
1.18 |
|
|
$ |
1.17 |
|
|
$ |
1.07 |
|
|
Diluted |
|
$ |
1.19 |
|
|
$ |
1.18 |
|
|
$ |
1.17 |
|
|
$ |
1.07 |
|
|
(1) |
Earnings per share are computed independently for each of the quarters presented and therefore may not total earnings per share for the year. |
59
|
ITEM 9. |
CHANGES IN AND DISAGREEMENTS WITH ACCOUNTANTS ON ACCOUNTING AND FINANCIAL DISCLOSURE |
None.
|
ITEM 9A. |
CONTROLS AND PROCEDURES |
Evaluation of disclosure controls and procedures. As of the end of the period covered by this report, the Company carried out an evaluation, under the supervision and with the participation of its management, including its Chief Executive Officer and Chief Financial Officer, of the effectiveness of the design and operation of its disclosure controls and procedures. In designing and evaluating the disclosure controls and procedures, management recognizes that any controls and procedures, no matter how well designed and operated, can provide only reasonable assurance of achieving the desired control objectives, and management was required to apply judgment in evaluating its controls and procedures. Based on this evaluation, the Company’s Chief Executive Officer and Chief Financial Officer concluded that the Company’s disclosure controls and procedures (as defined in Rules 13a-15(e) and 15d-15(e) under the Exchange Act), were effective as of the end of the period covered by this report.
On November 1, 2019, the Company completed the merger with LegacyTexas Financial Group, Inc. (“LegacyTexas”). The Company is in the process of evaluating the existing controls and procedures of LegacyTexas and integrating LegacyTexas into the internal control over financial reporting. In accordance with SEC Staff guidance permitting a company to exclude an acquired business from management’s assessment of the effectiveness of internal control over financial reporting for the year in which the acquisition is completed, the Company has excluded LegacyTexas from the assessment of the effectiveness of internal control over financial reporting as of December 31, 2019. The scope of management’s assessment of the effectiveness of the design and operation of the Company’s disclosure controls and procedures as of December 31, 2019 includes all of the Company’s consolidated operations except for those disclosure controls and procedures of LegacyTexas that are included in internal control over financial reporting
Changes in internal control over financial reporting. There were no changes in the Company’s internal control over financial reporting (as defined in Rules 13a-15(f) and 15d-15(f) under the Exchange Act) that occurred during the quarter ended December 31, 2019, that have materially affected, or are reasonably likely to materially affect, the Company’s internal control over financial reporting.
60
MANAGEMENT’S REPORT ON INTERNAL CONTROL OVER FINANCIAL REPORTING
The management of the Company is responsible for establishing and maintaining adequate internal control over financial reporting. The Company’s internal control over financial reporting is a process designed under the supervision of the Company’s Chief Executive Officer and Chief Financial Officer to provide reasonable assurance regarding the reliability of financial reporting and the preparation of the Company’s financial statements for external purposes in accordance with generally accepted accounting principles.
As of December 31, 2019, management assessed the effectiveness of the Company’s internal control over financial reporting based on the criteria for effective internal control over financial reporting established in “Internal Control—Integrated Framework,” issued by the Committee of Sponsoring Organizations (“COSO”) of the Treadway Commission (“2013 Framework”). Based on the assessment, management determined that the Company maintained effective internal control over financial reporting as of December 31, 2019.
On November 1, 2019, the Company completed the merger with LegacyTexas Financial Group, Inc. (“LegacyTexas”). The Company is in the process of evaluating the existing controls and procedures of LegacyTexas and integrating LegacyTexas into the internal control over financial reporting. In accordance with SEC Staff guidance permitting a company to exclude an acquired business from management’s assessment of the effectiveness of internal control over financial reporting for the year in which the acquisition is completed, the Company has excluded LegacyTexas from the assessment of the effectiveness of internal control over financial reporting as of December 31, 2019. The LegacyTexas merger represented 27.2% of the Company’s total assets as of December 31, 2019, and 9.3% of the Company’s revenues and 16.4% of the Company’s net income for the year ended December 31, 2019. The scope of management’s assessment of the effectiveness of the design and operation of the Company’s disclosure controls and procedures as of December 31, 2019 includes all of the Company’s consolidated operations except for those disclosure controls and procedures of LegacyTexas that are included in internal control over financial reporting.
Deloitte & Touche LLP the independent registered public accounting firm that audited the consolidated financial statements of the Company included in this Annual Report on Form 10-K, has issued an attestation report on the Company’s internal control over financial reporting as of December 31, 2019. The report is included in this Item under the heading “Report of Independent Registered Public Accounting Firm.”
61
REPORT OF INDEPENDENT REGISTERED PUBLIC ACCOUNTING FIRM
To the shareholders and the Board of Directors of Prosperity Bancshares, Inc.
Opinion on Internal Control over Financial Reporting
We have audited the internal control over financial reporting of Prosperity Bancshares, Inc. and subsidiaries (the “Company”) as of December 31, 2019, based on criteria established in Internal Control — Integrated Framework (2013) issued by the Committee of Sponsoring Organizations of the Treadway Commission (COSO). In our opinion, the Company maintained, in all material respects, effective internal control over financial reporting as of December 31, 2019, based on criteria established in Internal Control — Integrated Framework (2013) issued by COSO.
We have also audited, in accordance with the standards of the Public Company Accounting Oversight Board (United States) (PCAOB), the consolidated financial statements as of and for the year ended December 31, 2019, of the Company and our report dated February 28, 2020 expressed an unqualified opinion on those financial statements.
As described in Management’s Report on Internal Control Over Financial Reporting, management excluded from its assessment the internal control over financial reporting at LegacyTexas Financial Group, Inc. “(LegacyTexas”), which was acquired on November 1, 2019, and whose financial statements constitute 27.2% of the Company’s total assets as of December 31, 2019, and 9.3% of the Company’s revenues and 16.4% of the Company’s net income for the year ended December 31, 2019. Accordingly, our audit did not include the internal control over financial reporting at LegacyTexas.
Basis for Opinion
The Company’s management is responsible for maintaining effective internal control over financial reporting and for its assessment of the effectiveness of internal control over financial reporting, included in the accompanying Management’s Report on Internal Control Over Financial Reporting. Our responsibility is to express an opinion on the Company’s internal control over financial reporting based on our audit. We are a public accounting firm registered with the PCAOB and are required to be independent with respect to the Company in accordance with the U.S. federal securities laws and the applicable rules and regulations of the Securities and Exchange Commission and the PCAOB.
We conducted our audit in accordance with the standards of the PCAOB. Those standards require that we plan and perform the audit to obtain reasonable assurance about whether effective internal control over financial reporting was maintained in all material respects. Our audit included obtaining an understanding of internal control over financial reporting, assessing the risk that a material weakness exists, testing and evaluating the design and operating effectiveness of internal control based on the assessed risk, and performing such other procedures as we considered necessary in the circumstances. We believe that our audit provides a reasonable basis for our opinion.
Definition and Limitations of Internal Control over Financial Reporting
A company’s internal control over financial reporting is a process designed to provide reasonable assurance regarding the reliability of financial reporting and the preparation of financial statements for external purposes in accordance with generally accepted accounting principles. A company’s internal control over financial reporting includes those policies and procedures that (1) pertain to the maintenance of records that, in reasonable detail, accurately and fairly reflect the transactions and dispositions of the assets of the company; (2) provide reasonable assurance that transactions are recorded as necessary to permit preparation of financial statements in accordance with generally accepted accounting principles, and that receipts and expenditures of the company are being made only in accordance with authorizations of management and directors of the company; and (3) provide reasonable assurance regarding prevention or timely detection of unauthorized acquisition, use, or disposition of the company’s assets that could have a material effect on the financial statements.
Because of its inherent limitations, internal control over financial reporting may not prevent or detect misstatements. Also, projections of any evaluation of effectiveness to future periods are subject to the risk that controls may become inadequate because of changes in conditions, or that the degree of compliance with the policies or procedures may deteriorate.
/s/ Deloitte and Touche LLP
Houston, Texas
February 28, 2020
62
|
ITEM 9B. |
OTHER INFORMATION |
None.
PART III.
|
ITEM 10. |
DIRECTORS, EXECUTIVE OFFICERS AND CORPORATE GOVERNANCE |
The information required by this Item is incorporated herein by reference to the information under the captions “Election of Directors,” “Continuing Directors and Executive Officers,” “Delinquent Section 16(a) Reports,” “Corporate Governance—Committees of the Board—Audit Committee,” “Corporate Governance—Director Nominations Process” and “Corporate Governance—Code of Ethics” in the Company’s definitive Proxy Statement for its 2020 Annual Meeting of Shareholders (the “2020 Proxy Statement”) to be filed with the Commission pursuant to Regulation 14A under the Exchange Act within 120 days of the Company’s fiscal year end.
|
ITEM 11. |
EXECUTIVE COMPENSATION |
The information required by this Item is incorporated herein by reference to the information under the captions “Executive Compensation and Other Matters” and “Director Compensation” in the 2020 Proxy Statement.
|
ITEM 12. |
SECURITY OWNERSHIP OF CERTAIN BENEFICIAL OWNERS AND MANAGEMENT AND RELATED SHAREHOLDER MATTERS |
Certain information required by this Item 12 is included under “Securities Authorized for Issuance under Equity Compensation Plans” in Part II, Item 5 of this Annual Report on Form 10-K. The other information required by this Item is incorporated herein by reference to the information under the caption “Beneficial Ownership of Common Stock by Management of the Company and Principal Shareholders” in the 2020 Proxy Statement.
|
ITEM 13. |
CERTAIN RELATIONSHIPS AND RELATED TRANSACTIONS AND DIRECTOR INDEPENDENCE |
The information required by this Item is incorporated herein by reference to the information under the captions “Corporate Governance—Director Independence” and “Certain Relationships and Related Transactions” in the 2020 Proxy Statement.
|
ITEM 14. |
PRINCIPAL ACCOUNTANT FEES AND SERVICES |
The information required by this Item is incorporated herein by reference to the information under the caption “Fees and Services of Independent Registered Public Accounting Firm” in the 2020 Proxy Statement.
63
PART IV.
|
ITEM 15. |
EXHIBITS AND FINANCIAL STATEMENT SCHEDULES |
(a) The following documents are filed as part of this Annual Report on Form 10-K:
1. Consolidated Financial Statements. Reference is made to the Consolidated Financial Statements, the report thereon and the notes thereto commencing at page 67 of this Annual Report on Form 10-K. Set forth below is a list of such Consolidated Financial Statements:
2. Financial Statement Schedules. All supplemental schedules are omitted as inapplicable or because the required information is included in the Consolidated Financial Statements or notes thereto.
3. The exhibits to this Annual Report on Form 10-K listed below have been included only with the copy of this report filed with the Securities and Exchange Commission. The Company will furnish a copy of any exhibit to shareholders upon written request to the Company and payment of a reasonable fee not to exceed the Company’s reasonable expense.
Each exhibit marked with an asterisk is filed or furnished with this Annual Report on Form 10-K as noted below.
|
Exhibit Number (1) |
|
|
Description |
|
|
|
|
|
|
2.1 |
— |
|
|
|
|
|
|
|
|
3.1 |
— |
|
|
|
|
|
|
|
|
3.2 |
— |
|
|
|
|
|
|
|
|
3.3 |
— |
|
|
|
|
|
|
|
|
4.1 |
— |
|
|
|
|
|
|
|
|
4.2* |
— |
|
Description of Securities Registered Pursuant to Section 12 of the Securities Exchange Act of 1934 |
|
|
|
|
|
|
10.1† |
— |
|
|
|
|
|
|
|
|
10.2† |
— |
|
|
|
|
|
|
|
|
10.3† |
— |
|
|
|
|
|
|
|
|
10.4† |
— |
|
|
|
|
|
|
|
|
|
|
|
|
64
|
Exhibit Number (1) |
|
|
Description |
|
|
|
|
|
|
10.5† |
— |
|
|
|
|
|
|
|
|
10.6† |
— |
|
|
|
|
|
|
|
|
10.7† |
— |
|
|
|
|
|
|
|
|
10.8† |
— |
|
|
|
|
|
|
|
|
10.9† |
— |
|
|
|
|
|
|
|
|
10.10† |
— |
|
|
|
|
|
|
|
|
10.11† |
— |
|
|
|
|
|
|
|
|
10.12† |
— |
|
|
|
|
|
|
|
|
10.13† |
— |
|
|
|
|
|
|
|
|
21.1* |
— |
|
|
|
|
|
|
|
|
23.1* |
— |
|
|
|
|
|
|
|
|
31.1* |
— |
|
|
|
|
|
|
|
|
31.2* |
— |
|
|
|
|
|
|
|
|
32.1** |
— |
|
|
|
|
|
|
|
|
32.2** |
— |
|
|
|
|
|
|
|
|
101.INS* |
— |
|
Inline XBRL Instance Document – The instance document does not appear in the interactive data file because its XBRL tags are embedded within the Inline XBRL document |
|
|
|
|
|
|
101.SCH* |
— |
|
Inline XBRL Taxonomy Extension Schema Document |
|
|
|
|
|
|
101.CAL* |
— |
|
Inline XBRL Taxonomy Extension Calculation Linkbase Document |
|
|
|
|
|
|
101.LAB* |
— |
|
Inline XBRL Taxonomy Extension Label Linkbase Document |
|
|
|
|
|
|
101.PRE* |
— |
|
Inline XBRL Taxonomy Extension Presentation Linkbase Document |
|
|
|
|
|
|
101.DEF* |
— |
|
Inline XBRL Taxonomy Extension Definition Linkbase Document |
|
|
|
|
|
|
104 |
— |
|
The cover page from the Company’s Quarterly Report on Form 10-Q for the quarter ended September 30, 2019 (formatted as Inline XBRL and contained in Exhibits 101) |
|
|
|
|
|
65
|
§ |
Schedules attached to the Merger Agreement have been omitted pursuant to Item 601(b)(2) of Regulation S-K. Prosperity will furnish the omitted schedules to the Securities and Exchange Commission upon request by the Commission. |
|
† |
Management contract or compensatory plan or arrangement. |
|
* |
Filed with this Annual Report on Form 10-K. |
|
** |
Furnished with this Annual Report on Form 10-K. |
|
(1) |
The Company has other long-term debt agreements that meet the exclusion set forth in Section 601(b)(4)(iii)(A) of Regulation S-K. The Company hereby agrees to furnish a copy of such agreements to the Commission upon request. |
(b) Exhibits. See the exhibit list included in Item 15(a)3 of this Annual Report on Form 10-K.
(c) Financial Statement Schedules. See Item 15(a)2 of this Annual Report on Form 10-K.
|
ITEM 16. |
FORM 10-K SUMMARY |
None.
66
SIGNATURES
Pursuant to the requirements of Section 13 or 15(d) of the Securities Exchange Act of 1934, as amended, the registrant, has duly caused this report to be signed on its behalf by the undersigned, thereunto duly authorized.
Date: February 28, 2020
|
|
|
PROSPERITY BANCSHARES, INC.® |
|
|
|
|
|
BY: |
|
/S/ DAVID ZALMAN |
|
|
|
David Zalman Senior Chairman of the Board and Chief Executive Officer |
Pursuant to the requirements of the Securities Exchange Act of 1934, as amended, this report has been signed below by the following persons on behalf of the registrant and in the capacities and on the date indicated.
|
Signature |
|
Positions |
|
Date |
|
|
|
|
|
|
|
/s/ DAVID ZALMAN |
|
Senior Chairman of the Board and Chief Executive Officer (principal executive officer); Director |
|
February 28, 2020 |
|
David Zalman |
|
|
||
|
|
|
|
|
|
|
/s/ ASYLBEK OSMONOV |
|
Chief Financial Officer (principal financial officer and principal accounting officer) |
|
February 28, 2020 |
|
Asylbek Osmonov |
|
|
||
|
|
|
|
|
|
|
/s/ JAMES A. BOULIGNY |
|
Director |
|
February 28, 2020 |
|
James A. Bouligny |
|
|
||
|
|
|
|
|
|
|
/s/ W. R. COLLIER |
|
Director |
|
February 28, 2020 |
|
W. R. Collier |
|
|
||
|
|
|
|
|
|
|
/s/ George A. Fisk |
|
Director |
|
February 28, 2020 |
|
George A. Fisk |
|
|
||
|
|
|
|
|
|
|
/s/ Kevin J. Hanigan |
|
President and Chief Operating Officer; Director |
|
February 28, 2020 |
|
Kevin J. Hanigan |
|
|
||
|
|
|
|
|
|
|
/s/ LEAH HENDERSON |
|
Director |
|
February 28, 2020 |
|
Leah Henderson |
|
|
||
|
|
|
|
|
|
|
/s/ NED S. HOLMES |
|
Director |
|
February 28, 2020 |
|
Ned S. Holmes |
|
|
||
|
|
|
|
|
|
|
/s/ Bruce W. Hunt |
|
Director |
|
February 28, 2020 |
|
Bruce W. Hunt |
|
|
||
|
|
|
|
|
|
|
/s/ JACK LORD |
|
Director |
|
February 28, 2020 |
|
Jack Lord |
|
|
||
|
|
|
|
|
|
|
/s/ WILLIAM T. LUEDKE IV |
|
Director |
|
February 28, 2020 |
|
William T. Luedke IV |
|
|
||
|
|
|
|
|
|
|
/s/ PERRY MUELLER, JR., D.D.S. |
|
Director |
|
February 28, 2020 |
|
Perry Mueller, Jr., D.D.S. |
|
|
||
|
|
|
|
|
|
|
/s/ HARRISON STAFFORD II |
|
Director |
|
February 28, 2020 |
|
Harrison Stafford II |
|
|
||
|
|
|
|
|
|
|
/s/ ROBERT STEELHAMMER |
|
Director |
|
February 28, 2020 |
|
Robert Steelhammer |
|
|
||
|
|
|
|
|
|
|
/s/ H.E. TIMANUS, JR. |
|
Chairman; Director |
|
February 28, 2020 |
|
H.E. Timanus, Jr. |
|
|
67
TABLE OF CONTENTS TO CONSOLIDATED FINANCIAL STATEMENTS
68
REPORT OF INDEPENDENT REGISTERED PUBLIC ACCOUNTING FIRM
To the shareholders and the Board of Directors of Prosperity Bancshares, Inc.
Opinion on the Financial Statements
We have audited the accompanying consolidated balance sheets of Prosperity Bancshares, Inc. and subsidiaries (the "Company") as of December 31, 2018 and 2019, the related consolidated statements of income, comprehensive income, changes in shareholders' equity, and cash flows, for each of the three years in the period ended December 31, 2019, and the related notes (collectively referred to as the "financial statements"). In our opinion, the financial statements present fairly, in all material respects, the financial position of the Company as of December 31, 2019 and 2018, and the results of its operations and its cash flows for each of the three years in the period ended December 31, 2019, in conformity with accounting principles generally accepted in the United States of America.
We have also audited, in accordance with the standards of the Public Company Accounting Oversight Board (United States) (PCAOB), the Company's internal control over financial reporting as of December 31, 2019, based on criteria established in Internal Control — Integrated Framework (2013) issued by the Committee of Sponsoring Organizations of the Treadway Commission and our report dated February 28, 2020 expressed an unqualified opinion on the Company's internal control over financial reporting.
Basis for Opinion
These financial statements are the responsibility of the Company's management. Our responsibility is to express an opinion on the Company's financial statements based on our audits. We are a public accounting firm registered with the PCAOB and are required to be independent with respect to the Company in accordance with the U.S. federal securities laws and the applicable rules and regulations of the Securities and Exchange Commission and the PCAOB.
We conducted our audits in accordance with the standards of the PCAOB. Those standards require that we plan and perform the audit to obtain reasonable assurance about whether the financial statements are free of material misstatement, whether due to error or fraud. Our audits included performing procedures to assess the risks of material misstatement of the financial statements, whether due to error or fraud, and performing procedures that respond to those risks. Such procedures included examining, on a test basis, evidence regarding the amounts and disclosures in the financial statements. Our audits also included evaluating the accounting principles used and significant estimates made by management, as well as evaluating the overall presentation of the financial statements. We believe that our audits provide a reasonable basis for our opinion.
Critical Audit Matters
The critical audit matters communicated below are matters arising from the current-period audit of the financial statements that were communicated or required to be communicated to the audit committee and that (1) relate to accounts or disclosures that are material to the financial statements and (2) involved our especially challenging, subjective, or complex judgments. The communication of critical audit matters does not alter in any way our opinion on the financial statements, taken as a whole, and we are not, by communicating the critical audit matters below, providing separate opinions on the critical audit matters or on the accounts or disclosures to which they relate.
Allowance for Credit Losses - Refer to Note 6 to the Financial Statements
Critical Audit Matter Description
The Company’s allowance for credit losses (“ACL”) consists of two components: (1) a specific valuation allowance based on probable losses on specifically identified loans and (2) a general valuation allowance based on historical loan loss experience, general economic conditions and other qualitative risk factors both internal and external to the Company. In determining the amount of the general valuation allowance, management considers factors such as historical loan loss experience, concentration risk of specific loan types, the volume, growth and composition of the Company’s loan portfolio, current economic conditions that may affect the borrower’s ability to pay and the value of collateral, the evaluation of the Company’s loan portfolio through its internal loan review process, general economic conditions and other qualitative risk factors both internal and external to the Company. Based on these factors the Company determines an estimated percentage to apply to the outstanding balance of each loan type. At December 31, 2019, the allowance for credit losses recorded on the balance sheet was $87.5 million, and the provision for credit losses recorded on the statement of income was $4.3 million.
We identified the general valuation allowance for loan losses as a critical audit matter because of the significant amount of judgment required by management when determining the percentage to apply to each loan type based on the economic and qualitative inputs. This required a high degree of auditor judgment and an increased extent of effort, including the need to involve our credit specialists.
69
How the Critical Audit Matter Was Addressed in the Audit
Our audit procedures related to the allowance for credit losses – general valuation allowance included the following, among others:
|
|
• |
We tested the effectiveness of controls over the (i) written policy in place for the calculation of the general valuation allowance, (ii) data input to the general valuation allowance calculation and (iii) management’s review of the adequacy of the general valuation allowance calculation, including the assumptions used in the calculation. |
|
|
• |
With the assistance of a credit specialist, we evaluated: |
|
|
• |
the reasonableness of the classification of the loan types. |
|
|
• |
the methodology surrounding the reasonableness of economic factors and assumptions used in the general valuation allowance calculation. |
|
|
• |
the reasonableness of the logic, statistical validity, and computations of the ACL calculation. |
|
|
• |
We evaluated the appropriateness and relevance of the qualitative factors and related quantitative measures by comparing to external sources. |
|
|
• |
We tested the accuracy and evaluated the relevance of the historical loss data. |
|
|
• |
We tested the accuracy of the historical net charge offs. |
|
|
• |
We tested the arithmetic accuracy of the general valuation allowance calculation. |
LegacyTexas Bank Acquisition - Refer to Note 2 to the Financial Statements
Critical Audit Matter Description
The Company completed the acquisition of LegacyTexas Financial Group, Inc. (“LegacyTexas”) on November 1, 2019. The Company accounted for the acquisition of LegacyTexas under the acquisition method of accounting for business combinations. Accordingly, the purchase price was allocated to the assets acquired and liabilities assumed based on their respective fair values, including loans receivable of $8.5 billion. Management estimated the fair value of loans using a discounted cash flow method, which required management to make significant estimates and assumptions related to forecasted default rates, loan losses, and recoveries, as well as, determine discount rates to present value the cash flows. Changes in the assumptions could impact the amount allocated to loans and ultimately the amount recorded as goodwill.
Given the fair value determination of loans receivable requires management to make significant estimates and assumptions regarding projected default rates and discount rates, performing audit procedures to evaluate the reasonableness of those estimates and assumptions required a high degree of auditor judgment, and an increased extent of effort, including involving fair value specialists.
How the Critical Audit Matter Was Addressed in the Audit
Our audit procedures related to the fair value of loans receivable acquired from LegacyTexas included the following, among others:
|
|
• |
We tested the effectiveness of controls over the valuation of acquired loans receivable, including management’s controls over forecasts of default rates, loan losses and recoveries used in developing estimated future cash flows, and discount rates used to present value cash flows. |
|
|
• |
We assessed the reasonableness of management’s forecasts by comparing the projection to historical results of LegacyTexas’ loans losses, as well as, to certain peer companies of LegacyTexas. |
|
|
• |
With the assistance of fair value specialists, we evaluated: |
|
|
• |
the reasonableness of the valuation methodology, and |
|
|
• |
the reasonableness of the discount rate used to present value the expected cash flows by: |
|
|
– |
Testing the source information underlying the determination of the discount rate and testing mathematical accuracy of the calculation for a selected sample of the loans. |
|
|
– |
Developing a range of independent estimates and comparing those to the discount rate selected by management to evaluate the inputs used in the calculation. |
|
|
• |
We evaluated whether the estimated cash flows were consistent with evidence obtained in other areas of the audit. |
|
|
• |
We tested the accuracy and evaluated the relevance of the loan data on the date of the acquisition. |
/s/ Deloitte and Touche LLP
Houston, Texas
February 28, 2020
We have served as the Company’s auditor since 1993.
70
PROSPERITY BANCSHARES, INC.® AND SUBSIDIARIES
CONSOLIDATED BALANCE SHEETS
|
|
|
December 31, |
|
|||||
|
|
|
2019 |
|
|
2018 |
|
||
|
|
|
(Dollars in thousands) |
|
|||||
|
ASSETS |
|
|
|
|
|
|
|
|
|
Cash and due from banks |
|
$ |
|
|
|
$ |
|
|
|
Federal funds sold |
|
|
|
|
|
|
|
|
|
Total cash and cash equivalents |
|
|
|
|
|
|
|
|
|
Available for sale securities, at fair value |
|
|
|
|
|
|
|
|
|
Held to maturity securities, at cost (fair value of $ |
|
|
|
|
|
|
|
|
|
Total securities |
|
|
|
|
|
|
|
|
|
Loans held for sale |
|
|
|
|
|
|
|
|
|
Loans held for investment |
|
|
|
|
|
|
|
|
|
Loans held for investment - Warehouse Purchase Program |
|
|
|
|
|
|
— |
|
|
Total loans |
|
|
|
|
|
|
|
|
|
Less: allowance for credit losses |
|
|
( |
) |
|
|
( |
) |
|
Loans, net |
|
|
|
|
|
|
|
|
|
Accrued interest receivable |
|
|
|
|
|
|
|
|
|
Goodwill |
|
|
|
|
|
|
|
|
|
Core deposit intangibles, net |
|
|
|
|
|
|
|
|
|
Bank premises and equipment, net |
|
|
|
|
|
|
|
|
|
Other real estate owned |
|
|
|
|
|
|
|
|
|
Bank owned life insurance (BOLI) |
|
|
|
|
|
|
|
|
|
Federal Home Loan Bank of Dallas stock |
|
|
|
|
|
|
|
|
|
Other assets |
|
|
|
|
|
|
|
|
|
TOTAL ASSETS |
|
$ |
|
|
|
$ |
|
|
|
LIABILITIES AND SHAREHOLDERS’ EQUITY |
|
|
|
|
|
|
|
|
|
LIABILITIES: |
|
|
|
|
|
|
|
|
|
Deposits: |
|
|
|
|
|
|
|
|
|
Noninterest-bearing |
|
$ |
|
|
|
$ |
|
|
|
Interest-bearing |
|
|
|
|
|
|
|
|
|
Total deposits |
|
|
|
|
|
|
|
|
|
Fed funds purchased and other borrowings |
|
|
|
|
|
|
|
|
|
Securities sold under repurchase agreements |
|
|
|
|
|
|
|
|
|
Subordinated notes |
|
|
|
|
|
|
— |
|
|
Accrued interest payable |
|
|
|
|
|
|
|
|
|
Other liabilities |
|
|
|
|
|
|
|
|
|
Total liabilities |
|
|
|
|
|
|
|
|
|
COMMITMENTS AND CONTINGENCIES |
|
|
|
|
|
|
|
|
|
SHAREHOLDERS’ EQUITY: |
|
|
|
|
|
|
|
|
|
Preferred stock, $ |
|
|
|
|
|
|
|
|
|
Common stock, $ |
|
|
|
|
|
|
|
|
|
Capital surplus |
|
|
|
|
|
|
|
|
|
Retained earnings |
|
|
|
|
|
|
|
|
|
Accumulated other comprehensive income —net unrealized gain on available for sale securities, net of tax expense of $ |
|
|
|
|
|
|
|
|
|
Total shareholders’ equity |
|
|
|
|
|
|
|
|
|
TOTAL LIABILITIES AND SHAREHOLDERS’ EQUITY |
|
$ |
|
|
|
$ |
|
|
See notes to consolidated financial statements.
71
PROSPERITY BANCSHARES, INC.® AND SUBSIDIARIES
CONSOLIDATED STATEMENTS OF INCOME
|
|
|
For the Years Ended December 31, |
|
|||||||||
|
|
|
|
2019 |
|
|
|
2018 |
|
|
|
2017 |
|
|
|
|
(Dollars in thousands, except per share data) |
|
|||||||||
|
INTEREST INCOME: |
|
|
|
|
|
|
|
|
|
|
|
|
|
Loans, including fees |
|
$ |
|
|
|
$ |
|
|
|
$ |
|
|
|
Securities |
|
|
|
|
|
|
|
|
|
|
|
|
|
Federal funds sold and other earning assets |
|
|
|
|
|
|
|
|
|
|
|
|
|
Total interest income |
|
|
|
|
|
|
|
|
|
|
|
|
|
INTEREST EXPENSE: |
|
|
|
|
|
|
|
|
|
|
|
|
|
Deposits |
|
|
|
|
|
|
|
|
|
|
|
|
|
Other borrowings |
|
|
|
|
|
|
|
|
|
|
|
|
|
Securities sold under repurchase agreements |
|
|
|
|
|
|
|
|
|
|
|
|
|
Subordinated notes and trust preferred |
|
|
|
|
|
|
|
|
|
|
|
|
|
Total interest expense |
|
|
|
|
|
|
|
|
|
|
|
|
|
NET INTEREST INCOME |
|
|
|
|
|
|
|
|
|
|
|
|
|
PROVISION FOR CREDIT LOSSES |
|
|
|
|
|
|
|
|
|
|
|
|
|
NET INTEREST INCOME AFTER PROVISION FOR CREDIT LOSSES |
|
|
|
|
|
|
|
|
|
|
|
|
|
NONINTEREST INCOME: |
|
|
|
|
|
|
|
|
|
|
|
|
|
Nonsufficient funds (NSF) fees |
|
|
|
|
|
|
|
|
|
|
|
|
|
Credit card, debit card and ATM card income |
|
|
|
|
|
|
|
|
|
|
|
|
|
Service charges on deposit accounts |
|
|
|
|
|
|
|
|
|
|
|
|
|
Trust income |
|
|
|
|
|
|
|
|
|
|
|
|
|
Mortgage income |
|
|
|
|
|
|
|
|
|
|
|
|
|
Brokerage income |
|
|
|
|
|
|
|
|
|
|
|
|
|
Net loss on sale or write-off of assets |
|
|
( |
) |
|
|
( |
) |
|
|
( |
) |
|
Net (loss) gain on sale of securities |
|
|
|
|
|
|
( |
) |
|
|
|
|
|
Other |
|
|
|
|
|
|
|
|
|
|
|
|
|
Total noninterest income |
|
|
|
|
|
|
|
|
|
|
|
|
|
NONINTEREST EXPENSE: |
|
|
|
|
|
|
|
|
|
|
|
|
|
Salaries and employee benefits |
|
|
|
|
|
|
|
|
|
|
|
|
|
Net occupancy and equipment |
|
|
|
|
|
|
|
|
|
|
|
|
|
Credit and debit card, data processing and software amortization |
|
|
|
|
|
|
|
|
|
|
|
|
|
Regulatory assessments and FDIC insurance |
|
|
|
|
|
|
|
|
|
|
|
|
|
Core deposit intangibles amortization |
|
|
|
|
|
|
|
|
|
|
|
|
|
Depreciation |
|
|
|
|
|
|
|
|
|
|
|
|
|
Communications |
|
|
|
|
|
|
|
|
|
|
|
|
|
Other real estate (income) expense |
|
|
( |
) |
|
|
|
|
|
|
|
|
|
Merger related expenses |
|
|
|
|
|
|
|
|
|
|
|
|
|
Other |
|
|
|
|
|
|
|
|
|
|
|
|
|
Total noninterest expense |
|
|
|
|
|
|
|
|
|
|
|
|
|
INCOME BEFORE INCOME TAXES |
|
|
|
|
|
|
|
|
|
|
|
|
|
PROVISION FOR INCOME TAXES |
|
|
|
|
|
|
|
|
|
|
|
|
|
NET INCOME |
|
$ |
|
|
|
$ |
|
|
|
$ |
|
|
|
EARNINGS PER SHARE: |
|
|
|
|
|
|
|
|
|
|
|
|
|
Basic |
|
$ |
|
|
|
$ |
|
|
|
$ |
|
|
|
Diluted |
|
$ |
|
|
|
$ |
|
|
|
$ |
|
|
See notes to consolidated financial statements.
72
PROSPERITY BANCSHARES, INC. ® AND SUBSIDIARIES
CONSOLIDATED STATEMENTS OF COMPREHENSIVE INCOME
|
|
|
For the Years Ended December 31, |
|
|||||||||
|
|
|
2019 |
|
|
2018 |
|
|
2017 |
|
|||
|
|
|
(Dollars in thousands) |
|
|||||||||
|
Net income |
|
$ |
|
|
|
$ |
|
|
|
$ |
|
|
|
Other comprehensive income (loss), before tax: |
|
|
|
|
|
|
|
|
|
|
|
|
|
Securities available for sale: |
|
|
|
|
|
|
|
|
|
|
|
|
|
Change in unrealized gain or loss during the period |
|
|
|
|
|
|
|
|
|
|
( |
) |
|
Total other comprehensive income (loss) |
|
|
|
|
|
|
|
|
|
|
( |
) |
|
Deferred tax related to other comprehensive income or loss |
|
|
( |
) |
|
|
( |
) |
|
|
|
|
|
Other comprehensive income (loss), net of tax |
|
|
|
|
|
|
|
|
|
|
( |
) |
|
Comprehensive income |
|
$ |
|
|
|
$ |
|
|
|
$ |
|
|
See notes to consolidated financial statements.
73
PROSPERITY BANCSHARES, INC.® AND SUBSIDIARIES
CONSOLIDATED STATEMENTS OF CHANGES IN SHAREHOLDERS’ EQUITY
|
|
|
|
|
|
|
|
|
|
|
|
|
|
|
|
|
|
|
|
|
|
|
|
|
|
|
|
|
|
|
|
|
|
|
|
|
|
|
|
|
|
|
|
|
Accumulated |
|
|
|
|
|
|
|
|
|
Common Stock |
|
|
Capital |
|
|
Retained |
|
|
Other Comprehensive |
|
|
Total Shareholders’ |
|
|||||||||
|
|
|
Shares |
|
|
Amount |
|
|
Surplus |
|
|
Earnings |
|
|
Income (Loss) |
|
|
Equity |
|
||||||
|
|
|
(In thousands, except share and per share data) |
|
|||||||||||||||||||||
|
BALANCE AT DECEMBER 31, 2016 |
|
|
|
|
|
$ |
|
|
|
$ |
|
|
|
$ |
|
|
|
$ |
|
|
|
$ |
|
|
|
Net income |
|
|
|
|
|
|
|
|
|
|
|
|
|
|
|
|
|
|
|
|
|
|
|
|
|
Other comprehensive loss |
|
|
|
|
|
|
|
|
|
|
|
|
|
|
|
|
|
|
( |
) |
|
|
( |
) |
|
Common stock issued in connection with the exercise of stock options and restricted stock awards, net |
|
|
( |
) |
|
|
— |
|
|
|
|
|
|
|
|
|
|
|
|
|
|
|
|
|
|
Stock based compensation expense |
|
|
|
|
|
|
|
|
|
|
|
|
|
|
|
|
|
|
|
|
|
|
|
|
|
Cash dividends declared, $ |
|
|
|
|
|
|
|
|
|
|
|
|
|
|
( |
) |
|
|
|
|
|
|
( |
) |
|
BALANCE AT DECEMBER 31, 2017 |
|
|
|
|
|
|
|
|
|
|
|
|
|
|
|
|
|
|
( |
) |
|
|
|
|
|
Net income |
|
|
|
|
|
|
|
|
|
|
|
|
|
|
|
|
|
|
|
|
|
|
|
|
|
Other comprehensive income |
|
|
|
|
|
|
|
|
|
|
|
|
|
|
|
|
|
|
|
|
|
|
|
|
|
Common stock issued in connection with the exercise of restricted stock awards, net |
|
|
|
|
|
|
|
|
|
|
( |
) |
|
|
|
|
|
|
|
|
|
|
— |
|
|
Stock based compensation expense |
|
|
|
|
|
|
|
|
|
|
|
|
|
|
|
|
|
|
|
|
|
|
|
|
|
Cash dividends declared, $ |
|
|
|
|
|
|
|
|
|
|
|
|
|
|
( |
) |
|
|
|
|
|
|
( |
) |
|
BALANCE AT DECEMBER 31, 2018 |
|
|
|
|
|
|
|
|
|
|
|
|
|
|
|
|
|
|
|
|
|
|
|
|
|
Net income |
|
|
|
|
|
|
|
|
|
|
|
|
|
|
|
|
|
|
|
|
|
|
|
|
|
Other comprehensive income |
|
|
|
|
|
|
|
|
|
|
|
|
|
|
|
|
|
|
|
|
|
|
|
|
|
Common stock issued in connection with the exercise of restricted stock awards, net |
|
|
|
|
|
|
|
|
|
|
( |
) |
|
|
|
|
|
|
|
|
|
|
— |
|
|
Common stock issued in connection with the acquisition of LegacyTexas Financial Group, Inc. |
|
|
|
|
|
|
|
|
|
|
|
|
|
|
|
|
|
|
|
|
|
|
|
|
|
Common stock repurchase |
|
|
( |
) |
|
|
( |
) |
|
|
( |
) |
|
|
|
|
|
|
|
|
|
|
( |
) |
|
Stock based compensation expense |
|
|
|
|
|
|
|
|
|
|
|
|
|
|
|
|
|
|
|
|
|
|
|
|
|
Cash dividends declared, $ |
|
|
|
|
|
|
|
|
|
|
|
|
|
|
( |
) |
|
|
|
|
|
|
( |
) |
|
BALANCE AT DECEMBER 31, 2019 |
|
|
|
|
|
$ |
|
|
|
$ |
|
|
|
$ |
|
|
|
$ |
|
|
|
$ |
|
|
See notes to consolidated financial statements.
74
PROSPERITY BANCSHARES, INC.® AND SUBSIDIARIES
CONSOLIDATED STATEMENTS OF CASH FLOWS
|
|
|
For the Years Ended December 31, |
|
|||||||||
|
|
|
2019 |
|
|
2018 |
|
|
2017 |
|
|||
|
|
|
(Dollars in thousands) |
|
|||||||||
|
CASH FLOWS FROM OPERATING ACTIVITIES: |
|
|
|
|
|
|
|
|
|
|
|
|
|
Net income |
|
$ |
|
|
|
$ |
|
|
|
$ |
|
|
|
Adjustments to reconcile net income to net cash provided by operating activities: |
|
|
|
|
|
|
|
|
|
|
|
|
|
Depreciation and core deposit intangibles amortization |
|
|
|
|
|
|
|
|
|
|
|
|
|
Provision for credit losses |
|
|
|
|
|
|
|
|
|
|
|
|
|
Deferred income tax (benefit) expense |
|
|
( |
) |
|
|
|
|
|
|
|
|
|
Net amortization of premium on investments |
|
|
|
|
|
|
|
|
|
|
|
|
|
(Gain) loss on sale or write down of premises, equipment and other real estate |
|
|
( |
) |
|
|
|
|
|
|
|
|
|
Loss (gain) on sale of investment securities |
|
|
— |
|
|
|
|
|
|
|
( |
) |
|
Net amortization of premium on deposits |
|
|
( |
) |
|
|
( |
) |
|
|
( |
) |
|
Net accretion of discount on loans |
|
|
( |
) |
|
|
( |
) |
|
|
( |
) |
|
Proceeds from sale of loans held for sale |
|
|
|
|
|
|
|
|
|
|
|
|
|
Originations of loans held for sale |
|
|
( |
) |
|
|
( |
) |
|
|
( |
) |
|
Stock based compensation expense |
|
|
|
|
|
|
|
|
|
|
|
|
|
Decrease (increase) in accrued interest receivable and other assets |
|
|
|
|
|
|
( |
) |
|
|
|
|
|
(Decrease) increase in accrued interest payable and other liabilities |
|
|
( |
) |
|
|
( |
) |
|
|
|
|
|
Net cash provided by operating activities |
|
|
|
|
|
|
|
|
|
|
|
|
|
CASH FLOWS FROM INVESTING ACTIVITIES: |
|
|
|
|
|
|
|
|
|
|
|
|
|
Proceeds from maturities, sales and principal paydowns of held to maturity securities |
|
|
|
|
|
|
|
|
|
|
|
|
|
Purchase of held to maturity securities |
|
|
( |
) |
|
|
( |
) |
|
|
( |
) |
|
Proceeds from maturities, sales and principal paydowns of available for sale securities |
|
|
|
|
|
|
|
|
|
|
|
|
|
Purchase of available for sale securities |
|
|
( |
) |
|
|
( |
) |
|
|
( |
) |
|
Originations of WPP loans |
|
|
( |
) |
|
|
— |
|
|
|
— |
|
|
Proceeds from pay-offs of WPP |
|
|
|
|
|
|
— |
|
|
|
— |
|
|
Net (increase) decrease in loans held for investment |
|
|
( |
) |
|
|
( |
) |
|
|
( |
) |
|
Purchase of bank premises and equipment |
|
|
( |
) |
|
|
( |
) |
|
|
( |
) |
|
Proceeds from sale of bank premises, equipment and other real estate |
|
|
|
|
|
|
|
|
|
|
|
|
|
Proceeds from insurance claims |
|
|
|
|
|
|
|
|
|
|
— |
|
|
Net cash used in the purchase of LegacyTexas Financial Group, Inc. |
|
|
( |
) |
|
|
— |
|
|
|
— |
|
|
Net cash provided by (used in) investing activities |
|
|
|
|
|
|
( |
) |
|
|
( |
) |
|
CASH FLOWS FROM FINANCING ACTIVITIES: |
|
|
|
|
|
|
|
|
|
|
|
|
|
Net increase in noninterest-bearing deposits |
|
|
|
|
|
|
|
|
|
|
|
|
|
Net increase (decrease) in interest-bearing deposits |
|
|
|
|
|
|
( |
) |
|
|
|
|
|
Net (repayments) proceeds from other short-term borrowings |
|
|
( |
) |
|
|
|
|
|
|
( |
) |
|
Repayments of other long-term borrowings |
|
|
( |
) |
|
|
( |
) |
|
|
( |
) |
|
Net increase (decrease) in securities sold under repurchase agreements |
|
|
|
|
|
|
( |
) |
|
|
|
|
|
Redemption of junior subordinated debentures |
|
|
( |
) |
|
|
— |
|
|
|
— |
|
|
Proceeds from stock option exercises |
|
|
— |
|
|
|
— |
|
|
|
|
|
|
Repurchase of common stock |
|
|
( |
) |
|
|
— |
|
|
|
— |
|
|
Payments of cash dividends |
|
|
( |
) |
|
|
( |
) |
|
|
( |
) |
|
Net cash used in financing activities |
|
|
( |
) |
|
|
( |
) |
|
|
( |
) |
|
NET INCREASE (DECREASE) IN CASH AND CASH EQUIVALENTS |
|
|
|
|
|
|
|
|
|
|
( |
) |
|
CASH AND CASH EQUIVALENTS, BEGINNING OF PERIOD |
|
|
|
|
|
|
|
|
|
|
|
|
|
CASH AND CASH EQUIVALENTS, END OF PERIOD |
|
$ |
|
|
|
$ |
|
|
|
$ |
|
|
|
NONCASH ACTIVITIES: |
|
|
|
|
|
|
|
|
|
|
|
|
|
Stock issued in connection with the LegacyTexas Financial Group, Inc. merger |
|
$ |
|
|
|
$ |
— |
|
|
$ |
— |
|
|
Acquisition of real estate through foreclosure of collateral |
|
|
|
|
|
|
|
|
|
|
|
|
|
SUPPLEMENTAL INFORMATION: |
|
|
|
|
|
|
|
|
|
|
|
|
|
Income taxes paid |
|
$ |
|
|
|
$ |
|
|
|
$ |
|
|
|
Interest paid |
|
|
|
|
|
|
|
|
|
|
|
|
75
See notes to consolidated financial statements.
PROSPERITY BANCSHARES, INC.® AND SUBSIDIARIES
NOTES TO CONSOLIDATED FINANCIAL STATEMENTS
1. NATURE OF OPERATIONS AND SUMMARY OF SIGNIFICANT ACCOUNTING AND REPORTING POLICIES
Nature of Operations—Prosperity Bancshares, Inc.® (“Bancshares”) and its subsidiary, Prosperity Bank® (the “Bank”, collectively referred to as the “Company”), provide retail and commercial banking services.
On November 1, 2019, LegacyTexas Financial Group, Inc. (“LegacyTexas”), merged with Prosperity Bancshares and LegacyTexas Bank merged with Prosperity Bank (collectively, the “Merger”). LegacyTexas was headquartered in Plano, Texas and operated
As of December 31, 2019, the Bank operated
Summary of Significant Accounting and Reporting Policies—The accounting and reporting policies of the Company conform to generally accepted accounting principles (“GAAP”) and the prevailing practices within the financial services industry. A summary of significant accounting and reporting policies are as follows:
Basis of Presentation—The consolidated financial statements include the accounts of Bancshares and its subsidiaries. Intercompany transactions have been eliminated in consolidation. Operations are managed and financial performance is evaluated on a company-wide basis. Accordingly, all of the Company’s banking operations are considered by management to be aggregated in
Use of Estimates—The preparation of financial statements in conformity with GAAP requires management to make estimates and assumptions that affect the reported amounts of assets and liabilities and disclosure of contingent assets and liabilities at the date of the financial statements and the reported amounts of revenues and expenses during the reporting period. Such estimates include, but are not limited to certain fair value measures including the calculation of stock-based compensation, the valuation of goodwill and available for sale and held to maturity securities and the calculation of allowance for credit losses. Actual results could differ from these estimates.
Business Combinations—Generally, acquisitions are accounted for under the acquisition method of accounting in accordance with Financial Accounting Standards Board (“FASB”) Accounting Standards Codification (“ASC”) 805, Business Combinations. A business combination occurs when the Company acquires net assets that constitute a business and obtains control over that business. Business combinations are effected through the transfer of consideration consisting of cash and/or common stock and are accounted for using the acquisition method. Accordingly, the assets and liabilities of the acquired business are recorded at their respective fair values at the acquisition date. Determining the fair value of assets and liabilities, especially the loan portfolio, is a process involving significant judgment regarding methods and assumptions used to calculate estimated fair values. Fair values are subject to refinement for up to one year after the closing date of the acquisition as information relative to closing date fair values becomes available. The results of operations of an acquired entity are included in the Company’s consolidated results from acquisition date, and prior periods are not restated. The fair value of acquired loans incorporates assumptions regarding future credit losses and therefore
Securities —Securities held to maturity are carried at cost, adjusted for the amortization of premiums and the accretion of discounts. Management has the positive intent and the Company has the ability to hold these assets until their estimated maturities.
Securities available for sale are carried at fair value. Unrealized gains and losses are excluded from earnings and reported, net of tax, as a separate component of shareholders’ equity until realized. Securities within the available for sale portfolio may be used as part of the Company’s asset/liability strategy and may be sold in response to changes in interest rate risk, prepayment risk or other similar economic factors.
For debt securities, when other-than-temporary impairment (“OTTI”) occurs, the amount of the OTTI recognized in earnings depends on whether an entity intends to sell the security or more likely than not will be required to sell the security before recovery of
76
its amortized cost basis less any current-period credit loss. If an entity intends to sell or more likely than not will be required to sell the security before recovery of its amortized cost basis less any current-period credit loss, the OTTI will be recognized in earnings equal to the entire difference between the investment’s amortized cost basis and its fair value at the balance sheet date. If an entity does not intend to sell the security and it is not more likely than not that the entity will be required to sell the security before recovery of its amortized cost basis less any current-period loss, the OTTI will be separated into the amount representing the credit-related portion of the impairment loss (“credit loss”) and the noncredit portion of the impairment loss (“noncredit portion”). The amount of the total OTTI related to the credit loss is determined based on the difference between the present value of cash flows expected to be collected and the amortized cost basis and such difference is recognized in earnings. The amount of the total OTTI related to the noncredit portion is recognized in other comprehensive income, net of applicable taxes. The previous amortized cost basis less the OTTI recognized in earnings shall become the new amortized cost basis of the investment.
Premiums and discounts are amortized and accreted to operations using the level-yield method of accounting, adjusted for prepayments as applicable. The specific identification method of accounting is used to compute gains or losses on the sales of these assets. Interest earned on these assets is included in interest income.
Loans Held for Sale—Loans held for sale are carried at the lower of cost or market value. Premiums, discounts and loan fees (net of certain direct loan origination costs) on loans held for sale are deferred until the related loans are sold or repaid. Gains or losses on loan sales are recognized at the time of sale and determined using the specific identification method.
Loans Held for Investment—Loans originated and held for investment are stated at the principal amount outstanding, net of unearned fees. The related interest income for multi-payment loans is recognized principally by the simple interest method; for single payment loans, such income is recognized using the straight-line method.
The Company has two general categories of loans in its portfolio. Loans originated by the Bank and made pursuant to the Company’s loan policy and procedures in effect at the time the loan was made are referred to as “originated loans” and loans acquired in a business combination are referred to as “acquired loans.” Acquired loans are initially recorded at fair value based on a discounted cash flow valuation methodology that considers, among other things, interest rates, projected default rates, loss given default and recovery rates, with no carryover of any existing allowance for credit losses. Those acquired loans that are renewed or substantially modified after the date of the business combination, thereby subjecting them to the Company’s allowance for credit losses methodology, are referred to as “re-underwritten acquired loans.” Modifications are reviewed for determination of troubled debt restructuring status independently of this process. In certain instances, acquired loans to one borrower may be combined or otherwise re-originated such that they are re-categorized as originated loans. Acquired loans with a fair value discount or premium at the date of the business combination that remained at the reporting date are referred to as “fair-valued acquired loans.” All fair-valued acquired loans are further categorized into “Non-PCI loans” and “PCI loans” (purchased credit impaired loans). Acquired loans with evidence of credit quality deterioration at acquisition are reviewed to determine if it is probable that the Company will not be able to collect all contractual amounts due, including both principal and interest. When both conditions exist, such loans are accounted for as PCI loans.
The Company estimates the total cash flows expected to be collected from the PCI loans, which include undiscounted expected principal and interest, using credit risk, interest rate and prepayment risk assessments that incorporate management’s best estimate of current key assumptions such as default rates, loss severity and payment speeds. The excess of the undiscounted total cash flows expected to be collected over the fair value of the related PCI loans represents the accretable yield, which is recognized as interest income on a level-yield basis over the life of the related loan. The difference between the undiscounted contractual principal and interest and the undiscounted total cash flows expected to be collected is the nonaccretable difference, which reflects the impact of estimated credit losses and other factors. Subsequent increases in expected cash flows will result in a recovery of any previously recorded allowance for credit losses, to the extent applicable, and a reclassification from nonaccretable difference to accretable yield, which is recognized prospectively over the then remaining life of the loan. Subsequent decreases in expected cash flows will result in an impairment charge to the provision for credit losses, resulting in an addition to the allowance for credit losses, and a reclassification from accretable yield to nonaccretable difference.
A loan disposal, which may include a loan sale, receipt of payment in full from the borrower or foreclosure, results in removal of the loan from the balance sheet at its allocated carrying amount and accretion of any remaining fair value discount to income.
Warehouse Purchase Program Loans— The Company acquired the Warehouse Purchase Program as part of the merger with LegacyTexas. All Warehouse Purchase Program loans are collectively evaluated for impairment and are purchased under several contractual requirements, providing safeguards to the Company. These safeguards include the requirement that the mortgage company customers have a takeout commitment or similar arrangement for each loan. To date, neither the Company nor LegacyTexas have experienced a loss on these loans and
77
Nonrefundable Fees and Costs Associated with Lending Activities—Loan origination fees in excess of the associated costs are recognized over the life of the related loan as an adjustment to yield using the interest method.
Loan commitment fees and loan origination costs are deferred and recognized as an adjustment of yield by the interest method over the related loan life or, if the commitment expires unexercised, recognized in income upon expiration of the commitment.
Nonperforming and Past Due Loans—Included in the nonperforming loan category are loans which have been categorized by management as nonaccrual because collection of interest is doubtful and loans which have been restructured through a troubled debt restructuring to provide a reduction in the interest rate or a deferral of interest or principal payments. The Company generally places a loan on nonaccrual status and ceases accruing interest when the payment of principal or interest is delinquent for 90 days, or earlier in some cases, unless the loan is in the process of collection and the underlying collateral fully supports the carrying value of the loan. If the decision is made to continue accruing interest on the loan, periodic reviews are made to confirm the accruing status of the loan. When a loan is placed on nonaccrual status, interest accrued but not yet collected prior to the determination of uncollectibility is charged to operations. Interest accrued during prior periods is charged to the allowance for credit losses. Any payments received on nonaccrual loans are applied first to outstanding principal of the loan amount, next to the recovery of charged-off loan amounts and finally, any excess is treated as recovery of lost interest.
Restructured loans are those loans on which concessions in terms have been granted because of a borrower’s financial difficulty. Interest is generally not accrued on such loans in accordance with the new terms.
Allowance for Credit Losses—The allowance for credit losses is an allowance available for losses incurred on loans. All losses are charged to the allowance when the loss actually occurs or when a determination is made that such a loss is probable and reasonably estimatable. Recoveries are credited to the allowance at the time of recovery.
Throughout the year, management estimates the probable level of losses to determine whether the allowance for credit losses is adequate to absorb losses inherent in the loan portfolio. Based on these estimates, an amount is charged to the provision for credit losses and credited to the allowance for credit losses in order to adjust the allowance to a level determined to be adequate to absorb losses.
In making its evaluation of the adequacy of the allowance for credit losses, management considers factors such as historical loan loss experience, the amount of nonperforming assets and related collateral, the volume, growth and composition of the Company’s loan portfolio, current economic conditions that may affect the borrower’s ability to pay and the value of collateral, the evaluation of the Company’s loan portfolio through its internal loan review process and other relevant factors.
Estimates of credit losses involve an exercise of judgment. While it is possible that in the short term the Company may sustain losses which are substantial in relation to the allowance for credit losses, it is the judgment of management that the allowance for credit losses reflected in the consolidated balance sheets is adequate to absorb probable losses that exist in the loan portfolio as of December 31, 2019.
The Company’s allowance for credit losses consists of two elements: (1) specific valuation allowances based on probable losses on impaired loans; and (2) a general valuation allowance based on historical loan loss experience, general economic conditions and other qualitative risk factors both internal and external to the Company. A loan is defined as impaired if, based on current information and events, it is probable that a creditor will be unable to collect all amounts due, both interest and principal, according to the contractual terms of the loan agreement. The allowance for credit losses related to impaired loans is determined based on the difference of carrying value of loans and the present value of expected cash flows discounted at the loan’s effective interest rate or, as a practical expedient, the loan’s observable market price or the fair value of the collateral if the loan is collateral dependent.
Loans acquired in business combinations are initially recorded at fair value, which includes an estimate of credit losses expected to be realized over the remaining lives of the loans, and therefore no corresponding allowance for credit losses is recorded for these loans at acquisition. These fair value estimates associated with acquired loans, based on a discounted cash flow model, include estimates related to market interest rates and undiscounted projections of future cash flows that incorporate expectations of prepayments and the amount and timing of principal, interest and other cash flows, as well as any shortfalls thereof. At period-end after acquisition, the fair-valued acquired loans from each acquisition are reassessed to determine whether an addition to the allowance for credit losses is appropriate due to further credit quality deterioration. Methods utilized to estimate any subsequently required allowance for acquired loans not deemed credit impaired at acquisition are similar to originated loans; however, the estimate of loss is based on the unpaid principal balance and then compared to any remaining unaccreted purchase discount. To the extent that the calculated loss is greater than the remaining unaccreted purchase discount, an allowance is recorded for such difference.
78
Premises and Equipment—Premises and equipment are carried at cost less accumulated depreciation. Depreciation expense is computed principally using the straight-line method over the estimated useful lives of the assets which range from
Derivative Financial Instruments—The Company has interest rate swaps and caps with certain commercial customers who wished to obtain a loan at a fixed rate. The Company enters into an interest rate swap with the customer while at the same time entering into an offsetting interest rate swap with another financial institution. In connection with each swap transaction, the Company agrees to pay interest to the borrowing customer on a notional amount at a variable interest rate and receives interest from the customer on the same notional amount at a fixed interest rate. At the same time, the Company agrees to pay another financial institution the same fixed interest rate on the same notional amount and receive the same variable interest rate on the same notional amount. The transaction allows the customer to effectively convert a variable-rate loan to a fixed-rate. Because the Company acts solely as an intermediary for its customer, changes in the fair value of the underlying derivative contracts offset each other and do not significantly impact the Company’s results of operations.
The Company obtained interest rate lock commitments and forward mortgage-backed securities trades with the Merger. In the normal course of business, the Company enters into interest rate lock commitments with consumers to originate mortgage loans at a specified interest rate. These commitments, which contain fixed expiration dates, offer the borrower an interest rate guarantee provided the loan meets underwriting guidelines and closes within the timeframe established by the Company. The Company manages the changes in fair value associated with changes in interest rates related to interest rate lock commitments by using forward sold commitments known as forward mortgage-backed securities trades. These instruments are typically entered into at the time the interest rate lock commitment is made.
These financial instruments are not designated as hedging instruments and are used for asset and liability management and commercial customers’ financing needs. All derivatives are carried at fair value in either other assets or other liabilities.
Goodwill —Goodwill is annually assessed for impairment or when events or changes in circumstances indicate that the carrying amount of the asset may not be recoverable.
Under Accounting Standards Codification (“ASC”) Topic 350-20, “Intangibles—Goodwill and Other—Goodwill” companies have the option to first assess qualitative factors to determine whether it is more likely than not that the fair value of a reporting unit is less than its carrying amount as a basis for determining the need to perform step one of the annual test for goodwill impairment. An entity has an unconditional option to bypass the qualitative assessment described in the following paragraph for any reporting unit in any period and proceed directly to performing the first step of the goodwill impairment test. An entity may resume performing the qualitative assessment in any subsequent period.
If the Company bypasses the qualitative assessment, a two-step goodwill impairment test would be performed. The first step of the goodwill impairment test compares the estimated fair value of the Company’s reporting unit to its carrying value. If the estimated fair value of the reporting unit exceeds its carrying value, goodwill of the reporting unit is not impaired. If the estimated fair value of the reporting unit is less than the carrying value, the second step must be performed to determine the implied fair value of the reporting unit’s goodwill and the amount of goodwill impairment, if any. The Company currently utilizes a qualitative assessment for its annual goodwill impairment analysis.
Amortization of Core Deposit Intangibles—Core deposit intangibles are being amortized on a non-pro rata basis over an estimated life of
Income Taxes— The Company files a consolidated federal income tax return and a consolidated Oklahoma state income tax return. Since 2014, the Bank has filed an Arkansas state income tax return related to loans in Arkansas. Due to the Merger, the Company or the Bank will now be required to make tax-related filings in the following states: Colorado, Maryland, Maine, New Mexico, New York, Florida, Washington and Idaho.
Deferred tax assets and liabilities are recognized for the estimated tax consequences attributable to differences between the financial statement carrying amounts of existing assets and liabilities and their respective tax bases and are recorded net to other assets on the Company’s consolidated balance sheets. The Company records uncertain tax positions in accordance with ASC Topic 740 “Income Taxes” on the basis of a two-step process whereby (1) the Company determines whether it is more likely than not that the tax positions will be sustained on the basis of the technical merits of the position and (2) for those tax positions that meet the more-likely-than-not recognition threshold, the Company recognizes the largest amount of tax benefit that is more than
79
Realization of net deferred tax assets is based upon the level of historical income and on estimates of future taxable income. Although realization is not assured, management believes it is more likely than not that all of the net deferred tax assets will be realized. Interest and/or penalties related to income taxes are reported as a component of income tax expense. Beginning in 2017, the income tax effects related to settlements of share-based payment awards are reported in earnings as an increase (or decrease) to income tax expense (see Note 11 - Income Taxes).
Stock-Based Compensation—The Company accounts for stock-based employee compensation plans using the fair value-based method of accounting. The expense associated with stock-based compensation is recognized over the vesting period of each individual arrangement. The fair value of restricted stock awards is based on the current market price on the date of grant.
Cash and Cash Equivalents—For purposes of reporting cash flows, cash and cash equivalents include cash and due from banks as well as federal funds sold that mature in three days or less.
Earnings Per Common Share—Basic earnings per common share are calculated using the two-class method. The two-class method provides that unvested share-based payment awards that contain nonforfeitable rights to dividends or dividend equivalents (whether paid or unpaid) are participating securities and shall be included in the computation of basic earnings per share.
Diluted earnings per common share is computed using the weighted-average number of shares determined for the basic earnings per common share computation plus the potential dilution that could occur if securities or other contracts to issue common stock were exercised or converted into common stock using the treasury stock method.
The following table illustrates the computation of basic and diluted earnings per share:
|
|
|
Year Ended December 31, |
|
|||||||||||||||||||||
|
|
|
2019 |
|
|
2018 |
|
|
2017 |
|
|||||||||||||||
|
|
|
Amount |
|
|
Per Share Amount |
|
|
Amount |
|
|
Per Share Amount |
|
|
Amount |
|
|
Per Share Amount |
|
||||||
|
|
|
(Amounts in thousands, except per share data) |
|
|||||||||||||||||||||
|
Net income |
|
$ |
|
|
|
|
|
|
|
$ |
|
|
|
|
|
|
|
$ |
|
|
|
|
|
|
|
Basic: |
|
|
|
|
|
|
|
|
|
|
|
|
|
|
|
|
|
|
|
|
|
|
|
|
|
Weighted average shares outstanding |
|
|
|
|
|
$ |
|
|
|
|
|
|
|
$ |
|
|
|
|
|
|
|
$ |
|
|
|
Diluted: |
|
|
|
|
|
|
|
|
|
|
|
|
|
|
|
|
|
|
|
|
|
|
|
|
|
Add incremental shares for: |
|
|
|
|
|
|
|
|
|
|
|
|
|
|
|
|
|
|
|
|
|
|
|
|
|
Effect of dilutive securities - options |
|
|
— |
|
|
|
|
|
|
|
— |
|
|
|
|
|
|
|
— |
|
|
|
|
|
|
Total |
|
|
|
|
|
$ |
|
|
|
|
|
|
|
$ |
|
|
|
|
|
|
|
$ |
|
|
As of December 31, 2019, all stock options have been exercised and there are
80
New Accounting Standards
Accounting Standards Updates (“ASU”)
ASU 2018-13 "Fair Value Measurement (Topic 820) - Changes to the Disclosure Requirements for Fair Value Measurement" eliminates the requirements to disclose the amount and reasons for transfers between Level 1 and Level 2 fair value methodology, the policy for the timing of transfers between levels and the valuation processes for Level 3 fair value measurements. The ASU requires the entity to disclose relevant quantitative information used to develop Level 3 fair value measurements. ASU 2018-13 will become effective for the Company on January 1, 2020 and is not expected to have a significant impact on the Company’s financial statements.
ASU 2018-02, “Income Statement-Reporting Comprehensive Income (Topic 220): Reclassification of Certain Tax Effects from Accumulated Other Comprehensive Income.” The amendments of ASU 2018-02 allow a reclassification from accumulated other comprehensive income to retained earnings for stranded tax effects resulting from the Tax Cuts and Jobs Act. ASU 2018-02 became effective for all entities beginning January 1, 2019 and did not have a significant impact on the Company’s financial statements.
ASU 2017-04, “Intangibles—Goodwill and Other (Topic 350).” ASU 2017-04 simplifies the subsequent measurement of goodwill by eliminating the second step of the goodwill impairment test, which required computing the implied fair value of goodwill.
Under the amendments in this update, an entity should perform its annual, or interim, goodwill impairment test by comparing the fair value of a reporting unit with its carrying amount. An impairment charge should be recognized for the amount by which the carrying amount exceeds the reporting unit’s fair value; however, the loss recognized should not exceed the total amount of goodwill allocated to that reporting unit. ASU 2017-04 will be effective for the Company on January 1, 2020 and is not expected to have a significant impact on the Company’s financial statements.
ASU 2017-01, “Business Combinations (Topic 805).” ASU 2017-01 is intended to clarify or correct unintended application of ASU 2014-09 “Revenue from Contract with Customers (Topic 606).” ASU 2017-01 clarifies the definition of a business with the objective of adding guidance to assist entities with evaluating whether transactions should be accounted for as acquisitions (or disposals) of assets or businesses. Additionally, the amendments in this update provide a more robust framework to assist entities in evaluating whether a set of assets and activities constitutes a business. Lastly, the amendments in this update narrow the definition of the term output so that the term is consistent with how outputs are described in Topic 606. ASU 2017-01 became effective for the Company on January 1, 2018 and did not have a significant impact on the Company’s financial statements.
ASU 2016-18, “Statement of Cash Flows (Topic 230) – Restricted Cash.” ASU 2016-18 requires the Statement of Cash Flows to explain the change during the period in the total of cash, cash equivalents and amounts generally described as restricted cash or restricted cash equivalents. Therefore, restricted cash or cash equivalents should be included with cash and cash equivalents when recording the beginning-of-period and end-of-period total amounts on the Statement of Cash Flows. ASU 2016-18 became effective for the Company on January 1, 2018 and did not have a significant impact on the Company’s financial statements.
ASU 2016-15, “Statement of Cash Flows (Topic 230) - Classification of Certain Cash Receipts and Cash Payments.” ASU 2016-15 addresses certain cash receipts and cash payments with the objective of reducing the existing diversity in practice. ASU 2016-15 became effective for the Company on January 1, 2018 and did not have a significant impact on the Company's financial statements.
ASU 2016-13, “Financial Instruments – Credit Losses (Topic 326)—Measurement of Credit Losses on Financial Instruments.” ASU 2016-13 requires a financial asset (or a group of financial assets) measured at amortized cost basis to be presented at the net amount expected to be collected. The measurement of current expected credit losses (“CECL”) is based on relevant information about past events, including historical experience, current conditions, and reasonable and supportable forecasts that affect the collectability of the reported amount. An entity must use judgment in determining the relevant information and estimation methods that are appropriate in its circumstances. Additionally, available for sale debt securities may realize value either through collection of contractual cash flows or through sale of the security at fair value. Therefore, the amendments limit the amount of the allowance for credit losses to the difference between amortized cost and fair value. ASU 2016-13 will be effective for the Company as of January 1, 2020. The Company’s implementation workgroup is comprised of individuals from various functional areas including credit, risk management, finance and information technology, among others, and meets periodically to discuss the latest developments and monitor implementation progress. During the fourth quarter of 2019, the Company continued running parallel processes, assessing disclosure requirements, and developing appropriate internal controls around the CECL process. The Company continues to evaluate the potential impact of ASU 2016-13 on the Company’s financial statements. Based on the Company’s loan portfolio at December 31, 2019 and current expectation of future economic conditions, the allowance for credit losses and the reserve for unfunded commitments is expected to be between $
81
merger. Warehouse Purchase Program loans are excluded from the “expected loss” model due to the extremely short life of mortgage warehouse loans. During the first quarter of 2020, the Company will continue to work on the integration of acquired loan data, run parallel processes, and internally test the model.
ASU 2016-09, “Compensation - Stock Compensation (Topic 718)—Improvements to Employee Share-Based Payment Accounting.” ASU 2016-09 simplifies the accounting for share-based awards paid to employees. The amended guidance 1) requires excess tax benefits and tax deficiencies on share-based awards payments to employees to be recognized directly to income tax expense or benefit in the Consolidated Statement of Income rather than to capital surplus; 2) requires excess tax benefits to be included as operating activities on the Consolidated Statements of Cash Flows; 3) provides entities with the option of making an accounting policy election to account for forfeitures of share-based payments as they occur instead of estimating the awards expected to be forfeited; and 4) changes the threshold to qualify for equity classification to permit withholdings up to the maximum statutory tax rate in the applicable jurisdiction. In addition, excess tax benefits and tax deficiencies are considered discrete items in the reporting period they occur and are not included in the estimate of an entity’s annual effective tax rate. The Company adopted ASU 2016-09 on January 1, 2017 and elected to recognize forfeitures as they occur. Implementation of ASU 2016-09 will add volatility to tax expense as the Company’s stock price changes. The adoption of ASU 2016-09 did not have a significant impact on the Company’s financial statements.
ASU 2016-02, "Leases (Topic 842)." ASU 2016-02 requires that lessees recognize lease assets and lease liabilities on the balance sheet and disclose key information about leasing arrangements. The requirements for lessors under ASU 2016-02 are largely unchanged from existing guidance, however certain necessary changes have been made to align with specific changes to lessee accounting and key aspects of the revenue recognition guidance (Topic 606).
The Company’s leases relate primarily to office space and banking centers. The Company identified and reviewed existing leases applicable to ASU 2016-02 and elected certain optional practical expedients: 1) not to reassess whether any expired or existing contracts are or contain leases, 2) not to reassess the lease classification for any expired or existing lease, 3) not to reassess initial direct cost for any existing leases and 4) not to separately identify lease and non-lease components. Additionally, the Company elected the short-term lease exemption for lease terms less than 12 months. The Company adopted ASU 2016-02 on January 1, 2019 using a modified retrospective transition approach without adjusting comparative periods. With the adoption of the new standard, the Company recognized right-of-use assets and lease liabilities of $
ASU 2016-01, “Financial Instruments—Overall (Subtopic 825-10)—Recognition and Measurement of Financial Assets and Financial Liabilities.” ASU 2016-01 addresses certain aspects of recognition, measurement, presentation, and disclosure of financial instruments. ASU 2016-01 (1) requires equity investments (except those accounted for under the equity method of accounting or those that result in consolidation of the investee) to be measured at fair value with changes in fair value recognized in net income; (2) simplifies the impairment assessment of equity investments without readily determinable fair values by requiring a qualitative assessment to identify impairment; (3) eliminates the requirement to disclose the fair value of financial instruments measured at amortized cost for entities that are not public business entities; (4) eliminates the requirement for public business entities to disclose the method(s) and significant assumptions used to estimate the fair value that is required to be disclosed for financial instruments measured at amortized cost on the balance sheet; (5) requires public business entities to use the exit price notion when measuring the fair value of financial instruments for disclosure purposes; (6) requires an entity to present separately in other comprehensive income the portion of the total change in the fair value of a liability resulting from a change in the instrument-specific credit risk when the entity has elected to measure the liability at fair value in accordance with the fair value option for financial instruments; (7) requires separate presentation of financial assets and financial liabilities by measurement category and form of financial asset (that is, securities or loans and receivables) on the balance sheet or the accompanying notes to the financial statements; and (8) clarifies that an entity should evaluate the need for a valuation allowance on a deferred tax asset related to available-for-sale securities in combination with the entity’s other deferred tax assets. The amendments in this update affect all entities that hold financial assets or owe financial liabilities. ASU 2016-01 became effective for the Company on January 1, 2018, and did not have a significant financial impact on the Company’s financial statements.
ASU 2014-09, “Revenue from Contracts with Customers (Topic 606).” ASU 2014-09 supersedes the revenue recognition requirements in Revenue Recognition (Topic 605), and most industry-specific guidance throughout the Industry Topics of the Codification. The core principle of ASU 2014-09 is that an entity should recognize revenue to depict the transfer of promised goods or services to customers in an amount that reflects the consideration to which the entity expects to be entitled in exchange for those goods or services. In addition, the FASB has issued targeted updates to clarify specific implementation issues of ASU 2014-09. These updates include ASU 2016-08 - Principal versus Agent Considerations (Reporting Revenue Gross versus Net), ASU 2016-10 - Identifying Performance Obligations and Licensing, ASU 2016-12 - Narrow-Scope Improvements and Practical Expedients and ASU 2016-20 - Technical Corrections and Improvements to Topic 606 - Revenue from Contract with Customers. These amendments do not change the core principles in ASU 2014-09. The Company’s primary sources of revenue consist of net interest income on financial assets and liabilities, which are not within the scope of ASU 2014-09. The Company completed its overall assessment of revenue
82
streams and review of related contracts potentially affected by the ASU. Based on this assessment, the Company concluded the ASU did not significantly change the method in which the Company currently recognizes revenue. ASU 2014-09 became effective for the Company on January 1, 2018 and did not have a significant financial impact on the Company’s financial statements.
The following provides further detail on other revenue streams within noninterest income that are within the scope of this update.
Nonsufficient Funds (NSF) Fees – NSF fees are generated on a transactional basis from accounts with nonsufficient funds. Revenue is recognized once the performance obligation is satisfied.
Credit Card, Debit Card and ATM Card Income – Credit card and debit card income primarily consists of interchange fees earned on a transactional basis through card payment networks. ATM card income is generated when the Company’s card holders use foreign ATMs or when non-customers utilize the Company’s ATMs. Revenue is recognized after the performance obligation is satisfied generally after the transaction is completed.
Service Charges on Deposit Accounts – Service charges on deposit accounts consist of account maintenance or transaction-based fees. The Company’s performance obligation is satisfied over a period of time for account maintenance and at the time of service for transaction-based fees. Revenue is recognized after the performance obligation is satisfied.
Trust Income – Trust income represents monthly income from trust and estate administration, investment management services, and employee benefits services. The Company’s performance obligation is generally performed over a period of time and varies by the type of trust services being provided to the customer. Revenue is recognized after the performance obligation is satisfied.
Brokerage Income – Brokerage income represents fees and commissions from asset management services and transaction processing. The Company’s performance obligation is generally performed over a period of time for asset management services and at a point in time for transaction processing. Revenue is recognized after the performance obligation is satisfied.
2. ACQUISITIONS
Acquisitions are an integral part of the Company’s growth strategy. All acquisitions were accounted for using the acquisition method of accounting. Accordingly, the assets and liabilities of the acquired entities were recorded at their fair values at the acquisition date. The excess of the purchase price over the estimated fair value of the net assets for tax-free acquisitions was recorded as goodwill, none of which is deductible for tax purposes. The excess of the purchase price over the estimated fair value of the net assets for taxable acquisitions was also recorded as goodwill, and is deductible for tax purposes. The identified core deposit intangibles for each acquisition are being amortized using a non-pro rata basis over an estimated life of
The measurement period for the Company to determine the fair values of acquired identifiable assets and assumed liabilities will end at the earlier of (1) twelve months from the date of the acquisition or (2) as soon as the Company receives the information it was seeking about facts and circumstances that existed as of the acquisition date or learns that more information is not obtainable. The following acquisitions were completed on the dates indicated:
2019 Acquisition
Merger with LegacyTexas Financial Group, Inc. — On November 1, 2019, LegacyTexas Financial Group, Inc. merged with Prosperity Bancshares and LegacyTexas Bank merged with Prosperity Bank. LegacyTexas was headquartered in Plano, Texas and operated
Pursuant to the terms of the merger agreement, Prosperity issued
83
The assets and liabilities of LegacyTexas were recorded on the consolidated balance sheet at estimated fair value on the acquisition date. As of December 31, 2019, the following table presents the amounts recorded on the consolidated balance sheet on the acquisition date (dollars in thousands).
|
Fair value of consideration paid: |
|
|
|
|
|
Common stock issued ( |
|
$ |
|
|
|
Cash |
|
|
|
|
|
Total consideration paid |
|
$ |
|
|
|
|
|
|
|
|
|
Fair value of assets acquired: |
|
|
|
|
|
Cash and due from banks |
|
$ |
|
|
|
Securities held to maturity |
|
|
|
|
|
Loans held for sale |
|
|
|
|
|
Loans held for investment |
|
|
|
|
|
Loans held for investment - Warehouse Purchase Program |
|
|
|
|
|
Bank premises and equipment |
|
|
|
|
|
Other real estate owned |
|
|
|
|
|
Core deposit intangibles |
|
|
|
|
|
Federal Home Loan Bank stock |
|
|
|
|
|
Bank owned life insurance and other assets |
|
|
|
|
|
Total assets acquired |
|
|
|
|
|
|
|
|
|
|
|
Fair value of liabilities assumed: |
|
|
|
|
|
Deposits |
|
|
|
|
|
Other borrowings |
|
|
|
|
|
Securities sold under repurchase agreements |
|
|
|
|
|
Trust preferred securities |
|
|
|
|
|
Subordinated notes |
|
|
|
|
|
Other liabilities |
|
|
|
|
|
Total liabilities assumed |
|
|
|
|
|
Fair value of net assets acquired |
|
$ |
|
|
|
Goodwill resulting from acquisition |
|
$ |
|
|
As of December 31, 2019, the Company recognized goodwill of $
Merger Related Expenses: The Company incurred $
Pro Forma Information: Operations of LegacyTexas have been included in the consolidated financial statements since November 1, 2019. The amount of revenue (net interest income plus non-interest income) derived from LegacyTexas since the acquisition date included in the consolidated income statement for the year ended December 31, 2019 was approximately $
The following pro forma information presents the results of operations for the years ended December 31, 2019 and 2018, as if the Merger had occurred on January 1, 2018 (dollars in thousands, except per share amounts).
|
|
|
|
2019 |
|
|
|
2018 |
|
|
Net interest income |
|
$ |
|
|
|
$ |
|
|
|
Net income |
|
|
|
|
|
|
|
|
|
Basic earnings per share |
|
|
|
|
|
|
|
|
|
Diluted earnings per share |
|
|
|
|
|
|
|
|
84
The above pro forma results are presented for illustrative purposes and are not intended to represent or be indicative of the actual results of operations of the merged companies that would have been achieved had the Merger occurred on January 1, 2018, nor are they intended to represent or be indicative of future results of operations. The pro forma results do not include expected operating cost savings as a result of the acquisition. These pro forma results require significant estimates and judgments particularly as it relates to valuation and accretion of income associated with acquired loans. Pro forma adjustments principally included:
|
|
• |
Reversing interest income and interest expense as previously recorded by LegacyTexas and recording interest income and interest expense based on impact of estimated fair values of the acquired interest-earning assets and assumed interest-bearing liabilities; |
|
|
• |
Reversing core deposit intangible amortization as previously recorded by LegacyTexas and recording amortization expense as it relates to the core deposit intangible recognized from the acquisition; and |
|
|
• |
Reporting merger related expenses as if they were incurred in 2018. |
Acquired Loans
Acquired loans were preliminarily recorded at fair value based on a discounted cash flow valuation methodology that considers, among other things, interest rates, projected default rates, loss given default and recovery rates. During the valuation process, the Company identified PCI and Non-PCI loans in the acquired loan portfolios. PCI loan identification considers the following factors: payment history and past due status, debt service coverage, loan grading, collateral values and other factors that may indicate deterioration of credit quality since origination. Non-PCI loan identification considers the following factors: account types, remaining terms, annual interest rates or coupons, current market rates, interest types, past delinquencies, timing of principal and interest payments, loan to value ratios, loss exposures and remaining balances. Accretion of purchased discounts on PCI loans will be based on estimated future cash flows, regardless of contractual maturities. Accretion of purchased discounts on Non-PCI loans will be recognized on a level-yield basis based on contractual maturity of individual loans.
PCI Loans. The recorded investment in PCI loans included in the consolidated balance sheets and the related outstanding balances at December 31, 2019 and 2018 are presented in the table below. The outstanding balance represents the total amount owed as of December 31, 2019 and 2018.
|
|
|
|
|
|
|
|
|
|
|
|
|
December 31, 2019 |
|
|
December 31, 2018 |
|
||
|
|
|
(Dollars in thousands) |
|
|||||
|
PCI loans: |
|
|
|
|
|
|
|
|
|
Outstanding balance |
|
$ |
|
|
|
$ |
|
|
|
Discount |
|
|
( |
) |
|
|
( |
) |
|
Recorded investment |
|
$ |
|
|
|
$ |
|
|
Changes in the accretable yield for PCI loans for the years ended December 31, 2019 and 2018 were as follows:
|
|
|
Year Ended December 31, |
|
|||||
|
|
|
2019 |
|
|
2018 |
|
||
|
|
|
(Dollars in thousands) |
|
|||||
|
Balance at beginning of period |
|
$ |
|
|
|
$ |
|
|
|
Additions |
|
|
|
|
|
|
— |
|
|
Reclassifications from nonaccretable |
|
|
|
|
|
|
|
|
|
Accretion |
|
|
( |
) |
|
|
( |
) |
|
Balance at December 31 |
|
$ |
|
|
|
$ |
|
|
Income recognition on PCI loans is subject to the Company’s ability to reasonably estimate both the timing and amount of future cash flows. PCI loans for which the Company is accruing interest income are not considered non-performing or impaired. The non-accretable difference represents contractual principal and interest the Company does not expect to collect.
85
Non-PCI Loans. The recorded investment in Non-PCI loans included in the consolidated balance sheets and the related outstanding balances at December 31, 2019 and 2018 are presented in the table below. The outstanding balance represents the total amount owed as of December 31, 2019 and 2018.
|
|
|
|
|
|
|
|
|
|
|
|
|
December 31, 2019 |
|
|
December 31, 2018 |
|
||
|
|
|
(Dollars in thousands) |
|
|||||
|
Non-PCI loans: |
|
|
|
|
|
|
|
|
|
Outstanding balance |
|
$ |
|
|
|
$ |
|
|
|
Discount |
|
|
( |
) |
|
|
( |
) |
|
Recorded investment |
|
$ |
|
|
|
$ |
|
|
Changes in the discount accretion for Non-PCI loans for the years ended December 31, 2019 and 2018 were as follows:
|
|
|
Year Ended December 31, |
|
|||||
|
|
|
2019 |
|
|
2018 |
|
||
|
|
|
(Dollars in thousands) |
|
|||||
|
Balance at beginning of period |
|
$ |
|
|
|
$ |
|
|
|
Additions |
|
|
|
|
|
|
— |
|
|
Accretion charge-offs |
|
|
( |
) |
|
|
( |
) |
|
Accretion |
|
|
( |
) |
|
|
( |
) |
|
Balance at December 31 |
|
$ |
|
|
|
$ |
|
|
At December 31, 2019, the Company had $
3. GOODWILL AND CORE DEPOSIT INTANGIBLES
Changes in the carrying amount of the Company’s goodwill and core deposit intangibles for fiscal years 2019 and 2018 were as follows:
|
|
|
Goodwill |
|
|
Core Deposit Intangibles |
|
||
|
|
|
(Dollars in thousands) |
|
|||||
|
Balance as of December 31, 2017 |
|
$ |
|
|
|
$ |
|
|
|
Less: |
|
|
|
|
|
|
|
|
|
Amortization |
|
|
— |
|
|
|
( |
) |
|
Balance as of December 31, 2018 |
|
|
|
|
|
|
|
|
|
Less: |
|
|
|
|
|
|
|
|
|
Amortization |
|
|
— |
|
|
|
( |
) |
|
Add: |
|
|
|
|
|
|
|
|
|
LegacyTexas Merger |
|
|
|
|
|
|
|
|
|
Balance as of December 31, 2019 |
|
$ |
|
|
|
$ |
|
|
Management performs an evaluation annually, and more frequently if a triggering event occurs, of whether any impairment of the goodwill and other intangibles has occurred. If any such impairment is determined, a write down is recorded. As of December 31, 2019, there was
86
Core deposit intangibles are being amortized on a non-pro rata basis over their estimated lives, which the Company believes is between
|
2020 |
|
$ |
|
|
|
2021 |
|
|
|
|
|
2022 |
|
|
|
|
|
2023 |
|
|
|
|
|
Thereafter |
|
|
|
|
|
Total |
|
$ |
|
|
4. CASH AND DUE FROM BANKS
The Federal Reserve Bank requires banks to maintain minimum average reserve balances. The amount of the required reserve balance for the Bank was $
5. SECURITIES
The amortized cost and fair value of investment securities were as follows:
|
|
|
December 31, 2019 |
|
|||||||||||||
|
|
|
Amortized Cost |
|
|
Gross Unrealized Gains |
|
|
Gross Unrealized Losses |
|
|
Fair Value |
|
||||
|
|
|
(Dollars in thousands) |
|
|||||||||||||
|
Available for Sale |
|
|
|
|
|
|
|
|
|
|
|
|
|
|
|
|
|
States and political subdivisions |
|
$ |
|
|
|
$ |
|
|
|
$ |
— |
|
|
$ |
|
|
|
Collateralized mortgage obligations |
|
|
|
|
|
|
|
|
|
|
( |
) |
|
|
|
|
|
Mortgage-backed securities |
|
|
|
|
|
|
|
|
|
|
( |
) |
|
|
|
|
|
Total |
|
$ |
|
|
|
$ |
|
|
|
$ |
( |
) |
|
$ |
|
|
|
Held to Maturity |
|
|
|
|
|
|
|
|
|
|
|
|
|
|
|
|
|
U.S. Treasury securities and obligations of U.S. Government agencies |
|
$ |
|
|
|
$ |
|
|
|
$ |
— |
|
|
$ |
|
|
|
States and political subdivisions |
|
|
|
|
|
|
|
|
|
|
( |
) |
|
|
|
|
|
Collateralized mortgage obligations |
|
|
|
|
|
|
|
|
|
|
( |
) |
|
|
|
|
|
Mortgage-backed securities |
|
|
|
|
|
|
|
|
|
|
( |
) |
|
|
|
|
|
Total |
|
$ |
|
|
|
$ |
|
|
|
$ |
( |
) |
|
$ |
|
|
|
|
|
December 31, 2018 |
|
|||||||||||||
|
|
|
Amortized Cost |
|
|
Gross Unrealized Gains |
|
|
Gross Unrealized Losses |
|
|
Fair Value |
|
||||
|
|
|
(Dollars in thousands) |
|
|||||||||||||
|
Available for Sale |
|
|
|
|
|
|
|
|
|
|
|
|
|
|
|
|
|
States and political subdivisions |
|
$ |
|
|
|
$ |
|
|
|
$ |
— |
|
|
$ |
|
|
|
Collateralized mortgage obligations |
|
|
|
|
|
|
|
|
|
|
( |
) |
|
|
|
|
|
Mortgage-backed securities |
|
|
|
|
|
|
|
|
|
|
( |
) |
|
|
|
|
|
Total |
|
$ |
|
|
|
$ |
|
|
|
$ |
( |
) |
|
$ |
|
|
|
Held to Maturity |
|
|
|
|
|
|
|
|
|
|
|
|
|
|
|
|
|
U.S. Treasury securities and obligations of U.S. Government agencies |
|
$ |
|
|
|
$ |
— |
|
|
$ |
( |
) |
|
$ |
|
|
|
States and political subdivisions |
|
|
|
|
|
|
|
|
|
|
( |
) |
|
|
|
|
|
Collateralized mortgage obligations |
|
|
|
|
|
|
|
|
|
|
( |
) |
|
|
|
|
|
Mortgage-backed securities |
|
|
|
|
|
|
|
|
|
|
( |
) |
|
|
|
|
|
Total |
|
$ |
|
|
|
$ |
|
|
|
$ |
( |
) |
|
$ |
|
|
87
Management evaluates securities for other-than-temporary impairment at least on a quarterly basis, and more frequently when economic or market conditions warrant such an evaluation. The investment securities portfolio is evaluated for OTTI by segregating the portfolio into
In determining OTTI, management considers many factors, including: (1) the length of time and the extent to which the fair value has been less than cost, (2) the financial condition and near-term prospects of the issuer, (3) whether the market decline was affected by macroeconomic conditions and (4) whether the entity has the intent to sell the debt security or more likely than not will be required to sell the debt security before its anticipated recovery. The assessment of whether an other-than-temporary decline exists involves a high degree of subjectivity and judgment and is based on the information available to management at the time of such determination.
When OTTI occurs, the amount of the other-than-temporary impairment recognized in earnings depends on whether an entity intends to sell the security or more likely than not will be required to sell the security before recovery of its amortized cost basis less any current-period credit loss.
Management has the ability and intent to hold the securities classified as held-to-maturity until they mature, at which time the Company will receive full value for the securities. Furthermore, as of December 31, 2019, management does not have the intent to sell any of the securities classified as available for sale before a recovery of cost. In addition, management believes it is more likely than not that the Company will not be required to sell any of its investment securities before a recovery of cost. The unrealized losses are largely due to increases in market interest rates over the yields available at the time the underlying securities were purchased. The fair value is expected to recover as the securities approach their maturity date or repricing date or if market yields for such investments decline. Management does not believe any of the securities are impaired due to reasons of credit quality. Accordingly, as of December 31, 2019, management believes any impairment in the Company’s securities is temporary and
Securities with unrealized losses segregated by length of time such securities have been in a continuous loss position were as follows:
|
|
|
December 31, 2019 |
|
|||||||||||||||||||||
|
|
|
Less than 12 Months |
|
|
12 Months or More |
|
|
Total |
|
|||||||||||||||
|
|
|
Estimated Fair Value |
|
|
Unrealized Losses |
|
|
Estimated Fair Value |
|
|
Unrealized Losses |
|
|
Estimated Fair Value |
|
|
Unrealized Losses |
|
||||||
|
|
|
(Dollars in thousands) |
|
|||||||||||||||||||||
|
Available for Sale |
|
|
|
|
|
|
|
|
|
|
|
|
|
|
|
|
|
|
|
|
|
|
|
|
|
Collateralized mortgage obligations |
|
$ |
|
|
|
$ |
( |
) |
|
$ |
|
|
|
$ |
( |
) |
|
$ |
|
|
|
$ |
( |
) |
|
Mortgage-backed securities |
|
|
|
|
|
|
( |
) |
|
|
|
|
|
|
— |
|
|
|
|
|
|
|
( |
) |
|
Total |
|
$ |
|
|
|
$ |
( |
) |
|
$ |
|
|
|
$ |
( |
) |
|
$ |
|
|
|
$ |
( |
) |
|
Held to Maturity |
|
|
|
|
|
|
|
|
|
|
|
|
|
|
|
|
|
|
|
|
|
|
|
|
|
U.S. Treasury securities and obligations of U.S. Government agencies |
|
$ |
— |
|
|
$ |
— |
|
|
$ |
— |
|
|
$ |
— |
|
|
$ |
— |
|
|
$ |
— |
|
|
States and political subdivisions |
|
|
|
|
|
|
( |
) |
|
|
|
|
|
|
( |
) |
|
|
|
|
|
|
( |
) |
|
Collateralized mortgage obligations |
|
|
|
|
|
|
( |
) |
|
|
— |
|
|
|
— |
|
|
|
|
|
|
|
( |
) |
|
Mortgage-backed securities |
|
|
|
|
|
|
( |
) |
|
|
|
|
|
|
( |
) |
|
|
|
|
|
|
( |
) |
|
Total |
|
$ |
|
|
|
$ |
( |
) |
|
$ |
|
|
|
$ |
( |
) |
|
$ |
|
|
|
$ |
( |
) |
88
|
|
|
December 31, 2018 |
|
|||||||||||||||||||||
|
|
|
Less than 12 Months |
|
|
12 Months or More |
|
|
Total |
|
|||||||||||||||
|
|
|
Estimated Fair Value |
|
|
Unrealized Losses |
|
|
Estimated Fair Value |
|
|
Unrealized Losses |
|
|
Estimated Fair Value |
|
|
Unrealized Losses |
|
||||||
|
|
|
(Dollars in thousands) |
|
|||||||||||||||||||||
|
Available for Sale |
|
|
|
|
|
|
|
|
|
|
|
|
|
|
|
|
|
|
|
|
|
|
|
|
|
Collateralized mortgage obligations |
|
$ |
|
|
|
$ |
— |
|
|
$ |
|
|
|
$ |
( |
) |
|
$ |
|
|
|
$ |
( |
) |
|
Mortgage-backed securities |
|
|
|
|
|
|
( |
) |
|
|
|
|
|
|
( |
) |
|
|
|
|
|
|
( |
) |
|
Total |
|
$ |
|
|
|
$ |
( |
) |
|
$ |
|
|
|
$ |
( |
) |
|
$ |
|
|
|
$ |
( |
) |
|
Held to Maturity |
|
|
|
|
|
|
|
|
|
|
|
|
|
|
|
|
|
|
|
|
|
|
|
|
|
U.S. Treasury securities and obligations of U.S. Government agencies |
|
$ |
|
|
|
$ |
( |
) |
|
$ |
|
|
|
$ |
( |
) |
|
$ |
|
|
|
$ |
( |
) |
|
States and political subdivisions |
|
|
|
|
|
|
( |
) |
|
|
|
|
|
|
( |
) |
|
|
|
|
|
|
( |
) |
|
Collateralized mortgage obligations |
|
|
— |
|
|
|
— |
|
|
|
|
|
|
|
( |
) |
|
|
|
|
|
|
( |
) |
|
Mortgage-backed securities |
|
|
|
|
|
|
( |
) |
|
|
|
|
|
|
( |
) |
|
|
|
|
|
|
( |
) |
|
Total |
|
$ |
|
|
|
$ |
( |
) |
|
$ |
|
|
|
$ |
( |
) |
|
$ |
|
|
|
$ |
( |
) |
At December 31, 2019 and 2018 there were
The amortized cost and fair value of investment securities at December 31, 2019, by contractual maturity, are shown below. Actual maturities will differ from contractual maturities because borrowers may have the right to call or prepay obligations at any time with or without call or prepayment penalties.
|
|
|
Held to Maturity |
|
|
Available for Sale |
|
||||||||||
|
|
|
Amortized Cost |
|
|
Fair Value |
|
|
Amortized Cost |
|
|
Fair Value |
|
||||
|
|
|
(Dollars in thousands) |
|
|||||||||||||
|
Due in one year or less |
|
$ |
|
|
|
$ |
|
|
|
$ |
|
|
|
$ |
|
|
|
Due after one year through five years |
|
|
|
|
|
|
|
|
|
|
— |
|
|
|
— |
|
|
Due after five years through ten years |
|
|
|
|
|
|
|
|
|
|
— |
|
|
|
— |
|
|
Due after ten years |
|
|
|
|
|
|
|
|
|
|
— |
|
|
|
— |
|
|
Subtotal |
|
|
|
|
|
|
|
|
|
|
|
|
|
|
|
|
|
Mortgage-backed securities and collateralized mortgage obligations |
|
|
|
|
|
|
|
|
|
|
|
|
|
|
|
|
|
Total |
|
$ |
|
|
|
$ |
|
|
|
$ |
|
|
|
$ |
|
|
The Company recorded
At December 31, 2019 and 2018, the Company did not own securities of any one issuer (other than the U.S. government and its agencies) for which aggregate adjusted cost exceeded
Securities with an amortized cost of $
89
6. LOANS AND ALLOWANCE FOR CREDIT LOSSES
The loan portfolio consists of various types of loans made principally to borrowers located within the states of Texas and Oklahoma and is categorized by major type as follows:
|
|
|
December 31, |
|
|||||
|
|
|
2019 |
|
|
2018 |
|
||
|
|
|
(Dollars in thousands) |
|
|||||
|
Residential mortgage loans held for sale |
|
$ |
|
|
|
$ |
|
|
|
|
|
|
|
|
|
|
|
|
|
Commercial and industrial |
|
|
|
|
|
|
|
|
|
Real estate: |
|
|
|
|
|
|
|
|
|
Construction, land development and other land loans |
|
|
|
|
|
|
|
|
|
1-4 family residential (including home equity) |
|
|
|
|
|
|
|
|
|
Commercial real estate (including multi-family residential) |
|
|
|
|
|
|
|
|
|
Farmland |
|
|
|
|
|
|
|
|
|
Agriculture |
|
|
|
|
|
|
|
|
|
Consumer and other |
|
|
|
|
|
|
|
|
|
Total loans held for investment, excluding Warehouse Purchase Program |
|
|
|
|
|
|
|
|
|
Warehouse Purchase Program |
|
|
|
|
|
|
— |
|
|
Total loans, including Warehouse Purchase Program |
|
$ |
|
|
|
$ |
|
|
Loan Origination/Risk Management. The Company has certain lending policies and procedures in place that are designed to maximize loan income within an acceptable level of risk. Management reviews and approves these policies and procedures on a regular basis. A reporting system supplements the review process by providing management with frequent reports related to loan production, loan quality, concentrations of credit, loan delinquencies and non-performing and potential problem loans. Diversification in the loan portfolio is a means of managing risk associated with fluctuations in economic conditions. Loans to borrowers with aggregate debt relationships over $
The Company maintains an independent loan review department that reviews and validates the credit risk program on a periodic basis. Results of these reviews are presented to management. The loan review process complements and reinforces the risk identification and assessment decisions made by lenders and credit personnel, as well as the Company’s policies and procedures.
(i) Commercial and Industrial Loans. In nearly all cases, the Company’s commercial loans are made in the Company’s market areas and are underwritten on the basis of the borrower’s ability to service the debt from income. As a general practice, the Company takes as collateral a lien, as appropriate, on any short term assets, available real estate, equipment or other assets owned by the borrower and obtains a personal guaranty of a principal. Working capital loans are primarily collateralized by short-term assets whereas term loans are primarily collateralized by long-term assets. In general, commercial loans involve more credit risk than residential mortgage loans and commercial mortgage loans and, therefore, usually yield a higher return. The increased risk in commercial loans is due to the type of collateral securing these loans as well as the expectation that commercial loans generally will be serviced principally from the operations of the business, and those operations may not be successful. Historical trends have shown these types of loans to have higher delinquencies than mortgage loans. As a result of these additional complexities, variables and risks, commercial loans require more thorough underwriting and servicing than other types of loans.
(ii) Commercial Real Estate. The Company makes commercial real estate loans collateralized by owner-occupied and nonowner-occupied real estate to finance the purchase of real estate. The Company’s commercial real estate loans are collateralized by first liens on real estate, typically have variable interest rates (or
(iii) 1-4 Family Residential Loans. The Company’s lending activities also include the origination of 1-4 family residential mortgage loans (including home equity loans) collateralized by owner-occupied and nonowner-occupied residential properties located
90
in the Company’s market areas. The Company offers a variety of mortgage loan portfolio products which generally are amortized over five to
(iv) Construction, Land Development and Other Land Loans. The Company makes loans to finance the construction of residential and nonresidential properties. Construction loans generally are collateralized by first liens on real estate and have floating interest rates. The Company conducts periodic inspections, either directly or through an agent, prior to approval of periodic draws on these loans. Underwriting guidelines similar to those described above are also used in the Company’s construction lending activities, with heightened analysis of construction and/or development costs. Construction loans involve additional risks attributable to the fact that loan funds are advanced upon the security of a project under construction, and the project is of uncertain value prior to its completion. Because of uncertainties inherent in estimating construction costs, the market value of the completed project and the effects of governmental regulation on real property, it can be difficult to accurately evaluate the total funds required to complete a project and the related loan to value ratio. As a result of these uncertainties, construction lending often involves the disbursement of substantial funds with repayment dependent, in part, on the success of the ultimate project rather than the ability of a borrower or guarantor to repay the loan. If the Company is forced to foreclose on a project prior to completion, the Company may not be able to recover all of the unpaid portion of the loan. In addition, the Company may be required to fund additional amounts to complete a project and may have to hold the property for an indeterminate period of time. Although the Company has underwriting procedures designed to identify what it believes to be acceptable levels of risks in construction lending, these procedures may not prevent losses from the risks described above.
(v) Warehouse Purchase Program. The Company acquired the Warehouse Purchase Program as part of the merger with LegacyTexas. The Warehouse Purchase Program allows unaffiliated mortgage originators (“Clients”) to close 1-4 family real estate loans in their own name and manage their cash flow needs until the loans are sold to investors. The Company's Clients are strategically targeted for their experienced management teams and analyzed for the expected profitability of each Client’s business model over the long term. The Clients are located across the U.S. and originate mortgage loans primarily through traditional retail and/or wholesale business models using underwriting standards consistent with the United States government-sponsored enterprises, “Agencies” such as Fannie Mae, the private investors to which the mortgage loans are ultimately sold and the mortgage insurers.
Although not subject to any legally binding commitment, when the Company makes a purchase decision, it acquires a
(vi) Agriculture Loans. The Company provides agriculture loans for short-term livestock and crop production, including rice, cotton, milo and corn, farm equipment financing and agriculture real estate financing. The Company evaluates agriculture borrowers primarily based on their historical profitability, level of experience in their particular agriculture industry segment, overall financial capacity and the availability of secondary collateral to withstand economic and natural variations common to the industry. Because agriculture loans present a higher level of risk associated with events caused by nature, the Company routinely makes on-site visits and inspections in order to identify and monitor such risks.
(vii) Consumer Loans. Consumer loans made by the Company include direct “A”-credit automobile loans, recreational vehicle loans, boat loans, home improvement loans, personal loans (collateralized and uncollateralized), credit cards and deposit account collateralized loans. The terms of these loans typically range from
91
|
|
|
One Year or Less |
|
|
After One Year Through Five Years |
|
|
After Five Years |
|
|
Total |
|
||||
|
|
|
(Dollars in thousands) |
|
|||||||||||||
|
Commercial and industrial |
|
$ |
|
|
|
$ |
|
|
|
$ |
|
|
|
$ |
|
|
|
Real estate: |
|
|
|
|
|
|
|
|
|
|
|
|
|
|
|
|
|
Construction, land development and other land loans |
|
|
|
|
|
|
|
|
|
|
|
|
|
|
|
|
|
1-4 family residential (includes home equity) |
|
|
|
|
|
|
|
|
|
|
|
|
|
|
|
|
|
Commercial (includes multi-family residential) |
|
|
|
|
|
|
|
|
|
|
|
|
|
|
|
|
|
Agriculture (includes farmland) |
|
|
|
|
|
|
|
|
|
|
|
|
|
|
|
|
|
Consumer and other |
|
|
|
|
|
|
|
|
|
|
|
|
|
|
|
|
|
Total |
|
$ |
|
|
|
$ |
|
|
|
$ |
|
|
|
$ |
|
|
|
Loans with a predetermined interest rate |
|
$ |
|
|
|
$ |
|
|
|
$ |
|
|
|
$ |
|
|
|
Loans with a floating interest rate |
|
|
|
|
|
|
|
|
|
|
|
|
|
|
|
|
|
Total |
|
$ |
|
|
|
$ |
|
|
|
$ |
|
|
|
$ |
|
|
Concentrations of Credit. Most of the Company’s lending activity occurs within the states of Texas and Oklahoma. Commercial real estate loans, 1-4 family residential loans and construction, land development and other land loans make up
Related Party Loans. As of December 31, 2019 and 2018, loans outstanding to directors, officers and their affiliates totaled $
An analysis of activity with respect to these related-party loans is as follows:
|
|
|
As of and for the year ended December 31, |
|
|||||
|
|
|
2019 |
|
|
2018 |
|
||
|
|
|
(Dollars in thousands) |
|
|||||
|
Beginning balance on January 1 |
|
$ |
|
|
|
$ |
|
|
|
New loans |
|
|
|
|
|
|
|
|
|
Transfers |
|
|
|
|
|
|
— |
|
|
Repayments |
|
|
( |
) |
|
|
( |
) |
|
Ending balance |
|
$ |
|
|
|
$ |
|
|
Nonperforming Assets and Nonaccrual and Past Due Loans. The Company has several procedures in place to assist it in maintaining the overall quality of its loan portfolio. The Company has established underwriting guidelines to be followed by its officers, and the Company also monitors its delinquency levels for any negative or adverse trends. Nevertheless, the Company’s loan portfolio could become subject to increasing pressures from deteriorating borrower credit due to general economic conditions.
The Company generally places a loan on nonaccrual status and ceases accruing interest when the payment of principal or interest is delinquent for 90 days, or earlier in some cases, unless the loan is in the process of collection and the underlying collateral fully supports the carrying value of the loan.
The Company requires appraisals on loans collateralized by real estate. With respect to potential problem loans, an evaluation of the borrower’s overall financial condition is made to determine the need, if any, for possible writedowns or appropriate additions to the allowance for credit losses.
92
An aging analysis of past due loans, segregated by category of loan, is presented below:
|
|
|
December 31, 2019 |
|
|||||||||||||||||||||
|
|
|
Loans Past Due and Still Accruing |
|
|
|
|
|
|
|
|
|
|
|
|
|
|||||||||
|
|
|
30-89 Days |
|
|
90 or More Days |
|
|
Total Past Due Loans |
|
|
Nonaccrual Loans |
|
|
Current Loans |
|
|
Total Loans |
|
||||||
|
|
|
(Dollars in thousands) |
|
|||||||||||||||||||||
|
Construction, land development and other land loans |
|
$ |
|
|
|
$ |
— |
|
|
$ |
|
|
|
$ |
|
|
|
$ |
|
|
|
$ |
|
|
|
Warehouse Purchase Program loans |
|
|
— |
|
|
|
— |
|
|
|
— |
|
|
|
— |
|
|
|
|
|
|
|
|
|
|
Agriculture and agriculture real estate (includes farmland) |
|
|
|
|
|
|
— |
|
|
|
|
|
|
|
|
|
|
|
|
|
|
|
|
|
|
1-4 family (includes home equity) (1) |
|
|
|
|
|
|
|
|
|
|
|
|
|
|
|
|
|
|
|
|
|
|
|
|
|
Commercial real estate (includes multi-family residential) |
|
|
|
|
|
|
— |
|
|
|
|
|
|
|
|
|
|
|
|
|
|
|
|
|
|
Commercial and industrial |
|
|
|
|
|
|
— |
|
|
|
|
|
|
|
|
|
|
|
|
|
|
|
|
|
|
Consumer and other |
|
|
|
|
|
|
— |
|
|
|
|
|
|
|
|
|
|
|
|
|
|
|
|
|
|
Total |
|
$ |
|
|
|
$ |
|
|
|
$ |
|
|
|
$ |
|
|
|
$ |
|
|
|
$ |
|
|
|
|
|
December 31, 2018 |
|
|||||||||||||||||||||
|
|
|
Loans Past Due and Still Accruing |
|
|
|
|
|
|
|
|
|
|
|
|
|
|||||||||
|
|
|
30-89 Days |
|
|
90 or More Days |
|
|
Total Past Due Loans |
|
|
Nonaccrual Loans |
|
|
Current Loans |
|
|
Total Loans |
|
||||||
|
|
|
(Dollars in thousands) |
|
|||||||||||||||||||||
|
Construction, land development and other land loans |
|
$ |
|
|
|
$ |
|
|
|
$ |
|
|
|
$ |
|
|
|
$ |
|
|
|
$ |
|
|
|
Agriculture and agriculture real estate (includes farmland) |
|
|
|
|
|
|
— |
|
|
|
|
|
|
|
|
|
|
|
|
|
|
|
|
|
|
1-4 family (includes home equity) (1) |
|
|
|
|
|
|
|
|
|
|
|
|
|
|
|
|
|
|
|
|
|
|
|
|
|
Commercial real estate (includes multi-family residential) |
|
|
|
|
|
|
— |
|
|
|
|
|
|
|
|
|
|
|
|
|
|
|
|
|
|
Commercial and industrial |
|
|
|
|
|
|
|
|
|
|
|
|
|
|
|
|
|
|
|
|
|
|
|
|
|
Consumer and other |
|
|
|
|
|
|
— |
|
|
|
|
|
|
|
|
|
|
|
|
|
|
|
|
|
|
Total |
|
$ |
|
|
|
$ |
|
|
|
$ |
|
|
|
$ |
|
|
|
$ |
|
|
|
$ |
|
|
|
(1) |
|
The following table presents information regarding nonperforming assets at the dates indicated:
|
|
|
December 31, |
|
|||||||||||||||||
|
|
|
|
2019 |
|
|
|
2018 |
|
|
|
2017 |
|
|
|
2016 |
|
|
|
2015 |
|
|
|
|
(Dollars in thousands) |
|
|||||||||||||||||
|
Nonaccrual loans (1)(2) |
|
$ |
|
|
|
$ |
|
|
|
$ |
|
|
|
$ |
|
|
|
$ |
|
|
|
Accruing loans 90 or more days past due |
|
|
|
|
|
|
|
|
|
|
|
|
|
|
|
|
|
|
|
|
|
Total nonperforming loans |
|
|
|
|
|
|
|
|
|
|
|
|
|
|
|
|
|
|
|
|
|
Repossessed assets |
|
|
|
|
|
|
— |
|
|
|
|
|
|
|
|
|
|
|
|
|
|
Other real estate |
|
|
|
|
|
|
|
|
|
|
|
|
|
|
|
|
|
|
|
|
|
Total nonperforming assets |
|
$ |
|
|
|
$ |
|
|
|
$ |
|
|
|
$ |
|
|
|
$ |
|
|
|
Nonperforming assets to total loans and other real estate |
|
|
|
% |
|
|
|
% |
|
|
|
% |
|
|
|
% |
|
|
|
% |
|
Nonperforming assets to total loans, excluding Warehouse Purchase Program loans, and other real estate |
|
|
|
% |
|
|
|
% |
|
|
|
% |
|
|
|
% |
|
|
|
% |
|
(1) |
|
|
(2) |
|
93
The Company had $
If interest on nonaccrual loans had been accrued under the original loan terms, approximately $
Impaired Loans. Loans are considered impaired when, based on current information and events, it is probable the Company will be unable to collect all amounts due in accordance with the original contractual terms of the loan agreement, including scheduled principal and interest payments. Impairment is evaluated in total for smaller-balance loans of a similar nature and on an individual loan basis for other loans. If a loan is impaired, a specific valuation allowance is allocated, if necessary, so that the loan is reported net, at the present value of estimated future cash flows using the loan’s existing rate or at the fair value of collateral if repayment is expected solely from the collateral. Interest payments on impaired loans are typically applied to principal unless collectability of the principal amount is reasonably assured, in which case interest is recognized on a cash basis. Impaired loans, or portions thereof, are charged off when deemed uncollectible.
Year-end impaired loans are set forth in the following tables. No interest income was recognized on impaired loans subsequent to their classification as impaired. The average recorded investment presented in the tables below is reported on a year-to-date basis.
|
|
|
December 31, 2019 |
|
|||||||||||||
|
|
|
Recorded Investment |
|
|
Unpaid Contractual Principal Balance |
|
|
Related Allowance |
|
|
Average Recorded Investment |
|
||||
|
|
|
(Dollars in thousands) |
|
|||||||||||||
|
With no related allowance recorded: |
|
|
|
|
|
|
|
|
|
|
|
|
|
|
|
|
|
Construction, land development and other land loans |
|
$ |
|
|
|
$ |
|
|
|
$ |
— |
|
|
$ |
|
|
|
Agriculture and agriculture real estate (includes farmland) |
|
|
|
|
|
|
|
|
|
|
— |
|
|
|
|
|
|
1-4 family (includes home equity) |
|
|
|
|
|
|
|
|
|
|
— |
|
|
|
|
|
|
Commercial real estate (includes multi-family residential) |
|
|
|
|
|
|
|
|
|
|
— |
|
|
|
|
|
|
Commercial and industrial |
|
|
|
|
|
|
|
|
|
|
— |
|
|
|
|
|
|
Consumer and other |
|
|
|
|
|
|
|
|
|
|
— |
|
|
|
|
|
|
Total |
|
|
|
|
|
|
|
|
|
|
— |
|
|
|
|
|
|
With an allowance recorded: |
|
|
|
|
|
|
|
|
|
|
|
|
|
|
|
|
|
Construction, land development and other land loans |
|
|
|
|
|
|
|
|
|
|
|
|
|
|
|
|
|
Agriculture and agriculture real estate (includes farmland) |
|
|
|
|
|
|
|
|
|
|
|
|
|
|
|
|
|
1-4 family (includes home equity) |
|
|
|
|
|
|
|
|
|
|
|
|
|
|
|
|
|
Commercial real estate (includes multi-family residential) |
|
|
— |
|
|
|
— |
|
|
|
— |
|
|
|
— |
|
|
Commercial and industrial |
|
|
|
|
|
|
|
|
|
|
|
|
|
|
|
|
|
Consumer and other |
|
|
— |
|
|
|
— |
|
|
|
— |
|
|
|
— |
|
|
Total |
|
|
|
|
|
|
|
|
|
|
|
|
|
|
|
|
|
Total: |
|
|
|
|
|
|
|
|
|
|
|
|
|
|
|
|
|
Construction, land development and other land loans |
|
|
|
|
|
|
|
|
|
|
58 |
|
|
|
|
|
|
Agriculture and agriculture real estate (includes farmland) |
|
|
|
|
|
|
|
|
|
|
7 |
|
|
|
|
|
|
1-4 family (includes home equity) |
|
|
|
|
|
|
|
|
|
|
1,255 |
|
|
|
|
|
|
Commercial real estate (includes multi-family residential) |
|
|
|
|
|
|
|
|
|
|
— |
|
|
|
|
|
|
Commercial and industrial |
|
|
|
|
|
|
|
|
|
|
121 |
|
|
|
|
|
|
Consumer and other |
|
|
|
|
|
|
|
|
|
|
— |
|
|
|
|
|
|
|
|
$ |
|
|
|
$ |
|
|
|
$ |
|
|
|
$ |
|
|
94
|
|
|
December 31, 2018 |
|
|||||||||||||
|
|
|
Recorded Investment |
|
|
Unpaid Contractual Principal Balance |
|
|
Related Allowance |
|
|
Average Recorded Investment |
|
||||
|
|
|
(Dollars in thousands) |
|
|||||||||||||
|
With no related allowance recorded: |
|
|
|
|
|
|
|
|
|
|
|
|
|
|
|
|
|
Construction, land development and other land loans |
|
$ |
|
|
|
$ |
|
|
|
$ |
— |
|
|
$ |
|
|
|
Agriculture and agriculture real estate (includes farmland) |
|
|
|
|
|
|
|
|
|
|
— |
|
|
|
|
|
|
1-4 family (includes home equity) |
|
|
|
|
|
|
|
|
|
|
— |
|
|
|
|
|
|
Commercial real estate (includes multi-family residential) |
|
|
|
|
|
|
|
|
|
|
— |
|
|
|
|
|
|
Commercial and industrial |
|
|
|
|
|
|
|
|
|
|
— |
|
|
|
|
|
|
Consumer and other |
|
|
|
|
|
|
|
|
|
|
— |
|
|
|
|
|
|
Total |
|
|
|
|
|
|
|
|
|
|
— |
|
|
|
|
|
|
With an allowance recorded: |
|
|
|
|
|
|
|
|
|
|
|
|
|
|
|
|
|
Construction, land development and other land loans |
|
|
|
|
|
|
|
|
|
|
|
|
|
|
|
|
|
Agriculture and agriculture real estate (includes farmland) |
|
|
— |
|
|
|
— |
|
|
|
— |
|
|
|
— |
|
|
1-4 family (includes home equity) |
|
|
|
|
|
|
|
|
|
|
|
|
|
|
|
|
|
Commercial real estate (includes multi-family residential) |
|
|
- |
|
|
|
- |
|
|
|
- |
|
|
|
|
|
|
Commercial and industrial |
|
|
|
|
|
|
|
|
|
|
|
|
|
|
|
|
|
Consumer and other |
|
|
— |
|
|
|
— |
|
|
|
— |
|
|
|
— |
|
|
Total |
|
|
|
|
|
|
|
|
|
|
|
|
|
|
|
|
|
Total: |
|
|
|
|
|
|
|
|
|
|
|
|
|
|
|
|
|
Construction, land development and other land loans |
|
|
|
|
|
|
|
|
|
|
|
|
|
|
|
|
|
Agriculture and agriculture real estate (includes farmland) |
|
|
|
|
|
|
|
|
|
|
— |
|
|
|
|
|
|
1-4 family (includes home equity) |
|
|
|
|
|
|
|
|
|
|
|
|
|
|
|
|
|
Commercial real estate (includes multi-family residential) |
|
|
|
|
|
|
|
|
|
|
- |
|
|
|
|
|
|
Commercial and industrial |
|
|
|
|
|
|
|
|
|
|
|
|
|
|
|
|
|
Consumer and other |
|
|
|
|
|
|
|
|
|
|
— |
|
|
|
|
|
|
|
|
$ |
|
|
|
$ |
|
|
|
$ |
|
|
|
$ |
|
|
Credit Quality Indicators. As part of the on-going monitoring of the credit quality of the Company’s loan portfolio and methodology for calculating the allowance for credit losses, management assigns and tracks loan grades to be used as credit quality indicators.
The following is a general description of the loan grades used:
Grade 1—Credits in this category have risk potential that is virtually nonexistent. These loans may be secured by insured certificates of deposit, insured savings accounts, U.S. Government securities and highly rated municipal bonds.
Grade 2—Credits in this category are of the highest quality. These borrowers represent top-rated companies and individuals with unquestionable financial standing with excellent global cash flow coverage, net worth, liquidity and collateral coverage.
Grade 3—Credits in this category are not immune from risk but are well protected by the collateral and paying capacity of the borrower. These loans may exhibit a minor unfavorable credit factor, but the overall credit is sufficiently strong to minimize the possibility of loss.
Grade 4—Credits in this category are considered to be of acceptable credit quality with moderately greater risk than Grade 3 and receiving closer monitoring. Loans in this category have sources of repayment that remain sufficient to preclude a larger than normal probability of default and secondary sources are likewise currently of sufficient quantity, quality, and liquidity to protect the Company against loss of principal and interest. These borrowers have specific risk factors, but the overall strength of the credit is acceptable based on other mitigating credit and/or collateral factors and can repay the debt in the normal course of business.
Grade 5—Credits in this category constitute an undue and unwarranted credit risk; however, the factors do not rise to a level of substandard. These credits have potential weaknesses and/or declining trends that, if not corrected, could expose the Company to risk at a future date. These loans are monitored on the Company’s internally generated watch list and evaluated on a quarterly basis.
95
Grade 6—Credits in this category are considered “substandard” but “non-impaired” loans in accordance with regulatory guidelines. Loans in this category have well-defined weakness that, if not corrected, could make default of principal and interest possible. Loans in this category are still accruing interest and may be dependent upon secondary sources of repayment and/or collateral liquidation.
Grade 7—Credits in this category are deemed “substandard” and “impaired” pursuant to regulatory guidelines. As such, the Company has determined that it is probable that less than 100% of the contractual principal and interest will be collected. These loans are individually evaluated for a specific reserve and will typically have the accrual of interest stopped.
Grade 8—Credits in this category include “doubtful” loans in accordance with regulatory guidance. Such loans are no longer accruing interest and factors indicate a loss is imminent. These loans are also deemed “impaired.” While a specific reserve may be in place while the loan and collateral is being evaluated these loans are typically charged down to an amount the Company estimates is collectible.
Grade 9—Credits in this category are deemed a “loss” in accordance with regulatory guidelines and have been charged off or charged down. The Company may continue collection efforts and may have partial recovery in the future.
The following table presents loans by risk grade and category of loan at December 31, 2019. Impaired loans include loans in risk grades 7, 8 and 9, as well as any PCI loan that has a specific reserve allocated to it.
|
|
|
Construction, Land Development and Other Land Loans |
|
|
Agriculture and Agriculture Real Estate (includes Farmland) |
|
|
1-4 Family (includes Home Equity) (1) |
|
|
Commercial Real Estate (includes Multi-Family Residential) |
|
|
Commercial and Industrial |
|
|
Consumer and Other |
|
|
Warehouse Purchase Program |
|
|
Total |
|
||||||||
|
|
|
(Dollars in thousands) |
|
|||||||||||||||||||||||||||||
|
Grade 1 |
|
$ |
|
|
|
$ |
|
|
|
$ |
|
|
|
$ |
|
|
|
$ |
|
|
|
$ |
|
|
|
$ |
|
|
|
$ |
|
|
|
Grade 2 |
|
|
|
|
|
|
|
|
|
|
|
|
|
|
|
|
|
|
|
|
|
|
|
|
|
|
|
|
|
|
|
|
|
Grade 3 |
|
|
|
|
|
|
|
|
|
|
|
|
|
|
|
|
|
|
|
|
|
|
|
|
|
|
|
|
|
|
|
|
|
Grade 4 |
|
|
|
|
|
|
|
|
|
|
|
|
|
|
|
|
|
|
|
|
|
|
|
|
|
|
|
|
|
|
|
|
|
Grade 5 |
|
|
|
|
|
|
|
|
|
|
|
|
|
|
|
|
|
|
|
|
|
|
|
|
|
|
|
|
|
|
|
|
|
Grade 6 |
|
|
|
|
|
|
|
|
|
|
|
|
|
|
|
|
|
|
|
|
|
|
|
|
|
|
|
|
|
|
|
|
|
Grade 7 |
|
|
|
|
|
|
|
|
|
|
|
|
|
|
|
|
|
|
|
|
|
|
|
|
|
|
|
|
|
|
|
|
|
Grade 8 |
|
|
|
|
|
|
|
|
|
|
|
|
|
|
|
|
|
|
|
|
|
|
|
|
|
|
|
|
|
|
|
|
|
Grade 9 |
|
|
|
|
|
|
|
|
|
|
|
|
|
|
|
|
|
|
|
|
|
|
|
|
|
|
|
|
|
|
|
|
|
PCI Loans |
|
|
|
|
|
|
|
|
|
|
|
|
|
|
|
|
|
|
|
|
|
|
|
|
|
|
|
|
|
|
|
|
|
Total |
|
$ |
|
|
|
$ |
|
|
|
$ |
|
|
|
$ |
|
|
|
$ |
|
|
|
$ |
|
|
|
$ |
|
|
|
$ |
|
|
|
(1) |
|
96
The following table presents loans by risk grade and category of loan at December 31, 2018. Impaired loans include loans in risk grades 7, 8 and 9.
|
|
|
Construction, Land Development and Other Land Loans |
|
|
Agriculture and Agriculture Real Estate (includes Farmland) |
|
|
1-4 Family (includes Home Equity) (1) |
|
|
Commercial Real Estate (includes Multi-Family Residential) |
|
|
Commercial and Industrial |
|
|
Consumer and Other |
|
|
Total |
|
|||||||
|
|
|
(Dollars in thousands) |
|
|||||||||||||||||||||||||
|
Grade 1 |
|
$ |
|
|
|
$ |
|
|
|
$ |
|
|
|
$ |
|
|
|
$ |
|
|
|
$ |
|
|
|
$ |
|
|
|
Grade 2 |
|
|
|
|
|
|
|
|
|
|
|
|
|
|
|
|
|
|
|
|
|
|
|
|
|
|
|
|
|
Grade 3 |
|
|
|
|
|
|
|
|
|
|
|
|
|
|
|
|
|
|
|
|
|
|
|
|
|
|
|
|
|
Grade 4 |
|
|
|
|
|
|
|
|
|
|
|
|
|
|
|
|
|
|
|
|
|
|
|
|
|
|
|
|
|
Grade 5 |
|
|
|
|
|
|
|
|
|
|
|
|
|
|
|
|
|
|
|
|
|
|
|
|
|
|
|
|
|
Grade 6 |
|
|
|
|
|
|
|
|
|
|
|
|
|
|
|
|
|
|
|
|
|
|
|
|
|
|
|
|
|
Grade 7 |
|
|
|
|
|
|
|
|
|
|
|
|
|
|
|
|
|
|
|
|
|
|
|
|
|
|
|
|
|
Grade 8 |
|
|
|
|
|
|
|
|
|
|
|
|
|
|
|
|
|
|
|
|
|
|
|
|
|
|
|
|
|
Grade 9 |
|
|
|
|
|
|
|
|
|
|
|
|
|
|
|
|
|
|
|
|
|
|
|
|
|
|
|
|
|
PCI Loans |
|
|
|
|
|
|
|
|
|
|
|
|
|
|
|
|
|
|
|
|
|
|
|
|
|
|
|
|
|
Total |
|
$ |
|
|
|
$ |
|
|
|
$ |
|
|
|
$ |
|
|
|
$ |
|
|
|
$ |
|
|
|
$ |
|
|
|
(1) |
|
Allowance for Credit Losses. The allowance for credit losses is established through charges to earnings in the form of a provision for credit losses. Management has established an allowance for credit losses which it believes is adequate as of December 31, 2019 for estimated losses in the Company’s loan portfolio. The amount of the allowance for credit losses is affected by the following: (1) charge-offs of loans that occur when loans are deemed uncollectible and decrease the allowance, (2) recoveries on loans previously charged off that increase the allowance and (3) provisions for credit losses charged to earnings that increase the allowance. Based on an evaluation of the loan portfolio and consideration of the factors listed below, management presents a quarterly review of the allowance for credit losses to the Bank’s Board of Directors, indicating any change in the allowance since the last review and any recommendations as to adjustments in the allowance. Although management believes it uses the best information available to make determinations with respect to the allowance for credit losses, future adjustments may be necessary if economic conditions or the borrower’s performance differ from the assumptions used in making the initial determinations.
The Company’s allowance for credit losses consists of two components: (1) a specific valuation allowance based on probable losses on specifically identified loans and (2) a general valuation allowance based on historical loan loss experience, general economic conditions and other qualitative risk factors both internal and external to the Company.
In setting the specific valuation allowance, the Company follows a loan review program to evaluate the credit risk in the total loan portfolio and assigns risk grades to each loan. Through this loan review process, the Company maintains an internal list of impaired loans which, along with the delinquency list of loans, helps management assess the overall quality of the loan portfolio and the adequacy of the allowance for credit losses. All loans that have been identified as impaired are reviewed on a quarterly basis in order to determine whether a specific reserve is required. For certain impaired loans, the Company allocates a specific loan loss reserve primarily based on the value of the collateral securing the impaired loan in accordance with ASC Topic 310-10,“Receivables.” The specific reserves are determined on an individual loan basis. Loans for which specific reserves are provided are excluded from the general valuation allowance described below.
In connection with this review of the loan portfolio, the Company considers risk elements attributable to particular loan types or categories in assessing the quality of individual loans. Some of the risk elements include:
|
|
• |
for 1-4 family residential mortgage loans, the borrower’s ability to repay the loan, including a consideration of the debt to income ratio and employment and income stability, the loan to value ratio, and the age, condition and marketability of collateral; |
|
|
• |
for commercial real estate loans and multifamily residential loans, the debt service coverage ratio (income from the property in excess of operating expenses compared to loan payment requirements), operating results of the owner in the case of owner-occupied properties, the loan to value ratio, the age and condition of the collateral and the volatility of income, property value and future operating results typical of properties of that type; |
97
|
|
• |
for construction, land development and other land loans, the perceived feasibility of the project including the ability to sell developed lots or improvements constructed for resale or the ability to lease property constructed for lease, the quality and nature of contracts for presale or prelease, if any, experience and ability of the developer and loan to value ratio; |
|
|
• |
for commercial and industrial loans, the operating results of the commercial, industrial or professional enterprise, the borrower’s business, professional and financial ability and expertise, the specific risks and volatility of income and operating results typical for businesses in that category and the value, nature and marketability of collateral; |
|
|
• |
for the Warehouse Purchase Program, the capitalization and liquidity of the mortgage banking client, the operating experience, the Client’s satisfactory underwriting of purchased loans and the consistent timeliness by Client of loan resale to investors; |
|
|
• |
for agricultural real estate loans, the experience and financial capability of the borrower, projected debt service coverage of the operations of the borrower and loan to value ratio; and |
|
|
• |
for non-real estate agricultural loans, the operating results, experience and financial capability of the borrower, historical and expected market conditions and the value, nature and marketability of collateral. |
In addition, for each category, the Company considers secondary sources of income and the financial strength and credit history of the borrower and any guarantors.
In determining the amount of the general valuation allowance, management considers factors such as historical loan loss experience, concentration risk of specific loan types, the volume, growth and composition of the Company’s loan portfolio, current economic conditions that may affect the borrower’s ability to pay and the value of collateral, the evaluation of the Company’s loan portfolio through its internal loan review process, general economic conditions and other qualitative risk factors both internal and external to the Company and other relevant factors in accordance with ASC Topic 450, “Contingencies.” Based on a review of these factors for each loan type, the Company applies an estimated percentage to the outstanding balance of each loan type, excluding any loan that has a specific reserve allocated to it. Allocation of a portion of the allowance to one category of loans does not preclude its availability to absorb losses in other categories. The Company uses this information to establish the amount of the general valuation allowance.
A change in the allowance for credit losses can be attributable to several factors, most notably (1) specific reserves identified for impaired loans, (2) historical credit loss information, (3) changes in environmental factors and (4) growth in the balance of originated loans and the renewal or substantial modification of acquired loans (Non-PCI and PCI loans as discussed in Note 2) into the loan portfolio subject to the allowance methodology.
Changes in the Company’s asset quality are reflected in the allowance in several ways. Specific reserves that are calculated on a loan-by-loan basis and the qualitative assessment of all other loans reflect current changes in the credit quality of the loan portfolio. Historical credit losses, on the other hand, are based on a three-year look back period, which are then applied to estimate current credit losses inherent in the loan portfolio. A deterioration in the credit quality of the loan portfolio in the current period would increase the historical credit loss factor to be applied in future periods, just as an improvement in credit quality would decrease the historical credit loss factor.
The allowance for credit losses is further determined by the size of the loan portfolio subject to the allowance methodology and environmental factors that include Company-specific risk indicators and general economic conditions, both of which are constantly changing. The Company evaluates the economic and portfolio-specific factors on a quarterly basis to determine a qualitative component of the general valuation allowance. The factors include economic metrics, business conditions, delinquency trends, credit concentrations, nature and volume of the portfolio and other adjustments for items not covered by specific reserves and historical loss experience. Management’s assessment of qualitative factors is a statistically based approach to determine the inherent probable loss associated with such factors. Based on the Company’s actual historical loan loss experience relative to economic and loan portfolio-specific factors at the time the losses occurred, management is able to identify the probable level of incurred losses as of the date of measurement. The correlation of historical loss experience with current economic conditions provides an estimate of inherent and probable losses that has not been previously factored into the general valuation allowance by the determination of specific reserves and recent historical losses. Additionally, the Company considers qualitative factors not easily quantified and the possibility of model imprecision.
Utilizing the aggregation of specific reserves, historical loss experience and a qualitative component, management is able to determine the valuation allowance to reflect the full inherent probable loss.
98
Loans acquired in business combinations are initially recorded at fair value, which includes an estimate of inherent credit losses expected to be realized over the remaining lives of the loans, and therefore no corresponding allowance for credit losses is recorded for these loans at acquisition. When a fair-valued acquired loan is renewed at its maturity date, the loan is re-categorized and is subject to the allowance methodology. When a fair-valued acquired loan is modified after acquisition, the loan is independently evaluated subsequent to the modification decision to determine whether the modification was, substantial, and therefore, requires that the loan be re-categorized as a re-underwritten acquired loan. The determination is based on a discounted cash-flow analysis. Generally, when a change in discounted cash-flow of greater than
Non-PCI loans that were not deemed impaired subsequent to the acquisition date are considered non-impaired and are evaluated as part of the general valuation allowance. Non-PCI loans that have not become impaired subsequent to acquisition are segregated into a pool for each acquisition for allowance calculation purposes. For each pool, the Company estimates a hypothetical allowance for credit losses also referred to as an “indicated reserve” that is calculated in accordance with GAAP requirements. The Company uses the acquired bank’s past loss history adjusted for qualitative factors to establish the indicated reserve. The indicated reserve for each pool of Non-PCI loans is compared with the remaining discount for the respective pool to test for credit quality deterioration and the possible need for a loan loss provision. To the extent the remaining discount of the pool is greater than the indicated reserve, no additional allowance is necessary. If the remaining discount of the pool is less than the indicated reserve, the difference results in an increase to the allowance recorded through a provision for credit losses.
Non-PCI loans that have deteriorated to an impaired status subsequent to acquisition are evaluated for a specific reserve on a quarterly basis which, when identified, is added to the allowance for credit losses. The Company reviews impaired Non-PCI loans on a loan-by-loan basis and determines the specific reserve based on the difference between the recorded investment in the loan and one of three factors: expected future cash flows, observable market price or fair value of the collateral. Because essentially all of the Company’s impaired Non-PCI loans have been collateral-dependent, the amount of the specific reserve historically has been determined by comparing the fair value of the collateral securing the Non-PCI loan with the recorded investment in such loan. In the future, the Company will continue to analyze impaired Non-PCI loans on a loan-by-loan basis and may use an alternative measurement method to determine the specific reserve, as appropriate and in accordance with applicable accounting standards.
PCI loans are individually monitored on a quarterly basis to assess for deterioration subsequent to acquisition and are only subject to the Company’s allowance methodology when a deterioration in projected cash flows is identified. In the event that a deterioration in cash flows is identified, an additional provision for credit losses is made. PCI loans were recorded at their acquisition date fair values, which were based on expected cash flows and included estimates of expected future credit losses. The Company’s estimates of loan fair values at the acquisition date may be adjusted for a period of up to one year as the Company continues to evaluate its estimate of expected future cash flows at the acquisition date. If the Company determines that losses arose after the acquisition date, the additional losses will be reflected as a provision for credit losses. An allowance for credit losses is not calculated for PCI loans that have not experienced deterioration subsequent to the acquisition date.
At December 31, 2019, the allowance for credit losses totaled $
99
The following tables detail the activity in the allowance for credit losses by category of loan and the allowance for credit losses and recorded investment in loans by category of loan on the basis of the impairment methodology used to determine the allowance for credit losses, excluding $
|
|
|
Construction, Land Development and Other Land Loans |
|
|
Agriculture and Agriculture Real Estate (includes Farmland) |
|
|
1-4 Family (includes Home Equity) |
|
|
Commercial Real Estate (includes Multi-Family Residential) |
|
|
Commercial and Industrial |
|
|
Consumer and Other |
|
|
Total |
|
|||||||
|
|
|
(Dollars in thousands) |
|
|||||||||||||||||||||||||
|
Allowance for credit losses: |
|
|
|
|
|
|
|
|
|
|
|
|
|
|
|
|
|
|
|
|
|
|
|
|
|
|
|
|
|
Balance January 1, 2019 |
|
$ |
|
|
|
$ |
|
|
|
$ |
|
|
|
$ |
|
|
|
$ |
|
|
|
$ |
|
|
|
$ |
|
|
|
Provision for credit losses |
|
|
( |
) |
|
|
( |
) |
|
|
|
|
|
|
|
|
|
|
|
|
|
|
|
|
|
|
|
|
|
Charge-offs |
|
|
( |
) |
|
|
( |
) |
|
|
( |
) |
|
|
( |
) |
|
|
( |
) |
|
|
( |
) |
|
|
( |
) |
|
Recoveries |
|
|
|
|
|
|
|
|
|
|
|
|
|
|
|
|
|
|
|
|
|
|
|
|
|
|
|
|
|
Net charge-offs |
|
|
|
|
|
|
|
|
|
|
( |
) |
|
|
( |
) |
|
|
( |
) |
|
|
( |
) |
|
|
( |
) |
|
Balance December 31, 2019 |
|
$ |
|
|
|
$ |
|
|
|
$ |
|
|
|
$ |
|
|
|
$ |
|
|
|
$ |
|
|
|
$ |
|
|
|
Allowance for credit losses related to: |
|
|
|
|
|
|
|
|
|
|
|
|
|
|
|
|
|
|
|
|
|
|
|
|
|
|
|
|
|
December 31, 2019 |
|
|
|
|
|
|
|
|
|
|
|
|
|
|
|
|
|
|
|
|
|
|
|
|
|
|
|
|
|
Individually evaluated for impairment |
|
$ |
|
|
|
$ |
|
|
|
$ |
|
|
|
$ |
— |
|
|
$ |
|
|
|
$ |
— |
|
|
$ |
|
|
|
Collectively evaluated for impairment |
|
|
|
|
|
|
|
|
|
|
|
|
|
|
|
|
|
|
|
|
|
|
|
|
|
|
|
|
|
PCI loans |
|
|
— |
|
|
|
— |
|
|
|
— |
|
|
|
— |
|
|
|
— |
|
|
|
— |
|
|
|
— |
|
|
Total allowance for credit losses |
|
$ |
|
|
|
$ |
|
|
|
$ |
|
|
|
$ |
|
|
|
$ |
|
|
|
$ |
|
|
|
$ |
|
|
|
Recorded investment in loans: |
|
|
|
|
|
|
|
|
|
|
|
|
|
|
|
|
|
|
|
|
|
|
|
|
|
|
|
|
|
December 31, 2019 |
|
|
|
|
|
|
|
|
|
|
|
|
|
|
|
|
|
|
|
|
|
|
|
|
|
|
|
|
|
Individually evaluated for impairment |
|
$ |
|
|
|
$ |
|
|
|
$ |
|
|
|
$ |
|
|
|
$ |
|
|
|
$ |
|
|
|
$ |
|
|
|
Collectively evaluated for impairment |
|
|
|
|
|
|
|
|
|
|
|
|
|
|
|
|
|
|
|
|
|
|
|
|
|
|
|
|
|
PCI loans |
|
|
|
|
|
|
|
|
|
|
|
|
|
|
|
|
|
|
|
|
|
|
— |
|
|
|
|
|
|
Total loans evaluated for impairment |
|
$ |
|
|
|
$ |
|
|
|
$ |
|
|
|
$ |
|
|
|
$ |
|
|
|
$ |
|
|
|
$ |
|
|
100
|
|
|
Construction, Land Development and Other Land Loans |
|
|
Agriculture and Agriculture Real Estate (includes Farmland) |
|
|
1-4 Family (includes Home Equity) |
|
|
Commercial Real Estate (includes Multi-Family Residential) |
|
|
Commercial and Industrial |
|
|
Consumer and Other |
|
|
Total |
|
|||||||
|
|
|
(Dollars in thousands) |
|
|||||||||||||||||||||||||
|
Allowance for credit losses: |
|
|
|
|||||||||||||||||||||||||
|
Balance January 1, 2018 |
|
$ |
|
|
|
$ |
|
|
|
$ |
|
|
|
$ |
|
|
|
$ |
|
|
|
$ |
|
|
|
$ |
|
|
|
Provision for credit losses |
|
|
|
|
|
|
( |
) |
|
|
|
|
|
|
|
|
|
|
|
|
|
|
|
|
|
|
|
|
|
Charge-offs |
|
|
( |
) |
|
|
( |
) |
|
|
( |
) |
|
|
( |
) |
|
|
( |
) |
|
|
( |
) |
|
|
( |
) |
|
Recoveries |
|
|
|
|
|
|
|
|
|
|
|
|
|
|
|
|
|
|
|
|
|
|
|
|
|
|
|
|
|
Net charge-offs |
|
|
( |
) |
|
|
|
|
|
|
( |
) |
|
|
( |
) |
|
|
( |
) |
|
|
( |
) |
|
|
( |
) |
|
Balance December 31, 2018 |
|
$ |
|
|
|
$ |
|
|
|
$ |
|
|
|
$ |
|
|
|
$ |
|
|
|
$ |
|
|
|
$ |
|
|
|
Allowance for credit losses related to: |
|
|
|
|
|
|
|
|
|
|
|
|
|
|
|
|
|
|
|
|
|
|
|
|
|
|
|
|
|
December 31, 2018 |
|
|
|
|
|
|
|
|
|
|
|
|
|
|
|
|
|
|
|
|
|
|
|
|
|
|
|
|
|
Individually evaluated for impairment |
|
$ |
|
|
|
$ |
— |
|
|
$ |
|
|
|
$ |
— |
|
|
$ |
|
|
|
$ |
— |
|
|
$ |
|
|
|
Collectively evaluated for impairment |
|
|
|
|
|
|
|
|
|
|
|
|
|
|
|
|
|
|
|
|
|
|
|
|
|
|
|
|
|
PCI loans |
|
|
— |
|
|
|
— |
|
|
|
— |
|
|
|
— |
|
|
|
— |
|
|
|
— |
|
|
|
— |
|
|
Total allowance for credit losses |
|
$ |
|
|
|
$ |
|
|
|
$ |
|
|
|
$ |
|
|
|
$ |
|
|
|
$ |
|
|
|
$ |
|
|
|
Recorded investment in loans: |
|
|
|
|
|
|
|
|
|
|
|
|
|
|
|
|
|
|
|
|
|
|
|
|
|
|
|
|
|
December 31, 2018 |
|
|
|
|
|
|
|
|
|
|
|
|
|
|
|
|
|
|
|
|
|
|
|
|
|
|
|
|
|
Individually evaluated for impairment |
|
$ |
|
|
|
$ |
|
|
|
$ |
|
|
|
$ |
|
|
|
$ |
|
|
|
$ |
|
|
|
$ |
|
|
|
Collectively evaluated for impairment |
|
|
|
|
|
|
|
|
|
|
|
|
|
|
|
|
|
|
|
|
|
|
|
|
|
|
|
|
|
PCI loans |
|
|
|
|
|
|
|
|
|
|
|
|
|
|
|
|
|
|
|
|
|
|
— |
|
|
|
|
|
|
Total loans evaluated for impairment |
|
$ |
|
|
|
$ |
|
|
|
$ |
|
|
|
$ |
|
|
|
$ |
|
|
|
$ |
|
|
|
$ |
|
|
101
|
|
|
Construction, Land Development and Other Land Loans |
|
|
Agriculture and Agriculture Real Estate (includes Farmland) |
|
|
1-4 Family (includes Home Equity) |
|
|
Commercial Real Estate (includes Multi-Family Residential) |
|
|
Commercial and Industrial |
|
|
Consumer and Other |
|
|
Total |
|
|||||||
|
|
|
(Dollars in thousands) |
|
|||||||||||||||||||||||||
|
Allowance for credit losses: |
|
|
|
|
|
|
|
|
|
|
|
|
|
|
|
|
|
|
|
|
|
|
|
|
|
|
|
|
|
Balance January 1, 2017 |
|
$ |
|
|
|
$ |
|
|
|
$ |
|
|
|
$ |
|
|
|
$ |
|
|
|
$ |
|
|
|
$ |
|
|
|
Provision for credit losses |
|
|
( |
) |
|
|
( |
) |
|
|
( |
) |
|
|
( |
) |
|
|
|
|
|
|
|
|
|
|
|
|
|
Charge-offs |
|
|
( |
) |
|
|
( |
) |
|
|
( |
) |
|
|
( |
) |
|
|
( |
) |
|
|
( |
) |
|
|
( |
) |
|
Recoveries |
|
|
|
|
|
|
|
|
|
|
|
|
|
|
|
|
|
|
|
|
|
|
|
|
|
|
|
|
|
Net charge-offs |
|
|
|
|
|
|
|
|
|
|
( |
) |
|
|
( |
) |
|
|
( |
) |
|
|
( |
) |
|
|
( |
) |
|
Balance December 31, 2017 |
|
$ |
|
|
|
$ |
|
|
|
$ |
|
|
|
$ |
|
|
|
$ |
|
|
|
$ |
|
|
|
$ |
|
|
|
Allowance for credit losses related to: |
|
|
|
|
|
|
|
|
|
|
|
|
|
|
|
|
|
|
|
|
|
|
|
|
|
|
|
|
|
December 31, 2017 |
|
|
|
|
|
|
|
|
|
|
|
|
|
|
|
|
|
|
|
|
|
|
|
|
|
|
|
|
|
Individually evaluated for impairment |
|
$ |
— |
|
|
$ |
— |
|
|
$ |
|
|
|
$ |
|
|
|
$ |
|
|
|
$ |
- |
|
|
$ |
|
|
|
Collectively evaluated for impairment |
|
|
|
|
|
|
|
|
|
|
|
|
|
|
|
|
|
|
|
|
|
|
|
|
|
|
|
|
|
PCI loans |
|
|
— |
|
|
|
— |
|
|
|
— |
|
|
|
— |
|
|
|
— |
|
|
|
— |
|
|
|
— |
|
|
Total allowance for credit losses |
|
$ |
|
|
|
$ |
|
|
|
$ |
|
|
|
$ |
|
|
|
$ |
|
|
|
$ |
|
|
|
$ |
|
|
|
Recorded investment in loans: |
|
|
|
|
|
|
|
|
|
|
|
|
|
|
|
|
|
|
|
|
|
|
|
|
|
|
|
|
|
December 31, 2017 |
|
|
|
|
|
|
|
|
|
|
|
|
|
|
|
|
|
|
|
|
|
|
|
|
|
|
|
|
|
Individually evaluated for impairment |
|
$ |
|
|
|
$ |
|
|
|
$ |
|
|
|
$ |
|
|
|
$ |
|
|
|
$ |
|
|
|
$ |
|
|
|
Collectively evaluated for impairment |
|
|
|
|
|
|
|
|
|
|
|
|
|
|
|
|
|
|
|
|
|
|
|
|
|
|
|
|
|
PCI loans |
|
|
|
|
|
|
|
|
|
|
|
|
|
|
|
|
|
|
|
|
|
|
— |
|
|
|
|
|
|
Total loans evaluated for impairment |
|
$ |
|
|
|
$ |
|
|
|
$ |
|
|
|
$ |
|
|
|
$ |
|
|
|
$ |
|
|
|
$ |
|
|
102
Troubled Debt Restructurings. The restructuring of a loan is considered a “troubled debt restructuring” if both (1) the borrower is experiencing financial difficulties and (2) the creditor has granted a concession. Concessions may include interest rate reductions or below market interest rates, principal forgiveness, restructuring amortization schedules and other actions intended to minimize potential losses. Under ASC Topic 310-40 “Receivables—Troubled Debt Restructurings by Creditors,” the Company evaluates all loan modifications for identification as troubled debt restructurings. At December 31, 2019 and 2018, the Company had $
|
|
|
Years Ended December 31, |
|
|||||||||||||||||||||
|
|
|
2019 |
|
|
2018 |
|
||||||||||||||||||
|
|
|
Number of Loans |
|
|
Recorded Investment at Date of Restructure |
|
|
Recorded Investment at Year-End |
|
|
Number of Loans |
|
|
Recorded Investment at Date of Restructure |
|
|
Recorded Investment at Year-End |
|
||||||
|
|
|
(Dollars in thousands) |
|
|||||||||||||||||||||
|
Troubled Debt Restructurings |
|
|
|
|
|
|
|
|
|
|
|
|
|
|
|
|
|
|
|
|
|
|
|
|
|
Construction, land development and other land loans |
|
|
— |
|
|
$ |
— |
|
|
$ |
— |
|
|
|
— |
|
|
$ |
— |
|
|
$ |
— |
|
|
Agriculture and agriculture real estate (includes farmland) |
|
|
— |
|
|
|
— |
|
|
|
— |
|
|
|
— |
|
|
|
— |
|
|
|
— |
|
|
1-4 Family (includes home equity) |
|
|
— |
|
|
|
— |
|
|
|
— |
|
|
|
— |
|
|
|
— |
|
|
|
— |
|
|
Commercial real estate (commercial mortgage and multi-family) |
|
|
— |
|
|
|
— |
|
|
|
— |
|
|
|
— |
|
|
|
— |
|
|
|
— |
|
|
Commercial and industrial |
|
|
|
|
|
|
|
|
|
|
|
|
|
|
|
|
|
|
|
|
|
|
|
|
|
Consumer and other |
|
|
|
|
|
|
|
|
|
|
|
|
|
|
— |
|
|
|
— |
|
|
|
— |
|
|
Total |
|
|
|
|
|
$ |
|
|
|
$ |
|
|
|
|
|
|
|
$ |
|
|
|
$ |
|
|
For the year ended December 31, 2019, the Company added
7. FAIR VALUE
The Company uses fair value measurements to record fair value adjustments to certain assets and to determine fair value disclosures. Fair values represent the estimated price that would be received from selling an asset or paid to transfer a liability, otherwise known as an “exit price.” Securities available for sale are recorded at fair value on a recurring basis. Additionally, from time to time, the Company may be required to record at fair value other assets on a nonrecurring basis. These nonrecurring fair value adjustments typically involve application of lower-of-cost-or-market accounting or write downs of individual assets. ASC Topic 820, “Fair Value Measurements and Disclosures” establishes a fair value hierarchy for valuation inputs that gives the highest priority to quoted prices in active markets for identical assets or liabilities and the lowest priority to unobservable inputs. The fair value hierarchy is as follows:
Fair Value Hierarchy
The Company groups financial assets and financial liabilities measured at fair value in three levels, based on the markets in which the assets and liabilities are traded and the reliability of the assumptions used to determine fair value. These levels are:
|
|
• |
Level 1—Quoted prices in active markets for identical assets or liabilities. |
|
|
• |
Level 2—Other significant observable inputs (including quoted prices in active markets for similar assets or liabilities) or other inputs that are observable or can be corroborated by observable market data for substantially the full term of the assets or liabilities. |
|
|
• |
Level 3—Unobservable inputs that are supported by little or no market activity and that are significant to the fair value of the assets or liabilities. |
103
The fair value of an asset or liability is the price that would be received to sell that asset or paid to transfer that liability in an orderly transaction occurring in the principal market (or most advantageous market in the absence of a principal market) for such asset or liability. In estimating fair value, the Company utilizes valuation techniques that are consistent with the market approach, the income approach and/or the cost approach. Such valuation techniques are consistently applied. Inputs to valuation techniques include the assumptions that market participants would use in pricing an asset or liability.
The fair value disclosures below represent the Company’s estimates based on relevant market information and information about the financial instruments. Fair value estimates are based on judgments regarding current economic conditions, risk characteristics of the various instruments, and other factors. These estimates are subjective in nature and involve uncertainties and matters of significant judgment and therefore cannot be determined with precision. Changes in the above methodologies and assumptions could significantly affect the estimates.
The following tables present fair values for assets measured at fair value on a recurring basis:
|
|
|
December 31, 2019 |
|
|||||||||||||
|
|
|
Level 1 |
|
|
Level 2 |
|
|
Level 3 |
|
|
Total |
|
||||
|
|
|
(Dollars in thousands) |
|
|||||||||||||
|
Assets: |
|
|
|
|
|
|
|
|
|
|
|
|
|
|
|
|
|
Available for sale securities: |
|
|
|
|
|
|
|
|
|
|
|
|
|
|
|
|
|
States and political subdivisions |
|
$ |
— |
|
|
$ |
|
|
|
$ |
— |
|
|
$ |
|
|
|
Collateralized mortgage obligations |
|
|
— |
|
|
|
|
|
|
|
— |
|
|
|
|
|
|
Mortgage-backed securities |
|
|
— |
|
|
|
|
|
|
|
— |
|
|
|
|
|
|
Total available for sale securities |
|
|
— |
|
|
|
|
|
|
|
— |
|
|
|
|
|
|
|
|
|
|
|
|
|
|
|
|
|
|
|
|
|
|
|
|
Derivative financial instruments: |
|
|
|
|
|
|
|
|
|
|
|
|
|
|
|
|
|
Interest rate lock commitments |
|
$ |
— |
|
|
$ |
|
|
|
$ |
— |
|
|
$ |
|
|
|
Forward mortgage-backed securities trades |
|
|
— |
|
|
|
|
|
|
|
— |
|
|
|
|
|
|
Loan customer counterparty |
|
|
— |
|
|
|
|
|
|
|
— |
|
|
|
|
|
|
Financial institution counterparty |
|
|
— |
|
|
|
|
|
|
|
— |
|
|
|
|
|
|
Liabilities: |
|
|
|
|
|
|
|
|
|
|
|
|
|
|
|
|
|
Derivative financial instruments: |
|
|
|
|
|
|
|
|
|
|
|
|
|
|
|
|
|
Interest rate lock commitments |
|
$ |
— |
|
|
$ |
— |
|
|
$ |
— |
|
|
$ |
— |
|
|
Forward mortgage-backed securities trades |
|
|
— |
|
|
|
|
|
|
|
— |
|
|
|
|
|
|
Loan customer counterparty |
|
|
— |
|
|
|
|
|
|
|
— |
|
|
|
|
|
|
Financial institution counterparty |
|
|
— |
|
|
|
|
|
|
|
— |
|
|
|
|
|
|
|
|
December 31, 2018 |
|
|||||||||||||
|
|
|
Level 1 |
|
|
Level 2 |
|
|
Level 3 |
|
|
Total |
|
||||
|
|
|
(Dollars in thousands) |
|
|||||||||||||
|
Assets: |
|
|
|
|
|
|
|
|
|
|
|
|
|
|
|
|
|
Available for sale securities: |
|
|
|
|
|
|
|
|
|
|
|
|
|
|
|
|
|
States and political subdivisions |
|
$ |
— |
|
|
$ |
|
|
|
$ |
— |
|
|
$ |
|
|
|
Collateralized mortgage obligations |
|
|
— |
|
|
|
|
|
|
|
— |
|
|
|
|
|
|
Mortgage-backed securities |
|
|
— |
|
|
|
|
|
|
|
— |
|
|
|
|
|
Certain assets and liabilities are measured at fair value on a nonrecurring basis; that is, the instruments are not measured at fair value on an ongoing basis but are subject to fair value adjustments in certain circumstances (for example, when there is evidence of impairment). These instruments include other real estate owned, repossessed assets, held to maturity debt securities, loans held for sale, and impaired loans. For the year ended December 31, 2019, the Company had additions to other real estate owned of $
104
The following tables summarize the carrying values and estimated fair values of certain financial instruments not recorded at fair value on a recurring basis:
|
|
|
As of December 31, 2019 |
|
|||||||||||||||||
|
|
|
Carrying |
|
|
Estimated Fair Value |
|
||||||||||||||
|
|
|
Amount |
|
|
Level 1 |
|
|
Level 2 |
|
|
Level 3 |
|
|
Total |
|
|||||
|
|
|
(Dollars in thousands) |
|
|||||||||||||||||
|
Assets |
|
|
|
|
|
|
|
|
|
|
|
|
|
|
|
|
|
|
|
|
|
Cash and due from banks |
|
$ |
|
|
|
$ |
|
|
|
$ |
— |
|
|
$ |
— |
|
|
$ |
|
|
|
Federal funds sold |
|
|
|
|
|
|
|
|
|
|
— |
|
|
|
— |
|
|
|
|
|
|
Held to maturity securities |
|
|
|
|
|
|
— |
|
|
|
|
|
|
|
— |
|
|
|
|
|
|
Loans held for sale |
|
|
|
|
|
|
— |
|
|
|
|
|
|
|
— |
|
|
|
|
|
|
Loans held for investment, net of allowance |
|
|
|
|
|
|
— |
|
|
|
— |
|
|
|
|
|
|
|
|
|
|
Loans held for investment - Warehouse Purchase Program |
|
|
|
|
|
|
— |
|
|
|
|
|
|
|
— |
|
|
|
|
|
|
Other real estate owned |
|
|
|
|
|
|
— |
|
|
|
|
|
|
|
— |
|
|
|
|
|
|
Liabilities |
|
|
|
|
|
|
|
|
|
|
|
|
|
|
|
|
|
|
|
|
|
Deposits: |
|
|
|
|
|
|
|
|
|
|
|
|
|
|
|
|
|
|
|
|
|
Noninterest-bearing |
|
$ |
|
|
|
$ |
— |
|
|
$ |
|
|
|
$ |
— |
|
|
$ |
|
|
|
Interest-bearing |
|
|
|
|
|
|
— |
|
|
|
|
|
|
|
— |
|
|
|
|
|
|
Other borrowings |
|
|
|
|
|
|
— |
|
|
|
|
|
|
|
— |
|
|
|
|
|
|
Securities sold under repurchase agreements |
|
|
|
|
|
|
— |
|
|
|
|
|
|
|
— |
|
|
|
|
|
|
Subordinated notes |
|
|
|
|
|
|
— |
|
|
|
|
|
|
|
— |
|
|
|
|
|
|
|
|
As of December 31, 2018 |
|
|||||||||||||||||
|
|
|
Carrying |
|
|
Estimated Fair Value |
|
||||||||||||||
|
|
|
Amount |
|
|
Level 1 |
|
|
Level 2 |
|
|
Level 3 |
|
|
Total |
|
|||||
|
|
|
(Dollars in thousands) |
|
|||||||||||||||||
|
Assets |
|
|
|
|
|
|
|
|
|
|
|
|
|
|
|
|
|
|
|
|
|
Cash and due from banks |
|
$ |
|
|
|
$ |
|
|
|
$ |
— |
|
|
$ |
— |
|
|
$ |
|
|
|
Federal funds sold |
|
|
|
|
|
|
|
|
|
|
— |
|
|
|
— |
|
|
|
|
|
|
Held to maturity securities |
|
|
|
|
|
|
— |
|
|
|
|
|
|
|
— |
|
|
|
|
|
|
Loans held for sale |
|
|
|
|
|
|
— |
|
|
|
|
|
|
|
— |
|
|
|
|
|
|
Loans held for investment, net of allowance |
|
|
|
|
|
|
— |
|
|
|
— |
|
|
|
|
|
|
|
|
|
|
Other real estate owned |
|
|
|
|
|
|
— |
|
|
|
|
|
|
|
— |
|
|
|
|
|
|
Liabilities |
|
|
|
|
|
|
|
|
|
|
|
|
|
|
|
|
|
|
|
|
|
Deposits: |
|
|
|
|
|
|
|
|
|
|
|
|
|
|
|
|
|
|
|
|
|
Noninterest-bearing |
|
$ |
|
|
|
$ |
— |
|
|
$ |
|
|
|
$ |
— |
|
|
$ |
|
|
|
Interest-bearing |
|
|
|
|
|
|
— |
|
|
|
|
|
|
|
— |
|
|
|
|
|
|
Other borrowings |
|
|
|
|
|
|
— |
|
|
|
|
|
|
|
— |
|
|
|
|
|
|
Securities sold under repurchase agreements |
|
|
|
|
|
|
— |
|
|
|
|
|
|
|
— |
|
|
|
|
|
Entities may choose to measure eligible financial instruments at fair value at specified election dates. The fair value measurement option (1) may be applied instrument by instrument, with certain exceptions, (2) is generally irrevocable and (3) is applied only to entire instruments and not to portions of instruments. Unrealized gains and losses on items for which the fair value measurement option has been elected must be reported in earnings at each subsequent reporting date. During the reported periods, the Company had no financial instruments measured at fair value under the fair value measurement option.
The fair value estimates presented herein are based on pertinent information available to management as of the dates indicated. Although management is not aware of any factors that would significantly affect the estimated fair value amounts, such amounts have not been comprehensively revalued for purposes of these financial statements since those dates and, therefore, current estimates of fair value may differ significantly from the amounts presented herein.
105
The following is a description of valuation methodologies used for assets and liabilities recorded at fair value, non-financial assets and non-financial liabilities, and for estimating fair value for financial instruments not recorded at fair value:
Loans held for sale—Loans held for sale are carried at the lower of cost or estimated fair value. Fair value for consumer mortgages held for sale is based on commitments on hand from investors or prevailing market prices. As such, the Company classifies loans held for sale subjected to nonrecurring fair value adjustments as Level 2.
Loans held for investment—The Company does not record loans at fair value on a recurring basis. As such, valuation techniques discussed herein for loans are primarily for estimating fair value disclosures. The Company refined the calculation to estimate fair value for loans held for investment to be in accordance with ASU 2016-01. The refined discounted cash flow calculation to determine fair value considers internal and market-based information such as prepayment risk, cost of funds and liquidity. From time to time, the Company records nonrecurring fair value adjustments to impaired loans to reflect (1) partial write downs that are based on the observable market price or current appraised value of the collateral, or (2) the full charge-off of the loan carrying value. Where appraisals are not available, estimated cash flows are discounted using a rate commensurate with the credit risk associated with those cash flows. Assumptions regarding credit risk, cash flows and discount rates are judgmentally determined using available market information and specific borrower information.
The Company classifies the estimated fair value of loans held for investment as Level 3.
Other real estate owned—Other real estate owned is primarily foreclosed properties securing residential loans and commercial real estate. Foreclosed assets are adjusted to fair value less estimated costs to sell upon transfer of the loans to other real estate owned. Subsequently, these assets are carried at the lower of carrying value or fair value less estimated costs to sell. Other real estate carried at fair value based on an observable market price or a current appraised value is classified by the Company as Level 2. When management determines that the fair value of other real estate requires additional adjustments, either as a result of a non-current appraisal or when there is no observable market price, the Company classifies the other real estate as Level 3.
8. PREMISES AND EQUIPMENT
Premises and equipment are summarized as follows:
|
|
|
December 31, |
|
|||||
|
|
|
2019 |
|
|
2018 |
|
||
|
|
|
(Dollars in thousands) |
|
|||||
|
Land |
|
$ |
|
|
|
$ |
|
|
|
Buildings |
|
|
|
|
|
|
|
|
|
Furniture, fixtures and equipment |
|
|
|
|
|
|
|
|
|
Construction in progress |
|
|
|
|
|
|
|
|
|
Total |
|
|
|
|
|
|
|
|
|
Less accumulated depreciation |
|
|
( |
) |
|
|
( |
) |
|
Premises and equipment, net |
|
$ |
|
|
|
$ |
|
|
Depreciation expense was $
9. DEPOSITS
Included in interest-bearing deposits are certificates of deposit in amounts of $100,000 or more.
|
Three months or less |
|
$ |
|
|
|
|
|
% |
|
Over three through six months |
|
|
|
|
|
|
|
|
|
Over six through 12 months |
|
|
|
|
|
|
|
|
|
Over 12 months |
|
|
|
|
|
|
|
|
|
Total |
|
$ |
|
|
|
|
|
% |
Interest expense for certificates of deposit in excess of $100,000 was $
106
As of December 31, 2019, the Company had $
10. OTHER BORROWINGS AND SECURITIES SOLD UNDER REPURCHASE AGREEMENTS
The Company utilizes borrowings to supplement deposits to fund its lending and investment activities. Borrowings consist of funds from the Federal Home Loan Bank (“FHLB”), securities sold under repurchase agreements and subordinated notes.
The following table presents the Company’s borrowings at December 31, 2019 and 2018:
|
|
|
December 31, |
|
|||||
|
|
|
2019 |
|
|
2018 |
|
||
|
|
|
(Dollars in thousands) |
|
|||||
|
FHLB advances |
|
$ |
|
|
|
$ |
|
|
|
FHLB long-term notes payable |
|
|
|
|
|
|
|
|
|
Total other borrowings |
|
|
|
|
|
|
|
|
|
Securities sold under repurchase agreements |
|
|
|
|
|
|
|
|
|
Subordinated notes - Fixed to floating rate notes maturing on |
|
|
|
|
|
|
— |
|
|
Total |
|
$ |
|
|
|
$ |
|
|
FHLB advances and long-term notes payable—The Company has an available line of credit with the FHLB of Dallas, which allows the Company to borrow on a collateralized basis. The Company’s FHLB advances are typically considered short-term borrowings and are used to manage liquidity as needed. Maturing advances are replaced by drawing on available cash, making additional borrowings or through increased customer deposits. At December 31, 2019, the Company had total funds of $
Securities sold under repurchase agreements with Company customers—At December 31, 2019, the Company had $
Subordinated notes—On November 1, 2019, the Company merged with LegacyTexas and assumed the obligations related to a $
107
11. INCOME TAXES
The components of the provision for federal income taxes are as follows:
|
|
|
Year Ended December 31, |
|
|||||||||
|
|
|
2019 |
|
|
2018 |
|
|
2017 |
|
|||
|
|
|
(Dollars in thousands) |
|
|||||||||
|
Current |
|
$ |
|
|
|
$ |
|
|
|
$ |
|
|
|
Deferred |
|
|
( |
) |
|
|
|
|
|
|
|
|
|
Total |
|
$ |
|
|
|
$ |
|
|
|
$ |
|
|
The provision for federal income taxes differs from the amount computed by applying the federal income tax statutory rate of
|
|
|
Year Ended December 31, |
|
|||||||||
|
|
|
2019 |
|
|
2018 |
|
|
2017 |
|
|||
|
|
|
(Dollars in thousands) |
|
|||||||||
|
Taxes calculated at statutory rate |
|
$ |
|
|
|
$ |
|
|
|
$ |
|
|
|
(Decrease) increase resulting from: |
|
|
|
|
|
|
|
|
|
|
|
|
|
Excess FMV on restricted stock vesting |
|
|
( |
) |
|
|
( |
) |
|
|
( |
) |
|
Certain compensation >$ |
|
|
|
|
|
|
|
|
|
|
— |
|
|
Non deductible compensation |
|
|
|
|
|
|
— |
|
|
|
— |
|
|
Tax-exempt interest |
|
|
( |
) |
|
|
( |
) |
|
|
( |
) |
|
Qualified School Construction Bond credit |
|
|
( |
) |
|
|
( |
) |
|
|
( |
) |
|
Non taxable death benefits |
|
|
( |
) |
|
|
( |
) |
|
|
( |
) |
|
BOLI income |
|
|
( |
) |
|
|
( |
) |
|
|
( |
) |
|
Leverage lease items |
|
|
— |
|
|
|
— |
|
|
|
( |
) |
|
State tax, net |
|
|
|
|
|
|
|
|
|
|
|
|
|
Other, net |
|
|
|
|
|
|
|
|
|
|
|
|
|
Tax rate change |
|
|
— |
|
|
|
— |
|
|
|
|
|
|
Total |
|
$ |
|
|
|
$ |
|
|
|
$ |
|
|
Year-end deferred taxes are presented in the table below. As a result of the Tax Cuts and Jobs Act enacted on December 22, 2017, deferred taxes as of December 31, 2019 and 2018 are based on the U.S. statutory federal corporate income tax rate of
|
|
|
December 31, |
|
|||||
|
|
|
2019 |
|
|
2018 |
|
||
|
|
|
(Dollars in thousands) |
|
|||||
|
Deferred tax assets: |
|
|
|
|
|
|
|
|
|
Loan purchase discounts |
|
$ |
|
|
|
$ |
|
|
|
Allowance for credit losses |
|
|
|
|
|
|
|
|
|
Accrued liabilities |
|
|
|
|
|
|
|
|
|
Restricted stock |
|
|
|
|
|
|
|
|
|
Deferred compensation |
|
|
|
|
|
|
|
|
|
Certificates of Deposit |
|
|
|
|
|
|
— |
|
|
Net operating losses |
|
|
|
|
|
|
|
|
|
ORE write-downs |
|
|
— |
|
|
|
|
|
|
Other |
|
|
|
|
|
|
|
|
|
Total deferred tax assets |
|
|
|
|
|
|
|
|
|
Deferred tax liabilities: |
|
|
|
|
|
|
|
|
|
Goodwill and core deposit intangibles |
|
|
( |
) |
|
|
( |
) |
|
Bank premises and equipment |
|
|
( |
) |
|
|
( |
) |
|
Securities |
|
|
( |
) |
|
|
( |
) |
|
Unrealized gain on available for sale securities |
|
|
( |
) |
|
|
( |
) |
|
Prepaid expenses |
|
|
( |
) |
|
|
( |
) |
|
Deferred loan fees and costs |
|
|
( |
) |
|
|
( |
) |
|
Investments in partnerships |
|
|
( |
) |
|
|
( |
) |
|
Total deferred tax liabilities |
|
|
( |
) |
|
|
( |
) |
|
Net deferred tax assets (liabilities) |
|
$ |
|
|
|
$ |
( |
) |
108
The ultimate realization of deferred tax assets is dependent upon the generation of future taxable income during the periods in which those temporary differences become deductible. Management considers the scheduled reversal of deferred tax liabilities, projected future taxable income, and tax planning strategies in making this assessment. Based upon the level of historical taxable income and estimates of future taxable income over the periods for which the deferred tax assets are deductible, management believes it is more likely than not the Company will realize the benefits of these deductible differences at December 31, 2019.
Benefits from tax positions are recognized in the financial statements only when it is more likely than not that the tax position will be sustained upon examination by the appropriate taxing authority that would have full knowledge of all relevant information. A tax position that meets the more-likely-than-not recognition threshold is measured at the largest amount of benefit that is greater than fifty percent likely of being realized upon ultimate settlement. Tax positions that previously failed to meet the more-likely-than-not recognition threshold are recognized in the first subsequent financial reporting period in which that threshold is met. Previously recognized tax positions that no longer meet the more-likely-than-not recognition threshold are derecognized in the first subsequent financial reporting period in which that threshold is no longer met. The Company had
Tax Cuts and Jobs Act. The Tax Cuts and Jobs Act was enacted on December 22, 2017. Among other things, the new law (i) establishes a new, flat federal statutory corporate income tax rate of 21%, (ii) eliminates the corporate alternative minimum tax and allows the use of any such carryforwards to offset regular tax liability for any taxable year, (iii) limits the deduction for net interest expense incurred by U.S. corporations, (iv) allows businesses to immediately expense, for tax purposes, the cost of new investments in certain qualified depreciable assets, (v) eliminates or reduces certain deductions related to meals and entertainment expenses, (vi) modifies the limitation on excessive employee remuneration to eliminate the exception for performance-based compensation and clarifies the definition of a covered employee and (vii) limits the deductibility of deposit insurance premiums. The Tax Cuts and Jobs Act also significantly changes U.S. tax law related to foreign operations, however, such changes do not currently impact the Company. As stated above, as a result of the enactment of the Tax Cuts and Jobs Act on December 22, 2017, the Company remeasured its deferred tax assets and liabilities based upon the newly enacted U.S. statutory federal corporate income tax rate of 21%, which is the tax rate at which these assets and liabilities are expected to reverse in the future. The Company recognized a one-time non-cash income tax expense related to the remeasurement of its deferred tax assets and liabilities totaling $
12. STOCK INCENTIVE PROGRAMS
At December 31, 2019, the Company had
On February 22, 2012, Bancshares’ Board of Directors adopted the Prosperity Bancshares, Inc. 2012 Stock Incentive Plan (the “2012 Plan”), which was approved by Bancshares’ shareholders on April 17, 2012. The 2012 Plan authorizes the issuance of up to
Stock Options
Stock options are issued at the current market price on the date of the grant, subject to a pre-determined vesting period with a contractual term of
109
option grant agreements entered into prior to acquisition. The fair value of stock options granted is estimated at the date of grant using the Black-Scholes option-pricing model. The Black-Scholes pricing model utilizes certain assumptions including expected life of the option, risk free interest rate, volatility and dividend yield. Stock-based compensation expense is recognized ratably over the requisite service period for all awards. There were
A summary of changes in outstanding vested and unvested options during the three-year period ended December 31, 2019 is set forth below:
|
|
|
Number of Options |
|
|
Weighted Average Exercise Price |
|
|
Weighted Average Contractual Term |
|
|
Aggregate Intrinsic Value |
|
||||
|
|
|
(In thousands) |
|
|
|
|
|
|
(In years) |
|
|
(In thousands) |
|
|||
|
Options outstanding, December 31, 2016 |
|
|
|
|
|
$ |
|
|
|
|
|
|
|
$ |
|
|
|
Options granted |
|
|
— |
|
|
|
— |
|
|
|
|
|
|
|
|
|
|
Options forfeited |
|
|
— |
|
|
|
— |
|
|
|
|
|
|
|
|
|
|
Options exercised |
|
|
( |
) |
|
|
|
|
|
|
|
|
|
|
|
|
|
Options outstanding, December 31, 2017 |
|
|
— |
|
|
$ |
— |
|
|
|
— |
|
|
|
— |
|
|
Options granted |
|
|
— |
|
|
|
— |
|
|
|
|
|
|
|
|
|
|
Options forfeited |
|
|
— |
|
|
|
— |
|
|
|
|
|
|
|
|
|
|
Options exercised |
|
|
— |
|
|
|
— |
|
|
|
|
|
|
|
|
|
|
Options outstanding, December 31, 2018 |
|
|
— |
|
|
|
— |
|
|
|
— |
|
|
|
— |
|
|
Options granted |
|
|
— |
|
|
|
— |
|
|
|
|
|
|
|
|
|
|
Options forfeited |
|
|
— |
|
|
|
— |
|
|
|
|
|
|
|
|
|
|
Options exercised |
|
|
— |
|
|
|
— |
|
|
|
|
|
|
|
|
|
|
Options outstanding, December 31, 2019 |
|
|
— |
|
|
$ |
— |
|
|
|
— |
|
|
$ |
— |
|
|
Shares vested or expected to vest, December 31, 2019 |
|
|
— |
|
|
$ |
— |
|
|
|
— |
|
|
$ |
— |
|
|
Shares exercisable, December 31, 2019 |
|
|
— |
|
|
$ |
— |
|
|
|
— |
|
|
$ |
— |
|
The Company received
Restricted Stock
The Company has granted shares of restricted stock pursuant to the 2012 Plan. These shares of restricted stock generally vest over a period of
A summary of the status of nonvested shares of restricted stock as of December 31, 2019, and changes during the year then ended is as follows:
|
|
|
Number of Shares |
|
|
Weighted Average Grant Date Fair Value |
|
||
|
|
|
(Shares in thousands) |
|
|||||
|
Nonvested share awards outstanding, December 31, 2018 |
|
|
|
|
|
$ |
|
|
|
Share awards granted |
|
|
|
|
|
|
|
|
|
Unvested share awards forfeited |
|
|
( |
) |
|
|
|
|
|
Share awards vested |
|
|
( |
) |
|
|
|
|
|
Nonvested share awards outstanding, December 31, 2019 |
|
|
|
|
|
$ |
|
|
The total fair value of restricted stock awards that fully vested during the year ended December 31, 2019 was $
110
As of December 31, 2019, there was $
13. OTHER NONINTEREST INCOME AND EXPENSE
Other noninterest income and expense totals are more fully detailed in the following tables.
|
|
|
Years Ended December 31, |
|
|||||||||
|
|
|
2019 |
|
|
2018 |
|
|
2017 |
|
|||
|
|
|
(Dollars in thousands) |
|
|||||||||
|
Other noninterest income |
|
|
|
|
|
|
|
|
|
|
|
|
|
Banking related service fees |
|
$ |
|
|
|
$ |
|
|
|
$ |
|
|
|
Bank Owned Life Insurance (BOLI) |
|
|
|
|
|
|
|
|
|
|
|
|
|
Rental income |
|
|
|
|
|
|
|
|
|
|
|
|
|
Other |
|
|
|
|
|
|
|
|
|
|
|
|
|
Total |
|
$ |
|
|
|
$ |
|
|
|
$ |
|
|
|
Other noninterest expense |
|
|
|
|
|
|
|
|
|
|
|
|
|
Advertising |
|
$ |
|
|
|
$ |
|
|
|
$ |
|
|
|
Losses |
|
|
|
|
|
|
|
|
|
|
|
|
|
Printing and supplies |
|
|
|
|
|
|
|
|
|
|
|
|
|
Professional and legal fees |
|
|
|
|
|
|
|
|
|
|
|
|
|
Property taxes |
|
|
|
|
|
|
|
|
|
|
|
|
|
Travel and development |
|
|
|
|
|
|
|
|
|
|
|
|
|
Other |
|
|
|
|
|
|
|
|
|
|
|
|
|
Total |
|
$ |
|
|
|
$ |
|
|
|
$ |
|
|
14. PROFIT SHARING PLAN
The Company has adopted a profit sharing plan pursuant to Section 401(k) of the Internal Revenue Code (the “Code”), whereby the participants may contribute a percentage of their compensation as permitted under the Code. Matching contributions are made at the discretion of the Company. Presently, the Company matches
15. OFF-BALANCE SHEET ARRANGEMENTS, COMMITMENTS AND CONTINGENCIES
|
|
|
1 year or less |
|
|
More than 1 year but less than 3 years |
|
|
3 years or more but less than 5 years |
|
|
5 years or more |
|
|
Total |
|
|||||
|
|
|
(Dollars in thousands) |
|
|||||||||||||||||
|
Subordinated notes |
|
$ |
|
|
|
$ |
|
|
|
$ |
|
|
|
$ |
|
|
|
$ |
|
|
|
Federal Home Loan Bank advances and notes payable |
|
|
|
|
|
|
|
|
|
|
|
|
|
|
|
|
|
|
|
|
|
Total |
|
$ |
|
|
|
$ |
|
|
|
$ |
|
|
|
$ |
|
|
|
$ |
|
|
Off-Balance Sheet Items
111
In the normal course of business, the Company enters into various transactions that, in accordance with GAAP, are not included in its consolidated balance sheets. The Company enters into these transactions to meet the financing needs of its customers. These transactions include commitments to extend credit and standby letters of credit, which involve, to varying degrees, elements of credit risk and interest rate risk in excess of the amounts recognized in the consolidated balance sheets.
The Company’s commitments associated with outstanding standby letters of credit and commitments to extend credit expiring by period as of December 31, 2019 are summarized below. Since commitments associated with letters of credit and commitments to extend credit may expire unused, the amounts shown do not necessarily reflect the actual future cash funding requirements.
|
|
|
1 year or less |
|
|
More than 1 year but less than 3 years |
|
|
3 years or more but less than 5 years |
|
|
5 years or more |
|
|
Total |
|
|||||
|
|
|
(Dollars in thousands) |
|
|||||||||||||||||
|
Standby letters of credit |
|
$ |
|
|
|
$ |
|
|
|
$ |
|
|
|
$ |
|
|
|
$ |
|
|
|
Unused capacity on Warehouse Purchase Program loans |
|
|
|
|
|
|
— |
|
|
|
— |
|
|
|
— |
|
|
|
|
|
|
Commitments to extend credit |
|
|
|
|
|
|
|
|
|
|
|
|
|
|
|
|
|
|
|
|
|
Total |
|
$ |
|
|
|
$ |
|
|
|
$ |
|
|
|
$ |
|
|
|
$ |
|
|
Standby Letters of Credit. Standby letters of credit are written conditional commitments issued by the Company to guarantee the payment by or performance of a customer to a third party. In the event the customer does not perform in accordance with the terms of the agreement with the third party, the Company would be required to fund the commitment. The maximum potential amount of future payments the Company could be required to make is represented by the contractual amount of the commitment. If the commitment is funded, the Company would be entitled to seek recovery from the customer. The Company’s policies generally require that standby letter of credit arrangements contain security and debt covenants similar to those contained in loan agreements.
Unused Capacity on Warehouse Purchase Program Loans. For Warehouse Purchase Program loans, the Company has established maximum purchase facility amounts, but reserves the right, at any time, to refuse to buy any mortgage loans offered for sale by each customer, for any reason.
Commitments to Extend Credit. The Company enters into contractual commitments to extend credit, normally with fixed expiration dates or termination clauses, at specified rates and for specific purposes. Substantially all of the Company’s commitments to extend credit are contingent upon customers maintaining specific credit standards at the time of loan funding. The Company minimizes its exposure to loss under these commitments by subjecting them to credit approval and monitoring procedures. Management assesses the credit risk associated with certain commitments to extend credit in determining the level of the allowance for credit losses.
At December 31, 2019, $
The Company evaluates customer creditworthiness on a case-by-case basis. The amount of collateral obtained, if considered necessary by the Company upon extension of credit, is based on management’s credit evaluation of the customer.
Leases
The Company’s leases relate primarily to operating leases for office space and banking centers. The Company determines if an arrangement is a lease or contains a lease at inception. The Company’s leases have remaining lease terms of
As of December 31, 2019, the weighted average remaining lease terms of the Company’s operating leases were
112
The Company’s future undiscounted cash payments associated with its operating leases as of December 31, 2019 are summarized below (dollars in thousands).
|
2020 |
|
$ |
|
|
|
2021 |
|
|
|
|
|
2022 |
|
|
|
|
|
2023 |
|
|
|
|
|
2024 |
|
|
|
|
|
Thereafter |
|
|
|
|
|
Total undiscounted lease payments |
|
$ |
|
|
The following table presents a summary of non-cancelable future operating lease commitments as of December 31, 2018 (dollars in thousands):
|
2019 |
|
$ |
|
|
|
2020 |
|
|
|
|
|
2021 |
|
|
|
|
|
2022 |
|
|
|
|
|
2023 |
|
|
|
|
|
Thereafter |
|
|
|
|
|
Total non-cancelable lease payments |
|
$ |
|
|
It is expected that in the normal course of business, expiring leases will be renewed or replaced by leases on other property or equipment.
Rent expense under all operating lease obligations aggregated approximately $
Litigation—The Company and the Bank are defendants, from time to time, in legal actions arising from transactions conducted in the ordinary course of business. After consultations with legal counsel, the Company and the Bank believe that the ultimate liability, if any, arising from such actions will not have a material adverse effect on their financial statements.
16. OTHER COMPREHENSIVE INCOME (LOSS)
|
|
|
For the Years Ended December 31, |
|
|||||||||||||||||||||||||||||||||
|
|
|
2019 |
|
|
2018 |
|
|
2017 |
|
|||||||||||||||||||||||||||
|
|
|
Before Tax Amount |
|
|
Tax Benefit |
|
|
Net of Tax Amount |
|
|
Before Tax Amount |
|
|
Tax Benefit |
|
|
Net of Tax Amount |
|
|
Before Tax Amount |
|
|
Tax Benefit |
|
|
Net of Tax Amount |
|
|||||||||
|
|
|
(Dollars in thousands) |
|
|||||||||||||||||||||||||||||||||
|
Other comprehensive income (loss): |
|
|
|
|
|
|
|
|
|
|
|
|
|
|
|
|
|
|
|
|
|
|
|
|
|
|
|
|
|
|
|
|
|
|
|
|
|
Securities available for sale: |
|
|
|
|
|
|
|
|
|
|
|
|
|
|
|
|
|
|
|
|
|
|
|
|
|
|
|
|
|
|
|
|
|
|
|
|
|
Change in unrealized gain or loss during the period |
|
$ |
|
|
|
$ |
( |
) |
|
$ |
|
|
|
$ |
|
|
|
$ |
( |
) |
|
$ |
|
|
|
$ |
( |
) |
|
$ |
|
|
|
$ |
( |
) |
|
Total securities available for sale |
|
|
|
|
|
|
( |
) |
|
|
|
|
|
|
|
|
|
|
( |
) |
|
|
|
|
|
|
( |
) |
|
|
|
|
|
|
( |
) |
|
Total other comprehensive income (loss) |
|
$ |
|
|
|
$ |
( |
) |
|
$ |
|
|
|
$ |
|
|
|
$ |
( |
) |
|
$ |
|
|
|
$ |
( |
) |
|
$ |
|
|
|
$ |
( |
) |
113
Activity in accumulated other comprehensive income, net of tax, was as follows:
|
|
|
Securities Available for Sale |
|
|
Accumulated Other Comprehensive Income |
|
||
|
|
|
(Dollars in thousands) |
|
|||||
|
Balance at January 1, 2019 |
|
$ |
|
|
|
$ |
|
|
|
Other comprehensive income |
|
|
|
|
|
|
|
|
|
Balance at December 31, 2019 |
|
$ |
|
|
|
$ |
|
|
|
Balance at January 1, 2018 |
|
$ |
( |
) |
|
$ |
( |
) |
|
Other comprehensive income |
|
|
|
|
|
|
|
|
|
Balance at December 31, 2018 |
|
$ |
|
|
|
$ |
|
|
|
Balance at January 1, 2017 |
|
$ |
|
|
|
$ |
|
|
|
Other comprehensive loss |
|
|
( |
) |
|
|
( |
) |
|
Balance at December 31, 2017 |
|
$ |
( |
) |
|
$ |
( |
) |
17. DERIVATIVE FINANCIAL INSTRUMENTS
The following table provides the outstanding notional balances and fair values of outstanding derivative positions at December 31, 2019 and 2018.
|
|
|
December 31, 2019 |
|
|
December 31, 2018 |
|
||||||||||||||||||
|
|
|
Outstanding Notional Balance |
|
|
Asset Derivative Fair Value |
|
|
Liability Derivative Fair Value |
|
|
Outstanding Notional Balance |
|
|
Asset Derivative Fair Value |
|
|
Liability Derivative Fair Value |
|
||||||
|
|
|
(Dollars in thousands) |
|
|||||||||||||||||||||
|
Interest rate lock commitments |
|
$ |
|
|
|
$ |
|
|
|
$ |
— |
|
|
$ |
— |
|
|
$ |
— |
|
|
$ |
— |
|
|
Forward mortgage-backed securities trades |
|
|
|
|
|
|
|
|
|
|
|
|
|
|
— |
|
|
|
— |
|
|
|
— |
|
|
Commercial loan interest rate swaps and caps: |
|
|
|
|
|
|
|
|
|
|
|
|
|
|
|
|
|
|
|
|
|
|
|
|
|
Loan customer counterparty |
|
|
|
|
|
|
|
|
|
|
|
|
|
|
— |
|
|
|
— |
|
|
|
— |
|
|
Financial institution counterparty |
|
|
|
|
|
|
|
|
|
|
|
|
|
|
— |
|
|
|
— |
|
|
|
— |
|
These financial instruments are not designated as hedging instruments and are used for asset and liability management and commercial customers’ financing needs. All derivatives are carried at fair value in either other assets or other liabilities.
Interest rate lock commitments - In the normal course of business, the Company enters into interest rate lock commitments with consumers to originate mortgage loans at a specified interest rate. These commitments, which contain fixed expiration dates, offer the borrower an interest rate guarantee provided the loan meets underwriting guidelines and closes within the timeframe established by the Company.
Forward mortgage-backed securities trades - The Company manages the changes in fair value associated with changes in interest rates related to IRLCs by using forward sold commitments known as forward mortgage-backed securities trades. These instruments are typically entered into at the time the interest rate lock commitment is made.
Interest rate swaps and caps - These derivative positions relate to transactions in which the Company enters into an interest rate swap or cap with a customer, while at the same time entering into an offsetting interest rate swap or cap with another financial institution. An interest rate swap transaction allows the Company’s customer to effectively convert a variable rate loan to a fixed rate. In connection with each swap, the Company agrees to pay interest to the customer on a notional amount at a variable interest rate and receive interest from the customer on a similar notional amount at a fixed interest rate. At the same time, the Company agrees to pay another financial institution the same fixed interest rate on the same notional amount and receive the same variable interest rate on the same notional amount. In connection with each interest rate cap, the Company sells a cap to the customer and agree to pay interest if the underlying index exceeds the strike price defined in the cap agreement. Simultaneously the Company purchases a cap with matching terms from another financial institution that agrees to pay the Company if the underlying index exceeds the strike price.
114
The commercial loan customer counterparty weighted average received and paid interest rates for interest rate swaps outstanding at December 31, 2019 and 2018 are presented in the following table.
|
|
|
Weighted-Average Interest Rate |
|
|||||||||||||
|
|
|
December 31, 2019 |
|
|
December 31, 2018 |
|
||||||||||
|
|
|
Received |
|
|
Paid |
|
|
Received |
|
|
Paid |
|
||||
|
Loan customer counterparty |
|
|
|
% |
|
|
|
% |
|
|
— |
|
|
|
— |
|
The Company’s credit exposure on interest rate swaps is limited to the net favorable value of all swaps by each counterparty, which was approximately $
The initial and subsequent changes in the fair value of IRLCs and the forward sales of mortgage-back securities are recorded in net gain on sale of mortgage loans. These gains and losses were not attributable to instrument-specific credit risk. For interest rate swaps and caps, because the Company acts as an intermediary for its customer, changes in the fair value of the underlying derivative contracts substantially offset each other and do not have a material impact on its results of operations.
|
|
|
Year Ended December 31, |
|
|||||||||
|
Derivatives not designated as hedging instruments |
|
2019 |
|
|
2018 |
|
|
2017 |
|
|||
|
Interest rate lock commitments |
|
$ |
( |
) |
|
$ |
— |
|
|
$ |
— |
|
|
Forward mortgage-backed securities trades |
|
|
( |
) |
|
|
— |
|
|
|
— |
|
18. REGULATORY MATTERS
The Company and the Bank are subject to various regulatory capital requirements administered by the federal banking agencies. Any institution that fails to meet its minimum capital requirements is subject to actions by regulators that could have a direct material effect on the Company’s financial statements. Under the capital adequacy guidelines and the regulatory framework for prompt corrective action, the Bank must meet specific capital guidelines based on the Bank’s assets, liabilities and certain off-balance-sheet items as calculated under regulatory accounting practices. The Company’s and the Bank’s capital amounts and the Bank’s classification under the regulatory framework for prompt corrective action are also subject to qualitative judgments by the regulators about the components, risk weightings and other factors.
The Basel III Capital Rules adopted by the federal regulatory authorities in 2013 substantially revised the risk-based capital requirements applicable to the Company and the Bank. The Basel III Capital Rules became effective for the Company and the Bank on January 1, 2015, subject to a phase-in period for certain provisions. Among other things, the Basel III Capital Rules introduced a new capital measure called “Common Equity Tier 1” (“CET1”), which is a comparison of the sum of certain equity capital components to total risk-weighted assets, and revised the risk-weighting approach of the capital ratios with a more risk-sensitive approach that expanded the risk-weighting categories from the previous Basel I derived categories to a much larger and more risk-sensitive number of categories, depending on the nature of the assets.
To meet the capital adequacy requirements, the Company and the Bank must maintain minimum capital amounts and ratios of CET1, Tier 1 and Total capital to risk weighted assets, and of Tier 1 capital to adjusted quarterly average assets as defined in the regulations. As of December 31, 2019, the Company and the Bank met all capital adequacy requirements to which they were subject.
The Basel III Capital Rules require a “capital conservation buffer,” composed entirely of CET1, in addition to the minimum risk-weighted asset capital ratios. The implementation of the capital conservation buffer began on January 1, 2016 at the
Since being fully phased in on January 1, 2019, the Basel III Capital Rules require the Company to maintain an additional capital conservation buffer, composed entirely of Common Equity Tier 1 (“CET1”), of 2.5%, effectively resulting in minimum ratios of (1) CET1 to risk-weighted assets of
115
Tier 2) to risk-weighted assets of
The CET1, Tier 1 and total capital ratios are calculated by dividing the respective capital amounts by risk weighted assets. Risk weighted assets include total assets, excluding goodwill and other intangible assets, allocated by risk weight category, and certain off-balance-sheet items. The leverage ratio is calculated by dividing Tier 1 capital by adjusted quarterly average total assets, excluding goodwill and other intangible assets.
As of December 31, 2019, the most recent notification from the FDIC categorized the Bank as “well capitalized” under the regulatory framework for prompt corrective action. There have been no conditions or events since that notification which management believes have changed the Bank’s category. To be categorized as well capitalized the Bank must maintain minimum CET1 risk-based, Tier 1 risk-based, total risk-based and Tier 1 leverage ratios as set forth in the table below.
The following is a summary of the Company’s and the Bank’s capital ratios at December 31, 2019 and 2018:
|
|
|
Actual |
|
|
Minimum Required For Capital Adequacy Purposes |
|
|
Minimum Required Plus Capital Conservation Buffer for 2019 |
|
|
To Be Categorized As Well Capitalized Under Prompt Corrective Action Provisions |
|
||||||||||||||||||||
|
|
|
Amount |
|
|
Ratio |
|
|
Amount |
|
|
Ratio |
|
|
Amount |
|
|
Ratio |
|
|
Amount |
|
|
Ratio |
|
||||||||
|
|
|
(Dollars in thousands) |
|
|||||||||||||||||||||||||||||
|
CONSOLIDATED: |
|
|
|
|
|
|
|
|
|
|
|
|
|
|
|
|
|
|
|
|
|
|
|
|
|
|
|
|
|
|
|
|
|
As of December 31, 2019 (1) |
|
|
|
|
|
|
|
|
|
|
|
|
|
|
|
|
|
|
|
|
|
|
|
|
|
|
|
|
|
|
|
|
|
CET1 Capital (to Risk Weighted Assets) |
|
$ |
|
|
|
|
|
% |
|
$ |
|
|
|
|
|
% |
|
$ |
|
|
|
|
|
% |
|
|
N/A |
|
|
|
N/A |
|
|
Tier 1 Capital (to Risk Weighted Assets) |
|
|
|
|
|
|
|
% |
|
|
|
|
|
|
|
% |
|
|
|
|
|
|
|
% |
|
|
N/A |
|
|
|
N/A |
|
|
Total Capital (to Risk Weighted Assets) |
|
|
|
|
|
|
|
% |
|
|
|
|
|
|
|
% |
|
|
|
|
|
|
|
% |
|
|
N/A |
|
|
|
N/A |
|
|
Tier 1 Capital (to Average Tangible Assets) |
|
|
|
|
|
|
|
% |
|
|
|
|
|
|
|
% |
|
|
|
|
|
|
|
% |
|
|
N/A |
|
|
|
N/A |
|
|
As of December 31, 2018 (1) |
|
|
|
|
|
|
|
|
|
|
|
|
|
|
|
|
|
|
|
|
|
|
|
|
|
|
|
|
|
|
|
|
|
CET1 Capital (to Risk Weighted Assets) |
|
$ |
|
|
|
|
|
% |
|
$ |
|
|
|
|
|
% |
|
$ |
|
|
|
|
|
% |
|
|
N/A |
|
|
|
N/A |
|
|
Tier 1 Capital (to Risk Weighted Assets) |
|
|
|
|
|
|
|
% |
|
|
|
|
|
|
|
% |
|
|
|
|
|
|
|
% |
|
|
N/A |
|
|
|
N/A |
|
|
Total Capital (to Risk Weighted Assets) |
|
|
|
|
|
|
|
% |
|
|
|
|
|
|
|
% |
|
|
|
|
|
|
|
% |
|
|
N/A |
|
|
|
N/A |
|
|
Tier 1 Capital (to Average Tangible Assets) |
|
|
|
|
|
|
|
% |
|
|
|
|
|
|
|
% |
|
|
|
|
|
|
|
% |
|
|
N/A |
|
|
|
N/A |
|
|
BANK ONLY: |
|
|
|
|
|
|
|
|
|
|
|
|
|
|
|
|
|
|
|
|
|
|
|
|
|
|
|
|
|
|
|
|
|
As of December 31, 2019 (1) |
|
|
|
|
|
|
|
|
|
|
|
|
|
|
|
|
|
|
|
|
|
|
|
|
|
|
|
|
|
|
|
|
|
CET1 Capital (to Risk Weighted Assets) |
|
$ |
|
|
|
|
|
% |
|
$ |
|
|
|
|
|
% |
|
$ |
|
|
|
|
|
% |
|
$ |
|
|
|
|
|
% |
|
Tier 1 Capital (to Risk Weighted Assets) |
|
|
|
|
|
|
|
% |
|
|
|
|
|
|
|
% |
|
|
|
|
|
|
|
% |
|
|
|
|
|
|
|
% |
|
Total Capital (to Risk Weighted Assets) |
|
|
|
|
|
|
|
% |
|
|
|
|
|
|
|
% |
|
|
|
|
|
|
|
% |
|
|
|
|
|
|
|
% |
|
Tier 1 Capital (to Average Tangible Assets) |
|
|
|
|
|
|
|
% |
|
|
|
|
|
|
|
% |
|
|
|
|
|
|
|
% |
|
|
|
|
|
|
|
% |
|
As of December 31, 2018 (1) |
|
|
|
|
|
|
|
|
|
|
|
|
|
|
|
|
|
|
|
|
|
|
|
|
|
|
|
|
|
|
|
|
|
CET1 Capital (to Risk Weighted Assets) |
|
$ |
|
|
|
|
|
% |
|
$ |
|
|
|
|
|
% |
|
$ |
|
|
|
|
|
% |
|
$ |
|
|
|
|
|
% |
|
Tier 1 Capital (to Risk Weighted Assets) |
|
|
|
|
|
|
|
% |
|
|
|
|
|
|
|
% |
|
|
|
|
|
|
|
% |
|
|
|
|
|
|
|
% |
|
Total Capital (to Risk Weighted Assets) |
|
|
|
|
|
|
|
% |
|
|
|
|
|
|
|
% |
|
|
|
|
|
|
|
% |
|
|
|
|
|
|
|
% |
|
Tier 1 Capital (to Average Tangible Assets) |
|
|
|
|
|
|
|
% |
|
|
|
|
|
|
|
% |
|
|
|
|
|
|
|
% |
|
|
|
|
|
|
|
% |
|
(1) |
Calculated pursuant to the phase-in provisions of the Basel III Capital Rules. |
116
Dividends paid by Bancshares and the Bank are subject to restrictions by certain regulatory agencies. Dividends declared to be paid by Bancshares during the years ended December 31, 2019, 2018 and 2017 were $
19. PARENT COMPANY ONLY FINANCIAL STATEMENTS
PROSPERITY BANCSHARES, INC.
(Parent Company Only)
CONDENSED BALANCE SHEETS
|
|
|
December 31, |
|
|||||
|
|
|
2019 |
|
|
2018 |
|
||
|
|
|
(Dollars in thousands) |
|
|||||
|
ASSETS |
|
|
|
|
|
|
|
|
|
Cash |
|
$ |
|
|
|
$ |
|
|
|
Investment in subsidiary |
|
|
|
|
|
|
|
|
|
Goodwill |
|
|
|
|
|
|
|
|
|
Other assets |
|
|
|
|
|
|
|
|
|
TOTAL |
|
$ |
|
|
|
$ |
|
|
|
|
|
|
|
|
|
|
|
|
|
LIABILITIES AND SHAREHOLDERS’ EQUITY |
|
|
|
|
|
|
|
|
|
LIABILITIES: |
|
|
|
|
|
|
|
|
|
Accrued interest payable and other liabilities |
|
$ |
|
|
|
$ |
— |
|
|
Subordinated notes |
|
|
|
|
|
|
— |
|
|
Total liabilities |
|
|
|
|
|
|
— |
|
|
SHAREHOLDERS’ EQUITY: |
|
|
|
|
|
|
|
|
|
Common stock |
|
|
|
|
|
|
|
|
|
Capital surplus |
|
|
|
|
|
|
|
|
|
Retained earnings |
|
|
|
|
|
|
|
|
|
Unrealized gain (loss) on available for sale securities, net of tax |
|
|
|
|
|
|
|
|
|
Total shareholders’ equity |
|
|
|
|
|
|
|
|
|
TOTAL |
|
$ |
|
|
|
$ |
|
|
117
PROSPERITY BANCSHARES, INC.
(Parent Company Only)
CONDENSED STATEMENTS OF INCOME
|
|
|
For the Years Ended December 31, |
|
||||||||||
|
|
|
2019 |
|
|
2018 |
|
|
2017 |
|
||||
|
|
|
(Dollars in thousands) |
|
||||||||||
|
OPERATING INCOME: |
|
|
|
|
|
|
|
|
|
|
|
|
|
|
Dividends from subsidiary |
|
$ |
|
|
|
$ |
|
|
|
$ |
|
|
|
|
Other income |
|
|
|
|
|
|
|
|
|
|
|
|
|
|
Total income |
|
|
|
|
|
|
|
|
|
|
|
|
|
|
OPERATING EXPENSE: |
|
|
|
|
|
|
|
|
|
|
|
|
|
|
Subordinated notes and trust preferred interest expense |
|
|
|
|
|
|
— |
|
|
|
— |
|
|
|
Stock based compensation expense (includes restricted stock) |
|
|
|
|
|
|
|
|
|
|
|
|
|
|
Merger related expenses |
|
|
|
|
|
|
— |
|
|
|
— |
|
|
|
Other expenses |
|
|
|
|
|
|
|
|
|
|
|
|
|
|
Total operating expense |
|
|
|
|
|
|
|
|
|
|
|
|
|
|
INCOME BEFORE INCOME TAX BENEFIT AND EQUITY IN UNDISTRIBUTED EARNINGS OF SUBSIDIARIES |
|
|
|
|
|
|
|
|
|
|
|
|
|
|
FEDERAL INCOME TAX BENEFIT (EXPENSE) |
|
|
|
|
|
|
|
|
|
|
( |
) |
|
|
INCOME BEFORE EQUITY IN UNDISTRIBUTED EARNINGS OF SUBSIDIARIES |
|
|
|
|
|
|
|
|
|
|
|
|
|
|
EQUITY IN UNDISTRIBUTED EARNINGS OF SUBSIDIARIES |
|
|
( |
) |
|
|
|
|
|
|
|
|
|
|
NET INCOME |
|
$ |
|
|
|
$ |
|
|
|
$ |
|
|
|
118
PROSPERITY BANCSHARES, INC.
(Parent Company Only)
CONDENSED STATEMENTS OF COMPREHENSIVE INCOME
|
|
|
For the Years Ended December 31, |
|
|||||||||
|
|
|
2019 |
|
|
2018 |
|
|
2017 |
|
|||
|
|
|
(Dollars in thousands) |
|
|||||||||
|
Net income |
|
$ |
|
|
|
$ |
|
|
|
$ |
|
|
|
Other comprehensive income (loss), before tax: |
|
|
|
|
|
|
|
|
|
|
|
|
|
Securities available for sale: |
|
|
|
|
|
|
|
|
|
|
|
|
|
Change in unrealized gain or loss during the period |
|
|
|
|
|
|
|
|
|
|
( |
) |
|
Total other comprehensive income (loss) |
|
|
|
|
|
|
|
|
|
|
( |
) |
|
Deferred tax related to other comprehensive income or loss |
|
|
( |
) |
|
|
( |
) |
|
|
|
|
|
Other comprehensive income (loss), net of tax |
|
|
|
|
|
|
|
|
|
|
( |
) |
|
Comprehensive income |
|
$ |
|
|
|
$ |
|
|
|
$ |
|
|
119
PROSPERITY BANCSHARES, INC.
(Parent Company Only)
CONDENSED STATEMENTS OF CASH FLOWS
|
|
|
For the Years Ended December 31, |
|
|||||||||
|
|
|
2019 |
|
|
2018 |
|
|
2017 |
|
|||
|
|
|
(Dollars in thousands) |
|
|||||||||
|
CASH FLOWS FROM OPERATING ACTIVITIES: |
|
|
|
|
|
|
|
|
|
|
|
|
|
Net income |
|
$ |
|
|
|
$ |
|
|
|
$ |
|
|
|
Adjustments to reconcile net income to net cash provided by operating activities: |
|
|
|
|
|
|
|
|
|
|
|
|
|
Equity in undistributed earnings of subsidiaries |
|
|
|
|
|
|
( |
) |
|
|
( |
) |
|
Stock based compensation expense (includes restricted stock) |
|
|
|
|
|
|
|
|
|
|
|
|
|
Decrease (increase) in other assets |
|
|
|
|
|
|
( |
) |
|
|
|
|
|
Increase in accrued interest payable and other liabilities |
|
|
|
|
|
|
— |
|
|
|
— |
|
|
Net cash provided by operating activities |
|
|
|
|
|
|
|
|
|
|
|
|
|
CASH FLOWS FROM INVESTING ACTIVITIES: |
|
|
|
|
|
|
|
|
|
|
|
|
|
Cash paid for acquisitions |
|
|
( |
) |
|
|
— |
|
|
|
— |
|
|
Net cash used in investing activities |
|
|
( |
) |
|
|
— |
|
|
|
— |
|
|
CASH FLOWS FROM FINANCING ACTIVITIES: |
|
|
|
|
|
|
|
|
|
|
|
|
|
Redemption of junior subordinated debentures |
|
|
( |
) |
|
|
— |
|
|
|
— |
|
|
Proceeds from stock option exercises |
|
|
— |
|
|
|
— |
|
|
|
|
|
|
Repurchase of common stock |
|
|
( |
) |
|
|
— |
|
|
|
— |
|
|
Payments of cash dividends |
|
|
( |
) |
|
|
( |
) |
|
|
( |
) |
|
Net cash used in financing activities |
|
|
( |
) |
|
|
( |
) |
|
|
( |
) |
|
NET (DECREASE) INCREASE IN CASH AND CASH EQUIVALENTS |
|
|
|
|
|
|
( |
) |
|
|
|
|
|
CASH AND CASH EQUIVALENTS, BEGINNING OF PERIOD |
|
|
|
|
|
|
|
|
|
|
|
|
|
CASH AND CASH EQUIVALENTS, END OF PERIOD |
|
$ |
|
|
|
$ |
|
|
|
$ |
|
|
120