false--12-31FY20230001058090YesYesNoYesP3YP3YP3YP3YP3Y0001058090us-gaap:DomesticCountryMember2023-01-012023-12-310001058090cmg:NotPartOfShareRepurchasePlanMember2023-01-012023-12-310001058090cmg:NotPartOfShareRepurchasePlanMember2022-01-012022-12-310001058090cmg:NotPartOfShareRepurchasePlanMember2021-01-012021-12-310001058090us-gaap:GeneralAndAdministrativeExpenseMember2023-01-012023-12-310001058090us-gaap:GeneralAndAdministrativeExpenseMember2022-01-012022-12-310001058090us-gaap:GeneralAndAdministrativeExpenseMember2021-01-012021-12-310001058090cmg:AdditionalAuthorizationMember2023-12-140001058090us-gaap:EmployeeStockMember2022-01-012022-12-310001058090us-gaap:EmployeeStockMember2021-01-012021-12-310001058090us-gaap:RetainedEarningsMember2023-12-310001058090us-gaap:AdditionalPaidInCapitalMember2023-12-310001058090us-gaap:AccumulatedOtherComprehensiveIncomeMember2023-12-310001058090us-gaap:RetainedEarningsMember2022-12-310001058090us-gaap:AdditionalPaidInCapitalMember2022-12-310001058090us-gaap:AccumulatedOtherComprehensiveIncomeMember2022-12-310001058090us-gaap:RetainedEarningsMember2021-12-310001058090us-gaap:AdditionalPaidInCapitalMember2021-12-310001058090us-gaap:AccumulatedOtherComprehensiveIncomeMember2021-12-310001058090us-gaap:RetainedEarningsMember2020-12-310001058090us-gaap:AdditionalPaidInCapitalMember2020-12-310001058090us-gaap:AccumulatedOtherComprehensiveIncomeMember2020-12-310001058090us-gaap:OtherOperatingIncomeExpenseMember2023-01-012023-12-310001058090us-gaap:OtherOperatingIncomeExpenseMember2022-01-012022-12-310001058090us-gaap:OtherOperatingIncomeExpenseMember2021-01-012021-12-310001058090us-gaap:TreasuryStockCommonMember2023-12-310001058090us-gaap:CommonStockMember2023-12-310001058090us-gaap:TreasuryStockCommonMember2022-12-310001058090us-gaap:CommonStockMember2022-12-310001058090us-gaap:TreasuryStockCommonMember2021-12-310001058090us-gaap:CommonStockMember2021-12-310001058090us-gaap:TreasuryStockCommonMember2020-12-310001058090us-gaap:CommonStockMember2020-12-310001058090cmg:StockAwards2018Memberus-gaap:PerformanceSharesMember2020-12-300001058090cmg:StockAwards2018Memberus-gaap:PerformanceSharesMember2020-01-012020-12-310001058090cmg:StockOptionsStockAppreciationRightsSosarsMember2022-01-012022-12-310001058090cmg:StockOptionsStockAppreciationRightsSosarsMember2021-01-012021-12-310001058090cmg:StockIncentivePlan2022Member2023-12-310001058090us-gaap:StockAppreciationRightsSARSMember2023-01-012023-12-310001058090us-gaap:PerformanceSharesMembercmg:DefinedMinimumTargetsNotMetMember2022-01-012022-12-310001058090us-gaap:PerformanceSharesMembercmg:DefinedMinimumTargetsNotMetMember2021-01-012021-12-310001058090us-gaap:RestrictedStockUnitsRSUMember2022-12-310001058090us-gaap:PerformanceSharesMember2022-12-310001058090us-gaap:RestrictedStockUnitsRSUMember2022-01-012022-12-310001058090us-gaap:RestrictedStockUnitsRSUMember2021-01-012021-12-310001058090cmg:CertainEquityAwardsOfEmployeeMembercmg:SeparationVestingPeriodMember2022-07-012022-07-310001058090cmg:PerformanceStockAwardsPsusMember2023-01-012023-12-310001058090us-gaap:FoodAndBeverageMember2023-01-012023-12-310001058090cmg:DeliveryServiceMember2023-01-012023-12-310001058090us-gaap:FoodAndBeverageMember2022-01-012022-12-310001058090cmg:DeliveryServiceMember2022-01-012022-12-310001058090us-gaap:FoodAndBeverageMember2021-01-012021-12-310001058090cmg:DeliveryServiceMember2021-01-012021-12-310001058090cmg:VebuMemberus-gaap:SeriesAPreferredStockMember2023-01-012023-12-310001058090cmg:VebuMemberus-gaap:SeriesAPreferredStockMember2022-01-012022-12-310001058090cmg:VebuMemberus-gaap:SeriesAPreferredStockMember2021-01-012021-12-310001058090cmg:TractorMember2021-01-012021-12-310001058090srt:MinimumMemberus-gaap:FurnitureAndFixturesMember2023-12-310001058090srt:MinimumMemberus-gaap:EquipmentMember2023-12-310001058090srt:MinimumMembercmg:LeaseholdImprovementsAndBuildingsMember2023-12-310001058090srt:MaximumMemberus-gaap:FurnitureAndFixturesMember2023-12-310001058090srt:MaximumMemberus-gaap:EquipmentMember2023-12-310001058090srt:MaximumMembercmg:LeaseholdImprovementsAndBuildingsMember2023-12-310001058090us-gaap:LandMember2023-12-310001058090us-gaap:FurnitureAndFixturesMember2023-12-310001058090us-gaap:EquipmentMember2023-12-310001058090us-gaap:ConstructionInProgressMember2023-12-310001058090cmg:LeaseholdImprovementsAndBuildingsMember2023-12-310001058090us-gaap:LandMember2022-12-310001058090us-gaap:FurnitureAndFixturesMember2022-12-310001058090us-gaap:EquipmentMember2022-12-310001058090us-gaap:ConstructionInProgressMember2022-12-310001058090cmg:LeaseholdImprovementsAndBuildingsMember2022-12-310001058090us-gaap:StateAndLocalJurisdictionMember2023-12-310001058090us-gaap:ForeignCountryMember2023-12-310001058090us-gaap:StateAndLocalJurisdictionMember2022-12-310001058090us-gaap:ForeignCountryMember2022-12-310001058090us-gaap:SellingGeneralAndAdministrativeExpensesMember2023-01-012023-12-310001058090us-gaap:SellingGeneralAndAdministrativeExpensesMember2022-01-012022-12-310001058090us-gaap:SellingGeneralAndAdministrativeExpensesMember2021-01-012021-12-310001058090cmg:ChipotleMemberus-gaap:GeographicDistributionForeignMember2023-12-310001058090cmg:ChipotleMembercountry:US2023-12-310001058090cmg:ChipotleMember2023-12-310001058090cmg:NuroMember2022-12-310001058090us-gaap:RevolvingCreditFacilityMembercmg:JpmorganChaseBankMember2023-01-012023-12-310001058090us-gaap:RevolvingCreditFacilityMembercmg:JpmorganChaseBankMember2022-12-310001058090srt:MinimumMember2023-12-310001058090srt:MaximumMember2023-12-310001058090cmg:NuroMember2023-12-310001058090us-gaap:FairValueInputsLevel3Memberus-gaap:CorporateDebtSecuritiesMember2023-12-310001058090us-gaap:FairValueInputsLevel3Membercmg:NoteReceivableMember2023-12-310001058090us-gaap:FairValueInputsLevel1Memberus-gaap:USTreasurySecuritiesMember2023-12-310001058090us-gaap:FairValueInputsLevel1Memberus-gaap:CorporateDebtSecuritiesMember2023-12-310001058090us-gaap:FairValueInputsLevel3Member2023-12-310001058090us-gaap:FairValueInputsLevel3Memberus-gaap:CorporateDebtSecuritiesMember2022-12-310001058090us-gaap:FairValueInputsLevel3Membercmg:NoteReceivableMember2022-12-310001058090us-gaap:FairValueInputsLevel1Memberus-gaap:USTreasurySecuritiesMember2022-12-310001058090us-gaap:FairValueInputsLevel3Member2022-12-310001058090cmg:AccruedLiabilitiesCurrentAndOtherLiabilitiesNoncurrentMember2023-12-310001058090cmg:AccruedLiabilitiesCurrentAndOtherLiabilitiesNoncurrentMember2022-12-310001058090cmg:NuroMember2023-01-012023-12-310001058090cmg:CultivateFundMember2023-12-310001058090cmg:TractorWarrantsMember2022-12-310001058090cmg:TractorMember2022-12-310001058090cmg:CultivateFundMember2022-12-310001058090cmg:TractorMember2023-01-012023-12-310001058090cmg:TractorMember2022-01-012022-12-310001058090cmg:TractorMember2023-12-310001058090us-gaap:RestrictedStockUnitsRSUMember2023-01-012023-12-310001058090cmg:StockOptionsStockAppreciationRightsSosarsMember2023-01-012023-12-310001058090cmg:StockOptionsStockAppreciationRightsSosarsMember2023-12-310001058090cmg:Plan401kMember2022-01-012022-12-310001058090cmg:Plan401kMember2021-01-012021-12-310001058090us-gaap:DomesticPlanMember2023-12-310001058090us-gaap:DomesticPlanMember2022-12-310001058090us-gaap:RevolvingCreditFacilityMembercmg:JpmorganChaseBankMemberus-gaap:SecuredOvernightFinancingRateSofrOvernightIndexSwapRateMember2023-01-012023-12-310001058090cmg:GiftCardMember2023-01-012023-12-310001058090cmg:GiftCardMember2022-01-012022-12-310001058090cmg:GiftCardMember2021-01-012021-12-310001058090cmg:GiftCardMember2023-12-310001058090cmg:ChipotleRewardsMember2023-12-310001058090cmg:GiftCardMember2022-12-310001058090cmg:ChipotleRewardsMember2022-12-310001058090cmg:ChipotleRewardsMember2021-12-310001058090cmg:ChipotleRewardsMember2020-12-310001058090cmg:TractorWarrantsMember2023-12-3100010580902021-12-3100010580902020-12-310001058090us-gaap:MoneyMarketFundsMemberus-gaap:FairValueInputsLevel1Member2023-12-310001058090us-gaap:BankTimeDepositsMemberus-gaap:FairValueInputsLevel1Member2023-12-310001058090us-gaap:CashMember2023-12-310001058090us-gaap:MoneyMarketFundsMemberus-gaap:FairValueInputsLevel1Member2022-12-310001058090us-gaap:BankTimeDepositsMemberus-gaap:FairValueInputsLevel1Member2022-12-310001058090us-gaap:CashMember2022-12-310001058090us-gaap:FairValueMeasurementsNonrecurringMember2023-12-310001058090us-gaap:FairValueMeasurementsNonrecurringMember2022-12-310001058090us-gaap:TreasuryStockCommonMember2023-01-012023-12-310001058090us-gaap:RetainedEarningsMember2023-01-012023-12-310001058090us-gaap:CommonStockMember2023-01-012023-12-310001058090us-gaap:AdditionalPaidInCapitalMember2023-01-012023-12-310001058090us-gaap:AccumulatedOtherComprehensiveIncomeMember2023-01-012023-12-310001058090us-gaap:TreasuryStockCommonMember2022-01-012022-12-310001058090us-gaap:RetainedEarningsMember2022-01-012022-12-310001058090us-gaap:CommonStockMember2022-01-012022-12-310001058090us-gaap:AdditionalPaidInCapitalMember2022-01-012022-12-310001058090us-gaap:AccumulatedOtherComprehensiveIncomeMember2022-01-012022-12-310001058090us-gaap:TreasuryStockCommonMember2021-01-012021-12-310001058090us-gaap:RetainedEarningsMember2021-01-012021-12-310001058090us-gaap:CommonStockMember2021-01-012021-12-310001058090us-gaap:AdditionalPaidInCapitalMember2021-01-012021-12-310001058090us-gaap:AccumulatedOtherComprehensiveIncomeMember2021-01-012021-12-310001058090cmg:ChristopherBrandtMember2023-12-3100010580902023-10-012023-12-3100010580902023-06-3000010580902024-02-020001058090cmg:ChristopherBrandtMember2023-10-012023-12-310001058090us-gaap:RestrictedStockUnitsRSUMember2023-12-310001058090us-gaap:PerformanceSharesMember2023-12-310001058090srt:MinimumMember2023-01-012023-12-310001058090srt:MaximumMember2023-01-012023-12-310001058090us-gaap:PerformanceSharesMember2023-01-012023-12-310001058090us-gaap:PerformanceSharesMember2022-01-012022-12-310001058090us-gaap:PerformanceSharesMember2021-01-012021-12-310001058090us-gaap:FairValueInputsLevel3Memberus-gaap:FairValueMeasurementsNonrecurringMember2023-12-310001058090us-gaap:FairValueInputsLevel3Memberus-gaap:FairValueMeasurementsNonrecurringMember2022-12-310001058090cmg:CertainEquityAwardsOfEmployeeMember2022-07-012022-07-310001058090cmg:StockAwards2018Memberus-gaap:PerformanceSharesMembercmg:SecondHalfVestedMember2023-01-012023-12-310001058090cmg:StockAwards2018Memberus-gaap:PerformanceSharesMembercmg:FirstHalfVestedMember2022-01-012022-12-310001058090cmg:StockAwards2018Memberus-gaap:PerformanceSharesMember2022-01-012022-12-310001058090us-gaap:RevolvingCreditFacilityMembercmg:JpmorganChaseBankMember2023-12-310001058090us-gaap:EmployeeStockMember2023-01-012023-12-310001058090cmg:Plan401kMember2023-01-012023-12-310001058090us-gaap:DomesticPlanMember2023-01-012023-12-310001058090cmg:ChipotleRewardsMember2023-01-012023-12-310001058090cmg:ChipotleRewardsMember2022-01-012022-12-310001058090cmg:ChipotleRewardsMember2021-01-012021-12-310001058090srt:MinimumMemberus-gaap:PerformanceSharesMembercmg:VestingPeriod1Member2023-01-012023-12-310001058090srt:MaximumMemberus-gaap:PerformanceSharesMembercmg:VestingPeriod1Member2023-01-012023-12-310001058090srt:MaximumMemberus-gaap:PerformanceSharesMembercmg:DefinedMinimumTargetsNotMetMember2023-01-012023-12-310001058090srt:MinimumMemberus-gaap:PerformanceSharesMembercmg:VestingPeriod1Member2022-01-012022-12-310001058090srt:MaximumMemberus-gaap:PerformanceSharesMembercmg:VestingPeriod1Member2022-01-012022-12-310001058090srt:MaximumMemberus-gaap:PerformanceSharesMembercmg:DefinedMinimumTargetsNotMetMember2022-01-012022-12-310001058090srt:MinimumMemberus-gaap:PerformanceSharesMembercmg:VestingPeriod1Member2021-01-012021-12-310001058090srt:MaximumMemberus-gaap:PerformanceSharesMembercmg:VestingPeriod1Member2021-01-012021-12-310001058090srt:MaximumMemberus-gaap:PerformanceSharesMember2021-01-012021-12-310001058090us-gaap:EmployeeStockMember2023-12-310001058090us-gaap:FairValueInputsLevel1Member2023-12-3100010580902023-12-310001058090us-gaap:FairValueInputsLevel1Member2022-12-3100010580902022-12-3100010580902023-01-012023-12-3100010580902022-01-012022-12-3100010580902021-01-012021-12-31cmg:segmentiso4217:USDxbrli:sharescmg:regioncmg:employeecmg:itemxbrli:purexbrli:sharesiso4217:USD
UNITED STATES
SECURITIES AND EXCHANGE COMMISSION
WASHINGTON, D.C. 20549
______________________
FORM 10-K
______________________
ANNUAL REPORT PURSUANT TO SECTION 13 OR 15(d) OF THE SECURITIES EXCHANGE ACT OF 1934
For the fiscal year ended December 31, 2023
or
TRANSITION REPORT PURSUANT TO SECTION 13 OR 15(d) OF THE SECURITIES EXCHANGE ACT OF 1934
For the transition period from to
Commission File Number: 1-32731
______________________
CHIPOTLE MEXICAN GRILL, INC.
(Exact name of registrant as specified in its charter)
______________________
| |
Delaware | 84-1219301 |
(State or other jurisdiction of incorporation or organization) | (IRS Employer Identification No.) |
| |
610 Newport Center Drive, Suite 1100 Newport Beach, CA | 92660 |
(Address of Principal Executive Offices) | (Zip Code) |
Registrant’s telephone number, including area code: (949) 524-4000
Securities registered pursuant to Section 12(b) of the Act:
| | |
Title of each class | Trading Symbol(s) | Name of each exchange on which registered |
Common stock, par value $0.01 per share | CMG | New York Stock Exchange |
Securities registered pursuant to Section 12(g) of the Act: None
______________________
Indicate by check mark if the registrant is a well-known seasoned issuer, as defined in Rule 405 of the Securities Act. Yes No
Indicate by check mark if the registrant is not required to file reports pursuant to Section 13 or Section 15(d) of the Act. Yes No
Indicate by check mark whether the registrant: (1) has filed all reports required to be filed by Section 13 or 15(d) of the Securities Exchange Act of 1934 during the preceding 12 months (or for such shorter period that the registrant was required to file such reports), and (2) has been subject to such filing requirements for the past 90 days. Yes No
Indicate by check mark whether the registrant has submitted electronically every Interactive Data File required to be submitted pursuant to Rule 405 of Regulation S-T (§232.405 of this chapter) during the preceding 12 months (or for such shorter period that the registrant was required to submit such files). Yes No .
Indicate by check mark whether the registrant is a large accelerated filer, an accelerated filer, a non-accelerated filer, a smaller reporting company, or an emerging growth company. See the definitions of “large accelerated filer,” “accelerated filer,” “smaller reporting company,” and “emerging growth company” in Rule 12b-2 of the Exchange Act (check one):
| | | | |
Large accelerated filer | Accelerated filer | Non-accelerated filer | Smaller reporting company | Emerging growth company |
If an emerging growth company, indicate by check mark if the registrant has elected not to use the extended transition period for complying with accounting standards provided pursuant to Section 13(a) of the Exchange Act. ¨
Indicate by check mark whether the registrant has filed a report on and attestation to its management’s assessment of the effectiveness of its internal control over financial reporting under Section 404(b) of the Sarbanes-Oxley Act (15 U.S.C. 7262(b)) by the registered public accounting firm that prepared or issued its audit report.
If securities are registered pursuant to Section 12(b) of the Act, indicate by check mark whether the financial statements of the registrant included in the filing reflect the correction of an error to previously issued financial statements.
Indicate by check mark whether any of those error corrections are restatements that required a recovery analysis of incentive-based compensation received by any of the registrant’s executive officers during the relevant recovery period pursuant to §240.10D-1(b).
Indicate by check mark whether the registrant is a shell company (as defined in Rule 12b-2 of the Exchange Act). Yes No
As of June 30, 2023, the aggregate market value of the registrant’s outstanding common equity held by non-affiliates was $46.885 billion, based on the closing price of the registrant’s common stock on June 30, 2023, the last trading day of the registrant’s most recently completed second fiscal quarter. For purposes of this calculation, shares of common stock held by each executive officer and director and by holders of 5% or more of the outstanding common stock have been excluded since those persons may under certain circumstances be deemed to be affiliates. This determination of affiliate status is not necessarily a conclusive determination for other purposes.
As of February 2, 2024, there were 27,421,169 shares of the registrant’s common stock, par value of $0.01 per share outstanding.
DOCUMENTS INCORPORATED BY REFERENCE
Part III incorporates certain information by reference from the registrant’s definitive proxy statement for the 2024 annual meeting of shareholders, which will be filed no later than 120 days after the close of the registrant’s fiscal year ended December 31, 2023.
TABLE OF CONTENTS
PART I |
Item 1. | Business | 3 |
Item 1A. | Risk Factors | 9 |
Item 1B. | Unresolved Staff Comments | 19 |
Item 1C. | Cybersecurity | 19 |
Item 2. | Properties | 20 |
Item 3. | Legal Proceedings | 21 |
Item 4. | Mine Safety Disclosures | 21 |
PART II |
Item 5. | Market for Registrant’s Common Equity, Related Stockholder Matters and Issuer Purchases of Equity Securities | 22 |
Item 6. | Reserved | 24 |
Item 7. | Management’s Discussion and Analysis of Financial Condition and Results of Operations | 24 |
Item 7A. | Quantitative and Qualitative Disclosure About Market Risk | 32 |
Item 8. | Financial Statements and Supplementary Data | 33 |
| Report of Independent Registered Public Accounting Firm (PCAOB ID: 42) | 33 |
| Consolidated Balance Sheets as of December 31, 2023 and 2022 | 35 |
| Consolidated Statements of Income and Comprehensive Income for the years ended December 31, 2023, 2022 and 2021 | 36 |
| Consolidated Statements of Shareholders’ Equity for the years ended December 31, 2023, 2022 and 2021 | 37 |
| Consolidated Statements of Cash Flows for the years ended December 31, 2023, 2022 and 2021 | 38 |
| Notes to Consolidated Financial Statements | 39 |
| Note 1 – Description of Business and Summary of Significant Accounting Policies | 39 |
| Note 2 – Supplemental Balance Sheet Information | 45 |
| Note 3 – Revenue Recognition | 46 |
| Note 4 – Fair Value Measurements | 47 |
| Note 5 – Equity Investments | 49 |
| Note 6 – Income Taxes | 49 |
| Note 7 – Shareholders’ Equity | 52 |
| Note 8 – Stock-Based Compensation and Employee Benefit Plans | 52 |
| Note 9 – Leases | 56 |
| Note 10 – Earnings Per Share | 57 |
| Note 11 – Commitments and Contingencies | 57 |
| Note 12 – Debt | 57 |
| Note 13 – Related Party Transactions | 58 |
Item 9. | Changes in and Disagreements With Accountants on Accounting and Financial Disclosure | 58 |
Item 9A. | Controls and Procedures | 58 |
Item 9B. | Other Information | 61 |
Item 9C. | Disclosure Regarding Foreign Jurisdictions that Prevent Inspections | 61 |
PART III |
Item 10. | Directors, Executive Officers and Corporate Governance | 61 |
Item 11. | Executive Compensation | 62 |
Item 12. | Security Ownership of Certain Beneficial Owners and Management and Related Stockholder Matters | 62 |
Item 13. | Certain Relationships and Related Transactions, and Director Independence | 62 |
Item 14. | Principal Accounting Fees and Services | 62 |
PART IV |
Item 15. | Exhibits, Financial Statement Schedules | 63 |
Item 16. | Form 10-K Summary | 65 |
| Signatures | 66 |
PART I
Cautionary Note Regarding Forward-Looking Statements
This report includes “forward-looking” statements within the meaning of the Private Securities Litigation Reform Act of 1995, including projected cash from operations, expected capital expenditures for 2024 and all other statements that are not historical facts. We use words such as “may,” “will,” “should,” “expect,” “intend,” “plan,” “anticipate,” “believe,” “think,” “estimate,” “seek,” “expect,” “predict,” “could,” “project,” “potential”, “goal” and other similar terms and phrases, including references to assumptions, to identify forward-looking statements. These forward-looking statements are based on currently available operating, financial and competitive information and are subject to various risks and uncertainties. Our actual future results and trends may differ materially depending on a variety of factors, including, but not limited to, the risks and uncertainties described in this report under the heading “Risk Factors” and “Management’s Discussion and Analysis of Financial Condition and Results of Operations,” so you should not place undue reliance on forward-looking statements. These statements are subject to risks and uncertainties that could cause actual results to differ materially from those described in the statements, including: increasing wage inflation and the competitive labor market, including as a result of regulations such as California AB 1228, which impacts our ability to attract and retain qualified employees and has resulted in occasional staffing shortages; increases in ingredient and other operating costs and the inability of our third-party suppliers and business partners to fulfill their responsibilities and commitments due to inflation, global conflicts, climate change, our Food with Integrity philosophy, tariffs or trade restrictions and supply shortages; increasing supply costs (including beef, tortillas, queso, salsa, beans and rice); risks of food safety incidents and food-borne illnesses; risks associated with our reliance on certain information technology systems operated by us or by third parties and potential failures, outages or interruptions; privacy and cybersecurity risks, including risk of breaches, unauthorized access, theft, modification, destruction or ransom of guest or employee personal or confidential information stored on our network or the network of third-party providers; the impact of competition, including from sources outside the restaurant industry; the competitive labor market and changes in the availability and cost of labor and the impact of any union organizing efforts and our responses to such efforts; the financial impact of increasing our average hourly wage; the impact of federal, state or local government regulations relating to our employees, employment practices, restaurant design and construction, and the sale of food or alcoholic beverages; our ability to achieve our planned growth, such as the costs and availability of suitable new restaurant sites and the equipment needed to fully outfit new restaurants, construction materials and contractors and the expected costs to accelerate our international expansion through franchise restaurants in the Middle East; the uncertainty of our ability to achieve expected levels of comparable restaurant sales due to factors such as changes in guests' perceptions of our brand, including as a result of actual or rumored food safety concerns or other negative publicity, decreased overall consumer spending, including as a result of high inflation, mass layoffs, fears of possible recession and higher energy costs, or the inability to increase menu prices or realize the benefits of menu price increases; risks associated with our digital business, including risks arising from our reliance on third party delivery services; and risks relating to litigation, including possible governmental actions and potential class action litigation related to food safety incidents, cybersecurity incidents, employment or privacy laws, advertising claims or other matters. We are including this Cautionary Note to make applicable and take advantage of the safe harbor provisions of the Private Securities Litigation Reform Act of 1995 for forward-looking statements. We expressly disclaim any obligation to update or revise any forward-looking statements after the date of this report as a result of new information, future events or other developments, except as required by applicable laws and regulations.
ITEM 1. BUSINESS
General
Chipotle Mexican Grill, Inc., a Delaware corporation, together with its subsidiaries (“Chipotle,” “we,” “us,” or “our”) owns and operates Chipotle Mexican Grill restaurants, which feature a relevant menu of burritos, burrito bowls (a burrito without the tortilla), quesadillas, tacos, and salads. We strive to cultivate a better world by serving responsibly sourced, classically cooked, real food with wholesome ingredients and without artificial colors, flavors or preservatives. We are passionate about providing a great guest experience and making our food more accessible to everyone while continuing to be a brand with a demonstrated purpose. Our first Chipotle restaurant opened in Denver, Colorado in 1993. Over 30 years later, our devotion to seeking out high-quality ingredients, raised with respect for animals, farmers, and the environment, remains at the core of our commitment to Food with Integrity.
As of December 31, 2023, we owned and operated 3,371 Chipotle restaurants throughout the United States (“U.S.”) and 66 international Chipotle restaurants. We manage our operations based on eight regions and aggregate our operations to one reportable segment. Our revenue is derived from sales by our restaurants.
Business Strategy
We are a brand with a demonstrated purpose of Cultivating a Better World. Our mission is to win today while we grow our future by focusing on five key fundamental strategies:
Sustaining world class people leadership by developing and retaining diverse talent at every level;
Running successful restaurants with a people accountable culture that provides great Food with Integrity while delivering exceptional in-restaurant and digital experiences;
Making the brand visible, relevant, and loved to improve overall guest engagement;
Amplifying technology and innovation to drive growth and productivity at our restaurants, support centers and in our supply chain; and
Expanding access and convenience by accelerating new restaurant openings in North America and internationally.
Food with Integrity
Serving high-quality food while still charging reasonable prices is critical to ensuring guests enjoy wholesome food at a great value. In our Chipotle restaurants, we strive to serve only meats that are raised in accordance with criteria we have established in an effort to improve sustainability and promote animal welfare, and without the use of non-therapeutic antibiotics or added growth hormones. We brand these meats as “Responsibly Raised®.” We also seek to use responsibly grown produce, by which we mean produce grown by suppliers whose practices conform to our Food with Integrity standards and our priorities with respect to environmental considerations and employee welfare. For more information about our sustainability and animal welfare initiatives, see our biennial Sustainability Report and interim Update Report on our website www.chipotle.com/sustainability.
Purchasing
Maintaining the high levels of quality and safety we demand in our restaurants depends in part on our ability to acquire high-quality, fresh ingredients and other necessary supplies that meet our specifications from reliable suppliers. Our 26 independently owned and operated regional distribution centers purchase from various suppliers we carefully select based on quality, price, availability, and the suppliers’ understanding of and adherence to our mission and Food with Integrity standards. We have also sought to increase, where practical, the number of suppliers for our ingredients to help mitigate pricing volatility and reduce our reliance on one or several suppliers, which could create supply shortages. In addition, we closely monitor industry news, trade tariffs, weather, exchange rates, foreign demand, crises and other world events that may affect our ingredient prices or available supply. Certain key ingredients (beef, tomatoes, tortillas and adobo) are purchased from a small number of suppliers.
Quality Assurance and Food Safety
We are committed to serving only safe, high-quality food. Our food safety and quality assurance teams work to ensure compliance with our food safety programs and practices, components of which include:
natural inhibitors (to prevent microbial growth in ingredients);
advanced technologies (tools that reduce or eliminate pathogens while maintaining food quality);
enhanced restaurant procedures (protocols for handling ingredients and sanitizing surfaces in our restaurants);
food safety certifications;
internal and third-party restaurant inspections;
small grower support during on-site audits;
supplier interventions (steps to mitigate food safety risks before ingredients reach Chipotle); and
ingredient traceability.
These and other food safety practices underscore our commitment to be a leader in food safety while continuing to serve high-quality food that our guests love. Our food safety and quality assurance teams establish and monitor our quality and food safety programs and work closely with suppliers to ensure our high standards are met throughout the supply chain. We maintain a limited list of approved suppliers, many of whom are among the top suppliers in the industry. In addition, we have a team approach where our training, operations, culinary, legal and restaurant food safety and quality assurance departments develop and implement operating standards for food quality, food preparation, restaurant cleanliness, employee health protocols, and safety in the restaurants. Our food safety programs are also intended to ensure that we not only continue to comply with applicable national, federal, state and local food safety regulations, but also establish Chipotle as an industry leader in food safety. To help achieve this goal, we have a Food Safety Advisory Council comprised of some of the nation’s foremost food safety authorities. The Food Safety Advisory Council is charged with evaluating our programs and advising us on ways to elevate our already high standards for food safety. Our food safety and quality assurance team members hold board seats and participate in technical working groups with several associations. This gives us the opportunity to learn and share our knowledge and expertise with other food safety professionals and regulatory agencies.
Digital Business
Our digital platform continues to be a strategic driver of our growth. In recent years, we have significantly upgraded our capabilities by digitizing our restaurant kitchens, expanding our partnerships with third-party delivery services and building more Chipotlanes, which is our drive through format for customer pick-up of digital orders. Digital sales represent food and beverage revenue generated through the Chipotle website, Chipotle app or third-party delivery aggregators and include revenue deferrals associated with Chipotle Rewards. Digital sales represented 37.4% of food and beverage revenue in 2023, compared to 39.4% of food and beverage revenue in 2022. We have made digital ordering convenient with enhancements to the Chipotle app and website, such as customization, contactless delivery, and group ordering and we have improved the overall guest experience within the app with the inclusion of order readiness messaging, wrong location detection and reminders to scan for points.
Human Capital
At Chipotle, our vision is to cultivate an environment where our employees can thrive, pursue their passion and become lifelong leaders. We believe in investing and supporting our people because they are our most important asset and give us a competitive advantage in our business. As of December 31, 2023, Chipotle employed 116,068 people worldwide and 1,088 contract workers. Of our employees, 114,042 worked in the United States, and 2,026 worked internationally across Canada, France, Germany, and the United Kingdom. Within the U.S., 112,572 employees worked in our restaurants, and 1,470 in our Restaurant Support Centers. There were no union petitions or campaigns in 2023. We continue to bargain with the one restaurant that voted in 2022 to form a union, and we believe that our relationship with our employees is good. We also believe our efforts to manage our workforce have been effective, as evidenced by a strong culture and our employees’ demonstrated commitment to living our purpose and values.
Talent Acquisition
We continue to invest heavily in recruiting top talent and ensuring appropriate staffing levels are maintained, especially during our two peak hiring seasons (spring and fall). We focus on new and innovative ways to attract and engage talent for our restaurants, which includes marketing campaigns that build on our documentary-style television spots, featuring unscripted testimonials from team members about the impact Chipotle has had on their lives. We invest in advertising on social media and highlight growth opportunities and the possible trajectory of achieving six-figure total compensation in approximately three years.
Additionally, we now offer a formal Summer Internship Program to invest in students while creating opportunities for our restaurant employees to further gain exposure to our Restaurant Support Centers.
Diversity, Equity & Inclusion
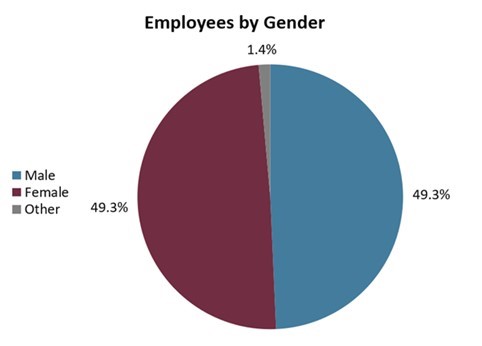
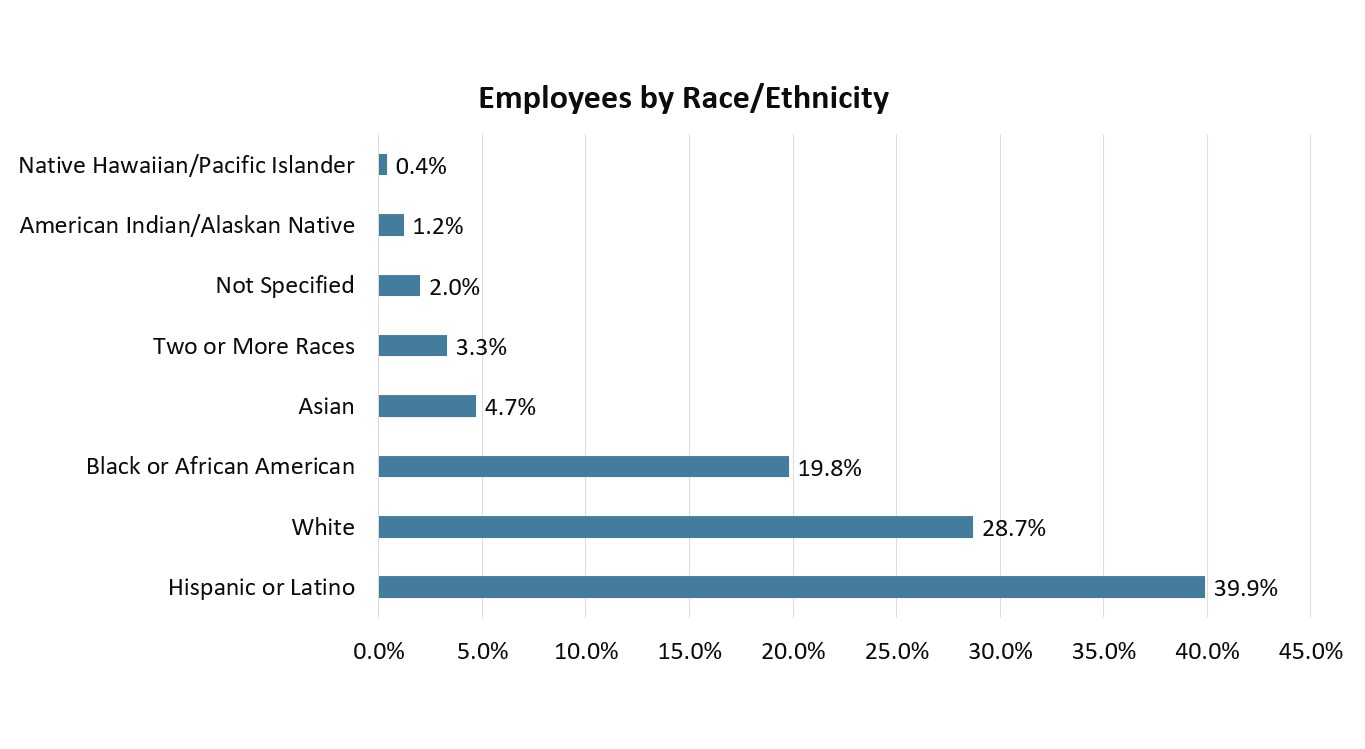
Maintaining a diverse, equitable and inclusive work environment is critical to our success as a business. As of December 31, 2023, U.S.-based employee diversity statistics were as follows:
Our most recent EEO-1 consolidated report is posted on the Investors page of our website at www.ir.chipotle.com under Corporate Governance – Human Capital Information and additional details about the demographics of our employee population is included in our biennial Sustainability Report and interim Update Report on our website www.chipotle.com/sustainability.
Notably, our rate of internal promotions for 2023 was similar within our employee populations, with approximately 50% of promoted employees identifying as female and 39% of promoted employees identifying as Hispanic or Latino.
We have undertaken several actions to promote diverse, equitable and inclusive work environments.
We created a consistent and structured candidate interview process with new interview guides. This ensures quality, speed and equitable hiring practices are followed throughout internal and external candidate interviews. We also launched an internal job board across multiple communication channels to our employees to provide increased visibility and access to internal opportunities.
Since December 2021, we have participated in Management Leadership for Tomorrow’s Black Equity at Work Certification Program, which establishes a comprehensive aggregate measurement system and provides a rigorous, results-oriented approach that accelerates progress toward Black equity internally, amongst our employees, and externally by supporting Black equity within our business partners and in the communities where we operate.
In early 2023, we engaged an independent third-party consultant to conduct a Talent Management Equity Audit to identify places in our talent management cycle where we may need to eliminate bias and/or create more equitable policies, practices, and procedures; identify potential blockers and new opportunities to create and sustain equity in talent management; and identify key strengths and pockets of risk. The consultant concluded that Chipotle has a robust set of processes, practices and policies to enable equitable talent recruiting, development and retention throughout the company and identified opportunities to strengthen Chipotle’s existing practices. See the Investors page of our website at www.ir.chipotle.com under Corporate Governance – Human Capital Information for additional details.
We have a holistic approach to pay equity to ensure consistent and equitable treatment among our employees. We retain an independent third-party compensation consultant each year to conduct a pay equity analysis of our U.S. and Canadian workforce, including factors of pay (e.g., grade level, tenure in role, most recent promotion) and external market conditions (e.g., geographic location), to ensure consistency and equitable treatment among our employees. In 2023, our review included 99% of our U.S. and Canadian employee population, excluding only approximately 50 of our most senior management employees. The analysis identified small, isolated pay gaps for certain segments of the population, and we subsequently made pay adjustments to close those gaps. Since there are not many common roles among our 50 most senior executives, we consider both internal equity by level as well as individualized market data to help ensure we maintain pay equity among this group.
Talent Development
We provide high-quality growth and development opportunities to retain top talent and support internal promotions. In 2023, we had more than 24,000 internal promotions, including 100% of U.S. based Regional Vice Presidents, 87% of Team Directors, and 87% of Field Leaders. To develop our employees, we provide the following programs:
Leadership Evolution and Development: Focuses on preparing a cross-functional cohort of mid-level managers for the future of work and leadership. During the 9-month program, participants learn the critical capabilities of leading oneself, leading others, and leading the business with topics designed to stretch capabilities and improve decision-making skills.
Cultivate University: A four-day immersive leadership experience designed to upskill our new multi-unit restaurant leaders to excel in their role and execute on their Top 5 KPIs. Participants are introduced to a variety of leadership models as well as operational tools to support them in leading effective teams and driving results in their restaurants.
General Manager Upskilling: Trains our restaurant leaders in fundamental soft skills to help bolster their leadership acumen so that they can better lead their teams and create an exceptional guest experience.
Executive Development: Focuses on developing high potential Team Directors in areas such as leadership, marketing, business and finance, data and analytics, ESG and hospitality, so they gain an in-depth understanding of various functions within the company.
Teach & Taste Live seminars: Offers lunch and learn sessions on leadership topics such as effective communication, emotional intelligence, and building a culture of accountability to provide on-going professional development for employees at our Restaurant Support Centers. Each course introduces a new leadership skill and offers best practices and actionable tools to continue developing the top talent that supports our field operations.
Development courses and online programs that focus on creating a culture of belonging.
Online executive coaching for mid- and senior-level leaders throughout the organization.
Succession Planning: We utilize talent calibrations to identify a diverse pipeline of emerging leaders and define appropriate development programs.
Total Rewards
The financial, physical, and mental wellness of our employees remains our top priority and we believe we have compelling compensation packages and incentive programs, and a robust suite of benefit offerings that enable us to engage current team members and attract new team members:
We have made substantial investments in our compensation packages, including competitive wages and industry leading incentive programs, such as our annual and quarterly bonus programs, which allow us to attract and retain the top talent in the industry.
We offer a Debt-Free Degree program that provides Chipotle employees access to nearly 100 degrees at 10 universities, completely tuition debt free.
We support Career Certificates, which further enhances our Tuition Assistance benefits by providing on-demand certificate programs to help Chipotle team members advance their careers in as little as eight weeks.
In 2023, we launched a program that provides our medically enrolled employees and their families with a Health Pro who can help them navigate the complex healthcare environment, helping them understand how their health benefits cover their care, how to save money, as well as get expert, high-quality medical care.
In 2023, we also offered personalized mental health assistance to all Chipotle employees and their family members with support available 24/7 via in-person, phone, or virtual visits with a licensed counselor.
Starting in 2024, we are partnering with SoFi to offer student loan payment matching programs via our 401(k)-retirement program. This, in addition to a credit optimization service, will help bolster our employees’ financial well-being.
Culture and Engagement
Giving employees the opportunity to provide anonymous feedback is a key part of our employee engagement strategy, which positively contributes to our culture. This begins with soliciting feedback regarding onboarding. As of December 31, 2023, 9 in 10 respondents in our restaurants reported a favorable onboarding experience. For our employees in field support organizations and Restaurant Support Centers, nearly 95% of respondents had a favorable view of their onboarding. Results of our surveys are shared with business partners and senior leaders, who continuously work to improve the experience for all employees.
To encourage a collaborative working culture between our Restaurant Support Centers and restaurant operations, we created an Operations Council comprised of employees from restaurant and field leadership, operations, and our business partners, who work together to share feedback and implement new projects collaboratively.
Additionally, to promote an engaged culture, we respond to employees quickly via our Employee Service Center (“ESC”). The ESC is available seven days a week to resolve employee questions about things like restaurant health and safety, compliance, benefits, payroll, etc. We also maintain a confidential Respectful Workplace Hotline that allows employees to anonymously report concerns like sexual harassment, discrimination, and retaliation.
Government Regulation and Environmental Matters
We are subject to various federal, state and local laws and regulations that govern aspects of our business operations. While costs associated with compliance with laws and regulations have increased as the number and scope of regulation have increased, the total costs incurred have not had, and are not expected to have, a material effect on our capital expenditures, results of operations or competitive position. See “Risk Factors” in Item 1A for discussion of risks relating to federal, state, local and international laws and regulations applicable to our business.
Seasonality
Seasonal factors influencing our business are described under the heading “Quarterly Financial Data/Seasonality” in Item 7. “Management’s Discussion and Analysis of Financial Condition and Results of Operations.”
Competition
The fast-casual, quick-service, and casual dining segments of the restaurant industry are highly competitive with respect to, among other things, taste, price, food quality and presentation, service, location, convenience, brand reputation, cleanliness, and ambience of each restaurant. Our competition includes a variety of restaurants in each of these segments, including locally-owned restaurants, as well as national and regional chains. Competition from food delivery services, which offer meals from a wide variety of restaurants, also has increased in recent years and is expected to continue to increase. Many of our competitors also offer dine-in, carry-out, online, catering, and delivery services. Among our main competitors are restaurant formats that claim to serve higher quality ingredients without artificial flavors, colors and preservatives, and that serve food quickly and at a reasonable price.
Our Intellectual Property and Trademarks
“Chipotle,” “Chipotle Mexican Grill,” “Food with Integrity,” “Responsibly Raised,” “Chipotle Rewards,” and a number of other marks and related designs and logos are U.S. registered trademarks of Chipotle. We have filed trademark applications for a number of additional marks in the U.S. as well. In addition to our U.S. registrations, we have registered trademarks for “Chipotle” and a number of other marks in Canada, the European Union, the Middle East and various other countries, and have filed trademark applications for “Chipotle Mexican Grill,” “Chipotle” and a number of other marks in additional countries. We also believe that the design of our restaurants is our proprietary trade dress and have registered elements of our restaurant design for trade dress protection in the U.S. as well.
From time to time, we have taken action against other restaurants that we believe are misappropriating our trademarks, restaurant designs or advertising. Although our policy is to protect and defend vigorously our rights to our intellectual property, we may not be able to adequately protect our intellectual property, which could harm the value of our brand and adversely affect our business.
Available Information
We maintain a website at www.chipotle.com, including an investor relations section at ir.chipotle.com, on which we routinely post important information, such as webcasts of quarterly earnings calls and other investor events in which we participate or host, and any related materials. Our Code of Ethics and our Supplier Code of Conduct also are available in this section of our website. You may access our annual reports on Form 10-K, quarterly reports on Form 10-Q, current reports on Form 8-K and amendments to those reports, as well as other reports relating to us that are filed with or furnished to the SEC, free of charge in the investor relations section of our website as soon as reasonably practicable after such material is electronically filed with or furnished to the SEC. The SEC also maintains a website that contains reports, proxy and information statements and other information regarding issuers that file electronically with the SEC at www.sec.gov.
The contents of the websites mentioned above and elsewhere in this report are not incorporated into and should not be considered a part of this report. The references to the URLs for these websites are intended to be inactive textual references only.
ITEM 1A. RISK FACTORS
You should carefully consider the risks described below in addition to the other information set forth in this Annual Report on Form 10-K, including the “Management’s Discussion and Analysis of Financial Conditions and Results of Operations” section and the consolidated financial statements and related notes. If any of the risks and uncertainties described below occur or continue to occur, our business, financial condition and results of operations, and the trading price of our common stock could be materially and adversely affected. The risks and uncertainties described below are those that we have identified as material but are not the only risks and uncertainties we face. Our business is also subject to general risks and uncertainties that affect many other companies, including, but not limited to, overall economic and industry conditions. Additional risks not currently known to us or that we presently deem immaterial may arise or become material and may negatively impact our business, reputation, financial condition, results of operations or the trading price of our common stock.
Risks Related to the Nature of our Business and the Restaurant Industry
Food safety and food-borne illness concerns may have an adverse effect on our business by decreasing sales and increasing costs.
Food safety is our top priority, and we dedicate significant resources to ensuring that our guests enjoy safe, high-quality food products. However, even with strong preventative controls and interventions, food safety risks cannot be completely eliminated in every restaurant. Incidents of food-borne illnesses continue to occur in the restaurant industry and may result from the failure of restaurant employees or suppliers to follow our food safety policies and procedures, or from employees or guests entering our restaurant while ill and contaminating ingredients or surfaces. Although we monitor and audit compliance with our program, we cannot guarantee that each and every food item is safely and properly maintained from the start of the supply chain through guest consumption. Any report, legitimate or rumored, of food-borne illness such as E. coli, hepatitis A, norovirus or salmonella, or other food safety issues, such as food tampering or contamination, at one of our restaurants could adversely affect our reputation and have a negative impact on our sales. In addition, instances of food-borne illness or food safety issues that occur solely at competitors’ restaurants could result in negative publicity about the restaurant industry and adversely impact our sales. Social media has dramatically increased the speed with which negative publicity, including actual or perceived food safety incidents, is disseminated before there is any meaningful opportunity to investigate, respond to and address an issue. The occurrence of food-borne illnesses or food safety issues could also adversely affect the price and availability of affected ingredients, resulting in higher costs and lower margins.
We may be at a higher risk for food safety incidents than some competitors due to our greater use of fresh, unprocessed produce, handling of raw chicken in our restaurants, our reliance on employees cooking with traditional methods and the lack of added preservatives and frozen ingredients in our menu items. The risk of illnesses associated with our food also may increase due to our delivery or catering businesses, in which our food is transported, stored and/or served in conditions that are not under our control. All of these factors could have an adverse impact on our ability to attract and retain guests, which could in turn have a material adverse effect on our growth and profitability.
Our digital business, which accounted for a significant portion of our 2023 total revenue, is subject to risks.
In 2023, 37.4% of our food and beverage revenue was derived from digital orders, which includes third-party delivery and customer pickup in-restaurant and through our Chipotlanes. Approximately 18% of our 2023 food and beverage revenue consisted of delivery orders for which we are reliant on third-party delivery companies. Depending on which ordering platform a guest uses – our platform or the platform of a third-party delivery service – the delivery fee we collect from the guest may be less than the actual delivery cost, which has a negative impact on our profitability. In addition, several jurisdictions (e.g., California, New York City and Seattle) have implemented minimum wages for delivery drivers, and other jurisdictions are considering similar wage regulations, which could increase delivery fees and decrease our digital sales. In 2023, we implemented menu price increases to partially offset the increases in ingredients, labor and other costs; however, our higher menu prices may cause some guests to shift their purchases to other restaurants offered on the platform. If the third-party delivery companies we utilize increase their fees or give greater priority or promotions on their platforms to other restaurants, our delivery business and our sales may be negatively impacted. These delivery companies maintain control over data regarding our guests who use their platform and over the guest experience. We use our mobile app to drive convenience and increase brand engagement with our guests. If a third-party delivery driver fails to make timely deliveries or fails to deliver the complete order, our guests may attribute the bad customer experience to Chipotle and our reputation and sales could be negatively impacted. The ordering and payment platforms used by these third parties, our mobile app or our online ordering site have been and could again be interrupted by technological failures, user errors, cyber-attacks or other factors, which could adversely impact sales through these channels and negatively impact our overall sales and reputation. In addition, the delivery business has been consolidating and may continue to consolidate, which may give third-party delivery companies more leverage in negotiating the terms and pricing of contracts, which in turn could negatively impact our profits from this channel.
The restaurant industry is highly competitive. If we are not able to compete successfully, our business, financial condition and results of operations would be adversely affected.
The restaurant industry is highly competitive with respect to taste preferences, price, food quality and selection, customer service, brand reputation, digital engagement, advertising and promotional initiatives, and the location, attractiveness and maintenance of restaurants. We also compete with non-traditional market participants, such as “convenience meals” in the form of entrées, side dishes or meal preparation kits from the deli or prepared foods sections of grocery stores, meal kit delivery services, and “ghost” or “dark” kitchens, where meals are prepared at separate takeaway premises rather than a restaurant. Increased competition could have an adverse effect on our sales, profitability and development plans. If guest or dietary preferences change, if our marketing efforts are unsuccessful, or if our restaurants are unable to compete successfully with other restaurant outlets, our business could be adversely affected.
We continue to believe that our commitment to higher-quality and responsibly sourced ingredients resonates with guests and gives us a competitive advantage; however, many of our competitors also make claims related to the quality of their ingredients and lack of artificial flavors, colors and preservatives. The increasing use of these claims by competitors, regardless of the accuracy of such claims, may lessen our differentiation and make it more difficult for us to compete. If we are unable to continue to maintain our distinctiveness and compete effectively, our business, financial condition and results of operations could be adversely affected.
If we do not continue to persuade guests of the benefits of paying higher prices for our higher-quality food, our sales and results of operations could be hurt.
Our success depends in large part on our ability to persuade guests that food made with ingredients that were raised or grown according to our Food with Integrity principles are worth paying a higher price relative to prices of some of our competitors, particularly quick-service restaurants. Under our Food with Integrity principles, for example, animals must be responsibly raised, and the milk in our sour cream, cheese and queso must come from cows that have not been treated with rBGH, practices which typically are more costly than conventional farming. If we are not able to successfully persuade guests that consuming food made in accordance with our Food with Integrity principles is better for them and the environment, or if guests do not agree with the overall value proposition of our menu, our sales could be adversely affected, which would negatively impact our results of operations.
Our inability or failure to recognize, respond to and effectively manage the immediacy of social media could have a material adverse impact on our business.
Social media and internet-based communications, including video-sharing, social networking, and gaming and messaging platforms, give users immediate access to a broad audience. These platforms have dramatically increased the speed and scale of dissemination and accessibility of information, including negative comments about our food quality or safety, negative guest or employee experiences and videos depicting inappropriate behavior of employees and guests. Accurate, inaccurate or misleading information can be widely disseminated before there is any meaningful opportunity to respond or address an issue. It is impossible for us to fully predict or control social media backlash, and the inappropriate use of social media by our guests or employees could harm our business, prospects, financial condition, and results of operations, regardless of the information’s accuracy.
Use of social media is an important element of our marketing efforts. Social media and internet-based communication platforms are evolving rapidly, and we need to continuously innovate and evolve our marketing strategies to maintain our brand relevance and broad appeal to guests. We also continue to invest in other digital marketing initiatives to reach our guests and build their awareness of, engagement with, and loyalty to us, including our “Chipotle Rewards” loyalty program. These initiatives may not be successful, resulting in expenses incurred without the benefit of higher revenues, increased customer engagement or brand recognition. Other risks associated with our use of social media and internet-based communication platforms include association with influencers or online celebrities who become embroiled in controversy, platforms and business partners who experience challenges, improper disclosure of proprietary information, negative comments about us, exposure of personally identifiable information, fraud, hoaxes or malicious dissemination of false information. Use of social media by our employees, guests and associates could lead to litigation or result in negative publicity that could damage our reputation.
Risks Related to Human Capital
If we are not able to hire, develop and retain qualified restaurant employees and/or appropriately plan our workforce, our growth plan and profitability could be adversely affected.
Our aggressive pace of opening new restaurants can make it increasingly difficult to recruit and hire sufficient numbers of qualified employees to manage and work in our restaurants, to maintain an effective system of internal controls for a dispersed workforce and to train employees to deliver a consistently high-quality product and customer experience, which could materially harm our business and results of operations. Maintaining appropriate staffing in our restaurants requires precise workforce planning, which has become more complex due to predictive scheduling laws (also called “fair workweek” or “secure scheduling”) and “just cause” termination legislation in certain geographic areas where we operate. The market for qualified talent continues to be competitive and we must continue to offer competitive wages, benefits and workplace conditions to retain qualified employees. We have experienced and may continue to experience challenges in hiring and retaining restaurant employees and in maintaining full restaurant staffing in various locations, which has resulted in longer wait times for guest orders, temporary closures of the digital make line and decreased employee and guest satisfaction. In one instance, we permanently closed a restaurant due to lack of necessary staff after a prolonged recruiting effort. A shortage of qualified candidates who meet legal work authorization requirements, failure to hire, train and retain new restaurant employees in a timely manner or higher than expected turnover levels could affect our ability to open new restaurants, grow sales at existing restaurants or meet our labor cost objectives. In addition, failure to adequately monitor and proactively respond to employee dissatisfaction could lead to poor guest satisfaction, higher turnover, litigation and unionization efforts, which could negatively impact our ability to meet our growth targets. We have experienced labor union efforts to organize groups of our employees from time to time and, if successful, those organizational efforts may decrease our operational flexibility and disrupt our normal operations, which could adversely affect our business.
If we fail to comply with applicable federal, state and local employment and labor laws and regulations, it could have a material, adverse impact on our business.
Various federal, state and local employment and labor laws and regulations govern our relationships with our employees, and similar laws and regulations apply to our operations outside of the U.S. These laws and regulations relate to matters such as employment discrimination, wage and hour laws, requirements to provide and document meal and rest periods or other benefits, family leave mandates, requirements regarding working conditions and accommodations to certain employees, citizenship or work authorization and related requirements, insurance and workers’ compensation rules, healthcare laws and anti-discrimination and anti-harassment laws. We incur substantial costs to comply with these laws and regulations and non-compliance could expose us to significant liabilities. For example, we have had lawsuits filed against us alleging violations of federal and state laws regarding employee wages and payment of overtime, meal and rest breaks, employee classification, employee record-keeping and related practices with respect to our employees. We incur legal costs to defend these types cases, and we could incur losses from these and similar cases, and the amount of such losses or costs could be material.
In addition, several jurisdictions (e.g. New York City, Philadelphia, Chicago, Seattle, etc.) have implemented fair workweek or “secure scheduling” legislation, which impose complex requirements related to scheduling for certain restaurant and retail employees, and additional jurisdictions are considering similar legislation. Several jurisdictions also have implemented sick pay and paid time off legislation, which requires employers to provide paid time off to employees, and “just cause” termination legislation, which restricts companies’ ability to terminate employees or reduce employees’ hours unless they can prove “just cause” or a “bona fide economic reason” for the termination or reduction in hours. All of these regulations impose additional obligations on us and our failure to comply with any of these regulations could subject us to penalties and other legal liabilities, which could adversely affect our ability to attract and retain employees and our results of operations, and potentially cause us to close or reduce operating hours of some restaurants in these jurisdictions. For example, we previously reported the settlement of a complaint alleging that we violated New York City’s Fair Workweek law and Earned Safe and Sick Time Act, and we also have been and are undergoing several audits of our compliance with employment law requirements, which could result in additional liabilities. Our liability exposure for these employment laws and regulations may be higher than our restaurant peers because we are one of the largest restaurant companies that owns and operates all our restaurants, while most of our restaurant peers franchise some or a significant portion of their operations.
Increases in the cost of labor, including mandated minimum wage increases, could adversely impact our business and profitability.
Our profitability has been and could continue to be adversely impacted by increases in labor costs, including wages and benefits, which are some of our most significant costs, including increases triggered by federal, state and local laws governing matters such as minimum wages, meal and rest breaks and changes to eligibility for overtime pay; regulations regarding scheduling and benefits; increased health care and workers’ compensation insurance costs; and higher wages and benefit costs necessary to attract, hire and retain high-quality employees with the right skill sets in a highly competitive job market. In addition, state and local laws may require wage increases and standards on working hours and other factors that would restrict our flexibility to respond to market conditions and increase our costs without corresponding benefits. Beginning in April 2024, new California legislation requires national restaurant chains, including Chipotle, to pay a minimum $20 per hour wage to restaurant workers in California, which minimum wage may be increased annually by a state-appointed council. Other state, county and city jurisdictions are considering similar regulations. Our ability to offset higher labor costs by increasing menu prices depends on the willingness of our guests to pay the higher prices and the perceived value of our meals relative to competitors. If competitive or inflationary pressures or other factors prevent us from offsetting higher labor costs by increased menu prices, our profitability may decline.
A failure to recruit, develop and retain effective leaders or the loss or shortage of personnel with key capacities and skills could impact our strategic growth plans and jeopardize our ability to meet our business performance expectations and growth targets.
Our ability to continue to grow our business depends substantially on the contributions and abilities of our executive leadership team and other key management personnel. Changes in senior management could expose us to significant changes in strategic direction and initiatives. A failure to maintain appropriate organizational capacity and capability to support our strategic initiatives or to build adequate bench strength with key skillsets required for seamless succession of leadership, could jeopardize our ability to meet our business performance expectations and growth targets. If we are unable to attract, develop, retain and incentivize sufficiently experienced and capable management personnel, our business and financial results may suffer.
Risks Related to Cybersecurity, Data Privacy and IT Systems
Breaches or other unauthorized access, theft, modification or destruction of guest and/or employee personal, confidential or other material information that is stored in our systems or by third parties on our behalf could adversely affect our business.
As our reliance on technology has grown, the scope and severity of risks posed to our systems from cyber threats has increased. Many of our information technology systems (whether cloud-based or hosted in proprietary servers), including those used for our point-of-sale, web and mobile platforms, online and mobile payment systems, delivery services and rewards programs and administrative functions, contain personal, financial or other information that is entrusted to us by our guests, business partners and employees. Many of our information technology systems also contain confidential information about our business, such as business strategies, development initiatives and designs, and confidential information about third parties, such as suppliers. Similar to many other restaurant companies, we have in the past experienced, and we expect to continue to experience, cyber-attacks, including phishing, and other attempts to breach, or gain unauthorized access to, our systems and databases. To date, these attacks have not had a material impact on our operations, but we cannot provide assurance that they will not have an impact in the future.
Our third-party providers’ and business partners’ information technology systems and databases are likewise subject to such risks. The number and frequency of these attempts varies from year to year but could be exacerbated to some extent by an increase in our digital operations. In addition, we provide some guest and employee data, as well as confidential information important to our business, to third parties to conduct our business. Individuals performing work for us and these third parties also may access some of this data, including on personally owned digital devices. To the extent we, a third party or such an individual were to experience a breach of our or their information technology systems that results in the unauthorized access, theft, use, destruction or other compromises of customers’ or employees’ data or confidential information of Chipotle stored in or transmitted through such systems, including through cyber-attacks or other external or internal methods, it could result in a material loss of revenues from the potential adverse impact to our reputation and brand, a decrease in our ability to retain customers or attract new ones, the imposition of potentially significant costs (including loss of data or payment for recovery of data) and liabilities, loss of business, loss of business partners and licensees and the disruption to our supply chain, business and plans. Unauthorized access, theft, use, destruction or other compromises are becoming increasingly sophisticated and may occur through a variety of methods, including attacks using malicious code, vulnerabilities in software, hardware or other infrastructure (including systems used by our supply chain), system misconfigurations, phishing or social engineering. The rapid evolution and increased adoption of artificial intelligence technologies may intensify our cybersecurity risks. Our logging capabilities, or the logging capabilities of third parties, are not always complete or sufficiently granular, affecting our ability to fully understand the scope of security breaches.
Such security breaches also could result in a violation of applicable U.S. and international privacy, cyber and other laws or trigger data breach notification laws, including new disclosure rules promulgated by the SEC, and subject us to private third party or securities litigation and governmental investigations and proceedings, any of which could result in our exposure to material civil or criminal liability.
We may be required to make significant capital investments and other expenditures to investigate security incidents, remedy cybersecurity problems, recuperate lost data, prevent future compromises and adapt systems and practices to react to the changing threat environment. These include costs associated with notifying affected individuals and other agencies, additional security technologies, training and personnel, retention of experts and providing credit monitoring services for individuals whose data has been breached. These costs could be material and could adversely impact our results of operations in the period in which they are incurred, including by causing us to delay the pursuit of other important business strategies and initiatives, and may not meaningfully limit the success of future attempts to breach our information technology systems.
Media or other reports of existing or perceived security vulnerabilities in our systems or those of our third-party business partners or service providers can also adversely impact our brand and reputation and materially impact our business. Additionally, the techniques and sophistication used to conduct cyber-attacks and compromise information technology systems, as well as the sources and targets of these attacks, change frequently and are often not recognized until such attacks are launched or have been in place for a period of time. The rapid evolution and increased adoption of artificial intelligence technologies amplifies these concerns. We continue to make significant investments in technology, third-party services and personnel to develop and implement systems and processes that are designed to anticipate cyber-attacks and to prevent or minimize breaches of our information technology systems or data loss, but these security measures cannot provide assurance that we will be successful in preventing such breaches or data loss.
We may incur increased costs to comply with privacy and data protection laws and, if we fail to comply, we could be subject to government enforcement actions, private litigation and adverse publicity.
Complex local, state, federal and international laws and regulations apply to the collection, use, retention, protection, disclosure, transfer and other processing of personal data. These privacy and data protection laws and regulations are quickly evolving, with new or modified laws and regulations proposed and implemented frequently and existing laws and regulations subject to new or different interpretations and enforcement. For example, the European Union’s General Data Protection Regulation (“GDPR”) requires companies to meet certain requirements regarding the handling of personal data, including its use, protection and transfer and the ability of persons whose data is stored to correct or delete such data about themselves, and failure to meet the GDPR requirements could result in penalties of up to 4% of annual worldwide revenue. Additionally, the California Consumer Privacy Act of 2018 (“CCPA”) provides a private right of action for data breaches and requires companies that process the personal information of California residents to make new disclosures to consumers about their data collection, use and sharing practices, allow consumers to opt out of certain data sharing with third parties and to request deletion of personal information (subject to certain exceptions). Other states passed similar privacy legislation that took effect in 2023, and other states and countries passed or are considering expanding or passing comprehensive privacy laws. If we fail, or are perceived to have failed, to properly respond to security breaches of our or a third party’s information technology systems or fail to properly respond to or honor consumer requests under any of the foregoing privacy laws, we could experience reputational damage, adverse publicity, loss of consumer confidence, reduced sales and profits, complications in executing our growth initiatives and regulatory and legal risk, including regulatory fines and penalties, and in some cases civil liabilities where individuals have been provided with a private right of action.
Compliance with the current and future privacy and data protection laws can be costly and time-consuming and there is no assurance that our compliance efforts will be successful in preventing breaches or data loss. Our failure to comply with applicable laws and regulations or other obligations to which we may be subject relating to personal information, or to protect personal information from unauthorized access, use or other processing, could result in enforcement actions and regulatory investigations against us, claims for damages by customers and other affected individuals, fines or damage to our brand reputation, any of which could have a material adverse effect on our operations, financial performance and business.
The regulatory environment related to privacy and data security is changing at an ever-increasing pace, with new, increasingly rigorous, and often unclear requirements applicable to our business. In addition, the issues regulated by privacy laws (such as advertising and marketing, children, biometric, employee, surveillance, artificial intelligence, and health related information) have expanded, as have the number of city, state, federal and international governmental bodies and agencies that have recently passed or are currently considering privacy legislation or regulatory rulemaking. Where not limited by preemption and where there are perceived shortcomings in federal laws, many states have passed or are considering adopting stricter versions of federal privacy laws (e.g., state level statutes similar to the Telephone Consumer Protection Act of 1991, the Health Insurance Portability and Accountability Act, and the Children’s Online Privacy Protection Act of 1998). Private service providers also have implemented mandatory privacy requirements impacting businesses, like Chipotle, that wish to utilize services available on their platforms.
In addition, a number of recent lawsuits have pled creative claims under privacy legislation such as the Video Privacy Protection Act, Electronic Communications Privacy Act (including the WireTap Act and Stored Communications Act), Computer Fraud and Abuse Act, and similar state laws alleging wiretapping, eavesdropping, tape recording and invasion of privacy through the use of marketing pixels, analytics software, session replay technology, voice recording, and live chat functionality. Defending against such claims can be costly and strain internal resources.
Taken together, Chipotle faces rapidly increasing compliance costs in order to modify its operations and business practices to comply with applicable laws, regulations and other requirements.
We rely heavily on information technology systems and failures or interruptions in our IT systems could harm our ability to effectively operate our business and/or result in the loss of guests or employees.
We rely heavily on information technology systems, including the point-of-sale and payment processing system in our restaurants, technologies supporting our digital and delivery business, technologies that trace ingredients back to suppliers and growers and manage our supply chain, our rewards program, technologies that facilitate marketing initiatives, employee engagement and payroll processing, and various other processes and transactions. Our ability to effectively manage our business and coordinate the procurement, production, distribution, safety and sale of our products depends significantly on the availability, reliability and security of these systems. Many of these critical systems are provided and managed by third parties, and we are reliant on these third-party providers to implement protective measures that ensure the security and availability of their systems. Although we have operational safeguards in place, these safeguards may not be effective in preventing the failure of these third-party systems or platforms to operate effectively and be available. Failures may be caused by various factors, including power outages, catastrophic events, physical theft, computer and network failures, inadequate or ineffective redundancy, problems with transitioning to upgraded or replacement systems or platforms, flaws in third-party software or services, errors or improper use by our employees or the third-party service providers. If any of our critical IT systems were to become unreliable, unavailable, compromised or otherwise fail, and we were unable to recover in a timely manner, we could experience an interruption in our operations that could have a material adverse impact on our profitability.
Risks Related to Supply Chain
Increases in the costs of ingredients and other materials, including increases caused by inflation, global conflicts and climate risks, or the failure to procure sufficient ingredients could adversely affect our results of operations.
Supply chain risk could increase our costs and result in a shortage of ingredients and supplies that are critical to our restaurant operations. The markets for some of our ingredients, such as beef, avocado and other produce, are particularly volatile due to factors beyond our control such as limited sources, seasonal shifts, climate conditions, inclement weather, natural disasters, recent inflationary trends, military and geopolitical conflicts and industry demand, including as a result of animal disease outbreaks, international commodity markets, food safety concerns, product recalls and government regulation. In addition, for certain of our ingredients and other materials, we have a limited number of suppliers and distributors. We remain in regular contact with our key suppliers and to date we have not experienced significant prolonged disruptions in our supply chain; however, inflationary pressures for certain supplies and ingredients could continue as inflation increases continue across the global supply chain. Our efforts to mitigate future price risk through forward contracts, strong partnerships with key suppliers, directly managing key raw material procurement, diversifying our supply base and other activities may not fully insulate us from increases in commodity costs, which could have an adverse impact on our profitability.
We also could be adversely impacted by price increases specific to meats raised in accordance with our Responsibly Raised animal welfare criteria, and ingredients grown in accordance with our Food with Integrity specifications, the markets for which are generally smaller and more concentrated than the markets for conventionally raised or grown ingredients. Any increase in the prices of the ingredients most critical to our menu, such as chicken, beef, dairy (for cheese, sour cream and queso), avocados, tomatoes and pork, would have a particularly adverse effect on our operating results. If the cost of one or more ingredients significantly increases, we may choose to temporarily suspend serving menu items that use those ingredients, such as guacamole or one of our proteins, rather than pay the increased cost. Any such changes to our available menu may negatively impact our restaurant traffic and could adversely impact our sales and brand.
Shortages or interruptions in the supply of ingredients could adversely affect our operating results.
Our business is dependent on frequent and consistent deliveries of ingredients that comply with our Food with Integrity specifications, such as dairy (for cheese, sour cream and queso). We may experience shortages, delays or interruptions in the supply of ingredients and other supplies to our restaurants due to inclement weather, natural disasters, labor issues or other operational disruptions at our suppliers, distributors or transportation providers, or other conditions beyond our control. Ongoing global conflicts have disrupted and could continue to disrupt some shipping routes, which could result in shortages or delays of certain ingredients. In addition, we have a single or a limited number of suppliers for some of our ingredients, including certain oils, tomatoes, tortillas and adobo. Although we believe we have potential alternative suppliers and sufficient reserves of ingredients, shortages or interruptions in our supply of ingredients could adversely affect our financial results.
Legal and Regulatory Risks
We could be party to litigation or other legal proceedings that could adversely affect our business, results of operations and reputation.
We have been and likely will continue to be subject to litigation and other legal proceedings that may adversely affect our business. These legal proceedings may involve claims brought by employees, guests, government agencies, suppliers, shareholders or others through private actions, administrative proceedings, regulatory actions or other litigation, including litigation on a class or collective basis on behalf of what can be a large group of potential claimants. These legal proceedings have involved, and in the future may involve, allegations of illegal, unfair or inconsistent employment practices, including those governing wage and hour, employment of minors, discrimination, harassment, wrongful termination, and vacation and family leave laws; food safety issues including food-borne illness, food contamination and adverse health effects from consumption of our food products; data security or privacy breaches; guest discrimination; personal injury in our restaurants; marketing and advertising claims, including claims that our Food with Integrity or other sustainability claims are misleading or inaccurate; infringement of patent, copyright or other intellectual property rights; violation of the federal securities laws; workers’ compensation; or other concerns. We are party to a number of pending lawsuits and governmental audits alleging violations of federal and state employment laws, including wage and hour claims, and we could be involved in similar or even more significant litigation and legal proceedings in the future. Even if the allegations against us in current or future legal matters are unfounded or we ultimately are held not liable, the costs to defend ourselves may be significant and the litigation may subject us to substantial settlements, fines, penalties or judgments against us and may divert management's attention away from operating our business, all of which could negatively impact our financial condition and results of operations. Litigation also may generate negative publicity, regardless of whether the allegations are valid, or we ultimately are not liable, which could damage our reputation, and adversely impact our sales as well as our relationships with our employees and guests.
We are subject to extensive laws, government regulation, and other legal requirements and our failure to comply with existing or new laws and regulations could adversely affect our operational efficiencies, ability to attract and retain talent and results of operations.
Our business is subject to extensive federal, state, local and international laws and regulations, including those relating to:
preparation, sale and labeling of food, including regulations of the Food and Drug Administration, which oversees the safety of the entire food system, including inspections and mandatory food recalls, menu labeling and nutritional content;
employment practices and working conditions, including minimum wage rates, wage and hour practices, meal and rest breaks, fair workweek/secure scheduling and “just cause” legislation, employment of minors, discrimination, harassment, classification of employees, paid and family leave, workplace safety, immigration and overtime among others;
privacy and data security (including regulations governing the protection of personal information, advertising and marketing, access by children, biometrics, surveillance, artificial intelligence, health-related information and financial information), such as California Privacy Rights Act and CCPA in California and privacy-related legislation in a growing number of other states, and international laws such as GDPR in the European Union and Personal Information Protection and Electronic Documents Act in Canada;
health, sanitation, safety and fire standards and the sale of alcoholic beverages;
building and zoning requirements, including state and local licensing and regulation governing the design and operation of facilities and land use;
public accommodations and safety conditions, including the Americans with Disabilities Act and similar state laws that give civil rights protections to individuals with disabilities in the context of employment, public accommodations, online resources and other areas;
environmental matters, such as emissions and air quality; water consumption; the discharge, storage, handling, release and disposal of hazardous or toxic substances; local ordinances restricting the types of packaging we can use in our restaurants; and claims we make about our sustainability practices and achievements; and
public company compliance, disclosure and governance matters, including accounting and tax regulations, SEC and NYSE disclosure requirements.
Compliance with these laws and regulations, and future new laws or changes in these laws or regulations that impose additional requirements, can be costly. Any failure or perceived failure to comply with these laws or regulations could result in, among other things, revocation of required licenses, administrative enforcement actions, fines and civil and criminal liability.
Risks Related to Our Growth and Business Strategy
If we are unable to meet our projections for new restaurant openings, or efficiently maintain the attractiveness of our existing restaurants, our profitability could suffer.
Our growth depends on our ability to open new restaurants at an aggressive rate and operate them profitably as soon as possible. In the past year, the cost of opening new restaurants has increased, due to construction labor inflation and increased costs of materials and equipment. Our timeline for completing construction also has gotten longer, due to landlord reluctance to commit to building in light of high interest rates, tight money supply and general economic conditions, and due to backlogs and long wait times for us to obtain required permits and utility hookups. In addition, we incur substantial startup expenses each time we open a new restaurant, and it can take up to 36 months to ramp up the sales and profitability of a new restaurant, during which time costs may be higher as we train new employees and build up a customer base. If we are unable to build the customer base that we expect or fail to overcome the higher startup expenses associated with new restaurants, our new restaurants may not be as profitable as our existing restaurants. Our ability to open and profitably operate new restaurants also is subject to various risks, such as the identification and availability of desirable locations; the negotiation of acceptable lease terms; the need to obtain all required governmental permits (including zoning approvals and liquor licenses) and comply with other regulatory requirements; the availability of capable contractors and subcontractors; increases in the cost and decreases in the availability of labor and building material; changes in weather, natural disasters, pandemics or other acts of God that could delay construction and adversely affect guest traffic; our ability to hire and train qualified management and restaurant employees; and general economic and business conditions. At each potential location, we compete with other restaurants and retail businesses for desirable development sites, construction contractors, management personnel, hourly employees and other resources. If we are unable to successfully manage these risks, we could face increased costs and lower than anticipated sales and earnings in future periods.
In addition, we continue to improve our existing restaurants through remodels, upgrades and regular upkeep. If the costs associated with remodels, upgrades or regular upkeep are higher than anticipated, restaurants are closed for remodeling for longer periods than planned or remodeled restaurants do not perform as expected, we may not realize our projected desired return on investment, which could have a negative effect on our operating results.
Our failure to effectively manage and support our growth could have a negative adverse effect on our business and financial results.
As of December 31, 2023, we owned and operated over 3,400 Chipotle restaurants and we plan to open a significant number of new restaurants in the next several years. Our existing restaurant management systems, back-office technology systems and processes, financial and management controls, information systems and personnel may not be adequate to support our continued growth. To effectively manage a larger number of restaurants, we may need to upgrade and expand our infrastructure and information systems, automate more processes that currently are manual or require manual intervention and hire, train and retrain restaurant employees and corporate support staff, all of which may result in increased costs and at least temporary inefficiencies. We also place a lot of importance on our culture, which we believe has been an important contributor to our success, and as we continue to grow it may be increasingly difficult to maintain our culture. Our failure to sufficiently invest in our infrastructure and information systems and maintain our strong staffing and culture could harm our brand and operating results.
If we partner with or acquire new businesses and third-party providers that do not align with our core values or that do not fulfill their contractual responsibilities and commitments, our brand reputation and international growth plans could suffer.
Our global growth strategy includes expanding our existing restaurant footprint and introducing Chipotle in new international jurisdictions in which we currently do not operate. The success of our strategy will depend on our identifying and partnering with new business partners, including licensees, joint venture partners, suppliers and distributors, and may include identifying suitable acquisition targets in these new jurisdictions that align with our core values. In 2023, we signed our first-ever development agreement to open restaurants in the Middle East in partnership with international franchise retail operator Alshaya Group, which will initially open new Chipotle restaurants in Dubai and Kuwait before expanding further across the region. Licensees like Alshaya, and future joint venture partners would be authorized to operate restaurants under the Chipotle brand, and we believe guests will expect the same quality of food and customer service in these third-party operated restaurants as they receive in Chipotle-operated restaurants. We provide extensive training to our business partners and we include specific food quality and safety standards and guest service requirements in the contracts we sign with our business partners; however, we do not have direct control over the restaurants operated by third-party partners, and the quality and service in those restaurants may be less than the quality and service of Chipotle-operated restaurants. Failure of our business partners to adhere to our high food quality and operating standards could damage our brand reputation and impair our international expansion plans. New partnerships and/or acquisitions also may divert management’s attention from other initiatives and/or day-to-day operations, which could adversely affect our business and results of operations.
The market price of our common stock may be more volatile than the market price of our peers.
We believe the market price of our common stock generally has traded at a higher price-earnings ratio than stocks of most of our peer companies as well as the overall market, which typically has reflected market expectations for higher future operating results. At any given point in time, our price-earnings ratio may trade at more than twice the price-earnings ratio of the S&P 500. Also, the trading market for our common stock has been volatile at times, including because of adverse publicity events. As a result, if we fail to meet market expectations for our operating results in the future, any resulting decline in the price of our common stock could be significant.
Risks Related to Sustainability Factors
We are subject to evolving public disclosure requirements and expectations, including with respect to sustainability matters, that could expose us to numerous risks and could adversely affect our reputation and results of operations.
We are subject to evolving disclosure obligations promulgated by governmental and regulatory organizations relating to sustainability factors that impact our business. These disclosure obligations are complex and not always consistent, making compliance difficult and uncertain. In addition, investors, guests and other stakeholders increasingly are focusing on sustainability matters and related disclosures. We have incurred and expect to continue to incur increased expenses and management time and attention to comply with these disclosure obligations and stakeholder expectations. For example, measuring Scope 1, 2 and 3 greenhouse gas emissions relating to our business, developing reduction plans and initiatives, and creating and disclosing achievable reduction goals can be costly, difficult and time consuming and is subject to evolving reporting standards, including California’s Climate Corporate Data Accountability Act, California’s Greenhouse Gases: Climate-Related Financial Risk Bill, the SEC’s proposed climate-related reporting requirements, and similar proposals by other local and international regulatory agencies. We may also communicate certain initiatives and goals regarding sustainability and human capital management related matters, such as diversity, responsible sourcing and social investments in our SEC filings or in other public disclosures. In November 2021, we announced that we had set science-based targets validated by the Science Based Targets Initiative to reduce absolute Scope 1, 2 and 3 greenhouse gas emissions 50% by 2030 from a 2019 base year, and achievement of this goal is subject to risks and uncertainties, many of which are outside of our control and may prove to be more difficult and costly than we anticipate.
In addition, statements about our sustainability-related initiatives and goals, and progress toward those goals, may be based on standards for measuring progress that are still developing, internal controls and processes that continue to evolve, and assumptions that are subject to change in the future. If we are unable to meet our sustainability-related goals or evolving stakeholder or industry expectations and standards, or if we are perceived to have not responded appropriately to the growing concern for sustainability issues, investors, guest and other stakeholders may choose to patronize a competitor that they perceive to be more responsive, and our reputation, business or financial condition may be adversely affected. If our sustainability-related data, processes and reporting are incomplete or inaccurate, or if we fail to achieve progress with respect to our sustainability goals on a timely basis, or at all, our reputation, business, financial performance and growth could be adversely affected.
In addition, we could be criticized by anti-ESG stakeholders for the scope or nature of our sustainability initiatives or goals or for any revisions to these goals. We could also be subjected to negative responses by governmental actors (such as anti-ESG legislation or retaliatory legislative treatment) or consumers (such as boycotts or negative publicity campaigns) that could adversely affect our reputation, business, financial performance and growth.
Climate change and volatile adverse weather conditions could adversely affect our restaurant sales or results of operations.
There is growing concern that climate change and global warming has caused and may continue to cause more severe, volatile weather or extended droughts, which could increase the frequency and duration of weather impacts on our operations. Adverse weather conditions have in the past and may again impact guest traffic at our restaurants and, in more severe cases such as hurricanes, tornadoes, wildfires or other natural disasters, cause temporary restaurant closures, all of which negatively impact our restaurant sales. In addition, our supply chain is subject to increased costs caused by the effects of climate change, diminishing energy and water resources. Increasing weather volatility and changes in global weather patterns can reduce crop size and crop quality, or destroy crops altogether, which could result in decreased availability or higher pricing for our produce and other ingredients. We may be forced to source ingredients from new geographic regions, which could impact quality and taste, and increase our costs. These factors are beyond our control and, in many instances, unpredictable. Climate change and government regulation relating to climate change also could result in construction delays for new restaurants and interruptions to the availability or increases in the cost of utilities. The ongoing and long-term costs of these impacts related to climate change and other sustainability-related issues could have a material adverse effect on our business and financial condition if we are not able to mitigate them.
General Risk Factors
Economic and business factors that are largely beyond our control may adversely affect consumer behavior and the results of our operations.
Restaurant dining generally is dependent upon consumer discretionary spending, which may be affected by general economic conditions that are beyond our control. Increasing or prolonged high inflation, international, domestic and regional economic conditions, consumer income levels, financial market volatility, a slow or stagnant pace of economic growth, mass layoffs, rising energy costs, rising interest rates, social unrest, military conflicts and governmental, political and budget concerns or divisions may have a negative effect on consumer confidence and discretionary spending. Persistent inflation and concern about a prolonged economic downturn may lead consumers to decrease their discretionary spending. A significant decrease in our guest traffic or average transactions would negatively impact our financial performance. The actual or perceived threat of a pandemic or communicable disease, terrorist attack, mass shooting, heightened security requirements, including cybersecurity, or a failure to protect information systems for critical infrastructure, such as the electrical grid and telecommunications systems, could harm our operations, the economy or consumer confidence generally. Any of the above factors or other unfavorable changes in business and economic conditions affecting our guests could increase our costs, reduce traffic in our restaurants or limit our ability to increase pricing, any of which could lower our profit margins and have a material adverse effect on our sales, financial condition and results of operations. These factors also could cause us to, among other things, reduce the number and frequency of new restaurant openings, close restaurants or delay remodeling of our existing restaurant locations. Further, poor economic conditions may force nearby businesses to shut down, which could reduce traffic to our restaurants or cause our restaurant locations to be less attractive.
Our quarterly financial results may fluctuate significantly, including due to factors that are not in our control.
Our quarterly financial results may fluctuate significantly and could fail to meet investors’ expectations for various reasons, including:
negative publicity about the safety of our food, employment-related issues, litigation or other issues involving our restaurants;
fluctuations in supply costs, particularly for our most significant ingredients, and our inability to offset the higher cost with price increases, without adversely impacting guest traffic;
our inability to purchase sufficient quantities of our key ingredients as our restaurant count grows;
labor availability and wages of restaurant management and employees;
increases in marketing or promotional expenses;
the timing of new restaurant openings and related revenues and expenses, and the operating costs at newly opened restaurants;
the impact of inclement weather and natural disasters, such as freezes and droughts, which could decrease guest traffic and increase the costs of ingredients;
the amount and timing of stock-based compensation;
litigation, settlement costs and related legal expenses;
tax expenses, asset impairment charges and non-operating costs; and
variations in general economic conditions, including the impact of rising inflation and the impact of rising interest rates on consumer demand trends.
As a result of any of these factors, results for any one quarter are not necessarily indicative of results to be expected for any other quarter or for any year. Average restaurant sales or comparable restaurant sales in any future period may decrease.
ITEM 1B. UNRESOLVED STAFF COMMENTS
None.
ITEM 1C. CYBERSECURITY
Cybersecurity Risk Management and Strategy
As a global company, we are regularly subject to cyberattacks and other cybersecurity incidents. In response, we have implemented cybersecurity processes, technologies, and controls to aid in our efforts to assess, identify, and manage cybersecurity risks. Our enterprise risk management framework considers cybersecurity risk alongside other company risks as part of our overall risk assessment process. Our enterprise risk management team collaborates with our Information Security function, led by our Chief Information Security Officer (“CISO”) and our Chief Customer and Technology Officer (“CCTO”), to gather insights for assessing, identifying and managing cybersecurity threat risks, their severity, and potential mitigations. We also are a member of an industry cybersecurity intelligence and risk sharing organization to stay abreast of changes in the cybersecurity environment.
We assess Chipotle’s Information Security program using an industry cybersecurity framework from the National Institute of Standards and Technology. This program includes policies, processes and procedures that help assess and identify our cybersecurity risks and inform how security measures and controls are developed, implemented and maintained. The risk assessment along with risk-based analysis and judgment are used to select security controls to address risks. During this process, the following factors, among others, are considered: likelihood and severity of risk, impact on the Company and others if a risk materializes, feasibility and cost of controls and impact of controls on operations.
We maintain internal resources to perform penetration testing designed to simulate evolving tactics and techniques of real-world threat actors, engage with industry partners and law enforcement and intelligence communities and conduct tabletop exercises and periodic risk interviews across our business. We also engage an independent third party to perform internal and external penetration testing of Chipotle's information security environment periodically and engage other third parties to periodically conduct assessments of our cybersecurity capabilities. In addition, we continue to expand training and awareness practices to mitigate risk from human error, including mandatory computer-based training and internal communications for employees. Our employees undergo cybersecurity awareness training and regular phishing awareness campaigns that are based upon and designed to emulate real-world contemporary threats. We provide prompt feedback (and, if necessary, additional training or remedial action) based on the results of such exercises.
Our processes also address cybersecurity risks associated with our use of third-party service providers including suppliers, software and cloud-based service providers, as well as third-party security firms used in different capacities to provide or operate some of our cybersecurity controls and technology systems. We proactively evaluate the cybersecurity risk of a third party by utilizing a repository of risk assessments, external monitoring sources, threat intelligence and predictive analytics to better inform Chipotle during contracting and vendor selection processes. Additionally, when third party risks are identified, we require those third parties to agree by contract to implement appropriate security controls. Security issues are documented and tracked, and periodic monitoring of third parties is conducted in an effort to mitigate risk.
In addition to the processes, technologies, and controls that we have in place to reduce the likelihood of a material cybersecurity incident (or series of related cybersecurity incidents), Chipotle has a written incident response plan outlining how to address cybersecurity events that occur. The plan sets forth the steps for coordination among various corporate functions and governance groups and serves as a framework for the execution of responsibilities across businesses and operational roles. Our incident response plan is designed to help us coordinate actions to prepare for, detect, respond to and recover from cybersecurity incidents, and includes processes to triage, assess severity, escalate, contain, investigate, and remediate the incident, as well as to assess the need for disclosure, comply with applicable legal obligations and mitigate the impact to our brand and reputation and on impacted parties. We also maintain insurance coverage that, subject to its terms and conditions, is intended to help us cover certain costs associated with cybersecurity incidents and information system failures.
In addition to our cybersecurity incident response plan, we conduct tabletop exercises to enhance our incident response preparedness. We maintain business continuity and disaster recovery plans to prepare for and respond to the potential for a disruption in the technology we rely on.
Chipotle (or the third parties it relies on) may not be able to fully, continuously, or effectively implement security controls as intended. As described above, we utilize a risk-based approach and judgment to determine whether and how to implement certain security controls and it is possible that we may not implement the necessary controls if we are unable to recognize or underestimate a particular risk. In addition, security controls, no matter how well designed or implemented, may only mitigate and not fully eliminate cybersecurity risks. Cybersecurity events, when detected by security tools or third parties, may not always be identified immediately or addressed in the manner intended by our cybersecurity incident response plan.
Impact of cybersecurity risks on business strategy, results of operations or financial condition
Based on the information available as of the date of this Annual Report, we have no reason to believe any risks from cybersecurity threats, including as a result of any previous cybersecurity incidents, have materially affected or are reasonably likely to materially affect us, including our business strategy, results of operations or financial condition. For additional information, see “Risks Related to Cybersecurity, Data Privacy and IT Systems,” in Item 1A, “Risk Factors” in this Annual Report.
Cybersecurity Governance
Our cybersecurity risk management and strategy processes are led by our CISO and our CCTO. These individuals have collectively over 50 years of professional experience in various roles across multiple industries involving managing information security, developing cybersecurity strategy, implementing effective information and cybersecurity programs and managing multiple industry and regulatory compliance environments. Both individuals previously held positions similar to their current roles at other large publicly traded organizations.
Cybersecurity is an important part of our risk management processes and an area of focus for our Board of Directors (the “Board”) and management. Although cybersecurity risk oversight continues to remain a top priority for the Board, the Audit and Risk Committee of our Board has primary oversight responsibility for the Company’s cybersecurity and other technology risks. The Committee regularly reviews and discusses with our CISO and our CCTO the Company’s cybersecurity, privacy and data security programs, the status of projects to strengthen internal cybersecurity, results from third-party assessments, and any significant cybersecurity incidents, including recent incidents at other companies and the emerging threat landscape. The Committee also reviews with management the implementation and effectiveness of the Company’s controls to monitor and mitigate cybersecurity risks. In addition, our Board receives an annual report and quarterly written updates regarding our cybersecurity program.
ITEM 2. PROPERTIES
As of December 31, 2023, there were 3,437 restaurants operated by Chipotle and our consolidated subsidiaries. Our main office is located at 610 Newport Center Drive, Suite 1100, Newport Beach, CA 92660 and our telephone number is (949) 524-4000. We lease our main office and substantially all of the properties on which we operate restaurants. We own 17 properties and operate restaurants on all of them. For additional information regarding the lease terms and provisions, see Note 1. “Description of Business and Summary of Significant Accounting Policies” and Note 9. “Leases” in our consolidated financial statements included in Item 8. “Financial Statements and Supplementary Data.”
ITEM 3. LEGAL PROCEEDINGS
For information regarding legal proceedings, see Note 11. “Commitments and Contingencies” in our consolidated financial statements included in Item 8. “Financial Statements and Supplementary Data.”
ITEM 4. MINE SAFETY DISCLOSURES
Not applicable.
PART II
ITEM 5. MARKET FOR REGISTRANT’S COMMON EQUITY, RELATED SHAREHOLDER MATTERS AND ISSUER PURCHASES OF EQUITY SECURITIES
Our common stock trades on the New York Stock Exchange under the symbol “CMG.”
As of February 5, 2024, there were approximately 1,508 shareholders of record. This does not include persons whose stock is in nominee or “street name” accounts through brokers.
Purchases of Equity Securities by the Issuer
The table below reflects shares of common stock we repurchased during the fourth quarter of 2023.
| | | | | | | | | | | |
| | | Total Number of Shares Purchased | | Average Price Paid Per Share | | Total Number of Shares Purchased as Part of Publicly Announced Plans or Programs(1) | | Approximate Dollar Value of Shares that May Yet Be Purchased Under the Plans or Programs |
October | | | 52,611 | | $ | 1,840.49 | | 52,611 | | $ | 271,538,394 |
| Purchased 10/1 through 10/31 | | | | | | | | | | |
November | | | 13,084 | | $ | 2,092.54 | | 13,084 | | $ | 244,159,596 |
| Purchased 11/1 through 11/30 | | | | | | | | | | |
December | | | 8,828 | | $ | 2,271.49 | | 8,828 | | $ | 424,106,921 |
| Purchased 12/1 through 12/31 | | | | | | | | | | |
Total | | | 74,523 | | $ | 1,935.80 | | 74,523 | | | |
(1) Shares were repurchased pursuant to repurchase programs announced on July 26, 2023 and October 26, 2023.
(2) The December total includes an additional $200 million in authorized repurchases approved on December 14, 2023 and announced February 6, 2024. There is no expiration date for this program. The authorization to repurchase shares will end when we have repurchased the maximum amount of shares authorized, or we have determined to discontinue such repurchases.
Dividend Policy
We are not required to pay any dividends and have not declared or paid any cash dividends on our common stock. We intend to continue to retain earnings for use in the operation and expansion of our business and to repurchase shares of common stock (subject to market conditions), and therefore do not anticipate paying any cash dividends on our common stock in the foreseeable future.
COMPARISON OF CUMULATIVE TOTAL RETURN
The following graph compares the cumulative annual stockholders return on our common stock from December 31, 2018, through December 31, 2023, to that of the total return index for the S&P 500 and the S&P 500 Restaurants Index assuming an investment of $100 on December 31, 2018. In calculating total annual stockholder return, reinvestment of dividends, if any, is assumed. The indices are included for comparative purposes only. They do not necessarily reflect management’s opinion that such indices are an appropriate measure of the relative performance of our common stock. The values shown are neither indicative nor determinative of future performance. This graph is not “soliciting material,” is not deemed filed with the Securities and Exchange Commission and is not to be incorporated by reference in any of our filings under the Securities Act or the Exchange Act, whether made before or after the date hereof and irrespective of any general incorporation language in any such filing.
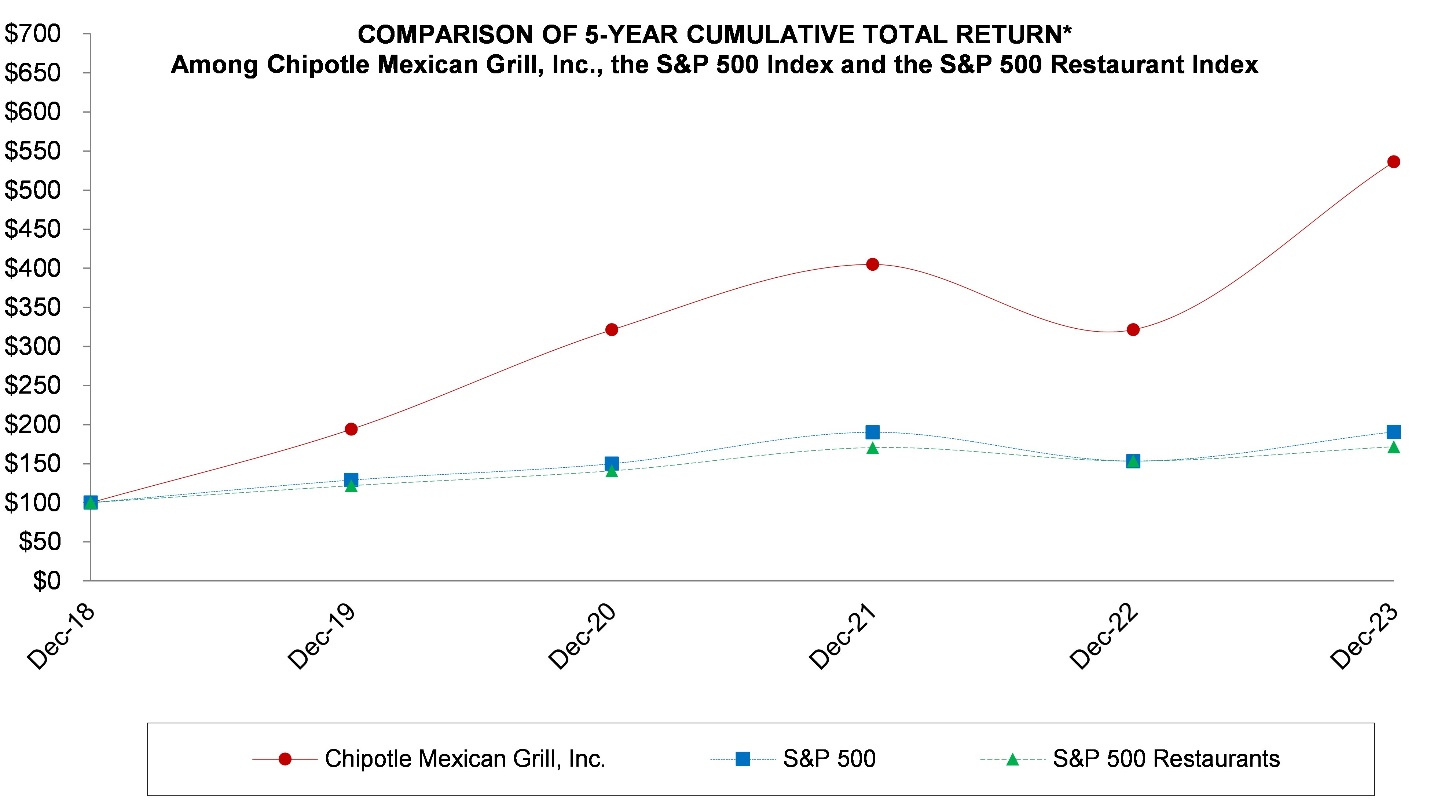
| | | | | | | | | | | | | | | | | |
| | | | | | | | | | | | | | | | | |
Company/Index | 2018 | | 2019 | | 2020 | | 2021 | | 2022 | | 2023 |
Chipotle Mexican Grill, Inc. | $ | 100 | | $ | 194 | | $ | 321 | | $ | 405 | | $ | 321 | | $ | 536 |
S&P 500 | | 100 | | | 129 | | | 150 | | | 190 | | | 153 | | | 191 |
S&P 500 Restaurants | | 100 | | | 122 | | | 141 | | | 170 | | | 153 | | | 172 |
*$100 invested on December 31, 2018, in stock or index, including reinvestment of dividends.
Fiscal year ending December 31, 2023.
Source data: FactSet
ITEM 6. RESERVED
ITEM 7. MANAGEMENT’S DISCUSSION AND ANALYSIS OF FINANCIAL CONDITION AND RESULTS OF OPERATIONS
You should read the following discussion together with our consolidated financial statements and related notes included in Item 8. “Financial Statements and Supplementary Data.” This section of the Form 10-K generally discusses 2023 items and year-to-year comparisons of 2023 to 2022. Discussions of 2021 items and year-to-year comparisons of 2022 and 2021 that are not included in this Form 10-K can be found in “Management’s Discussion and Analysis of Financial Condition and Results of Operations” in Part II, Item 7 on our Annual Report on Form 10-K for the year ended December 31, 2022. The discussion contains forward-looking statements involving risks, uncertainties and assumptions that could cause our results to differ materially from expectations. See “Cautionary Note Regarding Forward-Looking Statements.” Factors that might cause such differences include those described in Item 1A. “Risk Factors” and elsewhere in this report.
Overview
As of December 31, 2023, we operated 3,371 Chipotle restaurants throughout the United States, and 66 international Chipotle restaurants. We manage our U.S. operations based on eight regions and aggregate our operations to one reportable segment.
Throughout “Management’s Discussion and Analysis of Financial Condition and Results of Operations” we commonly discuss the following key operating metrics which we believe will drive our financial results and long-term growth model. We believe these metrics are useful to investors because management uses these metrics to assess the growth of our business and the effectiveness of our marketing and operational strategies:
Comparable restaurant sales
Restaurant operating costs as a percentage of total revenue
New restaurant openings
2023 Financial Highlights, year-over-year:
Total revenue increased 14.3% to $9.9 billion
Comparable restaurant sales increased 7.9%
Diluted earnings per share was $44.34, a 38.4% increase from $32.04, which includes a $0.52 after-tax impact from expenses related to restaurant and corporate level impairment and closure costs, accelerated depreciation and corporate restructuring, partially offset by a reduction in contingencies related to certain legal proceedings.
Sales Trends. Comparable restaurant sales increased 7.9% for the year ended December 31, 2023. The increase is primarily attributable to higher transactions and, to a lesser extent, an increase in average check. Comparable restaurant sales represent the change in period-over-period total revenue for restaurants in operation for at least 13 full calendar months. Digital sales represented 37.4% of total food and beverage revenue.
Restaurant Operating Costs. During the year ended December 31, 2023, our restaurant operating costs (food, beverage and packaging; labor; occupancy; and other operating costs) were 73.8% of total revenue, a decrease from 76.1% during the year ended December 31, 2022. The decrease was driven primarily by sales leverage and, to a lesser extent, lower avocado prices. These decreases were partially offset by higher inflation across several food ingredients and, to a lesser extent, wage inflation.
Restaurant Development. During the year ended December 31, 2023, we opened 271 new restaurants, which included 238 restaurants with a Chipotlane. We expect to open approximately 285-315 new restaurants in 2024 (including 5 to 10 relocations), which assumes developer, permit, inspection, and utility delays do not worsen. We expect that at least 80% of our new restaurants will include a Chipotlane.
Cultivate Next Fund. Our Cultivate Next Fund is a venture formed to make early-stage investments into strategically aligned companies that further our mission to Cultivate a Better World. The Fund has an initial size of $50.0 million, which is financed almost entirely by Chipotle. As of December 31, 2023, we have made $33.0 million in investments through this Fund. In December 2023, our Board approved an additional $50.0 million financial commitment to this Fund. As of December 31, 2023, none of this additional $50.0 million has been invested.
Restaurant Activity
The following table details restaurant unit data for the years indicated.
| | | |
| | | |
| Year ended December 31, |
| 2023 | | 2022 |
Beginning of period | 3,187 | | 2,966 |
Chipotle openings | 270 | | 235 |
Non-Chipotle openings | 1 | | 1 |
Chipotle permanent closures | (3) | | (3) |
Chipotle relocations | (12) | | (12) |
Non-Chipotle permanent closures | (6) | | - |
Total restaurants at end of period | 3,437 | | 3,187 |
Results of Operations
Our results of operations as a percentage of total revenue and period-over-period change are discussed in the following section.
Revenue
| | | | | | | |
| | | | | | | |
| Year ended December 31, | | Percentage |
| 2023 | | 2022 | | change |
| (dollars in millions) | | |
Food and beverage revenue | $ | 9,804.1 | | $ | 8,558.0 | | 14.6% |
Delivery service revenue | | 67.5 | | | 76.7 | | (11.9%) |
Total revenue | $ | 9,871.6 | | $ | 8,634.7 | | 14.3% |
Average restaurant sales (1) | $ | 3.0 | | $ | 2.8 | | 6.9% |
Comparable restaurant sales increase | | 7.9% | | | 8.0% | | |
Transactions | | 5.0% | | | 0.9% | | |
Average check | | 2.9% | | | 7.1% | | |
Menu price increase | | 5.2% | | | 12.0% | | |
Check mix | | (2.3%) | | | (4.9%) | | |
| | | | | | | |
(1) Average restaurant sales refer to the average trailing 12-month food and beverage sales for restaurants in operation for at least 12 full calendar months. |
The following is a summary of the change in restaurant sales for the period indicated:
| | |
| | |
| | |
| Year ended |
| (dollars in millions) |
For the period ending December 31, 2022 | $ | 8,634.7 |
Change from: | | |
Comparable restaurant sales | | 636.3 |
Restaurant not yet in comparable base opened in 2023 | | 242.1 |
Restaurant not yet in comparable base opened in 2022 | | 356.3 |
Other | | 2.2 |
For the period ending December 31, 2023 | $ | 9,871.6 |
Food, Beverage and Packaging Costs
| | | | | | | |
| | | | | | | |
| Year ended December 31, | | Percentage |
| 2023 | | 2022 | | change |
| (dollars in millions) | | |
Food, beverage and packaging | $ | 2,912.6 | | $ | 2,602.2 | | 11.9% |
As a percentage of total revenue | | 29.5% | | | 30.1% | | (0.6%) |
Food, beverage and packaging costs decreased 0.6% as a percentage of total revenue for the year ended December 31, 2023 compared to the year ended December 31, 2022, including 1.6% from menu price increases and 0.6% from lower avocado costs, partially offset by 1.6% due to inflation across several ingredient costs, primarily beef, tortillas and queso.
Labor Costs
| | | | | | | |
| | | | | | | |
| Year ended December 31, | | Percentage |
| 2023 | | 2022 | | change |
| (dollars in millions) | | |
Labor costs | $ | 2,441.0 | | $ | 2,198.0 | | 11.1% |
As a percentage of total revenue | | 24.7% | | | 25.5% | | (0.8%) |
Labor costs decreased 0.8% as a percentage of total revenue for the year ended December 31, 2023 compared to the year ended December 31, 2022, including 1.4% from sales leverage, partially offset by 0.8% due to restaurant wage inflation.
Beginning in April 2024, California legislation will require national restaurant chains, including Chipotle, to pay a minimum $20 per hour wage to restaurant workers in California This will increase wages in California nearly 20% and will result in wage inflation increasing from the low to mid-single digit range to the mid-single-digit range. We expect to increase menu prices in California to mitigate higher wage costs resulting from this legislation.
Occupancy Costs
| | | | | | | |
| | | | | | | |
| Year ended December 31, | | Percentage |
| 2023 | | 2022 | | change |
| (dollars in millions) | | |
Occupancy costs | $ | 503.3 | | $ | 460.4 | | 9.3% |
As a percentage of total revenue | | 5.1% | | | 5.3% | | (0.2%) |
Occupancy costs decreased 0.2% as a percentage of total revenue for the year ended December 31, 2023 compared to the year ended December 31, 2022, primarily due to sales leverage, partially offset by increased rent expense associated with new restaurants.
Other Operating Costs
| | | | | | | |
| | | | | | | |
| Year ended December 31, | | Percentage |
| 2023 | | 2022 | | change |
| (dollars in millions) | | |
Other operating costs | $ | 1,428.7 | | $ | 1,311.9 | | 8.9% |
As a percentage of total revenue | | 14.5% | | | 15.2% | | (0.7%) |
Other operating costs decreased 0.7% as a percentage of total revenue for the year ended December 31, 2023 compared to the year ended December 31, 2022, including 0.6% of sales leverage and 0.2% of lower delivery expenses, partially offset by 0.1% of higher maintenance costs.
General and Administrative Expenses
| | | | | | | |
| | | | | | | |
| Year ended December 31, | | Percentage |
| 2023 | | 2022 | | change |
| (dollars in millions) | | |
General and administrative expense | $ | 633.6 | | $ | 564.2 | | 12.3% |
As a percentage of total revenue | | 6.4% | | | 6.5% | | (0.1%) |
Following is a summary of the change in General and administrative expense for the periods indicated:
| | |
| | |
| Year ended |
| (dollars in millions) |
For the period ending December 31, 2022 | $ | 564.2 |
Change from: | | |
Performance bonuses | | 31.1 |
Stock-based compensation, primarily performance-based awards | | 24.3 |
Outside services related to corporate initiatives | | 14.5 |
Wages, primarily due to headcount growth | | 10.9 |
Conferences, primarily biennial All Managers’ Conference | | (8.9) |
Other | | (2.5) |
For the period ending December 31, 2023 | $ | 633.6 |
Depreciation and Amortization
| | | | | | | |
| | | | | | | |
| Year ended December 31, | | Percentage |
| 2023 | | 2022 | | change |
| (dollars in millions) | | |
Depreciation and amortization | $ | 319.4 | | $ | 286.8 | | 11.4% |
As a percentage of total revenue | | 3.2% | | | 3.3% | | (0.1%) |
Depreciation and amortization decreased 0.1% as a percentage of total revenue for the year ended December 31, 2023 compared to the year ended December 31, 2022, primarily due to sales leverage, partially offset by increased depreciation expense associated with new restaurants and, to a lesser extent, the reduction of useful lives for certain leasehold improvements.
Impairment, Closure Costs, and Asset Disposals
| | | | | | | |
| | | | | | | |
| Year ended December 31, | | Percentage |
| 2023 | | 2022 | | change |
| (dollars in millions) | | |
Impairment, closure costs, and asset disposals | $ | 38.4 | | $ | 21.1 | | 81.5% |
As a percentage of total revenue | | 0.4% | | | 0.2% | | 0.2% |
Impairment, closure costs, and asset disposals increased in dollar terms for the year ended December 31, 2023 compared to the year ended December 31, 2022, primarily due to elevated impairment of operating lease assets and leasehold improvements and higher charges related to the replacement of certain leasehold improvements and, to a lesser extent, the replacement of certain kitchen equipment. These elevated impairments include the impact of closing all Pizzeria Locale restaurants.
Interest and Other Income, Net
| | | | | | | |
| | | | | | | |
| Year ended December 31, | | Percentage |
| 2023 | | 2022 | | change |
| (dollars in millions) | | |
Interest and other income, net | $ | 62.7 | | $ | 21.1 | | 196.7% |
As a percentage of total revenue | | 0.6% | | | 0.2% | | 0.4% |
Interest and other income, net increased in dollar terms for the year ended December 31, 2023 compared to the year ended December 31, 2022, primarily due to increased interest income on our investments in U.S. Treasury securities, money market funds and time deposits, partially offset by a gain on our investments in Tractor Beverages, Inc. of $10.4 million recognized in the second quarter of 2022.
Provision for Income Taxes
| | | | | | | |
| | | | | | | |
| Year ended December 31, | | Percentage |
| 2023 | | 2022 | | change |
| (dollars in millions) | | |
Provision for income taxes | $ | (391.8) | | $ | (282.4) | | 38.7% |
Effective income tax rate | | 24.2% | | | 23.9% | | n/m* |
| | | | | | | |
*Not meaningful | | | | | | | |
The effective income tax rate increased 0.3% for the year ended December 31, 2023, compared to the year ended December 31, 2022, primarily due to a 0.4% decrease in excess tax benefits from equity vesting and exercises.
Quarterly Financial Data/Seasonality
Seasonal factors cause our profitability to fluctuate from quarter to quarter. Historically, our average daily restaurant sales and net income are lower in the first and fourth quarters due, in part, to the holiday season and because fewer people eat out during periods of inclement weather (the winter months) than during periods of mild or warm weather (the spring, summer and fall months). Other factors also have a seasonal effect on our results. For example, restaurants located near colleges and universities generally do more business during the academic year. Seasonal factors, however, might be moderated or outweighed by other factors that may influence our quarterly results, such as unexpected publicity impacting our business in a positive or negative way, worldwide health pandemics, impact of inflation on consumer spending, fluctuations in food or packaging costs, or the timing of menu price increases or promotional activities and other marketing initiatives. The number of trading days in a quarter can also affect our results, although, on an overall annual basis, changes in trading days do not have a significant impact.
Our quarterly results are also affected by other factors such as the amount and timing of non-cash stock-based compensation expense and related tax rate impacts, litigation, settlement costs and related legal expenses, impairment charges and non-operating costs, timing of marketing or promotional expenses, the number and timing of new restaurants opened in a quarter, and closure of restaurants. New restaurants typically have higher operating costs following opening because of the expenses associated with their opening and operating inefficiencies in the months immediately following opening. Accordingly, results for a particular quarter are not necessarily indicative of results to be expected for any other quarter or for any year.
Liquidity and Capital Resources
Cash and Investments
As of December 31, 2023, we had a cash and marketable investments balance of $1.8 billion, non-marketable investments of $75.4 million, and $25.6 million of restricted cash. After funding the current operations in our restaurants and support centers, the first planned use of our cash flow from operations is to provide capital for the continued investment in new restaurant construction. In addition to continuing to invest in our restaurant expansion, we expect to utilize cash flow from operations to: repurchase additional shares of our common stock subject to market conditions; invest in, maintain, and refurbish our existing restaurants; and for general corporate purposes. As of December 31, 2023, $424.1 million remained available for repurchases of shares of our common stock, which includes the $200.0 million additional authorization approved by our Board of Directors on December 14, 2023. Under the remaining repurchase authorizations, shares may be purchased from time to time in open market transactions, subject to market conditions.
Borrowing Capacity
As of December 31, 2023, we had $500.0 million of undrawn borrowing capacity under a line of credit facility.
Use of Cash
We believe that cash from operations, together with our cash and investment balances, will be sufficient to meet ongoing capital expenditures, working capital requirements and other cash needs for the foreseeable future. Assuming no significant declines in comparable restaurant sales, we expect we will generate positive cash flow for the foreseeable future.
We have not required significant working capital because customers generally pay using cash or credit and debit cards and because our operations do not require significant receivables, nor do they require significant inventories due, in part, to our use of various fresh ingredients. In addition, we generally have the right to pay for the purchase of food, beverages and supplies sometime after the receipt of those items, generally within ten days, thereby reducing the need for incremental working capital to support our growth.
Our total capital expenditures for 2023 were $560.7 million. In 2023, we spent on average about $1.4 million in development and construction costs per new restaurant, or about $1.2 million net of landlord reimbursements of $0.2 million. In 2024, we expect to incur about $635.0 million in total capital expenditures. We expect approximately $430.0 million in capital expenditures related to our construction of new restaurants, before any reductions for landlord reimbursements. For new restaurants to be opened in 2024, we anticipate average development costs will remain consistent with 2023. We expect approximately $130.0 million in capital expenditures related to investments in existing restaurants including remodeling and similar improvements, new equipment and hardware, technology to optimize efficiencies. Finally, we expect a portion of our incurred capital expenditures to be for additional corporate initiatives including investments in technology to boost innovation, enhance the guest experience, and improve operations.
The following table summarizes current and long-term material cash requirements as of December 31, 2023, which we expect to fund primarily with operating cash flows:
| | | | | | | | | | | | | | | |
| | | | | | | | | | | | | | | |
| | Payments Due by Fiscal Year |
| | Total | | 2024 | | 2025-2026 | | 2027-2028 | | Thereafter |
| | (dollars in millions) |
Operating leases(1) | | $ | 6,343 | | $ | 447 | | $ | 971 | | $ | 938 | | $ | 3,987 |
Purchase obligations(2) | | | 2,090 | | | 969 | | | 768 | | | 352 | | | 1 |
Total | | $ | 8,433 | | $ | 1,416 | | $ | 1,739 | | $ | 1,290 | | $ | 3,988 |
(1)See Note 9. “Leases” of our consolidated financial statements included in Item 8. “Financial Statements and Supplementary Data.” This includes commitments related to reasonably certain renewal periods.
(2)Purchase obligations include agreements to purchase goods or services that are enforceable and legally binding on us and that specify all significant terms. We have excluded agreements that are cancelable without penalty. The majority of our purchase obligations relate to food, beverage and packaging, capital projects, information technology, marketing initiatives and corporate sponsorships, and other miscellaneous items.
The above table does not include income tax liabilities for uncertain tax positions for which we are not able to make a reasonably reliable estimate of the amount and period of related future payments. Additionally, we have excluded our estimated loss contingencies, due to uncertainty regarding the timing and amount of payment. See Note 11. “Commitments and Contingencies” of our consolidated financial statements included in Item 8. “Financial Statements and Supplementary Data.”
Cash Flows
Cash provided by operating activities was $1.8 billion for the year ended December 31, 2023, compared to $1.3 billion for the year ended December 31, 2022. The increase was primarily due to higher net earnings and, to a lesser extent, net cash changes in non-tax operating assets and liabilities.
Cash used in investing activities was $946.0 million for the year ended December 31, 2023, compared to $830.0 million for the year ended December 31, 2022. The change was primarily associated with increased capital expenditures of $81.6 million primarily related to costs associated with new restaurant development and, to a lesser extent, a $34.4 million increase in investment purchases net of investment maturities.
Cash used in financing activities was $660.7 million for the year ended December 31, 2023, compared to $929.4 million for the year ended December 31, 2022. The change was primarily due to decreased treasury stock repurchases of $237.8 million and, to a lesser extent, $29.8 million of lower payments of tax withholdings related to stock-based compensation.
Critical Accounting Estimates
We describe our significant accounting policies in Note 1. “Description of Business and Summary of Significant Accounting Policies” of our consolidated financial statements included in Item 8. “Financial Statements and Supplementary Data.” Critical accounting estimates are those that we believe are both significant and that require us to make difficult, subjective or complex judgments, often because we need to estimate the effect of inherently uncertain matters. We base our estimates and judgments on historical experiences and various other factors that we believe to be appropriate under the circumstances. Actual results may differ from these estimates, and we might obtain different estimates if we used different assumptions or factors.
Leases
The majority of our operating leases consist of restaurant locations and office space. We determine if a contract contains a lease at inception. Our leases generally have remaining terms of 1-20 years and most include options to extend the leases for additional 5-year periods. Generally, the lease term is the minimum of the noncancelable period of the lease or the lease term inclusive of reasonably certain renewal periods up to a term of 20 years. If the estimate of our reasonably certain lease term was changed, our depreciation and rent expense could differ materially.
Operating lease assets and liabilities are recognized at the lease commencement date, which is the date we control the use of the property. Operating lease liabilities represent the present value of lease payments not yet paid. We made the policy election to combine lease and non-lease components. We consider fixed common area maintenance (“CAM”) part of our fixed future lease payments; therefore, fixed CAM is also included in our operating lease liability. Operating lease assets represent our right to use an underlying asset and are based upon the operating lease liabilities adjusted for prepayments, initial direct costs, lease incentives, and impairment of operating lease assets. To determine the present value of lease payments not yet paid, we estimate incremental borrowing rates corresponding to the reasonably certain lease term. As we have no outstanding debt nor committed credit facilities, secured or otherwise, we estimate this rate based on prevailing financial market conditions, comparable company and credit analysis, and management judgment. If the estimate of our incremental borrowing rate was changed, our operating lease assets and liabilities could differ materially.
Deferred Revenue
Chipotle Rewards
Eligible customers who enroll in the Chipotle Rewards loyalty program generally earn points for every dollar spent. After accumulating the required number of points, the customer may select a reward. Earned rewards generally expire one to two months after they are issued, and points generally expire if an account is inactive for a period of six months.
The estimation of the standalone selling price of points and other rewards issued to customers involves several assumptions, primarily the estimated value of product for which the reward is expected to be redeemed and the probability that the points or reward will expire. Our estimate of points and other rewards we expect to be redeemed is based on historical company specific data. These inputs are subject to change over time due to factors such as menu price increases, changes in point redemption options and changes in customer behavior. A relative increase of 100 basis points in our estimated ultimate redemption rate for future redemptions would have resulted in a reduction of food and beverage revenue on our consolidated statement of income and comprehensive income of approximately $0.9 million for the year ended December 31, 2023.
Gift Cards
We sell gift cards, which do not have expiration dates, and we do not deduct non-usage fees from outstanding gift card balances. Gift card balances are initially recorded as unearned revenue. We recognize revenue from gift cards when the gift card is redeemed by the customer. Historically, the majority of gift cards are redeemed within one year. In addition, a portion of gift cards are not expected to be redeemed and will be recognized as breakage over time in proportion to gift card redemptions (“gift card breakage rate”). The gift card breakage rate is based on company and program specific information, including historical redemption patterns, and expected remittance to government agencies under unclaimed property laws, if applicable. We evaluate our gift card breakage rate estimate annually, or more frequently as circumstances warrant, and apply that rate to gift card redemptions. A relative decrease of 100 basis points to our gift card breakage rate would have resulted in a reduction of food and beverage revenue on our consolidated statement of income and comprehensive income of approximately $0.6 million for the year ended December 31, 2023.
Impairment of Long-Lived Assets
Long-lived assets are reviewed for impairment whenever events or changes in circumstances indicate that the carrying amount of an asset may not be recoverable. Long-lived assets are grouped at the lowest level for which identifiable cash flows are largely independent of the cash flows of other assets and liabilities. For restaurant assets, we test impairment at the individual restaurant asset group level, which includes leasehold improvements, property and equipment and operating lease assets.
The fair value measurement for asset impairment is generally based on Level 3 inputs. We first compare the carrying value of the asset (or asset group, referred interchangeably throughout as asset) to the asset’s estimated future undiscounted cash flows. If the estimated undiscounted future cash flows are less than the carrying value of the asset, we determine if we have an impairment loss by comparing the carrying value of the asset to the asset's estimated fair value. The estimated fair value of the asset is generally determined using the income approach to measure the fair value, which is based on the present value of estimated future cash flows. Key inputs to the income approach for restaurant assets include the discount rate, projected revenue and expenses, and sublease income if we are closing the restaurant. In certain cases, management uses other market information, when available, to estimate the fair value of an asset. The impairment charges represent the excess of each asset’s carrying amount over its estimated fair value and are allocated among the long-lived asset or assets of the group.
Our estimates of future revenues and expenses are highly subjective judgments based on internal projections and knowledge of our operations, historical performance, and trends in sales and restaurant operating costs, and can be significantly impacted by changes in our business or economic conditions. The determination of asset fair value is also subject to significant judgment and utilizes valuation techniques including discounting estimated future cash flows and market-based analyses to determine fair value. If our estimates or underlying assumptions, including discount rate and sublease income change in the future, our operating results may be materially impacted.
Stock-based Compensation
We recognize compensation expense for equity awards over the requisite service period based on the award’s fair value. We use the Black-Scholes valuation model to determine the fair value of our stock-only stock appreciation rights (“SOSARs”), and we use the Monte Carlo simulation model to determine the fair value of stock awards that contain market conditions. Both of these models require assumptions to be made regarding our stock price volatility, the expected life of the award and expected dividend rates. The volatility and the expected life assumptions were based on our historical data. Similarly, the compensation expense of performance share awards is based in part on the estimated probability of achieving levels of performance associated with particular levels of payout for performance shares. We determine the probability of achievement of future levels of performance by comparing the relevant performance level with our internal estimates of future performance. Those estimates are based on a number of assumptions, including but not limited to growth in restaurant cash flow dollars, growth in comparable restaurant sales and average restaurant level operating margin, and different assumptions may have resulted in different conclusions regarding the probability of achieving future levels of performance relevant to the payout levels for the awards. If we change our estimates of stock price volatility or expected lives of our SOSARs, or if we change our assumptions regarding the probability of achieving future levels of performance with respect to performance share awards, our stock-based compensation expense and results of operations may be materially impacted.
Insurance Liability
We are self-insured for a significant portion of our employee health benefits programs. We carry significant retentions for risks and associated liabilities with respect to workers’ compensation, general liability, property and auto damage, employment practices liability, cyber liability and directors’ and officers’ liability. Predetermined loss limits have been arranged with third-party insurance companies to limit exposure to these claims. We record a liability that represents our estimated cost of claims incurred and unpaid as of the balance sheet date. Our estimated liability is not discounted and is based on a number of assumptions and factors, including historical trends, actuarial assumptions and economic conditions, and is closely monitored and adjusted when warranted by changing circumstances. If a greater amount of claims occurs compared to what we have estimated, or if medical costs increase beyond what we expected, our accrued liabilities might not be sufficient. Actual claims experience could also be more favorable than estimated. If we change our estimates for the cost of claims incurred and unpaid, or if actual claims differ from these estimates, our insurance expense and results of operations may be materially impacted.
Reserves/Contingencies for Litigation and Other Matters
We are involved in various claims and legal actions that arise in the ordinary course of business. We record an accrual for legal contingencies when we determine that it is probable that we have incurred a liability and we can reasonably estimate the amount of the loss. Although we have recorded liabilities related to a number of legal actions, our estimates used to determine the amount of these liabilities may not be accurate, and there are other legal actions for which we have not recorded a liability. As a result, in the event legal actions for which we have not accrued a liability or for which our accrued liabilities are not accurate are resolved, such resolution may affect our operating results and cash flows.
Income Taxes
Our provision for income taxes, deferred tax assets and liabilities and any related valuation allowance requires the use of estimates based on our management’s interpretation and application of complex tax laws and accounting guidance. We are primarily subject to income taxes in the U.S. We establish reserves for uncertain tax positions for material, known tax exposures relating to deductions, transactions and other matters involving some uncertainty as to the measurement and recognition of the item. We may adjust these reserves when our judgment changes as a result of the evaluation of new information not previously available and will be reflected in the period in which the new information is available, or due to the expiration of any applicable statute of limitations. While we believe that our reserves are adequate, issues raised by a tax authority may be resolved at an amount different than the related reserve and could materially increase or decrease our income tax provision in future periods.
ITEM 7A. QUANTITATIVE AND QUALITATIVE DISCLOSURE ABOUT MARKET RISK
Commodity Price Risks
We are exposed to commodity price risks. Many of the ingredients we use to prepare our food, as well as our packaging materials and utilities to run our restaurants, are ingredients or commodities that are affected by the price of other commodities, exchange rates, foreign demand, weather, seasonality, production, availability and other factors outside our control. We work closely with our suppliers and use a mix of forward pricing protocols under which we agree with our supplier on fixed prices for deliveries at some time in the future, fixed pricing protocols under which we agree on a fixed price with our supplier for the duration of that protocol, formula pricing protocols under which the prices we pay are based on a specified formula related to the prices of the goods, such as spot prices or based on changes in industry indices, and range forward protocols under which we agree on a price range for the duration of that protocol. Generally, our pricing protocols with suppliers can remain in effect for periods ranging from one to 24 months, depending on the outlook for prices of the particular ingredient. In some cases, we have minimum purchase obligations. We have tried to increase, where practical, the number of suppliers for our ingredients, which we believe can help mitigate pricing volatility, and we follow industry news, trade issues, exchange rates, foreign demand, weather, crises and other world events that may affect our ingredient prices. Increases in ingredient prices could adversely affect our results if we choose for competitive or other reasons not to increase menu prices at the same rate at which ingredient costs increase, or if menu price increases result in customer resistance. We also could experience shortages of key ingredients for many unforeseen reasons, such as crop damage due to inclement weather, if our suppliers need to close or restrict operations, or due to industry-wide shipping and freight delays.
Changing Interest Rates
We are exposed to interest rate risk through fluctuations of interest rates on our investments. As of December 31, 2023, we had $1.9 billion in cash and cash equivalents, current and long-term investments, and restricted cash, of which the substantial majority are interest bearing. Changes in interest rates affect the interest income we earn, and therefore impact our cash flows and results of operations.
Foreign Currency Exchange Risk
A portion of our operations consist of activities outside of the U.S. and we have currency risk on the transactions in other currencies and translation adjustments resulting from the conversion of our international financial results into the U.S. dollar. However, a substantial majority of our operations and investment activities are transacted in the U.S., and therefore our foreign currency risk is not material at this date.
ITEM 8. FINANCIAL STATEMENTS AND SUPPLEMENTARY DATA
Report of Independent Registered Public Accounting Firm
To the Shareholders and the Board of Directors of Chipotle Mexican Grill, Inc.
Opinion on the Financial Statements
We have audited the accompanying consolidated balance sheets of Chipotle Mexican Grill, Inc. (the Company) as of December 31, 2023 and 2022, the related consolidated statements of income and comprehensive income, shareholders' equity and cash flows for each of the three years in the period ended December 31, 2023, and the related notes (collectively referred to as the “consolidated financial statements”). In our opinion, the consolidated financial statements present fairly, in all material respects, the financial position of the Company at December 31, 2023 and 2022, and the results of its operations and its cash flows for each of the three years in the period ended December 31, 2023, in conformity with U.S. generally accepted accounting principles.
We also have audited, in accordance with the standards of the Public Company Accounting Oversight Board (United States) (PCAOB), the Company's internal control over financial reporting as of December 31, 2023, based on criteria established in Internal Control-Integrated Framework issued by the Committee of Sponsoring Organizations of the Treadway Commission (2013 framework) and our report dated February 7, 2024 expressed an unqualified opinion thereon.
Basis for Opinion
These financial statements are the responsibility of the Company's management. Our responsibility is to express an opinion on the Company’s financial statements based on our audits. We are a public accounting firm registered with the PCAOB and are required to be independent with respect to the Company in accordance with the U.S. federal securities laws and the applicable rules and regulations of the Securities and Exchange Commission and the PCAOB.
We conducted our audits in accordance with the standards of the PCAOB. Those standards require that we plan and perform the audit to obtain reasonable assurance about whether the financial statements are free of material misstatement, whether due to error or fraud. Our audits included performing procedures to assess the risks of material misstatement of the financial statements, whether due to error or fraud, and performing procedures that respond to those risks. Such procedures included examining, on a test basis, evidence regarding the amounts and disclosures in the financial statements. Our audits also included evaluating the accounting principles used and significant estimates made by management, as well as evaluating the overall presentation of the financial statements. We believe that our audits provide a reasonable basis for our opinion.
Critical Audit Matter
The critical audit matter communicated below is a matter arising from the current period audit of the financial statements that was communicated or required to be communicated to the audit committee and that: (1) relates to accounts or disclosures that are material to the financial statements and (2) involved our especially challenging, subjective or complex judgments. The communication of the critical audit matter does not alter in any way our opinion on the consolidated financial statements, taken as a whole, and we are not, by communicating the critical audit matter below, providing a separate opinion on the critical audit matter or on the account or disclosure to which it relates.
| | |
| | |
| | Evaluation of stock-based compensation performance condition assumptions |
Description of the Matter | | The Company incurred $126.7 million in stock-based compensation expense during the year ended December 31, 2023. Approximately 114,000 of the Company’s vested and non-vested stock awards were subject to performance conditions during the year ended December 31, 2023. As described in Notes 1 and 8 of the consolidated financial statements, the Company records the grant date fair value of the performance stock awards and expenses the fair value of the performance stock awards subject to service conditions over the respective vesting period. Stock-based compensation expense of stock awards subject to performance conditions is based on the estimated probability of achieving levels of performance associated with particular levels of payout. Additionally, at each reporting period, the Company evaluates the probable outcome of the performance conditions including consideration of significant assumptions and as applicable, recognizes the cumulative effect of the change in estimate in the period of the change. Auditing the estimated quantity of awards the Company determined are probable of vesting for the Company’s stock awards subject to performance conditions was complex and judgmental. In particular, the stock compensation expense is sensitive to significant assumptions including management’s internal estimates of the Company’s future performance. |
How We Addressed the Matter in Our Audit | | We obtained an understanding, evaluated the design, and tested the operating effectiveness of management’s controls over stock-based compensation. We tested controls over management’s review of the assumptions used with regards to the performance conditions. We also tested management's controls to validate that data used in management’s internal estimates of the Company’s future performance was complete and accurate. Our substantive audit procedures included, among others, testing the significant assumptions underlying the performance conditions (e.g., certain targets related to growth in cumulative restaurant cash flow dollars and cumulative base restaurant cash flow dollars) and testing the completeness and accuracy of the underlying data. We evaluated management’s significant assumptions by comparing the assumptions to current market and economic trends, historical results of the Company's business, and to other relevant factors. We additionally performed a sensitivity analysis of the significant assumptions to evaluate the change in the expense to be recognized for the stock awards subject to performance conditions. We also evaluated the adequacy of the Company’s stock-based compensation disclosures included in Notes 1 and 8 of the consolidated financial statements in relation to these matters. |
/s/ Ernst & Young LLP
We have served as the Company’s auditor since 1997.
Irvine, California
February 7, 2024
CHIPOTLE MEXICAN GRILL, INC.
CONSOLIDATED BALANCE SHEETS
(in thousands, except per share data)
| | | | | |
| | | | | |
| December 31, |
| 2023 | | 2022 |
Assets | | | | | |
Current assets: | | | | | |
Cash and cash equivalents | $ | 560,609 | | $ | 384,000 |
Accounts receivable, net | | 115,535 | | | 106,880 |
Inventory | | 39,309 | | | 35,668 |
Prepaid expenses and other current assets | | 117,462 | | | 86,412 |
Income tax receivable | | 52,960 | | | 47,741 |
Investments | | 734,838 | | | 515,136 |
Total current assets | | 1,620,713 | | | 1,175,837 |
Leasehold improvements, property and equipment, net | | 2,170,038 | | | 1,951,147 |
Long-term investments | | 564,488 | | | 388,055 |
Restricted cash | | 25,554 | | | 24,966 |
Operating lease assets | | 3,578,548 | | | 3,302,402 |
Other assets | | 63,082 | | | 63,158 |
Goodwill | | 21,939 | | | 21,939 |
Total assets | $ | 8,044,362 | | $ | 6,927,504 |
Liabilities and shareholders' equity | | | | | |
Current liabilities: | | | | | |
Accounts payable | $ | 197,646 | | $ | 184,566 |
Accrued payroll and benefits | | 227,537 | | | 170,456 |
Accrued liabilities | | 147,688 | | | 147,539 |
Unearned revenue | | 209,680 | | | 183,071 |
Current operating lease liabilities | | 248,074 | | | 236,248 |
Total current liabilities | | 1,030,625 | | | 921,880 |
Commitments and contingencies (Note 11) | | | | | |
Long-term operating lease liabilities | | 3,803,551 | | | 3,495,162 |
Deferred income tax liabilities | | 89,109 | | | 98,623 |
Other liabilities | | 58,870 | | | 43,816 |
Total liabilities | | 4,982,155 | | | 4,559,481 |
Shareholders' equity: | | | | | |
Preferred stock, $0.01 par value, 600,000 shares authorized, no shares issued as of December 31, 2023 and December 31, 2022, respectively | | - | | | - |
Common stock, $0.01 par value, 230,000 shares authorized, 37,483 and 37,320 shares issued as of December 31, 2023 and December 31, 2022, respectively | | 375 | | | 373 |
Additional paid-in capital | | 1,956,160 | | | 1,829,304 |
Treasury stock, at cost, 10,057 and 9,693 common shares as of December 31, 2023 and December 31, 2022, respectively | | (4,944,656) | | | (4,282,014) |
Accumulated other comprehensive loss | | (6,657) | | | (7,888) |
Retained earnings | | 6,056,985 | | | 4,828,248 |
Total shareholders' equity | | 3,062,207 | | | 2,368,023 |
Total liabilities and shareholders' equity | $ | 8,044,362 | | $ | 6,927,504 |
See accompanying notes to consolidated financial statements.
CHIPOTLE MEXICAN GRILL, INC.
CONSOLIDATED STATEMENTS OF INCOME AND COMPREHENSIVE INCOME
(in thousands, except per share data)
| | | | | | | | |
| | | | | | | | |
| Year ended December 31, |
| 2023 | | 2022 | | 2021 |
Food and beverage revenue | $ | 9,804,124 | | $ | 8,558,001 | | $ | 7,457,169 |
Delivery service revenue | | 67,525 | | | 76,651 | | | 89,892 |
Total revenue | | 9,871,649 | | | 8,634,652 | | | 7,547,061 |
Restaurant operating costs (exclusive of depreciation and amortization shown separately below): | | | | | | | | |
Food, beverage and packaging | | 2,912,564 | | | 2,602,245 | | | 2,308,631 |
Labor | | 2,440,982 | | | 2,197,958 | | | 1,917,761 |
Occupancy | | 503,264 | | | 460,425 | | | 416,606 |
Other operating costs | | 1,428,747 | | | 1,311,905 | | | 1,197,054 |
General and administrative expenses | | 633,584 | | | 564,191 | | | 606,854 |
Depreciation and amortization | | 319,394 | | | 286,826 | | | 254,657 |
Pre-opening costs | | 36,931 | | | 29,560 | | | 21,264 |
Impairment, closure costs, and asset disposals | | 38,370 | | | 21,139 | | | 19,291 |
Total operating expenses | | 8,313,836 | | | 7,474,249 | | | 6,742,118 |
Income from operations | | 1,557,813 | | | 1,160,403 | | | 804,943 |
Interest and other income, net | | 62,693 | | | 21,128 | | | 7,820 |
Income before income taxes | | 1,620,506 | | | 1,181,531 | | | 812,763 |
Provision for income taxes | | (391,769) | | | (282,430) | | | (159,779) |
Net income | $ | 1,228,737 | | $ | 899,101 | | $ | 652,984 |
Earnings per share: | | | | | | | | |
Basic | $ | 44.59 | | $ | 32.28 | | $ | 23.21 |
Diluted | $ | 44.34 | | $ | 32.04 | | $ | 22.90 |
Weighted-average common shares outstanding: | | | | | | | | |
Basic | | 27,555 | | | 27,851 | | | 28,132 |
Diluted | | 27,710 | | | 28,062 | | | 28,511 |
Other comprehensive income/(loss), net of income taxes: | | | | | | | | |
Foreign currency translation adjustments | $ | 1,231 | | $ | (2,534) | | | (1,125) |
Comprehensive income | $ | 1,229,968 | | $ | 896,567 | | $ | 651,859 |
See accompanying notes to consolidated financial statements.
CHIPOTLE MEXICAN GRILL, INC.
CONSOLIDATED STATEMENTS OF SHAREHOLDERS’ EQUITY
(in thousands)
| | | | | | | | | | | | | | | | | | | | | |
| Common Stock | | | | Treasury Stock | | | | | | | | |
| Shares | | Amount | | Additional
Paid-In
Capital | | Shares | | Amount | | Retained
Earnings | | Accumulated Other Comprehensive Loss | | Total |
Balance, December 31, 2020 | 36,704 | | $ | 367 | | $ | 1,549,909 | | 8,703 | | $ | (2,802,075) | | $ | 3,276,163 | | $ | (4,229) | | $ | 2,020,135 |
Stock-based compensation | - | | | - | | | 178,703 | | - | | | - | | | - | | | - | | | 178,703 |
Stock plan transactions and other | 428 | | | 4 | | | 700 | | - | | | - | | | - | | | - | | | 704 |
Acquisition of treasury stock | - | | | - | | | - | | 349 | | | (554,027) | | | - | | | - | | | (554,027) |
Net income | - | | | - | | | - | | - | | | - | | | 652,984 | | | - | | | 652,984 |
Other comprehensive income (loss), net of income taxes | - | | | - | | | - | | - | | | - | | | - | | | (1,125) | | | (1,125) |
Balance, December 31, 2021 | 37,132 | | $ | 371 | | $ | 1,729,312 | | 9,052 | | $ | (3,356,102) | | $ | 3,929,147 | | $ | (5,354) | | $ | 2,297,374 |
Stock-based compensation | - | | | - | | | 99,821 | | - | | | - | | | - | | | - | | | 99,821 |
Stock plan transactions and other | 188 | | | 2 | | | 171 | | - | | | - | | | - | | | - | | | 173 |
Acquisition of treasury stock | - | | | - | | | - | | 641 | | | (925,912) | | | - | | | - | | | (925,912) |
Net income | - | | | - | | | - | | - | | | - | | | 899,101 | | | - | | | 899,101 |
Other comprehensive income (loss), net of income taxes | - | | | - | | | - | | - | | | - | | | - | | | (2,534) | | | (2,534) |
Balance, December 31, 2022 | 37,320 | | $ | 373 | | $ | 1,829,304 | | 9,693 | | $ | (4,282,014) | | $ | 4,828,248 | | $ | (7,888) | | $ | 2,368,023 |
Stock-based compensation | - | | | - | | | 126,686 | | - | | | - | | | - | | | - | | | 126,686 |
Stock plan transactions and other | 163 | | | 2 | | | 170 | | - | | | - | | | - | | | - | | | 172 |
Acquisition of treasury stock | - | | | - | | | - | | 364 | | | (662,642) | | | - | | | - | | | (662,642) |
Net income | - | | | - | | | - | | - | | | - | | | 1,228,737 | | | - | | | 1,228,737 |
Other comprehensive income (loss), net of income taxes | - | | | - | | | - | | - | | | - | | | - | | | 1,231 | | | 1,231 |
Balance, December 31, 2023 | 37,483 | | $ | 375 | | $ | 1,956,160 | | 10,057 | | $ | (4,944,656) | | $ | 6,056,985 | | $ | (6,657) | | $ | 3,062,207 |
See accompanying notes to consolidated financial statements.
CHIPOTLE MEXICAN GRILL, INC.
CONSOLIDATED STATEMENTS OF CASH FLOWS
(in thousands)
| | | | | | | | |
| | | | | | | | |
| Year ended December 31, |
| 2023 | | 2022 | | 2021 |
Operating activities | | | | | | | | |
Net income | $ | 1,228,737 | | $ | 899,101 | | $ | 652,984 |
Adjustments to reconcile net income to net cash provided by operating activities: | | | | | | | | |
Depreciation and amortization | | 319,394 | | | 286,826 | | | 254,657 |
Deferred income tax provision | | (9,505) | | | (43,195) | | | (12,357) |
Impairment, closure costs, and asset disposals | | 37,025 | | | 20,738 | | | 17,086 |
Provision for credit losses | | 1,570 | | | (760) | | | 493 |
Stock-based compensation expense | | 124,016 | | | 98,030 | | | 176,392 |
Other | | (13,080) | | | (16,202) | | | (4,599) |
Changes in operating assets and liabilities: | | | | | | | | |
Accounts receivable | | (11,216) | | | (14,026) | | | (1,687) |
Inventory | | (3,649) | | | (3,011) | | | (6,392) |
Prepaid expenses and other current assets | | (39,211) | | | (14,660) | | | (26,826) |
Operating lease assets | | 254,241 | | | 234,273 | | | 223,837 |
Other assets | | 4,204 | | | (346) | | | 3,993 |
Accounts payable | | 5,313 | | | 18,208 | | | 21,440 |
Accrued payroll and benefits | | 57,048 | | | 9,864 | | | (44,555) |
Accrued liabilities | | 3,188 | | | (27,964) | | | 10,997 |
Unearned revenue | | 35,685 | | | 33,374 | | | 34,387 |
Income tax payable/receivable | | (5,237) | | | 46,262 | | | 193,379 |
Operating lease liabilities | | (214,477) | | | (207,186) | | | (207,164) |
Other long-term liabilities | | 9,431 | | | 3,853 | | | (3,984) |
Net cash provided by operating activities | | 1,783,477 | | | 1,323,179 | | | 1,282,081 |
Investing activities | | | | | | | | |
Purchases of leasehold improvements, property and equipment | | (560,731) | | | (479,164) | | | (442,475) |
Purchases of investments | | (1,115,131) | | | (614,416) | | | (429,350) |
Maturities of investments | | 729,853 | | | 263,548 | | | 345,748 |
Proceeds from sale of equipment | | - | | | - | | | 4,035 |
Net cash used in investing activities | | (946,009) | | | (830,032) | | | (522,042) |
Financing activities | | | | | | | | |
Acquisition of treasury stock | | (592,349) | | | (830,140) | | | (466,462) |
Tax withholding on stock-based compensation awards | | (69,146) | | | (98,970) | | | (79,870) |
Other financing activities | | 843 | | | (294) | | | (2,274) |
Net cash used in financing activities | | (660,652) | | | (929,404) | | | (548,606) |
Effect of exchange rate changes on cash, cash equivalents and restricted cash | | 381 | | | (1,007) | | | (1,039) |
Net change in cash, cash equivalents, and restricted cash | | 177,197 | | | (437,264) | | | 210,394 |
Cash, cash equivalents, and restricted cash at beginning of year | | 408,966 | | | 846,230 | | | 635,836 |
Cash, cash equivalents, and restricted cash at end of year | $ | 586,163 | | $ | 408,966 | | $ | 846,230 |
Supplemental disclosures of cash flow information | | | | | | | | |
Income taxes paid (refunded) | $ | 400,229 | | $ | 275,796 | | $ | (17,831) |
Purchases of leasehold improvements, property and equipment accrued in accounts payable and accrued liabilities | $ | 76,415 | | $ | 72,021 | | $ | 63,802 |
Acquisition of treasury stock accrued in accounts payable and accrued liabilities | $ | 5,643 | | $ | 4,497 | | $ | 7,695 |
See accompanying notes to consolidated financial statements.
CHIPOTLE MEXICAN GRILL, INC.
NOTES TO CONSOLIDATED FINANCIAL STATEMENTS
(dollar and share amounts in thousands, unless otherwise specified)
1. Description of Business and Summary of Significant Accounting Policies
In this annual report on Form 10-K, Chipotle Mexican Grill, Inc., a Delaware corporation, together with its subsidiaries, is collectively referred to as “Chipotle,” “we,” “us,” or “our.”
We develop and operate restaurants that serve a relevant menu of burritos, burrito bowls, quesadillas, tacos, and salads, made using fresh, high-quality ingredients. As of December 31, 2023, we operated 3,437 restaurants, including 3,371 Chipotle restaurants within the United States, and 66 international Chipotle restaurants. In the current year we closed all non-Chipotle restaurants. We manage our U.S. operations based on eight regions and aggregate our operations to one reportable segment.
Principles of Consolidation and Basis of Presentation
Our consolidated financial statements include our accounts, our wholly and majority owned subsidiaries and investees we control after elimination of all intercompany accounts and transactions.
Management Estimates
The preparation of financial statements in conformity with U.S. generally accepted accounting principles requires management to make estimates and assumptions that affect the reported amounts of assets and liabilities and the disclosure of contingent assets and liabilities as of the date of the financial statements, as well as the reported amounts of revenue and expenses during the reporting period. Actual results could differ from those estimates under different assumptions or conditions.
Cash and Cash Equivalents
We consider highly liquid investment instruments purchased with an initial maturity of three months or less to be cash equivalents. Amounts receivable from credit card companies are also considered cash equivalents as they are both short-term and highly liquid in nature. We maintain cash and cash equivalent balances that exceed federally-insured limits with a number of financial institutions.
Restricted Cash
We maintain certain cash balances restricted as to withdrawal or use. Restricted cash assets are primarily insurance-related restricted trust assets.
Accounts Receivable
Accounts receivable primarily consists of receivables from third party gift card distributors, delivery partners, insurance liabilities covered by third-party insurance carriers and vendor rebates.
Allowance for Credit Losses
We closely monitor accounts receivable and held to maturity investment balances and estimate the allowance for credit losses when lifetime credit losses are expected by management. Our estimate is based on historical collection experience, external market data and other factors, including those related to current market conditions and events. We do not recognize a reserve for expected credit losses related to our U.S. Treasury security investments as management has concluded there is no risk of non-payment.
As of December 31, 2023 and 2022, our allowance for credit losses was $2,742 and $1,180, respectively.
Inventory
Inventory, consisting principally of food, beverages, and supplies, is valued at the lower of first-in, first-out cost or net realizable value.
Equity Method Investments
Investments are accounted for under the equity method if we are able to exercise significant influence, but not control, over an investee. Our share of the earnings or losses as reported by the investees is included in interest and other income, net on the consolidated statements of income and comprehensive income. The investments are evaluated for impairment annually and when facts and circumstances indicate that the carrying value may not be recoverable. If a decline in fair value is determined to be other-than-temporary, an impairment charge is recorded in interest income and other income, net on our consolidated statements of income and comprehensive income.
Investments
Investments classified as trading securities are carried at fair value with any unrealized gain or loss being recorded in interest and other income, net on the consolidated statements of income and comprehensive income. Investments classified as available-for-sale are carried at fair value with unrealized gains and losses, net of tax, included as a component of other comprehensive income (loss), net of income taxes on the consolidated statements of income and comprehensive income. Held-to-maturity securities are carried at amortized cost. Non-marketable equity investments are measured at cost, less impairments, if any, plus or minus changes resulting from observable price changes in orderly transactions for the identical or similar investment of the same issuer. These gains or losses are included in interest and other income, net on the consolidated statements of income and comprehensive income.
Impairment charges on investments are recognized in interest and other income, net on the consolidated statements of income and comprehensive income when management believes the decline in the fair value of the investment is other-than-temporary.
Fair Value Measurements
Fair value is the price we would receive to sell an asset or pay to transfer a liability (exit price) in an orderly transaction between market participants. For assets and liabilities recorded or disclosed at fair value, we determine fair value based on the following:
Level 1: Quoted prices in active markets for identical assets or liabilities that the entity has the ability to access.
Level 2: Observable inputs other than prices included in Level 1, such as quoted prices for similar assets and liabilities in active markets; quoted prices for identical or similar assets and liabilities in markets that are not active; or other inputs that are observable or can be corroborated with observable market data.
Level 3: Unobservable inputs for the asset or liability. This includes certain pricing models, discounted cash flow methodologies and similar techniques that use significant unobservable inputs.
Foreign Currency Translation
The functional currency of our foreign entities is the currency of the primary economic environment in which the entity operates. The operations, assets, and liabilities of our entities outside the U.S. are initially measured using the functional currency of that entity. Gains and losses arising from the impact of foreign currency exchange rate fluctuations on transactions in foreign currency are included as a separate component of other comprehensive income (loss), net of income taxes on the consolidated statements of income and comprehensive income. Assets and liabilities of these foreign entities are translated at exchange rates in effect as of the balance sheet date. Income and expense accounts are translated monthly using average monthly exchange rates. Resulting translation adjustments are recorded in accumulated other comprehensive loss on the consolidated balance sheets.
Leasehold Improvements, Property and Equipment
Leasehold improvements, property and equipment are recorded at cost. Internal costs directly associated with the acquisition, development and construction of a restaurant are capitalized. During the years ended December 31, 2023, 2022 and 2021, we capitalized $15,385, $12,695, and $10,870 of internal costs, respectively. Expenditures for refurbishments and improvements that significantly add to the productivity capacity or extend the useful life are capitalized, while expenditures for maintenance and repairs are expensed as incurred. Depreciation is calculated using the straight-line method over the estimated useful lives of the assets. Leasehold improvements are amortized over the shorter of the lease term, which generally includes option periods that are reasonably certain, or the estimated useful lives of the assets. Upon retirement or disposal of assets, the accounts are relieved of cost and accumulated depreciation and any related gain or loss is reflected in impairment, closure costs, and asset disposals in the consolidated statements of income and comprehensive income. Assets to be disposed of are reported at the lower of their carrying amount or fair value less estimated costs to sell.
At least annually, or when impairment indicators are present, we evaluate, and adjust when necessary, the estimated useful lives of leasehold improvements, property and equipment. The changes in estimated useful lives did not have a material impact on depreciation in any period. The estimated useful lives are:
| |
| |
Leasehold improvements and buildings | 3-20 years |
Furniture and fixtures | 4-7 years |
Equipment | 3-10 years |
Leases
The majority of our operating leases consist of restaurant locations and office space. We determine if a contract contains a lease at inception. Our leases generally have remaining terms of 1-20 years and most include options to extend the leases for additional 5-year periods. Generally, the lease term is the minimum of the noncancelable period of the lease or the lease term inclusive of reasonably certain renewal periods up to a term of 20 years.
We recognize an operating lease asset and operating lease liability for each lease with a contractual term greater than 12 months at the time of lease inception. We do not record leases with an initial term of 12 months or less on our consolidated balance sheet but continue to record rent expense on a straight-line basis over the lease term.
Operating lease assets and liabilities are recognized at the lease commencement date, which is the date we control the use of the property. Operating lease liabilities represent the present value of lease payments not yet paid. We made the policy election to combine lease and non-lease components. We consider fixed CAM part of our fixed future lease payments; therefore, fixed CAM is also included in our lease liability. To determine the present value of lease payments not yet paid, we estimate incremental borrowing rates corresponding to the lease term including reasonably certain renewal periods. As we have no outstanding debt nor committed credit facilities, secured or otherwise, we estimate this rate based on prevailing financial market conditions, comparable company and credit analysis, and management judgment.
Total lease costs, which are recorded primarily as occupancy costs, include fixed operating lease costs, variable lease costs and short-term lease costs. Most of our real estate leases require we pay certain expenses, such as CAM costs, real estate taxes and insurance, of which the fixed portion is included in operating lease costs. We recognize operating lease costs on a straight-line basis over the lease term. In addition to the above costs, variable lease costs also include amounts based on a percentage of gross sales in excess of specified levels and are recognized when probable and are not included in determining the present value of our operating lease liability.
Operating lease assets represent our right to use an underlying asset and are based upon the operating lease liabilities adjusted for prepayments, initial direct costs, lease incentives, and impairment of operating lease assets. For operating leases, operating lease assets are reduced over the lease term by the recognized straight-line lease expense less the amount of accretion of the lease liability. Additionally, tenant incentives used to fund leasehold improvements are generally recognized when earned and reduce our right-of-use asset related to the lease. These are amortized through the operating lease asset as reductions of expense over the lease term.
Our lease agreements do not contain any material residual value guarantees or material restrictive covenants. We have not entered into any leases with related parties.
Goodwill
Goodwill is not subject to amortization, but instead is tested for impairment annually in the fourth quarter, or more frequently when impairment indicators are present, and we are required to record any necessary impairment adjustments. Impairment is measured as the excess of the carrying value over the fair value of the goodwill. No impairment charges were recognized on goodwill for the years ended December 31, 2023, 2022, and 2021.
Other Assets
Other assets consist primarily of a rabbi trust as described further in Note 4. “Fair Value Measurements,” software as a service implementation costs where the service period is greater than one year, an equity method investment described further in Note 5. “Equity Investments” and transferable liquor licenses.
Insurance Liability
We are self-insured for a significant portion of our employee health benefits programs, and carry significant retentions for risks and associated liabilities with respect to workers’ compensation, general liability, property and auto damage, employment practices liability, cyber liability and directors’ and officers’ liability. Predetermined loss limits have been arranged with third party insurance companies to limit exposure to these claims. We record a liability that represents our estimated cost of claims incurred and unpaid as of the balance sheet date. Our estimated liability is not discounted and is based on a number of assumptions and factors, including historical trends, actuarial assumptions and economic conditions, and is closely monitored and adjusted when warranted by changing circumstances.
Reserves/Contingencies for Litigation and Other Matters
We are involved in various claims and legal actions that arise in the ordinary course of business. We record an accrual for legal contingencies when we determine that it is probable that we have incurred a liability and we can reasonably estimate the amount of the loss.
Income Taxes
We compute income taxes using the asset and liability method, under which deferred income tax assets and liabilities are recognized based on the differences between the financial reporting bases and the respective tax bases of assets and liabilities. Deferred tax assets and liabilities are measured using enacted tax rates expected to apply to taxable income in the years in which we expect the temporary differences to reverse. Any effects of changes in income tax rates or tax laws are included in the provision for income taxes in the period that includes the enactment date.
We routinely assess the realizability of our deferred tax assets by jurisdiction and may record a valuation allowance if, based on all available positive and negative evidence, we determine that some portion of the deferred tax assets may not be realized prior to expiration. If we determine that we may be able to realize our deferred tax assets in the future in excess of their net recorded amount, we would make an adjustment to the deferred tax asset valuation allowance, which would reduce the provision for income taxes during the period in which the determination was made that the deferred tax asset can be realized.
We evaluate our tax filing positions and recognize a tax benefit from an uncertain tax position only if it is more likely than not that based on its technical merits the tax position will be sustained upon examination by the relevant taxing authorities, including resolutions of any related appeals or litigation processes. The tax benefits recognized in the financial statements from such a position are measured based on the largest tax benefit that has a greater than 50% likelihood of being realized upon settlement with a taxing authority. For uncertain tax positions that do not meet this threshold, we record a related tax reserve in the period in which it arises. We adjust our unrecognized tax benefit liability and provision for income taxes in the period in which the uncertain tax position is effectively settled, the statute of limitations expires for the relevant taxing authority to examine the tax position or when new information becomes available that requires a change in recognition and/or measurement of the liability.
We recognize interest to be paid on an underpayment of income taxes in interest expense and any related statutory penalties in the provision for income taxes in our consolidated statements of income and comprehensive income. Accrued interest and penalties are included within the related tax reserve on our consolidated balance sheets.
Revenue Recognition
We generally recognize revenue, net of discounts and incentives, when payment is tendered at the point of sale. We report revenue net of sales-related taxes collected from customers and remitted to governmental taxing authorities. Food and beverage revenue primarily relates to the sale of food and beverages. Delivery service revenue is comprised of delivery and related service fees charged to customers on sales made through Chipotle’s app and website.
Delivery
We offer our customers delivery in almost all of our geographic regions. Delivery services are fulfilled by third-party service providers. In some cases, we make delivery sales through our website Chipotle.com or the Chipotle App (“White Label Sales”). In other cases, we make delivery sales through a non-Chipotle owned channel, such as the delivery partner’s website or mobile app (“Marketplace Sales”). With respect to White Label Sales, we control the delivery services and generally recognize revenue, including delivery fees, when the delivery partner transfers food to the customer. For these sales, we receive payment directly from the customer at the time of sale. With respect to Marketplace Sales, we generally recognize revenue, excluding delivery fees collected by the delivery partner, when control of the food is transferred to the delivery partner. We receive payment from the delivery partner subsequent to the transfer of food and the payment terms are short-term in nature.
Gift Cards
We sell gift cards, which do not have expiration dates and we do not deduct non-usage fees from outstanding gift card balances. Gift card balances are initially recorded as unearned revenue. We recognize revenue from gift cards when the gift card is redeemed by the customer. Historically, the majority of gift cards are redeemed within one year. In addition, a portion of gift cards are not expected to be redeemed and will be recognized as breakage over time in proportion to gift card redemptions. The gift card breakage rate is based on company and program specific information, including historical redemption patterns, and expected remittance to government agencies under unclaimed property laws, if applicable. We evaluate our gift card breakage rate estimate annually, or more frequently as circumstances warrant, and apply that rate to gift card redemptions. Gift card liability balances are typically highest at the end of each calendar year following increased gift card sales during the holiday season; accordingly, revenue recognized from gift card liability balances is highest in the first quarter of each calendar year.
Chipotle Rewards
We have a loyalty program called Chipotle Rewards. Eligible customers who enroll in the program generally earn points for every dollar spent.
We may also periodically offer promotions, which typically provide the customer with the opportunity to earn bonus points or other rewards. Customers may redeem earned points for various rewards, which are primarily comprised of free food and beverage items. Earned rewards generally expire one month to two months after they are issued, and points generally expire if an account is inactive for a period of six months.
We defer revenue associated with the estimated selling price of points or rewards earned by customers as each point or reward is earned, net of points or rewards we do not expect to be redeemed. The estimated selling price of each point or reward earned is based on the estimated value of the product for which the reward is expected to be redeemed. Our estimate of points and rewards we expect to be redeemed is based on historical and other company specific data. The costs associated with rewards redeemed are primarily included in food, beverage, and packaging on our consolidated statements of income and comprehensive income.
We evaluate Chipotle Rewards point breakage annually, or more frequently as circumstances warrant. The result of this annual breakage assessment did not have a material impact on our consolidated financial statements.
We recognize revenue associated with Chipotle Rewards within food and beverage revenue on the consolidated statements of income and comprehensive income when a customer redeems an earned reward. Deferred revenue associated with Chipotle Rewards is included in unearned revenue on our consolidated balance sheets.
Food, Beverage and Packaging Costs
Food, beverage and packaging costs include inventory, warehousing and related purchasing and distribution costs.
Other Operating Costs
Other operating costs include, among other items, marketing and promotional costs, delivery expense, bank and credit card processing fees, restaurant utilities, technology costs, and maintenance costs.
Consideration Received from Vendors
We receive consideration for a variety of vendor-sponsored programs, such as volume rebates and promotions. Vendor consideration is recorded as a reduction of food, beverage and packaging or other operating costs on our consolidated statements of income and comprehensive income depending on the classification of the related costs.
Advertising, Marketing and Promotional Costs
Advertising, marketing and promotional costs are expensed as incurred and totaled $264,085, $250,673 and $222,091 for the years ended December 31, 2023, 2022 and 2021, respectively. Advertising, marketing and promotional costs include costs related to free food which a customer does not need to make a purchase to earn. These costs are included in other operating costs on the consolidated statements of income and comprehensive income.
Stock-Based Compensation
During 2023, we issued shares as part of employee compensation pursuant to the Chipotle Mexican Grill, Inc. 2022 Stock Incentive Plan (the “2022 Incentive Plan”). SOSARs and stock awards generally vest equally on the second and third anniversaries of the grant date, and SOSARs expire after seven years. Stock-based compensation expense is generally recognized on a straight-line basis for each separate vesting portion. Compensation expense related to employees eligible to retire and retain full rights to the awards is recognized over 12 months which coincides with the service period required to earn the full award. We estimate forfeitures based on historical data when determining the amount of stock-based compensation costs to be recognized in each period. We have also granted stock awards with performance vesting conditions and/or market vesting conditions. Stock awards with performance or market vesting conditions generally vest based on our achievement versus stated targets or criteria over a three-year performance and service period. Performance goals are determined by the Board and include measures such as comparable restaurant sales, average restaurant operating margin, restaurant cash flow, new restaurant unit growth, and total shareholder return relative to our peer group. Compensation expense on stock awards subject to performance conditions, which is based on the quantity of awards we have determined are probable of vesting, is recognized over the longer of the estimated performance goal attainment period or time vesting period. Compensation expense is recognized ratably for awards subject to market conditions regardless of whether the market condition is satisfied, provided that the requisite service has been met. Some stock-based compensation awards are made to employees involved in our new restaurant development activities, and expense for these awards is recognized as capitalized development and included in leasehold improvements, property and equipment, net, on the consolidated balance sheets.
Restaurant Pre-Opening Costs
Pre-opening costs, including rent, wages, benefits and travel for training and opening teams, food and other restaurant operating costs, are expensed as incurred prior to a restaurant opening for business, and are included in operating expenses on the consolidated statements of income and comprehensive income.
Impairment of Long-Lived Assets
Long-lived assets are reviewed for impairment whenever events or changes in circumstances indicate that the carrying amount of an asset may not be recoverable. Long-lived assets are grouped at the lowest level for which identifiable cash flows are largely independent of the cash flows of other assets and liabilities. For restaurant assets we test impairment at the individual restaurant asset group level, which includes leasehold improvements, property and equipment and operating lease assets.
The fair value measurement for asset impairment is generally based on Level 3 inputs. See “Fair Value Measurements” above for a description of level inputs. We first compare the carrying value of the asset (or asset group, referred interchangeably throughout as asset) to the asset’s estimated future undiscounted cash flows. If the estimated undiscounted future cash flows are less than the carrying value of the asset, we determine if we have an impairment loss by comparing the carrying value of the asset to the asset's estimated fair value. The estimated fair value of the asset is generally determined using the income approach to measure the fair value, which is based on the present value of estimated future cash flows. Key inputs to the income approach for restaurant assets include the discount rate, projected restaurant revenues and expenses, and sublease income if we are closing the restaurant. In certain cases, management uses other market information, when available, to estimate the fair value of an asset. The impairment charges represent the excess of each asset’s carrying amount over its estimated fair value and are allocated among the long-lived asset or assets of the group.
Earnings per Share
Basic earnings per share is calculated by dividing income available to common shareholders by the weighted-average number of shares of common stock outstanding during each period. Diluted earnings per share (“diluted EPS”) is calculated using income available to common shareholders divided by diluted weighted-average shares of common stock outstanding during each period. Potentially dilutive securities include shares of common stock underlying SOSARs and non-vested stock awards (collectively “stock awards”). Diluted EPS considers the impact of potentially dilutive securities except in periods in which there is a loss because the inclusion of the potential common shares would have an anti-dilutive effect. Stock awards are excluded from the calculation of diluted EPS in the event they are subject to performance conditions or are antidilutive.
Recently Issued Accounting Standards
In November 2023, the FASB issued ASU No. 2023-07, “Segment Reporting (Topic 280): Improvements to Reportable Segment Disclosure.” The ASU updates reportable segment disclosure requirements, primarily through requiring enhanced disclosures about significant segment expenses and information used to assess segment performance. The ASU is effective for fiscal years beginning after December 15, 2023, with early adoption permitted. We are currently evaluating the impact of adopting this ASU on our disclosures.
In December 2023, the FASB issued ASU No. 2023-09, “Income Taxes (Topic 740): Improvements to Income Tax Disclosures.” The ASU includes amendments requiring enhanced income tax disclosures, primarily related to standardization and disaggregation of rate reconciliation categories and income taxes paid by jurisdiction. The guidance is effective for fiscal years beginning after December 15, 2024, with early adoption permitted, and should be applied either prospectively or retrospectively. We are currently evaluating the impact of adopting this ASU on our disclosures.
We reviewed all other recently issued accounting pronouncements and concluded that they were either not applicable or not expected to have a significant impact to the consolidated financial statements.
2. Supplemental Balance Sheet Information
Prepaid expenses and other current assets were as follows:
| | | | | |
| | | | | |
| December 31, |
| 2023 | | 2022 |
Prepaid expenses | $ | 97,670 | | $ | 69,167 |
Other current assets | | 19,792 | | | 17,245 |
Prepaid expenses and other current assets | $ | 117,462 | | $ | 86,412 |
Leasehold improvements, property and equipment, net were as follows:
| | | | | |
| | | | | |
| December 31, |
| 2023 | | 2022 |
Land | $ | 12,943 | | $ | 12,943 |
Leasehold improvements and buildings | | 2,595,866 | | | 2,317,277 |
Furniture and fixtures | | 267,294 | | | 242,166 |
Equipment | | 1,114,236 | | | 989,895 |
Construction in Progress | | 161,721 | | | 123,453 |
Leasehold improvements, property and equipment, gross | | 4,152,060 | | | 3,685,734 |
Accumulated depreciation | | (1,982,022) | | | (1,734,587) |
Leasehold improvements, property and equipment, net | $ | 2,170,038 | | $ | 1,951,147 |
Accrued payroll and benefits were as follows:
| | | | | |
| | | | | |
| December 31, |
| 2023 | | 2022 |
Workers' compensation liability | $ | 30,520 | | $ | 27,531 |
Accrued payroll, bonuses and taxes | | 170,251 | | | 118,638 |
Other accrued payroll and benefits | | 26,766 | | | 24,287 |
Accrued payroll and benefits | $ | 227,537 | | $ | 170,456 |
Accrued liabilities were as follows:
| | | | | |
| | | | | |
| December 31, |
| 2023 | | 2022 |
Sales and use tax payable | $ | 42,071 | | $ | 35,567 |
General, product and automobile insurance reserves | | 30,169 | | | 29,544 |
Other accrued liabilities | | 75,448 | | | 82,428 |
Accrued liabilities | $ | 147,688 | | $ | 147,539 |
3. Revenue Recognition
Gift Cards
The gift card liability included in unearned revenue on the consolidated balance sheets was as follows:
| | | | | |
| | | | | |
| December 31, |
| 2023 | | 2022 |
Gift card liability | $ | 164,930 | | $ | 145,014 |
Revenue recognized from the redemption of gift cards that was included in unearned revenue at the beginning of the year was as follows:
| | | | | | | | |
| | | | | | | | |
| Year ended December 31, |
| 2023 | | 2022 | | 2021 |
Revenue recognized from gift card liability balance at the beginning of the year | $ | 61,389 | | $ | 59,175 | | $ | 48,605 |
Chipotle Rewards
Changes in our Chipotle Rewards liability included in unearned revenue on the consolidated balance sheets were as follows:
| | | | | | | | |
| Year ended December 31, |
| 2023 | | 2022 | | 2021 |
Chipotle Rewards liability, beginning balance | $ | 38,057 | | $ | 25,572 | | $ | 22,337 |
Revenue deferred | | 135,490 | | | 121,406 | | | 106,759 |
Revenue recognized | | (128,797) | | | (108,921) | | | (103,524) |
Chipotle Rewards liability, ending balance | $ | 44,750 | | $ | 38,057 | | $ | 25,572 |
4. Fair Value Measurements
Assets and Liabilities Measured at Fair Value on a Recurring Basis
The carrying value of our cash and cash equivalents, restricted cash, accounts receivable and accounts payable approximate fair value because of their short-term nature.
Our held-to-maturity investments are comprised of U.S. Treasury securities and a corporate debt security, which are held at amortized cost. We also have investments in convertible notes receivable which are held at fair-value. Additionally, we maintain a deferred compensation plan with related assets held in a rabbi trust.
The following tables show our cash, cash equivalents, and debt investments by significant investment category as of December 31, 2023 and 2022:
| | | | | | | | | | | | | | | | | | | | |
| | | | | | | | | | | | | | | | | | | | |
| December 31, 2023 |
| Adjusted cost | | Unrealized Gains | | Unrealized Losses | | Fair Value | | Cash and Cash Equivalents | | Current Investments | | Long-term Investments |
Cash | $ | 128,458 | | $ | - | | $ | - | | $ | 128,458 | | $ | 128,458 | | $ | - | | $ | - |
Level 1(1) | | | | | | | | | | | | | | | | | | | | |
Money market funds | | 355,872 | | | - | | | - | | | 355,872 | | | 355,872 | | | - | | | - |
Time deposits | | 76,279 | | | - | | | - | | | 76,279 | | | 76,279 | | | - | | | - |
U.S. Treasury securities | | 1,200,658 | | | 4,352 | | | 4,083 | | | 1,200,927 | | | - | | | 731,339 | | | 469,319 |
Corporate debt securities | | 19,755 | | | 13 | | | 7 | | | 19,761 | | | - | | | - | | | 19,755 |
Subtotal | | 1,652,564 | | | 4,365 | | | 4,090 | | | 1,652,839 | | | 432,151 | | | 731,339 | | | 489,074 |
Level 3 | | | | | | | | | | | | | | | | | | | | |
Corporate debt security(2) | | 17,401 | | | - | | | 27 | | | 17,374 | | | - | | | 999 | | | 16,402 |
Notes receivable(3) | | 14,500 | | | 1,289 | | | 141 | | | 15,648 | | | - | | | 2,500 | | | 13,148 |
Subtotal | | 31,901 | | | 1,289 | | | 168 | | | 33,022 | | | - | | | 3,499 | | | 29,550 |
Total | $ | 1,812,923 | | $ | 5,654 | | $ | 4,258 | | $ | 1,814,319 | | $ | 560,609 | | $ | 734,838 | | $ | 518,624 |
| | | | | | | | | | | | | | | | | | | | |
| December 31, 2022 |
| Adjusted cost | | Unrealized Gains | | Unrealized Losses | | Fair Value | | Cash and Cash Equivalents | | Current Investments | | Long-term Investments |
Cash | $ | 75,829 | | $ | - | | $ | - | | $ | 75,829 | | $ | 75,829 | | $ | - | | $ | - |
Level 1(1) | | | | | | | | | | | | | | | | | | | | |
Money market funds | | 232,477 | | | - | | | - | | | 232,477 | | | 232,477 | | | - | | | - |
Time deposits | | 75,694 | | | - | | | - | | | 75,694 | | | 75,694 | | | - | | | - |
U.S. Treasury securities | | 847,354 | | | 63 | | | 14,355 | | | 833,062 | | | - | | | 515,136 | | | 332,218 |
Subtotal | | 1,155,525 | | | 63 | | | 14,355 | | | 1,141,233 | | | 308,171 | | | 515,136 | | | 332,218 |
Level 3 | | | | | | | | | | | | | | | | | | | | |
Corporate debt security(2) | | 17,900 | | | - | | | 700 | | | 17,200 | | | - | | | - | | | 17,900 |
Note receivable(3) | | 4,860 | | | 222 | | | - | | | 5,082 | | | - | | | - | | | 5,082 |
Subtotal | | 22,760 | | | 222 | | | 700 | | | 22,282 | | | - | | | - | | | 22,982 |
Total | $ | 1,254,114 | | $ | 285 | | $ | 15,055 | | $ | 1,239,344 | | $ | 384,000 | | $ | 515,136 | | $ | 355,200 |
(1) Level 1: Quoted prices in active markets for identical assets or liabilities that the entity has the ability to access.
(2) The fair value of the corporate debt security is measured using Level 3 (unobservable) inputs. We determined the fair value for the corporate debt security using an internally-developed valuation model and unobservable inputs include credit and liquidity spreads and effective maturity.
(3) We have elected to measure our investments in convertible notes receivable of private companies at fair value under the fair value option. The fair value of the notes receivable is measured using Level 3 (unobservable) inputs. We determined the fair value for the notes receivable using an internally-developed valuation model and unobservable inputs include estimates of the equity value of the underlying business and the timing and probability of future financing events.
Rabbi Trust
We have elected to fund certain deferred compensation plan obligations, as described further in Note 8. “Stock-Based Compensation and Employee Benefit Plans”, through a rabbi trust, the assets of which are designated as trading securities. The rabbi trust is subject to creditor claims in the event of insolvency, but the assets held in the rabbi trust are not available for general corporate purposes. Amounts in the rabbi trust are invested in mutual funds, consistent with the investment choices selected by participants in their Deferred Plan accounts, which are designated as trading securities, carried at fair value, and are included in other assets on the consolidated balance sheets. We record trading gains and losses, along with the offsetting amount related to the increase or decrease in deferred compensation to reflect our exposure to liabilities for payment under the deferred plan in general and administrative expenses on the consolidated statements of income and comprehensive income.
Assets and Liabilities Measured at Fair Value on a Nonrecurring Basis
Assets recognized or disclosed at fair value on the consolidated financial statements on a nonrecurring basis include items such as leasehold improvements, property and equipment, certain long-term investments, operating lease assets, other assets, and goodwill. These assets are measured at fair value whenever events or changes in circumstances indicate that the carrying amount of an asset may not be recoverable or if there has been an observable price change of a non-marketable equity security.
The following table summarizes our restaurant and office assets measured at fair value by hierarchy level on a nonrecurring basis:
| | | | | | |
| | | | | | |
| | Carrying Value |
| | December 31, |
| Level | 2023 | | 2022 |
Leasehold improvements, property and equipment, net | 3 | $ | 3,571 | | $ | 264 |
Operating lease assets | 3 | | 4,505 | | | 713 |
Total | | $ | 8,076 | | $ | 977 |
Fair value of these assets was measured using Level 3 inputs (unobservable inputs for the asset or liability). Unobservable inputs include the discount rate, projected restaurant revenues and expenses, and sublease income if we are closing and intend to sublease the restaurant or office space. For the years ended December 31, 2023, 2022 and 2021, we recorded asset impairments related to restaurants and offices of $12,613, $2,387 and $4,727, respectively. Costs are recorded within impairment, closure costs, and asset disposals on the consolidated statements of income and comprehensive income. Carrying value after the impairment charges approximates fair value.
5. Equity Investments
| | | | | |
| | | | | |
| December 31, |
| 2023 | | 2022 |
Equity method investments | $ | 8,896 | | $ | 11,697 |
Other investments | | 45,864 | | | 32,855 |
Total | $ | 54,760 | | $ | 44,552 |
Equity Method Investments
As of December 31, 2023, we owned 4,325 shares of common stock of Tractor Beverages, Inc. (“Tractor”). Our investment represents ownership of approximately 10.2% of Tractor, and we have invested total cash consideration of $10,000. As we are a significant customer of Tractor and maintain board representation, we are accounting for our investment under the equity method. There were no impairment charges for the year ended December 31, 2023 or 2022 associated with this equity method investment. The investment in common stock is included within other assets on the consolidated balance sheets with a carrying value of $8,896 and $11,697 as of December 31, 2023 and December 31, 2022, respectively. Refer to Note 13. “Related Party Transactions” for related party disclosures.
Other Investments
As of December 31, 2023, we hold warrants (the “Tractor Warrants”) to purchase 2,162 shares of common stock of Tractor. Tractor is a privately held company, and as such, the Tractor Warrants represent non-marketable equity securities. The investment is included within long-term investments on the consolidated balance sheets with a carrying value of $8,675 and $10,747 as of December 31, 2023 and December 31, 2022, respectively.
As of December 31, 2023, we own 766 shares of the Series C Preferred Stock of Nuro, Inc. (“Nuro”). Our investment represents a minority interest and we have determined that we do not have significant influence over Nuro. Nuro is a privately held company, and as such, the preferred shares comprising our investment are illiquid and fair value is not readily determinable. As of December 31, 2023, we have recognized a cumulative gain of $5,968 related to our investment in Nuro due to observable transactions in prior periods. The investment is included within long-term investments on the consolidated balance sheets with a carrying value of $15,968 as of December 31, 2023 and December 31, 2022, respectively.
As of December 31, 2023, we held additional investments in other entities through the Cultivate Next Fund. These additional investments are included within long-term investments on the consolidated balance sheets with a carrying value of $21,221 and $6,140 as of December 31, 2023 and December 31, 2022, respectively.
6. Income Taxes
Income before income taxes, classified by source of income, was as follows:
| | | | | | | | |
| | | | | | | | |
| Year ended December 31, |
| 2023 | | 2022 | | 2021 |
Domestic | $ | 1,637,756 | | $ | 1,192,004 | | $ | 818,057 |
Foreign | | (17,250) | | | (10,473) | | | (5,294) |
Income before income taxes | $ | 1,620,506 | | $ | 1,181,531 | | $ | 812,763 |
The components of the provision for income taxes were as follows:
| | | | | | | | |
| | | | | | | | |
| Year ended December 31, |
| 2023 | | 2022 | | 2021 |
Current tax: | | | | | | | | |
U.S. Federal | $ | (314,757) | | $ | (246,210) | | $ | (156,447) |
U.S. State and Local | | (85,355) | | | (79,041) | | | (15,351) |
Foreign | | (1,162) | | | (374) | | | (338) |
| | (401,274) | | | (325,625) | | | (172,136) |
Deferred tax: | | | | | | | | |
U.S. Federal | | 7,992 | | | 23,502 | | | 33,004 |
U.S. State and Local | | 1,532 | | | 19,940 | | | (20,404) |
Foreign | | 7,606 | | | (3,771) | | | 7,229 |
| | 17,130 | | | 39,671 | | | 19,829 |
Valuation allowance | | (7,625) | | | 3,524 | | | (7,472) |
Provision for income taxes | $ | (391,769) | | $ | (282,430) | | $ | (159,779) |
The effective tax rate differs from the statutory tax rates as follows:
| | | | | | | | | |
| | | | | | | | | |
| Year ended December 31, |
| 2023 | | 2022 | | 2021 |
Statutory U.S. federal income tax rate | | 21.0 | % | | 21.0 | % | | 21.0 | % |
State income tax, net of related federal income tax benefit | | 4.0 | | | 3.8 | | | 3.5 | |
Federal tax credits | | (1.0) | | | (1.0) | | | (1.6) | |
Executive compensation disallowed | | 0.8 | | | 0.8 | | | 2.9 | |
Valuation allowance | | 0.3 | | | 0.2 | | | 0.3 | |
Uncertain tax position reserves | | 0.4 | | | 0.3 | | | - | |
Other | | 0.2 | | | 0.6 | | | - | |
Return to provision and other discrete items | | (0.2) | | | (0.1) | | | 0.1 | |
Equity compensation related adjustments | | (1.3) | | | (1.7) | | | (4.7) | |
Federal net operating loss | | - | | | - | | | (1.8) | |
Effective income tax rate | | 24.2 | % | | 23.9 | % | | 19.7 | % |
The effective tax rate for the year ended December 31, 2023, was higher than the effective tax rate for the year ended December 31, 2022, primarily due to a decrease in excess tax benefits related to option exercises and equity vesting in relation to income before taxes.
The components of the deferred income tax assets and liabilities for continuing operations were as follows:
| | | | | | | | |
| | | | | | | | |
| | | | December 31, |
| | | | 2023 | | 2022 |
Deferred income tax liability: | | | | | | | | |
Leasehold improvements, property and equipment, net | | | | $ | 272,017 | | $ | 263,444 |
Goodwill and other assets | | | | | 1,743 | | | 1,754 |
Operating lease assets | | | | | 972,835 | | | 901,058 |
Total deferred income tax liability | | | | | 1,246,595 | | | 1,166,256 |
Deferred income tax asset: | | | | | | | | |
Gift card liability | | | | | 18,101 | | | 15,893 |
Capitalized transaction costs | | | | | 323 | | | 323 |
Stock-based compensation and other employee benefits | | | | | 50,954 | | | 45,129 |
Foreign net operating loss carry-forwards | | | | | 32,252 | | | 24,799 |
State credits | | | | | 1,838 | | | 3,151 |
Operating lease liabilities | | | | | 1,038,911 | | | 962,815 |
Allowances, reserves and other | | | | | 12,870 | | | 15,688 |
Capitalized research costs | | | | | 25,990 | | | 17,415 |
Prepaid assets and other | | | | | 6,637 | | | 4,685 |
State net operating loss carry-forwards | | | | | 4,332 | | | 4,832 |
Valuation allowance | | | | | (34,722) | | | (27,097) |
Total deferred income tax asset | | | | | 1,157,486 | | | 1,067,633 |
Deferred income tax liabilities | | | | $ | 89,109 | | $ | 98,623 |
Gross foreign net operating losses (“NOLs”) were $149,891 and $114,727 as of December 31, 2023 and 2022, respectively. Our foreign NOLs can be carried forward indefinitely.
Gross state NOLs available across all jurisdictions in which we operate were $62,492 and $73,327 as of December 31, 2023 and 2022, respectively. Our state NOLs expire over varying intervals in the future.
We had gross valuation allowances against certain foreign deferred tax assets of $160,607 and $124,609 as of December 31, 2023 and 2022, respectively. The increase in the valuation allowance was primarily due to the recording of a valuation allowance on various foreign tax attributes.
Unrecognized Tax Benefits
A reconciliation of the unrecognized tax benefits was as follows:
| | | | | | | | |
| Year ended December 31, |
| 2023 | | 2022 | | 2021 |
Beginning of year | $ | 8,902 | | $ | 5,262 | | $ | 10,859 |
Increase resulting from prior year tax positions | | 7,561 | | | 3,937 | | | 180 |
Decrease resulting from prior year tax positions | | (295) | | | - | | | (331) |
Increase resulting from current year tax positions | | 783 | | | 312 | | | 1,387 |
Settlements with taxing authorities | | (6) | | | - | | | - |
Lapsing of statutes of limitations | | (457) | | | (609) | | | (6,833) |
End of year | $ | 16,488 | | $ | 8,902 | | $ | 5,262 |
Interest expense related to uncertain tax positions is recognized in interest and other income, net on the consolidated statements of income and comprehensive income. Penalties related to uncertain tax positions are recognized in provision for income taxes on the consolidated statements of income and comprehensive income. For the years ended December 31, 2023, 2022 and 2021, we recognized $1,541, $384 and $180, respectively, in interest expense related to uncertain tax positions. These are gross amounts before any tax benefits and are included in other liabilities on the consolidated balance sheets. As of December 31, 2023 and 2022, we have accrued interest of $2,026 and $589, respectively.
The Internal Revenue Service (“IRS”) commenced an examination of our U.S. income tax returns for the tax year ended December 31, 2020 in the fourth quarter of 2022. The exam is still in progress. As of December 31, 2023, the IRS has not proposed any adjustments to our tax positions.
Our tax returns are currently under audit by the State of Pennsylvania for the tax years ended December 31, 2019, December 31, 2020 and December 31, 2021. As of December 31, 2023, the State of Pennsylvania has not proposed any adjustments to our tax positions. For the majority of states where we have a significant presence, we are no longer subject to tax examinations by tax authorities for tax years before 2019. Currently, we expect expirations of statutes of limitations, excluding indemnified amounts, on reserves of approximately $481 within the next twelve months.
It is reasonably possible the amount of the unrecognized benefit with respect to certain unrecognized positions could significantly increase or decrease within the next twelve months and would have an impact on net income.
Inflation Reduction Act of 2022
On August 16, 2022, President Biden signed into law the Inflation Reduction Act of 2022, which includes provisions imposing a 15% alternative corporate minimum tax (“CAMT”), and a 1% excise tax on net stock repurchases made by publicly traded U.S. corporations, which are effective in taxable years beginning after December 31, 2022. The CAMT does not apply to the Company and the excise tax is immaterial to our financial statements as of December 31, 2023.
7. Shareholders’ Equity
We have had a stock repurchase program in place since 2008. As of December 31, 2023, we had $424,107 authorized for repurchasing shares of our common stock, which includes the $200,000 additional authorization approved by our Board of Directors on December 14, 2023. Shares we repurchased are being held in treasury stock until they are reissued or retired at the discretion of our Board of Directors.
During the years ended December 31, 2023, 2022, and 2021, shares of common stock at a total cost of $69,146, $98,970, and $79,870, respectively, were netted and surrendered as payment for minimum statutory withholding obligations in connection with the vesting of outstanding stock awards. Shares surrendered by the participants in accordance with the applicable award agreements and plan are deemed repurchased by us but are not part of publicly announced share repurchase programs.
8. Stock-Based Compensation and Employee Benefit Plans
Pursuant to the 2022 Stock Incentive Plan, we grant stock options, SOSARs, RSUs, or PSUs to employes and non-employee directors. We issue shares of common stock upon the exercise of stock options and SOSARs, and the vesting of RSUs and PSUs.
We also have an employee stock purchase plan (“ESPP”), Defined Contribution Plan, and a Deferred Compensation Plan.
Stock-Based Compensation
Under the 2022 Stock Incentive Plan, 2,431 shares of common stock have been authorized and reserved for issuance to eligible participants, of which 2,165 shares were authorized for issuance but not issued or subject to outstanding awards as of December 31, 2023. For purposes of calculating the available shares remaining, each share issuable pursuant to outstanding full value awards, such as RSUs and PSUs, count as two shares, and each share underlying a stock option or SOSAR count as one share.
Total stock-based compensation expense was as follows:
| | | | | | | | |
| | | | | | | | |
| Year ended December 31, |
| 2023 | | 2022 | | 2021 |
Stock-based compensation | $ | 126,686 | | $ | 99,821 | | $ | 178,703 |
Stock-based compensation, net of income taxes | $ | 107,210 | | $ | 84,928 | | $ | 159,972 |
Total capitalized stock-based compensation included in leasehold improvements, property and equipment, net on the consolidated balance sheets | $ | 2,670 | | $ | 1,791 | | $ | 2,311 |
Excess tax benefit on stock-based compensation recognized in provision for income taxes on the consolidated statements of income and comprehensive income | $ | 25,437 | | $ | 24,689 | | $ | 47,958 |
SOSARs
A summary of SOSAR activity was as follows (in thousands, except years and per share data):
| | | | | | | | | | | |
| | | | | | | | | | | |
| Shares | | Weighted-Average Exercise Price per Share | | Weighted-Average Remaining Contractual Life (Years) | | Aggregate Intrinsic Value |
Outstanding, January 1, 2023 | | 355 | | $ | 1,053.84 | | | | | $ | 142,916 |
Granted | | 77 | | | 1,640.78 | | | | | | |
Exercised | | (117) | | | 722.87 | | | | | | |
Forfeited or cancelled | | (20) | | | 1,579.77 | | | | | | |
Outstanding, December 31, 2023 | | 295 | | | 1,302.60 | | | 4.4 | | | 290,156 |
Exercisable, December 31, 2023 | | 115 | | | 860.55 | | | 2.8 | | | 164,574 |
Vested and expected to vest, December 31, 2023 | | 282 | | | 1,288.79 | | | 4.3 | | | 281,385 |
The total intrinsic value of SOSARs exercised during the years ended December 31, 2023, 2022, and 2021, was $142,830, $77,124, and $498,399, respectively. Unrecognized stock-based compensation expense for SOSARs as of December 31, 2023 was $28,196 and is expected to be recognized over a weighted-average period of 1.5 years. SOSARs expire 7 years after the day they were granted.
The weighted-average assumptions utilized in the Black-Scholes option-pricing model to estimate the fair value of SOSARs granted each year were as follows:
| | | | | | | | | | | | |
| | | | | | | | | | | | |
| | 2023 | | 2022 | | 2021 |
Risk-free interest rate | | | 4.1 | % | | | 2.1 | % | | | 0.3 | % |
Expected life (years) | | | 3.6 | | | | 3.6 | | | | 3.7 | |
Expected dividend yield | | | 0.0 | % | | | 0.0 | % | | | 0.0 | % |
Volatility | | | 36.4 | % | | | 36.0 | % | | | 35.2 | % |
Weighted-average Black-Scholes fair value per share at date of grant | | $ | 530.22 | | | $ | 456.44 | | | $ | 403.01 | |
The risk-free interest rate is based on U.S. Treasury rates for instruments with similar terms, and the expected life assumption is based on our historical data. We have not paid dividends to date and do not plan to pay dividends in the near future. The volatility assumption is based on our historical data and implied volatility.
Non-Vested Stock Awards (RSUs)
A summary of RSU award activity was as follows (in thousands, except per share data):
| | | | | | | | | | | |
| | | | | | | | | | | |
| | | | | | Shares | | Weighted-Average Grant Date Fair Value per Share |
Outstanding, January 1, 2023 | | | | | | | | 55 | | $ | 1,396.78 |
Granted | | | | | | | | 37 | | | 1,666.18 |
Vested | | | | | | | | (23) | | | 1,211.81 |
Forfeited or cancelled | | | | | | | | (9) | | | 1,581.08 |
Outstanding, December 31, 2023 | | | | | | | | 60 | | | 1,604.25 |
Vested and expected to vest, December 31, 2023 | | | | | | | | 52 | | | 1,600.97 |
The weighted-average grant date fair value per RSU granted during the years ended December 31, 2022 and 2021, was $1,559.73 and $1,492.15, respectively. Unrecognized stock-based compensation expense for non-vested RSU stock awards we have determined are probable of vesting was $33,680 as of December 31, 2023, and is expected to be recognized over a weighted-average period of 1.6 years. The fair value of shares earned as of the vesting date during the years ended December 31, 2023, 2022, and 2021, was $39,464, $33,959, and $73,540, respectively.
Non-Vested Performance Stock Awards (PSUs)
A summary of PSU award activity was as follows (in thousands, except per share data):
| | | | | | | | | | | |
| | | | | | | | | | | |
| | | | | | Shares | | Weighted-Average Grant Date Fair Value per Share |
Outstanding, January 1, 2023 | | | | | | | | 69 | | $ | 1,194.80 |
Granted | | | | | | | | 24 | | | 1,606.91 |
Vested | | | | | | | | (33) | | | 857.00 |
Expired | | | | | | | | (4) | | | 1,562.35 |
Outstanding, December 31, 2023 | | | | | | | | 56 | | | 1,562.14 |
Vested and expected to vest, December 31, 2023* | | | | | | | | 114 | | | 1,557.11 |
*The vested and expected to vest total above represents outstanding base PSUs, adjusted for expected payout amounts in line with current and future estimated performance levels.
The weighted-average fair value per PSU granted during the years ended December 31, 2022 and 2021, was $1,569.39 and $1,479.55, respectively. The unrecognized stock-based compensation expense for non-vested PSU stock awards we have determined are probable of vesting was $69,610 as of December 31, 2023, and is expected to be recognized over a weighted-average period of 1.9 years. The fair value of shares earned as of the vesting date during the years ended December 31, 2023, 2022, and 2021, was $110,794, $177,293, and $97,496, respectively.
During the year ended December 31, 2023, we awarded performance share awards that are subject to service, market, and performance vesting conditions. The quantity of shares that vest will range from 0% to 300% of the targeted number of shares based on performance factors related to restaurant cash flow dollars earned over a three-year period beginning on January 1, 2023, and gross new restaurant openings over the same three-year period. If the defined minimum targets are not met, then no shares will vest. Further, in no event may more than 100% of the target number of PSUs vest if our 3-year total shareholder return is below the 25th percentile of the constituent companies comprising the S&P 500 on the day of the grant.
During the year ended December 31, 2022, we awarded performance share awards that are subject to service, market, and performance vesting conditions. The quantity of shares that vest will range from 0% to 300% of the targeted number of shares based on performance factors related to restaurant cash flow dollars earned over a three-year period beginning on January 1, 2022. If the defined minimum targets are not met, then no shares will vest. Further, in no event may more than 100% of the target number of PSUs vest if our 3-year total shareholder return is below the 25th percentile of the constituent companies comprising the S&P 500 on the day of the grant.
During the year ended December 31, 2021, we awarded performance share awards that are subject to service, market, and performance vesting conditions. The quantity of shares that vest will range from 0% to 300% of the targeted number of shares based on performance factors related to our growth in comparable restaurant sales and average restaurant margin over a three-year period beginning on January 1, 2021. If the defined minimum targets are not met, then no shares will vest. Further, in no event may more than 100% of the target number of PSUs vest if our 3-year total shareholder return is below the 25th percentile of the constituent companies comprising the S&P 500 on the day of the grant.
On December 30, 2020, we modified the 2018 Performance Share Awards due to the impact that the COVID-19 pandemic had on the growth in comparable restaurant sales and restaurant margin relative to the trajectory of both of these performance factors prior to the pandemic, and also due to the significant shareholder value created over the performance period of the original award, the Compensation Committee of the Board of Directors modified the 2018 PSU award. This modification pertained to all seven recipients of this award, and resulted in incremental compensation expense of $71,441, of which $7,255 was recognized during the year ended December 31, 2022, and $0 remained unamortized as of December 31, 2022. The incremental compensation cost is calculated by multiplying the number of incremental shares generated though the modification by the stock price on the modification date. The stock price on the modification date of December 30, 2020 was $1,374.17. To receive all incremental shares generated through the modification, the employees had to remain employed through December 31, 2022, and the incremental shares vested in four installments over this period. The first two installments of the modification vested during 2021, which included the vesting of 33 PSUs, and the second two installments of the modification vested during 2022, which included the vesting of 16 PSUs. One employee terminated employment during July 2022, which resulted in the forfeiture of 1 PSU.
On July 27, 2022, we modified certain equity awards of an employee in connection with a separation agreement to allow short-term extension of vesting of these certain equity awards that would have otherwise vested within eight months of the separation date. This modification impacted one individual and resulted in incremental compensation expense of $6,701, which was recognized in July 2022.
Employee Stock Purchase Plan
We also offer an ESPP. Employees become eligible to participate in the program after one year of service with Chipotle and may contribute up to 15% of their earnings, subject to an annual maximum dollar amount. The ESPP provides a quarterly offering period to purchase our common stock at a price of 92.5% of the lower of the fair market value on the first and last trading days of each offering period. A total of 250 shares were authorized for issuance within the ESPP, of which 248 were available for issuance as of December 31, 2023. For the year ended December 31, 2023, the number of shares issued were one and for the years ended December 31, 2022, and 2021, the number of shares issued each year under the ESPP were less than one.
Employee Benefit Plans
Defined Contribution Plan
We maintain the Chipotle Mexican Grill 401(k) Plan (“401(k) Plan”) for eligible U.S.-based employees. The 401(k) Plan allows participants to make cash contributions from payroll deductions. Employees become eligible to receive matching contributions after one year, and at least 1,000 hours, of service with Chipotle. We match 100% of the first 3% of pay contributed by each eligible employee and 50% on the next 2% of pay contributed each pay period (with an annual true-up) through cash contributions. For the years ended December 31, 2023, 2022, and 2021, matching contributions totaled approximately $13,821, $12,923, and $10,527, respectively and are included in general and administrative expenses and labor dependent on employee classification on the consolidated statements of income and comprehensive income. Certain subsidiaries outside the U.S. also offer other similar benefits and are immaterial to the consolidated statements of income and comprehensive income.
Deferred Compensation Plan
We also maintain the Chipotle Mexican Grill, Inc. Supplemental Deferred Investment Plan (the “Deferred Plan”) for eligible employees. The Deferred Plan is a non-qualified plan that allows participants to make tax-deferred contributions that cannot be made under the 401(k) Plan because of Internal Revenue Service limitations. Participants’ earnings on contributions made to the Deferred Plan fluctuate with the actual earnings and losses of a variety of available investment choices selected by the participant. Total obligations under the Deferred Plan as of December 31, 2023 and 2022 were $27,178 and $21,140, respectively, and are included in other liabilities on the consolidated balance sheets and were fully funded as of December 31, 2023. We match 100% of the first 3% of pay contributed by each eligible employee and 50% on the next 2% of pay contributed once the 401(k) contribution limits are reached.
The following table summarizes estimated current and long-term material cash requirements for our deferred compensation plan as of December 31, 2023:
| | | | | | | | | | | | | | | |
| | | | | | | | | | | | | | | |
| | Payments Due by Fiscal Year |
| | Total | | 2024 | | 2025-2026 | | 2027-2028 | | Thereafter |
Deferred compensation(1) | | $ | 27,178 | | $ | 5,339 | | $ | 6,523 | | $ | 5,997 | | $ | 9,319 |
(1) Includes scheduled payments from our deferred compensation plan where payment dates are determinable for employed participants in accordance with the account’s election, and the assumption that active participants will retire at the age of 65 and begin distributions from their accounts at that time. This does not include future contributions, investment earnings, or future participants. Timing and amounts of payments may vary significantly.
9. Leases
The weighted-average remaining lease term and discount rate were as follows:
| | | | | |
| | | | | |
| December 31, | | December 31, |
| 2023 | | 2022 |
Weighted-average remaining lease term (years) | | 13.7 | | | 13.8 |
Weighted-average discount rate | | 5.10% | | | 4.77% |
The components of lease cost were as follows:
| | | | | | | | | |
| | | | | | | | | |
| | Year ended December 31, |
| Classification | 2023 | | 2022 | | 2021 |
Operating lease cost | Occupancy, Other operating costs, General and administrative expenses and Pre-opening costs | $ | 436,313 | | $ | 397,112 | | $ | 364,314 |
Short-term lease cost | Other operating costs | | 519 | | | 633 | | | 256 |
Variable lease cost | Occupancy, Other operating costs, General and administrative expenses and Pre-opening costs | | 111,896 | | | 102,636 | | | 92,145 |
Sublease income | General and administrative expenses | | (4,765) | | | (5,444) | | | (4,930) |
Total lease cost | | $ | 543,963 | | $ | 494,937 | | $ | 451,785 |
Supplemental disclosures of cash flow information related to leases were as follows:
| | | | | | | | |
| | | | | | | | |
| Year ended December 31, |
| 2023 | | 2022 | | 2021 |
Cash paid for operating lease liabilities | $ | 421,591 | | $ | 386,238 | | $ | 359,391 |
Operating lease assets obtained in exchange for operating lease liabilities | $ | 521,759 | | $ | 425,243 | | $ | 577,273 |
Derecognition of operating lease assets due to terminations or impairment | $ | 6,862 | | $ | 14,718 | | $ | 5,765 |
Maturities of lease liabilities were as follows as of December 31, 2023:
| | |
| | |
| Operating Leases |
2024 | $ | 413,064 |
2025 | | 450,092 |
2026 | | 443,845 |
2027 | | 436,937 |
2028 | | 422,776 |
Thereafter | | 3,576,738 |
Total lease payments | | 5,743,452 |
Less: imputed interest | | 1,691,827 |
Operating lease liabilities (Current and Long-Term) | $ | 4,051,625 |
As of December 31, 2023, the total lease payments include $2,515,107 related to options to extend lease terms that are reasonably certain of being exercised and exclude approximately $599,015 of legally binding lease payments for leases signed but not yet commenced and $12,737 of future sublease income.
We have six sale and leaseback transactions, which do not qualify for sale leaseback accounting due to fixed price renewal options prohibiting sale accounting. These transactions are accounted for under the financing method. Under the financing method, the assets remain on the consolidated balance sheets and the proceeds from the transactions are recorded as a financing liability. A portion of lease payments are applied as payments of deemed principal and imputed interest. The deemed landlord financing liability was $774 and $1,158 as of December 31, 2023, and 2022, respectively, with the current portion of the liability included in accrued liabilities, and the remaining portion included in other liabilities on the consolidated balance sheets.
10. Earnings Per Share
The following table sets forth the computations of basic and diluted earnings per share:
| | | | | | | | |
| | | | | | | | |
| Year ended December 31, |
| 2023 | | 2022 | | 2021 |
Net income | $ | 1,228,737 | | $ | 899,101 | | $ | 652,984 |
Shares: | | | | | | | | |
Weighted-average number of common shares outstanding (for basic calculation) | | 27,555 | | | 27,851 | | | 28,132 |
Dilutive stock awards | | 155 | | | 211 | | | 379 |
Weighted-average number of common shares outstanding (for diluted calculation) | | 27,710 | | | 28,062 | | | 28,511 |
Basic earnings per share | $ | 44.59 | | $ | 32.28 | | $ | 23.21 |
Diluted earnings per share | $ | 44.34 | | $ | 32.04 | | $ | 22.90 |
The following stock awards were excluded from the calculation of diluted earnings per share:
| | | | | | | | |
| | | | | | | | |
| Year ended December 31, |
| 2023 | | 2022 | | 2021 |
Stock awards subject to performance conditions | | 50 | | | 54 | | | 66 |
Stock awards that were antidilutive | | 71 | | | 163 | | | 34 |
Total stock awards excluded from diluted earnings per share | | 121 | | | 217 | | | 100 |
11. Commitments and Contingencies
Purchase Obligations
We enter into various purchase obligations in the ordinary course of business, generally of a short-term nature. Those that are binding primarily relate to commitments for food purchases and supplies, capital projects, corporate assets, information technology, marketing initiatives and corporate sponsorships, and other miscellaneous items.
Litigation
We are involved in various claims and legal actions, such as wage and hour, wrongful termination and other employment-related claims, slip and fall and other personal injury claims, advertising and consumer claims, privacy claims, and lease, construction and other commercial disputes, that arise in the ordinary course of business, some of which may be covered by insurance. The outcomes of these actions are not predictable, but we do not believe that the ultimate resolution of any pending or threatened actions of these types will have a material adverse effect on our financial position, results of operations, liquidity, or capital resources. However, if there is a significant increase in the number of these claims, or if we incur greater liabilities than we currently anticipate under one or more claims, it could materially and adversely affect our business, financial condition, results of operations and cash flows.
Accrual for Estimated Liability
In relation to various legal matters, we had an accrued legal liability balance of $7,640 and $15,227 included within accrued liabilities on the consolidated balance sheets as of as of December 31, 2023 and 2022, respectively.
12. Debt
As of December 31, 2023, we had a $500,000 revolving credit facility with JPMorgan Chase Bank (“JPMorgan”) as administrative agent. Borrowings on the credit facility bear interest at a rate equal to the Secured Overnight Financing Rate (“SOFR”) plus 1.475%, which is subject to increase due to changes in our total leverage ratio as defined in the credit agreement. We are also obligated to pay a commitment fee of 0.175% per year for unused amounts under the credit facility, which also may increase due to changes in our total leverage ratio. Further, we are subject to certain covenants defined in the credit agreement, which include maintaining a total leverage ratio of less than 3.0x, maintaining a consolidated fixed charge coverage ratio of greater than 1.5x, and limiting us from incurring additional indebtedness in certain circumstances. We had no outstanding borrowings under the credit facility and were in compliance with all covenants as of December 31, 2023 and December 31, 2022.
13. Related Party Transactions
As of December 31, 2023, we owned approximately 10.2% of the common stock outstanding of Tractor. As we are a significant customer of Tractor and maintain board representation, we are accounting for our investment under the equity method. Accordingly, we have identified Tractor as a related party. We purchase product from the supplier for sale to customers in our restaurants. During the years ended December 31, 2023, 2022 and 2021, purchases from the supplier were $43,555, $37,015, and $29,400, respectively.
During the second quarter of 2023, we made an investment in the Series A preferred shares of Vebu Inc. (“Vebu”), a developer of restaurant automation technology. As we are a significant customer of Vebu and maintain board representation, we have determined that we maintain significant influence over Vebu. During the years ended December 31, 2023, 2022 and 2021, purchases from Vebu were $991, $840, and $0, respectively.
ITEM 9. CHANGES IN AND DISAGREEMENTS WITH ACCOUNTANTS ON ACCOUNTING AND FINANCIAL DISCLOSURE
None.
ITEM 9A. CONTROLS AND PROCEDURES
We maintain disclosure controls and procedures (as defined in Rule 13a-15(e) promulgated under the Securities Exchange Act of 1934, as amended (the “Exchange Act”)) that are designed to ensure that information required to be disclosed in Exchange Act reports is recorded, processed, summarized and reported within the time periods specified in the Securities and Exchange Commission’s rules and forms, and that such information is accumulated and communicated to our management, including our Chief Executive Officer and Chief Financial and Administrative Officer, as appropriate, to allow timely decisions regarding required disclosure.
Evaluation of Disclosure Controls and Procedures
As of December 31, 2023, we carried out an evaluation, under the supervision and with the participation of our management, including our Chief Executive Officer and Chief Financial and Administrative Officer, of the effectiveness of the design and operation of our disclosure controls and procedures. Based on the foregoing, our Chief Executive Officer and Chief Financial and Administrative Officer concluded that our disclosure controls and procedures were effective as of the end of the period covered by this annual report.
Changes in Internal Control over Financial Reporting
There were no changes during the fiscal quarter ended December 31, 2023 in our internal control over financial reporting (as defined in Rule 13a-15(f) under the Exchange Act) that have materially affected or are reasonably likely to materially affect our internal control over financial reporting.
Management’s Annual Report on Internal Control over Financial Reporting
The management of Chipotle Mexican Grill, Inc. is responsible for establishing and maintaining adequate internal control over financial reporting. Our internal control over financial reporting is a process designed to provide reasonable assurance regarding the reliability of financial reporting and the preparation of financial statements for external purposes in accordance with accounting principles generally accepted in the United States of America. Our internal control over financial reporting includes those policies and procedures that (i) pertain to the maintenance of records that, in reasonable detail, accurately and fairly reflect the transactions and dispositions of our assets; (ii) provide reasonable assurance that transactions are recorded as necessary to permit preparation of financial statements in accordance with accounting principles generally accepted in the United States of America, and that our receipts and expenditures are being made only in accordance with authorizations of our management and directors; and (iii) provide reasonable assurance regarding prevention or timely detection of unauthorized acquisition, use, or disposition of assets that could have a material effect on our financial statements.
Because of its inherent limitations, internal control over financial reporting may not prevent or detect misstatements. Also, projections of any evaluation of effectiveness to future periods are subject to the risk that controls may become inadequate because of changes in conditions, or that the degree of compliance with the policies or procedures may deteriorate.
Management assessed the effectiveness of our internal control over financial reporting as of December 31, 2023, based on the framework set forth by the Committee of Sponsoring Organizations of the Treadway Commission in Internal Control—Integrated Framework (the “2013 framework”). Based on that assessment, management concluded that, as of December 31, 2023, our internal control over financial reporting was effective based on the criteria established in the 2013 framework.
Our independent registered public accounting firm, Ernst & Young LLP, has issued an attestation report on the effectiveness of our internal control over financial reporting as of December 31, 2023. This report follows.
Report of Independent Registered Public Accounting Firm
To the Shareholders and the Board of Directors of Chipotle Mexican Grill, Inc.
Opinion on Internal Control Over Financial Reporting
We have audited Chipotle Mexican Grill, Inc.’s internal control over financial reporting as of December 31, 2023, based on criteria established in Internal Control—Integrated Framework issued by the Committee of Sponsoring Organizations of the Treadway Commission (2013 framework) (the COSO criteria). In our opinion, Chipotle Mexican Grill, Inc. (the Company) maintained, in all material respects, effective internal control over financial reporting as of December 31, 2023, based on the COSO criteria.
We also have audited, in accordance with the standards of the Public Company Accounting Oversight Board (United States) (PCAOB), the consolidated balance sheets of the Company as of December 31, 2023 and 2022, the related consolidated statements of income and comprehensive income, shareholders’ equity and cash flows for each of the three years in the period ended December 31, 2023, and the related notes and our report dated February 7, 2024 expressed an unqualified opinion thereon.
Basis for Opinion
The Company’s management is responsible for maintaining effective internal control over financial reporting and for its assessment of the effectiveness of internal control over financial reporting included in the accompanying Management’s Annual Report on Internal Control over Financial Reporting. Our responsibility is to express an opinion on the Company’s internal control over financial reporting based on our audit. We are a public accounting firm registered with the PCAOB and are required to be independent with respect to the Company in accordance with the U.S. federal securities laws and the applicable rules and regulations of the Securities and Exchange Commission and the PCAOB.
We conducted our audit in accordance with the standards of the PCAOB. Those standards require that we plan and perform the audit to obtain reasonable assurance about whether effective internal control over financial reporting was maintained in all material respects.
Our audit included obtaining an understanding of internal control over financial reporting, assessing the risk that a material weakness exists, testing and evaluating the design and operating effectiveness of internal control based on the assessed risk, and performing such other procedures as we considered necessary in the circumstances. We believe that our audit provides a reasonable basis for our opinion.
Definition and Limitations of Internal Control Over Financial Reporting
A company’s internal control over financial reporting is a process designed to provide reasonable assurance regarding the reliability of financial reporting and the preparation of financial statements for external purposes in accordance with generally accepted accounting principles. A company’s internal control over financial reporting includes those policies and procedures that (1) pertain to the maintenance of records that, in reasonable detail, accurately and fairly reflect the transactions and dispositions of the assets of the company; (2) provide reasonable assurance that transactions are recorded as necessary to permit preparation of financial statements in accordance with generally accepted accounting principles, and that receipts and expenditures of the company are being made only in accordance with authorizations of management and directors of the company; and (3) provide reasonable assurance regarding prevention or timely detection of unauthorized acquisition, use, or disposition of the company’s assets that could have a material effect on the financial statements.
Because of its inherent limitations, internal control over financial reporting may not prevent or detect misstatements. Also, projections of any evaluation of effectiveness to future periods are subject to the risk that controls may become inadequate because of changes in conditions, or that the degree of compliance with the policies or procedures may deteriorate.
/s/ Ernst & Young LLP
Irvine, California
February 7, 2024
ITEM 9B. OTHER INFORMATION
Adoption or Termination of 10b5-1 Trading Plans
During the fiscal quarter ended December 31, 2023, one Section 16 officer adopted modified or terminated a “Rule 10b5-1 trading arrangement” (as defined in Item 408 of Regulation S-K of the Exchange Act):
Christopher Brandt, Chief Brand Officer, adopted a new trading plan on December 14, 2023 (with the first trade under the plan to occur on or after March 15, 2024). The trading plan will be effective until January 31, 2025 and provides for the exercise of a SOSAR for 4,453 shares and the sale of the net shares if the Company’s stock price reaches a specified limit order.
The Rule 10b5-1 trading arrangement complies with our Insider Trading Policy and actual transactions will be disclosed in Section 16 filings made with the SEC in accordance with applicable securities laws, rules and regulations.
Adoption of an Executive Officer Severance Plan and Letter Agreement with the CEO
On February 6, 2024, the Compensation, People and Culture Committee of the Company’s Board of Directors (the “Committee”) approved the Chipotle Mexican Grill, Inc. Executive Officer Severance Plan, which was effective immediately (the “Severance Plan”). The Severance Plan provides for severance benefits to the “executive officers” of the Company, as defined by Rule 3b-7 under the Securities Exchange Act of 1934, as amended (the “Participants”), if the Participant’s employment is terminated either by the Company without “cause” (excluding termination by the Company due to the Participant’s death or disability) or due to a resignation by the Participant for “good reason” (each as defined in the Severance Plan) that in each case does not entitle the Participant to benefits under the Company’s Change in Control Severance Plan (a “Qualifying Termination”).
Under the Severance Plan, if a Participant experiences a Qualified Termination, the Participant would be eligible to receive (i) cash severance equal to the sum of the Participant’s base salary plus target cash bonus under the Company’s Annual Incentive Plan for the year in which the Qualifying Termination occurs multiplied by two, in the case of the Chief Executive Officer, or one and one-half, in the case of other Participants, which cash severance would be paid in equal installments over 24 months, for the Chief Executive Officer, and 18 months for other Participants, plus (ii) a pro-rated portion of the Participant’s annual bonus under the Company’s Annual Incentive Plan for the year in which the Qualifying Termination occurs, based on the Company’s actual performance, plus (iii) the cash equivalent of the employer portion of the cost of the Company group health plans in which the Participant was participating immediately prior to the Qualifying Termination for 24 months, with respect to the Chief Executive Officer, or for 18 months, with respect to other Participants. In addition, each Participant will vest in a pro rata portion of their unvested equity awards under the Company’s equity compensation plans, with the performance-based equity awards vesting based on the extent of the Company’s achievement of the applicable performance-based metrics. Any SOSARs held by the Participant would be exercisable for 12 months after the Qualifying Termination or if earlier, until the expiration date.
A Participant’s eligibility for payments and benefits under the Severance Plan is subject to such Participant’s timely execution and nonrevocation of a separation and general release agreement, in the form provided by the Company, which contains customary confidentiality, non-solicitation and non-disparagement restrictions.
On February 6, 2024 the Committee also approved a letter agreement with the Company’s Chief Executive Officer providing that, if he is subject to a Qualifying Termination under the Severance Plan, he will receive an additional 12 months of pro-rated vesting credit for any equity awards held by him on the Qualifying Termination Date.
The foregoing description of the Severance Plan and the letter agreement with the Company’s Chief Executive Officer does not purport to be complete and is qualified in its entirety by the full text of the Severance Plan and the letter agreement, which are filed as Exhibit 10.25 and Exhibit 10.26 to this annual report on Form 10-K and are incorporated herein by reference.
ITEM 9C. DISCLOSURE REGARDING FOREIGN JURISDICTIONS THAT PREVENT INSPECTIONS
Not applicable.
PART III
ITEM 10. DIRECTORS, EXECUTIVE OFFICERS AND CORPORATE GOVERNANCE
Incorporated by reference from the definitive proxy statement for our 2024 annual meeting of shareholders, which will be filed no later than 120 days after December 31, 2023.
ITEM 11. EXECUTIVE COMPENSATION
Incorporated by reference from the definitive proxy statement for our 2024 annual meeting of shareholders, which will be filed no later than 120 days after December 31, 2023.
ITEM 12. SECURITY OWNERSHIP OF CERTAIN BENEFICIAL OWNERS AND MANAGEMENT AND RELATED STOCKHOLDER MATTERS
Incorporated by reference from the definitive proxy statement for our 2024 annual meeting of shareholders, which will be filed no later than 120 days after December 31, 2023.
| | | | | | |
| | | | | | |
| (a)
Number of Securities
to be Issued Upon
Exercise of Outstanding
Options and Rights(1)
| | | (b)
Weighted-Average
Exercise Price of
Outstanding Options and
Rights(1)
| | (c)
Number of Securities
Remaining Available for
Future Issuance Under
Equity Compensation Plans
(excluding securities
reflected in column (a))(2)
|
Equity Compensation Plans Approved by Security Holders | 410,735 | | $ | 1,302.60 | | 2,412,349 |
Equity Compensation Plans Not Approved by Security Holders | None | | | N/A | | None |
Total | 410,735 | | $ | 1,302.60 | | 2,412,349 |
__________________
(1) Includes shares issuable in connection with awards with performance and market conditions, which will be issued based on achievement of performance criteria associated with the awards, with the number of shares issuable dependent on our level of performance. The weighted-average exercise price in column (b) includes the weighted-average exercise price of SOSARs only.
(2) Includes 2,164,565 shares remaining available under the Chipotle Mexican Grill, Inc. 2022 Stock Incentive Plan, and 247,784 shares remaining available under the Chipotle Mexican Grill, Inc. Employee Stock Purchase Plan. In addition to being available for future issuance upon exercise of SOSARs or stock options that may be granted after December 31, 2023, all of the shares available for grant under the Chipotle Mexican Grill, Inc. 2022 Stock Incentive Plan, may instead be issued in the form of restricted stock, restricted stock units, performance shares or other equity-based awards. Each share underlying a full value award such as restricted stock, restricted stock units or performance shares counts as two shares used against the total number of securities authorized under the plan.
Additional information for this item is incorporated by reference from the definitive proxy statement for our 2024 annual meeting of shareholders, which will be filed no later than 120 days after December 31, 2023.
ITEM 13. CERTAIN RELATIONSHIPS AND RELATED TRANSACTIONS, AND DIRECTOR INDEPENDENCE
Incorporated by reference from the definitive proxy statement for our 2024 annual meeting of shareholders, which will be filed no later than 120 days after December 31, 2023.
ITEM 14. PRINCIPAL ACCOUNTING FEES AND SERVICES
Incorporated by reference from the definitive proxy statement for our 2024 annual meeting of shareholders, which will be filed no later than 120 days after December 31, 2023.
PART IV
ITEM 15. EXHIBITS, FINANCIAL STATEMENT SCHEDULES
1. All Financial statements
The following consolidated financial statements filed as part of this report are included in Part II, Item 8. “Financial Statements and Supplementary Data” of this 10-K:
Consolidated Statements of Income and Comprehensive Income for the years ended December 31, 2023, 2022 and 2021;
Consolidated Balance Sheets as of December 31, 2023 and 2022;
Consolidated Statements of Cash Flows for the years ended December 31, 2023, 2022 and 2021;
Consolidated Statements of Equity for the years ended December 31, 2023, 2022 and 2021;
Notes to Consolidated Financial Statements; and
Reports of Independent Registered Public Accounting Firm
2. Financial statement schedules
No schedules are required because either the required information is not present or is not present in amounts sufficient to require submission of the schedule, or because the information required is included in the consolidated financial statements or the notes thereto.
3. Exhibits
| | | | | | |
| | | | | | |
| | Description of Exhibit Incorporated Herein by Reference |
Exhibit Number | Exhibit Description | Form | File No. | Filing Date | Exhibit Number | Filed Herewith |
3.1 | Amended and Restated Certificate of Incorporation of Chipotle Mexican Grill, Inc. | 10-Q | 001-32731 | October 26, 2016 | 3.1 | |
3.2 | Chipotle Mexican Grill, Inc. Amended and Restated Bylaws | 8-K | 001-32731 | June 1, 2023 | 3.1 | |
4.1 | Form of Stock Certificate for Shares of Common Stock | 10-K | 001-32731 | February 10, 2012 | 4.1 | |
4.2 | Description of Chipotle Securities | 10-K | 001-32731 | February 5, 2020 | 4.2 | |
10.1† | Change in Control Severance Plan, effective June 1, 2019 | 10-Q | 001-32731 | July 24, 2019 | 10.1 | |
10.2† | Form of Participation and Restrictive Covenant Agreement for Change in Control Severance Plan | 10-Q | 001-32731 | July 24, 2019 | 10.2 | |
10.3† | Amended and Restated Chipotle Mexican Grill, Inc. 2011 Stock Incentive Plan | 8-K | 001-32731 | May 24, 2018 | 10.1 | |
10.4† | Amended and Restated Registration Rights Agreement dated January 31, 2006 among Chipotle Mexican Grill, Inc., McDonald’s Corporation and certain shareholders | 10-K | 001-32731 | March 17, 2006 | 10.6 | |
10.5† | Form of Director and Officer Indemnification Agreement | 8-K | 001-32731 | March 21, 2007 | 10.1 | |
10.6† | Offer Letter, dated February 11, 2018, between Brian R. Niccol and Chipotle Mexican Grill, Inc. | 8-K | 001-32731 | February 15, 2018 | 10.1 | |
10.7† | Executive Chairman Agreement dated November 28, 2017 between Chipotle Mexican Grill, Inc. and Steve Ells | 8-K | 001-32731 | December 1, 2017 | 10.1 | |
10.8† | Form of 2018 Stock Appreciation Rights Agreement | 10-Q | 001-32731 | April 26, 2018 | 10.14 | |
10.9† | Amendment No. 1 dated March 5, 2020 to the Executive Chairman Agreement dated November 28, 2017 between Chipotle Mexican Grill, Inc. and Steve Ells | 10-Q | 001-32731 | April 29, 2020 | 10.1 | |
10.10 | Revolving Credit Agreement dated April 13, 2021, among Chipotle Mexican Grill, Inc. and JPMorgan Chase Bank, N.A., Administrative Agent, and other lenders party to the Agreement, amended February 1, 2023 | - | - | - | - | X |
10.11† | Form of 2020 Stock Appreciation Rights Agreement | 10-K | 001-32731 | February 10, 2021 | 10.36 | |
10.12† | Form of 2021 Performance Share Unit Agreement | 10-Q | 001-32731 | April 29, 2021 | 10.2 | |
10.13† | Form of 2022 Restricted Stock Unit Agreement | 10-Q | 001-32731 | April 28, 2022 | 10.1 | |
10.14† | Form of 2022 Stock Appreciation Rights Agreement | 10-Q | 001-32731 | April 28, 2022 | 10.2 | |
10.15† | Form of 2022 Performance Share Agreement | 10-Q | 001-32731 | April 28, 2022 | 10.3 | |
10.16† | Form of 2022 Stock Option Agreement (Canada) | 10-Q | 001-32731 | April 28, 2022 | 10.4 | |
10.17† | Director Compensation Program and Stock Ownership Guidelines (Revised May 25, 2023) | 10-Q | 001-32731 | July 28, 2023 | 10.1 | |
10.18† | Chipotle Mexican Grill, Inc. 2022 Stock Incentive Plan | 10-Q | 001-32731 | July 27, 2022 | 10.2 | |
10.19† | Form of 2023 Restricted Stock Unit Agreement | 10-Q | 001-32731 | April 27, 2023 | 10.1 | |
10.20† | Form of 2023 Stock Appreciation Rights Agreement | 10-Q | 001-32731 | April 27, 2023 | 10.2 | |
10.21† | Form of 2023 Performance Share Agreement | 10-Q | 001-32731 | April 27, 2023 | 10.3 | |
10.22† | Form of 2023 Stock Option Agreement (Canada) | 10-Q | 001-32731 | April 27, 2023 | 10.4 | |
10.23† | Chipotle Mexican Grill, Inc. Employee Stock Purchase Plan | 10-Q | 001-32731 | October 27, 2023 | 10.3 | |
10.24† | Supplemental Deferred Investment Plan | 10-K | 001-32731 | February 9, 2023 | 10.33 | |
10.25† | Executive Officer Severance Plan | - | - | - | - | X |
10.26† | Letter Agreement regarding Severance dated February 6, 2024 between Brian Niccol and Chipotle Mexican Grill, Inc. | - | - | - | - | X |
21.1 | Subsidiaries of Chipotle Mexican Grill, Inc. | - | - | - | - | X |
23.1 | Consent of Ernst & Young LLP (as the independent registered public accounting firm of Chipotle Mexican Grill, Inc.) | - | - | - | - | X |
31.1 | Certification of Chief Executive Officer of Chipotle Mexican Grill, Inc. pursuant to Section 302 of the Sarbanes-Oxley Act of 2002 | - | - | - | - | X |
31.2 | Certification of Chief Financial and Administrative Officer of Chipotle Mexican Grill, Inc. pursuant to Section 302 of the Sarbanes-Oxley Act of 2002 | - | - | - | - | X |
32.1 | Certification of Chief Executive Officer and Chief Financial and Administrative Officer of Chipotle Mexican Grill, Inc. pursuant to Section 906 of the Sarbanes-Oxley Act of 2002 | - | - | - | - | X |
97.1† | Executive Compensation Recovery Policy | - | - | - | - | X |
101.INS | Inline XBRL Instance Document (the instance document does not appear in the Interactive Data File because its XBRL tags are embedded within the Inline XBRL document) | - | - | - | - | X |
101.SCH | Inline XBRL Taxonomy Extension Schema Document | - | - | - | - | X |
101.CAL | Inline XBRL Taxonomy Extension Calculation Linkbase Document | - | - | - | - | X |
101.DEF | Inline XBRL Taxonomy Extension Definition Linkbase Document | - | - | - | - | X |
101.LAB | Inline XBRL Taxonomy Extension Label Linkbase Document | - | - | - | - | X |
101.PRE | Inline XBRL Taxonomy Extension Presentation Linkbase Document | - | - | - | - | X |
104 | Cover Page Interactive Data File (formatted as inline XBRL and contained in Exhibit 101) | - | - | - | - | X |
| | | |
| | | (1) Portions of this exhibit have been omitted as permitted by applicable regulations. †- Management contracts and compensatory plans or arrangements required to be filed as exhibits. |
| | | |
ITEM 16. FORM 10-K SUMMARY
None.
SIGNATURES
Pursuant to the requirements of Section 13 or 15(d) of the Securities Exchange Act of 1934, the registrant has duly caused this report to be signed on its behalf by the undersigned, thereunto duly authorized.
| |
CHIPOTLE MEXICAN GRILL, INC. |
| |
By: | /s/ JOHN R. HARTUNG |
Name: | John R. Hartung |
Title: | Chief Financial and Administrative Officer |
Date: February 7, 2024
Pursuant to the requirements of the Securities Exchange Act of 1934, this report has been signed below by the following persons on behalf of the registrant and in the capacities and on the dates indicated.
| | | | |
Signature | | Date | | Title |
| | | | |
/s/ BRIAN NICCOL | | February 7, 2024 | | Chief Executive Officer and Chairman of the Board of Directors (principal executive officer) |
Brian Niccol | | | | |
/s/ JOHN R. HARTUNG | | February 7, 2024 | | Chief Financial and Administrative Officer (principal financial and accounting officer) |
John R. Hartung | | | | |
/s/ ALBERT BALDOCCHI | | February 7, 2024 | | Director |
Albert S. Baldocchi | | | | |
/s/ MATTHEW CAREY | | February 7, 2024 | | Director |
Matthew Carey | | | | |
/s/ GREGG ENGLES | | February 7, 2024 | | Director |
Gregg Engles | | | | |
/s/ PATRICIA FILI-KRUSHEL | | February 7, 2024 | | Director |
Patricia Fili-Krushel | | | | |
| | | | |
/s/ LAURA FUENTES | | February 7, 2024 | | Director |
Laura Fuentes | | | | |
/s/ MAURICIO GUTIERREZ | | February 7, 2024 | | Director |
Mauricio Gutierrez | | | | |
/s/ ROBIN HICKENLOOPER | | February 7, 2024 | | Director |
Robin Hickenlooper | | | | |
/s/ SCOTT MAW | | February 7, 2024 | | Director |
Scott Maw | | | | |
/s/ MARY WINSTON | | February 7, 2024 | | Director |
Mary Winston | | | | |