P1Mfalse--12-31FY20210001058090YesYesNoYesP4YP3YP3YP2Y0001058090us-gaap:DomesticCountryMember2021-01-012021-12-310001058090cmg:NotPartOfShareRepurchasePlanMember2021-01-012021-12-310001058090cmg:NotPartOfShareRepurchasePlanMember2020-01-012020-12-310001058090cmg:NotPartOfShareRepurchasePlanMember2019-01-012019-12-310001058090us-gaap:GeneralAndAdministrativeExpenseMember2021-01-012021-12-310001058090us-gaap:GeneralAndAdministrativeExpenseMember2020-01-012020-12-310001058090us-gaap:GeneralAndAdministrativeExpenseMember2019-01-012019-12-310001058090us-gaap:EmployeeStockMember2020-01-012020-12-310001058090us-gaap:EmployeeStockMember2019-01-012019-12-310001058090us-gaap:RetainedEarningsMember2021-12-310001058090us-gaap:AdditionalPaidInCapitalMember2021-12-310001058090us-gaap:AccumulatedTranslationAdjustmentMember2021-12-310001058090us-gaap:AccumulatedNetUnrealizedInvestmentGainLossMember2021-12-310001058090us-gaap:RetainedEarningsMember2020-12-310001058090us-gaap:AdditionalPaidInCapitalMember2020-12-310001058090us-gaap:AccumulatedTranslationAdjustmentMember2020-12-310001058090us-gaap:AccumulatedNetUnrealizedInvestmentGainLossMember2020-12-310001058090srt:RevisionOfPriorPeriodAccountingStandardsUpdateAdjustmentMemberus-gaap:AccountingStandardsUpdate201613Memberus-gaap:TreasuryStockMember2019-12-310001058090srt:RevisionOfPriorPeriodAccountingStandardsUpdateAdjustmentMemberus-gaap:AccountingStandardsUpdate201613Memberus-gaap:RetainedEarningsMember2019-12-310001058090srt:RevisionOfPriorPeriodAccountingStandardsUpdateAdjustmentMemberus-gaap:AccountingStandardsUpdate201613Memberus-gaap:AccumulatedTranslationAdjustmentMember2019-12-310001058090srt:RevisionOfPriorPeriodAccountingStandardsUpdateAdjustmentMemberus-gaap:AccountingStandardsUpdate201613Memberus-gaap:AccumulatedNetUnrealizedInvestmentGainLossMember2019-12-310001058090srt:RevisionOfPriorPeriodAccountingStandardsUpdateAdjustmentMemberus-gaap:AccountingStandardsUpdate201613Member2019-12-310001058090us-gaap:RetainedEarningsMember2019-12-310001058090us-gaap:AdditionalPaidInCapitalMember2019-12-310001058090us-gaap:AccumulatedTranslationAdjustmentMember2019-12-310001058090us-gaap:AccumulatedNetUnrealizedInvestmentGainLossMember2019-12-310001058090srt:RevisionOfPriorPeriodAccountingStandardsUpdateAdjustmentMemberus-gaap:AccountingStandardsUpdate201602Memberus-gaap:TreasuryStockMember2018-12-310001058090srt:RevisionOfPriorPeriodAccountingStandardsUpdateAdjustmentMemberus-gaap:AccountingStandardsUpdate201602Memberus-gaap:RetainedEarningsMember2018-12-310001058090srt:RevisionOfPriorPeriodAccountingStandardsUpdateAdjustmentMemberus-gaap:AccountingStandardsUpdate201602Memberus-gaap:AdditionalPaidInCapitalMember2018-12-310001058090srt:RevisionOfPriorPeriodAccountingStandardsUpdateAdjustmentMemberus-gaap:AccountingStandardsUpdate201602Memberus-gaap:AccumulatedTranslationAdjustmentMember2018-12-310001058090srt:RevisionOfPriorPeriodAccountingStandardsUpdateAdjustmentMemberus-gaap:AccountingStandardsUpdate201602Memberus-gaap:AccumulatedNetUnrealizedInvestmentGainLossMember2018-12-310001058090srt:RevisionOfPriorPeriodAccountingStandardsUpdateAdjustmentMemberus-gaap:AccountingStandardsUpdate201602Member2018-12-310001058090us-gaap:RetainedEarningsMember2018-12-310001058090us-gaap:AdditionalPaidInCapitalMember2018-12-310001058090us-gaap:AccumulatedTranslationAdjustmentMember2018-12-310001058090us-gaap:AccumulatedNetUnrealizedInvestmentGainLossMember2018-12-310001058090us-gaap:OtherOperatingIncomeExpenseMember2021-01-012021-12-310001058090us-gaap:OtherOperatingIncomeExpenseMember2020-01-012020-12-310001058090us-gaap:OtherOperatingIncomeExpenseMember2019-01-012019-12-310001058090us-gaap:TreasuryStockMember2021-12-310001058090us-gaap:CommonStockMember2021-12-310001058090us-gaap:TreasuryStockMember2020-12-310001058090us-gaap:CommonStockMember2020-12-310001058090srt:RevisionOfPriorPeriodAccountingStandardsUpdateAdjustmentMemberus-gaap:AccountingStandardsUpdate201613Memberus-gaap:CommonStockMember2019-12-310001058090srt:RevisionOfPriorPeriodAccountingStandardsUpdateAdjustmentMemberus-gaap:AccountingStandardsUpdate201613Memberus-gaap:AdditionalPaidInCapitalMember2019-12-310001058090us-gaap:TreasuryStockMember2019-12-310001058090us-gaap:CommonStockMember2019-12-310001058090srt:RevisionOfPriorPeriodAccountingStandardsUpdateAdjustmentMemberus-gaap:AccountingStandardsUpdate201602Memberus-gaap:CommonStockMember2018-12-310001058090us-gaap:TreasuryStockMember2018-12-310001058090us-gaap:CommonStockMember2018-12-310001058090cmg:StockAwards2018Memberus-gaap:PerformanceSharesMember2020-12-300001058090cmg:StockAwards2018Memberus-gaap:PerformanceSharesMember2020-01-012020-12-310001058090cmg:StockOptionsAndStockAppreciationRightsSRSMember2020-01-012020-12-310001058090cmg:StockOptionsAndStockAppreciationRightsSRSMember2019-01-012019-12-310001058090us-gaap:StockAppreciationRightsSARSMember2021-01-012021-12-310001058090cmg:RestrictedStockUnits2011StockIncentivePlanMember2020-12-310001058090cmg:PerformanceShares2011StockIncentivePlanMember2020-12-310001058090cmg:RestrictedStockUnitsMember2020-01-012020-12-310001058090us-gaap:PerformanceSharesMember2019-01-012019-12-310001058090cmg:RestrictedStockUnitsMember2019-01-012019-12-310001058090cmg:PerformanceSharesGrant2Member2019-01-012019-12-310001058090cmg:RestrictedStockUnits2011StockIncentivePlanMember2021-01-012021-12-310001058090cmg:PerformanceSharesGrant2Membercmg:FirstHalfVestedMember2019-01-012019-12-310001058090us-gaap:StockAppreciationRightsSARSMembercmg:VestingPeriod2Member2021-01-012021-12-310001058090us-gaap:StockAppreciationRightsSARSMembercmg:VestingPeriod1Member2021-01-012021-12-310001058090cmg:PerformanceSharesGrant2Membercmg:FirstHalfVestedMember2021-01-012021-12-310001058090cmg:PerformanceSharesGrant2Membercmg:SecondHalfVestedMember2019-01-012019-12-310001058090cmg:PerformanceSharesGrant1Member2019-01-012019-12-310001058090us-gaap:RestrictedStockUnitsRSUMember2021-01-012021-12-310001058090cmg:PerformanceStockAwardsPsusMember2021-01-012021-12-310001058090us-gaap:FoodAndBeverageMember2021-01-012021-12-310001058090cmg:DeliveryServiceMember2021-01-012021-12-310001058090us-gaap:FoodAndBeverageMember2020-01-012020-12-310001058090cmg:DeliveryServiceMember2020-01-012020-12-310001058090us-gaap:FoodAndBeverageMember2019-01-012019-12-310001058090cmg:DeliveryServiceMember2019-01-012019-12-310001058090us-gaap:OtherRestructuringMember2021-01-012021-12-310001058090us-gaap:EmployeeSeveranceMember2021-01-012021-12-310001058090us-gaap:ContractTerminationMember2021-01-012021-12-310001058090cmg:ShareBasedCompensationMember2021-01-012021-12-310001058090cmg:RecruitmentAndRelocationCostsMember2021-01-012021-12-310001058090us-gaap:OtherRestructuringMember2020-01-012020-12-310001058090us-gaap:EmployeeSeveranceMember2020-01-012020-12-310001058090us-gaap:ContractTerminationMember2020-01-012020-12-310001058090cmg:ShareBasedCompensationMember2020-01-012020-12-310001058090cmg:RecruitmentAndRelocationCostsMember2020-01-012020-12-310001058090us-gaap:OtherRestructuringMember2019-01-012019-12-310001058090us-gaap:EmployeeSeveranceMember2019-01-012019-12-310001058090us-gaap:ContractTerminationMember2019-01-012019-12-310001058090cmg:ShareBasedCompensationMember2019-01-012019-12-310001058090cmg:RecruitmentAndRelocationCostsMember2019-01-012019-12-310001058090cmg:SupplierMember2021-01-012021-12-310001058090cmg:SupplierMember2020-01-012020-12-310001058090srt:MinimumMemberus-gaap:FurnitureAndFixturesMember2021-01-012021-12-310001058090srt:MinimumMemberus-gaap:EquipmentMember2021-01-012021-12-310001058090srt:MinimumMembercmg:LeaseholdImprovementsAndBuildingsMember2021-01-012021-12-310001058090srt:MaximumMemberus-gaap:FurnitureAndFixturesMember2021-01-012021-12-310001058090srt:MaximumMemberus-gaap:EquipmentMember2021-01-012021-12-310001058090srt:MaximumMembercmg:LeaseholdImprovementsAndBuildingsMember2021-01-012021-12-310001058090us-gaap:LandMember2021-12-310001058090us-gaap:FurnitureAndFixturesMember2021-12-310001058090us-gaap:EquipmentMember2021-12-310001058090us-gaap:ConstructionInProgressMember2021-12-310001058090cmg:LeaseholdImprovementsAndBuildingsMember2021-12-310001058090us-gaap:LandMember2020-12-310001058090us-gaap:FurnitureAndFixturesMember2020-12-310001058090us-gaap:EquipmentMember2020-12-310001058090us-gaap:ConstructionInProgressMember2020-12-310001058090cmg:LeaseholdImprovementsAndBuildingsMember2020-12-310001058090cmg:OfficeLeaseCorporateRestructuringCostsIntoOperatingLeaseAssetsMemberus-gaap:AccountingStandardsUpdate201602Member2019-01-012019-01-010001058090cmg:SupplierMember2020-12-310001058090us-gaap:StateAndLocalJurisdictionMember2021-12-310001058090us-gaap:ForeignCountryMember2021-12-310001058090us-gaap:StateAndLocalJurisdictionMember2020-12-310001058090us-gaap:ForeignCountryMember2020-12-310001058090us-gaap:SellingGeneralAndAdministrativeExpensesMember2021-01-012021-12-310001058090us-gaap:SellingGeneralAndAdministrativeExpensesMember2020-01-012020-12-310001058090us-gaap:SellingGeneralAndAdministrativeExpensesMember2019-01-012019-12-310001058090cmg:ChipotleMemberus-gaap:GeographicDistributionForeignMember2021-12-310001058090cmg:ChipotleMembercountry:US2021-12-310001058090cmg:PizzeriaLocaleMember2021-12-310001058090cmg:ChipotleMember2021-12-310001058090us-gaap:RevolvingCreditFacilityMembercmg:JpmorganChaseBankMember2020-05-080001058090us-gaap:RevolvingCreditFacilityMembercmg:JpmorganChaseBankMember2021-12-310001058090srt:MinimumMember2021-12-310001058090srt:MaximumMember2021-12-310001058090us-gaap:USTreasurySecuritiesMember2021-12-310001058090us-gaap:USTreasurySecuritiesMember2020-12-310001058090cmg:NuroMember2021-01-012021-12-310001058090cmg:SupplierMember2021-12-310001058090cmg:SupplierMember2020-04-160001058090us-gaap:PerformanceSharesMember2021-01-012021-12-310001058090cmg:StockOptionsAndStockAppreciationRightsSRSMember2021-01-012021-12-310001058090cmg:RestrictedStockUnitsMember2021-01-012021-12-310001058090us-gaap:PerformanceSharesMember2021-12-310001058090cmg:StockOptionsAndStockAppreciationRightsSRSMember2021-12-310001058090cmg:RestrictedStockUnitsMember2021-12-3100010580902015-01-012017-12-310001058090cmg:Plan401kMember2020-01-012020-12-310001058090cmg:Plan401kMember2019-01-012019-12-310001058090us-gaap:DomesticPlanMember2021-12-310001058090us-gaap:DomesticPlanMember2020-12-310001058090us-gaap:CorporateDebtSecuritiesMember2021-12-310001058090us-gaap:RevolvingCreditFacilityMembercmg:JpmorganChaseBankMember2021-04-132021-04-130001058090us-gaap:CorporateDebtSecuritiesMember2021-09-300001058090us-gaap:RevolvingCreditFacilityMembercmg:JpmorganChaseBankMemberus-gaap:LondonInterbankOfferedRateLIBORMember2021-04-132021-04-130001058090cmg:ChipotleRewardsMember2021-10-012021-12-310001058090cmg:GiftCardMember2021-01-012021-12-310001058090cmg:GiftCardMember2020-01-012020-12-310001058090cmg:GiftCardMember2019-01-012019-12-310001058090cmg:GiftCardMember2021-12-310001058090cmg:ChipotleRewardsMember2021-12-310001058090cmg:GiftCardMember2020-12-310001058090cmg:ChipotleRewardsMember2020-12-310001058090cmg:ChipotleRewardsMember2019-12-310001058090cmg:ChipotleRewardsMember2018-12-3100010580902019-12-3100010580902018-12-310001058090us-gaap:FairValueMeasurementsNonrecurringMember2021-12-310001058090us-gaap:FairValueMeasurementsNonrecurringMember2020-12-310001058090us-gaap:TreasuryStockMember2021-01-012021-12-310001058090us-gaap:RetainedEarningsMember2021-01-012021-12-310001058090us-gaap:CommonStockMember2021-01-012021-12-310001058090us-gaap:AdditionalPaidInCapitalMember2021-01-012021-12-310001058090us-gaap:AccumulatedTranslationAdjustmentMember2021-01-012021-12-310001058090us-gaap:AccumulatedNetUnrealizedInvestmentGainLossMember2021-01-012021-12-310001058090us-gaap:TreasuryStockMember2020-01-012020-12-310001058090us-gaap:RetainedEarningsMember2020-01-012020-12-310001058090us-gaap:CommonStockMember2020-01-012020-12-310001058090us-gaap:AdditionalPaidInCapitalMember2020-01-012020-12-310001058090us-gaap:AccumulatedTranslationAdjustmentMember2020-01-012020-12-310001058090us-gaap:AccumulatedNetUnrealizedInvestmentGainLossMember2020-01-012020-12-310001058090us-gaap:TreasuryStockMember2019-01-012019-12-310001058090us-gaap:RetainedEarningsMember2019-01-012019-12-310001058090us-gaap:CommonStockMember2019-01-012019-12-310001058090us-gaap:AdditionalPaidInCapitalMember2019-01-012019-12-310001058090us-gaap:AccumulatedTranslationAdjustmentMember2019-01-012019-12-310001058090us-gaap:AccumulatedNetUnrealizedInvestmentGainLossMember2019-01-012019-12-3100010580902021-06-3000010580902022-02-040001058090us-gaap:SubsequentEventMember2022-02-080001058090cmg:RestrictedStockUnits2011StockIncentivePlanMember2021-12-310001058090cmg:PerformanceShares2011StockIncentivePlanMember2021-12-310001058090cmg:PerformanceShares2011StockIncentivePlanMember2021-01-012021-12-310001058090srt:MinimumMember2021-01-012021-12-310001058090srt:MaximumMember2021-01-012021-12-310001058090us-gaap:FairValueInputsLevel3Memberus-gaap:FairValueMeasurementsNonrecurringMember2021-12-310001058090us-gaap:FairValueInputsLevel3Memberus-gaap:FairValueMeasurementsNonrecurringMember2020-12-310001058090us-gaap:PerformanceSharesMember2020-01-012020-12-310001058090cmg:NuroMember2021-03-230001058090cmg:NuroMember2021-03-232021-03-230001058090us-gaap:USTreasurySecuritiesMember2021-01-012021-12-310001058090us-gaap:USTreasurySecuritiesMember2020-01-012020-12-310001058090cmg:StockAwards2018Memberus-gaap:PerformanceSharesMembercmg:FirstHalfVestedMember2021-01-012021-12-310001058090cmg:StockAwards2018Memberus-gaap:PerformanceSharesMember2021-01-012021-12-310001058090us-gaap:RevolvingCreditFacilityMembercmg:JpmorganChaseBankMember2021-04-130001058090us-gaap:EmployeeStockMember2021-01-012021-12-310001058090cmg:SupplierMember2020-08-060001058090cmg:Plan401kMember2021-01-012021-12-310001058090us-gaap:DomesticPlanMember2021-01-012021-12-310001058090cmg:ChipotleRewardsMember2021-01-012021-12-310001058090cmg:ChipotleRewardsMember2020-01-012020-12-310001058090cmg:ChipotleRewardsMember2019-01-012019-12-310001058090srt:MinimumMemberus-gaap:PerformanceSharesMembercmg:VestingPeriod1Member2021-01-012021-12-310001058090srt:MaximumMemberus-gaap:PerformanceSharesMembercmg:VestingPeriod1Member2021-01-012021-12-310001058090srt:MaximumMemberus-gaap:PerformanceSharesMember2021-01-012021-12-310001058090srt:MinimumMemberus-gaap:PerformanceSharesMembercmg:VestingPeriod1Member2019-01-012019-12-310001058090srt:MaximumMemberus-gaap:PerformanceSharesMembercmg:VestingPeriod1Member2019-01-012019-12-310001058090us-gaap:EmployeeStockMember2021-12-3100010580902021-01-012021-12-3100010580902020-01-012020-12-3100010580902019-01-012019-12-3100010580902021-12-3100010580902020-12-31cmg:employeecmg:segmentiso4217:USDxbrli:sharescmg:regioncmg:itemxbrli:purexbrli:sharesiso4217:USD
UNITED STATES
SECURITIES AND EXCHANGE COMMISSION
WASHINGTON, D.C. 20549
______________________
FORM 10-K
______________________
ANNUAL REPORT PURSUANT TO SECTION 13 OR 15(d) OF THE SECURITIES EXCHANGE ACT OF 1934
For the fiscal year ended December 31, 2021
or
TRANSITION REPORT PURSUANT TO SECTION 13 OR 15(d) OF THE SECURITIES EXCHANGE ACT OF 1934
For the transition period from to
Commission File Number: 1-32731
______________________
CHIPOTLE MEXICAN GRILL, INC.
(Exact name of registrant as specified in its charter)
______________________
| |
Delaware | 84-1219301 |
(State or other jurisdiction of incorporation or organization) | (IRS Employer Identification No.) |
| |
610 Newport Center Drive, Suite 1400 Newport Beach, CA | 92660 |
(Address of Principal Executive Offices) | (Zip Code) |
Registrant’s telephone number, including area code: (949) 524-4000
Securities registered pursuant to Section 12(b) of the Act:
| | |
Title of each class | Trading Symbol(s) | Name of each exchange on which registered |
Common stock, par value $0.01 per share | CMG | New York Stock Exchange |
Securities registered pursuant to Section 12(g) of the Act: None
______________________
Indicate by check mark if the registrant is a well-known seasoned issuer, as defined in Rule 405 of the Securities Act. Yes No
Indicate by check mark if the registrant is not required to file reports pursuant to Section 13 or Section 15(d) of the Act. Yes No
Indicate by check mark whether the registrant: (1) has filed all reports required to be filed by Section 13 or 15(d) of the Securities Exchange Act of 1934 during the preceding 12 months (or for such shorter period that the registrant was required to file such reports), and (2) has been subject to such filing requirements for the past 90 days. Yes No
Indicate by check mark whether the registrant has submitted electronically every Interactive Data File required to be submitted pursuant to Rule 405 of Regulation S-T (§232.405 of this chapter) during the preceding 12 months (or for such shorter period that the registrant was required to submit such files). Yes No .
Indicate by check mark whether the registrant is a large accelerated filer, an accelerated filer, a non-accelerated filer, a smaller reporting company, or an emerging growth company. See the definitions of “large accelerated filer,” “accelerated filer,” “smaller reporting company,” and “emerging growth company” in Rule 12b-2 of the Exchange Act (check one):
| | | | |
Large accelerated filer | Accelerated filer | Non-accelerated filer | Smaller reporting company | Emerging growth company |
If an emerging growth company, indicate by check mark if the registrant has elected not to use the extended transition period for complying with accounting standards provided pursuant to Section 13(a) of the Exchange Act. ¨
Indicate by check mark whether the registrant has filed a report on and attestation to its management’s assessment of the effectiveness of its internal control over financial reporting under Section 404(b) of the Sarbanes-Oxley Act (15 U.S.C. 7262(b)) by the registered public accounting firm that prepared or issued its audit report.
Indicate by check mark whether the registrant is a shell company (as defined in Rule 12b-2 of the Exchange Act). Yes No
As of June 30, 2021, the aggregate market value of the registrant’s outstanding common equity held by non-affiliates was $35.159 billion, based on the closing price of the registrant’s common stock on June 30, 2021, the last trading day of the registrant’s most recently completed second fiscal quarter. For purposes of this calculation, shares of common stock held by each executive officer and director and by holders of 5% or more of the outstanding common stock have been excluded since those persons may under certain circumstances be deemed to be affiliates. This determination of affiliate status is not necessarily a conclusive determination for other purposes.
As of February 4, 2022, there were 28,031,948 shares of the registrant’s common stock, par value of $0.01 per share outstanding.
DOCUMENTS INCORPORATED BY REFERENCE
Part III incorporates certain information by reference from the registrant’s definitive proxy statement for the 2022 annual meeting of shareholders, which will be filed no later than 120 days after the close of the registrant’s fiscal year ended December 31, 2021.
TABLE OF CONTENTS
PART I |
Item 1. | Business | 3 |
Item 1A. | Risk Factors | 8 |
Item 1B. | Unresolved Staff Comments | 18 |
Item 2. | Properties | 18 |
Item 3. | Legal Proceedings | 18 |
Item 4. | Mine Safety Disclosures | 18 |
PART II |
Item 5. | Market for Registrant’s Common Equity, Related Stockholder Matters and Issuer Purchases of Equity Securities | 19 |
Item 6. | Reserved | 21 |
Item 7. | Management’s Discussion and Analysis of Financial Condition and Results of Operations | 21 |
Item 7A. | Quantitative and Qualitative Disclosure About Market Risk | 29 |
Item 8. | Financial Statements and Supplementary Data | 30 |
| Report of Independent Registered Public Accounting Firm (PCAOB ID: 42) | 30 |
| Consolidated Balance Sheets as of December 31, 2021 and 2020 | 32 |
| Consolidated Statements of Income and Consolidated Statements of Comprehensive Income for the years ended December 31, 2021, 2020 and 2019 | 33 |
| Consolidated Statements of Shareholders’ Equity for the years ended December 31, 2021, 2020 and 2019 | 34 |
| Consolidated Statements of Cash Flows for the years ended December 31, 2021, 2020 and 2019 | 35 |
| Notes to Consolidated Financial Statements | 36 |
| Note 1 – Description of Business and Summary of Significant Accounting Policies | 36 |
| Note 2 – Supplemental Balance Sheet Information | 42 |
| Note 3 – Revenue Recognition | 43 |
| Note 4 – Fair Value of Financial Instruments | 43 |
| Note 5 – Corporate Restructuring Costs | 45 |
| Note 6 – Income Taxes | 45 |
| Note 7 – Shareholders’ Equity | 47 |
| Note 8 – Stock-Based Compensation | 48 |
| Note 9 – Employee Benefit Plans | 50 |
| Note 10 – Leases | 51 |
| Note 11 – Earnings Per Share | 53 |
| Note 12 – Commitments and Contingencies | 53 |
| Note 13 – Debt | 54 |
| Note 14 – Related Party Transactions | 54 |
Item 9. | Changes in and Disagreements With Accountants on Accounting and Financial Disclosure | 54 |
Item 9A. | Controls and Procedures | 54 |
Item 9B. | Other Information | 57 |
PART III |
Item 10. | Directors, Executive Officers and Corporate Governance | 57 |
Item 11. | Executive Compensation | 57 |
Item 12. | Security Ownership of Certain Beneficial Owners and Management and Related Stockholder Matters | 57 |
Item 13. | Certain Relationships and Related Transactions, and Director Independence | 57 |
Item 14. | Principal Accounting Fees and Services | 57 |
PART IV |
Item 15. | Exhibits, Financial Statement Schedules | 58 |
Item 16. | Form 10-K Summary | 60 |
| Signatures | 61 |
PART I
Cautionary Note Regarding Forward-Looking Statements
This report includes “forward-looking” statements within the meaning of the Private Securities Litigation Reform Act of 1995, including projected cash from operations, expected capital expenditures for 2022 and all other statements that are not historical facts. We use words such as “may,” “will,” “should,” “expect,” “intend,” “plan,” “anticipate,” “believe,” “think,” “estimate,” “seek,” “expect,” “predict,” “could,” “project,” “potential” and other similar terms and phrases, including references to assumptions, to identify forward-looking statements. These forward-looking statements are based on currently available operating, financial and competitive information and are subject to various risks and uncertainties. Our actual future results and trends may differ materially depending on a variety of factors, including, but not limited to, the risks and uncertainties described in this report under the heading “Risk Factors” and “Management’s Discussion and Analysis of Financial Condition and Results of Operations,” so you should not place undue reliance on forward-looking statements. These statements are subject to risks and uncertainties that could cause actual results to differ materially from those described in the statements, including: the potential future impact of COVID-19 on our results of operations, including supply chain disruptions and difficulties in acquiring restaurant equipment; risks of food safety and food-borne illnesses and other health concerns about our food; risks associated with our reliance on certain information technology systems and potential failures or interruptions; privacy and cyber security risks related to our acceptance of electronic payments or electronic processing of confidential customer or employee information; the impact of competition, including from sources outside the restaurant industry; the increasingly competitive labor market and our ability to attract and retain qualified employees, which has resulted in staffing shortages; the impact of federal, state and local government regulations relating to our employees, including new predictive scheduling and just cause legislation; restaurant design and construction, and the sale of food or alcoholic beverages; our ability to achieve our planned growth, such as the availability of suitable new restaurant sites; and increases in ingredient and other operating costs due to our Food With Integrity philosophy, tariffs or trade restrictions and supply shortages. We are including this Cautionary Note to make applicable and take advantage of the safe harbor provisions of the Private Securities Litigation Reform Act of 1995 for forward-looking statements. We expressly disclaim any obligation to update or revise any forward-looking statements after the date of this report as a result of new information, future events or other developments, except as required by applicable laws and regulations.
ITEM 1. BUSINESS
General
Chipotle Mexican Grill, Inc., a Delaware corporation, together with its subsidiaries (“Chipotle,” “we,” “us,” or “our”) owns and operates Chipotle Mexican Grill restaurants, which feature a relevant menu of burritos, burrito bowls (a burrito without the tortilla), quesadillas, tacos, and salads. We strive to cultivate a better world by serving responsibly sourced, classically cooked, real food with wholesome ingredients and without artificial colors, flavors or preservatives. We are passionate about providing a great guest experience and making our food more accessible to everyone while continuing to be a brand with a demonstrated purpose. Our first Chipotle restaurant opened in Denver, Colorado in 1993. Over 25 years later, our devotion to seeking out high-quality ingredients, raised with respect for animals, farmers, and the environment, remains at the core of our commitment to Food With Integrity.
As of December 31, 2021, we owned and operated 2,918 Chipotle restaurants throughout the United States, 44 international Chipotle restaurants, and four non-Chipotle restaurants. We manage our operations based on eight regions and have aggregated our operations to one reportable segment. Our revenue is derived from sales by company-owned restaurants.
Business Strategy
We are a brand with a demonstrated purpose of cultivating a better world. Our mission is to win today while creating a bright future by focusing on five key fundamental strategies:
Running successful restaurants with a people accountable culture that provides great food with integrity while delivering exceptional in-restaurant and digital experiences;
Sustaining world class people leadership by developing and retaining diverse talent at every level;
Making the brand visible, relevant, and loved to improve overall guest engagement;
Amplifying technology and innovation to drive digital growth and productivity at our restaurants and support centers;
And expanding access and convenience by accelerating new restaurant openings.
Food with Integrity
Serving high quality food while still charging reasonable prices is critical to ensuring guests enjoy wholesome food at a great value. In our Chipotle restaurants, we endeavor to serve only meats that are raised in accordance with criteria we have established in an effort to improve sustainability and promote animal welfare, and without the use of non-therapeutic antibiotics or added growth hormones. We brand these meats as “Responsibly Raised®.” We also seek to use responsibly grown produce, by which we mean produce grown by suppliers whose practices conform to our Food With Integrity standards and our priorities with respect to environmental considerations and employee welfare. For more information about our sustainability and animal welfare initiatives see our biennial Sustainability Report and interim Update Report on our website www.chipotle.com/about-us/sustainability.
Purchasing
Maintaining the high levels of quality and safety we demand in our restaurants depends in part on our ability to acquire high-quality, fresh ingredients and other necessary supplies that meet our specifications from reliable suppliers. Our 25 independently owned and operated regional distribution centers purchase from various suppliers we carefully select based on quality, price, availability, and the suppliers’ understanding of and adherence to our mission. We’ve also sought to increase, where practical, the number of suppliers for our ingredients to help mitigate pricing volatility and reduce our reliance on one or several suppliers, which could create supply shortages. In addition, we closely monitor industry news, trade tariffs, weather, exchange rates, foreign demand, crises and other world events that may affect our ingredient prices. Certain key ingredients (certain cuts of beef, tomatoes, tortillas and adobo) are purchased from a small number of suppliers.
Quality Assurance and Food Safety
We are committed to serving only safe, high quality food. Our food safety and quality assurance teams work to ensure compliance with our food safety programs and practices, components of which include:
natural inhibitors (to prevent microbial growth in ingredients);
advanced technologies (tools that reduce or eliminate pathogens while maintaining food quality);
small grower support and training;
enhanced restaurant procedures (protocols for handling ingredients and sanitizing surfaces in our restaurants);
food safety certifications;
internal and third-party restaurant inspections;
supplier interventions (steps to mitigate food safety risks before ingredients reach Chipotle); and
ingredient traceability.
These and other food safety practices underscore our commitment to be a leader in food safety while continuing to serve high quality food that our guests love. Our food safety and quality assurance teams establish and monitor our quality and food safety programs and work closely with suppliers to ensure our high standards are met throughout the supply chain. We maintain a limited list of approved suppliers, many of whom are among the top suppliers in the industry. In addition, we have a team approach where our training, operations, culinary, legal and restaurant food safety and quality assurance departments develop and implement operating standards for food quality, food preparation, restaurant cleanliness, employee health protocols, and safety in the restaurants. Our food safety programs are also intended to ensure that we not only continue to comply with applicable federal, state and local food safety regulations, but also establish Chipotle as an industry leader in food safety. To help achieve this goal, we have a Food Safety Advisory Council comprised of some of the nation’s foremost food safety authorities. The Food Safety Advisory Council is charged with evaluating our programs and advising us on ways to elevate our already high standards for food safety. Our food safety and quality assurance team members hold board seats and participate in technical working groups with several associations. This gives us the opportunity to learn and share our knowledge and expertise with other food safety professionals and regulatory agencies.
Digital Business
Our digital platform continues to be a strategic driver of our growth. We have significantly upgraded our capabilities by digitizing almost all of our restaurant kitchens, expanding our partnerships with third-party delivery services and building more Chipotlanes, which is our drive through format for customer pick-up of digital orders. Digital sales, which includes delivery and customer pick-up, represented 45.6% of our total revenue in 2021, compared to 46.2% of total revenue in 2020. Our strong digital platform gave us a competitive advantage during the peaks of the COVID-19 pandemic, as more guests preferred to eat their meals at home and in-restaurant dining was prohibited or restricted. We have made digital ordering convenient with enhancements to the Chipotle App and website, such as unlimited customization, contactless delivery, and group ordering.
Human Capital
As of December 31, 2021, Chipotle employed 97,660 people worldwide. In the United States, we employed 94,992 people in our restaurants and 1,451 people in our Restaurant Support Centers and field support organizations; 96,443 individuals are employed in the U.S. and 1,217 are employed in Canada, France, Germany and the United Kingdom. Currently, none of our employees are represented by unions. We believe our efforts to manage our workforce have been effective, as evidenced by a strong culture and our employees’ demonstrated commitment to living our purpose and values.
Culture, Values & Diversity, Equity & Inclusion
As a people-first company rooted in values, our purpose of Cultivating a Better World extends beyond serving nutritious food using real ingredients. It means hiring world-class individuals dedicated to investing in their future and partnering together to positively impact the communities they serve. Most notably, it means fostering a culture that champions diversity, ensures equity, and celebrates inclusion.
As of December 31, 2021, more than 50% of our U.S.-based employee population is female and approximately 68% of our U.S based employee population is comprised of racial and ethnic minorities. U.S. diversity statistics were as follows:
| | | |
| | | |
Gender | | Race/Ethnicity | |
Female | 53% | Hispanic or Latino | 38% |
Male | 46% | White | 30% |
Not Indicated | 1% | Black or African American | 20% |
| | Asian | 5% |
| | Two or More Races | 4% |
| | Not Indicated/Specified | 2% |
| | American Indian/Alaskan Native | 1% |
Our most recent EEO-1 consolidated report is posted on the Investors page of our website at www.ir.chipotle.com under Corporate Governance – Human Capital Information and additional details about the demographics of our employee population is included in our biennial Sustainability Report and interim Update Report on our website www.chipotle.com/about-us/sustainability.
Talent Partnerships
We develop Talent Partnerships to amplify our purpose and vision for people and to foster talent curation, grow our employees and scale Chipotle. We believe we have a compelling employee value proposition that enables us to engage current team members, as well as the communities we serve, via these partnerships. Internally, we connect with employees who are enrolled in our debt-free degree programs and explore career pathways and internal opportunities in collaboration with leaders throughout the corporate Restaurant Support Centers and restaurant and field staff. Externally, we are forging alliances with select organizations whose mission and values are aligned with ours, and who are also committed to growing their people and ensuring equity; Big Brothers Big Sisters of America, Job Corps and Paul Quinn College are amongst these partners. We believe our overall talent strategy will allow us to effectively leverage existing talent to grow future leaders and mitigate turnover, while increasing employee engagement and driving business results.
Total Rewards
The financial, physical and mental wellness of our employees remains our top priority. During 2021, we conducted an independent pay equity analysis of our U.S. workforce to identify risks and pay gaps in our organization by gender and race/ethnicity to support our commitment to pay our employees equally across gender and race/ethnicity. The results of the 2021 analysis did not identify preferential treatment to any class of employee; however, we identified several isolated discrepancies between actual compensation and our policies and we quickly made pay adjustments to close all identified gaps. Our commitment to pay equity is evidenced by our investment in our compensation packages and robust suite of benefit offerings, such as:
Eligible Crew members who work at locations that meet team sales and output goals may qualify for a quarterly Crew Bonus (equivalent to one week’s worth of pay on average). In addition to quarterly performance bonuses, full-time crew members with at least one continuous year of service may be eligible for an annual bonus. In 2021, we paid out $6.7 million across these bonus programs.
Wages for hourly crew members increased over 15% in 2021, resulting in a national average hourly wage of greater than $15.00 per hour by the end of the year.
An expanded Debt-Free Degree program that now provides Chipotle employees access to nearly 100 degrees at 10 universities, completely tuition debt free.
New Career Certificates further enhances our Tuition Assistance benefits by providing on-demand Certificate programs to help Chipotle team members advance their careers in as little as eight weeks.
Personalized mental health assistance is available to all Chipotle employees and their family members through a partnership with Health Advocate; support is available 24/7 via in-person, phone, or virtual visits with a licensed counselor.
Government Regulation and Environmental Matters
We are subject to various federal, state and local laws and regulations that govern aspects of our business operations, including those governing:
COVID-19 protective measures, such as requiring employees and/or guests to provide proof of vaccination, imposing social distancing, and requiring and enforcing the wearing of face coverings;
the preparation, sale and labeling of food, including regulations of the Food and Drug Administration, which oversees the safety of the entire food system, including inspections and mandatory food recalls, menu labeling and nutritional content;
employment practices and working conditions, such as minimum wage rates, wage and hour practices, requirements to provide meal and rest periods, Fair Workweek and “just cause” legislation, employment of minors, anti-discrimination, anti-harassment, classification of employees, paid and family leave, workplace safety accommodations to certain employees, immigration and overtime pay, among others;
privacy and data security, laws governing the collection, maintenance and use of information regarding employees and guests and consumer credit protection and fraud;
compliance with the Americans with Disabilities Act and similar laws that give civil rights protections to individuals with disabilities in the context of employment, public accommodations and other areas;
environmental practices, such as the discharge, storage, handling, release and disposal of hazardous or toxic substances, and regulations restricting the use of straws, utensils and the types of packaging we can use in our restaurants;
building and zoning requirements, including state and local licensing and regulation governing the design and operation of facilities and land use; and
licensing and regulation by health, alcoholic beverage, sanitation, food and other agencies.
While costs associated with compliance with these laws and regulations have increased as the number and scope of the laws have increased, the total costs incurred have not had, and are not expected to have, a material effect on our capital expenditures, results of operations or competitive position. See “Risk Factors” in Item 1A for a discussion of risks relating to federal, state, local and international laws and regulations applicable to our business.
Seasonality
Seasonal factors influencing our business are described under the heading “Quarterly Financial Data/Seasonality” in Item 7. “Management’s Discussion and Analysis of Financial Condition and Results of Operations.”
Competition
The fast-casual, quick-service, and casual dining segments of the restaurant industry are highly competitive with respect to, among other things, taste, price, food quality and presentation, service, location, convenience, brand reputation, cleanliness, and ambience of each restaurant. Our competition includes a variety of restaurants in each of these segments, including locally-owned restaurants, as well as national and regional chains. Competition from food delivery services, which offer meals from a wide variety of restaurants, also has increased in recent years, particularly during COVID-19, and is expected to continue to increase. Many of our competitors also offer dine-in, carry-out, online, catering, and delivery services. Among our main competitors are restaurant formats that claim to serve higher quality ingredients without artificial flavors, colors and preservatives, and that serve food quickly and at a reasonable price.
Our Intellectual Property and Trademarks
“Chipotle,” “Chipotle Mexican Grill,” “Food With Integrity,” “Responsibly Raised,” “Chipotle Rewards,” and a number of other marks and related designs and logos are U.S. registered trademarks of Chipotle. We have filed trademark applications for a number of additional marks in the U.S. as well. In addition to our U.S. registrations, we have registered trademarks for “Chipotle” and a number of other marks in Canada, the European Union and various other countries, and have filed trademark applications for “Chipotle Mexican Grill,” “Chipotle” and a number of other marks in additional countries. We also believe that the design of our restaurants is our proprietary trade dress and have registered elements of our restaurant design for trade dress protection in the U.S. as well.
From time to time, we have taken action against other restaurants that we believe are misappropriating our trademarks, restaurant designs or advertising. Although our policy is to protect and defend vigorously our rights to our intellectual property, we may not be able to adequately protect our intellectual property, which could harm the value of our brand and adversely affect our business.
Available Information
We maintain a website at www.chipotle.com, including an investor relations section at ir.chipotle.com, on which we routinely post important information, such as webcasts of quarterly earnings calls and other investor events in which we participate or host, and any related materials. Our Code of Ethics and our Code of Conduct for Suppliers also are available in this section of our website. You may access our annual reports on Form 10-K, quarterly reports on Form 10-Q, current reports on Form 8-K and amendments to those reports, as well as other reports relating to us that are filed with or furnished to the SEC, free of charge in the investor relations section of our website as soon as reasonably practicable after such material is electronically filed with or furnished to the SEC. The SEC also maintains a website that contains reports, proxy and information statements and other information regarding issuers that file electronically with the SEC at www.sec.gov.
The contents of the websites mentioned above and elsewhere in this report are not incorporated into and should not be considered a part of this report. The references to the URLs for these websites are intended to be inactive textual references only.
ITEM 1A. RISK FACTORS
You should carefully consider the risks described below in addition to the other information set forth in this Annual Report on Form 10-K, including the “Management’s Discussion and Analysis of Financial Conditions and Results of Operations” section and the consolidated financial statements and related notes. If any of the risks and uncertainties described below actually occur or continue to occur, our business, financial condition and results of operations, and the trading price of our common stock could be materially and adversely affected. The risks and uncertainties described below are those that we have identified as material but are not the only risks and uncertainties we face. Our business is also subject to general risks and uncertainties that affect many other companies, including, but not limited to, overall economic and industry conditions. Additional risks not currently known to us or that we presently deem immaterial may arise or become material and may negatively impact our business, reputation, financial condition, results of operations or the trading price of our common stock.
Risks Related to the COVID-19 Pandemic
The COVID-19 pandemic has adversely affected and could continue to adversely affect our financial results, operations and outlook for an extended period of time.
The COVID-19 pandemic has had and is likely to continue to have a significant impact on our business and results of operations. During the peak of the pandemic in 2020 and during subsequent resurgences of the virus, government restrictions have required us to close some of our restaurants, close dining rooms and offer only takeout and delivery, impose social distancing, require proof of vaccinations and enforce the wearing of face coverings. In addition, the COVID-19 pandemic has required and may continue to require us to make difficult decisions about COVID-19 protective measures, such as requiring employees and guests to be vaccinated and/or wear face coverings, which could impact our brand, employee satisfaction, hiring and retention, and the willingness of guests to frequent our restaurants.
Our restaurant operations have been and could continue to be disrupted by employees who are unable or unwilling to work, whether because of illness, quarantine, fear of contracting COVID-19 or caring for family members impacted by COVID-19. The so-called “great resignation” trend that began in 2021, in which U.S. employees voluntarily resigned from their jobs in large numbers, has further strained our ability to keep our restaurants fully staffed and negatively impacted employee satisfaction.
The COVID-19 outbreak also has impacted and is likely to continue to impact our supply chain, which could negatively impact our business. These impacts could include but are not limited to disruptions in our ability to obtain ingredients, packaging and cleaning supplies due to labor shortages at our suppliers and service providers, transportation bottlenecks, or increases in raw material and commodity costs. If our suppliers do not fulfill their obligations to us, we could face shortages of food items or other supplies at our restaurants, and our results of operations and sales could be adversely impacted.
We cannot predict the impact that resurgences of the COVID-19 virus and new variants of the virus will have on the overall economy and consumer behavior, or how long those impacts may last, so we cannot predict how long our results of operations and financial performance will be adversely impacted.
Risks Related to Human Capital
If we are not able to hire, train, reward and retain qualified restaurant employees and/or appropriately plan our workforce, our growth plan and profitability could be adversely affected.
We rely on our restaurant-level employees to consistently provide high-quality food and positive experiences to our guests. In addition, our ability to continue to open new restaurants depends on us recruiting, training and retaining high-quality employees to manage and work in our restaurants. Maintaining appropriate staffing in our restaurants requires precise workforce planning, which has become more complex due to predictive scheduling (“fair workweek” or “secure scheduling”) laws and “just cause” termination legislation in certain geographic areas where we operate, and the impacts of the COVID-19 pandemic and the so-called “great resignation” trend on relevant labor markets. The market for qualified talent continues to be competitive and we must provide increasingly competitive wages, benefits and workplace conditions to retain qualified employees. We have experienced and may continue to experience challenges in recruiting and retaining restaurant employees and in maintaining full restaurant staffing in various locations, which has resulted in longer wait times for guest orders, temporary closures of the digital make line and decreased employee satisfaction. A shortage of qualified candidates who meet all legal work authorization requirements, our failure to recruit and retain new restaurant employees in a timely manner or higher than expected turnover levels could affect our ability to open new restaurants, grow sales at existing restaurants or meet our labor cost objectives. In addition, failure to adequately monitor and proactively respond to employee dissatisfaction could lead to poor guest satisfaction, higher turnover, litigation and unionization efforts, which could negatively impact our ability to meet our growth targets.
If we fail to comply with applicable federal, state and local employment and labor laws and regulations, it could have a material, adverse impact on our business.
Various federal, state and local employment and labor laws and regulations govern our relationships with our employees, and similar laws and regulations apply to our operations outside of the U.S. These laws and regulations relate to matters such as employment discrimination, wage and hour laws, predictive scheduling (“fair workweek”) and “just cause” termination laws, requirements to provide and document meal and rest periods or other benefits, family leave mandates, requirements regarding working conditions and accommodations to certain employees, citizenship or work authorization and related requirements, insurance and workers’ compensation rules, healthcare laws and anti-discrimination and anti-harassment laws. We incur significant costs to comply with these laws and regulations and non-compliance could expose us to significant liabilities. For example, previously a number of lawsuits have been filed against us alleging violations of federal and state laws regarding employee wages and payment of overtime, meal and rest breaks, employee classification, employee record-keeping and related practices with respect to our employees. We incur legal costs to defend, and we could incur losses from these and similar cases, and the amount of such losses or costs could be significant.
In addition, several jurisdictions, including New York City, Philadelphia, Chicago, Seattle, Oregon, San Francisco and San Jose, have implemented fair workweek or “secure scheduling” legislation, which impose complex requirements related to scheduling for certain restaurant and retail employees, and additional jurisdictions are considering similar legislation. Several jurisdictions also have implemented sick pay/paid time off legislation, which requires employers to provide paid time off to employees, and “just cause” termination legislation, which restricts companies’ ability to terminate employees unless they can prove “just cause” or a “bona fide economic reason” for the termination. All of these regulations impose additional obligations on us and our failure to comply with any of these regulations could subject us to penalties and other legal liabilities, which could adversely affect our business and results of operations and potentially cause us to close or reduce operating hours of some restaurants in these jurisdictions. For example, we previously reported that a complaint has been filed against us alleging that we have violated New York City’s Fair Work Week law and Earned Safe and Sick Time Act at our restaurants in New York City. We also have been subject to several audits of our compliance with employment law requirements in other cities.
Difficulties in hiring qualified employees and increases in the cost of labor could adversely impact our business and profitability.
Our business has been and could continue to be adversely impacted by increases in labor costs caused by factors such as federal, state and local laws governing matters such as minimum wages, meal and rest breaks and changes to eligibility for overtime pay; regulations regarding scheduling and benefits; increased health care and workers’ compensation insurance costs; higher wages and costs of other benefits necessary to attract, hire and retain high-quality employees with the right skill sets in a highly competitive job market; and increased wages, benefits and costs related to the COVID-19 pandemic. Our ability to offset higher labor costs by increasing menu prices depends on the willingness of our guests to pay the higher prices and the perceived value of our meals relative to competitors. If competitive pressures or other factors prevent us from offsetting higher labor costs by increased menu prices, our profitability may decline.
Additionally, while our employees are not currently covered by any collective bargaining agreements, union organizers have engaged in efforts to organize our employees and those of other restaurant companies. If a significant portion of our employees were to unionize, our labor costs could increase, and it could negatively impact our culture, reduce our flexibility and disrupt our business. In addition, our responses to any union organizing efforts could negatively impact our reputation and dissuade guests from patronizing our restaurants.
Risks Related to the Nature of our Business and the Restaurant Industry
Food safety and food-borne illness concerns may have an adverse effect on our business by decreasing sales and increasing costs.
Food safety is our top priority, and we dedicate significant resources to ensuring that our guests enjoy safe, high-quality food products. However, even with strong preventative controls and interventions, food safety risks cannot be completely eliminated in any restaurant and incidents of food-borne illnesses continue to occur in the restaurant industry. Incidents may result from the failure of restaurant employees or suppliers to follow our food safety policies and procedures, or from employees or guests entering our restaurant while ill and contaminating ingredients or surfaces. Although we monitor and audit compliance with our program, we cannot guarantee that each and every food item is safely and properly maintained from the start of the supply chain through guest consumption. Any report, legitimate or otherwise, of food-borne illness such as E. coli, hepatitis A, norovirus or salmonella, or other food safety issue, such as food tampering or contamination, at one of our restaurants could adversely affect our reputation and have a negative impact on our sales. In addition, instances of food-borne illness or food safety issues that occur solely at competitors’ restaurants could result in negative publicity about the restaurant industry and adversely impact our sales. Social media has dramatically increased the speed with which negative publicity, including actual or perceived food safety incidents, is disseminated before there is any meaningful opportunity to investigate, respond and address an issue. The occurrence of food-borne illnesses or food safety issues could also adversely affect the price and availability of affected ingredients, resulting in higher costs and lower margins.
We may be more susceptible than our competitors to incur significant negative consequences from food safety incidents due to several highly publicized food safety events that previously occurred in our restaurants. From 2015 to 2018, illnesses caused by E. coli and C. perfringens bacteria and norovirus were connected to a number of our restaurants. These incidents and the related negative publicity had a significant negative impact on our sales and profitability for those years. Because of consumer perceptions in the wake of these food safety incidents, any future food safety incidents associated with our restaurants—even incidents that would be considered minor at other restaurants—may have a more significant negative impact on our sales and our ability to retain guests. In addition, we may be at a higher risk for food safety incidents than some competitors due to our greater use of fresh, unprocessed produce, handling of raw chicken in our restaurants, our reliance on employees cooking with traditional methods rather than automation, and our avoidance of frozen ingredients. The risk of illnesses associated with our food also may increase due to the growth of our delivery or catering businesses, in which our food is transported, stored and/or served in conditions that are not under our control. All of these factors could have an adverse impact on our ability to attract and retain guests, which could in turn have a material adverse effect on our growth and profitability.
Our delivery business, which accounted for a significant portion of our 2021 total revenue, is subject to risks.
In 2021, 45.6% of our total revenue was derived from digital orders, which includes delivery and customer pickup in-restaurant and through our Chipotlanes. Approximately 21.5% of our 2021 total revenue consisted of delivery orders for which we are reliant on third-party delivery companies. Depending on which ordering platform a guest uses – our platform or the platform of a third-party delivery service – the delivery fee we collect from the guest may be less than the actual delivery cost, which has a negative impact on our profitability. In 2021, we implemented several menu price increases to partially offset the increases in higher delivery, labor and other costs; however, our higher menu prices may cause some guests to shift their purchases to other restaurants offered on the platform. These delivery companies maintain control over data regarding our guests who use their platform and over the guest experience. If a third-party delivery driver fails to make timely deliveries or fails to deliver the complete order, our guests may attribute the bad customer experience to Chipotle and could stop ordering from us. The ordering and payment platforms used by these third-parties, or our mobile app or online ordering system, could be interrupted by technological failures, user errors, cyber-attacks or other factors, which could adversely impact sales through these channels and negatively impact our overall sales and reputation. The third-party delivery business is intensely competitive, with a number of players competing for market share, online traffic capital, and delivery drivers. If the third-party delivery companies we utilize cease or curtail operations, increase their fees, or give greater priority or promotions on their platforms to our competitors, our delivery business and our sales may be negatively impacted. The delivery business has been consolidating and may continue to consolidate, which may give third-party delivery companies more leverage in negotiating the terms and pricing of contracts, which in turn could negatively impact our profits from this channel.
The restaurant industry is highly competitive. If we are not able to compete successfully, our business, financial condition and results of operations would be adversely affected.
The restaurant industry is highly competitive with respect to taste preferences, price, food quality and selection, customer service, brand reputation, digital engagement, advertising and promotional initiatives, and the location, attractiveness and maintenance of restaurants. We also compete with a number of non-traditional market participants, such as convenience stores, grocery stores, coffee shops, meal kit delivery services, and “ghost” or “dark” kitchens, where meals are prepared at separate takeaway premises rather than a restaurant. Competition from food delivery services, which promote a wide variety of restaurant options on their sites, also has increased in recent years, particularly during the COVID-19 pandemic. Increased competition could have an adverse effect on our sales, profitability and development plans. If consumer or dietary preferences change, if our marketing efforts are unsuccessful, or if our restaurants are unable to compete successfully with other restaurant outlets, our business could be adversely affected.
We continue to believe that our commitment to higher-quality and responsibly sourced ingredients resonates with guests and gives us a competitive advantage; however, more competitors have made and continue to make claims related to the quality of their ingredients and lack of artificial flavors, colors and preservatives. The increasing use of these claims by competitors, regardless of the accuracy of such claims, may lessen our differentiation and make it more difficult for us to compete. If we are unable to continue to maintain our distinctiveness and compete effectively, our business, financial condition and results of operations could be adversely affected.
Our inability or failure to recognize, respond to and effectively manage the immediacy of social media could have a material adverse impact on our business.
Social media and internet-based communications, including video-sharing, social networking and messaging platforms, give users immediate access to a broad audience. These platforms have dramatically increased the speed of dissemination and accessibility of information, including negative publicity related to food safety incidents and negative guest and employee experiences. Accurate and inaccurate or misleading information can be widely disseminated before there is any meaningful opportunity to respond or address an issue. As a result of our highly publicized food safety incidents in 2015 - 2018, negative social media posts about our business may generate a disproportionately negative response than would be experienced by other companies without a similar history. It is impossible for us to fully predict or control social media backlash, which could harm our business, prospects, financial condition, and results of operations, regardless of the information’s accuracy.
Use of social media is an important element of our marketing efforts. New social media platforms are developing rapidly, and we need to continuously innovate and evolve our social media strategies to maintain broad appeal with guests and brand relevance. We also continue to invest in other digital marketing initiatives to reach our guests and build their awareness of, engagement with, and loyalty to us, including our “Chipotle Rewards” national loyalty program. These initiatives may not be successful, resulting in expenses incurred without the benefit of higher revenues, increased customer engagement or brand recognition. Other risks associated with our use of social media include association with influencers or online celebrities who become embroiled in controversy, improper disclosure of proprietary information, negative comments about us, exposure of personally identifiable information, fraud, hoaxes or malicious dissemination of false information. The inappropriate use of social media by our guests or employees could lead to litigation or result in negative publicity that could damage our reputation.
If we do not continue to persuade consumers of the benefits of paying higher prices for our higher-quality food, our sales and results of operations could be hurt.
Our success depends in large part on our ability to persuade consumers that food made with ingredients that were raised or grown according to our Food With Integrity principles is worth paying a higher price relative to prices of some of our competitors, particularly quick-service restaurant competitors. Under our Food With Integrity principles, for example, animals must be responsibly raised, and the milk in our sour cream, cheese and queso must come from cows that have not been treated with rBGH, which practices typically are more costly than conventional farming. If we are not able to successfully persuade consumers that consuming food made consistent with our Food With Integrity principles is better for them and the environment, or if consumers are not willing to pay the prices we charge, our sales could be adversely affected, which would negatively impact our results of operations.
Risks Related to Supply Chain
Increases in the costs of ingredient and other materials, including increases caused by the COVID-19 pandemic, climate and/or other sustainability risks, could adversely affect our results of operations.
Supply chain risk could increase our costs and limit the availability of ingredients and supplies that are critical to our restaurant operations. The markets for some of our ingredients, such as beef, avocado and other produce, are particularly volatile due to factors beyond our control such as limited sources, seasonal shifts, climate conditions and industry demand, including as a result of animal disease outbreaks, international commodity markets, food safety concerns, product recalls and government regulation. In addition, for certain of our ingredients and other materials, we have a limited number of suppliers and distributors. We remain in regular contact with our major suppliers and to date we have not experienced significant disruptions in our supply chain; however, in the latter part of 2021 costs for certain supplies and ingredients, such as packaging, beef, tortillas and freight, increased materially and rapidly, which inflationary pressures could continue and/or spread to more categories as the impacts of COVID-19 continue across the global supply chain. Our efforts to mitigate future price risk through forward contracts, careful planning and other activities may not fully insulate us from increases in commodity costs, which could have an adverse impact on our profitability.
We also could be adversely impacted by price increases specific to meats raised in accordance with our Responsibly Raised animal welfare criteria, and ingredients grown in accordance with our Food With Integrity specifications, the markets for which are generally smaller and more concentrated than the markets for conventionally raised or grown ingredients. Any increase in the prices of the ingredients most critical to our menu, such as chicken, beef, dairy (for cheese and sour cream), avocados, beans, rice, tomatoes and pork, would have a particularly adverse effect on our operating results. If the cost of one or more ingredients significantly increases, we may choose to temporarily suspend serving menu items that use those ingredients, such as guacamole or one of our proteins, rather than pay the increased cost. Any such changes to our available menu may negatively impact our restaurant traffic and could adversely impact our sales and brand.
Shortages or interruptions in the supply of ingredients could adversely affect our operating results.
Our business is dependent on frequent and consistent deliveries of ingredients that comply with our Food With Integrity specifications. We may experience shortages, delays or interruptions in the supply of ingredients and other supplies to our restaurants due to inclement weather, natural disasters, labor issues or other operational disruptions at our suppliers, distributors or transportation providers, or other conditions beyond our control. In addition, we have a single or a limited number of suppliers for some of our ingredients, including certain cuts of beef, tomatoes, tortillas and adobo. Although we believe we have potential alternative suppliers and sufficient reserves of ingredients, shortages or interruptions in our supply of ingredients could adversely affect our financial results.
Risks Related to IT Systems, Cybersecurity and Data Privacy
Breaches or other unauthorized access, theft, modification or destruction of confidential guest, employee and other material, confidential information that is stored in our systems or by third parties on our behalf could adversely affect our business.
We could experience a cyber incident, which generally refers to any intentional attack or an unintentional event that results in unauthorized access to systems to disrupt operations, corrupt data or steal or expose confidential information or intellectual property, or a ransomware attack, which is a type of malicious software that infects a computer and restricts users' access to it until a ransom is paid to unlock it. Any such incident that compromises the information of our guests or employees could result in widespread negative publicity, damage to our reputation, a loss of guests, disruption of our business and legal liabilities. If any of our critical suppliers is the subject of a cyber or ransomware attack, we could experience a significant disruption in our supply chain and possibly shortages of key ingredients. In the past year, a ransomware attack on one of our key suppliers required us to revert to a manual ordering and tracking process, which resulted in some delays and reduced efficiencies.
As our reliance on technology has grown, the scope and severity of risks posed to our systems from cyber threats has increased. In addition, as more business activities have shifted online and more people are working remotely, including as a result of COVID-19, we have experienced an increase in cybersecurity threats and attempts to breach our security networks. The techniques and sophistication used to conduct cyber-attacks and breaches of information technology systems, as well as the sources and targets of these attacks, change frequently and are often not recognized until attacks are launched or have been in place for a period of time. We continuously monitor and develop our information technology networks and infrastructure to prevent, detect, address and mitigate the risk of unauthorized access, misuse, malware and other events that could have a security impact; however there can be no assurance that these measures will be effective.
The majority of our restaurant sales are made by credit or debit cards, and we also maintain personal information regarding our employees and confidential information about our guests and suppliers. We segment our card data environment and employ a cyber security protection program that is based on proven industry frameworks, including cyber security techniques, tactics and procedures such as the deployment of a robust set of security controls, continuous monitoring and detection programs, network protections, vendor selection criteria, secure software development programs and ongoing employee training, awareness and incident response preparedness. In addition, we continuously scan our environment for any vulnerabilities, perform penetration testing, engage third parties to assess effectiveness of our security measures and collaborate with members of the cyber security community. However, there are no assurances that such programs will be effective in detecting or preventing cybersecurity breaches.
From time to time we have been, and likely will continue to be, the target of cyber and other security threats. For example, some of our guests have experienced account takeover fraud, in which guests use the same log in credentials on multiple websites and, when a third party fraudulently obtains those credentials from one website, they can gain unauthorized access to their accounts on our website and charge food orders to the credit card linked to the account (without accessing credit card data). We may in the future become subject to other legal proceedings or governmental investigations for purportedly fraudulent transactions arising out of the actual or alleged theft of data or if consumer or employee information is obtained by unauthorized persons or used inappropriately. Any such claim or proceeding, or any adverse publicity resulting from such an event, may have a material adverse effect on our business and we may incur significant remediation costs.
We may incur increased costs to comply with privacy and data protection laws and, if we fail to comply, we could be subject to government enforcement actions, private litigation and adverse publicity.
Complex local, state, federal and international laws and regulations apply to the collection, use, retention, protection, disclosure, transfer and other processing of personal data. These privacy and data protection laws and regulations are quickly evolving, with new or modified laws and regulations proposed and implemented frequently and existing laws and regulations subject to new or different interpretations and enforcement. For example, the European Union’s General Data Protection Regulation (“GDPR”) requires companies to meet certain requirements regarding the handling of personal data, including its use, protection and transfer and the ability of persons whose data is stored to correct or delete such data about themselves. Failure to meet the GDPR requirements could result in penalties of up to 4% of annual worldwide revenue. Additionally, the California Privacy Act of 2018 (“CCPA”), which became effective on January 1, 2020, provides a private right of action for data breaches and requires companies that process information of California residents to make new disclosures to consumers about their data collection, use and sharing practices, allow consumers to opt out of certain data sharing with third parties and to request deletion of personal information (subject to certain exceptions). Further, the California Privacy Rights Act, which was passed in November 2020 and is fully effective on January 1, 2023, significantly modifies the CCPA. These modifications will require us to incur additional costs and expenses in our effort to comply. Virginia and Colorado recently enacted similar data privacy legislation that will take effect in 2023, and several other states and countries are considering expanding or passing privacy laws in the near term. If we fail, or are perceived to have failed, to properly respond to security breaches of our or a third party’s information technology systems or fail to properly respond to consumer requests under the CCPA, we could experience reputational damage, adverse publicity, loss of consumer confidence, reduced sales and profits, complications in executing our growth initiatives and regulatory and legal risk, including criminal penalties or civil liabilities. In July 2021, the European Commission finalized recommendations in relation to cross-border data transfers and published new versions of the Standard Contractual Clauses. Together with the finalization of Brexit in April 2021, the new requirements will require us to incur additional costs and expenses in order to comply and may impact the transfer of personal data throughout our organization and to third parties.
Compliance with the current and future privacy and data protection laws can be costly and time-consuming and there is no assurance that our compliance efforts will be successful in preventing breaches or data loss. Our failure to comply with applicable laws and regulations or other obligations to which we may be subject relating to personal data, or to protect personal data from unauthorized access, use or other processing, could result in enforcement actions and regulatory investigations against us, claims for damages by customers and other affected individuals, fines or damage to our brand reputation, any of which could have a material adverse effect on our operations, financial performance and business.
The regulatory environment related to privacy and data security is changing at an ever-increasing pace, with new and increasingly rigorous requirements applicable to our business. In addition, many of the leading third-party tech platforms are moving away from third-party cookies, such as ours, and moving to their own required frameworks, which may hinder our ability to target our marketing efforts. Along with newly developed laws and regulations, the frameworks of these tech platforms are subject to change, carry uncertain interpretations and may be inconsistent in application, which may lead to a decline in guest engagement or cause us to incur substantial costs or modifications to our operations or business practices to comply.
We rely heavily on information technology systems and failures or interruptions in our IT systems could harm our ability to effectively operate our business and/or result in the loss of guests or employees.
We rely heavily on information technology systems, including the point-of-sale and payment processing system in our restaurants, technologies supporting our digital and delivery business, technologies that traceback ingredients to suppliers and growers and manage our supply chain, our rewards program, technologies that facilitate marketing initiatives, employee engagement and payroll processing, and various other processes and transactions. Our ability to effectively manage our business and coordinate the procurement, production, distribution, safety and sale of our products depends significantly on the availability, reliability and security of these systems. Many of these critical systems are provided and managed by third parties, and we are reliant on these third-party providers to implement protective measures that ensure the security and availability of their systems. Although we have operational safeguards in place, these safeguards may not be effective in preventing the failure of these third-party systems or platforms to operate effectively and be available. Failures may be caused by various factors, including power outages, catastrophic events, physical theft, computer and network failures, inadequate or ineffective redundancy, problems with transitioning to upgraded or replacement systems or platforms, flaws in third-party software or services, errors or improper use by our employees or the third-party service providers. If any of our critical IT systems were to become unreliable, unavailable, compromised or otherwise fail, and we were unable to recover in a timely manner, we could experience an interruption in our operations that could have a material adverse impact on our profitability.
Our inability or failure to execute a comprehensive business continuity plan at our restaurant support centers following a disaster or force majeure event could have a material adverse impact on our business.
Many of our corporate systems and processes and corporate support for our restaurant operations are centralized at one location. We have disaster recovery procedures and business continuity plans in place to address crisis-level events, including hurricanes and other natural disasters, and back up and off-site locations for recovery of electronic and other forms of data and information, and the COVID-19 pandemic has provided a limited test of our ability to manage our business remotely. However, if we are unable to fully implement our disaster recovery plans, we may experience delays in recovery of data, inability to perform vital corporate functions, tardiness in required reporting and compliance, failures to adequately support field operations and other breakdowns in normal communication and operating procedures that could have a material adverse effect on our financial condition, results of operation and exposure to administrative and other legal claims. In addition, these threats are constantly evolving, which increases the difficulty of accurately and timely predicting, planning for and protecting against the threat. As a result, our disaster recovery procedures and business continuity plans security may not adequately address all threats we face or protect us from loss.
Legal and Regulatory Risks
A violation of Chipotle’s Deferred Prosecution Agreement could have an adverse effect on our business and reputation.
In April 2020, Chipotle signed a Deferred Prosecution Agreement (the “DPA”) to settle an official criminal investigation conducted by the U.S. Attorney’s Office for the Central District of California, in conjunction with the U.S. Food and Drug Administration’s Office of Criminal Investigations (collectively, the “DOJ”), into company-wide food safety matters that occurred in our restaurants dating back to January 1, 2013. Pursuant to the DPA, the DOJ filed a two-count Class A Misdemeanor Information in the United States District Court for the Central District of California charging Chipotle with adulterating and causing food to be adulterated within the meaning of the Federal Food, Drug and Cosmetic Act while such food was held for sale. Under the DPA, Chipotle paid a fine and is required to maintain a comprehensive compliance program that is designed to ensure Chipotle complies with all applicable federal and state food safety laws. The DOJ agreed that if Chipotle is in full compliance with all of its obligations under the DPA at the conclusion of the three-year deferred prosecution term, the DOJ will move to dismiss the two-count information filed against Chipotle. Full compliance with the DPA requires, among other things, Chipotle to conduct a root cause analysis of the historic food safety matters, maintain and annually update a comprehensive food safety plan and comply with applicable provisions of the FDCA.
Chipotle owns and operates over 2,900 restaurants and we dedicate substantial resources to our food safety program; however, even with strong preventative controls and interventions, food safety risks cannot be completely eliminated in any restaurant. Food safety risks may arise due to possible failures by restaurant employees or suppliers to follow food safety policies and procedures, employees or guests coming to the restaurant while ill or serving contaminated food ingredients. If Chipotle is found to have breached the terms of the DPA, the DOJ may elect to prosecute, or bring a civil action against the company for conduct alleged in the DPA’s Statement of Facts, which could result in additional fines, penalties, and have material adverse impacts on our results of operations. In addition, further action by the DOJ may significantly and adversely affect our brand and reputation, especially in light of our highly publicized food safety incidents in 2015 – 2018.
We could be party to litigation or other legal proceedings that could adversely affect our business, results of operations and reputation.
We have been and likely will continue to be subject to litigation and other legal proceedings that may adversely affect our business. These legal proceedings may involve claims brought by employees, guests, government agencies, suppliers, shareholders or others through private actions, class actions, administrative proceedings, regulatory actions or other litigation. These legal proceedings may involve allegations of illegal, unfair or inconsistent employment practices, including wage and hour, employment of minors, discrimination, harassment, wrongful termination, and vacation and family leave laws; food safety issues including food-borne illness, food contamination and adverse health effects from consumption of our food products; data security or privacy breaches; guest discrimination; personal injury in our restaurants; trademark infringement; violation of the federal securities laws or other concerns. For example, a number of lawsuits have been filed against us alleging violations of federal and state employment laws, including wage and hour claims, and in 2020 we signed a DPA with the U.S. Attorney’s Office for the Central District of California referred to earlier. We could be involved in similar or even more significant litigation and legal proceedings in the future. Even if the allegations against us in current or future legal matters are unfounded or we ultimately are not held liable, the costs to defend ourselves may be significant and the litigation may subject us to substantial settlements, fines, penalties or judgments against us and may divert management's attention away from operating our business, all of which could negatively impact our financial condition and results of operations. Litigation also may generate negative publicity, regardless of whether the allegations are valid, or we ultimately are liable, which could damage our reputation, and adversely impact our sales and our relationship with our employees and guests.
We are subject to extensive laws, government regulation, and other legal requirements and our failure to comply with existing or new laws and regulations could adversely affect our operational efficiencies, ability to attract and retain talent and results of operations.
Our business is subject to extensive federal, state, local and international laws and regulations, including those relating to:
preparation, sale and labeling of food, including regulations of the Food and Drug Administration, which oversees the safety of the entire food system, including inspections and mandatory food recalls, menu labeling and nutritional content;
employment practices and working conditions, including minimum wage rates, wage and hour practices, Fair Workweek and “just cause” legislation, employment of minors, discrimination, harassment, classification of employees, paid and family leave, workplace safety, immigration and overtime among others;
health, sanitation, safety and fire standards and the sale of alcoholic beverages;
building and zoning requirements, including state and local licensing and regulation governing the design and operation of facilities and land use;
public accommodations and safety conditions, including the Americans with Disabilities Act and similar state laws that give civil rights protections to individuals with disabilities in the context of employment, public accommodations, and other areas;
data privacy laws and standards for the protection of personal information, including social security numbers, financial information (including credit card numbers), and health information, and payment card industry standards and requirements;
environmental matters, such as emissions and air quality, water consumption, the discharge, storage, handling, release, and disposal of hazardous or toxic substances, and local ordinances restricting the types of packaging we can use in our restaurants; and
public company compliance, disclosure and governance matters, including accounting and tax regulations, SEC and NYSE disclosure requirements.
Compliance with these laws and regulations, and future new laws or changes in these laws or regulations that impose additional requirements, can be costly. Any failure or perceived failure to comply with these laws or regulations could result in, among other things, revocation of required licenses, administrative enforcement actions, fines and civil and criminal liability.
Risks Related to Our Growth and Business Strategy
If we are unable to meet our projections for new restaurant openings, or efficiently maintain the attractiveness of our existing restaurants, our profitability could suffer.
Our growth depends on our ability to open new restaurants and operate them profitably. Since 2020, COVID-19 related disruptions in the global supply chain have increased the cost and decreased the availability of construction materials and restaurant equipment needed to open and operate our restaurants, which can delay the openings of new restaurants. In addition, we incur substantial startup expenses each time we open a new restaurant, and it can take up to 24 months to ramp up the sales and profitability of a new restaurant, during which time costs may be higher as we train new employees and build up a customer base. If we are unable to build the customer base that we expect or fail to overcome the higher startup expenses associated with new restaurants, our new restaurants may not be as profitable as our existing restaurants. Our ability to open and profitably operate new restaurants also is subject to various risks, such as the identification and availability of desirable locations; the negotiation of acceptable lease terms; the need to obtain all required governmental permits (including zoning approvals and liquor licenses) and comply with other regulatory requirements; the availability of capable contractors and subcontractors; increases in the cost and decreases in the availability of labor and building material; changes in weather, natural disasters, pandemics or other acts of God that could delay construction and adversely affect guest traffic; our ability to hire and train qualified management and restaurant employees; and general economic and business conditions. At each potential location, we compete with other restaurants and retail businesses for desirable development sites, construction contractors, management personnel, hourly employees and other resources. If we are unable to successfully manage these risks, we could face increased costs and lower than anticipated sales and earnings in future periods.
In addition, in an effort to increase same-restaurant sales and improve our operating performance, we continue to improve our existing restaurants through remodels, upgrades and regular upkeep. If the costs associated with remodels, upgrades or regular upkeep are higher than anticipated, restaurants are closed for remodeling for longer periods than planned or remodeled restaurants do not perform as expected, we may not realize our projected desired return on investment, which could have a negative effect on our operating results.
Substantially all of our restaurants operate in leased properties subject to long-term leases. If we are unable to secure new leases on favorable terms, terminate unfavorable leases or renew or extend favorable leases, our profitability may suffer.
We operate substantially all of our restaurants in leased facilities. It is becoming increasingly challenging to locate and secure favorable lease facilities for new restaurants as competition for restaurant sites in our target markets is intense. Development and leasing costs are increasing, particularly for urban locations. These factors could negatively impact our ability to manage our occupancy costs, which may adversely impact our profitability. In addition, any of these factors may be exacerbated by economic factors, which may result in an increased demand for developers and contractors that could drive up our construction and leasing costs. Also, as we open and operate more restaurants, our rate of expansion relative to the size of our existing restaurant base will decline, making it increasingly difficult to achieve levels of sales and profitability growth that we achieved in prior years.
From time to time we may close or relocate a restaurant if a current location becomes less profitable as a result of adverse economic conditions or local regulatory compliance in the area. We may incur significant lease termination expenses when we close or relocate a restaurant and are often obligated to continue to pay rent and other lease-related expenses after closing a restaurant. We also may incur significant asset impairment and other charges in connection with closures and relocations. If the lease termination cost is significant, we may decide to keep underperforming restaurants open. Ongoing lease obligations at closed or underperforming restaurant locations could decrease our results of operations. In addition, we may be unable to renew a lease without substantial additional cost at the end of the lease term and expiration of all renewal periods. As a result, we may be required to close or relocate a restaurant, which could subject us to construction and other costs and risks that may have an adverse effect on our operating performance.
Our failure to effectively manage and support our growth could have a negative adverse effect on our business and financial results.
As of December 31, 2021, we owned and operated 2,962 Chipotle restaurants and we plan to open a significant number of new restaurants in the next several years. Our existing restaurant management systems, back office technology systems and processes, financial and management controls, information systems and personnel may not be adequate to support our continued growth. To effectively manage a larger number of restaurants, we may need to upgrade and expand our infrastructure and information systems, automate more processes that currently are manual or require manual intervention and hire, train and retain restaurant employees and corporate support staff, all of which may result in increased costs and at least temporary inefficiencies. We also place a lot of importance on our culture, which we believe has been an important contributor to our success, and as we continue to grow, it may be increasingly difficult to maintain our culture. Our failure to sufficiently invest in our infrastructure and information systems and maintain our strong staffing and culture could harm our brand and operating results.
A failure to recruit, develop and retain effective leaders or the loss or shortage of personnel with key capacities and skills could impact our strategic growth plans and jeopardize our ability to meet our business performance expectations and growth targets.
Our ability to continue to grow our business depends substantially on the contributions and abilities of our executive leadership team and other key management personnel. Changes in senior management could expose us to significant changes in strategic direction and initiatives. A failure to maintain appropriate organizational capacity and capability to support our strategic initiatives or to build adequate bench strength with key skillsets required for seamless succession of leadership, could jeopardize our ability to meet our business performance expectations and growth targets. If we are unable to attract, develop, retain and incentivize sufficiently experienced and capable management personnel, our business and financial results may suffer.
The market price of our common stock may be more volatile than the market price of our peers.
We believe the market price of our common stock generally has traded at a higher price-earnings ratio than stocks of most of our peer companies as well as the overall market, which typically has reflected market expectations for higher future operating results. At any given point in time, our price-earnings ratio may trade at more than twice the price-earnings ratio of the S&P 500. Also, the trading market for our common stock has been volatile at times, including as a result of adverse publicity events. As a result, if we fail to meet market expectations for our operating results in the future, any resulting decline in the price of our common stock could be significant.
General Risk Factors
Economic and business factors that are largely beyond our control may adversely affect consumer behavior and the results of our operations.
Restaurant dining generally is dependent upon consumer discretionary spending, which may be affected by general economic conditions that are beyond our control. For example, increasing inflation, international, domestic and regional economic conditions, consumer income levels, financial market volatility, a slow or stagnant pace of economic growth, rising energy costs, rising interest rates, social unrest, and governmental, political and budget concerns or divisions may have a negative effect on consumer confidence and discretionary spending. Due to the COVID-19 pandemic, we may experience a reduction and/or increased volatility in sales due to, among other things, reduced customer traffic due to illness, quarantine or government or self-imposed restrictions on our restaurant operations, customer responses to government imposed mask and vaccine mandates, and decreases in consumer confidence in general macroeconomic conditions and in discretionary spending. The rapid rise in inflation may prompt consumers to decrease discretionary spending. A significant decrease in our guest traffic or average transactions would negatively impact our financial performance. The actual or perceived threat of a pandemic or communicable disease, terrorist attack, mass shooting, heightened security requirements, including cybersecurity, or a failure to protect information systems for critical infrastructure, such as the electrical grid and telecommunications systems, could harm our operations, the economy or consumer confidence generally. Any of the above factors or other unfavorable changes in business and economic conditions affecting our guests could increase our costs, reduce traffic in some or all of our restaurants or limit our ability to increase pricing, any of which could lower our profit margins and have a material adverse effect on our sales, financial condition and results of operations. These factors also could cause us to, among other things, reduce the number and frequency of new restaurant openings, close restaurants or delay remodeling of our existing restaurant locations. Further, poor economic conditions may force nearby businesses to shut down, which could reduce traffic to our restaurants or cause our restaurant locations to be less attractive.
Climate change and volatile adverse weather conditions could adversely affect our restaurant sales or results of operations.
There is growing concern that climate change and global warming has caused and may continue to cause more severe, volatile weather or extended droughts, which could increase the frequency and duration of weather impacts on our operations. Adverse weather conditions have in the past and may again impact guest traffic at our restaurants, and, in more severe cases such as hurricanes, tornadoes, wildfires or other natural disasters, cause temporary restaurant closures, all of which negatively impact our restaurant sales. In addition, our supply chain is subject to increased costs caused by the effects of climate change, greenhouse gases and diminishing energy and water resources. Increasing weather volatility and changes in global weather patterns can reduce crop size and crop quality, which could result in decreased availability or higher pricing for our produce and other ingredients. These factors are beyond our control and, in many instances, unpredictable. Climate change and government regulation relating to climate change could result in construction delays for new restaurants and interruptions to the availability or increases in the cost of utilities. The ongoing and long-term costs of these impacts related to climate change and other sustainability related issues could have a material adverse effect on our business and financial condition if we are not able to mitigate them.
Our quarterly financial results may fluctuate significantly, including due to factors that are not in our control.
Our quarterly financial results may fluctuate significantly and could fail to meet investors’ expectations for various reasons, including:
negative publicity about the safety of our food, employment-related issues, litigation or other issues involving our restaurants;
fluctuations in supply costs, particularly for our most significant ingredients, and our inability to offset the higher cost with price increases without adversely impacting guest traffic;
labor availability and wages of restaurant management and employees;
increases in marketing or promotional expenses;
the timing of new restaurant openings and related revenues and expenses, and the operating costs at newly opened restaurants;
the impact of inclement weather and natural disasters, such as freezes and droughts, which could decrease guest traffic and increase the costs of ingredients;
the amount and timing of stock-based compensation;
litigation, settlement costs and related legal expenses;
tax expenses, asset impairment charges and non-operating costs; and
variations in general economic conditions, including the impact of declining interest rates on our interest income.
As a result of any of these factors, results for any one quarter are not necessarily indicative of results to be expected for any other quarter or for any year. Average restaurant sales or comparable restaurant sales in any particular future period may decrease.
ITEM 1B. UNRESOLVED STAFF COMMENTS
None.
ITEM 2. PROPERTIES
As of December 31, 2021, there were 2,966 restaurants operated by Chipotle and our consolidated subsidiaries, 2,962 of which were Chipotle restaurants. Our main office is located at 610 Newport Center Drive, Suite 1400, Newport Beach, CA 92660 and our telephone number is (949) 524-4000. We lease our main office and substantially all of the properties on which we operate restaurants. We own 17 properties and operate restaurants on all of them. For additional information regarding the lease terms and provisions, see Note 1. “Description of Business and Summary of Significant Accounting Policies” and Note 10. “Leases” in our consolidated financial statements included in Item 8. “Financial Statements and Supplementary Data.”
ITEM 3. LEGAL PROCEEDINGS
For information regarding legal proceedings, see Note 12. “Commitments and Contingencies” in our consolidated financial statements included in Item 8. “Financial Statements and Supplementary Data.”
ITEM 4. MINE SAFETY DISCLOSURES
Not applicable.
PART II
ITEM 5. MARKET FOR REGISTRANT’S COMMON EQUITY, RELATED SHAREHOLDER MATTERS AND ISSUER PURCHASES OF EQUITY SECURITIES
Our common stock trades on the New York Stock Exchange under the symbol “CMG.”
As of February 7, 2022, there were approximately 1,091 shareholders of record. This does not include persons whose stock is in nominee or “street name” accounts through brokers.
Purchases of Equity Securities by the Issuer
The table below reflects shares of common stock we repurchased during the fourth quarter of 2021.
| | | | | | | | | | | |
| | | Total Number of Shares Purchased | | Average Price Paid Per Share | | Total Number of Shares Purchased as Part of Publicly Announced Plans or Programs(1) | | Approximate Dollar Value of Shares that May Yet Be Purchased Under the Plans or Programs |
October | | | 27,172 | | $ | 1,811.91 | | 27,172 | | $ | 160,558,269 |
| Purchased 10/1 through 10/31 | | | | | | | | | | |
November | | | 29,834 | | $ | 1,767.37 | | 29,834 | | $ | 107,830,424 |
| Purchased 11/1 through 11/30 | | | | | | | | | | |
December(2) | | | 39,518 | | $ | 1,694.41 | | 39,518 | | $ | 240,870,889 |
| Purchased 12/1 through 12/31 | | | | | | | | | | |
Total | | | 96,524 | | $ | 1,750.04 | | 96,524 | | | |
(1) Shares were repurchased pursuant to repurchase programs announced on July 20, 2021 and October 21, 2021.
(2) The December total includes an additional $200 million in authorized repurchases approved on December 7, 2021 and announced February 8, 2022. There is no expiration date for this program. The authorization to repurchase shares will end when we have repurchased the maximum amount of shares authorized, or we have determined to discontinue such repurchases.
Dividend Policy
We are not required to pay any dividends and have not declared or paid any cash dividends on our common stock. We intend to continue to retain earnings for use in the operation and expansion of our business and to repurchase shares of common stock (subject to market conditions), and therefore do not anticipate paying any cash dividends on our common stock in the foreseeable future.
COMPARISON OF CUMULATIVE TOTAL RETURN
The following graph compares the cumulative annual stockholders return on our common stock from December 31, 2016, through December 31, 2021, to that of the total return index for the S&P 500 and the S&P 500 Restaurants Index assuming an investment of $100 on December 31, 2016. In calculating total annual stockholder return, reinvestment of dividends, if any, is assumed. The indices are included for comparative purposes only. They do not necessarily reflect management’s opinion that such indices are an appropriate measure of the relative performance of our common stock. The values shown are neither indicative nor determinative of future performance. This graph is not “soliciting material,” is not deemed filed with the Securities and Exchange Commission and is not to be incorporated by reference in any of our filings under the Securities Act or the Exchange Act, whether made before or after the date hereof and irrespective of any general incorporation language in any such filing.
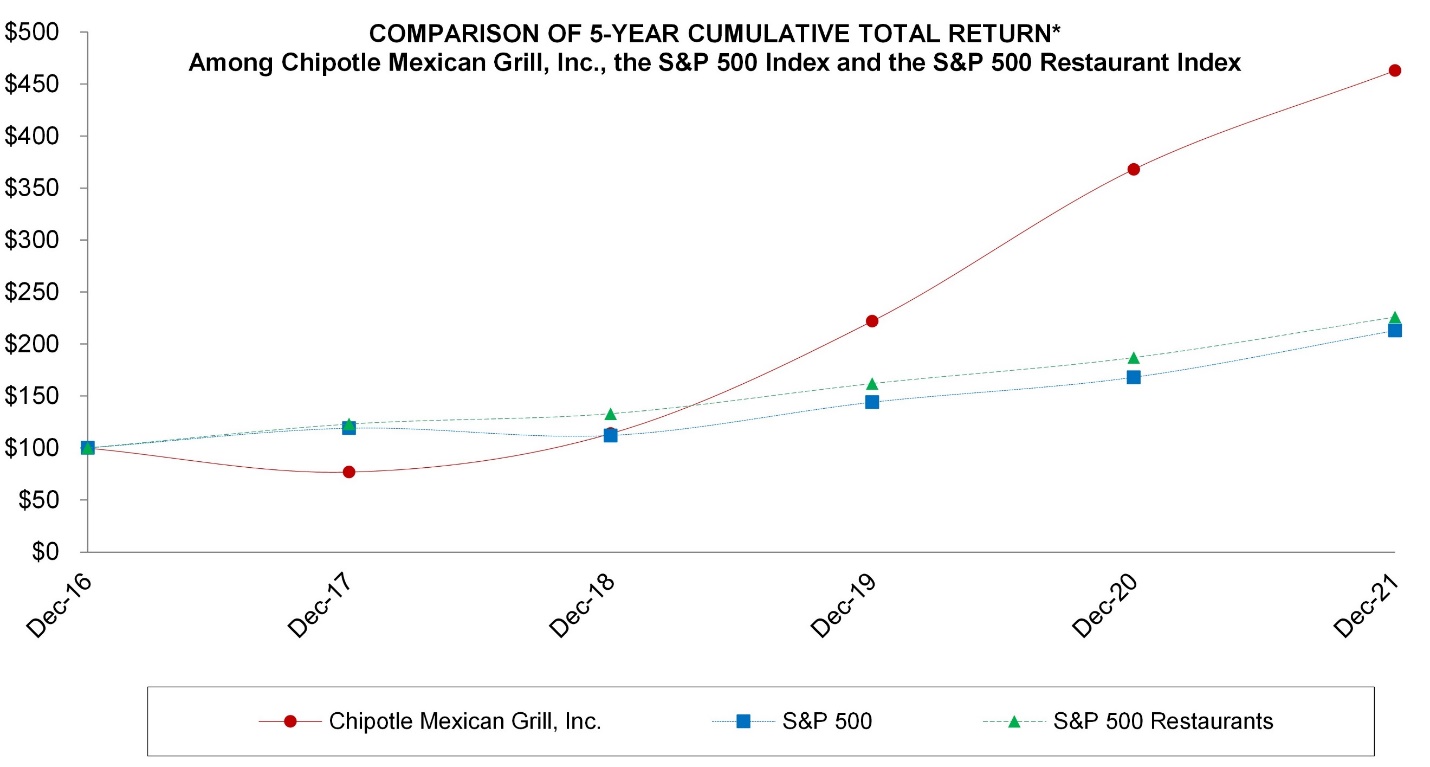
| | | | | | | | | | | | | | | | | |
| | | | | | | | | | | | | | | | | |
Company/Index | 2016 | | 2017 | | 2018 | | 2019 | | 2020 | | 2021 |
Chipotle Mexican Grill, Inc. | $ | 100 | | $ | 77 | | $ | 114 | | $ | 222 | | $ | 368 | | $ | 463 |
S&P 500 | | 100 | | | 119 | | | 112 | | | 144 | | | 168 | | | 213 |
S&P 500 Restaurants | | 100 | | | 123 | | | 133 | | | 162 | | | 187 | | | 226 |
*$100 invested on December 31, 2016, in stock or index, including reinvestment of dividends.
Fiscal year ending December 31.
Source data: S&P Capital IQ
ITEM 6. RESERVED
ITEM 7. MANAGEMENT’S DISCUSSION AND ANALYSIS OF FINANCIAL CONDITION AND RESULTS OF OPERATIONS
You should read the following discussion together with our consolidated financial statements and related notes included in Item 8. “Financial Statements and Supplementary Data.” This section of the Form 10-K generally discusses 2021 and 2020 items and year-to-year comparisons of 2021 to 2020. Discussions of 2019 items and year-to-year comparisons of 2020 and 2019 that are not included in this Form 10-K can be found in “Management’s Discussion and Analysis of Financial Condition and Results of Operations” in Part II, Item 7 on our Annual Report on Form 10-K for the year ended December 31, 2020. The discussion contains forward-looking statements involving risks, uncertainties and assumptions that could cause our results to differ materially from expectations. See “Cautionary Note Regarding Forward-Looking Statements.” Factors that might cause such differences include those described in Item 1A. “Risk Factors” and elsewhere in this report.
Overview
As of December 31, 2021, we operated 2,918 Chipotle restaurants throughout the United States, 44 international Chipotle restaurants, and four non-Chipotle restaurants. We manage our U.S. operations based on eight regions and have aggregated our operations to one reportable segment.
Throughout “Management’s Discussion and Analysis of Financial Condition and Results of Operations” we commonly discuss the following key operating metrics which we believe will drive our financial results and long-term growth model. We believe these metrics are useful to investors because management uses these metrics to assess the growth of our business and the effectiveness of our marketing and operational strategies:
Comparable restaurant sales
Restaurant operating costs as a percentage of total revenue
New restaurant openings
The COVID-19 pandemic has adversely affected, and may continue to adversely affect, our operations and financial results for the foreseeable future. We continue to follow guidance from health officials in determining the appropriate restrictions to put in place for each restaurant. Our restaurant operations have been and could continue to be disrupted by COVID-19 related employee absences or due to changes in the availability and cost of labor. We remain in regular contact with our major suppliers and to date we have not experienced significant disruptions in our supply chain; however, we have experienced inflationary pressures in freight and the costs of some of our ingredients and temporary shortages in equipment and other goods, which could increase and/or spread to more categories as the impacts of COVID-19 continue across the global supply chain. We anticipate the restaurant wage increases implemented in June 2021 and any future wage increases in the U.S. along with increased supply chain costs, primarily related to inflationary pressures that began in the latter half of 2021 will have an impact on restaurant operating costs in 2022. However, these should be offset to some extent by benefits from pricing actions, leverage from revenue growth and supply chain initiatives.
2021 Financial Highlights
Sales Trends. Average restaurant sales were $2.641 million for the year ended December 31, 2021, an increase from $2.223 million for the year ended December 31, 2020. We define average restaurant sales as the average trailing 12-month food and beverage sales for restaurants in operation for at least 12 full calendar months.
Total revenue was $7.5 billion for the year ended December 31, 2021, an increase of 26.1% from $6.0 billion for the year ended December 31, 2020. The increase was attributable to comparable restaurant sales and, to a lesser extent, new restaurant openings. Comparable restaurant sales increased 19.3% for the year ended December 31, 2021, primarily due to a 10.3% increase in transactions and an 8.5% benefit from menu price increases implemented in late 2020 and during 2021. Comparable restaurant sales represent the change in period-over-period sales or transactions for restaurants in operation for at least 13 full calendar months.
Digital sales, which includes delivery and customer pick-up, were $3.4 billion for the year ended December 31, 2021, and represented 45.6% of total revenue compared to 46.2% of total revenue for the year ended December 31, 2020. Higher volumes of in-store transactions in 2021 contributed to the decrease in digital sales as a percentage of total revenue. Order ahead sales were 50.9% and 49.9% of digital sales for the years ended December 31, 2021, and 2020, respectively.
During 2021, we completed several company initiatives which we believe contributed to sales growth. These initiatives included the launch of cauliflower rice in January 2021, digital launch of quesadillas in March 2021 and smoked brisket in September 2021. Additionally, in June 2021, we enhanced our loyalty program, Chipotle Rewards, by introducing new redemption options and personalized offers primarily targeted at new and at-risk customers.
Restaurant Operating Costs. During the year ended December 31, 2021, our restaurant operating costs (food, beverage and packaging; labor; occupancy; and other operating costs) were 77.4% of total revenue, a decrease from 82.6% during the year ended December 31, 2020. The decrease was driven primarily by higher comparable restaurant sales, partially offset by wage inflation, higher commodity inflation primarily from freight and beef and, to a lesser extent, increased delivery fees.
Diluted Earnings Per Share. During the year ended December 31, 2021, our diluted earnings per share were $22.90, an 82.9% increase from $12.52 in 2020.
Restaurant Development. For the full year 2021, we opened 215 new restaurants, which included 174 restaurants with a Chipotlane. We expect to open approximately 235-250 new restaurants in 2022, including five to 10 relocations, of which we are targeting 80% with a Chipotlane.
Restaurant Activity
The following table details restaurant unit data for the years indicated.
| | | |
| | | |
| Year ended December 31, |
| 2021 | | 2020 |
Beginning of period | 2,768 | | 2,622 |
Chipotle openings | 215 | | 160 |
Pizzeria Locale openings | - | | 1 |
Chipotle permanent closures | (10) | | (9) |
Chipotle relocations | (7) | | (6) |
Total restaurants at end of period | 2,966 | | 2,768 |
Results of Operations
Our results of operations as a percentage of total revenue and period-over-period change are discussed in the following section.
Revenue
| | | | | | | |
| | | | | | | |
| Year ended December 31, | | Percentage |
| 2021 | | 2020 | | change |
| (dollars in millions) | | |
Food and beverage revenue | $ | 7,457.2 | | $ | 5,920.5 | | 26.0% |
Delivery service revenue | | 89.9 | | | 64.1 | | 40.3% |
Total revenue | $ | 7,547.1 | | $ | 5,984.6 | | 26.1% |
Average restaurant sales (1) | $ | 2.6 | | $ | 2.2 | | 18.8% |
Comparable restaurant sales increase | | 19.3% | | | 1.8% | | |
| | | | | | | |
(1) Average restaurant sales refer to the average trailing 12-month food and beverage sales for restaurants in operation for at least 12 full calendar months. |
The significant factors contributing to the total revenue increase for the year ended December 31, 2021 compared to the year ended December 31, 2020, were comparable restaurant sales increases and new restaurant openings. Comparable restaurant sales increased $1,128.2 million and total revenue from restaurants not yet in the comparable base contributed $434.1 million to the total revenue increase, of which $201.9 million was due to restaurants opened in 2021.
Food, Beverage and Packaging Costs
| | | | | | | |
| | | | | | | |
| Year ended December 31, | | Percentage |
| 2021 | | 2020 | | change |
| (dollars in millions) | | |
Food, beverage and packaging | $ | 2,308.6 | | $ | 1,932.8 | | 19.4% |
As a percentage of total revenue | | 30.6% | | | 32.3% | | (1.7%) |
Food, beverage and packaging costs decreased as a percentage of total revenue for the year ended December 31, 2021 compared to the year ended December 31, 2020, primarily due to sales leverage from menu price increases. This decrease was partially offset by higher costs for freight and beef and, to a lesser extent, higher costs for avocados.
Labor Costs
| | | | | | | |
| | | | | | | |
| Year ended December 31, | | Percentage |
| 2021 | | 2020 | | change |
| (dollars in millions) | | |
Labor costs | $ | 1,917.8 | | $ | 1,593.0 | | 20.4% |
As a percentage of total revenue | | 25.4% | | | 26.6% | | (1.2%) |
Labor costs decreased as a percentage of total revenue for the year ended December 31, 2021 compared to the year ended December 31, 2020, primarily due to sales leverage and, to a lesser extent, lower COVID-19 related pay for restaurant employees. This decrease was partially offset primarily by wage inflation from increasing restaurant wages to a $15.00 national average hourly wage for our restaurant employees implemented across all restaurants by June 30, 2021.
Occupancy Costs
| | | | | | | |
| | | | | | | |
| Year ended December 31, | | Percentage |
| 2021 | | 2020 | | change |
| (dollars in millions) | | |
Occupancy costs | $ | 416.6 | | $ | 387.8 | | 7.4% |
As a percentage of total revenue | | 5.5% | | | 6.5% | | (1.0%) |
Occupancy costs decreased as a percentage of total revenue for the year ended December 31, 2021 compared to the year ended December 31, 2020, primarily due to sales leverage, partially offset by increased rent expense associated with new restaurants.
Other Operating Costs
| | | | | | | |
| | | | | | | |
| Year ended December 31, | | Percentage |
| 2021 | | 2020 | | change |
| (dollars in millions) | | |
Other operating costs | $ | 1,197.1 | | $ | 1,030.0 | | 16.2% |
As a percentage of total revenue | | 15.9% | | | 17.2% | | (1.3%) |
Other operating costs include, among other items, marketing and promotional costs, delivery expense, bank and credit card processing fees, restaurant utilities, and maintenance costs. Other operating costs decreased as a percentage of total revenue for the year ended December 31, 2021 compared to the year ended December 31, 2020, primarily due to sales leverage and, to a lesser extent, lower marketing and promotional expense. These decreases were partially offset by higher delivery and technology expense.
General and Administrative Expenses
| | | | | | | |
| | | | | | | |
| Year ended December 31, | | Percentage |
| 2021 | | 2020 | | change |
| (dollars in millions) | | |
General and administrative expense | $ | 606.9 | | $ | 466.3 | | 30.1% |
As a percentage of total revenue | | 8.0% | | | 7.8% | | 0.2% |
General and administrative expenses increased in dollar terms for the year ended December 31, 2021 compared to the year ended December 31, 2020, primarily due to the following: a $92.8 million increase in stock-based compensation, primarily attributable to the December 2020 modification of 2018 performance awards related to COVID-19; a $23.2 million increase in outside services expense related to corporate initiatives; an $11.8 million increase in performance bonuses; and a $9.6 million increase in employee wages primarily due to headcount growth. These increases were partially offset by a $17.1 million decrease in estimated loss contingencies related to legal matters in 2021 compared to 2020.
Depreciation and Amortization
| | | | | | | |
| | | | | | | |
| Year ended December 31, | | Percentage |
| 2021 | | 2020 | | change |
| (dollars in millions) | | |
Depreciation and amortization | $ | 254.7 | | $ | 238.5 | | 6.8% |
As a percentage of total revenue | | 3.4% | | | 4.0% | | (0.6%) |
Depreciation and amortization decreased as a percentage of total revenue for the year ended December 31, 2021 compared to the year ended December 31, 2020, primarily due to sales leverage.
Impairment, Closure Costs, and Asset Disposals
| | | | | | | |
| | | | | | | |
| Year ended December 31, | | Percentage |
| 2021 | | 2020 | | change |
| (dollars in millions) | | |
Impairment, closure costs, and asset disposals | $ | 19.3 | | $ | 30.6 | | (36.9%) |
As a percentage of total revenue | | 0.3% | | | 0.5% | | (0.2%) |
Impairment, closure costs, and asset disposals decreased in dollar terms for the year ended December 31, 2021 compared to the year ended December 31, 2020, primarily due to a comparison against elevated impairments of operating lease assets and leasehold improvements in 2020. These elevated impairments in 2020 were primarily the result of the COVID-19 pandemic negatively impacting our near-term restaurant level cash flow forecasts.
Benefit/(Provision) for Income Taxes
| | | | | | | |
| | | | | | | |
| Year ended December 31, | | Percentage |
| 2021 | | 2020 | | change |
| (dollars in millions) | | |
Benefit/(Provision) for income taxes | $ | (159.8) | | $ | 62.0 | | n/m* |
Effective income tax rate | | 19.7% | | | (21.1%) | | n/m* |
| | | | | | | |
*Not meaningful | | | | | | | |
The effective income tax rate for the year ended December 31, 2021, was higher than the effective income tax rate for the year ended December 31, 2020, primarily due to comparing against the federal net operating loss for tax year 2020, which had a statutory federal income tax rate of 21%, that was carried back to tax years 2015-2017, which had a statutory federal income tax rate of 35%. There is a further increase in the effective income tax rate due to the proportionality of the excess tax benefits from equity vesting and exercises relative to profit before tax in each respective year. This was partially offset by a net reduction in the 2021 effective income tax rate primarily related to the write-off of uncertain tax positions reserves for the year ended December 31, 2021.
Quarterly Financial Data/Seasonality
Seasonal factors cause our profitability to fluctuate from quarter to quarter. Historically, our average daily restaurant sales and net income are lower in the first and fourth quarters due, in part, to the holiday season and because fewer people eat out during periods of inclement weather (the winter months) than during periods of mild or warm weather (the spring, summer and fall months). Other factors also have a seasonal effect on our results. For example, restaurants located near colleges and universities generally do more business during the academic year. Seasonal factors, however, might be moderated or outweighed by other factors that may influence our quarterly results, such as unexpected publicity impacting our business in a positive or negative way, worldwide health pandemics, fluctuations in food or packaging costs, or the timing of menu price increases or promotional activities and other marketing initiatives. The number of trading days in a quarter can also affect our results, although, on an overall annual basis, changes in trading days do not have a significant impact.
Our quarterly results are also affected by other factors such as the amount and timing of non-cash stock-based compensation expense and related tax rate impacts, litigation, settlement costs and related legal expenses, impairment charges and non-operating costs, timing of marketing or promotional expenses, the number and timing of new restaurants opened in a quarter, and closure of restaurants. New restaurants typically have higher operating costs following opening because of the expenses associated with their opening and operating inefficiencies in the months immediately following opening. Accordingly, results for a particular quarter are not necessarily indicative of results to be expected for any other quarter or for any year.
Liquidity and Capital Resources
As of December 31, 2021, we had a cash and marketable investments balance of $1.3 billion, excluding restricted cash of $30.9 million and non-marketable investments of $43.2 million. After funding the current operations in our restaurants and support centers, the first planned use of our cash flow from operations is to provide capital for the continued investment in new restaurant construction. In addition to continuing to invest in our restaurant expansion, we expect to utilize cash flow from operations to: repurchase additional shares of our common stock subject to market conditions; invest in, maintain, and refurbish our existing restaurants; and for general corporate purposes. As of December 31, 2021, $240.9 million remained available for repurchases of shares of our common stock, which includes the $200.0 million additional authorization approved by our Board of Directors and announced on February 8, 2022. Under the remaining repurchase authorizations, shares may be purchased in open market transactions, subject to market conditions. Additionally, as of December 31, 2021, we had $500.0 million of undrawn borrowing capacity under a line of credit facility.
We believe that cash from operations, together with our cash and investment balances, will be sufficient to meet ongoing capital expenditures, working capital requirements and other cash needs for the foreseeable future. Assuming no significant declines in comparable restaurant sales, we expect we will generate positive cash flow for the foreseeable future. Should our business deteriorate due to changing conditions, there are actions we can take to further conserve liquidity.
We have not required significant working capital because customers generally pay using cash or credit and debit cards and because our operations do not require significant receivables, nor do they require significant inventories due, in part, to our use of various fresh ingredients. In addition, we generally have the right to pay for the purchase of food, beverages and supplies sometime after the receipt of those items, within ten days, thereby reducing the need for incremental working capital to support our growth.
Our total capital expenditures for 2021 were $442.5 million. In 2021, we spent on average about $1.1 million in development and construction costs per new restaurant, or about $1.0 million net of landlord reimbursements of $0.1 million. In 2022, we expect to incur about $450 million in total capital expenditures. We expect approximately $260 million in capital expenditures related to our construction of new restaurants, before any reductions for landlord reimbursements. For new restaurants to be opened in 2022, we anticipate average development costs will remain consistent with 2021 due to a significant portion including Chipotlanes. We expect approximately $150 million in capital expenditures related to investments in existing restaurants including new equipment and hardware, technology to optimize efficiencies, remodeling and similar improvements. Finally, we expect a portion of our incurred capital expenditures to be for additional corporate initiatives including investments in technology for support centers to boost innovation, enhance the customer experience, and improve operations.
The following table summarizes current and long-term material cash requirements as of December 31, 2021, which we expect to fund primarily with operating cash flows:
| | | | | | | | | | | | | | | |
| | | | | | | | | | | | | | | |
| | Payments Due by Fiscal Year |
| | Total | | 2022 | | 2023-2024 | | 2025-2026 | | Thereafter |
| | (dollars in millions) |
Operating leases(1) | | $ | 5,066 | | $ | 366 | | $ | 785 | | $ | 752 | | $ | 3,163 |
Purchase obligations(2) | | | 1,743 | | | 573 | | | 472 | | | 465 | | | 233 |
Deemed landlord financing(1) | | | 2 | | | - | | | 1 | | | 1 | | | - |
Total | | $ | 6,811 | | $ | 939 | | $ | 1,258 | | $ | 1,218 | | $ | 3,396 |
(1)See Note 10. “Leases” of our consolidated financial statements included in Item 8. “Financial Statements and Supplementary Data.” This includes commitments related to reasonably certain renewal periods.
(2)Purchase obligations include agreements to purchase goods or services that are enforceable and legally binding on us and that specify all significant terms. We have excluded agreements that are cancelable without penalty. The majority of our purchase obligations relate to amounts owed for produce and other ingredients and supplies, orders submitted for equipment for restaurants under construction and planned remodels, information technology, and marketing initiatives and corporate sponsorships.
The above table does not include income tax liabilities for uncertain tax positions for which we are not able to make a reasonably reliable estimate of the amount and period of related future payments. Additionally, we have excluded our estimated loss contingencies, due to uncertainty regarding the timing and amount of payment. See Note 12. “Commitments and Contingencies” of our consolidated financial statements included in Item 8. “Financial Statements and Supplementary Data.”
Critical Accounting Estimates
We describe our significant accounting policies in Note 1. “Description of Business and Summary of Significant Accounting Policies” of our consolidated financial statements included in Item 8. “Financial Statements and Supplementary Data.” Critical accounting estimates are those that we believe are both significant and that require us to make difficult, subjective or complex judgments, often because we need to estimate the effect of inherently uncertain matters. We base our estimates and judgments on historical experiences and various other factors that we believe to be appropriate under the circumstances. Actual results may differ from these estimates, and we might obtain different estimates if we used different assumptions or factors.
Leases
We determine if a contract contains a lease at inception. Our material operating leases consist of restaurant locations and office space. Our leases generally have remaining terms of 1-20 years and most include options to extend the leases for additional 5-year periods. Generally, the lease term is the minimum of the noncancelable period of the lease or the lease term inclusive of reasonably certain renewal periods up to a term of 20 years. If the estimate of our reasonably certain lease term was changed, our depreciation and rent expense could differ materially.
Operating lease assets and liabilities are recognized at time of lease inception. Operating lease liabilities represent the present value of lease payments not yet paid. We made the policy election to combine lease and non-lease components, we also consider fixed common area maintenance (“CAM”) part of our fixed future lease payments. Fixed CAM is also included in our operating lease liability. Operating lease assets represent our right to use an underlying asset and are based upon the operating lease liabilities adjusted for prepayments, initial direct costs, lease incentives, and impairment of operating lease assets. To determine the present value of lease payments not yet paid, we estimate incremental borrowing rates corresponding to the reasonably certain lease term. As we have no outstanding debt nor committed credit facilities, secured or otherwise, we estimate this rate based on prevailing financial market conditions, comparable company and credit analysis, and management judgment. If the estimate of our incremental borrowing rate was changed, our operating lease assets and liabilities could differ materially.
Chipotle Rewards
Eligible customers who enroll in the Chipotle Rewards loyalty program generally earn points for every dollar spent. After accumulating the required number of points, the customer may select a reward. Earned rewards generally expire one to two months after they are issued, and points generally expire if an account is inactive for a period of six months.
The estimation of the standalone selling price of points and other rewards issued to customers involves several assumptions, primarily the estimated value of product for which the reward is expected to be redeemed and the probability that the points or reward will expire. Our estimate of points and other rewards we expect to be redeemed is based on historical company specific data. These inputs are subject to change over time due to factors such as menu price increases, changes in point redemption options and changes in customer behavior. Increasing our estimated ultimate redemption rate for estimated future redemptions by 100 basis points would have resulted in a reduction of food and beverage revenue on our consolidated statement of income of approximately $0.4 million for the year ended December 31, 2021.
Gift Cards
We sell gift cards, which do not have expiration dates, and we do not deduct non-usage fees from outstanding gift card balances. Gift card balances are initially recorded as unearned revenue. We recognize revenue from gift cards when the gift card is redeemed by the customer. Historically, the majority of gift cards are redeemed within one year. In addition, a portion of gift cards are not expected to be redeemed and will be recognized as breakage over time in proportion to gift card redemptions (“gift card breakage rate”). The gift card breakage rate is based on company and program specific information, including historical redemption patterns, and expected remittance to government agencies under unclaimed property laws, if applicable. We evaluate our gift card breakage rate estimate annually, or more frequently as circumstances warrant, and apply that rate to gift card redemptions. Decreasing our gift card breakage rate by 50 basis points would have resulted in a reduction of food and beverage revenue on our consolidated statement of income of approximately $5.1 million for the year ended December 31, 2021.
Impairment of Long-Lived Assets
Long-lived assets are reviewed for impairment whenever events or changes in circumstances indicate that the carrying amount of an asset may not be recoverable. For the purpose of reviewing restaurant assets to be held and used for potential impairment, assets are grouped together at the market level, or in the case of a potential relocation or closure, at the restaurant level. We manage our restaurants as a group with significant common costs and promotional activities; as such, an individual restaurant’s cash flows are not generally independent of the cash flows of others in a market.
The fair value measurement for asset impairment is based on Level 3 inputs. We first compare the carrying value of the asset (or asset group, referred interchangeably throughout as asset) to the asset’s estimated future undiscounted cash flows. If the estimated undiscounted future cash flows are less than the carrying value of the asset, we determine if we have an impairment loss by comparing the carrying value of the asset to the asset's estimated fair value. The estimated fair value of the asset is generally determined using the income approach to measure the fair value, which is based on the present value of estimated future cash flows. Key inputs to the income approach for restaurant assets include the discount rate, projected revenue and expenses, and sublease income if we are closing the restaurant. In certain cases, management uses other market information, when available, to estimate the fair value of an asset. The impairment charges represent the excess of each asset’s carrying amount over its estimated fair value and are allocated among the long-lived asset or assets of the group.
Our estimates of future revenues and expenses are highly subjective judgments based on internal projections and knowledge of our operations, historical performance, and trends in sales and restaurant operating costs, and can be significantly impacted by changes in our business or economic conditions. The determination of asset fair value is also subject to significant judgment and utilizes valuation techniques including discounting estimated future cash flows and market-based analyses to determine fair value. If our estimates or underlying assumptions, including discount rate and sublease income change in the future, our operating results may be materially impacted.
Stock-based Compensation
We recognize compensation expense for equity awards over the requisite service period based on the award’s fair value. We use the Black-Scholes valuation model to determine the fair value of our stock-only stock appreciation rights (“SOSARs”), and we use the Monte Carlo simulation model to determine the fair value of stock awards that contain market conditions. Both of these models require assumptions to be made regarding our stock price volatility, the expected life of the award and expected dividend rates. The volatility and the expected life assumptions were based on our historical data. Similarly, the compensation expense of performance share awards is based in part on the estimated probability of achieving levels of performance associated with particular levels of payout for performance shares. We determine the probability of achievement of future levels of performance by comparing the relevant performance level with our internal estimates of future performance. Those estimates are based on a number of assumptions, including but not limited to growth in comparable restaurant sales and average restaurant level margin, and different assumptions may have resulted in different conclusions regarding the probability of achieving future levels of performance relevant to the payout levels for the awards. Had we arrived at different assumptions of stock price volatility or expected lives of our SOSARs, or if we changed our assumptions regarding the probability of achieving future levels of performance with respect to performance share awards, our stock-based compensation expense and results of operations may be materially different. As a result of changing our assumptions for the estimated payout of our various performance base awards during the year ended December 31, 2021 relative to these estimated payouts as of December 31, 2020, we incurred an additional $21.1 million of stock-based compensation expense during the year ended December 31, 2021.
Insurance Liability
We are self-insured for a significant portion of our employee health benefits programs. We carry significant retentions for risks and associated liabilities with respect to workers’ compensation, general liability, property and auto damage, employment practices liability, cyber liability and directors’ and officers’ liability. Predetermined loss limits have been arranged with third-party insurance companies to limit exposure to these claims. We record a liability that represents our estimated cost of claims incurred and unpaid as of the balance sheet date. Our estimated liability is not discounted and is based on a number of assumptions and factors, including historical trends, actuarial assumptions and economic conditions, and is closely monitored and adjusted when warranted by changing circumstances. If a greater amount of claims occurs compared to what we have estimated, or if medical costs increase beyond what we expected, our accrued liabilities might not be sufficient. Actual claims experience could also be more favorable than estimated. Unanticipated changes may produce materially different amounts of expense than that reported under these programs.
Reserves/Contingencies for Litigation and Other Matters
We are involved in various claims and legal actions that arise in the ordinary course of business. We record an accrual for legal contingencies when we determine that it is probable that we have incurred a liability and we can reasonably estimate the amount of the loss. Although we have recorded liabilities related to a number of legal actions, our estimates used to determine the amount of these liabilities may not be accurate, and there are other legal actions for which we have not recorded a liability. As a result, in the event legal actions for which we have not accrued a liability or for which our accrued liabilities are not accurate are resolved, such resolution may affect our operating results and cash flows.
Income Taxes
Our benefit/(provision) for income taxes, deferred tax assets and liabilities and any related valuation allowance requires the use of estimates based on our management’s interpretation and application of complex tax laws and accounting guidance. We are primarily subject to income taxes in the United States. We establish reserves for uncertain tax positions for material, known tax exposures relating to deductions, transactions and other matters involving some uncertainty as to the measurement and recognition of the item. We may adjust these reserves when our judgment changes as a result of the evaluation of new information not previously available and will be reflected in the period in which the new information is available, or due to the expiration of any applicable statute of limitations. While we believe that our reserves are adequate, issues raised by a tax authority may be resolved at an amount different than the related reserve and could materially increase or decrease our income tax provision in future periods.
ITEM 7A. QUANTITATIVE AND QUALITATIVE DISCLOSURE ABOUT MARKET RISK
Commodity Price Risks
We are exposed to commodity price risks. Many of the ingredients we use to prepare our food, as well as our packaging materials and utilities to run our restaurants, are ingredients or commodities that are affected by the price of other commodities, exchange rates, foreign demand, weather, seasonality, production, availability and other factors outside our control. We work closely with our suppliers and use a mix of forward pricing protocols under which we agree with our supplier on fixed prices for deliveries at some time in the future, fixed pricing protocols under which we agree on a fixed price with our supplier for the duration of that protocol, formula pricing protocols under which the prices we pay are based on a specified formula related to the prices of the goods, such as spot prices, and range forward protocols under which we agree on a price range for the duration of that protocol. Generally, our pricing protocols with suppliers can remain in effect for periods ranging from one to 24 months, depending on the outlook for prices of the particular ingredient. In some cases, we have minimum purchase obligations. We have tried to increase, where practical, the number of suppliers for our ingredients, which we believe can help mitigate pricing volatility, and we follow industry news, trade issues, exchange rates, foreign demand, weather, crises and other world events that may affect our ingredient prices. Increases in ingredient prices could adversely affect our results if we choose for competitive or other reasons not to increase menu prices at the same rate at which ingredient costs increase, or if menu price increases result in customer resistance. We also could experience shortages of key ingredients if our suppliers need to close or restrict operations due to the impact of the COVID-19 outbreak or, due to industry-wide shipping and freight delays.
Changing Interest Rates
We are exposed to interest rate risk through fluctuations of interest rates on our investments. As of December 31, 2021, we had $1.4 billion in cash and cash equivalents, current and long-term investments, and restricted cash, nearly all of which are interest bearing. Changes in interest rates affect the interest income we earn, and therefore impact our cash flows and results of operations.
Foreign Currency Exchange Risk
A portion of our operations consist of activities outside of the U.S. and we have currency risk on the transactions in other currencies and translation adjustments resulting from the conversion of our international financial results into the U.S. dollar. However, a substantial majority of our operations and investment activities are transacted in the U.S., and therefore our foreign currency risk is not material at this date.
ITEM 8. FINANCIAL STATEMENTS AND SUPPLEMENTARY DATA
Report of Independent Registered Public Accounting Firm
To the Shareholders and the Board of Directors of Chipotle Mexican Grill, Inc.
Opinion on the Financial Statements
We have audited the accompanying consolidated balance sheets of Chipotle Mexican Grill, Inc. (the Company) as of December 31, 2021 and 2020, the related consolidated statements of income, comprehensive income, shareholders' equity and cash flows for each of the three years in the period ended December 31, 2021, and the related notes (collectively referred to as the “consolidated financial statements”). In our opinion, the consolidated financial statements present fairly, in all material respects, the financial position of the Company at December 31, 2021 and 2020, and the results of its operations and its cash flows for each of the three years in the period ended December 31, 2021, in conformity with U.S. generally accepted accounting principles.
We also have audited, in accordance with the standards of the Public Company Accounting Oversight Board (United States) (PCAOB), the Company's internal control over financial reporting as of December 31, 2021, based on criteria established in Internal Control-Integrated Framework issued by the Committee of Sponsoring Organizations of the Treadway Commission (2013 framework), and our report dated February 11, 2022 expressed an unqualified opinion thereon.
Basis for Opinion
These financial statements are the responsibility of the Company's management. Our responsibility is to express an opinion on the Company’s financial statements based on our audits. We are a public accounting firm registered with the PCAOB and are required to be independent with respect to the Company in accordance with the U.S. federal securities laws and the applicable rules and regulations of the Securities and Exchange Commission and the PCAOB.
We conducted our audits in accordance with the standards of the PCAOB. Those standards require that we plan and perform the audit to obtain reasonable assurance about whether the financial statements are free of material misstatement, whether due to error or fraud. Our audits included performing procedures to assess the risks of material misstatement of the financial statements, whether due to error or fraud, and performing procedures that respond to those risks. Such procedures included examining, on a test basis, evidence regarding the amounts and disclosures in the financial statements. Our audits also included evaluating the accounting principles used and significant estimates made by management, as well as evaluating the overall presentation of the financial statements. We believe that our audits provide a reasonable basis for our opinion.
Critical Audit Matter
The critical audit matter communicated below is a matter arising from the current period audit of the financial statements that was communicated or required to be communicated to the audit committee and that: (1) relates to accounts or disclosures that are material to the financial statements and (2) involved our especially challenging, subjective or complex judgments. The communication of the critical audit matter does not alter in any way our opinion on the consolidated financial statements, taken as a whole, and we are not, by communicating the critical audit matter below, providing a separate opinion on the critical audit matter or on the account or disclosure to which it relates.
| | |
| | |
| | Valuation and accounting for stock-based compensation |
Description of the Matter | | The Company incurred $178.7 million in stock-based compensation expense during the year ended December 31, 2021. Approximately 229,000 of the Company’s vested and non-vested stock awards were subject to service and performance conditions during the year ended December 31, 2021. As described in Notes 1 and 8 of the consolidated financial statements, the Company estimates the grant date fair value of the stock awards and expenses the fair value of stock awards subject to service conditions over the respective vesting period. Stock-based compensation expense of stock awards subject to performance conditions is based on the estimated probability of achieving levels of performance associated with particular levels of payout. Additionally, at each reporting period, the Company evaluates the probable outcome of the performance conditions including consideration of significant assumptions and as applicable, recognizes the cumulative effect of the change in estimate in the period of the change. Auditing the grant date fair value and the appropriateness of the accounting treatment of the Company’s stock awards was complex and judgmental. In particular, the fair value estimate for stock awards subject to performance conditions is sensitive to significant assumptions including management’s internal estimates of the Company’s future performance. |
How We Addressed the Matter in Our Audit | | We obtained an understanding, evaluated the design, and tested the operating effectiveness of management’s controls over stock-based compensation. We tested controls over management’s review of the valuation model methodology and assumptions used with regards to the service and performance conditions. We also tested management's controls to validate that data used in the valuation model was complete and accurate. Our substantive audit procedures included, among others, testing the significant assumptions underlying the performance conditions (e.g., certain targets related to growth in comparable restaurant sales and average restaurant margin) and testing the completeness and accuracy of the underlying data. We evaluated management’s significant assumptions by comparing the assumptions to current market and economic trends, historical results of the Company’s business, and to other relevant factors. We additionally performed a sensitivity analysis of the significant assumptions to evaluate the change in the fair value of the stock awards subject to performance conditions resulting from changes in the assumptions. We also evaluated the adequacy of the Company’s stock-based compensation disclosures included in Notes 1 and 8 of the consolidated financial statements in relation to these matters. |
/s/ Ernst & Young LLP
We have served as the Company’s auditor since 1997.
Irvine, California
February 11, 2022
CHIPOTLE MEXICAN GRILL, INC.
CONSOLIDATED BALANCE SHEETS
(in thousands, except per share data)
| | | | | |
| | | | | |
| December 31, |
| 2021 | | 2020 |
Assets | | | | | |
Current assets: | | | | | |
Cash and cash equivalents | $ | 815,374 | | $ | 607,987 |
Accounts receivable, net | | 99,599 | | | 104,500 |
Inventory | | 32,826 | | | 26,445 |
Prepaid expenses and other current assets | | 78,756 | | | 54,906 |
Income tax receivable | | 94,064 | | | 282,783 |
Investments | | 260,945 | | | 343,616 |
Total current assets | | 1,381,564 | | | 1,420,237 |
Leasehold improvements, property and equipment, net | | 1,769,278 | | | 1,584,311 |
Long-term investments | | 274,311 | | | 102,328 |
Restricted cash | | 30,856 | | | 27,849 |
Operating lease assets | | 3,118,294 | | | 2,767,185 |
Other assets | | 56,716 | | | 59,047 |
Goodwill | | 21,939 | | | 21,939 |
Total assets | $ | 6,652,958 | | $ | 5,982,896 |
Liabilities and shareholders' equity | | | | | |
Current liabilities: | | | | | |
Accounts payable | $ | 163,161 | | $ | 121,990 |
Accrued payroll and benefits | | 162,405 | | | 203,054 |
Accrued liabilities | | 173,052 | | | 164,649 |
Unearned revenue | | 156,351 | | | 127,750 |
Current operating lease liabilities | | 218,713 | | | 204,756 |
Total current liabilities | | 873,682 | | | 822,199 |
Commitments and contingencies (Note 12) | | | | | |
Long-term operating lease liabilities | | 3,301,601 | | | 2,952,296 |
Deferred income tax liabilities | | 141,765 | | | 149,422 |
Other liabilities | | 38,536 | | | 38,844 |
Total liabilities | | 4,355,584 | | | 3,962,761 |
Shareholders' equity: | | | | | |
Preferred stock, $0.01 par value, 600,000 shares authorized, no shares issued as of December 31, 2021 and 2020, respectively | | - | | | - |
Common stock, $0.01 par value, 230,000 shares authorized, 37,132 and 36,704 shares issued as of December 31, 2021 and 2020, respectively | | 371 | | | 367 |
Additional paid-in capital | | 1,729,312 | | | 1,549,909 |
Treasury stock, at cost, 9,052 and 8,703 common shares as of December 31, 2021 and 2020, respectively | | (3,356,102) | | | (2,802,075) |
Accumulated other comprehensive loss | | (5,354) | | | (4,229) |
Retained earnings | | 3,929,147 | | | 3,276,163 |
Total shareholders' equity | | 2,297,374 | | | 2,020,135 |
Total liabilities and shareholders' equity | $ | 6,652,958 | | $ | 5,982,896 |
See accompanying notes to consolidated financial statements.
CHIPOTLE MEXICAN GRILL, INC.
CONSOLIDATED STATEMENTS OF INCOME
(in thousands, except per share data)
| | | | | | | | |
| | | | | | | | |
| Year ended December 31, |
| 2021 | | 2020 | | 2019 |
Food and beverage revenue | $ | 7,457,169 | | $ | 5,920,545 | | $ | 5,561,036 |
Delivery service revenue | | 89,892 | | | 64,089 | | | 25,333 |
Total revenue | | 7,547,061 | | | 5,984,634 | | | 5,586,369 |
Restaurant operating costs (exclusive of depreciation and amortization shown separately below): | | | | | | | | |
Food, beverage and packaging | | 2,308,631 | | | 1,932,766 | | | 1,847,916 |
Labor | | 1,917,761 | | | 1,593,013 | | | 1,472,060 |
Occupancy | | 416,606 | | | 387,762 | | | 363,072 |
Other operating costs | | 1,197,054 | | | 1,030,012 | | | 760,831 |
General and administrative expenses | | 606,854 | | | 466,291 | | | 451,552 |
Depreciation and amortization | | 254,657 | | | 238,534 | | | 212,778 |
Pre-opening costs | | 21,264 | | | 15,515 | | | 11,108 |
Impairment, closure costs, and asset disposals | | 19,291 | | | 30,577 | | | 23,094 |
Total operating expenses | | 6,742,118 | | | 5,694,470 | | | 5,142,411 |
Income from operations | | 804,943 | | | 290,164 | | | 443,958 |
Interest and other income, net | | 7,820 | | | 3,617 | | | 14,327 |
Income before income taxes | | 812,763 | | | 293,781 | | | 458,285 |
Benefit/(Provision) for income taxes | | (159,779) | | | 61,985 | | | (108,127) |
Net income | $ | 652,984 | | $ | 355,766 | | $ | 350,158 |
Earnings per share: | | | | | | | | |
Basic | $ | 23.21 | | $ | 12.74 | | $ | 12.62 |
Diluted | $ | 22.90 | | $ | 12.52 | | $ | 12.38 |
Weighted-average common shares outstanding: | | | | | | | | |
Basic | | 28,132 | | | 27,917 | | | 27,740 |
Diluted | | 28,511 | | | 28,416 | | | 28,295 |
CONSOLIDATED STATEMENTS OF COMPREHENSIVE INCOME
(in thousands)
| | | | | | | | |
| | | | | | | | |
| Year ended December 31, |
| 2021 | | 2020 | | 2019 |
Net income | $ | 652,984 | | $ | 355,766 | | $ | 350,158 |
Other comprehensive income (loss), net of income taxes: | | | | | | | | |
Foreign currency translation adjustments | | (1,125) | | | 1,134 | | | 726 |
Unrealized gain on available-for-sale securities, net of income taxes | | - | | | - | | | 147 |
Other comprehensive income (loss), net of income taxes | | (1,125) | | | 1,134 | | | 873 |
Comprehensive income | $ | 651,859 | | $ | 356,900 | | $ | 351,031 |
See accompanying notes to consolidated financial statements.
CHIPOTLE MEXICAN GRILL, INC.
CONSOLIDATED STATEMENTS OF SHAREHOLDERS’ EQUITY
(in thousands)
| | | | | | | | | | | | | | | | | | | | | | | | |
| Common Stock | | | | Treasury Stock | | | | | | | | | | | |
| Shares | | Amount | | Additional
Paid-In
Capital | | Shares | | Amount | | Retained
Earnings | | Available-for-Sale Securities | | Accumulated Other Comprehensive Loss | | Total |
Balance, December 31, 2018 | 35,973 | | $ | 360 | | $ | 1,374,154 | | 8,276 | | $ | (2,500,556) | | $ | 2,573,617 | | $ | (147) | | $ | (6,089) | | $ | 1,441,339 |
Adoption of ASU No. 2016-02, Leases (Topic 842) | - | | | - | | | - | | - | | | - | | | (2,327) | | | - | | | - | | | (2,327) |
Stock-based compensation | - | | | - | | | 92,062 | | - | | | - | | | - | | | - | | | - | | | 92,062 |
Stock plan transactions and other | 350 | | | 3 | | | (519) | | - | | | - | | | - | | | - | | | - | | | (516) |
Acquisition of treasury stock | - | | | - | | | - | | 292 | | | (198,563) | | | - | | | - | | | - | | | (198,563) |
Net income | - | | | - | | | - | | - | | | - | | | 350,158 | | | - | | | - | | | 350,158 |
Other comprehensive income (loss), net of income taxes | - | | | - | | | - | | - | | | - | | | - | | | 147 | | | 726 | | | 873 |
Balance, December 31, 2019 | 36,323 | | $ | 363 | | $ | 1,465,697 | | 8,568 | | $ | (2,699,119) | | $ | 2,921,448 | | $ | - | | $ | (5,363) | | $ | 1,683,026 |
Adoption of ASU No. 2016-13, Financial Instrument-Credit Losses (Topic 326) | - | | | - | | | - | | - | | | - | | | (1,051) | | | - | | | - | | | (1,051) |
Stock-based compensation | - | | | - | | | 84,463 | | - | | | - | | | - | | | - | | | - | | | 84,463 |
Stock plan transactions and other | 381 | | | 4 | | | (251) | | - | | | - | | | - | | | - | | | - | | | (247) |
Acquisition of treasury stock | - | | | - | | | - | | 135 | | | (102,956) | | | - | | | - | | | - | | | (102,956) |
Net income | - | | | - | | | - | | - | | | - | | | 355,766 | | | - | | | - | | | 355,766 |
Other comprehensive income (loss), net of income taxes | - | | | - | | | - | | - | | | - | | | - | | | - | | | 1,134 | | | 1,134 |
Balance, December 31, 2020 | 36,704 | | $ | 367 | | $ | 1,549,909 | | 8,703 | | $ | (2,802,075) | | $ | 3,276,163 | | $ | - | | $ | (4,229) | | $ | 2,020,135 |
Stock-based compensation | - | | | - | | | 178,703 | | - | | | - | | | - | | | - | | | - | | | 178,703 |
Stock plan transactions and other | 428 | | | 4 | | | 700 | | - | | | - | | | - | | | - | | | - | | | 704 |
Acquisition of treasury stock | - | | | - | | | - | | 349 | | | (554,027) | | | - | | | - | | | - | | | (554,027) |
Net income | - | | | - | | | - | | - | | | - | | | 652,984 | | | - | | | - | | | 652,984 |
Other comprehensive income (loss), net of income taxes | - | | | - | | | - | | - | | | - | | | - | | | - | | | (1,125) | | | (1,125) |
Balance, December 31, 2021 | 37,132 | | $ | 371 | | $ | 1,729,312 | | 9,052 | | $ | (3,356,102) | | $ | 3,929,147 | | $ | - | | $ | (5,354) | | $ | 2,297,374 |
See accompanying notes to consolidated financial statements.
CHIPOTLE MEXICAN GRILL, INC.
CONSOLIDATED STATEMENTS OF CASH FLOWS
(in thousands)
| | | | | | | | |
| | | | | | | | |
| Year ended December 31, |
| 2021 | | 2020 | | 2019 |
Operating activities | | | | | | | | |
Net income | $ | 652,984 | | $ | 355,766 | | $ | 350,158 |
Adjustments to reconcile net income to net cash provided by operating activities: | | | | | | | | |
Depreciation and amortization | | 254,657 | | | 238,534 | | | 212,778 |
Deferred income tax provision | | (12,357) | | | 108,350 | | | 29,962 |
Impairment, closure costs, and asset disposals | | 17,086 | | | 28,874 | | | 15,402 |
Provision for credit losses | | 493 | | | 164 | | | 33 |
Stock-based compensation expense | | 176,392 | | | 82,626 | | | 91,396 |
Other | | (4,599) | | | 3,643 | | | (10,592) |
Changes in operating assets and liabilities: | | | | | | | | |
Accounts receivable | | (1,687) | | | 3,010 | | | (2,630) |
Inventory | | (6,392) | | | (394) | | | (4,530) |
Prepaid expenses and other current assets | | (26,826) | | | (11,442) | | | (23,066) |
Operating lease assets | | 223,837 | | | 184,538 | | | 163,952 |
Other assets | | 3,993 | | | (26,577) | | | 2,818 |
Accounts payable | | 21,440 | | | (3,859) | | | (973) |
Accrued payroll and benefits | | (44,555) | | | 76,683 | | | 11,759 |
Accrued liabilities | | 10,997 | | | 5,596 | | | 36,543 |
Unearned revenue | | 34,387 | | | 36,958 | | | 30,400 |
Income tax payable/receivable | | 193,379 | | | (255,251) | | | (32,083) |
Operating lease liabilities | | (207,164) | | | (165,154) | | | (151,557) |
Other long-term liabilities | | (3,984) | | | 1,782 | | | 1,862 |
Net cash provided by operating activities | | 1,282,081 | | | 663,847 | | | 721,632 |
Investing activities | | | | | | | | |
Purchases of leasehold improvements, property and equipment | | (442,475) | | | (373,352) | | | (333,912) |
Purchases of investments | | (429,350) | | | (468,418) | | | (448,754) |
Maturities of investments | | 345,748 | | | 419,078 | | | 476,723 |
Proceeds from sale of equipment | | 4,035 | | | - | | | 13,969 |
Acquisitions of equity method investments | | - | | | (10,025) | | | - |
Net cash used in investing activities | | (522,042) | | | (432,717) | | | (291,974) |
Financing activities | | | | | | | | |
Acquisition of treasury stock | | (466,462) | | | (54,401) | | | (190,617) |
Tax withholding on stock-based compensation awards | | (79,870) | | | (48,555) | | | (10,420) |
Other financing activities | | (2,274) | | | (1,895) | | | (698) |
Net cash used in financing activities | | (548,606) | | | (104,851) | | | (201,735) |
Effect of exchange rate changes on cash, cash equivalents and restricted cash | | (1,039) | | | 1,076 | | | 406 |
Net change in cash, cash equivalents, and restricted cash | | 210,394 | | | 127,355 | | | 228,329 |
Cash, cash equivalents, and restricted cash at beginning of period | | 635,836 | | | 508,481 | | | 280,152 |
Cash, cash equivalents, and restricted cash at end of period | $ | 846,230 | | $ | 635,836 | | $ | 508,481 |
Supplemental disclosures of cash flow information | | | | | | | | |
Income taxes paid (refunded) | $ | (17,831) | | $ | 85,010 | | $ | 109,571 |
Purchases of leasehold improvements, property, and equipment accrued in accounts payable and accrued liabilities | $ | 63,802 | | $ | 46,975 | | $ | 36,886 |
Acquisition of treasury stock accrued in accounts payable and accrued liabilities | $ | 7,695 | | $ | - | | $ | - |
See accompanying notes to consolidated financial statements.
CHIPOTLE MEXICAN GRILL, INC.
NOTES TO CONSOLIDATED FINANCIAL STATEMENTS
(dollar and share amounts in thousands, unless otherwise specified)
1. Description of Business and Summary of Significant Accounting Policies
In this annual report on Form 10-K, Chipotle Mexican Grill, Inc., a Delaware corporation, together with its subsidiaries, is collectively referred to as “Chipotle,” “we,” “us,” or “our.”
We develop and operate restaurants that serve a relevant menu of burritos, burrito bowls, quesadillas, tacos, and salads, made using fresh, high-quality ingredients. As of December 31, 2021, we operated 2,962 Chipotle restaurants including 2,918 within the United States as well as 44 international Chipotle restaurants. We are also an investor in a consolidated entity that owns and operates four Pizzeria Locale restaurants, a fast-casual pizza concept. We manage our U.S. operations based on eight regions and have aggregated our operations to one reportable segment.
Principles of Consolidation and Basis of Presentation
Our consolidated financial statements include our accounts and our wholly and majority owned subsidiaries after elimination of all intercompany accounts and transactions. Certain prior-year amounts have been reclassified to conform to the current year presentation.
Management Estimates
The preparation of financial statements in conformity with U.S. generally accepted accounting principles requires management to make estimates and assumptions that affect the reported amounts of assets and liabilities and the disclosure of contingent assets and liabilities as of the date of the financial statements, as well as the reported amounts of revenue and expenses during the reporting period. Actual results could differ from those estimates under different assumptions or conditions.
Cash and Cash Equivalents
We consider highly liquid investment instruments purchased with an initial maturity of three months or less to be cash equivalents. We maintain cash and cash equivalent balances that exceed federally-insured limits with a number of financial institutions.
Restricted Cash
We maintain certain cash balances restricted as to withdrawal or use. Restricted cash assets are primarily insurance-related restricted trust assets.
Accounts Receivable
Accounts receivable primarily consists of receivables from third party gift card distributors, delivery receivables, insurance liabilities covered by third-party insurance carriers and vendor rebates.
Allowance for Credit Losses
We closely monitor accounts receivable and held to maturity investment balances and estimate the allowance for credit losses. Our estimate is based on historical collection experience, external market data and other factors, including those related to current market conditions and events.
Inventory
Inventory, consisting principally of food, beverages, and supplies, is valued at the lower of first-in, first-out cost or net realizable value.
Investments
Investments classified as trading securities are carried at fair value with any unrealized gain or loss being recorded in the consolidated statements of income. Investments classified as available-for-sale are carried at fair value with unrealized gains and losses, net of tax, included as a component of other comprehensive income (loss), net of income taxes on the consolidated statements of comprehensive income. Held-to-maturity securities are carried at amortized cost. Non-marketable equity investments are measured at cost, less impairments, if any, plus or minus changes resulting from observable price changes in orderly transactions for the identical or similar investment of the same issuer.
Impairment charges on investments are recognized in interest and other income, net on the consolidated statements of income when management believes the decline in the fair value of the investment is other-than-temporary.
Fair Value Measurements
Fair value is the price we would receive to sell an asset or pay to transfer a liability (exit price) in an orderly transaction between market participants. For assets and liabilities recorded or disclosed at fair value, we determine fair value based on the following:
Level 1: Quoted prices in active markets for identical assets or liabilities that the entity has the ability to access.
Level 2: Observable inputs other than prices included in Level 1, such as quoted prices for similar assets and liabilities in active markets; quoted prices for identical or similar assets and liabilities in markets that are not active; or other inputs that are observable or can be corroborated with observable market data.
Level 3: Unobservable inputs for the asset or liability. This includes certain pricing models, discounted cash flow methodologies and similar techniques that use significant unobservable inputs.
Foreign Currency Translation
Our international operations use the local currency as the functional currency. Assets and liabilities are translated at exchange rates in effect as of the balance sheet date. Income and expense accounts are translated monthly using average monthly exchange rates. Resulting translation adjustments are recorded as a separate component of other comprehensive income (loss), net of income taxes on the consolidated statement of comprehensive income.
Leasehold Improvements, Property and Equipment
Leasehold improvements, property and equipment are recorded at cost. Internal costs directly associated with the acquisition, development and construction of a restaurant are capitalized. During the years ended December 31, 2021, 2020 and 2019, we capitalized $10,870, $9,268, and $6,735 of internal costs, respectively. Expenditures for refurbishments and improvements that significantly add to the productivity capacity or extend the useful life are capitalized, while expenditures for maintenance and repairs are expensed as incurred. Depreciation is calculated using the straight-line method over the estimated useful lives of the assets. Leasehold improvements are amortized over the shorter of the lease term, which generally includes option periods that are reasonably certain, or the estimated useful lives of the assets. Upon retirement or disposal of assets, the accounts are relieved of cost and accumulated depreciation and any related gain or loss is reflected in impairment, closure costs, and asset disposals in the consolidated statements of income. Assets to be disposed of are reported at the lower of their carrying amount or fair value less estimated costs to sell.
At least annually, or when impairment indicators are present, we evaluate, and adjust when necessary, the estimated useful lives of leasehold improvements, property and equipment. The changes in estimated useful lives did not have a material impact on depreciation in any period. The estimated useful lives are:
| |
| |
Leasehold improvements and buildings | 3-20 years |
Furniture and fixtures | 4-7 years |
Equipment | 3-10 years |
Leases
The majority of our operating leases consist of restaurant locations and office space. We determine if a contract contains a lease at inception. Our leases generally have remaining terms of 1-20 years and most include options to extend the leases for additional 5-year periods. Generally, the lease term is the minimum of the noncancelable period of the lease or the lease term inclusive of reasonably certain renewal periods up to a term of 20 years.
We recognize an operating lease asset and operating lease liability for each lease with a contractual term greater than 12 months at the time of lease inception. We do not record leases with an initial term of 12 months or less on our consolidated balance sheet but continue to record rent expense on a straight-line basis over the lease term.
Operating lease assets and liabilities are recognized at the lease commencement date, which is the date we control the use of the property. Operating lease liabilities represent the present value of lease payments not yet paid. We made the policy election to combine lease and non-lease components. We consider fixed CAM part of our fixed future lease payments; therefore, fixed CAM is also included in our lease liability. To determine the present value of lease payments not yet paid, we estimate incremental borrowing rates corresponding to the lease term including reasonably certain renewal periods. As we have no outstanding debt nor committed credit facilities, secured or otherwise, we estimate this rate based on prevailing financial market conditions, comparable company and credit analysis, and management judgment.
Total lease costs recorded primarily as occupancy costs include fixed operating lease costs, variable lease costs and short-term lease costs. Most of our real estate leases require we pay certain expenses, such as CAM costs, real estate taxes and insurance, of which the fixed portion is included in operating lease costs. We recognize operating lease costs on a straight-line basis over the lease term. In addition to the above costs, variable lease costs also include amounts based on a percentage of gross sales in excess of specified levels and are recognized when probable and are not included in determining the present value of our operating lease liability.
Operating lease assets represent our right to use an underlying asset and are based upon the operating lease liabilities adjusted for prepayments, initial direct costs, lease incentives, and impairment of operating lease assets. For operating leases, operating lease assets are reduced over the lease term by the recognized straight-line lease expense less the amount of accretion of the lease liability. Additionally, tenant incentives used to fund leasehold improvements are generally recognized when earned and reduce our right-of-use asset related to the lease. These are amortized through the operating lease asset as reductions of expense over the lease term.
Our lease agreements do not contain any material residual value guarantees or material restrictive covenants. We have not entered into any leases with related parties.
Goodwill
Goodwill is not subject to amortization, but instead is tested for impairment at least annually, or when impairment indicators are present, and we are required to record any necessary impairment adjustments. Impairment is measured as the excess of the carrying value over the fair value of the goodwill. No impairment charges were recognized on goodwill for the years ended December 31, 2021, 2020, and 2019.
Other Assets
Other assets consist primarily of a rabbi trust as described further in Note 9. “Employee Benefit Plans,” software as a service implementation costs where the service period is greater than one year, an equity method investment described further in Note 4. “Fair Value of Financial Instruments” and transferable liquor licenses.
Insurance Liability
We are self-insured for a significant portion of our employee health benefits programs, and carry significant retentions for risks and associated liabilities with respect to workers’ compensation, general liability, property and auto damage, employment practices liability, cyber liability and directors’ and officers’ liability. Predetermined loss limits have been arranged with third party insurance companies to limit exposure to these claims. We record a liability that represents our estimated cost of claims incurred and unpaid as of the balance sheet date. Our estimated liability is not discounted and is based on a number of assumptions and factors, including historical trends, actuarial assumptions and economic conditions, and is closely monitored and adjusted when warranted by changing circumstances.
Reserves/Contingencies for Litigation and Other Matters
We are involved in various claims and legal actions that arise in the ordinary course of business. We record an accrual for legal contingencies when we determine that it is probable that we have incurred a liability and we can reasonably estimate the amount of the loss.
Income Taxes
We compute income taxes using the asset and liability method, under which deferred income tax assets and liabilities are recognized based on the differences between the financial reporting bases and the respective tax bases of assets and liabilities. Deferred tax assets and liabilities are measured using enacted tax rates expected to apply to taxable income in the years in which we expect the temporary differences to reverse. Any effects of changes in income tax rates or tax laws are included in the provision for income taxes in the period that includes the enactment date.
We routinely assess the realizability of our deferred tax assets by jurisdiction and may record a valuation allowance if, based on all available positive and negative evidence, we determine that some portion of the deferred tax assets may not be realized prior to expiration. If we determine that we may be able to realize our deferred tax assets in the future in excess of their net recorded amount, we would make an adjustment to the deferred tax asset valuation allowance, which would reduce the provision for income taxes during the period in which the determination was made that the deferred tax asset can be realized.
We evaluate our tax filing positions and recognize a tax benefit from an uncertain tax position only if it is more likely than not that based on its technical merits the tax position will be sustained upon examination by the relevant taxing authorities, including resolutions of any related appeals or litigation processes. The tax benefits recognized in the financial statements from such a position are measured based on the largest tax benefit that has a greater than 50% likelihood of being realized upon settlement with a taxing authority. For uncertain tax positions that do not meet this threshold, we record a related tax reserve in the period in which it arises. We adjust our unrecognized tax benefit liability and provision for income taxes in the period in which the uncertain tax position is effectively settled, the statute of limitations expires for the relevant taxing authority to examine the tax position or when new information becomes available that requires a change in recognition and/or measurement of the liability.
We recognize interest to be paid on an underpayment of income taxes in interest expense and any related statutory penalties in the provision for income taxes in our consolidated statements of income. Accrued interest and penalties are included within the related tax reserve on our consolidated balance sheets.
Revenue Recognition
We generally recognize revenue, net of discounts and incentives, when payment is tendered at the point of sale. We report revenue net of sales-related taxes collected from customers and remitted to governmental taxing authorities. Food and beverage revenue primarily relates to the sale of food and beverages. Delivery service revenue is comprised of delivery and related service fees charged to customers on sales made through Chipotle’s app and website.
Delivery
We offer our customers delivery in almost all of our geographic regions. Delivery services are fulfilled by third-party service providers. In some cases, we make delivery sales through our website Chipotle.com or the Chipotle App (“White Label Sales”). In other cases, we make delivery sales through a non-Chipotle owned channel, such as the delivery partner’s website or mobile app (“Marketplace Sales”). With respect to White Label Sales, we control the delivery services and generally recognize revenue, including delivery fees, when the delivery partner transfers food to the customer. For these sales, we receive payment directly from the customer at the time of sale. With respect to Marketplace Sales, we generally recognize revenue, excluding delivery fees collected by the delivery partner, when control of the food is transferred to the delivery partner. We receive payment from the delivery partner subsequent to the transfer of food and the payment terms are short-term in nature.
Gift Cards
We sell gift cards, which do not have expiration dates and we do not deduct non-usage fees from outstanding gift card balances. Gift card balances are initially recorded as unearned revenue. We recognize revenue from gift cards when the gift card is redeemed by the customer. Historically, the majority of gift cards are redeemed within one year. In addition, a portion of gift cards are not expected to be redeemed and will be recognized as breakage over time in proportion to gift card redemptions (“gift card breakage rate”). The gift card breakage rate is based on company and program specific information, including historical redemption patterns, and expected remittance to government agencies under unclaimed property laws, if applicable. We evaluate our gift card breakage rate estimate annually, or more frequently as circumstances warrant, and apply that rate to gift card redemptions. Gift card liability balances are typically highest at the end of each calendar year following increased gift card sales during the holiday season; accordingly, revenue recognized from gift card liability balances is highest in the first quarter of each calendar year.
Chipotle Rewards
We have a loyalty program called Chipotle Rewards. Eligible customers who enroll in the program generally earn points for every dollar spent. In June 2021, we enhanced Chipotle Rewards and introduced a new redemption feature we call the “Rewards Exchange” that provides loyalty members multiple redemption options. Previously, Chipotle Rewards points were automatically redeemed for a free entrée when the customer obtained the required number of points. The change in the Chipotle Rewards program did not have a material impact on our consolidated financial statements.
We may also periodically offer promotions, which typically provide the customer with the opportunity to earn bonus points or other rewards. Earned rewards generally expire one to two months after they are issued, and points generally expire if an account is inactive for a period of six months.
We defer revenue associated with the estimated selling price of points or rewards earned by customers as each point or reward is earned, net of points or rewards we do not expect to be redeemed. The estimated selling price of each point or reward earned is based on the estimated value of product for which the reward is expected to be redeemed. Our estimate of points and rewards we expect to be redeemed is based on historical and other company specific data. The costs associated with rewards redeemed are primarily included in food, beverage, and packaging expense on our consolidated statements of income.
We evaluate Chipotle Rewards point breakage annually, or more frequently as circumstances warrant. We completed our most recent breakage assessment as of October 31, 2021, which resulted in incremental revenue recognized of $10,831 during the three months ended December 31, 2021. Revenue recognized was primarily the result of a change in our ultimate redemption rate estimate as program data indicated a lower redemption trend than originally estimated.
We recognize loyalty revenue within food and beverage revenue on the consolidated statements of income when a customer redeems an earned reward. Deferred revenue associated with Chipotle Rewards is included in unearned revenue on our consolidated balance sheets.
Advertising, Marketing and Promotional Costs
Advertising, marketing and promotional costs are expensed as incurred and totaled $222,091, $222,820 and $168,881 for the years ended December 31, 2021, 2020 and 2019, respectively. Advertising, marketing and promotional costs include costs related to free food which a customer does not need to make a purchase to earn. These costs are included in other operating costs on the consolidated statements of income.
Stock-Based Compensation
We issue shares as part of employee compensation pursuant to the Amended and Restated Chipotle Mexican Grill, Inc. 2011 Stock Incentive Plan (the “2011 Incentive Plan”). Stock-only stock appreciation rights, or “SOSARs”, and stock awards generally vest equally over two and three years and expire after seven years. Stock-based compensation expense is generally recognized on a straight-line basis for each separate vesting portion. Compensation expense related to employees eligible to retire and retain full rights to the awards is recognized over 12 months which coincides with the service period required to earn the full award. We estimate forfeitures based on historical data when determining the amount of stock-based compensation costs to be recognized in each period. We have also granted stock awards with performance vesting conditions and/or market vesting conditions. Stock awards with performance or market vesting conditions generally vest based on our achievement versus stated targets or criteria over a three-year performance and service period. Compensation expense on stock awards subject to performance conditions, which is based on the quantity of awards we have determined are probable of vesting, is recognized over the longer of the estimated performance goal attainment period or time vesting period. Compensation expense is recognized ratably for awards subject to market conditions regardless of whether the market condition is satisfied, provided that the requisite service has been provided. Some stock-based compensation awards are made to employees involved in our new restaurant development activities, and expense for these awards is recognized as capitalized development and included in leasehold improvements, property and equipment, net, on the consolidated balance sheets.
Restaurant Pre-Opening Costs
Pre-opening costs, including rent, wages, benefits and travel for training and opening teams, food and other restaurant operating costs, are expensed as incurred prior to a restaurant opening for business, and are included in operating expenses on the consolidated statements of income.
Impairment of Long-Lived Assets
Long-lived assets are reviewed for impairment whenever events or changes in circumstances indicate that the carrying amount of an asset may not be recoverable. For the purpose of reviewing restaurant assets to be held and used for potential impairment, assets are grouped together at the market level, or in the case of a potential relocation or closure, at the restaurant level. We manage our restaurants as a group with significant common costs and promotional activities; as such, an individual restaurant’s cash flows are not generally independent of the cash flows of others in a market.
The fair value measurement for asset impairment is based on Level 3 inputs. See “Fair Value Measurements” above for a description of level inputs. We first compare the carrying value of the asset (or asset group, referred interchangeably throughout as asset) to the asset’s estimated future undiscounted cash flows. If the estimated undiscounted future cash flows are less than the carrying value of the asset, we determine if we have an impairment loss by comparing the carrying value of the asset to the asset's estimated fair value. The estimated fair value of the asset is generally determined using the income approach to measure the fair value, which is based on the present value of estimated future cash flows. Key inputs to the income approach for restaurant assets include the discount rate, projected restaurant revenues and expenses, and sublease income if we are closing the restaurant. In certain cases, management uses other market information, when available, to estimate the fair value of an asset. The impairment charges represent the excess of each asset’s carrying amount over its estimated fair value and are allocated among the long-lived asset or assets of the group.
Earnings per Share
Basic earnings per share is calculated by dividing income available to common shareholders by the weighted-average number of shares of common stock outstanding during each period. Diluted earnings per share (“diluted EPS”) is calculated using income available to common shareholders divided by diluted weighted-average shares of common stock outstanding during each period. Potentially dilutive securities include shares of common stock underlying SOSARs and non-vested stock awards (collectively “stock awards”). Diluted EPS considers the impact of potentially dilutive securities except in periods in which there is a loss because the inclusion of the potential common shares would have an anti-dilutive effect. Stock awards are excluded from the calculation of diluted EPS in the event they are subject to performance conditions or are antidilutive.
Recently Issued Accounting Standards
Recently Issued Accounting Standards
In November 2021, the Financial Accounting Standards Board (the “FASB”) issued ASU No. 2021-10, “Disclosures by Business Entities about Government Assistance.” The ASU codifies new requirements to disclose information about the nature of certain government assistance received, the accounting policy used to account for the transactions, the location in the financial statements where such transactions were recorded and significant terms and conditions associated with such transactions. The guidance is effective for annual periods beginning after December 15, 2021. We do not expect the adoption of ASU No. 2021-10 to have a material impact to our consolidated financial statements.
In March 2020, the FASB issued ASU No. 2020-04, “Reference Rate Reform (Topic 848): Facilitation of the Effects of Reference Rate Reform on Financial Reporting.” The pronouncement provides temporary optional expedients and exceptions to the current guidance on contract modifications and hedge accounting to ease the financial reporting burden related to the expected market transition from the London Interbank Offered Rate ("LIBOR") and other interbank offered rates to alternative reference rates. The guidance was effective upon issuance and generally can be applied to applicable contract modifications through December 31, 2022. We are evaluating the impact of the transition from LIBOR to alternative reference rates but do not expect a significant impact to our consolidated financial statements.
We reviewed all other recently issued accounting pronouncements and concluded that they were either not applicable or not expected to have a significant impact to the consolidated financial statements.
Recently Adopted Accounting Standards
On January 1, 2021, we adopted ASU 2019-12, “Simplifying the Accounting for Income Taxes (Topic 740),” which modified certain technical guidelines for accounting for income taxes. The adoption of ASU 2019-12 did not result in a material change to our consolidated financial statements.
2. Supplemental Balance Sheet Information
Leasehold improvements, property and equipment, net were as follows:
| | | | | |
| | | | | |
| December 31, |
| 2021 | | 2020 |
Land | $ | 12,943 | | $ | 12,943 |
Leasehold improvements and buildings | | 2,094,227 | | | 1,921,371 |
Furniture and fixtures | | 222,774 | | | 198,387 |
Equipment | | 868,435 | | | 755,003 |
Construction in Progress | | 107,222 | | | 76,317 |
Leasehold improvements, property and equipment, gross | | 3,305,601 | | | 2,964,021 |
Accumulated depreciation | | (1,536,323) | | | (1,379,710) |
Leasehold improvements, property and equipment, net | $ | 1,769,278 | | $ | 1,584,311 |
Accrued payroll and benefits were as follows:
| | | | | |
| | | | | |
| December 31, |
| 2021 | | 2020 |
Workers' compensation liability | $ | 27,456 | | $ | 27,630 |
Accrued payroll and bonuses | | 107,799 | | | 79,702 |
Accrued employer payroll taxes, deferred pursuant to the CARES Act | | - | | | 70,812 |
Other accrued payroll and benefits | | 27,150 | | | 24,910 |
Accrued payroll and benefits | $ | 162,405 | | $ | 203,054 |
Accrued liabilities were as follows:
| | | | | |
| | | | | |
| December 31, |
| 2021 | | 2020 |
Sales and use tax payable | $ | 32,004 | | $ | 26,419 |
Legal reserve liability | | 48,098 | | | 51,214 |
Other accrued liabilities | | 92,950 | | | 87,016 |
Accrued liabilities | $ | 173,052 | | $ | 164,649 |
3. Revenue Recognition
Gift Cards
The gift card liability included in unearned revenue on the consolidated balance sheets was as follows:
| | | | | |
| | | | | |
| December 31, |
| 2021 | | 2020 |
Gift card liability | $ | 130,779 | | $ | 105,413 |
Revenue recognized from the redemption of gift cards that was included in unearned revenue at the beginning of the year was as follows:
| | | | | | | | |
| | | | | | | | |
| Year ended December 31, |
| 2021 | | 2020 | | 2019 |
Revenue recognized from gift card liability balance at the beginning of the year | $ | 48,605 | | $ | 39,612 | | $ | 37,386 |
Chipotle Rewards
Changes in our Chipotle Rewards liability included in unearned revenue on the consolidated balance sheets were as follows:
| | | | | | | | |
| Year ended December 31, |
| 2021 | | 2020 | | 2019 |
Chipotle Rewards liability, beginning balance | $ | 22,337 | | $ | 10,584 | | $ | - |
Revenue deferred | | 106,759 | | | 87,259 | | | 44,666 |
Revenue recognized | | (103,524) | | | (75,506) | | | (34,082) |
Chipotle Rewards liability, ending balance | $ | 25,572 | | $ | 22,337 | | $ | 10,584 |
4. Fair Value of Financial Instruments
Assets and Liabilities Measured at Fair Value on a Recurring Basis
The carrying value of our cash and cash equivalents, restricted cash, accounts receivable and accounts payable approximate fair value because of their short-term nature.
Our investments are comprised of U.S. Treasury securities, a corporate debt security, non-marketable equity securities, and an equity method investment. We also maintain a deferred compensation plan with related assets held in a rabbi trust. We designate the appropriate classification of our investments at the time of purchase based upon the intended holding period.
Held-to-Maturity Investments
U.S. Treasury Securities
As of December 31, 2021, we held $501,288 of U.S. Treasury securities with maturities of up to 24 months, of which $260,945 mature within one year. As of December 31, 2020, we held $445,944 of U.S. Treasury securities with maturities of up to 16 months, of which $343,616 matured within one year. Our investments in U.S. Treasury securities are held at amortized cost. The fair value of our held-to-maturity U.S. Treasury security investments is measured using Level 1 inputs (quoted prices for identical assets in active markets). For the years ended December 31, 2021 and 2020, the fair value of our securities were $500,172 and $445,828, respectively. We recognize a reserve for expected credit losses when lifetime credit losses are expected by management. As of December 31, 2021, management has concluded there is no risk of non-payment with respect to our U.S. Treasury security investments.
Corporate Debt Security
On September 30, 2021, we acquired a promissory note issued by a supplier in exchange for $18,000. The promissory note has a principal balance of $18,000 and bears interest at a rate equal to the 3-month U.S. dollar London Interbank Offered Rate (“LIBOR”) plus a fixed interest spread. Accrued interest is paid quarterly in arrears and principal is payable in accordance with an amortization schedule beginning on December 31, 2022. The promissory note matures on September 30, 2028. Our investment in the corporate debt security is held at amortized cost and approximates fair value as of December 31, 2021. As of December 31, 2021, we maintained a reserve of $423 for expected credit losses associated with the investment.
Rabbi Trust
We have elected to fund certain deferred compensation obligations through a rabbi trust, the assets of which are designated as trading securities, as described further in Note 9. “Employee Benefit Plans.”
Assets and Liabilities Measured at Fair Value on a Nonrecurring Basis
Assets recognized or disclosed at fair value on the consolidated financial statements on a nonrecurring basis include items such as leasehold improvements, property and equipment, certain long-term investments, operating lease assets, other assets, and goodwill. These assets are measured at fair value whenever events or changes in circumstances indicate that the carrying amount of an asset may not be recoverable.
The following table summarizes our assets measured at fair value by hierarchy level on a nonrecurring basis:
| | | | | | |
| | | | | | |
| | Carrying Value |
| | December 31, |
| Level | 2021 | | 2020 |
Leasehold improvements, property and equipment, net | 3 | $ | 1,041 | | $ | 4,682 |
Operating lease assets | 3 | | 2,791 | | | 10,372 |
Total | | $ | 3,832 | | $ | 15,054 |
Fair value of these assets was measured using Level 3 inputs (unobservable inputs for the asset or liability). Unobservable inputs include the discount rate, projected restaurant revenues and expenses, and sublease income if we are closing the restaurant. For the years ended December 31, 2021, 2020 and 2019 we recorded asset impairments related to restaurants and offices of $4,727, $16,683 and $2,897, respectively. Carrying value after the impairment charges approximates fair value.
Non-Marketable Equity Securities
On March 23, 2021, we acquired 766 shares of the Series C Preferred Stock of Nuro, Inc. (“Nuro”) in exchange for cash consideration of $10,000. Our investment represents a minority interest and we have determined that we do not have significant influence over Nuro. Nuro is a privately held company, and as such, the preferred shares comprising our investment are illiquid and fair value is not readily determinable. We have elected to measure our investment in the non-marketable equity securities of Nuro at cost, less impairments, if any, plus or minus changes resulting from observable price changes in orderly transactions for the identical or similar investment of the same issuer.
In November 2021, Nuro completed a Series D financing round. With respect to our Series C Preferred Stock of Nuro, we concluded that this transaction represented an observable price change in an orderly transaction for a similar investment of the same issuer. Accordingly, we recognized a gain of $5,968 relating to the increase in fair value of our investment in Nuro, within interest and other income on the consolidated statement of income for the year ended December 31, 2021.
Equity Method Investment
On April 16, 2020, we acquired approximately 10% of the common stock of a supplier in exchange for cash consideration of $7,500. On August 6, 2020, we acquired an additional 3.2% of the common stock of the same supplier in exchange for cash consideration of $2,500. As of December 31, 2021, we own approximately 12.7% of the supplier’s common stock and have invested total cash consideration of $10,000. As we are a significant customer of the supplier and maintain board representation, we are accounting for our investment under the equity method. The investment is included within other assets on the consolidated balance sheets with a carrying value of $9,251 and $9,529 as of December 31, 2021 and 2020, respectively. There were no impairment charges in 2021 or 2020 associated with this equity method investment. Refer to Note 14. “Related Party Transactions” for related party disclosures.
5. Corporate Restructuring Costs
In May 2018, we announced that we would open a headquarters office in Newport Beach, California, consolidate certain corporate administrative functions into our existing office in Columbus, Ohio, and close our existing headquarters offices in Denver, Colorado, as well as additional corporate offices in New York, New York. All affected employees were either offered an opportunity to continue in the new organization or were offered a severance package. We record severance as a one-time termination benefit and recognize the expense ratably over the employees’ required future service period.
All other costs, including other employee transition costs, recruitment and relocation costs, office asset impairment and other office closure costs, and third-party and other costs, are recognized in the period incurred.
Corporate restructuring costs consist of the following:
| | | | | | | | |
| Year ended December 31, |
| 2021 | | 2020 | | 2019 |
Employee severance and other employee transition costs(1) | $ | - | | $ | 303 | | $ | 1,768 |
Recruitment and relocation costs(1) | | 449 | | | 874 | | | 6,231 |
Office asset impairment and other office closure costs(2) | | - | | | - | | | 1,719 |
Third-party and other costs(1) | | 4,964 | | | 5,222 | | | 4,324 |
Stock-based compensation(1) | | - | | | - | | | 134 |
Total corporate restructuring costs | $ | 5,413 | | $ | 6,399 | | $ | 14,176 |
__________________
(1)
(2)
Upon the adoption of Accounting Standards Codification Topic 842 on January 1, 2019, lease termination and other closure liabilities of $14,716 were reclassified into operating lease assets and are no longer within the scope of ASC 420, Exit or Disposal Cost Obligations.
6. Income Taxes
Income before income taxes, classified by source of income, was as follows:
| | | | | | | | |
| | | | | | | | |
| Year ended December 31, |
| 2021 | | 2020 | | 2019 |
Domestic | $ | 818,057 | | $ | 311,021 | | $ | 465,253 |
Foreign | | (5,294) | | | (17,240) | | | (6,968) |
Income before income taxes | $ | 812,763 | | $ | 293,781 | | $ | 458,285 |
The components of the benefit/(provision) for income taxes were as follows:
| | | | | | | | |
| | | | | | | | |
| Year ended December 31, |
| 2021 | | 2020 | | 2019 |
Current tax: | | | | | | | | |
U.S. Federal | $ | (156,447) | | $ | 204,063 | | $ | (57,020) |
U.S. State | | (15,351) | | | (32,684) | | | (20,499) |
Foreign | | (338) | | | (1,044) | | | (646) |
| | (172,136) | | | 170,335 | | | (78,165) |
Deferred tax: | | | | | | | | |
U.S. Federal | | 33,004 | | | (120,066) | | | (27,231) |
U.S. State | | (20,404) | | | 11,507 | | | (2,740) |
Foreign | | 7,229 | | | 7,158 | | | 2,685 |
| | 19,829 | | | (101,401) | | | (27,286) |
Valuation allowance | | (7,472) | | | (6,949) | | | (2,676) |
Benefit/(provision) for income taxes | $ | (159,779) | | $ | 61,985 | | $ | (108,127) |
The effective tax rate differs from the statutory tax rates as follows:
| | | | | | | | | |
| | | | | | | | | |
| Year ended December 31, |
| 2021 | | 2020 | | 2019 |
Statutory U.S. federal income tax rate | | 21.0 | % | | 21.0 | % | | 21.0 | % |
State income tax, net of related federal income tax benefit | | 3.5 | | | 4.2 | | | 4.1 | |
Federal credits | | (1.6) | | | (3.5) | | | (1.7) | |
Executive compensation disallowed | | 2.9 | | | 2.9 | | | 2.0 | |
Meals and entertainment | | - | | | 0.1 | | | 0.1 | |
Enhanced deduction for food donation | | - | | | (0.1) | | | - | |
Valuation allowance | | 0.3 | | | 1.6 | | | 0.5 | |
Other | | - | | | 1.8 | | | 0.8 | |
Return to provision and other discrete items | | 0.1 | | | 2.1 | | | 0.1 | |
Equity compensation related adjustments | | (4.7) | | | (13.5) | | | (3.3) | |
Federal net operating loss | | (1.8) | | | (37.7) | | | - | |
Effective income tax rate | | 19.7 | % | | (21.1) | % | | 23.6 | % |
The effective tax rate for the year ended December 31, 2021, was higher than the effective tax rate for the year ended December 31, 2020, primarily due to fewer net excess benefits generated from a federal net operating loss (“NOL”) and the proportionality of excess tax benefits related to option exercises and equity vesting relative to profit before tax in each respective year. This is partially offset by a net reduction in tax expense mostly related to the write-off of uncertain tax position reserves.
The components of the deferred income tax assets and liabilities for continuing operations were as follows:
| | | | | | | | |
| | | | | | | | |
| | | | December 31, |
| | | | 2021 | | 2020 |
Deferred income tax liability: | | | | | | | | |
Leasehold improvements, property and equipment, net | | | | $ | 279,586 | | $ | 298,225 |
Goodwill and other assets | | | | | 1,728 | | | 1,628 |
Prepaid assets and other | | | | | 106 | | | (350) |
Operating lease assets | | | | | 851,324 | | | 752,864 |
Total deferred income tax liability | | | | | 1,132,744 | | | 1,052,367 |
Deferred income tax asset: | | | | | | | | |
Gift card liability | | | | | 9,699 | | | 3,849 |
Capitalized transaction costs | | | | | 324 | | | 324 |
Stock-based compensation and other employee benefits | | | | | 45,261 | | | 34,709 |
Foreign net operating loss carry-forwards | | | | | 27,446 | | | 21,598 |
State credits | | | | | 3,595 | | | 4,452 |
Operating lease liabilities | | | | | 909,528 | | | 812,699 |
Allowances, reserves and other | | | | | 24,179 | | | 25,981 |
State net operating loss carry-forwards | | | | | 1,568 | | | 22,482 |
Valuation allowance | | | | | (30,621) | | | (23,149) |
Total deferred income tax asset | | | | | 990,979 | | | 902,945 |
Deferred income tax liabilities | | | | $ | 141,765 | | $ | 149,422 |
Gross foreign NOLs were $108,324 and $98,710 for the year ended December 31, 2021 and 2020, respectively. Our foreign NOLs can be carried forward indefinitely.
Gross state NOLs available across all jurisdictions in which we operate were $50,467 and $340,259 as of December 31, 2021 and 2020, respectively. Our state NOLs expire over varying intervals in the future.
We had gross valuation allowances against certain foreign deferred tax assets of $119,741 and $104,820 as of December 31, 2021 and 2020, respectively. The increase in the valuation allowance was primarily due to the recording of a valuation allowance on various foreign tax attributes.
Unrecognized Tax Benefits
A reconciliation of the unrecognized tax benefits was as follows:
| | | | | | | | |
| Year ended December 31, |
| 2021 | | 2020 | | 2019 |
Beginning of year | $ | 10,859 | | $ | 15,028 | | $ | 9,360 |
(Decrease)/Increase resulting from prior year tax position | | (151) | | | (2,853) | | | 5,855 |
Increase resulting from current year tax position | | 1,387 | | | 1,870 | | | 758 |
Settlements with taxing authorities | | - | | | - | | | (736) |
Lapsing of statutes of limitations | | (6,833) | | | (3,186) | | | (209) |
End of year | $ | 5,262 | | $ | 10,859 | | $ | 15,028 |
Interest expense related to uncertain tax positions is recognized in interest and other income, net on the consolidated statements of income. Penalties related to uncertain tax positions are recognized in benefit/(provision) for income taxes on the consolidated statements of income. For the years ended December 31, 2021, 2020 and 2019, we recognized $180, $554 and $1,853, respectively, in interest expense related to uncertain tax positions. These are gross amounts before any tax benefits and are included in other liabilities on the consolidated balance sheets. As of December 31, 2021 and 2020, we have accrued interest of $356 and $2,185, respectively.
We are no longer subject to U.S. federal tax examinations by tax authorities for tax years before 2017. For the majority of states where we have a significant presence, we are no longer subject to tax examinations by tax authorities for tax years before 2017. Currently, we expect expirations of statutes of limitations, excluding indemnified amounts, on reserves of approximately $826 within the next twelve months.
It is reasonably possible the amount of the unrecognized benefit with respect to certain unrecognized positions could significantly increase or decrease within the next twelve months and would have an impact on net income.
Coronavirus Aid, Relief and Economic Security Act (“CARES Act”)
On March 27, 2020, President Trump signed into law the CARES Act. Intended to provide economic relief to those impacted by the COVID-19 pandemic, the CARES Act includes provisions, among others, addressing the carryback of NOLs for specific periods, refunds of alternative minimum tax credits, temporary modifications to the limitations placed on the tax deductibility of net interest expenses, and technical amendments for qualified improvement property (“QIP”). Additionally, the CARES Act, in efforts to enhance business’ liquidity, provides for refundable employee retention tax credits and the deferral of the employer-paid portion of social security taxes.
In connection with the CARES Act, we carried back the federal NOL generated in 2020 to tax years 2015-2017 when the corporate federal income tax rate was 35%. As a result, for the year ended December 31, 2021 and December 31, 2020, we recorded an income tax benefit of $14,431 and $110,765 respectively, due to the federal income tax rate differential in 2020 of 21% versus 2015-2017 of 35%.
The CARES Act provides for the deferral of the employer-paid portion of social security payroll taxes. We elected to defer the employer-paid portion of social security payroll taxes through December 31, 2020, of $70,812 and early remitted all deferred amounts to the IRS during the year ended December 31, 2021.
The CARES Act provided refundable employee retention credits, which could be used to offset payroll tax liabilities. For the year ended December 31, 2020, we recorded a benefit of $3,403, which primarily offsets payroll tax expense. On March 11, 2021, President Biden signed the American Rescue Plan Act (“ARPA”). The ARPA includes several provisions, such as measures that extend and expand the employee retention credit, previously enacted under the CARES Act, through December 31, 2021. During the year ended December 31, 2021, we recorded an employee retention credit of $11,445 which primarily offset payroll tax expense.
7. Shareholders’ Equity
We have had a stock repurchase program in place since 2008. As of December 31, 2021, we had $240,871 authorized for repurchasing shares of our common stock, which includes the $200,000 additional authorization approved by our Board of Directors and announced on February 8, 2022. Shares we repurchased are being held in treasury stock until they are reissued or retired at the discretion of our Board of Directors.
During the years ended December 31, 2021, 2020, and 2019, shares of common stock at a total cost of $79,870, $48,555, and $10,420, respectively, were netted and surrendered as payment for minimum statutory withholding obligations in connection with the vesting of outstanding stock awards. Shares surrendered by the participants in accordance with the applicable award agreements and plan are deemed repurchased by us but are not part of publicly announced share repurchase programs.
8. Stock-Based Compensation
Pursuant to the 2011 Incentive Plan, we grant stock options, SOSARs, restricted stock units (“RSUs”), or performance and/or market based restricted stock units (“PSUs”) to employees and non-employee directors. We issue shares of common stock upon the exercise of SOSARs and the vesting of RSUs and PSUs.
Under the 2011 Incentive Plan, 6,830 shares of common stock have been authorized and reserved for issuance to eligible participants, of which 2,141 shares were authorized for issuance but not issued or subject to outstanding awards as of December 31, 2021. For purposes of calculating the available shares remaining, each share issuable pursuant to outstanding full value awards, such as RSUs and PSUs, counts as two shares, and each share underlying a stock option or SOSAR count as one share.
The following table sets forth total stock-based compensation expense:
| | | | | | | | |
| | | | | | | | |
| Year ended December 31, |
| 2021 | | 2020 | | 2019 |
Stock-based compensation | $ | 178,703 | | $ | 84,463 | | $ | 92,062 |
Stock-based compensation, net of income taxes | $ | 159,972 | | $ | 69,904 | | $ | 73,866 |
Total capitalized stock-based compensation included in leasehold improvements, property and equipment, net on the consolidated balance sheets | $ | 2,311 | | $ | 1,837 | | $ | 666 |
Excess tax benefit on stock-based compensation recognized in benefit/(provision) for income taxes on the consolidated statements of income | $ | 47,958 | | $ | 49,690 | | $ | 16,203 |
SOSARs
A summary of SOSAR activity was as follows (in thousands, except years and per share data):
| | | | | | | | | | | |
| | | | | | | | | | | |
| Shares | | Weighted-Average Exercise Price per Share | | Weighted-Average Remaining Contractual Life (Years) | | Aggregate Intrinsic Value |
Outstanding, January 1, 2021 | | 748 | | $ | 533.71 | | | | | $ | 637,905 |
Granted | | 82 | | | 1,510.79 | | | | | | |
Exercised | | (446) | | | 448.02 | | | | | | |
Forfeited or cancelled | | (20) | | | 913.86 | | | | | | |
Outstanding, December 31, 2021 | | 364 | | | 838.62 | | | 4.7 | | | 331,352 |
Exercisable, December 31, 2021 | | 100 | | | 473.64 | | | 3.4 | | | 127,918 |
Vested and expected to vest, December 31, 2021 | | 353 | | | 823.91 | | | 4.6 | | | 326,444 |
The total intrinsic value of SOSARs exercised during the years ended December 31, 2021, 2020, and 2019, was $498,399, $236,573, and $219,984, respectively. Unrecognized stock-based compensation expense for SOSARs as of December 31, 2021 was $23,115 and is expected to be recognized over a weighted average period of 1.5 years. SOSARs expire 7 years after the day they were granted.
The weighted average assumptions utilized in the Black-Scholes option-pricing model to estimate the fair value of SOSARs granted each year were as follows:
| | | | | | | | | | | | |
| | | | | | | | | | | | |
| | 2021 | | 2020 | | 2019 |
Risk-free interest rate | | | 0.3 | % | | | 1.3 | % | | | 2.4 | % |
Expected life (years) | | | 3.7 | | | | 3.8 | | | | 3.9 | |
Expected dividend yield | | | 0.0 | % | | | 0.0 | % | | | 0.0 | % |
Volatility | | | 35.2 | % | | | 32.4 | % | | | 34.7 | % |
Weighted-average Black-Scholes fair value per share at date of grant | | $ | 403.01 | | | $ | 231.52 | | | $ | 176.79 | |
The risk-free interest rate is based on U.S. Treasury rates for instruments with similar terms, and the expected life assumption is based on our historical data. We have not paid dividends to date and do not plan to pay dividends in the near future. The volatility assumption is based on our historical data and implied volatility.
Non-Vested Stock Awards (RSUs)
A summary of RSU award activity was as follows (in thousands, except per share data):
| | | | | | | | | | | |
| | | | | | | | | | | |
| | | | | | Shares | | Weighted-Average Grant Date Fair Value per Share |
Outstanding, January 1, 2021 | | | | | | | | 92 | | $ | 631.66 |
Granted | | | | | | | | 25 | | | 1,492.15 |
Vested | | | | | | | | (50) | | | 497.97 |
Forfeited or cancelled | | | | | | | | (9) | | | 1,021.45 |
Outstanding, December 31, 2021 | | | | | | | | 58 | | | 1,064.67 |
Vested and expected to vest, December 31, 2021 | | | | | | | | 53 | | | 1,042.33 |
The weighted average grant date fair value per RSU granted during the years ended December 31, 2020 and 2019, was $905.96 and $627.94, respectively. Unrecognized stock-based compensation expense for non-vested RSU stock awards we have determined are probable of vesting was $21,600 as of December 31, 2021, and is expected to be recognized over a weighted average period of 1.5 years. The fair value of shares earned as of the vesting date during the years ended December 31, 2021, 2020, and 2019, was $73,540, $47,649, and $27,197, respectively.
Non-Vested Performance Stock Awards (PSUs)
A summary of PSU award activity was as follows (in thousands, except per share data):
| | | | | | | | | | | |
| | | | | | | | | | | |
| | | | | | Shares | | Weighted-Average Grant Date Fair Value per Share |
Outstanding, January 1, 2021 (1) | | | | | | | | 150 | | $ | 846.22 |
Granted | | | | | | | | 18 | | | 1,479.55 |
Vested | | | | | | | | (62) | | | 891.17 |
Expired | | | | | | | | (1) | | | 946.17 |
Outstanding, December 31, 2021 | | | | | | | | 105 | | | 928.28 |
Vested and expected to vest, December 31, 2021 | | | | | | | | 229 | | | 880.99 |
(1)The beginning outstanding balance includes the shares issued through the modification of the 2018 Performance Share Awards which was completed on December 30, 2020. This amount was not included in the table above in the 2020 Form 10-K and instead was discussed in a separate paragraph.
The weighted average fair value per PSU granted during the years ended December 31, 2020 and 2019, was $853.03 and $583.13, respectively. The Unrecognized stock-based compensation expense for non-vested PSU stock awards we have determined are probable of vesting was $69,203 as of December 31, 2021, and is expected to be recognized over a weighted average period of 1.7 years. The fair value of shares earned as of the vesting date during the years ended December 31, 2021, 2020, and 2019, was $97,496, $60,081, and $0, respectively.
During the year ended December 31, 2021, we awarded performance share awards that are subject to service, market, and performance vesting conditions. The quantity of shares that will vest will range from 0% to 300% of the target number of shares based on performance factors related to our growth in comparable restaurant sales and average restaurant margin over a three year period beginning on January 1, 2021. If the defined minimum targets are not met, then no shares will vest. Further, in no event may more than 100% of the target number of PSUs vest if our 3-year total shareholder return is below the 25th percentile of the constituent companies comprising the S&P 500 on the day of the grant.
During the year ended December 31, 2020, we awarded performance share awards that are subject to service, market, and performance vesting conditions. The quantity of shares that will vest will range from 0% to 300% of the target number of shares based on performance factors related to our growth in comparable restaurant sales and average restaurant margin over a three year period beginning on January 1, 2020. If the defined minimum targets are not met, then no shares will vest. Further, in no event may more than 100% of the target number of PSUs vest if our 3-year total shareholder return is below the 25th percentile of the constituent companies comprising the S&P 500 on the day of the grant.
During the year ended December 31, 2019, we awarded two types of performance share awards that are subject to service and performance vesting conditions. The quantity of shares that will vest range from 0% to 300% of the targeted number of shares for both awards. The first award, consisting of 33 shares, will vest based on our growth in comparable restaurant sales and average restaurant margin over a three year period beginning on January 1, 2019. The second award, consisting of 13 shares, will vest based on performance conditions based on achievement of certain targets related to digital sales, general and administrative expenses as a percentage of total revenue, and successful completion of a defined number of strategic initiatives in 2019 and 2020. These awards will vest 40% on the third anniversary of the grant date and 60% on the fourth anniversary of the grant date provided required service is completed through these dates.
The information contained in this paragraph describing the modification of the 2018 Performance Share Awards is included in the PSU table above. On December 30, 2020, due to the impact that the COVID-19 pandemic had on the growth in comparable restaurant sales and restaurant margin relative to the trajectory of both of these performance factors prior to the pandemic, and also due to the significant shareholder value created over the performance period of the original award, the Compensation Committee of the Board of Directors modified the 2018 PSU award. This modification pertained to all seven recipients of this award, and resulted in incremental compensation expense of $71,441, of which $63,050 was recognized during the year ended December 31, 2021, and $8,391 remains unamortized as of December 31, 2021. To receive all incremental shares generated through the modification, the employees must remain employed through December 31, 2022, and the incremental shares will vest in four installments over this period. The first two installments of the modification vested during 2021, which included the vesting of 33 PSUs. The remaining expense will be recognized over this requisite service period of 12 months. The incremental compensation cost is calculated by multiplying the number of incremental shares generated though the modification by the stock price on the modification date. The stock price on the modification date of December 30, 2020 was $1,374.17.
9. Employee Benefit Plans
Defined Contribution Plan—We maintain the Chipotle Mexican Grill 401(k) Plan (“401(k) Plan”) for eligible U.S.-based employees. The 401(k) Plan allows participants to make cash contributions from payroll deductions. Employees become eligible to receive matching contributions after one year, and at least 1,000 hours, of service with Chipotle. We match 100% of the first 3% of pay contributed by each eligible employee and 50% on the next 2% of pay contributed each pay period (with an annual true-up) through cash contributions. For the years ended December 31, 2021, 2020, and 2019, matching contributions totaled approximately $10,527, $8,490 and $6,968, respectively and are included in general and administrative expenses on the consolidated statements of income. Certain subsidiaries outside the U.S. also offer other similar benefits and are immaterial to the consolidated statements of income.
Deferred Compensation Plan—We also maintain the Chipotle Mexican Grill, Inc. Supplemental Deferred Investment Plan (the “Deferred Plan”) for eligible employees. The Deferred Plan is a non-qualified plan that allows participants to make tax-deferred contributions that cannot be made under the 401(k) Plan because of Internal Revenue Service limitations. Participants’ earnings on contributions made to the Deferred Plan fluctuate with the actual earnings and losses of a variety of available investment choices selected by the participant. Total obligations under the Deferred Plan as of December 31, 2021 and 2020, were $19,330 and $15,296, respectively, and are included in other liabilities on the consolidated balance sheets and was fully funded as of December 31, 2021. We match 100% of the first 3% of pay contributed by each eligible employee and 50% on the next 2% of pay contributed once the 401(k) contribution limits are reached.
The following table summarizes estimated current and long-term material cash requirements for our deferred compensation plan as of December 31, 2021:
| | | | | | | | | | | | | | | |
| | | | | | | | | | | | | | | |
| | Payments Due by Fiscal Year |
| | Total | | 2022 | | 2023-2024 | | 2025-2026 | | Thereafter |
Deferred compensation(1) | | $ | 19,330 | | $ | 3,797 | | $ | 4,640 | | $ | 4,265 | | $ | 6,628 |
(1) Includes scheduled payments from our deferred compensation plan where payment dates are determinable for employed participants in accordance with the account’s election, and the assumption that active participants will retire at the age of 65 and begin distributions from their accounts at that time. This does not include future contributions, investment earnings, or future participants. Timing and amounts of payments may vary significantly.
We have elected to fund our deferred compensation obligation through a rabbi trust. The rabbi trust is subject to creditor claims in the event of insolvency, but the assets held in the rabbi trust are not available for general corporate purposes. Amounts in the rabbi trust are invested in mutual funds, consistent with the investment choices selected by participants in their Deferred Plan accounts, which are designated as trading securities, carried at fair value, and are included in other assets on the consolidated balance sheets. Fair value of rabbi trust investments in mutual funds is measured using Level 1 inputs. The fair value of the investments in the rabbi trust was $19,330 and $15,296 as of December 31, 2021 and 2020, respectively. We record trading gains and losses in general and administrative expenses on the consolidated statements of income, along with the offsetting amount related to the increase or decrease in deferred compensation to reflect our exposure to liabilities for payment under the deferred plan.
Employee Stock Purchase Plan—We also offer an employee stock purchase plan (“ESPP”). Employees become eligible to participate after one year of service with Chipotle and may contribute up to 15% of their base earnings, subject to an annual maximum dollar amount, toward the monthly purchase of our common stock. The purchase price is 95% of the fair market value of the stock on the last trading date of the monthly exercise period. Under the ESPP, 250 shares of common stock have been authorized and reserved for issuances to eligible employees, of which 245 represent shares that were authorized for issuance but not issued as of December 31, 2021. For the years ended December 31, 2021, 2020, and 2019, the number of shares issued each year under the ESPP were less than one.
10. Leases
The weighted average remaining lease term and discount rate were as follows:
| | | | | |
| | | | | |
| December 31, | | December 31, |
| 2021 | | 2020 |
Weighted average remaining lease term (years) | | 13.8 | | | 13.4 |
Weighted average discount rate | | 4.56% | | | 4.92% |
The components of lease cost were as follows:
| | | | | | | | | |
| | | | | | | | | |
| | Year ended December 31, |
| Classification | 2021 | | 2020 | | 2019 |
Operating lease cost | Occupancy, Other operating costs, General and administrative expenses and Pre-opening costs | $ | 364,314 | | $ | 333,878 | | $ | 308,586 |
Short-term lease cost | Other operating costs | | 256 | | | 36 | | | 3,238 |
Variable lease cost | Occupancy, Other operating costs, General and administrative expenses and Pre-opening costs | | 92,145 | | | 37,860 | | | 36,828 |
Sublease income | General and administrative expenses | | (4,930) | | | (3,588) | | | (3,385) |
Total lease cost | | $ | 451,785 | | $ | 368,186 | | $ | 345,267 |
Supplemental disclosures of cash flow information related to leases were as follows:
| | | | | | | | |
| | | | | | | | |
| Year ended December 31, |
| 2021 | | 2020 | | 2019 |
Cash paid for operating lease liabilities | $ | 359,391 | | $ | 316,249 | | $ | 295,113 |
Operating lease assets obtained in exchange for operating lease liabilities(1) | $ | 577,273 | | $ | 484,888 | | $ | 2,702,778 |
Derecognition of operating lease assets due to terminations or impairment | $ | 5,765 | | $ | 20,242 | | $ | 17,740 |
(1)Amounts for the year ended December 31, 2019, include the transition adjustment for the adoption of Topic 842 discussed in Note 1. “Description of Business and Summary of Significant Accounting Policies” on Annual Report on Form 10-K for the year ended December 31, 2019.
Maturities of lease liabilities were as follows as of December 31, 2021:
| | |
| | |
| Operating Leases |
2022 | $ | 347,399 |
2023 | | 377,064 |
2024 | | 367,618 |
2025 | | 359,687 |
2026 | | 351,393 |
Thereafter | | 2,973,135 |
Total lease payments | | 4,776,296 |
Less: imputed interest | | 1,255,982 |
Operating lease liabilities (Current and Long-Term) | $ | 3,520,314 |
As of December 31, 2021, the total lease payments include $2,321,456 related to options to extend lease terms that are reasonably certain of being exercised, and exclude approximately $289,840 of legally binding lease payments for leases signed but not yet commenced and $20,132 of future sublease income.
In April 2020, the FASB issued guidance allowing entities to make a policy election whether to account for lease concessions related to the COVID-19 pandemic as lease modifications. The election applies to any lessor-provided lease concession related to the impact of the COVID-19 pandemic, provided the concession does not result in a substantial increase in the rights of the lessor or in the obligations of the lessee. In 2020 and 2021, we received non-substantial concessions from certain landlords in the form of rent deferrals and abatements related to the COVID-19 pandemic. We have elected to not account for these rent concessions as lease modifications. The recognition of rent concessions did not have a material impact on our consolidated financial statements as of December 31, 2021.
We have six sale and leaseback transactions, which do not qualify for sale leaseback accounting due to fixed price renewal options prohibiting sale accounting. These transactions are accounted for under the financing method. Under the financing method, the assets remain on the consolidated balance sheets and the proceeds from the transactions are recorded as a financing liability. A portion of lease payments are applied as payments of deemed principal and imputed interest. The deemed landlord financing liability was $1,515 and $1,845 as of December 31, 2021, and 2020, respectively, with the current portion of the liability included in accrued liabilities, and the remaining portion included in other liabilities on the consolidated balance sheets.
11. Earnings Per Share
The following table sets forth the computations of basic and diluted earnings per share:
| | | | | | | | |
| | | | | | | | |
| Year ended December 31, |
| 2021 | | 2020 | | 2019 |
Net income | $ | 652,984 | | $ | 355,766 | | $ | 350,158 |
Shares: | | | | | | | | |
Weighted-average number of common shares outstanding (for basic calculation) | | 28,132 | | | 27,917 | | | 27,740 |
Dilutive stock awards | | 379 | | | 499 | | | 555 |
Weighted-average number of common shares outstanding (for diluted calculation) | | 28,511 | | | 28,416 | | | 28,295 |
Basic earnings per share | $ | 23.21 | | $ | 12.74 | | $ | 12.62 |
Diluted earnings per share | $ | 22.90 | | $ | 12.52 | | $ | 12.38 |
The following stock awards were excluded from the calculation of diluted earnings per share:
| | | | | | | | |
| | | | | | | | |
| Year ended December 31, |
| 2021 | | 2020 | | 2019 |
Stock awards subject to performance conditions | | 66 | | | 87 | | | 81 |
Stock awards that were antidilutive | | 34 | | | 57 | | | 139 |
Total stock awards excluded from diluted earnings per share | | 100 | | | 144 | | | 220 |
12. Commitments and Contingencies
Purchase Obligations
We enter into various purchase obligations in the ordinary course of business, generally of a short-term nature. Those that are binding primarily relate to commitments for food purchases and supplies, amounts owed under contractor and subcontractor agreements, orders submitted for equipment for restaurants under construction, and marketing initiatives and corporate sponsorships.
Litigation
New York Legal Proceedings
As reported in our previous SEC filings, on September 10, 2019, the New York City Department of Consumer and Worker Protection (“DCWP”) filed a complaint in the City of New York Office of Administrative Trials and Hearings alleging violations at five Chipotle restaurants of New York City’s Fair Work Week law (“FWW”) and Earned Safe and Sick Time Act (“ESTA”) between November 2017 and September 2019. On April 28, 2021, DCWP amended the complaint to cover purported violations of FWW and ESTA at substantially all Chipotle restaurants in New York City, through the date the amended complaint was filed. Chipotle and the DCWP have engaged in mediation proceedings, which are ongoing. In the event the parties are not able to resolve the matter, Chipotle intends to vigorously defend against the allegations. During the three months ended December 31, 2021, we accrued a liability that represents the total estimated amount we expect to pay to settle this matter. We do not expect any additional losses above the amount accrued to be material to our consolidated financial statements.
Other
We are involved in various claims and legal actions, such as wage and hour, wrongful termination and other employment-related claims, slip and fall and other personal injury claims, advertising and consumer claims, and lease and other commercial disputes, that arise in the ordinary course of business, some of which may be covered by insurance. The outcomes of these actions are not predictable, but we do not believe that the ultimate resolution of these actions will have a material adverse effect on our financial position, results of operations, liquidity, or capital resources. However, if there is a significant increase in the number of these claims, or if we incur greater liabilities than we currently anticipate under one or more claims, it could materially and adversely affect our business, financial condition, results of operations and cash flows.
Accrual for Estimated Liability
In relation to various legal matters as of December 31, 2021, we had an accrued legal liability balance of $48,098 included within accrued liabilities on the consolidated balance sheet. Included in this amount is the accrued loss for the DCWP legal matter discussed above.
13. Debt
On May 8, 2020, we entered into a $600,000 revolving credit facility with JPMorgan Chase Bank (“JPMorgan”) as administrative agent. On April 13, 2021, we terminated this facility, which we did not borrow on over the period of which it was active, and entered into a new 5-year $500,000 revolving credit facility, with JPMorgan as administrative agent. Borrowings on the new credit facility bear interest at a rate equal to LIBOR plus 1.375%, which is subject to increase due to changes in our total leverage ratio as defined in the credit agreement. We are also obligated to pay a commitment fee of 0.175% per year for unused amounts under the credit facility, which also may increase due to changes in our total leverage ratio. Further, we are subject to certain covenants defined in the credit agreement, which include maintaining a total leverage ratio of less than 3.0x, maintaining a consolidated fixed charge coverage ratio of greater than 1.5x, and limiting us from incurring additional indebtedness in certain circumstances. We had no outstanding borrowings under the credit facility and are in compliance with all covenants as of December 31, 2021.
14. Related Party Transactions
In April 2020, we acquired common stock of a supplier. As of December 31, 2021, we owned approximately 12.7% of the common stock outstanding of a supplier. As we are a significant customer of the supplier and maintain board representation, we are accounting for our investment under the equity method. Accordingly, we have identified the supplier as a related party. We purchase product from the supplier for sale to customers in our restaurants. During the years ended December 31, 2021 and 2020, purchases from the supplier were $29,400 and $11,931.
ITEM 9. CHANGES IN AND DISAGREEMENTS WITH ACCOUNTANTS ON ACCOUNTING AND FINANCIAL DISCLOSURE
None.
ITEM 9A. CONTROLS AND PROCEDURES
We maintain disclosure controls and procedures (as defined in Rule 13a-15(e) promulgated under the Securities Exchange Act of 1934, as amended (the “Exchange Act”)) that are designed to ensure that information required to be disclosed in Exchange Act reports is recorded, processed, summarized and reported within the time periods specified in the Securities and Exchange Commission’s rules and forms, and that such information is accumulated and communicated to our management, including our Chief Executive Officer and Chief Financial Officer, as appropriate, to allow timely decisions regarding required disclosure.
Evaluation of Disclosure Controls and Procedures
As of December 31, 2021, we carried out an evaluation, under the supervision and with the participation of our management, including our Chief Executive Officer and Chief Financial Officer, of the effectiveness of the design and operation of our disclosure controls and procedures. Based on the foregoing, our Chief Executive Officer and Chief Financial Officer concluded that our disclosure controls and procedures were effective as of the end of the period covered by this annual report.
Changes in Internal Control over Financial Reporting
There were no changes during the fiscal quarter ended December 31, 2021, in our internal control over financial reporting (as defined in Rule 13a-15(f) under the Exchange Act) that have materially affected or are reasonably likely to materially affect our internal control over financial reporting.
Management’s Annual Report on Internal Control over Financial Reporting
The management of Chipotle Mexican Grill, Inc. is responsible for establishing and maintaining adequate internal control over financial reporting. Our internal control over financial reporting is a process designed to provide reasonable assurance regarding the reliability of financial reporting and the preparation of financial statements for external purposes in accordance with accounting principles generally accepted in the United States of America. Our internal control over financial reporting includes those policies and procedures that (i) pertain to the maintenance of records that, in reasonable detail, accurately and fairly reflect the transactions and dispositions of our assets; (ii) provide reasonable assurance that transactions are recorded as necessary to permit preparation of financial statements in accordance with accounting principles generally accepted in the United States of America, and that our receipts and expenditures are being made only in accordance with authorizations of our management and directors; and (iii) provide reasonable assurance regarding prevention or timely detection of unauthorized acquisition, use, or disposition of assets that could have a material effect on our financial statements.
Because of its inherent limitations, internal control over financial reporting may not prevent or detect misstatements. Also, projections of any evaluation of effectiveness to future periods are subject to the risk that controls may become inadequate because of changes in conditions, or that the degree of compliance with the policies or procedures may deteriorate.
Management assessed the effectiveness of our internal control over financial reporting as of December 31, 2021, based on the framework set forth by the Committee of Sponsoring Organizations of the Treadway Commission in Internal Control—Integrated Framework (the “2013 framework”). Based on that assessment, management concluded that, as of December 31, 2021, our internal control over financial reporting was effective based on the criteria established in the 2013 framework.
Our independent registered public accounting firm, Ernst & Young LLP, has issued an attestation report on the effectiveness of our internal control over financial reporting as of December 31, 2021. This report follows.
Report of Independent Registered Public Accounting Firm
To the Shareholders and the Board of Directors of Chipotle Mexican Grill, Inc.
Opinion on Internal Control Over Financial Reporting
We have audited Chipotle Mexican Grill, Inc.’s internal control over financial reporting as of December 31, 2021, based on criteria established in Internal Control—Integrated Framework issued by the Committee of Sponsoring Organizations of the Treadway Commission (2013 framework) (the COSO criteria). In our opinion, Chipotle Mexican Grill, Inc. (the Company) maintained, in all material respects, effective internal control over financial reporting as of December 31, 2021, based on the COSO criteria.
We also have audited, in accordance with the standards of the Public Company Accounting Oversight Board (United States) (PCAOB), the consolidated balance sheets of the Company as of December 31, 2021 and 2020, the related consolidated statements of income, comprehensive income, shareholders’ equity and cash flows for each of the three years in the period ended December 31, 2021, and the related notes and our report dated February 11, 2022 expressed an unqualified opinion thereon.
Basis for Opinion
The Company’s management is responsible for maintaining effective internal control over financial reporting and for its assessment of the effectiveness of internal control over financial reporting included in the accompanying Management’s Annual Report on Internal Control over Financial Reporting. Our responsibility is to express an opinion on the Company’s internal control over financial reporting based on our audit. We are a public accounting firm registered with the PCAOB and are required to be independent with respect to the Company in accordance with the U.S. federal securities laws and the applicable rules and regulations of the Securities and Exchange Commission and the PCAOB.
We conducted our audit in accordance with the standards of the PCAOB. Those standards require that we plan and perform the audit to obtain reasonable assurance about whether effective internal control over financial reporting was maintained in all material respects.
Our audit included obtaining an understanding of internal control over financial reporting, assessing the risk that a material weakness exists, testing and evaluating the design and operating effectiveness of internal control based on the assessed risk, and performing such other procedures as we considered necessary in the circumstances. We believe that our audit provides a reasonable basis for our opinion.
Definition and Limitations of Internal Control Over Financial Reporting
A company’s internal control over financial reporting is a process designed to provide reasonable assurance regarding the reliability of financial reporting and the preparation of financial statements for external purposes in accordance with generally accepted accounting principles. A company’s internal control over financial reporting includes those policies and procedures that (1) pertain to the maintenance of records that, in reasonable detail, accurately and fairly reflect the transactions and dispositions of the assets of the company; (2) provide reasonable assurance that transactions are recorded as necessary to permit preparation of financial statements in accordance with generally accepted accounting principles, and that receipts and expenditures of the company are being made only in accordance with authorizations of management and directors of the company; and (3) provide reasonable assurance regarding prevention or timely detection of unauthorized acquisition, use, or disposition of the company’s assets that could have a material effect on the financial statements.
Because of its inherent limitations, internal control over financial reporting may not prevent or detect misstatements. Also, projections of any evaluation of effectiveness to future periods are subject to the risk that controls may become inadequate because of changes in conditions, or that the degree of compliance with the policies or procedures may deteriorate.
/s/ Ernst & Young LLP
Irvine, California
February 11, 2022
ITEM 9B. OTHER INFORMATION
None.
PART III
ITEM 10. DIRECTORS, EXECUTIVE OFFICERS AND CORPORATE GOVERNANCE
Incorporated by reference from the definitive proxy statement for our 2022 annual meeting of shareholders, which will be filed no later than 120 days after December 31, 2021.
ITEM 11. EXECUTIVE COMPENSATION
Incorporated by reference from the definitive proxy statement for our 2022 annual meeting of shareholders, which will be filed no later than 120 days after December 31, 2021.
ITEM 12. SECURITY OWNERSHIP OF CERTAIN BENEFICIAL OWNERS AND MANAGEMENT AND RELATED STOCKHOLDER MATTERS
Incorporated by reference from the definitive proxy statement for our 2022 annual meeting of shareholders, which will be filed no later than 120 days after December 31, 2021.
ITEM 13. CERTAIN RELATIONSHIPS AND RELATED TRANSACTIONS, AND DIRECTOR INDEPENDENCE
Incorporated by reference from the definitive proxy statement for our 2022 annual meeting of shareholders, which will be filed no later than 120 days after December 31, 2021.
ITEM 14. PRINCIPAL ACCOUNTING FEES AND SERVICES
Incorporated by reference from the definitive proxy statement for our 2022 annual meeting of shareholders, which will be filed no later than 120 days after December 31, 2021.
PART IV
ITEM 15. EXHIBITS, FINANCIAL STATEMENT SCHEDULES
1. All Financial statements
Consolidated financial statements filed as part of this report are listed under Item 8. “Financial Statements and Supplementary Data.”
2. Financial statement schedules
No schedules are required because either the required information is not present or is not present in amounts sufficient to require submission of the schedule, or because the information required is included in the consolidated financial statements or the notes thereto.
3. Exhibits
| | | | | | |
| | | | | | |
| | Description of Exhibit Incorporated Herein by Reference |
Exhibit Number | Exhibit Description | Form | File No. | Filing Date | Exhibit Number | Filed Herewith |
3.1 | Amended and Restated Certificate of Incorporation of Chipotle Mexican Grill, Inc. | 10-Q | 001-32731 | October 26, 2016 | 3.1 | |
3.2 | Chipotle Mexican Grill, Inc. Amended and Restated Bylaws | 8-K | 001-32731 | May 21, 2021 | 3.1 | |
4.1 | Form of Stock Certificate for Shares of Common Stock | 10-K | 001-32731 | February 10, 2012 | 4.1 | |
4.2 | Description of Chipotle Securities | 10-K | 001-32731 | February 5, 2020 | 4.2 | |
10.1† | Form of 2019 Performance Share Unit Agreement | 10-Q | 001-32731 | April 25, 2019 | 10.1 | |
10.2† | Form of 2019 Transformation Performance Share Unit Agreement (1) | 10-K | 001-32731 | February 10, 2020 | 10.2 | |
10.3† | Change in Control Severance Plan, effective June 1, 2019 | 10-Q | 001-32731 | July 24, 2019 | 10.1 | |
10.4† | Form of Participation and Restrictive Covenant Agreement for Change in Control Severance Plan | 10-Q | 001-32731 | July 24, 2019 | 10.2 | |
10.5† | Amended and Restated Chipotle Mexican Grill, Inc. 2011 Stock Incentive Plan | 8-K | 001-32731 | May 24, 2018 | 10.1 | |
10.6† | Form of 2016 Stock Appreciation Rights Agreement | 10-Q | 001-32731 | April 27, 2016 | 10.1 | |
10.7† | Amended and Restated Registration Rights Agreement dated January 31, 2006 among Chipotle Mexican Grill, Inc., McDonald’s Corporation and certain shareholders | 10-K | 001-32731 | March 17, 2006 | 10.6 | |
10.8† | Supplemental Deferred Investment Plan | 10-Q | 001-32731 | July 27, 2018 | 10.3 | |
10.9† | Form of Director and Officer Indemnification Agreement | 8-K | 001-32731 | March 21, 2007 | 10.1 | |
10.10† | Offer Letter, dated February 11, 2018, between Brian R. Niccol and Chipotle Mexican Grill, Inc. | 8-K | 001-32731 | February 15, 2018 | 10.1 | |
10.11† | Chipotle Mexican Grill, Inc. Employee Stock Purchase Plan | 10-K | 001-32731 | February 10, 2012 | 10.11 | |
10.12† | Non-Plan Inducement SOSARs Agreement between Brian R. Niccol and Chipotle Mexican Grill, Inc. | S-8 | 33-223467 | March 6, 2018 | 4.3 | |
10.13† | Non-Plan Inducement RSUs Agreement between Brian R. Niccol and Chipotle Mexican Grill, Inc. | S-8 | 33-223467 | March 6, 2018 | 4.4 | |
10.14 | Investor Agreement dated December 14, 2016 between Chipotle Mexican Grill, Inc. and Pershing Square Capital Management, L.P. | 8-K | 001-32731 | December 19, 2016 | 10.1 | |
10.15 | Registration Rights Agreement dated February 3, 2017, between Chipotle Mexican Grill, Inc. and Pershing Square Capital Management, L.P. | 10-K | 001-32731 | February 7, 2017 | 10.11 | |
10.16† | Form of 2018 CEO SOSARs Agreement | 8-K/A | 001-32731 | April 3, 2018 | 10.2 | |
10.17† | Executive Agreement dated May 29, 2017 between Chipotle Mexican Grill, Inc. and Scott Boatwright | 8-K | 001-32731 | September 15, 2017 | 10.1 | |
10.18† | Form of 2018 Premium-priced SOSARs Agreement | 8-K/A | 001-32731 | April 3, 2018 | 10.3 | |
10.19† | Executive Chairman Agreement dated November 28, 2017 between Chipotle Mexican Grill, Inc. and Steve Ells | 8-K | 001-32731 | December 1, 2017 | 10.1 | |
10.20† | Offer Letter, dated March 9, 2018, between Christopher Brandt and Chipotle Mexican Grill, Inc. | 10-Q | 001-32731 | April 26, 2018 | 10.13 | |
10.21† | Form of 2018 Stock Appreciation Rights Agreement | 10-Q | 001-32731 | April 26, 2018 | 10.14 | |
10.22† | Form of 2021 Director Restricted Stock Unit Agreement | 10-Q | 001-32731 | July 23, 2021 | 10.2 | |
10.23† | Amendment No. 1 dated March 5, 2020 to the Executive Chairman Agreement dated November 28, 2017 between Chipotle Mexican Grill, Inc. and Steve Ells | 10-Q | 001-32731 | April 29, 2020 | 10.1 | |
10.24† | Deferred Prosecution Agreement dated April 20, 2020 between Chipotle Mexican Grill, Inc. and the United States Attorney’s Office for the Central District of California and the United States Department of Justice’s Consumer Protection Branch | 8-K | 001-32731 | April 21, 2020 | 10.1 | |
10.25 | Revolving Credit Agreement dated April 13, 2021, among Chipotle Mexican Grill, Inc. and JPMorgan Chase Bank, N.A., Administrative Agent, and other lenders party to the Agreement | 8-K | 001-32731 | April 16, 2021 | 10.1 | |
10.26 | Director Compensation Program and Stock Ownership Guidelines (revised May 18, 2021) | 10-Q | 001-32731 | July 23, 2021 | 10.1 | |
10.27† | Form of 2020 Performance Share Agreement | 10-K | 001-32731 | February 10, 2021 | 10.34 | |
10.28† | Form of 2020 Restricted Stock Units Agreement | 10-K | 001-32731 | February 10, 2021 | 10.35 | |
10.29† | Form of 2020 Stock Appreciation Rights Agreement | 10-K | 001-32731 | February 10, 2021 | 10.36 | |
10.30† | Form of 2021 Performance Share Unit Agreement | 10-Q | 001-32731 | April 29, 2021 | 10.2 | |
10.31† | Form of Amended and Restated 2018 Performance Share Unit Agreement | 10-Q | 001-32731 | April 29, 2021 | 10.3 | |
21.1 | Subsidiaries of Chipotle Mexican Grill, Inc. | - | - | - | - | X |
23.1 | Consent of Ernst & Young LLP (as the independent registered public accounting firm of Chipotle Mexican Grill, Inc.) | - | - | - | - | X |
24.1 | Power of Attorney (included on signature page of this report) | - | - | - | - | X |
31.1 | Certification of Chief Executive Officer of Chipotle Mexican Grill, Inc. pursuant to Section 302 of the Sarbanes-Oxley Act of 2002 | - | - | - | - | X |
31.2 | Certification of Chief Financial Officer of Chipotle Mexican Grill, Inc. pursuant to Section 302 of the Sarbanes-Oxley Act of 2002 | - | - | - | - | X |
32.1 | Certification of Chief Executive Officer and Chief Financial Officer of Chipotle Mexican Grill, Inc. pursuant to Section 906 of the Sarbanes-Oxley Act of 2002 | - | - | - | - | X |
101.INS | Inline XBRL Instance Document (the instance document does not appear in the Interactive Data File because its XBRL tags are embedded within the Inline XBRL document) | - | - | - | - | X |
101.SCH | Inline XBRL Taxonomy Extension Schema Document | - | - | - | - | X |
101.CAL | Inline XBRL Taxonomy Extension Calculation Linkbase Document | - | - | - | - | X |
101.DEF | Inline XBRL Taxonomy Extension Definition Linkbase Document | - | - | - | - | X |
101.LAB | Inline XBRL Taxonomy Extension Label Linkbase Document | - | - | - | - | X |
101.PRE | Inline XBRL Taxonomy Extension Presentation Linkbase Document | - | - | - | - | X |
104 | Cover Page Interactive Data File (formatted as inline XBRL and contained in Exhibit 101) | - | - | - | - | X |
| | | |
| | | (1) Portions of this exhibit have been omitted as permitted by applicable regulations. †- Management contracts and compensatory plans or arrangements required to be filed as exhibits. |
| | | |
ITEM 16. FORM 10-K SUMMARY
None.
SIGNATURES
Pursuant to the requirements of Section 13 or 15(d) of the Securities Exchange Act of 1934, the registrant has duly caused this report to be signed on its behalf by the undersigned, thereunto duly authorized.
| |
CHIPOTLE MEXICAN GRILL, INC. |
| |
By: | /s/ JOHN R. HARTUNG |
Name: | John R. Hartung |
Title: | Chief Financial Officer |
Date: February 11, 2022
POWER OF ATTORNEY
KNOW ALL PERSONS BY THESE PRESENTS, that each person whose signature appears below constitutes and appoints Brian Niccol and John Hartung, and each of them, his or her true and lawful attorneys-in-fact, each with full power of substitution, for him or her in any and all capacities, to sign any amendments to this report on Form 10-K and to file the same, with exhibits thereto and other documents in connection therewith, with the Securities and Exchange Commission, hereby ratifying and confirming all that each of said attorneys-in-fact or their substitute or substitutes may do or cause to be done by virtue hereof.
Pursuant to the requirements of the Securities Exchange Act of 1934, this report has been signed below by the following persons on behalf of the registrant and in the capacities and on the dates indicated.
| | | | |
Signature | | Date | | Title |
| | | | |
/s/ BRIAN NICCOL | | February 11, 2022 | | Chief Executive Officer and Chairman of the Board of Directors (principal executive officer) |
Brian Niccol | | | | |
/s/ JOHN R. HARTUNG | | February 11, 2022 | | Chief Financial Officer (principal financial and accounting officer) |
John R. Hartung | | | | |
/s/ ALBERT S. BALDOCCHI | | February 11, 2022 | | Director |
Albert S. Baldocchi | | | | |
/s/ MATTHEW A. CAREY | | February 11, 2022 | | Director |
Matthew A. Carey | | | | |
/s/ GREGG L. ENGLES | | February 11, 2022 | | Director |
Gregg L. Engles | | | | |
/s/ PATRICIA FILI-KRUSHEL | | February 11, 2022 | | Director |
Patricia Fili-Krushel | | | | |
/s/ NEIL W. FLANZRAICH | | February 11, 2022 | | Director |
Neil W. Flanzraich | | | | |
/s/ MAURICIO GUTIERREZ | | February 11, 2022 | | Director |
Mauricio Gutierrez | | | | |
/s/ ROBIN S. HICKENLOOPER | | February 11, 2022 | | Director |
Robin S. Hickenlooper | | | | |
/s/ SCOTT MAW | | February 11, 2022 | | Director |
Scott Maw | | | | |
/s/ ALI NAMVAR | | February 11, 2022 | | Director |
Ai Namvar | | | | |
/s/ MARY A. WINSTON | | February 11, 2022 | | Director |
Mary A. Winston | | | | |