P1Y0.66660.3333P1Mfalse--12-31FY20190001058090YesLarge Accelerated FilerDEYes84-1219301NoYesP3YP3YP3YP3YP3YP4YP2Y0001058090us-gaap:DomesticCountryMember2019-01-012019-12-310001058090cmg:NotPartOfShareRepurchasePlanMember2019-01-012019-12-310001058090cmg:NotPartOfShareRepurchasePlanMember2018-01-012018-12-310001058090cmg:NotPartOfShareRepurchasePlanMember2017-01-012017-12-3100010580902008-10-012019-12-310001058090us-gaap:SubsequentEventMember2020-02-040001058090us-gaap:EmployeeStockMember2018-01-012018-12-310001058090us-gaap:EmployeeStockMember2017-01-012017-12-310001058090us-gaap:RetainedEarningsMember2018-12-310001058090us-gaap:AdditionalPaidInCapitalMember2018-12-310001058090us-gaap:AccumulatedTranslationAdjustmentMember2018-12-310001058090us-gaap:AccumulatedNetUnrealizedInvestmentGainLossMember2018-12-310001058090us-gaap:RetainedEarningsMember2017-12-310001058090us-gaap:AdditionalPaidInCapitalMember2017-12-310001058090us-gaap:AccumulatedTranslationAdjustmentMember2017-12-310001058090us-gaap:AccumulatedNetUnrealizedInvestmentGainLossMember2017-12-310001058090us-gaap:RetainedEarningsMember2016-12-310001058090us-gaap:AdditionalPaidInCapitalMember2016-12-310001058090us-gaap:AccumulatedTranslationAdjustmentMember2016-12-310001058090us-gaap:AccumulatedNetUnrealizedInvestmentGainLossMember2016-12-310001058090us-gaap:TreasuryStockMember2018-12-310001058090us-gaap:CommonStockMember2018-12-310001058090us-gaap:TreasuryStockMember2017-12-310001058090us-gaap:CommonStockMember2017-12-310001058090us-gaap:TreasuryStockMember2016-12-310001058090us-gaap:CommonStockMember2016-12-310001058090us-gaap:StockAppreciationRightsSARSMember2018-01-012018-12-310001058090us-gaap:StockAppreciationRightsSARSMember2017-01-012017-12-310001058090cmg:StockOptionsStockAppreciationRightsSosarsMember2019-01-012019-12-310001058090cmg:StockOptionsStockAppreciationRightsSosarsMember2018-01-012018-12-310001058090cmg:StockOptionsStockAppreciationRightsSosarsMember2017-01-012017-12-310001058090cmg:RestrictedStockUnits2011StockIncentivePlanMember2018-12-310001058090cmg:PerformanceShares2011StockIncentivePlanMember2018-12-310001058090us-gaap:PerformanceSharesMember2018-01-012018-12-310001058090cmg:RestrictedStockUnitsMember2018-01-012018-12-310001058090us-gaap:PerformanceSharesMember2017-01-012017-12-310001058090cmg:RestrictedStockUnitsMember2017-01-012017-12-310001058090cmg:PerformanceSharesWithMarketConditionsMember2019-01-012019-12-310001058090cmg:PerformanceSharesGrant2Member2019-01-012019-12-310001058090cmg:PerformanceSharesWithMarketConditionsMember2018-01-012018-12-310001058090cmg:RestrictedStockUnits2011StockIncentivePlanMember2019-01-012019-12-310001058090srt:MinimumMemberus-gaap:PerformanceSharesMembercmg:VestingPeriod1Member2019-01-012019-12-310001058090srt:MaximumMemberus-gaap:PerformanceSharesMembercmg:VestingPeriod1Member2019-01-012019-12-310001058090srt:MinimumMembercmg:StockAwards2018Memberus-gaap:PerformanceSharesMembercmg:VestingPeriod1Member2018-01-012018-12-310001058090srt:MaximumMembercmg:StockAwards2018Memberus-gaap:PerformanceSharesMembercmg:VestingPeriod1Member2018-01-012018-12-310001058090srt:MinimumMembercmg:StockAwards2017Membercmg:PerformanceSharesGrant2Membercmg:VestingPeriod2Member2017-01-012017-12-310001058090srt:MinimumMembercmg:StockAwards2017Membercmg:PerformanceSharesGrant1Membercmg:VestingPeriod1Member2017-01-012017-12-310001058090srt:MaximumMembercmg:StockAwards2017Membercmg:PerformanceSharesGrant2Membercmg:VestingPeriod2Member2017-01-012017-12-310001058090srt:MaximumMembercmg:StockAwards2017Membercmg:PerformanceSharesGrant1Membercmg:VestingPeriod1Member2017-01-012017-12-310001058090us-gaap:StockAppreciationRightsSARSMembercmg:VestingPeriod2Member2019-01-012019-12-310001058090us-gaap:StockAppreciationRightsSARSMembercmg:VestingPeriod1Member2019-01-012019-12-310001058090cmg:PerformanceSharesGrant2Membercmg:SecondHalfVestedMember2019-01-012019-12-310001058090cmg:PerformanceSharesGrant2Membercmg:FirstHalfVestedMember2019-01-012019-12-310001058090cmg:PerformanceSharesGrant1Member2019-01-012019-12-310001058090cmg:StockAwards2017Membercmg:PerformanceSharesGrant2Member2017-01-012017-12-310001058090cmg:StockAwards2017Membercmg:PerformanceSharesGrant1Member2017-01-012017-12-310001058090us-gaap:StockAppreciationRightsSARSMember2019-01-012019-12-310001058090us-gaap:RestrictedStockUnitsRSUMember2019-01-012019-12-310001058090cmg:PerformanceStockAwardsPsusMember2019-01-012019-12-310001058090us-gaap:OtherRestructuringMember2019-12-310001058090us-gaap:EmployeeSeveranceMember2019-12-310001058090cmg:RecruitmentAndRelocationCostsMember2019-12-310001058090us-gaap:OtherRestructuringMember2018-12-310001058090us-gaap:EmployeeSeveranceMember2018-12-310001058090cmg:RecruitmentAndRelocationCostsMember2018-12-310001058090us-gaap:ContractTerminationMember2019-01-012019-12-310001058090cmg:ShareBasedCompensationMember2019-01-012019-12-310001058090us-gaap:OtherRestructuringMember2018-01-012018-12-310001058090us-gaap:EmployeeSeveranceMember2018-01-012018-12-310001058090us-gaap:ContractTerminationMember2018-01-012018-12-310001058090cmg:ShareBasedCompensationMember2018-01-012018-12-310001058090cmg:RecruitmentAndRelocationCostsMember2018-01-012018-12-310001058090us-gaap:OtherRestructuringMember2017-01-012017-12-310001058090us-gaap:EmployeeSeveranceMember2017-01-012017-12-310001058090us-gaap:ContractTerminationMember2017-01-012017-12-310001058090cmg:ShareBasedCompensationMember2017-01-012017-12-310001058090cmg:RecruitmentAndRelocationCostsMember2017-01-012017-12-310001058090srt:MinimumMemberus-gaap:LandAndBuildingMember2019-01-012019-12-310001058090srt:MinimumMemberus-gaap:FurnitureAndFixturesMember2019-01-012019-12-310001058090srt:MinimumMemberus-gaap:EquipmentMember2019-01-012019-12-310001058090srt:MaximumMemberus-gaap:LandAndBuildingMember2019-01-012019-12-310001058090srt:MaximumMemberus-gaap:FurnitureAndFixturesMember2019-01-012019-12-310001058090srt:MaximumMemberus-gaap:EquipmentMember2019-01-012019-12-310001058090cmg:RestuarantClosureCostsIntoOperatingLeaseAssetsMemberus-gaap:AccountingStandardsUpdate201602Member2019-01-012019-01-010001058090cmg:OfficeLeaseCorporateRestructuringCostsIntoOperatingLeaseAssetsMemberus-gaap:AccountingStandardsUpdate201602Member2019-01-012019-01-010001058090us-gaap:OtherRestructuringMember2019-01-012019-12-310001058090us-gaap:EmployeeSeveranceMember2019-01-012019-12-310001058090cmg:RecruitmentAndRelocationCostsMember2019-01-012019-12-310001058090us-gaap:ForeignCountryMember2019-12-310001058090us-gaap:ForeignCountryMember2018-12-310001058090us-gaap:GeographicDistributionForeignMember2019-12-310001058090country:US2019-12-310001058090cmg:NonChipotleRestaurantsMember2019-12-310001058090cmg:DataSecurityIncidentMember2019-12-310001058090srt:MinimumMember2019-12-310001058090srt:MaximumMember2019-12-310001058090cmg:StockOptionsAndStockAppreciationRightsSRSMember2019-01-012019-12-310001058090cmg:RestrictedStockUnitsMember2019-01-012019-12-310001058090us-gaap:PerformanceSharesMember2019-12-310001058090cmg:StockOptionsAndStockAppreciationRightsSRSMember2019-12-310001058090cmg:RestrictedStockUnitsMember2019-12-3100010580902019-07-012019-09-3000010580902019-04-012019-06-3000010580902019-01-012019-03-3100010580902018-10-012018-12-3100010580902018-07-012018-09-3000010580902018-04-012018-06-3000010580902018-01-012018-03-310001058090cmg:Plan401kMember2018-01-012018-12-310001058090cmg:Plan401kMember2017-01-012017-12-310001058090us-gaap:DomesticPlanMember2019-12-310001058090us-gaap:DomesticPlanMember2018-12-310001058090us-gaap:DomesticPlanMember2018-01-012018-12-310001058090us-gaap:DomesticPlanMember2017-01-012017-12-310001058090us-gaap:TreasuryStockMember2019-12-310001058090us-gaap:RetainedEarningsMember2019-12-310001058090us-gaap:CommonStockMember2019-12-310001058090us-gaap:AdditionalPaidInCapitalMember2019-12-310001058090us-gaap:AccumulatedTranslationAdjustmentMember2019-12-310001058090us-gaap:AccumulatedNetUnrealizedInvestmentGainLossMember2019-12-310001058090cmg:GiftCardMember2019-01-012019-12-310001058090cmg:GiftCardMember2018-01-012018-12-310001058090cmg:GiftCardMember2017-01-012017-12-310001058090cmg:GiftCardMember2019-12-310001058090cmg:ChipotleRewardsMember2019-12-310001058090cmg:GiftCardMember2018-12-3100010580902017-12-3100010580902016-12-310001058090us-gaap:TreasuryStockMember2019-01-012019-12-310001058090us-gaap:RetainedEarningsMember2019-01-012019-12-310001058090us-gaap:CommonStockMember2019-01-012019-12-310001058090us-gaap:AdditionalPaidInCapitalMember2019-01-012019-12-310001058090us-gaap:AccumulatedTranslationAdjustmentMember2019-01-012019-12-310001058090us-gaap:AccumulatedNetUnrealizedInvestmentGainLossMember2019-01-012019-12-310001058090us-gaap:TreasuryStockMember2018-01-012018-12-310001058090us-gaap:RetainedEarningsMember2018-01-012018-12-310001058090us-gaap:CommonStockMember2018-01-012018-12-310001058090us-gaap:AdditionalPaidInCapitalMember2018-01-012018-12-310001058090us-gaap:AccumulatedTranslationAdjustmentMember2018-01-012018-12-310001058090us-gaap:AccumulatedNetUnrealizedInvestmentGainLossMember2018-01-012018-12-310001058090us-gaap:TreasuryStockMember2017-01-012017-12-310001058090us-gaap:RetainedEarningsMember2017-01-012017-12-310001058090us-gaap:CommonStockMember2017-01-012017-12-310001058090us-gaap:AdditionalPaidInCapitalMember2017-01-012017-12-310001058090us-gaap:AccumulatedTranslationAdjustmentMember2017-01-012017-12-310001058090us-gaap:AccumulatedNetUnrealizedInvestmentGainLossMember2017-01-012017-12-310001058090us-gaap:AccountingStandardsUpdate201602Member2019-01-010001058090srt:RestatementAdjustmentMemberus-gaap:AccountingStandardsUpdate201602Member2018-12-310001058090srt:ScenarioPreviouslyReportedMember2018-12-3100010580902019-06-3000010580902020-01-310001058090cmg:RestrictedStockUnits2011StockIncentivePlanMember2019-12-310001058090cmg:PerformanceShares2011StockIncentivePlanMember2019-12-310001058090cmg:PerformanceShares2011StockIncentivePlanMember2019-01-012019-12-310001058090srt:MinimumMember2019-01-012019-12-310001058090srt:MaximumMember2019-01-012019-12-310001058090cmg:StockAwards2018Memberus-gaap:PerformanceSharesMember2018-01-012018-12-310001058090cmg:StockAwards2017Memberus-gaap:PerformanceSharesMembercmg:VestingPeriod2Member2017-01-012017-12-310001058090cmg:StockAwards2017Memberus-gaap:PerformanceSharesMembercmg:VestingPeriod1Member2017-01-012017-12-3100010580902019-10-012019-12-310001058090us-gaap:PerformanceSharesMember2019-01-012019-12-3100010580902018-07-012019-12-310001058090us-gaap:EmployeeStockMember2019-01-012019-12-310001058090cmg:Plan401kMember2019-01-012019-12-310001058090us-gaap:DomesticPlanMember2019-01-012019-12-3100010580902019-12-3100010580902018-12-310001058090cmg:ChipotleRewardsMember2018-12-310001058090cmg:ChipotleRewardsMember2017-12-310001058090cmg:ChipotleRewardsMember2019-01-012019-12-310001058090us-gaap:EmployeeStockMember2019-12-3100010580902019-01-012019-12-3100010580902018-01-012018-12-3100010580902017-01-012017-12-31cmg:segmentiso4217:USDxbrli:sharescmg:itemcmg:regioncmg:propertyxbrli:purexbrli:sharesiso4217:USD
UNITED STATES
SECURITIES AND EXCHANGE COMMISSION
WASHINGTON, D.C. 20549
FORM 10-K
ANNUAL REPORT PURSUANT TO SECTION 13 OR 15(d) OF THE SECURITIES EXCHANGE ACT OF 1934
For the fiscal year ended December 31, 2019
or
TRANSITION REPORT PURSUANT TO SECTION 13 OR 15(d) OF THE SECURITIES EXCHANGE ACT OF 1934
For the transition period from to
Commission File Number: 1-32731
CHIPOTLE MEXICAN GRILL, INC.
(Exact name of registrant as specified in its charter)
Delaware | 84-1219301 |
(State or other jurisdiction of incorporation or organization) | (IRS Employer Identification No.) |
610 Newport Center Drive, Suite 1300 Newport Beach, CA | 92660 |
(Address of Principal Executive Offices) | (Zip Code) |
Registrant’s telephone number, including area code: (949) 524-4000
Securities registered pursuant to Section 12(b) of the Act:
| | |
Title of each class | Trading Symbol(s) | Name of each exchange on which registered |
Common stock, par value $0.01 per share | CMG | New York Stock Exchange |
Securities registered pursuant to Section 12(g) of the Act: None
Indicate by check mark if the registrant is a well-known seasoned issuer, as defined in Rule 405 of the Securities Act. Yes No
Indicate by check mark if the registrant is not required to file reports pursuant to Section 13 or Section 15(d) of the Act. Yes No
Indicate by check mark whether the registrant: (1) has filed all reports required to be filed by Section 13 or 15(d) of the Securities Exchange Act of 1934 during the preceding 12 months (or for such shorter period that the registrant was required to file such reports), and (2) has been subject to such filing requirements for the past 90 days. Yes No
Indicate by check mark whether the registrant has submitted electronically every Interactive Data File required to be submitted pursuant to Rule 405 of Regulation S-T (§232.405 of this chapter) during the preceding 12 months (or for such shorter period that the registrant was required to submit such files). Yes No .
Indicate by check mark whether the registrant is a large accelerated filer, an accelerated filer, a non-accelerated filer, a smaller reporting company, or an emerging growth company. See the definitions of “large accelerated filer,” “accelerated filer,” “smaller reporting company,” and “emerging growth company” in Rule 12b-2 of the Exchange Act (check one):
Large accelerated filer | Accelerated filer | Non-accelerated filer | Smaller reporting company | Emerging growth company |
If an emerging growth company, indicate by check mark if the registrant has elected not to use the extended transition period for complying with accounting standards provided pursuant to Section 13(a) of the Exchange Act. ¨
Indicate by check mark whether the registrant is a shell company (as defined in Rule 12b-2 of the Act). Yes No
As of June 30, 2019, the aggregate market value of the registrant’s outstanding common equity held by non-affiliates was $14.301 billion, based on the closing price of the registrant’s common stock on June 28, 2019, the last trading day of the registrant’s most recently completed second fiscal quarter. For purposes of this calculation, shares of common stock held by each executive officer and director and by holders of 5% or more of the outstanding common stock have been excluded since those persons may under certain circumstances be deemed to be affiliates. This determination of affiliate status is not necessarily a conclusive determination for other purposes.
As of January 31, 2020, there were 27,767,965 shares of the registrant’s common stock, par value of $0.01 per share outstanding.
DOCUMENTS INCORPORATED BY REFERENCE
Part III incorporates certain information by reference from the registrant’s definitive proxy statement for the 2020 annual meeting of shareholders, which will be filed no later than 120 days after the close of the registrant’s fiscal year ended December 31, 2019.
PART I
Cautionary Note Regarding Forward-Looking Statements
This report includes “forward-looking” statements within the meaning of the Private Securities Litigation Reform Act of 1995. We use words such as “may,” “will,” “should,” “expect,” “intend,” “plan,” “anticipate,” “believe,” “think,” “estimate,” “seek,” “expect,” “predict,” “could,” “project,” “potential” and other similar terms and phrases, including references to assumptions, to identify forward-looking statements. These forward-looking statements are based on currently available operating, financial and competitive information and are subject to various risks and uncertainties. Our actual future results and trends may differ materially depending on a variety of factors, including, but not limited to, the risks and uncertainties described in this report under the heading “Risk Factors” and “Management’s Discussion and Analysis of Financial Condition and Results of Operations,” so you should not place undue reliance on forward-looking statements. These statements are subject to risks and uncertainties that could cause actual results to differ materially from those described in the statements, including: risks of food safety and food-borne illnesses and other health concerns about our food; risks associated with our reliance on certain information technology systems and potential failures or interruptions; privacy and cyber security risks related to our acceptance of electronic payments or electronic processing of confidential customer or employee information; the impact of competition, including from sources outside the restaurant industry; the increasingly competitive labor market and our ability to attract and retain qualified employees; the impact of federal, state or local government regulations relating to our employees, restaurant design and construction, or the sale of food or alcoholic beverages; our ability to achieve our planned growth, such as the availability of suitable new restaurant sites; and increases in ingredient and other operating costs due to our Food With Integrity philosophy, tariffs or trade restrictions and supply shortages. We are including this Cautionary Note to make applicable and take advantage of the safe harbor provisions of the Private Securities Litigation Reform Act of 1995 for forward-looking statements. We expressly disclaim any obligation to update or revise any forward-looking statements after the date of this report as a result of new information, future events or other developments, except as required by applicable laws and regulations.
ITEM 1. BUSINESS
General
Chipotle Mexican Grill, Inc., a Delaware corporation, together with its subsidiaries (“Chipotle”, “we”, “us”, or “our”) operates Chipotle Mexican Grill restaurants, which feature a relevant menu of burritos, burrito bowls (a burrito without the tortilla), tacos, and salads. We are cultivating a better world by serving responsibly sourced, classically cooked, real food with wholesome ingredients without artificial colors, flavors or preservatives. We are passionate about providing a great guest experience and making our food more accessible to everyone while continuing to be a brand with a demonstrated purpose. Steve Ells, founder and executive chairman, first opened Chipotle with a single restaurant in Denver, Colorado in 1993. Over 25 years later, our devotion to seeking out the very best ingredients, raised with respect for animals, farmers, and the environment, remains at the core of our commitment to Food With Integrity. As of December 31, 2019, we operated 2,580 Chipotle restaurants throughout the United States, 39 international Chipotle restaurants, and three non-Chipotle restaurants.
Business Strategy
We are a brand with a demonstrated purpose of cultivating a better world. Our mission is to win today while creating a bright future by focusing on five key fundamental strategies:
Making the brand more visible and loved;
Creating innovation utilizing a stage-gate process;
Leveraging our digital-make line to expand access and convenience;
Engaging with customers through our loyalty program;
And running successful restaurants with a strong culture that provides great food, hospitality, throughput, and economics.
Relevant Menu. Our restaurants feature a relevant menu of burritos, burrito bowls, tacos and salads. In preparing our food, we employ classic cooking methods and use stoves and grills, pots and pans, cutting knives and other kitchen utensils, walk-in refrigerators stocked with a variety of fresh ingredients, herbs and spices, and dry goods such as rice. Our restaurants do not have microwaves or freezers. Our proteins include chicken, steak, carnitas (seasoned and braised pork), barbacoa (spicy braised and shredded beef), Sofritas (organic braised tofu) and vegetarian pinto and black beans. We add our rice, which is tossed with lime juice, freshly chopped cilantro, and a pinch of salt, as well as freshly shredded cheese, sour cream, lettuce, and sautéed peppers and onions, to our entrees depending on each guest’s request. We use various herbs, spices and seasonings to prepare our meats and vegetables. We also serve tortilla chips that are fried twice a day in each restaurant and seasoned with fresh lime juice and salt, with sides of hand mashed guacamole, salsas, or queso. In addition to sodas, fruit and tea drinks, and organic milk, most of our restaurants also offer a
selection of beer and margaritas. Our food is prepared from scratch, some in our restaurants and some with the same fresh ingredients in larger batches in commissaries.
Food with Integrity. Serving high quality food while still charging reasonable prices is critical to ensuring guests enjoy wholesome food at a great value. We respect our environment and insist on preparing, cooking, and serving nutritious food made from natural ingredients and animals that are raised or grown with care. We spend time on farms and in the field to understand where our food comes from and how it is raised. We concentrate on the sourcing of each ingredient, and this has become a cornerstone of our continuous effort to improve the food we serve. Our food is made from ingredients that everyone can both recognize and pronounce. We're all about simple, fresh food without the use of artificial colors or flavors typically found in fast food—just genuine real ingredients and their individual, delectable flavors.
In all of our Chipotle restaurants, we endeavor to serve only meats that are raised in accordance with criteria we have established in an effort to improve sustainability and promote animal welfare, and without the use of non-therapeutic antibiotics or added hormones. We brand these meats as “Responsibly Raised®.” One of our primary goals is for all of Chipotle restaurants to serve meats raised to our standards, but we have and expect to continue to face challenges in doing so. For example, some of our restaurants periodically serve conventionally raised chicken or beef due to supply constraints for our Responsibly Raised brand meats or stop serving one or more menu items due to additional supply constraints. When we become aware of such an issue, we clearly and specifically disclose this temporary change on signage in each affected restaurant so that guests can adjust their orders if they choose to do so.
We also seek to use responsibly grown produce, by which we mean produce grown by suppliers whose practices conform to our priorities with respect to environmental considerations and employee welfare. Some of the beans we serve are organically grown or grown using conservation tillage methods that improve soil conditions, reduce erosion, and help preserve the environment in which the beans are grown. We call these beans “transitional.” Some of the other produce items we serve are organically grown as well. In 2019, we increased the percentage of organic cilantro, rice and beans purchased as we continue our commitment to find high quality ingredients.
Purchasing and Food Safety
Close Relationships with Suppliers. Maintaining the high levels of quality and safety we expect in our restaurants depends in part on our ability to acquire high-quality, fresh ingredients and other necessary supplies that meet our specifications from reliable suppliers. Our 23 independently owned and operated regional distribution centers purchase from various suppliers we carefully select based on quality and the suppliers’ understanding and adherence of our mission. We work closely with our suppliers and seek to develop mutually beneficial long-term relationships with them. We use a mix of forward, fixed, formula and range forward pricing protocols, and our distribution centers purchase within the pricing guidelines and protocols we have established with suppliers. We’ve also sought to increase, where practical, the number of suppliers for our ingredients to help mitigate pricing volatility and supply shortages. In addition, we closely monitor industry news, trade tariffs, weather, exchange rates, foreign demand, crises and other world events that may affect our ingredient prices. Certain key ingredients (including beef, pork, chicken, beans, rice, sour cream, cheese, and tortillas) are purchased from a small number of suppliers.
Quality Assurance and Food Safety. We are committed to serving safe, high quality food. Our food safety and quality assurance teams work to ensure compliance with our food safety programs and practices, components of which include:
supplier interventions (steps to avoid food safety risks before ingredients reach Chipotle);
advanced technologies (tools that reduce or eliminate pathogens while maintaining food quality);
small grower support and training;
enhanced restaurant procedures (protocols for handling ingredients and sanitizing surfaces in our restaurants);
food safety certifications;
internal and third-party restaurant inspections; and
ingredient traceability.
These and other food safety practices underscore our commitment to be a leader in food safety while continuing to serve high quality food that our guests love. Our food safety and quality assurance teams establish and monitor our quality and food safety programs and work closely with suppliers to ensure our high standards are met throughout the supply chain. We maintain a limited list of approved suppliers, many of whom are among the top suppliers in the industry. In addition, we have a team approach where our training, operations, culinary, legal and safety, security and risk management departments develop and implement operating standards for food quality, preparation, cleanliness, employee health protocols, and safety in the restaurants. Our food safety programs are also intended to ensure that we not only continue to comply with applicable federal, state and local food safety regulations, but also establish Chipotle as an industry leader in food safety. To help achieve this goal, we have a Food Safety Advisory Council comprised of some of the nation’s foremost food safety authorities. The Food Safety Advisory Council is charged with evaluating our programs, both in practice and implementation, and advising us on ways to elevate our already high standards for food safety. Our food safety and quality assurance team members hold board seats and participate in technical working groups with several associations. This gives us the opportunity to learn and share our knowledge and expertise with other food safety professionals and regulatory agencies.
Guest Experience and Operations
Serving delicious food, with great service in a safe, quick, clean and happy environment is always our highest priority, and we take pride in making the Chipotle experience exceptional. We invest in training to consistently deliver an outstanding guest experience, and in our facilities to improve the appearance of our restaurants and modernize tools. We are also focused on making progress in throughput and getting our guests quality food quickly.
Restaurant Team. We believe creating an excellent guest experience starts with hiring great leaders and creating great teams. Each restaurant typically has a General Manager or Restaurateur (a high-performing general manager), an Apprentice Manager (in a majority of our restaurants), two or three Service Managers, one or two Kitchen Managers and an average of 26 full and part-time crew members, though our busier restaurants tend to have slightly more employees. We generally have two shifts at our restaurants, which simplifies scheduling and provides stability for our employees. In addition to the employees serving our guests at each restaurant, we also have a field support system that includes Field Leaders and Team Directors, as well as Executive Team Directors who report to our Chief Restaurant Officer.
Innovation. We are prioritizing the development of technological and other innovations, such as digital/mobile ordering platforms, digital order pick-up lanes we call “Chipotlanes”, delivery and catering, that allow our guests to engage with us in whatever fashion is most convenient for them. By allowing our guests to order and receive their food in a variety of ways, we believe we can attract more guests and encourage them to choose us more frequently. During 2019, we completed the installation of mobile order pick-up shelves as well as digital make lines in almost all of our restaurants which allows us to fulfill catering or digital/mobile orders without disrupting throughput on our main service line. Additionally, we have enhanced our data capabilities to allow us to better identify individual guests and their unique frequency patterns, and to target our marketing and promotional efforts at the individual level. We are also testing new menu items. We have built a stage-gate process around innovation where we test, learn and iterate, so that when we roll out a new initiative, we are highly confident in the probability of success.
Marketing
Our marketing programs are designed to increase transactions and grow sales by driving culture, driving a difference, and ultimately driving purchases. Our ultimate marketing mission is to make Chipotle not just a food brand, but also a purpose driven lifestyle brand that is more visible, more engaging, and more relevant.
In 2019, we made our brand more visible with culturally relevant marketing campaigns and initiatives. This included the Behind the Foil advertising campaign which showcased our real ingredients, fresh food and the culinary skills of our team members in action. We also launched a new loyalty program, Chipotle Rewards, that currently has more than 8 million members and provides us with customer information that can be used to incent behaviors and engage with our customers on a more personal level.
Our marketing efforts this year were elevated by our stage-gate innovation process that identifies and validates new initiatives and menu items in test markets before they are rolled out more widely. We rolled out several successful menu items including our digital only Lifestyle Bowls, which help our guests reach or maintain their health and wellness goals, and carne asada, a premium seasoned steak.
We utilize multiple marketing channels, including national television, digital marketing, social media, fundraising, events and sponsorships to make our brand more visible. We have invested and will continue to invest in extensive customer research that will give us insight into our consumers in order to inform our business decisions, media, messaging, and innovation pipeline.
Competition
The fast-casual, quick-service, and casual dining segments of the restaurant industry are highly competitive with respect to, among other things, taste, price, food quality and presentation, service, location, convenience, brand reputation, cleanliness, and ambience of each restaurant. Our competition includes a variety of restaurants in each of these segments, including locally-owned restaurants, as well as national and regional chains. Many of our competitors offer dine-in, carry-out, online, catering, and delivery services. Among our main competitors are a number of multi-unit, multi-market Mexican food or burrito restaurant concepts, some of which are expanding nationally. In recent years, competition has increased significantly from restaurant formats like ours that serve higher quality food, quickly and at a reasonable price.
Moreover, we may also compete with companies outside the fast-casual, quick-service, and casual dining segments of the restaurant industry. For example, competitive pressures can come from deli sections and in-store cafés of major grocery store chains, including those targeted at customers who seek higher-quality food, as well as from convenience stores, cafeterias, and other dining outlets. Meal kit delivery companies and other eat-at-home options also present some degree of competition for our restaurants.
Competition has made it more challenging to maintain or increase the frequency of customer visits, however we believe that we can differentiate ourselves with our fresh ingredients and our purpose of cultivating a better world.
Restaurant Site Selection
We believe restaurant site selection is critical to our long-term success and growth strategy. As a result, we devote substantial time and effort to carefully evaluate each potential new restaurant location. Our site selection process is led by our internal team of real estate managers and includes external real estate brokers with expertise in specific markets, as well as support from an internal real estate strategy and research group. We thoroughly assess the surrounding trade area, demographic and business information within that area, and available information on competitors and other restaurants. Based on this analysis, including utilization of predictive modeling using proprietary formulas, we determine projected sales and targeted return on investment for each potential restaurant site. We have been successful in a number of different types of locations, such as in-line or end-cap locations in strip or power centers, in regional malls and downtown business districts, free-standing buildings, food courts, outlet centers, airports, military bases and train stations.
Other Restaurant Concepts
Although in 2020 our focus will remain on thoughtfully growing the Chipotle brand, we believe that the fundamental principles on which our restaurants are based – sourcing better ingredients, preparing them using classic techniques in front of our guests, and serving them in an interactive format with great teams dedicated to providing an excellent dining experience – can be adapted to cuisines other than the food served at Chipotle. We have invested in innovative concepts such as Pizzeria Locale, a fast-casual pizza restaurant that has three restaurants in Denver, Colorado.
Information Systems and Cyber Security
We use a variety of applications and systems to securely manage the flow of information within each of our restaurants and centralized corporate infrastructure. The services available within our systems and applications include restaurant operations, supply chain, inventory, scheduling, training, human capital management, financial tools, and data protection services. Our digital ordering system allows guests to place orders online or through our mobile app and enables delivery by third-party services with which we have entered into delivery agreements. We also continue to modernize and make investments in our information technology networks and infrastructure, specifically in our physical and technological security measures to anticipate cyber-attacks in order to combat breaches, as well as provide improved control, security and scalability.
Government Regulation and Environmental Matters
We are subject to various federal, state and local laws and regulations that govern aspects of our business operations, including:
employment practices, such as wage and hour and fair work week regulations, requirements to provide meal and rest periods, family leave mandates, workplace safety and accommodations to certain employees, citizenship or work authorization requirements, insurance and workers’ compensation rules, and anti-discrimination and anti-harassment laws;
privacy and data security, laws governing the collection, maintenance and use of information regarding employees and guests and consumer credit protection and fraud;
compliance with the Americans with Disabilities Act and similar laws that give civil rights protections to individuals with disabilities in the context of employment, public accommodations and other areas;
food safety and nutrition, including nutritional menu labeling nutrition and advertising practices;
environmental practices, including concerning the discharge, storage, handling, release and disposal of hazardous or toxic substances, and regulations restricting the use of straws, utensils and the types of packaging we can use in our restaurants; and
licensing and regulation by health, alcoholic beverage, sanitation, food and other agencies.
Employees
As of December 31, 2019, we had about 83,000 employees, including about 6,000 salaried employees and about 77,000 hourly employees. None of our employees are unionized or covered by a collective bargaining agreement.
Seasonality
Seasonal factors influencing our business are described under the heading “Quarterly Financial Data/Seasonality” in Item 7. “Management’s Discussion and Analysis of Financial Condition and Results of Operations.”
Our Intellectual Property and Trademarks
“Chipotle,” “Chipotle Mexican Grill,” “Food With Integrity,” “Responsibly Raised,” “Chipotle Rewards,” and a number of other marks and related designs and logos are U.S. registered trademarks of Chipotle. We have filed trademark applications for a number of additional marks in the U.S. as well. In addition to our U.S. registrations, we have registered trademarks for “Chipotle” and a number of other marks in Canada, the European Union and various other countries, and have filed trademark applications for “Chipotle Mexican Grill,” “Chipotle” and a number of other marks in additional countries. We also believe that the design of our restaurants is our proprietary trade dress and have registered elements of our restaurant design for trade dress protection in the U.S. as well.
From time to time we have taken action against other restaurants that we believe are misappropriating our trademarks, restaurant designs or advertising. Although our policy is to protect and defend vigorously our rights to our intellectual property, we may not be able to adequately protect our intellectual property, which could harm the value of our brand and adversely affect our business.
Available Information
We maintain a website at www.chipotle.com, including an investor relations section at ir.chipotle.com in which we routinely post important information, such as webcasts of quarterly earnings calls and other investor events in which we participate or host, and any related materials. Our Code of Conduct is also available in this section of our website. You may access our annual reports on Form 10-K, quarterly reports on Form 10-Q, current reports on Form 8-K and amendments to those reports, as well as other reports relating to us that are filed with or furnished to the SEC, free of charge in the investor relations section of our website as soon as reasonably practicable after such material is electronically filed with or furnished to the SEC. The SEC also maintains a website that contains reports, proxy and information statements and other information regarding issuers that file electronically with the SEC at www.sec.gov.
The contents of the websites mentioned above are not incorporated into and should not be considered a part of this report. The references to the URLs for these websites are intended to be inactive textual references only.
ITEM 1A RISK FACTORS
You should carefully consider the risks described below in addition to the other information set forth in this Annual Report on Form 10-K, including the Management’s Discussion and Analysis of Financial Conditions and Results of Operations section and the consolidated financial statements and related notes. If any of the risks and uncertainties described below actually occur or continue to occur, our business, financial condition and results of operations, and the trading price of our common stock could be materially and adversely affected. The risks and uncertainties described below are those that we have identified as material but are not the only risks and uncertainties we face. Our business is also subject to general risks and uncertainties that affect many other companies, including, but not limited to, overall economic and industry conditions and additional risks not currently known to us or that we presently deem immaterial may arise or become material and may negatively impact our business, reputation, financial condition, results of operations or the trading price of our common stock.
Risks Related to our Business and Industry
Food safety and food-borne illness concerns may have an adverse effect on our business by decreasing sales and increasing costs.
Food safety is our top priority, and we dedicate substantial resources to ensuring that our guests enjoy safe, high-quality food products. Even with strong preventative controls and interventions, food safety incidents continue to occur in the food service industry because food safety risks cannot be completely eliminated in any restaurant, including as a result of possible failures by restaurant crew or suppliers to follow food safety policies and procedures. Although we test and audit these activities, we cannot guarantee that all food items are safely and properly maintained during transport or distribution throughout the supply chain. Regardless of the source or cause, any report of food-borne illnesses such as E. coli, hepatitis A, norovirus or salmonella, and other food safety issues, including food tampering or contamination, at one of our restaurants could adversely affect our reputation and have a negative impact on our sales. Even instances of food-borne illness, food tampering or food contamination that occur solely at competitors’ restaurants could result in negative publicity about the food service industry generally and adversely impact our sales. Social media has dramatically increased the rate at which negative publicity, including as it relates to food safety incidents, can be disseminated before there is any meaningful opportunity to respond or address an issue. The occurrence of food-borne illnesses or food safety issues could also adversely affect the price and availability of affected ingredients, resulting in higher costs and lower margins.
Several highly publicized food safety incidents in our restaurants and our Food With Integrity business principles may make us more susceptible than our competitors to significant adverse consequences arising from food safety incidents. From 2015 to 2017, illnesses caused by E. coli bacteria and norovirus were connected to a number of our restaurants and, in 2018, illnesses believed to be caused by c. perfringens bacteria were connected to the food in one of our restaurants. As a result of these incidents and the related negative publicity, our sales and profitability were severely impacted throughout 2016 and from time to time through 2018. Because of consumer perceptions in the wake of these food safety incidents, any future food safety incidents associated with our restaurants—even incidents that may be considered minor at other restaurants—may have a more significant negative impact on our sales and our ability to regain guests. In addition, we may be at a higher risk for food safety incidents than some competitors due to our greater use of fresh, unprocessed produce and meats, our reliance on employees cooking with traditional methods rather than automation, and our avoidance of frozen ingredients. The risk of illnesses associated with our food also may increase due to the growth of our delivery or catering businesses, in which our food is transported and/or served in transportation conditions that we cannot control. All of these factors could have an adverse impact on our ability to attract and retain guests, which could in turn have a material adverse effect on our growth and profitability.
Information technology system failures or interruptions could harm our ability to effectively operate our business and/or result in the loss of guests or employees.
We rely heavily on information technology systems, including the point-of-sale and payment processing system in our restaurants, technologies supporting our digital and delivery businesses, technologies that facilitate e-commerce, marketing programs, employee engagement and payroll processing, management of our supply chain, and various other processes and transactions. Our ability to effectively manage our business and coordinate the procurement, production, distribution and sale of our products depends significantly on the availability, reliability, security and capacity of these systems. Despite the implementation of protective measures, these technology systems and solutions could become vulnerable to damage, disability or failures due to theft, fire, power loss, telecommunications failure or other catastrophic events. We also are in the process of implementing a new enterprise resource planning (ERP) system, which will significantly impact our financial reporting control environment. If we fail to successfully implement the new system and effectively train our employees and update our processes, we could experience disruptions or delays in processing financial and business information. Our increasing reliance on systems operated by third parties, including delivery aggregators and payment processors, also present the risks faced by the third-party’s business, including the operational, security and credit risks of those parties. If those systems were to become unreliable, unavailable, compromised or otherwise fail, and we were unable to recover in a timely manner, we could experience an interruption in our operations that could have a material adverse impact on our profitability.
Cyber security breaches or other privacy or data security incidents that expose confidential guest, personal employee and other material, confidential information may adversely affect our business.
A cyber incident generally refers to any intentional attack or an unintentional event that results in unauthorized access to systems to disrupt operations, corrupt data or steal or expose confidential information or intellectual property. A cyber incident that compromises the information of our guests or employees could result in widespread negative publicity, damage to our reputation, a loss of guests, disruption of our business and legal liabilities. In recent years as our reliance on technology has increased, so have the scope and severity of risks posed to our systems from cyber threats. The techniques and sophistication used to conduct cyber-attacks and breaches of information technology systems, as well as the sources and targets of these attacks, change frequently and are often not recognized until such attacks are launched or have been in place for a period of time. We continuously monitor and develop our information technology networks and infrastructure to prevent, detect, address and mitigate the risk of unauthorized access, misuse, malware and other events that could have a security impact; however there can be no assurance that these measures will be effective.
The majority of our restaurant sales are made by credit or debit cards. We also maintain certain personal information regarding our employees and confidential information about our guests and suppliers. We segment our card data environment and employ a cyber security protection program that is based on proven industry frameworks. This program includes but is not limited to cyber security techniques, tactics and procedures, including the deployment of a robust set of security controls, continuous monitoring and detection programs, network protections, vendor selection criteria, secure software development programs and ongoing employee training, awareness and incident response preparedness. In addition, we continuously scan our environment for any vulnerabilities, perform penetration testing, engage third parties to assess effectiveness of our security measures and collaborate with members of the cyber security community. However, there are no assurances that such programs will prevent or detect cyber security breaches.
From time to time we have been, and likely will continue to be, the target of cyber and other security threats. In April 2017, malware was detected in our payment processing network that was designed to access payment card data from cards used at point-of-sale devices at most of our restaurants. We removed the malware from our systems and enhanced our security measures; however, we incurred significant costs and legal liabilities in connection with this incident. See Note 13. “Commitments and Contingencies” to our financial statements for a description of this incident. Some of our guests also have experienced account takeover fraud, in which guests use the same log in credentials on multiple websites and, when a third party obtains those credentials, they can gain unauthorized access to their accounts and charge food orders to the credit card linked to the account (without accessing credit card data). We may in the future become subject to other legal proceedings for purportedly fraudulent transactions arising out of the actual or alleged theft of our consumers’ credit or debit card information or if consumer or employee information is obtained by unauthorized persons or used inappropriately. Any such claim or proceeding, or any adverse publicity resulting from such an event, may have a material adverse effect on our business and the potential of incurring significant remediation costs.
Security breaches also could result in a violation of applicable U.S. and international privacy and other laws, and subject us to private consumer, business partner, or securities litigation and governmental investigations and proceedings, any of which could result in our exposure to material civil or criminal liability. For example, the European Union adopted a regulation that became effective in May 2018, called the General Data Protection Regulation (“GDPR”), which requires companies to meet new requirements regarding the handling of personal data, including its use, protection and transfer and the ability of persons whose data is stored to correct or delete such data about themselves. Failure to meet the GDPR requirements could result in penalties of up to 4% of annual worldwide revenue. The GDPR also confers a private right of action on certain individuals and associations. Additionally, the California Privacy Act of 2018 (“CCPA”), which became effective on January 1, 2020, provides a new private right of action for data breaches and requires companies that process information on California residents to make new disclosures to consumers about their data collection, use and sharing practices and allow consumers to opt out of certain data sharing with third parties. If we fail, or are perceived to have failed, to properly respond to security breaches of our or third party’s information technology systems or fail to properly respond to consumer requests under the CCPA, we could experience reputational damage, adverse publicity, loss of consumer confidence, reduced sales and profits, complications in executing our growth initiatives and regulatory and legal risk, including criminal penalties or civil liabilities.
Compliance with the GDPR, the CCPA and other current and future applicable international and U.S. privacy, cybersecurity and related laws can be costly and time-consuming. We make significant investments in technology, third-party services and personnel to develop and implement systems and processes that are designed to anticipate cyber-attacks and to prevent or minimize breaches of our information technology systems or data loss, but these security measures cannot provide assurance that we will be successful in preventing such breaches or data loss. In addition, media or other reports of existing or perceived security vulnerabilities in our systems or those of our third-party business partners or service providers can also adversely impact our brand and reputation and materially impact our business, even if no breach has been attempted or has occurred.
The retail food industry in which we operate is highly competitive. If we are not able to compete successfully, our business, financial condition and results of operations would be adversely affected.
The retail food industry in which we operate is highly competitive with respect to taste, price, food quality and selection, customer service, brand reputation, digital engagement, advertising levels and promotional initiatives, and the location, attractiveness and maintenance of restaurants. We also compete with a number of non-traditional market participants, such as convenience stores, grocery stores, coffee shops and meal kit delivery services. Competition from delivery aggregators and other food delivery services has also increased in recent years, particularly in urbanized areas, and is expected to continue to increase. Increased competition could have an adverse effect on our sales, profitability and development plans. If consumer or dietary preferences change, if our marketing efforts are unsuccessful, or if our restaurants are unable to compete successfully with other retail food outlets, our business could be adversely affected.
We continue to believe that our commitment to higher-quality and responsibly sourced ingredients gives us a competitive advantage; however, more competitors have made claims related to the quality of their ingredients and lack of artificial flavors, colors and preservatives. The increasing use of these claims by competitors, regardless of the accuracy of such claims, may lessen our differentiation and make it more difficult for us to compete. If we are unable to continue to maintain our distinctiveness and compete effectively, our business, financial condition and results of operations would be adversely affected.
If we are not able to hire, train, reward and retain qualified restaurant crew and/or if we are not able to appropriately plan our workforce, our growth plan and profitability could be adversely affected.
We rely on our restaurant-level employees to consistently provide high-quality food and experiences to our guests. In addition, our ability to continue to open new restaurants depends on our ability to recruit, train and retain high-quality crew members to manage and work in our restaurants. Maintaining appropriate staffing in our existing restaurants and hiring and training staff for our new restaurants requires precise workforce planning. If we fail to appropriately plan our workforce, it could adversely impact guest satisfaction, operational efficiency and restaurant profitability. In addition, if we fail to adequately monitor and proactively respond to employee dissatisfaction, it could lead to poor guest satisfaction, higher turnover, litigation and unionization efforts. The low level of unemployment in the United States is resulting in aggressive competition for talent, wage inflation and pressure to improve benefits and workplace conditions to remain competitive. A shortage of quality candidates who meet legal citizenship or work authorization requirements, our failure to recruit and retain new restaurant crew members in a timely manner or higher employee turnover levels all could affect our ability to open new restaurants and grow sales at existing restaurants, and we may experience higher than projected labor costs.
Substantially all of our restaurants operate in leased properties subject to long-term leases. If we are unable to secure new leases on favorable terms, terminate unfavorable leases or renew or extend favorable leases, our profitability may suffer.
Substantially all of our restaurants operate in leased facilities. Locating and securing suitable lease facilities for new restaurants is becoming increasing challenging as competition for restaurant sites in our target markets is intense. Development and leasing costs are increasing, particularly for urban locations. These factors could negatively impact our ability to manage our occupancy costs, which may adversely impact our profitability. In addition, any of these factors may be exacerbated by economic factors, which may result in an increased demand for developers and contractors that could drive up our construction and leasing costs. Also, as we open and operate more restaurants, our rate of expansion relative to the size of our existing restaurant base will decline, making it increasingly difficult to achieve levels of sales and profitability growth that we achieved in prior years.
From time to time we close or relocate a restaurant as a result of adverse economic conditions in an area if a current location becomes less profitable. Because substantially all of our restaurants operate in leased facilities, we may incur significant lease termination expenses when we close or relocate a restaurant and are often obligated to continue rent and other lease related payments after restaurant closure. We also may incur significant asset impairment and other charges in connection with closures and relocations. If the lease termination cost is significant, we may decide to keep underperforming restaurants open. Ongoing lease obligations at closed or underperforming restaurant locations could decrease our results of operations. In addition, we may be unable to renew a lease or be unable to renew a lease without substantial additional cost at the end of the lease term and expiration of all renewal periods. As a result, we may be required to close or relocate a restaurant, which could subject us to construction and other costs and risks that may have an adverse effect on our operating performance.
If we are unable to meet our projections for new restaurant openings, or efficiently maintain the attractiveness of our existing restaurants, our profitability could suffer.
Our growth strategy depends on our ability to continue to open new restaurants and operate them profitably. Historically, it could take up to 24 months to ramp up a new restaurant, during which the restaurant generates sales and income below the levels at which we expect them to normalize and during which costs may be higher as we train new employees and adjust our food deliveries and preparation to sales trends. If we are unable to build the customer base that we expect or overcome the initial higher fixed costs associated with new restaurants, our new restaurants may not be as profitable as our existing restaurants. Our ability to open and profitably operate new restaurants also is subject to various risks, such as the identification and availability of economically viable locations, the negotiation of acceptable lease terms, the need to obtain all required governmental permits (including zoning approvals and liquor licenses) and to comply with other regulatory requirements, the availability of capable contractors and subcontractors, the ability to meet construction schedules and budgets, the ability to manage labor activities that could delay construction, increases in labor and building material costs, changes in weather or other acts of God that could result in construction delays and adversely affect the results of one or more restaurants for an indeterminate amount of time, our ability to hire and train qualified management personnel and general economic and business conditions. At each potential location, we compete with other restaurants and retail businesses for desirable development sites, construction contractors, management personnel, hourly employees and other resources. If we are unable to successfully manage these risks, we could face increased costs and lower than anticipated sales and earnings in future periods.
In addition, in an effort to increase same-restaurant sales and improve our operating performance, we continue to improve our existing restaurants through our remodels and upgrades. If the costs associated with remodels or upgrades are higher than anticipated, restaurants are closed for remodeled for longer periods than planned or remodeled restaurants do not perform as expected, we may not realize our projected desired return on investment, which could have a negative effect on our operating results.
Our inability or failure to recognize, respond to and effectively manage the accelerated impact of social media could have a material adverse impact on our business.
There has been a marked increase in the use of social media and similar platforms, including blogs, microblogs, video-sharing and messaging platforms and other forms of internet-based communications that allow immediate access to a broad audience. These platforms have dramatically increased the speed of dissemination and accessibility of information, including negative publicity related to food safety incidents and guest experience. Information, whether accurate or inaccurate, can be disseminated before there is any meaningful opportunity to respond or address an issue. The dissemination of information via social media could harm our business, prospects, financial condition, and results of operations, regardless of the information’s accuracy.
As part of our marketing efforts, we rely on social media platforms to attract and retain guests. New social media platforms are rapidly being developed, potentially making more traditional social media platforms obsolete. As a result, we need to continuously innovate and develop our social media strategies in order to maintain broad appeal with guests and brand relevance. We also continue to invest in other digital marketing initiatives that allow us to reach our guests across multiple digital channels and build their awareness of, engagement with, and loyalty to us. These initiatives may not be successful, resulting in expenses incurred without the benefit of higher revenues, increased employee engagement or brand recognition. Other risks associated with the use of social media include improper disclosure of proprietary information, negative comments about us, exposure of personally identifiable information, fraud, hoaxes or malicious dissemination of false information. The inappropriate use of social media by our guests or employees could increase our costs, lead to litigation or result in negative publicity that could damage our reputation.
Our failure to comply with various applicable federal and state employment and labor laws and regulations could have a material, adverse impact on our business.
Various federal and state employment and labor laws and regulations govern our relationships with our employees, and similar laws and regulations apply to our operations outside of the U.S. These laws and regulations relate to matters such as employment discrimination, wage and hour laws, requirements to provide meal and rest periods or other benefits, family leave mandates, requirements regarding working conditions and accommodations to certain employees, citizenship or work authorization and related requirements, insurance and workers’ compensation rules, healthcare laws, scheduling notification requirements and anti-discrimination and anti-harassment laws. Complying with these laws and regulations subjects us to substantial expense and non-compliance could expose us to significant liabilities. For example, a number of lawsuits have been filed against us alleging violations of federal and state laws regarding employee wages and payment of overtime, meal and rest breaks, employee classification, employee record-keeping and related practices with respect to our employees. We incur legal costs to defend, and we could suffer losses from, these and similar cases, and the amount of such losses or costs could be significant. In addition, several states and localities in which we operate, and the federal government have from time to time enacted minimum wage increases, changes to eligibility for overtime pay, paid sick leave and mandatory vacation accruals, and similar requirements. These changes have increased our labor costs and may have a further negative impact on our labor costs in the future.
In addition, several jurisdictions, including New York City have implemented Fair Workweek (or Secure Scheduling) legislation, which impose complex requirements related to scheduling for certain restaurant and retail employee and Sick Pay/Paid Time Off Legislation, which requires employers to provide paid time off to employees. Other jurisdictions where we operate are considering enacting similar legislation. All of these regulations impose additional obligations on us and could increase our costs of doing business. Our failure to comply with any of these laws and regulations could lead to higher employee turnover and negative publicity, and subject us to penalties and other legal liabilities, which could adversely affect our business and results of operations.
In addition, a significant number of our restaurant crew are paid at rates related to the applicable minimum wage. Federal, state and local proposals that increase minimum wage requirements or mandate other employee matters could, to the extent implemented, materially increase our labor and other costs. Several states in which we operate have approved minimum wage increases that are above the federal minimum. As more jurisdictions implement minimum wage increases, we expect our labor costs will continue to increase. Our ability to respond to minimum wage increases by increasing menu prices depends on willingness of our guests to pay the higher prices and our perceived value relative to competitors. Our distributors and suppliers could also be affected by higher minimum wage, benefit standards and compliance costs, which could result in higher costs for goods and services supplied to us.
Additionally, while our employees are not currently covered by any collective bargaining agreements, union organizers have engaged in efforts to organize our employees and those of other restaurant companies. If a significant portion of our employees were to become covered by collective bargaining agreements, our labor costs could increase, and it could negatively impact our culture and reduce our flexibility to attract and retain top performing employees.
Increase in ingredient and other operating costs could adversely affect our results of operations.
Our profitability depends in part on our ability to anticipate and react to changes in commodity costs, including ingredients, paper, supplies, fuel, utilities and distribution, and other operating costs, including leasing costs and labor. Any volatility in key commodity prices or fluctuation in labor costs could adversely affect our operating results by impacting restaurant profitability. The markets for some of the ingredients we use, such as beef, avocado and chicken, are particularly volatile due to factors such as seasonal shifts, climate conditions, industry demand, including as a result of animal disease outbreaks in other parts of the world, international commodity markets, food safety concerns, product recalls and government regulation. Increasing weather volatility or other long-term changes in global weather patterns, including any changes associated with global climate change, could have a significant impact on the price or availability of some of our ingredients. These factors are beyond our control and, in many instances, unpredictable. Volatility in prices or disruptions in supply also may result from governmental actions, such as changes in trade-related tariffs or controls, sanctions and counter sanctions, government-mandated closure of our suppliers’ operations, and asset seizures. The cost and disruption of responding to governmental investigations or inquiries, whether or not they have merit, or the impact of these other measures, may impact our results and could cause reputational or other harm.
We also could be adversely impacted by price increases specific to meats raised in accordance with our sustainability and animal welfare criteria, or other ingredients grown in accordance with our Food With Integrity specifications, the markets for which are generally smaller and more concentrated than the markets for conventionally raised or grown ingredients. Any increase in the prices of the ingredients most critical to our menu, such as chicken, beef, dairy (for cheese and sour cream), avocados, beans, rice, tomatoes and pork, would have a particularly adverse effect on our operating results. Alternatively, in the event the cost of one or more ingredients significantly increases, we may choose to temporarily suspend serving menu items, such as guacamole or one of our proteins, that use those ingredients rather than pay the increased cost. Any such changes to our available menu may negatively impact our restaurant traffic and could adversely impact our sales and brand. We can only partially address future price risk through forward contracts, careful planning and other activities, and therefore increases in commodity costs could have an adverse impact on our profitability.
Shortages or interruptions in the supply or delivery of ingredients could adversely affect our operating results.
Our business is dependent on frequent and consistent deliveries of ingredients that comply with our Food With Integrity specifications. Shortages, delays or interruptions in the supply of ingredients and other supplies to our restaurants may be caused by inclement weather, natural disasters, labor issues or other operational disruptions at our suppliers, distributors or transportation providers, or other conditions beyond our control. In addition, we have a single or a limited number of suppliers for some of our ingredients, including certain cuts of beef, tomatoes and adobo. Although we believe we have potential alternative suppliers and sufficient reserves of ingredients, shortages or interruptions in our supply of ingredients could adversely affect our financial results.
Our inability or failure to execute on a comprehensive business continuity plan following a major natural disaster such as a hurricane, earthquake or manmade disaster, including fire or terrorism, at our restaurant support centers could have a material adverse impact on our business.
Many of our corporate systems and processes and corporate support for our restaurant operations are centralized at one location. We have disaster recovery procedures and business continuity plans in place to address most events of a crisis nature, including hurricanes and other natural disasters, and back up and off-site locations for recovery of electronic and other forms of data and information. However, if we are unable to fully implement our disaster recovery plans, we may experience delays in recovery of data, inability to perform vital corporate functions, tardiness in required reporting and compliance, failures to adequately support field operations and other breakdowns in normal communication and operating procedures that could have a material adverse effect on our financial condition, results of operation and exposure to administrative and other legal claims. In addition, these threats are constantly evolving, which increases the difficulty of accurately and timely predicting, planning for and protecting against the threat. As a result, our disaster recovery procedures and business continuity plans security may not adequately address all threats we face or protect us from loss.
Our failure to effectively manage our growth could have a negative adverse effect on our business and financial results.
As of December 31, 2019, we operated 2,619 Chipotle restaurants and we plan to open a significant number of new restaurants in the next few years. Our existing restaurant management systems, back office technology systems and processes, financial and management controls, information systems and personnel may not be adequate to support our continued growth. To effectively manage our growth, we may need to upgrade, expand or enhance our infrastructure and information systems, as well as hire, train and retain restaurant crew and corporate support staff, which may result in increased costs or inefficiencies. We also place a lot of importance on our culture, which we believe has been an important contributor to our success. As we continue to grow, it may be increasingly difficult to maintain our culture. Our failure to effectively manage our growth could harm our business and operating results.
The increasing impact of and focus on sustainability and climate change could increase our costs, harm our reputation and adversely affect our financial results.
There has been increasing public focus by investors, environmental activists, the media and governmental and nongovernmental organizations on social and environmental sustainability matters, including packaging and waste, animal health and welfare, human rights, carbon footprints, deforestation and land use. In addition, we and our supply chain are subject to increased costs arising from the effects of climate change, greenhouse gases and diminishing energy and water resources. As a result, we have experienced increased pressure to make commitments relating to social and environmental sustainability, set science-based targets related to climate change and establish specific strategic initiatives relating to sustainability. If we are not effective in addressing social and environmental sustainability matters, or set and meet achievable sustainability goals, consumer trust in our brand may suffer. In addition, the costs to achieve our sustainability goals and the increased costs in our supply chain resulting from the impact of climate change, could have a material adverse effect on our business and financial condition.
If we do not continue to persuade consumers of the benefits of paying higher prices for our higher-quality food, our sales and results of operations could be hurt.
Our success depends in large part on our ability to persuade consumers that food made with ingredients that were raised or grown in accordance with our Food With Integrity principles is worth paying a higher price at our restaurants relative to prices of some of our competitors, particularly quick-service restaurant competitors. Under our Food With Integrity principles, for example, animals must be responsibly raised, and the milk in our sour cream, cheese and queso must come from cows that have not been treated with rBGH, which practices typically are more costly than traditional farming. If we are not able to successfully persuade consumers that consuming food made consistent with our Food With Integrity principles is better for them and the environment, or if consumers are not willing to pay the prices we charge, our sales could be adversely affected, which would negatively impact our results of operations.
We could be party to litigation or other legal proceedings that could adversely affect our business, results of operations and reputation.
We have been and, in the future, could be subject to litigation and other legal proceedings that may adversely affect our business. These legal proceedings may involve claims brought by employees, guests, government agencies, suppliers, shareholders or others through private actions, class actions, administrative proceedings, regulatory actions or other litigation. These legal proceedings may involve allegations of illegal, unfair or inconsistent employment practices, including wage and hour, vacation and family leave laws, discrimination, and wrongful termination; food safety issues including poor food quality, food-borne illness, food contamination and adverse health effects from consumption of our food products; data security or privacy breaches; guest discrimination; personal injury in our restaurants; trademark infringement; violation of the federal securities laws or other concerns. For example, several lawsuits were filed against us in connection with malware that we detected in our payment processing network in 2017 alleging, among other things, that we negligently failed to provide adequate security to protect the payment card information of our customers; a number of lawsuits have been filed against us alleging violations of federal and state employment laws, including wage and hour claims; and we are the subject of an official criminal investigation being conducted by the U.S. Attorney’s Office for the Central District of California, in conjunction with the U.S. Food and Drug Administration’s Office of Criminal Investigations, related to company-wide food safety matters dating back to January 1, 2013. See Note 13. “Commitments and Contingencies” to our financial statements for a description of potential liabilities in connection with these matters. We could be involved in similar or even more significant litigation and legal proceedings in the future. Even if the allegations against us in current or future legal matters are unfounded or we ultimately are not held liable, the costs to defend ourselves may be significant and the litigation may subject us to substantial settlements, fines, penalties or judgments against us and may divert management's attention away from operating our business, all of which could negatively impact our financial condition and results of operations. Litigation also may generate negative publicity, regardless of whether the allegations are valid, or we ultimately are liable, which could damage our reputation, and adversely impact our sales and our relationship with our employees.
A failure to recruit, develop and retain effective leaders or the loss or shortage of personnel with key capacities and skills could impact our strategic growth plans and jeopardize our ability to meet our business performance expectations and growth targets.
Our ability to continue to grow our business depends substantially on the contributions and abilities of our executive leadership team and other key management personnel. Changes in senior management could expose us to significant changes in strategic direction and initiatives. A failure to maintain appropriate organizational capacity and capability to support our strategic initiatives or to build adequate bench strength with key skillsets required for seamless succession of leadership, could jeopardize our ability to meet our business performance expectations and growth targets. If we are unable to attract, develop, retain and incentivize sufficiently experienced and capable management personnel, our business and financial results may suffer.
Our digital business, which has become an increasing significant part of our business, is subject to risks.
In 2019, 18% of our revenue was derived from digital orders, which includes delivery and customer pickup. We have implemented technology, targeted advertising and promotions and remodeled our restaurants, including adding Chipotlanes, to accommodate the growth of our digital business. If we do not continue to grow our digital business, it may be difficult for us to achieve our planned sales growth. We rely on third-party delivery services to fulfill delivery orders, and the ordering and payment platforms used by these third-parties, or our mobile app or online ordering system, could be interrupted by technological failures, user errors, cyber-attacks or other factors, which could adversely impact sales through these channels and negatively impact our reputation. Additionally, our delivery partners are responsible for order fulfillment and errors or failures to make timely deliveries could cause guests to stop ordering from us. The third-party restaurant delivery business is intensely competitive, with a number of players competing for market share, online traffic capital, and delivery drivers. If the third-party delivery services that we utilize cease or curtail operations, increase their fees, or give greater priority or promotions on their platforms to our competitors, our delivery business and our sales may be negatively impacted.
General Business and Regulatory Risks
We are subject to extensive laws, government regulation, and other legal requirements and our failure to comply with existing or new laws and regulations could adversely affect our operational efficiencies, ability to attract and retain talent and results of operations.
Our business is subject to extensive federal, state, local and international laws and regulations, including those relating to:
preparation, sale and labeling of food, including regulations of the Food and Drug Administration, which oversees the safety of the entire food system, including inspections and mandatory food recalls, menu labeling and nutritional content;
employment practices and working conditions, including minimum wage rates, wage and hour practices, labor relations, paid and family leave, workplace safety, immigration, overtime, discrimination and harassment, among others;
health, sanitation, safety and fire standards and the sale of alcoholic beverages;
building and zoning requirements, including state and local licensing and regulation governing the design and operation of facilities and land use;
public accommodations and safety conditions, including the Americans with Disabilities Act and similar state laws that give civil rights protections to individuals with disabilities in the context of employment, public accommodations, and other areas;
environmental matters, such as animal health and welfare, climate change, the reduction of greenhouse gases, water consumption, the discharge, storage, handling, release, and disposal of hazardous or toxic substances, and local ordinances restricting the types of packaging we can use in our restaurants;
public company compliance, disclosure and governance matters, including accounting and tax regulations, SEC and NYSE disclosure requirements;
data privacy laws and standards for the protection of personal information, including social security numbers, financial information (including credit card numbers), and health information, and payment card industry standards and requirements.
Compliance with these laws and regulations, and future new laws or changes in these laws or regulations that impose additional requirements, can be costly. Any failure or perceived failure to comply with these laws or regulations could result in, among other things, revocation of required licenses, administrative enforcement actions, fines and civil and criminal liability.
Economic and business factors that are largely beyond our control may adversely affect consumer behavior and the results of our operations.
Restaurant dining generally is dependent upon consumer discretionary spending, which may be affected by general economic conditions that are largely beyond our control. For example, international, domestic and regional economic conditions, consumer income levels, financial market volatility, a slow or stagnant pace of economic growth, rising energy costs, rising interest rates, social unrest, and governmental, political and budget concerns may have a negative effect on consumer confidence and discretionary spending. Any significant decrease in our guest traffic or average transactions would negatively impact our financial performance. Any actual or perceived threat of a pandemic or communicable disease, terrorist attack, mass shooting, heightened security requirements, or a failure to protect information systems for critical infrastructure, such as the electrical grid and telecommunications systems, could harm our operations, the economy or consumer confidence generally. Any of the above factors or other unfavorable changes in business and economic conditions affecting our guests could increase our costs, reduce traffic in some or all of our restaurants or limit our ability to increase pricing, any of which could lower our profit margins and have a material adverse effect on our sales, financial condition and results of operations. These factors also could cause us to, among other things, reduce the number and frequency of new restaurant openings, close restaurants or delay remodeling of our existing restaurant locations. Further, poor economic conditions may force nearby businesses to shut down, which could reduce traffic to our restaurants or cause our restaurant locations to be less attractive.
Our quarterly results may fluctuate significantly, including due to factors that are not in our control.
Our quarterly results may fluctuate significantly and could fail to meet investors’ expectations for various reasons, including:
negative publicity about the safety of our food, employment-related issues, litigation or other issues involving our restaurants;
fluctuations in supply costs, particularly for our most significant ingredients, and our inability to offset the higher cost with price increases without adversely impacting guest traffic;
labor availability and wages of restaurant management and crew;
increases in marketing or promotional expenses;
the timing of new restaurant openings and related revenues and expenses, and the operating costs at newly opened restaurants;
the impact of inclement weather and natural disasters, such as freezes and droughts, which could decrease guest traffic and increase the costs of ingredients;
the amount and timing of stock-based compensation;
litigation, settlement costs and related legal expenses;
tax expenses, impairment charges and non-operating costs; and
variations in general economic conditions, including the impact of declining interest rates on our interest income.
As a result of any of these factors, results for any one quarter are not necessarily indicative of results to be expected for any other quarter or for any year. Average restaurant sales or comparable restaurant sales in any particular future period may decrease.
The market price of our common stock may be more volatile than the market price of our peers.
We believe the market price of our common stock generally has traded at a higher price-earnings ratio than stocks of most of our peer companies, which typically has reflected market expectations for higher future operating results. The trading market for our common stock has been volatile at times as well, including during the recent past as a result of adverse publicity events. As a result, if we fail to meet market expectations for our operating results in the future, any resulting decline in the price of our common stock could be significant.
Our anti-takeover provisions may delay or prevent a change in control of Chipotle, which could adversely affect the price of our common stock.
Our amended and restated certificate of incorporation and amended and restated bylaws contain some provisions that may make the acquisition of control of Chipotle without the approval of our Board of Directors more difficult, including provisions relating to the nomination, election and removal of directors, and limitations on actions by our shareholders. Delaware law also imposes some restrictions on mergers and other business combinations between Chipotle and any holder of 15% or more of our outstanding common stock. Any of these provisions may discourage a potential acquirer from proposing or completing a transaction that may have otherwise presented a premium to our shareholders, which could adversely affect the price of our common stock.
ITEM 1B. UNRESOLVED STAFF COMMENTS
None.
ITEM 2. PROPERTIES
As of December 31, 2019, there were 2,622 restaurants operated by Chipotle and our consolidated subsidiaries, 2,619 of which were Chipotle restaurants. Our main office is located at 610 Newport Center Drive, Suite 1300, Newport Beach, CA 92660 and our telephone number is (949) 524-4000. We lease our main office and substantially all of the properties on which we operate restaurants. We own 17 properties and operate restaurants on all of them. For additional information regarding the lease terms and provisions, see Note 11. “Leases” in our consolidated financial statements included in Item 8. “Financial Statements and Supplementary Data.”
ITEM 3. LEGAL PROCEEDINGS
For information regarding legal proceedings, see Note 13. “Commitments and Contingencies” in our consolidated financial statements included in Item 8. “Financial Statements and Supplementary Data.”
PART II
ITEM 5. MARKET FOR REGISTRANT’S COMMON EQUITY, RELATED SHAREHOLDER MATTERS AND ISSUER PURCHASES OF EQUITY SECURITIES
Our common stock trades on the New York Stock Exchange under the symbol “CMG.”
As of January 31, 2020, there were approximately 864 shareholders of record. This does not include persons whose stock is in nominee or “street name” accounts through brokers.
Purchases of Equity Securities by the Issuer
The table below reflects shares of common stock we repurchased during the fourth quarter of 2019.
| | | | | | | | | | | |
| | | Total Number of Shares Purchased | | Average Price Paid Per Share | | Total Number of Shares Purchased as Part of Publicly Announced Plans or Programs(1) | | Approximate Dollar Value of Shares that May Yet Be Purchased Under the Plans or Programs(2) |
October | | | 26,811 | | $ | 792.50 | | 26,811 | | $ | 86,414,406 |
| Purchased 10/1 through 10/31 | | | | | | | | | | |
November | | | 22,684 | | $ | 749.33 | | 22,684 | | $ | 69,416,580 |
| Purchased 11/1 through 11/30 | | | | | | | | | | |
December | | | - | | $ | - | | - | | $ | 69,416,580 |
| Purchased 12/1 through 12/31 | | | | | | | | | | |
Total | | | 49,495 | | $ | 772.71 | | 49,495 | | | |
__________________
(1)Shares were repurchased pursuant to the $100 million repurchase programs announced on February 6, 2019 and July 23, 2019.
(2)This column does not include an additional $100 million in authorized repurchases announced on February 4, 2020. There is no expiration date for this program, and the authorization to repurchase shares will end when we have repurchased the maximum amount of shares authorized, or our Board of Directors have determined to discontinue such repurchases.
Dividend Policy
We are not required to pay any dividends and have not declared or paid any cash dividends on our common stock. We intend to continue to retain earnings for use in the operation and expansion of our business and to repurchase shares of common stock (subject to market conditions), and therefore do not anticipate paying any cash dividends on our common stock in the foreseeable future.
COMPARISON OF CUMULATIVE TOTAL RETURN
The following graph compares the cumulative annual stockholders return on our common stock from December 31, 2014, through December 31, 2019, to that of the total return index for the S&P 500 and the S&P 500 Restaurants Index assuming an investment of $100 on December 31, 2014. In calculating total annual stockholder return, reinvestment of dividends, if any, is assumed. The indices are included for comparative purposes only. They do not necessarily reflect management’s opinion that such indices are an appropriate measure of the relative performance of our common stock. The values shown are neither indicative nor determinative of future performance. This graph is not “soliciting material,” is not deemed filed with the Securities and Exchange Commission and is not to be incorporated by reference in any of our filings under the Securities Act or the Exchange Act, whether made before or after the date hereof and irrespective of any general incorporation language in any such filing.
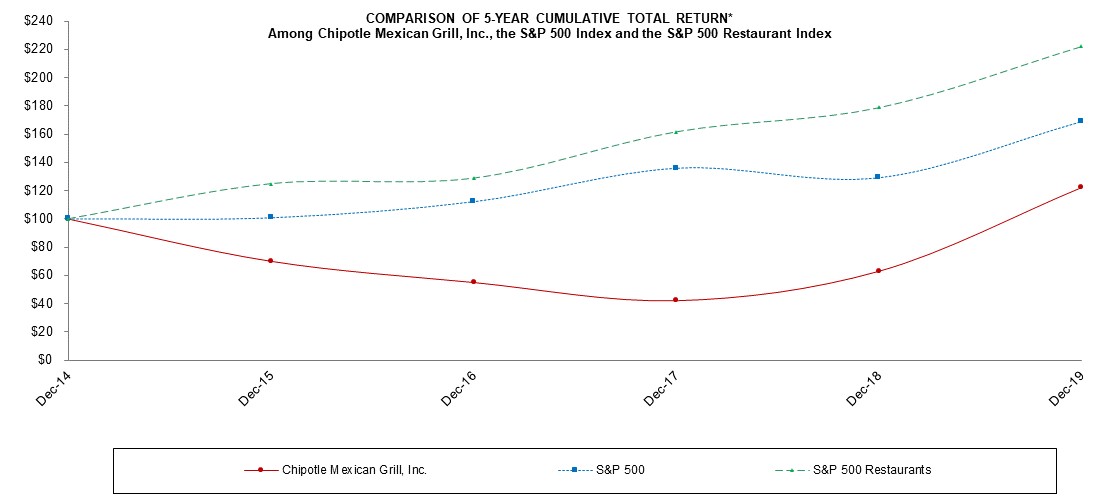
| | | | | | | | | | | | | | | | | |
| | | | | | | | | | | | | | | | | |
Company/Index | Dec. 31, 2014 | | Dec. 31, 2015 | | Dec. 30, 2016 | | Dec. 30, 2017 | | Dec. 30, 2018 | | Dec. 30, 2019 |
Chipotle Mexican Grill, Inc. | $ | 100 | | $ | 70 | | $ | 55 | | $ | 42 | | $ | 63 | | $ | 122 |
S&P 500 | | 100 | | | 101 | | | 112 | | | 136 | | | 129 | | | 169 |
S&P 500 Restaurants | | 100 | | | 125 | | | 129 | | | 162 | | | 179 | | | 222 |
*$100 invested on December 31, 2014 in stock or index, including reinvestment of dividends.
Fiscal year ending December 31.
Source data: S&P Capital IQ
ITEM 6. SELECTED FINANCIAL DATA
Our selected consolidated financial data shown below should be read together with Item 7. “Management’s Discussion and Analysis of Financial Condition and Results of Operations” and our consolidated financial statements and respective notes included in Item 8. “Financial Statements and Supplementary Data.” The data shown below are not necessarily indicative of results to be expected for any future period (dollar and share amounts in thousands, except per share data).
| | | | | | | | | | | | | | |
| | | | | | | | | | | | | | |
| Year ended December 31, |
| 2019 | | 2018 | | 2017 | | 2016 | | 2015 |
Statement of Income: | | | | | | | | | | | | | | |
Revenue | $ | 5,586,369 | | $ | 4,864,985 | | $ | 4,476,412 | | $ | 3,904,384 | | $ | 4,501,223 |
Food, beverage and packaging costs | | 1,847,916 | | | 1,600,760 | | | 1,535,428 | | | 1,365,580 | | | 1,503,835 |
Labor costs | | 1,472,060 | | | 1,326,079 | | | 1,205,992 | | | 1,105,001 | | | 1,045,726 |
Occupancy costs | | 363,072 | | | 347,123 | | | 327,132 | | | 293,636 | | | 262,412 |
Other operating costs | | 760,831 | | | 680,031 | | | 651,644 | | | 641,953 | | | 514,963 |
General and administrative expenses | | 451,552 | | | 375,460 | | | 296,388 | | | 276,240 | | | 250,214 |
Depreciation and amortization | | 212,778 | | | 201,979 | | | 163,348 | | | 146,368 | | | 130,368 |
Pre-opening costs | | 11,108 | | | 8,546 | | | 12,341 | | | 17,162 | | | 16,922 |
Impairment, closure costs and asset disposals | | 23,094 | | | 66,639 | | | 13,345 | | | 23,877 | | | 13,194 |
Total operating expenses | | 5,142,411 | | | 4,606,617 | | | 4,205,618 | | | 3,869,817 | | | 3,737,634 |
Income from operations | | 443,958 | | | 258,368 | | | 270,794 | | | 34,567 | | | 763,589 |
Interest and other income, net | | 14,327 | | | 10,068 | | | 4,949 | | | 4,172 | | | 6,278 |
Income before income taxes | | 458,285 | | | 268,436 | | | 275,743 | | | 38,739 | | | 769,867 |
Provision for income taxes | | (108,127) | | | (91,883) | | | (99,490) | | | (15,801) | | | (294,265) |
Net income | $ | 350,158 | | $ | 176,553 | | $ | 176,253 | | $ | 22,938 | | $ | 475,602 |
Earnings per share: | | | | | | | | | | | | | | |
Basic | $ | 12.62 | | $ | 6.35 | | $ | 6.19 | | $ | 0.78 | | $ | 15.30 |
Diluted | $ | 12.38 | | $ | 6.31 | | $ | 6.17 | | $ | 0.77 | | $ | 15.10 |
Weighted average common shares: outstanding | | | | | | | | | | | | | | |
Basic | | 27,740 | | | 27,823 | | | 28,491 | | | 29,265 | | | 31,092 |
Diluted | | 28,295 | | | 27,962 | | | 28,561 | | | 29,770 | | | 31,494 |
| | | | | |
| | | | | | | | | | | | | | |
| December 31, |
| 2019 | | 2018 | | 2017 | | 2016 | | 2015 |
Balance Sheet Data: | | | | | | | | | | |
Total current assets | $ | 1,072,204 | | $ | 814,794 | | $ | 629,535 | | $ | 522,374 | | $ | 814,647 |
Total assets | $ | 5,104,604 | | $ | 2,265,518 | | $ | 2,045,692 | | $ | 2,026,103 | | $ | 2,725,066 |
Total current liabilities | $ | 666,593 | | $ | 449,990 | | $ | 323,893 | | $ | 281,793 | | $ | 279,942 |
Total liabilities | $ | 3,421,578 | | $ | 824,179 | | $ | 681,247 | | $ | 623,610 | | $ | 597,092 |
Total shareholders’ equity | $ | 1,683,026 | | $ | 1,441,339 | | $ | 1,364,445 | | $ | 1,402,493 | | $ | 2,127,974 |
ITEM 7. MANAGEMENT’S DISCUSSION AND ANALYSIS OF FINANCIAL CONDITION AND RESULTS OF OPERATIONS
You should read the following discussion together with Item 6. “Selected Financial Data” and our consolidated financial statements and related notes included in Item 8. “Financial Statements and Supplementary Data.” This section of the Form 10-K generally discusses 2019 and 2018 items and year-to-year comparisons of 2019 to 2018. Discussions of 2017 items and year-to-year comparisons of 2018 and 2017 that are not included in this Form 10-K can be found in “Management’s Discussion and Analysis of Financial Condition and Results of Operations” in Part II, Item 7 on our Annual Report on Form 10-K for the year ended December 31, 2018. The discussion contains forward-looking statements involving risks, uncertainties and assumptions that could cause our results to differ materially from expectations. See “Cautionary Note Regarding Forward-Looking Statements.” Factors that might cause such differences include those described in Item 1A. “Risk Factors” and elsewhere in this report.
Overview
As of December 31, 2019, we operated 2,580 Chipotle restaurants throughout the United States, 39 international Chipotle restaurants, and three non-Chipotle restaurants. We are committed to making good food more accessible to everyone while continuing to be a brand with a demonstrated purpose.
2019 Financial Highlights
Revenue increased 14.8% to $5.6 billion in 2019 compared to $4.9 billion in 2018
Comparable sales increased 11.1%, which included a 7.0% increase in comparable restaurant transactions
Diluted earnings per share (“diluted EPS”) for 2019 increased to $12.38, which included corporate restructuring, restaurant closure costs, charges relate to settlements for several distinct legal matters and other costs of $54.3 million, compared to $6.31 diluted EPS for 2018, which included corporate restructuring, restaurant closure costs, litigation and other costs of $90.7 million.
Sales Trends. Average restaurant sales were $2.2 million for the year ended December 31, 2019, an increase from $2.0 million for the year ended December 31, 2018. We define average restaurant sales as the average trailing 12-month sales for restaurants in operation for at least 12 full calendar months.
Comparable restaurant sales increased 11.1% for the full year 2019, which included a 7% increase in comparable restaurant transactions. Comparable restaurant sales and comparable restaurant transactions represent the change in period-over-period sales or transactions for restaurants in operation for at least 13 full calendar months. We expect our full year 2020 comparable restaurant sales to be in the mid-single digit range.
We continue to invest in improving our digital platforms and have significantly upgraded our capabilities by completing the rollout of digital pickup shelves, digitizing almost all of our digital-make lines, and expanding our delivery capabilities to over 98% of our store base. Digital sales from out-of-restaurant orders, including delivery orders, increased 7.1% to 18.0% of revenue for the full year 2019, an increase from 10.9% of revenue for the full year 2018.
Restaurant Operating Costs. During the full year 2019, our restaurant operating costs (food, beverage and packaging; labor; occupancy; and other operating costs) as a percentage of revenue decreased 180 basis points to 79.5% compared to 81.3% for the full year 2018. The decrease was primarily due to comparable restaurant sales increases, partially offset by higher food costs across many items and food expenses related to the launch of Chipotle Rewards, as well as wage inflation, and increased delivery expenses.
Corporate Restructuring. In 2018, we opened a new headquarters office in Newport Beach, California, consolidated certain corporate administrative functions into our existing office in Columbus, Ohio, closed a corporate office in New York, New York, and commenced the closure of our previous headquarters office in Denver, Colorado. All affected employees were either offered an opportunity to continue in the new organization or were offered a severance package. In total we recognized corporate restructuring activities of $56.8 million, of which $14.2 million was recognized during the full year 2019. We do not expect any other material costs to be incurred in connection with the corporate restructuring. For additional information, please see Note 5. “Corporate Restructuring” in the notes to the consolidated financial statements included in Item 8. “Financial Statements and Supplementary Data”.
Restaurant Closures. In June 2018, we announced planned restaurant closures of approximately 55 to 65 restaurants beginning in the second quarter of 2018 and continuing over the next several quarters. We have closed or relocated 51 Chipotle restaurants and five Pizzeria Locale restaurants in connection with this initiative. In total we recognized restaurant exit costs of approximately $36.5 million, of which $0.8 million was recognized during the full year 2019. We do not expect any other material costs to be incurred in connection with the planned restaurant closures. For additional information, please see Note 6. “Restaurant Closure Costs” in the notes to the consolidated financial statements.
Restaurant Development. For the full year 2019, we opened 140 new restaurants, which included 56 restaurants with a Chipotlane. We expect to open between 150 to 165 new restaurants in 2020, with a heavier weighting of openings towards the second half of the year.
Restaurant Activity
The following table details restaurant unit data for the years indicated.
| | | | | |
| | | | | |
| Year ended December 31, |
| 2019 | | 2018 | | 2017 |
Beginning of period | 2,491 | | 2,408 | | 2,250 |
Openings | 140 | | 137 | | 183 |
Chipotle closures | (7) | | (43) | | (8) |
Chipotle relocations | (2) | | (5) | | (2) |
Pizzeria Locale closures | - | | (5) | | - |
TastyMade closures | - | | (1) | | - |
ShopHouse closures | - | | - | | (15) |
Total restaurants at end of period | 2,622 | | 2,491 | | 2,408 |
Results of Operations
Our results of operations as a percentage of revenue and period-over-period change are discussed in the following section.
Revenue
| | | | | | | | | | | | |
| | | | | | | | | | | | |
| Year ended December 31, | | Percentage change |
| 2019 | | 2018 | | 2017 | | 2019/2018 | | 2018/2017 |
| (dollars in millions) | | | | |
Revenue | $ | 5,586.4 | | $ | 4,865.0 | | $ | 4,476.4 | | 14.8% | | 8.7% |
Average restaurant sales | $ | 2.2 | | $ | 2.0 | | $ | 1.9 | | 10.8% | | 3.3% |
Comparable restaurant sales increases | | 11.1% | | | 4.0% | | | 6.4% | | | | |
The significant factors contributing to the revenue increase in 2019 were comparable restaurant sales increases and new restaurant openings. Comparable restaurant sales increased $498.7 million and revenue from restaurants not yet in the comparable restaurant base contributed $222.7 million to the revenue increase, of which $76.6 million was attributable to restaurants opened in 2019. In 2019 comparable restaurant sales increased 11.1% as a result of a 7.0% increase in comparable restaurant transactions and a 4.1% increase in average check. The increase in average check includes a 2.4% benefit from menu price increases that were implemented at the end of 2018 and a 0.2% benefit from menu price increases implemented at the end of 2019.
Food, Beverage and Packaging Costs
| | | | | | | | | | | | |
| | | | | | | | | | | | |
| Year ended December 31, | | Percentage change |
| 2019 | | 2018 | | 2017 | | 2019/2018 | | 2018/2017 |
| (dollars in millions) | | | | |
Food, beverage and packaging | $ | 1,847.9 | | $ | 1,600.8 | | $ | 1,535.4 | | 15.4% | | 4.3% |
As a percentage of revenue | | 33.1% | | | 32.9% | | | 34.3% | | 0.2% | | (1.4%) |
Food, beverage and packaging costs increased as a percentage of revenue in 2019 primarily due to higher protein costs, food expenses related to the launch of Chipotle Rewards in March of 2019, and to a lesser extent higher costs of cheese, avocados, and beverages. These increases were partially offset by the menu price increases taken at the end of 2018.
Labor Costs
| | | | | | | | | | | | |
| | | | | | | | | | | | |
| Year ended December 31, | | Percentage change |
| 2019 | | 2018 | | 2017 | | 2019/2018 | | 2018/2017 |
| (dollars in millions) | | | | |
Labor costs | $ | 1,472.1 | | $ | 1,326.1 | | $ | 1,206.0 | | 11.0% | | 10.0% |
As a percentage of revenue | | 26.4% | | | 27.3% | | | 26.9% | | (0.9%) | | 0.3% |
Labor costs decreased as a percentage of revenue in 2019 primarily due to sales leverage, partially offset by wage inflation.
Occupancy Costs
| | | | | | | | | | | | |
| | | | | | | | | | | | |
| Year ended December 31, | | Percentage change |
| 2019 | | 2018 | | 2017 | | 2019/2018 | | 2018/2017 |
| (dollars in millions) | | | | |
Occupancy costs | $ | 363.1 | | $ | 347.1 | | $ | 327.1 | | 4.6% | | 6.1% |
As a percentage of revenue | | 6.5% | | | 7.1% | | | 7.3% | | (0.6%) | | (0.2%) |
Occupancy costs as a percentage of revenue decreased in 2019 and 2018 primarily due to sales leverage on a largely fixed-cost base.
Other Operating Costs
| | | | | | | | | | | | |
| | | | | | | | | | | | |
| Year ended December 31, | | Percentage change |
| 2019 | | 2018 | | 2017 | | 2019/2018 | | 2018/2017 |
| (dollars in millions) | | | | |
Other operating costs | $ | 760.8 | | $ | 680.0 | | $ | 651.6 | | 11.9% | | 4.4% |
As a percentage of revenue | | 13.6% | | | 14.0% | | | 14.6% | | (0.4%) | | (0.6%) |
Other operating costs include, among other items, marketing and promotional costs, bank and credit card processing fees, restaurant utilities and maintenance costs, and delivery expense. Other operating costs decreased as a percentage of revenue in 2019 primarily due to sales leverage and, to a lesser extent, elevated store repairs and maintenance in 2018. This was partially offset by increased delivery expenses in 2019 compared to 2018 as we launched delivery during the middle of 2018 and delivery sales (or transactions) grew substantially in 2019.
General and Administrative Expenses
| | | | | | | | | | | | |
| | | | | | | | | | | | |
| Year ended December 31, | | Percentage change |
| 2019 | | 2018 | | 2017 | | 2019/2018 | | 2018/2017 |
| (dollars in millions) | | | | |
General and administrative expense | $ | 451.6 | | $ | 375.5 | | $ | 296.4 | | 20.3% | | 26.7% |
As a percentage of revenue | | 8.1% | | | 7.7% | | | 6.6% | | 0.4% | | 1.1% |
General and administrative expenses increased in dollar terms in 2019, primarily due to the following: a $41.6 million increase in estimated loss contingencies related to a number of legal matters; $29.2 million increase in wage and payroll tax expense, which includes increased expense for performance bonuses and increased payroll tax expense from stock-based compensation; $25.0 million in non-cash stock-based compensation expense, which includes increased expense for performance shares in the current year; $9.5 million to support our restaurant growth and digitizing our restaurant experience, and increased legal expense of $2.8 million. These increases were partially offset by a $14.6 million reduction in restructuring expense, an $11.4 million reduction in estimated charges related to the data security incident, and a reduction of $7.3 million primarily associated with the biennial All Managers’ Conference that was held in September 2018.
Depreciation and Amortization
| | | | | | | | | | | | |
| | | | | | | | | | | | |
| Year ended December 31, | | Percentage change |
| 2019 | | 2018 | | 2017 | | 2019/2018 | | 2018/2017 |
| (dollars in millions) | | | | |
Depreciation and amortization | $ | 212.8 | | $ | 202.0 | | $ | 163.3 | | 5.3% | | 23.6% |
As a percentage of revenue | | 3.8% | | | 4.2% | | | 3.6% | | (0.3%) | | 0.5% |
Depreciation and amortization decreased as a percentage of revenue in 2019 due to sales leverage on a partially fixed-cost base, partially offset by increased depreciation associated with our website and mobile app and upgrading equipment in the restaurants primarily to support the growth in our digital business.
Impairment, Closure Costs, and Asset Disposals
| | | | | | | | | | | | |
| | | | | | | | | | | | |
| Year ended December 31, | | Percentage change |
| 2019 | | 2018 | | 2017 | | 2019/2018 | | 2018/2017 |
| (dollars in millions) | | | | |
Impairment, closure costs, and asset disposals | $ | 23.1 | | $ | 66.6 | | $ | 13.3 | | (65.3%) | | 399.4% |
As a percentage of revenue | | 0.4% | | | 1.4% | | | 0.3% | | (1.0%) | | 1.1% |
Impairment, closure costs, and asset disposals during 2019 consisted primarily of charges related to the replacement of certain kitchen equipment and leasehold improvements, and to a lesser extent impairments on equipment, restaurants, and offices.
Provision for Income Tax
| | | | | | | | | | | | |
| | | | | | | | | | | | |
| Year ended December 31, | | Percentage change |
| 2019 | | 2018 | | 2017 | | 2019/2018 | | 2018/2017 |
| (dollars in millions) | | | | |
Provision for income taxes | $ | 108.1 | | $ | 91.9 | | $ | 99.5 | | 17.7% | | (7.6%) |
Effective tax rate | | 23.6% | | | 34.2% | | | 36.1% | | (10.6%) | | (1.9%) |
The effective tax rate for the year ended December 31, 2019 was lower than the effective tax rate for the year ended December 31, 2018, primarily due to net excess benefits from stock-based compensation and a net year over year decrease in tax expense related to equity award expirations, partially offset by current year increases in non-deductible executive compensation.
Quarterly Financial Data/Seasonality
See Note 14. “Quarterly Financial Data (Unaudited)” for a table presenting data from the consolidated statements of income for each of the eight quarters in the period ended December 31, 2019.
Seasonal factors cause our profitability to fluctuate from quarter to quarter. Historically, our average daily restaurant sales and net income are lower in the first and fourth quarters due, in part, to the holiday season and because fewer people eat out during periods of inclement weather (the winter months) than during periods of mild or warm weather (the spring, summer and fall months). Other factors also have a seasonal effect on our results. For example, restaurants located near colleges and universities generally do more business during the academic year. Seasonal factors, however, might be moderated or outweighed by other factors that may influence our quarterly results, such as unexpected publicity impacting our business in a positive or negative way, fluctuations in food or packaging costs, or the timing of menu price increases or promotional activities and other marketing initiatives. The number of trading days in a quarter can also affect our results, although, on an overall annual basis, changes in trading days do not have a significant impact.
Our quarterly results are also affected by other factors such as the amount and timing of non-cash stock-based compensation expense and related tax rate impacts, litigation, settlement costs and related legal expenses, impairment charges and non-operating costs, timing of marketing or promotional expenses, the number and timing of new restaurants opened in a quarter, and closure of restaurants. New restaurants typically have lower margins following opening as a result of the expenses associated with their opening and operating inefficiencies in the months immediately following opening. Accordingly, results for a particular quarter are not necessarily indicative of results to be expected for any other quarter or for any year.
Liquidity and Capital Resources
Our primary liquidity and capital requirements are for new restaurant construction, initiatives to improve the guest experience in our restaurants, working capital, and general corporate expenses. As of December 31, 2019, we had a cash and short-term investment balance of $880.8 million that we expect to utilize, along with cash flow from operations, to provide capital in support of the growth of our business, to invest in, maintain, and refurbish our existing restaurants, to repurchase additional shares of our common stock subject to market conditions, and for general corporate purposes. As of December 31, 2019, $169.4 million remained available for repurchases of shares of our common stock repurchase authorizations. Under the remaining repurchase authorizations, shares may be purchased from time to time in open market transactions, subject to market conditions. We believe that cash from operations, together with our cash and investment balances, will be sufficient to meet ongoing capital expenditures, working capital requirements and other cash needs for the foreseeable future.
We have not required significant working capital because customers generally pay using cash or credit and debit cards and because our operations do not require significant receivables, nor do they require significant inventories due, in part, to our use of various fresh ingredients. In addition, we generally have the right to pay for the purchase of food, beverages and supplies sometime after the receipt of those items, generally within ten days, thereby reducing the need for incremental working capital to support our growth.
Our total capital expenditures for 2019 were $333.9 million. In 2019, we spent on average about $1.0 million in development and construction costs per new restaurant, or about $0.9 million net of landlord reimbursements of $0.1 million. In 2020, we expect to incur about $350 million in total capital expenditures. We expect approximately $160 million in capital expenditures related to our construction of new restaurants, before any reductions for landlord reimbursements. For new restaurants to be opened in 2020, we anticipate average development costs will increase due to strategic initiatives planned in new restaurants such as design updates or the addition of Chipotlanes. We expect approximately $140 million in capital expenditures related to investments in existing restaurants, including updated equipment, technology, remodeling and similar improvements, and upgrading our digital make lines and other restaurant equipment. Finally, we expect a portion of our capital expenditures for the year to be incurred for additional corporate initiatives including building corporate offices, a culinary and training center, rebuilding our mobile app, and other projects.
Contractual Obligations
Our contractual obligations as of December 31, 2019 were as follows:
| | | | | | | | | | | | | | | |
| | | | | | | | | | | | | | | |
| | Payments Due by Fiscal Year |
| | Total | | 2020 | | 2021-2022 | | 2023-2024 | | Thereafter |
| | (in thousands) |
Operating leases(1) | | $ | 4,108,804 | | $ | 294,291 | | $ | 643,675 | | $ | 622,358 | | $ | 2,548,479 |
Purchase obligations(2) | | $ | 807,718 | | $ | 591,801 | | $ | 197,555 | | $ | 18,362 | | $ | - |
Deemed landlord financing(1) | | $ | 2,626 | | $ | 432 | | $ | 908 | | $ | 910 | | $ | 376 |
Total | | $ | 4,919,148 | | $ | 886,524 | | $ | 842,138 | | $ | 641,630 | | $ | 2,548,855 |
(1)See Note 11. “Leases” of our consolidated financial statements included in Item 8. “Financial Statements and Supplementary Data.” This includes commitments related to reasonably certain renewal periods.
(2)Purchase obligations include agreements to purchase goods or services that are enforceable and legally binding on us and that specify all significant terms. We have excluded agreements that are cancelable without penalty. The majority of our purchase obligations relate to amounts owed for produce and other ingredients and supplies, chicken, orders submitted for equipment for restaurants under construction and planned remodels, information technology, and marketing initiatives and corporate sponsorships.
The above table does not include income tax liabilities for uncertain tax positions for which we are not able to make a reasonably reliable estimate of the amount and period of related future payments. Additionally, we have excluded our estimated loss contingencies, due to uncertainty regarding the timing and amount of payment. See Note 13. “Commitments and Contingencies” of our consolidated financial statements included in Item 8. “Financial Statements and Supplementary Data.”
Off-Balance Sheet Arrangements
As of December 31, 2019 and 2018, we had no material off-balance sheet arrangements or obligations.
Inflation
The primary areas of our operations affected by inflation are food, labor, rent, healthcare costs, fuel, utility costs, and materials used in the construction of our restaurants. Although a significant majority of our crew members make more than the federal and applicable state and local minimum wage, increases in the applicable federal or state minimum wage may have an impact on our labor costs by causing wage inflation above the minimum wage level. Additionally, many of our leases require us to pay property taxes, maintenance, and utilities, all of which are generally subject to inflationary increases. In the past we have largely been able to offset inflationary increases with menu price increases. If we do raise menu prices in the future, general competitive pressures or negative consumer responses may limit our ability to completely recover cost increases attributable to inflation.
Critical Accounting Estimates
We describe our significant accounting policies in Note 1. “Description of Business and Summary of Significant Accounting Policies” of our consolidated financial statements included in Item 8. “Financial Statements and Supplementary Data.” Critical accounting estimates are those that we believe are both significant and that require us to make difficult, subjective or complex judgments, often because we need to estimate the effect of inherently uncertain matters. We base our estimates and judgments on historical experiences and various other factors that we believe to be appropriate under the circumstances. Actual results may differ from these estimates, and we might obtain different estimates if we used different assumptions or factors.
Leases
We determine if a contract contains a lease at inception. Our material operating leases consist of restaurant locations and office space. Our leases generally have remaining terms of 1-20 years and most include options to extend the leases for additional 5-year periods. Generally, the lease term is the minimum of the noncancelable period of the lease or the lease term inclusive of reasonably certain renewal periods up to a term of 20 years. If the estimate of our reasonably certain lease term was changed, our depreciation and rent expense could differ materially.
Operating lease assets and liabilities are recognized at the lease commencement date. Operating lease liabilities represent the present value of lease payments not yet paid. Operating lease assets represent our right to use an underlying asset and are based upon the operating lease liabilities adjusted for prepayments or accrued lease payments, initial direct costs, lease incentives, and impairment of operating lease assets. To determine the present value of lease payments not yet paid, we estimate incremental borrowing rates corresponding to the reasonably certain lease term. As we have no outstanding debt nor committed credit facilities, secured or otherwise, we estimate this rate based on prevailing financial market conditions, comparable company and credit analysis, and management judgment. If the estimate of our incremental borrowing rate was changed, our operating lease assets and liabilities could differ materially.
Impairment of Long-Lived Assets
Long-lived assets are reviewed for impairment whenever events or changes in circumstances indicate that the carrying amount of an asset may not be recoverable. For the purpose of reviewing restaurant assets to be held and used for potential impairment, assets are grouped together at the market level, or in the case of a potential relocation or closure, at the restaurant level. We manage our restaurants as a group with significant common costs and promotional activities; as such, an individual restaurant’s cash flows are not generally independent of the cash flows of others in a market.
The fair value measurement for asset impairment is based on Level 3 inputs. We first compare the carrying value of the asset (or asset group, referred interchangeably throughout as asset) to the asset’s estimated future undiscounted cash flows. If the estimated undiscounted future cash flows are less than the carrying value of the asset, we determine if we have an impairment loss by comparing the carrying value of the asset to the asset's estimated fair value. The estimated fair value of the asset is generally determined using the income approach to measure the fair value, which is based on the present value of estimated future cash flows. Key inputs to the income approach for restaurant assets include the discount rate, projected restaurant cash flows, and sublease income if we are closing the restaurant. In certain cases, management uses other market information, when available, to estimate the fair value of an asset. The impairment charges represent the excess of each asset’s carrying amount over its estimated fair value and are allocated among the long-lived asset or assets of the group.
Our estimates of future cash flows are highly subjective judgments based on internal projections and knowledge of our operations, historical performance, and trends in sales and restaurant operating costs, and can be significantly impacted by changes in our business or economic conditions. The determination of asset fair value is also subject to significant judgment and utilizes valuation techniques including discounting estimated future cash flows and market-based analyses to determine fair value. If our estimates or underlying assumptions, including discount rate and sublease income change in the future, our operating results may be materially impacted.
Stock-based Compensation
We recognize compensation expense for equity awards over the requisite service period based on the award’s fair value. We use the Black-Scholes valuation model to determine the fair value of our stock-only stock appreciation rights, or “SOSARs”, and we use the Monte Carlo simulation model to determine the fair value of stock awards that contain market conditions. Both of these models require assumptions to be made regarding our stock price volatility, the expected life of the award and expected dividend rates. The volatility assumption was based on our historical data and implied volatility, and the expected life assumptions were based on our historical data. Similarly, the compensation expense of performance share awards, and SOSARs with performance-based vesting conditions, is based in part on the estimated probability of achieving levels of performance associated with particular levels of payout for performance shares and with vesting for performance SOSARs. We determine the probability of achievement of future levels of performance by comparing the relevant performance level with our internal estimates of future performance. Those estimates are
based on a number of assumptions, including but not limited to growth in comparable restaurant sales and average restaurant level margin, and different assumptions may have resulted in different conclusions regarding the probability of our achieving future levels of performance relevant to the payout levels for the awards. Had we arrived at different assumptions of stock price volatility or expected lives of our SOSARs, or if we changed our assumptions regarding the probability of our achieving future levels of performance with respect to performance share awards and performance SOSARs, our stock-based compensation expense and results of operations may be materially different.
Insurance Liability
We are self-insured for a significant portion of our employee health benefits programs, and carry significant retentions for risks and associated liabilities with respect to workers’ compensation, general liability, property and auto damage, employment practices liability, cyber liability and directors and officer’s liability. Predetermined loss limits have been arranged with third party insurance companies to limit exposure to these claims. We record a liability that represents our estimated cost of claims incurred and unpaid as of the balance sheet date. Our estimated liability is not discounted and is based on a number of assumptions and factors, including historical trends, actuarial assumptions and economic conditions, and is closely monitored and adjusted when warranted by changing circumstances. If a greater amount of claims occurs compared to what we have estimated, or if medical costs increase beyond what we expected, our accrued liabilities might not be sufficient and we may be required to record additional expense. Actual claims experience could also be more favorable than estimated, which would result in expense reductions. Unanticipated changes may produce materially different amounts of expense than that reported under these programs.
Reserves/Contingencies for Litigation and Other Matters
We are involved in various claims and legal actions that arise in the ordinary course of business. We record an accrual for legal contingencies when we determine that it is probable that we have incurred a liability and we can reasonably estimate the amount of the loss. Although we have recorded liabilities related to a number of legal actions, our estimates used to determine the amount of these liabilities may not be accurate, and there are other legal actions for which we have not recorded a liability. As a result, in the event legal actions for which we have not accrued a liability or for which our accrued liabilities are not accurate are resolved, such resolution may affect our operating results and cash flows.
Income Taxes
Our provision for income taxes, deferred tax assets and liabilities including valuation allowance requires the use of estimates based on our management’s interpretation and application of complex tax laws and accounting guidance. We are primarily subject to income taxes in the United States. We establish reserves for uncertain tax positions for material, known tax exposures in accordance with Accounting Standards Codification (“ASC”) 740 relating to deductions, transactions and other matters involving some uncertainty as to the measurement and recognition of the item. We may adjust these reserves when our judgment changes as a result of the evaluation of new information not previously available and will be reflected in the period in which the new information is available. While we believe that our reserves are adequate, issues raised by a tax authority may be resolved at an amount different than the related reserve and could materially increase or decrease our income tax provision in future periods.
ITEM 7A. QUANTITATIVE AND QUALITATIVE DISCLOSURE ABOUT MARKET RISK
Commodity Price Risks
We are exposed to commodity price risks. Many of the ingredients we use to prepare our food, as well as our packaging materials and utilities to run our restaurants, are ingredients or commodities that are affected by the price of other commodities, exchange rates, foreign demand, weather, seasonality, production, availability and other factors outside our control. We work closely with our suppliers and use a mix of forward pricing protocols under which we agree with our supplier on fixed prices for deliveries at some time in the future, fixed pricing protocols under which we agree on a fixed price with our supplier for the duration of that protocol, formula pricing protocols under which the prices we pay are based on a specified formula related to the prices of the goods, such as spot prices, and range forward protocols under which we agree on a price range for the duration of that protocol. Generally, our pricing protocols with suppliers can remain in effect for periods ranging from one to 36 months, depending on the outlook for prices of the particular ingredient. In several cases, we have minimum purchase obligations. We’ve tried to increase, where practical, the number of suppliers for our ingredients, which we believe can help mitigate pricing volatility, and we follow industry news, trade issues, exchange rates, foreign demand, weather, crises and other world events that may affect our ingredient prices. Increases in ingredient prices could adversely affect our results if we choose for competitive or other reasons not to increase menu prices at the same rate at which ingredient costs increase, or if menu price increases result in customer resistance.
Changing Interest Rates
We are also exposed to interest rate risk through fluctuations of interest rates on our investments. Changes in interest rates affect the interest income we earn, and therefore impact our cash flows and results of operations. As of December 31, 2019, we had $824.8 million in investments and interest-bearing cash accounts, including insurance-related restricted trust accounts classified in restricted cash, and $60.7 million in accounts with an earnings credit we classify as interest and other income, which combined earned a weighted average interest rate of 1.75%.
Foreign Currency Exchange Risk
A portion of our operations consist of activities outside of the U.S. and we have currency risk on the transactions in other currencies and translation adjustments resulting from the conversion of our international financial results into the U.S. dollar. However, a substantial majority of our operations and investment activities are transacted in the U.S., and therefore our foreign currency risk is not material at this date.
ITEM 8. FINANCIAL STATEMENTS AND SUPPLEMENTARY DATA
INDEX TO CONSOLIDATED FINANCIAL STATEMENTS
Report of Independent Registered Public Accounting Firm
To the Shareholders and the Board of Directors of Chipotle Mexican Grill, Inc.
Opinion on the Financial Statements
We have audited the accompanying consolidated balance sheets of Chipotle Mexican Grill, Inc. (the Company) as of December 31, 2019 and 2018, the related consolidated statements of income, comprehensive income, shareholders’ equity and cash flows for each of the three years in the period ended December 31, 2019, and the related notes (collectively referred to as the “consolidated financial statements”). In our opinion, the consolidated financial statements present fairly, in all material respects, the financial position of the Company at December 31, 2019 and 2018, and the results of its operations and its cash flows for each of the three years in the period ended December 31, 2019, in conformity with U.S. generally accepted accounting principles.
We also have audited, in accordance with the standards of the Public Company Accounting Oversight Board (United States) (PCAOB), the Company’s internal control over financial reporting as of December 31, 2019, based on criteria established in Internal Control-Integrated Framework issued by the Committee of Sponsoring Organizations of the Treadway Commission (2013 framework), and our report dated February 4, 2020 expressed an unqualified opinion thereon.
Adoption of New Accounting Standard
As discussed in Note 11 to the consolidated financial statements, the Company changed its method for accounting for leases in 2019. As explained below, auditing the Company’s valuation and accounting for leases was a critical audit matter.
Basis for Opinion
These financial statements are the responsibility of the Company’s management. Our responsibility is to express an opinion on the Company’s financial statements based on our audits. We are a public accounting firm registered with the PCAOB and are required to be independent with respect to the Company in accordance with the U.S. federal securities laws and the applicable rules and regulations of the Securities and Exchange Commission and the PCAOB.
We conducted our audits in accordance with the standards of the PCAOB. Those standards require that we plan and perform the audit to obtain reasonable assurance about whether the financial statements are free of material misstatement, whether due to error or fraud. Our audits included performing procedures to assess the risks of material misstatement of the financial statements, whether due to error or fraud, and performing procedures that respond to those risks. Such procedures included examining, on a test basis, evidence regarding the amounts and disclosures in the financial statements. Our audits also included evaluating the accounting principles used and significant estimates made by management, as well as evaluating the overall presentation of the financial statements. We believe that our audits provide a reasonable basis for our opinion.
Critical Audit Matters
The critical audit matters communicated below are matters arising from the current period audit of the financial statements that were communicated or required to be communicated to the audit committee and that: (1) relate to accounts or disclosures that are material to the financial statements and (2) involved our especially challenging, subjective, or complex judgments. The communication of critical audit matters does not alter in any way our opinion on the consolidated financial statements, taken as a whole, and we are not, by communicating the critical audit matters below, providing separate opinions on the critical audit matters or on the accounts or disclosures to which they relate.
| | |
| | Valuation and accounting for leases |
Description of the Matter | | As described above and in Notes 1 and 11 to the consolidated financial statements, the Company adopted Accounting Standards Update (“ASU”) 2016-02, “Leases (Topic 842)” (“ASC 842”) on January 1, 2019. In conjunction with the adoption of ASC 842, the Company evaluated the overall accounting implications, including review of contracts and vendor agreements to determine whether such agreements contained a lease. The Company determined its material operating leases consist of approximately 2,500 restaurant locations and office space. On the adoption date, the Company recorded $2.4 billion in operating lease assets and $2.7 billion in current and long-term operating lease liabilities on its consolidated balance sheet for existing operating leases. The calculation of the Company’s operating lease assets and liabilities include an estimate of the present value of future lease payments. Management estimated the Company’s incremental borrowing rates used in its present value calculation which required subjectivity. The incremental borrowing rate is the rate of interest that the lessee would have to pay to borrow on a collateralized basis over a similar term an amount equal to the lease payments in a similar economic environment. Auditing management’s contract evaluation performed in conjunction with the adoption of ASC 842 was complex and required judgment to analyze the terms within the contracts and vendor agreements to determine whether we concurred with management’s evaluation. Additionally, during the inspection of contracts and vendor agreements and analysis of contractual terms, inquiries and discussions were held outside of the accounting department to support the evaluation. Further, auditing management’s assessment of its incremental borrowing rate is especially subjective and judgmental as the Company has no outstanding debt nor committed credit facilities, secured or otherwise that would have comparable collateral or similar terms as their underlying restaurant locations and office space. |
How We Addressed the Matter in Our Audit | | We obtained an understanding, evaluated the design, and tested the operating effectiveness of management’s controls over the implementation of the ASC 842 process, including the Company’s controls with regards to the contract evaluation, and review of the methodology, inputs, and assumptions used to determine the incremental borrowing rate. Our substantive audit procedures included, among others, involving specialists to assist in evaluating management’s methodology and assumptions used to determine the Company’s incremental borrowing rate at the date of adoption of ASC 842. The considerations to determine the appropriateness of the Company’s incremental borrowing rate included the Company’s credit rating, current market environment for recent debt transactions, and market data available to support the adjustment required to reflect a collateralized borrowing rate. In addition, we obtained and inspected a sample of individual leases to test the completeness and accuracy of the lease inputs and terms used in the Company’s calculation and tested the computational accuracy. We additionally performed procedures to determine the completeness of the lease population used in the Company’s analysis. We tested a sample of contracts and vendor agreements to determine whether management appropriately evaluated whether such agreements contained a lease. These procedures included, among others, inspecting contracts and vendor agreements, analyzing contractual terms and performing inquiries within the organization outside of the accounting department. Additionally, our procedures included reviewing management’s lease questionnaires sent to relevant employees and cash disbursement listings to test that contracts which could contain lease provisions were considered in the lease population used in the Company’s analysis. We also evaluated the Company’s lease disclosures included in Notes 1 and 11 in relation to these matters. |
| | |
| | Valuation and accounting for stock-based compensation |
Description of the Matter | | The Company incurred $92.1 million in stock-based compensation expense during the year ended December 31, 2019. Approximately 227,000 of the Company’s non-vested stock awards were subject to service and performance conditions during the year ended December 31, 2019. As described in Notes 1 and 9 to the consolidated financial statements, the Company estimates the grant date fair value of the stock awards and expenses the fair value of stock awards subject to service conditions over the respective vesting period. Stock-based compensation expense of stock awards subject to performance conditions is based on the estimated probability of achieving levels of performance associated with particular levels of payout. Additionally, at each reporting period, the Company evaluates the probable outcome of the performance conditions including consideration of significant assumptions and as applicable, recognizes the cumulative effect of the change in estimate in the period of the change. Auditing the grant date fair value and the appropriateness of the accounting treatment of the Company’s stock awards was complex and judgmental. In particular, the fair value estimate for stock awards subject to performance conditions is sensitive to significant assumptions including management’s internal estimates of the Company’s future performance. |
How We Addressed the Matter in Our Audit | | We obtained an understanding, evaluated the design, and tested the operating effectiveness of management’s controls over stock-based compensation. We tested controls over management’s review of the valuation model methodology and assumptions used with regards to the service and performance conditions. We also tested management's controls to validate that data used in the valuation model was complete and accurate. Our substantive audit procedures included, among others, testing the significant assumptions underlying the performance conditions (e.g., certain targets related to growth in comparable restaurant sales and average restaurant margin) and testing the completeness and accuracy of the underlying data. We evaluated management’s significant assumptions by comparing the assumptions to current market and economic trends, historical results of the Company’s business, and to other relevant factors. We additionally performed a sensitivity analysis of the significant assumptions to evaluate the change in the fair value of the stock awards subject to performance conditions resulting from changes in the assumptions. We also evaluated the adequacy of the Company’s stock-based compensation disclosures included in Notes 1 and 9 in relation to these matters. |
/s/ Ernst & Young LLP
We have served as the Company’s auditor since 1997.
Irvine, California
February 4, 2020
CHIPOTLE MEXICAN GRILL, INC.
CONSOLIDATED BALANCE SHEETS
(in thousands, except per share data)
| | | | | |
| | | | | |
| December 31, |
| 2019 | | 2018 |
Assets | | | | | |
Current assets: | | | | | |
Cash and cash equivalents | $ | 480,626 | | $ | 249,953 |
Accounts receivable, net | | 80,545 | | | 62,312 |
Inventory | | 26,096 | | | 21,555 |
Prepaid expenses and other current assets | | 57,076 | | | 54,129 |
Income tax receivable | | 27,705 | | | - |
Investments | | 400,156 | | | 426,845 |
Total current assets | | 1,072,204 | | | 814,794 |
Leasehold improvements, property and equipment, net | | 1,458,690 | | | 1,379,254 |
Restricted cash | | 27,855 | | | 30,199 |
Operating lease assets | | 2,505,466 | | | - |
Other assets | | 18,450 | | | 19,332 |
Goodwill | | 21,939 | | | 21,939 |
Total assets | $ | 5,104,604 | | $ | 2,265,518 |
Liabilities and shareholders' equity | | | | | |
Current liabilities: | | | | | |
Accounts payable | $ | 115,816 | | $ | 113,071 |
Accrued payroll and benefits | | 126,600 | | | 113,467 |
Accrued liabilities | | 155,843 | | | 147,849 |
Unearned revenue | | 95,195 | | | 70,474 |
Current operating lease liabilities | | 173,139 | | | - |
Income tax payable | | - | | | 5,129 |
Total current liabilities | | 666,593 | | | 449,990 |
Commitments and contingencies (Note 13) | | | | | |
Deferred rent | | - | | | 330,985 |
Long-term operating lease liabilities | | 2,678,374 | | | - |
Deferred income tax liabilities | | 37,814 | | | 11,566 |
Other liabilities | | 38,797 | | | 31,638 |
Total liabilities | | 3,421,578 | | | 824,179 |
Shareholders' equity: | | | | | |
Preferred stock, $0.01 par value, 600,000 shares authorized, no shares issued as of December 31, 2019 and 2018, respectively | | - | | | - |
Common stock, $0.01 par value, 230,000 shares authorized, 36,323 and 35,973 shares issued as of December 31, 2019 and 2018, respectively | | 363 | | | 360 |
Additional paid-in capital | | 1,465,697 | | | 1,374,154 |
Treasury stock, at cost, 8,568 and 8,276 common shares as of December 31, 2019 and 2018, respectively | | (2,699,119) | | | (2,500,556) |
Accumulated other comprehensive loss | | (5,363) | | | (6,236) |
Retained earnings | | 2,921,448 | | | 2,573,617 |
Total shareholders' equity | | 1,683,026 | | | 1,441,339 |
Total liabilities and shareholders' equity | $ | 5,104,604 | | $ | 2,265,518 |
See accompanying notes to consolidated financial statements.
CHIPOTLE MEXICAN GRILL, INC.
CONSOLIDATED STATEMENTS OF INCOME
(in thousands, except per share data)
| | | | | | | | |
| | | | | | | | |
| Year ended December 31, |
| 2019 | | 2018 | | 2017 |
Revenue | $ | 5,586,369 | | $ | 4,864,985 | | $ | 4,476,412 |
Restaurant operating costs (exclusive of depreciation and amortization shown separately below): | | | | | | | | |
Food, beverage and packaging | | 1,847,916 | | | 1,600,760 | | | 1,535,428 |
Labor | | 1,472,060 | | | 1,326,079 | | | 1,205,992 |
Occupancy | | 363,072 | | | 347,123 | | | 327,132 |
Other operating costs | | 760,831 | | | 680,031 | | | 651,644 |
General and administrative expenses | | 451,552 | | | 375,460 | | | 296,388 |
Depreciation and amortization | | 212,778 | | | 201,979 | | | 163,348 |
Pre-opening costs | | 11,108 | | | 8,546 | | | 12,341 |
Impairment, closure costs, and asset disposals | | 23,094 | | | 66,639 | | | 13,345 |
Total operating expenses | | 5,142,411 | | | 4,606,617 | | | 4,205,618 |
Income from operations | | 443,958 | | | 258,368 | | | 270,794 |
Interest and other income, net | | 14,327 | | | 10,068 | | | 4,949 |
Income before income taxes | | 458,285 | | | 268,436 | | | 275,743 |
Provision for income taxes | | (108,127) | | | (91,883) | | | (99,490) |
Net income | $ | 350,158 | | $ | 176,553 | | $ | 176,253 |
Earnings per share: | | | | | | | | |
Basic | $ | 12.62 | | $ | 6.35 | | $ | 6.19 |
Diluted | $ | 12.38 | | $ | 6.31 | | $ | 6.17 |
Weighted-average common shares outstanding: | | | | | | | | |
Basic | | 27,740 | | | 27,823 | | | 28,491 |
Diluted | | 28,295 | | | 27,962 | | | 28,561 |
CONSOLIDATED STATEMENTS OF COMPREHENSIVE INCOME
(in thousands)
| | | | | | | | |
| | | | | | | | |
| Year ended December 31, |
| 2019 | | 2018 | | 2017 |
Net income | $ | 350,158 | | $ | 176,553 | | $ | 176,253 |
Other comprehensive income (loss), net of income taxes: | | | | | | | | |
Foreign currency translation adjustments | | 726 | | | (2,736) | | | 4,689 |
Unrealized gain (loss) on available-for-sale securities, net of income taxes | | 147 | | | 159 | | | (186) |
Other comprehensive income (loss), net of income taxes | | 873 | | | (2,577) | | | 4,503 |
Comprehensive income | $ | 351,031 | | $ | 173,976 | | $ | 180,756 |
See accompanying notes to consolidated financial statements.
CHIPOTLE MEXICAN GRILL, INC.
CONSOLIDATED STATEMENTS OF SHAREHOLDERS’ EQUITY
(in thousands)
| | | | | | | | | | | | | | | | | | | | | | | | |
| Common Stock | | | | Treasury Stock | | | | Accumulated Other Comprehensive Income (Loss) | | | |
| Shares | | Amount | | Additional
Paid-In
Capital | | Shares | | Amount | | Retained
Earnings | | Available-for-Sale Securities | | | Foreign Currency Translation | | Total |
Balance, December 31, 2016 | 35,833 | | $ | 358 | | $ | 1,238,875 | | 7,019 | | $ | (2,049,389) | | $ | 2,220,811 | | $ | (120) | | $ | (8,042) | | $ | 1,402,493 |
Stock-based compensation | - | | | - | | | 66,396 | | - | | | - | | | - | | | - | | | - | | | 66,396 |
Stock plan transactions and other | 19 | | | 1 | | | (181) | | - | | | - | | | - | | | - | | | - | | | (180) |
Acquisition of treasury stock | - | | | - | | | - | | 807 | | | (285,020) | | | - | | | - | | | - | | | (285,020) |
Net income | - | | | - | | | - | | - | | | - | | | 176,253 | | | - | | | - | | | 176,253 |
Other comprehensive income (loss), net of income taxes | - | | | - | | | - | | - | | | - | | | - | | | (186) | | | 4,689 | | | 4,503 |
Balance, December 31, 2017 | 35,852 | | $ | 359 | | $ | 1,305,090 | | 7,826 | | $ | (2,334,409) | | $ | 2,397,064 | | $ | (306) | | $ | (3,353) | | $ | 1,364,445 |
Stock-based compensation | - | | | - | | | 69,947 | | - | | | - | | | - | | | - | | | - | | | 69,947 |
Stock plan transactions and other | 121 | | | 1 | | | (883) | | - | | | - | | | - | | | - | | | - | | | (882) |
Acquisition of treasury stock | - | | | - | | | - | | 450 | | | (166,147) | | | - | | | - | | | - | | | (166,147) |
Net income | - | | | - | | | - | | - | | | - | | | 176,553 | | | - | | | - | | | 176,553 |
Other comprehensive income (loss), net of income taxes | - | | | - | | | - | | - | | | - | | | - | | | 159 | | | (2,736) | | | (2,577) |
Balance, December 31, 2018 | 35,973 | | $ | 360 | | $ | 1,374,154 | | 8,276 | | $ | (2,500,556) | | $ | 2,573,617 | | $ | (147) | | $ | (6,089) | | $ | 1,441,339 |
Adoption of ASU No. 2016-02, Leases (Topic 842) | - | | | - | | | - | | - | | | - | | | (2,327) | | | - | | | - | | | (2,327) |
Stock-based compensation | - | | | - | | | 92,062 | | - | | | - | | | - | | | - | | | - | | | 92,062 |
Stock plan transactions and other | 350 | | | 3 | | | (519) | | - | | | - | | | - | | | - | | | - | | | (516) |
Acquisition of treasury stock | - | | | - | | | - | | 292 | | | (198,563) | | | - | | | - | | | - | | | (198,563) |
Net income | - | | | - | | | - | | - | | | - | | | 350,158 | | | - | | | - | | | 350,158 |
Other comprehensive income (loss), net of income taxes | - | | | - | | | - | | - | | | - | | | - | | | 147 | | | 726 | | | 873 |
Balance, December 31, 2019 | 36,323 | | $ | 363 | | $ | 1,465,697 | | 8,568 | | $ | (2,699,119) | | $ | 2,921,448 | | $ | - | | $ | (5,363) | | $ | 1,683,026 |
See accompanying notes to consolidated financial statements.
CHIPOTLE MEXICAN GRILL, INC.
CONSOLIDATED STATEMENTS OF CASH FLOWS
(in thousands)
| | | | | | | | |
| | | | | | | | |
| Year ended December 31, |
| 2019 | | 2018 | | 2017 |
Operating activities | | | | | | | | |
Net income | $ | 350,158 | | $ | 176,553 | | $ | 176,253 |
Adjustments to reconcile net income to net cash provided by operating activities: | | | | | | | | |
Depreciation and amortization | | 212,778 | | | 201,979 | | | 163,348 |
Amortization of operating lease assets | | 163,952 | | | - | | | - |
Deferred income tax (benefit) provision | | 29,962 | | | 10,585 | | | (18,026) |
Impairment, closure costs, and asset disposals | | 15,402 | | | 61,987 | | | 13,345 |
Bad debt allowance | | 33 | | | 125 | | | 214 |
Stock-based compensation expense | | 91,396 | | | 69,164 | | | 65,255 |
Other | | (10,592) | | | (2,918) | | | (218) |
Changes in operating assets and liabilities: | | | | | | | | |
Accounts receivable | | (2,630) | | | (8,298) | | | (140) |
Inventory | | (4,530) | | | (1,722) | | | (5,250) |
Prepaid expenses and other current assets | | (23,066) | | | (3,811) | | | (6,710) |
Other assets | | 2,818 | | | (2,005) | | | (1,476) |
Accounts payable | | (973) | | | 32,080 | | | 10,908 |
Accrued payroll and benefits | | 11,759 | | | 29,568 | | | 6,188 |
Accrued liabilities | | 36,543 | | | 14,831 | | | 28,179 |
Unearned revenue | | 30,400 | | | 6,829 | | | 4,207 |
Income tax payable/receivable | | (32,083) | | | 14,439 | | | (4,173) |
Deferred rent | | - | | | 21,297 | | | 29,996 |
Operating lease liabilities | | (151,557) | | | - | | | - |
Other long-term liabilities | | 1,862 | | | 869 | | | 6,316 |
Net cash provided by operating activities | | 721,632 | | | 621,552 | | | 468,216 |
Investing activities | | | | | | | | |
Purchases of leasehold improvements, property and equipment | | (333,912) | | | (287,390) | | | (216,777) |
Purchases of investments | | (448,754) | | | (485,188) | | | (199,801) |
Maturities of investments | | 476,723 | | | 385,000 | | | 330,000 |
Proceeds from sale of equipment | | 13,969 | | | - | | | - |
Net cash used in investing activities | | (291,974) | | | (387,578) | | | (86,578) |
Financing activities | | | | | | | | |
Acquisition of treasury stock | | (190,617) | | | (160,937) | | | (285,218) |
Tax withholding on stock-based compensation awards | | (10,420) | | | (5,411) | | | (702) |
Stock plan transactions and other financing activities | | (698) | | | (187) | | | 26 |
Net cash used in financing activities | | (201,735) | | | (166,535) | | | (285,894) |
Effect of exchange rate changes on cash, cash equivalents and restricted cash | | 406 | | | (1,457) | | | 2,056 |
Net change in cash, cash equivalents, and restricted cash | | 228,329 | | | 65,982 | | | 97,800 |
Cash, cash equivalents, and restricted cash at beginning of period | | 280,152 | | | 214,170 | | | 116,370 |
Cash, cash equivalents, and restricted cash at end of period | $ | 508,481 | | $ | 280,152 | | $ | 214,170 |
Supplemental disclosures of cash flow information | | | | | | | | |
Income taxes paid | $ | 109,571 | | $ | 67,053 | | $ | 119,787 |
Purchases of leasehold improvements, property, and equipment accrued in accounts payable and accrued liabilities | $ | 36,886 | | $ | 30,870 | | $ | 31,806 |
Acquisition of treasury stock accrued in accounts payable and accrued liabilities | $ | - | | $ | 2,474 | | $ | 2,274 |
See accompanying notes to consolidated financial statements.
CHIPOTLE MEXICAN GRILL, INC.
NOTES TO CONSOLIDATED FINANCIAL STATEMENTS
(dollar and share amounts in thousands, unless otherwise specified)
1. Description of Business and Summary of Significant Accounting Policies
In this annual report on Form 10-K, Chipotle Mexican Grill, Inc., a Delaware corporation, together with its subsidiaries, is collectively referred to as “Chipotle,” “we,” “us,” or “our.”
We develop and operate restaurants that serve a relevant menu of burritos, burrito bowls, tacos, and salads, made using fresh, high-quality ingredients. As of December 31, 2019, we operated 2,580 Chipotle restaurants throughout the United States as well as 39 international Chipotle restaurants. We are also an investor in a consolidated entity that owns and operates three Pizzeria Locale restaurants, a fast-casual pizza concept. We manage our operations based on eight regions and have aggregated our operations to one reportable segment.
Principles of Consolidation and Basis of Presentation
Our consolidated financial statements include our accounts and our wholly and majority owned subsidiaries after elimination of all intercompany accounts and transactions.
Management Estimates
The preparation of financial statements in conformity with U.S. generally accepted accounting principles requires management to make estimates and assumptions that affect the reported amounts of assets and liabilities and the disclosure of contingent assets and liabilities as of the date of the financial statements, as well as the reported amounts of revenue and expenses during the reporting period. Actual results could differ from those estimates under different assumptions or conditions.
Cash and Cash Equivalents
We consider highly liquid investment instruments purchased with an initial maturity of three months or less to be cash equivalents. We maintain cash and cash equivalent balances that exceed federally-insured limits with a number of financial institutions.
Restricted Cash
We maintain certain cash balances restricted as to withdrawal or use. Restricted cash assets are primarily insurance-related restricted trust assets.
Accounts Receivable
Accounts receivable primarily consists of receivables from third party gift card distributors, tenant improvement receivables from landlords, vendor rebates, delivery receivables and interest receivable. The allowance for doubtful accounts is our best estimate of the amount of probable credit losses in our existing accounts receivable based on a specific review of account balances. Account balances are charged against the allowance after all means of collection have been exhausted and the potential for recoverability is considered remote. The allowance for doubtful accounts is $7 and $0 as of December 31, 2019 and 2018, respectively.
Inventory
Inventory, consisting principally of food, beverages, and supplies, is valued at the lower of first-in, first-out cost or net realizable value. Certain key ingredients (beef, pork, chicken, beans, rice, sour cream, cheese, and tortillas) are purchased from a small number of suppliers.
Investments
Investments classified as trading securities are carried at fair value with any unrealized gain or loss being recorded in the consolidated statements of income. Investments classified as available-for-sale are carried at fair value with unrealized gains and losses, net of tax, included as a component of other comprehensive income (loss), net of income taxes on the consolidated statements of comprehensive income. Held-to-maturity securities are carried at amortized cost. Impairment charges on investments are recognized in interest and other income, net on the consolidated statements of income when management believes the decline in the fair value of the investment is other-than-temporary.
Fair Value Measurements
Fair value is the price we would receive to sell an asset or pay to transfer a liability (exit price) in an orderly transaction between market participants. For assets and liabilities recorded or disclosed at fair value, we determine fair value based on the following:
Level 1: Quoted prices in active markets for identical assets or liabilities that the entity has the ability to access.
Level 2: Observable inputs other than prices included in Level 1, such as quoted prices for similar assets and liabilities in active markets; quoted prices for identical or similar assets and liabilities in markets that are not active; or other inputs that are observable or can be corroborated with observable market data.
Level 3: Unobservable inputs for the asset or liability. This includes certain pricing models, discounted cash flow methodologies and similar techniques that use significant unobservable inputs.
Foreign Currency Translation
Our international operations use the local currency as the functional currency. Assets and liabilities are translated at exchange rates in effect as of the balance sheet date. Income and expense accounts are translated monthly using average monthly exchange rates. Resulting translation adjustments are recorded as a separate component of other comprehensive income (loss), net of income taxes on the consolidated statement of comprehensive income.
Leasehold Improvements, Property and Equipment
Leasehold improvements, property and equipment are recorded at cost. Internal costs directly associated with the acquisition, development and construction of a restaurant are capitalized. During the years ended December 31, 2019, 2018 and 2017, we capitalized $6,735, $6,285, and $7,507 of internal cost, respectively. Expenditures for refurbishments and improvements that significantly add to the productivity capacity or extend the useful life are capitalized, while expenditures for maintenance and repairs are expensed as incurred. Depreciation is calculated using the straight-line method over the estimated useful lives of the assets. Leasehold improvements are amortized over the shorter of the lease term, which generally include option periods that are reasonably certain, or the estimated useful lives of the assets. Upon retirement or disposal of assets, the accounts are relieved of cost and accumulated depreciation and any related gain or loss is reflected in impairment, closure costs, and asset disposals in the consolidated statements of income. Assets to be disposed of are reported at the lower of their carrying amount or fair value less estimated costs to sell.
At least annually, or when impairment indicators are present, we evaluate, and adjust when necessary, the estimated useful lives of leasehold improvements, property and equipment. The changes in estimated useful lives did not have a material impact on depreciation in any period. The estimated useful lives are:
| |
| |
Leasehold improvements and buildings | 3-20 years |
Furniture and fixtures | 4-7 years |
Equipment | 3-10 years |
Leases
We determine if a contract contains a lease at inception. Our material operating leases consist of restaurant locations and office space. Our leases generally have remaining terms of 1-20 years and most include options to extend the leases for additional 5-year periods. Generally, the lease term is the minimum of the noncancelable period of the lease or the lease term inclusive of reasonably certain renewal periods up to a term of 20 years.
Operating lease assets and liabilities are recognized at the lease commencement date, which is the date we take possession of the property. Operating lease liabilities represent the present value of lease payments not yet paid. Operating lease assets represent our right to use an underlying asset and are based upon the operating lease liabilities adjusted for prepayments or accrued lease payments, initial direct costs, lease incentives, and impairment of operating lease assets. To determine the present value of lease payments not yet paid, we estimate incremental borrowing rates corresponding to the lease term including reasonably certain renewal periods. As we have no outstanding debt nor committed credit facilities, secured or otherwise, we estimate this rate based on prevailing financial market conditions, comparable company and credit analysis, and management judgment.
Our leases typically contain rent escalations over the lease term. We recognize expense for these leases on a straight-line basis over the lease term. Additionally, tenant incentives used to fund leasehold improvements are recognized when earned and reduce our right-of-use asset related to the lease. These are amortized through the operating lease asset as reductions of expense over the lease term.
Some of our leases include rent escalations based on inflation indexes and fair market value adjustments. Certain leases contain contingent rental provisions that include a fixed base rent plus an additional percentage of the restaurant’s sales, generally in excess of a stipulated amount. Operating lease liabilities are calculated using the prevailing index or rate at lease commencement. Subsequent escalations in the index or rate and contingent rental payments are recognized as variable lease expenses. Our lease agreements do not contain any material residual value guarantees or material restrictive covenants.
Goodwill
Goodwill is not subject to amortization, but instead is tested for impairment at least annually, or when impairment indicators are present, and we are required to record any necessary impairment adjustments. Impairment is measured as the excess of the carrying value over the fair value of the goodwill. No impairment charges were recognized on goodwill for the years ended December 31, 2019, 2018, and 2017.
Other Assets
Other assets consist primarily of a rabbi trust as described further in Note 10. “Employee Benefit Plans,” transferable liquor licenses which are carried at the lower of fair value or cost and rental deposits related to leased properties.
Insurance Liability
We are self-insured for a significant portion of our employee health benefits programs, and carry significant retentions for risks and associated liabilities with respect to workers’ compensation, general liability, property and auto damage, employment practices liability, cyber liability and directors and officer’s liability. Predetermined loss limits have been arranged with third party insurance companies to limit exposure to these claims. We record a liability that represents our estimated cost of claims incurred and unpaid as of the balance sheet date. Our estimated liability is not discounted and is based on a number of assumptions and factors, including historical trends, actuarial assumptions and economic conditions, and is closely monitored and adjusted when warranted by changing circumstances.
Reserves/Contingencies for Litigation and Other Matters
We are involved in various claims and legal actions that arise in the ordinary course of business. We record an accrual for legal contingencies when we determine that it is probable that we have incurred a liability and we can reasonably estimate the amount of the loss.
Income Taxes
We compute income taxes using the asset and liability method, under which deferred income tax assets and liabilities are recognized based on the differences between the financial reporting bases and the respective tax bases of assets and liabilities. Deferred tax assets and liabilities are measured using enacted tax rates expected to apply to taxable income in the years in which we expect the temporary differences to reverse. Any effects of changes in income tax rates or tax laws are included in the provision for income taxes in the period that includes the enactment date.
We routinely assess the realizability of our deferred tax assets by jurisdiction and may record a valuation allowance if, based on all available positive and negative evidence, we determine that some portion of the deferred tax assets may not be realized prior to expiration. If we determine that we may be able to realize our deferred tax assets in the future in excess of their net recorded amount, we would make an adjustment to the deferred tax asset valuation allowance, which would reduce the provision for income taxes during the period in which the determination was made that the deferred tax asset can be realized.
We evaluate our tax filing positions and recognize a tax benefit from an uncertain tax position only if it is more likely than not that based on its technical merits the tax position will be sustained upon examination by the relevant taxing authorities, including resolutions of any related appeals or litigation processes. The tax benefits recognized in the financial statements from such a position are measured based on the largest tax benefit that has a greater than 50% likelihood of being realized upon settlement with a taxing authority. For uncertain tax positions that do not meet this threshold, we record a related tax reserve in the period in which it arises. We adjust our unrecognized tax benefit liability and provision for income taxes in the period in which the uncertain tax position is effectively settled, the statute of limitations expires for the relevant taxing authority to examine the tax position or when new information becomes available that requires a change in recognition and/or measurement of the liability.
We recognize interest to be paid on an underpayment of income taxes in interest expense and any related statutory penalties in the provision for income taxes in our consolidated statements of income. Accrued interest and penalties are included within the related tax reserve on our consolidated balance sheets.
Revenue Recognition
We generally recognize revenue, net of discounts and incentives, when payment is tendered at the point of sale. We report revenue net of sales-related taxes collected from customers and remit to governmental taxing authorities.
Delivery
We offer our customers delivery in almost all of our geographic regions. Delivery services are fulfilled by third-party service providers. In some cases, we make delivery sales through our website Chipotle.com or the Chipotle App (“White Label Sales”). In other cases, we make delivery sales through a non-Chipotle owned channel, such as the delivery partner’s website or mobile app (“Marketplace Sales”). With respect to White Label Sales, we control the delivery services and generally recognize revenue, including delivery fees, when the delivery partner transfers food to the customer. For these sales, we receive payment directly from the customer at the time of sale. With respect to Marketplace Sales, we generally recognize revenue, excluding delivery fees collected by the delivery partner, when control of the food is transferred to the delivery partner. We receive payment from the delivery partner subsequent to the transfer of food and the payment terms are short-term in nature.
Gift Cards
We sell gift cards, which do not have expiration dates and we do not deduct non-usage fees from outstanding gift card balances. Gift card balances are initially recorded as unearned revenue. We recognize revenue from gift cards when the gift card is redeemed by the customer. Historically, the majority of gift cards are redeemed within one year. In addition, based on historical redemption rates, a portion of gift cards are not expected to be redeemed and will be recognized as breakage over time in proportion to gift card redemptions. The breakage rates are based on company and program specific information, including historical redemption patterns, and expected remittance to government agencies under unclaimed property laws, if applicable. We evaluate our breakage rate estimate annually and apply that rate to gift card redemptions. Gift card liability balances are typically highest at the end of each calendar year following increased gift card sales during the holiday season; accordingly, revenue recognized from gift card liability balances is highest in the first quarter of each calendar year.
Chipotle Rewards
During the first quarter of 2019, we launched Chipotle Rewards nationally. Eligible customers who enroll in the program generally earn points for every dollar spent. After accumulating a certain number of points, the customer earns a reward that can be redeemed for a free entrée. We may also periodically offer promotions, which provide the customer with the opportunity to earn bonus points or free food vouchers (“Bonus Vouchers”). Earned rewards generally expire one to two months after they are issued, and points generally expire if an account is inactive for a period of six months.
We defer revenue associated with the estimated standalone selling price of points or Bonus Vouchers earned by customers as each point or Bonus Voucher is earned, net of points we do not expect to be redeemed. The estimated standalone selling price of each point or Bonus Voucher earned is based on the estimated value of product for which the reward is expected to be redeemed. Our estimate of points and Bonus Vouchers we expect to be redeemed is based on historical company specific data. The cost associated with rewards and Bonus Vouchers are recorded when they are redeemed and are included in food, beverage, and packaging expense on our consolidated statements of income.
We recognize loyalty revenue on the consolidated statements of income when a customer redeems an earned reward. Deferred revenue associated with Chipotle Rewards is included in unearned revenue on our consolidated balance sheets.
Advertising and Marketing Costs
Advertising and marketing costs are expensed as incurred and totaled $141,567, and $111,695 and $106,345 for the years ended December 31, 2019, 2018 and 2017, respectively. Advertising and marketing costs are included in other operating costs on the consolidated statements of income.
Stock-Based Compensation
We issue shares as part of employee compensation pursuant to the Amended and Restated Chipotle Mexican Grill, Inc. 2011 Stock Incentive Plan (the “2011 Incentive Plan”). Stock-only stock appreciation rights, or “SOSARs”, and stock awards generally vest equally over two and three years and expire after seven years. Stock-based compensation expense is generally recognized on a straight-line basis for each separate vesting portion. Compensation expense related to employees eligible to retire and retain full rights to the awards is recognized over six months which coincides with the notice period. We estimate forfeitures based on historical data when determining the amount of stock-based compensation costs to be recognized in each period. We have also granted SOSARs and stock awards with performance vesting conditions and/or market vesting conditions. Stock awards with performance or market vesting conditions generally vest based on our achievement versus stated targets or criteria over a three-year performance and service period. Compensation expense on SOSARs subject to performance conditions is recognized over the longer of the estimated performance goal attainment period or time vesting period. Compensation expense on stock awards subject to performance conditions, which is based on the quantity of awards we have determined are probable of vesting, is recognized over the longer of the estimated performance goal attainment period or time vesting period. Compensation expense is recognized ratably for awards subject to market conditions regardless of whether the market condition is satisfied, provided that the requisite service has been provided. Some stock-based compensation awards are made to employees involved in our new restaurant development activities, and expense for these awards is recognized as capitalized development and included in leasehold improvements, property and equipment on the consolidated balance sheets.
Restaurant Pre-Opening Costs
Pre-opening costs, including rent, wages, benefits and travel for training and opening teams, food and other restaurant operating costs, are expensed as incurred prior to a restaurant opening for business, and are included in operating expenses on the consolidated statements of income.
Impairment of Long-Lived Assets
Long-lived assets are reviewed for impairment whenever events or changes in circumstances indicate that the carrying amount of an asset may not be recoverable. For the purpose of reviewing restaurant assets to be held and used for potential impairment, assets are grouped together at the market level, or in the case of a potential relocation or closure, at the restaurant level. We manage our restaurants as a group with significant common costs and promotional activities; as such, an individual restaurant’s cash flows are not generally independent of the cash flows of others in a market.
The fair value measurement for asset impairment is based on Level 3 inputs. See “Fair Value Measurements” above for a description of level inputs. We first compare the carrying value of the asset (or asset group, referred interchangeably throughout as asset) to the asset’s estimated future undiscounted cash flows. If the estimated undiscounted future cash flows are less than the carrying value of the asset, we determine if we have an impairment loss by comparing the carrying value of the asset to the asset's estimated fair value. The estimated fair value of the asset is generally determined using the income approach to measure the fair value,
which is based on the present value of estimated future cash flows. Key inputs to the income approach for restaurant assets include the discount rate, projected restaurant cash flows, and sublease income if we are closing the restaurant. In certain cases, management uses other market information, when available, to estimate the fair value of an asset. The impairment charges represent the excess of each asset’s carrying amount over its estimated fair value and are allocated among the long-lived asset or assets of the group.
Earnings per Share
Basic earnings per share is calculated by dividing income available to common shareholders by the weighted-average number of shares of common stock outstanding during each period. Diluted earnings per share (“diluted EPS”) is calculated using income available to common shareholders divided by diluted weighted-average shares of common stock outstanding during each period. Potentially dilutive securities include shares of common stock underlying SOSARs and non-vested stock awards (collectively “stock awards”). Diluted EPS considers the impact of potentially dilutive securities except in periods in which there is a loss because the inclusion of the potential common shares would have an anti-dilutive effect. Stock awards are excluded from the calculation of diluted EPS in the event they are subject to performance conditions or are antidilutive.
Recently Issued Accounting Standards
In June 2016, the Financial Accounting Standards Board “FASB” issued Accounting Standards Update “ASU” 2016-13, Financial Instruments – Credit Losses (Topic 326): Measurement of Credit Losses on Financial Instruments (“ASU 2016-13”). ASU 2016-13 requires companies to measure credit losses utilizing a methodology that reflects expected credit losses and requires a consideration of a broader range of reasonable and supportable information to inform credit loss estimates. ASU 2016-13 is effective for fiscal years beginning after December 15, 2019, including interim periods within those fiscal years. We will adopt the standard effective January 1, 2020. We do not expect the adoption of ASU 2016-13 to result in a material change to our consolidated financial statements.
In August 2018, the FASB issued ASU 2018-15, “Intangibles—Goodwill and Other—Internal-Use Software (Subtopic 350-40)”: Customer’s Accounting for Implementation Costs Incurred in a Cloud Computing Arrangement That Is a Service Contract (“ASU 2018-15”), which clarifies the accounting for implementation costs in cloud computing arrangements. ASU 2018-15 is effective for fiscal years beginning after December 15, 2019, including interim periods within those fiscal years. We will adopt the standard prospectively on January 1, 2020. Prior to the adoption of ASU 2018-15, we capitalized implementation costs incurred during the application development phase of cloud computing arrangements to leasehold improvements, property and equipment, net on our consolidated balance sheets and have recognized expense over the useful life of the related asset within depreciation and amortization on our consolidated statements of income. Subsequent to the adoption of ASU 2018-15, we will capitalize such costs within prepaid expenses and other current assets or other assets on our consolidated balance sheets and will recognize expense within general and administrative expenses or other operating costs on our consolidated statements of income, consistent with the where the expense associated with the hosting element of the arrangement are presented. We do not expect the adoption of ASU 2018-15 to result in a material change to our consolidated financial statements.
We reviewed all other recently issued accounting pronouncements and concluded that they were either not applicable or not expected to have a significant impact to the consolidated financial statements.
Recently Adopted Accounting Standards
On January 1, 2019, we adopted ASU 2016-02, “Leases (Topic 842),” along with related clarifications and improvements. This pronouncement requires lessees to recognize a liability for lease obligations, which represents the discounted obligation to make future lease payments, and a corresponding right-of-use asset on the consolidated balance sheets. The guidance requires disclosure of key information about leasing arrangements that is intended to give financial statement users the ability to assess the amount, timing, and potential uncertainty of cash flows related to leases. We elected the optional transition method to apply the standard as of the effective date and therefore, we have not applied the standard to the comparative periods presented on our consolidated financial statements.
Our practical expedients were as follows:
| | |
| | |
| | Implications as of January 1, 2019 |
Practical expedient package | | We have not reassessed whether any expired or existing contracts are, or contain, leases. |
| | We have not reassessed the lease classification for any expired or existing leases. |
| | We have not reassessed initial direct costs for any expired or existing leases. |
Hindsight practical expedient | | We have not elected the hindsight practical expedient, which permits the use of hindsight when determining lease term and impairment of operating lease assets. |
The impact on the consolidated balance sheet is as follows:
| | | | | | | | |
| | | | | | | | |
| December 31, 2018 | | Adjustments Due to the Adoption of Topic 842 | | January 1, 2019 |
Assets | | | | | | | | |
Current assets: | | | | | | | | |
Cash and cash equivalents | $ | 249,953 | | $ | - | | $ | 249,953 |
Accounts receivable | | 62,312 | | | - | | | 62,312 |
Inventory | | 21,555 | | | - | | | 21,555 |
Prepaid expenses and other current assets | | 54,129 | | | (23,653) | | | 30,476 |
Investments | | 426,845 | | | - | | | 426,845 |
Total current assets | | 814,794 | | | (23,653) | | | 791,141 |
Leasehold improvements, property and equipment, net | | 1,379,254 | | | (15,167) | | | 1,364,087 |
Restricted cash | | 30,199 | | | - | | | 30,199 |
Operating lease assets | | - | | | 2,363,020 | | | 2,363,020 |
Other assets | | 19,332 | | | - | | | 19,332 |
Goodwill | | 21,939 | | | - | | | 21,939 |
Total assets | $ | 2,265,518 | | $ | 2,324,200 | | $ | 4,589,718 |
Liabilities and shareholders' equity | | | | | | | | |
Current liabilities: | | | | | | | | |
Accounts payable | $ | 113,071 | | $ | - | | $ | 113,071 |
Accrued payroll and benefits | | 113,467 | | | - | | | 113,467 |
Accrued liabilities | | 147,849 | | | (23,860) | | | 123,989 |
Unearned revenue | | 70,474 | | | - | | | 70,474 |
Income tax payable | | 5,129 | | | - | | | 5,129 |
Total current liabilities | | 449,990 | | | (23,860) | | | 426,130 |
Commitments and contingencies | | | | | | | | |
Deferred rent | | 330,985 | | | (330,985) | | | - |
Current and long-term operating lease liabilities | | - | | | 2,682,203 | | | 2,682,203 |
Deferred income tax liabilities | | 11,566 | | | (831) | | | 10,735 |
Other liabilities | | 31,638 | | | - | | | 31,638 |
Total liabilities | | 824,179 | | | 2,326,527 | | | 3,150,706 |
Shareholders' equity: | | | | | | | | |
Preferred stock, $0.01 par value, 600,000 shares authorized, no shares issued as of December 31, 2018 and 2017, respectively | | - | | | - | | | - |
Common stock, $0.01 par value, 230,000 shares authorized, 35,973 and 35,852 shares issued as of December 31, 2018 and 2017, respectively | | 360 | | | - | | | 360 |
Additional paid-in capital | | 1,374,154 | | | - | | | 1,374,154 |
Treasury stock, at cost, 8,276 and 7,826 common shares at December 31, 2018 and 2017, respectively | | (2,500,556) | | | - | | | (2,500,556) |
Accumulated other comprehensive loss | | (6,236) | | | - | | | (6,236) |
Retained earnings | | 2,573,617 | | | (2,327) | | | 2,571,290 |
Total shareholders' equity | | 1,441,339 | | | (2,327) | | | 1,439,012 |
Total liabilities and shareholders' equity | $ | 2,265,518 | | $ | 2,324,200 | | $ | 4,589,718 |
2. Supplemental Balance Sheet Information
Leasehold improvements, property and equipment, net were as follows:
| | | | | |
| | | | | |
| December 31, |
| 2019 | | 2018 |
Land | $ | 12,943 | | $ | 12,943 |
Leasehold improvements and buildings | | 1,765,464 | | | 1,689,873 |
Furniture and fixtures | | 182,391 | | | 173,252 |
Equipment | | 653,909 | | | 543,869 |
Construction in Progress | | 45,422 | | | 42,824 |
Leasehold improvements, property and equipment | | 2,660,129 | | | 2,462,761 |
Accumulated depreciation | | (1,201,439) | | | (1,083,507) |
Leasehold improvements, property and equipment, net | $ | 1,458,690 | | $ | 1,379,254 |
Accrued payroll and benefits were as follows:
| | | | | |
| | | | | |
| December 31, |
| 2019 | | 2018 |
Workers' compensation liability | $ | 29,837 | | $ | 30,878 |
Accrued payroll | | 31,188 | | | 35,622 |
Other accrued payroll and benefits | | 65,575 | | | 46,967 |
Accrued payroll and benefits | $ | 126,600 | | $ | 113,467 |
Accrued liabilities were as follows:
| | | | | |
| | | | | |
| December 31, |
| 2019 | | 2018 |
Sales and Use tax payable | $ | 26,484 | | $ | 21,762 |
Legal reserve liability | | 45,721 | | | 4,661 |
Data security incident liability | | 15,000 | | | 29,289 |
Other accrued liabilities | | 68,638 | | | 92,137 |
Accrued liabilities | $ | 155,843 | | $ | 147,849 |
3. Revenue Recognition
Gift Cards
The gift card liability included in unearned revenue on the consolidated balance sheets was as follows:
| | | | | |
| | | | | |
| December 31, |
| 2019 | | 2018 |
Gift card liability | $ | 84,611 | | $ | 70,474 |
Revenue recognized from the redemption of gift cards that was included in unearned revenue at the beginning of the year was as follows:
| | | | | | | | |
| | | | | | | | |
| Year ended December 31, |
| 2019 | | 2018 | | 2017 |
Revenue recognized from gift card liability balance at the beginning of the year | $ | 37,386 | | $ | 36,094 | | $ | 37,109 |
Chipotle Rewards
Chipotle Rewards launched nationally in March 2019. Accordingly, there was no revenue recognized from unearned revenue associated with this loyalty program in the years ended December, 2018 or 2017. Changes in our Chipotle Rewards liability included in unearned revenue on the consolidated balance sheets were as follows:
| | | | | | | | |
| | | | | | | Year ended |
| | | | | | | December 31, |
| | | | | | | 2019 |
Chipotle Rewards liability, beginning balance | | | | | | | $ | - |
Revenue deferred | | | | | | | | 44,666 |
Revenue recognized | | | | | | | | (34,082) |
Chipotle Rewards liability, ending balance | | | | | | | $ | 10,584 |
4. Fair Value of Financial Instruments
Assets and Liabilities Measured at Fair Value on a Recurring Basis
The carrying value of our cash and cash equivalents, accounts receivable and accounts payable approximate fair value because of their short-term nature.
Our investments consist of U.S. treasury notes with maturities of up to one year. Fair value of investments is measured using Level 1 inputs. We designate the appropriate classification of our investments at the time of purchase based upon the intended holding period.
Investments, all of which are classified as held-to-maturity (“HTM”), are carried at amortized cost and approximated fair value as of December 31, 2019. We recognize impairment charges when management believes the decline in the fair value of the investment below the carrying value is other-than-temporary. No impairment charges were recognized on our investments for the twelve months ended December 31, 2019 and 2018.
We have elected to fund certain deferred compensation obligations through a rabbi trust, the assets of which are designated as trading securities, as described further in Note 10. “Employee Benefit Plans.”
Assets and Liabilities Measured at Fair Value on a Nonrecurring Basis
Assets recognized or disclosed at fair value on the consolidated financial statements on a nonrecurring basis include items such as leasehold improvements, property and equipment, operating lease assets, goodwill, and other intangible assets. These assets are measured at fair value if determined to be impaired.
Other than as disclosed in Note 5. “Corporate Restructuring Costs”, Note 6. “Restaurant Closure Costs” and Note 11. “Leases” as of December 31, 2019 and 2018, we had no material non-financial assets or liabilities that were measured using Level 3 inputs.
5. Corporate Restructuring Costs
In May 2018, we announced that we would open a headquarters office in Newport Beach, California, consolidate certain corporate administrative functions into our existing office in Columbus, Ohio, and close our existing headquarters offices in Denver, Colorado, as well as additional corporate offices in New York, New York. All affected employees were either offered an opportunity to continue in the new organization or were offered a severance package. We record severance as a one-time termination benefit and recognize the expense ratably over the employees’ required future service period.
All other costs, including other employee transition costs, recruitment and relocation costs, office asset impairment and other office closure costs, and third-party and other costs, are recognized in the period incurred.
Corporate restructuring costs consist of the following:
| | | | | | | | |
| Year ended December 31, |
| 2019 | | 2018 | | 2017 |
Employee severance and other employee transition costs(1) | $ | 1,768 | | $ | 6,919 | | $ | - |
Recruitment and relocation costs(1) | | 6,231 | | | 9,952 | | | - |
Office asset impairment and other office closure costs(2) | | 1,719 | | | 15,571 | | | - |
Third-party and other costs(1) | | 4,324 | | | 8,836 | | | - |
Stock-based compensation(1) | | 134 | | | 1,345 | | | - |
Total corporate restructuring costs | $ | 14,176 | | $ | 42,623 | | $ | - |
__________________
(1)
(2)
Upon the adoption of Topic 842 on January 1, 2019, lease termination and other closure liabilities of $14,716 were reclassified into operating lease assets and are no longer within the scope of ASC 420, Exit or Disposal Cost Obligations.
Changes in our corporate restructuring liabilities which are included in accrued liabilities on the consolidated balance sheets were as follows:
| | | | | | | | | | | |
| | | | | | | | | | | |
| December 31, 2018 | | Charges | | Payments | | December 31, 2019 |
Employee severance and other employee transition costs | $ | 2,722 | | $ | 1,768 | | $ | (4,490) | | $ | - |
Recruitment and relocation costs | | 224 | | | 6,231 | | | (6,425) | | | 30 |
Third-party and other costs | | 554 | | | 4,324 | | | (4,878) | | | - |
Total restructuring liability | $ | 3,500 | | $ | 12,323 | | $ | (15,793) | | $ | 30 |
6. Restaurant Closure Costs
During the year ended December 31, 2019, 2018, and 2017, we closed or relocated underperforming restaurants totaling nine, 54, and 25, respectively. This included the planned restaurant closures announced in June 2018. In connection with this initiative, we have closed or relocated 56 restaurants, of which six of these closures were in 2019. In total, we incurred restaurant asset impairment and other restaurant closure costs, which were recorded in impairment, closure costs, and asset disposals on the consolidated statements of income as follows:
| | | | | | | | |
| | | | | | | | |
| Year ended December 31, |
| 2019 | | 2018 | | 2017 |
Restaurant asset impairment and other restaurant closure costs | $ | 2,997 | | $ | 40,522 | | $ | 3,284 |
Upon the adoption of Topic 842 on January 1, 2019, lease termination and other closure liabilities of $9,144 were reclassified into operating lease assets and are no longer within the scope of ASC 420, Exit or Disposal Cost Obligations.
7. Income Taxes
The components of the provision for income taxes were as follows:
| | | | | | | | |
| | | | | | | | |
| Year ended December 31, |
| 2019 | | 2018 | | 2017 |
Current tax: | | | | | | | | |
U.S. Federal | $ | 57,020 | | $ | 58,878 | | $ | 98,208 |
U.S. State | | 20,499 | | | 21,780 | | | 18,639 |
Foreign | | 646 | | | 637 | | | 669 |
| | 78,165 | | | 81,295 | | | 117,516 |
Deferred tax: | | | | | | | | |
U.S. Federal | | 27,231 | | | 10,541 | | | (16,201) |
U.S. State | | 2,740 | | | 479 | | | (1,559) |
Foreign | | (2,685) | | | (2,261) | | | (496) |
| | 27,286 | | | 8,759 | | | (18,256) |
Valuation allowance | | 2,676 | | | 1,829 | | | 230 |
Provision for income taxes | $ | 108,127 | | $ | 91,883 | | $ | 99,490 |
The effective tax rate differs from the statutory tax rates as follows:
| | | | | | | | | |
| | | | | | | | | |
| | | | | | | | | |
| Year ended December 31, |
| 2019 | | 2018 | | 2017 |
Statutory U.S. federal income tax rate | | 21.0 | % | | 21.0 | % | | 35.0 | % |
State income tax, net of related federal income tax benefit | | 4.1 | | | 6.6 | | | 4.4 | |
Federal credits | | (1.7) | | | (2.1) | | | (1.5) | |
Executive compensation disallowed | | 2.0 | | | 1.4 | | | - | |
Meals and entertainment | | 0.1 | | | 0.1 | | | - | |
Enhanced deduction for food donation | | - | | | (0.1) | | | (0.2) | |
Valuation allowance | | 0.5 | | | 0.7 | | | 0.1 | |
Other | | 0.8 | | | 3.5 | | | 1.5 | |
Effects of the TCJA | | - | | | - | | | (2.3) | |
Return to provision and other discrete items | | 0.1 | | | 1.1 | | | (0.9) | |
Equity compensation related adjustments | | (3.3) | | | 2.0 | | | - | |
Effective income tax rate | | 23.6 | % | | 34.2 | % | | 36.1 | % |
The effective tax rate for the year ended December 31, 2019, was lower than the effective tax rate for the year ended December 31, 2018, primarily due to net excess benefits from stock-based compensation and net year over year decrease in tax expense related to equity award expirations, partially offset by current year increases in non-deductible executive compensation.
The components of the deferred income tax assets and liabilities for continuing operations were as follows:
| | | | | | | | |
| | | | | | | | |
| | | | December 31, |
| | | | 2019 | | 2018 |
Deferred income tax liability: | | | | | | | | |
Leasehold improvements, property and equipment | | | | $ | 162,291 | | $ | 144,113 |
Goodwill and other assets | | | | | 1,537 | | | 1,438 |
Prepaid assets and other | | | | | 1,290 | | | 4,154 |
Operating lease asset | | | | | 686,333 | | | - |
Total deferred income tax liability | | | | | 851,451 | | | 149,705 |
Deferred income tax asset: | | | | | | | | |
Deferred rent | | | | | - | | | 49,481 |
Gift card liability | | | | | 6,185 | | | 5,752 |
Capitalized transaction costs | | | | | 323 | | | 323 |
Stock-based compensation and other employee benefits | | | | | 41,270 | | | 65,651 |
Foreign net operating loss carry-forwards | | | | | 13,796 | | | 11,871 |
State credits | | | | | 4,170 | | | 5,230 |
Operating lease liability | | | | | 741,120 | | | - |
Allowances, reserves and other | | | | | 22,973 | | | 13,355 |
Valuation allowance | | | | | (16,200) | | | (13,524) |
Total deferred income tax asset | | | | | 813,637 | | | 138,139 |
Deferred income tax liabilities | | | | $ | 37,814 | | $ | 11,566 |
As of December 31, 2019, we no longer have deferred tax assets related to outstanding non-vested stock awards that contain market conditions.
Gross foreign net operating losses were $68,169 and $54,599 as of December 31, 2019 and 2018, respectively.
We had gross valuation allowances against certain foreign deferred tax assets of $77,191 and $63,509 as of December 31, 2019 and 2018, respectively. The increase in the valuation allowance was primarily due to the recording of a valuation allowance on various foreign tax attributes.
Unrecognized Tax Benefits
A reconciliation of the unrecognized tax benefits was as follows:
| | | | | | | | |
| Year ended December 31, |
| 2019 | | 2018 | | 2017 |
Beginning of year | $ | 9,360 | | $ | 8,937 | | $ | 4,211 |
Increase resulting from prior year tax position | | 5,855 | | | - | | | - |
Increase resulting from current year tax position | | 758 | | | 751 | | | 4,726 |
Settlements with taxing authorities | | (736) | | | - | | | - |
Lapsing of statutes of limitations | | (209) | | | (328) | | | - |
End of year | $ | 15,028 | | $ | 9,360 | | $ | 8,937 |
Interest expense related to uncertain tax positions is recognized in interest expense on the consolidated statements of income. Penalties related to uncertain tax positions are recognized in income tax expense on the consolidated statements of income. During the years ended December 31, 2019, 2018, and 2017, we recognized $1,853, $536, and $364, respectively, in interest expense related to uncertain tax positions. These balances are gross amounts before any tax benefits and are included in other liabilities in the accompanying consolidated balance sheets. We accrued $3,054 and $1,329 for the payment of interest at December 31, 2019 and 2018, respectively.
We are no longer subject to U.S. federal tax examinations by tax authorities for tax years before 2016. For the majority of states where we have a significant presence, we are no longer subject to tax examinations by tax authorities for tax years before 2016. Currently, we expect expirations of statutes of limitations, excluding indemnified amounts, on reserves of approximately $202 within the next twelve months.
It is reasonably possible the amount of the unrecognized benefit with respect to certain unrecognized positions could significantly increase or decrease within the next twelve months and would have an impact on net income.
Tax Cuts and Jobs Act
Effective for tax years beginning after December 31, 2017, the U.S. corporate income tax rate is 21% pursuant to the Tax Cuts and Jobs Act (“TCJA”), that was signed into law December 2017. As of December 31, 2018, we completed our accounting for the tax effects of the TCJA and recorded cumulative tax adjustments of $6,446 in accordance with SAB 118 guidance.
In connection with the TCJA, a one-time transition tax is assessed on total post-1986 accumulated foreign earnings and profits that were previously deferred from U.S. income taxes, the amount of those earnings held in cash, and other specified assets and foreign tax pools. Based on our analysis of our total post-1986 accumulated foreign earnings and profits that were previously deferred from U.S. income taxes, the amount of those earnings held in cash, and other specified assets and foreign tax pools, we have determined a one-time transition tax of $0 for the year ended December 31, 2017.
8. Shareholders’ Equity
We have had a stock repurchase program in place since 2008 and, through December 31, 2019 we have repurchased shares with a total value of $2.6 billion. As of December 31, 2019, $69,417 was available to be repurchased under announced repurchase authorizations, which does not include an additional $100,000 that was authorized by our Board of Directors in December 2019 but not announced until February 4, 2020. Shares repurchased are being held in treasury stock until they are reissued or retired at the discretion of the Board of Directors.
During the years ended December 31, 2019, 2018, and 2017, shares of common stock at total costs of $10,420, $5,411, and $702, respectively, were netted and surrendered as payment for minimum statutory withholding obligations in connection with the vesting of outstanding stock awards. Shares surrendered by the participants in accordance with the applicable award agreements and plan are deemed repurchased by us but are not part of publicly announced share repurchase programs.
9. Stock-Based Compensation
Pursuant to the 2011 Incentive Plan, we grant stock options, SOSARs, restricted stock units (“RSUs”), or performance and/or market based restricted stock units (“PSUs”) to employees and non-employee directors. We issue shares of common stock upon the exercise of SOSARs and the vesting of RSUs and PSUs.
Under the 2011 Incentive Plan, 6,830 shares of common stock have been authorized and reserved for issuance to eligible participants, of which 2,321 shares were authorized for issuance but not issued or subject to outstanding awards as of December 31, 2019. For purposes of calculating the available shares remaining under the 2011 Incentive Plan, each share issuable pursuant to outstanding full value awards, such as RSUs and PSUs, counts as two shares, and each share underlying a stock option or SOSAR count as one share. The 2011 Incentive Plan is administered by the Compensation Committee of the Board of Directors, which has the authority to select the individuals to whom awards will be granted and to delegate its authority under the plan to make grants (subject to certain legal and regulatory restrictions), to determine the type of awards and when the awards are to be granted, the number of shares to be covered by each award, the vesting schedule and all other terms and conditions of the awards. The exercise price for stock awards granted under the 2011 Incentive Plan cannot be less than fair market value at the date of grant.
Stock-based compensation expense recognized in the consolidated financial statements was as follows:
| | | | | | | | |
| | | | | | | | |
| Year ended December 31, |
| 2019 | | 2018 | | 2017 |
Stock-based compensation | $ | 92,062 | | $ | 69,947 | | $ | 66,396 |
Stock-based compensation, net of income taxes | $ | 73,866 | | $ | 51,544 | | $ | 40,370 |
Total capitalized stock-based compensation included in net leasehold improvements, property and equipment on the consolidated balance sheets | $ | 666 | | $ | 783 | | $ | 1,141 |
Excess tax benefit (deficit) on stock-based compensation recognized in provision for income taxes | $ | 16,203 | | $ | (6,162) | | $ | 448 |
SOSARs
SOSAR activity under the 2011 Stock Incentive Plan (in thousands, except years and per share data) was as follows:
| | | | | | | | | | | |
| | | | | | | | | | | |
| Shares | | Weighted-Average Exercise Price per Share | | Weighted-Average Remaining Contractual Life (Years) | | Aggregate Intrinsic Value |
Outstanding, January 1, 2019 | | 2,151 | | $ | 474.51 | | | | | $ | 49,160 |
Granted | | 201 | | | 601.59 | | | | | | |
Exercised | | (1,130) | | | 510.35 | | | | | | |
Forfeited or cancelled | | (40) | | | 483.11 | | | | | | |
Expired | | (50) | | | 559.29 | | | | | | |
Outstanding, December 31, 2019 | | 1,132 | | | 457.14 | | | 4.4 | | | 430,270 |
Exercisable, December 31, 2019 | | 365 | | | 505.35 | | | 2.4 | | | 121,242 |
Vested and expected to vest, December 31, 2019 | | 1,095 | | | 454.76 | | | 4.3 | | | 418,815 |
The total intrinsic value of SOSARs exercised during the years ended December 31, 2019, 2018 and 2017, was $219,984, $35,907, and $4,296, respectively. Unrecognized stock-based compensation expense for SOSARs as of December 31, 2019 was $30,338 and is expected to be recognized over a weighted average period of 1.5 years.
The weighted average assumptions utilized in the Black-Scholes option-pricing model to estimate the fair value of SOSARs granted each year were as follows:
| | | | | | | | | | | | |
| | | | | | | | | | | | |
| | 2019 | | 2018 | | 2017 |
Risk-free interest rate | | | 2.4 | % | | | 2.4 | % | | | 1.6 | % |
Expected life (years) | | | 3.9 | | | | 3.9 | | | | 3.7 | |
Expected dividend yield | | | 0.0 | % | | | 0.0 | % | | | 0.0 | % |
Volatility | | | 34.7 | % | | | 32.2 | % | | | 29.9 | % |
Weighted-average Black-Scholes fair value per share at date of grant | | $ | 176.79 | | | $ | 77.61 | | | $ | 105.97 | |
The risk-free interest rate is based on U.S. Treasury rates for instruments with similar terms, and the expected life assumption is based on our historical data. We have not paid dividends to date and do not plan to pay dividends in the near future. The volatility assumption is based on our historical data and implied volatility.
Non-Vested Stock Awards (RSUs)
A summary of non-vested RSU award activity under the 2011 Stock Incentive Plan was as follows (in thousands, except per share data):
| | | | | | | | | | | |
| | | | | | | | | | | |
| | | | | | Shares | | Weighted-Average Grant Date Fair Value per Share |
Outstanding, January 1, 2019 | | | | | | | | 154 | | $ | 352.85 |
Granted | | | | | | | | 28 | | | 627.94 |
Vested | | | | | | | | (46) | | | 388.08 |
Forfeited or cancelled | | | | | | | | (15) | | | 303.84 |
Outstanding, December 31, 2019 | | | | | | | | 121 | | | 408.56 |
Vested and expected to vest, December 31, 2019 | | | | | | | | 113 | | | 401.74 |
The weighted average grant date fair value per RSU granted during the years ended December 31, 2018 and 2017, was $299.25 and $414.36, respectively. Unrecognized stock-based compensation expense for non-vested RSU stock awards we have determined are probable of vesting was $14,803 as of December 31, 2019, and is expected to be recognized over a weighted average period of 1.4 years. The fair value of shares earned as of the vesting date during the years ended December 31, 2019, 2018, and 2017, was $27,197, $4,192, and $3,524, respectively.
Non-Vested Performance Stock Awards (PSUs)
A summary of non-vested PSU award activity under the 2011 Stock Incentive Plan was as follows:
| | | | | | | | | | | |
| | | | | | | | | | | |
| | | | | | Shares | | Weighted-Average Grant Date Fair Value per Share |
Outstanding, January 1, 2019 | | | | | | | | 70 | | $ | 418.52 |
Granted | | | | | | | | 46 | | | 583.13 |
Vested | | | | | | | | - | | | - |
Expired | | | | | | | | (13) | | | 518.62 |
Outstanding, December 31, 2019 | | | | | | | | 103 | | | 479.83 |
Vested and expected to vest, December 31, 2019 | | | | | | | | 227 | | | 479.61 |
The weighted average fair value per PSU granted during the years ended December 31, 2018 and 2017, was $327.58 and $466.29, respectively. The Unrecognized stock-based compensation expense for non-vested PSU stock awards we have determined are probable of vesting was $60,921 as of December 31, 2019, and is expected to be recognized over a weighted average period of 2.2 years. The fair value of shares earned as of the vesting date during the years ended December 31, 2019, 2018, and 2017, was $0, $9,317, and $0, respectively.
During the year ended December 31, 2019, we awarded two types of performance share awards that are subject to service and performance vesting conditions. The quantity of shares that will vest range from 0% to 300% of the targeted number of shares for both awards. The first award, consisting of 33 shares, will vest based on our growth in comparable restaurant sales and average restaurant margin over a three-year period beginning on January 1, 2019. The second award, consisting of 13 shares, will vest based on achievement of certain targets related to digital sales, general and administrative expenses as a percentage of revenue, and successful completion of a defined number of strategic initiatives in 2019 and 2020. These awards will vest 40% on the third anniversary of the grant date and 60% on the fourth anniversary of the grant date provided required service is completed through these dates.
During the year ended December 31, 2018, we awarded performance share awards that are subject to service and performance vesting conditions. The quantity of shares that will vest range from 0% to 300% of the targeted number of shares based on performance factors related to our growth in comparable restaurant sales and average restaurant margin over a three year period beginning on January 1, 2018. If the defined minimum targets are not met, then no shares will vest.
During the year ended December 31, 2017, we awarded performance shares that are subject to service, market and performance vesting conditions. Two-thirds of the shares have vesting criteria based on the price of our common stock reaching certain targets for a consecutive number of days during the three-year period starting on the grant date, with the quantity of shares that vest ranging from 0% to 350% of the targeted number of shares. The remaining one-third of the shares have vesting criteria based on reaching certain comparable restaurant sales increases during the three-year period starting on January 1, 2017, with the quantity of shares that vest ranging from 0% to 300% of the targeted number of shares. If the defined minimum targets are not met, then no shares will vest.
No stock awards with market conditions were granted during the years ended December 31, 2019 and 2018. Measurement of the grant date fair value of stock awards with market conditions in 2017 included a Monte Carlo simulation model, which incorporates into the fair value determination the possibility that the market condition may not be satisfied, using the following assumptions:
| | | | | | | | | | | | |
| | | | | | | | | | | | |
| | | | | | | 2017 |
Risk-free interest rate | | | | | | | | | | | 1.5 | % |
Expected life (years) | | | | | | | | | | | 3.0 | |
Expected dividend yield | | | | | | | | | | | 0.0 | % |
Volatility | | | | | | | | | | | 29.9 | % |
The assumptions are based on the same factors as those described for SOSARs, except that the expected life is based on the contractual performance period for the stock awards.
10. Employee Benefit Plans
Defined Contribution Plan—We maintain the Chipotle Mexican Grill 401(k) Plan (the “401(k) Plan”). We match 100% of the first 3% of pay contributed by each eligible employee and 50% on the next 2% of pay contributed. Employees become eligible to receive matching contributions after one year of service with Chipotle. For the years ended December 31, 2019, 2018, and 2017, matching contributions totaled approximately $6,968, $6,090 and $6,072, respectively and are included in general and administrative expenses on the consolidated statements of income.
Deferred Compensation Plan—We also maintain the Chipotle Mexican Grill, Inc. Supplemental Deferred Investment Plan (the “Deferred Plan”) which covers our eligible employees. The Deferred Plan is a non-qualified plan that allows participants to make tax-deferred contributions that cannot be made under the 401(k) Plan because of Internal Revenue Service limitations. Participants’ earnings on contributions made to the Deferred Plan fluctuate with the actual earnings and losses of a variety of available investment choices selected by the participant. Total liabilities under the Deferred Plan as of December 31, 2019 and 2018, were $12,811 and $10,872, respectively, and are included in other liabilities on the consolidated balance sheets. We match 100% of the first 3% of pay contributed by each eligible employee and 50% on the next 2% of pay contributed once the 401(k) contribution limits are reached. For the years ended December 31, 2019, 2018, and 2017, we made deferred compensation matches of $412, $152, and $199, respectively, to the Deferred Plan and are included in general and administrative expenses on the consolidated statements of income.
We have elected to fund our deferred compensation obligation through a rabbi trust. The rabbi trust is subject to creditor claims in the event of insolvency, but the assets held in the rabbi trust are not available for general corporate purposes. Amounts in the rabbi trust are invested in mutual funds, consistent with the investment choices selected by participants in their Deferred Plan accounts, which are designated as trading securities, carried at fair value, and are included in other assets on the consolidated balance sheets. Fair value of mutual funds is measured using Level 1 inputs. The fair value of the investments in the rabbi trust was $12,811 and $10,872 as of December 31, 2019 and 2018, respectively. We record trading gains and losses in general and administrative expenses on the consolidated statements of income, along with the offsetting amount related to the increase or decrease in deferred compensation to reflect our exposure to liabilities for payment under the deferred plan.
Employee Stock Purchase Plan—We also offer an employee stock purchase plan (“ESPP”). Employees become eligible to participate after one year of service with Chipotle and may contribute up to 15% of their base earnings, subject to an annual maximum dollar amount, toward the monthly purchase of our common stock. The purchase price is 95% of the fair market value of the stock on the last trading date of the monthly exercise period. Under the ESPP, 250 shares of common stock have been authorized and reserved for issuances to eligible employees, of which 246 represent shares that were authorized for issuance but not issued at December 31, 2019. For the years ended December 31, 2019, 2018, and 2017, the number of shares issued each year under the ESPP was less than one.
11. Leases
Related to the adoption of Topic 842, and for leases executed subsequent to the adoption of Topic 842 our policy elections are as follows:
| | |
Separation of lease and non-lease components | | We elected this expedient to account for lease and non-lease components as a single component for our entire population of operating lease assets. |
Short-term policy | | We have elected the short-term lease recognition exemption for all applicable classes of underlying assets. Short-term disclosures include only those leases with a term greater than one month and 12 months or less, and expense is recognized on a straight-line basis over the lease term. Leases with an initial term of 12 months or less, that do not include an option to purchase the underlying asset that we are reasonably certain to exercise, are not recorded on the consolidated balance sheets. |
Supplemental balance sheet information related to leases was as follows:
| | | | | | |
| | | | | | |
| | | | | December 31, |
Operating Leases | Classification | | | | 2019 |
Right-of-use assets | Operating lease assets | | | | $ | 2,505,466 |
| | | | | | |
Current lease liabilities | Current operating lease liabilities | | | | | 173,139 |
Non-current lease liabilities | Long-term operating lease liabilities | | | | | 2,678,374 |
Total lease liabilities | | | | | $ | 2,851,513 |
| | | | | |
| | | | | |
| | | | December 31, |
| | | | 2019 |
Weighted average remaining lease term (years) | | | | | 13.4 |
Weighted average discount rate | | | | | 5.19% |
The components of lease cost were as follows:
| | | | | | |
| | | | | | |
| | Three months ended | | Year ended |
| | December 31, | | December 31, |
| Classification | 2019 | | 2019 |
Operating lease cost | Occupancy, General and administrative expenses and Pre-opening costs | $ | 79,597 | | $ | 308,586 |
Short-term lease cost | Other operating costs | | 1,027 | | | 3,238 |
Variable lease cost | Occupancy | | 9,019 | | | 36,828 |
Sublease income | General and administrative expenses | | (824) | | | (3,385) |
Total lease cost | | $ | 88,819 | | $ | 345,267 |
Supplemental disclosures of cash flow information related to leases were as follows:
| | | | | |
| | | | | |
| Three months ended | | Year ended |
| December 31, | | December 31, |
| 2019 | | 2019 |
Cash paid for operating lease liabilities | $ | 75,189 | | $ | 295,113 |
Operating lease assets obtained in exchange for operating lease liabilities(1) | $ | 83,079 | | $ | 2,702,778 |
Derecognition of operating lease assets due to terminations or impairment | $ | 3,755 | | $ | 17,740 |
(1)
Maturities of lease liabilities were as follows as of December 31, 2019:
| | |
| | |
| Operating Leases |
2020 | $ | 286,807 |
2021 | | 313,729 |
2022 | | 313,577 |
2023 | | 309,068 |
2024 | | 297,457 |
Thereafter | | 2,483,595 |
Total lease payments | | 4,004,233 |
Less: imputed interest | | 1,152,720 |
Present value of lease liabilities | $ | 2,851,513 |
As of December 31, 2019, the total lease payments include $2,127,446 related to options to extend lease terms that are reasonably certain of being exercised, and exclude approximately $105,000 of legally binding minimum lease payments for leases signed but not yet commenced and $9,514 of future sublease income.
As previously disclosed in our 2018 Annual Report on Form 10-K and under the previous lease accounting, maturities of lease liabilities were as follows as of December 31, 2018:
| | |
| | |
| Operating Leases |
2019 | $ | 294,191 |
2020 | | 296,579 |
2021 | | 294,941 |
2022 | | 295,290 |
2023 | | 290,980 |
Thereafter | | 2,478,397 |
Total minimum lease payments | $ | 3,950,378 |
As of December 31, 2018, maturities of lease liabilities have not been reduced by minimum sublease income of $11,790 due in the future under our subleases. As of December 31, 2018, we had $90,484 of legally binding minimum lease payments related to leases that have not yet commenced.
We have six sale and leaseback transactions, which do not qualify for sale leaseback accounting due to fixed price renewal options prohibiting sale accounting. These transactions are accounted for under the financing method. Under the financing method, the assets remain on the consolidated balance sheets and the proceeds from the transactions are recorded as a financing liability. A portion of lease payments are applied as payments of deemed principal and imputed interest. The deemed landlord financing liability was $2,390 as of December 31, 2018, with the current portion of the liability included in accrued liabilities, and the remaining portion included in other liabilities on the consolidated balance sheets.
12. Earnings Per Share
The following table sets forth the computations of basic and diluted earnings per share:
| | | | | | | | |
| | | | | | | | |
| Year ended December 31, |
| 2019 | | 2018 | | 2017 |
Net income | $ | 350,158 | | $ | 176,553 | | $ | 176,253 |
Shares: | | | | | | | | |
Weighted-average number of common shares outstanding (for basic calculation) | | 27,740 | | | 27,823 | | | 28,491 |
Dilutive stock awards | | 555 | | | 139 | | | 70 |
Weighted-average number of common shares outstanding (for diluted calculation) | | 28,295 | | | 27,962 | | | 28,561 |
Basic earnings per share | $ | 12.62 | | $ | 6.35 | | $ | 6.19 |
Diluted earnings per share | $ | 12.38 | | $ | 6.31 | | $ | 6.17 |
The following stock awards were excluded from the calculation of diluted earnings per share:
| | | | | | | | |
| | | | | | | | |
| Year ended December 31, |
| 2019 | | 2018 | | 2017 |
Stock awards subject to performance conditions | | 81 | | | 95 | | | 217 |
Stock awards that were antidilutive | | 139 | | | 1,741 | | | 1,695 |
Total stock awards excluded from diluted earnings per share | | 220 | | | 1,836 | | | 1,912 |
13. Commitments and Contingencies
Purchase Obligations
We enter into various purchase obligations in the ordinary course of business, generally of a short-term nature. Those that are binding primarily relate to commitments for food purchases and supplies, amounts owed under contractor and subcontractor agreements, orders submitted for equipment for restaurants under construction, and marketing initiatives and corporate sponsorships.
Litigation
Data Security Incident
In April 2017, we detected malware in our payment processing network that was designed to access payment card data from cards used at point-of-sale devices at most of our restaurants. We removed the malware from our systems and self-reported the issue to payment card processors and law enforcement, and we continue to enhance our security measures. Substantially all of our investigation costs related to this incident have been covered by insurance.
As a result of this incident, several lawsuits were filed alleging, among other things, that we negligently failed to provide adequate security to protect the payment card information of the plaintiffs and other similarly situated customers. These lawsuits were consolidated into one action captioned Todd Gordon, et. al. v. Chipotle Mexican Grill, Inc., which was pending in the United States District Court for the District of Colorado. In March 2019, we reached an agreement to settle the consolidated Gordon action, and in December 2019 the court granted final approval of the settlement. The financial terms of the Gordon settlement were covered by insurance.
As of December 31, 2019, we had a balance of $15,000 for loss contingencies related to the data security incident on the consolidated balance sheet, which is included in the accrued liabilities line item. We ultimately may be subject to liabilities greater or less than the amount accrued.
Receipt of Grand Jury Subpoenas
On January 28, 2016, we were served with a Federal Grand Jury Subpoena from the U.S. District Court for the Central District of California in connection with an official criminal investigation being conducted by the U.S. Attorney’s Office for the Central District of California, in conjunction with the U.S. Food and Drug Administration’s Office of Criminal Investigations. The subpoena required the production of documents and information related to company-wide food safety matters dating back to January 1, 2013. Since then we have received additional subpoenas requesting information related to illness incidents associated with several of our restaurants, and we may receive additional subpoenas in the future related to illness incidents at these or other restaurants. We have cooperated with the investigation, and we are in discussions with the U.S. Attorney's Office in an effort to resolve this matter through a settlement. We believe that if a settlement is reached, it will contain both monetary and non-monetary elements, including a deferred prosecution agreement and additional undertakings by the Company. We have reserved a total of $25 million in connection with this investigation, which we believe is a reasonable estimate of the amount we may be expected to pay to settle this matter. Based on discussions to date, we are hopeful that a settlement can be reached; however, there can be no assurance that a settlement will be reached or as to the ultimate timing or monetary or non-monetary terms of such a settlement.
Shareholder Class Action
On January 8, 2016, Susie Ong filed a complaint in the U.S. District Court for the Southern District of New York on behalf of a purported class of purchasers of shares of our common stock between February 4, 2015 and January 5, 2016. The complaint purports to state claims against us, each of the co-Chief Executive Officers serving during the claimed class period and the Chief Financial Officer under Sections 10(b) and 20(a) of the Securities Exchange Act of 1934, as amended, and related rules, based on our alleged failure during the claimed class period to disclose material information about our quality controls and safeguards in relation to consumer and employee health. The complaint asserts that those failures and related public statements were false and misleading and that, as a result, the market price of our stock was artificially inflated during the claimed class period. The complaint seeks damages on behalf of the purported class in an unspecified amount, interest, and an award of reasonable attorneys’ fees, expert fees and other costs. On March 22, 2018, the court granted our motion to dismiss, with prejudice. On April 20, 2018, the plaintiffs filed a motion for relief from the judgment and seeking leave to file a third amended complaint, and on November 20, 2018, the court denied the motion. On December 20, 2018, the plaintiff initiated an appeal to the U.S. Court of Appeals for the Second Circuit. We intend to continue vigorously defending the case, but it is not possible at this time to reasonably estimate the outcome of or any potential liability from the case.
Miscellaneous
We are involved in various other claims and legal actions that arise in the ordinary course of business. We do not believe that the ultimate resolution of these actions will have a material adverse effect on our financial position, results of operations, liquidity or capital resources. However, a significant increase in the number of these claims, or one or more successful claims under which we incur greater liabilities than we currently anticipate, could materially and adversely affect our business, financial condition, results of operations and cash flows.
Accrual for Estimated Liability
Excluding the accrual for the data security incident described above, we had a balance of $45,721 on the consolidated balance sheet as of December 31, 2019, which is included in the accrued liabilities line item. We ultimately may be subject to liabilities greater or less than the amount accrued.
14. Quarterly Financial Data (Unaudited)
The following table presents summarized unaudited quarterly financial data from the consolidated statements of income for each of the eight quarters in the periods ended December 31, 2019 and December 31, 2018. The operating results for any quarter are not necessarily indicative of the results for any subsequent quarter. Basic and diluted net income per share calculations for each quarter is based on the weighted average diluted shares outstanding for that quarter and may not sum to the full year total amount as presented on our consolidated statements of income:
| | | | | | | | | | | | | | | |
| | | | | | | | | | | | | | | |
| | | | | 2019 |
| | | | | March 31 | | June 30 | | September 30 | | December 31 |
Revenue | | | | | $ | 1,308,217 | | $ | 1,434,231 | | $ | 1,403,697 | | $ | 1,440,224 |
Income from operations | | | | | $ | 110,161 | | $ | 120,020 | | $ | 115,621 | | $ | 98,156 |
Net income | | | | | $ | 88,132 | | $ | 91,028 | | $ | 98,582 | | $ | 72,416 |
Basic earnings per share | | | | | $ | 3.18 | | $ | 3.28 | | $ | 3.55 | | $ | 2.61 |
Diluted earnings per share | | | | | $ | 3.13 | | $ | 3.22 | | $ | 3.47 | | $ | 2.55 |
| | | | | | | | | | | | | | | |
| | | | | 2018 |
| | | | | March 31 | | June 30 | | September 30 | | December 31 |
Revenue | | | | | $ | 1,148,397 | | $ | 1,266,520 | | $ | 1,225,007 | | $ | 1,225,061 |
Income from operations | | | | | $ | 92,808 | | $ | 67,957 | | $ | 57,991 | | $ | 39,612 |
Net income | | | | | $ | 59,446 | | $ | 46,884 | | $ | 38,204 | | $ | 32,019 |
Basic earnings per share | | | | | $ | 2.13 | | $ | 1.69 | | $ | 1.37 | | $ | 1.15 |
Diluted earnings per share | | | | | $ | 2.13 | | $ | 1.68 | | $ | 1.36 | | $ | 1.15 |
ITEM 9. CHANGES IN AND DISAGREEMENTS WITH ACCOUNTANTS ON ACCOUNTING AND FINANCIAL DISCLOSURE
None.
ITEM 9A. CONTROLS AND PROCEDURES
We maintain disclosure controls and procedures (as defined in Rule 13a-15(e) promulgated under the Securities Exchange Act of 1934, as amended (the “Exchange Act”)) that are designed to ensure that information required to be disclosed in Exchange Act reports is recorded, processed, summarized and reported within the time periods specified in the Securities and Exchange Commission’s rules and forms, and that such information is accumulated and communicated to our management, including our Chief Executive Officer and Chief Financial Officer, as appropriate, to allow timely decisions regarding required disclosure.
Evaluation of Disclosure Controls and Procedures
As of December 31, 2019, we carried out an evaluation, under the supervision and with the participation of our management, including our Chief Executive Officer and Chief Financial Officer, of the effectiveness of the design and operation of our disclosure controls and procedures. Based on the foregoing, our Chief Executive Officer and Chief Financial Officer concluded that our disclosure controls and procedures were effective as of the end of the period covered by this annual report.
Changes in Internal Control over Financial Reporting
There were no changes during the fiscal quarter ended December 31, 2019, in our internal control over financial reporting (as defined in Rule 13a-15(f) under the Exchange Act) that have materially affected or are reasonably likely to materially affect our internal control over financial reporting.
Management’s Annual Report on Internal Control over Financial Reporting
The management of Chipotle Mexican Grill, Inc. is responsible for establishing and maintaining adequate internal control over financial reporting. Our internal control over financial reporting is a process designed to provide reasonable assurance regarding the reliability of financial reporting and the preparation of financial statements for external purposes in accordance with accounting principles generally accepted in the United States of America. Our internal control over financial reporting includes those policies and procedures that (i) pertain to the maintenance of records that, in reasonable detail, accurately and fairly reflect the transactions and dispositions of our assets; (ii) provide reasonable assurance that transactions are recorded as necessary to permit preparation of financial statements in accordance with accounting principles generally accepted in the United States of America, and that our receipts and expenditures are being made only in accordance with authorizations of our management and directors; and (iii) provide reasonable assurance regarding prevention or timely detection of unauthorized acquisition, use, or disposition of assets that could have a material effect on our financial statements.
Because of its inherent limitations, internal control over financial reporting may not prevent or detect misstatements. Also, projections of any evaluation of effectiveness to future periods are subject to the risk that controls may become inadequate because of changes in conditions, or that the degree of compliance with the policies or procedures may deteriorate.
Management assessed the effectiveness of our internal control over financial reporting as of December 31, 2019, based on the framework set forth by the Committee of Sponsoring Organizations of the Treadway Commission in Internal Control—Integrated Framework (the “2013 framework”). Based on that assessment, management concluded that, as of December 31, 2019, our internal control over financial reporting was effective based on the criteria established in the 2013 framework.
Our independent registered public accounting firm, Ernst & Young LLP, has issued an attestation report on the effectiveness of our internal control over financial reporting as of December 31, 2019. This report follows.
Report of Independent Registered Public Accounting Firm
To the Shareholders and the Board of Directors of Chipotle Mexican Grill, Inc.
Opinion on Internal Control Over Financial Reporting
We have audited Chipotle Mexican Grill, Inc.’s internal control over financial reporting as of December 31, 2019, based on criteria established in Internal Control—Integrated Framework issued by the Committee of Sponsoring Organizations of the Treadway Commission (2013 framework) (the COSO criteria). In our opinion, Chipotle Mexican Grill, Inc. (the Company) maintained, in all material respects, effective internal control over financial reporting as of December 31, 2019, based on the COSO criteria.
We also have audited, in accordance with the standards of the Public Company Accounting Oversight Board (United States) (PCAOB), the consolidated balance sheets as of December 31, 2019 and 2018, the related consolidated statements of income, comprehensive income, shareholders’ equity and cash flows for each of the three years in the period ended December 31, 2019, and the related notes and our report dated February 4, 2020 expressed an unqualified opinion thereon.
Basis for Opinion
The Company’s management is responsible for maintaining effective internal control over financial reporting and for its assessment of the effectiveness of internal control over financial reporting included in the accompanying Management’s Annual Report on Internal Control over Financial Reporting. Our responsibility is to express an opinion on the Company’s internal control over financial reporting based on our audit. We are a public accounting firm registered with the PCAOB and are required to be independent with respect to the Company in accordance with the U.S. federal securities laws and the applicable rules and regulations of the Securities and Exchange Commission and the PCAOB.
We conducted our audit in accordance with the standards of the PCAOB. Those standards require that we plan and perform the audit to obtain reasonable assurance about whether effective internal control over financial reporting was maintained in all material respects.
Our audit included obtaining an understanding of internal control over financial reporting, assessing the risk that a material weakness exists, testing and evaluating the design and operating effectiveness of internal control based on the assessed risk, and performing such other procedures as we considered necessary in the circumstances. We believe that our audit provides a reasonable basis for our opinion.
Definition and Limitations of Internal Control Over Financial Reporting
A company’s internal control over financial reporting is a process designed to provide reasonable assurance regarding the reliability of financial reporting and the preparation of financial statements for external purposes in accordance with generally accepted accounting principles. A company’s internal control over financial reporting includes those policies and procedures that (1) pertain to the maintenance of records that, in reasonable detail, accurately and fairly reflect the transactions and dispositions of the assets of the company; (2) provide reasonable assurance that transactions are recorded as necessary to permit preparation of financial statements in accordance with generally accepted accounting principles, and that receipts and expenditures of the company are being made only in accordance with authorizations of management and directors of the company; and (3) provide reasonable assurance regarding prevention or timely detection of unauthorized acquisition, use, or disposition of the company’s assets that could have a material effect on the financial statements.
Because of its inherent limitations, internal control over financial reporting may not prevent or detect misstatements. Also, projections of any evaluation of effectiveness to future periods are subject to the risk that controls may become inadequate because of changes in conditions, or that the degree of compliance with the policies or procedures may deteriorate.
/s/ Ernst & Young LLP
Irvine, California
February 4, 2020
ITEM 9B. OTHER INFORMATION
None.
PART III
ITEM 10. DIRECTORS, EXECUTIVE OFFICERS AND CORPORATE GOVERNANCE
Incorporated by reference from the definitive proxy statement for our 2020 annual meeting of shareholders, which will be filed no later than 120 days after December 31, 2019.
ITEM 11. EXECUTIVE COMPENSATION
Incorporated by reference from the definitive proxy statement for our 2020 annual meeting of shareholders, which will be filed no later than 120 days after December 31, 2019.
ITEM 12. SECURITY OWNERSHIP OF CERTAIN BENEFICIAL OWNERS AND MANAGEMENT AND RELATED STOCKHOLDER MATTERS
Securities Authorized for Issuance Under Equity Compensation Plans
The following table presents information regarding options and rights outstanding under our equity compensation plans as of December 31, 2019. All options/SOSARs reflected are options to purchase common stock.
| | | | | | |
| | | | | | |
| (a)
Number of Securities
to be Issued Upon
Exercise of Outstanding
Options and Rights(1)
| | | (b)
Weighted-Average
Exercise Price of
Outstanding Options and
Rights(1)
| | (c)
Number of Securities
Remaining Available for
Future Issuance Under
Equity Compensation Plans
(excluding securities
reflected in column (a))(2)
|
Equity Compensation Plans Approved by Security Holders | 1,356,553 | | $ | 457.14 | | 2,566,656 |
Equity Compensation Plans Not Approved by Security Holders | None | | | N/A | | None |
Total | 1,356,553 | | $ | 457.14 | | 2,566,656 |
__________________
(1)Includes shares issuable in connection with awards with performance and market conditions, which will be issued based on achievement of performance criteria associated with the awards, with the number of shares issuable dependent on our level of performance. The weighted-average exercise price in column (b) includes the weighted-average exercise price of SOSARs only.
(2)Includes 2,320,929 shares remaining available under the Amended and Restated Chipotle Mexican Grill, Inc. 2011 Stock Incentive Plan, and 245,727 shares remaining available under the Chipotle Mexican Grill, Inc. Employee Stock Purchase Plan. In addition to being available for future issuance upon exercise of SOSARs or stock options that may be granted after December 31, 2019, all of the shares available for grant under the Amended and Restated Chipotle Mexican Grill, Inc. 2011 Stock Incentive Plan may instead be issued in the form of restricted stock, restricted stock units, performance shares or other equity-based awards. Each share underlying a full value award such as restricted stock, restricted stock units or performance shares counts as two shares used against the total number of securities authorized under the plan.
Additional information for this item is incorporated by reference from the definitive proxy statement for our 2020 annual meeting of shareholders, which will be filed no later than 120 days after December 31, 2019.
ITEM 13. CERTAIN RELATIONSHIPS AND RELATED TRANSACTIONS, AND DIRECTOR INDEPENDENCE
Incorporated by reference from the definitive proxy statement for our 2020 annual meeting of shareholders, which will be filed no later than 120 days after December 31, 2019.
ITEM 14. PRINCIPAL ACCOUNTING FEES AND SERVICES
Incorporated by reference from the definitive proxy statement for our 2020 annual meeting of shareholders, which will be filed no later than 120 days after December 31, 2019.
PART IV
ITEM 15. EXHIBITS, FINANCIAL STATEMENT SCHEDULES
1. All Financial statements
Consolidated financial statements filed as part of this report are listed under Item 8. “Financial Statements and Supplementary Data.”
2. Financial statement schedules
No schedules are required because either the required information is not present or is not present in amounts sufficient to require submission of the schedule, or because the information required is included in the consolidated financial statements or the notes thereto.
3. Exhibits
| | | | | | |
| | | | | | |
| | Description of Exhibit Incorporated Herein by Reference |
Exhibit Number | Exhibit Description | Form | File No. | Filing Date | Exhibit Number | Filed Herewith |
3.1 | Amended and Restated Certificate of Incorporation of Chipotle Mexican Grill, Inc. | 10-Q | 001-32731 | October 26, 2016 | 3.1 | |
3.2 | Chipotle Mexican Grill, Inc. Amended and Restated Bylaws | 8-K | 001-32731 | October 6, 2016 | 3.1 | |
4.1 | Form of Stock Certificate for Shares of Common Stock | 10-K | 001-32731 | February 10, 2012 | 4.1 | |
4.2 | Description of Chipotle Securities | - | - | - | - | X |
10.1† | Amended and Restated Chipotle Mexican Grill, Inc. 2006 Stock Incentive Plan | 10-K | 001-32731 | February 17, 2011 | 10.2 | |
10.2† | Stock Appreciation Rights Agreement between Steve Ells and Chipotle Mexican Grill, Inc. | 10-Q | 001-32731 | April 26, 2018 | 10.1 | |
10.3† | Form of 2019 Performance Share Unit Agreement | 10-Q | 001-32731 | April 25, 2019 | 10.1 | |
10.4† | Form of 2019 Transformation Performance Share Unit Agreement (1) | 10-Q | 001-32731 | April 25, 2019 | 10.2 | |
10.5† | Change in Control Severance Plan, effective June 1, 2019 | 10-Q | 001-32731 | July 24, 2019 | 10.1 | |
10.6† | Form of Participation Agreement for Change in Control Severance Plan | 10-Q | 001-32731 | July 24, 2019 | 10.2 | |
10.7† | Amended and Restated Chipotle Mexican Grill, Inc. 2011 Stock Incentive Plan | 8-K | 001-32731 | May 24, 2018 | 10.1 | |
10.8† | Form of Board Restricted Stock Units Agreement | 10-Q | 001-32731 | July 22, 2014 | 10.1 | |
10.9† | Form of Stock Appreciation Rights Agreement | 10-Q | 001-32731 | April 20, 2012 | 10.1 | |
10.10† | Form of 2014 Stock Appreciation Rights Agreement | 10-K | 001-32731 | February 7, 2017 | 10.2.4 | |
10.11† | Form of 2014 Performance-Based Stock Appreciation Rights Agreement | 10-K | 001-32731 | February 7, 2017 | 10.2.5 | |
10.12† | Form of 2016 Stock Appreciation Rights Agreement | 10-Q | 001-32731 | April 27, 2016 | 10.1 | |
10.13† | Form of 2017 Performance Share Agreement | 10-Q | 001-32731 | July 26, 2017 | 10.2 | |
10.14† | Retention Agreement, dated January 9, 2018, between Jack Hartung and Chipotle Mexican Grill, Inc. | 8-K | 001-32731 | January 12, 2018 | 10.1 | |
10.15† | Amended and Restated Registration Rights Agreement dated January 31, 2006 among Chipotle Mexican Grill, Inc., McDonald’s Corporation and certain shareholders | 10-K | 001-32731 | March 17, 2006 | 10.6 | |
10.16 | Board Pay Policies effective May 22, 2018 | 8-K | 001-32731 | May 24, 2018 | 10.2 | |
10.17† | Retention Agreement, dated January 9, 2018, between Scott Boatwright and Chipotle Mexican Grill, Inc. | 10-Q | 001-32731 | April 26, 2018 | 10.4 | |
10.18† | Supplemental Deferred Investment Plan | 10-Q | 001-32731 | July 27, 2018 | 10.3 | |
10.19† | Retention Agreement, dated January 9, 2018, between Curt Garner and Chipotle Mexican Grill, Inc. | 10-Q | 001-32731 | April 26, 2018 | 10.5 | |
10.20† | Form of Director and Officer Indemnification Agreement | 8-K | 001-32731 | March 21, 2007 | 10.1 | |
10.21† | Offer Letter, dated February 11, 2018, between Brian R. Niccol and Chipotle Mexican Grill, Inc. | 8-K | 001-32731 | February 15, 2018 | 10.1 | |
10.22† | Chipotle Mexican Grill, Inc. Employee Stock Purchase Plan | 10-K | 001-32731 | February 10, 2012 | 10.11 | |
10.23† | Non-Plan Inducement SOSARs Agreement between Brian R. Niccol and Chipotle Mexican Grill, Inc. | S-8 | 33-223467 | March 6, 2018 | 4.3 | |
10.24† | Non-Plan Inducement RSUs Agreement between Brian R. Niccol and Chipotle Mexican Grill, Inc. | S-8 | 33-223467 | March 6, 2018 | 4.4 | |
10.25 | Investor Agreement dated December 14, 2016 between Chipotle Mexican Grill, Inc. and Pershing Square Capital Management, L.P. | 8-K | 001-32731 | December 19, 2016 | 10.1 | |
10.26 | Registration Rights Agreement dated February 3, 2017, between Chipotle Mexican Grill, Inc. and Pershing Square Capital Management, L.P. | 10-K | 001-32731 | February 7, 2017 | 10.11 | |
10.27† | Form of 2018 CEO SOSARs Agreement | 8-K/A | 001-32731 | April 3, 2018 | 10.2 | |
10.28† | Executive Agreement dated May 29, 2017 between Chipotle Mexican Grill, Inc. and Scott Boatwright | 8-K | 001-32731 | September 15, 2017 | 10.1 | |
10.29† | Form of 2018 Premium-priced SOSARs Agreement | 8-K/A | 001-32731 | April 3, 2018 | 10.3 | |
10.30† | Executive Chairman Agreement dated November 28, 2017 between Chipotle Mexican Grill, Inc. and Steve Ells | 8-K | 001-32731 | December 1, 2017 | 10.1 | |
10.31† | Offer Letter, dated March 9, 2018, between Christopher Brandt and Chipotle Mexican Grill, Inc. | 10-Q | 001-32731 | April 26, 2018 | 10.13 | |
10.32† | Form of 2018 Stock Appreciation Rights Agreement | 10-Q | 001-32731 | April 26, 2018 | 10.14 | |
10.33† | Form of 2018 Restricted Stock Units Agreement | 10-Q | 001-32731 | April 26, 2018 | 10.15 | |
10.34 | Form of 2019 Director Restricted Stock Unit Agreement | - | - | - | - | X |
21.1 | Subsidiaries of Chipotle Mexican Grill, Inc. | - | - | - | - | X |
23.1 | Consent of Ernst & Young LLP (as the independent registered public accounting firm of Chipotle Mexican Grill, Inc.) | - | - | - | - | X |
24.1 | Power of Attorney (included on signature page of this report) | - | - | - | - | X |
31.1 | Certification of Chief Executive Officer of Chipotle Mexican Grill, Inc. pursuant to Section 302 of the Sarbanes-Oxley Act of 2002 | - | - | - | - | X |
31.2 | Certification of Chief Financial Officer of Chipotle Mexican Grill, Inc. pursuant to Section 302 of the Sarbanes-Oxley Act of 2002 | - | - | - | - | X |
32.1 | Certification of Chief Executive Officer and Chief Financial Officer of Chipotle Mexican Grill, Inc. pursuant to Section 906 of the Sarbanes-Oxley Act of 2002 | - | - | - | - | X |
101.INS | Inline XBRL Instance Document (the instance document does not appear in the Interactive Data File because its XBRL tags are embedded within the Inline XBRL document) | - | - | - | - | X |
101.SCH | Inline XBRL Taxonomy Extension Schema Document | - | - | - | - | X |
101.CAL | Inline XBRL Taxonomy Extension Calculation Linkbase Document | - | - | - | - | X |
101.DEF | Inline XBRL Taxonomy Extension Definition Linkbase Document | - | - | - | - | X |
101.LAB | Inline XBRL Taxonomy Extension Label Linkbase Document | - | - | - | - | X |
101.PRE | Inline XBRL Taxonomy Extension Presentation Linkbase Document | - | - | - | - | X |
104 | Cover Page Interactive Data File (formatted as inline XBRL and contained in Exhibit 101) | - | - | - | - | X |
| | | |
| | | (1) Portions of this exhibit have been omitted as permitted by applicable regulations. †- Management contracts and compensatory plans or arrangements required to be filed as exhibits. |
ITEM 16. FORM 10-K SUMMARY
None.
SIGNATURES
Pursuant to the requirements of Section 13 or 15(d) of the Securities Exchange Act of 1934, the registrant has duly caused this report to be signed on its behalf by the undersigned, thereunto duly authorized.
| |
CHIPOTLE MEXICAN GRILL, INC. |
| |
By: | /s/ JOHN R. HARTUNG |
Name: | John R. Hartung |
Title: | Chief Financial Officer |
Date: February 4, 2020
POWER OF ATTORNEY
KNOW ALL PERSONS BY THESE PRESENTS, that each person whose signature appears below constitutes and appoints Brian Niccol and John Hartung, and each of them, his or her true and lawful attorneys-in-fact, each with full power of substitution, for him or her in any and all capacities, to sign any amendments to this report on Form 10-K and to file the same, with exhibits thereto and other documents in connection therewith, with the Securities and Exchange Commission, hereby ratifying and confirming all that each of said attorneys-in-fact or their substitute or substitutes may do or cause to be done by virtue hereof.
Pursuant to the requirements of the Securities Exchange Act of 1934, this report has been signed below by the following persons on behalf of the registrant and in the capacities and on the dates indicated.
| | | | |
Signature | | Date | | Title |
| | | | |
/s/ BRIAN NICCOL | | February 4, 2020 | | Chief Executive Officer (principal executive officer) |
Brian Niccol | | | | |
/s/ JOHN R. HARTUNG | | February 4, 2020 | | Chief Financial Officer (principal financial and accounting officer) |
John R. Hartung | | | | |
/s/ STEVE ELLS | | February 4, 2020 | | Chairman of the Board of Directors |
Steve Ells | | | | |
/s/ ALBERT S. BALDOCCHI | | February 4, 2020 | | Director |
Albert S. Baldocchi | | | | |
/s/ PAUL CAPPUCCIO | | February 4, 2020 | | Director |
Paul Cappuccio | | | | |
/s/ PATRICIA FILI-KRUSHEL | | February 4, 2020 | | Director |
Patricia Fili-Krushel | | | | |
/s/ NEIL W. FLANZRAICH | | February 4, 2020 | | Director |
Neil W. Flanzraich | | | | |
/s/ ROBIN S. HICKENLOOPER | | February 4, 2020 | | Director |
Robin S. Hickenlooper | | | | |
/s/ ALI NAMVAR | | February 4, 2020 | | Director |
Ali Namvar | | | | |
/s/ SCOTT MAW | | February 4, 2020 | | Director |
Scott Maw | | | | |
/s/ MATTHEW PAULL | | February 4, 2020 | | Director |
Matthew Paull | | | | |