SAN JUAN, Puerto Rico--(BUSINESS WIRE)--July 22, 2022--First BanCorp. (the “Corporation” or “First BanCorp.”) (NYSE: FBP), the bank holding company for FirstBank Puerto Rico (“FirstBank” or “the Bank”), today reported net income of $74.7
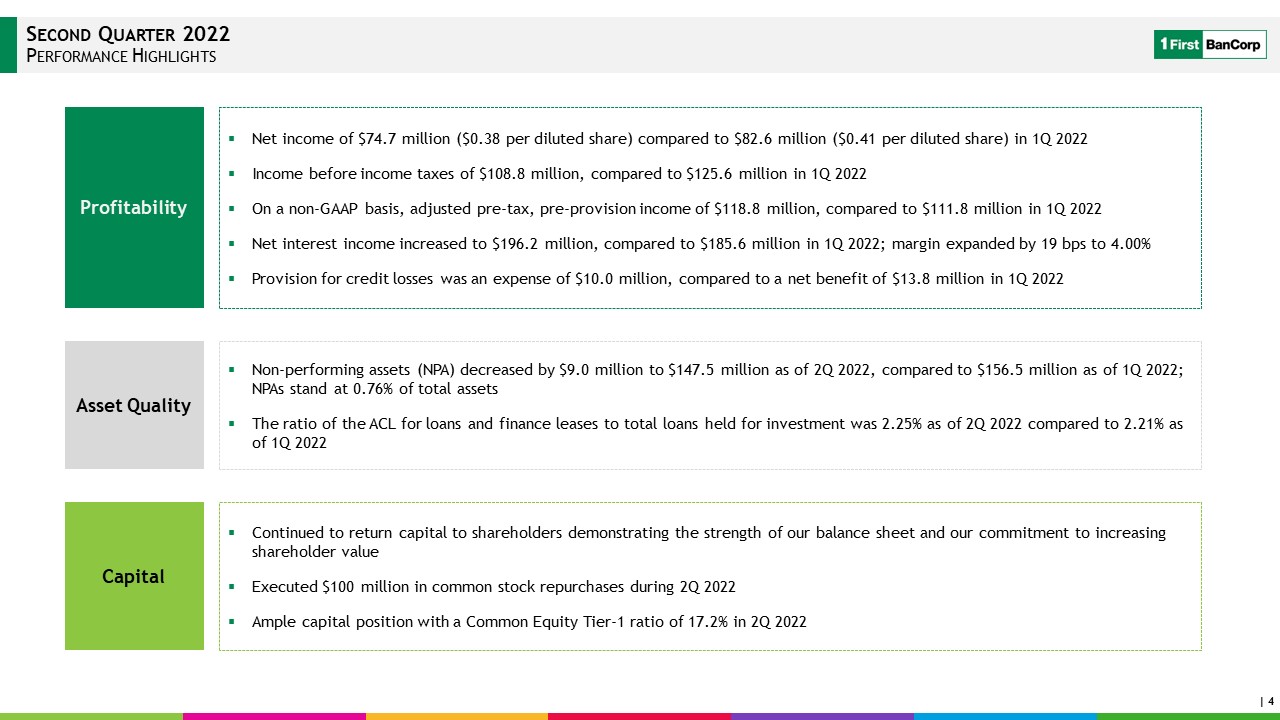
million, or $0.38 per diluted share, for the second quarter of 2022, compared to $82.6 million, or $0.41 per diluted share, for the first quarter of 2022, and $70.6 million, or $0.33 per diluted share, for the second quarter of 2021. Financial
results for the second quarter of 2022 include an expense of $10.0 million ($6.3 million after-tax) or a decrease of $0.05 per diluted share recorded to the provision for credit losses, compared to a net benefit of $13.8 million ($8.6 million
after-tax) or an increase of $0.07 per diluted share for the first quarter of 2022.
Aurelio Alemán, President and Chief Executive Officer of First BanCorp., commented: “We continued to perform exceptionally well during the second quarter by leveraging our market position to strategically grow the balance sheet and continue
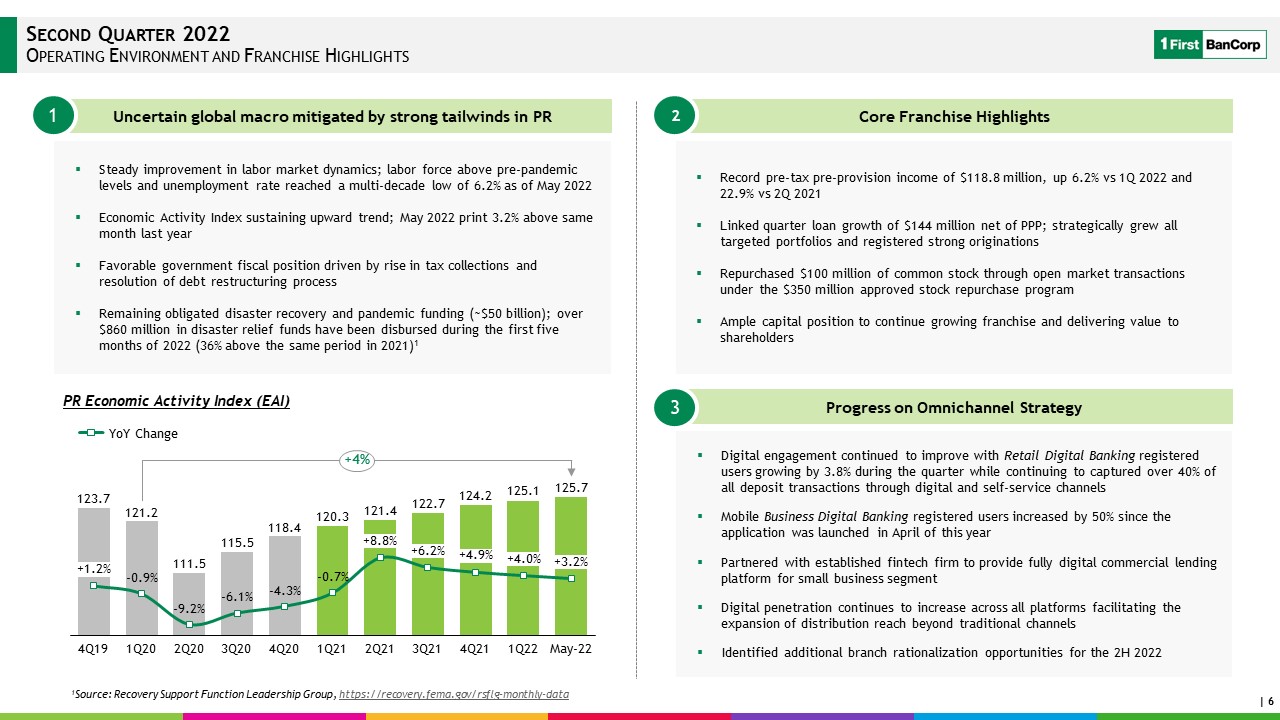
improving the banking experience of our customers. We earned $74.7 million or $0.38 per diluted share during the quarter and reached a record pre-tax pre-provision income of $118.8 million, up 6.2% when compared to the first quarter of 2022 and
23% when compared to the second quarter last year. These results were achieved within the context of an uncertain global economic backdrop and highlight the strength of our franchise.
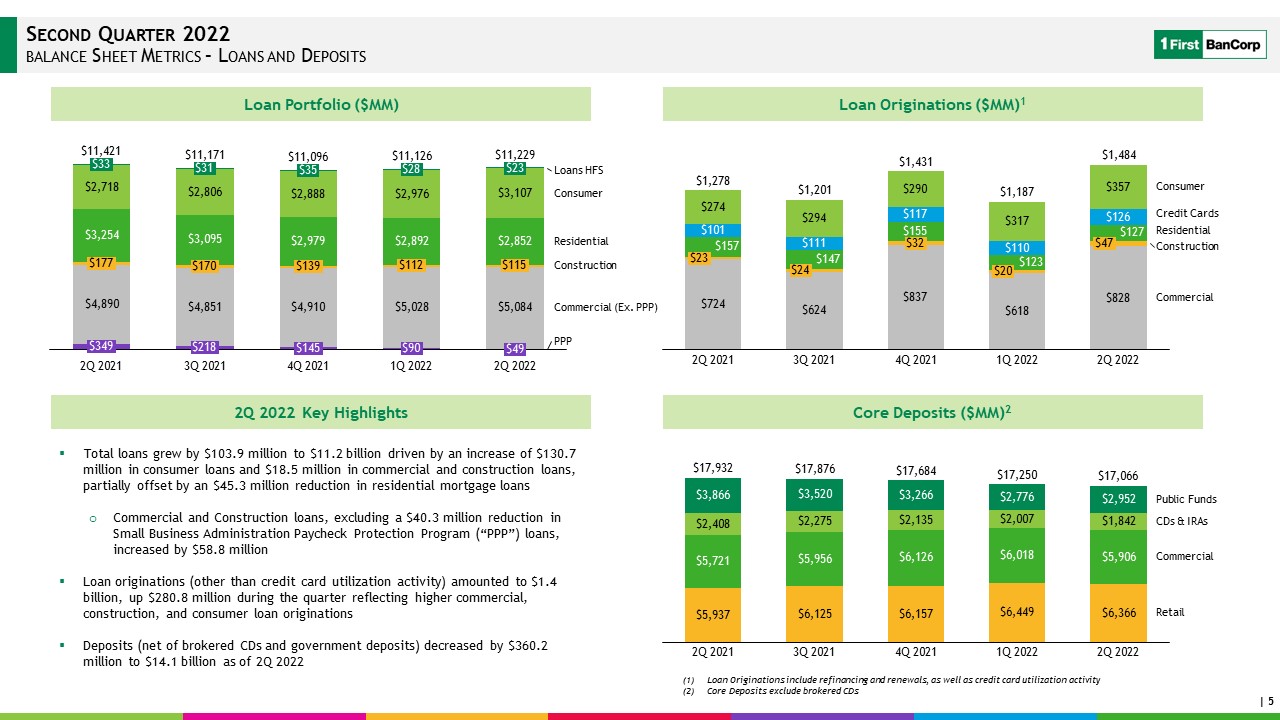
We continued to register loan growth across our targeted business segments during the quarter. Loan portfolio balances, excluding SBA PPP loans, grew by $144.2 million when compared to the first quarter of 2022, driven by increases of $130.7
million in consumer loans and $58.8 million in construction and commercial loans, partially offset by a decrease of $45.3 million in residential mortgages. Total loan originations, excluding credit card utilization activity, were very strong at
$1.4 billion, an increase of $280.8 million when compared to the first quarter of 2022 primarily attributed to higher commercial and consumer loan originations. We expect that healthy loan pipelines coupled with steady recovery trends in our
main market should result in sustained loan originations throughout the second half of the year. Core deposits, net of government deposits and brokered CDs, decreased by $360.2 million when compared to the first quarter of 2022, primarily in
the Puerto Rico region, while government deposits grew by $176.6 million driven by increases in both Puerto Rico and the Virgin Islands. Average deposit balances decreased slightly during the quarter but are still 31% above pre-pandemic levels.
Asset quality continued to improve with non-performing assets reaching 0.76% of total assets. Notwithstanding, we recorded an expense of $10.0 million to the provision for credit losses, primarily reflecting an overall increase in the loan
portfolio and increased uncertainty that is reflected in the forecast of certain macroeconomic variables. We remain attentive to the potential impact of global inflation in our markets.
Our strategic focus remains centered around providing the best omnichannel experience to our clients. During the quarter, digital engagement continued to progress nicely with retail digital banking users growing by 4% and continuing to
capture over 40% of deposit transactions through digital and self-service channels. Also, mobile Digital Banking users grew by 50% since the application was launched in April of this year. Most importantly, we partnered with an established
fintech firm to provide a fully digital commercial lending platform for small business loans. We now have the ability to process consumer, mortgage, and small business loan applications through self-service digital platforms.
Finally, we continued to execute on our capital deployment plan and repurchased approximately 7.07 million shares of common stock for a total purchase price of $100 million under the previously-announced $350 million stock repurchase program.
We believe that our fortress balance sheet, complemented by strong economic tailwinds in Puerto Rico, will contribute to the mitigation of rising market challenges and allow us to continue supporting our clients and delivering value to
shareholders.”
NON-GAAP DISCLOSURES
This press release includes certain non-GAAP financial measures, including adjusted net income, adjusted pre-tax, pre-provision income, adjusted net interest income and margin, tangible common equity, tangible book value per common share,
certain capital ratios, and certain other financial measures that exclude the effect of items that management believes are not reflective of core operating performance, are not expected to reoccur with any regularity or may reoccur at uncertain
times and in uncertain amounts (the “Special Items”), and should be read in conjunction with the discussion below in Basis of Presentation – Use of Non-GAAP Financial Measures, the accompanying tables (Exhibit A), which are an integral
part of this press release, and the Corporation’s other financial information that is presented in accordance with GAAP.
SPECIAL ITEMS
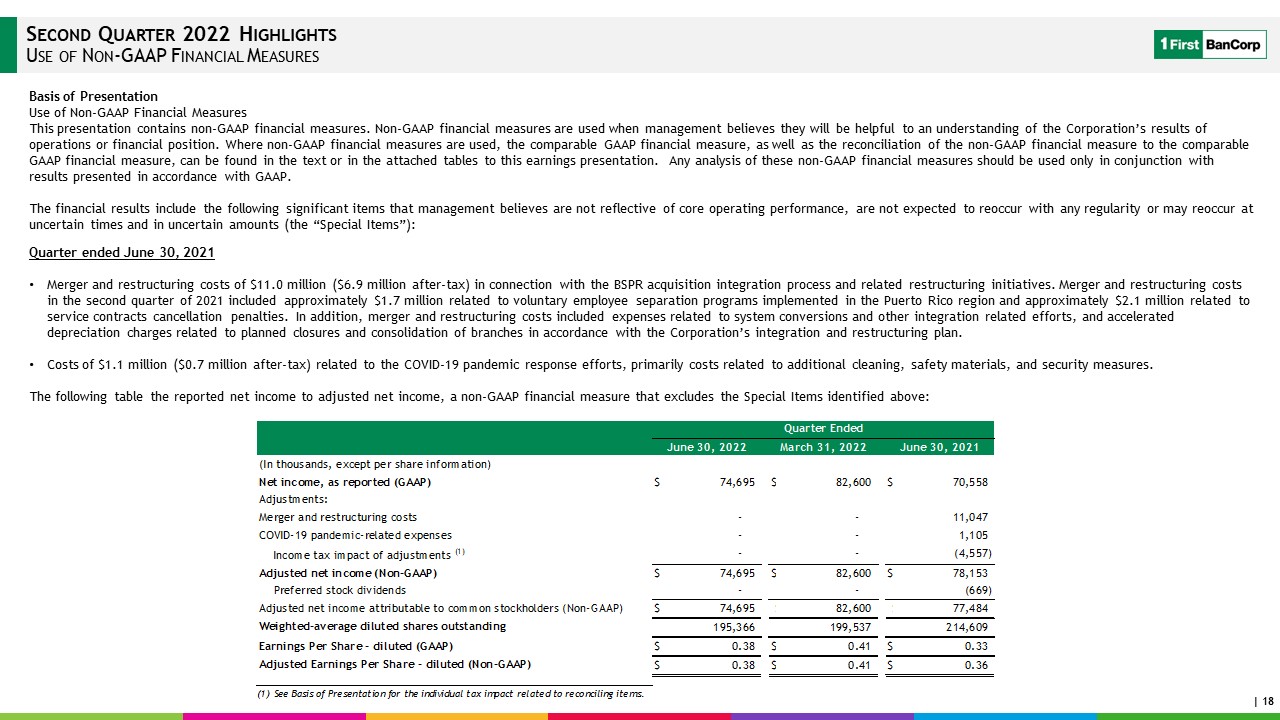
The financial results for the second and first quarters of 2022 did not include any significant Special Items. The financial results for the second quarter of 2021 included the significant Special Items discussed below.
Quarter ended June 30, 2021
- Merger and restructuring costs of $11.0 million ($6.9 million after-tax) in connection with the Banco Santander Puerto Rico (“BSPR”) acquisition integration process and related restructuring initiatives. Merger
and restructuring costs in the second quarter of 2021 included approximately $1.7 million related to voluntary employee separation programs implemented in the Puerto Rico region and approximately $2.1 million related to service contracts
cancellation penalties. In addition, merger and restructuring costs included expenses related to system conversions and other integration related efforts, and accelerated depreciation charges related to planned closures and consolidation of
branches in accordance with the Corporation’s integration and restructuring plan.
- Costs of $1.1 million ($0.7 million after-tax) related to the COVID-19 pandemic response efforts, primarily costs related to additional cleaning, safety materials, and security measures.
NET INCOME AND RECONCILIATION TO ADJUSTED NET INCOME (NON-GAAP)
Net income was $74.7 million for the second quarter of 2022, or $0.38 per diluted share, compared to $82.6 million for the first quarter of 2022, or $0.41 per diluted share. The following table shows the net income and earnings per diluted
share for the second and first quarters of 2022 and reconciles, for the second quarter of 2021, the net income to adjusted net income and adjusted earnings per share, which are non-GAAP financial measures that exclude the significant Special
Items identified above.
|
|
|
Quarter Ended
|
|
|
|
June 30, 2022
|
|
March 31, 2022
|
|
June 30, 2021
|
|
(In thousands, except per share information)
|
|
|
|
|
|
|
|
|
|
|
Net income, as reported (GAAP)
|
|
$
|
74,695
|
|
$
|
82,600
|
|
$
|
70,558
|
|
|
Adjustments:
|
|
|
|
|
|
|
|
|
|
|
Merger and restructuring costs
|
|
|
-
|
|
|
-
|
|
|
11,047
|
|
|
COVID-19 pandemic-related expenses
|
|
|
-
|
|
|
-
|
|
|
1,105
|
|
|
Income tax impact of adjustments (1)
|
|
|
-
|
|
|
-
|
|
|
(4,557
|
)
|
|
Adjusted net income (Non-GAAP)
|
|
$
|
74,695
|
|
$
|
82,600
|
|
$
|
78,153
|
|
|
Preferred stock dividends
|
|
|
-
|
|
|
-
|
|
|
(669
|
)
|
|
Adjusted net income attributable to common stockholders (Non-GAAP)
|
|
$
|
74,695
|
|
$
|
82,600
|
|
$
|
77,484
|
|
|
Weighted-average diluted shares outstanding
|
|
|
195,366
|
|
|
199,537
|
|
|
214,609
|
|
|
Earnings Per Share - diluted (GAAP)
|
|
$
|
0.38
|
|
$
|
0.41
|
|
$
|
0.33
|
|
|
Adjusted Earnings Per Share - diluted (Non-GAAP)
|
|
$
|
0.38
|
|
$
|
0.41
|
|
$
|
0.36
|
|
|
|
|
|
|
|
|
|
|
|
|
| |
|
(1) See Basis of Presentation for the individual tax impact related to the above adjustments.
|
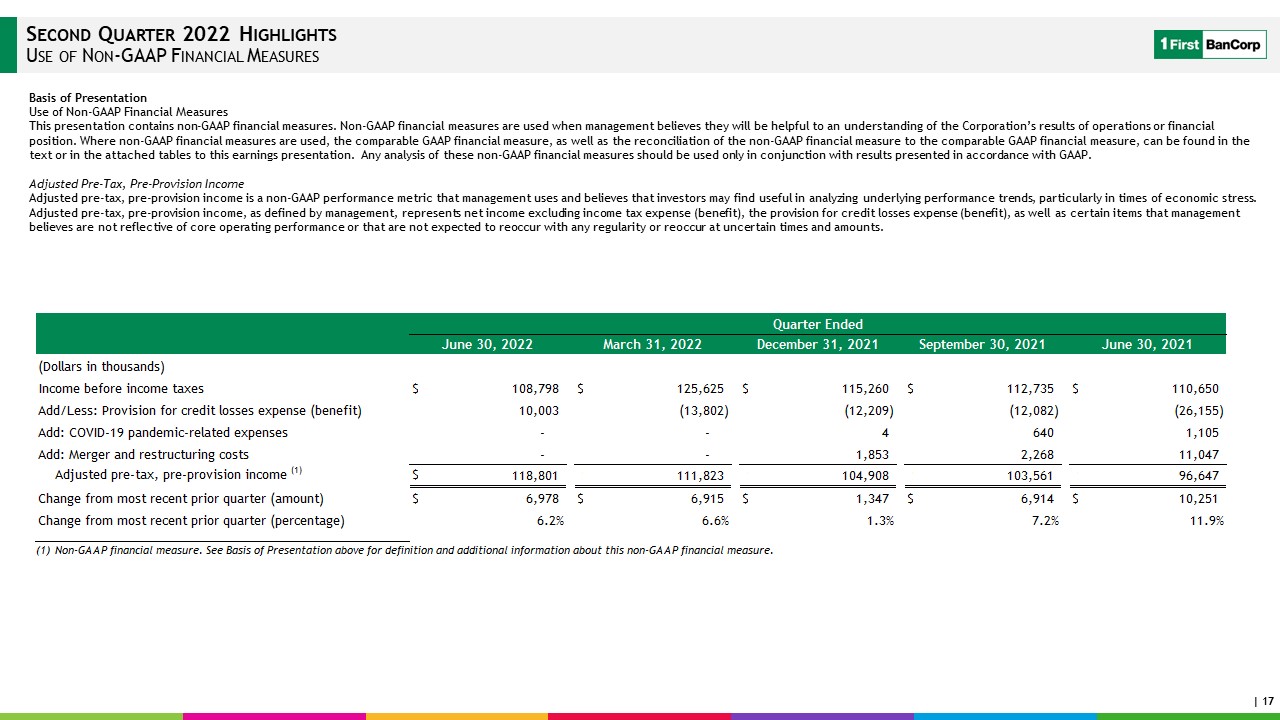
INCOME BEFORE INCOME TAXES AND RECONCILIATION TO ADJUSTED PRE-TAX, PRE-PROVISION INCOME (NON-GAAP)
Income before income taxes was $108.8 million for the second quarter of 2022, compared to $125.6 million for the first quarter of 2022. Adjusted pre-tax, pre-provision income was $118.8 million for the second quarter of 2022, compared to
$111.8 million for the first quarter of 2022. The following table reconciles income before income taxes to adjusted pre-tax, pre-provision income for the last five quarters:
|
|
|
Quarter Ended
|
|
|
|
June 30, 2022
|
|
March 31, 2022
|
|
December 31, 2021
|
|
September 30, 2021
|
|
June 30, 2021
|
|
(Dollars in thousands)
|
|
|
|
|
|
|
|
|
|
|
|
|
|
|
|
|
Income before income taxes
|
|
$
|
108,798
|
|
|
$
|
125,625
|
|
|
$
|
115,260
|
|
|
$
|
112,735
|
|
|
$
|
110,650
|
|
|
Add/Less: Provision for credit losses expense (benefit)
|
|
|
10,003
|
|
|
|
(13,802
|
)
|
|
|
(12,209
|
)
|
|
|
(12,082
|
)
|
|
|
(26,155
|
)
|
|
Add: COVID-19 pandemic-related expenses
|
|
|
-
|
|
|
|
-
|
|
|
|
4
|
|
|
|
640
|
|
|
|
1,105
|
|
|
Add: Merger and restructuring costs
|
|
|
-
|
|
|
|
-
|
|
|
|
1,853
|
|
|
|
2,268
|
|
|
|
11,047
|
|
|
Adjusted pre-tax, pre-provision income (1)
|
|
$
|
118,801
|
|
|
$
|
111,823
|
|
|
$
|
104,908
|
|
|
$
|
103,561
|
|
|
$
|
96,647
|
|
|
Change from most recent prior quarter (amount)
|
|
$
|
6,978
|
|
|
$
|
6,915
|
|
|
$
|
1,347
|
|
|
$
|
6,914
|
|
|
$
|
10,251
|
|
|
Change from most recent prior quarter (percentage)
|
|
|
6.2
|
%
|
|
|
6.6
|
%
|
|
|
1.3
|
%
|
|
|
7.2
|
%
|
|
|
11.9
|
%
|
|
|
|
|
|
|
|
|
|
|
|
|
|
|
|
|
|
| |
|
(1) Non-GAAP financial measure. See Basis of Presentation below for definition and additional information about this non-GAAP financial measure.
|
NET INTEREST INCOME
The following table sets forth information concerning net interest income for the last five quarters:
|
|
|
Quarter Ended
|
|
(Dollars in thousands)
|
|
June 30, 2022
|
|
March 31, 2022
|
|
December 31, 2021
|
|
September 30, 2021
|
|
June 30, 2021
|
|
Net Interest Income
|
|
|
|
|
|
|
|
|
|
|
|
|
|
|
|
|
Interest income
|
|
$
|
208,625
|
|
|
$
|
197,854
|
|
|
$
|
198,435
|
|
|
$
|
200,172
|
|
|
$
|
201,459
|
|
|
Interest expense
|
|
|
12,439
|
|
|
|
12,230
|
|
|
|
14,297
|
|
|
|
15,429
|
|
|
|
16,676
|
|
|
Net interest income
|
|
$
|
196,186
|
|
|
$
|
185,624
|
|
|
$
|
184,138
|
|
|
$
|
184,743
|
|
|
$
|
184,783
|
|
|
|
|
|
|
|
|
|
|
|
|
|
|
|
|
|
|
|
Average Balances
|
|
|
|
|
|
|
|
|
|
|
|
|
|
|
|
|
Loans and leases
|
|
$
|
11,102,310
|
|
|
$
|
11,106,855
|
|
|
$
|
11,108,997
|
|
|
$
|
11,223,926
|
|
|
$
|
11,560,731
|
|
|
Total securities, other short-term investments and interest-bearing cash balances
|
|
|
8,568,022
|
|
|
|
8,647,087
|
|
|
|
9,140,313
|
|
|
|
9,134,121
|
|
|
|
7,898,975
|
|
|
Average interest-earning assets
|
|
$
|
19,670,332
|
|
|
$
|
19,753,942
|
|
|
$
|
20,249,310
|
|
|
$
|
20,358,047
|
|
|
$
|
19,459,706
|
|
|
|
|
|
|
|
|
|
|
|
|
|
|
|
|
|
|
|
Average interest-bearing liabilities
|
|
$
|
11,567,228
|
|
|
$
|
11,211,780
|
|
|
$
|
11,467,480
|
|
|
$
|
11,718,557
|
|
|
$
|
12,118,631
|
|
|
|
|
|
|
|
|
|
|
|
|
|
|
|
|
|
|
|
Average Yield/Rate
|
|
|
|
|
|
|
|
|
|
|
|
|
|
|
|
|
Average yield on interest-earning assets - GAAP
|
|
|
4.25
|
%
|
|
|
4.06
|
%
|
|
|
3.89
|
%
|
|
|
3.90
|
%
|
|
|
4.15
|
%
|
|
Average rate on interest-bearing liabilities - GAAP
|
|
|
0.43
|
%
|
|
|
0.44
|
%
|
|
|
0.49
|
%
|
|
|
0.52
|
%
|
|
|
0.55
|
%
|
|
Net interest spread - GAAP
|
|
|
3.82
|
%
|
|
|
3.62
|
%
|
|
|
3.40
|
%
|
|
|
3.38
|
%
|
|
|
3.60
|
%
|
|
Net interest margin - GAAP
|
|
|
4.00
|
%
|
|
|
3.81
|
%
|
|
|
3.61
|
%
|
|
|
3.60
|
%
|
|
|
3.81
|
%
|
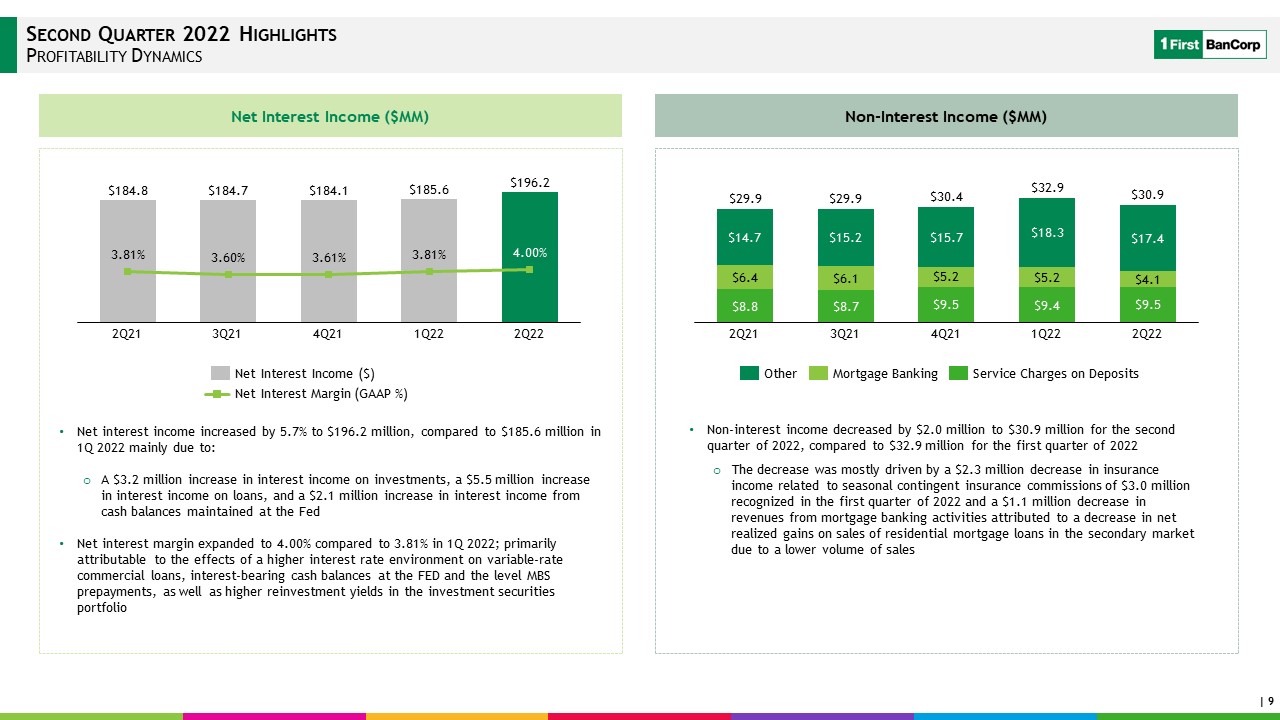
Net interest income amounted to $196.2 million for the second quarter of 2022, an increase of $10.6 million, compared to $185.6 million for the first quarter of 2022. The increase in net interest income was mainly due to:
- A $3.2 million increase in interest income on investment securities, primarily reflecting the effects of a lower U.S. agencies MBS premium amortization expense associated to lower actual and expected prepayments, and the effects of higher
reinvestment yields in the investment securities portfolio.
- A $3.1 million increase in interest income on consumer loans and finance leases, primarily due to an increase of approximately $105.8 million in the average balance of this portfolio, which resulted in an increase in interest income of
approximately $2.5 million and the favorable impact of one additional day in the second quarter, which resulted in an increase in interest income of approximately $0.8 million.
- A $2.6 million increase in interest income on commercial and construction loans, primarily due to: (i) the upward repricing of variable-rate commercial and construction loans, which resulted in an increase of approximately $3.5 million in
interest income, (ii) the effects in the second quarter of interest income of approximately $0.8 million realized from deferred interest recognized on three commercial loans paid off, and (iii) the positive effect of one additional day in the
second quarter, which resulted in an increase of approximately $0.7 million in this portfolio, partially offset by (iv) a $1.2 million decrease in interest income from SBA PPP loans and (v) $1.1 million collected on a nonaccrual commercial
loan in the first quarter of 2022.
- A $2.1 million increase in interest income from interest-bearing cash balances, which consisted primarily of deposits maintained at the FED, with an average yield of 0.75% during the second quarter of 2022 compared to 0.18% in the first
quarter of 2022, mainly attributable to increases in the federal funds target rate during the second quarter of 2022.
Partially offset by:
- A $0.2 million decrease in interest income on residential mortgage loans primarily due to a decrease of $70.2 million in the average balance of this portfolio, partially offset by an improvement in the average yield of the residential
mortgage portfolio.
- A $0.2 million increase in interest expense, which includes $0.6 million mainly related to the upward repricing of floating rate junior subordinated debentures and, to a lesser extent, $452.2 million in average balances of demand deposit
accounts that were converted to interest bearing at the end of the first quarter of 2022, partially offset by a $0.3 million decrease due to the full effect in the second quarter of 2022 associated with the repayment of a $100 million
repurchase agreement that carried a cost of 2.26% and matured early in the first quarter of 2022.
Net interest margin for the second quarter of 2022 increased to 4.00%, when compared to 3.81% for the first quarter of 2022.
NON-INTEREST INCOME
The following table sets forth information concerning non-interest income for the last five quarters:
|
|
|
Quarter Ended
|
|
|
|
June 30, 2022
|
|
March 31, 2022
|
|
December 31, 2021
|
|
September 30, 2021
|
|
June 30, 2021
|
|
(In thousands)
|
|
|
|
|
|
|
|
|
|
|
|
|
|
|
|
|
Service charges and fees on deposit accounts
|
|
$
|
9,466
|
|
$
|
9,363
|
|
$
|
9,502
|
|
$
|
8,690
|
|
$
|
8,788
|
|
Mortgage banking activities
|
|
|
4,082
|
|
|
5,206
|
|
|
5,223
|
|
|
6,098
|
|
|
6,404
|
|
Other operating income
|
|
|
17,393
|
|
|
18,289
|
|
|
15,653
|
|
|
15,158
|
|
|
14,692
|
|
Non-interest income
|
|
$
|
30,941
|
|
$
|
32,858
|
|
$
|
30,378
|
|
$
|
29,946
|
|
$
|
29,884
|
Non-interest income amounted to $30.9 million for the second quarter of 2022, compared to $32.9 million for the first quarter of 2022. The $2.0 million decrease in non-interest income was mainly due to:
- A $2.3 million decrease in insurance income, included as part of Other operating income in the table above, reflecting the effect of seasonal contingent commissions of $3.0 million recorded in the first quarter of 2022 based on the prior
year’s production of insurance policies.
- A $1.1 million decrease in revenues from mortgage banking activities, mainly driven by a decrease in net realized gains on sales of residential mortgage loans in the secondary market due to a lower volume of sales. During the second and
first quarters of 2022, net gains of $2.2 million and $3.5 million, respectively, were recognized as a result of Government National Mortgage Association (“GNMA”) securitization transactions and whole loan sales to U.S. government-sponsored
entities (“GSEs”) amounting to $64.2 million and $93.9 million, respectively.
Partially offset by:
- A $0.6 million net increase in transactional fee income from credit and debit cards, point-of-sale terminals (“POS”), ATMs, and merchant transactions, mainly due to higher transactional volumes.
- A $0.9 million gain on the sale of a banking facility related to branch consolidation efforts.
NON-INTEREST EXPENSES
The following table sets forth information concerning non-interest expenses for the last five quarters:
|
|
|
Quarter Ended
|
|
|
|
June 30, 2022
|
|
March 31, 2022
|
|
December 31, 2021
|
|
September 30, 2021
|
|
June 30, 2021
|
|
(In thousands)
|
|
|
|
|
|
|
|
|
|
|
|
|
|
|
|
|
Employees' compensation and benefits
|
|
$
|
51,304
|
|
|
$
|
49,554
|
|
|
$
|
49,681
|
|
|
$
|
50,220
|
|
|
$
|
49,714
|
|
|
Occupancy and equipment
|
|
|
21,505
|
|
|
|
22,386
|
|
|
|
21,589
|
|
|
|
23,306
|
|
|
|
24,116
|
|
|
Deposit insurance premium
|
|
|
1,466
|
|
|
|
1,673
|
|
|
|
1,253
|
|
|
|
1,381
|
|
|
|
1,922
|
|
|
Other insurance and supervisory fees
|
|
|
2,303
|
|
|
|
2,235
|
|
|
|
2,127
|
|
|
|
2,249
|
|
|
|
2,360
|
|
|
Taxes, other than income taxes
|
|
|
4,689
|
|
|
|
5,018
|
|
|
|
5,138
|
|
|
|
5,238
|
|
|
|
5,576
|
|
|
Professional service fees:
|
|
|
|
|
|
|
|
|
|
|
|
|
|
|
|
|
Collections, appraisals and other credit-related fees
|
|
|
1,075
|
|
|
|
909
|
|
|
|
874
|
|
|
|
1,451
|
|
|
|
1,080
|
|
|
Outsourcing technology services
|
|
|
7,636
|
|
|
|
6,905
|
|
|
|
7,909
|
|
|
|
8,878
|
|
|
|
11,946
|
|
|
Other professional fees
|
|
|
3,325
|
|
|
|
2,780
|
|
|
|
3,154
|
|
|
|
3,225
|
|
|
|
3,738
|
|
|
Credit and debit card processing expenses
|
|
|
5,843
|
|
|
|
4,121
|
|
|
|
5,523
|
|
|
|
5,573
|
|
|
|
6,795
|
|
|
Business promotion
|
|
|
4,042
|
|
|
|
3,463
|
|
|
|
5,794
|
|
|
|
3,370
|
|
|
|
3,225
|
|
|
Communications
|
|
|
1,978
|
|
|
|
2,151
|
|
|
|
2,268
|
|
|
|
2,250
|
|
|
|
2,407
|
|
|
Net gain on OREO operations
|
|
|
(1,485
|
)
|
|
|
(720
|
)
|
|
|
(1,631
|
)
|
|
|
(2,288
|
)
|
|
|
(139
|
)
|
|
Merger and restructuring costs
|
|
|
-
|
|
|
|
-
|
|
|
|
1,853
|
|
|
|
2,268
|
|
|
|
11,047
|
|
|
Other
|
|
|
4,645
|
|
|
|
6,184
|
|
|
|
5,933
|
|
|
|
6,915
|
|
|
|
6,385
|
|
|
Total
|
|
$
|
108,326
|
|
|
$
|
106,659
|
|
|
$
|
111,465
|
|
|
$
|
114,036
|
|
|
$
|
130,172
|
|
Non-interest expenses amounted to $108.3 million in the second quarter of 2022, an increase of $1.6 million from $106.7 million in the first quarter of 2022. The $1.6 million increase reflects, among other things, the following significant
variances:
- A $1.8 million increase in employees’ compensation and benefits expense, driven by a $1.0 million increase in compensation expense and a $1.6 million increase in bonus expense and other incentives, partially offset by a $0.9 million
decrease in payroll taxes and other employee expenses.
- A $1.7 million increase in credit and debit card processing expenses, primarily related to credit card networks expense incentive of $1.0 million received in the first quarter of 2022, as well as higher transaction volumes.
- A $1.4 million increase in professional service fees, mainly due to a $0.7 million increase in outsourcing technology service fees mainly related to the reversal of technology processing and data-related costs of the acquired BSPR
operations in the first quarter of 2022 and a $0.6 million increase in consulting fees driven by various technology projects.
- A $0.6 million increase in business promotion expenses, mainly related to a credit card loyalty rewards program adjustment recognized in the first quarter of 2022 to reduce the credit card rewards estimated liability based on updated lower
historical trends of customer redemption rates.
Partially offset by:
- A $1.5 million decrease in other non-interest expenses, mainly driven by the reversal of a $1.0 million sundry loss reserve as a result of the resolution of an operational loss during the second quarter of 2022.
- A $0.9 million decrease in occupancy and equipment costs, primarily related to a reduction in rental expense and depreciation charges mainly due to the consolidation of additional branches during the first quarter of 2022 and the
resolution of a rent contingency during the second quarter of 2022.
- A $0.8 million increase in net gains on other real estate owned (“OREO”) operations, mainly due to a $0.9 million increase in net realized gains on sales of OREO properties, primarily residential properties in the Puerto Rico region.
INCOME TAXES
The Corporation recorded an income tax expense of $34.1 million for the second quarter of 2022, compared to $43.0 million for the first quarter of 2022. The variance was primarily related to lower pre-tax income when compared to the prior
quarter.
The Corporation’s estimated effective tax rate, excluding entities with pre-tax losses from which a tax benefit cannot be recognized and discrete items, decreased to 31.7% compared to 32.9% for the first quarter of 2022, mostly attributable
to a higher proportion of exempt to taxable income when compared to prior quarter. As of June 30, 2022, the Corporation had a deferred tax asset of $167.0 million, net of a valuation allowance of $166.4 million against the deferred tax assets.
The Corporation’s banking subsidiary, FirstBank, had a deferred tax asset of $166.9 million net of a valuation allowance of $127.7 million.
CREDIT QUALITY
Non-Performing Assets
The following table sets forth information concerning non-performing assets for the last five quarters:
|
(Dollars in thousands)
|
|
June 30, 2022
|
|
March 31, 2022
|
|
December 31, 2021
|
|
September 30, 2021
|
|
June 30, 2021
|
|
Nonaccrual loans held for investment:
|
|
|
|
|
|
|
|
|
|
|
|
|
|
|
|
|
Residential mortgage
|
|
$
|
44,588
|
|
|
$
|
48,818
|
|
|
$
|
55,127
|
|
|
$
|
60,589
|
|
|
$
|
121,695
|
|
|
Commercial mortgage
|
|
|
24,753
|
|
|
|
26,576
|
|
|
|
25,337
|
|
|
|
26,812
|
|
|
|
27,242
|
|
|
Commercial and Industrial
|
|
|
17,079
|
|
|
|
18,129
|
|
|
|
17,135
|
|
|
|
18,990
|
|
|
|
18,835
|
|
|
Construction
|
|
|
2,375
|
|
|
|
2,543
|
|
|
|
2,664
|
|
|
|
6,093
|
|
|
|
6,175
|
|
|
Consumer and finance leases
|
|
|
10,315
|
|
|
|
10,964
|
|
|
|
10,454
|
|
|
|
9,657
|
|
|
|
8,703
|
|
|
Total nonaccrual loans held for investment
|
|
$
|
99,110
|
|
|
$
|
107,030
|
|
|
$
|
110,717
|
|
|
$
|
122,141
|
|
|
$
|
182,650
|
|
|
OREO
|
|
|
41,706
|
|
|
|
42,894
|
|
|
|
40,848
|
|
|
|
43,798
|
|
|
|
66,586
|
|
|
Other repossessed property
|
|
|
3,840
|
|
|
|
3,823
|
|
|
|
3,687
|
|
|
|
3,550
|
|
|
|
3,470
|
|
|
Other assets (1)
|
|
|
2,809
|
|
|
|
2,727
|
|
|
|
2,850
|
|
|
|
2,894
|
|
|
|
2,928
|
|
|
Total non-performing assets (2)
|
|
$
|
147,465
|
|
|
$
|
156,474
|
|
|
$
|
158,102
|
|
|
$
|
172,383
|
|
|
$
|
255,634
|
|
|
|
|
|
|
|
|
|
|
|
|
|
|
|
|
|
|
|
Past due loans 90 days and still accruing (3)
|
|
$
|
94,485
|
|
|
$
|
118,798
|
|
|
$
|
115,448
|
|
|
$
|
148,322
|
|
|
$
|
144,262
|
|
|
Nonaccrual loans held for investment to total loans held for investment
|
|
|
0.88
|
%
|
|
|
0.96
|
%
|
|
|
1.00
|
%
|
|
|
1.10
|
%
|
|
|
1.60
|
%
|
|
Nonaccrual loans to total loans
|
|
|
0.88
|
%
|
|
|
0.96
|
%
|
|
|
1.00
|
%
|
|
|
1.09
|
%
|
|
|
1.60
|
%
|
|
Non-performing assets to total assets
|
|
|
0.76
|
%
|
|
|
0.79
|
%
|
|
|
0.76
|
%
|
|
|
0.81
|
%
|
|
|
1.20
|
%
|
|
|
|
|
|
|
|
|
|
|
|
|
|
|
|
|
|
|
(1)
|
Residential pass-through MBS issued by the Puerto Rico Housing Finance Authority ("PRHFA") held as part of the available-for-sale debt securities portfolio.
|
|
(2)
|
Excludes purchased-credit deteriorated ("PCD") loans previously accounted for under Accounting Standards Codification ("ASC") Subtopic 310-30 for which the Corporation made the accounting
policy election of maintaining pools of loans as “units of account” both at the time of adoption of current expected credit losses ("CECL") on January 1, 2020 and on an ongoing basis for credit loss measurement. These loans will
continue to be excluded from nonaccrual loan statistics as long as the Corporation can reasonably estimate the timing and amount of cash flows expected to be collected on the loan pools. The portion of such loans contractually past due
90 days or more amounted to $15.3 million as of June 30, 2022 (March 31, 2022 - $18.0 million; December 31, 2021 - $20.6 million; September 30, 2021 - $22.1 million; June 30, 2021 - $24.6 million).
|
|
(3)
|
These include rebooked loans, which were previously pooled into GNMA securities, amounting to $10.8 million as of June 30, 2022 (March 31, 2022 - $9.5 million;
|
|
|
December 31, 2021 - $7.2 million; September 30, 2021 - $8.5 million; June 30, 2021 - $8.0 million). Under the GNMA program, the Corporation has the option but not the obligation to
repurchase loans that meet GNMA’s specified delinquency criteria. For accounting purposes, the loans subject to the repurchase option are required to be reflected on the financial statements with an offsetting liability.
|
Variances in credit quality metrics:
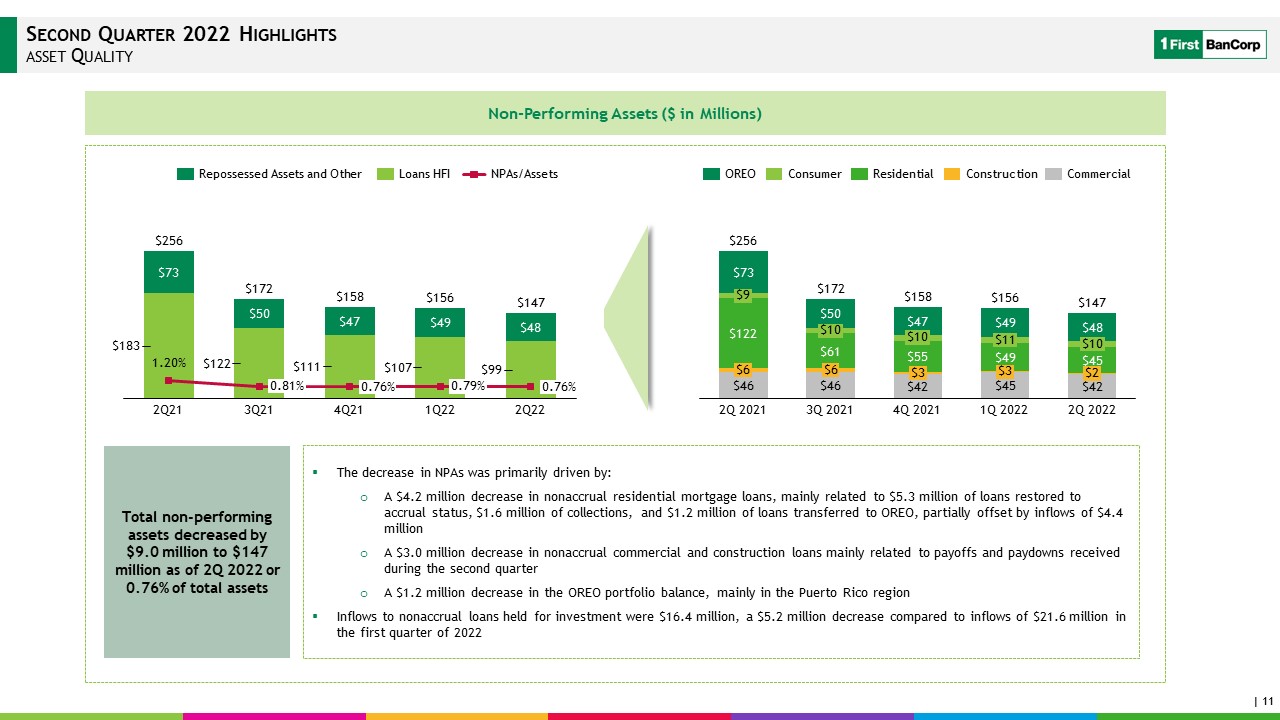
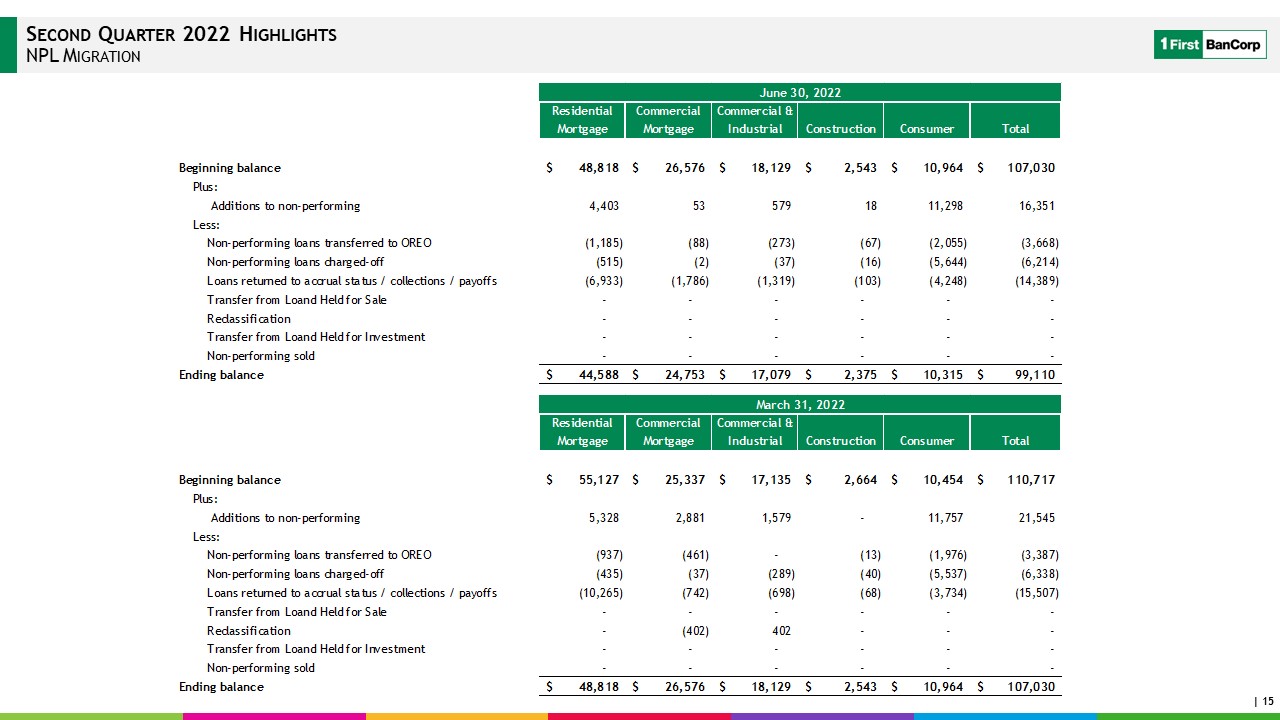
- Total non-performing assets decreased by $9.0 million to $147.5 million as of June 30, 2022, compared to $156.5 million as of March 31, 2022. Total nonaccrual loans held for investment decreased by $7.9 million to $99.1 million as of June
30, 2022, compared to $107.0 million as of March 31, 2022.
The decrease in non-performing assets was mainly driven by:
- A $4.2 million decrease in nonaccrual residential mortgage loans, mainly related to $5.3 million of loans restored to accrual status, $1.6 million of collections, and $1.2 million of loans transferred to OREO, partially offset by inflows of
$4.4 million.
- A $3.0 million decrease in nonaccrual commercial and construction loans mainly related to payoffs and paydowns received during the second quarter.
- A $1.2 million decrease in the OREO portfolio balance, mainly in the Puerto Rico region.
- Inflows to nonaccrual loans held for investment were $16.4 million, a $5.2 million decrease compared to inflows of $21.6 million in the first quarter of 2022. Inflows to nonaccrual consumer loans were $11.4 million, a decrease of $0.4
million compared to inflows of $11.8 million in the first quarter of 2022. Inflows to nonaccrual residential mortgage loans were $4.4 million in the second quarter of 2022, a decrease of $0.9 million compared to inflows of $5.3 million in the
first quarter of 2022. Inflows to nonaccrual commercial and construction loans were $0.6 million in the second quarter of 2022, a decrease of $3.9 million compared to inflows of $4.5 million in the first quarter of 2022. See Early
Delinquency below for additional information.
- Adversely classified commercial and construction loans decreased by $5.4 million to $170.7 million as of June 30, 2022.
- Total Troubled Debt Restructured (“TDR”) loans held for investment were $394.5 million as of June 30, 2022, down $10.2 million from March 31, 2022. Approximately $345.4 million of total TDR loans held for investment were in accrual status
as of June 30, 2022. These figures exclude $55.1 million of government-guaranteed TDR residential mortgage loans (i.e., Federal Housing Administration and Veterans Administration loans).
Early Delinquency
Total loans held for investment in early delinquency (i.e., 30-89 days past due accruing loans, as defined in regulatory reporting instructions) amounted to $92.2 million as of June 30, 2022, a decrease of $8.2 million, compared to $100.4
million as of March 31, 2022. The variances by major portfolio categories are as follows:
- Commercial and construction loans in early delinquency decreased in the second quarter by $19.0 million to $5.6 million as of June 30, 2022, primarily due to the renewal of four commercial and construction
relationships totaling $14.0 million that had matured during the previous quarter, the migration to the 90 days or more past due and still accruing category of a $2.6 million matured commercial and industrial loan that is in the process of
renewal but for which the Corporation continues to receive principal and interest payments from the borrower, and the payoff of a $1.8 million commercial and industrial loan that had matured during the previous quarter.
- Consumer loans in early delinquency increased by $9.6 million to $53.3 million, mainly in auto loans, and residential mortgage loans in early delinquency increased by $1.2 million to $33.3 million.
Allowance for Credit Losses
The following table summarizes the activity of the allowance for credit losses (“ACL”) for on-balance sheet and off-balance sheet exposures during the second and first quarters of 2022:
|
|
|
Quarter ended June 30, 2022
|
|
|
|
Loans and Finance Leases
|
|
|
|
|
Debt Securities
|
|
|
|
|
|
|
Residential
Mortgage
Loans
|
|
Commercial and
Construction
Loans
|
|
Consumer Loans
and Finance
Leases
|
|
Total Loans and
Finance Leases
|
|
Unfunded
Loans
Commitments
|
|
Held-to-
Maturity
|
|
Available-
for-Sale
|
|
Total ACL
|
|
Allowance for Credit Losses
|
|
|
|
|
|
|
|
|
|
(Dollars in thousands)
|
|
|
|
|
|
|
|
|
|
|
|
|
|
|
|
|
|
|
|
|
|
|
|
|
|
Allowance for credit losses, beginning balance
|
|
$
|
68,820
|
|
|
$
|
68,764
|
|
|
$
|
107,863
|
|
|
$
|
245,447
|
|
|
$
|
1,359
|
|
|
$
|
12,324
|
|
|
$
|
711
|
|
|
$
|
259,841
|
|
|
Provision for credit losses - (benefit) expense
|
|
|
(2,797
|
)
|
|
|
314
|
|
|
|
15,148
|
|
|
|
12,665
|
|
|
|
812
|
|
|
|
(3,439
|
)
|
|
|
(35
|
)
|
|
|
10,003
|
|
|
Net (charge-offs) recoveries
|
|
|
(792
|
)
|
|
|
1,764
|
|
|
|
(6,932
|
)
|
|
|
(5,960
|
)
|
|
|
-
|
|
|
|
-
|
|
|
|
-
|
|
|
|
(5,960
|
)
|
|
Allowance for credit losses, end of period
|
|
$
|
65,231
|
|
|
$
|
70,842
|
|
|
$
|
116,079
|
|
|
$
|
252,152
|
|
|
$
|
2,171
|
|
|
$
|
8,885
|
|
|
$
|
676
|
|
|
$
|
263,884
|
|
|
Amortized cost of loans and finance leases
|
|
$
|
2,851,685
|
|
|
$
|
5,248,340
|
|
|
$
|
3,106,849
|
|
|
$
|
11,206,874
|
|
|
|
|
|
|
|
|
|
|
|
|
|
|
Allowance for credit losses on loans to amortized cost
|
|
|
2.29
|
%
|
|
|
1.35
|
%
|
|
|
3.74
|
%
|
|
|
2.25
|
%
|
|
|
|
|
|
|
|
|
|
|
|
|
|
|
|
|
|
|
|
|
|
|
|
|
|
|
|
|
|
|
|
|
|
|
|
|
|
|
|
|
|
Quarter ended March 31, 2022
|
|
|
|
Loans and Finance Leases
|
|
|
|
|
Debt Securities
|
|
|
|
|
|
|
Residential
Mortgage
Loans
|
|
Commercial and
Construction
Loans
|
|
Consumer Loans
and Finance
Leases
|
|
Total Loans and
Finance Leases
|
|
Unfunded
Loans
Commitments
|
|
Held-to-
Maturity
|
|
Available-
for-Sale
|
|
Total ACL
|
|
Allowance for Credit Losses
|
|
|
|
|
|
|
|
|
|
(Dollars in thousands)
|
|
|
|
|
|
|
|
|
|
|
|
|
|
|
|
|
|
|
|
|
|
|
|
|
|
Allowance for credit losses, beginning balance
|
|
$
|
74,837
|
|
|
$
|
91,103
|
|
|
$
|
103,090
|
|
|
$
|
269,030
|
|
|
$
|
1,537
|
|
|
$
|
8,571
|
|
|
$
|
1,105
|
|
|
$
|
280,243
|
|
|
Provision for credit losses - (benefit) expense
|
|
|
(4,871
|
)
|
|
|
(23,099
|
)
|
|
|
10,981
|
|
|
|
(16,989
|
)
|
|
|
(178
|
)
|
|
|
3,753
|
|
|
|
(388
|
)
|
|
|
(13,802
|
)
|
|
Net (charge-offs) recoveries
|
|
|
(1,146
|
)
|
|
|
760
|
|
|
|
(6,208
|
)
|
|
|
(6,594
|
)
|
|
|
-
|
|
|
|
-
|
|
|
|
(6
|
)
|
|
|
(6,600
|
)
|
|
Allowance for credit losses, end of period
|
|
$
|
68,820
|
|
|
$
|
68,764
|
|
|
$
|
107,863
|
|
|
$
|
245,447
|
|
|
$
|
1,359
|
|
|
$
|
12,324
|
|
|
$
|
711
|
|
|
$
|
259,841
|
|
|
Amortized cost of loans and finance leases
|
|
$
|
2,891,699
|
|
|
$
|
5,229,866
|
|
|
$
|
2,976,140
|
|
|
$
|
11,097,705
|
|
|
|
|
|
|
|
|
|
|
|
|
|
|
Allowance for credit losses on loans to amortized cost
|
|
|
2.38
|
%
|
|
|
1.31
|
%
|
|
|
3.62
|
%
|
|
|
2.21
|
%
|
|
|
|
|
|
|
|
|
|
|
|
|
The main variances of the total ACL by main categories are discussed below:
Allowance for Credit Losses for Loans and Finance Leases
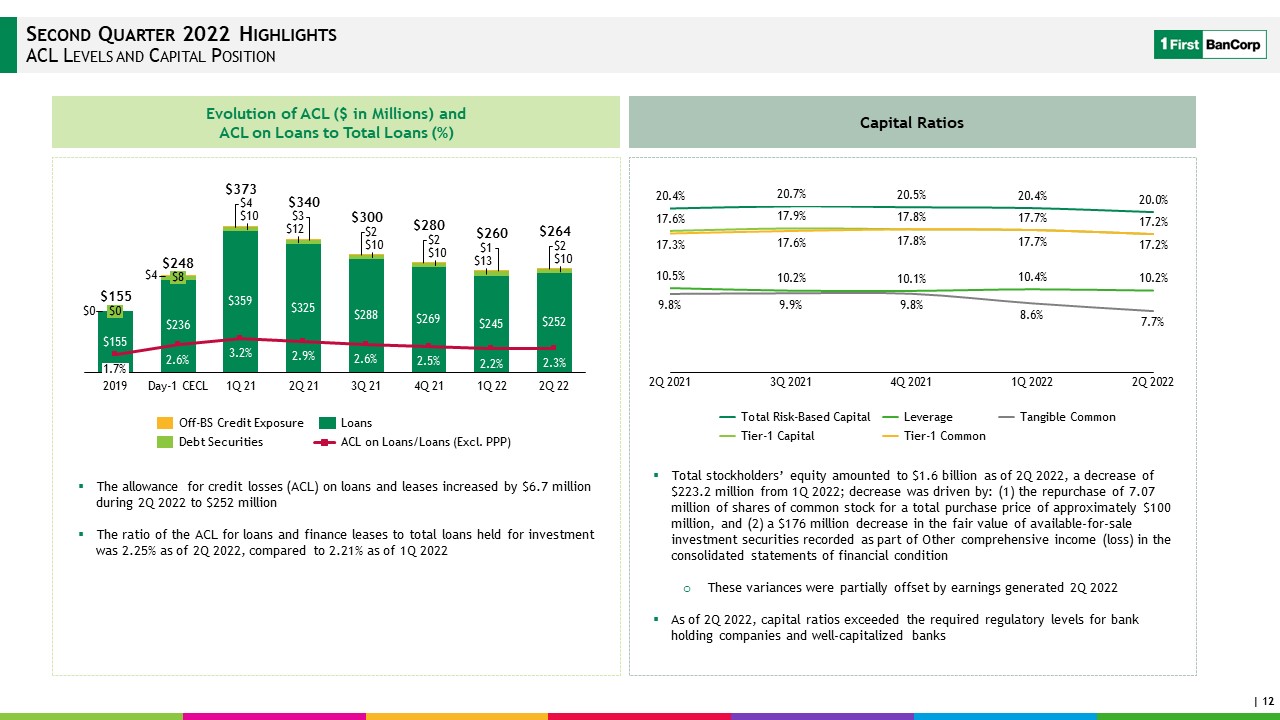
- As of June 30, 2022, the ACL for loans and finance leases was $252.1 million, an increase of $6.7 million, from $245.4 million as of March 31, 2022. The ACL for consumer loans increased by $8.2 million, primarily reflecting the effect of
the increase in the size of the auto loans and finance lease portfolios. The ACL for commercial and construction loans increased $2.1 million, primarily as a result of increased economic uncertainty that is reflected in the forecast of
certain macro-economic variables and the related qualitative reserves. On the other hand, the ACL for residential mortgage loans decreased by $3.6 million, primarily due to the overall reduction in the size of this portfolio.
- The provision for credit losses on loans and finance leases was an expense of $12.7 million for the second quarter of 2022, compared to a net benefit of $17.0 million in the first quarter of 2022.
- Provision for credit losses for the commercial and construction loan portfolio was an expense of $0.3 million for the second quarter of 2022, compared to a net benefit of $23.1 million in the first quarter of
2022. The benefit recognized during the first quarter of 2022 was related to reductions in qualitative reserves associated with a positive long-term outlook of forecasted macroeconomic variables, primarily in the commercial real estate price
index, as a result of a reduced impact of the Omicron variant.
- Provision for credit losses for the consumer loans and finance leases portfolio was an expense of $15.2 million for the second quarter of 2022, compared to an expense of $11.0 million in the first quarter of 2022,
primarily reflecting the effect of the increase in the size of the auto loans and finance lease portfolios.
- Provision for credit losses for the residential mortgage loan portfolio was a net benefit of $2.8 million for the second quarter of 2022, compared to a net benefit of $4.9 million in the first quarter of 2022. The
net benefit recorded for the second quarter of 2022 was primarily related to the overall decrease in the size of the residential mortgage portfolio.
- The ratio of the ACL for loans and finance leases to total loans held for investment was 2.25% as of June 30, 2022, compared to 2.21% as of March 31, 2022. The ratio of the total ACL for loans and finance leases to nonaccrual loans held
for investment was 254% as of June 30, 2022, compared to 229% as of March 31, 2022.
Net Charge-Offs
The following table presents ratios of annualized net charge-offs (recoveries) to average loans held-in-portfolio:
|
|
|
Quarter Ended
|
|
|
|
June 30, 2022
|
|
March 31, 2022
|
|
December 31, 2021
|
|
September 30, 2021
|
|
June 30, 2021
|
|
|
|
|
|
|
|
|
|
|
|
|
|
Residential mortgage
|
|
0.11%
|
|
0.15%
|
|
0.13%
|
|
2.94%
|
(1)
|
0.24%
|
|
Commercial mortgage
|
|
-0.22%
|
|
0.00%
|
|
0.01%
|
|
0.07%
|
|
0.01%
|
|
Commercial and industrial
|
|
-0.07%
|
|
-0.10%
|
|
0.10%
|
|
-0.04%
|
|
-0.74%
|
|
Construction
|
|
-0.09%
|
|
-0.03%
|
|
-0.03%
|
|
-0.08%
|
|
-0.09%
|
|
Consumer loans and finance leases
|
|
0.91%
|
|
0.85%
|
|
0.75%
|
|
0.64%
|
|
1.72%
|
|
Total loans
|
|
0.21%
|
|
0.24%
|
|
0.26%
|
|
0.99%
|
(1)
|
0.27%
|
|
|
|
|
|
|
|
|
|
|
|
|
|
(1)
|
Includes net charge-offs totaling $23.1 million associated with a bulk sale of residential mortgage nonaccrual loans and related servicing advance receivables. Excluding net charge-offs
associated with the bulk sale, residential mortgage and total net charge-offs to related average loans for the third quarter of 2021 was 0.05% and 0.17%, respectively.
|
The ratios above are based on annualized net charge-offs and are not necessarily indicative of the results expected in subsequent periods.
Net charge-offs were $6.0 million for the second quarter of 2022, or an annualized 0.21% of average loans, compared to $6.6 million, or an annualized 0.24% of average loans, in the first quarter of 2022. The decrease of $0.6 million in net
charge-offs included the following:
- A $1.0 million increase in commercial and construction loan net recoveries mainly related to $1.2 million in recoveries recorded in the second quarter of 2022 on two commercial mortgage relationships.
- A $0.3 million decrease in residential mortgage loan net charge-offs.
Partially offset by:
- A $0.7 million increase in consumer loan net charge-offs, primarily reflecting increases in charge-offs taken on credit cards and personal loans.
Allowance for Credit Losses for Unfunded Loan Commitments
The Corporation estimates expected credit losses over the contractual period during which the Corporation is exposed to credit risk as a result of a contractual obligation to extend credit, such as pursuant to unfunded loan commitments and
standby letters of credit for commercial and construction loans, unless the obligation is unconditionally cancellable by the Corporation. The ACL for off-balance sheet credit exposures is adjusted as a provision for credit loss expense. As of
June 30, 2022, the ACL for off-balance sheet credit exposures was $2.2 million, an increase of $0.8 million from $1.4 million as of March 31, 2022.
Allowance for Credit Losses for Held-to-Maturity Debt Securities
As of June 30, 2022, the ACL for held-to-maturity debt securities consisted of Puerto Rico municipal bonds. As of June 30, 2022, the ACL for held-to-maturity debt securities was $8.9 million, compared to $12.3 million as of March 31, 2022.
The decrease on the ACL is mostly related to a reduction in qualitative reserves driven by updated financial information received during the second quarter of 2022.
STATEMENT OF FINANCIAL CONDITION
Total assets were approximately $19.5 billion as of June 30, 2022, down $397.4 million from March 31, 2022.
The following variances within the main components of total assets are noted:
- A $432.7 million decrease in cash and cash equivalents mainly related to the overall decline in total deposits, the deployment of liquidity into U.S. agencies MBS, funding of new loan originations, and the repurchase of approximately 7.07
million shares of common stock for a total purchase price of approximately $100 million.
- A $59.1 million decrease in investment securities, mainly driven by a $175.9 million decrease in the fair value of available-for-sale debt securities attributable to changes in market interest rates, and the prepayments of approximately
$166.6 million of U.S. agencies MBS, partially offset by purchases of U.S. agencies MBS totaling $280.2 million which were classified as part of the held-to-maturity debt securities portfolio.
- A $103.9 million increase in total loans. The increase consisted of a $60.8 million increase in the Puerto Rico region and a $46.2 million increase in the Florida region, partially offset by a reduction of $3.1 million in the Virgin
Islands region. On a portfolio basis, the increase consisted of a $130.7 million increase in consumer loans (including a $101.0 million increase in auto loans and finance leases) and an increase of $18.5 million in commercial and construction
loans (net of the $40.3 million decrease in the carrying value of the SBA PPP loan portfolio), partially offset by a reduction of $45.3 million in residential mortgage loans. Excluding the $40.3 million decrease in the carrying value of the
SBA PPP loan portfolio, commercial and construction loans increased by $58.8 million mainly reflecting the origination of loans related to seven commercial and industrial relationships, each in excess of $10 million, amounting to $133.8
million, partially offset by a decrease of $36.4 million in the balance of floor plan lines of credit, and payoffs and paydowns.
Total loan originations, including refinancings, renewals and draws from existing commitments (excluding credit card utilization activity), amounted to $1.4 billion in the second quarter of 2022, an increase of $280.8 million compared to the
first quarter of 2022. The increase in total loan originations consisted of: (i) a $237.1 million increase in commercial and construction loan originations; (ii) a $39.7 million increase in consumer loan originations; and (iii) a $4.0 million
increase in residential mortgage loan originations.
Total loan originations in the Puerto Rico region amounted to $993.8 million in the second quarter of 2022, an increase of $136.0 million when compared to $857.8 million in the first quarter of 2022. The $136.0 million net increase in total
loan originations in the Puerto Rico region consisted of: (i) a $104.2 million increase in commercial and construction loan originations; (ii) a $37.9 million increase in consumer loan originations; and (iii) a $6.1 million decrease in
residential mortgage loan originations.
Total loan originations in the Florida region amounted to $328.0 million in the second quarter of 2022, compared to $202.8 million in the first quarter of 2022. The increase of $125.2 million in total loan originations in the Florida region
consisted of: (i) a $115.5 million increase in commercial and construction loan originations; (ii) a $9.4 million increase in residential mortgage loan originations; and (iii) a $0.3 million increase in consumer loan originations.
Total loan originations in the Virgin Islands region amounted to $36.8 million in the second quarter of 2022, compared to $17.2 million in the first quarter of 2022. The increase of $19.6 million in total loan originations in the Virgin
Islands region consisted of: (i) a $17.4 million increase in commercial and construction loan originations; (ii) a $1.5 million increase in consumer loan originations; and (iii) a $0.7 million increase in residential mortgage loan
originations.
Total liabilities were approximately $18.0 billion as of June 30, 2022, down $174.2 million from March 31, 2022.
The decrease in total liabilities was mainly due to:
- A $360.2 million decrease in total deposits, excluding brokered CDs and government deposits, reflecting reductions of $425.5 million in the Puerto Rico region and $19.0 million in the Virgin Islands region, partially offset by an increase
of $84.3 million in the Florida region.
- A $11.7 million decrease in brokered CDs.
Partially offset by:
- A $176.6 million increase in government deposits, consisting of increases of $98.1 million in the Virgin Islands region, $77.2 million in the Puerto Rico region, and $1.3 million in the Florida region. The increase in the Virgin Islands
region was primarily related to income tax collections made by the central government and the increase reflected in the Puerto Rico region was primarily related to municipal tax collections.
Total stockholders’ equity amounted to $1.6 billion as of June 30, 2022, a decrease of $223.2 million from March 31, 2022. The decrease was driven by the $175.9 million increase in other comprehensive loss (“OCL”) directly related to
reductions in the fair value of available-for-sale debt securities due to changes in market interest rates, the repurchase of approximately 7.07 million shares of common stock for a total purchase price of approximately $100 million as part of
the $350 million stock repurchase program announced in April 2022, and $23.4 million in quarterly dividends declared to common stock shareholders. These variances were partially offset by earnings generated in the second quarter.
As of June 30, 2022, capital ratios exceeded the required regulatory levels for bank holding companies and well-capitalized banks. The Corporation’s estimated common equity tier 1 capital, tier 1 capital, total capital and leverage ratios
under the Basel III rules were 17.23%, 17.23%, 19.98%, and 10.18%, respectively, as of June 30, 2022, compared to common equity tier 1 capital, tier 1 capital, total capital and leverage ratios of 17.71%, 17.71%, 20.44%, and 10.35%,
respectively, as of March 31, 2022.
Meanwhile, estimated common equity tier 1 capital, tier 1 capital, total capital and leverage ratios of our banking subsidiary, FirstBank Puerto Rico, were 17.16%, 18.00%, 19.25%, and 10.63%, respectively, as of June 30, 2022, compared to
common equity tier 1 capital, tier 1 capital, total capital and leverage ratios of 18.09%, 18.93%, 20.17%, and 11.07%, respectively, as of March 31, 2022.
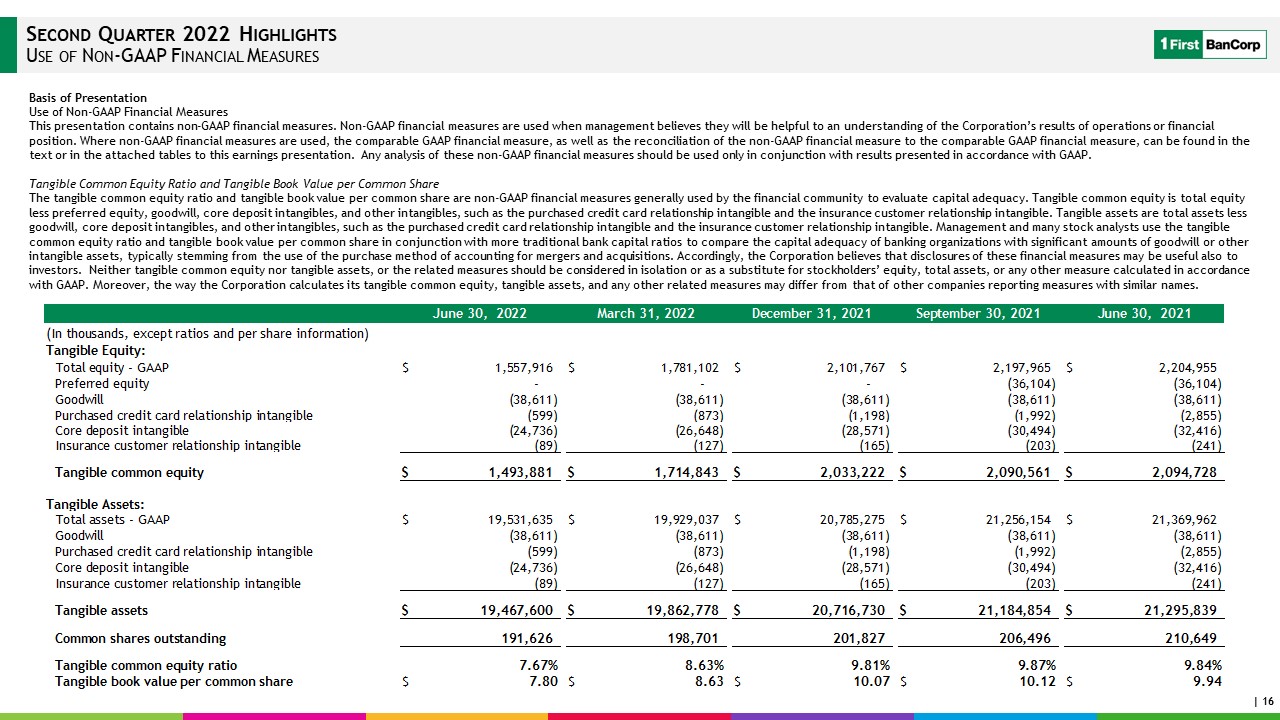
Tangible Common Equity
The Corporation’s tangible common equity ratio decreased to 7.67% as of June 30, 2022, compared to 8.63% as of March 31, 2022. The decrease in tangible common equity includes a $175.9 million increase in OCL.
The following table presents a reconciliation of the Corporation’s tangible common equity and tangible assets to the most comparable GAAP items as of the indicated dates:
|
|
|
June 30, 2022
|
|
March 31, 2022
|
|
December 31, 2021
|
|
September 30, 2021
|
|
June 30, 2021
|
|
(In thousands, except ratios and per share information)
|
|
|
|
|
|
|
|
|
|
|
|
|
|
|
|
|
Tangible Equity:
|
|
|
|
|
|
|
|
|
|
|
|
|
|
|
|
|
Total equity - GAAP
|
|
$
|
1,557,916
|
|
|
$
|
1,781,102
|
|
|
$
|
2,101,767
|
|
|
$
|
2,197,965
|
|
|
$
|
2,204,955
|
|
|
Preferred equity
|
|
|
-
|
|
|
|
-
|
|
|
|
-
|
|
|
|
(36,104
|
)
|
|
|
(36,104
|
)
|
|
Goodwill
|
|
|
(38,611
|
)
|
|
|
(38,611
|
)
|
|
|
(38,611
|
)
|
|
|
(38,611
|
)
|
|
|
(38,611
|
)
|
|
Purchased credit card relationship intangible
|
|
|
(599
|
)
|
|
|
(873
|
)
|
|
|
(1,198
|
)
|
|
|
(1,992
|
)
|
|
|
(2,855
|
)
|
|
Core deposit intangible
|
|
|
(24,736
|
)
|
|
|
(26,648
|
)
|
|
|
(28,571
|
)
|
|
|
(30,494
|
)
|
|
|
(32,416
|
)
|
|
Insurance customer relationship intangible
|
|
|
(89
|
)
|
|
|
(127
|
)
|
|
|
(165
|
)
|
|
|
(203
|
)
|
|
|
(241
|
)
|
|
|
|
|
|
|
|
|
|
|
|
|
|
|
|
|
|
|
Tangible common equity
|
|
$
|
1,493,881
|
|
|
$
|
1,714,843
|
|
|
$
|
2,033,222
|
|
|
$
|
2,090,561
|
|
|
$
|
2,094,728
|
|
|
|
|
|
|
|
|
|
|
|
|
|
|
|
|
|
|
|
Tangible Assets:
|
|
|
|
|
|
|
|
|
|
|
|
|
|
|
|
|
Total assets - GAAP
|
|
$
|
19,531,635
|
|
|
$
|
19,929,037
|
|
|
$
|
20,785,275
|
|
|
$
|
21,256,154
|
|
|
$
|
21,369,962
|
|
|
Goodwill
|
|
|
(38,611
|
)
|
|
|
(38,611
|
)
|
|
|
(38,611
|
)
|
|
|
(38,611
|
)
|
|
|
(38,611
|
)
|
|
Purchased credit card relationship intangible
|
|
|
(599
|
)
|
|
|
(873
|
)
|
|
|
(1,198
|
)
|
|
|
(1,992
|
)
|
|
|
(2,855
|
)
|
|
Core deposit intangible
|
|
|
(24,736
|
)
|
|
|
(26,648
|
)
|
|
|
(28,571
|
)
|
|
|
(30,494
|
)
|
|
|
(32,416
|
)
|
|
Insurance customer relationship intangible
|
|
|
(89
|
)
|
|
|
(127
|
)
|
|
|
(165
|
)
|
|
|
(203
|
)
|
|
|
(241
|
)
|
|
|
|
|
|
|
|
|
|
|
|
|
|
|
|
|
|
|
Tangible assets
|
|
$
|
19,467,600
|
|
|
$
|
19,862,778
|
|
|
$
|
20,716,730
|
|
|
$
|
21,184,854
|
|
|
$
|
21,295,839
|
|
|
|
|
|
|
|
|
|
|
|
|
|
|
|
|
|
|
|
Common shares outstanding
|
|
|
191,626
|
|
|
|
198,701
|
|
|
|
201,827
|
|
|
|
206,496
|
|
|
|
210,649
|
|
|
|
|
|
|
|
|
|
|
|
|
|
|
|
|
|
|
|
Tangible common equity ratio
|
|
|
7.67
|
%
|
|
|
8.63
|
%
|
|
|
9.81
|
%
|
|
|
9.87
|
%
|
|
|
9.84
|
%
|
|
Tangible book value per common share
|
|
$
|
7.80
|
|
|
$
|
8.63
|
|
|
$
|
10.07
|
|
|
$
|
10.12
|
|
|
$
|
9.94
|
|
|
|
|
|
|
|
|
|
|
|
|
|
|
|
|
|
|
Exposure to Puerto Rico Government
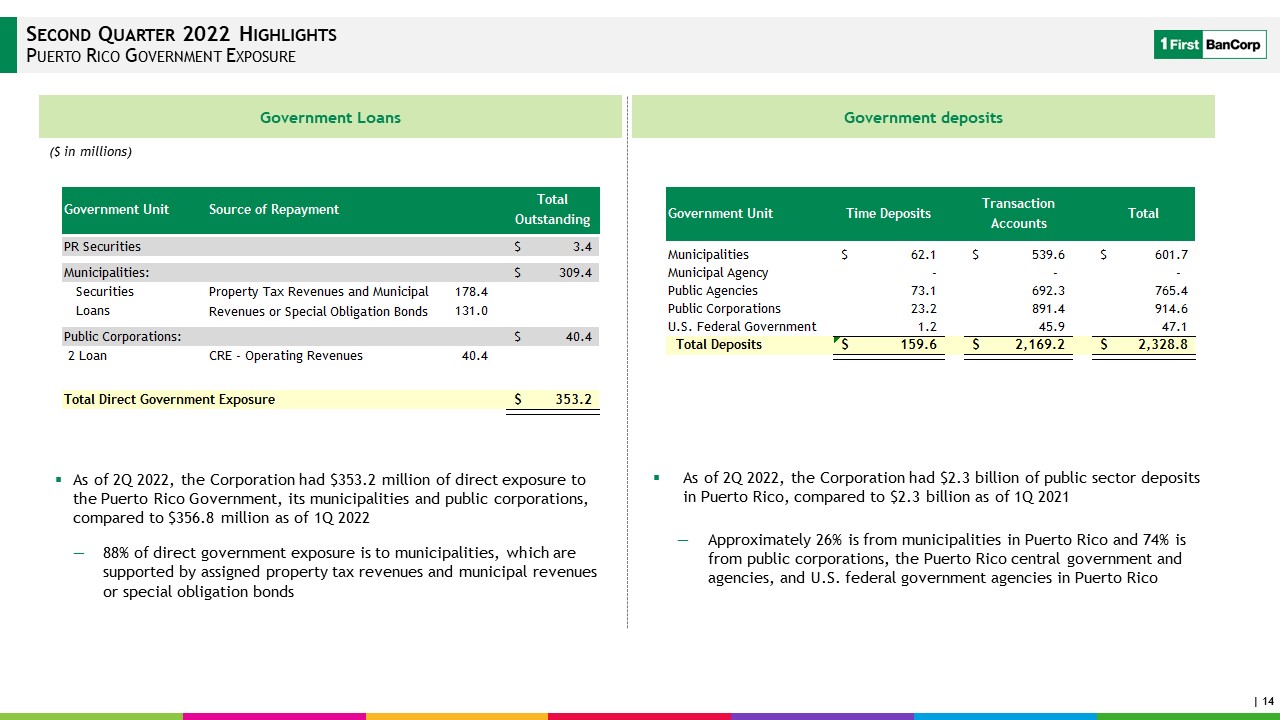
As of June 30, 2022, the Corporation had $353.2 million of direct exposure to the Puerto Rico government, its municipalities and public corporations, compared to $356.8 million as of March 31, 2022. As of June 30, 2022, approximately $187.6
million of the exposure consisted of loans and obligations of municipalities in Puerto Rico that are supported by assigned property tax revenues and for which, in most cases, the good faith, credit and unlimited taxing power of the applicable
municipality have been pledged to their repayment, and $121.8 million consisted of municipal revenue or special obligation bonds. The Corporation’s total direct exposure to the Puerto Rico government also included $11.7 million in loans
extended to an affiliate of a public corporation, $28.7 million in loans to an agency of the Puerto Rico central government, and obligations of the Puerto Rico government, specifically a residential pass-through MBS issued by the PRHFA, at an
amortized cost of $3.4 million (fair value of $2.8 million as of June 30, 2022), included as part of the Corporation’s available-for-sale debt securities portfolio. This residential pass-through MBS issued by the PRHFA is collateralized by
certain second mortgages and had an unrealized loss of $0.6 million as of June 30, 2022, of which $0.4 million is due to credit deterioration.
The aforementioned exposure to municipalities in Puerto Rico included $178.4 million of financing arrangements with Puerto Rico municipalities that were issued in bond form but underwritten as loans with features that are typically found in
commercial loans. These bonds are accounted for as held-to-maturity debt securities. As of June 30, 2022, the ACL for these securities was $8.9 million, compared to $12.3 million as of March 31, 2022.
As of each June 30, 2022 and March 31, 2022, the Corporation had $2.3 billion of public sector deposits in Puerto Rico. Approximately 26% of the public sector deposits as of June 30, 2022, was from municipalities and municipal agencies in
Puerto Rico and 74% was from public corporations, the Puerto Rico central government and agencies, and U.S. federal government agencies in Puerto Rico.
Conference Call / Webcast Information
First BanCorp.’s senior management will host an earnings conference call and live webcast on Friday, July 22, 2022, at 10:00 a.m. (Eastern Time). The call may be accessed via a live Internet webcast through the investor relations section of
the Corporation’s web site: fbpinvestor.com or through a dial-in telephone number at (844) 200-6205 or (929) 526–1599 for international callers. The participant access code is 030860. The Corporation recommends that listeners go to the web site
at least 15 minutes prior to the call to download and install any necessary software. Following the webcast presentation, a question and answer session will be made available to research analysts and institutional investors. A replay of the
webcast will be archived in the investor relations section of First BanCorp.’s website, fbpinvestor.com, until July 22, 2023. A telephone replay will be available one hour after the end of the conference call through August 19, 2022 at (929)
458-6194 or (866) 813-9403 for international callers. The replay access code is 577598.
Safe Harbor
This press release may contain “forward-looking statements” concerning the Corporation’s future economic, operational and financial performance. The words or phrases “expect,” “anticipate,” “intend,” “should,” “would,” “will,” “plans,”
“forecast,” “believe” and similar expressions are meant to identify “forward-looking statements” within the meaning of Section 27A of the Securities Act of 1933, as amended, and Section 21E of the Securities Exchange Act of 1934, as amended,
and are subject to the safe harbor created by such sections. The Corporation cautions readers not to place undue reliance on any such forward-looking statements, which speak only as of the date hereof, and advises readers that any such
forward-looking statements are not guarantees of future performance and involve certain risks, uncertainties, estimates and assumptions by us that are difficult to predict.
Various factors, some of which are beyond our control, including, but not limited to, the uncertainties more fully discussed in Part I, Item 1A, “Risk Factors of the Corporation’s Annual Report on Form 10-K for the year ended December 31,
2021 and the following, could cause actual results to differ materially from those expressed in, or implied by, such forward-looking statements: the impact of rising interest rates and inflation on the Corporation, including a decrease in
demand for new mortgage loan originations and refinancings, increased competition for borrowers, and increase in non-interest expenses which would have an impact on the Corporation’s margins and may have an adverse impact on origination volumes
and financial performance; uncertainties relating to the impact of the COVID-19 pandemic, including new variants and mutations of the virus, such as the Omicron variant, and the efficacy and acceptance of various vaccines and treatments for the
disease, on the Corporation’s business, operations, employees, credit quality, financial condition and net income, including because of uncertainties as to the extent and duration of the pandemic and the impact of the pandemic on consumer
spending, borrowing and saving habits, the underemployment and unemployment rates, which can adversely affect repayment patterns, the Puerto Rico economy and the global economy, as well as the risk that the COVID-19 pandemic may exacerbate any
other factor that could cause our actual results to differ materially from those expressed in or implied by any forward-looking statements; risks related to the effect on the Corporation and its customers of governmental, regulatory, or central
bank responses to the COVID-19 pandemic and the Corporation’s participation in any such responses or programs, such as the SBA PPP established by the CARES Act of 2020, as amended, including any judgments, claims, damages, penalties, fines or
reputational damage resulting from claims or challenges against the Corporation by governments, regulators, customers or otherwise, relating to the Corporation’s participation in any such responses or programs; risks, uncertainties and other
factors related to the Corporation’s acquisition of BSPR, including the risk that the Corporation may not realize, either fully or on a timely basis, the cost savings and any other synergies from the acquisition that the Corporation expected,
because of deposit attrition, customer loss and/or revenue loss as a result of unexpected factors or events, including those that are outside of our control, and any future business acquisitions or dispositions; uncertainty as to the ultimate
outcome of the recently approved debt restructuring plan of Puerto Rico (“Plan of Adjustment” or “PoA”) and the 2022 Fiscal Plan for Puerto Rico as certified by the Financial Oversight Management Board for Puerto Rico, or any revisions to it,
on our clients and loan portfolios, and any potential impact from future economic or political developments in Puerto Rico; the impact that a resumption of the slowing economy and increased unemployment or underemployment may have on the
performance of our loan and lease portfolio, the market price of our investment securities, the availability of sources of funding and the demand for our products; uncertainty as to the availability of wholesale funding sources, such as
securities sold under agreements to repurchase, Federal Home Loan Bank (“FHLB”) advances and brokered CDs; the effect of a resumption of deteriorating economic conditions in the real estate markets and the consumer and commercial sectors and
their impact on the credit quality of the Corporation’s loans and other assets, which may contribute to, among other things, higher than targeted levels of non-performing assets, charge-offs and provisions for credit losses, and may subject the
Corporation to further risk from loan defaults and foreclosures; the impact of changes in accounting standards or assumptions in applying those standards, including the continuing impact of the COVID-19 pandemic, or geopolitical concerns, such
as the ongoing conflict in Ukraine, on forecasts of economic variables considered for the determination of the ACL required by the CECL accounting standard; the ability of FirstBank to realize the benefits of its net deferred tax assets; the
ability of FirstBank to generate sufficient cash flow to make dividend payments to the Corporation; adverse changes in general economic conditions in Puerto Rico, the U.S., and the U.S. and British Virgin Islands, including the interest rate
environment, market liquidity, housing absorption rates, real estate prices, and disruptions in the U.S. capital markets, including as a result of the COVID-19 pandemic, which may reduce interest margins, affect funding sources and demand for
all of the Corporation’s products and services, and reduce the Corporation’s revenues and earnings and the value of the Corporation’s assets; uncertainty about the effect of the cessation of the London Interbank Offered Rate, which could
adversely affect the Corporation’s results of operations, cash flows, and liquidity; an adverse change in the Corporation’s ability to attract new clients and retain existing ones; the risk that additional portions of the unrealized losses in
the Corporation’s investment portfolio are determined to be credit-related, resulting in additional charges to the provision for credit losses on the Corporation’s available-for-sale securities portfolio uncertainty about legislative, tax or
regulatory changes that affect financial services companies in Puerto Rico, the U.S., and the U.S. and British Virgin Islands, which could affect the Corporation’s financial condition or performance and could cause the Corporation’s actual
results for future periods to differ materially from prior results and anticipated or projected results; changes in the fiscal and monetary policies and regulations of the U.S. federal government and the Puerto Rico and other governments,
including those determined by the Federal Reserve Board, the Federal Reserve Bank of New York, the Federal Deposit Insurance Corporation (the “FDIC”), government-sponsored housing agencies, and regulators in Puerto Rico and the U.S. and British
Virgin Islands; the risk of possible failure or circumvention of the Corporation’s internal controls and procedures and the risk that the Corporation’s risk management policies may not be adequate; the Corporation’s ability to identify and
prevent cyber-security incidents, such as data security breaches, ransomware, malware, “denial of service” attacks, “hacking”, identity theft and state-sponsored cyberthreats, and the occurrence of any of which may result in misuse or
misappropriation of confidential or proprietary information and could result in the disruption or damage to our systems, increased costs and losses or an adverse effect to our reputation; the risk that the FDIC may increase the deposit
insurance premium and/or require special assessments to replenish its insurance fund, causing an additional increase in the Corporation’s non-interest expenses; a need to recognize impairments on the Corporation’s financial instruments,
goodwill and other intangible assets relating to business acquisitions, including as a result of the COVID-19 pandemic; the risk that the impact of the occurrence of any of these uncertainties on the Corporation’s capital would preclude further
growth of FirstBank and preclude the Corporation’s Board of Directors from declaring dividends; uncertainty as to whether FirstBank will be able to continue to satisfy its regulators regarding, among other things, its asset quality, liquidity
plans, maintenance of capital levels and compliance with applicable laws, regulations, and related requirements; and general competitive factors and industry consolidation. The Corporation does not undertake, and specifically disclaims any
obligation to update any “forward-looking statements” to reflect occurrences or unanticipated events or circumstances after the date of such statements, except as required by federal securities laws.
Basis of Presentation
Use of Non-GAAP Financial Measures
This press release contains GAAP financial measures and non-GAAP financial measures. Non-GAAP financial measures are used when management believes them to be helpful to an investor’s understanding of the Corporation’s results of operations or
financial position. Where non-GAAP financial measures are used, the most comparable GAAP financial measure, as well as the reconciliation of the non-GAAP financial measure to the most comparable GAAP financial measure, can be found in the text
or in the tables in or attached to this press release. Any analysis of these non-GAAP financial measures should be used only in conjunction with results presented in accordance with GAAP.
Tangible Common Equity Ratio and Tangible Book Value per Common Share
The tangible common equity ratio and tangible book value per common share are non-GAAP financial measures that management believes are generally used by the financial community to evaluate capital adequacy. Tangible common equity is total
equity less preferred equity, goodwill, and other intangibles. Tangible assets are total assets less goodwill and other intangibles. Management uses and believes that many stock analysts use the tangible common equity ratio and tangible book
value per common share in conjunction with other more traditional bank capital ratios to compare the capital adequacy of banking organizations with significant amounts of goodwill or other intangible assets, typically stemming from the use of
the purchase method of accounting for mergers and acquisitions. Accordingly, the Corporation believes that disclosure of these financial measures may be useful to investors. Neither tangible common equity nor tangible assets, or the related
measures, should be considered in isolation or as a substitute for stockholders’ equity, total assets, or any other measure calculated in accordance with GAAP. Moreover, the manner in which the Corporation calculates its tangible common equity,
tangible assets, and any other related measures may differ from that of other companies reporting measures with similar names.
Adjusted Pre-Tax, Pre-Provision Income
Adjusted pre-tax, pre-provision income is a non-GAAP performance metric that management uses and believes that investors may find useful in analyzing underlying performance trends, particularly in times of economic stress, including as a
result of natural catastrophes or health epidemics, such as the COVID-19 pandemic. Adjusted pre-tax, pre-provision income, as defined by management, represents income before income taxes adjusted to exclude the provisions for credit losses on
loans, finance leases and debt securities and any gains or losses on sales of investment securities. In addition, from time to time, earnings are also adjusted for certain items regarded as Special Items, such as merger and restructuring costs
in connection with the acquisition of BSPR and related integration and restructuring efforts, and costs incurred in connection with the COVID-19 pandemic response efforts, because management believes these items are not reflective of core
operating performance, are not expected to reoccur with any regularity or may reoccur at uncertain times and in uncertain amounts.
Net Interest Income, Excluding Valuations, and on a Tax-Equivalent Basis
Net interest income, interest rate spread, and net interest margin are reported excluding the changes in the fair value of derivative instruments and on a tax-equivalent basis in order to provide to investors additional information about the
Corporation’s net interest income that management uses and believes should facilitate comparability and analysis of the periods presented. The changes in the fair value of derivative instruments have no effect on interest due or interest earned
on interest-bearing liabilities or interest-earning assets, respectively. The tax-equivalent adjustment to net interest income recognizes the income tax savings when comparing taxable and tax-exempt assets and assumes a marginal income tax
rate. Income from tax-exempt earning assets is increased by an amount equivalent to the taxes that would have been paid if this income had been taxable at statutory rates. Management believes that it is a standard practice in the banking
industry to present net interest income, interest rate spread, and net interest margin on a fully tax-equivalent basis. This adjustment puts all earning assets, most notably tax-exempt securities and tax-exempt loans, on a common basis that
management believes facilitates comparison of results to the results of peers.
The following table reconciles net interest income in accordance with GAAP to net interest income excluding valuations, and net interest income on a tax-equivalent basis for the second and first quarters of 2022, the second quarter of 2021
and the six-month period ended June 30, 2022 and 2021, respectively. The table also reconciles net interest spread and net interest margin to these items excluding valuations, and on a tax-equivalent basis.
|
|
|
Quarter Ended
|
|
Six-Month Period Ended
|
|
(Dollars in thousands)
|
|
June 30,2022
|
March 31, 2022
|
June 30,2021
|
|
June 30,2022
|
June 30,2021
|
|
Net Interest Income
|
|
|
|
|
|
|
|
|
|
|
|
|
|
|
|
|
|
|
Interest Income - GAAP
|
|
$
|
208,625
|
|
|
$
|
197,854
|
|
|
$
|
201,459
|
|
|
|
$
|
406,479
|
|
|
$
|
396,101
|
|
|
|
Unrealized (gain) loss on derivative instruments
|
|
|
(9
|
)
|
|
|
(15
|
)
|
|
|
7
|
|
|
|
|
(24
|
)
|
|
|
(18
|
)
|
|
|
Interest income excluding valuations
|
|
|
208,616
|
|
|
|
197,839
|
|
|
|
201,466
|
|
|
|
|
406,455
|
|
|
|
396,083
|
|
|
|
Tax-equivalent adjustment
|
|
|
9,389
|
|
|
|
7,219
|
|
|
|
6,129
|
|
|
|
|
16,608
|
|
|
|
10,681
|
|
|
|
Interest income on a tax-equivalent basis and excluding valuations
|
|
$
|
218,005
|
|
|
$
|
205,058
|
|
|
$
|
207,595
|
|
|
|
$
|
423,063
|
|
|
$
|
406,764
|
|
|
|
|
|
|
|
|
|
|
|
|
|
|
|
|
|
|
|
|
|
|
Interest Expense - GAAP
|
|
$
|
12,439
|
|
|
$
|
12,230
|
|
|
$
|
16,676
|
|
|
|
$
|
24,669
|
|
|
$
|
35,053
|
|
|
|
|
|
|
|
|
|
|
|
|
|
|
|
|
|
|
|
|
|
|
Net interest income - GAAP
|
|
$
|
196,186
|
|
|
$
|
185,624
|
|
|
$
|
184,783
|
|
|
|
$
|
381,810
|
|
|
$
|
361,048
|
|
|
|
|
|
|
|
|
|
|
|
|
|
|
|
|
|
|
|
|
|
|
Net interest income excluding valuations
|
|
$
|
196,177
|
|
|
$
|
185,609
|
|
|
$
|
184,790
|
|
|
|
$
|
381,786
|
|
|
$
|
361,030
|
|
|
|
|
|
|
|
|
|
|
|
|
|
|
|
|
|
|
|
|
|
|
Net interest income on a tax-equivalent basis and excluding valuations
|
|
$
|
205,566
|
|
|
$
|
192,828
|
|
|
$
|
190,919
|
|
|
|
$
|
398,394
|
|
|
$
|
371,711
|
|
|
|
|
|
|
|
|
|
|
|
|
|
|
|
|
|
|
|
|
|
|
Average Balances
|
|
|
|
|
|
|
|
|
|
|
|
|
|
|
|
|
|
|
Loans and leases
|
|
$
|
11,102,310
|
|
|
$
|
11,106,855
|
|
|
$
|
11,560,731
|
|
|
|
$
|
11,104,571
|
|
|
$
|
11,663,924
|
|
|
|
Total securities, other short-term investments and interest-bearing cash balances
|
|
|
8,568,022
|
|
|
|
8,647,087
|
|
|
|
7,898,975
|
|
|
|
|
8,607,337
|
|
|
|
7,208,803
|
|
|
|
Average Interest-Earning Assets
|
|
$
|
19,670,332
|
|
|
$
|
19,753,942
|
|
|
$
|
19,459,706
|
|
|
|
$
|
19,711,908
|
|
|
$
|
18,872,727
|
|
|
|
Average Interest-Bearing Liabilities
|
|
$
|
11,567,228
|
|
|
$
|
11,211,780
|
|
|
$
|
12,118,631
|
|
|
|
$
|
11,390,486
|
|
|
$
|
11,967,743
|
|
|
|
|
|
|
|
|
|
|
|
|
|
|
|
|
|
|
|
|
|
|
Average Yield/Rate
|
|
|
|
|
|
|
|
|
|
|
|
|
|
|
|
|
|
|
Average yield on interest-earning assets - GAAP
|
|
|
4.25
|
%
|
|
|
4.06
|
%
|
|
|
4.15
|
%
|
|
|
|
4.16
|
%
|
|
|
4.23
|
%
|
|
|
Average rate on interest-bearing liabilities - GAAP
|
|
|
0.43
|
%
|
|
|
0.44
|
%
|
|
|
0.55
|
%
|
|
|
|
0.44
|
%
|
|
|
0.59
|
%
|
|
|
Net interest spread - GAAP
|
|
|
3.82
|
%
|
|
|
3.62
|
%
|
|
|
3.60
|
%
|
|
|
|
3.72
|
%
|
|
|
3.64
|
%
|
|
|
Net interest margin - GAAP
|
|
|
4.00
|
%
|
|
|
3.81
|
%
|
|
|
3.81
|
%
|
|
|
|
3.91
|
%
|
|
|
3.86
|
%
|
|
|
|
|
|
|
|
|
|
|
|
|
|
|
|
|
|
|
|
|
|
Average yield on interest-earning assets excluding valuations
|
|
|
4.25
|
%
|
|
|
4.06
|
%
|
|
|
4.15
|
%
|
|
|
|
4.16
|
%
|
|
|
4.23
|
%
|
|
|
Average rate on interest-bearing liabilities excluding valuations
|
|
|
0.43
|
%
|
|
|
0.44
|
%
|
|
|
0.55
|
%
|
|
|
|
0.44
|
%
|
|
|
0.59
|
%
|
|
|
Net interest spread excluding valuations
|
|
|
3.82
|
%
|
|
|
3.62
|
%
|
|
|
3.60
|
%
|
|
|
|
3.72
|
%
|
|
|
3.64
|
%
|
|
|
Net interest margin excluding valuations
|
|
|
4.00
|
%
|
|
|
3.81
|
%
|
|
|
3.81
|
%
|
|
|
|
3.91
|
%
|
|
|
3.86
|
%
|
|
|
|
|
|
|
|
|
|
|
|
|
|
|
|
|
|
|
|
|
|
Average yield on interest-earning assets on a tax-equivalent basis
|
|
|
|
|
|
|
|
|
|
|
|
|
|
|
|
|
|
|
and excluding valuations
|
|
|
4.45
|
%
|
|
|
4.21
|
%
|
|
|
4.28
|
%
|
|
|
|
4.33
|
%
|
|
|
4.35
|
%
|
|
|
Average rate on interest-bearing liabilities
|
|
|
0.43
|
%
|
|
|
0.44
|
%
|
|
|
0.55
|
%
|
|
|
|
0.44
|
%
|
|
|
0.59
|
%
|
|
|
Net interest spread on a tax-equivalent basis and excluding valuations
|
|
|
4.01
|
%
|
|
|
3.77
|
%
|
|
|
3.73
|
%
|
|
|
|
3.89
|
%
|
|
|
3.76
|
%
|
|
|
Net interest margin on a tax-equivalent basis and excluding valuations
|
|
|
4.19
|
%
|
|
|
3.96
|
%
|
|
|
3.94
|
%
|
|
|
|
4.08
|
%
|
|
|
3.97
|
%
|
|
Financial measures adjusted to exclude the effect of Special Items that management believes are not reflective of core operating performance, are not expected to reoccur with any regularity or may reoccur at uncertain times and in
uncertain amounts.
To supplement the Corporation’s financial statements presented in accordance with GAAP, the Corporation uses, and believes that investors would benefit from disclosure of, non-GAAP financial measures that reflect adjustments to net income to
exclude items that management identifies as Special Items because management believes they are not reflective of core operating performance, are not expected to reoccur with any regularity or may reoccur at uncertain times and in uncertain
amounts.
- Adjusted net income – The adjusted net income amount for the second quarter of 2021 reflects the following exclusions:
- Merger and restructuring costs of $11.0 million related to transaction costs and restructuring initiatives in connection with the acquisition of BSPR.
- COVID-19 pandemic-related expenses of $1.1 million.
- The tax-related effects of all of the pre-tax items mentioned in the above bullets as follows:
- Tax benefit of $4.1 million related to merger and restructuring costs in connection with the acquisition of BSPR (calculated based on the statutory tax rate of 37.5%).
- Tax benefit of $0.4 million in connection with COVID-19 pandemic-related expenses (calculated based on the statutory tax rate of 37.5%).
Management believes that the presentation of adjusted net income enhances the ability of analysts and investors to analyze trends in the Corporation’s business and understand the performance of the Corporation. In addition, the Corporation
may utilize these non-GAAP financial measures as guides in its budgeting and long-term planning process.
|
FIRST BANCORP
|
|
CONDENSED CONSOLIDATED STATEMENTS OF FINANCIAL CONDITION
|
|
|
|
|
|
|
|
|
|
|
|
|
|
|
As of
|
|
|
|
June 30, 2022
|
|
March 31, 2022
|
|
December 31, 2021
|
|
(In thousands, except for share information)
|
|
|
|
|
|
|
|
|
|
|
ASSETS
|
|
|
|
|
|
|
|
|
|
|
Cash and due from banks
|
|
$
|
1,261,590
|
|
|
$
|
1,694,066
|
|
|
$
|
2,540,376
|
|
|
Money market investments:
|
|
|
|
|
|
|
|
|
|
|
Time deposits with other financial institutions
|
|
|
300
|
|
|
|
300
|
|
|
|
300
|
|
|
Other short-term investments
|
|
|
1,633
|
|
|
|
1,883
|
|
|
|
2,382
|
|
|
Total money market investments
|
|
|
1,933
|
|
|
|
2,183
|
|
|
|
2,682
|
|
|
Investment securities available for sale, at fair value (ACL of $676 as of June 30, 2022; $711 as of March 31, 2022; $1,105 as of December 31, 2021)
|
|
|
6,081,120
|
|
|
|
6,424,660
|
|
|
|
6,453,761
|
|
|
Investment securities held to maturity, at amortized cost, net of ACL of $8,885 as of June 30, 2022, $12,324 as of March 31, 2022, and $8,571 as of December 31, 2021
|
|
|
449,342
|
|
|
|
165,735
|
|
|
|
169,562
|
|
|
Equity securities
|
|
|
32,843
|
|
|
|
32,014
|
|
|
|
32,169
|
|
|
Total investment securities
|
|
|
6,563,305
|
|
|
|
6,622,409
|
|
|
|
6,655,492
|
|
|
Loans, net of ACL (June 30, 2022 - $252,152; March 31, 2022 - $245,447; December 31, 2021 - $269,030)
|
|
|
10,954,722
|
|
|
|
10,852,258
|
|
|
|
10,791,628
|
|
|
Loans held for sale, at lower of cost or market
|
|
|
22,601
|
|
|
|
27,905
|
|
|
|
35,155
|
|
|
Total loans, net
|
|
|
10,977,323
|
|
|
|
10,880,163
|
|
|
|
10,826,783
|
|
|
Premises and equipment, net
|
|
|
145,395
|
|
|
|
145,850
|
|
|
|
146,417
|
|
|
OREO
|
|
|
41,706
|
|
|
|
42,894
|
|
|
|
40,848
|
|
|
Accrued interest receivable on loans and investments
|
|
|
62,501
|
|
|
|
57,425
|
|
|
|
61,507
|
|
|
Deferred tax asset, net
|
|
|
166,999
|
|
|
|
176,775
|
|
|
|
208,482
|
|
|
Goodwill
|
|
|
38,611
|
|
|
|
38,611
|
|
|
|
38,611
|
|
|
Intangible assets
|
|
|
25,424
|
|
|
|
27,648
|
|
|
|
29,934
|
|
|
Other assets
|
|
|
246,848
|
|
|
|
241,013
|
|
|
|
234,143
|
|
|
Total assets
|
|
$
|
19,531,635
|
|
|
$
|
19,929,037
|
|
|
$
|
20,785,275
|
|
|
LIABILITIES
|
|
|
|
|
|
|
|
|
|
|
Deposits:
|
|
|
|
|
|
|
|
|
|
|
Non-interest-bearing deposits
|
|
$
|
6,286,922
|
|
|
$
|
6,344,385
|
|
|
$
|
7,027,513
|
|
|
Interest-bearing deposits
|
|
|
10,853,206
|
|
|
|
10,991,018
|
|
|
|
10,757,381
|
|
|
Total deposits
|
|
|
17,140,128
|
|
|
|
17,335,403
|
|
|
|
17,784,894
|
|
|
Securities sold under agreements to repurchase
|
|
|
200,000
|
|
|
|
200,000
|
|
|
|
300,000
|
|
|
Advances from the FHLB
|
|
|
200,000
|
|
|
|
200,000
|
|
|
|
200,000
|
|
|
Other borrowings
|
|
|
183,762
|
|
|
|
183,762
|
|
|
|
183,762
|
|
|
Accounts payable and other liabilities
|
|
|
249,829
|
|
|
|
228,770
|
|
|
|
214,852
|
|
|
Total liabilities
|
|
|
17,973,719
|
|
|
|
18,147,935
|
|
|
|
18,683,508
|
|
|
STOCKHOLDERSʼ EQUITY
|
|
|
|
|
|
|
|
|
|
|
Common stock, $0.10 par value, authorized, 2,000,000,000 shares; 223,663,116 shares issued
|
|
|
22,366
|
|
|
|
22,366
|
|
|
|
22,366
|
|
|
Less: Treasury stock (at par value)
|
|
|
(3,203
|
)
|
|
|
(2,496
|
)
|
|
|
(2,183
|
)
|
|
Common stock outstanding (June 30, 2022 - 191,626,336; March 31, 2022 - 198,700,871;
|
|
|
19,163
|
|
|
|
19,870
|
|
|
|
20,183
|
|
|
December 31, 2021 - 201,826,505)
|
|
|
|
|
|
|
|
|
|
|
Additional paid-in capital
|
|
|
589,175
|
|
|
|
687,070
|
|
|
|
738,288
|
|
|
Retained earnings
|
|
|
1,541,334
|
|
|
|
1,489,995
|
|
|
|
1,427,295
|
|
|
Accumulated other comprehensive loss
|
|
|
(591,756
|
)
|
|
|
(415,833
|
)
|
|
|
(83,999
|
)
|
|
Total stockholdersʼ equity
|
|
|
1,557,916
|
|
|
|
1,781,102
|
|
|
|
2,101,767
|
|
|
Total liabilities and stockholdersʼ equity
|
|
$
|
19,531,635
|
|
|
$
|
19,929,037
|
|
|
$
|
20,785,275
|
|
|
|
|
|
|
|
|
|
|
|
|
|
FIRST BANCORP
|
|
CONDENSED CONSOLIDATED STATEMENTS OF INCOME
|
|
|
|
|
|
|
|
|
|
|
|
|
|
|
|
|
|
|
|
|
Quarter Ended
|
|
Six-Month Period Ended
|
|
|
|
June 30, 2022
|
|
March 31, 2022
|
|
June 30, 2021
|
|
June 30, 2022
|
|
June 30, 2021
|
|
(In thousands, except per share information)
|
|
|
|
|
|
|
|
|
|
|
|
|
|
|
|
|
Net interest income:
|
|
|
|
|
|
|
|
|
|
|
|
|
|
|
|
|
Interest income
|
|
$
|
208,625
|
|
|
$
|
197,854
|
|
|
$
|
201,459
|
|
|
$
|
406,479
|
|
|
$
|
396,101
|
|
|
Interest expense
|
|
|
12,439
|
|
|
|
12,230
|
|
|
|
16,676
|
|
|
|
24,669
|
|
|
|
35,053
|
|
|
Net interest income
|
|
|
196,186
|
|
|
|
185,624
|
|
|
|
184,783
|
|
|
|
381,810
|
|
|
|
361,048
|
|
|
Provision for credit losses - expense (benefit):
|
|
|
|
|
|
|
|
|
|
|
|
|
|
|
|
|
Loans
|
|
|
12,665
|
|
|
|
(16,989
|
)
|
|
|
(26,302
|
)
|
|
|
(4,324
|
)
|
|
|
(40,745
|
)
|
|
Unfunded loan commitments
|
|
|
812
|
|
|
|
(178
|
)
|
|
|
(1,669
|
)
|
|
|
634
|
|
|
|
(2,375
|
)
|
|
Debt securities
|
|
|
(3,474
|
)
|
|
|
3,365
|
|
|
|
1,816
|
|
|
|
(109
|
)
|
|
|
1,713
|
|
|
Provision for credit losses - expense (benefit)
|
|
10,003
|
|
|
(13,802
|
)
|
|
(26,155
|
)
|
|
(3,799
|
)
|
|
(41,407
|
)
|
|
Net interest income after provision for credit losses
|
|
186,183
|
|
|
199,426
|
|
|
210,938
|
|
|
385,609
|
|
|
402,455
|
|
|
|
|
|
|
|
|
|
|
|
|
|
|
|
|
|
|
|
Non-interest income:
|
|
|
|
|
|
|
|
|
|
|
|
|
|
|
|
|
Service charges and fees on deposit accounts
|
|
|
9,466
|
|
|
|
9,363
|
|
|
|
8,788
|
|
|
|
18,829
|
|
|
|
17,092
|
|
|
Mortgage banking activities
|
|
|
4,082
|
|
|
|
5,206
|
|
|
|
6,404
|
|
|
|
9,288
|
|
|
|
13,677
|
|
|
Other non-interest income
|
|
|
17,393
|
|
|
|
18,289
|
|
|
|
14,692
|
|
|
|
35,682
|
|
|
|
30,071
|
|
|
Total non-interest income
|
|
30,941
|
|
|
32,858
|
|
|
29,884
|
|
|
63,799
|
|
|
60,840
|
|
|
|
|
|
|
|
|
|
|
|
|
|
|
|
|
|
|
|
Non-interest expenses:
|
|
|
|
|
|
|
|
|
|
|
|
|
|
|
|
|
Employees’ compensation and benefits
|
|
|
51,304
|
|
|
|
49,554
|
|
|
|
49,714
|
|
|
|
100,858
|
|
|
|
100,556
|
|
|
Occupancy and equipment
|
|
|
21,505
|
|
|
|
22,386
|
|
|
|
24,116
|
|
|
|
43,891
|
|
|
|
48,358
|
|
|
Business promotion
|
|
|
4,042
|
|
|
|
3,463
|
|
|
|
3,225
|
|
|
|
7,505
|
|
|
|
6,195
|
|
|
Professional service fees
|
|
|
12,036
|
|
|
|
10,594
|
|
|
|
16,764
|
|
|
|
22,630
|
|
|
|
34,465
|
|
|
Taxes, other than income taxes
|
|
|
4,689
|
|
|
|
5,018
|
|
|
|
5,576
|
|
|
|
9,707
|
|
|
|
11,775
|
|
|
Insurance and supervisory fees
|
|
|
3,769
|
|
|
|
3,908
|
|
|
|
4,282
|
|
|
|
7,677
|
|
|
|
8,632
|
|
|
Net (gain) loss on OREO operations
|
|
|
(1,485
|
)
|
|
|
(720
|
)
|
|
|
(139
|
)
|
|
|
(2,205
|
)
|
|
|
1,759
|
|
|
Merger and restructuring costs
|
|
|
-
|
|
|
|
-
|
|
|
|
11,047
|
|
|
|
-
|
|
|
|
22,314
|
|
|
Other non-interest expenses
|
|
|
12,466
|
|
|
|
12,456
|
|
|
|
15,587
|
|
|
|
24,922
|
|
|
|
29,419
|
|
|
Total non-interest expenses
|
|
108,326
|
|
|
106,659
|
|
|
130,172
|
|
|
214,985
|
|
|
263,473
|
|
|
|
|
|
|
|
|
|
|
|
|
|
|
|
|
|
|
|
Income before income taxes
|
|
|
108,798
|
|
|
|
125,625
|
|
|
|
110,650
|
|
|
|
234,423
|
|
|
|
199,822
|
|
|
Income tax expense
|
|
|
(34,103
|
)
|
|
|
(43,025
|
)
|
|
|
(40,092
|
)
|
|
|
(77,128
|
)
|
|
|
(68,114
|
)
|
|
|
|
|
|
|
|
|
|
|
|
|
|
|
|
|
|
|
Net income
|
|
$
|
74,695
|
|
|
$
|
82,600
|
|
|
$
|
70,558
|
|
|
$
|
157,295
|
|
|
$
|
131,708
|
|
|
|
|
|
|
|
|
|
|
|
|
|
|
|
|
|
|
|
Net income attributable to common stockholders
|
|
$
|
74,695
|
|
|
$
|
82,600
|
|
|
$
|
69,889
|
|
|
$
|
157,295
|
|
|
$
|
130,370
|
|
|
|
|
|
|
|
|
|
|
|
|
|
|
|
|
|
|
|
Earnings per common share:
|
|
|
|
|
|
|
|
|
|
|
|
|
|
|
|
|
Basic
|
|
$
|
0.38
|
|
|
$
|
0.42
|
|
|
$
|
0.33
|
|
|
$
|
0.80
|
|
|
$
|
0.61
|
|
|
Diluted
|
|
$
|
0.38
|
|
|
$
|
0.41
|
|
|
$
|
0.33
|
|
|
$
|
0.80
|
|
|
$
|
0.60
|
|
About First BanCorp.
First BanCorp. is the parent corporation of FirstBank Puerto Rico, a state-chartered commercial bank with operations in Puerto Rico, the U.S. and the British Virgin Islands and Florida, and of FirstBank Insurance Agency. Among the
subsidiaries of FirstBank Puerto Rico are First Federal Finance Corp. and First Express, both small loan companies. First BanCorp.’s shares of common stock trade on the New York Stock Exchange under the symbol FBP. Additional information about
First BanCorp. may be found at www.1firstbank.com.
EXHIBIT A
|
Table 1 – Selected Financial Data
|
|
|
|
|
|
|
|
|
|
|
|
|
Quarter ended
|
|
Six-Month Period Ended
|
|
(Shares in thousands)
|
|
June 30, 2022
|
|
March 31, 2022
|
|
June 30, 2021
|
|
June 30, 2022
|
|
June 30, 2021
|
|
Selected Financial Ratios (In Percent):
|
|
|
|
|
|
|
|
|
|
|
|
|
|
|
|
|
Per Common Share Results:
|
|
|
|
|
|
|
|
|
|
|
|
|
|
|
|
|
Net earnings per share - basic
|
|
$
|
0.38
|
|
$
|
0.42
|
|
|
$
|
0.33
|
|
|
$
|
0.80
|
|
|
$
|
0.61
|
|
|
Net earnings per share - diluted
|
|
$
|
0.38
|
|
$
|
0.41
|
|
|
$
|
0.33
|
|
|
$
|
0.80
|
|
|
$
|
0.60
|
|
|
Cash dividends declared
|
|
$
|
0.12
|
|
$
|
0.10
|
|
|
$
|
0.07
|
|
|
$
|
0.22
|
|
|
$
|
0.14
|
|
|
Average shares outstanding
|
|
|
194,405
|
|
|
198,130
|
|
|
|
213,574
|
|
|
|
196,257
|
|
|
|
215,294
|
|
|
Average shares outstanding diluted
|
|
|
195,366
|
|
|
199,537
|
|
|
|
214,609
|
|
|
|
197,441
|
|
|
|
216,433
|
|
|
Book value per common share
|
|
$
|
8.13
|
|
$
|
8.96
|
|
|
$
|
10.30
|
|
|
$
|
8.13
|
|
|
$
|
10.30
|
|
|
Tangible book value per common share (1)
|
|
$
|
7.80
|
|
$
|
8.63
|
|
|
$
|
9.94
|
|
|
$
|
7.80
|
|
|
$
|
9.94
|
|
|
Profitability:
|
|
|
|
|
|
|
|
|
|
|
|
|
|
|
|
|
Return on Average Assets
|
|
|
1.52
|
|
|
1.65
|
|
|
|
1.40
|
|
|
|
1.59
|
|
|
|
1.35
|
|
|
Interest Rate Spread (2)
|
|
|
4.01
|
|
|
3.77
|
|
|
|
3.73
|
|
|
|
3.89
|
|
|
|
3.76
|
|
|
Net Interest Margin (2)
|
|
|
4.19
|
|
|
3.96
|
|
|
|
3.94
|
|
|
|
4.08
|
|
|
|
3.97
|
|
|
Return on Average Total Equity
|
|
|
17.82
|
|
|
16.64
|
|
|
|
12.60
|
|
|
|
17.18
|
|
|
|
11.71
|
|
|
Return on Average Common Equity
|
|
|
17.82
|
|
|
16.64
|
|
|
|
12.68
|
|
|
|
17.18
|
|
|
|
11.77
|
|
|
Average Total Equity to Average Total Assets
|
|
|
8.52
|
|
|
9.94
|
|
|
|
11.13
|
|
|
|
9.24
|
|
|
|
11.55
|
|
|
Total capital
|
|
|
19.98
|
|
|
20.44
|
|
|
|
20.38
|
|
|
|
19.98
|
|
|
|
20.38
|
|
|
Common equity Tier 1 capital
|
|
|
17.23
|
|
|
17.71
|
|
|
|
17.34
|
|
|
|
17.23
|
|
|
|
17.34
|
|
|
Tier 1 capital
|
|
|
17.23
|
|
|
17.71
|
|
|
|
17.64
|
|
|
|
17.23
|
|
|
|
17.64
|
|
|
Leverage
|
|
|
10.18
|
|
|
10.35
|
|
|
|
10.51
|
|
|
|
10.18
|
|
|
|
10.51
|
|
|
Tangible common equity ratio (1)
|
|
|
7.67
|
|
|
8.63
|
|
|
|
9.84
|
|
|
|
7.67
|
|
|
|
9.84
|
|
|
Dividend payout ratio
|
|
|
31.23
|
|
|
23.81
|
|
|
|
21.39
|
|
|
|
27.45
|
|
|
|
23.12
|
|
|
Efficiency ratio (3)
|
|
|
47.69
|
|
|
48.82
|
|
|
|
60.64
|
|
|
|
48.25
|
|
|
|
62.45
|
|
|
Asset Quality:
|
|
|
|
|
|
|
|
|
|
|
|
|
|
|
|
|
Allowance for credit losses for loans and finance leases to total loans held for investment
|
|
|
2.25
|
|
|
2.21
|
|
|
|
2.85
|
|
|
|
2.25
|
|
|
|
2.85
|
|
|
Net charge-offs (annualized) to average loans
|
|
|
0.21
|
|
|
0.24
|
|
|
|
0.27
|
|
|
|
0.23
|
|
|
|
0.35
|
|
|
Provision for credit losses for loans and finance leases - expense (benefit) to net charge-offs
|
|
|
212.50
|
|
|
(257.64
|
)
|
|
|
(342.66
|
)
|
|
|
(34.44
|
)
|
|
|
(201.87
|
)
|
|
Non-performing assets to total assets
|
|
|
0.76
|
|
|
0.79
|
|
|
|
1.20
|
|
|
|
0.76
|
|
|
|
1.20
|
|
|
Nonaccrual loans held for investment to total loans held for investment
|
|
|
0.88
|
|
|
0.96
|
|
|
|
1.60
|
|
|
|
0.88
|
|
|
|
1.60
|
|
|
Allowance for credit losses for loans and finance leases to total nonaccrual loans held for investment
|
|
|
254.42
|
|
|
229.33
|
|
|
|
177.91
|
|
|
|
254.42
|
|
|
|
177.91
|
|
|
Allowance for credit losses for loans and finance leases to total nonaccrual loans held for investment, excluding residential estate loans
|
|
|
462.48
|
|
|
421.64
|
|
|
|
533.11
|
|
|
|
462.48
|
|
|
|
533.11
|
|
|
Other Information:
|
|
|
|
|
|
|
|
|
|
|
|
|
|
|
|
|
Common Stock Price: End of period
|
|
$
|
12.91
|
|
$
|
13.12
|
|
|
$
|
11.92
|
|
|
$
|
12.91
|
|
|
$
|
11.92
|
|
|
|
|
|
|
|
|
|
|
|
|
|
|
|
|
|
|
|
(1)
|
Non-GAAP financial measures (as defined above). Refer to Basis of Presentation above for additional information about the components and a reconciliation of these measures.
|
|
(2)
|
On a tax-equivalent basis and excluding changes in the fair value of derivative instruments (Non-GAAP financial measure).
|
|
(3)
|
Non-interest expenses to the sum of net interest income and non-interest income.
|
|
|
Table 2 – Quarterly Statement of Average Interest-Earning Assets and Average Interest-Bearing Liabilities (On a Tax-Equivalent Basis)
|
|
|
|
|
|
|
|
|
|
|
Average Volume
|
|
Interest income (1) / expense
|
|
Average Rate (1)
|
|
Quarter ended
|
|
June 30,
|
|
March 31,
|
|
June 30,
|
|
June 30,
|
|
March 31,
|
|
June 30,
|
|
June 30,
|
|
March 31,
|
|
June 30,
|
|
|
|
2022
|
|
2022
|
|
2021
|
|
2022
|
|
2022
|
|
2021
|
|
2022
|
|
2022
|
|
2021
|
|
(Dollars in thousands)
|
|
|
|
|
|
|
|
|
|
|
|
|
|
|
|
|
|
|
|
|
|
|
|
|
|
Interest-earning assets:
|
|
|
|
|
|
|
|
|
|
|
|
|
|
|
|
|
|
|
|
|
|
|
|
|
|
Money market and other short-term investments
|
|
$
|
1,530,353
|
|
$
|
1,835,766
|
|
$
|
1,741,167
|
|
$
|
2,873
|
|
$
|
820
|
|
$
|
433
|
|
0.75
|
%
|
|
0.18
|
%
|
|
0.10
|
%
|
|
Government obligations (2)
|
|
|
2,922,226
|
|
|
2,736,095
|
|
|
1,895,868
|
|
|
10,090
|
|
|
8,232
|
|
|
6,609
|
|
1.38
|
%
|
|
1.22
|
%
|
|
1.40
|
%
|
|
Mortgage-backed securities
|
|
|
4,081,573
|
|
|
4,041,975
|
|
|
4,222,478
|
|
|
22,804
|
|
|
19,420
|
|
|
14,352
|
|
2.24
|
%
|
|
1.95
|
%
|
|
1.36
|
%
|
|
FHLB stock
|
|
|
21,275
|
|
|
21,465
|
|
|
28,489
|
|
|
251
|
|
|
287
|
|
|
366
|
|
4.73
|
%
|
|
5.42
|
%
|
|
5.15
|
%
|
|
Other investments
|
|
|
12,595
|
|
|
11,786
|
|
|
10,973
|
|
|
12
|
|
|
21
|
|
|
6
|
|
0.38
|
%
|
|
0.72
|
%
|
|
0.22
|
%
|
|
Total investments (3)
|
|
|
8,568,022
|
|
|
8,647,087
|
|
|
7,898,975
|
|
|
36,030
|
|
|
28,780
|
|
|
21,766
|
|
1.69
|
%
|
|
1.35
|
%
|
|
1.11
|
%
|
|
Residential mortgage loans
|
|
|
2,891,403
|
|
|
2,961,456
|
|
|
3,357,114
|
|
|
40,573
|
|
|
40,687
|
|
|
45,627
|
|
5.63
|
%
|
|
5.57
|
%
|
|
5.45
|
%
|
|
Construction loans
|
|
|
124,070
|
|
|
114,732
|
|
|
177,688
|
|
|
1,768
|
|
|
1,524
|
|
|
5,108
|
|
5.72
|
%
|
|
5.39
|
%
|
|
11.53
|
%
|
|
C&I and commercial mortgage loans
|
|
|
5,054,223
|
|
|
5,103,870
|
|
|
5,353,657
|
|
|
64,500
|
|
|
62,004
|
|
|
67,027
|
|
5.12
|
%
|
|
4.93
|
%
|
|
5.02
|
%
|
|
Finance leases
|
|
|
617,399
|
|
|
588,200
|
|
|
501,734
|
|
|
11,410
|
|
|
10,912
|
|
|
9,322
|
|
7.41
|
%
|
|
7.52
|
%
|
|
7.45
|
%
|
|
Consumer loans
|
|
|
2,415,215
|
|
|
2,338,597
|
|
|
2,170,538
|
|
|
63,724
|
|
|
61,151
|
|
|
58,745
|
|
10.58
|
%
|
|
10.60
|
%
|
|
10.86
|
%
|
|
Total loans (4) (5)
|
|
|
11,102,310
|
|
|
11,106,855
|
|
|
11,560,731
|
|
|
181,975
|
|
|
176,278
|
|
|
185,829
|
|
6.57
|
%
|
|
6.44
|
%
|
|
6.45
|
%
|
|
Total interest-earning assets
|
|
$
|
19,670,332
|
|
$
|
19,753,942
|
|
$
|
19,459,706
|
|
$
|
218,005
|
|
$
|
205,058
|
|
$
|
207,595
|
|
4.45
|
%
|
|
4.21
|
%
|
|
4.28
|
%
|
|
|
|
|
|
|
|
|
|
|
|
|
|
|
|
|
|
|
|
|
|
|
|
|
|
|
|
Interest-bearing liabilities:
|
|
|
|
|
|
|
|
|
|
|
|
|
|
|
|
|
|
|
|
|
|
|
|
|
|
Brokered certificates of deposit (“CDs”)
|
|
$
|
76,790
|
|
$
|
91,713
|
|
$
|
146,912
|
|
$
|
404
|
|
$
|
477
|
|
$
|
768
|
|
2.11
|
%
|
|
2.11
|
%
|
|
2.10
|
%
|
|
Other interest-bearing deposits
|
|
|
10,906,676
|
|
|
10,495,194
|
|
|
11,131,583
|
|
|
7,290
|
|
|
7,175
|
|
|
10,014
|
|
0.27
|
%
|
|
0.28
|
%
|
|
0.36
|
%
|
|
Other borrowed funds
|
|
|
383,762
|
|
|
424,873
|
|
|
483,762
|
|
|
3,670
|
|
|
3,515
|
|
|
3,828
|
|
3.84
|
%
|
|
3.36
|
%
|
|
3.17
|
%
|
|
FHLB advances
|
|
|
200,000
|
|
|
200,000
|
|
|
356,374
|
|
|
1,075
|
|
|
1,063
|
|
|
2,066
|
|
2.16
|
%
|
|
2.16
|
%
|
|
2.33
|
%
|
|
Total interest-bearing liabilities
|
|
$
|
11,567,228
|
|
$
|
11,211,780
|
|
$
|
12,118,631
|
|
$
|
12,439
|
|
$
|
12,230
|
|
$
|
16,676
|
|
0.43
|
%
|
|
0.44
|
%
|
|
0.55
|
%
|
|
Net interest income
|
|
|
|
|
|
|
|
|
|
|
$
|
205,566
|
|
$
|
192,828
|
|
$
|
190,919
|
|
|
|
|
|
|
|
Interest rate spread
|
|
|
|
|
|
|
|
|
|
|
|
|
|
|
|
|
|
|
|
4.01
|
%
|
|
3.77
|
%
|
|
3.73
|
%
|
|
Net interest margin
|
|
|
|
|
|
|
|
|
|
|
|
|
|
|
|
|
|
|
|
4.19
|
%
|
|
3.96
|
%
|
|
3.94
|
%
|
|
|
|
|
|
|
|
|
|
|
|
|
|
|
|
|
|
|
|
|
|
|
|
|
|
|
|
(1)
|
On a tax-equivalent basis. The tax-equivalent yield was estimated by dividing the interest rate spread on exempt assets by 1 less the Puerto Rico statutory tax rate of 37.5% and adding to
it the cost of interest-bearing liabilities. When adjusted to a tax-equivalent basis, yields on taxable and exempt assets are comparable. Changes in the fair value of derivative instruments are excluded from interest income because the
changes in valuation do not affect interest paid or received.
|
|
(2)
|
Government obligations include debt issued by government-sponsored agencies.
|
|
(3)
|
Unrealized gains and losses on available-for-sale securities are excluded from the average volumes.
|
|
(4)
|
Average loan balances include the average of non-performing loans.
|
|
(5)
|
Interest income on loans includes $3.0 million, $2.6 million and $2.5 million for the quarters ended June 30, 2022, March 31, 2022, and June 30, 2021, respectively, of income from
prepayment penalties and late fees related to the Corporation's loan portfolio.
|
|
|
Table 3 – Year-to-Date Statement of Average Interest-Earning Assets and Average Interest-Bearing Liabilities (On a Tax-Equivalent Basis)
|
|
|
|
|
|
|
|
|
|
|
Average Volume
|
|
Interest income (1) / expense
|
|
Average Rate (1)
|
|
Six-Month Period Ended
|
|
June 30,2022
|
|
June 30,2021
|
|
June 30,2022
|
|
June 30,2021
|
|
June 30,2022
|
|
June 30,2021
|
|
(Dollars in thousands)
|
|
|
|
|
|
|
|
|
|
|
|
|
|
|
|
|
|
Interest-earning assets:
|
|
|
|
|
|
|
|
|
|
|
|
|
|
|
|
|
|
Money market and other short-term investments
|
|
$
|
1,682,216
|
|
$
|
1,585,468
|
|
$
|
3,693
|
|
$
|
782
|
|
0.44
|
%
|
|
0.10
|
%
|
|
Government obligations (2)
|
|
|
2,829,675
|
|
|
1,669,130
|
|
|
18,322
|
|
|
12,583
|
|
1.31
|
%
|
|
1.52
|
%
|
|
Mortgage-backed securities
|
|
|
4,061,883
|
|
|
3,915,238
|
|
|
42,224
|
|
|
24,082
|
|
2.10
|
%
|
|
1.24
|
%
|
|
FHLB stock
|
|
|
21,370
|
|
|
29,851
|
|
|
538
|
|
|
767
|
|
5.08
|
%
|
|
5.18
|
%
|
|
Other investments
|
|
|
12,193
|
|
|
9,116
|
|
|
33
|
|
|
15
|
|
0.55
|
%
|
|
0.33
|
%
|
|
Total investments (3)
|
|
|
8,607,337
|
|
|
7,208,803
|
|
|
64,810
|
|
|
38,229
|
|
1.52
|
%
|
|
1.07
|
%
|
|
Residential mortgage loans
|
|
|
2,926,236
|
|
|
3,425,090
|
|
|
81,260
|
|
|
91,213
|
|
5.60
|
%
|
|
5.37
|
%
|
|
Construction loans
|
|
|
119,427
|
|
|
195,085
|
|
|
3,292
|
|
|
8,352
|
|
5.56
|
%
|
|
8.63
|
%
|
|
C&I and commercial mortgage loans
|
|
|
5,078,910
|
|
|
5,392,420
|
|
|
126,504
|
|
|
133,296
|
|
5.02
|
%
|
|
4.98
|
%
|
|
Finance leases
|
|
|
602,880
|
|
|
491,919
|
|
|
22,322
|
|
|
18,192
|
|
7.47
|
%
|
|
7.46
|
%
|
|
Consumer loans
|
|
|
2,377,118
|
|
|
2,159,410
|
|
|
124,875
|
|
|
117,482
|
|
10.59
|
%
|
|
10.97
|
%
|
|
Total loans (4) (5)
|
|
|
11,104,571
|
|
|
11,663,924
|
|
|
358,253
|
|
|
368,535
|
|
6.51
|
%
|
|
6.37
|
%
|
|
Total interest-earning assets
|
|
$
|
19,711,908
|
|
$
|
18,872,727
|
|
$
|
423,063
|
|
$
|
406,764
|
|
4.33
|
%
|
|
4.35
|
%
|
|
|
|
|
|
|
|
|
|
|
|
|
|
|
|
|
|
|
|
Interest-bearing liabilities:
|
|
|
|
|
|
|
|
|
|
|
|
|
|
|
|
|
|
Brokered certificates of deposit (“CDs”)
|
|
$
|
84,210
|
|
$
|
167,814
|
|
$
|
881
|
|
$
|
1,757
|
|
2.11
|
%
|
|
2.11
|
%
|
|
Other interest-bearing deposits
|
|
|
10,702,072
|
|
|
10,918,211
|
|
|
14,465
|
|
|
21,367
|
|
0.27
|
%
|
|
0.39
|
%
|
|
Other borrowed funds
|
|
|
404,204
|
|
|
483,762
|
|
|
7,185
|
|
|
7,400
|
|
3.58
|
%
|
|
3.08
|
%
|
|
FHLB advances
|
|
|
200,000
|
|
|
397,956
|
|
|
2,138
|
|
|
4,529
|
|
2.16
|
%
|
|
2.29
|
%
|
|
Total interest-bearing liabilities
|
|
$
|
11,390,486
|
|
$
|
11,967,743
|
|
$
|
24,669
|
|
$
|
35,053
|
|
0.44
|
%
|
|
0.59
|
%
|
|
Net interest income
|
|
|
|
|
|
|
|
$
|
398,394
|
|
$
|
371,711
|
|
|
|
|
|
Interest rate spread
|
|
|
|
|
|
|
|
|
|
|
|
|
|
3.89
|
%
|
|
3.76
|
%
|
|
Net interest margin
|
|
|
|
|
|
|
|
|
|
|
|
|
|
4.08
|
%
|
|
3.97
|
%
|
|
|
|
|
|
|
|
|
|
|
|
|
|
|
|
|
|
|
|
(1)
|
On a tax-equivalent basis. The tax-equivalent yield was estimated by dividing the interest rate spread on exempt assets by 1 less the Puerto Rico statutory tax rate of 37.5% and adding to
it the cost of interest-bearing liabilities. When adjusted to a tax-equivalent basis, yields on taxable and exempt assets are comparable. Changes in the fair value of derivative instruments are excluded from interest income because the
changes in valuation do not affect interest paid or received.
|
|
(2)
|
Government obligations include debt issued by government-sponsored agencies.
|
|
(3)
|
Unrealized gains and losses on available-for-sale securities are excluded from the average volumes.
|
|
(4)
|
Average loan balances include the average of non-performing loans.
|
|
(5)
|
Interest income on loans includes $5.6 million and $5.2 million for the six-month periods ended June 30, 2022 and 2021, respectively, of income from prepayment penalties and late fees
related to the Corporation's loan portfolio.
|
|
|
|
|
Table 4 – Loan Portfolio by Geography
|
|
|
|
|
|
|
As of June 30, 2022
|
|
|
|
Puerto Rico
|
|
Virgin Islands
|
|
United States
|
|
Consolidated
|
|
(In thousands)
|
|
|
|
|
Residential mortgage loans
|
|
$
|
2,265,653
|
|
$
|
178,879
|
|
$
|
407,153
|
|
$
|
2,851,685
|
|
|
|
|
|
|
|
|
|
|
|
|
|
|
|
Commercial loans:
|
|
|
|
|
|
|
|
|
|
|
|
|
|
Construction loans
|
|
|
21,628
|
|
|
3,849
|
|
|
89,833
|
|
|
115,310
|
|
Commercial mortgage loans
|
|
|
1,718,961
|
|
|
65,918
|
|
|
485,234
|
|
|
2,270,113
|
|
Commercial and Industrial loans (1)
|
|
|
1,795,134
|
|
|
74,076
|
|
|
993,707
|
|
|
2,862,917
|
|
Commercial loans
|
|
|
3,535,723
|
|
|
143,843
|
|
|
1,568,774
|
|
|
5,248,340
|
|
|
|
|
|
|
|
|
|
|
|
|
|
|
|
Finance leases
|
|
|
633,781
|
|
|
-
|
|
|
-
|
|
|
633,781
|
|
|
|
|
|
|
|
|
|
|
|
|
|
|
|
Consumer loans
|
|
|
2,404,267
|
|
|
55,581
|
|
|
13,220
|
|
|
2,473,068
|
|
Loans held for investment
|
|
|
8,839,424
|
|
|
378,303
|
|
|
1,989,147
|
|
|
11,206,874
|
|
|
|
|
|
|
|
|
|
|
|
|
|
|
|
Loans held for sale
|
|
|
22,425
|
|
|
176
|
|
|
-
|
|
|
22,601
|
|
Total loans
|
|
$
|
8,861,849
|
|
$
|
378,479
|
|
$
|
1,989,147
|
|
$
|
11,229,475
|
|
|
|
|
|
|
|
|
|
|
|
|
|
|
|
|
|
As of March 31, 2022
|
|
|
|
Puerto Rico
|
|
Virgin Islands
|
|
United States
|
|
Consolidated
|
|
(In thousands)
|
|
|
|
|
Residential mortgage loans
|
|
$
|
2,305,461
|
|
$
|
181,632
|
|
$
|
404,606
|
|
$
|
2,891,699
|
|
|
|
|
|
|
|
|
|
|
|
|
|
|
|
Commercial loans:
|
|
|
|
|
|
|
|
|
|
|
|
|
|
Construction loans
|
|
|
41,176
|
|
|
4,244
|
|
|
66,488
|
|
|
111,908
|
|
Commercial mortgage loans
|
|
|
1,667,028
|
|
|
66,829
|
|
|
503,845
|
|
|
2,237,702
|
|
Commercial and Industrial loans (1)
|
|
|
1,851,527
|
|
|
75,399
|
|
|
953,330
|
|
|
2,880,256
|
|
Commercial loans
|
|
|
3,559,731
|
|
|
146,472
|
|
|
1,523,663
|
|
|
5,229,866
|
|
|
|
|
|
|
|
|
|
|
|
|
|
|
|
Finance leases
|
|
|
606,266
|
|
|
-
|
|
|
-
|
|
|
606,266
|
|
|
|
|
|
|
|
|
|
|
|
|
|
|
|
Consumer loans
|
|
|
2,302,480
|
|
|
53,253
|
|
|
14,141
|
|
|
2,369,874
|
|
Loans held for investment
|
|
|
8,773,938
|
|
|
381,357
|
|
|
1,942,410
|
|
|
11,097,705
|
|
|
|
|
|
|
|
|
|
|
|
|
|
|
|
Loans held for sale
|
|
|
27,151
|
|
|
232
|
|
|
522
|
|
|
27,905
|
|
Total loans
|
|
$
|
8,801,089
|
|
$
|
381,589
|
|
$
|
1,942,932
|
|
$
|
11,125,610
|
|
|
|
|
|
|
|
|
|
|
|
|
|
|
|
|
|
As of December 31, 2021
|
|
|
|
Puerto Rico
|
|
Virgin Islands
|
|
United States
|
|
Consolidated
|
|
(In thousands)
|
|
|
|
|
Residential mortgage loans
|
|
$
|
2,361,322
|
|
$
|
188,251
|
|
$
|
429,322
|
|
$
|
2,978,895
|
|
|
|
|
|
|
|
|
|
|
|
|
|
|
|
Commercial loans:
|
|
|
|
|
|
|
|
|
|
|
|
|
|
Construction loans
|
|
|
38,789
|
|
|
4,344
|
|
|
95,866
|
|
|
138,999
|
|
Commercial mortgage loans
|
|
|
1,635,137
|
|
|
67,094
|
|
|
465,238
|
|
|
2,167,469
|
|
Commercial and Industrial loans (1)
|
|
|
1,867,082
|
|
|
79,515
|
|
|
940,654
|
|
|
2,887,251
|
|
Commercial loans
|
|
|
3,541,008
|
|
|
150,953
|
|
|
1,501,758
|
|
|
5,193,719
|
|
|
|
|
|
|
|
|
|
|
|
|
|
|
|
Finance leases
|
|
|
575,005
|
|
|
-
|
|
|
-
|
|
|
575,005
|
|
|
|
|
|
|
|
|
|
|
|
|
|
|
|
Consumer loans
|
|
|
2,245,097
|
|
|
52,282
|
|
|
15,660
|
|
|
2,313,039
|
|
Loans held for investment
|
|
|
8,722,432
|
|
|
391,486
|
|
|
1,946,740
|
|
|
11,060,658
|
|
|
|
|
|
|
|
|
|
|
|
|
|
|
|
Loans held for sale
|
|
|
33,002
|
|
|
177
|
|
|
1,976
|
|
|
35,155
|
|
Total loans
|
|
$
|
8,755,434
|
|
$
|
391,663
|
|
$
|
1,948,716
|
|
$
|
11,095,813
|
|
|
|
|
|
|
|
|
|
|
|
|
|
|
|
(1)
|
Includes $49.4 million of SBA PPP loans, net of unearned fees of $3.3 million, as of June 30, 2022 (March 31, 2022 - $89.7 million; December 31, 2021 - $145.0 million).
|
|
|
|
|
Table 5 – Non-Performing Assets by Geography
|
|
|
|
|
|
|
As of June 30, 2022
|
|
(In thousands)
|
|
Puerto Rico
|
|
Virgin Islands
|
|
United States
|
|
Total
|
|
Nonaccrual loans held for investment:
|
|
|
|
|
Residential mortgage
|
|
$
|
32,161
|
|
$
|
6,455
|
|
$
|
5,972
|
|
$
|
44,588
|
|
Commercial mortgage
|
|
|
15,604
|
|
|
9,149
|
|
|
-
|
|
|
24,753
|
|
Commercial and Industrial
|
|
|
14,350
|
|
|
1,830
|
|
|
899
|
|
|
17,079
|
|
Construction
|
|
|
985
|
|
|
1,390
|
|
|
-
|
|
|
2,375
|
|
Consumer and finance leases
|
|
|
9,900
|
|
|
211
|
|
|
204
|
|
|
10,315
|
|
Total nonaccrual loans held for investment
|
|
|
73,000
|
|
|
19,035
|
|
|
7,075
|
|
|
99,110
|
|
OREO
|
|
|
37,606
|
|
|
4,100
|
|
|
-
|
|
|
41,706
|
|
Other repossessed property
|
|
|
3,709
|
|
|
98
|
|
|
33
|
|
|
3,840
|
|
Other assets (1)
|
|
|
2,809
|
|
|
-
|
|
|
-
|
|
|
2,809
|
|
Total non-performing assets (2)
|
|
$
|
117,124
|
|
$
|
23,233
|
|
$
|
7,108
|
|
$
|
147,465
|
|
Past due loans 90 days and still accruing (3)
|
|
$
|
92,739
|
|
$
|
1,625
|
|
$
|
121
|
|
$
|
94,485
|
|
|
|
|
|
|
|
|
|
|
|
|
|
|
|
|
|
As of March 31, 2022
|
|
(In thousands)
|
|
Puerto Rico
|
|
Virgin Islands
|
|
United States
|
|
Total
|
|
Nonaccrual loans held for investment:
|
|
|
|
|
Residential mortgage
|
|
$
|
36,348
|
|
$
|
6,851
|
|
$
|
5,619
|
|
$
|
48,818
|
|
Commercial mortgage
|
|
|
16,861
|
|
|
9,715
|
|
|
-
|
|
|
26,576
|
|
Commercial and Industrial
|
|
|
15,582
|
|
|
1,623
|
|
|
924
|
|
|
18,129
|
|
Construction
|
|
|
1,119
|
|
|
1,424
|
|
|
-
|
|
|
2,543
|
|
Consumer and finance leases
|
|
|
10,643
|
|
|
168
|
|
|
153
|
|
|
10,964
|
|
Total nonaccrual loans held for investment
|
|
|
80,553
|
|
|
19,781
|
|
|
6,696
|
|
|
107,030
|
|
OREO
|
|
|
39,124
|
|
|
3,770
|
|
|
-
|
|
|
42,894
|
|
Other repossessed property
|
|
|
3,654
|
|
|
107
|
|
|
62
|
|
|
3,823
|
|
Other assets (1)
|
|
|
2,727
|
|
|
-
|
|
|
-
|
|
|
2,727
|
|
Total non-performing assets (2)
|
|
$
|
126,058
|
|
$
|
23,658
|
|
$
|
6,758
|
|
$
|
156,474
|
|
Past due loans 90 days and still accruing (3)
|
|
$
|
115,029
|
|
$
|
3,638
|
|
$
|
131
|
|
$
|
118,798
|
|
|
|
|
|
|
|
|
|
|
|
|
|
|
|
|
|
As of December 31, 2021
|
|
(In thousands)
|
|
Puerto Rico
|
|
Virgin Islands
|
|
United States
|
|
Total
|
|
Nonaccrual loans held for investment:
|
|
|
|
|
Residential mortgage
|
|
$
|
39,256
|
|
$
|
8,719
|
|
$
|
7,152
|
|
$
|
55,127
|
|
Commercial mortgage
|
|
|
15,503
|
|
|
9,834
|
|
|
-
|
|
|
25,337
|
|
Commercial and Industrial
|
|
|
14,708
|
|
|
1,476
|
|
|
951
|
|
|
17,135
|
|
Construction
|
|
|
1,198
|
|
|
1,466
|
|
|
-
|
|
|
2,664
|
|
Consumer and finance leases
|
|
|
10,177
|
|
|
144
|
|
|
133
|
|
|
10,454
|
|
Total nonaccrual loans held for investment
|
|
|
80,842
|
|
|
21,639
|
|
|
8,236
|
|
|
110,717
|
|
OREO
|
|
|
36,750
|
|
|
3,450
|
|
|
648
|
|
|
40,848
|
|
Other repossessed property
|
|
|
3,456
|
|
|
187
|
|
|
44
|
|
|
3,687
|
|
Other assets (1)
|
|
|
2,850
|
|
|
-
|
|
|
-
|
|
|
2,850
|
|
Total non-performing assets (2)
|
|
$
|
123,898
|
|
$
|
25,276
|
|
$
|
8,928
|
|
$
|
158,102
|
|
Past due loans 90 days and still accruing (3)
|
|
$
|
114,001
|
|
$
|
1,265
|
|
$
|
182
|
|
$
|
115,448
|
|
|
|
|
|
|
|
|
|
|
|
|
|
|
|
(1)
|
Residential pass-through MBS issued by the PRHFA held as part of the available-for-sale debt securities portfolio.
|
|
(2)
|
Excludes PCD loans previously accounted for under ASC Subtopic 310-30 for which the Corporation made the accounting policy election of maintaining pools of loans as “units of account” both
at the time of adoption of CECL on January 1, 2020 and on an ongoing basis for credit loss measurement. These loans will continue to be excluded from nonaccrual loan statistics as long as the Corporation can reasonably estimate the
timing and amount of cash flows expected to be collected on the loan pools. The portion of such loans contractually past due 90 days or more amounted to $15.3 million as of June 30, 2022 (March 31, 2022 - $18.0 million; December 31,
2021 - $20.6 million).
|
|
(3)
|
These include rebooked loans, which were previously pooled into GNMA securities, amounting to $10.8 million as of June 30, 2022 (March 31, 2022 - $9.5 million; December 31, 2021 - $7.2
million). Under the GNMA program, the Corporation has the option but not the obligation to repurchase loans that meet GNMA's specified delinquency criteria. For accounting purposes, the loans subject to the repurchase option are
required to be reflected on the financial statements with an offsetting liability.
|
|
|
|
|
|
|
|
|
Table 6 – Allowance for Credit Losses on Loans and Finance Leases
|
|
|
|
|
|
|
|
|
|
|
|
Quarter Ended
|
|
|
Six-Month Period Ended
|
|
|
|
June 30,
|
|
March 31,
|
|
June 30,
|
|
June 30,
|
|
June 30,
|
|
|
|
2022
|
|
2022
|
|
2021
|
|
2022
|
|
2021
|
|
(Dollars in thousands)
|
|
|
|
|
|
|
|
|
|
|
|
|
|
|
|
|
Allowance for credit losses on loans and finance leases, beginning of period
|
|
$
|
245,447
|
|
|
$
|
269,030
|
|
|
$
|
358,936
|
|
|
$
|
269,030
|
|
|
$
|
385,887
|
|
|
Provision for credit losses on loans and finance leases expense (benefit)
|
|
|
12,665
|
|
|
|
(16,989
|
)
|
|
|
(26,302
|
)
|
|
|
(4,324
|
)
|
|
|
(40,745
|
)
|
|
Net (charge-offs) recoveries of loans:
|
|
|
|
|
|
|
|
|
|
|
|
|
|
|
|
|
Residential mortgage
|
|
|
(792
|
)
|
|
|
(1,146
|
)
|
|
|
(1,987
|
)
|
|
|
(1,938
|
)
|
|
|
(4,079
|
)
|
|
Commercial mortgage
|
|
|
1,216
|
|
|
|
7
|
|
|
|
(31
|
)
|
|
|
1,223
|
|
|
|
(771
|
)
|
|
Commercial and industrial
|
|
|
521
|
|
|
|
745
|
|
|
|
5,809
|
|
|
|
1,266
|
|
|
|
5,264
|
|
|
Construction
|
|
|
27
|
|
|
|
8
|
|
|
|
38
|
|
|
|
35
|
|
|
|
29
|
|
|
Consumer loans and finance leases
|
|
|
(6,932
|
)
|
|
|
(6,208
|
)
|
|
|
(11,505
|
)
|
|
|
(13,140
|
)
|
|
|
(20,627
|
)
|
|
Net charge-offs
|
|
|
(5,960
|
)
|
|
|
(6,594
|
)
|
|
|
(7,676
|
)
|
|
|
(12,554
|
)
|
|
|
(20,184
|
)
|
|
Allowance for credit losses on loans and finance leases, end of period
|
|
$
|
252,152
|
|
|
$
|
245,447
|
|
|
$
|
324,958
|
|
|
$
|
252,152
|
|
|
$
|
324,958
|
|
|
|
|
|
|
|
|
|
|
|
|
|
|
|
|
|
|
|
Allowance for credit losses on loans and finance leases to period end total loans held for investment
|
|
|
2.25
|
%
|
|
|
2.21
|
%
|
|
|
2.85
|
%
|
|
|
2.25
|
%
|
|
|
2.85
|
%
|
|
Net charge-offs (annualized) to average loans outstanding during the period
|
|
|
0.21
|
%
|
|
|
0.24
|
%
|
|
|
0.27
|
%
|
|
|
0.23
|
%
|
|
|
0.35
|
%
|
|
Provision for credit losses on loans and finance leases to net charge-offs during the period
|
|
|
2.13x
|
|
|
-2.58x
|
|
|
-3.43x
|
|
|
-0.34x
|
|
|
-2.02x
|
|
|
|
|
|
Table 7 – Net Charge-Offs to Average Loans
|
|
|
|
|
|
|
Quarter Ended
|
|
Six-Month Period Ended
|
|
|
June 30, 2022
|
|
March 31, 2022
|
|
June 30, 2021
|
|
June 30, 2022
|
|
June 30, 2021
|
|
Residential mortgage
|
0.11%
|
|
0.15%
|
|
0.24%
|
|
0.13%
|
|
0.24%
|
|
Commercial mortgage
|
-0.22%
|
|
0.00%
|
|
0.01%
|
|
-0.11%
|
|
0.07%
|
|
Commercial and industrial
|
-0.07%
|
|
-0.10%
|
|
-0.74%
|
|
-0.09%
|
|
-0.33%
|
|
Construction
|
-0.09%
|
|
-0.03%
|
|
-0.09%
|
|
-0.06%
|
|
-0.03%
|
|
Consumer loans and finance leases
|
0.91%
|
|
0.85%
|
|
1.72%
|
|
0.88%
|
|
1.56%
|
|
Total loans
|
0.21%
|
|
0.24%
|
|
0.27%
|
|
0.23%
|
|
0.35%
|