Exhibit 99.1
INAP Reports First Quarter 2019 Financial Results
| – |
Successfully Amended Existing Credit Facility to Gain
Operational Flexibility and Position for Growth
|
| – |
INAP’s Significant Product Portfolio Shift Resulted in
Reported Revenue of $73.6 Million, Flat YoY
|
| o |
First Quarter Revenue Represents a New Baseline. Planned Data
Center Exits are Now Completed, and Offset by Growth in Cloud Enabled by the Acquisition of SingleHop
|
| o |
The Revenue Decline Sequentially Includes Timing of Customer
Installs and Colocation Resizing
|
| – |
GAAP Net Loss Attributable to INAP Shareholders $(19.6)
Million was Flat Sequentially, or $(0.83) Per Share
|
| o |
Cash Flow from Operations was $2.3 million
|
| – |
Adjusted EBITDA of $23.6 Million, includes Approximately $1.0
Million of Cost Savings and Customer Installation Delays
|
| o |
One-Time EBITDA Decrease in the First Quarter was Offset by
Conservative Capital Expenditures of $8.6 Million to Maintain Cash Flow Objectives
|
RESTON, VA - (May 9, 2019)
Internap Corporation (NASDAQ: INAP), a leading-edge provider of high-performance data center and cloud solutions with global network connectivity, announced today financial results for the first quarter of 2019.
“We have significant opportunities ahead to grow INAP and gain scale with our reconstructed portfolio. Year-over-year,
management exited non-core data centers, and added a premier managed services platform through SingleHop to create a new baseline by the end of the first quarter of 2019. This portfolio right-sizing is now completed and establishes a new and
improved INAP platform of colo, cloud and network services,” said Peter D. Aquino, President and Chief Executive Officer. “In addition, we are pleased to report the completed amendment to INAP’s credit facility as a follow-on to our recent equity
raise. This operational flexibility positions the INAP platform for growth, partnerships and potential mergers. As we evaluate the opportunities to create shareholder value, we have retained Moelis & Company LLC and LionTree Advisors LLC as
Financial Advisors.”
Revenue
2018 results include SingleHop LLC (“SingleHop”) operations beginning March 1, 2018, and are therefore not comparable to
prior periods.
| · |
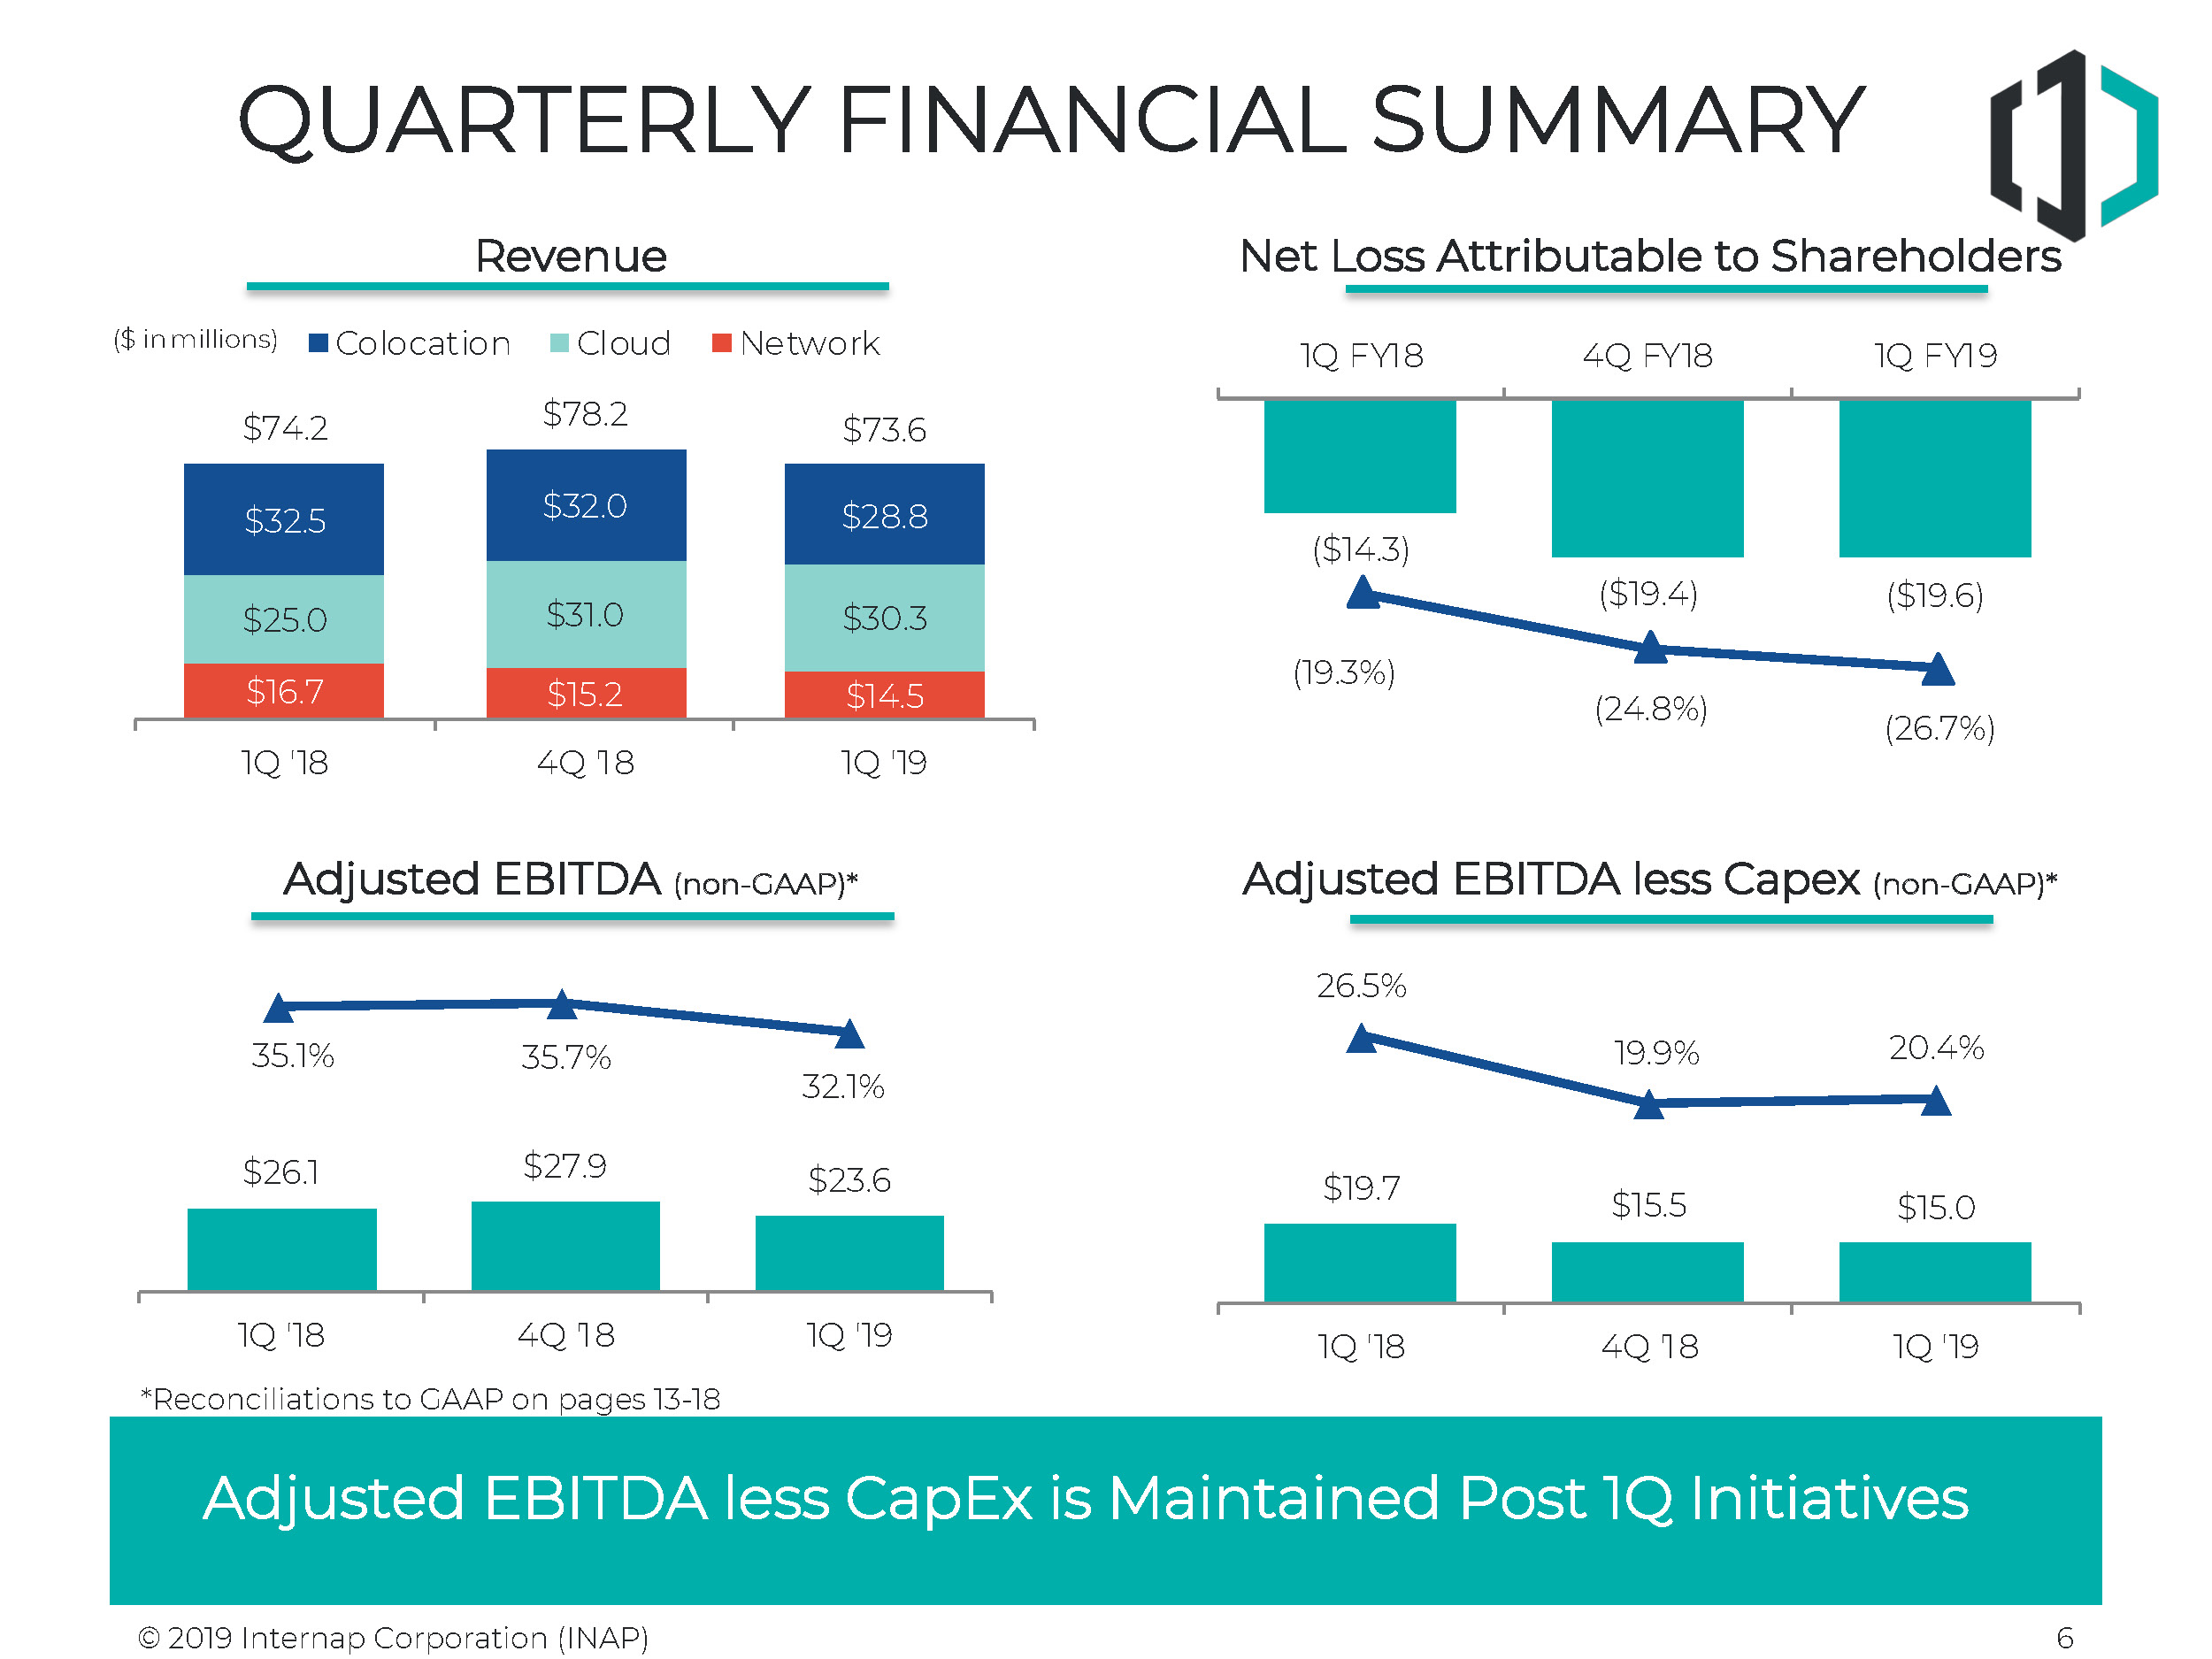
Total company revenue was $73.6 million in the first quarter of 2019, a decrease sequentially of $4.7 million or 6.0% and a decrease of $0.6 million or nearly
flat at 0.9% year-over-year. The sequential decrease was primarily due to planned data centers exits and resizing of certain customer footprints of $2.0 million, lower non-recurring revenues associated with installs and timing for $1.0
million, deferred revenue adjustments of $0.6 million and other decreases of $0.9 million. The sequential decreases are primarily related to the reshaping initiatives of the colocation product line.
|
| o |
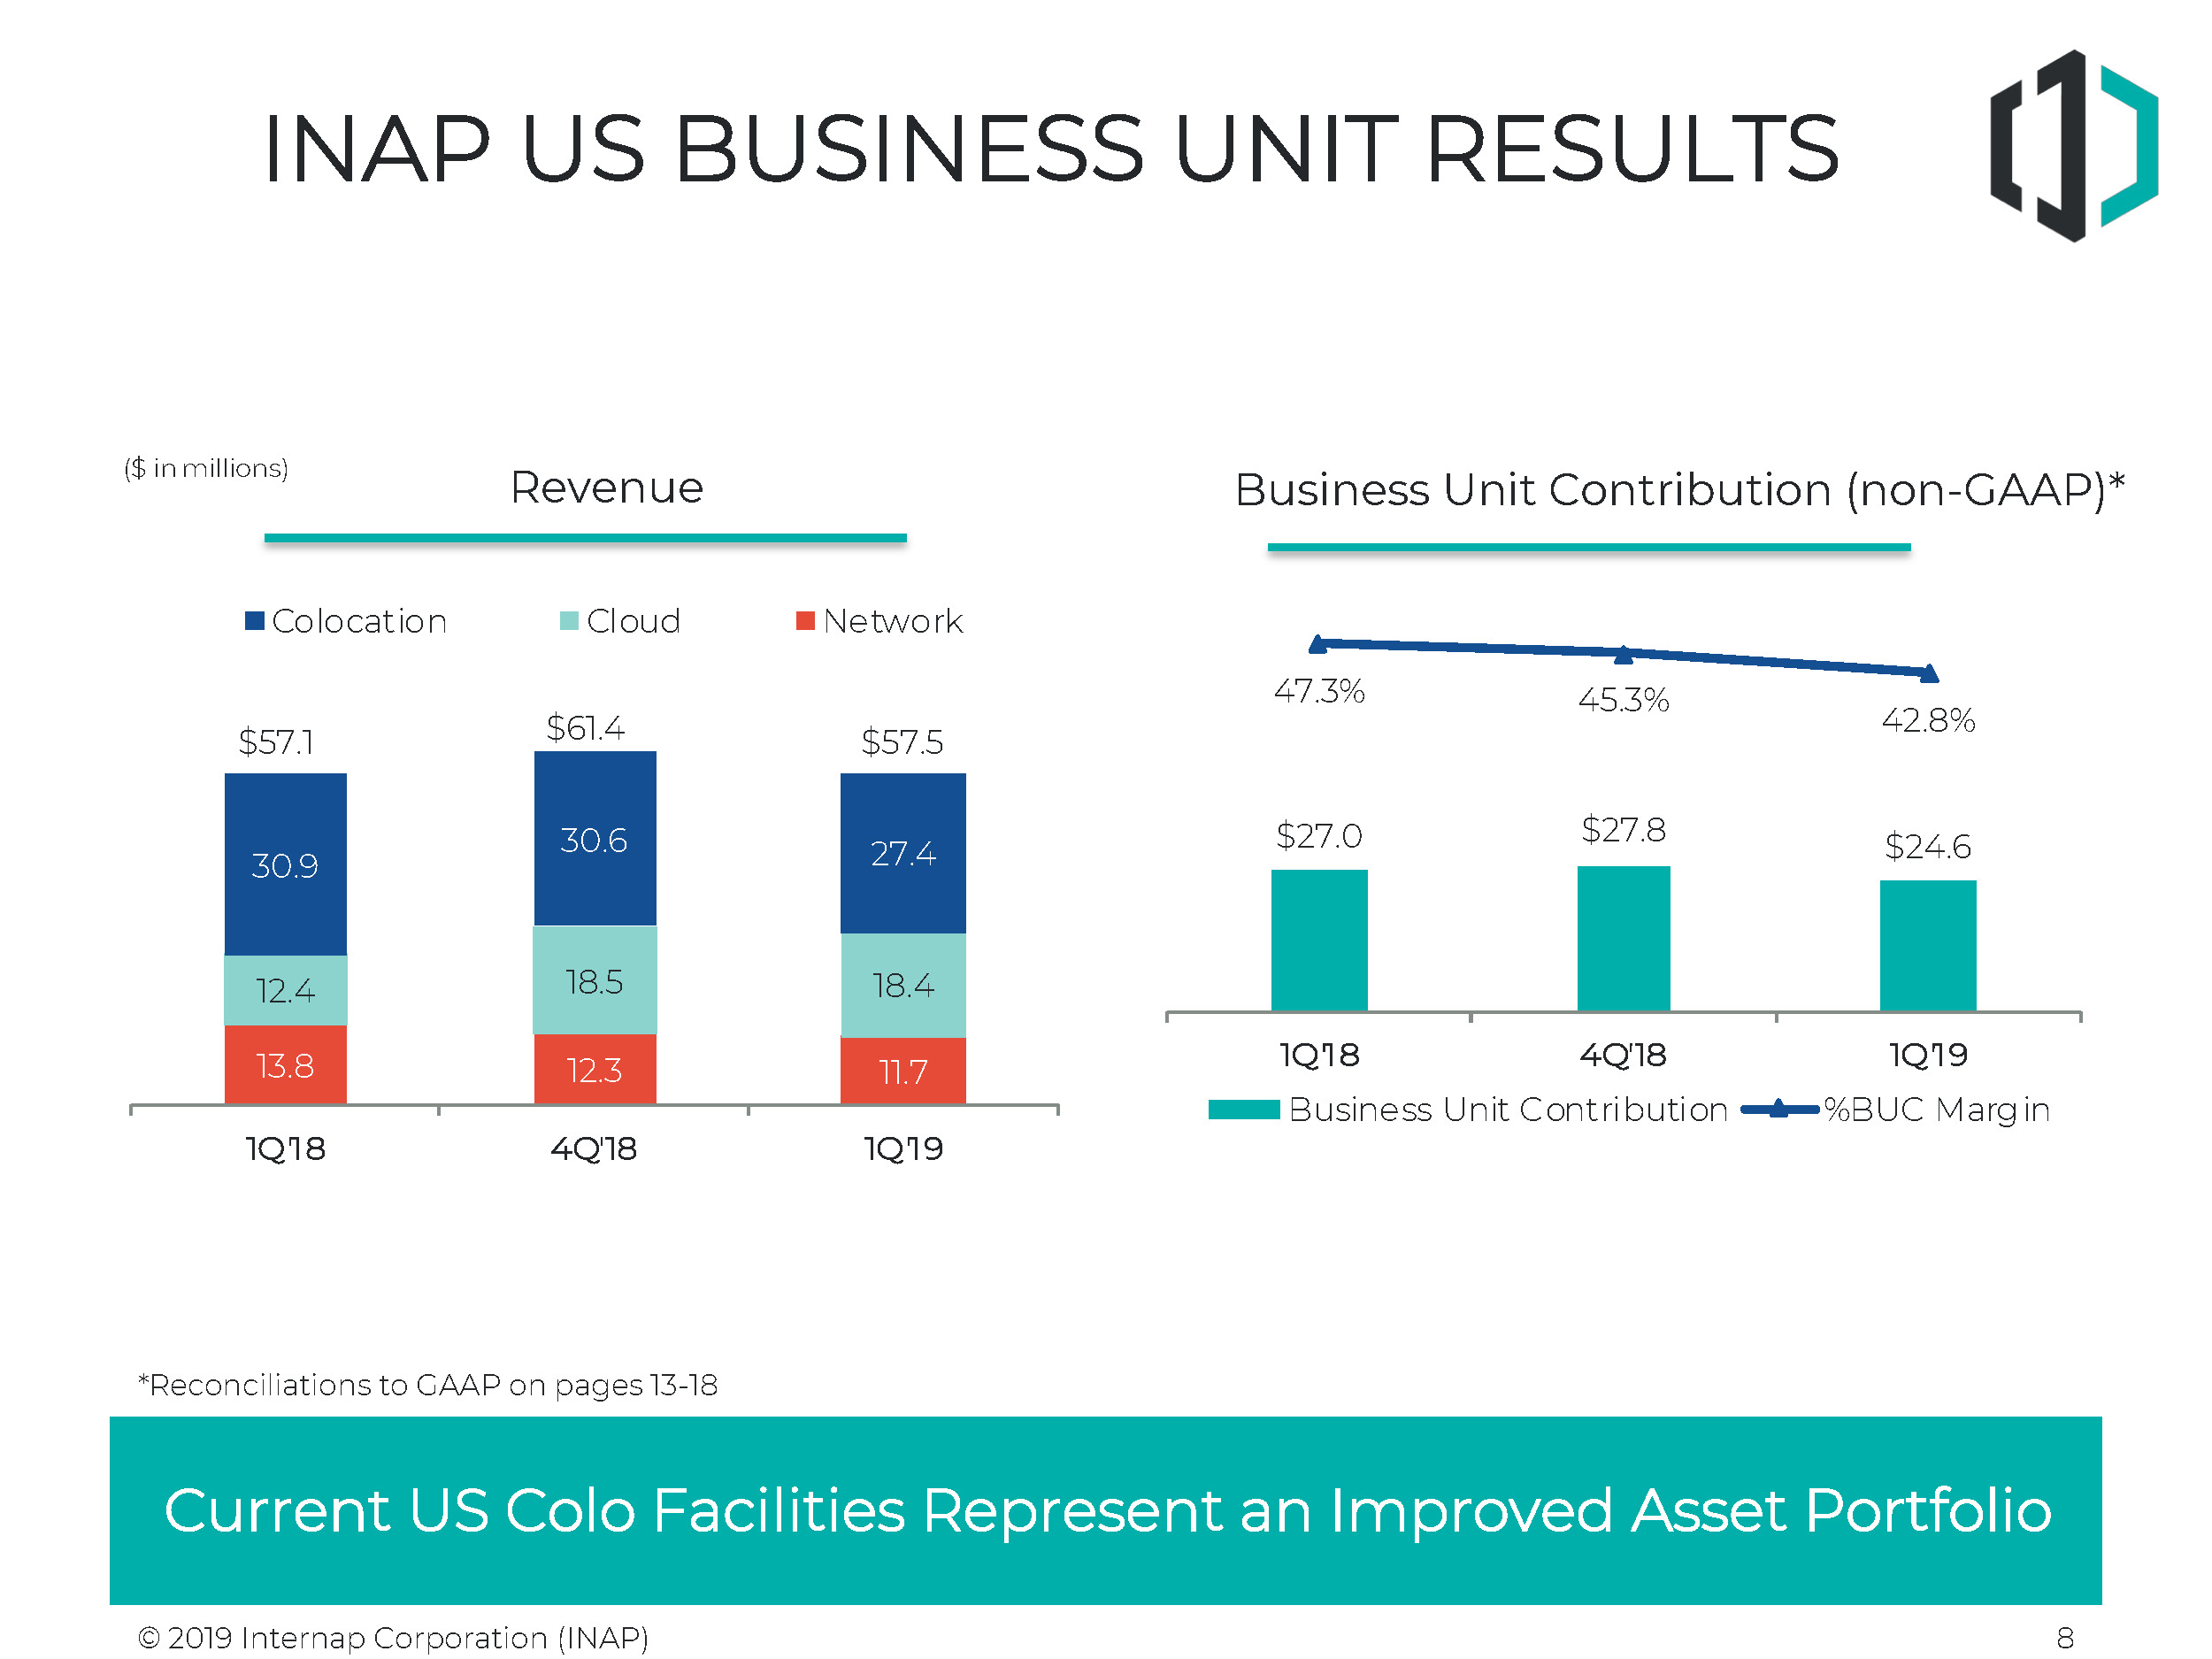
INAP US revenue totaled $57.5 million in the first quarter of 2019, a decrease of 6.3% sequentially and an increase of 0.8% year-over-year. The sequential
decrease was due primarily to all of the above.
|
| o |
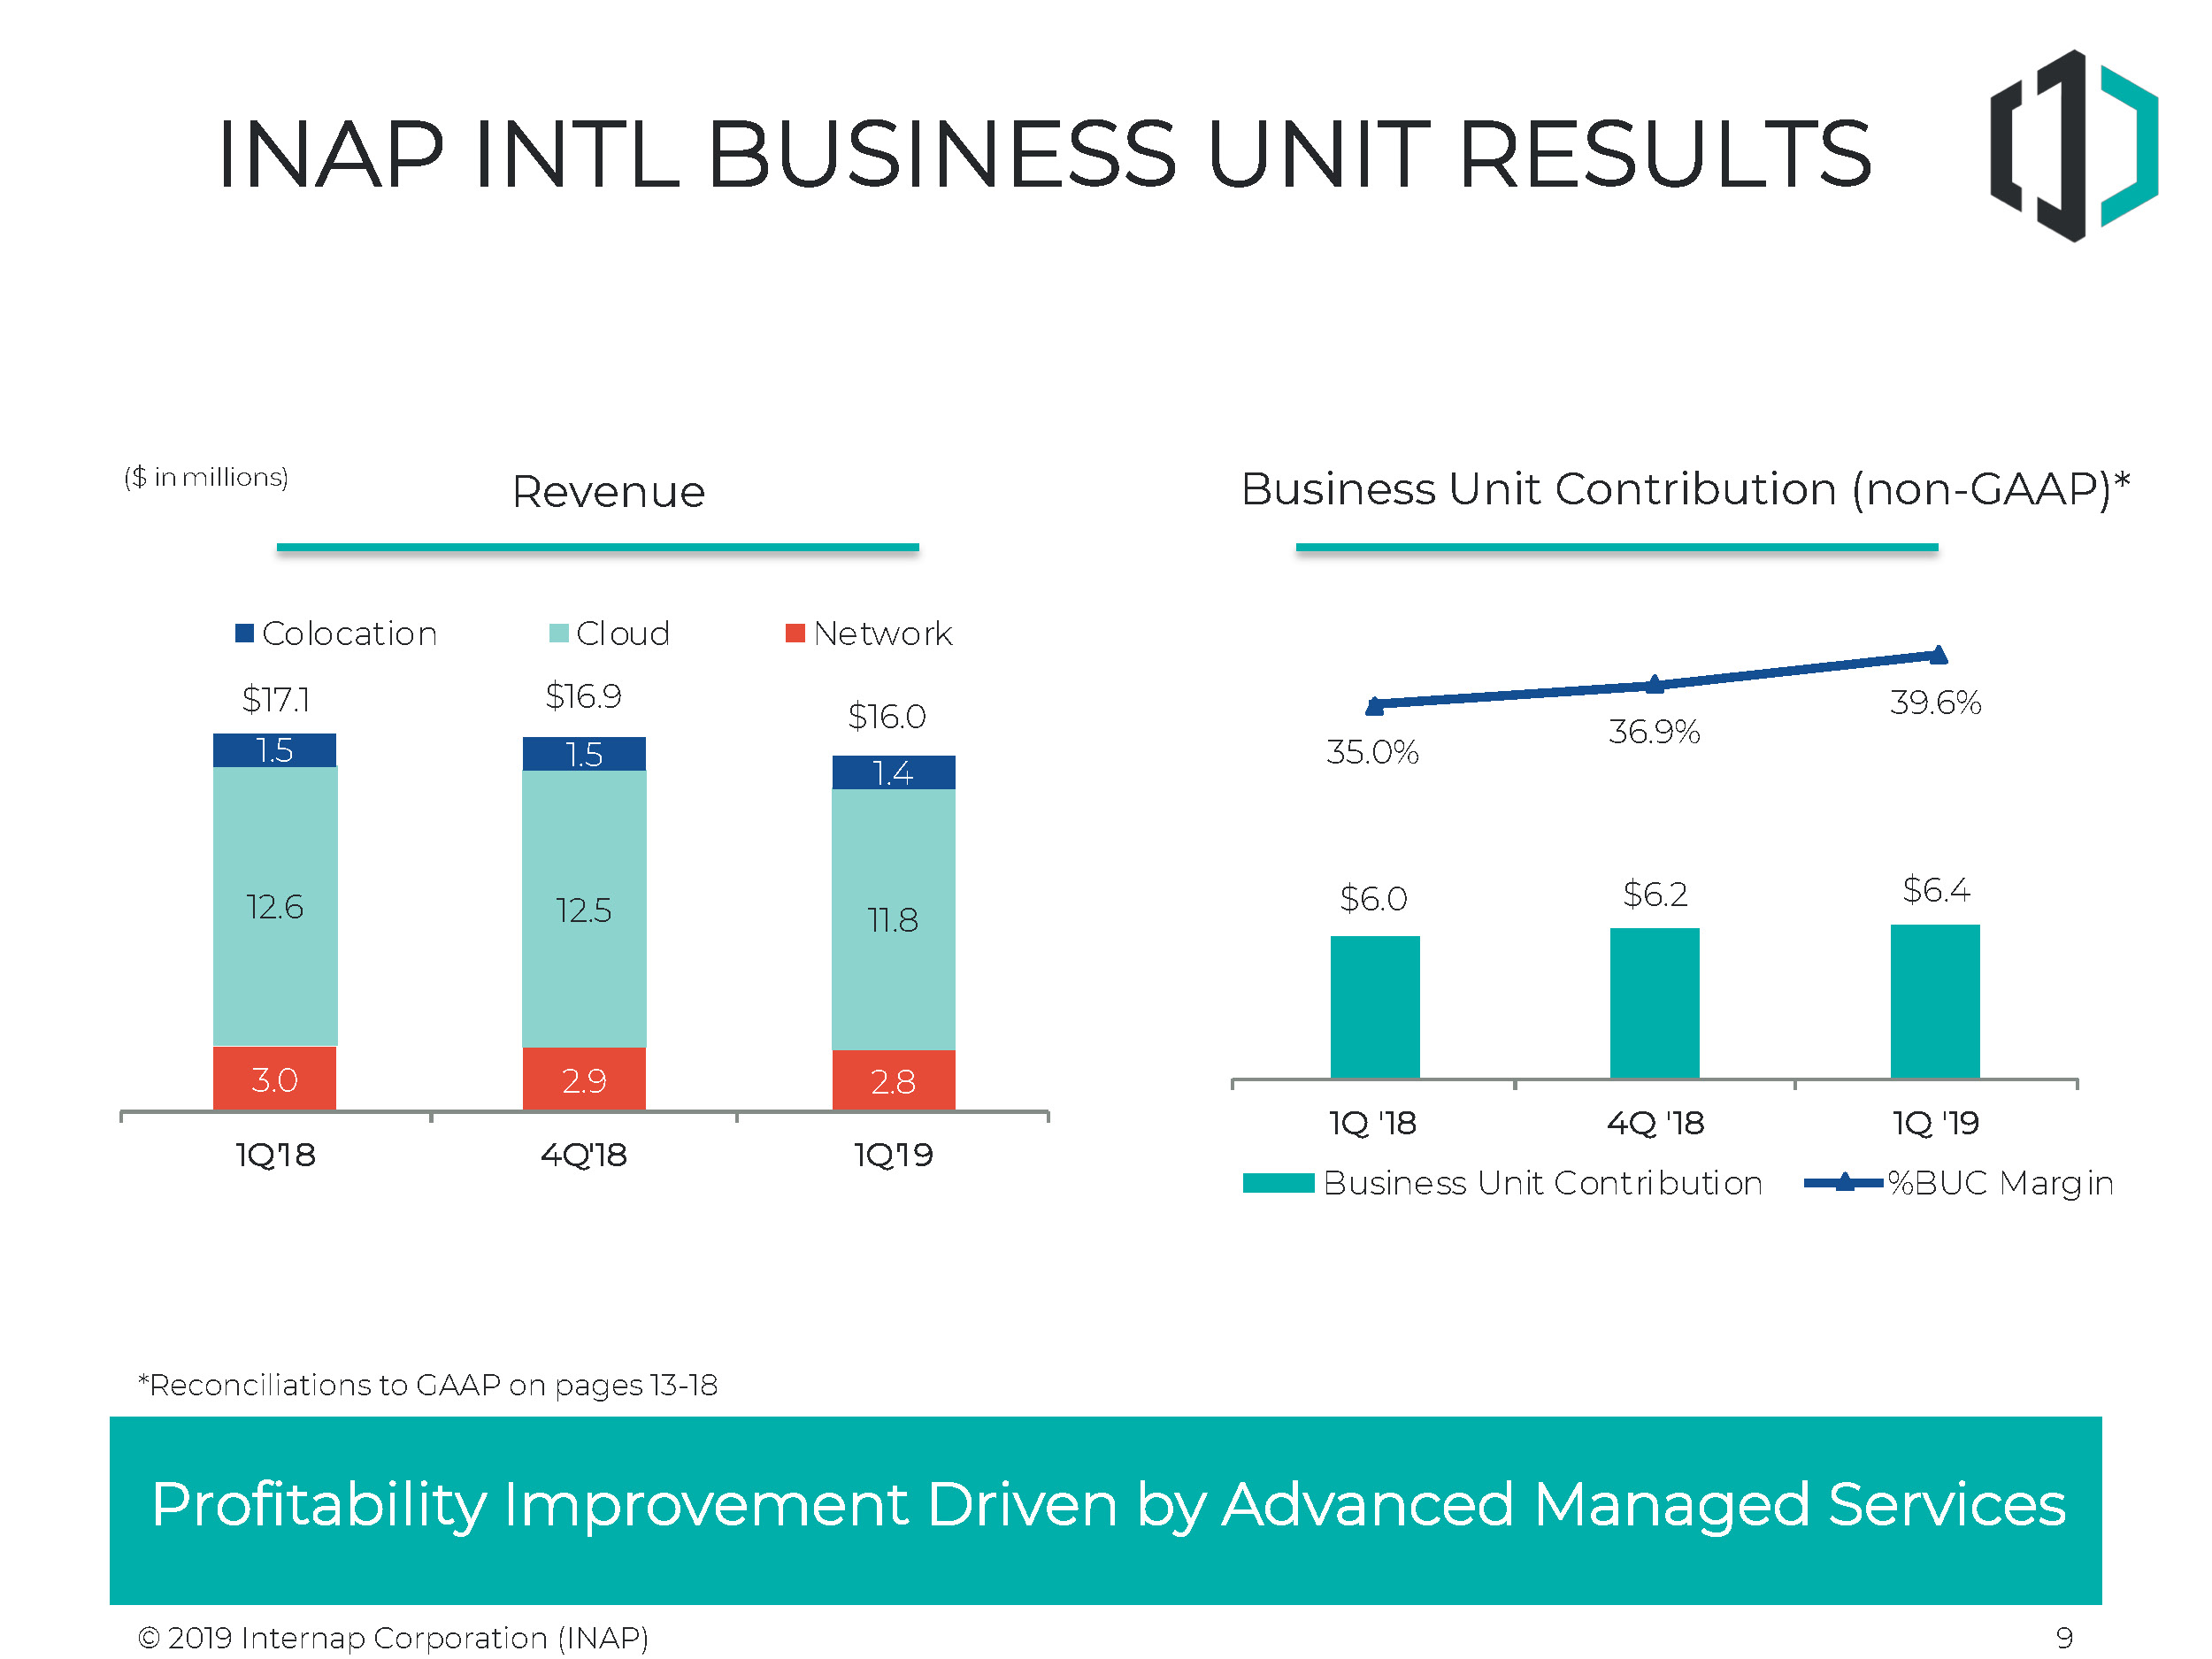
INAP INTL revenue was $16.0 million in the first quarter of 2019, a decrease of 4.9% sequentially and 6.3% year-over-year. The decrease sequentially was
primarily due to a decline in the Canada cloud business that targets smaller customers. The decrease year-over-year was partly offset by the addition of SingleHop.
|
First Quarter 2019
Financial Summary
|
QoQ
|
YoY
|
|||||||||||||||||||
|
($ in thousands)
|
1Q 2019
|
4Q 2018
|
1Q 2018
|
Growth
|
Growth
|
|||||||||||||||
|
Net Revenues
|
$
|
73,564
|
$
|
78,238
|
$
|
74,201
|
(6.0
|
)%
|
(0.9
|
)%
|
||||||||||
|
Operating Costs and Expenses
|
$
|
75,638
|
$
|
77,263
|
$
|
72,973
|
(2.1
|
)%
|
3.7
|
%
|
||||||||||
|
Depreciation and Amortization
|
$
|
22,178
|
$
|
23,579
|
$
|
21,158
|
(5.9
|
)%
|
4.8
|
%
|
||||||||||
|
Exit Activities, Restructuring and Impairments
|
$
|
1,416
|
$
|
2,266
|
$
|
(33
|
)
|
(37.5
|
)%
|
(4,390.9
|
)%
|
|||||||||
|
All Other Operating Costs and Expenses
|
$
|
52,044
|
$
|
51,418
|
$
|
51,848
|
1.2
|
%
|
0.4
|
%
|
||||||||||
|
GAAP Net Loss Attributable to INAP Shareholders
|
$
|
(19,644
|
)
|
$
|
(19,411
|
)
|
$
|
(14,288
|
)
|
1.2
|
%
|
37.5
|
%
|
|||||||
|
GAAP Net Loss Margin
|
(26.7
|
)%
|
(24.8
|
)%
|
(19.3
|
)%
|
||||||||||||||
|
Minus Stock-Based Compensation and Other Items
|
$
|
3,005
|
$
|
3,426
|
$
|
3,650
|
(12.3
|
)%
|
(17.7
|
)%
|
||||||||||
|
Normalized Net Loss2
|
$
|
(16,639
|
)
|
$
|
(15,985
|
)
|
$
|
(10,638
|
)
|
4.1
|
%
|
56.4
|
%
|
|||||||
|
Adjusted EBITDA1
|
$
|
23,615
|
$
|
27,919
|
$
|
26,055
|
(15.4
|
)%
|
(9.4
|
)%
|
||||||||||
|
Adjusted EBITDA Margin1
|
32.1
|
%
|
35.7
|
%
|
35.1
|
%
|
||||||||||||||
|
Capital Expenditures (CapEx)
|
$
|
8,623
|
$
|
12,376
|
$
|
6,359
|
(30.3
|
)%
|
35.6
|
%
|
||||||||||
|
Adjusted EBITDA less CapEx1
|
$
|
14,992
|
$
|
15,543
|
$
|
19,696
|
(3.5
|
)%
|
(23.9
|
)%
|
||||||||||
Net Loss, Normalized Net Loss, Adjusted EBITDA and Business Unit Contribution
| · |
GAAP net loss attributable to INAP shareholders was $(19.6) million, or $(0.83) per share in the first quarter of 2019 compared with $(19.4) million, or
$(0.82) per share in the fourth quarter of 2018. GAAP net loss in first quarter of 2018 was $(14.3) million. GAAP Net Loss Margin was (26.7)% compared to (24.8)% in the fourth quarter of 2018 and (19.3)% in the first quarter of 2018.
|
| · |
Normalized net loss2 was $(16.6) million in the first quarter of 2019
compared with $(16.0) million in the fourth quarter of 2018 and $(10.6) million in the first quarter of 2018.
|
| · |
Adjusted EBITDA1 totaled $23.6 million in the first quarter of 2019, a
decrease of 15.4% compared with $27.9 million in the fourth quarter of 2018, and 9.4% decrease compared with $26.1 million in the first quarter of 2018. The decrease is primarily due to the decline in revenues and several non-recurring
adjustments.
|
Business Unit Contribution3 - INAP US and
INAP INTL business unit contribution for first quarter of 2019 is as follows:
INAP US, includes Colocation, Cloud, and Network Services. Cloud contains AgileCloud, Managed Hosting, and SingleHop
businesses.
| o |
INAP US business unit contribution was $24.6 million in the first quarter, a 11.5% decrease compared to the fourth quarter of 2018 and a 8.7% decrease from
the first quarter of 2018. The decrease sequentially and year-over-year was primarily due to the decrease in revenue.
|
2
| o |
As a percent of revenue, INAP US business unit contribution margin was at 42.8% in the first quarter of 2019, and down 250 basis points sequentially and 450
basis points year-over-year.
|
INAP INTL, includes Colocation, Cloud, and Network Services. Cloud contains AgileCloud, Managed Hosting, Ubersmith, iWeb,
and SingleHop.
| o |
INAP INTL business unit contribution was $6.4 million in the first quarter of 2019, a 1.9% increase compared with the fourth quarter of 2018 and a 6.0%
increase from the first quarter of 2018.
|
| o |
As a percent of revenue, INAP INTL business unit contribution margin was 39.6% in the first quarter of 2019, up 270 basis points sequentially and up 460 basis
points year-over-year. INAP INTL business unit contribution increased sequentially due to lower network cost and was up year-over-year due to the SingleHop acquisition.
|
“In the first quarter, we experienced some timing delays associated with customer installs and larger wholesale deals in
the pipeline. Coming out of the fourth quarter data center rationalizations, we experienced some continued revenue impact in the first quarter. We worked to maintain cash flow consistency, while we completed these portfolio initiatives,” said Jim
Keeley, Executive Vice President, Chief Financial Officer. “We are focused on maintaining strict cost and capex control, while continuing to support new sales and installs.”
Balance Sheet and Cash Flow Statement
| · |
Cash and cash equivalents were $8.3 million at March 31, 2019. Total debt was $686.5 million, net of discount and prepaid costs, at the end of the first
quarter of 2019 including $271.0 million in finance lease obligations. The Company has $31.2 million of availability on its revolver, net of $3.8 million of letters of credit.
|
| · |
Cash generated from operations for the three months ended March 31, 2019 was $2.3 million compared to $5.4 million in the fourth quarter of 2018, and $3.7
million in the first quarter of 2018. Cash provided by operations was about $3.2 million lower than expected due to the delay of a large customer remittance and in line with prior periods when included. Capital expenditures over the
same periods were $8.6 million, compared to $12.4 million and $6.4 million, respectively. Adjusted EBITDA less CapEx1 was $15.0 million, compared to $15.5
million in the fourth quarter of 2018 and $19.7 million in the first quarter of 2018. Free cash flow4 over the same periods was $(6.4) million, compared to
$(7.0) million and $(2.7) million, respectively. Unlevered free cash flow4 was $7.9 million for the first quarter of 2019, compared to $9.0 million in the
fourth quarter of 2018 and $10.9 million in the first quarter of 2018.
|
Business
Outlook
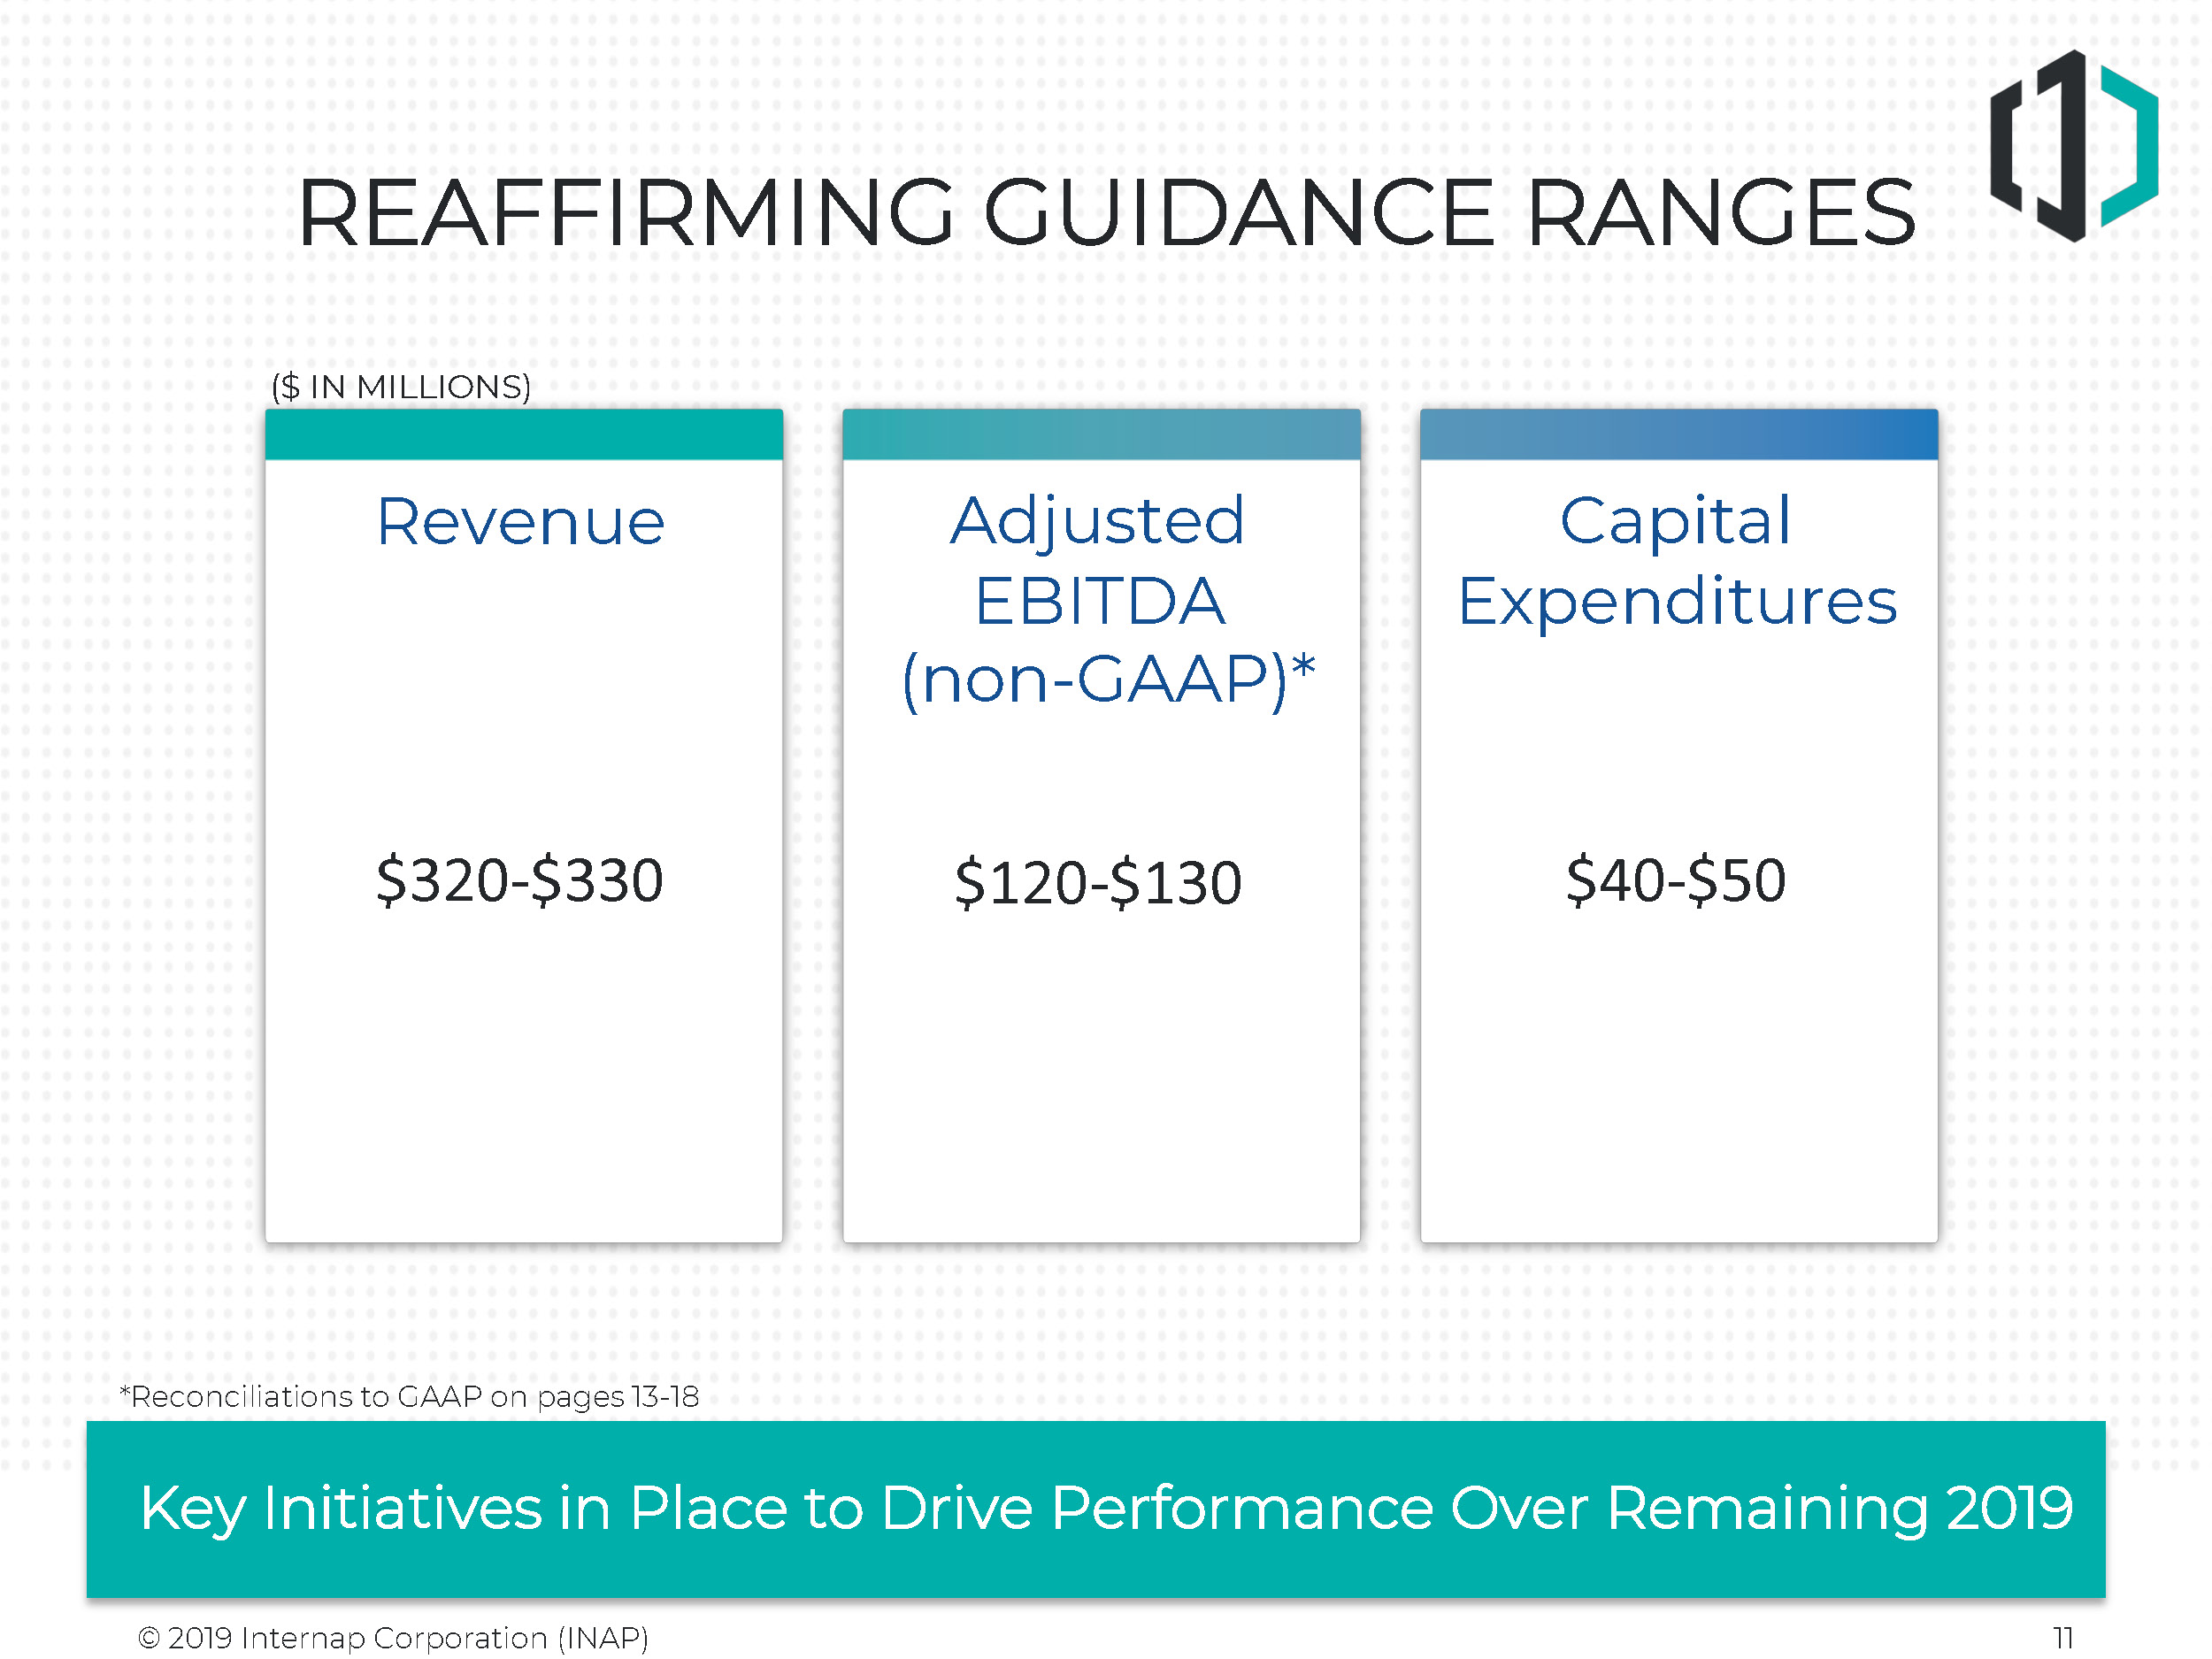
INAP’s business outlook for 2019 is shown in the table below.
|
Full-Year 2019 Expected Range
|
|
|
Revenue
|
$320 million - $330 million
|
|
Adjusted EBITDA (non-GAAP)
|
$120 million - $130 million
|
|
Capital Expenditures
|
$40 million - $50 million
|
3
| 1. |
Adjusted EBITDA, Adjusted EBITDA margin and Adjusted EBITDA less CapEx are non-GAAP financial measures which we define in an attachment to this press release
entitled “Non-GAAP (Adjusted) Financial Measures.” Reconciliations between GAAP information and non-GAAP information related to Adjusted EBITDA and Adjusted EBITDA margin are contained in the table entitled “Reconciliation of GAAP Net
Loss Attributable to INAP Shareholders to Adjusted EBITDA” and “Reconciliation of Forward Looking GAAP Net Loss Attributable to INAP Shareholders to Adjusted EBITDA.” Adjusted EBITDA margin is Adjusted EBITDA as a percentage of revenue.
A reconciliation between GAAP information and non-GAAP information related to Adjusted EBITDA less CapEx is contained in the table entitled “Reconciliation of GAAP Net Cash Flows provided by Operating Activities to Adjusted EBITDA less
CapEx."
|
| 2. |
Normalized net loss is a non-GAAP financial measure which we define in an attachment to this press release entitled “Non-GAAP (Adjusted) Financial Measures.”
Reconciliations between GAAP information and non-GAAP information related to normalized net loss are contained in the table entitled “Reconciliation of GAAP Net Loss Attributable to INAP Shareholders to Normalized Net Loss to INAP
Shareholders.”
|
| 3. |
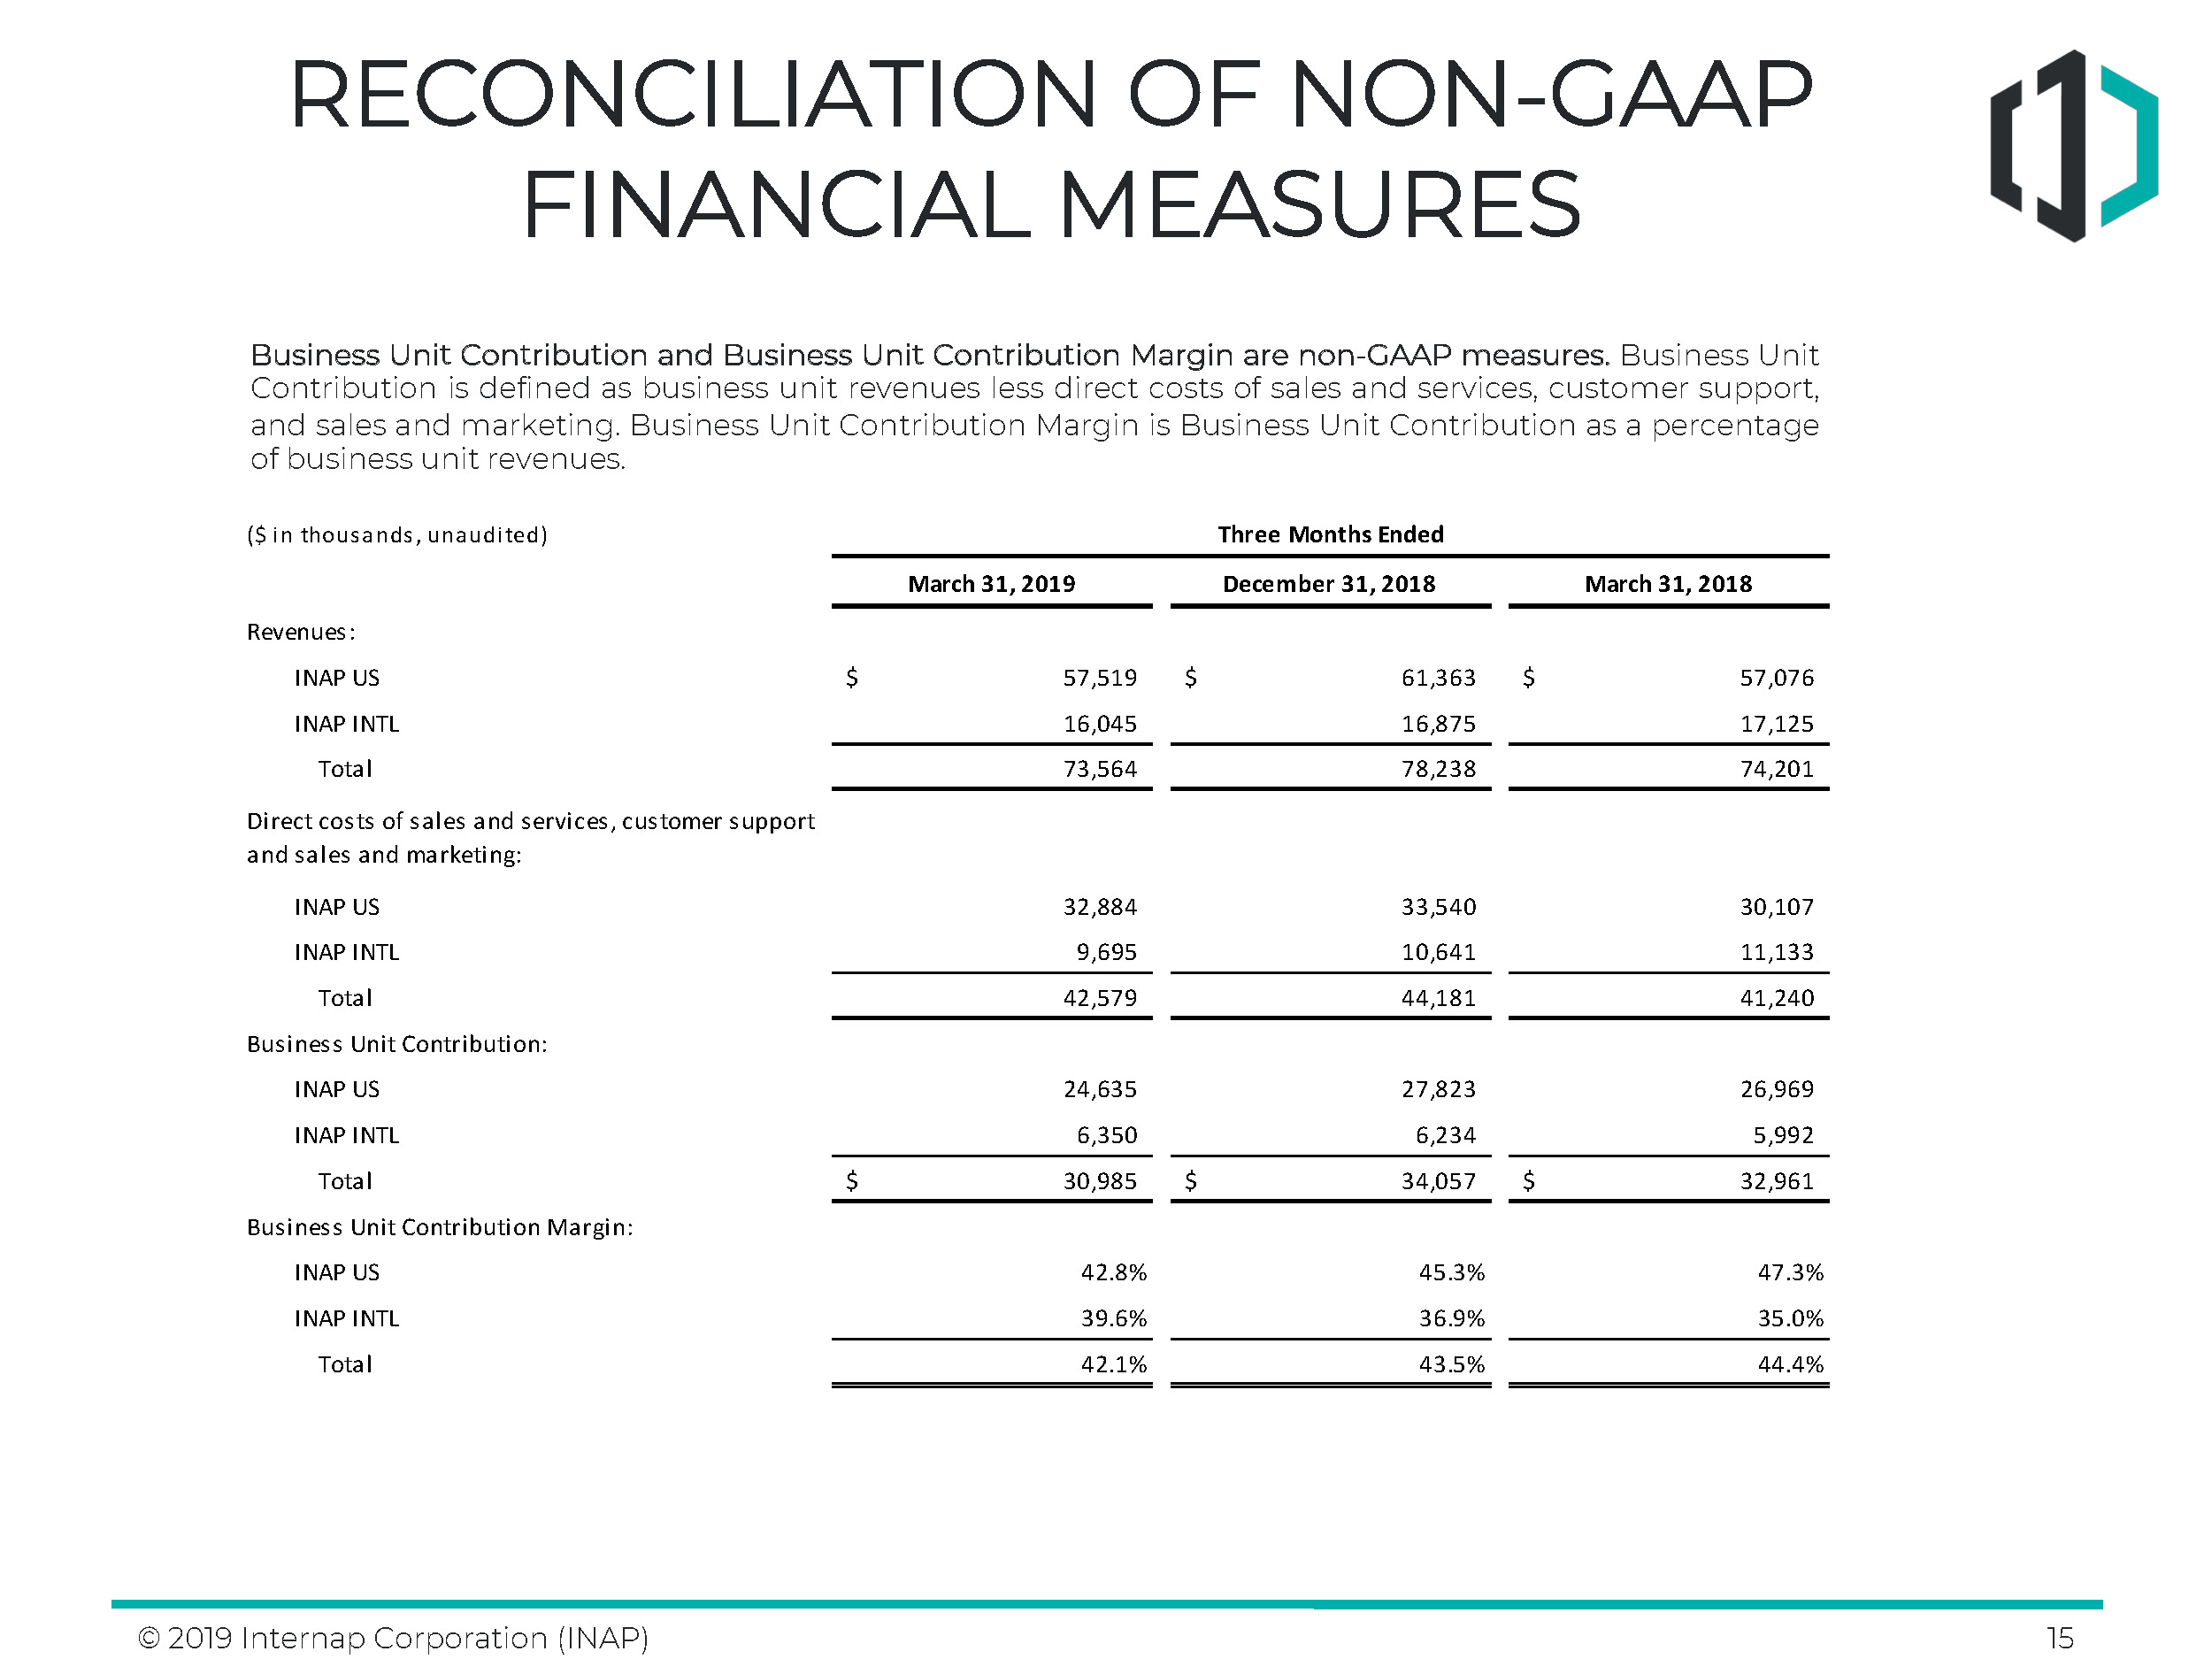
Business unit contribution and business unit contribution margin are non-GAAP financial measures which we define in an attachment to this press release
entitled “Non-GAAP (Adjusted) Financial Measures.” Reconciliations between GAAP and non-GAAP information related to business unit contribution and business unit contribution margin are contained in the table entitled “Business Unit
Contribution and Business Unit Contribution Margin” in the attachment. Business unit contribution margin is business unit contribution as a percentage of revenue.
|
| 4. |
Free cash flow and unlevered free cash flow are non-GAAP financial measures which we define in the attachment to the press release entitled “Non-GAAP
(Adjusted) Financial Measures.” Reconciliations between GAAP and non-GAAP information related to free cash flow and unlevered free cash flow are contained in the table entitled “Free Cash Flow and Unlevered Free Cash Flow.”
|
Conference Call Information
INAP's first quarter 2019 conference call will be held today at 8:30 a.m. ET. Listeners may connect to a simultaneous webcast of the call,
which will include accompanying presentation slides, on the Investor Relations section of INAP’s web site at http://ir.inap.com/events-and-presentations.
The call can be accessed by dialing 877-334-0775. International callers should dial 631-291-4567. An online archive of the webcast will be
archived in the Investor Relations section of the Company’s website. An audio-only telephonic replay will be accessible from Thursday, May 9, 2019 at 11:30 a.m. ET through Tuesday, May 14, 2019 at 855-859-2056 using replay code 8878338.
International callers can listen to the archived event at 404-537-3406 using replay code 8878338.
About INAP
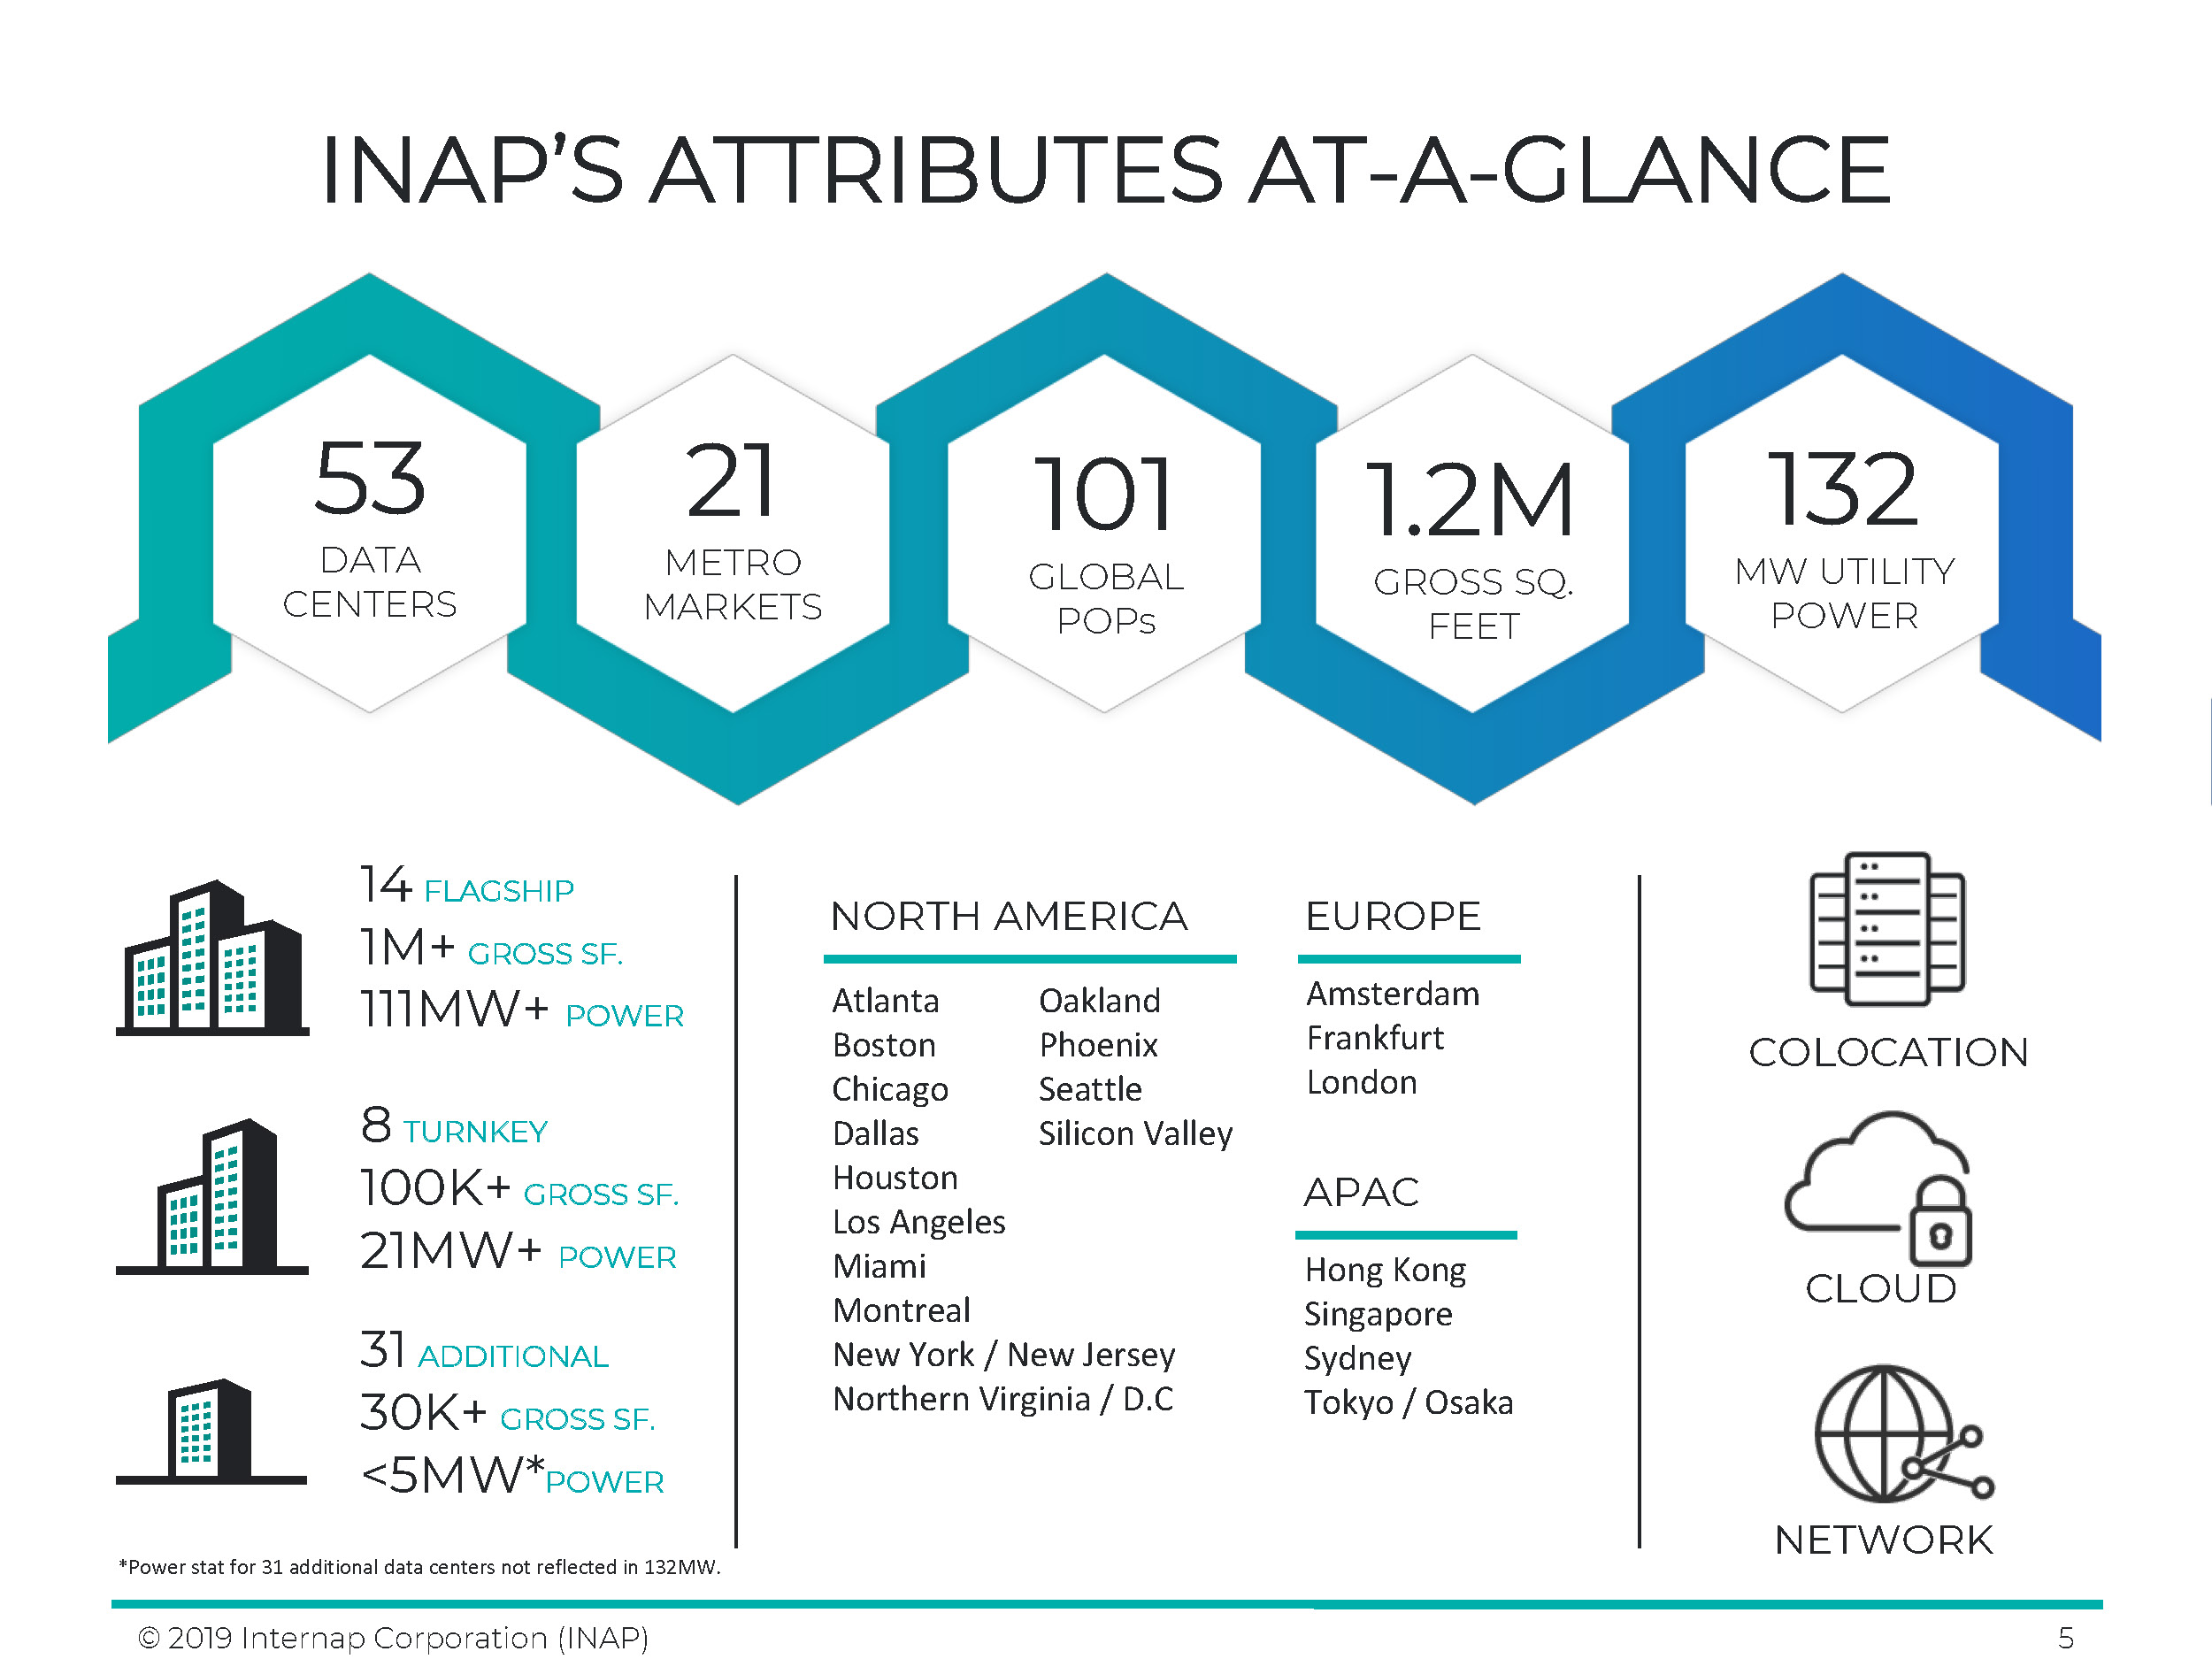
Internap Corporation (NASDAQ: INAP)
is a leading-edge provider of high-performance data center and cloud solutions with over 100 network Points of Presence worldwide. INAP’s full-spectrum portfolio of high-density colocation, managed cloud hosting and network solutions supports
evolving IT infrastructure requirements for customers ranging from the Fortune 500 to emerging startups. INAP operates in 21 metropolitan markets, primarily in North America, with data centers connected by a low-latency, high-capacity fiber
network. INAP has over one million gross square feet in its portfolio, with approximately
600,000 square feet of sellable data
center space. For more information, visit www.INAP.com.
4
Forward-Looking Statements
Certain statements in this press release contain “forward-looking statements” within the meaning of the Private Securities Litigation Reform
Act of 1995. Forward-looking statements include statements regarding industry trends, our future financial position and performance, business strategy, revenues and expenses in future periods, projected levels of growth and other matters that do
not relate strictly to historical facts. These statements are often identified by words such as “may,” “will,” “seeks,” “anticipates,” “believes,” “estimates,” “expects,” “projects,” “forecasts,” “plans,” “intends,” “continue,” “could” or “should,”
that an “opportunity” exists, that we are “positioned” for a particular result, statements regarding our vision or similar expressions or variations. These statements are based on the beliefs and expectations of our management team based on
information available at the time such statements are made. Such forward-looking statements are not guarantees of future performance and are subject to risks and uncertainties that could cause actual results to differ materially from those
contemplated by such forward-looking statements. Therefore, actual future results and trends may differ materially from what is forecast in such forward-looking statements due to a variety of factors, including, without limitation: our ability to
drive growth while reducing costs; our ability to maintain current customers and obtain new ones, whether in a cost-effective manner or at all; the robustness of the IT infrastructure services market; our ability to achieve or sustain
profitability; our ability to expand margins and drive higher returns on investment; our ability to sell into new and existing data center space; the actual performance of our IT infrastructure services and our ability to improve operations; our
ability to correctly forecast capital needs, demand and space utilization; our ability to respond successfully to technological change and the resulting competition; the geographic concentration of our data centers in certain markets and any
adverse developments in local economic conditions or the demand for data center space in these markets; our ability to identify any suitable strategic transactions; our ability to realize anticipated revenue, growth, synergies and cost savings from
the acquisition of SingleHop LLC (“SingleHop”); our ability to successfully integrate SingleHop’s sales, operations, technology, and products generally; the availability of services from Internet network service providers or network service
providers providing network access loops and local loops on favorable terms, or at all; the failure of third party suppliers to deliver their products and services on favorable terms, or at all; failures in our network operations centers, data
centers, network access points or computer systems; our ability to provide or improve Internet infrastructure services to our customers; our ability to protect our intellectual property; our substantial amount of indebtedness, our ability to raise
additional capital when needed, on attractive terms, or at all, and our ability to service existing debt or maintain compliance with financial and other covenants contained in our credit agreement; our compliance with and changes in complex laws
and regulations in the U.S. and internationally; our ability to attract and retain qualified management and other personnel; and volatility in the trading price of INAP common stock.
These risks and other important factors discussed under the caption “Risk Factors” in our most recent Annual Report on Form 10-K filed with
the SEC and our other reports filed with the SEC could cause actual results to differ materially from those expressed or implied by forward-looking statements made by INAP or on our behalf.
Given these risks and uncertainties, investors should not place undue reliance on forward-looking statements as a prediction of actual
results. All forward-looking statements attributable to INAP or persons acting on our behalf are expressly qualified in their entirety by the foregoing forward-looking statements. All such statements speak only as of the date made, and INAP
undertakes no obligation to update or revise publicly any forward-looking statements, whether as a result of new information, future events or otherwise.
5
###
|
Investor Contacts
|
|
|
Richard Ramlall
|
Carolyn Capaccio/Jody Burfening
|
|
Chief Communications Officer INAP
|
LHA
|
|
404-302-9982
|
212-838-3777
|
|
ir@inap.com
|
inap@lhai.com
|
6
INTERNAP CORPORATION AND SUBSIDIARIES
CONDENSED CONSOLIDATED STATEMENTS OF OPERATIONS
AND COMPREHENSIVE LOSS
(In thousands, except per share amounts)
(Unaudited)
|
Three Months Ended
March 31,
|
||||||||
|
2019
|
2018
|
|||||||
|
Net revenues
|
$
|
73,564
|
$
|
74,201
|
||||
|
Operating costs and expenses:
|
||||||||
|
Cost of sales and services, exclusive of depreciation and amortization
|
25,733
|
24,607
|
||||||
|
Costs of customer support
|
8,790
|
7,387
|
||||||
|
Sales, general and administrative
|
17,521
|
19,854
|
||||||
|
Depreciation and amortization
|
22,178
|
21,158
|
||||||
|
Exit activities, restructuring and impairments
|
1,416
|
(33
|
)
|
|||||
|
Total operating costs and expenses
|
75,638
|
72,973
|
||||||
|
(Loss) income from operations
|
(2,074
|
)
|
1,228
|
|||||
|
Interest expense
|
17,447
|
15,604
|
||||||
|
Loss (gain) on foreign currency, net
|
204
|
(215
|
)
|
|||||
|
Total non-operating expenses
|
17,651
|
15,389
|
||||||
|
Loss before income taxes and equity in earnings of equity-method investment
|
(19,725
|
)
|
(14,161
|
)
|
||||
|
(Benefit) provision for income taxes
|
(103
|
)
|
100
|
|||||
|
Net loss
|
(19,622
|
)
|
(14,261
|
)
|
||||
|
Less net income attributable to non-controlling interest
|
22
|
27
|
||||||
|
Net loss attributable to INAP shareholders
|
(19,644
|
)
|
(14,288
|
)
|
||||
|
Other comprehensive income:
|
||||||||
|
Foreign currency translation adjustment
|
197
|
61
|
||||||
|
Total other comprehensive income
|
197
|
61
|
||||||
|
Comprehensive loss
|
$
|
(19,447
|
)
|
$
|
(14,227
|
)
|
||
|
Basic and diluted net loss per share
|
$
|
(0.83
|
)
|
$
|
(0.70
|
)
|
||
|
Weighted average shares outstanding used in computing basic and diluted net loss per share
|
23,652
|
20,052
|
||||||
7
INTERNAP CORPORATION AND SUBSIDIARIES
CONDENSED CONSOLIDATED BALANCE SHEETS
(In thousands, except par value amounts)
(Unaudited)
|
March 31, 2019
|
December 31,
2018
|
|||||||
|
ASSETS
|
||||||||
|
Current assets:
|
||||||||
|
Cash and cash equivalents
|
$
|
8,266
|
$
|
17,823
|
||||
|
Accounts receivable, net of allowance for doubtful accounts of $1,171 and $1,547, respectively
|
21,452
|
20,054
|
||||||
|
Contract assets
|
9,006
|
8,844
|
||||||
|
Prepaid expenses and other assets
|
7,890
|
7,377
|
||||||
|
Total current assets
|
46,614
|
54,098
|
||||||
|
Property and equipment, net
|
229,185
|
478,061
|
||||||
|
Operating lease right-of-use assets
|
27,056
|
-
|
||||||
|
Finance lease right-of-use assets
|
236,077
|
-
|
||||||
|
Intangible assets, net
|
70,441
|
73,042
|
||||||
|
Goodwill
|
116,216
|
116,217
|
||||||
|
Contract assets
|
15,502
|
16,104
|
||||||
|
Deposits and other assets
|
7,251
|
7,409
|
||||||
|
Total assets
|
$
|
748,342
|
$
|
744,931
|
||||
|
LIABILITIES AND STOCKHOLDERS' (DEFICIT) EQUITY
|
||||||||
|
Current liabilities:
|
||||||||
|
Accounts payable
|
$
|
22,368
|
$
|
23,435
|
||||
|
Accrued liabilities
|
14,178
|
15,540
|
||||||
|
Deferred revenues
|
7,881
|
8,022
|
||||||
|
Capital lease obligations
|
-
|
9,080
|
||||||
|
Term loan, less discount and prepaid costs of $4,058 and $4,036, respectively
|
299
|
321
|
||||||
|
Exit activities and restructuring liability
|
1,883
|
2,526
|
||||||
|
Short-term operating lease liabilities
|
5,400
|
-
|
||||||
|
Short-term finance lease liabilities
|
8,328
|
-
|
||||||
|
Other current liabilities
|
33
|
1,063
|
||||||
|
Total current liabilities
|
60,370
|
59,987
|
||||||
|
Deferred revenues
|
341
|
511
|
||||||
|
Operating lease liabilities
|
24,149
|
-
|
||||||
|
Finance lease liabilities
|
262,632
|
-
|
||||||
|
Capital lease obligations
|
-
|
262,382
|
||||||
|
Term loan, less discount and prepaid costs of $8,472 and $9,508, respectively
|
415,226
|
415,278
|
||||||
|
Deferred tax liability
|
1,969
|
2,211
|
||||||
|
Other long-term liabilities
|
3,627
|
4,505
|
||||||
|
Total liabilities
|
$
|
768,314
|
$
|
744,874
|
||||
8
INTERNAP CORPORATION AND SUBSIDIARIES
CONDENSED CONSOLIDATED BALANCE SHEETS
(In thousands, except par value amounts)
(Unaudited)
| March 31, 2019 |
December 31,
2018
|
|||||||
|
Commitments and contingencies
|
||||||||
|
Stockholders' (deficit) equity:
|
||||||||
|
Preferred stock, $0.001 par value; 5,000 shares authorized; no shares issued or outstanding
|
$
|
-
|
$
|
-
|
||||
|
Common stock, $0.001 par value; 50,000 shares authorized; 26,746 and 25,455 shares outstanding, respectively
|
27
|
25
|
||||||
|
Additional paid-in capital
|
1,369,815
|
1,368,968
|
||||||
|
Treasury stock, at cost, 378 and 330, respectively
|
(7,914
|
)
|
(7,646
|
)
|
||||
|
Accumulated deficit
|
(1,382,715
|
)
|
(1,363,019
|
)
|
||||
|
Accumulated items of other comprehensive loss
|
(868
|
)
|
(1,065
|
)
|
||||
|
Total INAP stockholders’ deficit
|
(21,655
|
)
|
(2,737
|
)
|
||||
|
Non-controlling interest
|
1,683
|
2,794
|
||||||
|
Total stockholders' (deficit) equity
|
(19,972
|
)
|
57
|
|||||
|
Total liabilities and stockholders’ (deficit) equity
|
$
|
748,342
|
$
|
744,931
|
||||
9
INTERNAP CORPORATION AND SUBSIDIARIES
CONDENSED CONSOLIDATED STATEMENTS OF CASH FLOWS
(In thousands)
(Unaudited)
|
Three Months Ended
March 31,
|
||||||||
|
2019
|
2018
|
|||||||
|
Cash Flows from Operating Activities:
|
||||||||
|
Net loss
|
$
|
(19,622
|
)
|
$
|
(14,261
|
)
|
||
|
Adjustments to reconcile net loss to net cash provided by operating activities:
|
||||||||
|
Depreciation and amortization
|
22,178
|
21,158
|
||||||
|
Loss on disposal of fixed asset
|
528
|
46
|
||||||
|
Amortization of debt discount and issuance costs
|
1,097
|
638
|
||||||
|
Stock-based compensation expense, net of capitalized amount
|
890
|
858
|
||||||
|
Provision for doubtful accounts
|
248
|
332
|
||||||
|
Non-cash change in finance lease obligations
|
148
|
(213
|
)
|
|||||
|
Non-cash change in exit activities and restructuring liability
|
1,226
|
372
|
||||||
|
Deferred taxes
|
(261
|
)
|
(30
|
)
|
||||
|
Other, net
|
(66
|
)
|
(233
|
)
|
||||
|
Changes in operating assets and liabilities:
|
||||||||
|
Accounts receivable
|
(1,617
|
)
|
864
|
|||||
|
Prepaid expenses, deposits and other assets
|
1,043
|
(467
|
)
|
|||||
|
Accounts payable
|
763
|
(636
|
)
|
|||||
|
Accrued and other liabilities
|
(2,238
|
)
|
(2,904
|
)
|
||||
|
Deferred revenues
|
(262
|
)
|
(138
|
)
|
||||
|
Exit activities and restructuring liability
|
(1,903
|
)
|
(1,389
|
)
|
||||
|
Asset retirement obligation
|
85
|
(248
|
)
|
|||||
|
Other liabilities
|
25
|
(52
|
)
|
|||||
|
Net cash provided by operating activities
|
2,262
|
3,697
|
||||||
|
Cash Flows from Investing Activities:
|
||||||||
|
Purchases of property and equipment
|
(8,094
|
)
|
(6,082
|
)
|
||||
|
Proceeds from disposal of property and equipment
|
56
|
437
|
||||||
|
Business acquisition, net of cash acquired
|
-
|
(132,143
|
)
|
|||||
|
Additions to acquired and developed technology
|
(530
|
)
|
(277
|
)
|
||||
|
Net cash used in investing activities
|
$
|
(8,568
|
)
|
$
|
(138,065
|
)
|
||
10
INTERNAP CORPORATION AND SUBSIDIARIES
CONDENSED CONSOLIDATED STATEMENTS OF CASH FLOWS
(In thousands)
(Unaudited)
|
Three Months Ended
March 31,
|
||||||||
| 2019 | 2018 | |||||||
|
Cash Flows from Financing Activities:
|
||||||||
|
Proceeds from credit agreements
|
$
|
-
|
$
|
146,000
|
||||
|
Proceeds from stock issuance, net
|
(37
|
)
|
-
|
|||||
|
Principal payments on credit agreements
|
(1,089
|
)
|
(1,089
|
)
|
||||
|
Debt issuance costs
|
-
|
(5,976
|
)
|
|||||
|
Payments on finance lease obligations
|
(907
|
)
|
(1,897
|
)
|
||||
|
Acquisition of non-controlling interests
|
(973
|
)
|
(1,130
|
)
|
||||
|
Proceeds from exercise of stock options
|
-
|
31
|
||||||
|
Acquisition of common stock for income tax withholdings
|
(268
|
)
|
(270
|
)
|
||||
|
Other, net
|
(23
|
)
|
235
|
|||||
|
Net cash (used in) provided by financing activities
|
(3,297
|
)
|
135,904
|
|||||
|
Effect of exchange rates on cash and cash equivalents
|
46
|
20
|
||||||
|
Net (decrease) increase in cash and cash equivalents
|
(9,557
|
)
|
1,556
|
|||||
|
Cash and cash equivalents at beginning of period
|
17,823
|
14,603
|
||||||
|
Cash and cash equivalents at end of period
|
$
|
8,266
|
$
|
16,159
|
||||
|
Supplemental Disclosures of Cash Flow Information:
|
||||||||
|
Cash paid for interest
|
$
|
14,260
|
$
|
13,577
|
||||
|
Additions to property and equipment included in accounts payable
|
1,850
|
2,287
|
||||||
11
INTERNAP CORPORATION
NON-GAAP (ADJUSTED) FINANCIAL MEASURES
In addition to providing financial measurements based on accounting principles generally accepted in the United States of America (“GAAP”),
this earnings press release includes additional financial measures that are not prepared in accordance with GAAP (“non-GAAP”), including Adjusted EBITDA, Adjusted EBITDA margin, Adjusted EBITDA less CapEx, normalized net loss, business unit
contribution, business unit contribution margin, free cash flow and unlevered free cash flow. A reconciliation of non-GAAP financial measures to the most directly comparable GAAP financial measures can be found below.
We define the following non-GAAP measures as follows:
| • |
Adjusted EBITDA is a non-GAAP measure and is GAAP net loss attributable to INAP shareholders plus depreciation and amortization, interest expense, provision
(benefit) for income taxes, other (income) expense, (gain) loss on disposal of property and equipment, exit activities, restructuring and impairments, stock-based compensation, non-income tax contingency, strategic alternatives and
related costs, organizational realignment costs, acquisition costs and claim settlement.
|
| • |
Adjusted EBITDA margin is Adjusted EBITDA as a percentage of revenues.
|
| • |
Adjusted EBITDA less CapEx is Adjusted EBITDA less capital expenditures with Adjusted EBITDA for this non-GAAP measure defined as net cash flow provided by
operating activities plus cash paid for interest, cash paid for income taxes, cash paid for exit activities and restructuring, cash paid for strategic alternatives and related costs, cash paid for organizational realignment costs and
other working capital changes less capital expenditures.
|
| • |
Normalized net loss is GAAP net loss attributable to INAP shareholders plus exit activities, restructuring and impairments, stock-based compensation,
non-income tax contingency, strategic alternatives, realignment and related costs and acquisition costs.
|
| • |
Business unit contribution is business unit revenues less direct costs of sales and services, customer support, and sales and marketing, exclusive of
depreciation and amortization.
|
| • |
Business unit contribution margin is business unit contribution as a percentage of business unit revenue.
|
| • |
Free cash flow is net cash flows provided by operating activities minus capital expenditures.
|
| • |
Unlevered free cash flow is free cash flow plus cash interest expense.
|
We believe that presentation of these non-GAAP financial measures provides useful information to investors regarding our results of
operations.
We believe that excluding depreciation and amortization and (gain) loss on disposals of property and equipment, as well as restructuring and
impairments, to calculate Adjusted EBITDA provides supplemental information and an alternative presentation that is useful to investors’ understanding of our current ongoing operating results and trends. Not only are depreciation and amortization
expenses based on historical costs of assets that may have little bearing on present or future replacement costs, but also they are based on management estimates of remaining useful lives. Loss on disposals of property and equipment is also based
on historical costs of assets that may have little bearing on replacement costs. Impairments and restructuring expenses primarily reflect goodwill impairments and subsequent plan adjustments in sublease income assumptions for certain properties
included in our previously disclosed restructuring plans.
We believe that excluding interest expense, provision (benefit) for income taxes and other (income) expense from non-GAAP financial measures
provides supplemental information and an alternative presentation useful to investors’ understanding of our core operating results and trends. Investors have indicated that they consider financial measures of our results of operations excluding
interest expense, provision (benefit) for income taxes and other (income) expense as important supplemental information useful to their understanding of our historical results and estimating our future results.
12
INTERNAP CORPORATION
NON-GAAP (ADJUSTED) FINANCIAL MEASURES (Continued)
We also believe that, in excluding the effects of interest expense, provision (benefit) for income taxes and other (income) expense, our
non-GAAP financial measures provide investors with transparency into what management uses to measure and forecast our results of operations, to compare on a consistent basis our results of operations for the current period to that of prior periods
and to compare our results of operations on a more consistent basis against that of other companies, in making financial and operating decisions and to establish certain management compensation.
We believe that exit activities, restructuring and impairment charges, non-income tax contingency, strategic alternatives and related costs,
organizational realignment costs, acquisition costs and claim settlement costs are unique costs, and consequently, we do not consider these charges as a normal component of expenses related to current and ongoing operations.
Similarly, we believe that excluding the effects of stock-based compensation from non-GAAP financial measures provides supplemental
information and an alternative presentation useful to investors’ understanding of our current ongoing operating results and trends. Management believes that investors consider financial measures of our results of operations excluding stock-based
compensation as important supplemental information useful to their understanding of our historical results and estimating our future results.
We also believe that, in excluding the effects of stock-based compensation, our non-GAAP financial measures provide investors with
transparency into what management uses to measure and forecast our results of operations, to compare on a consistent basis our results of operations for the current period to that of prior periods and to compare our results of operations on a more
consistent basis against that of other companies, in making financial and operating decisions and to establish certain management compensation.
Stock-based compensation is an important part of total compensation, especially from the perspective of employees. We believe, however, that
supplementing GAAP net loss by providing normalized net loss, excluding the effect of exit activities, restructuring and impairments, stock-based compensation, non-income tax contingency, strategic alternatives and related costs, organizational
realignment costs, acquisition costs and claim settlement costs, in all periods, is useful to investors because it enables additional and more meaningful period-to-period comparisons.
Adjusted EBITDA is not a measure of financial performance calculated in accordance with GAAP, and should be viewed as a supplement to - not a
substitute for - our results of operations presented on the basis of GAAP. Adjusted EBITDA does not purport to represent cash flow provided by operating activities as defined by GAAP. Our statements of cash flows present our cash flow activity in
accordance with GAAP. Furthermore, Adjusted EBITDA is not necessarily comparable to similarly-titled measures reported by other companies.
We believe Adjusted EBITDA is used by and is useful to investors and other users of our financial statements in evaluating our operating
performance because it provides them with an additional tool to compare business performance across companies and across periods. We believe that:
| • |
EBITDA is widely used by investors to measure a company’s operating performance without regard to items such as interest expense, income taxes, depreciation
and amortization, which can vary substantially from company-to-company depending upon accounting methods and book value of assets, capital structure and the method by which assets were acquired; and
|
| • |
investors commonly adjust EBITDA information to eliminate the effect of disposals of property and equipment, impairments, restructuring and stock-based
compensation which vary widely from company-to-company and impair comparability.
|
13
INTERNAP CORPORATION
NON-GAAP (ADJUSTED) FINANCIAL MEASURES (Continued)
Our management uses Adjusted EBITDA:
| • |
as a measure of operating performance to assist in comparing performance from period-to-period on a consistent basis;
|
| • |
as a measure for planning and forecasting overall expectations and for evaluating actual results against such expectations; and
|
| • |
in communications with the board of directors, analysts and investors concerning our financial performance.
|
Our presentation of business unit contribution and business unit contribution margin excludes depreciation and amortization in order to allow
investors to see the business through the eyes of management.
We also have excluded depreciation and amortization from business unit contribution and business unit contribution margin because, as noted
above, they are based on estimated useful lives of tangible and intangible assets. Further, depreciation and amortization are based on historical costs incurred to build out our deployed network and the historical costs of these assets may not be
indicative of current or future capital expenditures.
Free cash flow and unlevered free cash flow are used in addition to and in conjunction with results presented in accordance with GAAP. Free
cash flow and unlevered free cash flow should not be relied upon to the exclusion of GAAP financial measures. Free cash flow and unlevered free cash flow reflect an additional way of viewing our liquidity that, when viewed with our GAAP results,
provides a more complete understanding of factors and trends affecting our cash flows. Management strongly encourages investors to review our financial statements and publicly-filed reports in their entirety and to not rely on any single financial
measure.
We use free cash flow and unlevered free cash flow, and ratios based on it, to conduct and evaluate our business because, although it is
similar to cash flow from operations, we believe it is a useful measure of cash flows since capital expenditures are a necessary component of ongoing operations. In limited circumstances in which proceeds from sales of fixed assets exceed capital
expenditures, free cash flow would exceed cash flow from operations. However, since we do not anticipate being a net seller of fixed assets, we expect free cash flow to be less than operating cash flows.
Free cash flow and unlevered free cash flow have limitations due to the fact that they do not represent the residual cash flow available for
discretionary expenditures. For example, free cash flow does not incorporate payments made to service our debt or capital lease obligations. Therefore, we believe it is important to view free cash flow as a complement to our entire consolidated
statements of cash flows.
Adjusted EBITDA less CapEx is used in addition to and in conjunction with results presented in accordance with GAAP. Adjusted EBITDA less
CapEx should not be relied upon to the exclusion of GAAP financial measures. Adjusted EBITDA less CapEx reflects an additional way of viewing our liquidity that, when viewed with our GAAP results, provides a more complete understanding of factors
and trends affecting our cash flows. Management strongly encourages investors to review our financial statements and publicly-filed reports in their entirety and to not rely on any single financial measure.
We use Adjusted EBITDA less CapEx, and ratios based on it, to conduct and evaluate our business because, although it is similar to cash flow
from operations, we believe it is a useful measure of cash flows since capital expenditures are a necessary component of ongoing operations.
Adjusted EBITDA less CapEx has limitations due to the fact that it does not represent the residual cash flow available for discretionary
expenditures. Adjusted EBITDA less CapEx does not incorporate payments made to service our debt or capital lease obligations. Therefore, we believe it is important to view Adjusted EBITDA less CapEx as a complement to our entire consolidated
statements of cash flows.
Adjusted EBITDA, as presented, may not be comparable to similarly titled measures of other companies. Adjusted EBITDA is presented as we
understand certain investors use it as one measure of our historical ability to service debt. Also Adjusted EBITDA is used in our debt covenants.
14
INTERNAP CORPORATION
NON-GAAP (ADJUSTED) FINANCIAL MEASURES (Continued)
Although we believe, for the foregoing reasons, that our presentation of non-GAAP financial measures provides useful supplemental information
to investors regarding our results of operations, our non-GAAP financial measures should only be considered in addition to, and not as a substitute for, or superior to, any measure of financial performance prepared in accordance with GAAP.
15
INTERNAP CORPORATION
NON-GAAP (ADJUSTED) FINANCIAL MEASURES (Continued)
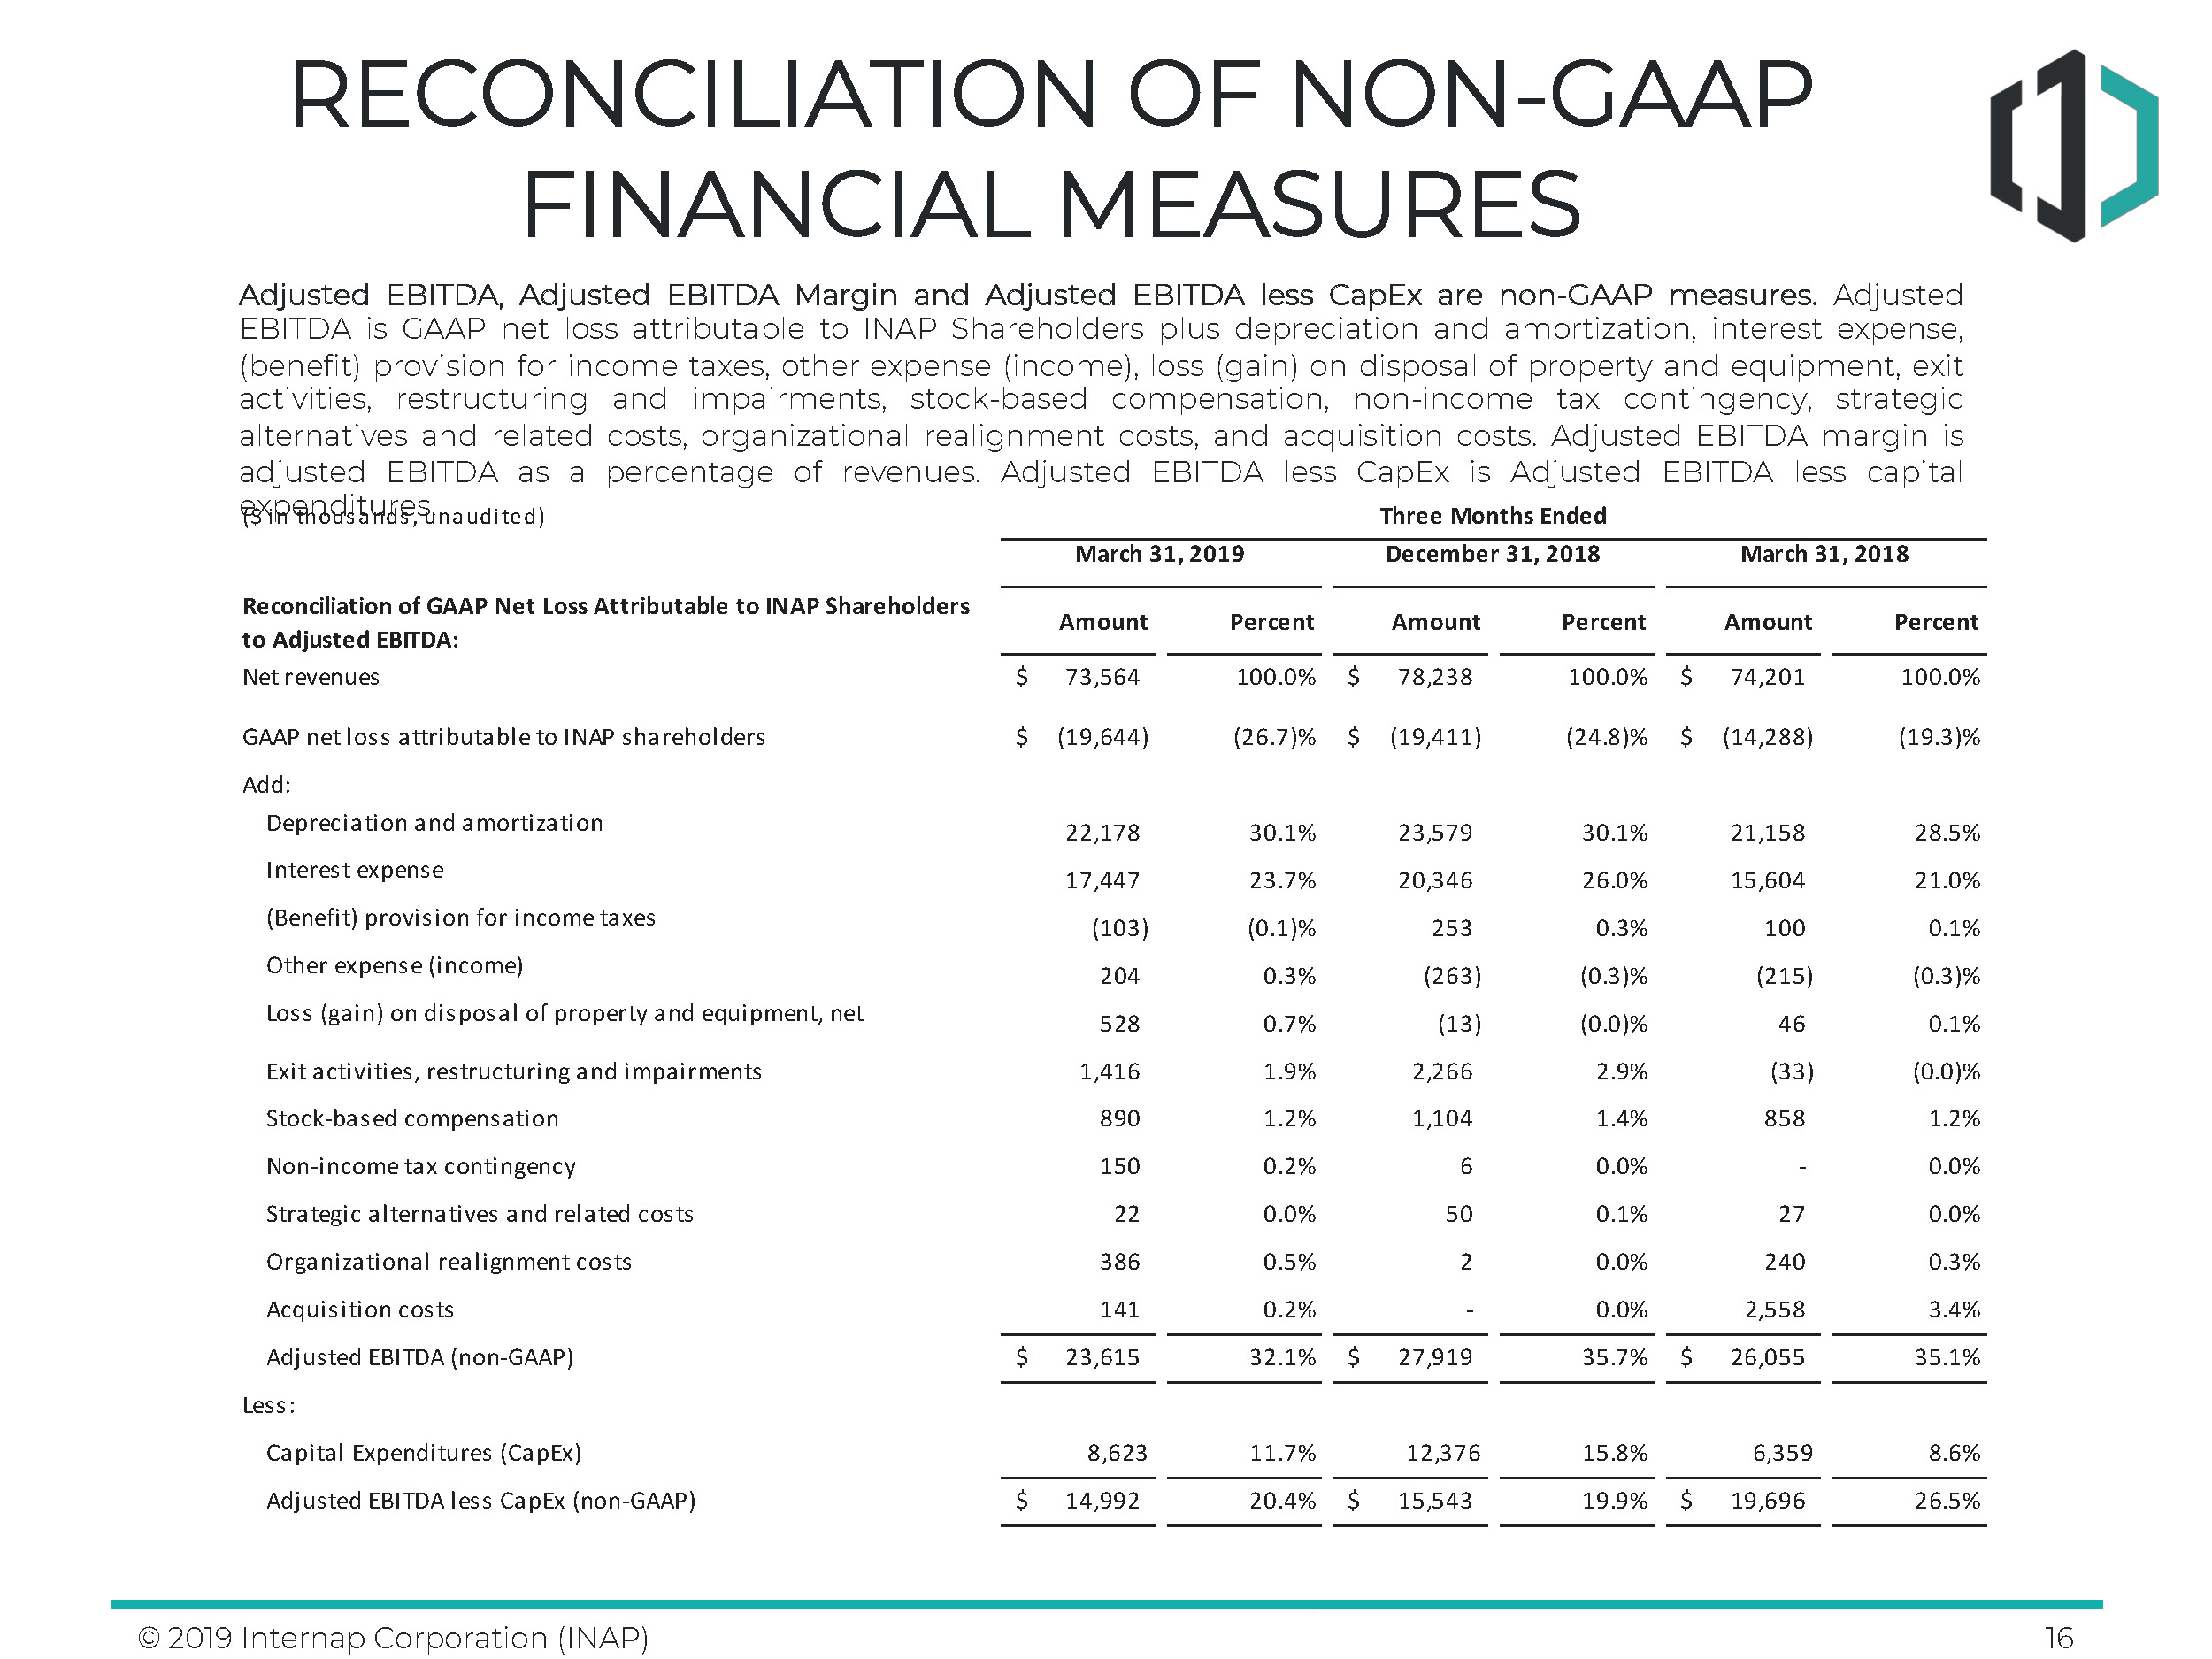
RECONCILIATION OF GAAP NET LOSS ATTRIBUTABLE TO INAP SHAREHOLDERS TO ADJUSTED EBITDA
A reconciliation of GAAP net loss attributable to INAP shareholders to Adjusted EBITDA (non-GAAP) for each of the periods indicated is as
follows (in thousands, unaudited):
|
Three Months Ended
|
||||||||||||||||||||||||
|
March 31, 2019
|
December 31, 2018
|
March 31, 2018
|
||||||||||||||||||||||
|
Reconciliation of GAAP Net Loss Attributable to INAP Shareholders to Adjusted EBITDA:
|
Amount
|
Percent
|
Amount
|
Percent
|
Amount
|
Percent
|
||||||||||||||||||
|
Net revenues
|
$
|
73,564
|
100.0
|
%
|
$
|
78,238
|
100.0
|
%
|
$
|
74,201
|
100.0
|
%
|
||||||||||||
|
GAAP net loss attributable to INAP shareholders
|
$
|
(19,644
|
)
|
(26.7
|
)%
|
$
|
(19,411
|
)
|
(24.8
|
)%
|
$
|
(14,288
|
)
|
(19.3
|
)%
|
|||||||||
|
Add:
|
||||||||||||||||||||||||
|
Depreciation and amortization
|
22,178
|
30.1
|
%
|
23,579
|
30.1
|
%
|
21,158
|
28.5
|
%
|
|||||||||||||||
|
Interest expense
|
17,447
|
23.7
|
%
|
20,346
|
26.0
|
%
|
15,604
|
21.0
|
%
|
|||||||||||||||
|
(Benefit) provision for income taxes
|
(103
|
)
|
(0.1
|
)%
|
253
|
0.3
|
%
|
100
|
0.1
|
%
|
||||||||||||||
|
Other expense (income)
|
204
|
0.3
|
%
|
(263
|
)
|
(0.3
|
)%
|
(215
|
)
|
(0.3
|
)%
|
|||||||||||||
|
Loss (gain) on disposal of property and equipment, net
|
528
|
0.7
|
%
|
(13
|
)
|
(0.0
|
)%
|
46
|
0.1
|
%
|
||||||||||||||
|
Exit activities, restructuring and impairments
|
1,416
|
1.9
|
%
|
2,266
|
2.9
|
%
|
(33
|
)
|
(0.0
|
)%
|
||||||||||||||
|
Stock-based compensation
|
890
|
1.2
|
%
|
1,104
|
1.4
|
%
|
858
|
1.2
|
%
|
|||||||||||||||
|
Non-income tax contingency
|
150
|
0.2
|
%
|
6
|
0.0
|
%
|
-
|
-
|
||||||||||||||||
|
Strategic alternatives and related costs
|
22
|
0.0
|
%
|
50
|
0.1
|
%
|
27
|
0.0
|
%
|
|||||||||||||||
|
Organizational realignment costs
|
386
|
0.5
|
%
|
2
|
0.0
|
%
|
240
|
0.3
|
%
|
|||||||||||||||
|
Acquisition costs
|
141
|
0.2
|
%
|
-
|
-
|
2,558
|
3.4
|
%
|
||||||||||||||||
|
Adjusted EBITDA (non-GAAP)
|
$
|
23,615
|
32.1
|
%
|
$
|
27,919
|
35.7
|
%
|
$
|
26,055
|
35.1
|
%
|
||||||||||||
|
Less:
|
||||||||||||||||||||||||
|
Capital Expenditures (CapEx)
|
8,623
|
11.7
|
%
|
12,376
|
15.8
|
%
|
6,359
|
8.6
|
%
|
|||||||||||||||
|
Adjusted EBITDA less CapEx (non-GAAP)
|
$
|
14,992
|
20.4
|
%
|
$
|
15,543
|
19.9
|
%
|
$
|
19,696
|
26.5
|
%
|
||||||||||||
16
INTERNAP CORPORATION
NON-GAAP (ADJUSTED) FINANCIAL MEASURES (Continued)
A reconciliation of forward looking GAAP net loss attributable to INAP shareholders to Adjusted EBITDA (non-GAAP) for full-year 2019 is as
follows (in millions, unaudited):
|
2019 Guidance (Reaffirmed)
|
||||||||
|
Low
|
High
|
|||||||
|
Net revenues
|
$
|
320
|
$
|
330
|
||||
|
GAAP net loss attributable to INAP shareholders
|
$
|
(47
|
)
|
$
|
(37
|
)
|
||
|
Add:
|
||||||||
|
Depreciation and amortization
|
90
|
90
|
||||||
|
Interest expense
|
68
|
68
|
||||||
|
Exit activities, restructuring and impairments
|
2
|
2
|
||||||
|
Stock-based compensation
|
5
|
5
|
||||||
|
Non-income tax contingency and acquisition costs
|
2
|
2
|
||||||
|
Adjusted EBITDA (non-GAAP)
|
$
|
120
|
$
|
130
|
||||
17
INTERNAP CORPORATION
NON-GAAP (ADJUSTED) FINANCIAL MEASURES (Continued)
RECONCILIATION OF GAAP NET LOSS ATTRIBUTABLE TO INAP SHAREHOLDERS TO
NORMALIZED NET LOSS TO INAP SHAREHOLDERS
Reconciliations of GAAP net loss attributable to INAP shareholders, the most directly comparable GAAP measure, to normalized net loss
(non-GAAP) attributable to INAP shareholders (in thousands, unaudited):
|
Three Months Ended
|
||||||||||||
|
March 31, 2019
|
December 31, 2018
|
March 31, 2018
|
||||||||||
|
GAAP net loss attributable to INAP shareholders
|
$
|
(19,644
|
)
|
$
|
(19,411
|
)
|
$
|
(14,288
|
)
|
|||
|
Exit activities, restructuring and impairments
|
1,416
|
2,266
|
(33
|
)
|
||||||||
|
Stock-based compensation
|
890
|
1,104
|
858
|
|||||||||
|
Strategic alternatives, realignment, and related costs
|
408
|
50
|
267
|
|||||||||
|
Acquisition costs
|
141
|
-
|
2,558
|
|||||||||
|
Non-income tax contingency
|
150
|
6
|
-
|
|||||||||
|
Normalized net loss (non-GAAP) attributable to INAP shareholders
|
$
|
(16,639
|
)
|
$
|
(15,985
|
)
|
$
|
(10,638
|
)
|
|||
18
INTERNAP CORPORATION
NON-GAAP (ADJUSTED) FINANCIAL MEASURES (Continued)
BUSINESS UNIT CONTRIBUTION AND BUSINESS UNIT CONTRIBUTION MARGIN
Business unit contribution and business unit contribution margin, which includes direct costs of sales and service, customer support and
sales and marketing for each of the periods indicated is as follows (in thousands, unaudited):
|
Three Months Ended
|
||||||||||||
|
March 31, 2019
|
December 31, 2018
|
March 31, 2018
|
||||||||||
|
Revenues:
|
||||||||||||
|
INAP US
|
$
|
57,519
|
$
|
61,363
|
$
|
57,076
|
||||||
|
INAP INTL
|
16,045
|
16,875
|
17,125
|
|||||||||
|
Total
|
73,564
|
78,238
|
74,201
|
|||||||||
|
Direct costs of sales and services, customer support and sales and marketing:
|
||||||||||||
|
INAP US
|
32,884
|
33,540
|
30,107
|
|||||||||
|
INAP INTL
|
9,695
|
10,641
|
11,133
|
|||||||||
|
Total
|
42,579
|
44,181
|
41,240
|
|||||||||
|
Business Unit Contribution:
|
||||||||||||
|
INAP US
|
24,635
|
27,823
|
26,969
|
|||||||||
|
INAP INTL
|
6,350
|
6,234
|
5,992
|
|||||||||
|
Total
|
$
|
30,985
|
$
|
34,057
|
$
|
32,961
|
||||||
|
Business Unit Contribution Margin:
|
||||||||||||
|
INAP US
|
42.8
|
%
|
45.3
|
%
|
47.3
|
%
|
||||||
|
INAP INTL
|
39.6
|
%
|
36.9
|
%
|
35.0
|
%
|
||||||
|
Total
|
42.1
|
%
|
43.5
|
%
|
44.4
|
%
|
||||||
19
INTERNAP CORPORATION
NON-GAAP (ADJUSTED) FINANCIAL MEASURES (Continued)
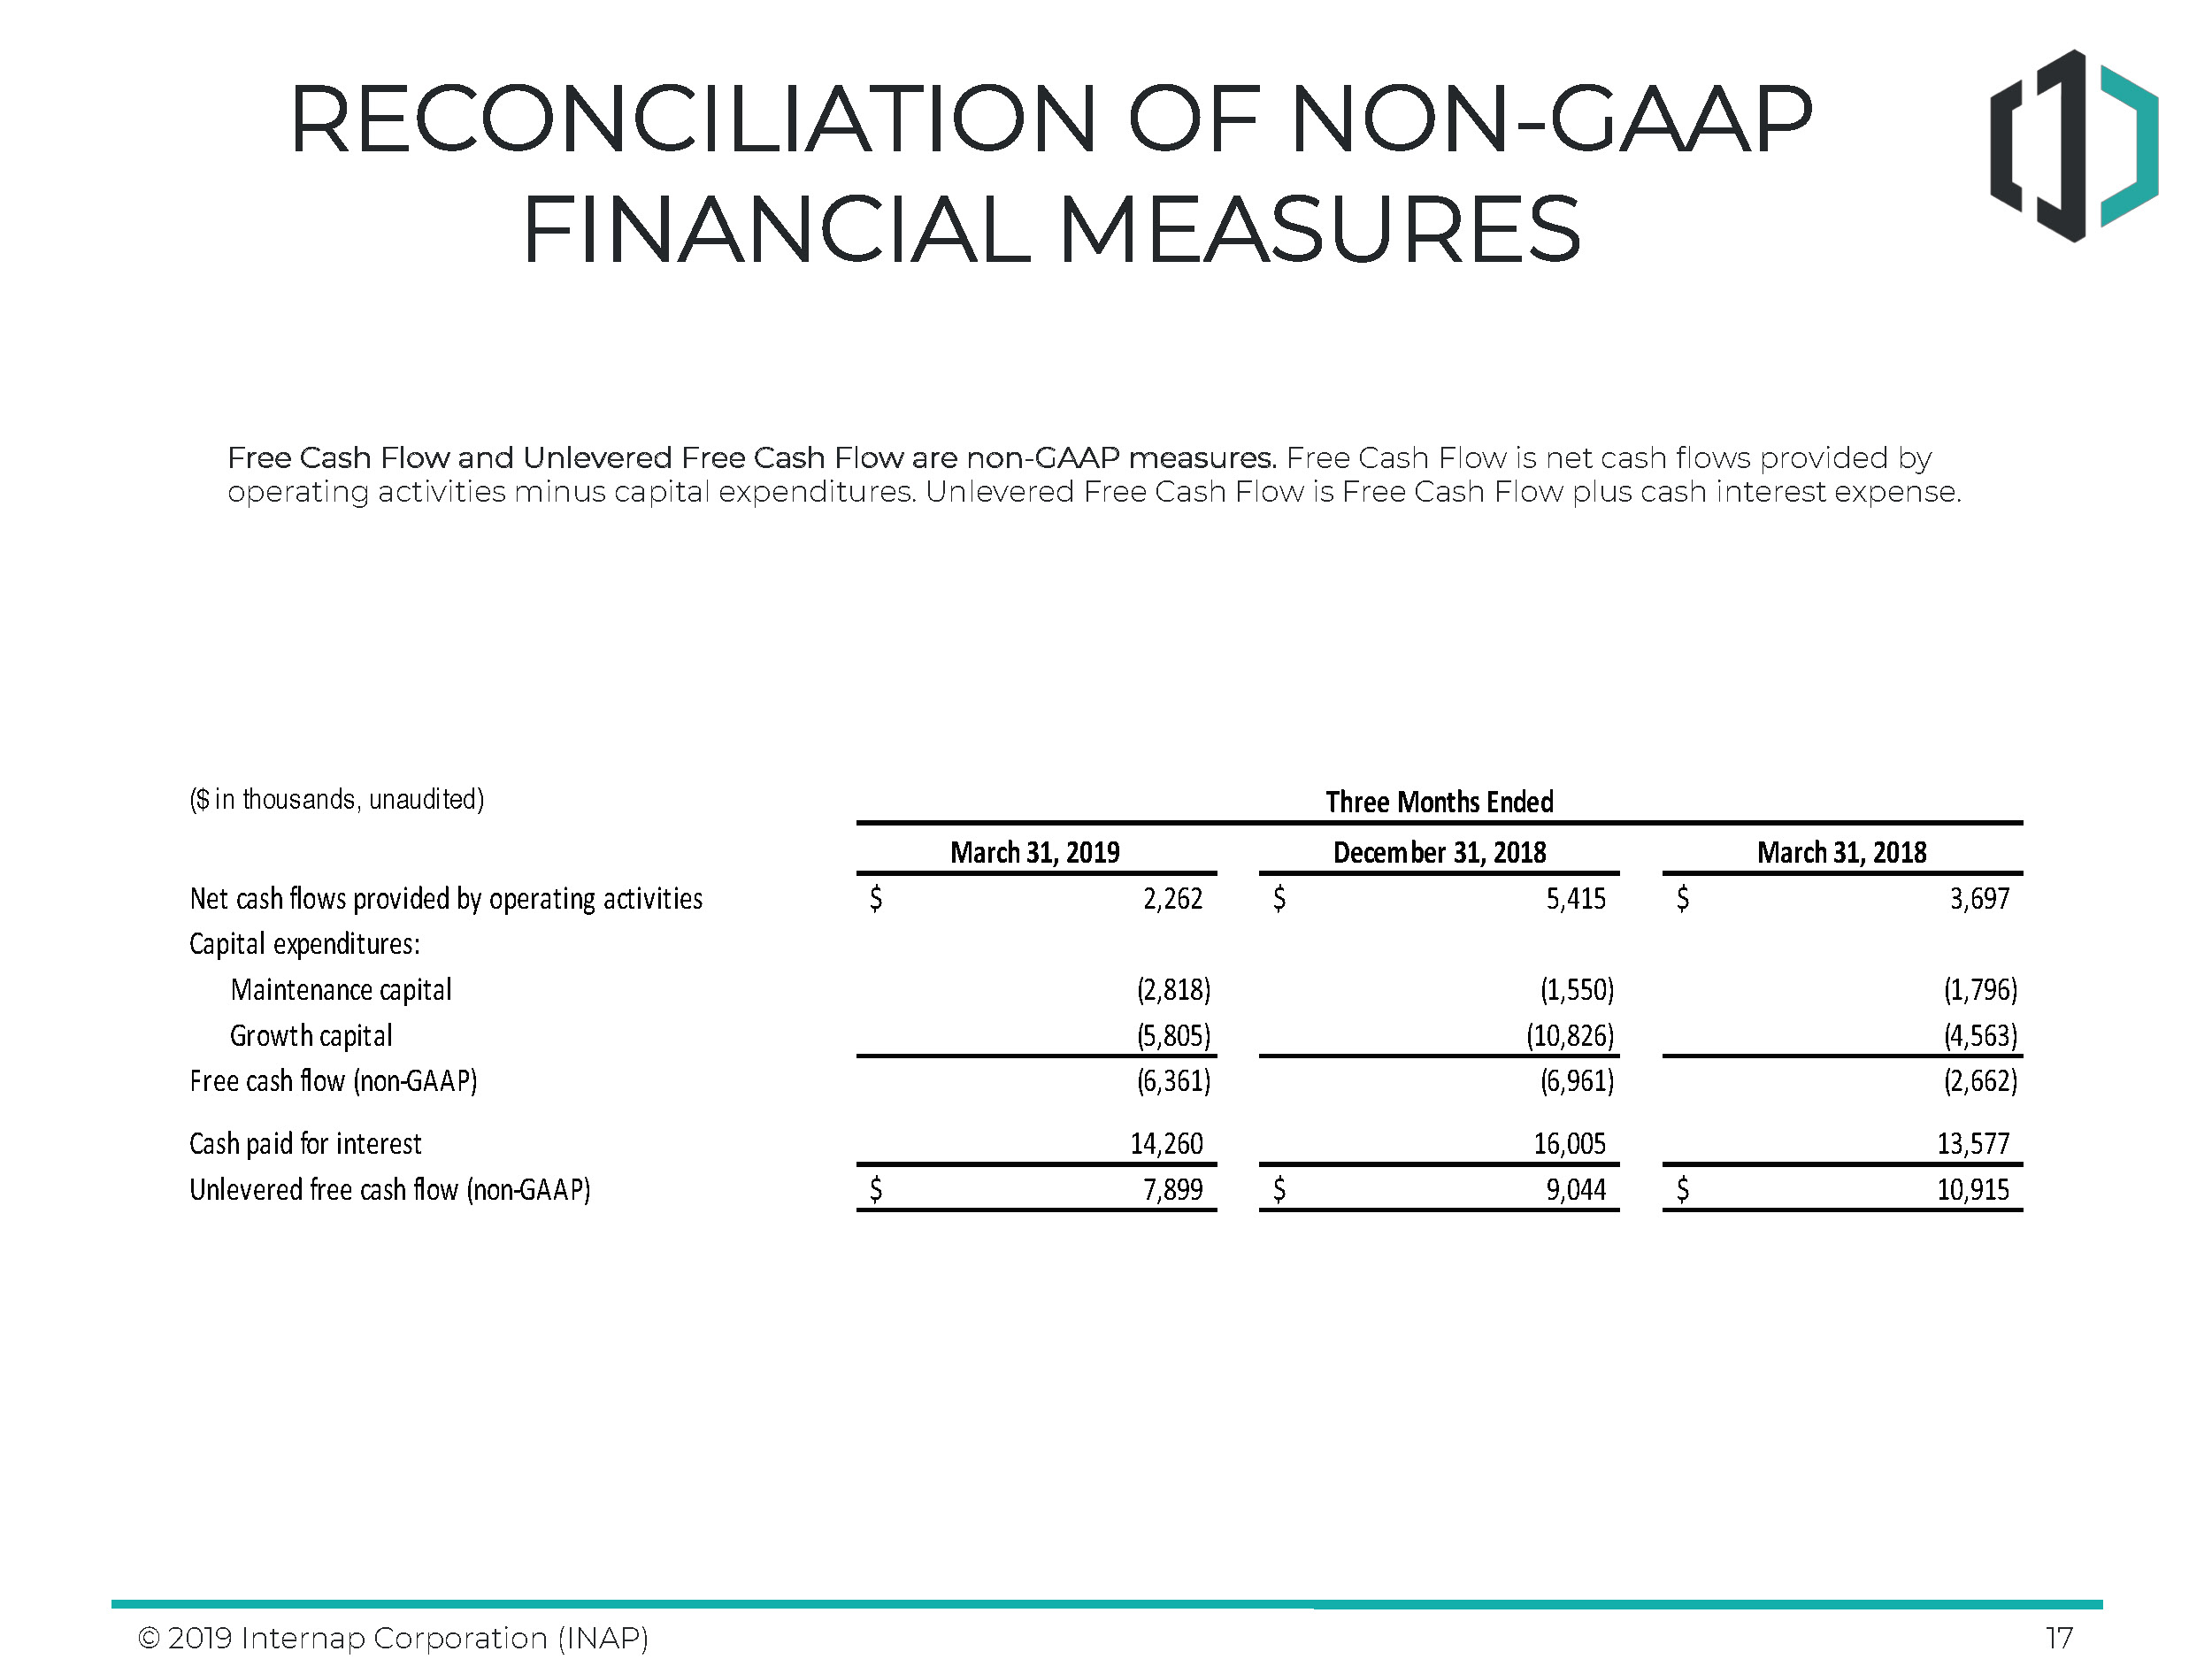
FREE CASH FLOW AND UNLEVERED FREE CASH FLOW
Free cash flow and unlevered free cash flow are non-GAAP measures. Free cash flow is net cash flows provided by operating activities minus
capital expenditures. Unlevered free cash flow is free cash flow plus cash interest expense (in thousands, unaudited):
|
Three Months Ended
|
||||||||||||
|
March 31, 2019
|
December 31, 2018
|
March 31, 2018
|
||||||||||
|
Net cash flows provided by operating activities
|
$
|
2,262
|
$
|
5,415
|
$
|
3,697
|
||||||
|
Capital expenditures:
|
||||||||||||
|
Maintenance capital
|
(2,818
|
)
|
(1,550
|
)
|
(1,796
|
)
|
||||||
|
Growth capital
|
(5,805
|
)
|
(10,826
|
)
|
(4,563
|
)
|
||||||
|
Free cash flow (non-GAAP)
|
(6,361
|
)
|
(6,961
|
)
|
(2,662
|
)
|
||||||
|
Cash paid for interest
|
14,260
|
16,005
|
13,577
|
|||||||||
|
Unlevered free cash flow (non-GAAP)
|
$
|
7,899
|
$
|
9,044
|
$
|
10,915
|
||||||
20
DATA CENTER PORTFOLIO
The following table presents an overview of the portfolio of data center properties that INAP leases as of March 31, 2019:
|
Gross Square
|
Supporting
|
Office &
|
Data Center
|
Current Raised
|
Occupied
|
Occupied
|
|
|
Market
|
Feet (SF)1
|
Infrastructure2
|
Other
|
Footprint SF3
|
Floor SF 4
|
SF
|
SF %
|
|
Phoenix
|
214,968
|
87,059
|
61,210
|
66,717
|
44,650
|
30,861
|
69%
|
|
Atlanta5
|
208,298
|
64,248
|
75,344
|
68,706
|
44,987
|
13,542
|
30%
|
|
Montreal
|
126,965
|
34,572
|
46,833
|
45,560
|
28,050
|
23,890
|
85%
|
|
New York/New Jersey6
|
105,115
|
16,405
|
28,468
|
60,242
|
37,702
|
23,379
|
62%
|
|
Dallas
|
112,085
|
23,763
|
21,023
|
67,299
|
30,432
|
17,459
|
57%
|
|
Los Angeles
|
109,181
|
9,623
|
12,366
|
87,192
|
18,020
|
13,882
|
77%
|
|
Seattle
|
100,497
|
31,326
|
21,552
|
47,619
|
38,619
|
24,547
|
64%
|
|
Santa Clara/San Jose
|
88,659
|
23,852
|
23,667
|
41,140
|
40,840
|
23,751
|
58%
|
|
Boston
|
45,637
|
18,785
|
5,199
|
21,653
|
21,653
|
10,743
|
50%
|
|
Houston
|
43,913
|
7,925
|
15,599
|
20,389
|
20,389
|
9,196
|
45%
|
|
Chicago
|
14,002
|
1,551
|
-
|
12,451
|
12,076
|
10,029
|
83%
|
|
Other7
|
35,988
|
-
|
981
|
34,990
|
30,580
|
18,181
|
59%
|
|
Total
|
1,205,308
|
319,109
|
312,242
|
573,958
|
367,998
|
219,460
|
60%
|
|
(1)
|
Represents total SF subject to our lease.
|
|
(2)
|
Represents total SF for mechanical and utility rooms.
|
|
(3)
|
Represents total SF that is currently leased or available for lease but excludes supporting infrastructure, office space, and common area. |
|
(4)
|
Represents data center footprint SF less unbuilt SF.
|
|
(5)
|
Includes planned resizing of Coca Cola facility moving from single tenant site to multi-tenant site, freeing up raised floor for new sales.
|
|
(6)
|
Represents Bethel CT facility being removed from the “New York/New Jersey” market and placed into “Other” market.
|
|
(7)
|
Represents Bethel CT, Miami, Northern Virginia, Oakland/San Francisco, London, Amsterdam, Frankfurt, Hong Kong, Singapore, Sydney, Tokyo, and Osaka.
|
21