UNITED STATES
SECURITIES AND EXCHANGE COMMISSION
Washington, D.C. 20549
FORM N-CSR
CERTIFIED SHAREHOLDER REPORT
OF
REGISTERED MANAGEMENT INVESTMENT COMPANIES
Investment Company Act file number: 811-00121
| Name of Registrant: | Vanguard Wellington Fund |
| Address of Registrant: | P.O. Box 2600 |
| Valley Forge, PA 19482 |
| Name and address of agent for service: | Anne E. Robinson, Esquire |
| P.O. Box 876 | |
| Valley Forge, PA 19482 |
Registrant’s telephone number, including area code: (610) 669-1000
Date of fiscal year end: November 30
Date of reporting period: December 1, 2021—November 30, 2022
Item 1: Reports to Shareholders

| 1 | |
| 2 | |
| 5 | |
| 7 | |
| 9 | |
| 56 |
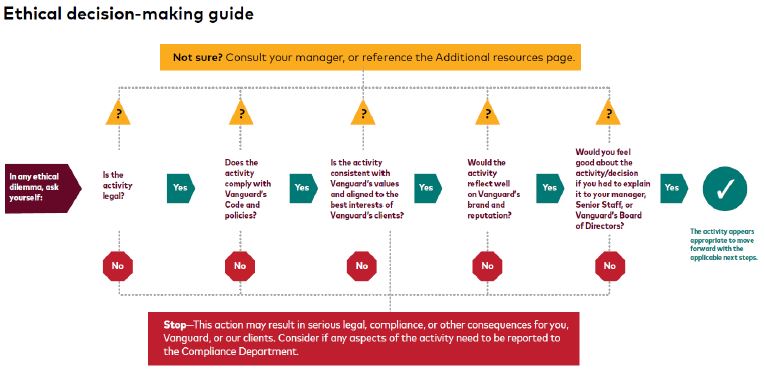
| • | Despite some relief toward the close of the period, the 12 months ended November 30, 2022, were a volatile, challenging period for financial markets. Vanguard Wellington Fund returned –8.36% for Admiral Shares and –8.43% for Investor Shares. It posted better results than the –10.80% return of its composite benchmark index, a mix of 65% U.S. stocks and 35% U.S. bonds that reflects the fund’s target asset allocation. |
| • | The economic backdrop deteriorated early on as inflation soared to multidecade highs, fueled in part by higher energy and food prices in the wake of Russia’s invasion of Ukraine. Then price increases broadened to other categories of goods and services, adding to concerns that inflation would remain stubbornly high. That prompted aggressive tightening by the Federal Reserve to bring inflation back in check, which weighed on bond prices and increased fears of recession. |
| • | The stock portion of the fund’s portfolio outpaced the –9.21% return of the Standard & Poor’s 500 Index by almost 4 percentage points. The fund’s holdings in the consumer discretionary sector held up much better than those in the index. However, the fund’s energy stocks, while posting an impressive return of around 31%, did not keep pace with the 76% return of the index’s energy stocks. |
| • | The bond portion just slightly lagged the –14.46% return of the Bloomberg U.S. Credit A or Better Bond Index. Relative to the bond index, the fund benefited from its underweight to duration and credit spread duration during this period of rising rates, but that was offset by its sector allocation and security selection. |
| Average Annual Total Returns Periods Ended November 30, 2022 | |||
| One Year | Three Years | Five Years | |
| Stocks | |||
| Russell 1000 Index (Large-caps) | -10.66% | 10.56% | 10.69% |
| Russell 2000 Index (Small-caps) | -13.01 | 6.44 | 5.45 |
| Russell 3000 Index (Broad U.S. market) | -10.80 | 10.28 | 10.33 |
| FTSE All-World ex US Index (International) | -11.40 | 2.23 | 1.86 |
| Bonds | |||
| Bloomberg U.S. Aggregate Float Adjusted Index (Broad taxable market) | -12.91% | -2.56% | 0.24% |
| Bloomberg Municipal Bond Index (Broad tax-exempt market) | -8.64 | -0.77 | 1.40 |
| FTSE Three-Month U.S. Treasury Bill Index | 1.16 | 0.64 | 1.19 |
| CPI | |||
| Consumer Price Index | 7.11% | 5.00% | 3.83% |
| • | Based on actual fund return. This section helps you to estimate the actual expenses that you paid over the period. The ”Ending Account Value“ shown is derived from the fund’s actual return, and the third column shows the dollar amount that would have been paid by an investor who started with $1,000 in the fund. You may use the information here, together with the amount you invested, to estimate the expenses that you paid over the period. |
| • | Based on hypothetical 5% yearly return. This section is intended to help you compare your fund‘s costs with those of other mutual funds. It assumes that the fund had a yearly return of 5% before expenses, but that the expense ratio is unchanged. In this case—because the return used is not the fund’s actual return—the results do not apply to your investment. The example is useful in making comparisons because the Securities and Exchange Commission requires all mutual funds to calculate expenses based on a 5% return. You can assess your fund’s costs by comparing this hypothetical example with the hypothetical examples that appear in shareholder reports of other funds. |
| Six Months Ended November 30, 2022 | |||
| Beginning Account Value 5/31/2022 | Ending Account Value 11/30/2022 | Expenses Paid During Period | |
| Based on Actual Fund Return | |||
| Wellington Fund | |||
| Investor Shares | $1,000.00 | $993.20 | $1.25 |
| Admiral™ Shares | 1,000.00 | 993.60 | 0.85 |
| Based on Hypothetical 5% Yearly Return | |||
| Wellington Fund | |||
| Investor Shares | $1,000.00 | $1,023.81 | $1.27 |
| Admiral Shares | 1,000.00 | 1,024.22 | 0.86 |
| Average Annual Total Returns Periods Ended November 30, 2022 | |||||
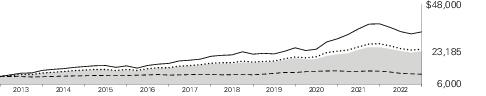
| One Year | Five Years | Ten Years | Final Value of a $10,000 Investment | ||

| Wellington Fund Investor Shares | -8.43% | 6.82% | 8.77% | $23,185 |

| Wellington Composite Index | -10.80 | 7.49 | 9.30 | 24,324 |

| Bloomberg U.S. Aggregate Bond Index | -12.84 | 0.21 | 1.09 | 11,142 |

| Dow Jones U.S. Total Stock Market Float Adjusted Index | -11.25 | 10.20 | 12.85 | 33,501 |
| One Year | Five Years | Ten Years | Final Value of a $50,000 Investment | ||
| Wellington Fund Admiral Shares | -8.36% | 6.91% | 8.86% | $116,836 | |
| Wellington Composite Index | -10.80 | 7.49 | 9.30 | 121,619 | |
| Bloomberg U.S. Aggregate Bond Index | -12.84 | 0.21 | 1.09 | 55,712 | |
| Dow Jones U.S. Total Stock Market Float Adjusted Index | -11.25 | 10.20 | 12.85 | 167,503 | |
| Asset-Backed/Commercial Mortgage-Backed Securities | 0.8% |
| Common Stocks | 67.2 |
| Corporate Bonds | 21.1 |
| Sovereign Bonds | 0.8 |
| Taxable Municipal Bonds | 1.5 |
| U.S. Government and Agency Obligations | 8.6 |
| Shares | Market Value• ($000) | |||||
| Common Stocks (66.6%) | ||||||
| Communication Services (4.0%) | ||||||
| * | Alphabet Inc. Class A | 25,709,121 | 2,596,364 | |||
| * | Meta Platforms Inc. Class A | 7,992,333 | 943,895 | |||
| Electronic Arts Inc. | 5,330,819 | 697,164 | ||||
| 4,237,423 | ||||||
| Consumer Discretionary (8.0%) | ||||||
| * | Amazon.com Inc. | 16,684,699 | 1,610,741 | |||
| McDonald's Corp. | 5,491,145 | 1,497,929 | ||||
| TJX Cos. Inc. | 16,572,663 | 1,326,642 | ||||
| Starbucks Corp. | 11,931,417 | 1,219,391 | ||||
| Home Depot Inc. | 3,112,499 | 1,008,419 | ||||
| Dollar General Corp. | 1,616,468 | 413,298 | ||||
| NIKE Inc. Class B | 3,750,867 | 411,433 | ||||
| Lennar Corp. Class A | 3,571,195 | 313,658 | ||||
| * | Coupang Inc. Class A | 13,364,482 | 260,340 | |||
| DR Horton Inc. | 2,757,635 | 237,157 | ||||
| Ross Stores Inc. | 1,884,731 | 221,776 | ||||
| 8,520,784 | ||||||
| Consumer Staples (5.0%) | ||||||
| Coca-Cola Co. | 26,080,066 | 1,658,953 | ||||
| Procter & Gamble Co. | 10,042,345 | 1,497,916 | ||||
| Sysco Corp. | 16,325,216 | 1,412,294 | ||||
| Nestle SA (Registered) | 6,296,295 | 749,408 | ||||
| 5,318,571 | ||||||
| Energy (3.5%) | ||||||
| Shell plc | 45,811,044 | 1,338,977 | ||||
| ConocoPhillips | 9,040,664 | 1,116,612 | ||||
| Cenovus Energy Inc. | 20,520,336 | 408,150 | ||||
| Pioneer Natural Resources Co. | 1,034,536 | 244,140 | ||||
| EQT Corp. | 4,849,314 | 205,659 | ||||
| Coterra Energy Inc. | 6,825,779 | 190,508 | ||||
| Chesapeake Energy Corp. | 1,840,156 | 190,456 | ||||
| Shell plc (XLON) | 2,607,900 | 76,322 | ||||
| 3,770,824 | ||||||
| Financials (8.4%) | ||||||
| Charles Schwab Corp. | 36,040,991 | 2,974,823 | ||||
| Progressive Corp. | 12,560,066 | 1,659,813 | ||||
| JPMorgan Chase & Co. | 7,090,485 | 979,763 | ||||
| Morgan Stanley | 10,487,264 | 976,050 | ||||
| S&P Global Inc. | 1,830,635 | 645,848 | ||||
| BlackRock Inc. | 873,109 | 625,146 | ||||
| Shares | Market Value• ($000) | |||||
| Goldman Sachs Group Inc. | 1,149,051 | 443,706 | ||||
| American Express Co. | 2,708,681 | 426,861 | ||||
| Blackstone Inc. | 2,373,520 | 217,248 | ||||
| 8,949,258 | ||||||
| Health Care (12.3%) | ||||||
| UnitedHealth Group Inc. | 3,436,435 | 1,882,342 | ||||
| HCA Healthcare Inc. | 6,722,628 | 1,614,910 | ||||
| Humana Inc. | 2,705,645 | 1,487,834 | ||||
| Pfizer Inc. | 29,679,466 | 1,487,832 | ||||
| Elevance Health Inc. | 2,493,621 | 1,328,900 | ||||
| AstraZeneca plc ADR | 19,183,174 | 1,303,880 | ||||
| Novartis AG (Registered) | 13,679,233 | 1,216,830 | ||||
| Becton Dickinson & Co. | 4,315,332 | 1,075,985 | ||||
| Danaher Corp. | 2,419,321 | 661,467 | ||||
| Baxter International Inc. | 6,942,900 | 392,482 | ||||
| Johnson & Johnson | 1,721,064 | 306,349 | ||||
| Zoetis Inc. Class A | 1,862,015 | 287,011 | ||||
| 13,045,822 | ||||||
| Industrials (6.8%) | ||||||
| Raytheon Technologies Corp. | 11,312,010 | 1,116,722 | ||||
| Deere & Co. | 2,297,952 | 1,013,397 | ||||
| Johnson Controls International plc | 14,933,551 | 992,185 | ||||
| Honeywell International Inc. | 4,457,449 | 978,633 | ||||
| Illinois Tool Works Inc. | 3,733,234 | 849,199 | ||||
| Northrop Grumman Corp. | 1,459,327 | 778,244 | ||||
| Fortive Corp. | 11,441,180 | 772,852 | ||||
| Parker-Hannifin Corp. | 2,071,865 | 619,363 | ||||
| Schneider Electric SE | 731,889 | 108,081 | ||||
| Trane Technologies plc | 143,811 | 25,659 | ||||
| 7,254,335 | ||||||
| Information Technology (13.3%) | ||||||
| Microsoft Corp. | 19,134,649 | 4,882,014 | ||||
| Apple Inc. | 17,630,702 | 2,609,873 | ||||
| Texas Instruments Inc. | 8,675,094 | 1,565,507 | ||||
| Mastercard Inc. Class A | 2,487,783 | 886,646 | ||||
| Visa Inc. Class A | 3,999,109 | 867,807 | ||||
| Accenture plc Class A | 2,068,988 | 622,621 | ||||
| Taiwan Semiconductor Manufacturing Co. Ltd. ADR | 7,386,175 | 612,905 | ||||
| Global Payments Inc. | 5,740,338 | 595,732 | ||||
| * | Salesforce Inc. | 2,698,442 | 432,425 | |||
| Intel Corp. | 10,353,608 | 311,333 | ||||
| Fidelity National Information Services Inc. | 4,080,905 | 296,192 | ||||
| KLA Corp. | 661,963 | 260,251 | ||||
| Marvell Technology Inc. | 5,549,560 | 258,166 | ||||
| 14,201,472 | ||||||
| Materials (1.2%) | ||||||
| Glencore plc | 133,147,787 | 908,616 | ||||
| Anglo American plc | 9,320,031 | 387,481 | ||||
| 1,296,097 | ||||||
| Real Estate (1.3%) | ||||||
| Welltower Inc. | 6,816,940 | 484,207 | ||||
| American Tower Corp. | 1,904,486 | 421,368 | ||||
| VICI Properties Inc. | 8,830,111 | 301,990 | ||||
| Prologis Inc. | 1,781,301 | 209,819 | ||||
| 1,417,384 | ||||||
| Shares | Market Value• ($000) | |||||
| Utilities (2.8%) | ||||||
| Duke Energy Corp. | 11,586,602 | 1,157,849 | ||||
| Exelon Corp. | 27,111,767 | 1,121,614 | ||||
| Constellation Energy Corp. | 6,601,422 | 634,529 | ||||
| American Electric Power Co. Inc. | 718,581 | 69,558 | ||||
| 2,983,550 | ||||||
| Total Common Stocks (Cost $46,215,833) | 70,995,520 | |||||
| Coupon | Maturity Date | Face Amount ($000) | ||||
| U.S. Government and Agency Obligations (8.5%) | ||||||
| U.S. Government Securities (7.7%) | ||||||
| United States Treasury Note/Bond | 2.250% | 3/31/24 | 135,000 | 130,823 | ||
| United States Treasury Note/Bond | 2.500% | 4/30/24 | 16,550 | 16,069 | ||
| United States Treasury Note/Bond | 1.750% | 6/30/24 | 316,970 | 303,598 | ||
| United States Treasury Note/Bond | 0.375% | 8/15/24 | 265,000 | 247,195 | ||
| United States Treasury Note/Bond | 0.375% | 9/15/24 | 108,000 | 100,491 | ||
| United States Treasury Note/Bond | 4.250% | 9/30/24 | 155,000 | 154,540 | ||
| United States Treasury Note/Bond | 0.625% | 10/15/24 | 610,000 | 568,920 | ||
| United States Treasury Note/Bond | 4.375% | 10/31/24 | 10,335 | 10,333 | ||
| United States Treasury Note/Bond | 1.125% | 1/15/25 | 155,000 | 144,973 | ||
| United States Treasury Note/Bond | 2.000% | 2/15/25 | 190,065 | 180,859 | ||
| United States Treasury Note/Bond | 1.125% | 2/28/25 | 198,905 | 185,572 | ||
| United States Treasury Note/Bond | 1.750% | 3/15/25 | 340,000 | 321,513 | ||
| United States Treasury Note/Bond | 2.625% | 4/15/25 | 303,280 | 292,191 | ||
| United States Treasury Note/Bond | 0.250% | 5/31/25 | 522,710 | 474,114 | ||
| United States Treasury Note/Bond | 0.250% | 7/31/25 | 145,975 | 131,788 | ||
| United States Treasury Note/Bond | 2.000% | 8/15/25 | 61,860 | 58,458 | ||
| United States Treasury Note/Bond | 3.125% | 8/15/25 | 400,000 | 389,562 | ||
| United States Treasury Note/Bond | 0.250% | 8/31/25 | 125,010 | 112,470 | ||
| United States Treasury Note/Bond | 3.500% | 9/15/25 | 5,480 | 5,392 | ||
| United States Treasury Note/Bond | 0.375% | 11/30/25 | 78,000 | 69,908 | ||
| United States Treasury Note/Bond | 0.375% | 1/31/26 | 639,150 | 569,842 | ||
| United States Treasury Note/Bond | 0.750% | 3/31/26 | 107,000 | 96,216 | ||
| United States Treasury Note/Bond | 0.750% | 4/30/26 | 89,000 | 79,752 | ||
| United States Treasury Note/Bond | 1.625% | 5/15/26 | 78,110 | 72,081 | ||
| United States Treasury Note/Bond | 0.750% | 5/31/26 | 281,245 | 251,407 | ||
| United States Treasury Note/Bond | 0.750% | 8/31/26 | 175,000 | 155,422 | ||
| 1 | United States Treasury Note/Bond | 0.875% | 9/30/26 | 254,100 | 226,308 | |
| United States Treasury Note/Bond | 2.000% | 11/15/26 | 29,650 | 27,533 | ||
| United States Treasury Note/Bond | 2.500% | 3/31/27 | 527,230 | 497,820 | ||
| United States Treasury Note/Bond | 2.750% | 4/30/27 | 178,525 | 170,324 | ||
| United States Treasury Note/Bond | 2.750% | 7/31/27 | 248,175 | 236,464 | ||
| United States Treasury Note/Bond | 3.125% | 8/31/27 | 46,560 | 45,141 | ||
| United States Treasury Note/Bond | 4.125% | 9/30/27 | 35,000 | 35,427 | ||
| United States Treasury Note/Bond | 4.125% | 10/31/27 | 195,000 | 197,468 | ||
| United States Treasury Note/Bond | 2.250% | 11/15/27 | 24,532 | 22,761 | ||
| United States Treasury Note/Bond | 3.875% | 11/30/27 | 78,000 | 78,293 | ||
| United States Treasury Note/Bond | 3.875% | 9/30/29 | 4,297 | 4,327 | ||
| United States Treasury Note/Bond | 4.000% | 10/31/29 | 175,000 | 177,680 | ||
| United States Treasury Note/Bond | 2.750% | 8/15/32 | 25,673 | 23,780 | ||
| United States Treasury Note/Bond | 4.125% | 11/15/32 | 109,116 | 113,378 | ||
| United States Treasury Note/Bond | 1.750% | 8/15/41 | 18,670 | 13,019 | ||
| United States Treasury Note/Bond | 2.000% | 11/15/41 | 663,555 | 483,151 | ||
| United States Treasury Note/Bond | 2.375% | 2/15/42 | 118,600 | 92,249 | ||
| Coupon | Maturity Date | Face Amount ($000) | Market Value• ($000) | |||
| United States Treasury Note/Bond | 3.250% | 5/15/42 | 20,950 | 18,806 | ||
| United States Treasury Note/Bond | 3.375% | 8/15/42 | 322,299 | 294,904 | ||
| United States Treasury Note/Bond | 4.000% | 11/15/42 | 57,500 | 57,761 | ||
| United States Treasury Note/Bond | 2.250% | 2/15/52 | 4,890 | 3,530 | ||
| United States Treasury Note/Bond | 2.875% | 5/15/52 | 52,829 | 43,906 | ||
| United States Treasury Note/Bond | 3.000% | 8/15/52 | 180,522 | 154,516 | ||
| United States Treasury Note/Bond | 4.000% | 11/15/52 | 21,542 | 22,390 | ||
| 8,164,425 | ||||||
| Conventional Mortgage-Backed Securities (0.7%) | ||||||
| 2,3 | Fannie Mae Pool | 1.770% | 1/1/36 | 20,151 | 15,418 | |
| 2 | Ginnie Mae I Pool | 7.000% | 11/15/31–11/15/33 | 905 | 934 | |
| 2,3 | UMBS Pool | 2.500% | 9/1/27–4/1/38 | 26,657 | 23,547 | |
| 2,3,4 | UMBS Pool | 3.000% | 8/1/42–12/25/52 | 311,252 | 275,413 | |
| 2,3,4 | UMBS Pool | 3.500% | 11/1/45–12/25/52 | 51,654 | 47,312 | |
| 2,3,4 | UMBS Pool | 4.000% | 12/25/52 | 173,587 | 164,257 | |
| 2,3,4 | UMBS Pool | 4.500% | 9/1/52–12/25/52 | 142,495 | 138,913 | |
| 2,3,4 | UMBS Pool | 5.000% | 12/25/52–1/25/53 | 107,000 | 106,501 | |
| 772,295 | ||||||
| Nonconventional Mortgage-Backed Securities (0.1%) | ||||||
| 2,3 | Fannie Mae REMICS | 1.500% | 8/25/41–11/25/42 | 4,219 | 3,871 | |
| 2,3 | Fannie Mae REMICS | 1.700% | 6/25/43 | 1,541 | 1,461 | |
| 2,3 | Fannie Mae REMICS | 2.000% | 6/25/44 | 471 | 456 | |
| 2,3 | Fannie Mae REMICS | 2.500% | 8/25/46 | 10,786 | 8,549 | |
| 2,3 | Fannie Mae REMICS | 3.000% | 12/25/39–9/25/57 | 41,497 | 37,618 | |
| 2,3 | Fannie Mae REMICS | 3.500% | 4/25/31–11/25/57 | 65,826 | 62,741 | |
| 2,3 | Fannie Mae REMICS | 4.000% | 7/25/53 | 2,465 | 2,405 | |
| 2,3 | Freddie Mac REMICS | 1.500% | 10/15/42 | 5,595 | 4,914 | |
| 2,3 | Freddie Mac REMICS | 3.000% | 6/15/44–7/15/45 | 8,507 | 7,579 | |
| 2,3 | Freddie Mac REMICS | 3.500% | 3/15/31–12/15/46 | 13,897 | 13,039 | |
| 2,3 | Freddie Mac REMICS | 4.000% | 12/15/30–2/15/31 | 4,756 | 4,595 | |
| 2 | Ginnie Mae REMICS | 1.700% | 10/20/45 | 863 | 850 | |
| 148,078 | ||||||
| Total U.S. Government and Agency Obligations (Cost $9,730,833) | 9,084,798 | |||||
| Asset-Backed/Commercial Mortgage-Backed Securities (0.8%) | ||||||
| 2,5 | Aaset Trust Series 2019-1 | 3.844% | 5/15/39 | 7,636 | 5,072 | |
| 2,5 | Affirm Asset Securitization Trust Series 2021-B | 1.030% | 8/17/26 | 17,590 | 16,601 | |
| 2,5 | Affirm Asset Securitization Trust Series 2021-Z1 | 1.070% | 8/15/25 | 6,627 | 6,386 | |
| 2,5 | Affirm Asset Securitization Trust Series 2021-Z2 | 1.170% | 11/16/26 | 9,790 | 9,342 | |
| 2,5 | Aligned Data Centers Issuer LLC Series 2021-1A | 1.937% | 8/15/46 | 43,270 | 36,252 | |
| 2,5 | American Tower Trust | 3.070% | 3/15/23 | 43,000 | 42,643 | |
| 2,5 | Angel Oak Mortgage Trust Series 2019-5 | 2.593% | 10/25/49 | 1,921 | 1,859 | |
| 2,5 | Angel Oak Mortgage Trust Series 2019-6 | 2.620% | 11/25/59 | 4,508 | 4,322 | |
| 2,5 | Angel Oak Mortgage Trust Series 2021-6 | 1.458% | 9/25/66 | 24,198 | 19,430 | |
| 2,5 | Angel Oak Mortgage Trust I LLC Series 2019-4 | 2.993% | 7/26/49 | 703 | 699 | |
| 2,5,6 | BX Commercial Mortgage Trust Series 2021-VOLT, 1M USD LIBOR + 0.700% | 4.575% | 9/15/36 | 29,050 | 27,812 | |
| 2,5,6 | BX Trust Series 2021-ARIA, 1M USD LIBOR + 0.899% | 4.774% | 10/15/36 | 14,785 | 13,937 | |
| 2,5,6 | BXHPP Trust Series 2021-FILM, 1M USD LIBOR + 0.650% | 4.525% | 8/15/36 | 15,225 | 14,353 | |
| 2,5,6 | BXHPP Trust Series 2021-FILM, 1M USD LIBOR + 0.900% | 4.775% | 8/15/36 | 3,140 | 2,956 | |
| Coupon | Maturity Date | Face Amount ($000) | Market Value• ($000) | |||
| 2,5 | Castlelake Aircraft Structured Trust Series 2019-1A | 3.967% | 4/15/39 | 19,266 | 16,252 | |
| 2,5 | CF Hippolyta Issuer LLC Series 2021-1A | 1.530% | 3/15/61 | 23,444 | 20,149 | |
| 2,5 | Cloud Pass-Through Trust Series 2019-1A | 3.554% | 12/5/22 | 5 | 5 | |
| 2,5 | DB Master Finance LLC Series 2019-1A | 4.021% | 5/20/49 | 13,782 | 12,711 | |
| 2,5 | Domino's Pizza Master Issuer LLC Series 2021-1A | 2.662% | 4/25/51 | 13,549 | 11,023 | |
| 2,5 | Domino's Pizza Master Issuer LLC Series 2021-1A | 3.151% | 4/25/51 | 23,798 | 18,680 | |
| 2,5 | Enterprise Fleet Financing LLC Series 2019-2 | 2.290% | 2/20/25 | 1,099 | 1,097 | |
| 2,5 | Enterprise Fleet Financing LLC Series 2019-3 | 2.060% | 5/20/25 | 905 | 903 | |
| 2,3,6 | Fannie Mae Connecticut Avenue Securities Series 2016-C03, 1M USD LIBOR + 5.900% | 9.916% | 10/25/28 | 2,662 | 2,772 | |
| 2,5 | FirstKey Homes Trust Series 2021-SFR1 | 1.538% | 8/17/38 | 64,569 | 54,969 | |
| 2,3 | Freddie Mac Multifamily Structured Pass-Through Certificates Series K-1512 | 3.059% | 4/25/34 | 6,000 | 5,125 | |
| 2,3 | Freddie Mac Multifamily Structured Pass-Through Certificates Series K-1513 | 2.797% | 8/25/34 | 7,500 | 6,287 | |
| 2,3 | Freddie Mac Multifamily Structured Pass-Through Certificates Series K-1521 | 2.184% | 8/25/36 | 17,705 | 13,026 | |
| 2,5 | Home Partners of America Trust Series 2021-2 | 1.901% | 12/17/26 | 34,834 | 29,554 | |
| 2,5 | Horizon Aircraft Finance II Ltd. Series 2019-1 | 3.721% | 7/15/39 | 9,431 | 7,341 | |
| 2,5 | Horizon Aircraft Finance III Ltd. Series 2019-2 | 3.425% | 11/15/39 | 10,006 | 7,641 | |
| 2,5,6 | Life Mortgage Trust Series 2021-BMR, 1M USD LIBOR + 0.700% | 4.575% | 3/15/38 | 9,147 | 8,793 | |
| 2,5 | MACH 1 Cayman Ltd. Series 2019-1 | 3.474% | 10/15/39 | 9,220 | 8,094 | |
| 2,5,6 | Madison Park Funding XIII Ltd. Series 2014-13A, 3M USD LIBOR + 0.950% | 5.177% | 4/19/30 | 31,681 | 31,208 | |
| 2,5,6 | Magnetite VII Ltd. Series 2012-7A, 3M USD LIBOR + 0.800% | 4.879% | 1/15/28 | 24,088 | 23,668 | |
| 2,5 | MAPS Ltd. Series 2019-1A | 4.458% | 3/15/44 | 3,813 | 3,339 | |
| 2,5 | Mercury Financial Credit Card Master Trust Series 2021-1A | 1.540% | 3/20/26 | 33,270 | 31,561 | |
| 2,5 | New Economy Assets Phase 1 Sponsor LLC Series 2021-1 | 1.910% | 10/20/61 | 100,980 | 85,377 | |
| 2,5 | New Economy Assets Phase 1 Sponsor LLC Series 2021-1 | 2.410% | 10/20/61 | 10,325 | 8,502 | |
| 2,5 | OneMain Direct Auto Receivables Trust Series 2021-1A | 0.870% | 7/14/28 | 30,280 | 27,761 | |
| 2 | Seasoned Credit Risk Transfer Trust Series 2019-3 | 3.500% | 10/25/58 | 25,642 | 24,640 | |
| 2,5 | SFAVE Commercial Mortgage Securities Trust Series 2015-5AVE | 4.144% | 1/5/43 | 27,300 | 20,089 | |
| 2,5 | SoFi Professional Loan Program Trust Series 2021-B | 1.140% | 2/15/47 | 16,117 | 12,559 | |
| 2,5 | Start II Ltd. Series 2019-1 | 4.089% | 3/15/44 | 10,044 | 8,560 | |
| 2,5,6 | Symphony CLO XIV Ltd. Series 2014-14A, 3M USD LIBOR + 0.950% | 4.961% | 7/14/26 | 1,754 | 1,750 | |
| 2,5 | Taco Bell Funding LLC Series 2021-1A | 1.946% | 8/25/51 | 19,275 | 16,045 | |
| 2,5 | Taco Bell Funding LLC Series 2021-1A | 2.294% | 8/25/51 | 35,655 | 28,534 | |
| 2,5 | Vantage Data Centers Issuer LLC Series 2019-1A | 3.188% | 7/15/44 | 10,570 | 9,938 | |
| 2,5 | Vantage Data Centers Issuer LLC Series 2020-1A | 1.645% | 9/15/45 | 29,505 | 25,647 | |
| Coupon | Maturity Date | Face Amount ($000) | Market Value• ($000) | |||
| 2,5 | Vantage Data Centers Issuer LLC Series 2021-1A | 2.165% | 10/15/46 | 48,430 | 40,870 | |
| Total Asset-Backed/Commercial Mortgage-Backed Securities (Cost $948,831) | 826,134 | |||||
| Corporate Bonds (21.0%) | ||||||
| Communications (1.2%) | ||||||
| America Movil SAB de CV | 3.625% | 4/22/29 | 26,990 | 24,768 | ||
| America Movil SAB de CV | 6.125% | 3/30/40 | 7,380 | 7,624 | ||
| AT&T Inc. | 4.300% | 12/15/42 | 35,590 | 30,023 | ||
| AT&T Inc. | 3.650% | 6/1/51 | 8,341 | 6,117 | ||
| AT&T Inc. | 3.500% | 9/15/53 | 13,515 | 9,543 | ||
| AT&T Inc. | 3.850% | 6/1/60 | 26,704 | 19,447 | ||
| Comcast Corp. | 3.375% | 2/15/25 | 2,540 | 2,472 | ||
| Comcast Corp. | 3.400% | 4/1/30 | 4,940 | 4,532 | ||
| Comcast Corp. | 4.250% | 1/15/33 | 42,890 | 40,755 | ||
| Comcast Corp. | 4.200% | 8/15/34 | 30,890 | 29,023 | ||
| Comcast Corp. | 5.650% | 6/15/35 | 4,725 | 4,971 | ||
| Comcast Corp. | 4.400% | 8/15/35 | 32,325 | 30,709 | ||
| Comcast Corp. | 6.500% | 11/15/35 | 945 | 1,050 | ||
| Comcast Corp. | 3.969% | 11/1/47 | 8,452 | 6,884 | ||
| Comcast Corp. | 4.000% | 3/1/48 | 12,180 | 10,027 | ||
| Comcast Corp. | 3.999% | 11/1/49 | 23,162 | 18,864 | ||
| Comcast Corp. | 2.887% | 11/1/51 | 56,240 | 37,527 | ||
| Comcast Corp. | 2.450% | 8/15/52 | 13,355 | 8,165 | ||
| Comcast Corp. | 4.049% | 11/1/52 | 10,339 | 8,454 | ||
| Comcast Corp. | 2.937% | 11/1/56 | 210,578 | 135,545 | ||
| Comcast Corp. | 2.987% | 11/1/63 | 95,407 | 60,363 | ||
| 5 | Cox Communications Inc. | 3.150% | 8/15/24 | 2,503 | 2,410 | |
| 5 | Cox Communications Inc. | 4.800% | 2/1/35 | 30,000 | 27,105 | |
| Discovery Communications LLC | 4.125% | 5/15/29 | 14,172 | 12,484 | ||
| Discovery Communications LLC | 3.625% | 5/15/30 | 20,000 | 16,927 | ||
| Discovery Communications LLC | 5.300% | 5/15/49 | 5,000 | 3,929 | ||
| Discovery Communications LLC | 4.000% | 9/15/55 | 24,992 | 15,982 | ||
| NBCUniversal Media LLC | 4.450% | 1/15/43 | 6,331 | 5,637 | ||
| 5 | NTT Finance Corp. | 1.162% | 4/3/26 | 44,235 | 39,298 | |
| 5 | NTT Finance Corp. | 2.065% | 4/3/31 | 12,995 | 10,552 | |
| 5 | Ooredoo International Finance Ltd. | 2.625% | 4/8/31 | 23,430 | 20,204 | |
| Orange SA | 9.000% | 3/1/31 | 20,280 | 25,143 | ||
| 5 | SK Telecom Co. Ltd. | 3.750% | 4/16/23 | 11,995 | 11,937 | |
| 5 | Sky Ltd. | 3.750% | 9/16/24 | 45,046 | 44,086 | |
| 5 | Sprint Spectrum Co. LLC | 4.738% | 3/20/25 | 27,041 | 26,648 | |
| Telefonica Emisiones SA | 5.213% | 3/8/47 | 19,100 | 15,532 | ||
| Telefonica Emisiones SA | 5.520% | 3/1/49 | 19,772 | 16,869 | ||
| Time Warner Cable Enterprises LLC | 8.375% | 3/15/23 | 3,925 | 3,967 | ||
| T-Mobile USA Inc. | 2.050% | 2/15/28 | 29,985 | 25,902 | ||
| T-Mobile USA Inc. | 3.875% | 4/15/30 | 80,576 | 73,989 | ||
| T-Mobile USA Inc. | 4.375% | 4/15/40 | 15,735 | 13,666 | ||
| TWDC Enterprises 18 Corp. | 4.375% | 8/16/41 | 26,724 | 24,216 | ||
| 2 | TWDC Enterprises 18 Corp. | 4.125% | 6/1/44 | 14,185 | 12,417 | |
| Verizon Communications Inc. | 4.329% | 9/21/28 | 23,335 | 22,695 | ||
| Verizon Communications Inc. | 2.355% | 3/15/32 | 108,462 | 87,257 | ||
| Verizon Communications Inc. | 4.812% | 3/15/39 | 85,963 | 80,783 | ||
| Verizon Communications Inc. | 4.750% | 11/1/41 | 7,750 | 7,096 | ||
| Verizon Communications Inc. | 2.987% | 10/30/56 | 9,247 | 5,853 | ||
| Walt Disney Co. | 2.650% | 1/13/31 | 16,330 | 14,069 | ||
| Walt Disney Co. | 3.500% | 5/13/40 | 50,260 | 41,420 | ||
| Walt Disney Co. | 4.750% | 9/15/44 | 2,358 | 2,219 | ||
| Walt Disney Co. | 4.750% | 11/15/46 | 14,000 | 13,075 | ||
| Coupon | Maturity Date | Face Amount ($000) | Market Value• ($000) | |||
| Walt Disney Co. | 2.750% | 9/1/49 | 16,835 | 11,425 | ||
| Walt Disney Co. | 3.600% | 1/13/51 | 27,250 | 21,394 | ||
| Walt Disney Co. | 3.800% | 5/13/60 | 28,415 | 22,535 | ||
| 1,275,584 | ||||||
| Consumer Discretionary (0.9%) | ||||||
| Amazon.com Inc. | 2.800% | 8/22/24 | 9,035 | 8,785 | ||
| Amazon.com Inc. | 3.600% | 4/13/32 | 84,875 | 79,138 | ||
| Amazon.com Inc. | 4.800% | 12/5/34 | 37,370 | 38,191 | ||
| Amazon.com Inc. | 4.950% | 12/5/44 | 22,605 | 22,957 | ||
| Amazon.com Inc. | 3.950% | 4/13/52 | 27,295 | 23,328 | ||
| Amazon.com Inc. | 4.250% | 8/22/57 | 41,385 | 37,100 | ||
| 2 | American Honda Finance Corp. | 2.000% | 3/24/28 | 19,250 | 16,714 | |
| 5 | BMW US Capital LLC | 0.800% | 4/1/24 | 12,590 | 11,937 | |
| 5 | BMW US Capital LLC | 1.250% | 8/12/26 | 28,900 | 25,378 | |
| 2 | Duke University | 2.832% | 10/1/55 | 25,700 | 17,300 | |
| 2 | Emory University | 2.143% | 9/1/30 | 25,351 | 21,053 | |
| General Motors Financial Co. Inc. | 3.950% | 4/13/24 | 57,810 | 56,846 | ||
| 2 | Georgetown University | 4.315% | 4/1/49 | 5,405 | 4,426 | |
| 2 | Georgetown University | 2.943% | 4/1/50 | 9,430 | 5,925 | |
| Home Depot Inc. | 3.900% | 12/6/28 | 10,250 | 9,958 | ||
| Home Depot Inc. | 2.700% | 4/15/30 | 7,480 | 6,622 | ||
| Home Depot Inc. | 3.250% | 4/15/32 | 44,440 | 40,188 | ||
| Home Depot Inc. | 4.500% | 9/15/32 | 27,360 | 27,157 | ||
| Home Depot Inc. | 3.300% | 4/15/40 | 18,410 | 14,942 | ||
| Home Depot Inc. | 4.400% | 3/15/45 | 28,655 | 26,093 | ||
| Home Depot Inc. | 4.250% | 4/1/46 | 25,000 | 22,174 | ||
| Home Depot Inc. | 4.500% | 12/6/48 | 12,215 | 11,354 | ||
| Home Depot Inc. | 3.125% | 12/15/49 | 2,490 | 1,823 | ||
| Home Depot Inc. | 2.375% | 3/15/51 | 2,495 | 1,565 | ||
| Home Depot Inc. | 2.750% | 9/15/51 | 19,955 | 13,497 | ||
| Home Depot Inc. | 3.625% | 4/15/52 | 25,570 | 20,318 | ||
| Home Depot Inc. | 4.950% | 9/15/52 | 36,582 | 35,934 | ||
| 5 | Hyundai Capital America | 0.800% | 4/3/23 | 91,160 | 89,700 | |
| 5 | Hyundai Capital America | 0.875% | 6/14/24 | 49,225 | 45,781 | |
| 5 | Hyundai Capital America | 1.650% | 9/17/26 | 36,480 | 31,364 | |
| 2 | Johns Hopkins University | 4.083% | 7/1/53 | 7,805 | 6,700 | |
| 2 | Johns Hopkins University | 2.813% | 1/1/60 | 6,420 | 4,131 | |
| Leland Stanford Junior University | 6.875% | 2/1/24 | 13,685 | 14,024 | ||
| 2 | Leland Stanford Junior University | 7.650% | 6/15/26 | 29,000 | 31,333 | |
| Lowe's Cos. Inc. | 3.100% | 5/3/27 | 8,700 | 8,173 | ||
| Lowe's Cos. Inc. | 6.500% | 3/15/29 | 13,301 | 14,423 | ||
| Lowe's Cos. Inc. | 3.750% | 4/1/32 | 11,620 | 10,567 | ||
| 2 | McDonald's Corp. | 3.250% | 6/10/24 | 5,460 | 5,352 | |
| 2 | McDonald's Corp. | 4.875% | 7/15/40 | 10,000 | 9,502 | |
| 2 | Northeastern University | 2.894% | 10/1/50 | 6,995 | 4,635 | |
| Stanley Black & Decker Inc. | 4.850% | 11/15/48 | 24,455 | 22,385 | ||
| Thomas Jefferson University | 3.847% | 11/1/57 | 23,125 | 16,995 | ||
| 2 | University of Chicago | 2.761% | 4/1/45 | 5,825 | 4,405 | |
| 2 | University of Miami | 4.063% | 4/1/52 | 9,030 | 7,520 | |
| VF Corp. | 2.800% | 4/23/27 | 17,615 | 16,064 | ||
| VF Corp. | 2.950% | 4/23/30 | 37,015 | 31,097 | ||
| 974,854 | ||||||
| Consumer Staples (0.7%) | ||||||
| Altria Group Inc. | 4.500% | 5/2/43 | 5,945 | 4,526 | ||
| Anheuser-Busch Cos. LLC | 6.500% | 1/1/28 | 19,550 | 20,913 | ||
| 2 | Anheuser-Busch Cos. LLC | 4.700% | 2/1/36 | 35,700 | 34,319 | |
| 2 | Anheuser-Busch Cos. LLC | 4.900% | 2/1/46 | 52,135 | 48,845 | |
| Coupon | Maturity Date | Face Amount ($000) | Market Value• ($000) | |||
| Anheuser-Busch InBev Worldwide Inc. | 4.950% | 1/15/42 | 5,818 | 5,576 | ||
| Anheuser-Busch InBev Worldwide Inc. | 3.750% | 7/15/42 | 23,160 | 19,188 | ||
| Anheuser-Busch InBev Worldwide Inc. | 4.500% | 6/1/50 | 29,542 | 26,773 | ||
| Anheuser-Busch InBev Worldwide Inc. | 4.600% | 6/1/60 | 14,600 | 13,158 | ||
| Archer-Daniels-Midland Co. | 4.500% | 3/15/49 | 35,045 | 32,701 | ||
| BAT Capital Corp. | 3.557% | 8/15/27 | 63,450 | 57,884 | ||
| 5 | Cargill Inc. | 6.875% | 5/1/28 | 19,355 | 20,830 | |
| 5 | Cargill Inc. | 2.125% | 4/23/30 | 5,265 | 4,368 | |
| 5 | Cargill Inc. | 4.760% | 11/23/45 | 28,190 | 25,470 | |
| 5 | CK Hutchison International 20 Ltd. | 3.375% | 5/8/50 | 22,015 | 15,779 | |
| 5 | Coca-Cola Europacific Partners plc | 0.800% | 5/3/24 | 32,165 | 30,186 | |
| 2 | Colgate-Palmolive Co. | 7.600% | 5/19/25 | 13,920 | 14,785 | |
| Conagra Brands Inc. | 4.600% | 11/1/25 | 7,855 | 7,777 | ||
| Conagra Brands Inc. | 1.375% | 11/1/27 | 11,765 | 9,813 | ||
| 5 | Danone SA | 2.947% | 11/2/26 | 30,550 | 28,460 | |
| Diageo Capital plc | 2.625% | 4/29/23 | 48,310 | 47,856 | ||
| Diageo Capital plc | 2.375% | 10/24/29 | 20,000 | 17,181 | ||
| Diageo Capital plc | 2.000% | 4/29/30 | 5,830 | 4,847 | ||
| Diageo Capital plc | 2.125% | 4/29/32 | 1,845 | 1,489 | ||
| Estee Lauder Cos. Inc. | 2.375% | 12/1/29 | 12,615 | 10,878 | ||
| Hormel Foods Corp. | 1.700% | 6/3/28 | 8,125 | 7,045 | ||
| Kroger Co. | 3.850% | 8/1/23 | 10,770 | 10,680 | ||
| Kroger Co. | 4.000% | 2/1/24 | 22,290 | 22,059 | ||
| McCormick & Co. Inc. | 2.500% | 4/15/30 | 3,205 | 2,699 | ||
| Molson Coors Beverage Co. | 3.000% | 7/15/26 | 54,900 | 51,542 | ||
| Philip Morris International Inc. | 3.600% | 11/15/23 | 7,000 | 6,911 | ||
| Philip Morris International Inc. | 3.375% | 8/11/25 | 14,440 | 13,862 | ||
| Philip Morris International Inc. | 5.125% | 11/17/27 | 39,385 | 39,474 | ||
| Philip Morris International Inc. | 5.625% | 11/17/29 | 39,305 | 39,964 | ||
| Philip Morris International Inc. | 5.750% | 11/17/32 | 50,815 | 52,339 | ||
| Philip Morris International Inc. | 4.875% | 11/15/43 | 6,185 | 5,368 | ||
| 5 | Sigma Alimentos SA de CV | 4.125% | 5/2/26 | 14,750 | 13,969 | |
| 769,514 | ||||||
| Energy (0.9%) | ||||||
| BP Capital Markets America Inc. | 1.749% | 8/10/30 | 12,780 | 10,335 | ||
| BP Capital Markets America Inc. | 2.721% | 1/12/32 | 42,755 | 36,319 | ||
| BP Capital Markets America Inc. | 3.060% | 6/17/41 | 20,000 | 15,211 | ||
| BP Capital Markets America Inc. | 2.772% | 11/10/50 | 11,870 | 7,900 | ||
| BP Capital Markets America Inc. | 2.939% | 6/4/51 | 30,385 | 20,754 | ||
| BP Capital Markets America Inc. | 3.001% | 3/17/52 | 68,790 | 47,158 | ||
| BP Capital Markets America Inc. | 3.379% | 2/8/61 | 12,750 | 9,060 | ||
| Eastern Gas Transmission & Storage Inc. | 3.000% | 11/15/29 | 19,580 | 17,101 | ||
| 2 | Eastern Gas Transmission & Storage Inc. | 4.800% | 11/1/43 | 4,185 | 3,610 | |
| 2 | Eastern Gas Transmission & Storage Inc. | 4.600% | 12/15/44 | 24,863 | 20,770 | |
| 5 | EIG Pearl Holdings Sarl | 3.545% | 8/31/36 | 43,005 | 35,879 | |
| 5 | EIG Pearl Holdings Sarl | 4.387% | 11/30/46 | 16,115 | 12,119 | |
| Energy Transfer LP | 5.250% | 4/15/29 | 40,000 | 38,968 | ||
| Energy Transfer LP | 5.350% | 5/15/45 | 3,500 | 3,044 | ||
| Energy Transfer LP | 5.300% | 4/15/47 | 5,745 | 4,911 | ||
| Energy Transfer LP | 5.400% | 10/1/47 | 750 | 649 | ||
| Energy Transfer LP | 5.000% | 5/15/50 | 10,000 | 8,241 | ||
| Enterprise Products Operating LLC | 5.100% | 2/15/45 | 9,720 | 8,934 | ||
| Enterprise Products Operating LLC | 3.700% | 1/31/51 | 5,935 | 4,408 | ||
| Enterprise Products Operating LLC | 3.300% | 2/15/53 | 15,000 | 10,337 | ||
| Exxon Mobil Corp. | 2.726% | 3/1/23 | 11,910 | 11,852 | ||
| Exxon Mobil Corp. | 3.043% | 3/1/26 | 8,115 | 7,777 | ||
| Exxon Mobil Corp. | 2.275% | 8/16/26 | 36,735 | 34,307 | ||
| Exxon Mobil Corp. | 2.440% | 8/16/29 | 25,195 | 22,285 | ||
| Coupon | Maturity Date | Face Amount ($000) | Market Value• ($000) | |||
| Exxon Mobil Corp. | 2.610% | 10/15/30 | 35,925 | 31,720 | ||
| Exxon Mobil Corp. | 4.114% | 3/1/46 | 12,060 | 10,574 | ||
| 5 | Galaxy Pipeline Assets Bidco Ltd. | 2.160% | 3/31/34 | 47,568 | 40,214 | |
| 5 | Galaxy Pipeline Assets Bidco Ltd. | 2.940% | 9/30/40 | 42,990 | 34,369 | |
| Plains All American Pipeline LP | 3.850% | 10/15/23 | 36,775 | 36,276 | ||
| 5 | Schlumberger Holdings Corp. | 3.900% | 5/17/28 | 31,025 | 29,307 | |
| Schlumberger Investment SA | 3.650% | 12/1/23 | 44,520 | 44,028 | ||
| Shell International Finance BV | 3.250% | 5/11/25 | 11,051 | 10,750 | ||
| Shell International Finance BV | 4.125% | 5/11/35 | 43,465 | 40,861 | ||
| Shell International Finance BV | 5.500% | 3/25/40 | 12,990 | 13,548 | ||
| Shell International Finance BV | 2.875% | 11/26/41 | 15,000 | 11,196 | ||
| Shell International Finance BV | 4.375% | 5/11/45 | 96,700 | 86,811 | ||
| Shell International Finance BV | 4.000% | 5/10/46 | 10,000 | 8,455 | ||
| Shell International Finance BV | 3.000% | 11/26/51 | 52,435 | 36,971 | ||
| Suncor Energy Inc. | 5.950% | 12/1/34 | 20,700 | 20,750 | ||
| TotalEnergies Capital International SA | 2.700% | 1/25/23 | 36,510 | 36,380 | ||
| TotalEnergies Capital International SA | 3.750% | 4/10/24 | 41,500 | 40,984 | ||
| TransCanada PipeLines Ltd. | 4.875% | 1/15/26 | 47,256 | 46,943 | ||
| TransCanada PipeLines Ltd. | 4.100% | 4/15/30 | 7,125 | 6,664 | ||
| 978,730 | ||||||
| Financials (8.9%) | ||||||
| ACE Capital Trust II | 9.700% | 4/1/30 | 20,000 | 24,696 | ||
| AerCap Ireland Capital DAC | 3.000% | 10/29/28 | 15,230 | 12,787 | ||
| AerCap Ireland Capital DAC | 3.300% | 1/30/32 | 3,550 | 2,805 | ||
| AerCap Ireland Capital DAC | 3.400% | 10/29/33 | 9,080 | 6,981 | ||
| 5 | AIA Group Ltd. | 3.600% | 4/9/29 | 50,475 | 46,330 | |
| 5 | AIA Group Ltd. | 3.375% | 4/7/30 | 12,460 | 11,116 | |
| American International Group Inc. | 6.250% | 5/1/36 | 7,775 | 8,360 | ||
| American International Group Inc. | 4.800% | 7/10/45 | 10,680 | 9,665 | ||
| American International Group Inc. | 4.750% | 4/1/48 | 21,995 | 19,952 | ||
| American International Group Inc. | 4.375% | 6/30/50 | 12,500 | 10,819 | ||
| Ameriprise Financial Inc. | 4.500% | 5/13/32 | 11,845 | 11,668 | ||
| Aon Corp. | 2.850% | 5/28/27 | 18,870 | 17,329 | ||
| 5 | Athene Global Funding | 1.000% | 4/16/24 | 22,095 | 20,667 | |
| 5 | Athene Global Funding | 1.985% | 8/19/28 | 290 | 236 | |
| 5 | Athene Global Funding | 2.717% | 1/7/29 | 33,350 | 27,758 | |
| 5 | Australia & New Zealand Banking Group Ltd. | 2.570% | 11/25/35 | 22,135 | 16,080 | |
| 5 | Aviation Capital Group LLC | 1.950% | 9/20/26 | 14,298 | 12,063 | |
| 5 | Avolon Holdings Funding Ltd. | 2.528% | 11/18/27 | 4,730 | 3,803 | |
| Banco Santander SA | 3.125% | 2/23/23 | 28,400 | 28,253 | ||
| Banco Santander SA | 3.848% | 4/12/23 | 16,400 | 16,312 | ||
| Banco Santander SA | 1.849% | 3/25/26 | 14,000 | 12,362 | ||
| Banco Santander SA | 2.749% | 12/3/30 | 15,600 | 11,717 | ||
| Banco Santander SA | 2.958% | 3/25/31 | 10,000 | 7,900 | ||
| 2 | Bank of America Corp. | 3.500% | 4/19/26 | 10,000 | 9,592 | |
| 2 | Bank of America Corp. | 3.559% | 4/23/27 | 86,705 | 81,834 | |
| 2 | Bank of America Corp. | 3.593% | 7/21/28 | 47,950 | 44,469 | |
| 2 | Bank of America Corp. | 3.419% | 12/20/28 | 8,681 | 7,918 | |
| 2 | Bank of America Corp. | 4.271% | 7/23/29 | 74,365 | 69,992 | |
| 2 | Bank of America Corp. | 3.974% | 2/7/30 | 120,185 | 110,530 | |
| 2 | Bank of America Corp. | 3.194% | 7/23/30 | 35,285 | 30,778 | |
| 2 | Bank of America Corp. | 2.496% | 2/13/31 | 50,870 | 41,901 | |
| Bank of America Corp. | 2.572% | 10/20/32 | 17,275 | 13,758 | ||
| Bank of America Corp. | 5.015% | 7/22/33 | 25,000 | 24,154 | ||
| Bank of America Corp. | 3.846% | 3/8/37 | 53,115 | 44,774 | ||
| 2 | Bank of America Corp. | 5.875% | 2/7/42 | 9,965 | 10,387 | |
| Bank of America Corp. | 3.311% | 4/22/42 | 55,635 | 42,129 | ||
| Coupon | Maturity Date | Face Amount ($000) | Market Value• ($000) | |||
| 2 | Bank of America Corp. | 5.000% | 1/21/44 | 39,433 | 37,153 | |
| 2 | Bank of America Corp. | 3.946% | 1/23/49 | 5,380 | 4,343 | |
| 2 | Bank of America Corp. | 4.330% | 3/15/50 | 78,120 | 66,474 | |
| Bank of America Corp. | 2.972% | 7/21/52 | 65,950 | 43,430 | ||
| 2 | Bank of New York Mellon Corp. | 3.000% | 2/24/25 | 27,990 | 27,042 | |
| Bank of New York Mellon Corp. | 5.834% | 10/25/33 | 18,540 | 19,523 | ||
| Bank of Nova Scotia | 2.700% | 8/3/26 | 63,160 | 58,786 | ||
| Bank of Nova Scotia | 1.950% | 2/2/27 | 12,470 | 11,133 | ||
| 5 | Banque Federative du Credit Mutuel SA | 1.604% | 10/4/26 | 34,305 | 29,881 | |
| 2 | Barclays plc | 3.932% | 5/7/25 | 55,605 | 53,640 | |
| 2 | Barclays plc | 2.852% | 5/7/26 | 9,975 | 9,196 | |
| Barclays plc | 2.279% | 11/24/27 | 14,930 | 12,857 | ||
| Barclays plc | 2.667% | 3/10/32 | 44,170 | 33,822 | ||
| Barclays plc | 2.894% | 11/24/32 | 20,000 | 15,317 | ||
| Barclays plc | 3.330% | 11/24/42 | 37,170 | 25,734 | ||
| 6 | Barclays plc, 3M USD LIBOR + 1.380% | 6.024% | 5/16/24 | 36,385 | 36,126 | |
| Berkshire Hathaway Finance Corp. | 2.875% | 3/15/32 | 9,700 | 8,570 | ||
| BlackRock Inc. | 2.100% | 2/25/32 | 29,005 | 23,574 | ||
| 5 | Blackstone Holdings Finance Co. LLC | 2.550% | 3/30/32 | 22,680 | 18,163 | |
| 2 | BNP Paribas SA | 3.250% | 3/3/23 | 7,620 | 7,590 | |
| 5 | BNP Paribas SA | 3.800% | 1/10/24 | 25,780 | 25,334 | |
| 5 | BNP Paribas SA | 3.375% | 1/9/25 | 60,670 | 58,308 | |
| 5 | BNP Paribas SA | 2.819% | 11/19/25 | 45,685 | 42,976 | |
| 5 | BNP Paribas SA | 1.323% | 1/13/27 | 18,995 | 16,575 | |
| 5 | BNP Paribas SA | 3.500% | 11/16/27 | 69,325 | 63,164 | |
| 5 | BNP Paribas SA | 2.591% | 1/20/28 | 35,220 | 30,896 | |
| 5 | BNP Paribas SA | 2.159% | 9/15/29 | 31,165 | 25,408 | |
| 5 | BNP Paribas SA | 2.871% | 4/19/32 | 26,985 | 21,316 | |
| 5 | BPCE SA | 5.700% | 10/22/23 | 6,225 | 6,162 | |
| BPCE SA | 4.000% | 4/15/24 | 30,615 | 30,090 | ||
| 5 | BPCE SA | 5.150% | 7/21/24 | 43,790 | 42,893 | |
| 5 | BPCE SA | 2.045% | 10/19/27 | 25,245 | 21,660 | |
| 5 | BPCE SA | 3.500% | 10/23/27 | 64,230 | 57,743 | |
| 5 | BPCE SA | 2.700% | 10/1/29 | 50,000 | 42,103 | |
| 5 | Brighthouse Financial Global Funding | 1.000% | 4/12/24 | 2,425 | 2,277 | |
| 5 | Brighthouse Financial Global Funding | 1.750% | 1/13/25 | 16,910 | 15,574 | |
| 5 | Brighthouse Financial Global Funding | 1.550% | 5/24/26 | 20,210 | 17,651 | |
| 5 | Brighthouse Financial Global Funding | 2.000% | 6/28/28 | 16,275 | 13,570 | |
| 5 | Canadian Imperial Bank of Commerce | 1.150% | 7/8/26 | 33,885 | 29,907 | |
| Capital One Financial Corp. | 3.750% | 4/24/24 | 55,460 | 54,369 | ||
| Capital One Financial Corp. | 3.200% | 2/5/25 | 24,185 | 23,246 | ||
| Charles Schwab Corp. | 0.750% | 3/18/24 | 30,130 | 28,618 | ||
| Charles Schwab Corp. | 3.200% | 3/2/27 | 19,665 | 18,596 | ||
| Charles Schwab Corp. | 2.000% | 3/20/28 | 27,375 | 24,234 | ||
| Charles Schwab Corp. | 2.900% | 3/3/32 | 50,765 | 43,626 | ||
| Chubb Corp. | 6.000% | 5/11/37 | 50,000 | 53,650 | ||
| Chubb INA Holdings Inc. | 3.350% | 5/15/24 | 22,345 | 21,926 | ||
| Chubb INA Holdings Inc. | 4.350% | 11/3/45 | 29,835 | 26,481 | ||
| Citigroup Inc. | 0.981% | 5/1/25 | 32,820 | 30,612 | ||
| Citigroup Inc. | 1.462% | 6/9/27 | 66,630 | 58,005 | ||
| 2 | Citigroup Inc. | 3.070% | 2/24/28 | 65,000 | 59,133 | |
| Citigroup Inc. | 4.125% | 7/25/28 | 14,550 | 13,755 | ||
| 2 | Citigroup Inc. | 3.520% | 10/27/28 | 72,550 | 66,599 | |
| 2 | Citigroup Inc. | 3.878% | 1/24/39 | 37,030 | 31,168 | |
| Citigroup Inc. | 2.904% | 11/3/42 | 19,370 | 13,606 | ||
| 5 | CNO Global Funding | 1.650% | 1/6/25 | 8,725 | 8,083 | |
| 5 | CNO Global Funding | 2.650% | 1/6/29 | 12,585 | 10,689 | |
| 5 | Commonwealth Bank of Australia | 2.688% | 3/11/31 | 74,015 | 56,675 | |
| Coupon | Maturity Date | Face Amount ($000) | Market Value• ($000) | |||
| 5 | Commonwealth Bank of Australia | 3.784% | 3/14/32 | 9,885 | 8,118 | |
| 5 | Cooperatieve Rabobank UA | 1.106% | 2/24/27 | 46,710 | 40,494 | |
| 5 | Cooperatieve Rabobank UA | 4.655% | 8/22/28 | 30,335 | 29,265 | |
| 5 | Corebridge Financial Inc. | 3.900% | 4/5/32 | 25,012 | 22,058 | |
| 5 | Corebridge Financial Inc. | 4.350% | 4/5/42 | 2,760 | 2,266 | |
| 5 | Corebridge Financial Inc. | 4.400% | 4/5/52 | 27,235 | 21,954 | |
| 5 | Credit Agricole SA | 3.750% | 4/24/23 | 31,675 | 31,472 | |
| 5 | Credit Agricole SA | 3.250% | 10/4/24 | 71,600 | 69,134 | |
| Credit Suisse Group AG | 3.750% | 3/26/25 | 67,850 | 60,132 | ||
| 5 | Credit Suisse Group AG | 2.593% | 9/11/25 | 17,585 | 15,686 | |
| 5 | Credit Suisse Group AG | 1.305% | 2/2/27 | 14,940 | 11,866 | |
| 5 | Credit Suisse Group AG | 3.869% | 1/12/29 | 10,980 | 8,829 | |
| 5 | Credit Suisse Group AG | 3.091% | 5/14/32 | 59,185 | 40,207 | |
| 5 | Credit Suisse Group AG | 6.537% | 8/12/33 | 28,540 | 24,555 | |
| 5 | Danske Bank A/S | 3.875% | 9/12/23 | 46,290 | 45,612 | |
| 5 | Danske Bank A/S | 5.375% | 1/12/24 | 28,240 | 28,071 | |
| 5 | Danske Bank A/S | 1.621% | 9/11/26 | 28,990 | 25,211 | |
| 5 | Danske Bank A/S | 1.549% | 9/10/27 | 55,460 | 47,551 | |
| 5 | DNB Bank ASA | 1.535% | 5/25/27 | 44,030 | 38,387 | |
| 5 | DNB Bank ASA | 1.605% | 3/30/28 | 45,870 | 39,014 | |
| 5 | Equitable Financial Life Global Funding | 1.400% | 7/7/25 | 10,395 | 9,417 | |
| 5 | Equitable Financial Life Global Funding | 1.300% | 7/12/26 | 26,755 | 23,422 | |
| 5 | Equitable Financial Life Global Funding | 1.700% | 11/12/26 | 12,440 | 10,964 | |
| 5 | Equitable Financial Life Global Funding | 1.400% | 8/27/27 | 18,220 | 15,402 | |
| 5 | Equitable Financial Life Global Funding | 1.800% | 3/8/28 | 28,220 | 23,720 | |
| 5 | Farmers Exchange Capital | 7.050% | 7/15/28 | 25,000 | 25,813 | |
| Fifth Third Bancorp | 4.055% | 4/25/28 | 15,040 | 14,122 | ||
| Fifth Third Bancorp | 4.337% | 4/25/33 | 40,175 | 36,569 | ||
| 5 | Five Corners Funding Trust | 4.419% | 11/15/23 | 5,935 | 5,883 | |
| 5 | Five Corners Funding Trust II | 2.850% | 5/15/30 | 30,000 | 25,406 | |
| 5 | GA Global Funding Trust | 1.000% | 4/8/24 | 21,750 | 20,327 | |
| Globe Life Inc. | 7.875% | 5/15/23 | 45,000 | 45,443 | ||
| Goldman Sachs Group Inc. | 3.625% | 1/22/23 | 35,320 | 35,256 | ||
| Goldman Sachs Group Inc. | 3.500% | 1/23/25 | 17,545 | 17,059 | ||
| 2 | Goldman Sachs Group Inc. | 3.272% | 9/29/25 | 46,260 | 44,549 | |
| Goldman Sachs Group Inc. | 3.850% | 1/26/27 | 17,980 | 17,284 | ||
| Goldman Sachs Group Inc. | 1.431% | 3/9/27 | 60,000 | 52,767 | ||
| Goldman Sachs Group Inc. | 1.542% | 9/10/27 | 97,685 | 84,418 | ||
| 2 | Goldman Sachs Group Inc. | 3.691% | 6/5/28 | 20,055 | 18,767 | |
| 2 | Goldman Sachs Group Inc. | 3.814% | 4/23/29 | 23,795 | 21,903 | |
| 2 | Goldman Sachs Group Inc. | 4.223% | 5/1/29 | 67,740 | 63,588 | |
| Goldman Sachs Group Inc. | 3.800% | 3/15/30 | 23,040 | 20,966 | ||
| Goldman Sachs Group Inc. | 1.992% | 1/27/32 | 30,600 | 23,649 | ||
| Goldman Sachs Group Inc. | 2.615% | 4/22/32 | 88,125 | 71,191 | ||
| Goldman Sachs Group Inc. | 2.383% | 7/21/32 | 67,160 | 53,121 | ||
| Goldman Sachs Group Inc. | 2.650% | 10/21/32 | 14,050 | 11,276 | ||
| Goldman Sachs Group Inc. | 3.102% | 2/24/33 | 58,620 | 48,689 | ||
| Goldman Sachs Group Inc. | 6.750% | 10/1/37 | 43,995 | 47,656 | ||
| Goldman Sachs Group Inc. | 6.250% | 2/1/41 | 20,135 | 21,675 | ||
| 2 | Goldman Sachs Group Inc. | 4.800% | 7/8/44 | 25,675 | 23,703 | |
| 5 | Guardian Life Global Funding | 1.250% | 5/13/26 | 6,735 | 5,959 | |
| HSBC Holdings plc | 3.600% | 5/25/23 | 60,200 | 59,847 | ||
| HSBC Holdings plc | 0.976% | 5/24/25 | 10,150 | 9,344 | ||
| HSBC Holdings plc | 1.589% | 5/24/27 | 25,850 | 22,158 | ||
| HSBC Holdings plc | 2.251% | 11/22/27 | 74,610 | 64,346 | ||
| 2 | HSBC Holdings plc | 4.041% | 3/13/28 | 21,805 | 20,007 | |
| HSBC Holdings plc | 7.390% | 11/3/28 | 36,196 | 37,962 | ||
| 2 | HSBC Holdings plc | 4.583% | 6/19/29 | 40,480 | 37,231 | |
| Coupon | Maturity Date | Face Amount ($000) | Market Value• ($000) | |||
| HSBC Holdings plc | 2.206% | 8/17/29 | 53,960 | 43,590 | ||
| 2 | HSBC Holdings plc | 2.357% | 8/18/31 | 54,320 | 41,568 | |
| HSBC Holdings plc | 2.804% | 5/24/32 | 50,910 | 39,426 | ||
| HSBC Holdings plc | 2.871% | 11/22/32 | 52,995 | 40,466 | ||
| HSBC Holdings plc | 6.500% | 5/2/36 | 25,000 | 25,149 | ||
| HSBC Holdings plc | 6.100% | 1/14/42 | 40,665 | 41,948 | ||
| HSBC Holdings plc | 5.250% | 3/14/44 | 13,210 | 11,576 | ||
| 6 | HSBC Holdings plc, 3M USD LIBOR + 1.000% | 5.674% | 5/18/24 | 26,340 | 26,147 | |
| Huntington National Bank | 4.552% | 5/17/28 | 11,240 | 10,930 | ||
| ING Groep NV | 3.950% | 3/29/27 | 44,565 | 42,268 | ||
| ING Groep NV | 1.726% | 4/1/27 | 16,075 | 14,164 | ||
| Intercontinental Exchange Inc. | 4.350% | 6/15/29 | 8,575 | 8,461 | ||
| Intercontinental Exchange Inc. | 1.850% | 9/15/32 | 26,030 | 20,002 | ||
| Intercontinental Exchange Inc. | 4.600% | 3/15/33 | 38,595 | 37,491 | ||
| Intercontinental Exchange Inc. | 2.650% | 9/15/40 | 5,860 | 4,188 | ||
| Intercontinental Exchange Inc. | 3.000% | 6/15/50 | 55,205 | 38,581 | ||
| Intercontinental Exchange Inc. | 4.950% | 6/15/52 | 74,200 | 71,565 | ||
| 5 | JAB Holdings BV | 2.200% | 11/23/30 | 9,385 | 7,101 | |
| 5 | JAB Holdings BV | 3.750% | 5/28/51 | 19,275 | 11,372 | |
| 5 | JAB Holdings BV | 4.500% | 4/8/52 | 31,940 | 21,597 | |
| 5 | Jackson National Life Global Funding | 3.250% | 1/30/24 | 24,070 | 23,460 | |
| 5 | Jackson National Life Global Funding | 1.750% | 1/12/25 | 18,915 | 17,544 | |
| 5 | Jackson National Life Insurance Co. | 8.150% | 3/15/27 | 18,890 | 20,481 | |
| JPMorgan Chase & Co. | 3.375% | 5/1/23 | 15,450 | 15,356 | ||
| JPMorgan Chase & Co. | 3.875% | 2/1/24 | 39,000 | 38,637 | ||
| JPMorgan Chase & Co. | 3.900% | 7/15/25 | 13,870 | 13,672 | ||
| JPMorgan Chase & Co. | 2.069% | 6/1/29 | 42,085 | 35,423 | ||
| 2 | JPMorgan Chase & Co. | 4.452% | 12/5/29 | 64,735 | 61,523 | |
| 2 | JPMorgan Chase & Co. | 3.702% | 5/6/30 | 16,000 | 14,547 | |
| JPMorgan Chase & Co. | 2.580% | 4/22/32 | 58,675 | 47,667 | ||
| JPMorgan Chase & Co. | 4.586% | 4/26/33 | 30,000 | 28,231 | ||
| JPMorgan Chase & Co. | 4.912% | 7/25/33 | 49,530 | 47,797 | ||
| JPMorgan Chase & Co. | 5.717% | 9/14/33 | 10,140 | 9,996 | ||
| 2 | JPMorgan Chase & Co. | 3.109% | 4/22/41 | 19,440 | 14,545 | |
| JPMorgan Chase & Co. | 5.600% | 7/15/41 | 96,000 | 98,616 | ||
| JPMorgan Chase & Co. | 5.400% | 1/6/42 | 18,035 | 18,237 | ||
| JPMorgan Chase & Co. | 3.157% | 4/22/42 | 50,000 | 37,157 | ||
| JPMorgan Chase & Co. | 5.625% | 8/16/43 | 16,100 | 16,437 | ||
| JPMorgan Chase & Co. | 4.950% | 6/1/45 | 15,000 | 13,896 | ||
| 2 | JPMorgan Chase & Co. | 3.964% | 11/15/48 | 159,600 | 129,171 | |
| 2 | JPMorgan Chase & Co. | 3.109% | 4/22/51 | 19,885 | 13,768 | |
| 5 | Liberty Mutual Group Inc. | 4.250% | 6/15/23 | 3,160 | 3,131 | |
| 5 | Liberty Mutual Group Inc. | 4.569% | 2/1/29 | 14,170 | 13,238 | |
| 5 | Liberty Mutual Group Inc. | 5.500% | 6/15/52 | 26,870 | 24,160 | |
| 5 | Liberty Mutual Insurance Co. | 7.875% | 10/15/26 | 31,210 | 33,118 | |
| 5 | LSEGA Financing plc | 1.375% | 4/6/26 | 56,790 | 50,287 | |
| 5 | LSEGA Financing plc | 2.000% | 4/6/28 | 24,615 | 21,108 | |
| 5 | LSEGA Financing plc | 2.500% | 4/6/31 | 44,330 | 37,310 | |
| 5 | Macquarie Group Ltd. | 4.150% | 3/27/24 | 49,500 | 49,225 | |
| 5 | Macquarie Group Ltd. | 1.935% | 4/14/28 | 42,835 | 36,042 | |
| 5 | Macquarie Group Ltd. | 2.871% | 1/14/33 | 59,895 | 46,052 | |
| 2 | Manufacturers & Traders Trust Co. | 2.900% | 2/6/25 | 24,685 | 23,646 | |
| Marsh & McLennan Cos. Inc. | 4.375% | 3/15/29 | 23,405 | 22,845 | ||
| Marsh & McLennan Cos. Inc. | 4.900% | 3/15/49 | 10,915 | 10,209 | ||
| Marsh & McLennan Cos. Inc. | 2.900% | 12/15/51 | 20,255 | 13,313 | ||
| 5 | Massachusetts Mutual Life Insurance Co. | 3.200% | 12/1/61 | 30,000 | 18,611 | |
| MetLife Inc. | 3.600% | 4/10/24 | 35,035 | 34,370 | ||
| Coupon | Maturity Date | Face Amount ($000) | Market Value• ($000) | |||
| MetLife Inc. | 4.125% | 8/13/42 | 15,565 | 13,428 | ||
| MetLife Inc. | 4.875% | 11/13/43 | 17,000 | 16,037 | ||
| MetLife Inc. | 5.000% | 7/15/52 | 15,634 | 15,119 | ||
| 5 | Metropolitan Life Global Funding I | 3.450% | 12/18/26 | 23,660 | 22,272 | |
| 5 | Metropolitan Life Global Funding I | 4.400% | 6/30/27 | 9,910 | 9,698 | |
| 5 | Metropolitan Life Global Funding I | 3.000% | 9/19/27 | 21,455 | 19,651 | |
| 5 | Metropolitan Life Global Funding I | 4.300% | 8/25/29 | 15,345 | 14,625 | |
| 5 | Metropolitan Life Global Funding I | 2.400% | 1/11/32 | 53,825 | 43,765 | |
| Mitsubishi UFJ Financial Group Inc. | 5.017% | 7/20/28 | 31,915 | 31,324 | ||
| 2 | Morgan Stanley | 3.875% | 4/29/24 | 97,010 | 95,448 | |
| 2 | Morgan Stanley | 3.700% | 10/23/24 | 29,050 | 28,432 | |
| Morgan Stanley | 0.790% | 5/30/25 | 42,545 | 39,404 | ||
| 2 | Morgan Stanley | 2.720% | 7/22/25 | 53,860 | 51,361 | |
| 2 | Morgan Stanley | 4.000% | 7/23/25 | 29,455 | 28,852 | |
| Morgan Stanley | 2.630% | 2/18/26 | 61,765 | 58,097 | ||
| 2 | Morgan Stanley | 3.125% | 7/27/26 | 11,435 | 10,731 | |
| 2 | Morgan Stanley | 6.250% | 8/9/26 | 20,000 | 21,207 | |
| Morgan Stanley | 3.625% | 1/20/27 | 60,000 | 57,060 | ||
| 2 | Morgan Stanley | 3.772% | 1/24/29 | 56,905 | 52,514 | |
| 2 | Morgan Stanley | 2.699% | 1/22/31 | 74,290 | 62,400 | |
| 2 | Morgan Stanley | 1.928% | 4/28/32 | 50,000 | 38,316 | |
| 2 | Morgan Stanley | 2.239% | 7/21/32 | 81,175 | 63,310 | |
| 2 | Morgan Stanley | 2.511% | 10/20/32 | 36,580 | 29,094 | |
| Morgan Stanley | 2.943% | 1/21/33 | 31,555 | 25,861 | ||
| Morgan Stanley | 2.484% | 9/16/36 | 43,080 | 31,962 | ||
| Morgan Stanley | 4.300% | 1/27/45 | 18,360 | 15,897 | ||
| Nasdaq Inc. | 3.950% | 3/7/52 | 18,120 | 14,273 | ||
| National Australia Bank Ltd. | 3.905% | 6/9/27 | 33,500 | 32,392 | ||
| 5 | National Australia Bank Ltd. | 2.332% | 8/21/30 | 75,550 | 57,552 | |
| 5 | National Australia Bank Ltd. | 2.990% | 5/21/31 | 62,492 | 48,975 | |
| 5 | National Australia Bank Ltd. | 3.347% | 1/12/37 | 38,825 | 29,359 | |
| 5 | National Securities Clearing Corp. | 5.100% | 11/21/27 | 52,090 | 52,929 | |
| 5 | Nationwide Financial Services Inc. | 3.900% | 11/30/49 | 48,905 | 34,927 | |
| 5 | Nationwide Mutual Insurance Co. | 4.350% | 4/30/50 | 41,675 | 31,693 | |
| NatWest Group plc | 1.642% | 6/14/27 | 29,040 | 24,944 | ||
| 5 | NatWest Markets plc | 0.800% | 8/12/24 | 22,050 | 20,374 | |
| 5 | NBK SPC Ltd. | 1.625% | 9/15/27 | 67,900 | 59,524 | |
| 5 | New York Life Global Funding | 2.900% | 1/17/24 | 29,050 | 28,403 | |
| 5 | New York Life Insurance Co. | 5.875% | 5/15/33 | 55,395 | 57,503 | |
| 5 | New York Life Insurance Co. | 3.750% | 5/15/50 | 9,245 | 7,168 | |
| 5 | New York Life Insurance Co. | 4.450% | 5/15/69 | 15,270 | 12,737 | |
| 5 | Nordea Bank Abp | 1.500% | 9/30/26 | 65,800 | 56,948 | |
| 5 | Northwestern Mutual Life Insurance Co. | 3.850% | 9/30/47 | 30,684 | 23,897 | |
| 5 | Northwestern Mutual Life Insurance Co. | 3.625% | 9/30/59 | 9,324 | 6,567 | |
| 5 | Pacific Life Global Funding II | 1.375% | 4/14/26 | 27,085 | 24,031 | |
| 5 | Pacific LifeCorp | 5.400% | 9/15/52 | 18,030 | 17,278 | |
| 5 | Penske Truck Leasing Co. LP | 3.450% | 7/1/24 | 16,420 | 15,845 | |
| 5 | Penske Truck Leasing Co. LP | 2.700% | 11/1/24 | 10,220 | 9,638 | |
| 5 | Penske Truck Leasing Co. LP | 3.950% | 3/10/25 | 52,010 | 50,079 | |
| 5 | Penske Truck Leasing Co. LP | 4.450% | 1/29/26 | 16,450 | 15,909 | |
| 5 | Penske Truck Leasing Co. LP | 5.875% | 11/15/27 | 45,805 | 46,226 | |
| 2 | PNC Bank NA | 3.300% | 10/30/24 | 18,195 | 17,684 | |
| 2 | PNC Bank NA | 4.200% | 11/1/25 | 16,650 | 16,319 | |
| 2 | PNC Bank NA | 3.100% | 10/25/27 | 41,975 | 39,436 | |
| 2 | PNC Bank NA | 3.250% | 1/22/28 | 60,465 | 56,446 | |
| PNC Financial Services Group Inc. | 3.900% | 4/29/24 | 41,565 | 41,026 | ||
| PNC Financial Services Group Inc. | 2.550% | 1/22/30 | 54,405 | 46,243 | ||
| PNC Financial Services Group Inc. | 6.037% | 10/28/33 | 3,550 | 3,730 | ||
| Coupon | Maturity Date | Face Amount ($000) | Market Value• ($000) | |||
| 5 | Principal Life Global Funding II | 2.500% | 9/16/29 | 25,000 | 21,173 | |
| 5 | Protective Life Global Funding | 4.714% | 7/6/27 | 18,335 | 17,915 | |
| 5 | RGA Global Funding | 2.700% | 1/18/29 | 14,330 | 12,277 | |
| Santander Holdings USA Inc. | 3.400% | 1/18/23 | 20,375 | 20,341 | ||
| 5 | Standard Chartered plc | 1.214% | 3/23/25 | 6,465 | 6,045 | |
| 5 | Sumitomo Mitsui Trust Bank Ltd. | 0.850% | 3/25/24 | 58,195 | 54,898 | |
| 5 | Svenska Handelsbanken AB | 1.418% | 6/11/27 | 62,395 | 54,824 | |
| 5 | Teachers Insurance & Annuity Association of America | 4.900% | 9/15/44 | 32,380 | 30,021 | |
| 5 | Teachers Insurance & Annuity Association of America | 4.270% | 5/15/47 | 42,390 | 35,755 | |
| Toronto-Dominion Bank | 4.456% | 6/8/32 | 13,271 | 12,707 | ||
| 2 | Truist Bank | 3.300% | 5/15/26 | 12,895 | 12,099 | |
| 2 | Truist Financial Corp. | 2.200% | 3/16/23 | 31,045 | 30,814 | |
| 2 | Truist Financial Corp. | 3.700% | 6/5/25 | 49,000 | 47,702 | |
| 2 | Truist Financial Corp. | 1.950% | 6/5/30 | 22,005 | 17,943 | |
| 5 | UBS AG | 1.250% | 6/1/26 | 36,125 | 31,643 | |
| 5 | UBS Group AG | 1.494% | 8/10/27 | 40,005 | 34,405 | |
| 5 | UBS Group AG | 3.126% | 8/13/30 | 16,000 | 13,641 | |
| 5 | UBS Group AG | 2.095% | 2/11/32 | 23,650 | 17,928 | |
| 5 | UBS Group AG | 2.746% | 2/11/33 | 37,160 | 29,042 | |
| 5 | UBS Group AG | 3.179% | 2/11/43 | 36,770 | 24,636 | |
| 5 | UniCredit SpA | 1.982% | 6/3/27 | 35,165 | 29,763 | |
| 5 | UniCredit SpA | 3.127% | 6/3/32 | 38,145 | 28,914 | |
| 2 | US Bancorp | 3.700% | 1/30/24 | 52,500 | 51,884 | |
| 2 | US Bancorp | 2.677% | 1/27/33 | 65,020 | 53,793 | |
| US Bancorp | 4.967% | 7/22/33 | 27,955 | 26,636 | ||
| US Bancorp | 2.491% | 11/3/36 | 64,150 | 49,733 | ||
| Wells Fargo & Co. | 4.480% | 1/16/24 | 46,156 | 45,940 | ||
| 2 | Wells Fargo & Co. | 3.750% | 1/24/24 | 50,755 | 50,069 | |
| 2 | Wells Fargo & Co. | 3.550% | 9/29/25 | 32,170 | 31,168 | |
| Wells Fargo & Co. | 3.000% | 4/22/26 | 39,405 | 37,053 | ||
| 2 | Wells Fargo & Co. | 3.196% | 6/17/27 | 60,555 | 56,375 | |
| 2 | Wells Fargo & Co. | 3.526% | 3/24/28 | 19,500 | 18,119 | |
| 2 | Wells Fargo & Co. | 2.879% | 10/30/30 | 15,000 | 12,914 | |
| 2 | Wells Fargo & Co. | 2.572% | 2/11/31 | 76,020 | 63,733 | |
| 2 | Wells Fargo & Co. | 3.350% | 3/2/33 | 7,970 | 6,815 | |
| 2 | Wells Fargo & Co. | 4.897% | 7/25/33 | 100,785 | 97,112 | |
| Wells Fargo & Co. | 5.606% | 1/15/44 | 71,831 | 70,270 | ||
| 2 | Wells Fargo & Co. | 4.650% | 11/4/44 | 10,315 | 8,979 | |
| 2 | Wells Fargo & Co. | 4.900% | 11/17/45 | 19,160 | 16,908 | |
| 2 | Wells Fargo & Co. | 4.400% | 6/14/46 | 73,300 | 60,029 | |
| 2 | Wells Fargo & Co. | 4.750% | 12/7/46 | 23,150 | 19,874 | |
| 2 | Wells Fargo & Co. | 4.611% | 4/25/53 | 84,025 | 74,626 | |
| 9,464,500 | ||||||
| Health Care (2.2%) | ||||||
| AbbVie Inc. | 3.800% | 3/15/25 | 15,725 | 15,397 | ||
| AbbVie Inc. | 4.300% | 5/14/36 | 5,120 | 4,745 | ||
| AbbVie Inc. | 4.050% | 11/21/39 | 3,550 | 3,102 | ||
| 2 | AdventHealth Obligated Group | 2.795% | 11/15/51 | 30,030 | 19,321 | |
| 2 | Advocate Health & Hospitals Corp. | 2.211% | 6/15/30 | 7,210 | 5,971 | |
| 2 | Advocate Health & Hospitals Corp. | 3.008% | 6/15/50 | 8,980 | 6,082 | |
| Aetna Inc. | 2.800% | 6/15/23 | 25,660 | 25,341 | ||
| 5 | Alcon Finance Corp. | 2.750% | 9/23/26 | 5,830 | 5,359 | |
| 5 | Alcon Finance Corp. | 2.600% | 5/27/30 | 5,665 | 4,786 | |
| 4,5 | Alcon Finance Corp. | 5.375% | 12/6/32 | 8,550 | 8,613 | |
| 5 | Alcon Finance Corp. | 3.800% | 9/23/49 | 22,830 | 17,288 | |
| 4,5 | Alcon Finance Corp. | 5.750% | 12/6/52 | 3,290 | 3,332 | |
| Coupon | Maturity Date | Face Amount ($000) | Market Value• ($000) | |||
| AmerisourceBergen Corp. | 0.737% | 3/15/23 | 24,926 | 24,615 | ||
| 2 | Ascension Health | 2.532% | 11/15/29 | 22,515 | 19,503 | |
| 2 | Ascension Health | 4.847% | 11/15/53 | 23,970 | 22,971 | |
| AstraZeneca plc | 4.000% | 1/17/29 | 47,000 | 45,680 | ||
| AstraZeneca plc | 6.450% | 9/15/37 | 23,385 | 26,662 | ||
| Banner Health | 2.907% | 1/1/42 | 29,965 | 21,922 | ||
| Baxter International Inc. | 2.272% | 12/1/28 | 27,495 | 23,761 | ||
| Baxter International Inc. | 1.730% | 4/1/31 | 18,239 | 14,063 | ||
| 5 | Bayer US Finance II LLC | 4.250% | 12/15/25 | 46,665 | 45,256 | |
| 5 | Bayer US Finance LLC | 3.375% | 10/8/24 | 33,220 | 32,136 | |
| 2 | Beth Israel Lahey Health Inc. | 3.080% | 7/1/51 | 8,555 | 5,472 | |
| 2 | Bon Secours Mercy Health Inc. | 4.302% | 7/1/28 | 20,339 | 19,666 | |
| 2 | Bon Secours Mercy Health Inc. | 3.464% | 6/1/30 | 17,085 | 15,425 | |
| 2 | Bon Secours Mercy Health Inc. | 2.095% | 6/1/31 | 11,305 | 8,958 | |
| Bristol-Myers Squibb Co. | 2.750% | 2/15/23 | 4,553 | 4,535 | ||
| Bristol-Myers Squibb Co. | 3.400% | 7/26/29 | 9,588 | 8,982 | ||
| Bristol-Myers Squibb Co. | 2.950% | 3/15/32 | 3,970 | 3,521 | ||
| Bristol-Myers Squibb Co. | 4.125% | 6/15/39 | 17,720 | 16,134 | ||
| Bristol-Myers Squibb Co. | 3.550% | 3/15/42 | 41,245 | 34,391 | ||
| Bristol-Myers Squibb Co. | 4.550% | 2/20/48 | 5,703 | 5,284 | ||
| Bristol-Myers Squibb Co. | 4.250% | 10/26/49 | 20,963 | 18,662 | ||
| Bristol-Myers Squibb Co. | 3.700% | 3/15/52 | 17,175 | 13,974 | ||
| 2 | Cedars-Sinai Health System | 2.288% | 8/15/31 | 43,795 | 35,577 | |
| 2 | Children's Hospital Corp. | 2.585% | 2/1/50 | 5,460 | 3,392 | |
| 2 | Cigna Corp. | 3.250% | 4/15/25 | 31,655 | 30,626 | |
| Cigna Corp. | 4.375% | 10/15/28 | 18,600 | 18,135 | ||
| CommonSpirit Health | 4.200% | 8/1/23 | 9,885 | 9,824 | ||
| CommonSpirit Health | 2.760% | 10/1/24 | 29,395 | 28,137 | ||
| CommonSpirit Health | 3.347% | 10/1/29 | 36,655 | 32,076 | ||
| CommonSpirit Health | 2.782% | 10/1/30 | 21,827 | 17,587 | ||
| 2 | CommonSpirit Health | 4.350% | 11/1/42 | 28,315 | 23,683 | |
| CommonSpirit Health | 4.187% | 10/1/49 | 51,788 | 39,875 | ||
| CommonSpirit Health | 3.910% | 10/1/50 | 4,370 | 3,200 | ||
| 2 | Cottage Health Obligated Group | 3.304% | 11/1/49 | 9,875 | 7,090 | |
| 5 | CSL Finance plc | 4.250% | 4/27/32 | 31,340 | 29,814 | |
| 5 | CSL Finance plc | 4.750% | 4/27/52 | 3,605 | 3,283 | |
| CVS Health Corp. | 4.300% | 3/25/28 | 953 | 926 | ||
| CVS Health Corp. | 1.750% | 8/21/30 | 4,940 | 3,940 | ||
| CVS Health Corp. | 4.875% | 7/20/35 | 6,900 | 6,619 | ||
| CVS Health Corp. | 4.125% | 4/1/40 | 11,570 | 9,753 | ||
| Dignity Health | 3.812% | 11/1/24 | 20,780 | 20,267 | ||
| Elevance Health Inc. | 3.300% | 1/15/23 | 42,468 | 42,385 | ||
| Elevance Health Inc. | 3.650% | 12/1/27 | 26,975 | 25,668 | ||
| Elevance Health Inc. | 4.101% | 3/1/28 | 15,910 | 15,390 | ||
| Elevance Health Inc. | 2.550% | 3/15/31 | 35,565 | 30,044 | ||
| Elevance Health Inc. | 5.500% | 10/15/32 | 17,525 | 18,104 | ||
| Elevance Health Inc. | 4.650% | 8/15/44 | 2,876 | 2,613 | ||
| Elevance Health Inc. | 6.100% | 10/15/52 | 4,640 | 5,056 | ||
| Gilead Sciences Inc. | 3.700% | 4/1/24 | 26,895 | 26,474 | ||
| Gilead Sciences Inc. | 3.500% | 2/1/25 | 22,335 | 21,812 | ||
| Gilead Sciences Inc. | 2.600% | 10/1/40 | 20,000 | 14,329 | ||
| Gilead Sciences Inc. | 4.500% | 2/1/45 | 13,465 | 12,185 | ||
| Gilead Sciences Inc. | 4.150% | 3/1/47 | 14,930 | 12,625 | ||
| Gilead Sciences Inc. | 2.800% | 10/1/50 | 48,610 | 32,141 | ||
| GlaxoSmithKline Capital Inc. | 5.375% | 4/15/34 | 45,000 | 47,052 | ||
| 5 | HCA Inc. | 3.625% | 3/15/32 | 10,560 | 9,042 | |
| 2 | Indiana University Health Inc. Obligated Group | 2.852% | 11/1/51 | 12,370 | 8,055 | |
| Coupon | Maturity Date | Face Amount ($000) | Market Value• ($000) | |||
| Inova Health System Foundation | 4.068% | 5/15/52 | 20,740 | 17,402 | ||
| Kaiser Foundation Hospitals | 3.150% | 5/1/27 | 14,823 | 13,975 | ||
| 2 | Kaiser Foundation Hospitals | 2.810% | 6/1/41 | 37,455 | 27,521 | |
| Kaiser Foundation Hospitals | 4.875% | 4/1/42 | 14,250 | 13,714 | ||
| 2 | Kaiser Foundation Hospitals | 3.002% | 6/1/51 | 36,720 | 25,417 | |
| 2 | Mass General Brigham Inc. | 3.192% | 7/1/49 | 12,361 | 8,790 | |
| 2 | Mass General Brigham Inc. | 3.342% | 7/1/60 | 32,045 | 21,465 | |
| 2 | Memorial Sloan-Kettering Cancer Center | 2.955% | 1/1/50 | 18,985 | 12,732 | |
| Memorial Sloan-Kettering Cancer Center | 4.125% | 7/1/52 | 12,320 | 10,383 | ||
| 2 | Memorial Sloan-Kettering Cancer Center | 4.200% | 7/1/55 | 5,910 | 4,914 | |
| Merck & Co. Inc. | 3.400% | 3/7/29 | 49,240 | 46,404 | ||
| Merck & Co. Inc. | 4.150% | 5/18/43 | 22,090 | 20,122 | ||
| Merck & Co. Inc. | 4.000% | 3/7/49 | 52,385 | 46,290 | ||
| Novartis Capital Corp. | 3.400% | 5/6/24 | 16,695 | 16,436 | ||
| Novartis Capital Corp. | 4.400% | 5/6/44 | 25,896 | 24,637 | ||
| OhioHealth Corp. | 2.297% | 11/15/31 | 26,665 | 21,560 | ||
| OhioHealth Corp. | 2.834% | 11/15/41 | 16,515 | 11,930 | ||
| Pfizer Inc. | 3.450% | 3/15/29 | 70,335 | 66,691 | ||
| Pfizer Inc. | 1.700% | 5/28/30 | 6,065 | 5,041 | ||
| Pfizer Inc. | 4.100% | 9/15/38 | 53,995 | 50,062 | ||
| Pfizer Inc. | 2.550% | 5/28/40 | 7,535 | 5,619 | ||
| 2 | Piedmont Healthcare Inc. | 2.044% | 1/1/32 | 8,825 | 6,926 | |
| 2 | Piedmont Healthcare Inc. | 2.719% | 1/1/42 | 8,830 | 6,092 | |
| Piedmont Healthcare Inc. | 2.864% | 1/1/52 | 11,725 | 7,430 | ||
| 2 | Providence St. Joseph Health Obligated Group | 2.532% | 10/1/29 | 17,470 | 14,767 | |
| 2 | Providence St. Joseph Health Obligated Group | 3.930% | 10/1/48 | 11,805 | 9,245 | |
| 2 | Providence St. Joseph Health Obligated Group | 2.700% | 10/1/51 | 39,905 | 23,841 | |
| 5 | Roche Holdings Inc. | 2.607% | 12/13/51 | 8,330 | 5,591 | |
| Royalty Pharma plc | 3.550% | 9/2/50 | 9,555 | 6,394 | ||
| 2 | Rush Obligated Group | 3.922% | 11/15/29 | 11,880 | 10,852 | |
| 2 | SSM Health Care Corp. | 3.823% | 6/1/27 | 34,910 | 33,184 | |
| 2 | Sutter Health | 2.294% | 8/15/30 | 18,345 | 15,128 | |
| Takeda Pharmaceutical Co. Ltd. | 2.050% | 3/31/30 | 30,355 | 25,044 | ||
| Takeda Pharmaceutical Co. Ltd. | 3.025% | 7/9/40 | 18,255 | 13,727 | ||
| Thermo Fisher Scientific Inc. | 1.750% | 10/15/28 | 8,965 | 7,675 | ||
| Thermo Fisher Scientific Inc. | 2.000% | 10/15/31 | 19,335 | 15,890 | ||
| Thermo Fisher Scientific Inc. | 4.950% | 11/21/32 | 24,125 | 24,724 | ||
| Toledo Hospital | 5.750% | 11/15/38 | 18,440 | 17,301 | ||
| UnitedHealth Group Inc. | 3.100% | 3/15/26 | 15,350 | 14,701 | ||
| UnitedHealth Group Inc. | 3.850% | 6/15/28 | 34,565 | 33,368 | ||
| UnitedHealth Group Inc. | 2.000% | 5/15/30 | 7,515 | 6,273 | ||
| UnitedHealth Group Inc. | 2.300% | 5/15/31 | 14,960 | 12,527 | ||
| UnitedHealth Group Inc. | 4.200% | 5/15/32 | 23,545 | 22,721 | ||
| UnitedHealth Group Inc. | 4.625% | 7/15/35 | 9,595 | 9,404 | ||
| UnitedHealth Group Inc. | 3.500% | 8/15/39 | 7,480 | 6,207 | ||
| UnitedHealth Group Inc. | 2.750% | 5/15/40 | 8,505 | 6,331 | ||
| UnitedHealth Group Inc. | 4.250% | 3/15/43 | 67,400 | 60,670 | ||
| UnitedHealth Group Inc. | 4.750% | 7/15/45 | 24,520 | 23,376 | ||
| UnitedHealth Group Inc. | 4.200% | 1/15/47 | 8,620 | 7,512 | ||
| UnitedHealth Group Inc. | 3.750% | 10/15/47 | 4,985 | 4,064 | ||
| UnitedHealth Group Inc. | 4.250% | 6/15/48 | 22,215 | 19,502 | ||
| UnitedHealth Group Inc. | 4.450% | 12/15/48 | 4,970 | 4,500 | ||
| UnitedHealth Group Inc. | 3.700% | 8/15/49 | 23,160 | 18,604 | ||
| UnitedHealth Group Inc. | 2.900% | 5/15/50 | 55,870 | 38,774 | ||
| UnitedHealth Group Inc. | 3.250% | 5/15/51 | 40,050 | 29,548 | ||
| UnitedHealth Group Inc. | 4.750% | 5/15/52 | 7,175 | 6,785 | ||
| Coupon | Maturity Date | Face Amount ($000) | Market Value• ($000) | |||
| UnitedHealth Group Inc. | 5.875% | 2/15/53 | 27,965 | 30,895 | ||
| UnitedHealth Group Inc. | 3.875% | 8/15/59 | 19,125 | 15,359 | ||
| UnitedHealth Group Inc. | 3.125% | 5/15/60 | 33,830 | 23,559 | ||
| Wyeth LLC | 5.950% | 4/1/37 | 25,000 | 27,420 | ||
| Zeneca Wilmington Inc. | 7.000% | 11/15/23 | 29,000 | 29,499 | ||
| 2,364,204 | ||||||
| Industrials (1.0%) | ||||||
| 5 | Ashtead Capital Inc. | 2.450% | 8/12/31 | 17,915 | 13,916 | |
| 5 | BAE Systems Holdings Inc. | 3.850% | 12/15/25 | 11,010 | 10,617 | |
| 5 | BAE Systems plc | 3.400% | 4/15/30 | 7,335 | 6,554 | |
| Boeing Co. | 1.433% | 2/4/24 | 15,490 | 14,779 | ||
| Boeing Co. | 2.700% | 2/1/27 | 17,155 | 15,516 | ||
| Boeing Co. | 3.625% | 2/1/31 | 24,800 | 21,871 | ||
| Boeing Co. | 8.625% | 11/15/31 | 9,460 | 10,957 | ||
| Burlington Northern Santa Fe LLC | 3.000% | 3/15/23 | 21,397 | 21,275 | ||
| Burlington Northern Santa Fe LLC | 3.850% | 9/1/23 | 20,891 | 20,776 | ||
| Burlington Northern Santa Fe LLC | 4.550% | 9/1/44 | 6,000 | 5,582 | ||
| Burlington Northern Santa Fe LLC | 4.150% | 4/1/45 | 13,365 | 11,701 | ||
| Burlington Northern Santa Fe LLC | 4.050% | 6/15/48 | 2,715 | 2,334 | ||
| Burlington Northern Santa Fe LLC | 3.050% | 2/15/51 | 9,950 | 7,118 | ||
| Burlington Northern Santa Fe LLC | 3.300% | 9/15/51 | 20,000 | 15,029 | ||
| Burlington Northern Santa Fe LLC | 2.875% | 6/15/52 | 17,935 | 12,505 | ||
| Burlington Northern Santa Fe LLC | 4.450% | 1/15/53 | 6,765 | 6,193 | ||
| Canadian National Railway Co. | 2.450% | 5/1/50 | 6,870 | 4,410 | ||
| Canadian Pacific Railway Co. | 2.450% | 12/2/31 | 8,735 | 7,294 | ||
| Canadian Pacific Railway Co. | 3.100% | 12/2/51 | 31,340 | 22,024 | ||
| Carrier Global Corp. | 2.722% | 2/15/30 | 15,418 | 13,160 | ||
| Caterpillar Inc. | 3.400% | 5/15/24 | 14,200 | 13,974 | ||
| CSX Corp. | 3.350% | 9/15/49 | 5,535 | 4,092 | ||
| 5 | Daimler Trucks Finance North America LLC | 3.650% | 4/7/27 | 17,489 | 16,263 | |
| Deere & Co. | 7.125% | 3/3/31 | 17,500 | 20,454 | ||
| Eaton Corp. | 4.150% | 3/15/33 | 25,860 | 24,414 | ||
| Eaton Corp. | 4.700% | 8/23/52 | 5,205 | 4,853 | ||
| 5 | ERAC USA Finance LLC | 5.625% | 3/15/42 | 21,787 | 20,735 | |
| Honeywell International Inc. | 5.000% | 2/15/33 | 81,464 | 83,968 | ||
| Illinois Tool Works Inc. | 3.500% | 3/1/24 | 52,955 | 52,311 | ||
| 2 | John Deere Capital Corp. | 3.450% | 3/13/25 | 43,145 | 42,183 | |
| 2 | Kansas City Southern | 4.950% | 8/15/45 | 16,985 | 15,549 | |
| Lockheed Martin Corp. | 1.850% | 6/15/30 | 1,700 | 1,406 | ||
| Lockheed Martin Corp. | 5.250% | 1/15/33 | 42,925 | 44,743 | ||
| Lockheed Martin Corp. | 4.500% | 5/15/36 | 8,015 | 7,727 | ||
| Lockheed Martin Corp. | 4.700% | 5/15/46 | 14,370 | 13,723 | ||
| Lockheed Martin Corp. | 4.090% | 9/15/52 | 5,500 | 4,750 | ||
| Lockheed Martin Corp. | 5.700% | 11/15/54 | 41,810 | 45,438 | ||
| Raytheon Technologies Corp. | 4.125% | 11/16/28 | 16,675 | 16,155 | ||
| Raytheon Technologies Corp. | 4.450% | 11/16/38 | 9,325 | 8,590 | ||
| 5 | Siemens Financieringsmaatschappij NV | 3.125% | 3/16/24 | 61,400 | 60,061 | |
| 5 | Siemens Financieringsmaatschappij NV | 1.700% | 3/11/28 | 20,360 | 17,494 | |
| 5 | Siemens Financieringsmaatschappij NV | 2.150% | 3/11/31 | 35,655 | 29,388 | |
| 5 | Siemens Financieringsmaatschappij NV | 4.400% | 5/27/45 | 34,365 | 31,239 | |
| Teledyne Technologies Inc. | 2.250% | 4/1/28 | 37,435 | 32,383 | ||
| Teledyne Technologies Inc. | 2.750% | 4/1/31 | 41,220 | 34,000 | ||
| Union Pacific Corp. | 3.700% | 3/1/29 | 17,470 | 16,689 | ||
| Union Pacific Corp. | 2.800% | 2/14/32 | 4,025 | 3,512 | ||
| Union Pacific Corp. | 3.375% | 2/14/42 | 18,180 | 14,800 | ||
| Union Pacific Corp. | 3.250% | 2/5/50 | 5,565 | 4,152 | ||
| Union Pacific Corp. | 3.799% | 10/1/51 | 38,061 | 31,364 | ||
| Union Pacific Corp. | 3.500% | 2/14/53 | 65,235 | 50,737 | ||
| Coupon | Maturity Date | Face Amount ($000) | Market Value• ($000) | |||
| Union Pacific Corp. | 3.839% | 3/20/60 | 29,365 | 23,264 | ||
| Union Pacific Corp. | 2.973% | 9/16/62 | 22,015 | 14,604 | ||
| Union Pacific Corp. | 3.750% | 2/5/70 | 13,510 | 10,091 | ||
| 2 | United Airlines Pass-Through Trust Class B Series 2018-1 | 4.600% | 3/1/26 | 4,923 | 4,434 | |
| 1,063,151 | ||||||
| Real Estate (0.4%) | ||||||
| American Tower Corp. | 5.000% | 2/15/24 | 2,770 | 2,767 | ||
| American Tower Corp. | 4.400% | 2/15/26 | 7,315 | 7,147 | ||
| American Tower Corp. | 3.800% | 8/15/29 | 33,804 | 30,946 | ||
| Boston Properties LP | 3.125% | 9/1/23 | 13,275 | 13,046 | ||
| Boston Properties LP | 3.800% | 2/1/24 | 1,750 | 1,716 | ||
| Crown Castle Inc. | 3.650% | 9/1/27 | 10,215 | 9,550 | ||
| Crown Castle Inc. | 3.800% | 2/15/28 | 8,435 | 7,882 | ||
| Crown Castle Inc. | 2.100% | 4/1/31 | 45,000 | 35,720 | ||
| CubeSmart LP | 2.250% | 12/15/28 | 12,135 | 10,046 | ||
| Healthpeak Properties Inc. | 2.125% | 12/1/28 | 30,395 | 25,737 | ||
| Healthpeak Properties Inc. | 3.000% | 1/15/30 | 31,475 | 27,161 | ||
| Realty Income Corp. | 3.400% | 1/15/28 | 5,900 | 5,459 | ||
| Realty Income Corp. | 2.200% | 6/15/28 | 24,400 | 21,003 | ||
| Realty Income Corp. | 3.250% | 1/15/31 | 12,940 | 11,328 | ||
| Realty Income Corp. | 2.850% | 12/15/32 | 16,610 | 13,732 | ||
| 5 | SBA Tower Trust | 3.448% | 3/15/23 | 23,770 | 23,656 | |
| 5 | SBA Tower Trust | 2.836% | 1/15/25 | 25,075 | 23,330 | |
| 5 | SBA Tower Trust | 1.884% | 1/15/26 | 8,960 | 7,850 | |
| 5 | SBA Tower Trust | 1.631% | 11/15/26 | 34,975 | 29,868 | |
| 5 | SBA Tower Trust | 1.840% | 4/15/27 | 54,190 | 45,409 | |
| 5 | SBA Tower Trust | 2.593% | 10/15/31 | 51,750 | 40,764 | |
| 5 | Scentre Group Trust 1 | 4.375% | 5/28/30 | 19,110 | 17,122 | |
| Simon Property Group LP | 3.750% | 2/1/24 | 3,265 | 3,217 | ||
| Simon Property Group LP | 3.375% | 10/1/24 | 10,055 | 9,779 | ||
| Simon Property Group LP | 2.450% | 9/13/29 | 19,865 | 16,696 | ||
| 440,931 | ||||||
| Technology (1.7%) | ||||||
| Apple Inc. | 3.000% | 2/9/24 | 22,535 | 22,138 | ||
| Apple Inc. | 3.450% | 5/6/24 | 39,950 | 39,349 | ||
| Apple Inc. | 2.850% | 5/11/24 | 44,990 | 43,941 | ||
| Apple Inc. | 3.250% | 2/23/26 | 37,631 | 36,432 | ||
| Apple Inc. | 2.450% | 8/4/26 | 43,466 | 40,749 | ||
| Apple Inc. | 3.350% | 2/9/27 | 55,925 | 54,120 | ||
| Apple Inc. | 3.200% | 5/11/27 | 39,185 | 37,634 | ||
| Apple Inc. | 2.900% | 9/12/27 | 55,355 | 52,360 | ||
| Apple Inc. | 3.850% | 5/4/43 | 17,000 | 15,184 | ||
| Apple Inc. | 4.450% | 5/6/44 | 5,075 | 4,968 | ||
| Apple Inc. | 3.850% | 8/4/46 | 36,890 | 32,172 | ||
| Apple Inc. | 2.650% | 5/11/50 | 17,660 | 12,201 | ||
| Apple Inc. | 2.550% | 8/20/60 | 48,290 | 31,222 | ||
| Broadcom Corp. | 3.875% | 1/15/27 | 11,385 | 10,787 | ||
| Broadcom Inc. | 4.110% | 9/15/28 | 37,859 | 35,422 | ||
| Broadcom Inc. | 4.150% | 11/15/30 | 24,480 | 22,016 | ||
| 5 | Broadcom Inc. | 2.600% | 2/15/33 | 24,680 | 18,640 | |
| Cisco Systems Inc. | 2.500% | 9/20/26 | 15,676 | 14,858 | ||
| Intel Corp. | 2.875% | 5/11/24 | 29,395 | 28,702 | ||
| Intel Corp. | 2.000% | 8/12/31 | 3,635 | 2,927 | ||
| Intel Corp. | 4.150% | 8/5/32 | 14,568 | 13,766 | ||
| Intel Corp. | 4.100% | 5/19/46 | 51,605 | 42,914 | ||
| Intel Corp. | 4.100% | 5/11/47 | 21,904 | 18,076 | ||
| Intel Corp. | 3.734% | 12/8/47 | 8,096 | 6,256 | ||
| Coupon | Maturity Date | Face Amount ($000) | Market Value• ($000) | |||
| Intel Corp. | 3.250% | 11/15/49 | 19,400 | 13,622 | ||
| Intel Corp. | 4.750% | 3/25/50 | 15,688 | 14,116 | ||
| Intel Corp. | 3.050% | 8/12/51 | 43,925 | 29,604 | ||
| Intel Corp. | 4.900% | 8/5/52 | 114,375 | 104,177 | ||
| International Business Machines Corp. | 3.625% | 2/12/24 | 35,000 | 34,515 | ||
| International Business Machines Corp. | 3.000% | 5/15/24 | 86,100 | 83,964 | ||
| International Business Machines Corp. | 3.300% | 5/15/26 | 155,985 | 148,948 | ||
| International Business Machines Corp. | 3.500% | 5/15/29 | 103,700 | 96,574 | ||
| International Business Machines Corp. | 5.875% | 11/29/32 | 20,240 | 21,863 | ||
| Microsoft Corp. | 3.125% | 11/3/25 | 17,700 | 17,227 | ||
| Microsoft Corp. | 3.500% | 2/12/35 | 23,520 | 21,884 | ||
| Microsoft Corp. | 3.450% | 8/8/36 | 31,097 | 28,445 | ||
| Microsoft Corp. | 2.525% | 6/1/50 | 122,844 | 84,788 | ||
| Microsoft Corp. | 2.921% | 3/17/52 | 123,829 | 91,933 | ||
| Oracle Corp. | 2.950% | 11/15/24 | 79,830 | 76,824 | ||
| Oracle Corp. | 1.650% | 3/25/26 | 17,300 | 15,529 | ||
| Oracle Corp. | 3.250% | 11/15/27 | 57,075 | 52,589 | ||
| QUALCOMM Inc. | 1.300% | 5/20/28 | 27,474 | 23,411 | ||
| QUALCOMM Inc. | 2.150% | 5/20/30 | 29,475 | 25,125 | ||
| QUALCOMM Inc. | 1.650% | 5/20/32 | 41,155 | 32,146 | ||
| QUALCOMM Inc. | 4.250% | 5/20/32 | 8,865 | 8,629 | ||
| QUALCOMM Inc. | 4.500% | 5/20/52 | 20,340 | 18,176 | ||
| 5 | S&P Global Inc. | 2.700% | 3/1/29 | 15,055 | 13,405 | |
| 5 | S&P Global Inc. | 2.900% | 3/1/32 | 7,355 | 6,346 | |
| 5 | S&P Global Inc. | 3.700% | 3/1/52 | 46,560 | 37,457 | |
| 1,738,131 | ||||||
| Utilities (3.1%) | ||||||
| 2 | AEP Texas Inc. | 4.150% | 5/1/49 | 5,065 | 3,968 | |
| 2 | AEP Texas Inc. | 3.450% | 1/15/50 | 16,810 | 11,969 | |
| 2 | AEP Transmission Co. LLC | 4.500% | 6/15/52 | 9,195 | 8,232 | |
| Alabama Power Co. | 5.700% | 2/15/33 | 15,000 | 15,475 | ||
| Alabama Power Co. | 3.750% | 3/1/45 | 24,430 | 19,215 | ||
| 2 | Alabama Power Co. | 4.300% | 7/15/48 | 28,015 | 23,764 | |
| Ameren Illinois Co. | 3.800% | 5/15/28 | 22,215 | 21,261 | ||
| Ameren Illinois Co. | 6.125% | 12/15/28 | 54,000 | 55,062 | ||
| Ameren Illinois Co. | 3.700% | 12/1/47 | 5,045 | 4,060 | ||
| American Water Capital Corp. | 2.950% | 9/1/27 | 9,975 | 9,251 | ||
| American Water Capital Corp. | 4.450% | 6/1/32 | 22,115 | 21,353 | ||
| American Water Capital Corp. | 3.750% | 9/1/47 | 1,435 | 1,133 | ||
| American Water Capital Corp. | 4.200% | 9/1/48 | 30,403 | 25,823 | ||
| American Water Capital Corp. | 4.150% | 6/1/49 | 850 | 715 | ||
| American Water Capital Corp. | 3.450% | 5/1/50 | 2,280 | 1,698 | ||
| Arizona Public Service Co. | 3.350% | 5/15/50 | 11,220 | 7,580 | ||
| Baltimore Gas & Electric Co. | 4.250% | 9/15/48 | 5,000 | 4,277 | ||
| Baltimore Gas & Electric Co. | 2.900% | 6/15/50 | 6,549 | 4,470 | ||
| Baltimore Gas & Electric Co. | 4.550% | 6/1/52 | 2,510 | 2,274 | ||
| Berkshire Hathaway Energy Co. | 6.125% | 4/1/36 | 41,185 | 43,979 | ||
| Berkshire Hathaway Energy Co. | 5.950% | 5/15/37 | 830 | 871 | ||
| Berkshire Hathaway Energy Co. | 5.150% | 11/15/43 | 10,715 | 10,290 | ||
| Berkshire Hathaway Energy Co. | 4.250% | 10/15/50 | 15,865 | 13,496 | ||
| 5 | Berkshire Hathaway Energy Co. | 4.600% | 5/1/53 | 62,750 | 56,865 | |
| 5 | Boston Gas Co. | 3.150% | 8/1/27 | 5,385 | 4,868 | |
| 5 | Boston Gas Co. | 3.001% | 8/1/29 | 5,970 | 5,113 | |
| 5 | Boston Gas Co. | 3.757% | 3/16/32 | 4,225 | 3,742 | |
| 5 | Brooklyn Union Gas Co. | 3.407% | 3/10/26 | 2,685 | 2,524 | |
| 5 | Brooklyn Union Gas Co. | 4.273% | 3/15/48 | 61,265 | 46,409 | |
| CenterPoint Energy Resources Corp. | 4.000% | 4/1/28 | 8,068 | 7,722 | ||
| Cleco Corporate Holdings LLC | 3.375% | 9/15/29 | 9,180 | 7,784 | ||
| Coupon | Maturity Date | Face Amount ($000) | Market Value• ($000) | |||
| 2 | Cleco Securitization I LLC | 4.646% | 9/1/42 | 27,070 | 24,816 | |
| Commonwealth Edison Co. | 4.350% | 11/15/45 | 13,610 | 11,788 | ||
| Commonwealth Edison Co. | 3.650% | 6/15/46 | 6,365 | 4,936 | ||
| 2 | Commonwealth Edison Co. | 3.750% | 8/15/47 | 10,000 | 7,932 | |
| Commonwealth Edison Co. | 4.000% | 3/1/48 | 17,455 | 14,613 | ||
| 2 | Commonwealth Edison Co. | 3.850% | 3/15/52 | 6,380 | 5,172 | |
| Consolidated Edison Co. of New York Inc. | 4.500% | 12/1/45 | 36,735 | 32,017 | ||
| Consolidated Edison Co. of New York Inc. | 3.850% | 6/15/46 | 2,729 | 2,181 | ||
| 2 | Consolidated Edison Co. of New York Inc. | 4.125% | 5/15/49 | 4,105 | 3,355 | |
| 2 | Consolidated Edison Co. of New York Inc. | 3.950% | 4/1/50 | 1,690 | 1,380 | |
| Consolidated Edison Co. of New York Inc. | 3.200% | 12/1/51 | 27,865 | 19,741 | ||
| Consolidated Edison Co. of New York Inc. | 6.150% | 11/15/52 | 21,575 | 23,753 | ||
| Consolidated Edison Co. of New York Inc. | 4.625% | 12/1/54 | 72,625 | 62,887 | ||
| Consolidated Edison Co. of New York Inc. | 4.500% | 5/15/58 | 32,349 | 27,363 | ||
| Consumers Energy Co. | 4.200% | 9/1/52 | 19,310 | 16,794 | ||
| Delmarva Power & Light Co. | 3.500% | 11/15/23 | 11,816 | 11,639 | ||
| 5 | Dominion Energy Inc. | 2.450% | 1/15/23 | 111,320 | 110,705 | |
| 2 | Dominion Energy Inc. | 5.250% | 8/1/33 | 5,706 | 5,633 | |
| 2 | Dominion Energy Inc. | 4.600% | 3/15/49 | 27,385 | 23,580 | |
| Dominion Energy South Carolina Inc. | 6.625% | 2/1/32 | 4,886 | 5,429 | ||
| Dominion Energy South Carolina Inc. | 5.800% | 1/15/33 | 9,000 | 9,276 | ||
| Dominion Energy South Carolina Inc. | 5.300% | 5/15/33 | 1,438 | 1,466 | ||
| Dominion Energy South Carolina Inc. | 6.050% | 1/15/38 | 44,155 | 46,975 | ||
| Dominion Energy South Carolina Inc. | 5.450% | 2/1/41 | 2,945 | 2,930 | ||
| Dominion Energy South Carolina Inc. | 4.600% | 6/15/43 | 7,251 | 6,500 | ||
| Dominion Energy South Carolina Inc. | 5.100% | 6/1/65 | 29,850 | 28,229 | ||
| Duke Energy Carolinas LLC | 6.100% | 6/1/37 | 3,404 | 3,569 | ||
| Duke Energy Carolinas LLC | 6.050% | 4/15/38 | 4,000 | 4,238 | ||
| Duke Energy Carolinas LLC | 3.700% | 12/1/47 | 17,085 | 13,301 | ||
| Duke Energy Corp. | 2.650% | 9/1/26 | 11,775 | 10,951 | ||
| Duke Energy Corp. | 3.400% | 6/15/29 | 12,030 | 10,934 | ||
| Duke Energy Corp. | 4.500% | 8/15/32 | 24,805 | 23,550 | ||
| Duke Energy Corp. | 3.300% | 6/15/41 | 31,380 | 23,293 | ||
| Duke Energy Corp. | 4.800% | 12/15/45 | 44,700 | 39,612 | ||
| Duke Energy Corp. | 3.750% | 9/1/46 | 9,940 | 7,490 | ||
| Duke Energy Corp. | 4.200% | 6/15/49 | 25,820 | 20,696 | ||
| Duke Energy Corp. | 3.500% | 6/15/51 | 34,035 | 24,391 | ||
| Duke Energy Corp. | 5.000% | 8/15/52 | 30,610 | 27,849 | ||
| Duke Energy Florida LLC | 6.350% | 9/15/37 | 8,000 | 8,715 | ||
| Duke Energy Florida LLC | 6.400% | 6/15/38 | 27,055 | 30,117 | ||
| Duke Energy Florida LLC | 5.950% | 11/15/52 | 11,250 | 12,332 | ||
| Duke Energy Progress LLC | 3.400% | 4/1/32 | 15,845 | 14,156 | ||
| Duke Energy Progress LLC | 6.300% | 4/1/38 | 14,705 | 15,916 | ||
| Duke Energy Progress LLC | 4.100% | 3/15/43 | 615 | 522 | ||
| Duke Energy Progress LLC | 4.200% | 8/15/45 | 40,400 | 34,271 | ||
| Duke Energy Progress LLC | 2.500% | 8/15/50 | 2,475 | 1,523 | ||
| Duke Energy Progress LLC | 2.900% | 8/15/51 | 2,450 | 1,638 | ||
| Duke Energy Progress LLC | 4.000% | 4/1/52 | 4,185 | 3,436 | ||
| 2 | Duke Energy Progress NC Storm Funding LLC | 2.387% | 7/1/37 | 34,870 | 28,223 | |
| 5 | East Ohio Gas Co. | 2.000% | 6/15/30 | 8,960 | 7,123 | |
| 5 | East Ohio Gas Co. | 3.000% | 6/15/50 | 13,050 | 8,563 | |
| Eastern Energy Gas Holdings LLC | 3.550% | 11/1/23 | 21,445 | 21,179 | ||
| Emera US Finance LP | 3.550% | 6/15/26 | 25,624 | 24,082 | ||
| 5 | Enel Finance International NV | 5.000% | 6/15/32 | 28,910 | 26,222 | |
| Entergy Louisiana LLC | 3.120% | 9/1/27 | 14,935 | 13,877 | ||
| Evergy Inc. | 2.450% | 9/15/24 | 10,420 | 9,897 | ||
| Evergy Kansas Central Inc. | 3.250% | 9/1/49 | 9,000 | 6,354 | ||
| Coupon | Maturity Date | Face Amount ($000) | Market Value• ($000) | |||
| 2 | Evergy Metro Inc. | 2.250% | 6/1/30 | 5,680 | 4,726 | |
| Evergy Metro Inc. | 4.200% | 3/15/48 | 3,419 | 2,791 | ||
| 2 | Eversource Energy | 2.900% | 10/1/24 | 17,450 | 16,781 | |
| 2 | Eversource Energy | 3.150% | 1/15/25 | 5,025 | 4,830 | |
| 2 | Eversource Energy | 3.300% | 1/15/28 | 14,410 | 13,297 | |
| Eversource Energy | 3.375% | 3/1/32 | 5,495 | 4,830 | ||
| 5 | Exelon Corp. | 3.350% | 3/15/32 | 18,315 | 16,082 | |
| Florida Power & Light Co. | 5.650% | 2/1/35 | 50,000 | 51,867 | ||
| Florida Power & Light Co. | 4.950% | 6/1/35 | 10,000 | 9,888 | ||
| Florida Power & Light Co. | 5.650% | 2/1/37 | 5,000 | 5,143 | ||
| Florida Power & Light Co. | 5.950% | 2/1/38 | 39,215 | 41,877 | ||
| Florida Power & Light Co. | 5.690% | 3/1/40 | 4,000 | 4,189 | ||
| Florida Power & Light Co. | 3.700% | 12/1/47 | 17,370 | 14,129 | ||
| Fortis Inc. | 3.055% | 10/4/26 | 28,565 | 26,632 | ||
| Georgia Power Co. | 4.700% | 5/15/32 | 21,575 | 21,002 | ||
| Georgia Power Co. | 5.400% | 6/1/40 | 6,665 | 6,218 | ||
| 2 | Georgia Power Co. | 4.750% | 9/1/40 | 34,703 | 32,033 | |
| Georgia Power Co. | 4.300% | 3/15/42 | 9,934 | 8,651 | ||
| Georgia Power Co. | 5.125% | 5/15/52 | 24,430 | 23,616 | ||
| Indiana Michigan Power Co. | 4.250% | 8/15/48 | 14,980 | 12,347 | ||
| 5 | ITC Holdings Corp. | 4.950% | 9/22/27 | 2,425 | 2,409 | |
| 5 | KeySpan Gas East Corp. | 2.742% | 8/15/26 | 25,345 | 22,795 | |
| 5 | Massachusetts Electric Co. | 5.900% | 11/15/39 | 21,565 | 21,360 | |
| 5 | Metropolitan Edison Co. | 4.300% | 1/15/29 | 6,572 | 6,201 | |
| MidAmerican Energy Co. | 4.400% | 10/15/44 | 1,050 | 931 | ||
| MidAmerican Energy Co. | 4.250% | 5/1/46 | 5,485 | 4,669 | ||
| MidAmerican Energy Co. | 4.250% | 7/15/49 | 11,545 | 10,028 | ||
| MidAmerican Energy Co. | 3.150% | 4/15/50 | 45,450 | 32,755 | ||
| 5 | Mid-Atlantic Interstate Transmission LLC | 4.100% | 5/15/28 | 3,170 | 3,001 | |
| 5 | Monongahela Power Co. | 5.400% | 12/15/43 | 4,570 | 4,428 | |
| National Rural Utilities Cooperative Finance Corp. | 2.950% | 2/7/24 | 15,255 | 14,902 | ||
| National Rural Utilities Cooperative Finance Corp. | 2.850% | 1/27/25 | 40,345 | 38,853 | ||
| 2 | Nevada Power Co. | 3.125% | 8/1/50 | 17,790 | 12,083 | |
| NextEra Energy Capital Holdings Inc. | 3.550% | 5/1/27 | 32,275 | 30,611 | ||
| NextEra Energy Capital Holdings Inc. | 1.900% | 6/15/28 | 27,465 | 23,562 | ||
| NextEra Energy Capital Holdings Inc. | 3.500% | 4/1/29 | 14,165 | 13,005 | ||
| NextEra Energy Capital Holdings Inc. | 2.250% | 6/1/30 | 48,660 | 40,407 | ||
| NextEra Energy Capital Holdings Inc. | 5.000% | 7/15/32 | 6,130 | 6,125 | ||
| 5 | Niagara Mohawk Power Corp. | 4.278% | 12/15/28 | 35,970 | 33,528 | |
| 5 | Niagara Mohawk Power Corp. | 3.025% | 6/27/50 | 14,840 | 9,275 | |
| NiSource Inc. | 5.250% | 2/15/43 | 14,588 | 13,909 | ||
| NiSource Inc. | 4.800% | 2/15/44 | 12,750 | 11,391 | ||
| NiSource Inc. | 5.000% | 6/15/52 | 19,985 | 18,441 | ||
| Northern States Power Co. | 2.250% | 4/1/31 | 4,940 | 4,153 | ||
| Northern States Power Co. | 6.250% | 6/1/36 | 50,000 | 54,807 | ||
| Northern States Power Co. | 4.500% | 6/1/52 | 4,320 | 3,978 | ||
| 5 | Oglethorpe Power Corp. | 6.191% | 1/1/31 | 36,565 | 37,254 | |
| Oglethorpe Power Corp. | 5.950% | 11/1/39 | 6,075 | 5,854 | ||
| Oglethorpe Power Corp. | 4.550% | 6/1/44 | 1,825 | 1,402 | ||
| Oglethorpe Power Corp. | 4.250% | 4/1/46 | 19,060 | 14,287 | ||
| 5 | Oglethorpe Power Corp. | 4.500% | 4/1/47 | 4,095 | 3,305 | |
| Oglethorpe Power Corp. | 5.050% | 10/1/48 | 4,690 | 4,089 | ||
| Oglethorpe Power Corp. | 5.250% | 9/1/50 | 17,220 | 14,999 | ||
| 5 | Oncor Electric Delivery Co. LLC | 4.150% | 6/1/32 | 4,425 | 4,243 | |
| 5 | Oncor Electric Delivery Co. LLC | 4.550% | 9/15/32 | 27,810 | 27,505 | |
| Oncor Electric Delivery Co. LLC | 4.550% | 12/1/41 | 10,735 | 9,959 | ||
| Oncor Electric Delivery Co. LLC | 2.700% | 11/15/51 | 23,120 | 15,222 | ||
| Coupon | Maturity Date | Face Amount ($000) | Market Value• ($000) | |||
| 5 | Oncor Electric Delivery Co. LLC | 4.600% | 6/1/52 | 26,115 | 24,485 | |
| 5 | Oncor Electric Delivery Co. LLC | 4.950% | 9/15/52 | 14,880 | 14,698 | |
| PacifiCorp | 2.950% | 6/1/23 | 29,675 | 29,348 | ||
| PacifiCorp | 2.700% | 9/15/30 | 5,025 | 4,315 | ||
| PacifiCorp | 5.900% | 8/15/34 | 12,500 | 12,632 | ||
| PacifiCorp | 6.250% | 10/15/37 | 36,635 | 39,124 | ||
| PacifiCorp | 4.125% | 1/15/49 | 3,611 | 3,003 | ||
| PacifiCorp | 4.150% | 2/15/50 | 11,625 | 9,753 | ||
| PacifiCorp | 3.300% | 3/15/51 | 11,806 | 8,581 | ||
| PECO Energy Co. | 2.850% | 9/15/51 | 8,000 | 5,391 | ||
| PECO Energy Co. | 4.600% | 5/15/52 | 12,845 | 11,865 | ||
| 2 | PG&E Energy Recovery Funding LLC | 2.280% | 1/15/36 | 3,775 | 2,878 | |
| 2 | PG&E Energy Recovery Funding LLC | 2.822% | 7/15/46 | 16,989 | 12,032 | |
| 2 | PG&E Wildfire Recovery Funding LLC | 5.212% | 12/1/47 | 25,815 | 25,109 | |
| 2 | PG&E Wildfire Recovery Funding LLC | 5.099% | 6/1/52 | 23,500 | 22,725 | |
| Piedmont Natural Gas Co. Inc. | 5.050% | 5/15/52 | 9,130 | 8,351 | ||
| Potomac Electric Power Co. | 6.500% | 11/15/37 | 25,000 | 27,647 | ||
| San Diego Gas & Electric Co. | 6.000% | 6/1/26 | 3,600 | 3,778 | ||
| 2 | San Diego Gas & Electric Co. | 1.700% | 10/1/30 | 4,940 | 3,958 | |
| 2 | San Diego Gas & Electric Co. | 3.750% | 6/1/47 | 5,390 | 4,241 | |
| San Diego Gas & Electric Co. | 4.150% | 5/15/48 | 5,940 | 5,032 | ||
| 2 | San Diego Gas & Electric Co. | 2.950% | 8/15/51 | 714 | 497 | |
| San Diego Gas & Electric Co. | 3.700% | 3/15/52 | 29,320 | 23,441 | ||
| 2 | SCE Recovery Funding LLC | 0.861% | 11/15/31 | 8,884 | 7,414 | |
| 2 | SCE Recovery Funding LLC | 1.942% | 5/15/38 | 3,655 | 2,606 | |
| 2 | SCE Recovery Funding LLC | 2.510% | 11/15/43 | 3,310 | 2,082 | |
| Sempra Energy | 3.250% | 6/15/27 | 80,765 | 75,123 | ||
| Sempra Energy | 3.700% | 4/1/29 | 2,295 | 2,101 | ||
| Sempra Energy | 6.000% | 10/15/39 | 14,800 | 15,018 | ||
| 2 | Sierra Pacific Power Co. | 3.375% | 8/15/23 | 34,040 | 33,623 | |
| Sierra Pacific Power Co. | 2.600% | 5/1/26 | 7,857 | 7,371 | ||
| 2 | Southern California Edison Co. | 3.700% | 8/1/25 | 3,315 | 3,219 | |
| Southern California Edison Co. | 5.950% | 11/1/32 | 30,370 | 32,181 | ||
| Southern California Edison Co. | 6.000% | 1/15/34 | 7,695 | 8,080 | ||
| 2 | Southern California Edison Co. | 5.550% | 1/15/37 | 50,475 | 49,490 | |
| 2 | Southern California Edison Co. | 5.950% | 2/1/38 | 40,000 | 40,832 | |
| Southern California Edison Co. | 6.050% | 3/15/39 | 1,980 | 2,021 | ||
| Southern California Edison Co. | 4.650% | 10/1/43 | 3,255 | 2,866 | ||
| Southern California Edison Co. | 4.000% | 4/1/47 | 6,530 | 5,152 | ||
| 2 | Southern California Edison Co. | 4.125% | 3/1/48 | 11,495 | 9,267 | |
| 2 | Southern California Edison Co. | 4.875% | 3/1/49 | 2,985 | 2,639 | |
| Southern California Edison Co. | 3.650% | 2/1/50 | 5,405 | 4,032 | ||
| Southern California Gas Co. | 6.350% | 11/15/52 | 17,580 | 19,806 | ||
| Southern Co. | 3.250% | 7/1/26 | 30,885 | 29,342 | ||
| Southern Co. | 4.400% | 7/1/46 | 41,137 | 34,843 | ||
| Southwest Gas Corp. | 2.200% | 6/15/30 | 6,310 | 4,907 | ||
| Southwestern Electric Power Co. | 6.200% | 3/15/40 | 9,800 | 10,049 | ||
| Southwestern Public Service Co. | 3.700% | 8/15/47 | 3,756 | 2,866 | ||
| 5 | Texas Electric Market Stabilization Funding N LLC | 4.966% | 2/1/42 | 39,235 | 37,283 | |
| 5 | Texas Electric Market Stabilization Funding N LLC | 5.057% | 8/1/46 | 18,860 | 18,058 | |
| 5 | Texas Electric Market Stabilization Funding N LLC | 5.167% | 2/1/50 | 17,640 | 17,538 | |
| Union Electric Co. | 4.000% | 4/1/48 | 14,316 | 11,668 | ||
| Union Electric Co. | 3.900% | 4/1/52 | 8,575 | 7,008 | ||
| 2 | Virginia Electric & Power Co. | 2.750% | 3/15/23 | 34,540 | 34,333 | |
| 2 | Virginia Electric & Power Co. | 3.500% | 3/15/27 | 16,025 | 15,266 | |
| 2 | Virginia Electric & Power Co. | 6.000% | 5/15/37 | 1,740 | 1,821 | |
| Coupon | Maturity Date | Face Amount ($000) | Market Value• ($000) | |||
| Wisconsin Electric Power Co. | 5.700% | 12/1/36 | 17,280 | 17,654 | ||
| Wisconsin Public Service Corp. | 6.080% | 12/1/28 | 45,000 | 47,172 | ||
| 3,248,623 | ||||||
| Total Corporate Bonds (Cost $25,127,483) | 22,318,222 | |||||
| Sovereign Bonds (0.8%) | ||||||
| 2,5 | Bermuda | 2.375% | 8/20/30 | 18,130 | 14,938 | |
| 2,5 | Bermuda | 3.375% | 8/20/50 | 6,835 | 4,637 | |
| 2,5 | Corp. Nacional del Cobre de Chile | 3.700% | 1/30/50 | 20,705 | 15,472 | |
| 2,5 | Electricite de France SA | 4.875% | 9/21/38 | 69,680 | 57,819 | |
| Equinor ASA | 2.450% | 1/17/23 | 15,017 | 14,973 | ||
| Equinor ASA | 2.650% | 1/15/24 | 14,000 | 13,680 | ||
| Equinor ASA | 3.700% | 3/1/24 | 25,320 | 25,034 | ||
| Equinor ASA | 3.250% | 11/10/24 | 25,200 | 24,633 | ||
| Equinor ASA | 2.875% | 4/6/25 | 4,775 | 4,594 | ||
| Equinor ASA | 3.125% | 4/6/30 | 80,155 | 73,107 | ||
| Equinor ASA | 2.375% | 5/22/30 | 7,585 | 6,544 | ||
| 2 | International Bank for Reconstruction & Development | 4.750% | 2/15/35 | 40,000 | 42,360 | |
| 2,5 | NBN Co. Ltd. | 1.625% | 1/8/27 | 26,265 | 22,888 | |
| 2,5 | NBN Co. Ltd. | 2.625% | 5/5/31 | 37,954 | 30,702 | |
| 2,5 | NBN Co. Ltd. | 2.500% | 1/8/32 | 77,087 | 60,573 | |
| 2,5 | Qatar Energy | 2.250% | 7/12/31 | 31,765 | 26,569 | |
| 2,5 | Qatar Energy | 3.125% | 7/12/41 | 23,200 | 17,656 | |
| 2 | Republic of Chile | 2.550% | 1/27/32 | 18,800 | 15,849 | |
| 2 | Republic of Chile | 2.550% | 7/27/33 | 36,780 | 29,559 | |
| 2 | Republic of Chile | 3.500% | 1/31/34 | 20,300 | 17,723 | |
| 2 | Republic of Chile | 3.500% | 4/15/53 | 20,175 | 14,701 | |
| 2 | Republic of Chile | 3.100% | 1/22/61 | 13,390 | 8,635 | |
| 2,5 | Saudi Arabian Oil Co. | 3.500% | 4/16/29 | 28,670 | 26,686 | |
| 2,5 | State of Qatar | 3.875% | 4/23/23 | 56,160 | 55,974 | |
| 2,5 | State of Qatar | 3.375% | 3/14/24 | 3,360 | 3,301 | |
| 2,5 | State of Qatar | 4.400% | 4/16/50 | 14,035 | 12,853 | |
| 2,5 | Temasek Financial I Ltd. | 2.375% | 1/23/23 | 45,150 | 45,026 | |
| 2,5 | Temasek Financial I Ltd. | 3.625% | 8/1/28 | 36,800 | 35,616 | |
| 2,5 | Temasek Financial I Ltd. | 2.375% | 8/2/41 | 46,170 | 33,482 | |
| 2,5 | Temasek Financial I Ltd. | 2.250% | 4/6/51 | 39,210 | 25,357 | |
| 2,5 | Temasek Financial I Ltd. | 2.500% | 10/6/70 | 22,880 | 14,006 | |
| 2,5 | UAE International Government Bond | 4.951% | 7/7/52 | 13,725 | 13,635 | |
| 2 | United Mexican States | 4.400% | 2/12/52 | 35,725 | 27,623 | |
| Total Sovereign Bonds (Cost $969,415) | 836,205 | |||||
| Taxable Municipal Bonds (1.5%) | ||||||
| Alabama Federal Aid Highway Finance Authority SO Revenue | 2.650% | 9/1/37 | 4,935 | 3,658 | ||
| Bay Area Toll Authority California Toll Bridge Revenue (San Francisco Bay Area) | 2.574% | 4/1/31 | 14,455 | 12,642 | ||
| Bay Area Toll Authority California Toll Bridge Revenue (San Francisco Bay Area) | 6.263% | 4/1/49 | 1,965 | 2,252 | ||
| Bay Area Toll Authority California Toll Bridge Revenue (San Francisco Bay Area) | 7.043% | 4/1/50 | 26,165 | 32,898 | ||
| Broward County FL Airport System Revenue | 3.477% | 10/1/43 | 10,370 | 7,883 | ||
| California GO | 7.350% | 11/1/39 | 56,970 | 70,597 | ||
| California Health Facilities Financing Authority Revenue | 4.190% | 6/1/37 | 6,410 | 5,595 | ||
| California State University Systemwide Revenue | 2.719% | 11/1/52 | 12,090 | 8,133 | ||
| Coupon | Maturity Date | Face Amount ($000) | Market Value• ($000) | |||
| California State University Systemwide Revenue | 2.939% | 11/1/52 | 15,225 | 10,315 | ||
| Chicago IL O'Hare International Airport Revenue | 6.395% | 1/1/40 | 3,205 | 3,645 | ||
| Chicago IL Transit Authority Sales & Transfer Tax Receipts Revenue | 6.899% | 12/1/40 | 33,870 | 38,214 | ||
| Chicago IL Transit Authority Sales & Transfer Tax Receipts Revenue | 6.899% | 12/1/40 | 57,835 | 65,252 | ||
| Chicago IL Transit Authority Sales Tax Receipts Revenue | 6.200% | 12/1/40 | 2,260 | 2,433 | ||
| Dallas-Fort Worth TX International Airport Revenue | 3.089% | 11/1/40 | 7,405 | 5,753 | ||
| Dallas-Fort Worth TX International Airport Revenue | 2.843% | 11/1/46 | 18,860 | 13,531 | ||
| Dallas-Fort Worth TX International Airport Revenue | 4.087% | 11/1/51 | 2,695 | 2,258 | ||
| Dallas-Fort Worth TX International Airport Revenue | 4.507% | 11/1/51 | 18,580 | 16,684 | ||
| Florida State Board of Administration Finance Corp. Revenue | 1.705% | 7/1/27 | 29,555 | 25,522 | ||
| Foothill-Eastern Transportation Corridor Agency CA Toll Road Revenue | 4.094% | 1/15/49 | 5,345 | 4,143 | ||
| 7 | Foothill-Eastern Transportation Corridor Agency CA Toll Road Revenue | 3.924% | 1/15/53 | 39,440 | 29,142 | |
| Georgia Municipal Electric Power Authority Revenue | 6.637% | 4/1/57 | 69,852 | 72,947 | ||
| Golden State Tobacco Securitization Corp. California Revenue | 2.746% | 6/1/34 | 2,430 | 1,941 | ||
| Golden State Tobacco Securitization Corp. California Revenue | 3.293% | 6/1/42 | 4,645 | 3,463 | ||
| Golden State Tobacco Securitization Corp. California Revenue | 3.000% | 6/1/46 | 10,105 | 9,345 | ||
| Grand Parkway Transportation Corp. Texas System Toll Revenue | 5.184% | 10/1/42 | 5,645 | 5,752 | ||
| Grand Parkway Transportation Corp. Texas System Toll Revenue | 3.236% | 10/1/52 | 28,900 | 20,422 | ||
| Great Lakes Michigan Water Authority Sewage Disposal System Revenue | 3.056% | 7/1/39 | 8,495 | 6,450 | ||
| Houston TX GO | 6.290% | 3/1/32 | 14,840 | 15,536 | ||
| Illinois GO | 5.100% | 6/1/33 | 146,970 | 141,674 | ||
| Illinois Toll Highway Authority Revenue | 6.184% | 1/1/34 | 29,200 | 31,850 | ||
| Jobs Ohio Beverage System Statewide Liquor Profits Revenue | 2.833% | 1/1/38 | 5,480 | 4,287 | ||
| Kansas Development Finance Authority Revenue | 4.927% | 4/15/45 | 7,745 | 7,334 | ||
| 8 | Kansas Development Finance Authority Revenue | 2.774% | 5/1/51 | 15,140 | 10,286 | |
| 7 | Kansas Development Finance Authority Revenue (Employees Retirement System) | 5.501% | 5/1/34 | 50,000 | 51,122 | |
| Louisville & Jefferson County KY Metropolitan Sewer District Sewer & Drainage System Revenue | 6.250% | 5/15/43 | 19,000 | 21,478 | ||
| Maryland Transportation Authority Facilities Projects Revenue | 5.888% | 7/1/43 | 18,985 | 20,622 | ||
| Massachusetts GO | 2.514% | 7/1/41 | 8,175 | 5,795 | ||
| Massachusetts School Building Authority Dedicated Sales Tax Revenue | 1.753% | 8/15/30 | 27,675 | 22,447 | ||
| Massachusetts School Building Authority Dedicated Sales Tax Revenue | 5.715% | 8/15/39 | 22,105 | 22,796 | ||
| Massachusetts School Building Authority Dedicated Sales Tax Revenue | 3.395% | 10/15/40 | 16,520 | 13,141 | ||
| Coupon | Maturity Date | Face Amount ($000) | Market Value• ($000) | |||
| Massachusetts School Building Authority Dedicated Sales Tax Revenue | 2.950% | 5/15/43 | 21,350 | 15,194 | ||
| Massachusetts SO Revenue | 4.110% | 7/15/31 | 19,740 | 19,209 | ||
| Massachusetts Water Resources Authority Revenue | 2.823% | 8/1/41 | 24,550 | 18,301 | ||
| Michigan Finance Authority Revenue (Trinity Health Credit Group) | 3.084% | 12/1/34 | 11,320 | 9,492 | ||
| New Jersey Turnpike Authority Revenue | 7.414% | 1/1/40 | 30,285 | 38,029 | ||
| New York Metropolitan Transportation Authority Revenue (Build America Bonds) | 6.200% | 11/15/26 | 1,805 | 1,834 | ||
| New York Metropolitan Transportation Authority Revenue (Build America Bonds) | 6.814% | 11/15/40 | 27,295 | 29,532 | ||
| New York Metropolitan Transportation Authority Revenue (Climate Bond Certified) | 5.175% | 11/15/49 | 23,665 | 21,522 | ||
| New York Metropolitan Transportation Authority Revenue (Dedicated Tax Fund) | 7.336% | 11/15/39 | 10,860 | 13,369 | ||
| New York Metropolitan Transportation Authority Revenue (Dedicated Tax Fund) | 6.089% | 11/15/40 | 16,085 | 17,515 | ||
| New York State Dormitory Authority Revenue (Personal Income Tax) | 3.110% | 2/15/39 | 21,260 | 16,744 | ||
| New York State Dormitory Authority Revenue (Personal Income Tax) | 3.190% | 2/15/43 | 12,095 | 8,966 | ||
| New York State Thruway Authority General Revenue | 2.900% | 1/1/35 | 16,730 | 13,754 | ||
| New York State Thruway Authority General Revenue | 3.500% | 1/1/42 | 9,430 | 7,430 | ||
| North Texas Tollway Authority System Revenue | 3.011% | 1/1/43 | 14,315 | 10,614 | ||
| North Texas Tollway Authority System Revenue | 6.718% | 1/1/49 | 11,035 | 13,211 | ||
| Oregon Department of Transportation Highway User Tax Revenue | 5.834% | 11/15/34 | 25,930 | 27,916 | ||
| 8 | Oregon GO | 3.424% | 3/1/60 | 28,000 | 19,656 | |
| 7 | Oregon School Boards Association GO | 5.528% | 6/30/28 | 50,000 | 50,726 | |
| 9 | Philadelphia PA Authority for Industrial Development Revenue | 6.550% | 10/15/28 | 66,810 | 70,670 | |
| Port Authority of New York & New Jersey Revenue | 5.859% | 12/1/24 | 2,600 | 2,636 | ||
| Port Authority of New York & New Jersey Revenue | 4.458% | 10/1/62 | 44,055 | 39,618 | ||
| Port Authority of New York & New Jersey Revenue | 4.810% | 10/15/65 | 21,985 | 21,107 | ||
| Riverside CA Pension Obligation Bonds Revenue | 3.857% | 6/1/45 | 8,775 | 7,381 | ||
| Riverside County CA Pension Obligation Bonds Revenue | 3.818% | 2/15/38 | 9,585 | 8,287 | ||
| Rutgers State University New Jersey Revenue | 3.270% | 5/1/43 | 11,960 | 9,067 | ||
| Sales Tax Securitization Corp. Illinois Revenue | 3.238% | 1/1/42 | 34,905 | 26,981 | ||
| San Antonio TX Electric & Gas Systems Revenue | 2.905% | 2/1/48 | 5,620 | 4,174 | ||
| Texas Transportation Commission GO | 2.562% | 4/1/42 | 7,310 | 5,442 | ||
| Texas Transportation Commission State Highway Revenue | 4.000% | 10/1/33 | 12,640 | 11,445 | ||
| University of California Regents Medical Center Pooled Revenue | 4.132% | 5/15/32 | 17,265 | 16,277 | ||
| University of California Regents Medical Center Pooled Revenue | 6.548% | 5/15/48 | 9,465 | 10,967 | ||
| University of California Regents Medical Center Pooled Revenue | 6.583% | 5/15/49 | 15,150 | 17,537 | ||
| Coupon | Maturity Date | Face Amount ($000) | Market Value• ($000) | |||
| University of California Regents Medical Center Pooled Revenue | 3.006% | 5/15/50 | 15,445 | 10,482 | ||
| University of California Regents Medical Center Pooled Revenue | 4.563% | 5/15/53 | 46,830 | 42,188 | ||
| University of California Regents Medical Center Pooled Revenue | 3.256% | 5/15/60 | 26,520 | 17,914 | ||
| University of California Revenue | 1.316% | 5/15/27 | 13,075 | 11,356 | ||
| University of California Revenue | 1.614% | 5/15/30 | 16,140 | 12,818 | ||
| University of California Revenue | 4.601% | 5/15/31 | 21,975 | 21,554 | ||
| University of California Revenue | 4.765% | 5/15/44 | 5,980 | 5,720 | ||
| University of California Revenue | 3.931% | 5/15/45 | 22,370 | 20,039 | ||
| University of Michigan Revenue | 3.504% | 4/1/52 | 7,445 | 5,869 | ||
| University of Minnesota GO | 4.048% | 4/1/52 | 27,160 | 23,742 | ||
| Utility Debt Securitization Authority NY Restructuring Bonds Revenue | 3.435% | 12/15/25 | 4,447 | 4,421 | ||
| Total Taxable Municipal Bonds (Cost $1,831,148) | 1,629,944 | |||||
| Shares | ||||||
| Temporary Cash Investments (1.0%) | ||||||
| Money Market Fund (0.0%) | ||||||
| 10 | Vanguard Market Liquidity Fund | 3.877% | 1,426 | 143 | ||
| Maturity Date | Face Amount ($000) | |||||
| Repurchase Agreements (0.5%) | ||||||
| Bank of America Securities, LLC (Dated 11/30/22, Repurchase Value $2,100,000, collateralized by Ginnie Mae 2.500%–3.500%, 10/20/51–5/20/52, with a value of $2,142,000) | 3.800% | 12/1/22 | 2,100 | 2,100 | ||
| Citigroup Global Markets Inc. (Dated 11/30/22, Repurchase Value $132,714,000, collateralized by U.S. Treasury Note/Bond 1.500%–6.125%, 7/31/29–2/15/30, with a value of $135,354,000) | 3.750% | 12/1/22 | 132,700 | 132,700 | ||
| Credit Agricole Securities (USA) Inc. (Dated 11/30/22, Repurchase Value $22,802,000, collateralized by Treasury Inflation Indexed Note/Bond 0.250%–2.125%, 2/15/40–2/15/50, and U.S. Treasury Note/Bond 2.375%, 2/15/42, with a value of $23,256,000) | 3.760% | 12/1/22 | 22,800 | 22,800 | ||
| Deutsche Bank Securities, Inc. (Dated 11/30/22, Repurchase Value $91,310,000, collateralized by Fannie Mae 2.000%–4.500%, 5/1/36–8/1/52, with a value of $93,126,000) | 3.790% | 12/1/22 | 91,300 | 91,300 | ||
| HSBC Bank USA (Dated 11/30/22, Repurchase Value $147,715,000, collateralized by U.S. Treasury Note/Bond 0.125%–3.125%, 2/28/23–2/15/43, with a value of $150,654,000) | 3.770% | 12/1/22 | 147,700 | 147,700 | ||
| Coupon | Maturity Date | Face Amount ($000) | Market Value• ($000) | |||
| HSBC Bank USA (Dated 11/30/22, Repurchase Value $20,002,000, collateralized by Fannie Mae 4.500%, 9/1/52, and Freddie Mac 2.500%, 9/1/51, with a value of $20,400,000) | 3.800% | 12/1/22 | 20,000 | 20,000 | ||
| Nomura International plc (Dated 11/30/22, Repurchase Value $8,601,000, collateralized by Treasury Inflation Indexed Note/Bond 0.125%–0.750%, 10/15/25–2/15/45, and U.S. Treasury Note/Bond 0.250%, 4/15/23, with a value of $8,772,000) | 3.800% | 12/1/22 | 8,600 | 8,600 | ||
| RBC Capital Markets LLC (Dated 11/30/22, Repurchase Value $36,004,000, collateralized by Fannie Mae 3.500%–4.500%, 2/1/43–6/1/52, and U.S. Treasury Bill 0.000%, 2/21/23, with a value of $36,720,000) | 3.770% | 12/1/22 | 36,000 | 36,000 | ||
| Societe Generale (Dated 11/30/22, Repurchase Value $3,000,000, collateralized by U.S. Treasury Note/Bond 1.250%, 8/15/31, with a value of $3,060,000) | 3.760% | 12/1/22 | 3,000 | 3,000 | ||
| TD Securities (USA) LLC (Dated 11/30/22, Repurchase Value $53,206,000, collateralized by Ginnie Mae 4.000%, 6/20/52, with a value of $54,264,000) | 3.800% | 12/1/22 | 53,200 | 53,200 | ||
| Wells Fargo & Co. (Dated 11/30/22, Repurchase Value $56,106,000, collateralized by Fannie Mae 3.000%–6.000%, 7/1/30–11/1/52, with a value of $57,222,000) | 3.810% | 12/1/22 | 56,100 | 56,100 | ||
| 573,500 | ||||||
| U.S. Government and Agency Obligations (0.5%) | ||||||
| United States Treasury Bill | 3.622% | 12/20/22 | 250,000 | 249,508 | ||
| United States Treasury Bill | 0.686% | 12/29/22 | 120,000 | 119,642 | ||
| Coupon | Maturity Date | Face Amount ($000) | Market Value• ($000) | |||
| United States Treasury Bill | 2.852% | 3/23/23 | 10,000 | 9,867 | ||
| United States Treasury Bill | 4.557% | 5/18/23 | 115,000 | 112,593 | ||
| 491,610 | ||||||
| Total Temporary Cash Investments (Cost $1,065,621) | 1,065,253 | |||||
| Total Investments (100.2%) (Cost $85,889,164) | 106,756,076 | |||||
| Other Assets and Liabilities—Net (-0.2%) | (166,209) | |||||
| Net Assets (100%) | 106,589,867 | |||||
| Cost is in $000. |
| • | See Note A in Notes to Financial Statements. |
| * | Non-income-producing security. |
| 1 | Securities with a value of $9,360,000 have been segregated as initial margin for open futures contracts. |
| 2 | The average or expected maturity is shorter than the final maturity shown because of the possibility of interim principal payments and prepayments or the possibility of the issue being called. |
| 3 | The issuer was placed under federal conservatorship in September 2008; since that time, its daily operations have been managed by the Federal Housing Finance Agency and it receives capital from the U.S. Treasury, as needed to maintain a positive net worth, in exchange for senior preferred stock. |
| 4 | Includes securities purchased on a when-issued or delayed-delivery basis for which the fund has not taken delivery as of November 30, 2022. |
| 5 | Security exempt from registration under Rule 144A of the Securities Act of 1933. Such securities may be sold in transactions exempt from registration, normally to qualified institutional buyers. At November 30, 2022, the aggregate value was $6,384,434,000, representing 6.0% of net assets. |
| 6 | Variable-rate security; rate shown is effective rate at period end. Certain variable-rate securities are not based on a published reference rate and spread but are determined by the issuer or agent based on current market conditions. |
| 7 | Scheduled principal and interest payments are guaranteed by Assured Guaranty Municipal Corp. |
| 8 | Scheduled principal and interest payments are guaranteed by Build America Mutual Assurance Co. |
| 9 | Scheduled principal and interest payments are guaranteed by National Public Finance Guarantee Corp. |
| 10 | Affiliated money market fund available only to Vanguard funds and certain trusts and accounts managed by Vanguard. Rate shown is the 7-day yield. |
| 1M—1-month. | |
| 3M—3-month. | |
| ADR—American Depositary Receipt. | |
| CLO—Collateralized Loan Obligation. | |
| DAC—Designated Activity Company. | |
| GO—General Obligation Bond. | |
| LIBOR—London Interbank Offered Rate. | |
| REMICS—Real Estate Mortgage Investment Conduits. | |
| SO—Special Obligation. | |
| UMBS—Uniform Mortgage-Backed Securities. | |
| USD—U.S. dollar. |
| Futures Contracts | ||||
| ($000) | ||||
| Expiration | Number of Long (Short) Contracts | Notional Amount | Value and Unrealized Appreciation (Depreciation) | |
| Long Futures Contracts | ||||
| 5-Year U.S. Treasury Note | March 2023 | 5,061 | 549,474 | 2,117 |
| 10-Year U.S. Treasury Note | March 2023 | 3,268 | 370,918 | 2,881 |
| 4,998 | ||||
| Short Futures Contracts | ||||
| Ultra 10-Year U.S. Treasury Note | March 2023 | (2,676) | (320,200) | (1,850) |
| 3,148 | ||||
| ($000s, except shares and per-share amounts) | Amount |
| Assets | |
| Investments in Securities, at Value | |
| Unaffiliated Issuers (Cost $85,889,024) | 106,755,933 |
| Affiliated Issuers (Cost $140) | 143 |
| Total Investments in Securities | 106,756,076 |
| Investment in Vanguard | 3,876 |
| Cash | 6,665 |
| Foreign Currency, at Value (Cost $1,593) | 1,537 |
| Receivables for Investment Securities Sold | 588,660 |
| Receivables for Accrued Income | 447,675 |
| Receivables for Capital Shares Issued | 20,277 |
| Variation Margin Receivable—Futures Contracts | 2,165 |
| Total Assets | 107,826,931 |
| Liabilities | |
| Payables for Investment Securities Purchased | 1,135,821 |
| Payables for Capital Shares Redeemed | 77,484 |
| Payables to Investment Advisor | 18,019 |
| Payables to Vanguard | 5,740 |
| Total Liabilities | 1,237,064 |
| Net Assets | 106,589,867 |
| At November 30, 2022, net assets consisted of: | |
| Paid-in Capital | 79,637,973 |
| Total Distributable Earnings (Loss) | 26,951,894 |
| Net Assets | 106,589,867 |
| Investor Shares—Net Assets | |
| Applicable to 310,404,774 outstanding $.001 par value shares of beneficial interest (unlimited authorization) | 13,097,445 |
| Net Asset Value Per Share—Investor Shares | $42.19 |
| Admiral Shares—Net Assets | |
| Applicable to 1,283,105,257 outstanding $.001 par value shares of beneficial interest (unlimited authorization) | 93,492,422 |
| Net Asset Value Per Share—Admiral Shares | $72.86 |
| Year Ended November 30, 2022 | |
| ($000) | |
| Investment Income | |
| Income | |
| Dividends1 | 1,328,663 |
| Interest2 | 1,148,233 |
| Securities Lending—Net | 30 |
| Total Income | 2,476,926 |
| Expenses | |
| Investment Advisory Fees—Note B | |
| Basic Fee | 85,595 |
| Performance Adjustment | (13,745) |
| The Vanguard Group—Note C | |
| Management and Administrative—Investor Shares | 23,568 |
| Management and Administrative—Admiral Shares | 93,804 |
| Marketing and Distribution—Investor Shares | 838 |
| Marketing and Distribution—Admiral Shares | 3,049 |
| Custodian Fees | 370 |
| Auditing Fees | 33 |
| Shareholders’ Reports—Investor Shares | 371 |
| Shareholders’ Reports—Admiral Shares | 374 |
| Trustees’ Fees and Expenses | 41 |
| Other Expenses | 1,040 |
| Total Expenses | 195,338 |
| Expenses Paid Indirectly | (141) |
| Net Expenses | 195,197 |
| Net Investment Income | 2,281,729 |
| Realized Net Gain (Loss) | |
| Investment Securities Sold2 | 6,205,253 |
| Futures Contracts | (146,405) |
| Swap Contracts | 6,401 |
| Foreign Currencies | 3,124 |
| Realized Net Gain (Loss) | 6,068,373 |
| Statement of Operations (continued) | |
| Year Ended November 30, 2022 | |
| ($000) | |
| Change in Unrealized Appreciation (Depreciation) | |
| Investment Securities2 | (18,642,567) |
| Futures Contracts | (8,308) |
| Foreign Currencies | (3,924) |
| Change in Unrealized Appreciation (Depreciation) | (18,654,799) |
| Net Increase (Decrease) in Net Assets Resulting from Operations | (10,304,697) |
| 1 | Dividends are net of foreign withholding taxes of $3,332,000. |
| 2 | Interest income, realized net gain (loss), and change in unrealized appreciation (depreciation) from an affiliated company of the fund were $0, ($2,000), and $1,000, respectively. Purchases and sales are for temporary cash investment purposes. |
| Year Ended November 30, | ||
| 2022 ($000) | 2021 ($000) | |
| Increase (Decrease) in Net Assets | ||
| Operations | ||
| Net Investment Income | 2,281,729 | 2,092,722 |
| Realized Net Gain (Loss) | 6,068,373 | 8,514,232 |
| Change in Unrealized Appreciation (Depreciation) | (18,654,799) | 7,990,979 |
| Net Increase (Decrease) in Net Assets Resulting from Operations | (10,304,697) | 18,597,933 |
| Distributions | ||
| Investor Shares | (1,281,722) | (1,149,407) |
| Admiral Shares | (9,066,000) | (7,140,083) |
| Total Distributions | (10,347,722) | (8,289,490) |
| Capital Share Transactions | ||
| Investor Shares | 207,506 | (1,554,501) |
| Admiral Shares | 3,179,261 | 3,457,185 |
| Net Increase (Decrease) from Capital Share Transactions | 3,386,767 | 1,902,684 |
| Total Increase (Decrease) | (17,265,652) | 12,211,127 |
| Net Assets | ||
| Beginning of Period | 123,855,519 | 111,644,392 |
| End of Period | 106,589,867 | 123,855,519 |
| Investor Shares | |||||
| For a Share Outstanding Throughout Each Period | Year Ended November 30, | ||||
| 2022 | 2021 | 2020 | 2019 | 2018 | |
| Net Asset Value, Beginning of Period | $50.15 | $46.10 | $43.72 | $41.86 | $43.45 |
| Investment Operations | |||||
| Net Investment Income1 | .857 | .811 | .966 | 1.098 | 1.083 |
| Net Realized and Unrealized Gain (Loss) on Investments | (4.681) | 6.638 | 3.345 | 4.269 | .100 |
| Total from Investment Operations | (3.824) | 7.449 | 4.311 | 5.367 | 1.183 |
| Distributions | |||||
| Dividends from Net Investment Income | (.828) | (.818) | (1.004) | (1.099) | (1.086) |
| Distributions from Realized Capital Gains | (3.308) | (2.581) | (.927) | (2.408) | (1.687) |
| Total Distributions | (4.136) | (3.399) | (1.931) | (3.507) | (2.773) |
| Net Asset Value, End of Period | $42.19 | $50.15 | $46.10 | $43.72 | $41.86 |
| Total Return2 | -8.43% | 17.16% | 10.41% | 14.22% | 2.80% |
| Ratios/Supplemental Data | |||||
| Net Assets, End of Period (Millions) | $13,097 | $15,469 | $15,635 | $17,209 | $16,438 |
| Ratio of Total Expenses to Average Net Assets3 | 0.25%4 | 0.24% | 0.24% | 0.25% | 0.25% |
| Ratio of Net Investment Income to Average Net Assets | 1.98% | 1.70% | 2.28% | 2.70% | 2.58% |
| Portfolio Turnover Rate5 | 41% | 35% | 51% | 28% | 34% |
| 1 | Calculated based on average shares outstanding. |
| 2 | Total returns do not include account service fees that may have applied in the periods shown. Fund prospectuses provide information about any applicable account service fees. |
| 3 | Includes performance-based investment advisory fee increases (decreases) of (0.01%), (0.02%), (0.02%), (0.00%), and (0.01%). |
| 4 | The ratio of expenses to average net assets for the period net of reduction from custody fee offset and broker commission abatement arrangements was 0.25%. |
| 5 | Includes 8%, 2%, 3%, 1%, and 2%, respectively, attributable to mortgage-dollar-roll activity. |
| Admiral Shares | |||||
| For a Share Outstanding Throughout Each Period | Year Ended November 30, | ||||
| 2022 | 2021 | 2020 | 2019 | 2018 | |
| Net Asset Value, Beginning of Period | $86.61 | $79.62 | $75.51 | $72.29 | $75.04 |
| Investment Operations | |||||
| Net Investment Income1 | 1.540 | 1.464 | 1.720 | 1.954 | 1.929 |
| Net Realized and Unrealized Gain (Loss) on Investments | (8.083) | 11.461 | 5.784 | 7.379 | .172 |
| Total from Investment Operations | (6.543) | 12.925 | 7.504 | 9.333 | 2.101 |
| Distributions | |||||
| Dividends from Net Investment Income | (1.493) | (1.477) | (1.794) | (1.955) | (1.936) |
| Distributions from Realized Capital Gains | (5.714) | (4.458) | (1.600) | (4.158) | (2.915) |
| Total Distributions | (7.207) | (5.935) | (3.394) | (6.113) | (4.851) |
| Net Asset Value, End of Period | $72.86 | $86.61 | $79.62 | $75.51 | $72.29 |
| Total Return2 | -8.36% | 17.25% | 10.50% | 14.33% | 2.88% |
| Ratios/Supplemental Data | |||||
| Net Assets, End of Period (Millions) | $93,492 | $108,386 | $96,009 | $93,469 | $86,207 |
| Ratio of Total Expenses to Average Net Assets3 | 0.17%4 | 0.16% | 0.16% | 0.17% | 0.17% |
| Ratio of Net Investment Income to Average Net Assets | 2.06% | 1.77% | 2.35% | 2.78% | 2.66% |
| Portfolio Turnover Rate5 | 41% | 35% | 51% | 28% | 34% |
| 1 | Calculated based on average shares outstanding. |
| 2 | Total returns do not include account service fees that may have applied in the periods shown. Fund prospectuses provide information about any applicable account service fees. |
| 3 | Includes performance-based investment advisory fee increases (decreases) of (0.01%), (0.02%), (0.02%), (0.00%), and (0.01%). |
| 4 | The ratio of expenses to average net assets for the period net of reduction from custody fee offset and broker commission abatement arrangements was 0.17%. |
| 5 | Includes 8%, 2%, 3%, 1%, and 2%, respectively, attributable to mortgage-dollar-roll activity. |
| Level 1 ($000) | Level 2 ($000) | Level 3 ($000) | Total ($000) | |
| Investments | ||||
| Assets | ||||
| Common Stocks | 66,209,805 | 4,785,715 | — | 70,995,520 |
| U.S. Government and Agency Obligations | — | 9,084,798 | — | 9,084,798 |
| Asset-Backed/Commercial Mortgage-Backed Securities | — | 826,134 | — | 826,134 |
| Corporate Bonds | — | 22,318,222 | — | 22,318,222 |
| Sovereign Bonds | — | 836,205 | — | 836,205 |
| Taxable Municipal Bonds | — | 1,629,944 | — | 1,629,944 |
| Temporary Cash Investments | 143 | 1,065,110 | — | 1,065,253 |
| Total | 66,209,948 | 40,546,128 | — | 106,756,076 |
| Derivative Financial Instruments | ||||
| Assets | ||||
| Futures Contracts1 | 4,998 | — | — | 4,998 |
| Liabilities | ||||
| Futures Contracts1 | 1,850 | — | — | 1,850 |
| 1 | Includes cumulative appreciation (depreciation) on futures contracts and centrally cleared swaps, if any, as reported in the Schedule of Investments. Only current day’s variation margin is reported within the Statement of Assets and Liabilities. |
| Realized Net Gain (Loss) on Derivatives | Interest Rate Contracts ($000) | Credit Contracts ($000) | Total ($000) |
| Futures Contracts | (146,405) | — | (146,405) |
| Swap Contracts | — | 6,401 | 6,401 |
| Realized Net Gain (Loss) on Derivatives | (146,405) | 6,401 | (140,004) |
| Change in Unrealized Appreciation (Depreciation) on Derivatives | |||
| Futures Contracts | (8,308) | — | (8,308) |
| Change in Unrealized Appreciation (Depreciation) on Derivatives | (8,308) | — | (8,308) |
| Amount ($000) | |
| Paid-in Capital | 462,037 |
| Total Distributable Earnings (Loss) | (462,037) |
| Amount ($000) | |
| Undistributed Ordinary Income | 512,611 |
| Undistributed Long-Term Gains | 5,726,451 |
| Capital Loss Carryforwards | — |
| Qualified Late-Year Losses | — |
| Net Unrealized Gains (Losses) | 20,712,832 |
| Year Ended November 30, | ||
| 2022 Amount ($000) | 2021 Amount ($000) | |
| Ordinary Income* | 3,864,834 | 2,502,914 |
| Long-Term Capital Gains | 6,482,888 | 5,786,576 |
| Total | 10,347,722 | 8,289,490 |
| * | Includes short-term capital gains, if any. |
| Amount ($000) | |
| Tax Cost | 86,043,145 |
| Gross Unrealized Appreciation | 27,758,382 |
| Gross Unrealized Depreciation | (7,045,451) |
| Net Unrealized Appreciation (Depreciation) | 20,712,931 |
| Year Ended November 30, | |||||
| 2022 | 2021 | ||||
| Amount ($000) | Shares (000) | Amount ($000) | Shares (000) | ||
| Investor Shares | |||||
| Issued | 1,286,082 | 29,118 | 1,621,764 | 34,004 | |
| Issued in Lieu of Cash Distributions | 1,221,648 | 25,794 | 1,097,976 | 24,568 | |
| Redeemed | (2,300,224) | (52,957) | (4,274,241) | (89,265) | |
| Net Increase (Decrease)—Investor Shares | 207,506 | 1,955 | (1,554,501) | (30,693) | |
| Year Ended November 30, | |||||
| 2022 | 2021 | ||||
| Amount ($000) | Shares (000) | Amount ($000) | Shares (000) | ||
| Admiral Shares | |||||
| Issued | 6,311,279 | 83,059 | 8,286,366 | 100,452 | |
| Issued in Lieu of Cash Distributions | 8,395,579 | 102,747 | 6,612,568 | 85,613 | |
| Redeemed | (11,527,597) | (154,162) | (11,441,749) | (140,499) | |
| Net Increase (Decrease)—Admiral Shares | 3,179,261 | 31,644 | 3,457,185 | 45,566 | |
Philadelphia, Pennsylvania
January 19, 2023


| Vanguard U.S. Minimum Volatility ETF |
| Vanguard U.S. Momentum Factor ETF |
| Vanguard U.S. Multifactor ETF |
| Vanguard U.S. Quality Factor ETF |
| Vanguard U.S. Value Factor ETF |
Your Fund’s Performance at a Glance | 1 |
Advisor's Report | 2 |
About Your Fund’s Expenses | 4 |
U.S. Minimum Volatility ETF | 6 |
U.S. Momentum Factor ETF | 20 |
U.S. Multifactor ETF | 38 |
U.S. Quality Factor ETF | 55 |
U.S. Value Factor ETF | 73 |
| • | Vanguard’s five U.S. Factor ETFs posted returns ranging from about –7% to nearly 8% (based on net asset value) for the 12 months ended November 30, 2022. Despite a challenging economic and investment environment, all five ETFs beat the –10.80% return of their benchmark, the Russell 3000 Index. |
| • | The economic backdrop deteriorated early on as inflation soared to multidecade highs, fueled in part by higher energy and food prices in the wake of Russia’s invasion of Ukraine. Then price increases broadened to other categories of goods and services. That prompted aggressive tightening by the Federal Reserve to bring inflation back in check, which increased fears of a recession. |
| • | The U.S. Factor ETFs seek to provide long-term capital appreciation by investing in stocks that have lower or higher measures of certain factors relative to the broad U.S. equity market. |
| • | Vanguard U.S. Value Factor ETF performed best among the group, returning 7.63% based on net asset value. Energy, information technology, and financials produced the strongest relative performance. Vanguard U.S. Quality Factor ETF had the lowest return, at –7.15% based on net asset value. |
| Average Annual Total Returns Periods Ended November 30, 2022 | |||
| One Year | Three Years | Five Years | |
| Stocks | |||
| Russell 1000 Index (Large-caps) | -10.66% | 10.56% | 10.69% |
| Russell 2000 Index (Small-caps) | -13.01 | 6.44 | 5.45 |
| Russell 3000 Index (Broad U.S. market) | -10.80 | 10.28 | 10.33 |
| FTSE All-World ex US Index (International) | -11.40 | 2.23 | 1.86 |
| Bonds | |||
| Bloomberg U.S. Aggregate Float Adjusted Index (Broad taxable market) | -12.91% | -2.56% | 0.24% |
| Bloomberg Municipal Bond Index (Broad tax-exempt market) | -8.64 | -0.77 | 1.40 |
| FTSE Three-Month U.S. Treasury Bill Index | 1.16 | 0.64 | 1.19 |
| CPI | |||
| Consumer Price Index | 7.11% | 5.00% | 3.83% |
| • | Based on actual fund return. This section helps you to estimate the actual expenses that you paid over the period. The ”Ending Account Value“ shown is derived from the fund‘s actual return, and the third column shows the dollar amount that would have been paid by an investor who started with $1,000 in the fund. You may use the information here, together with the amount you invested, to estimate the expenses that you paid over the period. |
| • | Based on hypothetical 5% yearly return. This section is intended to help you compare your fund‘s costs with those of other mutual funds. It assumes that the fund had a yearly return of 5% before expenses, but that the expense ratio is unchanged. In this case—because the return used is not the fund’s actual return—the results do not apply to your investment. The example is useful in making comparisons because the Securities and Exchange Commission requires all mutual funds to calculate expenses based on a 5% return. You can assess your fund’s costs by comparing this hypothetical example with the hypothetical examples that appear in shareholder reports of other funds. |
| Six Months Ended November 30, 2022 | |||
| Beginning Account Value 5/31/2022 | Ending Account Value 11/30/2022 | Expenses Paid During Period | |
| Based on Actual Fund Return | |||
| U.S. Minimum Volatility ETF | $1,000.00 | $1,031.90 | $0.66 |
| U.S. Momentum Factor ETF | $1,000.00 | $1,038.10 | $0.66 |
| U.S. Multifactor ETF | $1,000.00 | $1,056.30 | $0.93 |
| U.S. Quality Factor ETF | $1,000.00 | $1,047.30 | $0.67 |
| U.S. Value Factor ETF | $1,000.00 | $1,017.90 | $0.66 |
| Based on Hypothetical 5% Yearly Return | |||
| U.S. Minimum Volatility ETF | $1,000.00 | $1,024.42 | $0.66 |
| U.S. Momentum Factor ETF | $1,000.00 | $1,024.42 | $0.66 |
| U.S. Multifactor ETF | $1,000.00 | $1,024.17 | $0.91 |
| U.S. Quality Factor ETF | $1,000.00 | $1,024.42 | $0.66 |
| U.S. Value Factor ETF | $1,000.00 | $1,024.42 | $0.66 |

| Average Annual Total Returns Periods Ended November 30, 2022 | ||||
| One Year | Since Inception (2/13/2018) | Final Value of a $10,000 Investment | ||

| U.S. Minimum Volatility ETF Net Asset Value | 4.46% | 9.03% | $15,138 |
| U.S. Minimum Volatility ETF Market Price | 4.43 | 9.02 | 15,132 | |

| Russell 3000 Index | -10.80 | 10.69 | 16,272 |
| One Year | Since Inception (2/13/2018) | |
| U.S. Minimum Volatility ETF Market Price | 4.43% | 51.32% |
| U.S. Minimum Volatility ETF Net Asset Value | 4.46 | 51.38 |
| Russell 3000 Index | -10.80 | 62.72 |
| Basic Materials | 0.3% |
| Consumer Discretionary | 11.4 |
| Consumer Staples | 12.2 |
| Energy | 2.5 |
| Financials | 15.4 |
| Health Care | 17.8 |
| Industrials | 7.5 |
| Real Estate | 1.5 |
| Technology | 16.9 |
| Telecommunications | 7.0 |
| Utilities | 7.5 |
| Shares | Market Value• ($000) | ||
| Republic Services Inc. Class A | 2 | — | |
| 5,985 | |||
| Total Common Stocks (Cost $73,133) | 80,310 | ||
| Temporary Cash Investments (1.2%) | |||
| Money Market Fund (1.2%) | |||
| 2,3 | Vanguard Market Liquidity Fund, 3.877% (Cost $961) | 9,611 | 961 |
| Total Investments (100.6%) (Cost $74,094) | 81,271 | ||
| Other Assets and Liabilities—Net (-0.6%) | (483) | ||
| Net Assets (100%) | 80,788 | ||
| Cost is in $000. | |||
| • | See Note A in Notes to Financial Statements. |
| * | Non-income-producing security. |
| 1 | Includes partial security positions on loan to broker-dealers. The total value of securities on loan is $613,000. |
| 2 | Affiliated money market fund available only to Vanguard funds and certain trusts and accounts managed by Vanguard. Rate shown is the 7-day yield. |
| 3 | Collateral of $662,000 was received for securities on loan. |
| Futures Contracts | ||||
| ($000) | ||||
| Expiration | Number of Long (Short) Contracts | Notional Amount | Value and Unrealized Appreciation (Depreciation) | |
| Long Futures Contracts | ||||
| Micro E-mini S&P 500 Index | December 2022 | 16 | 327 | 8 |
| ($000s, except shares and per-share amounts) | Amount |
| Assets | |
| Investments in Securities, at Value1 | |
| Unaffiliated Issuers (Cost $73,133) | 80,310 |
| Affiliated Issuers (Cost $961) | 961 |
| Total Investments in Securities | 81,271 |
| Investment in Vanguard | 3 |
| Cash Collateral Pledged—Futures Contracts | 24 |
| Receivables for Investment Securities Sold | 17 |
| Receivables for Accrued Income | 130 |
| Receivables for Capital Shares Issued | 4,632 |
| Variation Margin Receivable—Futures Contracts | 10 |
| Total Assets | 86,087 |
| Liabilities | |
| Due to Custodian | 17 |
| Payables for Investment Securities Purchased | 4,616 |
| Collateral for Securities on Loan | 662 |
| Payables to Vanguard | 4 |
| Total Liabilities | 5,299 |
| Net Assets | 80,788 |
| 1 Includes $613 of securities on loan. | |
| At November 30, 2022, net assets consisted of: | |
| Paid-in Capital | 80,754 |
| Total Distributable Earnings (Loss) | 34 |
| Net Assets | 80,788 |
| Net Assets | |
| Applicable to 785,000 outstanding $.001 par value shares of beneficial interest (unlimited authorization) | 80,788 |
| Net Asset Value Per Share | $102.91 |
| Year Ended November 30, 2022 | |
| ($000) | |
| Investment Income | |
| Income | |
| Dividends | 1,369 |
| Interest1 | 3 |
| Securities Lending—Net | 17 |
| Total Income | 1,389 |
| Expenses | |
| The Vanguard Group—Note B | |
| Investment Advisory Services | — |
| Management and Administrative | 13 |
| Marketing and Distribution | — |
| Custodian Fees | 2 |
| Auditing Fees | 28 |
| Shareholders’ Reports | 19 |
| Trustees’ Fees and Expenses | — |
| Professional Services | 16 |
| Total Expenses | 78 |
| Net Investment Income | 1,311 |
| Realized Net Gain (Loss) | |
| Investment Securities Sold1,2 | 2,033 |
| Futures Contracts | (3) |
| Realized Net Gain (Loss) | 2,030 |
| Change in Unrealized Appreciation (Depreciation) | |
| Investment Securities1 | (44) |
| Futures Contracts | 1 |
| Change in Unrealized Appreciation (Depreciation) | (43) |
| Net Increase (Decrease) in Net Assets Resulting from Operations | 3,298 |
| 1 | Interest income, realized net gain (loss), capital gain distributions received, and change in unrealized appreciation (depreciation) from an affiliated company of the fund were $3,000, less than $1,000, less than $1,000, and $1,000, respectively. Purchases and sales are for temporary cash investment purposes. |
| 2 | Includes $1,231,000 of net gain (loss) resulting from in-kind redemptions. |
| Year Ended November 30, | ||
| 2022 ($000) | 2021 ($000) | |
| Increase (Decrease) in Net Assets | ||
| Operations | ||
| Net Investment Income | 1,311 | 699 |
| Realized Net Gain (Loss) | 2,030 | 6,386 |
| Change in Unrealized Appreciation (Depreciation) | (43) | 896 |
| Net Increase (Decrease) in Net Assets Resulting from Operations | 3,298 | 7,981 |
| Distributions | ||
| Total Distributions | (1,062) | (905) |
| Capital Share Transactions | ||
| Issued | 42,084 | 1,451 |
| Issued in Lieu of Cash Distributions | — | — |
| Redeemed | (10,661) | (18,000) |
| Net Increase (Decrease) from Capital Share Transactions | 31,423 | (16,549) |
| Total Increase (Decrease) | 33,659 | (9,473) |
| Net Assets | ||
| Beginning of Period | 47,129 | 56,602 |
| End of Period | 80,788 | 47,129 |
| For a Share Outstanding Throughout Each Period | Year Ended November 30, | February 13, 20181 to November 30, 2018 | |||
| 2022 | 2021 | 2020 | 2019 | ||
| Net Asset Value, Beginning of Period | $100.28 | $87.08 | $91.10 | $81.69 | $75.00 |
| Investment Operations | |||||
| Net Investment Income2 | 2.160 | 1.374 | 1.779 | 2.632 | 1.887 |
| Net Realized and Unrealized Gain (Loss) on Investments | 2.231 | 13.497 | (3.776) | 8.996 | 5.677 |
| Total from Investment Operations | 4.391 | 14.871 | (1.997) | 11.628 | 7.564 |
| Distributions | |||||
| Dividends from Net Investment Income | (1.761) | (1.671) | (2.023) | (2.218) | (.874) |
| Distributions from Realized Capital Gains | — | — | — | — | — |
| Total Distributions | (1.761) | (1.671) | (2.023) | (2.218) | (.874) |
| Net Asset Value, End of Period | $102.91 | $100.28 | $87.08 | $91.10 | $81.69 |
| Total Return | 4.46% | 17.22% | -1.99% | 14.58% | 10.07% |
| Ratios/Supplemental Data | |||||
| Net Assets, End of Period (Millions) | $81 | $47 | $57 | $91 | $22 |
| Ratio of Total Expenses to Average Net Assets | 0.13% | 0.13% | 0.13% | 0.13% | 0.13%3 |
| Ratio of Net Investment Income to Average Net Assets | 2.18% | 1.43% | 2.14% | 3.05% | 2.90%3 |
| Portfolio Turnover Rate | 32%4 | 46%4 | 83%4 | 23% | 5% |
| 1 | Inception. |
| 2 | Calculated based on average shares outstanding. |
| 3 | Annualized. |
| 4 | Excludes the value of portfolio securities received or delivered as a result of in-kind purchases or redemptions of the fund’s capital shares, including ETF Creation Units. |
| A. | The following significant accounting policies conform to generally accepted accounting principles for U.S. investment companies. The fund consistently follows such policies in preparing its financial statements. |
| B. | In accordance with the terms of a Funds' Service Agreement (the “FSA”) between Vanguard and the fund, Vanguard furnishes to the fund investment advisory, corporate management, administrative, marketing, and distribution services at Vanguard’s cost of operations (as defined by the FSA). These costs of operations are allocated to the fund based on methods and guidelines approved by the board of trustees and are generally settled twice a month. |
| C. | Various inputs may be used to determine the value of the fund’s investments and derivatives. These inputs are summarized in three broad levels for financial statement purposes. The inputs or methodologies used to value securities are not necessarily an indication of the risk associated with investing in those securities. |
| D. | Permanent differences between book-basis and tax-basis components of net assets are reclassified among capital accounts in the financial statements to reflect their tax character. These |
| Amount ($000) | |
| Paid-in Capital | 1,231 |
| Total Distributable Earnings (Loss) | (1,231) |
| Amount ($000) | |
| Undistributed Ordinary Income | 379 |
| Undistributed Long-Term Gains | — |
| Capital Loss Carryforwards | (7,522) |
| Qualified Late-Year Losses | — |
| Net Unrealized Gains (Losses) | 7,177 |
| Year Ended November 30, | ||
| 2022 Amount ($000) | 2021 Amount ($000) | |
| Ordinary Income* | 1,062 | 905 |
| Long-Term Capital Gains | — | — |
| Total | 1,062 | 905 |
| * | Includes short-term capital gains, if any. |
| Amount ($000) | |
| Tax Cost | 74,094 |
| Gross Unrealized Appreciation | 9,798 |
| Gross Unrealized Depreciation | (2,621) |
| Net Unrealized Appreciation (Depreciation) | 7,177 |
| E. | During the year ended November 30, 2022, the fund purchased $61,268,000 of investment securities and sold $29,839,000 of investment securities, other than temporary cash investments. Purchases and sales include $0 and $10,583,000, respectively, in connection with in-kind purchases and redemptions of the fund's capital shares. |
| F. | Capital shares issued and redeemed were: |
| Year Ended November 30, | ||
| 2022 Shares (000) | 2021 Shares (000) | |
| Issued | 425 | 15 |
| Issued in Lieu of Cash Distributions | — | — |
| Redeemed | (110) | (195) |
| Net Increase (Decrease) in Shares Outstanding | 315 | (180) |
| G. | Management has determined that no events or transactions occurred subsequent to November 30, 2022, that would require recognition or disclosure in these financial statements. |

| Average Annual Total Returns Periods Ended November 30, 2022 | ||||
| One Year | Since Inception (2/13/2018) | Final Value of a $10,000 Investment | ||
|
| U.S. Momentum Factor ETF Net Asset Value | -6.27% | 11.71% | $17,002 |
| U.S. Momentum Factor ETF Market Price | -6.30 | 11.70 | 16,997 | |
|
| Russell 3000 Index | -10.80 | 10.69 | 16,272 |
| One Year | Since Inception (2/13/2018) | |
| U.S. Momentum Factor ETF Market Price | -6.30% | 69.97% |
| U.S. Momentum Factor ETF Net Asset Value | -6.27 | 70.02 |
| Russell 3000 Index | -10.80 | 62.72 |
| Basic Materials | 3.3% |
| Consumer Discretionary | 9.8 |
| Consumer Staples | 10.1 |
| Energy | 20.0 |
| Financials | 13.8 |
| Health Care | 19.3 |
| Industrials | 14.6 |
| Real Estate | 0.1 |
| Technology | 6.2 |
| Telecommunications | 2.1 |
| Utilities | 0.7 |
| Shares | Market Value• ($000) | ||
| Temporary Cash Investments (1.2%) | |||
| Money Market Fund (1.2%) | |||
| 2,3 | Vanguard Market Liquidity Fund, 3.877% (Cost $3,414) | 34,147 | 3,414 |
| Total Investments (100.8%) (Cost $248,863) | 285,989 | ||
| Other Assets and Liabilities—Net (-0.8%) | (2,134) | ||
| Net Assets (100%) | 283,855 | ||
| Cost is in $000. | |||
| • | See Note A in Notes to Financial Statements. |
| * | Non-income-producing security. |
| 1 | Includes partial security positions on loan to broker-dealers. The total value of securities on loan is $1,930,000. |
| 2 | Affiliated money market fund available only to Vanguard funds and certain trusts and accounts managed by Vanguard. Rate shown is the 7-day yield. |
| 3 | Collateral of $2,465,000 was received for securities on loan. |
| Futures Contracts | ||||
| ($000) | ||||
| Expiration | Number of Long (Short) Contracts | Notional Amount | Value and Unrealized Appreciation (Depreciation) | |
| Long Futures Contracts | ||||
| E-mini S&P 500 Index | December 2022 | 4 | 816 | 48 |
| Micro E-mini S&P 500 Index | December 2022 | 18 | 367 | 7 |
| 55 | ||||
| ($000s, except shares and per-share amounts) | Amount |
| Assets | |
| Investments in Securities, at Value1 | |
| Unaffiliated Issuers (Cost $245,449) | 282,575 |
| Affiliated Issuers (Cost $3,414) | 3,414 |
| Total Investments in Securities | 285,989 |
| Investment in Vanguard | 10 |
| Cash Collateral Pledged—Futures Contracts | 66 |
| Receivables for Investment Securities Sold | 4 |
| Receivables for Accrued Income | 419 |
| Receivables for Capital Shares Issued | 609 |
| Variation Margin Receivable—Futures Contracts | 35 |
| Total Assets | 287,132 |
| Liabilities | |
| Due to Custodian | 4 |
| Payables for Investment Securities Purchased | 793 |
| Collateral for Securities on Loan | 2,465 |
| Payables to Vanguard | 15 |
| Total Liabilities | 3,277 |
| Net Assets | 283,855 |
| 1 Includes $1,930 of securities on loan. | |
| At November 30, 2022, net assets consisted of: | |
| Paid-in Capital | 274,610 |
| Total Distributable Earnings (Loss) | 9,245 |
| Net Assets | 283,855 |
| Net Assets | |
| Applicable to 2,330,000 outstanding $.001 par value shares of beneficial interest (unlimited authorization) | 283,855 |
| Net Asset Value Per Share | $121.83 |
| Year Ended November 30, 2022 | |
| ($000) | |
| Investment Income | |
| Income | |
| Dividends1 | 3,805 |
| Interest2 | 15 |
| Securities Lending—Net | 40 |
| Total Income | 3,860 |
| Expenses | |
| The Vanguard Group—Note B | |
| Investment Advisory Services | 124 |
| Management and Administrative | 46 |
| Marketing and Distribution | 11 |
| Custodian Fees | 6 |
| Auditing Fees | 28 |
| Shareholders’ Reports | 36 |
| Trustees’ Fees and Expenses | — |
| Professional Services | 16 |
| Total Expenses | 267 |
| Net Investment Income | 3,593 |
| Realized Net Gain (Loss) | |
| Investment Securities Sold2,3 | (15,000) |
| Futures Contracts | 36 |
| Realized Net Gain (Loss) | (14,964) |
| Change in Unrealized Appreciation (Depreciation) | |
| Investment Securities2 | 5,283 |
| Futures Contracts | 39 |
| Change in Unrealized Appreciation (Depreciation) | 5,322 |
| Net Increase (Decrease) in Net Assets Resulting from Operations | (6,049) |
| 1 | Dividends are net of foreign withholding taxes of less than $1,000. |
| 2 | Interest income, realized net gain (loss), capital gain distributions received, and change in unrealized appreciation (depreciation) from an affiliated company of the fund were $15,000, less than $1,000, less than $1,000, and less than $1,000, respectively. Purchases and sales are for temporary cash investment purposes. |
| 3 | Includes $9,093,000 of net gain (loss) resulting from in-kind redemptions. |
| Year Ended November 30, | ||
| 2022 ($000) | 2021 ($000) | |
| Increase (Decrease) in Net Assets | ||
| Operations | ||
| Net Investment Income | 3,593 | 1,153 |
| Realized Net Gain (Loss) | (14,964) | 47 |
| Change in Unrealized Appreciation (Depreciation) | 5,322 | 16,403 |
| Net Increase (Decrease) in Net Assets Resulting from Operations | (6,049) | 17,603 |
| Distributions | ||
| Total Distributions | (3,256) | (717) |
| Capital Share Transactions | ||
| Issued | 147,546 | 124,004 |
| Issued in Lieu of Cash Distributions | — | — |
| Redeemed | (45,302) | (8,454) |
| Net Increase (Decrease) from Capital Share Transactions | 102,244 | 115,550 |
| Total Increase (Decrease) | 92,939 | 132,436 |
| Net Assets | ||
| Beginning of Period | 190,916 | 58,480 |
| End of Period | 283,855 | 190,916 |
| For a Share Outstanding Throughout Each Period | Year Ended November 30, | February 13, 20181 to November 30, 2018 | |||
| 2022 | 2021 | 2020 | 2019 | ||
| Net Asset Value, Beginning of Period | $132.12 | $106.33 | $85.18 | $76.73 | $75.00 |
| Investment Operations | |||||
| Net Investment Income2 | 2.072 | 1.227 | .552 | .985 | .538 |
| Net Realized and Unrealized Gain (Loss) on Investments | (10.460) | 25.325 | 21.279 | 8.336 | 1.489 |
| Total from Investment Operations | (8.388) | 26.552 | 21.831 | 9.321 | 2.027 |
| Distributions | |||||
| Dividends from Net Investment Income | (1.902) | (.762) | (.681) | (.871) | (.297) |
| Distributions from Realized Capital Gains | — | — | — | — | — |
| Total Distributions | (1.902) | (.762) | (.681) | (.871) | (.297) |
| Net Asset Value, End of Period | $121.83 | $132.12 | $106.33 | $85.18 | $76.73 |
| Total Return | -6.27% | 25.01% | 25.91% | 12.25% | 2.67% |
| Ratios/Supplemental Data | |||||
| Net Assets, End of Period (Millions) | $284 | $191 | $58 | $32 | $33 |
| Ratio of Total Expenses to Average Net Assets | 0.13% | 0.13% | 0.13% | 0.13% | 0.13%3 |
| Ratio of Net Investment Income to Average Net Assets | 1.76% | 0.95% | 0.62% | 1.24% | 0.83%3 |
| Portfolio Turnover Rate | 88%4 | 103%4 | 115%4 | 118% | 53% |
| 1 | Inception. |
| 2 | Calculated based on average shares outstanding. |
| 3 | Annualized. |
| 4 | Excludes the value of portfolio securities received or delivered as a result of in-kind purchases or redemptions of the fund’s capital shares, including ETF Creation Units. |
| A. | The following significant accounting policies conform to generally accepted accounting principles for U.S. investment companies. The fund consistently follows such policies in preparing its financial statements. |
| B. | In accordance with the terms of a Funds' Service Agreement (the “FSA”) between Vanguard and the fund, Vanguard furnishes to the fund investment advisory, corporate management, administrative, marketing, and distribution services at Vanguard’s cost of operations (as defined by the FSA). These costs of operations are allocated to the fund based on methods and guidelines approved by the board of trustees and are generally settled twice a month. |
| C. | Various inputs may be used to determine the value of the fund’s investments and derivatives. These inputs are summarized in three broad levels for financial statement purposes. The inputs or methodologies used to value securities are not necessarily an indication of the risk associated with investing in those securities. |
| D. | Permanent differences between book-basis and tax-basis components of net assets are reclassified among capital accounts in the financial statements to reflect their tax character. These |
| Amount ($000) | |
| Paid-in Capital | 9,094 |
| Total Distributable Earnings (Loss) | (9,094) |
| Amount ($000) | |
| Undistributed Ordinary Income | 870 |
| Undistributed Long-Term Gains | — |
| Capital Loss Carryforwards | (28,741) |
| Qualified Late-Year Losses | — |
| Net Unrealized Gains (Losses) | 37,116 |
| Year Ended November 30, | ||
| 2022 Amount ($000) | 2021 Amount ($000) | |
| Ordinary Income* | 3,256 | 717 |
| Long-Term Capital Gains | — | — |
| Total | 3,256 | 717 |
| * | Includes short-term capital gains, if any. |
| Amount ($000) | |
| Tax Cost | 248,873 |
| Gross Unrealized Appreciation | 42,817 |
| Gross Unrealized Depreciation | (5,701) |
| Net Unrealized Appreciation (Depreciation) | 37,116 |
| E. | During the year ended November 30, 2022, the fund purchased $330,838,000 of investment securities and sold $228,519,000 of investment securities, other than temporary cash investments. Purchases and sales include $0 and $45,116,000, respectively, in connection with in-kind purchases and redemptions of the fund's capital shares. |
| F. | Capital shares issued and redeemed were: |
| Year Ended November 30, | ||
| 2022 Shares (000) | 2021 Shares (000) | |
| Issued | 1,260 | 960 |
| Issued in Lieu of Cash Distributions | — | — |
| Redeemed | (375) | (65) |
| Net Increase (Decrease) in Shares Outstanding | 885 | 895 |
| G. | Management has determined that no events or transactions occurred subsequent to November 30, 2022, that would require recognition or disclosure in these financial statements. |

| Average Annual Total Returns Periods Ended November 30, 2022 | ||||
| One Year | Since Inception (2/13/2018) | Final Value of a $10,000 Investment | ||
|
| U.S. Multifactor ETF Net Asset Value | 3.73% | 9.06% | $15,158 |
| U.S. Multifactor ETF Market Price | 3.70 | 9.06 | 15,157 | |
|
| Russell 3000 Index | -10.80 | 10.69 | 16,272 |
| One Year | Since Inception (2/13/2018) | |
| U.S. Multifactor ETF Market Price | 3.70% | 51.57% |
| U.S. Multifactor ETF Net Asset Value | 3.73 | 51.58 |
| Russell 3000 Index | -10.80 | 62.72 |
| Basic Materials | 4.9% |
| Consumer Discretionary | 14.2 |
| Consumer Staples | 8.3 |
| Energy | 17.3 |
| Financials | 18.5 |
| Health Care | 14.0 |
| Industrials | 12.8 |
| Real Estate | 0.1 |
| Technology | 8.7 |
| Telecommunications | 1.2 |
| Utilities | 0.0 |
| Futures Contracts | ||||
| ($000) | ||||
| Expiration | Number of Long (Short) Contracts | Notional Amount | Value and Unrealized Appreciation (Depreciation) | |
| Long Futures Contracts | ||||
| Micro E-mini S&P 500 Index | December 2022 | 29 | 592 | 54 |
| ($000s, except shares and per-share amounts) | Amount |
| Assets | |
| Investments in Securities, at Value1 | |
| Unaffiliated Issuers (Cost $143,967) | 169,561 |
| Affiliated Issuers (Cost $1,275) | 1,275 |
| Total Investments in Securities | 170,836 |
| Investment in Vanguard | 6 |
| Cash Collateral Pledged—Futures Contracts | 28 |
| Receivables for Accrued Income | 369 |
| Receivables for Capital Shares Issued | 6,306 |
| Variation Margin Receivable—Futures Contracts | 17 |
| Total Assets | 177,562 |
| Liabilities | |
| Payables for Investment Securities Purchased | 6,293 |
| Collateral for Securities on Loan | 1,001 |
| Payables to Vanguard | 11 |
| Total Liabilities | 7,305 |
| Net Assets | 170,257 |
| 1 Includes $988 of securities on loan. | |
| At November 30, 2022, net assets consisted of: | |
| Paid-in Capital | 163,073 |
| Total Distributable Earnings (Loss) | 7,184 |
| Net Assets | 170,257 |
| Net Assets | |
| Applicable to 1,620,000 outstanding $.001 par value shares of beneficial interest (unlimited authorization) | 170,257 |
| Net Asset Value Per Share | $105.10 |
| Year Ended November 30, 2022 | |
| ($000) | |
| Investment Income | |
| Income | |
| Dividends1 | 3,345 |
| Interest2 | 6 |
| Securities Lending—Net | — |
| Total Income | 3,351 |
| Expenses | |
| The Vanguard Group—Note B | |
| Investment Advisory Services | 88 |
| Management and Administrative | 83 |
| Marketing and Distribution | 6 |
| Custodian Fees | 4 |
| Auditing Fees | 28 |
| Shareholders’ Reports | 29 |
| Trustees’ Fees and Expenses | — |
| Professional Services | 16 |
| Total Expenses | 254 |
| Expenses Paid Indirectly | (1) |
| Net Expenses | 253 |
| Net Investment Income | 3,098 |
| Realized Net Gain (Loss) | |
| Investment Securities Sold2,3 | 3,107 |
| Futures Contracts | (39) |
| Realized Net Gain (Loss) | 3,068 |
| Change in Unrealized Appreciation (Depreciation) | |
| Investment Securities2 | 1,311 |
| Futures Contracts | 51 |
| Change in Unrealized Appreciation (Depreciation) | 1,362 |
| Net Increase (Decrease) in Net Assets Resulting from Operations | 7,528 |
| 1 | Dividends are net of foreign withholding taxes of $3,000. |
| 2 | Interest income, realized net gain (loss), capital gain distributions received, and change in unrealized appreciation (depreciation) from an affiliated company of the fund were $5,000, less than $1,000, less than $1,000, and ($1,000), respectively. Purchases and sales are for temporary cash investment purposes. |
| 3 | Includes $6,398,000 of net gain (loss) resulting from in-kind redemptions. |
| Year Ended November 30, | ||
| 2022 ($000) | 2021 ($000) | |
| Increase (Decrease) in Net Assets | ||
| Operations | ||
| Net Investment Income | 3,098 | 1,364 |
| Realized Net Gain (Loss) | 3,068 | 3,068 |
| Change in Unrealized Appreciation (Depreciation) | 1,362 | 15,645 |
| Net Increase (Decrease) in Net Assets Resulting from Operations | 7,528 | 20,077 |
| Distributions | ||
| Total Distributions | (2,850) | (1,170) |
| Capital Share Transactions | ||
| Issued | 83,650 | 31,503 |
| Issued in Lieu of Cash Distributions | — | — |
| Redeemed | (28,351) | (2,076) |
| Net Increase (Decrease) from Capital Share Transactions | 55,299 | 29,427 |
| Total Increase (Decrease) | 59,977 | 48,334 |
| Net Assets | ||
| Beginning of Period | 110,280 | 61,946 |
| End of Period | 170,257 | 110,280 |
| For a Share Outstanding Throughout Each Period | Year Ended November 30, | February 13, 20181 to November 30, 2018 | |||
| 2022 | 2021 | 2020 | 2019 | ||
| Net Asset Value, Beginning of Period | $103.55 | $79.93 | $79.60 | $76.07 | $75.00 |
| Investment Operations | |||||
| Net Investment Income2 | 2.188 | 1.534 | 1.191 | 1.340 | 1.007 |
| Net Realized and Unrealized Gain (Loss) on Investments | 1.467 | 23.442 | .372 | 3.458 | .543 |
| Total from Investment Operations | 3.655 | 24.976 | 1.563 | 4.798 | 1.550 |
| Distributions | |||||
| Dividends from Net Investment Income | (2.105) | (1.356) | (1.233) | (1.268) | (.480) |
| Distributions from Realized Capital Gains | — | — | — | — | — |
| Total Distributions | (2.105) | (1.356) | (1.233) | (1.268) | (.480) |
| Net Asset Value, End of Period | $105.10 | $103.55 | $79.93 | $79.60 | $76.07 |
| Total Return | 3.73% | 31.43% | 2.35% | 6.46% | 2.03% |
| Ratios/Supplemental Data | |||||
| Net Assets, End of Period (Millions) | $170 | $110 | $62 | $90 | $76 |
| Ratio of Total Expenses to Average Net Assets | 0.18%3 | 0.18% | 0.19%3 | 0.19%3 | 0.18%4 |
| Ratio of Net Investment Income to Average Net Assets | 2.21% | 1.56% | 1.66% | 1.79% | 1.59%4 |
| Portfolio Turnover Rate | 33%5 | 75%5 | 95%5 | 98% | 64% |
| 1 | Inception. |
| 2 | Calculated based on average shares outstanding. |
| 3 | The ratio of expenses to average net assets for the period net of reduction from custody fee offset arrangements was 0.18%. |
| 4 | Annualized. |
| 5 | Excludes the value of portfolio securities received or delivered as a result of in-kind purchases or redemptions of the fund’s capital shares, including ETF Creation Units. |
| A. | The following significant accounting policies conform to generally accepted accounting principles for U.S. investment companies. The fund consistently follows such policies in preparing its financial statements. |
| B. | In accordance with the terms of a Funds' Service Agreement (the “FSA”) between Vanguard and the fund, Vanguard furnishes to the fund investment advisory, corporate management, administrative, marketing, and distribution services at Vanguard’s cost of operations (as defined by the FSA). These costs of operations are allocated to the fund based on methods and guidelines approved by the board of trustees and are generally settled twice a month. |
| C. | The fund’s custodian bank has agreed to reduce its fees when the fund maintains cash on deposit in the non-interest-bearing custody account. For the year ended November 30, 2022, custodian fee offset arrangements reduced the fund’s expenses by $1,000 (an annual rate of less than 0.01% of average net assets). |
| D. | Various inputs may be used to determine the value of the fund’s investments and derivatives. These inputs are summarized in three broad levels for financial statement purposes. The inputs or methodologies used to value securities are not necessarily an indication of the risk associated with investing in those securities. |
| E. | Permanent differences between book-basis and tax-basis components of net assets are reclassified among capital accounts in the financial statements to reflect their tax character. These |
| Amount ($000) | |
| Paid-in Capital | 6,397 |
| Total Distributable Earnings (Loss) | (6,397) |
| Amount ($000) | |
| Undistributed Ordinary Income | 697 |
| Undistributed Long-Term Gains | — |
| Capital Loss Carryforwards | (19,107) |
| Qualified Late-Year Losses | — |
| Net Unrealized Gains (Losses) | 25,594 |
| Year Ended November 30, | ||
| 2022 Amount ($000) | 2021 Amount ($000) | |
| Ordinary Income* | 2,850 | 1,170 |
| Long-Term Capital Gains | — | — |
| Total | 2,850 | 1,170 |
| * | Includes short-term capital gains, if any. |
| Amount ($000) | |
| Tax Cost | 145,242 |
| Gross Unrealized Appreciation | 30,736 |
| Gross Unrealized Depreciation | (5,142) |
| Net Unrealized Appreciation (Depreciation) | 25,594 |
| F. | During the year ended November 30, 2022, the fund purchased $130,128,000 of investment securities and sold $74,713,000 of investment securities, other than temporary cash investments. Purchases and sales include $0 and $28,301,000, respectively, in connection with in-kind purchases and redemptions of the fund's capital shares. |
| G. | Capital shares issued and redeemed were: |
| Year Ended November 30, | ||
| 2022 Shares (000) | 2021 Shares (000) | |
| Issued | 840 | 315 |
| Issued in Lieu of Cash Distributions | — | — |
| Redeemed | (285) | (25) |
| Net Increase (Decrease) in Shares Outstanding | 555 | 290 |
| H. | Management has determined that no events or transactions occurred subsequent to November 30, 2022, that would require recognition or disclosure in these financial statements. |

| Average Annual Total Returns Periods Ended November 30, 2022 | ||||
| One Year | Since Inception (2/13/2018) | Final Value of a $10,000 Investment | ||
|
| U.S. Quality Factor ETF Net Asset Value | -7.15% | 10.13% | $15,883 |
| U.S. Quality Factor ETF Market Price | -7.21 | 10.13 | 15,883 | |
|
| Russell 3000 Index | -10.80 | 10.69 | 16,272 |
| One Year | Since Inception (2/13/2018) | |
| U.S. Quality Factor ETF Market Price | -7.21% | 58.83% |
| U.S. Quality Factor ETF Net Asset Value | -7.15 | 58.83 |
| Russell 3000 Index | -10.80 | 62.72 |
| Basic Materials | 3.4% |
| Consumer Discretionary | 16.0 |
| Consumer Staples | 5.6 |
| Energy | 9.0 |
| Financials | 16.2 |
| Health Care | 14.6 |
| Industrials | 17.2 |
| Real Estate | 0.5 |
| Technology | 15.9 |
| Telecommunications | 1.6 |
| Shares | Market Value• ($000) | ||
| Temporary Cash Investments (0.4%) | |||
| Money Market Fund (0.4%) | |||
| 3,4 | Vanguard Market Liquidity Fund, 3.877% (Cost $897) | 8,967 | 897 |
| Total Investments (99.9%) (Cost $188,042) | 205,878 | ||
| Other Assets and Liabilities—Net (0.1%) | 170 | ||
| Net Assets (100%) | 206,048 | ||
| Cost is in $000. | |||
| • | See Note A in Notes to Financial Statements. |
| * | Non-income-producing security. |
| 1 | Includes partial security positions on loan to broker-dealers. The total value of securities on loan is $62,000. |
| 2 | Security value determined using significant unobservable inputs. |
| 3 | Affiliated money market fund available only to Vanguard funds and certain trusts and accounts managed by Vanguard. Rate shown is the 7-day yield. |
| 4 | Collateral of $63,000 was received for securities on loan. |
| Futures Contracts | ||||
| ($000) | ||||
| Expiration | Number of Long (Short) Contracts | Notional Amount | Value and Unrealized Appreciation (Depreciation) | |
| Long Futures Contracts | ||||
| E-mini S&P 500 Index | December 2022 | 2 | 408 | 23 |
| Micro E-mini S&P 500 Index | December 2022 | 26 | 531 | 22 |
| 45 | ||||
| ($000s, except shares and per-share amounts) | Amount |
| Assets | |
| Investments in Securities, at Value1 | |
| Unaffiliated Issuers (Cost $187,145) | 204,981 |
| Affiliated Issuers (Cost $897) | 897 |
| Total Investments in Securities | 205,878 |
| Investment in Vanguard | 8 |
| Cash Collateral Pledged—Futures Contracts | 55 |
| Receivables for Investment Securities Sold | 2 |
| Receivables for Accrued Income | 272 |
| Receivables for Capital Shares Issued | 560 |
| Variation Margin Receivable—Futures Contracts | 27 |
| Total Assets | 206,802 |
| Liabilities | |
| Due to Custodian | 2 |
| Payables for Investment Securities Purchased | 678 |
| Collateral for Securities on Loan | 63 |
| Payables to Vanguard | 11 |
| Total Liabilities | 754 |
| Net Assets | 206,048 |
| 1 Includes $62 of securities on loan. | |
| At November 30, 2022, net assets consisted of: | |
| Paid-in Capital | 206,074 |
| Total Distributable Earnings (Loss) | (26) |
| Net Assets | 206,048 |
| Net Assets | |
| Applicable to 1,840,000 outstanding $.001 par value shares of beneficial interest (unlimited authorization) | 206,048 |
| Net Asset Value Per Share | $111.98 |
| Year Ended November 30, 2022 | |
| ($000) | |
| Investment Income | |
| Income | |
| Dividends1 | 2,884 |
| Interest2 | 9 |
| Securities Lending—Net | 9 |
| Total Income | 2,902 |
| Expenses | |
| The Vanguard Group—Note B | |
| Investment Advisory Services | 116 |
| Management and Administrative | 40 |
| Marketing and Distribution | 10 |
| Custodian Fees | 3 |
| Auditing Fees | 28 |
| Shareholders’ Reports | 28 |
| Trustees’ Fees and Expenses | — |
| Professional Services | 16 |
| Total Expenses | 241 |
| Net Investment Income | 2,661 |
| Realized Net Gain (Loss) | |
| Investment Securities Sold2,3 | (6,444) |
| Futures Contracts | (101) |
| Realized Net Gain (Loss) | (6,545) |
| Change in Unrealized Appreciation (Depreciation) | |
| Investment Securities2 | (9,124) |
| Futures Contracts | 46 |
| Change in Unrealized Appreciation (Depreciation) | (9,078) |
| Net Increase (Decrease) in Net Assets Resulting from Operations | (12,962) |
| 1 | Dividends are net of foreign withholding taxes of $4,000. |
| 2 | Interest income, realized net gain (loss), capital gain distributions received, and change in unrealized appreciation (depreciation) from an affiliated company of the fund were $9,000, less than $1,000, less than $1,000, and less than $1,000, respectively. Purchases and sales are for temporary cash investment purposes. |
| 3 | Includes $11,684,000 of net gain (loss) resulting from in-kind redemptions. |
| Year Ended November 30, | ||
| 2022 ($000) | 2021 ($000) | |
| Increase (Decrease) in Net Assets | ||
| Operations | ||
| Net Investment Income | 2,661 | 1,098 |
| Realized Net Gain (Loss) | (6,545) | 2,545 |
| Change in Unrealized Appreciation (Depreciation) | (9,078) | 14,521 |
| Net Increase (Decrease) in Net Assets Resulting from Operations | (12,962) | 18,164 |
| Distributions | ||
| Total Distributions | (2,385) | (932) |
| Capital Share Transactions | ||
| Issued | 108,666 | 74,754 |
| Issued in Lieu of Cash Distributions | — | — |
| Redeemed | (30,853) | (2,908) |
| Net Increase (Decrease) from Capital Share Transactions | 77,813 | 71,846 |
| Total Increase (Decrease) | 62,466 | 89,078 |
| Net Assets | ||
| Beginning of Period | 143,582 | 54,504 |
| End of Period | 206,048 | 143,582 |
| For a Share Outstanding Throughout Each Period | Year Ended November 30, | February 13, 20181 to November 30, 2018 | |||
| 2022 | 2021 | 2020 | 2019 | ||
| Net Asset Value, Beginning of Period | $122.20 | $94.79 | $84.21 | $78.58 | $75.00 |
| Investment Operations | |||||
| Net Investment Income2 | 1.562 | 1.403 | 1.291 | 1.199 | .899 |
| Net Realized and Unrealized Gain (Loss) on Investments | (10.356) | 27.292 | 10.428 | 5.559 | 3.266 |
| Total from Investment Operations | (8.794) | 28.695 | 11.719 | 6.758 | 4.165 |
| Distributions | |||||
| Dividends from Net Investment Income | (1.426) | (1.285) | (1.139) | (1.128) | (.585) |
| Distributions from Realized Capital Gains | — | — | — | — | — |
| Total Distributions | (1.426) | (1.285) | (1.139) | (1.128) | (.585) |
| Net Asset Value, End of Period | $111.98 | $122.20 | $94.79 | $84.21 | $78.58 |
| Total Return | -7.15% | 30.42% | 14.29% | 8.75% | 5.52% |
| Ratios/Supplemental Data | |||||
| Net Assets, End of Period (Millions) | $206 | $144 | $55 | $21 | $18 |
| Ratio of Total Expenses to Average Net Assets | 0.13% | 0.13% | 0.13% | 0.13% | 0.13%3,4 |
| Ratio of Net Investment Income to Average Net Assets | 1.43% | 1.21% | 1.59% | 1.52% | 1.40%3 |
| Portfolio Turnover Rate | 49%5 | 56%5 | 58% | 80% | 25% |
| 1 | Inception. |
| 2 | Calculated based on average shares outstanding. |
| 3 | Annualized. |
| 4 | The ratio of total expenses to average net assets before an expense reduction of 0.04% was 0.17%. The fund incurred higher than anticipated expenses, in which Vanguard voluntarily agreed to assume payment of certain expenses. The fund is not obligated to repay this amount to Vanguard. |
| 5 | Excludes the value of portfolio securities received or delivered as a result of in-kind purchases or redemptions of the fund’s capital shares, including ETF Creation Units. |
| A. | The following significant accounting policies conform to generally accepted accounting principles for U.S. investment companies. The fund consistently follows such policies in preparing its financial statements. |
| B. | In accordance with the terms of a Funds' Service Agreement (the “FSA”) between Vanguard and the fund, Vanguard furnishes to the fund investment advisory, corporate management, administrative, marketing, and distribution services at Vanguard’s cost of operations (as defined by the FSA). These costs of operations are allocated to the fund based on methods and guidelines approved by the board of trustees and are generally settled twice a month. |
| C. | Various inputs may be used to determine the value of the fund’s investments and derivatives. These inputs are summarized in three broad levels for financial statement purposes. The inputs or methodologies used to value securities are not necessarily an indication of the risk associated with investing in those securities. |
| Level 1 ($000) | Level 2 ($000) | Level 3 ($000) | Total ($000) | |
| Investments | ||||
| Assets | ||||
| Common Stocks | 204,981 | — | — | 204,981 |
| Temporary Cash Investments | 897 | — | — | 897 |
| Total | 205,878 | — | — | 205,878 |
| Derivative Financial Instruments | ||||
| Assets | ||||
| Futures Contracts1 | 45 | — | — | 45 |
| 1 | Includes cumulative appreciation (depreciation) on futures contracts and centrally cleared swaps, if any, as reported in the Schedule of Investments. Only current day’s variation margin is reported within the Statement of Assets and Liabilities. |
| D. | Permanent differences between book-basis and tax-basis components of net assets are reclassified among capital accounts in the financial statements to reflect their tax character. These reclassifications have no effect on net assets or net asset value per share. As of period end, permanent differences primarily attributable to the accounting for applicable in-kind redemptions were reclassified between the following accounts: |
| Amount ($000) | |
| Paid-in Capital | 11,685 |
| Total Distributable Earnings (Loss) | (11,685) |
| Amount ($000) | |
| Undistributed Ordinary Income | 602 |
| Undistributed Long-Term Gains | — |
| Capital Loss Carryforwards | (18,464) |
| Qualified Late-Year Losses | — |
| Net Unrealized Gains (Losses) | 17,836 |
| Year Ended November 30, | ||
| 2022 Amount ($000) | 2021 Amount ($000) | |
| Ordinary Income* | 2,385 | 932 |
| Long-Term Capital Gains | — | — |
| Total | 2,385 | 932 |
| * | Includes short-term capital gains, if any. |
| Amount ($000) | |
| Tax Cost | 188,042 |
| Gross Unrealized Appreciation | 25,949 |
| Gross Unrealized Depreciation | (8,113) |
| Net Unrealized Appreciation (Depreciation) | 17,836 |
| E. | During the year ended November 30, 2022, the fund purchased $198,457,000 of investment securities and sold $120,863,000 of investment securities, other than temporary cash investments. Purchases and sales include $0 and $30,778,000, respectively, in connection with in-kind purchases and redemptions of the fund's capital shares. |
| F. | Capital shares issued and redeemed were: |
| Year Ended November 30, | ||
| 2022 Shares (000) | 2021 Shares (000) | |
| Issued | 950 | 625 |
| Issued in Lieu of Cash Distributions | — | — |
| Redeemed | (285) | (25) |
| Net Increase (Decrease) in Shares Outstanding | 665 | 600 |
| G. | Management has determined that no events or transactions occurred subsequent to November 30, 2022, that would require recognition or disclosure in these financial statements. |

| Average Annual Total Returns Periods Ended November 30, 2022 | ||||
| One Year | Since Inception (2/13/2018) | Final Value of a $10,000 Investment | ||
|
| U.S. Value Factor ETF Net Asset Value | 7.63% | 9.52% | $15,464 |
| U.S. Value Factor ETF Market Price | 7.54 | 9.50 | 15,455 | |
|
| Russell 3000 Index | -10.80 | 10.69 | 16,272 |
| One Year | Since Inception (2/13/2018) | |
| U.S. Value Factor ETF Market Price | 7.54% | 54.55% |
| U.S. Value Factor ETF Net Asset Value | 7.63 | 54.64 |
| Russell 3000 Index | -10.80 | 62.72 |
| Basic Materials | 6.9% |
| Consumer Discretionary | 16.4 |
| Consumer Staples | 4.9 |
| Energy | 11.7 |
| Financials | 22.9 |
| Health Care | 7.9 |
| Industrials | 15.3 |
| Real Estate | 0.5 |
| Technology | 8.4 |
| Telecommunications | 5.1 |
| Utilities | 0.0 |
| Futures Contracts | ||||
| ($000) | ||||
| Expiration | Number of Long (Short) Contracts | Notional Amount | Value and Unrealized Appreciation (Depreciation) | |
| Long Futures Contracts | ||||
| E-mini S&P 500 Index | December 2022 | 11 | 2,245 | 19 |
| Micro E-mini S&P 500 Index | December 2022 | 16 | 327 | (4) |
| 15 | ||||
| ($000s, except shares and per-share amounts) | Amount |
| Assets | |
| Investments in Securities, at Value1 | |
| Unaffiliated Issuers (Cost $608,370) | 667,799 |
| Affiliated Issuers (Cost $1,770) | 1,770 |
| Total Investments in Securities | 669,569 |
| Investment in Vanguard | 26 |
| Cash | 1 |
| Cash Collateral Pledged—Futures Contracts | 138 |
| Receivables for Accrued Income | 1,355 |
| Variation Margin Receivable—Futures Contracts | 75 |
| Total Assets | 671,164 |
| Liabilities | |
| Due to Custodian | 1 |
| Payables for Investment Securities Purchased | 342 |
| Collateral for Securities on Loan | 70 |
| Payables for Capital Shares Redeemed | 34 |
| Payables to Vanguard | 36 |
| Total Liabilities | 483 |
| Net Assets | 670,681 |
| 1 Includes $67 of securities on loan. | |
| At November 30, 2022, net assets consisted of: | |
| Paid-in Capital | 668,561 |
| Total Distributable Earnings (Loss) | 2,120 |
| Net Assets | 670,681 |
| Net Assets | |
| Applicable to 6,375,000 outstanding $.001 par value shares of beneficial interest (unlimited authorization) | 670,681 |
| Net Asset Value Per Share | $105.20 |
| Year Ended November 30, 2022 | |
| ($000) | |
| Investment Income | |
| Income | |
| Dividends1 | 14,735 |
| Interest2 | 33 |
| Securities Lending—Net | 39 |
| Total Income | 14,807 |
| Expenses | |
| The Vanguard Group—Note B | |
| Investment Advisory Services | 349 |
| Management and Administrative | 340 |
| Marketing and Distribution | 34 |
| Custodian Fees | 1 |
| Auditing Fees | 28 |
| Shareholders’ Reports | 51 |
| Trustees’ Fees and Expenses | — |
| Other Expenses | 17 |
| Total Expenses | 820 |
| Expenses Paid Indirectly | (1) |
| Net Expenses | 819 |
| Net Investment Income | 13,988 |
| Realized Net Gain (Loss) | |
| Investment Securities Sold2,3 | 29,984 |
| Futures Contracts | (116) |
| Realized Net Gain (Loss) | 29,868 |
| Change in Unrealized Appreciation (Depreciation) | |
| Investment Securities2 | (11,692) |
| Futures Contracts | (34) |
| Change in Unrealized Appreciation (Depreciation) | (11,726) |
| Net Increase (Decrease) in Net Assets Resulting from Operations | 32,130 |
| 1 | Dividends are net of foreign withholding taxes of $6,000. |
| 2 | Interest income, realized net gain (loss), capital gain distributions received, and change in unrealized appreciation (depreciation) from an affiliated company of the fund were $32,000, ($1,000), less than $1,000, and less than $1,000, respectively. Purchases and sales are for temporary cash investment purposes. |
| 3 | Includes $79,674,000 of net gain (loss) resulting from in-kind redemptions. |
| Year Ended November 30, | ||
| 2022 ($000) | 2021 ($000) | |
| Increase (Decrease) in Net Assets | ||
| Operations | ||
| Net Investment Income | 13,988 | 6,528 |
| Realized Net Gain (Loss) | 29,868 | 7,659 |
| Change in Unrealized Appreciation (Depreciation) | (11,726) | 52,714 |
| Net Increase (Decrease) in Net Assets Resulting from Operations | 32,130 | 66,901 |
| Distributions | ||
| Total Distributions | (12,731) | (5,430) |
| Capital Share Transactions | ||
| Issued | 413,815 | 273,133 |
| Issued in Lieu of Cash Distributions | — | — |
| Redeemed | (210,797) | (19,466) |
| Net Increase (Decrease) from Capital Share Transactions | 203,018 | 253,667 |
| Total Increase (Decrease) | 222,417 | 315,138 |
| Net Assets | ||
| Beginning of Period | 448,264 | 133,126 |
| End of Period | 670,681 | 448,264 |
| For a Share Outstanding Throughout Each Period | Year Ended November 30, | February 13, 20181 to November 30, 2018 | |||
| 2022 | 2021 | 2020 | 2019 | ||
| Net Asset Value, Beginning of Period | $99.84 | $73.96 | $75.51 | $74.35 | $75.00 |
| Investment Operations | |||||
| Net Investment Income2 | 2.220 | 1.923 | 1.689 | 1.671 | 1.276 |
| Net Realized and Unrealized Gain (Loss) on Investments | 5.212 | 25.644 | (1.634) | 1.053 | (1.295) |
| Total from Investment Operations | 7.432 | 27.567 | .055 | 2.724 | (.019) |
| Distributions | |||||
| Dividends from Net Investment Income | (2.072) | (1.687) | (1.605) | (1.564) | (.631) |
| Distributions from Realized Capital Gains | — | — | — | — | — |
| Total Distributions | (2.072) | (1.687) | (1.605) | (1.564) | (.631) |
| Net Asset Value, End of Period | $105.20 | $99.84 | $73.96 | $75.51 | $74.35 |
| Total Return | 7.63% | 37.51% | 0.70% | 3.83% | -0.08% |
| Ratios/Supplemental Data | |||||
| Net Assets, End of Period (Millions) | $671 | $448 | $133 | $81 | $37 |
| Ratio of Total Expenses to Average Net Assets | 0.13%3 | 0.13% | 0.14%3 | 0.14%3 | 0.13%4 |
| Ratio of Net Investment Income to Average Net Assets | 2.22% | 1.98% | 2.68% | 2.32% | 2.05%4 |
| Portfolio Turnover Rate | 64%5 | 43%5 | 52%5 | 73% | 16% |
| 1 | Inception. |
| 2 | Calculated based on average shares outstanding. |
| 3 | The ratio of expenses to average net assets for the period net of reduction from custody fee offset arrangements was 0.13%. |
| 4 | Annualized. |
| 5 | Excludes the value of portfolio securities received or delivered as a result of in-kind purchases or redemptions of the fund’s capital shares, including ETF Creation Units. |
| A. | The following significant accounting policies conform to generally accepted accounting principles for U.S. investment companies. The fund consistently follows such policies in preparing its financial statements. |
| B. | In accordance with the terms of a Funds' Service Agreement (the “FSA”) between Vanguard and the fund, Vanguard furnishes to the fund investment advisory, corporate management, administrative, marketing, and distribution services at Vanguard’s cost of operations (as defined by the FSA). These costs of operations are allocated to the fund based on methods and guidelines approved by the board of trustees and are generally settled twice a month. |
| C. | The fund’s custodian bank has agreed to reduce its fees when the fund maintains cash on deposit in the non-interest-bearing custody account. For the year ended November 30, 2022, custodian fee offset arrangements reduced the fund’s expenses by $1,000 (an annual rate of less than 0.01% of average net assets). |
| D. | Various inputs may be used to determine the value of the fund’s investments and derivatives. These inputs are summarized in three broad levels for financial statement purposes. The inputs or methodologies used to value securities are not necessarily an indication of the risk associated with investing in those securities. |
| E. | Permanent differences between book-basis and tax-basis components of net assets are reclassified among capital accounts in the financial statements to reflect their tax character. These |
| Amount ($000) | |
| Paid-in Capital | 79,675 |
| Total Distributable Earnings (Loss) | (79,675) |
| Amount ($000) | |
| Undistributed Ordinary Income | 3,065 |
| Undistributed Long-Term Gains | — |
| Capital Loss Carryforwards | (60,124) |
| Qualified Late-Year Losses | — |
| Net Unrealized Gains (Losses) | 59,179 |
| Year Ended November 30, | ||
| 2022 Amount ($000) | 2021 Amount ($000) | |
| Ordinary Income* | 12,731 | 5,430 |
| Long-Term Capital Gains | — | — |
| Total | 12,731 | 5,430 |
| * | Includes short-term capital gains, if any. |
| Amount ($000) | |
| Tax Cost | 610,390 |
| Gross Unrealized Appreciation | 84,048 |
| Gross Unrealized Depreciation | (24,869) |
| Net Unrealized Appreciation (Depreciation) | 59,179 |
| F. | During the year ended November 30, 2022, the fund purchased $801,611,000 of investment securities and sold $598,155,000 of investment securities, other than temporary cash investments. Purchases and sales include $0 and $200,862,000, respectively, in connection with in-kind purchases and redemptions of the fund's capital shares. |
| G. | Capital shares issued and redeemed were: |
| Year Ended November 30, | ||
| 2022 Shares (000) | 2021 Shares (000) | |
| Issued | 4,035 | 2,895 |
| Issued in Lieu of Cash Distributions | — | — |
| Redeemed | (2,150) | (205) |
| Net Increase (Decrease) in Shares Outstanding | 1,885 | 2,690 |
| H. | Management has determined that no events or transactions occurred subsequent to November 30, 2022, that would require recognition or disclosure in these financial statements. |
Philadelphia, Pennsylvania
January 19, 2023
| Fund | Percentage |
| U.S. Minimum Volatility ETF | 98.8% |
| U.S. Momentum Factor ETF | 97.3 |
| U.S. Multifactor ETF | 99.1 |
| U.S. Quality Factor ETF | 100.0 |
| U.S. Value Factor ETF | 95.7 |
| Fund | ($000) |
| U.S. Minimum Volatility ETF | 1,062 |
| U.S. Momentum Factor ETF | 3,256 |
| U.S. Multifactor ETF | 2,850 |
| U.S. Quality Factor ETF | 2,385 |
| U.S. Value Factor ETF | 12,731 |
| Fund | ($000) |
| U.S. Minimum Volatility ETF | 1 |
| U.S. Momentum Factor ETF | 5 |
| U.S. Multifactor ETF | 2 |
| U.S. Quality Factor ETF | 3 |
| U.S. Value Factor ETF | 11 |


Your Fund’s Performance at a Glance | 1 |
Advisor's Report | 2 |
About Your Fund’s Expenses | 4 |
Performance Summary | 6 |
Financial Statements | 8 |
| • | The 12 months ended November 30, 2022, were a volatile, challenging period for financial markets. Despite these headwinds, Vanguard U.S. Multifactor Fund returned 4.43% for the 12 months ended November 30, 2022. It outpaced its benchmark, the Russell 3000 Index, which returned –10.80%. |
| • | The economic backdrop deteriorated early on as inflation soared to multidecade highs, fueled in part by higher energy and food prices in the wake of Russia’s invasion of Ukraine. Then price increases broadened to other categories of goods and services. That prompted aggressive tightening by the Federal Reserve to bring inflation back in check, which increased fears of a recession. |
| • | Ten of the fund’s 11 industry sectors contributed positively to relative performance. Our positions in energy, information technology, and communication services drove much of the fund’s outperformance. Consumer discretionary, health care, and financials also produced strong results. |
| • | Utilities was the only sector that detracted. |
| Average Annual Total Returns Periods Ended November 30, 2022 | |||
| One Year | Three Years | Five Years | |
| Stocks | |||
| Russell 1000 Index (Large-caps) | -10.66% | 10.56% | 10.69% |
| Russell 2000 Index (Small-caps) | -13.01 | 6.44 | 5.45 |
| Russell 3000 Index (Broad U.S. market) | -10.80 | 10.28 | 10.33 |
| FTSE All-World ex US Index (International) | -11.40 | 2.23 | 1.86 |
| Bonds | |||
| Bloomberg U.S. Aggregate Float Adjusted Index (Broad taxable market) | -12.91% | -2.56% | 0.24% |
| Bloomberg Municipal Bond Index (Broad tax-exempt market) | -8.64 | -0.77 | 1.40 |
| FTSE Three-Month U.S. Treasury Bill Index | 1.16 | 0.64 | 1.19 |
| CPI | |||
| Consumer Price Index | 7.11% | 5.00% | 3.83% |
| • | Based on actual fund return. This section helps you to estimate the actual expenses that you paid over the period. The ”Ending Account Value“ shown is derived from the fund‘s actual return, and the third column shows the dollar amount that would have been paid by an investor who started with $1,000 in the fund. You may use the information here, together with the amount you invested, to estimate the expenses that you paid over the period. |
| • | Based on hypothetical 5% yearly return. This section is intended to help you compare your fund‘s costs with those of other mutual funds. It assumes that the fund had a yearly return of 5% before expenses, but that the expense ratio is unchanged. In this case—because the return used is not the fund’s actual return—the results do not apply to your investment. The example is useful in making comparisons because the Securities and Exchange Commission requires all mutual funds to calculate expenses based on a 5% return. You can assess your fund’s costs by comparing this hypothetical example with the hypothetical examples that appear in shareholder reports of other funds. |
| Six Months Ended November 30, 2022 | |||
| U.S. Multifactor Fund | Beginning Account Value 5/31/2022 | Ending Account Value 11/30/2022 | Expenses Paid During Period |
| Based on Actual Fund Return | $1,000.00 | $1,049.00 | $0.92 |
| Based on Hypothetical 5% Yearly Return | 1,000.00 | 1,024.17 | 0.91 |

| Average Annual Total Returns Periods Ended November 30, 2022 | ||||
| One Year | Since Inception (2/15/2018) | Final Value of a $50,000 Investment | ||

| U.S. Multifactor Fund | 4.43% | 8.22% | $72,989 |

| Russell 3000 Index | -10.80 | 10.10 | 79,255 |
| Basic Materials | 4.6% |
| Consumer Discretionary | 13.8 |
| Consumer Staples | 8.1 |
| Energy | 18.6 |
| Financials | 18.2 |
| Health Care | 14.3 |
| Industrials | 13.5 |
| Real Estate | 0.3 |
| Technology | 7.9 |
| Telecommunications | 0.6 |
| Utilities | 0.1 |
| Futures Contracts | ||||
| ($000) | ||||
| Expiration | Number of Long (Short) Contracts | Notional Amount | Value and Unrealized Appreciation (Depreciation) | |
| Long Futures Contracts | ||||
| Micro E-mini S&P 500 Index | December 2022 | 53 | 1,082 | 52 |
| ($000s, except shares and per-share amounts) | Amount |
| Assets | |
| Investments in Securities, at Value1 | |
| Unaffiliated Issuers (Cost $51,685) | 65,664 |
| Affiliated Issuers (Cost $1,416) | 1,416 |
| Total Investments in Securities | 67,080 |
| Investment in Vanguard | 2 |
| Cash Collateral Pledged—Futures Contracts | 58 |
| Receivables for Investment Securities Sold | 2 |
| Receivables for Accrued Income | 130 |
| Receivables for Capital Shares Issued | 300 |
| Variation Margin Receivable—Futures Contracts | 29 |
| Total Assets | 67,601 |
| Liabilities | |
| Due to Custodian | 2 |
| Payables for Investment Securities Purchased | 550 |
| Collateral for Securities on Loan | 167 |
| Payables for Capital Shares Redeemed | 68 |
| Payables to Vanguard | 5 |
| Total Liabilities | 792 |
| Net Assets | 66,809 |
| 1 Includes $163 of securities on loan. | |
| At November 30, 2022, net assets consisted of: | |
| Paid-in Capital | 58,153 |
| Total Distributable Earnings (Loss) | 8,656 |
| Net Assets | 66,809 |
| Net Assets | |
| Applicable to 1,979,456 outstanding $.001 par value shares of beneficial interest (unlimited authorization) | 66,809 |
| Net Asset Value Per Share | $33.75 |
| Year Ended November 30, 2022 | |
| ($000) | |
| Investment Income | |
| Income | |
| Dividends1 | 1,197 |
| Interest2 | 12 |
| Securities Lending—Net | — |
| Total Income | 1,209 |
| Expenses | |
| The Vanguard Group—Note B | |
| Investment Advisory Services | — |
| Management and Administrative | 23 |
| Marketing and Distribution | — |
| Custodian Fees | 4 |
| Auditing Fees | 28 |
| Shareholders’ Reports | 23 |
| Trustees’ Fees and Expenses | — |
| Professional Services | 16 |
| Total Expenses | 94 |
| Net Investment Income | 1,115 |
| Realized Net Gain (Loss) | |
| Investment Securities Sold2 | (2,978) |
| Futures Contracts | (159) |
| Realized Net Gain (Loss) | (3,137) |
| Change in Unrealized Appreciation (Depreciation) | |
| Investment Securities2 | 4,704 |
| Futures Contracts | 65 |
| Change in Unrealized Appreciation (Depreciation) | 4,769 |
| Net Increase (Decrease) in Net Assets Resulting from Operations | 2,747 |
| 1 | Dividends are net of foreign withholding taxes of $1,000. |
| 2 | Interest income, realized net gain (loss), capital gain distributions received, and change in unrealized appreciation (depreciation) from an affiliated company of the fund were $12,000, less than $1,000, less than $1,000, and $1,000, respectively. Purchases and sales are for temporary cash investment purposes. |
| Year Ended November 30, | ||
| 2022 ($000) | 2021 ($000) | |
| Increase (Decrease) in Net Assets | ||
| Operations | ||
| Net Investment Income | 1,115 | 571 |
| Realized Net Gain (Loss) | (3,137) | 3,018 |
| Change in Unrealized Appreciation (Depreciation) | 4,769 | 4,974 |
| Net Increase (Decrease) in Net Assets Resulting from Operations | 2,747 | 8,563 |
| Distributions | ||
| Total Distributions | (1,031) | (509) |
| Capital Share Transactions | ||
| Issued | 33,547 | 30,399 |
| Issued in Lieu of Cash Distributions | 854 | 417 |
| Redeemed | (17,244) | (17,122) |
| Net Increase (Decrease) from Capital Share Transactions | 17,157 | 13,694 |
| Total Increase (Decrease) | 18,873 | 21,748 |
| Net Assets | ||
| Beginning of Period | 47,936 | 26,188 |
| End of Period | 66,809 | 47,936 |
| For a Share Outstanding Throughout Each Period | Year Ended November 30, | February 15, 20181 to November 30, 2018 | |||
| 2022 | 2021 | 2020 | 2019 | ||
| Net Asset Value, Beginning of Period | $32.99 | $25.47 | $25.70 | $24.53 | $25.00 |
| Investment Operations | |||||
| Net Investment Income2 | .680 | .466 | .382 | .425 | .333 |
| Net Realized and Unrealized Gain (Loss) on Investments | .725 | 7.485 | (.214) | 1.143 | (.598) |
| Total from Investment Operations | 1.405 | 7.951 | .168 | 1.568 | (.265) |
| Distributions | |||||
| Dividends from Net Investment Income | (.645) | (.431) | (.398) | (.398) | (.205) |
| Distributions from Realized Capital Gains | — | — | — | — | — |
| Total Distributions | (.645) | (.431) | (.398) | (.398) | (.205) |
| Net Asset Value, End of Period | $33.75 | $32.99 | $25.47 | $25.70 | $24.53 |
| Total Return3 | 4.43% | 31.39% | 0.97% | 6.54% | -1.11% |
| Ratios/Supplemental Data | |||||
| Net Assets, End of Period (Millions) | $67 | $48 | $26 | $33 | $36 |
| Ratio of Total Expenses to Average Net Assets | 0.18% | 0.18% | 0.18% | 0.18% | 0.18%4 |
| Ratio of Net Investment Income to Average Net Assets | 2.13% | 1.48% | 1.66% | 1.76% | 1.64%4 |
| Portfolio Turnover Rate | 55% | 62% | 74% | 96% | 58% |
| 1 | Inception. |
| 2 | Calculated based on average shares outstanding. |
| 3 | Total returns do not include transaction or account service fees that may have applied in the periods shown. Fund prospectuses provide information about any applicable transaction and account service fees. |
| 4 | Annualized. |
| A. | The following significant accounting policies conform to generally accepted accounting principles for U.S. investment companies. The fund consistently follows such policies in preparing its financial statements. |
| B. | In accordance with the terms of a Funds' Service Agreement (the “FSA”) between Vanguard and the fund, Vanguard furnishes to the fund investment advisory, corporate management, administrative, marketing, and distribution services at Vanguard’s cost of operations (as defined by the FSA). These costs of operations are allocated to the fund based on methods and guidelines approved by the board of trustees and are generally settled twice a month. |
| C. | Various inputs may be used to determine the value of the fund’s investments and derivatives. These inputs are summarized in three broad levels for financial statement purposes. The inputs or methodologies used to value securities are not necessarily an indication of the risk associated with investing in those securities. |
| D. | Permanent differences between book-basis and tax-basis components of net assets, if any, are reclassified among capital accounts in the financial statements to reflect their tax character. These reclassifications have no effect on net assets or net asset value per share. |
| Amount ($000) | |
| Undistributed Ordinary Income | 249 |
| Undistributed Long-Term Gains | — |
| Capital Loss Carryforwards | (5,572) |
| Qualified Late-Year Losses | — |
| Net Unrealized Gains (Losses) | 13,979 |
| Year Ended November 30, | ||
| 2022 Amount ($000) | 2021 Amount ($000) | |
| Ordinary Income* | 1,031 | 509 |
| Long-Term Capital Gains | — | — |
| Total | 1,031 | 509 |
| * | Includes short-term capital gains, if any. |
| Amount ($000) | |
| Tax Cost | 53,101 |
| Gross Unrealized Appreciation | 14,636 |
| Gross Unrealized Depreciation | (657) |
| Net Unrealized Appreciation (Depreciation) | 13,979 |
| E. | During the year ended November 30, 2022, the fund purchased $45,105,000 of investment securities and sold $28,500,000 of investment securities, other than temporary cash investments. |
| F. | Capital shares issued and redeemed were: |
| Year Ended November 30, | ||
| 2022 Shares (000) | 2021 Shares (000) | |
| Issued | 1,038 | 960 |
| Issued in Lieu of Cash Distributions | 27 | 14 |
| Redeemed | (539) | (549) |
| Net Increase (Decrease) in Shares Outstanding | 526 | 425 |
| G. | Management has determined that no events or transactions occurred subsequent to November 30, 2022, that would require recognition or disclosure in these financial statements. |
Philadelphia, Pennsylvania
January 19, 2023

Item 2: Code of Ethics.
The Registrant has adopted a code of ethics that applies to the Registrant’s principal executive officer, principal financial officer, principal accounting officer or controller or persons performing similar functions. The Code of Ethics was amended during the reporting period covered by this report to make certain technical, non-material changes.
Item 3: Audit Committee Financial Expert.
All members of the Audit Committee have been determined by the Registrant’s Board of Trustees to be Audit Committee Financial Experts and to be independent: F. Joseph Loughrey, Mark Loughridge, Sarah Bloom Raskin, and Peter F. Volanakis.
Item 4: Principal Accountant Fees and Services.
(a) Audit Fees.
Audit Fees of the Registrant.
Fiscal Year
Ended November 30, 2022: $250,000
Fiscal Year Ended November 30, 2021: $250,000
Aggregate Audit Fees of Registered Investment Companies in the Vanguard Group.
Fiscal Year
Ended November 30, 2022: $10,494,508
Fiscal Year Ended November 30, 2021: $11,244,694
Includes fees billed in connection with audits of the Registrant, other registered investment companies in the Vanguard complex, The Vanguard Group, Inc., and Vanguard Marketing Corporation.
(b) Audit-Related Fees.
Fiscal Year
Ended November 30, 2022: $2,757,764
Fiscal Year Ended November 30, 2021: $2,955,181
Includes fees billed in connection with assurance and related services provided to the Registrant, other registered investment companies in the Vanguard complex, The Vanguard Group, Inc., and Vanguard Marketing Corporation.
(c) Tax Fees.
Fiscal Year
Ended November 30, 2022: $5,202,689
Fiscal Year Ended November 30, 2021: $2,047,574
Includes fees billed in connection with tax compliance, planning, and advice services provided to the Registrant, other registered investment companies in the Vanguard complex, The Vanguard Group, Inc., and Vanguard Marketing Corporation.
(d) All Other Fees.
Fiscal Year
Ended November 30, 2022: $298,000
Fiscal Year Ended November 30, 2021: $280,000
Includes fees billed for services related to tax reported information provided to the Registrant, other registered investment companies in the Vanguard complex, The Vanguard Group, Inc., and Vanguard Marketing Corporation.
(e) (1) Pre-Approval Policies. The policy of the Registrant’s Audit Committee is to consider, and, if appropriate, approve before the principal accountant is engaged for such services, all specific audit and non-audit services provided to: the Registrant, other registered investment companies in the Vanguard complex, The Vanguard Group, Inc., and entities controlled by The Vanguard Group, Inc. that provide ongoing services to the Registrant. In making a determination, the Audit Committee considers whether the services are consistent with maintaining the principal accountant’s independence.
In the event of a contingency situation in which the principal accountant is needed to provide services in between scheduled Audit Committee meetings, the Chairman of the Audit Committee would be called on to consider and, if appropriate, pre-approve audit or permitted non-audit services in an amount sufficient to complete services through the next Audit Committee meeting, and to determine if such services would be consistent with maintaining the accountant’s independence. At the next scheduled Audit Committee meeting, services and fees would be presented to the Audit Committee for formal consideration, and, if appropriate, approval by the entire Audit Committee. The Audit Committee would again consider whether such services and fees are consistent with maintaining the principal accountant’s independence.
The Registrant’s Audit Committee is informed at least annually of all audit and non-audit services provided by the principal accountant to the Vanguard complex, whether such services are provided to: the Registrant, other registered investment companies in the Vanguard complex, The Vanguard Group, Inc., or other entities controlled by The Vanguard Group, Inc. that provide ongoing services to the Registrant.
(2) No percentage of the principal accountant’s fees or services were approved pursuant to the waiver provision of paragraph (c)(7)(i)(C) of Rule 2-01 of Regulation S-X.
(f) For the most recent fiscal year, over 50% of the hours worked under the principal accountant’s engagement were not performed by persons other than full-time, permanent employees of the principal accountant.
(g) Aggregate Non-Audit Fees.
Fiscal Year
Ended November 30, 2022: $5,500,689
Fiscal Year Ended November 30, 2021: $2,327,574
Includes fees billed for non-audit services provided to the Registrant, other registered investment companies in the Vanguard complex, The Vanguard Group, Inc., and Vanguard Marketing Corporation.
(h) For the most recent fiscal year, the Audit Committee has determined that the provision of all non-audit services was consistent with maintaining the principal accountant’s independence.
Item 5: Audit Committee of Listed Registrants.
The Registrant is a listed issuer as defined in rule 10A-3 under the Securities Exchange Act of 1934 (“Exchange Act”). The Registrant has a separately-designated standing audit committee established in accordance with Section 3(a)(58)(A) of the Exchange Act. The Registrant’s audit committee members are: F. Joseph Loughrey, Mark Loughridge, Sarah Bloom Raskin, and Peter F. Volanakis.
Item 6: Investments.
Not applicable. The complete schedule of investments is included as part of the report to shareholders filed under Item 1 of this Form.
Item 7: Disclosure of Proxy Voting Policies and Procedures for Closed-End Management Investment Companies.
Not applicable.
Item 8: Portfolio Managers of Closed-End Management Investment Companies.
Not applicable.
Item 9: Purchase of Equity Securities by Closed-End Management Investment Company and Affiliated Purchasers.
Not applicable.
Item 10: Submission of Matters to a Vote of Security Holders.
Not applicable.
Item 11: Controls and Procedures.
(a) Disclosure Controls and Procedures. The Principal Executive and Financial Officers concluded that the Registrant’s Disclosure Controls and Procedures are effective based on their evaluation of the Disclosure Controls and Procedures as of a date within 90 days of the filing date of this report.
(b) Internal Control Over Financial Reporting. There were no significant changes in the Registrant’s Internal Control Over Financial Reporting or in other factors that could significantly affect this control subsequent to the date of the evaluation, including any corrective actions with regard to significant deficiencies and material weaknesses.
Item 12: Disclosure of Securities Lending Activities for Closed-End Management Investment Companies.
Not applicable.
Item 13: Exhibits.
| (a)(1) | Code of Ethics filed herewith. |
| (a)(2) | Certifications filed herewith. |
| (b) | Certifications filed herewith. |
Pursuant to the requirements of the Securities Exchange Act of 1934 and the Investment Company Act of 1940, the registrant has duly caused this report to be signed on its behalf by the undersigned, thereunto duly authorized.
| VANGUARD WELLINGTON FUND | ||
| BY: | /s/ MORTIMER J. BUCKLEY* | |
| MORTIMER J. BUCKLEY | ||
| CHIEF EXECUTIVE OFFICER | ||
Date: January 23, 2023
Pursuant to the requirements of the Securities Exchange Act of 1934 and the Investment Company Act of 1940, this report has been signed below by the following persons on behalf of the registrant and in the capacities and on the dates indicated.
| VANGUARD WELLINGTON FUND | ||
| BY: | /s/ MORTIMER J. BUCKLEY* | |
| MORTIMER J. BUCKLEY | ||
| CHIEF EXECUTIVE OFFICER | ||
Date: January 23, 2023
| VANGUARD WELLINGTON FUND | ||
| BY: | /s/ CHRISTINE BUCHANAN* | |
| CHRISTINE BUCHANAN | ||
| CHIEF FINANCIAL OFFICER | ||
Date: January 23, 2023
| * By: | /s/ Anne E. Robinson |
Anne E. Robinson, pursuant to a Power of Attorney filed on October 11, 2022 (see File Number 333-11763), Incorporated by Reference.