UNITED STATES
SECURITIES AND EXCHANGE COMMISSION
Washington, D.C. 20549
FORM N-CSR
CERTIFIED SHAREHOLDER REPORT
OF
REGISTERED MANAGEMENT INVESTMENT COMPANIES
Investment Company Act file number: 811-00121
| Name of Registrant: | Vanguard Wellington Fund |
| Address of Registrant: | P.O. Box 2600 |
| Valley Forge, PA 19482 |
| Name and address of agent for service: | Anne E. Robinson, Esquire |
| P.O. Box 876 | |
| Valley Forge, PA 19482 |
Registrant’s telephone number, including area code: (610) 669-1000
Date of fiscal year end: November 30
Date of reporting period: December 1, 2019—November 30, 2020
Item 1: Reports to Shareholders

| Annual Report | November 30, 2020 | |
| Vanguard Wellington™ Fund | |
| Contents | |
| Your Fund’s Performance at a Glance | 1 |
| Advisor’s Report | 2 |
| About Your Fund’s Expenses | 7 |
| Performance Summary | 9 |
| Financial Statements | 11 |
| Trustees Approve Advisory Arrangement | 34 |
Please note: The opinions expressed in this report are just that—informed opinions. They should not be considered promises or advice. Also, please keep in mind that the information and opinions cover the period through the date on the front of this report. Of course, the risks of investing in your fund are spelled out in the prospectus.
Your Fund’s Performance at a Glance
• For the 12 months ended November 30, 2020, Vanguard Wellington Fund returned 10.50% for Admiral Shares and 10.41% for Investor Shares. It lagged the 15.11% return of its benchmark index, a 65% stocks / 35% bonds composite measure that reflects the fund’s target asset allocation.
• The 12 months were marked by the global spread of COVID-19 and efforts to contain it, including lockdowns, the shuttering of nonessential businesses, and travel restrictions. Responses from policymakers, the start of trials for vaccines and treatments, and the easing of some pandemic-related restrictions eventually lifted investor sentiment. Stock markets hit highs in November as news of possible vaccines buoyed investors. After an initial period of high volatility and low liquidity in the bond markets, yields fell and prices rose amid unprecedented actions taken by governments and central banks to blunt the virus’s economic impact.
• The stock portfolio underperformed the 17.46% return of its benchmark, the Standard & Poor’s 500 Index. Subpar stock selection in consumer discretionary, an underweight to information technology, and an overweight to financials hurt returns the most.
• The bond portfolio slightly outperformed its benchmark, the Bloomberg Barclays U.S. Credit A or Better Bond Index, which returned 9.20%. The portfolio benefited from security selection—particularly among industrial issuers—as well as an overweight to agency mortgage-backed securities and an underweight to credit risk.
| Market Barometer | |||
| Average Annual Total Returns | |||
| Periods Ended November 30, 2020 | |||
| One Year | Three Years | Five Years | |
| Stocks | |||
| Russell 1000 Index (Large-caps) | 19.41% | 13.66% | 14.23% |
| Russell 2000 Index (Small-caps) | 13.59 | 7.09 | 10.25 |
| Russell 3000 Index (Broad U.S. market) | 19.02 | 13.20 | 13.95 |
| FTSE All-World ex US Index (International) | 10.01 | 4.12 | 7.62 |
| Bonds | |||
| Bloomberg Barclays U.S. Aggregate Bond Index (Broad taxable market) | 7.28% | 5.45% | 4.34% |
| Bloomberg Barclays Municipal Bond Index (Broad tax-exempt market) | 4.89 | 4.80 | 3.93 |
| FTSE Three-Month U.S. Treasury Bill Index | 0.72 | 1.59 | 1.16 |
| CPI | |||
| Consumer Price Index | 1.17% | 1.80% | 1.86% |
1
Advisor’s Report
Vanguard Wellington Fund returned 10.41% for Investor Shares and 10.50% for Admiral Shares for the 12 months ended November 30, 2020. It lagged the 15.11% return of its benchmark, the Wellington Composite Index. The index is weighted 65% large-capitalization stocks (as measured by the Standard & Poor’s 500 Index) and 35% high-quality corporate bonds (as measured by the Bloomberg Barclays U.S. Credit A or Better Bond Index). The fund’s peer group—as defined by the Lipper Mixed-Asset Target Allocation Growth Funds—returned an average of 11.42%. The equity portfolio underperformed its benchmark, while the fixed income portfolio outperformed its benchmark.
Investment environment
U.S. stocks generally outperformed international stocks for the period, with the S&P 500, MSCI World, and MSCI EAFE Indexes returning 17.46%, 15.11%, and 6.83%, respectively.
The primary factors affecting the environment for equities during the period were the impacts from the COVID-19 pandemic, a declining interest rate environment, and the U.S. presidential election.
In March, COVID-19 spread globally, and affected countries were brought to an almost complete economic standstill. The pandemic’s impact was far-reaching and extended to businesses across almost all sectors, even those considered more stable or defensive. Businesses directly affected by the shutdown and those with higher leverage experienced outsized stock price impact early on. As the pandemic extended into the summer, high-growth stocks drove the market up from the lows of March, with many of these businesses benefiting from the digital shift in consumer behavior.
The declining interest rate environment has also affected equity returns. The Federal Reserve continued its supportive policy, cutting rates to near zero in March to help bolster the market. Exceptional fundamentals for many high-growth stocks were magnified by low interest rates. As a result, many high-growth technology companies, particularly in the mega-cap spectrum of the market, performed strongly.
The fourth quarter of 2020 has been marked by two significant events: the U.S. presidential election and COVID-19 vaccine developments. The market reacted positively to both events, with strong performance throughout the month of November. The high-growth dominance that marked much of 2020 began to subside as positive vaccine data led to optimism for a cyclical recovery.
Broad fixed income markets largely generated positive total returns over the period, driven by a significant decline in U.S. Treasury yields and the compression of credit spreads after the pandemic-driven widening earlier in 2020. Markets were driven mainly by the growth slowdown
2
caused by the COVID-19 pandemic and the unprecedented speed and magnitude of the resulting stimulus measures enacted by the Fed and the U.S. government.
The Bloomberg Barclays U.S. Aggregate Bond Index returned 7.28% for the period. The higher-quality credit market fared better, with the Bloomberg Barclays U.S. Credit A or Better Bond Index posting 9.20% for the period. The yield on the 10-year U.S. Treasury note fell, beginning the 12-month period at 1.78% and ending at 0.84%.
The fund’s shortfalls
In the stock portfolio, sector allocation and security selection detracted from relative performance. The portfolio’s overweighted position in financials was a significant headwind, as that sector underperformed, and its overweight to energy and under-weight to information technology held back returns as well.
Security selection in consumer discretionary, real estate, and consumer staples also hurt. Detractors included Bank of America, BP, Prudential Financial, and JPMorgan Chase. Stocks we did not hold or held in underweight positions that contributed negatively were Amazon, NVIDIA, and Apple.
On the fixed income side, an overweight to taxable municipal bonds detracted from relative returns within noncorporate credit as pandemic-related concerns weighed on this subsector. A modest out-of-benchmark allocation to asset-backed securities and commercial mortgage-backed securities also detracted slightly; these sectors came under pressure amid elevated market volatility and liquidity pressures, especially at the start of the pandemic. Duration/yield curve positioning moderately dampened performance, with an underweight to the front-end of the yield curve detracting notably, particularly in the earlier part of the period.
The fund’s successes
In the stock portfolio, strong selection within communication services, energy, and financials partially offset negative returns. Strong individual contributors to investment performance were positions held in Taiwan Semiconductor Manufacturing, BlackRock, Deere & Co., Eli Lilly, and Alphabet.
Not holding some stocks, including Wells Fargo and Boeing, also helped relative returns. An underweight to Exxon Mobil also contributed to overall performance.
On the fixed income side, most spread sectors recouped a large portion of their widening from early 2020; the segment made a dramatic recovery in response to policymakers’ unprecedented monetary and fiscal stimulus. Security selection within investment-grade corporates, particularly consumer noncyclicals and communications within industrials, drove much of the outperformance.
3
Security selection within financials and utilities also contributed. Within noncorporate credit, an underweight to supranational and local authority issuers, along with security selection within local agency and sovereign issuers, helped relative returns.
An out-of-benchmark allocation to agency mortgage-backed securities (MBS) pass-throughs helped as well. The spread-widening seen earlier in the period was later offset by strong technical support from the Fed’s asset purchases and strong demand for the asset class related to its yield advantages over Treasuries.
The fund’s positioning
Over the intermediate term, our outlook for equity markets remains balanced. The uncertainty surrounding the 2020 presidential election is largely behind us—and, with multiple vaccine trials releasing positive data, we can begin to conceive of a post-COVID economy. However, we appreciate the logistical challenges of vaccine production and distribution, and we recognize the economic uncertainty that still lies ahead.
At the portfolio level, we are enthusiastic about the prospects for many individual businesses. Large-cap financials Charles Schwab and JPMorgan Chase are showing strong underlying growth despite the challenging rate environment. Across sectors, businesses such as McDonald’s, HCA Healthcare, Facebook, Danaher, Blackstone Group, and Home Depot all have navigated the difficult conditions far better than expected.
Large pharmaceutical company Pfizer has been one of the leaders in developing a COVID-19 vaccine. Technology companies like Alphabet and Microsoft continue to achieve success across a range of businesses, product, and shareholders.
Over the course of the year, we initiated new positions in Facebook, Procter & Gamble, and Becton Dickinson. We believe Facebook has displayed excellent business resilience and has benefited from the accelerating shift to digital. The company is investing to extend their competitive advantage and still has a long runway for growth.
Procter & Gamble has an excellent management team, with solid market-share dynamics across key products that have continued to execute well. Nine out of ten of their product categories have grown organically despite the pandemic and its economic effects.
Becton Dickinson is a medical supply company that makes a wide range of everyday products that are essential to the delivery of health care. The company has a stable demand profile, with a dominant market share across most categories.
4
While the portfolio remains overweight in financials, we significantly reduced our positioning in the sector during the period. We did this by eliminating positions in several companies for which we had decreased confidence in their ability to create value at an attractive rate over time. The portfolio remains underweight in information technology, although we added to the sector during the year by buying competitively advantaged, growing businesses with strong management teams.
We remain committed to our investment philosophy and process to construct a portfolio of resilient businesses at reasonable valuations run by management teams that are likely to make value-enhancing decisions. Our goal is for the portfolio to deliver a superior rate of economic growth (earnings plus dividends) over the long term and downside protection during difficult economic and market environments.
On the fixed income side, we maintain a very modestly pro-cyclical risk posture. Our base case is for an improving economy and elevated volatility as the path of COVID-19 continues to develop. Recent economic data, however, indicates that the pace of this recovery may be slow and additional fiscal stimulus is uncertain.
Going forward, we will be focused on continued COVID-19 outbreaks and associated economic shutdowns; the potential for, and magnitude of, fiscal stimulus; policy changes that may occur during the Biden administration; and any changes from the current status quo driven by Congressional election outcomes.
The Fed’s purchase programs have been successful in restoring confidence and liquidity, and we generally expect that the central bank will continue to provide support in other ways following the cessation of most of these programs at year-end. We expect it to remain accommodative, pinning front-end rates while longer rates may respond to improvements in the economic outlook. Because of this, we have positioned the fund’s fixed income portion with a slightly short duration relative to the benchmark.
While valuations are near median levels and less compelling, credit markets remain the main investment focus of the portfolio as they continue to provide attractive income, and we will keep looking for opportunities within the sector. We are underweight corporate credit relative to the all-credit benchmark, with a bias toward defensive sectors with lower earnings volatility while also looking for opportunities to move up in credit quality. In terms of industries, the portfolio is overweight less cyclical sectors like communications and utilities while remaining cautious on more cyclical sectors such as energy. We maintain an overweight to taxable municipals, given their diversification benefit, still-strong underlying credit quality, and relatively attractive valuations.
5
We also maintain out-of-benchmark allocations to U.S. government bonds and agency MBS. The latter provides strong liquidity, and we believe they are well- supported by the Fed purchases, despite concerns around prepayment speeds. The portfolio holds an allocation to pass-throughs, focusing on low-coupon TBAs to maintain carry and liquidity, as well as CMOs and a modest allocation to delegated underwriting and servicing bonds for their stable cash flows.
The portfolio also holds out-of-benchmark allocations to high-quality securitized sectors, which remain protected from defaults. These include traditional asset-backed securities, collateralized loan obligations, commercial mortgage-backed securities, and non-agency residential mortgages.
Consistent with our practices, we hold adequate liquidity in the fixed income portion of the fund, notably government bonds and agency MBS as our “all-weather” liquidity buffer. This liquidity buffer should provide downside protection for shareholders if the economic cycle and/or the equity portfolio take an unfavorable turn.
We continue to be disciplined in our application of our investment process, which allows us to create a balanced portfolio that we believe should perform well in a variety of environments. We remain focused on long-term, low-turnover investing—features that we believe have served the fund’s shareholders well.
Loren L. Moran, CFA,
Senior Managing Director and
Fixed Income Portfolio Manager
Daniel J. Pozen
Senior Managing Director and
Equity Portfolio Manager
Michael E. Stack, CFA,
Senior Managing Director and
Fixed Income Portfolio Manager
Wellington Management Company LLP
December 17, 2020
6
About Your Fund’s Expenses
As a shareholder of the fund, you incur ongoing costs, which include costs for portfolio management, administrative services, and shareholder reports (like this one), among others. Operating expenses, which are deducted from a fund’s gross income, directly reduce the investment return of the fund.
A fund’s expenses are expressed as a percentage of its average net assets. This figure is known as the expense ratio. The following examples are intended to help you understand the ongoing costs (in dollars) of investing in your fund and to compare these costs with those of other mutual funds. The examples are based on an investment of $1,000 made at the beginning of the period shown and held for the entire period.
The accompanying table illustrates your fund’s costs in two ways:
• Based on actual fund return. This section helps you to estimate the actual expenses that you paid over the period. The “Ending Account Value” shown is derived from the fund’s actual return, and the third column shows the dollar amount that would have been paid by an investor who started with $1,000 in the fund. You may use the information here, together with the amount you invested, to estimate the expenses that you paid over the period.
To do so, simply divide your account value by $1,000 (for example, an $8,600 account value divided by $1,000 = 8.6), then multiply the result by the number given for your fund under the heading “Expenses Paid During Period.”
• Based on hypothetical 5% yearly return. This section is intended to help you compare your fund’s costs with those of other mutual funds. It assumes that the fund had a yearly return of 5% before expenses, but that the expense ratio is unchanged. In this case—because the return used is not the fund’s actual return—the results do not apply to your investment. The example is useful in making comparisons because the Securities and Exchange Commission requires all mutual funds to calculate expenses based on a 5% return. You can assess your fund’s costs by comparing this hypothetical example with the hypothetical examples that appear in shareholder reports of other funds.
Note that the expenses shown in the table are meant to highlight and help you compare ongoing costs only and do not reflect transaction costs incurred by the fund for buying and selling securities. Further, the expenses do not include any purchase, redemption, or account service fees described in the fund prospectus. If such fees were applied to your account, your costs would be higher. Your fund does not carry a “sales load.”
The calculations assume no shares were bought or sold during the period. Your actual costs may have been higher or lower, depending on the amount of your investment and the timing of any purchases or redemptions.
You can find more information about the fund’s expenses, including annual expense ratios, in the Financial Statements section of this report. For additional information on operating expenses and other shareholder costs, please refer to your fund’s current prospectus.
7
| Six Months Ended November 30, 2020 | |||
| Beginning | Ending | Expenses | |
| Account Value | Account Value | Paid During | |
| Wellington Fund | 5/31/2020 | 11/30/2020 | Period |
| Based on Actual Fund Return | |||
| Investor Shares | $1,000.00 | $1,130.75 | $1.23 |
| Admiral™ Shares | 1,000.00 | 1,131.21 | 0.80 |
| Based on Hypothetical 5% Yearly Return | |||
| Investor Shares | $1,000.00 | $1,023.85 | $1.16 |
| Admiral Shares | 1,000.00 | 1,024.25 | 0.76 |
The calculations are based on expenses incurred in the most recent six-month period. The fund’s annualized six-month expense ratios for that period are 0.23% for Investor Shares and 0.15% for Admiral Shares. The dollar amounts shown as “Expenses Paid” are equal to the annualized expense ratio multiplied by the average account value over the period, multiplied by the number of days in the most recent six-month period, then divided by the number of days in the most recent 12-month period (183/366).
8
Wellington Fund
Performance Summary
All of the returns in this report represent past performance, which is not a guarantee of future results that may be achieved by the fund. (Current performance may be lower or higher than the performance data cited. For performance data current to the most recent month-end, visit our website at vanguard.com/performance.) Note, too, that both investment returns and principal value can fluctuate widely, so an investor’s shares, when sold, could be worth more or less than their original cost. The returns shown do not reflect taxes that a shareholder would pay on fund distributions or on the sale of fund shares.
Cumulative Performance: November 30, 2010, Through November 30, 2020
Initial Investment of $10,000

| Average Annual Total Returns | |||||
| Periods Ended November 30, 2020 | |||||
| Final Value | |||||
| One | Five | Ten | of a $10,000 | ||
| Year | Years | Years | Investment | ||
 |
Wellington Fund Investor Shares | 10.41% | 9.97% | 10.12% | $26,226 |
 |
Wellington Composite Index | 15.11 | 11.21 | 11.05 | 28,514 |
 |
Bloomberg Barclays U.S. Aggregate Bond Index | 7.28 | 4.34 | 3.71 | 14,399 |
 |
Dow Jones U.S. Total Stock Market Float Adjusted Index | 18.93 | 13.89 | 13.99 | 37,049 |
Wellington Composite Index: 65% S&P 500 Index and 35% Lehman U.S. Long Credit AA or Better Bond Index through February 29, 2000; 65% S&P 500 Index and 35% Bloomberg Barclays U.S. Credit A or Better Bond Index thereafter.
| Final Value | ||||
| One | Five | Ten | of a $50,000 | |
| Year | Years | Years | Investment | |
| Wellington Fund Admiral Shares | 10.50% | 10.06% | 10.21% | $132,205 |
| Wellington Composite Index | 15.11 | 11.21 | 11.05 | 142,572 |
| Bloomberg Barclays U.S. Aggregate Bond Index | 7.28 | 4.34 | 3.71 | 71,994 |
| Dow Jones U.S. Total Stock Market Float Adjusted Index | 18.93 | 13.89 | 13.99 | 185,247 |
See Financial Highlights for dividend and capital gains information.
9
Wellington Fund
Fund Allocation
As of November 30, 2020
| Asset-Backed/Commercial Mortgage-Backed Securities | 1.0% |
| Common Stocks | 69.0 |
| Corporate Bonds | 21.6 |
| Sovereign Bonds | 0.9 |
| Taxable Municipal Bonds | 2.0 |
| U.S. Government and Agency Obligations | 5.5 |
The table reflects the fund’s investments, except for short-term investments and derivatives. The agency and mortgage- backed securities may include issues from government-sponsored enterprises; such issues are generally not backed by the full faith and credit of the U.S. government.
10
Wellington Fund
Financial Statements
Schedule of Investments—Investments Summary
As of November 30, 2020
This Statement summarizes the fund’s holdings by asset type. Details are reported for each of the fund’s 50 largest individual holdings and for investments that, in total for any issuer, represent more than 1% of the fund’s net assets. The total value of smaller holdings is reported as a single amount within each category.
The fund files its complete schedule of portfolio holdings with the Securities and Exchange Commission (SEC) four times in each fiscal year. For the second and fourth quarters the complete list of the fund’s holdings is available on vanguard.com and on Form N-CSR, or you can have it mailed to you without charge by calling 800-662-7447. For the first and third quarters of each fiscal year, the complete list of the fund’s holdings is available as an exhibit to its reports on Form N-PORT. The fund’s Form N-CSR and Form N-PORT reports are available on the SEC’s website at www.sec.gov.
| Market | Percentage | |||
| Value• | of Net | |||
| Shares | ($000) | Assets | ||
| Common Stocks | ||||
| Communication Services | ||||
| * | Alphabet Inc. Class A | 2,833,345 | 4,970,820 | 4.5% |
| * | Facebook Inc. Class A | 10,050,356 | 2,783,647 | 2.5% |
| Comcast Corp. Class A | 32,147,844 | 1,615,108 | 1.4% | |
| 9,369,575 | 8.4% | |||
| Consumer Discretionary | ||||
| McDonald’s Corp. | 12,475,407 | 2,712,653 | 2.4% | |
| TJX Cos. Inc. | 27,918,492 | 1,773,103 | 1.6% | |
| Home Depot Inc. | 6,179,195 | 1,714,170 | 1.5% | |
| * | Alibaba Group Holding Ltd. ADR | 4,464,653 | 1,175,811 | 1.1% |
| Consumer Discretionary—Other † | 384,800 | 0.3% | ||
| 7,760,537 | 6.9% | |||
| Consumer Staples | ||||
| Procter & Gamble Co. | 14,209,871 | 1,973,325 | 1.8% | |
| Coca-Cola Co. | 29,325,690 | 1,513,206 | 1.4% | |
| Nestle SA | 12,192,132 | 1,365,696 | 1.2% | |
| Sysco Corp. | 18,014,737 | 1,284,270 | 1.1% | |
| Consumer Staples—Other † | 332,850 | 0.3% | ||
| 6,469,347 | 5.8% | |||
| Energy | ||||
| TOTAL SE | 32,206,760 | 1,367,042 | 1.2% | |
| Financials | ||||
| JPMorgan Chase & Co. | 17,811,116 | 2,099,574 | 1.9% | |
| Charles Schwab Corp. | 40,719,889 | 1,986,316 | 1.8% | |
| BlackRock Inc. | 2,130,798 | 1,488,043 | 1.3% | |
| Bank of America Corp. | 47,083,838 | 1,325,881 | 1.2% | |
| Progressive Corp. | 14,091,409 | 1,227,503 | 1.1% | |
| American Express Co. | 8,293,198 | 983,490 | 0.9% | |
| 11 |
Wellington Fund
| Market | Percentage | |||
| Value• | of Net | |||
| Shares | ($000) | Assets | ||
| Blackstone Group LP Class A | 15,453,876 | 920,278 | 0.8% | |
| Financials—Other † | 521,844 | 0.5% | ||
| 10,552,929 | 9.5% | |||
| Health Care | ||||
| Pfizer Inc. | 44,106,059 | 1,689,703 | 1.5% | |
| Becton Dickinson and Co. | 6,174,609 | 1,450,045 | 1.3% | |
| UnitedHealth Group Inc. | 4,232,554 | 1,423,577 | 1.3% | |
| Novartis AG | 13,565,475 | 1,228,158 | 1.1% | |
| Abbott Laboratories | 11,260,203 | 1,218,579 | 1.1% | |
| AstraZeneca plc ADR | 20,079,268 | 1,062,996 | 1.0% | |
| HCA Healthcare Inc. | 5,985,122 | 898,427 | 0.8% | |
| Anthem Inc. | 2,814,460 | 876,761 | 0.8% | |
| Humana Inc. | 1,812,557 | 725,965 | 0.6% | |
| Danaher Corp. | 2,724,971 | 612,110 | 0.5% | |
| Health Care—Other † | 355,035 | 0.3% | ||
| 11,541,356 | 10.3% | |||
| Industrials | ||||
| Deere & Co. | 4,008,247 | 1,048,638 | 0.9% | |
| Union Pacific Corp. | 4,865,499 | 992,951 | 0.9% | |
| Trane Technologies plc | 6,118,754 | 894,807 | 0.8% | |
| Northrop Grumman Corp. | 2,624,086 | 793,156 | 0.7% | |
| Lockheed Martin Corp. | 2,136,555 | 779,842 | 0.7% | |
| Raytheon Technologies Corp. | 9,598,266 | 688,388 | 0.6% | |
| Schneider Electric SE | 4,770,563 | 664,668 | 0.6% | |
| Fortive Corp. | 9,464,295 | 663,731 | 0.6% | |
| Industrials—Other † | 1,072,335 | 1.0% | ||
| 7,598,516 | 6.8% | |||
| Information Technology | ||||
| Microsoft Corp. | 25,033,612 | 5,358,945 | 4.8% | |
| Apple Inc. | 29,607,744 | 3,524,802 | 3.2% | |
| Taiwan Semiconductor Manufacturing Co. Ltd. ADR | 17,392,543 | 1,687,424 | 1.5% | |
| Texas Instruments Inc. | 9,924,887 | 1,600,388 | 1.4% | |
| Global Payments Inc. | 6,776,836 | 1,322,771 | 1.2% | |
| Accenture plc Class A | 2,438,360 | 607,371 | 0.6% | |
| Lam Research Corp. | 1,218,832 | 551,716 | 0.5% | |
| Information Technology—Other † | 1,824,989 | 1.6% | ||
| 16,478,406 | 14.8% | |||
| Real Estate | ||||
| American Tower Corp. | 4,683,459 | 1,082,816 | 1.0% | |
| Utilities | ||||
| Duke Energy Corp. | 12,947,378 | 1,199,704 | 1.1% | |
| Exelon Corp. | 29,185,844 | 1,198,662 | 1.0% | |
| 2,398,366 | 2.1% | |||
| Total Common Stocks (Cost $46,901,108) | 74,618,890 | 66.8% | ||
| 12 |
Wellington Fund
| Face | Market | Percentage | ||||
| Maturity | Amount | Value• | of Net | |||
| Coupon | Date | ($000) | ($000) | Assets | ||
| U.S. Government and Agency Obligations | ||||||
| U.S. Government Securities | ||||||
| United States Treasury Note/Bond | 0.250% | 5/31/25 | 850,000 | 847,212 | 0.8% | |
| 1 | United States Treasury Note/Bond | 0.125%–3.125% | 10/31/22–11/15/50 | 3,908,210 | 4,065,490 | 3.6% |
| 4,912,702 | 4.4% | |||||
| Conventional Mortgage-Backed Securities † | 451,035 | 0.4% | ||||
| Nonconventional Mortgage-Backed Securities † | 592,263 | 0.5% | ||||
| Total U.S. Government and Agency Obligations (Cost $5,738,186) | 5,956,000 | 5.3% | ||||
| Asset-Backed/Commercial Mortgage-Backed Securities | ||||||
| 2 | American Tower Trust I | 3.070% | 3/15/23 | 43,000 | 43,793 | 0.1% |
| 2 | Asset-Backed/Commercial Mortgage-Backed Securities—Other † | 1,037,105 | 0.9% | |||
| Total Asset-Backed/Commercial Mortgage-Backed Securities (Cost $1,073,457) | 1,080,898 | 1.0% | ||||
| Corporate Bonds | ||||||
| Finance | ||||||
| Banking | ||||||
| 3 | Bank of America Corp. | 2.496%–5.875% | 1/11/23–3/15/50 | 674,369 | 790,810 | 0.7% |
| 3 | JPMorgan Chase & Co. | 3.109%–5.625% | 5/1/23–4/22/51 | 548,530 | 702,285 | 0.7% |
| 2 | Banking—Other † | 5,158,526 | 4.6% | |||
| Brokerage | ||||||
| Charles Schwab Corp. | 3.200% | 3/2/27 | 19,665 | 22,043 | 0.0% | |
| Brokerage—Other † | 53,899 | 0.1% | ||||
| Insurance | ||||||
| UnitedHealth Group Inc. | 2.000%–4.750% | 3/15/22–8/15/59 | 277,956 | 345,873 | 0.3% | |
| 2 | Insurance—Other † | 1,260,239 | 1.1% | |||
| 2 | Real Estate Investment Trusts † | 165,754 | 0.1% | |||
| 8,499,429 | 7.6% | |||||
| Industrial | ||||||
| Basic Industry † | 59,491 | 0.1% | ||||
| Capital Goods | ||||||
| Deere & Co. | 7.125% | 3/3/31 | 17,500 | 25,822 | 0.0% | |
| John Deere Capital Corp. | 3.450% | 3/13/25 | 43,145 | 48,160 | 0.0% | |
| 2 | Capital Goods—Other † | 632,174 | 0.6% | |||
| Communication | ||||||
| American Tower Corp. | 3.800%–5.000% | 2/15/24–8/15/29 | 43,889 | 50,684 | 0.1% | |
| Comcast Corp. | 3.000%–6.500% | 2/1/24–10/15/58 | 509,246 | 659,434 | 0.6% | |
| NBCUniversal Media LLC | 4.450% | 1/15/43 | 10,370 | 13,724 | 0.0% | |
| 2 | Sky Ltd. | 3.750% | 9/16/24 | 45,046 | 50,123 | 0.0% |
| 2 | Communication—Other † | 1,247,206 | 1.1% | |||
| Consumer Cyclical | ||||||
| Alibaba Group Holding Ltd. | 3.125%–3.600% | 11/28/21–12/6/27 | 127,615 | 141,932 | 0.1% | |
| Home Depot Inc. | 3.300%–4.500% | 12/6/28–12/6/48 | 69,530 | 88,998 | 0.1% | |
| McDonald’s Corp. | 3.250%–4.875% | 6/10/24–9/1/49 | 53,135 | 63,780 | 0.1% | |
| 2 | Consumer Cyclical—Other † | 706,242 | 0.6% | |||
| 13 |
Wellington Fund
| Face | Market | Percentage | ||||
| Maturity | Amount | Value• | of Net | |||
| Coupon | Date | ($000) | ($000) | Assets | ||
| Consumer Noncyclical | ||||||
| AstraZeneca plc | 4.000%–6.450% | 1/17/29–9/15/37 | 70,385 | 92,612 | 0.1% | |
| Novartis Capital Corp. | 3.400%–4.400% | 5/6/24–5/6/44 | 42,591 | 54,144 | 0.1% | |
| Pfizer Inc. | 1.700%–4.100% | 3/15/29–5/28/50 | 146,260 | 174,549 | 0.2% | |
| 3 | Procter & Gamble - Esop | 9.360% | 1/1/21 | 3,727 | 3,742 | 0.0% |
| Wyeth LLC | 5.950% | 4/1/37 | 25,000 | 37,605 | 0.0% | |
| Zeneca Wilmington Inc. | 7.000% | 11/15/23 | 29,000 | 34,179 | 0.0% | |
| 2 | Consumer Noncyclical—Other † | 3,012,787 | 2.7% | |||
| Energy | ||||||
| Total Capital International SA | 2.700%–3.750% | 1/25/23–4/10/24 | 78,010 | 84,105 | 0.1% | |
| 2 | Energy—Other † | 1,075,988 | 0.9% | |||
| 2 | Other Industrial † | 281,947 | 0.3% | |||
| Technology | ||||||
| Apple Inc. | 2.450%–4.450% | 2/9/24–8/20/60 | 485,447 | 544,003 | 0.5% | |
| Global Payments Inc. | 2.900% | 5/15/30 | 14,680 | 15,994 | 0.0% | |
| Microsoft Corp. | 2.525%–4.100% | 2/6/24–6/1/50 | 375,995 | 439,209 | 0.4% | |
| 2 | Technology—Other † | 1,392,352 | 1.2% | |||
| 2 | Transportation † | 569,414 | 0.5% | |||
| 11,600,400 | 10.4% | |||||
| Utilities | ||||||
| Electric | ||||||
| Baltimore Gas and Electric Co. | 2.900% | 6/15/50 | 6,549 | 7,066 | 0.0% | |
| Commonwealth Edison Co. | 3.650%–4.350% | 11/15/45–3/1/48 | 37,430 | 47,506 | 0.1% | |
| Delmarva Power & Light Co. | 3.500% | 11/15/23 | 11,816 | 12,788 | 0.0% | |
| Duke Energy Carolinas LLC | 3.700%–6.050% | 4/15/38–12/1/47 | 21,085 | 26,770 | 0.0% | |
| Duke Energy Corp. | 2.650%–4.800% | 9/1/26–9/1/46 | 78,445 | 99,150 | 0.1% | |
| Duke Energy Florida LLC | 6.350%–6.400% | 9/15/37–6/15/38 | 35,055 | 54,449 | 0.1% | |
| Duke Energy Progress LLC | 4.100%–6.300% | 4/1/38–8/15/45 | 55,720 | 74,909 | 0.1% | |
| Potomac Electric Power Co. | 3.050%–6.500% | 4/1/22–11/15/37 | 28,765 | 41,790 | 0.0% | |
| 2 | Electric—Other † | 2,503,438 | 2.2% | |||
| 2 | Natural Gas † | 349,062 | 0.3% | |||
| Other Utility † | 56,540 | 0.1% | ||||
| 3,273,468 | 3.0% | |||||
| Total Corporate Bonds (Cost $20,221,804) | 23,373,297 | 21.0% | ||||
| 2Sovereign Bonds (Cost $828,556) † | 923,895 | 0.8% | ||||
| Taxable Municipal Bonds (Cost $1,767,626) † | 2,110,109 | 1.9% | ||||
| Shares | ||||||
| Temporary Cash Investments | ||||||
| Money Market Fund | ||||||
| 4 | Vanguard Market Liquidity Fund 0.109% | 1,886 | 188 | 0.0% | ||
| 14 |
Wellington Fund
| Face | Market | Percentage | ||||
| Maturity | Amount | Value• | of Net | |||
| Coupon | Date | ($000) | ($000) | Assets | ||
| Repurchase Agreements | ||||||
| Bank of America Securities, LLC (Dated 11/30/20, Repurchase Value $21,700,000, collateralized by Federal Home Loan Bank 3.840%–4.250%, 9/28/28–10/19/38, with a value of $22,138,000) | 0.090% | 12/1/20 | 21,700 | 21,700 | 0.0% | |
| Citigroup Global Markets Inc. (Dated 11/30/20, Repurchase Value $240,900,000, collateralized by U.S. Treasury Note/Bond 2.500%–6.500%, 11/15/26–2/15/48, and U.S. Treasury Bill 0.000%, 1/19/21–2/23/21, with a value of $245,718,000) | 0.070% | 12/1/20 | 240,900 | 240,900 | 0.2% | |
| Credit Agricole Securities (USA) Inc. (Dated 11/30/20, Repurchase Value $447,501,000, collateralized by U.S. Treasury Note/Bond 1.250%–4.375%, 5/15/41–8/15/50, with a value of $456,450,000) | 0.070% | 12/1/20 | 447,500 | 447,500 | 0.4% | |
| Deutsche Bank Securities, Inc. (Dated 11/30/20, Repurchase Value $152,300,000, collateralized by U.S. Treasury Note/Bond 0.375%, 11/30/25, with a value of $155,346,000) | 0.090% | 12/1/20 | 152,300 | 152,300 | 0.1% | |
| HSBC Bank USA (Dated 11/30/20, Repurchase Value $57,800,000, collateralized by U.S. Treasury Note/Bond 0.625%–4.625%, 2/28/22–8/15/50, with a value of $58,956,000) | 0.070% | 12/1/20 | 57,800 | 57,800 | 0.1% | |
| HSBC Bank USA (Dated 11/30/20, Repurchase Value $100,400,000, collateralized by Federal Home Loan Mortgage Corp. 3.000%–4.000%, 9/1/42–7/1/50, and Federal National Mortgage Assn. 2.500%–4.500%, 7/1/35–10/1/50, with a value of $102,408,000) | 0.090% | 12/1/20 | 100,400 | 100,400 | 0.1% | |
| Nomura International plc (Dated 11/30/20, Repurchase Value $562,101,000, collateralized by U.S. Treasury Note/Bond 0.125% 3.375%, 2/28/21–2/15/43, with a value of $573,342,000) | 0.070% | 12/1/20 | 562,100 | 562,100 | 0.5% | |
| 15 |
Wellington Fund
| Face | Market | Percentage | ||||
| Maturity | Amount | Value• | of Net | |||
| Coupon | Date | ($000) | ($000) | Assets | ||
| RBC Capital Markets LLC (Dated 11/30/20, Repurchase Value $155,600,000, collateralized by Federal Home Loan Mortgage Corp. 2.500%, 9/1/50–11/1/50, and Federal National Mortgage Assn. 2.000%–3.000%, 2/1/50–12/1/50, with a value of $158,712,000) | 0.080% | 12/1/20 | 155,600 | 155,600 | 0.2% | |
| TD Securities (USA) LLC (Dated 11/30/20, Repurchase Value $80,200,000, collateralized by U.S. Treasury Bill 0.000%, 3/2/21, with a value of $81,804,000) | 0.090% | 12/1/20 | 80,200 | 80,200 | 0.1% | |
| Wells Fargo & Co. (Dated 11/30/20, Repurchase Value 144,200,000, collateralized by Federal National Mortgage Assn. 2.500%–5.500%, 7/1/33–12/1/50, with a value of $147,084,000) | 0.090% | 12/1/20 | 144,200 | 144,200 | 0.1% | |
| 1,962,700 | 1.8% | |||||
| U.S. Government and Agency Obligations | ||||||
| 1 | United States Treasury Bill | 0.108% | 3/25/21 | 1,000,000 | 999,700 | 0.9% |
| United States Treasury Bill | 0.096% | 4/15/21 | 424,000 | 423,864 | 0.4% | |
| U.S. Government and Agency Obligations—Other † | 152,750 | 0.1% | ||||
| 1,576,314 | 1.4% | |||||
| Total Temporary Cash Investments (Cost $3,539,107) | 3,539,202 | 3.2% | ||||
| Total Investments (Cost $80,069,844) | 111,602,291 | 100.0% | ||||
| Other Assets and Liabilities—Net (0.0%) | 42,101 | 0.0% | ||||
| Net Assets | 111,644,392 | 100.0% | ||||
Cost is in $000.
| • | See Note A in Notes to Financial Statements. |
| * | Non-income-producing security. |
| † | Represents the aggregate value, by category, of securities that are not among the 50 largest holdings and, in total for any issuer, represent 1% or less of net assets. |
| 1 | Securities with a value of $11,880,000 have been segregated as initial margin for open futures contracts. |
| 2 | Certain securities are exempt from registration under Rule 144A of the Securities Act of 1933. Such securities may be sold in transactions exempt from registration, normally to qualified institutional buyers. At November 30, 2020, the aggregate value of these securities was $5,615,863,000, representing 5.0% of net assets. |
| 3 | The average or expected maturity is shorter than the final maturity shown because of the possibility of interim principal payments and prepayments or the possibility of the issue being called. |
| 4 | Affiliated money market fund available only to Vanguard funds and certain trusts and accounts managed by Vanguard. Rate shown is the 7-day yield. |
ADR—American Depositary Receipt.
| 16 |
Wellington Fund
| Derivative Financial Instruments Outstanding as of Period End | ||||
| Futures Contracts | ||||
| ($000) | ||||
| Value and | ||||
| Number of | Unrealized | |||
| Long (Short) | Notional | Appreciation | ||
| Expiration | Contracts | Amount | (Depreciation) | |
| Long Futures Contracts | ||||
| 5-Year U.S. Treasury Note | March 2021 | 3,651 | 460,140 | 477 |
| 477 | ||||
| Short Futures Contracts | ||||
| 10-Year U.S. Treasury Note | March 2021 | (6,327) | (874,213) | (1,630) |
| (1,630) | ||||
| (1,153) | ||||
See accompanying Notes, which are an integral part of the Financial Statements.
| 17 |
Wellington Fund
Statement of Assets and Liabilities
As of November 30, 2020
| ($000s, except shares and per-share amounts) | Amount |
| Assets | |
| Investments in Securities, at Value | |
| Unaffiliated Issuers (Cost $80,069,656) | 111,602,103 |
| Affiliated Issuers (Cost $188) | 188 |
| Total Investments in Securities | 111,602,291 |
| Investment in Vanguard | 4,459 |
| Cash | 80,107 |
| Foreign Currency, at Value (Cost $1,491) | 1,633 |
| Receivables for Investment Securities Sold | 445,095 |
| Receivables for Accrued Income | 374,104 |
| Receivables for Capital Shares Issued | 36,446 |
| Variation Margin Receivable—Futures Contracts | 911 |
| Total Assets | 112,545,046 |
| Liabilities | |
| Payables for Investment Securities Purchased | 819,626 |
| Payables to Investment Advisor | 14,847 |
| Payables for Capital Shares Redeemed | 59,386 |
| Payables to Vanguard | 6,094 |
| Variation Margin Payable—Futures Contracts | 701 |
| Total Liabilities | 900,654 |
| Net Assets | 111,644,392 |
| At November 30, 2020, net assets consisted of: | |
| Paid-in Capital | 73,526,250 |
| Total Distributable Earnings (Loss) | 38,118,142 |
| Net Assets | 111,644,392 |
| Investor Shares—Net Assets | |
| Applicable to 339,143,034 outstanding $.001 par value shares of beneficial interest (unlimited authorization) | 15,635,367 |
| Net Asset Value Per Share—Investor Shares | $46.10 |
| Admiral Shares—Net Assets | |
| Applicable to 1,205,895,140 outstanding $.001 par value shares of beneficial interest (unlimited authorization) | 96,009,025 |
| Net Asset Value Per Share—Admiral Shares | $79.62 |
See accompanying Notes, which are an integral part of the Financial Statements.
| 18 |
Wellington Fund
Statement of Operations
| Year Ended | |
| November 30, 2020 | |
| ($000) | |
| Investment Income | |
| Income | |
| Dividends1 | 1,567,122 |
| Interest | 1,097,801 |
| Securities Lending—Net | 2,020 |
| Total Income | 2,666,943 |
| Expenses | |
| Investment Advisory Fees—Note B | |
| Basic Fee | 81,950 |
| Performance Adjustment | (21,754) |
| The Vanguard Group—Note C | |
| Management and Administrative—Investor Shares | 27,028 |
| Management and Administrative—Admiral Shares | 86,569 |
| Marketing and Distribution—Investor Shares | 1,414 |
| Marketing and Distribution—Admiral Shares | 3,255 |
| Custodian Fees | 398 |
| Auditing Fees | 36 |
| Shareholders’ Reports—Investor Shares | 201 |
| Shareholders’ Reports—Admiral Shares | 141 |
| Trustees’ Fees and Expenses | 156 |
| Total Expenses | 179,394 |
| Net Investment Income | 2,487,549 |
| Realized Net Gain (Loss) | |
| Investment Securities Sold2 | 6,634,094 |
| Futures Contracts | 2,468 |
| Options Purchased | (2,567) |
| Forward Currency Contracts | (985) |
| Foreign Currencies | (138) |
| Realized Net Gain (Loss) | 6,632,872 |
| Change in Unrealized Appreciation (Depreciation) | |
| Investment Securities2 | 1,216,552 |
| Futures Contracts | (211) |
| Foreign Currencies | 3,143 |
| Change in Unrealized Appreciation (Depreciation) | 1,219,484 |
| Net Increase (Decrease) in Net Assets Resulting from Operations | 10,339,905 |
| 1 | Dividends are net of foreign withholding taxes of $39,855,000. |
| 2 | Realized net gain (loss) and change in unrealized appreciation (depreciation) from an affiliated company of the fund were $114,000 and $0. Purchases and sales are for temporary cash investment purposes. |
See accompanying Notes, which are an integral part of the Financial Statements.
| 19 |
Wellington Fund
Statement of Changes in Net Assets
| Year Ended November 30, | ||
| 2020 | 2019 | |
| ($000) | ($000) | |
| Increase (Decrease) in Net Assets | ||
| Operations | ||
| Net Investment Income | 2,487,549 | 2,873,152 |
| Realized Net Gain (Loss) | 6,632,872 | 2,476,973 |
| Change in Unrealized Appreciation (Depreciation) | 1,219,484 | 8,665,727 |
| Net Increase (Decrease) in Net Assets Resulting from Operations | 10,339,905 | 14,015,852 |
| Distributions1 | ||
| Investor Shares | (738,980) | (1,380,670) |
| Admiral Shares | (4,196,596) | (7,336,921) |
| Total Distributions | (4,935,576) | (8,717,591) |
| Capital Share Transactions | ||
| Investor Shares | (2,344,969) | (32,115) |
| Admiral Shares | (2,092,620) | 2,766,577 |
| Net Increase (Decrease) from Capital Share Transactions | (4,437,589) | 2,734,462 |
| Total Increase (Decrease) | 966,740 | 8,032,723 |
| Net Assets | ||
| Beginning of Period | 110,677,652 | 102,644,929 |
| End of Period | 111,644,392 | 110,677,652 |
| 1 | Certain prior-period numbers have been reclassified to conform with the current-period presentation. |
See accompanying Notes, which are an integral part of the Financial Statements.
| 20 |
Wellington Fund
Financial Highlights
Investor Shares
| For a Share Outstanding | Year Ended November 30, | ||||
| Throughout Each Period | 2020 | 2019 | 2018 | 2017 | 2016 |
| Net Asset Value, Beginning of Period | $43.72 | $41.86 | $43.45 | $39.23 | $39.00 |
| Investment Operations | |||||
| Net Investment Income | .9661 | 1.0981 | 1.0831 | 1.0211 | 1.017 |
| Net Realized and Unrealized Gain (Loss) on Investments | 3.345 | 4.269 | .100 | 4.965 | 1.616 |
| Total from Investment Operations | 4.311 | 5.367 | 1.183 | 5.986 | 2.633 |
| Distributions | |||||
| Dividends from Net Investment Income | (1.004) | (1.099) | (1.086) | (1.030) | (1.014) |
| Distributions from Realized Capital Gains | (.927) | (2.408) | (1.687) | (.736) | (1.389) |
| Total Distributions | (1.931) | (3.507) | (2.773) | (1.766) | (2.403) |
| Net Asset Value, End of Period | $46.10 | $43.72 | $41.86 | $43.45 | $39.23 |
| Total Return2 | 10.41% | 14.22% | 2.80% | 15.72% | 7.18% |
| Ratios/Supplemental Data | |||||
| Net Assets, End of Period (Millions) | $15,635 | $17,209 | $16,438 | $18,422 | $18,967 |
| Ratio of Total Expenses to Average Net Assets3 | 0.24% | 0.25% | 0.25% | 0.25% | 0.25% |
| Ratio of Net Investment Income to Average Net Assets | 2.28% | 2.70% | 2.58% | 2.50% | 2.68% |
| Portfolio Turnover Rate4 | 51% | 28% | 34% | 30% | 31% |
| 1 | Calculated based on average shares outstanding. |
| 2 | Total returns do not include account service fees that may have applied in the periods shown. Fund prospectuses provide information about any applicable account service fees. |
| 3 | Includes performance-based investment advisory fee increases (decreases) of (0.02%), (0.00%), (0.01%), (0.01%), and (0.01%). |
| 4 | Includes 3%, 1%, 2%, 4%, and 6% attributable to mortgage-dollar-roll activity. |
See accompanying Notes, which are an integral part of the Financial Statements.
| 21 |
Wellington Fund
Financial Highlights
Admiral Shares
| For a Share Outstanding | Year Ended November 30, | ||||
| Throughout Each Period | 2020 | 2019 | 2018 | 2017 | 2016 |
| Net Asset Value, Beginning of Period | $75.51 | $72.29 | $75.04 | $67.75 | $67.36 |
| Investment Operations | |||||
| Net Investment Income | 1.7201 | 1.9541 | 1.9291 | 1.8241 | 1.812 |
| Net Realized and Unrealized Gain (Loss) on Investments | 5.784 | 7.379 | .172 | 8.572 | 2.784 |
| Total from Investment Operations | 7.504 | 9.333 | 2.101 | 10.396 | 4.596 |
| Distributions | |||||
| Dividends from Net Investment Income | (1.794) | (1.955) | (1.936) | (1.836) | (1.807) |
| Distributions from Realized Capital Gains | (1.600) | (4.158) | (2.915) | (1.270) | (2.399) |
| Total Distributions | (3.394) | (6.113) | (4.851) | (3.106) | (4.206) |
| Net Asset Value, End of Period | $79.62 | $75.51 | $72.29 | $75.04 | $67.75 |
| Total Return2 | 10.50% | 14.33% | 2.88% | 15.81% | 7.26% |
| Ratios/Supplemental Data | |||||
| Net Assets, End of Period (Millions) | $96,009 | $93,469 | $86,207 | $87,136 | $73,996 |
| Ratio of Total Expenses to Average Net Assets3 | 0.16% | 0.17% | 0.17% | 0.17% | 0.16% |
| Ratio of Net Investment Income to Average Net Assets | 2.35% | 2.78% | 2.66% | 2.58% | 2.77% |
| Portfolio Turnover Rate4 | 51% | 28% | 34% | 30% | 31% |
| 1 | Calculated based on average shares outstanding. |
| 2 | Total returns do not include account service fees that may have applied in the periods shown. Fund prospectuses provide information about any applicable account service fees. |
| 3 | Includes performance-based investment advisory fee increases (decreases) of (0.02%), (0.00%), (0.01%), (0.01%), and (0.01%). |
| 4 | Includes 3%, 1%, 2%, 4%, and 6% attributable to mortgage-dollar-roll activity. |
See accompanying Notes, which are an integral part of the Financial Statements.
| 22 |
Wellington Fund
Notes to Financial Statements
Vanguard Wellington Fund is registered under the Investment Company Act of 1940 as an open-end investment company, or mutual fund. The fund offers two classes of shares: Investor Shares and Admiral Shares. Each of the share classes has different eligibility and minimum purchase requirements, and is designed for different types of investors.
Certain of the fund’s investments are in corporate debt instruments; the issuers’ abilities to meet their obligations may be affected by economic developments in their respective industries. Market disruptions associated with the COVID-19 pandemic have had a global impact, and uncertainty exists as to the long-term implications. Such disruptions can adversely affect assets of the fund and thus fund performance.
A. The following significant accounting policies conform to generally accepted accounting principles for U.S. investment companies. The fund consistently follows such policies in preparing its financial statements.
1. Security Valuation: Securities are valued as of the close of trading on the New York Stock Exchange (generally 4 p.m., Eastern time) on the valuation date. Equity securities are valued at the latest quoted sales prices or official closing prices taken from the primary market in which each security trades; such securities not traded on the valuation date are valued at the mean of the latest quoted bid and asked prices. Bonds and temporary cash investments are valued using the latest bid prices or using valuations based on a matrix system (which considers such factors as security prices, yields, maturities, and ratings), both as furnished by independent pricing services. Structured debt securities, including mortgages and asset-backed securities, are valued using the latest bid prices or using valuations based on a matrix system that considers such factors as issuer, tranche, nominal or option-adjusted spreads, weighted average coupon, weighted average maturity, credit enhancements, and collateral. Investments in Vanguard Market Liquidity Fund are valued at that fund’s net asset value. Securities for which market quotations are not readily available, or whose values have been affected by events occurring before the fund’s pricing time but after the close of the securities’ primary markets, are valued at their fair values calculated according to procedures adopted by the board of trustees. These procedures include obtaining quotations from an independent pricing service, monitoring news to identify significant market- or security-specific events, and evaluating changes in the values of foreign market proxies (for example, ADRs, futures contracts, or exchange-traded funds), between the time the foreign markets close and the fund’s pricing time. When fair-value pricing is employed, the prices of securities used by a fund to calculate its net asset value may differ from quoted or published prices for the same securities.
2. Foreign Currency: Securities and other assets and liabilities denominated in foreign currencies are translated into U.S. dollars using exchange rates obtained from an independent third party as of the fund’s pricing time on the valuation date. Realized gains (losses) and unrealized appreciation (depreciation) on investment securities include the effects of changes in exchange rates since the securities were purchased, combined with the effects of changes in security prices. Fluctuations in the value of other assets and liabilities resulting from changes in exchange rates are recorded as unrealized foreign currency gains (losses) until the assets or liabilities are settled in cash, at which time they are recorded as realized foreign currency gains (losses).
3. Futures Contracts: The fund uses futures contracts to invest in fixed income asset classes with greater efficiency and lower cost than is possible through direct investment, to add value when these instruments are attractively priced, or to adjust sensitivity to changes in interest rates. The primary risks associated with the use of futures contracts are imperfect correlation between
| 23 |
Wellington Fund
changes in market values of bonds held by the fund and the prices of futures contracts, and the possibility of an illiquid market. Counterparty risk involving futures is mitigated because a regulated clearinghouse is the counterparty instead of the clearing broker. To further mitigate counterparty risk, the fund trades futures contracts on an exchange, monitors the financial strength of its clearing brokers and clearinghouse, and has entered into clearing agreements with its clearing brokers. The clearinghouse imposes initial margin requirements to secure the fund’s performance and requires daily settlement of variation margin representing changes in the market value of each contract. Any securities pledged as initial margin for open contracts are noted in the Schedule of Investments.
Futures contracts are valued at their quoted daily settlement prices. The notional amounts of the contracts are not recorded in the Statement of Assets and Liabilities. Fluctuations in the value of the contracts are recorded in the Statement of Assets and Liabilities as an asset (liability) and in the Statement of Operations as unrealized appreciation (depreciation) until the contracts are closed, when they are recorded as realized gains (losses) on futures contracts.
During the year ended November 30, 2020, the fund’s average investments in long and short futures contracts each represented less than 1% of net assets, based on the average of the notional amounts at each quarter-end during the period.
4. Forward Currency Contracts: The fund enters into forward currency contracts to protect the value of securities and related receivables and payables against changes in future foreign exchange rates. The fund’s risks in using these contracts include movement in the values of the foreign currencies relative to the U.S. dollar and the ability of the counterparties to fulfill their obligations under the contracts. The fund mitigates its counterparty risk by entering into forward currency contracts only with a diverse group of prequalified counterparties, monitoring their financial strength, entering into master netting arrangements with its counterparties, and requiring its counterparties to transfer collateral as security for their performance. In the absence of a default, the collateral pledged or received by the fund cannot be repledged, resold, or rehypothecated. The master netting arrangements provide that, in the event of a counterparty’s default (including bankruptcy), the fund may terminate the forward currency contracts, determine the net amount owed by either party in accordance with its master netting arrangements, and sell or retain any collateral held up to the net amount owed to the fund under the master netting arrangements. The forward currency contracts contain provisions whereby a counterparty may terminate open contracts if the fund’s net assets decline below a certain level, triggering a payment by the fund if the fund is in a net liability position at the time of the termination. The payment amount would be reduced by any collateral the fund has pledged. Any securities pledged as collateral for open contracts are noted in the Schedule of Investments. The value of collateral received or pledged is compared daily to the value of the forward currency contracts exposure with each counterparty, and any difference, if in excess of a specified minimum transfer amount, is adjusted and settled within two business days.
Forward currency contracts are valued at their quoted daily prices obtained from an independent third party, adjusted for currency risk based on the expiration date of each contract. The notional amounts of the contracts are not recorded in the Statement of Assets and Liabilities. Fluctuations in the value of the contracts are recorded in the Statement of Assets and Liabilities as an asset (liability) and in the Statement of Operations as unrealized appreciation (depreciation) until the contracts are closed, when they are recorded as realized gains (losses) on forward currency contracts.
| 24 |
Wellington Fund
During the year ended November 30, 2020, the fund’s average investment in forward currency contracts represented less than 1% of net assets, based on the average of notional amounts at each quarter-end during the period. The fund had no open forward currency contracts at November 30, 2020.
5. Options: The fund invests in options contracts on futures to adjust its exposure to the underlying investments. The primary risk associated with purchasing options is that if interest rates move in such a way that the option is out-of-the-money, the position is worthless at expiration, and the fund loses the premium paid. The primary risk associated with selling options is that if interest rates move in such a way that the option is in-the-money, the counterparty exercises the option, and the fund loses an amount equal to the market value of the option written less the premium received.
The fund invests in options on futures, which are exchange-traded. Counterparty risk involving exchange-traded options on futures is mitigated because a regulated clearinghouse is the counterparty instead of the clearing broker. To further mitigate counterparty risk, the fund trades options on futures on an exchange, monitors the financial strength of its clearing brokers and clearinghouses, and has entered into clearing agreements with its clearing brokers.
Options contracts on futures are valued at their quoted daily settlement prices. The premium paid for a purchased option is recorded in the Statement of Assets and Liabilities as an asset that is subsequently adjusted daily to the current market value of the option purchased. The premium received for a written option is recorded in the Statement of Assets and Liabilities as an asset with an equal liability that is subsequently adjusted daily to the current market value of the option written. The notional amounts of option contracts are not recorded in the Statement of Assets and Liabilities. Fluctuations in the value of the options are recorded in the Statement of Operations as unrealized appreciation (depreciation) until expired, closed, or exercised, at which time realized gains (losses) are recognized.
During the year ended November 30, 2020, the fund’s average value of investments in options purchased and options written represented less than 1% and 0% of net assets, respectively, based on the average market values at each quarter-end during the period. The fund had no open options contracts on futures at November 30, 2020.
6. To Be Announced (TBA) Transactions: A TBA transaction is an agreement to buy or sell mortgage-backed securities with agreed-upon characteristics (face amount, coupon, maturity) for settlement at a future date. The fund may be a seller of TBA transactions to reduce its exposure to the mortgage-backed securities market or in order to sell mortgage-backed securities it owns under delayed-delivery arrangements. When the fund is a buyer of TBA transactions, it maintains cash or short-term investments in an amount sufficient to meet the purchase price at the settlement date of the TBA transaction. The primary risk associated with TBA transactions is that a counterparty may default on its obligations. The fund mitigates its counterparty risk by, among other things, performing a credit analysis of counterparties, allocating transactions among numerous counterparties, and monitoring its exposure to each counterparty. The fund may also enter into a Master Securities Forward Transaction Agreement (MSFTA) with certain counterparties and require them to transfer collateral as security for their performance. In the absence of a default, the collateral pledged or received by the fund cannot be repledged, resold, or rehypothecated. Under an MSFTA, upon a counterparty default (including bankruptcy), the fund may terminate any TBA transactions with that counterparty, determine the net amount owed by either party in accordance with its master netting arrangements, and sell or retain any collateral held up to the net amount owed to the fund under the master netting arrangements.
| 25 |
Wellington Fund
At November 30, 2020, counterparties had deposited in segregated accounts cash of $895,000 in connection with TBA transactions.
7. Mortgage Dollar Rolls: The fund enters into mortgage-dollar-roll transactions, in which the fund sells mortgage-backed securities to a dealer and simultaneously agrees to purchase similar securities in the future at a predetermined price. The proceeds of the securities sold in mortgage-dollar-roll transactions are typically invested in high-quality short-term fixed income securities. The fund forgoes principal and interest paid on the securities sold, and is compensated by interest earned on the proceeds of the sale and by a lower price on the securities to be repurchased. The fund has also entered into mortgage-dollar-roll transactions in which the fund buys mortgage-backed securities from a dealer pursuant to a TBA transaction and simultaneously agrees to sell similar securities in the future at a predetermined price. The securities bought in mortgage-dollar-roll transactions are used to cover an open TBA sell position. The fund continues to earn interest on mortgage-backed security pools already held and receives a lower price on the securities to be sold in the future. The fund accounts for mortgage-dollar-roll transactions as purchases and sales; as such, these transactions may increase the fund’s portfolio turnover rate. Amounts to be received or paid in connection with open mortgage dollar rolls are included in Receivables for Investment Securities Sold or Payables for Investment Securities Purchased in the Statement of Assets and Liabilities.
8. Repurchase Agreements: The fund enters into repurchase agreements with institutional counterparties. Securities pledged as collateral to the fund under repurchase agreements are held by a custodian bank until the agreements mature, and in the absence of a default, such collateral cannot be repledged, resold, or rehypothecated. Each agreement requires that the market value of the collateral be sufficient to cover payments of interest and principal. The fund further mitigates its counterparty risk by entering into repurchase agreements only with a diverse group of prequalified counterparties, monitoring their financial strength, and entering into master repurchase agreements with its counterparties. The master repurchase agreements provide that, in the event of a counterparty’s default (including bankruptcy), the fund may terminate any repurchase agreements with that counterparty, determine the net amount owed, and sell or retain the collateral up to the net amount owed to the fund. Such action may be subject to legal proceedings, which may delay or limit the disposition of collateral.
9. Federal Income Taxes: The fund intends to continue to qualify as a regulated investment company and distribute all of its taxable income. The fund’s tax returns are open to examination by the relevant tax authorities until expiration of the applicable statute of limitations, which is generally three years after the filing of the tax return. Management has analyzed the fund’s tax positions taken for all open federal and state income tax years, and has concluded that no provision for income tax is required in the fund’s financial statements.
10. Distributions: Distributions to shareholders are recorded on the ex-dividend date. Distributions are determined on a tax basis at the fiscal year-end and may differ from net investment income and realized capital gains for financial reporting purposes.
11. Securities Lending: To earn additional income, the fund lends its securities to qualified institutional borrowers. Security loans are subject to termination by the fund at any time, and are required to be secured at all times by collateral in an amount at least equal to the market value of securities loaned. Daily market fluctuations could cause the value of loaned securities to be more or less than the value of the collateral received. When this occurs, the collateral is adjusted and
| 26 |
Wellington Fund
settled before the opening of the market on the next business day. The fund further mitigates its counterparty risk by entering into securities lending transactions only with a diverse group of prequalified counterparties, monitoring their financial strength, and entering into master securities lending agreements with its counterparties. The master securities lending agreements provide that, in the event of a counterparty’s default (including bankruptcy), the fund may terminate any loans with that borrower, determine the net amount owed, and sell or retain the collateral up to the net amount owed to the fund; however, such actions may be subject to legal proceedings. While collateral mitigates counterparty risk, in the event of a default, the fund may experience delays and costs in recovering the securities loaned. The fund invests cash collateral received in Vanguard Market Liquidity Fund, and records a liability in the Statement of Assets and Liabilities for the return of the collateral, during the period the securities are on loan. Collateral investments in Vanguard Market Liquidity Fund are subject to market appreciation or depreciation. Securities lending income represents fees charged to borrowers plus income earned on invested cash collateral, less expenses associated with the loan. During the term of the loan, the fund is entitled to all distributions made on or in respect of the loaned securities.
12. Credit Facilities and Interfund Lending Program: The fund and certain other funds managed by The Vanguard Group (“Vanguard”) participate in a $4.3 billion committed credit facility provided by a syndicate of lenders pursuant to a credit agreement and an uncommitted credit facility provided by Vanguard. Both facilities may be renewed annually. Each fund is individually liable for its borrowings, if any, under the credit facilities. Borrowings may be utilized for temporary or emergency purposes, subject to the fund’s regulatory and contractual borrowing restrictions. With respect to the committed credit facility, the participating funds are charged administrative fees and an annual commitment fee of 0.10% of the undrawn committed amount of the facility; these fees are allocated to the funds based on a method approved by the fund’s board of trustees and included in Management and Administrative expenses on the fund’s Statement of Operations. Any borrowings under either facility bear interest at a rate based upon the higher of the one-month London Interbank Offered Rate (or an acceptable alternate rate, if necessary), federal funds effective rate, or overnight bank funding rate plus an agreed-upon spread, except that borrowings under the uncommitted credit facility may bear interest based upon an alternative rate agreed to by the fund and Vanguard.
In accordance with an exemptive order (the “Order”) from the SEC, the fund may participate in a joint lending and borrowing program that allows registered open-end Vanguard funds to borrow money from and lend money to each other for temporary or emergency purposes (the “Interfund Lending Program”), subject to compliance with the terms and conditions of the Order, and to the extent permitted by the fund’s investment objective and investment policies. Interfund loans and borrowings normally extend overnight, but can have a maximum duration of seven days. Loans may be called on one business day’s notice. The interest rate to be charged is governed by the conditions of the Order and internal procedures adopted by the board of trustees. The board of trustees is responsible for overseeing the Interfund Lending Program.
For the year ended November 30, 2020, the fund did not utilize the credit facilities or the Interfund Lending Program.
13. Other: Dividend income is recorded on the ex-dividend date. Non-cash dividends included in dividend income, if any, are recorded at the fair value of the securities received. Interest income includes income distributions received from Vanguard Market Liquidity Fund and is accrued daily. Premiums and discounts on debt securities are amortized and accreted, respectively, to interest income over the lives of the respective securities, except for premiums on certain callable debt
| 27 |
Wellington Fund
securities that are amortized to the earliest call date. Security transactions are accounted for on the date securities are bought or sold. Costs used to determine realized gains (losses) on the sale of investment securities are those of the specific securities sold.
Withholding taxes on foreign dividends and capital gains have been provided for in accordance with the fund’s understanding of the applicable countries’ tax rules and rates. The fund has filed tax reclaims for previously withheld taxes on dividends earned in certain European Union countries. These filings are subject to various administrative and judicial proceedings within these countries. Such tax reclaims received during the year, if any, are included in dividend income. No other amounts for additional tax reclaims are reflected in the financial statements due to the uncertainty as to the ultimate resolution of proceedings, the likelihood of receipt of these reclaims, and the potential timing of payment.
Each class of shares has equal rights as to assets and earnings, except that each class separately bears certain class-specific expenses related to maintenance of shareholder accounts (included in Management and Administrative expenses) and shareholder reporting. Marketing and distribution expenses are allocated to each class of shares based on a method approved by the board of trustees. Income, other non-class-specific expenses, and gains and losses on investments are allocated to each class of shares based on its relative net assets.
B. Wellington Management Company llp provides investment advisory services to the fund for a fee calculated at an annual percentage rate of average net assets. The basic fee is subject to quarterly adjustments based on the fund’s performance relative to the combined index comprising the S&P 500 Index and the Bloomberg Barclays Capital U.S. Credit A or Better Bond Index for the preceding three years. For the year ended November 30, 2020, the investment advisory fee represented an effective annual basic rate of 0.08% of the fund’s average net assets before a decrease of $21,754,000 (0.02%) based on performance.
C. In accordance with the terms of a Funds’ Service Agreement (the “FSA”) between Vanguard and the fund, Vanguard furnishes to the fund corporate management, administrative, marketing, and distribution services at Vanguard’s cost of operations (as defined by the FSA). These costs of operations are allocated to the fund based on methods and guidelines approved by the board of trustees and are generally settled twice a month.
Upon the request of Vanguard, the fund may invest up to 0.40% of its net assets as capital in Vanguard. At November 30, 2020, the fund had contributed to Vanguard capital in the amount of $4,459,000, representing less than 0.01% of the fund’s net assets and 1.78% of Vanguard’s capital received pursuant to the FSA. The fund’s trustees and officers are also directors and employees, respectively, of Vanguard.
D. Various inputs may be used to determine the value of the fund’s investments and derivatives. These inputs are summarized in three broad levels for financial statement purposes. The inputs or methodologies used to value securities are not necessarily an indication of the risk associated with investing in those securities.
Level 1—Quoted prices in active markets for identical securities.
Level 2—Other significant observable inputs (including quoted prices for similar securities, interest rates, prepayment speeds, credit risk, etc.).
Level 3—Significant unobservable inputs (including the fund’s own assumptions used to determine the fair value of investments). Any investments and derivatives valued with significant unobservable inputs are noted on the Schedule of Investments.
| 28 |
Wellington Fund
The following table summarizes the market value of the fund’s investments and derivatives as of November 30, 2020, based on the inputs used to value them:
| Level 1 | Level 2 | Level 3 | Total | |
| ($000) | ($000) | ($000) | ($000) | |
| Investments | ||||
| Assets | ||||
| Common Stocks | 68,706,179 | 5,912,711 | — | 74,618,890 |
| U.S. Government and Agency Obligations | — | 5,956,000 | — | 5,956,000 |
| Asset-Backed/Commercial Mortgage-Backed Securities | — | 1,080,898 | — | 1,080,898 |
| Corporate Bonds | — | 23,373,297 | — | 23,373,297 |
| Sovereign Bonds | — | 923,895 | — | 923,895 |
| Taxable Municipal Bonds | — | 2,110,109 | — | 2,110,109 |
| Temporary Cash Investments | 188 | 3,539,014 | — | 3,539,202 |
| Total | 68,706,367 | 42,895,924 | — | 111,602,291 |
| Derivative Financial Instruments | ||||
| Assets | ||||
| Futures Contracts1 | 911 | — | — | 911 |
| Liabilities | ||||
| Futures Contracts1 | 701 | — | — | 701 |
1 Represents variation margin on the last day of the reporting period.
E. At November 30, 2020, the fair values of derivatives were reflected in the Statement of Assets and Liabilities as follows:
| Foreign | |||
| Interest Rate | Exchange | ||
| Contracts | Contracts | Total | |
| Statement of Assets and Liabilities Caption | ($000) | ($000) | ($000) |
| Options Purchased | — | — | — |
| Variation Margin Receivable—Futures Contracts | 911 | — | 911 |
| Unrealized Appreciation—Forward Currency Contracts | — | — | — |
| Total Assets | 911 | — | 911 |
| Variation Margin Payable—Futures Contracts | 701 | — | 701 |
| Unrealized Depreciation—Forward Currency Contracts | — | — | — |
| Total Liabilities | 701 | — | 701 |
| 29 |
Wellington Fund
Realized net gain (loss) and the change in unrealized appreciation (depreciation) on derivatives for the year ended November 30, 2020, were:
| Foreign | |||
| Interest Rate | Exchange | ||
| Contracts | Contracts | Total | |
| Realized Net Gain (Loss) on Derivatives | ($000) | ($000) | ($000) |
| Futures Contracts | 2,468 | — | 2,468 |
| Options Purchased | (2,567) | — | (2,567) |
| Forward Currency Contracts | — | (985) | (985) |
| Realized Net Gain (Loss) on Derivatives | (99) | (985) | (1,084) |
| Change in Unrealized Appreciation (Depreciation) on Derivatives | |||
| Futures Contracts | (211) | — | (211) |
| Options Purchased | — | — | — |
| Forward Currency Contracts | — | — | — |
| Change in Unrealized Appreciation (Depreciation) on Derivatives | (211) | — | (211) |
F. Permanent differences between book-basis and tax-basis components of net assets are reclassified among capital accounts in the financial statements to reflect their tax character. These reclassifications have no effect on net assets or net asset value per share. As of period end, permanent differences primarily attributable to the accounting for foreign currency transactions and distributions in connection with fund share redemptions were reclassified between the following accounts:
| Amount | |
| ($000) | |
| Paid-in Capital | 428,747 |
| Total Distributable Earnings (Loss) | (428,747) |
Temporary differences between book-basis and tax-basis components of total distributable earnings (loss) arise when certain items of income, gain, or loss are recognized in different periods for financial statement and tax purposes; these differences will reverse at some time in the future. The differences are primarily related to the deferral of losses from wash sales; the deferral of losses from straddles; and the recognition of unrealized gains or losses from certain derivative contracts. As of period end, the tax-basis components of total distributable earnings (loss) are detailed in the table as follows:
| Amount | |
| ($000) | |
| Undistributed Ordinary Income | 821,920 |
| Undistributed Long-Term Gains | 5,782,064 |
| Capital Loss Carryforwards | — |
| Qualified Late-Year Losses | — |
| Net Unrealized Gains (Losses) | 31,514,158 |
30
Wellington Fund
The tax character of distributions paid was as follows:
| Year Ended November 30, | ||
| 2020 | 2019 | |
| Amount | Amount | |
| ($000) | ($000) | |
| Ordinary Income* | 2,598,283 | 2,882,254 |
| Long-Term Capital Gains | 2,337,293 | 5,835,337 |
| Total | 4,935,576 | 8,717,591 |
* Includes short-term capital gains, if any.
As of November 30, 2020, gross unrealized appreciation and depreciation for investments and derivatives based on cost for U.S. federal income tax purposes were as follows:
| Amount | |
| ($000) | |
| Tax Cost | 80,090,620 |
| Gross Unrealized Appreciation | 32,009,547 |
| Gross Unrealized Depreciation | (497,876) |
| Net Unrealized Appreciation (Depreciation) | 31,511,671 |
G. During the year ended November 30, 2020, the fund purchased $39,987,715,000 of investment securities and sold $45,975,032,000 of investment securities, other than U.S. government securities and temporary cash investments. Purchases and sales of U.S. government securities were $13,064,900,000 and $15,572,516,000, respectively.
H. Capital share transactions for each class of shares were:
| Year Ended November 30, | |||||
| 2020 | 2019 | ||||
| Amount | Shares | Amount | Shares | ||
| ($000) | (000) | ($000) | (000) | ||
| Investor Shares | |||||
| Issued | 1,570,553 | 37,036 | 1,511,761 | 37,140 | |
| Issued in Lieu of Cash Distributions | 705,545 | 16,986 | 1,321,520 | 34,691 | |
| Redeemed | (4,621,067) | (108,454) | (2,865,396) | (70,964) | |
| Net Increase (Decrease)—Investor Shares | (2,344,969) | (54,432) | (32,115) | 867 | |
| Admiral Shares | |||||
| Issued | 7,817,857 | 105,629 | 5,763,319 | 82,106 | |
| Issued in Lieu of Cash Distributions | 3,891,977 | 54,268 | 6,857,481 | 104,181 | |
| Redeemed | (13,802,454) | (191,768) | (9,854,223) | (140,967) | |
| Net Increase (Decrease)—Admiral Shares | (2,092,620) | (31,871) | 2,766,577 | 45,320 | |
I. Management has determined that no events or transactions occurred subsequent to November 30, 2020, that would require recognition or disclosure in these financial statements.
31
Report of Independent Registered Public Accounting Firm
To the Board of Trustees and Shareholders of Vanguard Wellington Fund
Opinion on the Financial Statements
We have audited the accompanying statement of assets and liabilities, including the schedule of investments—investments summary of Vanguard Wellington Fund (one of the funds constituting Vanguard Wellington Fund, referred to hereafter as the “Fund”) as of November 30, 2020, the related statement of operations for the year ended November 30, 2020, the statement of changes in net assets for each of the two years in the period ended November 30, 2020, including the related notes, and the financial highlights for each of the five years in the period ended November 30, 2020 (collectively referred to as the “financial statements”). In our opinion, the financial statements present fairly, in all material respects, the financial position of the Fund as of November 30, 2020, the results of its operations for the year then ended, the changes in its net assets for each of the two years in the period ended November 30, 2020 and the financial highlights for each of the five years in the period ended November 30, 2020 in conformity with accounting principles generally accepted in the United States of America.
Basis for Opinion
These financial statements are the responsibility of the Fund’s management. Our responsibility is to express an opinion on the Fund’s financial statements based on our audits. We are a public accounting firm registered with the Public Company Accounting Oversight Board (United States) (PCAOB) and are required to be independent with respect to the Fund in accordance with the U.S. federal securities laws and the applicable rules and regulations of the Securities and Exchange Commission and the PCAOB.
We conducted our audits of these financial statements in accordance with the standards of the PCAOB. Those standards require that we plan and perform the audit to obtain reasonable assurance about whether the financial statements are free of material misstatement, whether due to error or fraud.
Our audits included performing procedures to assess the risks of material misstatement of the financial statements, whether due to error or fraud, and performing procedures that respond to those risks. Such procedures included examining, on a test basis, evidence regarding the amounts and disclosures in the financial statements. Our audits also included evaluating the accounting principles used and significant estimates made by management, as well as evaluating the overall presentation of the financial statements. Our procedures included confirmation of securities owned as of November 30, 2020 by correspondence with the custodian and brokers and by agreement to the underlying ownership records of the transfer agent; when replies were not received from brokers, we performed other auditing procedures. We believe that our audits provide a reasonable basis for our opinion.
/s/PricewaterhouseCoopers LLP
Philadelphia, Pennsylvania
January 14, 2021
We have served as the auditor of one or more investment companies in The Vanguard Group of Funds since 1975.
32
Special 2020 tax information (unaudited) for Vanguard Wellington Fund
This information for the fiscal year ended November 30, 2020, is included pursuant to provisions of the Internal Revenue Code.
The fund distributed $2,737,128,000 as capital gain dividends (20% rate gain distributions) to shareholders during the fiscal year.
For nonresident alien shareholders, 100% of short-term capital gain dividends distributed by the fund are qualified short-term capital gains.
The fund distributed $1,630,927,000 of qualified dividend income to shareholders during the fiscal year.
For corporate shareholders, 41.4% of investment income (dividend income plus short-term gains, if any) qualifies for the dividends-received deduction.
The fund distributed $50,028,000 of qualified business income to shareholders during the fiscal year.
33
Trustees Approve Advisory Arrangement
The board of trustees of Vanguard Wellington Fund has renewed the fund’s investment advisory arrangement with Wellington Management Company LLP (Wellington Management). The board determined that renewing the fund’s advisory arrangement was in the best interests of the fund and its shareholders.
The board based its decision upon an evaluation of the advisor’s investment staff, portfolio management process, and performance. This evaluation included information provided to the board by Vanguard’s Portfolio Review Department, which is responsible for fund and advisor oversight and product management. The Portfolio Review Department met regularly with the advisor and made monthly presentations to the board during the fiscal year that directed the board’s focus to relevant information and topics.
The board, or an investment committee made up of board members, also received information throughout the year during advisor presentations. For each advisor presentation, the board was provided with letters and reports that included information about, among other things, the advisory firm and the advisor’s assessment of the investment environment, portfolio performance, and portfolio characteristics.
In addition, the board received monthly reports, which included a Market and Economic Report, a Fund Dashboard Monthly Summary, and a Fund Performance Report.
Prior to their meeting, the trustees were provided with a memo and materials that summarized the information they received over the course of the year. They also considered the factors discussed below, among others. However, no single factor determined whether the board approved the arrangement. Rather, it was the totality of the circumstances that drove the board’s decision.
Nature, extent, and quality of services
The board reviewed the quality of the fund’s investment management services over both the short and long term, and took into account the organizational depth and stability of the advisor. The board considered that Wellington Management, founded in 1928, is among the nation’s oldest and most respected institutional managers. The portfolio managers leverage tenured teams of equity and fixed income research analysts who conduct detailed fundamental analysis of their respective industries and companies. In managing the equity portion of the fund, the portfolio managers employ bottom-up, fundamental research focusing on high-quality companies with above-average yields, strong balance sheets, sustainable competitive advantages, and attractive valuations. In managing the fixed income portion of the fund, the portfolio managers focus on investment-grade corporate bonds. The firm has advised the fund since its inception in 1929.
The board concluded that the advisor’s experience, stability, depth, and performance, among other factors, warranted continuation of the advisory arrangement.
Investment performance
The board considered the short- and long-term performance of the fund, including any periods of outperformance or underperformance compared with a relevant benchmark index and peer group. The board concluded that the performance was such that the advisory arrangement should continue.
34
Cost
The board concluded that the fund’s expense ratio was well below the average expense ratio charged by funds in its peer group and that the fund’s advisory fee rate was also well below the peer-group average.
The board did not consider the profitability of Wellington Management in determining whether to approve the advisory fee because Wellington Management is independent of Vanguard and the advisory fee is the result of arm’s-length negotiations.
The benefit of economies of scale
The board concluded that the fund’s shareholders benefit from economies of scale because of the breakpoints in the fund’s advisory fee schedule. The breakpoints reduce the effective rate of the fee as the fund’s assets increase.
The board will consider whether to renew the advisory arrangement again after a one-year period.
35
BLOOMBERG is a trademark and service mark of Bloomberg Finance L.P. BARCLAYS is a trademark and service mark of Barclays Bank Plc, used under license. Bloomberg Finance L.P. and its affiliates, including Bloomberg Index Services Limited (BISL) (collectively, Bloomberg), or Bloomberg’s licensors, own all proprietary rights in the Bloomberg Barclays U.S. Credit A or Better Bond Index (Index or Bloomberg Barclays Index).
Neither Barclays Bank Plc, Barclays Capital Inc., or any affiliate (collectively Barclays) or Bloomberg is the issuer or producer of the Wellington Fund and neither Bloomberg nor Barclays has any responsibilities, obligations or duties to investors in the Wellington Fund. The Index is licensed for use by The Vanguard Group, Inc. (Vanguard) as the sponsor of the Wellington Fund. Bloomberg and Barclays’ only relationship with Vanguard in respect of the Index is the licensing of the Index, which is determined, composed and calculated by BISL, or any successor thereto, without regard to the Issuer or the Wellington Fund or the owners of the Wellington Fund.
Additionally, Vanguard may for itself execute transaction(s) with Barclays in or relating to the Index in connection with the Wellington Fund. Investors acquire the Wellington Fund from Vanguard and investors neither acquire any interest in the Index nor enter into any relationship of any kind whatsoever with Bloomberg or Barclays upon making an investment in the Wellington Fund. The Wellington Fund is not sponsored, endorsed, sold or promoted by Bloomberg or Barclays. Neither Bloomberg nor Barclays makes any representation or warranty, express or implied regarding the advisability of investing in the Wellington Fund or the advisability of investing in securities generally or the ability of the Index to track corresponding or relative market performance. Neither Bloomberg nor Barclays has passed on the legality or suitability of the Wellington Fund with respect to any person or entity. Neither Bloomberg nor Barclays is responsible for and has not participated in the determination of the timing of, prices at, or quantities of the Wellington Fund to be issued. Neither Bloomberg nor Barclays has any obligation to take the needs of the Issuer or the owners of the Wellington Fund or any other third party into consideration in determining, composing or calculating the Index. Neither Bloomberg nor Barclays has any obligation or liability in connection with administration, marketing or trading of the Wellington Fund.
The licensing agreement between Bloomberg and Barclays is solely for the benefit of Bloomberg and Barclays and not for the benefit of the owners of the Wellington Fund, investors or other third parties. In addition, the licensing agreement between Vanguard and Bloomberg is solely for the benefit of Vanguard and Bloomberg and not for the benefit of the owners of the Wellington Fund, investors or other third parties.
NEITHER BLOOMBERG NOR BARCLAYS SHALL HAVE ANY LIABILITY TO THE ISSUER, INVESTORS OR TO OTHER THIRD PARTIES FOR THE QUALITY, ACCURACY AND/OR COMPLETENESS OF THE BLOOMBERG BARCLAYS INDEX OR ANY DATA INCLUDED THEREIN OR FOR INTERRUPTIONS IN THE DELIVERY OF THE BLOOMBERG BARCLAYS INDEX. NEITHER BLOOMBERG NOR BARCLAYS MAKES ANY WARRANTY, EXPRESS OR IMPLIED, AS TO RESULTS TO BE OBTAINED BY THE ISSUER, THE INVESTORS OR ANY OTHER PERSON OR ENTITY FROM THE USE OF THE BLOOMBERG BARCLAYS INDEX OR ANY DATA INCLUDED THEREIN. NEITHER BLOOMBERG NOR BARCLAYS MAKES ANY EXPRESS OR IMPLIED WARRANTIES, AND EACH HEREBY EXPRESSLY DISCLAIMS ALL WARRANTIES OF MERCHANTABILITY OR FITNESS FOR A PARTICULAR PURPOSE OR USE WITH RESPECT TO THE BLOOMBERG BARCLAYS INDEX OR ANY DATA INCLUDED THEREIN. BLOOMBERG RESERVES THE RIGHT TO CHANGE THE METHODS OF CALCULATION OR PUBLICATION, OR TO CEASE THE CALCULATION OR PUBLICATION OF THE BLOOMBERG BARCLAYS INDEX, AND NEITHER BLOOMBERG NOR BARCLAYS SHALL BE LIABLE FOR ANY MISCALCULATION OF OR ANY INCORRECT, DELAYED OR INTERRUPTED PUBLICATION WITH RESPECT TO ANY OF THE BLOOMBERG BARCLAYS INDEX. NEITHER BLOOMBERG NOR BARCLAYS SHALL BE LIABLE FOR ANY DAMAGES, INCLUDING, WITHOUT LIMITATION, ANY SPECIAL, INDIRECT OR CONSEQUENTIAL DAMAGES, OR ANY LOST PROFITS AND EVEN IF ADVISED OF THE POSSIBILITY OF SUCH, RESULTING FROM THE USE OF THE BLOOMBERG BARCLAYS INDEX OR ANY DATA INCLUDED THEREIN OR WITH RESPECT TO THE WELLINGTON FUND.
None of the information supplied by Bloomberg or Barclays and used in this publication may be reproduced in any manner without the prior written permission of both Bloomberg and Barclays Capital, the investment banking division of Barclays Bank Plc. Barclays Bank Plc is registered in England No. 1026167. Registered office 1 Churchill Place London E14 5HP.
© 2021 Bloomberg. Used with Permission.
Source: Bloomberg Index Services Limited. Copyright 2021, Bloomberg. All rights reserved.
36
This page intentionally left blank.
This page intentionally left blank.
This page intentionally left blank.
This page intentionally left blank.
This page intentionally left blank.
This page intentionally left blank.
The People Who Govern Your Fund
The trustees of your mutual fund are there to see that the fund is operated and managed in your best interests since, as a shareholder, you are a part owner of the fund. Your fund’s trustees also serve on the board of directors of The Vanguard Group, Inc., which is owned by the Vanguard funds and provides services to them.
A majority of Vanguard’s board members are independent, meaning that they have no affiliation with Vanguard or the funds they oversee, apart from the sizable personal investments they have made as private individuals. The independent board members have distinguished backgrounds in business, academia, and public service. Each of the trustees and executive officers oversees 211 Vanguard funds.
Information for each trustee and executive officer of the fund appears below. That information, as well as the Vanguard fund count, is as of the date on the cover of this fund report. The mailing address of the trustees and officers is P.O. Box 876, Valley Forge, PA 19482. More information about the trustees is in the Statement of Additional Information, which can be obtained, without charge, by contacting Vanguard at 800-662-7447, or online at vanguard.com.
Interested Trustee1
Mortimer J. Buckley
Born in 1969. Trustee since January 2018. Principal occupation(s) during the past five years and other experience: chairman of the board (2019–present) of Vanguard and of each of the investment companies served by Vanguard; chief executive officer (2018–present) of Vanguard; chief executive officer, president, and trustee (2018–present) of each of the investment companies served by Vanguard; president and director (2017–present) of Vanguard; and president (2018–present) of Vanguard Marketing Corporation. Chief investment officer (2013–2017), managing director (2002–2017), head of the Retail Investor Group (2006–2012), and chief information officer (2001–2006) of Vanguard. Chairman of the board (2011–2017) and trustee (2009–2017) of the Children’s Hospital of Philadelphia; and trustee (2018–present) and vice chair (2019–present) of The Shipley School.
Independent Trustees
Emerson U. Fullwood
Born in 1948. Trustee since January 2008. Principal occupation(s) during the past five years and other experience: executive chief staff and marketing officer for North America and corporate vice president (retired 2008) of Xerox Corporation (document management products and services). Former president of the Worldwide Channels Group, Latin America, and Worldwide Customer Service and executive chief staff officer of Developing Markets of Xerox. Executive in residence and 2009–2010 Distinguished Minett Professor at the Rochester Institute of Technology. Director of SPX FLOW, Inc. (multi-industry manufacturing). Director of the University of Rochester Medical Center, the Monroe Community College Foundation, the United Way of Rochester, North Carolina A&T University, and Roberts Wesleyan College. Trustee of the University of Rochester.
Amy Gutmann
Born in 1949. Trustee since June 2006. Principal occupation(s) during the past five years and other experience: president (2004–present) of the University of Pennsylvania. Christopher H. Browne Distinguished Professor of Political Science, School of Arts and Sciences, and professor of communication, Annenberg School for Communication, with secondary faculty appointments in the Department of Philosophy, School of Arts and Sciences, and at the Graduate School of Education, University of Pennsylvania.
F. Joseph Loughrey
Born in 1949. Trustee since October 2009. Principal occupation(s) during the past five years and other experience: president and chief operating officer (retired 2009) and vice chairman of the board (2008–2009) of Cummins Inc. (industrial machinery). Chairman of the board of Hillenbrand, Inc. (specialized consumer services) and the Lumina Foundation. Director of the V Foundation. Member of the advisory
| 1 | Mr. Buckley is considered an “interested person,” as defined in the Investment Company Act of 1940, because he is an officer of the Vanguard funds. |
council for the College of Arts and Letters and chair of the advisory board to the Kellogg Institute for International Studies, both at the University of Notre Dame.
Mark Loughridge
Born in 1953. Trustee since March 2012. Principal occupation(s) during the past five years and other experience: senior vice president and chief financial officer (retired 2013) of IBM (information technology services). Fiduciary member of IBM’s Retirement Plan Committee (2004–2013), senior vice president and general manager (2002–2004) of IBM Global Financing, vice president and controller (1998–2002) of IBM, and a variety of other prior management roles at IBM. Member of the Council on Chicago Booth.
Scott C. Malpass
Born in 1962. Trustee since March 2012. Principal occupation(s) during the past five years and other experience: chief investment officer (retired June 2020) and vice president (retired June 2020) of the University of Notre Dame. Assistant professor of finance at the Mendoza College of Business, University of Notre Dame, and member of the Notre Dame 403(b) Investment Committee (retired June 2020). Member of the board of Catholic Investment Services, Inc. (investment advisors) and the board of superintendence of the Institute for the Works of Religion.
Deanna Mulligan
Born in 1963. Trustee since January 2018. Principal occupation(s) during the past five years and other experience: board chair (2020–present), chief executive officer (2011–2020), and president (2010–2019) of The Guardian Life Insurance Company of America. Chief operating officer (2010–2011) and executive vice president (2008–2010) of the individual life and disability division of Guardian Life. Member of the board of the American Council of Life Insurers and the board of the Economic Club of New York. Trustee of the Partnership for New York City (business leadership), Chief Executives for Corporate Purpose, NewYork- Presbyterian Hospital, Catalyst, and the Bruce Museum (arts and science). Member of the Advisory Council for the Stanford Graduate School of Business.
André F. Perold
Born in 1952. Trustee since December 2004. Principal occupation(s) during the past five years and other experience: George Gund Professor of Finance and Banking, Emeritus at the Harvard Business School (retired 2011). Chief investment officer and co-managing partner of HighVista Strategies (private investment firm). Member of the board of advisors and member of the investment committee of the Museum of Fine Arts Boston. Member of the board (2018–present) of RIT Capital Partners (investment firm). Member of the investment committee of Partners Health Care System.
Sarah Bloom Raskin
Born in 1961. Trustee since January 2018. Principal occupation(s) during the past five years and other experience: deputy secretary (2014–2017) of the United States Department of the Treasury. Governor (2010–2014) of the Federal Reserve Board. Commissioner (2007–2010) of financial regulation for the State of Maryland. Member of the board of directors (2012–2014) of Neighborhood Reinvestment Corporation. Director (2017–present) of i(x) Investments, LLC; director (2017–present) of Reserve Trust. Rubenstein Fellow (2017–present) of Duke University; trustee (2017–present) of Amherst College, and trustee (2019–present) of the Folger Shakespeare Library.
Peter F. Volanakis
Born in 1955. Trustee since July 2009. Principal occupation(s) during the past five years and other experience: president and chief operating officer (retired 2010) of Corning Incorporated (communications equipment) and director of Corning Incorporated (2000–2010) and Dow Corning (2001–2010). Director (2012) of SPX Corporation (multi-industry manufacturing). Overseer of the Amos Tuck School of Business Administration, Dartmouth College (2001–2013). Chairman of the board of trustees of Colby-Sawyer College. Member of the board of Hypertherm Inc. (industrial cutting systems, software, and consumables).
Executive Officers
John Bendl
Born in 1970. Principal occupation(s) during the past five years and other experience: principal of Vanguard. Chief financial officer (2019–present) of each of the investment companies served by Vanguard. Chief accounting officer, treasurer, and controller of Vanguard (2017–present). Partner (2003–2016) at KPMG (audit, tax, and advisory services).
Christine M. Buchanan
Born in 1970. Principal occupation(s) during the past five years and other experience: principal of Vanguard. Treasurer (2017–present) of each of the investment companies served by Vanguard. Partner (2005–2017) at KPMG (audit, tax, and advisory services).
David Cermak
Born in 1960. Principal occupation(s) during the past five years and other experience: principal of Vanguard. Finance director (2019–present) of each of the investment companies served by Vanguard. Managing director and head (2017–present) of Vanguard Investments Singapore. Managing director and head (2017–2019) of Vanguard Investments Hong Kong. Representative director and head (2014–2017) of Vanguard Investments Japan.
John Galloway
Born in 1973. Principal occupation(s) during the past five years and other experience: principal of Vanguard. Investment stewardship officer (September 2020–present) of each of the investment companies served by Vanguard. Head of Investor Advocacy (February 2020–present) and head of Marketing Strategy and Planning (2017–2020) at Vanguard. Deputy assistant to the President of the United States (2015).
Thomas J. Higgins
Born in 1957. Principal occupation(s) during the past five years and other experience: principal of Vanguard. Finance director (2019–present), chief financial officer (2008–2019), and treasurer (1998–2008) of each of the investment companies served by Vanguard.
Peter Mahoney
Born in 1974. Principal occupation(s) during the past five years and other experience: principal of Vanguard. Controller (2015–present) of each of the investment companies served by Vanguard. Head of International Fund Services (2008–2014) at Vanguard.
Anne E. Robinson
Born in 1970. Principal occupation(s) during the past five years and other experience: general counsel (2016–present) of Vanguard. Secretary (2016–present) of Vanguard and of each of the investment companies served by Vanguard. Managing director (2016–present) of Vanguard. Managing director and general counsel of Global Cards and Consumer Services (2014–2016) at Citigroup. Counsel (2003–2014) at American Express.
Michael Rollings
Born in 1963. Principal occupation(s) during the past five years and other experience: finance director (2017–present) and treasurer (2017) of each of the investment companies served by Vanguard. Managing director (2016–present) of Vanguard. Chief financial officer (2016–present) of Vanguard. Director (2016–present) of Vanguard Marketing Corporation. Executive vice president and chief financial officer (2006–2016) of MassMutual Financial Group.
John E. Schadl
Born in 1972. Principal occupation(s) during the past five years and other experience: principal of Vanguard. Chief compliance officer (2019–present) of Vanguard and of each of the investment companies served by Vanguard. Assistant vice president (2019–present) of Vanguard Marketing Corporation.
Vanguard Senior Management Team
| Joseph Brennan | James M. Norris | |
| Mortimer J. Buckley | Thomas M. Rampulla | |
| Gregory Davis | Karin A. Risi | |
| John James | Anne E. Robinson | |
| John T. Marcante | Michael Rollings | |
| Chris D. McIsaac | Lauren Valente |

Connect with Vanguard® > vanguard.com
| Fund Information > 800-662-7447 |
Direct Investor Account Services > 800-662-2739
Institutional Investor Services > 800-523-1036
Text Telephone for People
Who Are Deaf or Hard of Hearing > 800-749-7273
This material may be used in conjunction with the offering of shares of any Vanguard fund only if preceded or accompanied by the fund’s current prospectus.
All comparative mutual fund data are from Morningstar, Inc., unless otherwise noted.
You can obtain a free copy of Vanguard’s proxy voting guidelines by visiting vanguard.com/proxyreporting or by calling Vanguard at 800-662-2739. The guidelines are also available from the SEC’s website, www.sec.gov. In addition, you may obtain a free report on how your fund voted the proxies for securities it owned during the 12 months ended June 30. To get the report, visit either vanguard.com/proxyreporting or www.sec.gov.
You can review information about your fund on the SEC’s website, and you can receive copies of this information, for a fee, by sending a request via email addressed to publicinfo@sec.gov.
CFA® is a registered trademark owned by CFA Institute.
| © 2021 The Vanguard Group, Inc. | |
| All rights reserved. | |
| Vanguard Marketing Corporation, Distributor. | |
| Q210 012021 | |

Annual Report | November 30, 2020
Vanguard U.S. Factor ETFs
Vanguard U.S. Liquidity Factor ETF
Vanguard U.S. Minimum Volatility ETF
Vanguard U.S. Momentum Factor ETF
Vanguard U.S. Multifactor ETF
Vanguard U.S. Quality Factor ETF
Vanguard U.S. Value Factor ETF
| Contents | ||
| Your Fund’s Performance at a Glance | 1 | |
| Advisor’s Report | 2 | |
| About Your Fund’s Expenses | 4 | |
| U.S. Liquidity Factor ETF | 6 | |
| U.S. Minimum Volatility ETF | 27 | |
| U.S. Momentum Factor ETF | 41 | |
| U.S. Multifactor ETF | 61 | |
| U.S. Quality Factor ETF | 80 | |
| U.S. Value Factor ETF | 101 |
Please note: The opinions expressed in this report are just that—informed opinions. They should not be considered promises or advice. Also, please keep in mind that the information and opinions cover the period through the date on the front of this report. Of course, the risks of investing in your fund are spelled out in the prospectus.
Your Fund’s Performance at a Glance
· Vanguard’s six U.S. Factor ETFs posted returns ranging from about –2% to nearly 26% for the 12 months ended November 30, 2020. All but one of the six ETFs trailed the 19.02% return of their benchmark, the Russell 3000 Index.
· The U.S. Factor ETFs seek to provide long-term capital appreciation by investing in stocks that have lower or higher measures of certain factors relative to the broad U.S. equity market.
· Vanguard U.S. Momentum Factor ETF did best among the group, returning 25.91% based on net asset value.
· Vanguard U.S. Minimum Volatility ETF produced the lowest returns, at –1.99% based on net asset value. Performance was held back as defensive sectors favored by this strategy provided muted downside protection during the market downturn earlier this year and trailed during the rebound.
Market Barometer
| Average Annual Total Returns | ||||
| Periods Ended November 30, 2020 | ||||
| One Year | Three Years | Five Years | ||
| Stocks | ||||
| Russell 1000 Index (Large-caps) | 19.41% | 13.66% | 14.23% | |
| Russell 2000 Index (Small-caps) | 13.59 | 7.09 | 10.25 | |
| Russell 3000 Index (Broad U.S. market) | 19.02 | 13.20 | 13.95 | |
| FTSE All-World ex US Index (International) | 10.01 | 4.12 | 7.62 | |
| Bonds | ||||
| Bloomberg Barclays U.S. Aggregate Bond Index | ||||
| (Broad taxable market) | 7.28% | 5.45% | 4.34% | |
| Bloomberg Barclays Municipal Bond Index | ||||
| (Broad tax-exempt market) | 4.89 | 4.80 | 3.93 | |
| FTSE Three-Month U.S. Treasury Bill Index | 0.72 | 1.59 | 1.16 | |
| CPI | ||||
| Consumer Price Index | 1.17% | 1.80% | 1.86% | |
1
Advisor’s Report
For the 12 months ended November 30, 2020, Vanguard’s six U.S. Factor ETFs posted returns ranging from about –2% for the U.S. Minimum Volatility ETF to nearly 26% for the U.S. Momentum Factor ETF. All but one of the six ETFs trailed the approximately 19% return of their benchmark, the Russell 3000 Index.
The objective of each U.S. Factor ETF is to create a portfolio that has broad exposure to large-, mid-, and small-capitalization U.S. equities and that has the potential for long-term capital appreciation, subject to rules-based screens as follows:
· Vanguard U.S. Liquidity Factor ETF seeks exposure to stocks with lower measures of trading liquidity, such as daily trading volume and its effect on the security’s price.
· Vanguard U.S. Minimum Volatility ETF seeks to build a portfolio of stocks with lower volatility relative to the broad U.S. equity market.
· Vanguard U.S. Momentum Factor ETF seeks exposure to stocks with relatively strong recent performance, as identified by measures such as returns over different periods.
· Vanguard U.S. Multifactor ETF seeks exposure to stocks with relatively strong recent performance, strong fundamentals, and low prices relative to fundamentals.
· Vanguard U.S. Quality Factor ETF seeks exposure to stocks with strong fundamentals as identified by measures such as profitability, earnings, and balance-sheet strength.
· Vanguard U.S. Value Factor ETF seeks exposure to stocks with lower prices relative to fundamental measures of value such as book/price and earnings/price ratios.
The investment environment
The fiscal year was marked by the global spread of COVID-19 and efforts to contain it. After a sharp, pandemic-related decline earlier in 2020, global stocks began a rebound in March that continued throughout most of the period.
Massive fiscal and monetary support from governments and central banks, signs of economic healing, and reported progress toward a COVID-19 vaccine all buoyed the markets. The U.S. Federal Reserve continued its supportive policy, cutting rates to near zero in March to help bolster the market. At the end of the fiscal year, the market reacted positively to the U.S. presidential election and COVID-19 vaccine development with strong performance throughout November.
For the 12 months, the FTSE Global All Cap Index returned 15.10%. The U.S. stock market returned 17.46%, as measured by the Standard & Poor’s 500 Index, outperforming emerging markets and especially developed markets outside the United States. Large-cap stocks bested small-caps, and growth stocks outpaced value.
2
The ETFs’ successes and shortfalls
Exposure to small-cap and value stocks dampened returns for most of the ETFs for the 12 months. Sector exposure affected the ETFs differently based on the factors each seeks to emphasize:
· The U.S. Liquidity Factor ETF posted positive relative results in four sectors: health care, telecommunications, consumer staples, and energy. Technology, consumer discretionary, and financials were the biggest relative laggards.
· The U.S. Minimum Volatility ETF benefited from its positions in energy, basic materials, and real estate. Consumer discretionary, financials, and health care were the biggest relative detractors.
· The U.S. Momentum Factor ETF benefited most on a relative basis from its positions in financials, energy, and health care. Technology, industrials, and basic materials were the biggest relative detractors.
· The U.S. Multifactor ETF was held back in particular by holdings in technology, consumer discretionary, and financials but benefited from holdings in real estate, utilities, energy, and telecommunications.
· The U.S. Quality Factor ETF was hurt most by holdings in consumer discretionary, technology, and financials. It was helped most by its positions in utilities, consumer staples, and telecommunications.
· The U.S. Value Factor ETF fell especially short in technology, consumer discretionary, and financials. Real estate, industrials, consumer staples, and telecommunications were the only sectors that produced positive relative results.
We expect our approach to portfolio construction to produce long-term capital appreciation that reflects the factors emphasized by each of the U.S. Factor ETF portfolios. Results will vary over different periods across the different factors. However, we believe that focusing on the risk-adjusted returns of each portfolio relative to its targeted factors and the benchmark will serve investors well over time.
We thank you for your investment and look forward to serving you in the period ahead.
Antonio Picca, Senior Portfolio Manager, Head of Factor-Based Strategies
Vanguard Quantitative Equity Group
December 14, 2020
3
About Your Fund’s Expenses
As a shareholder of the fund, you incur ongoing costs, which include costs for portfolio management, administrative services, and shareholder reports (like this one), among others. Operating expenses, which are deducted from a fund’s gross income, directly reduce the investment return of the fund.
A fund’s expenses are expressed as a percentage of its average net assets. This figure is known as the expense ratio. The following examples are intended to help you understand the ongoing costs (in dollars) of investing in your fund and to compare these costs with those of other mutual funds. The examples are based on an investment of $1,000 made at the beginning of the period shown and held for the entire period.
The accompanying table illustrates your fund’s costs in two ways:
· Based on actual fund return. This section helps you to estimate the actual expenses that you paid over the period. The ”Ending Account Value“ shown is derived from the fund‘s actual return, and the third column shows the dollar amount that would have been paid by an investor who started with $1,000 in the fund. You may use the information here, together with the amount you invested, to estimate the expenses that you paid over the period.
To do so, simply divide your account value by $1,000 (for example, an $8,600 account value divided by $1,000 = 8.6), then multiply the result by the number given for your fund under the heading ”Expenses Paid During Period.“
· Based on hypothetical 5% yearly return. This section is intended to help you compare your fund‘s costs with those of other mutual funds. It assumes that the fund had a yearly return of 5% before expenses, but that the expense ratio is unchanged. In this case—because the return used is not the fund’s actual return—the results do not apply to your investment. The example is useful in making comparisons because the Securities and Exchange Commission requires all mutual funds to calculate expenses based on a 5% return. You can assess your fund’s costs by comparing this hypothetical example with the hypothetical examples that appear in shareholder reports of other funds.
Note that the expenses shown in the table are meant to highlight and help you compare ongoing costs only and do not reflect transaction costs incurred by the fund for buying and selling securities. Further, the expenses do not include any purchase, redemption, or account service fees described in the fund prospectus. If such fees were applied to your account, your costs would be higher. Your fund does not carry a “sales load.”
The calculations assume no shares were bought or sold during the period. Your actual costs may have been higher or lower, depending on the amount of your investment and the timing of any purchases or redemptions.
You can find more information about the fund’s expenses, including annual expense ratios, in the Financial Statements section of this report. For additional information on operating expenses and other shareholder costs, please refer to your fund’s current prospectus.
4
Six Months Ended November 30, 2020
| Beginning | Ending | Expenses | |
| Account Value | Account Value | Paid During | |
| 5/31/2020 | 11/30/2020 | Period | |
| Based on Actual Fund Return | |||
| U.S. Liquidity Factor ETF | |||
| ETF Shares | $1,000.00 | $1,213.99 | $0.72 |
| U.S. Minimum Volatility ETF | |||
| ETF Shares | $1,000.00 | $1,095.73 | $0.68 |
| U.S. Momentum Factor ETF | |||
| ETF Shares | $1,000.00 | $1,286.75 | $0.74 |
| U.S. Multifactor ETF | |||
| ETF Shares | $1,000.00 | $1,206.11 | $1.05 |
| U.S. Quality Factor ETF | |||
| ETF Shares | $1,000.00 | $1,240.36 | $0.73 |
| U.S. Value Factor ETF | |||
| ETF Shares | $1,000.00 | $1,288.40 | $0.80 |
| Based on Hypothetical 5% Yearly Return | |||
| U.S. Liquidity Factor ETF | |||
| ETF Shares | $1,000.00 | $1,024.35 | $0.66 |
| U.S. Minimum Volatility ETF | |||
| ETF Shares | $1,000.00 | $1,024.35 | $0.66 |
| U.S. Momentum Factor ETF | |||
| ETF Shares | $1,000.00 | $1,024.35 | $0.66 |
| U.S. Multifactor ETF | |||
| ETF Shares | $1,000.00 | $1,024.05 | $0.96 |
| U.S. Quality Factor ETF | |||
| ETF Shares | $1,000.00 | $1,024.35 | $0.66 |
| U.S. Value Factor ETF | |||
| ETF Shares | $1,000.00 | $1,024.30 | $0.71 |
The calculations are based on expenses incurred in the most recent six-month period. The funds’ annualized six-month expense ratios for that period are 0.13% for the U.S. Liquidity Factor ETF, 0.13% for the U.S. Minimum Volatility ETF, 0.13% for the U.S. Momentum Factor ETF, 0.19% for the U.S. Multifactor ETF, 0.13% for the U.S. Quality Factor ETF, and 0.14% for the U.S. Value Factor ETF. The dollar amounts shown as “Expenses Paid” are equal to the annualized expense ratio multiplied by the average account value over the period, multiplied by the number of days in the most recent six-month period, then divided by the number of days in the most recent 12-month period (183/366).
5
U.S. Liquidity Factor ETF
Performance Summary
All of the returns in this report represent past performance, which is not a guarantee of future results that may be achieved by the fund. (Current performance may be lower or higher than the performance data cited. For performance data current to the most recent month-end, visit our website at vanguard.com/performance.) Note, too, that both investment returns and principal value can fluctuate widely, so an investor’s shares, when sold, could be worth more or less than their original cost. The returns shown do not reflect taxes that a shareholder would pay on fund distributions or on the sale of fund shares.
Cumulative Performance: February 13, 2018, Through November 30, 2020
Initial Investment of $10,000
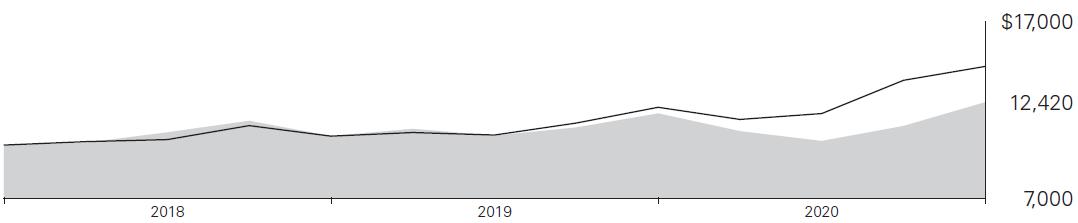
| Average Annual Total Returns | ||||
| Periods Ended November 30, 2020 | ||||
| Since | Final Value | |||
| One | Inception | of a $10,000 | ||
| Year | (2/13/2018) | Investment | ||
 |
U.S. Liquidity Factor ETF Net Asset Value | 5.38% | 8.06% | $12,420 |
| U.S. Liquidity Factor ETF Market Price | 5.40 | 8.08 | 12,426 | |
 |
Russell 3000 Index | 19.02 | 14.05 | 14,440 |
"Since Inception" performance is calculated from the ETF Shares’ inception date for both the fund and its comparative standard(s).
Cumulative Returns of ETF Shares: February 13, 2018, Through November 30, 2020
| Since | ||
| One | Inception | |
| Year | (2/13/2018) | |
| U.S. Liquidity Factor ETF Market Price | 5.40% | 24.26% |
| U.S. Liquidity Factor ETF Net Asset Value | 5.38 | 24.20 |
| Russell 3000 Index | 19.02 | 44.40 |
"Since Inception" performance is calculated from the ETF Shares’ inception date for both the fund and its comparative standard(s).
The market price is determined by the midpoint of the bid-offer spread as of the closing time of the New York Stock Exchange (generally 4 p.m., Eastern time). The net asset value is also determined as of the NYSE closing time. For more information about how the ETF Shares' market prices have compared with their net asset value, visit vanguard.com, select your ETF, and then select the Price and Performance tab. The ETF premium/discount analysis there shows the percentages of days on which the ETF Shares' market price was above or below the NAV.
See Financial Highlights for dividend and capital gains information.
6
U.S. Liquidity Factor ETF
Fund Allocation
As of November 30, 2020
| Basic Materials | 4.8% |
| Consumer Discretionary | 8.1 |
| Consumer Staples | 3.6 |
| Energy | 2.2 |
| Financials | 23.6 |
| Health Care | 13.7 |
| Industrials | 18.3 |
| Real Estate | 8.3 |
| Technology | 8.3 |
| Telecommunications | 2.2 |
| Utilities | 6.9 |
The table reflects the fund’s investments, except for short-term investments and derivatives. Sector categories are based on the Industry Classification Benchmark ("ICB"), except for the "Other" category (if applicable), which includes secur-ities that have not been provided an ICB classification as of the effective reporting period.
The Industry Classification Benchmark ("ICB") is owned by FTSE. FTSE does not accept any liability to any person for any loss or damage arising out of any error or omission in the ICB.
7
U.S. Liquidity Factor ETF
Financial Statements
Schedule of Investments
As of November 30, 2020
The fund files its complete schedule of portfolio holdings with the Securities and Exchange Commission (SEC) for the first and third quarters of each fiscal year as an exhibit to its reports on Form N-PORT. The fund’s Form N-PORT reports are available on the SEC’s website at www.sec.gov.
| Market | |||
| Value• | |||
| Shares | ($000) | ||
| Common Stocks (99.4%) | |||
| Basic Materials (4.8%) | |||
| Air Products & Chemicals Inc. | 912 | 255 | |
| Dow Inc. | 4,031 | 214 | |
| Southern Copper Corp. | 2,191 | 130 | |
| Ecolab Inc. | 492 | 109 | |
| Timken Co. | 1,365 | 100 | |
| Linde plc | 359 | 92 | |
| NewMarket Corp. | 230 | 85 | |
| Balchem Corp. | 640 | 66 | |
| UFP Industries Inc. | 1,213 | 65 | |
| * | RBC Bearings Inc. | 380 | 64 |
| Reliance Steel & Aluminum Co. | 538 | 63 | |
| Valvoline Inc. | 2,455 | 56 | |
| * | AdvanSix Inc. | 2,899 | 52 |
| * | Kraton Corp. | 1,626 | 44 |
| Scotts Miracle-Gro Co. | 248 | 44 | |
| Stepan Co. | 320 | 37 | |
| Huntsman Corp. | 1,336 | 33 | |
| Westlake Chemical Corp. | 438 | 33 | |
| Haynes International Inc. | 1,534 | 33 | |
| Orion Engineered Carbons SA | 1,782 | 28 | |
| * | Energy Fuels Inc. | 13,168 | 27 |
| * | Novagold Resources Inc. | 2,574 | 26 |
| Gold Resource Corp. | 8,283 | 25 | |
| * | Clearwater Paper Corp. | 706 | 25 |
| * | Koppers Holdings Inc. | 903 | 24 |
| W R Grace & Co. | 423 | 23 | |
| Minerals Technologies Inc. | 379 | 23 | |
| Materion Corp. | 392 | 23 | |
| Ashland Global Holdings Inc. | 293 | 22 | |
| Mueller Industries Inc. | 668 | 22 | |
| Glatfelter Corp. | 1,357 | 22 | |
| * | NN Inc. | 3,112 | 19 |
| DuPont de Nemours Inc. | 281 | 18 | |
| Avery Dennison Corp. | 80 | 12 | |
| Verso Corp. | 925 | 10 | |
| 1,924 | |||
| Consumer Discretionary (7.9%) | |||
| Ross Stores Inc. | 1,121 | 121 | |
| Amerco | 216 | 89 | |
| Dolby Laboratories Inc. Class A | 993 | 88 | |
| * | O’Reilly Automotive Inc. | 194 | 86 |
| Pool Corp. | 216 | 75 | |
| Yum! Brands Inc. | 701 | 74 | |
| Churchill Downs Inc. | 399 | 72 | |
| * | Vera Bradley Inc. | 8,279 | 70 |
| Haverty Furniture Cos. Inc. | 2,537 | 69 | |
| Rollins Inc. | 1,118 | 64 | |
| Choice Hotels International Inc. | 620 | 62 | |
| * | Clean Energy Fuels Corp. | 13,515 | 62 |
| Johnson Outdoors Inc. Class A | 626 | 52 | |
| * | Liberty Media Corp-Liberty Formula One Class C | 1,249 | 52 |
| * | Golden Entertainment Inc | 3,114 | 52 |
| * | Lands’ End Inc. | 2,055 | 51 |
| * | Carrols Restaurant Group Inc. | 7,174 | 49 |
| * | Liberty Media Corp-Liberty SiriusXM Class C | 1,141 | 47 |
| Genuine Parts Co. | 475 | 47 | |
| Carriage Services Inc. Class A | 1,639 | 45 | |
| News Corp. Class A | 2,520 | 44 | |
| Wyndham Destinations Inc. | 1,046 | 44 | |
| Winmark Corp. | 243 | 44 | |
| ViacomCBS Inc. Class A | 1,171 | 43 | |
| * | Green Brick Partners Inc. | 1,957 | 43 |
| Acushnet Holdings Corp. | 1,119 | 42 | |
| Strategic Education Inc. | 438 | 41 | |
| * | frontdoor Inc. | 868 | 41 |
| Gentex Corp. | 1,247 | 41 | |
| Franchise Group Inc. | 1,488 | 40 | |
| Fox Corp. Class B | 1,379 | 39 | |
8
U.S. Liquidity Factor ETF
| Market | |||
| Value• | |||
| Shares | ($000) | ||
| Cato Corp. Class A | 4,849 | 39 | |
| Movado Group Inc. | 2,260 | 38 | |
| * | PlayAGS Inc. | 7,562 | 37 |
| Service Corp. International | 756 | 37 | |
| EW Scripps Co. Class A | 2,653 | 34 | |
| Autoliv Inc. | 380 | 34 | |
| * | Monarch Casino & Resort Inc. | 594 | 33 |
| * | Noodles & Co. | 4,086 | 33 |
| Penske Automotive Group Inc. | 589 | 32 | |
| * | Mesa Air Group Inc. | 5,055 | 32 |
| Bally’s Corp. | 724 | 32 | |
| Sabre Corp. | 2,797 | 31 | |
| * | American Public Education Inc. | 1,011 | 31 |
| Viad Corp. | 1,029 | 31 | |
| Aaron’s Holdings Co. Inc. | 483 | 30 | |
| National CineMedia Inc. | 8,934 | 30 | |
| * | Stoneridge Inc. | 1,087 | 29 |
| Standard Motor Products Inc. | 623 | 29 | |
| * | Fiesta Restaurant Group Inc. | 2,448 | 29 |
| TEGNA Inc. | 1,994 | 29 | |
| * | Del Taco Restaurants Inc. | 3,241 | 29 |
| * | Lindblad Expeditions Holdings Inc. | 2,181 | 28 |
| * | Chuy’s Holdings Inc. | 1,165 | 28 |
| * | Duluth Holdings Inc. | 1,872 | 28 |
| Entercom Communications Corp. Class A | 11,308 | 27 | |
| Leggett & Platt Inc. | 632 | 27 | |
| Qurate Retail Group Inc. QVC Group Class A | 2,552 | 27 | |
| * | Houghton Mifflin Harcourt Co. | 8,859 | 27 |
| * | Motorcar Parts of America Inc. | 1,303 | 26 |
| * | Liberty Media Corp-Liberty Braves | 1,048 | 26 |
| Coty Inc. Class A | 3,633 | 26 | |
| * | MarineMax Inc. | 772 | 25 |
| * | Accel Entertainment Inc. Class A | 2,417 | 25 |
| * | Liberty TripAdvisor Holdings Inc. Class A | 9,122 | 25 |
| * | Universal Electronics Inc. | 470 | 25 |
| * | Century Casinos Inc. | 4,104 | 24 |
| Tilly’s Inc. Class A | 2,649 | 24 | |
| Ethan Allen Interiors Inc. | 1,315 | 24 | |
| Las Vegas Sands Corp. | 411 | 23 | |
| * | Container Store Group Inc. | 2,460 | 23 |
| Wyndham Hotels & Resorts Inc. | 396 | 23 | |
| National Presto Industries Inc. | 262 | 22 | |
| Marcus Corp. | 1,477 | 17 | |
| * | Floor & Decor Holdings Inc. Class A | 212 | 17 |
| Marriott Vacations Worldwide Corp. | 133 | 17 | |
| Inter Parfums Inc. | 309 | 17 | |
| * | ZAGG Inc. | 4,225 | 16 |
| * | El Pollo Loco Holdings Inc. | 1,026 | 16 |
| * | AutoNation Inc. | 251 | 15 |
| HNI Corp. | 364 | 13 | |
| * | Bright Horizons Family Solutions Inc. | 72 | 12 |
| * | Lovesac Co. | 321 | 10 |
| * | Sportsman’s Warehouse Holdings Inc. | 711 | 10 |
| * | Quotient Technology Inc. | 1,296 | 10 |
| VF Corp. | 103 | 9 | |
| Columbia Sportswear Co. | 99 | 8 | |
| 3,188 | |||
| Consumer Staples (3.5%) | |||
| * | Monster Beverage Corp. | 2,281 | 193 |
| Sysco Corp. | 2,648 | 189 | |
| Kimberly-Clark Corp. | 907 | 126 | |
| * | Darling Ingredients Inc. | 2,497 | 121 |
| Keurig Dr Pepper Inc. | 2,241 | 68 | |
| Brown-Forman Corp. Class A | 913 | 67 | |
| Lancaster Colony Corp. | 396 | 67 | |
| * | Pilgrim’s Pride Corp. | 3,500 | 66 |
| Weis Markets Inc. | 1,353 | 65 | |
| Seaboard Corp. | 20 | 64 | |
| Brown-Forman Corp. Class B | 610 | 49 | |
| Flowers Foods Inc. | 2,132 | 47 | |
| Philip Morris International Inc. | 562 | 43 | |
| Walgreens Boots Alliance Inc. | 908 | 35 | |
| Colgate-Palmolive Co. | 345 | 30 | |
| Tootsie Roll Industries Inc. | 895 | 28 | |
| Constellation Brands Inc. Class A | 117 | 24 | |
| * | Performance Food Group Co. | 554 | 24 |
| Andersons Inc. | 1,053 | 24 | |
| SpartanNash Co. | 1,100 | 21 | |
| Core-Mark Holding Co. Inc. | 621 | 19 | |
9
U.S. Liquidity Factor ETF
| Market | |||
| Value• | |||
| Shares | ($000) | ||
| ACCO Brands Corp. | 2,112 | 16 | |
| Universal Corp. | 301 | 14 | |
| Turning Point Brands Inc. | 339 | 13 | |
| Kraft Heinz Co. | 249 | 8 | |
| 1,421 | |||
| Energy (2.2%) | |||
| Kinder Morgan Inc. | 11,366 | 163 | |
| Phillips 66 | 2,019 | 122 | |
| EOG Resources Inc. | 1,624 | 76 | |
| Liberty Oilfield Services Inc. Class A | 6,305 | 59 | |
| * | Frank’s International NV | 19,300 | 43 |
| * | REX American Resources Corp. | 494 | 39 |
| Berry Corp. | 9,829 | 38 | |
| * | Matrix Service Co. | 3,673 | 35 |
| * | Tidewater Inc. | 3,503 | 33 |
| * | Oil States International Inc. | 7,482 | 33 |
| Archrock Inc. | 3,688 | 29 | |
| * | CONSOL Energy Inc. | 5,014 | 26 |
| * | KLX Energy Services Holdings Inc. | 3,854 | 26 |
| SunCoke Energy Inc. | 5,788 | 26 | |
| * | Talos Energy Inc. | 2,943 | 25 |
| * | Comstock Resources Inc. | 5,067 | 25 |
| * | Bonanza Creek Energy Inc. | 1,026 | 23 |
| Marathon Petroleum Corp. | 537 | 21 | |
| * | Newpark Resources Inc. | 10,520 | 16 |
| Antero Midstream Corp. | 1,422 | 10 | |
| Valero Energy Corp. | 147 | 8 | |
| 876 | |||
| Financials (23.5%) | |||
| Moody’s Corp. | 1,198 | 338 | |
| Aflac Inc. | 5,925 | 260 | |
| Truist Financial Corp. | 5,553 | 258 | |
| Intercontinental Exchange Inc. | 2,236 | 236 | |
| Marsh & McLennan Cos. Inc. | 2,003 | 230 | |
| Allstate Corp. | 2,208 | 226 | |
| Prudential Financial Inc. | 2,942 | 222 | |
| Aon plc Class A | 1,055 | 216 | |
| Travelers Cos. Inc. | 1,510 | 196 | |
| Chubb Ltd. | 1,315 | 194 | |
| T. Rowe Price Group Inc. | 1,172 | 168 | |
| Progressive Corp. | 1,798 | 157 | |
| Bank of New York Mellon Corp. | 3,829 | 150 | |
| American International Group Inc. | 3,714 | 143 | |
| BlackRock Inc. | 200 | 140 | |
| US Bancorp | 2,815 | 122 | |
| PNC Financial Services Group Inc. | 878 | 121 | |
| RLI Corp. | 1,118 | 107 | |
| MetLife Inc. | 2,199 | 102 | |
| S&P Global Inc. | 288 | 101 | |
| Brown & Brown Inc. | 2,196 | 99 | |
| First Citizens BancShares Inc. Class A | 183 | 97 | |
| Commerce Bancshares Inc. | 1,259 | 83 | |
| Morningstar Inc. | 408 | 82 | |
| Glacier Bancorp Inc. | 2,000 | 82 | |
| Stifel Financial Corp. | 1,160 | 80 | |
| CME Group Inc. | 447 | 78 | |
| ConnectOne Bancorp Inc. | 4,081 | 72 | |
| East West Bancorp Inc. | 1,683 | 72 | |
| Trustmark Corp. | 2,835 | 70 | |
| First Financial Bankshares Inc. | 2,035 | 68 | |
| Heritage Commerce Corp. | 8,022 | 68 | |
| * | Arch Capital Group Ltd. | 2,072 | 67 |
| Pinnacle Financial Partners Inc. | 1,210 | 66 | |
| Erie Indemnity Co. Class A | 287 | 65 | |
| Primerica Inc. | 487 | 63 | |
| Popular Inc. | 1,293 | 63 | |
| * | Enstar Group Ltd. | 331 | 63 |
| United Bankshares Inc. | 2,130 | 62 | |
| Community Bank System Inc. | 988 | 61 | |
| Globe Life Inc. | 657 | 61 | |
| Provident Financial Services Inc. | 3,878 | 61 | |
| Premier Financial Corp. | 2,909 | 60 | |
| Selective Insurance Group Inc. | 965 | 60 | |
| Live Oak Bancshares Inc. | 1,440 | 59 | |
| Berkshire Hills Bancorp Inc. | 3,576 | 59 | |
| TFS Financial Corp. | 3,409 | 59 | |
| White Mountains Insurance Group Ltd. | 60 | 58 | |
| Valley National Bancorp | 6,277 | 57 | |
| Hanover Insurance Group Inc. | 484 | 54 | |
| First Bancorp | 1,723 | 54 | |
| Central Pacific Financial Corp. | 3,284 | 54 | |
| Kemper Corp. | 705 | 53 | |
| Alleghany Corp. | 89 | 51 | |
| * | StoneX Group Inc. | 818 | 50 |
| Meridian Bancorp Inc. | 3,670 | 50 | |
| Hanmi Financial Corp. | 5,116 | 50 | |
| Radian Group Inc. | 2,639 | 50 | |
| B Riley Financial Inc. | 1,372 | 50 | |
10
| U.S. Liquidity Factor ETF | |||
| Market | |||
| Value• | |||
| Shares | ($000) | ||
| Boston Private Financial Holdings Inc. | 6,867 | 49 | |
| United Fire Group Inc. | 2,217 | 48 | |
| TCF Financial Corp. | 1,430 | 48 | |
| SEI Investments Co. | 908 | 48 | |
| * | Markel Corp. | 49 | 48 |
| First Busey Corp. | 2,344 | 47 | |
| Essent Group Ltd. | 1,060 | 46 | |
| Old Republic International Corp. | 2,570 | 46 | |
| Washington Trust Bancorp Inc. | 1,157 | 45 | |
| Janus Henderson Group plc | 1,572 | 45 | |
| Synovus Financial Corp. | 1,403 | 44 | |
| Univest Financial Corp. | 2,399 | 44 | |
| First Commonwealth Financial Corp. | 4,508 | 44 | |
| BOK Financial Corp. | 630 | 42 | |
| First Financial Bancorp | 2,571 | 41 | |
| * | Customers Bancorp Inc. | 2,387 | 40 |
| Assured Guaranty Ltd. | 1,326 | 40 | |
| First Foundation Inc. | 2,242 | 40 | |
| Northfield Bancorp Inc. | 3,542 | 39 | |
| Heritage Financial Corp. | 1,682 | 39 | |
| Lakeland Bancorp Inc. | 3,253 | 39 | |
| First American Financial Corp. | 800 | 39 | |
| SLM Corp. | 3,649 | 39 | |
| Hope Bancorp Inc. | 4,062 | 38 | |
| 1st Source Corp. | 1,031 | 38 | |
| * | Columbia Financial Inc. | 2,673 | 38 |
| Prosperity Bancshares Inc. | 611 | 38 | |
| Interactive Brokers Group Inc. | 727 | 38 | |
| BancFirst Corp. | 707 | 38 | |
| Lazard Ltd. Class A | 1,007 | 38 | |
| Cohen & Steers Inc. | 522 | 37 | |
| * | Cannae Holdings Inc. | 917 | 36 |
| Axis Capital Holdings Ltd. | 720 | 36 | |
| Lakeland Financial Corp. | 709 | 36 | |
| * | Triumph Bancorp Inc. | 775 | 35 |
| Nelnet Inc. Class A | 517 | 35 | |
| Safety Insurance Group Inc. | 492 | 35 | |
| HCI Group Inc. | 662 | 35 | |
| Equitable Holdings Inc. | 1,345 | 34 | |
| Park National Corp. | 335 | 34 | |
| South State Corp. | 506 | 34 | |
| Cullen/Frost Bankers Inc. | 400 | 34 | |
| Stock Yards Bancorp Inc. | 839 | 33 | |
| * | International Money Express Inc. | 2,084 | 33 |
| Jefferies Financial Group Inc. | 1,417 | 32 | |
| FB Financial Corp. | 1,002 | 32 | |
| Allegiance Bancshares Inc. | 998 | 32 | |
| First Bancshares Inc. | 1,136 | 31 | |
| TriCo Bancshares | 942 | 31 | |
| MGIC Investment Corp. | 2,578 | 31 | |
| HomeStreet Inc. | 941 | 30 | |
| Western Alliance Bancorp | 588 | 30 | |
| * | Silvergate Capital Corp. Class A | 842 | 30 |
| Federal Agricultural Mortgage Corp. Class C | 435 | 29 | |
| Tompkins Financial Corp. | 454 | 29 | |
| NBT Bancorp Inc. | 960 | 29 | |
| PJT Partners Inc. | 413 | 29 | |
| James River Group Holdings Ltd. | 617 | 28 | |
| First Merchants Corp. | 842 | 28 | |
| National Western Life Group Inc. Class A | 150 | 28 | |
| Bryn Mawr Bank Corp. | 931 | 28 | |
| AMERISAFE Inc. | 501 | 27 | |
| Brightsphere Investment Group Inc. | 1,540 | 27 | |
| FirstCash Inc. | 424 | 27 | |
| Atlantic Union Bankshares Corp. | 907 | 27 | |
| Towne Bank | 1,236 | 27 | |
| Capitol Federal Financial Inc. | 2,177 | 27 | |
| Banner Corp. | 635 | 26 | |
| ServisFirst Bancshares Inc. | 692 | 26 | |
| Southside Bancshares Inc. | 881 | 26 | |
| Sculptor Capital Management Inc. Class A | 1,828 | 26 | |
| * | TriState Capital Holdings Inc. | 1,724 | 26 |
| Northwest Bancshares Inc. | 2,135 | 25 | |
| * | Greenlight Capital Re Ltd. Class A | 3,271 | 25 |
| * | Brighthouse Financial Inc. | 717 | 25 |
| City Holding Co. | 380 | 25 | |
| Bank of NT Butterfield & Son Ltd. | 782 | 25 | |
| Unum Group | 1,098 | 24 | |
| * | EZCORP Inc. Class A | 4,764 | 24 |
| LPL Financial Holdings Inc. | 266 | 24 | |
| TrustCo Bank Corp. NY | 3,906 | 24 | |
| Diamond Hill Investment Group Inc. | 173 | 24 | |
| Horace Mann Educators Corp. | 581 | 23 | |
11
| U.S. Liquidity Factor ETF | |||
| Market | |||
| Value• | |||
| Shares | ($000) | ||
| Westamerica BanCorp | 418 | 23 | |
| Preferred Bank | 617 | 23 | |
| * | Bancorp Inc. | 1,916 | 23 |
| ProAssurance Corp. | 1,370 | 22 | |
| * | Focus Financial Partners Inc. Class A | 501 | 20 |
| National Bank Holdings Corp. Class A | 599 | 19 | |
| Curo Group Holdings Corp. | 2,073 | 18 | |
| OneMain Holdings Inc. | 459 | 18 | |
| Sandy Spring Bancorp Inc. | 601 | 18 | |
| Heartland Financial USA Inc. | 440 | 17 | |
| Banc of California Inc. | 1,252 | 17 | |
| Enterprise Financial Services Corp. | 484 | 16 | |
| Hamilton Lane Inc. Class A | 229 | 16 | |
| Greenhill & Co. Inc. | 1,149 | 15 | |
| Independent Bank Corp. | 205 | 14 | |
| * | Enova International Inc. | 653 | 14 |
| Santander Consumer USA Holdings Inc. | 593 | 13 | |
| American National Group Inc. | 150 | 13 | |
| Wintrust Financial Corp. | 225 | 12 | |
| International Bancshares Corp. | 335 | 11 | |
| Heritage Insurance Holdings Inc. | 1,035 | 11 | |
| Renasant Corp. | 346 | 11 | |
| American Financial Group Inc. | 115 | 10 | |
| OFG Bancorp | 595 | 10 | |
| WisdomTree Investments Inc. | 2,146 | 9 | |
| WesBanco Inc. | 308 | 9 | |
| FNB Corp. | 965 | 8 | |
| CNA Financial Corp. | 224 | 8 | |
| 9,436 | |||
| Health Care (13.7%) | |||
| Stryker Corp. | 1,303 | 304 | |
| HCA Healthcare Inc. | 1,686 | 253 | |
| Zoetis Inc. | 1,406 | 226 | |
| Zimmer Biomet Holdings Inc. | 999 | 149 | |
| * | Edwards Lifesciences Corp. | 1,608 | 135 |
| Baxter International Inc. | 1,542 | 117 | |
| * | Vertex Pharmaceuticals Inc. | 367 | 84 |
| * | Boston Scientific Corp. | 2,482 | 82 |
| * | Neogen Corp. | 1,062 | 79 |
| * | Ultragenyx Pharmaceutical Inc. | 643 | 76 |
| Bio-Techne Corp. | 249 | 76 | |
| * | Catalent Inc. | 754 | 73 |
| * | FibroGen Inc. | 1,720 | 71 |
| * | UNITY Biotechnology Inc. | 11,303 | 68 |
| * | NGM Biopharmaceuticals Inc. | 2,863 | 68 |
| * | Quanterix Corp. | 1,517 | 66 |
| * | Syneos Health Inc. | 961 | 63 |
| * | Calithera Biosciences Inc. | 12,006 | 59 |
| * | Globus Medical Inc. | 972 | 58 |
| PerkinElmer Inc. | 427 | 57 | |
| * | Novocure Ltd. | 447 | 56 |
| Bruker Corp. | 1,109 | 56 | |
| * | AngioDynamics Inc. | 3,778 | 54 |
| * | Replimune Group Inc. | 1,032 | 53 |
| * | Charles River Laboratories International Inc. | 225 | 53 |
| * | Prothena Corp. plc | 4,642 | 53 |
| * | Bridgebio Pharma Inc. | 1,028 | 52 |
| * | Providence Service Corp. | 377 | 51 |
| * | Integra LifeSciences Holdings Corp. | 926 | 51 |
| * | Rhythm Pharmaceuticals Inc. | 1,621 | 50 |
| * | Blueprint Medicines Corp. | 455 | 49 |
| * | Rocket Pharmaceuticals Inc. | 1,560 | 48 |
| * | AdaptHealth Corp. Class A | 1,613 | 48 |
| * | Geron Corp. | 25,668 | 48 |
| * | Frequency Therapeutics Inc. | 1,652 | 47 |
| * | Stoke Therapeutics Inc. | 903 | 47 |
| * | Avid Bioservices Inc. | 5,090 | 46 |
| * | SI-BONE Inc. | 1,977 | 46 |
| * | Rubius Therapeutics Inc. | 7,280 | 46 |
| * | Option Care Health Inc. | 2,817 | 44 |
| * | RadNet Inc. | 2,225 | 41 |
| * | BioLife Solutions Inc. | 1,145 | 41 |
| * | Phathom Pharmaceuticals Inc. | 940 | 40 |
| * | Affimed NV | 7,436 | 40 |
| * | CorVel Corp. | 441 | 40 |
| Chemed Corp. | 81 | 39 | |
| * | MEI Pharma Inc. | 13,411 | 39 |
| * | Alnylam Pharmaceuticals Inc. | 293 | 38 |
| * | Denali Therapeutics Inc. | 614 | 37 |
| * | Viela Bio Inc. | 972 | 37 |
| * | Oyster Point Pharma Inc. | 1,678 | 37 |
| * | RAPT Therapeutics Inc. | 1,690 | 37 |
| * | Allakos Inc. | 338 | 36 |
| * | Aprea Therapeutics Inc. | 1,420 | 36 |
| LeMaitre Vascular Inc. | 890 | 35 | |
12
| U.S. Liquidity Factor ETF | |||
| Market | |||
| Value• | |||
| Shares | ($000) | ||
| * | Hanger Inc. | 1,496 | 34 |
| * | Translate Bio Inc. | 1,510 | 34 |
| * | Odonate Therapeutics Inc. | 2,223 | 33 |
| * | Akero Therapeutics Inc. | 1,154 | 33 |
| Hill-Rom Holdings Inc. | 337 | 32 | |
| * | 89bio Inc. | 1,163 | 31 |
| * | Alphatec Holdings Inc. | 2,969 | 31 |
| * | Eiger BioPharmaceuticals Inc | 3,375 | 31 |
| * | Prevail Therapeutics Inc. | 2,923 | 30 |
| * | SpringWorks Therapeutics Inc. | 456 | 30 |
| * | Mustang Bio Inc. | 7,909 | 29 |
| * | Precision BioSciences Inc. | 2,341 | 29 |
| National HealthCare Corp. | 466 | 29 | |
| * | Ocular Therapeutix Inc. | 1,598 | 28 |
| * | Aquestive Therapeutics Inc. | 3,934 | 28 |
| * | Amphastar Pharmaceuticals Inc. | 1,522 | 27 |
| * | Cortexyme Inc. | 553 | 27 |
| * | iCAD Inc. | 2,654 | 27 |
| * | NeoGenomics Inc. | 556 | 26 |
| * | OrthoPediatrics Corp. | 576 | 26 |
| * | Paratek Pharmaceuticals Inc. | 4,208 | 26 |
| * | Y-mAbs Therapeutics Inc. | 509 | 26 |
| * | Natera Inc. | 293 | 26 |
| * | Triple-S Management Corp. Class B | 1,147 | 26 |
| * | Heska Corp. | 205 | 26 |
| * | PRA Health Sciences Inc. | 227 | 25 |
| * | Chiasma Inc. | 5,947 | 25 |
| * | Agenus Inc. | 6,863 | 25 |
| * | Omnicell Inc. | 239 | 25 |
| * | Neoleukin Therapeutics Inc. | 1,964 | 25 |
| * | Cerus Corp. | 3,729 | 25 |
| * | Fortress Biotech Inc | 9,009 | 25 |
| * | Atreca Inc. Class A | 1,590 | 25 |
| * | Nektar Therapeutics Class A | 1,505 | 25 |
| * | Pennant Group Inc. | 484 | 25 |
| * | CytomX Therapeutics Inc. | 3,258 | 25 |
| * | IGM Biosciences Inc. | 365 | 24 |
| * | Harpoon Therapeutics Inc. | 1,612 | 24 |
| * | VYNE Therapeutics Inc. | 14,098 | 24 |
| * | LivaNova plc | 452 | 24 |
| * | TCR2 Therapeutics Inc. | 875 | 24 |
| * | Durect Corp. | 12,557 | 23 |
| * | Antares Pharma Inc. | 7,184 | 22 |
| * | Molecular Templates Inc. | 2,467 | 22 |
| * | TransMedics Group Inc. | 1,472 | 22 |
| * | HealthStream Inc. | 1,165 | 22 |
| * | Inovalon Holdings Inc. Class A | 1,159 | 22 |
| * | Surgery Partners Inc. | 885 | 22 |
| * | Sientra Inc. | 4,061 | 21 |
| * | Repro-Med Systems Inc. | 4,656 | 21 |
| * | MannKind Corp. | 6,828 | 20 |
| * | OraSure Technologies Inc. | 1,683 | 20 |
| * | Horizon Therapeutics plc | 285 | 20 |
| * | Joint Corp. | 790 | 20 |
| * | Arcus Biosciences Inc. | 713 | 19 |
| * | NextGen Healthcare Inc. | 1,079 | 19 |
| * | BioDelivery Sciences International Inc. | 5,025 | 19 |
| * | Adamas Pharmaceuticals Inc. | 4,070 | 18 |
| * | Kura Oncology Inc. | 506 | 18 |
| * | Syros Pharmaceuticals Inc. | 2,239 | 18 |
| * | Quotient Ltd. | 2,590 | 18 |
| * | Immunovant Inc. | 327 | 16 |
| Invacare Corp. | 1,794 | 15 | |
| * | PDL BioPharma Inc. | 6,046 | 15 |
| * | Rigel Pharmaceuticals Inc. | 4,937 | 15 |
| * | Cutera Inc. | 579 | 14 |
| * | Voyager Therapeutics Inc. | 1,690 | 14 |
| * | Ionis Pharmaceuticals Inc. | 274 | 14 |
| * | Kiniksa Pharmaceuticals Ltd. Class A | 725 | 14 |
| * | Immunic Inc. | 709 | 13 |
| * | Avrobio Inc. | 930 | 13 |
| * | Surmodics Inc. | 328 | 12 |
| * | IntriCon Corp. | 698 | 12 |
| * | Abeona Therapeutics Inc. | 7,230 | 12 |
| * | Meridian Bioscience Inc. | 618 | 12 |
| * | Fluidigm Corp. | 1,604 | 10 |
| * | CytoSorbents Corp. | 1,063 | 9 |
| * | Albireo Pharma Inc. | 229 | 9 |
| * | Allogene Therapeutics Inc. | 242 | 8 |
| * | MeiraGTx Holdings plc | 516 | 7 |
| 5,495 | |||
| Industrials (18.2%) | |||
| Illinois Tool Works Inc. | 1,795 | 379 | |
| Eaton Corp. plc | 2,643 | 320 | |
| Emerson Electric Co. | 3,026 | 232 | |
| Capital One Financial Corp. | 2,636 | 226 | |
| General Dynamics Corp. | 1,175 | 175 | |
| Accenture plc Class A | 627 | 156 | |
| Deere & Co. | 516 | 135 | |
| MSA Safety Inc. | 809 | 121 | |
| * | Paylocity Holding Corp. | 475 | 93 |
| Norfolk Southern Corp. | 387 | 92 | |
| Nordson Corp. | 421 | 86 | |
| Tetra Tech Inc. | 718 | 86 | |
| Littelfuse Inc. | 343 | 82 | |
13
| U.S. Liquidity Factor ETF | |||
| Market | |||
| Value• | |||
| Shares | ($000) | ||
| CoreLogic Inc. | 1,053 | 82 | |
| Helios Technologies Inc. | 1,601 | 79 | |
| Graco Inc. | 1,151 | 78 | |
| nVent Electric plc | 3,292 | 76 | |
| Johnson Controls International plc | 1,507 | 69 | |
| Regal Beloit Corp. | 570 | 68 | |
| Sonoco Products Co. | 1,156 | 67 | |
| Donaldson Co. Inc. | 1,243 | 66 | |
| * | Aecom | 1,250 | 65 |
| * | Covenant Transportation Group Inc. Class A | 3,376 | 62 |
| * | Teledyne Technologies Inc. | 164 | 62 |
| Lincoln Electric Holdings Inc. | 538 | 62 | |
| Kronos Worldwide Inc. | 4,453 | 61 | |
| UniFirst Corp. | 331 | 61 | |
| Crane Co. | 877 | 61 | |
| AGCO Corp. | 656 | 61 | |
| * | Trimble Inc. | 1,011 | 61 |
| TTEC Holdings Inc. | 887 | 60 | |
| * | SEACOR Holdings Inc. | 1,777 | 59 |
| Exponent Inc. | 705 | 59 | |
| MDU Resources Group Inc. | 2,276 | 57 | |
| * | Forterra Inc. | 2,996 | 56 |
| * | Cornerstone Building Brands Inc. | 6,332 | 55 |
| * | ACI Worldwide Inc. | 1,672 | 54 |
| Cognex Corp. | 724 | 54 | |
| MKS Instruments Inc. | 392 | 54 | |
| * | Donnelley Financial Solutions Inc. | 3,320 | 54 |
| ArcBest Corp. | 1,280 | 54 | |
| CSW Industrials Inc. | 494 | 53 | |
| * | Lydall Inc. | 1,929 | 53 |
| Apogee Enterprises Inc. | 2,011 | 53 | |
| * | Gates Industrial Corp. plc | 4,031 | 52 |
| EMCOR Group Inc. | 585 | 50 | |
| Simpson Manufacturing Co. Inc. | 533 | 49 | |
| REV Group Inc. | 5,294 | 49 | |
| * | MYR Group Inc. | 949 | 49 |
| * | DXP Enterprises Inc. | 2,281 | 48 |
| RPM International Inc. | 545 | 48 | |
| ITT Inc. | 630 | 46 | |
| * | Parsons Corp. | 1,349 | 44 |
| * | Team Inc. | 5,022 | 44 |
| * | Textainer Group Holdings Ltd. | 2,344 | 43 |
| Griffon Corp. | 2,021 | 42 | |
| * | Ingersoll Rand Inc. | 948 | 42 |
| Wabash National Corp. | 2,365 | 42 | |
| * | Herc Holdings Inc. | 712 | 41 |
| * | Construction Partners Inc. Class A | 1,538 | 40 |
| Myers Industries Inc. | 2,355 | 40 | |
| * | BrightView Holdings Inc. | 2,925 | 40 |
| Kelly Services Inc. Class A | 1,840 | 38 | |
| Air Lease Corp. Class A | 1,026 | 38 | |
| Genco Shipping & Trading Ltd. | 4,950 | 37 | |
| * | Sykes Enterprises Inc. | 989 | 37 |
| * | Sterling Construction Co. Inc. | 2,320 | 37 |
| * | Modine Manufacturing Co. | 3,372 | 37 |
| Cass Information Systems Inc. | 855 | 36 | |
| Marten Transport Ltd. | 2,018 | 36 | |
| BWX Technologies Inc. | 618 | 35 | |
| * | Ducommun Inc. | 704 | 35 |
| * | AerCap Holdings NV | 943 | 35 |
| * | FARO Technologies Inc. | 522 | 35 |
| * | Vectrus Inc. | 723 | 34 |
| * | Great Lakes Dredge & Dock Corp. | 3,042 | 34 |
| Columbus McKinnon Corp. | 908 | 34 | |
| Curtiss-Wright Corp. | 296 | 34 | |
| Xylem Inc. | 349 | 33 | |
| Franklin Electric Co. Inc. | 487 | 33 | |
| * | Thermon Group Holdings Inc. | 2,304 | 33 |
| * | CBIZ Inc. | 1,337 | 32 |
| * | Sensata Technologies Holding plc | 648 | 32 |
| * | Axon Enterprise Inc. | 251 | 32 |
| * | Aerojet Rocketdyne Holdings Inc. | 816 | 31 |
| John Bean Technologies Corp. | 275 | 30 | |
| AAON Inc. | 465 | 30 | |
| Otter Tail Corp. | 758 | 30 | |
| * | ASGN Inc. | 386 | 30 |
| Astec Industries Inc. | 519 | 30 | |
| * | Aegion Corp. Class A | 1,748 | 30 |
| Quanex Building Products Corp. | 1,428 | 29 | |
| Hubbell Inc. Class B | 179 | 29 | |
| EnPro Industries Inc. | 407 | 29 | |
| Matson Inc. | 493 | 29 | |
| CAI International Inc. | 893 | 28 | |
| Brink’s Co. | 418 | 28 | |
| Ennis Inc. | 1,712 | 28 | |
| Primoris Services Corp. | 1,142 | 28 | |
| * | Gibraltar Industries Inc. | 419 | 27 |
| Textron Inc. | 605 | 27 | |
| ESCO Technologies Inc. | 274 | 27 | |
| Encore Wire Corp. | 522 | 27 | |
14
| U.S. Liquidity Factor ETF | |||
| Market | |||
| Value• | |||
| Shares | ($000) | ||
| * | ShotSpotter Inc. | 805 | 27 |
| Pentair plc | 513 | 27 | |
| Douglas Dynamics Inc. | 678 | 27 | |
| Raven Industries Inc. | 1,050 | 26 | |
| * | Astronics Corp. | 2,303 | 26 |
| * | TriMas Corp. | 978 | 26 |
| * | Vivint Smart Home Inc. | 1,174 | 26 |
| Barrett Business Services Inc. | 385 | 26 | |
| Tennant Co. | 373 | 25 | |
| * | BlueLinx Holdings Inc. | 936 | 24 |
| * | Mercury Systems Inc. | 341 | 24 |
| ManpowerGroup Inc. | 279 | 24 | |
| Landstar System Inc. | 183 | 24 | |
| * | PAE Inc. | 2,477 | 24 |
| * | Napco Security Technologies Inc. | 774 | 24 |
| * | Echo Global Logistics Inc. | 816 | 23 |
| Resources Connection Inc. | 1,869 | 23 | |
| * | US Xpress Enterprises Inc. Class A | 2,999 | 22 |
| * | Huron Consulting Group Inc. | 506 | 22 |
| Watsco Inc. | 98 | 22 | |
| Automatic Data Processing Inc. | 128 | 22 | |
| Scorpio Bulkers Inc. | 1,298 | 22 | |
| RR Donnelley & Sons Co. | 15,785 | 22 | |
| HEICO Corp. Class A | 197 | 22 | |
| Kforce Inc. | 527 | 22 | |
| * | Air Transport Services Group Inc. | 691 | 21 |
| * | Diamond S Shipping Inc. | 3,040 | 21 |
| Carlisle Cos. Inc. | 143 | 21 | |
| McGrath RentCorp | 321 | 20 | |
| Armstrong World Industries Inc. | 264 | 20 | |
| Kadant Inc. | 159 | 20 | |
| Standex International Corp. | 260 | 20 | |
| International Seaways Inc. | 1,053 | 18 | |
| * | ExlService Holdings Inc. | 212 | 18 |
| * | I3 Verticals Inc. Class A | 632 | 18 |
| Sealed Air Corp. | 381 | 17 | |
| MAXIMUS Inc. | 231 | 17 | |
| * | Coherent Inc. | 132 | 16 |
| Eagle Materials Inc. | 172 | 16 | |
| Woodward Inc. | 134 | 15 | |
| * | Manitowoc Co. Inc. | 1,305 | 14 |
| Powell Industries Inc. | 535 | 14 | |
| * | Franklin Covey Co. | 614 | 13 |
| * | Cross Country Healthcare Inc. | 1,450 | 13 |
| Toro Co. | 134 | 12 | |
| * | CIRCOR International Inc. | 363 | 12 |
| Park Aerospace Corp. | 917 | 12 | |
| Acuity Brands Inc. | 98 | 12 | |
| Luxfer Holdings plc | 752 | 11 | |
| SFL Corp. Ltd. | 1,668 | 11 | |
| Heidrick & Struggles International Inc. | 417 | 11 | |
| Mueller Water Products Inc. Class A | 893 | 11 | |
| Kaman Corp. | 195 | 10 | |
| ADT Inc. | 1,288 | 10 | |
| * | TopBuild Corp. | 57 | 10 |
| * | TriNet Group Inc. | 125 | 9 |
| Enerpac Tool Group Corp. Class A | 394 | 9 | |
| Heartland Express Inc. | 457 | 8 | |
| * | Willdan Group Inc. | 210 | 8 |
| Chase Corp. | 74 | 8 | |
| Silgan Holdings Inc. | 225 | 8 | |
| 7,328 | |||
| Real Estate (8.3%) | |||
| Prologis Inc. | 2,871 | 287 | |
| Public Storage | 805 | 181 | |
| SBA Communications Corp. Class A | 617 | 177 | |
| Equinix Inc. | 201 | 140 | |
| Crown Castle International Corp. | 824 | 138 | |
| Urstadt Biddle Properties Inc. Class A | 7,343 | 103 | |
| First Industrial Realty Trust Inc. | 1,897 | 79 | |
| * | Cushman & Wakefield plc | 4,831 | 72 |
| Franklin Street Properties Corp. | 15,226 | 71 | |
| Healthcare Realty Trust Inc. | 2,312 | 68 | |
| PS Business Parks Inc. | 508 | 67 | |
| Rayonier Inc. | 2,369 | 67 | |
| Lamar Advertising Co. Class A | 768 | 61 | |
| Rexford Industrial Realty Inc. | 1,227 | 59 | |
| St. Joe Co. | 1,770 | 58 | |
| JBG SMITH Properties | 1,891 | 58 | |
| Hersha Hospitality Trust Class A | 6,967 | 56 | |
| New Senior Investment Group Inc. | 10,031 | 55 | |
| EastGroup Properties Inc. | 400 | 55 | |
| Mid-America Apartment Communities Inc. | 428 | 54 | |
| Terreno Realty Corp. | 929 | 54 | |
| CatchMark Timber Trust Inc. Class A | 5,600 | 54 | |
15
| U.S. Liquidity Factor ETF | |||
| Market | |||
| Value• | |||
| Shares | ($000) | ||
| Whitestone REIT | 6,388 | 48 | |
| Newmark Group Inc. Class A | 6,756 | 47 | |
| Equity Commonwealth | 1,724 | 46 | |
| Sabra Health Care REIT Inc. | 2,570 | 42 | |
| * | Howard Hughes Corp. | 582 | 42 |
| Hudson Pacific Properties Inc. | 1,608 | 42 | |
| American Campus Communities Inc. | 1,047 | 42 | |
| Saul Centers Inc. | 1,333 | 42 | |
| Camden Property Trust | 405 | 40 | |
| Cousins Properties Inc. | 1,185 | 40 | |
| Global Medical REIT Inc. | 2,857 | 39 | |
| * | RealPage Inc. | 522 | 36 |
| Service Properties Trust | 3,025 | 36 | |
| UMH Properties Inc. | 2,447 | 35 | |
| National Health Investors Inc. | 533 | 34 | |
| Corporate Office Properties Trust | 1,250 | 33 | |
| Douglas Emmett Inc. | 1,021 | 32 | |
| Kite Realty Group Trust | 2,157 | 31 | |
| Duke Realty Corp. | 810 | 31 | |
| Highwoods Properties Inc. | 804 | 31 | |
| Preferred Apartment Communities Inc. Class A | 3,839 | 30 | |
| Getty Realty Corp. | 1,054 | 30 | |
| American Finance Trust Inc. | 4,016 | 30 | |
| * | CBRE Group Inc. Class A | 482 | 29 |
| Gaming and Leisure Properties Inc. | 695 | 29 | |
| Kilroy Realty Corp. | 458 | 28 | |
| Community Healthcare Trust Inc. | 619 | 28 | |
| Alexander & Baldwin Inc. | 1,736 | 27 | |
| American Homes 4 Rent Class A | 931 | 27 | |
| Life Storage Inc. | 243 | 27 | |
| Alexander’s Inc. | 96 | 26 | |
| RPT Realty | 3,426 | 25 | |
| CubeSmart | 767 | 25 | |
| Investors Real Estate Trust | 348 | 24 | |
| Plymouth Industrial REIT Inc. | 1,755 | 23 | |
| * | Marcus & Millichap Inc. | 638 | 23 |
| CoreSite Realty Corp. | 177 | 22 | |
| Independence Realty Trust Inc. | 1,376 | 18 | |
| Universal Health Realty Income Trust | 278 | 17 | |
| CorePoint Lodging Inc. | 2,466 | 16 | |
| NexPoint Residential Trust Inc. | 341 | 15 | |
| Gladstone Commercial Corp. | 800 | 15 | |
| CorEnergy Infrastructure Trust Inc. | 1,745 | 10 | |
| Welltower Inc. | 130 | 8 | |
| * | Ashford Hospitality Trust Inc. | 3 | — |
| 3,335 | |||
| Technology (8.2%) | |||
| Roper Technologies Inc. | 774 | 330 | |
| Amphenol Corp. Class A | 1,767 | 231 | |
| Analog Devices Inc. | 869 | 121 | |
| Cognizant Technology Solutions Corp. Class A | 1,471 | 115 | |
| TE Connectivity Ltd. | 962 | 110 | |
| Pegasystems Inc. | 810 | 106 | |
| SYNNEX Corp. | 556 | 89 | |
| * | Silicon Laboratories Inc. | 696 | 82 |
| * | Manhattan Associates Inc. | 677 | 69 |
| * | Digimarc Corp. | 1,576 | 66 |
| * | Black Knight Inc. | 715 | 65 |
| * | Novanta Inc. | 542 | 65 |
| * | Agilysys Inc. | 1,611 | 60 |
| Monolithic Power Systems Inc. | 177 | 57 | |
| National Instruments Corp. | 1,502 | 56 | |
| Cohu Inc. | 1,952 | 55 | |
| * | Nuance Communications Inc. | 1,225 | 53 |
| * | Ceridian HCM Holding Inc. | 536 | 52 |
| Perspecta Inc. | 2,281 | 51 | |
| QAD Inc. Class A | 870 | 50 | |
| PC Connection Inc. | 1,069 | 49 | |
| * | SolarWinds Corp. | 2,084 | 48 |
| * | EPAM Systems Inc. | 143 | 46 |
| American Software Inc. Class A | 2,600 | 43 | |
| * | FormFactor Inc. | 1,029 | 42 |
| Science Applications International Corp. | 444 | 41 | |
| * | Arlo Technologies Inc. | 7,775 | 41 |
| * | CEVA Inc. | 1,028 | 40 |
| * | Arrow Electronics Inc. | 427 | 39 |
| CTS Corp. | 1,242 | 38 | |
| * | A10 Networks Inc. | 4,642 | 37 |
| * | Qualys Inc. | 387 | 37 |
| * | Avid Technology Inc. | 2,957 | 36 |
| * | PDF Solutions Inc. | 1,614 | 36 |
| Blackbaud Inc. | 618 | 34 | |
| * | OneSpan Inc. | 1,698 | 34 |
| Hackett Group Inc. | 2,384 | 34 | |
| Simulations Plus Inc. | 597 | 33 | |
16
| U.S. Liquidity Factor ETF | |||
| Market | |||
| Value• | |||
| Shares | ($000) | ||
| * | Tucows Inc. Class A | 438 | 32 |
| * | Axcelis Technologies Inc. | 1,160 | 31 |
| * | Aspen Technology Inc. | 224 | 30 |
| * | Amkor Technology Inc. | 2,017 | 30 |
| * | NCR Corp. | 1,063 | 29 |
| * | MaxLinear Inc. | 928 | 29 |
| VirnetX Holding Corp. | 5,099 | 28 | |
| * | Intelligent Systems Corp. | 676 | 27 |
| * | Envestnet Inc. | 312 | 25 |
| Brooks Automation Inc. | 341 | 25 | |
| KLA Corp. | 98 | 25 | |
| * | Verint Systems Inc. | 431 | 25 |
| Jabil Inc. | 637 | 24 | |
| * | Veeco Instruments Inc. | 1,462 | 24 |
| * | eGain Corp. | 2,126 | 24 |
| Computer Programs and Systems Inc. | 812 | 23 | |
| * | Medallia Inc. | 655 | 23 |
| * | IPG Photonics Corp. | 110 | 23 |
| * | LiveRamp Holdings Inc. | 383 | 22 |
| * | nLight Inc. | 714 | 21 |
| * | Photronics Inc. | 1,838 | 21 |
| Entegris Inc. | 219 | 20 | |
| * | Forrester Research Inc. | 448 | 19 |
| * | comScore Inc. | 6,906 | 18 |
| * | ScanSource Inc. | 694 | 17 |
| * | Mitek Systems Inc. | 1,463 | 17 |
| Methode Electronics Inc. | 492 | 17 | |
| * | Limelight Networks Inc. | 3,486 | 15 |
| NIC Inc. | 635 | 15 | |
| * | ePlus Inc. | 173 | 15 |
| * | SecureWorks Corp. Class A | 1,027 | 12 |
| 3,297 | |||
| Telecommunications (2.2%) | |||
| L3Harris Technologies Inc. | 363 | 70 | |
| * | Liberty Broadband Corp. Class A | 412 | 65 |
| * | Liberty Broadband Corp. Class C | 403 | 63 |
| * | ORBCOMM Inc. | 10,246 | 59 |
| Ubiquiti Inc. | 209 | 52 | |
| Cable One Inc. | 26 | 51 | |
| * | Iridium Communications Inc. | 1,497 | 48 |
| Loral Space & Communications Inc. | 1,821 | 42 | |
| * | Ooma Inc. | 2,639 | 41 |
| * | Harmonic Inc. | 6,220 | 41 |
| * | Liberty Latin America Ltd. Class A | 3,244 | 37 |
| Cogent Communications Holdings Inc. | 626 | 36 | |
| ATN International Inc. | 736 | 36 | |
| ADTRAN Inc. | 2,582 | 33 | |
| * | WideOpenWest Inc. | 3,972 | 32 |
| * | CalAmp Corp. | 2,867 | 26 |
| * | Consolidated Communications Holdings Inc. | 4,521 | 25 |
| * | Digi International Inc. | 1,456 | 25 |
| * | Anterix Inc. | 790 | 24 |
| * | United States Cellular Corp. | 683 | 21 |
| Shenandoah Telecommunications Co. | 411 | 18 | |
| * | Liberty Global plc Class C | 730 | 16 |
| * | Casa Systems Inc. | 2,102 | 11 |
| 872 | |||
| Utilities (6.9%) | |||
| WEC Energy Group Inc. | 2,925 | 278 | |
| Public Service Enterprise Group Inc. | 4,250 | 248 | |
| Eversource Energy | 2,641 | 231 | |
| Waste Management Inc. | 1,873 | 223 | |
| Sempra Energy | 1,469 | 187 | |
| Xcel Energy Inc. | 1,939 | 131 | |
| American Electric Power Co. Inc. | 1,278 | 108 | |
| Southern Co. | 1,693 | 101 | |
| Spire Inc. | 1,565 | 100 | |
| ALLETE Inc. | 1,704 | 96 | |
| Hawaiian Electric Industries Inc. | 2,450 | 88 | |
| Exelon Corp. | 2,088 | 86 | |
| New Jersey Resources Corp. | 2,513 | 83 | |
| American States Water Co. | 1,123 | 83 | |
| ONE Gas Inc. | 944 | 75 | |
| Avangrid Inc. | 1,554 | 72 | |
| Dominion Energy Inc. | 845 | 66 | |
| Ormat Technologies Inc. | 778 | 61 | |
| NorthWestern Corp. | 939 | 54 | |
| Black Hills Corp. | 886 | 54 | |
| Southwest Gas Holdings Inc. | 689 | 44 | |
| Middlesex Water Co. | 637 | 44 | |
| UGI Corp. | 1,205 | 43 | |
| * | Clean Harbors Inc. | 585 | 42 |
| IDACORP Inc. | 372 | 34 | |
| Portland General Electric Co. | 628 | 26 | |
| National Fuel Gas Co. | 586 | 24 | |
| Unitil Corp. | 582 | 24 | |
| SJW Group | 336 | 22 | |
| OGE Energy Corp. | 639 | 21 | |
| Chesapeake Utilities Corp. | 178 | 19 | |
| 2,768 | |||
Total Common Stocks (Cost $34,929) |
39,940 | ||
17
| U.S. Liquidity Factor ETF | ||
| Market | ||
| Value• | ||
| Shares | ($000) | |
| Preferred Stocks (0.1%) | ||
| Qurate Retail Inc. Pfd., 8.000% (Cost $31) | 316 | 31 |
| Temporary Cash Investment (0.4%) | ||
| Money Market Fund (0.4%) | ||
1 Vanguard Market Liquidity Fund, 0.109% (Cost $182) |
1,825 | 182 |
Total Investments (99.9%) (Cost $35,142) |
40,153 | |
Other Asset and Liabilities— Net (0.1%) |
41 | |
| Net Assets (100%) | 40,194 | |
Cost is in $000.
| • | See Note A in Notes to Financial Statements. |
| * | Non-income-producing security. |
| 1 | Affiliated money market fund available only to Vanguard funds and certain trusts and accounts managed by Vanguard. Rate shown is the 7-day yield. |
| REIT—Real Estate Investment Trust. |
Derivative Financial Instruments Outstanding as of Period End
Futures Contracts
| ($000) | ||||
| Value and | ||||
| Number of | Unrealized | |||
| Long (Short) | Notional | Appreciation | ||
| Expiration | Contracts | Amount | (Depreciation) | |
| Long Futures Contracts | ||||
| Micro E-mini S&P 500 Index | December 2020 | 10 | 181 | 12 |
See accompanying Notes, which are an integral part of the Financial Statements.
18
U.S. Liquidity Factor ETF
Statement of Assets and Liabilities
As of November 30, 2020
| ($000s, except shares and per-share amounts) | Amount |
| Assets | |
| Investments in Securities, at Value | |
| Unaffiliated Issuers (Cost $34,960) | 39,971 |
| Affiliated Issuers (Cost $182) | 182 |
| Total Investments in Securities | 40,153 |
| Investment in Vanguard | 2 |
| Cash Collateral Pledged—Futures Contracts | 20 |
| Receivables for Investment Securities Sold | 148 |
| Receivables for Accrued Income | 71 |
| Total Assets | 40,394 |
| Liabilities | |
| Payables for Investment Securities Purchased | 196 |
| Payables to Vanguard | 3 |
| Variation Margin Payable—Futures Contracts | 1 |
| Total Liabilities | 200 |
| Net Assets | 40,194 |
| At November 30, 2020, net assets consisted of: | |
| Paid-in Capital | 37,591 |
| Total Distributable Earnings (Loss) | 2,603 |
| Net Assets | 40,194 |
| Net Assets | |
| Applicable to 450,000 outstanding $.001 par value shares of beneficial interest (unlimited authorization) | 40,194 |
| Net Asset Value Per Share | $89.32 |
See accompanying Notes, which are an integral part of the Financial Statements.
19
U.S. Liquidity Factor ETF
Statement of Operations
| Year Ended | |
| November 30, 2020 | |
| ($000) | |
| Investment Income | |
| Income | |
| Dividends | 734 |
| Interest1 | 3 |
| Total Income | 737 |
| Expenses | |
| The Vanguard Group—Note B | |
| Investment Advisory Fee Services | — |
| Management and Administrative | 28 |
| Marketing and Distributions | — |
| Custodian Fees | 3 |
| Auditing Fees | 17 |
| Shareholders’ Reports | 1 |
| Trustees’ Fees and Expenses | — |
| Total Expenses | 49 |
| Net Investment Income | 688 |
| Realized Net Gain (Loss) | |
| Investment Securities Sold1,2 | (1,930) |
| Futures Contracts | 16 |
| Realized Net Gain (Loss) | (1,914) |
| Change in Unrealized Appreciation (Depreciation) | |
| Investment Securities1 | 2,523 |
| Futures Contracts | 5 |
| Change in Unrealized Appreciation (Depreciation) | 2,528 |
| Net Increase (Decrease) in Net Assets Resulting from Operations | 1,302 |
| 1 | Interest income, realized net gain (loss), and change in unrealized appreciation (depreciation) from an affiliated company of the fund were $3,000, $0, and $0, respectively. Purchases and sales are for temporary cash investment purposes. |
| 2 | Includes $427,000 of net gain (loss) resulting from in-kind redemptions. |
See accompanying Notes, which are an integral part of the Financial Statements.
20
U.S. Liquidity Factor ETF
Statement of Changes in Net Assets
| Year Ended November 30, | ||
| 2020 | 2019 | |
| ($000) | ($000) | |
| Increase (Decrease) in Net Assets | ||
| Operations | ||
| Net Investment Income | 688 | 408 |
| Realized Net Gain (Loss) | (1,914) | (219) |
| Change in Unrealized Appreciation (Depreciation) | 2,528 | 2,624 |
| Net Increase (Decrease) in Net Assets Resulting from Operations | 1,302 | 2,813 |
| Distributions1 | ||
| Total Distributions | (690) | (303) |
| Capital Share Transactions | ||
| Issued | 2,195 | 27,038 |
| Issued in Lieu of Cash Distributions | — | — |
| Redeemed | (3,670) | (4,140) |
| Net Increase (Decrease) from Capital Share Transactions | (1,475) | 22,898 |
| Total Increase (Decrease) | (863) | 25,408 |
| Net Assets | ||
| Beginning of Period | 41,057 | 15,649 |
| End of Period | 40,194 | 41,057 |
1 Certain prior-period numbers have been reclassified to conform with the current-period presentation.
See accompanying Notes, which are an integral part of the Financial Statements.
21
U.S. Liquidity Factor ETF
Financial Highlights
| Feb. 13, | |||
| Year Ended | 20181 to | ||
| Nov. 30, | Nov. 30, | ||
| For a Share Outstanding Throughout Each Period | 2020 | 2019 | 2018 |
| Net Asset Value, Beginning of Period | $86.44 | $78.25 | $75.00 |
| Investment Operations | |||
| Net Investment Income2 | 1.436 | 1.310 | 1.010 |
| Net Realized and Unrealized Gain (Loss) on Investments | 2.882 | 8.047 | 2.834 |
| Total from Investment Operations | 4.318 | 9.357 | 3.844 |
| Distributions | |||
| Dividends from Net Investment Income | (1.438) | (1.167) | (.594) |
| Distributions from Realized Capital Gains | — | — | — |
| Total Distributions | (1.438) | (1.167) | (.594) |
| Net Asset Value, End of Period | $89.32 | $86.44 | $78.25 |
| Total Return | 5.38% | 12.14% | 5.09% |
| Ratios/Supplemental Data | |||
| Net Assets, End of Period (Millions) | $40 | $41 | $16 |
| Ratio of Total Expenses to Average Net Assets | 0.13% | 0.14%3 | 0.13%4,5 |
| Ratio of Net Investment Income to Average Net Assets | 1.83% | 1.62% | 1.58%5 |
| Portfolio Turnover Rate | 54%6 | 49% | 20% |
| 1 | Inception. |
| 2 | Calculated based on average shares outstanding. |
| 3 | The ratio of expenses to average net assets for the period net of reduction from custody fee offset arrangements was 0.13%. |
| 4 | The ratio of total expenses to average net assets before an expense reduction of 0.02% was 0.15%. The fund incurred higher than anticipated expenses, in which Vanguard voluntarily agreed to assume payment of certain expenses. The fund is not obligated to repay this amount to Vanguard. |
| 5 | Annualized. |
| 6 | Excludes the value of portfolio securities received or delivered as a result of in-kind purchases or redemptions of the fund’s capital shares, including ETF Creation Units. |
See accompanying Notes, which are an integral part of the Financial Statements.
22
U.S. Liquidity Factor ETF
Notes to Financial Statements
Vanguard U.S. Liquidity Factor ETF is registered under the Investment Company Act of 1940 as an open-end investment company, or mutual fund. ETF shares are listed for trading on Cboe BZX Exchange; they can be purchased and sold through a broker. Market disruptions associated with the COVID-19 pandemic have had a global impact, and uncertainty exists as to the long-term implications. Such disruptions can adversely affect assets of the fund and thus fund performance.
A. The following significant accounting policies conform to generally accepted accounting principles for U.S. investment companies. The fund consistently follows such policies in preparing its financial statements.
1. Security Valuation: Securities are valued as of the close of trading on the New York Stock Exchange (generally 4 p.m., Eastern time) on the valuation date. Equity securities are valued at the latest quoted sales prices or official closing prices taken from the primary market in which each security trades; such securities not traded on the valuation date are valued at the mean of the latest quoted bid and asked prices. Securities for which market quotations are not readily available, or whose values have been materially affected by events occurring before the fund’s pricing time but after the close of the securities’ primary markets, are valued by methods deemed by the board of trustees to represent fair value. Investments in Vanguard Market Liquidity Fund are valued at that fund’s net asset value.
2. Futures Contracts: The fund uses index futures contracts to a limited extent, with the objective of maintaining full exposure to the stock market while maintaining liquidity. The fund may purchase or sell futures contracts to achieve a desired level of investment, whether to accommodate portfolio turnover or cash flows from capital share transactions. The primary risks associated with the use of futures contracts are imperfect correlation between changes in market values of stocks held by the fund and the prices of futures contracts, and the possibility of an illiquid market. Counterparty risk involving futures is mitigated because a regulated clearinghouse is the counterparty instead of the clearing broker. To further mitigate counterparty risk, the fund trades futures contracts on an exchange, monitors the financial strength of its clearing brokers and clearinghouse, and has entered into clearing agreements with its clearing brokers. The clearinghouse imposes initial margin requirements to secure the fund’s performance and requires daily settlement of variation margin representing changes in the market value of each contract. Any securities pledged as initial margin for open contracts are noted in the Schedule of Investments.
Futures contracts are valued at their quoted daily settlement prices. The notional amounts of the contracts are not recorded in the Statement of Assets and Liabilities. Fluctuations in the value of the contracts are recorded in the Statement of Assets and Liabilities as an asset (liability) and in the Statement of Operations as unrealized appreciation (depreciation) until the contracts are closed, when they are recorded as realized gains (losses) on futures contracts.
During the year ended November 30, 2020, the fund’s average investments in long and short futures contracts represented less than 1% and 0% of net assets, respectively, based on the average of the notional amounts at each quarter-end during the period.
3. Federal Income Taxes: The fund intends to continue to qualify as a regulated investment company and distribute all of its taxable income. The fund’s tax returns are open to examination by the relevant tax authorities until expiration of the applicable statute of limitations, which is generally three years after the filing of the tax return. Management has analyzed the fund’s tax positions taken for all open federal and state income tax years, and has concluded that no provision for income tax is required in the fund’s financial statements.
23
U.S. Liquidity Factor ETF
4. Distributions: Distributions to shareholders are recorded on the ex-dividend date. Distributions are determined on a tax basis at the fiscal year-end and may differ from net investment income and realized capital gains for financial reporting purposes.
5. Credit Facilities and Interfund Lending Program: The fund and certain other funds managed by The Vanguard Group (“Vanguard”) participate in a $4.3 billion committed credit facility provided by a syndicate of lenders pursuant to a credit agreement and an uncommitted credit facility provided by Vanguard. Both facilities may be renewed annually. Each fund is individually liable for its borrowings, if any, under the credit facilities. Borrowings may be utilized for temporary or emergency purposes, subject to the fund’s regulatory and contractual borrowing restrictions. With respect to the committed credit facility, the participating funds are charged administrative fees and an annual commitment fee of 0.10% of the undrawn committed amount of the facility; these fees are allocated to the funds based on a method approved by the fund’s board of trustees and included in Management and Administrative expenses on the fund’s Statement of Operations. Any borrowings under either facility bear interest at a rate based upon the higher of the one-month London Interbank Offered Rate (or an acceptable alternate rate, if necessary), federal funds effective rate, or overnight bank funding rate plus an agreed-upon spread, except that borrowings under the uncommitted credit facility may bear interest based upon an alternative rate agreed to by the fund and Vanguard.
In accordance with an exemptive order (the “Order”) from the SEC, the fund may participate in a joint lending and borrowing program that allows registered open-end Vanguard funds to borrow money from and lend money to each other for temporary or emergency purposes (the “Interfund Lending Program”), subject to compliance with the terms and conditions of the Order, and to the extent permitted by the fund’s investment objective and investment policies. Interfund loans and borrowings normally extend overnight, but can have a maximum duration of seven days. Loans may be called on one business day’s notice. The interest rate to be charged is governed by the conditions of the Order and internal procedures adopted by the board of trustees. The board of trustees is responsible for overseeing the Interfund Lending Program.
For the year ended November 30, 2020, the fund did not utilize the credit facilities or the Interfund Lending Program.
6. Other: Dividend income is recorded on the ex-dividend date. Non-cash dividends included in dividend income, if any, are recorded at the fair value of the securities received. Interest income includes income distributions received from Vanguard Market Liquidity Fund and is accrued daily. Security transactions are accounted for on the date securities are bought or sold. Costs used to determine realized gains (losses) on the sale of investment securities are those of the specific securities sold.
B. In accordance with the terms of a Funds’ Service Agreement (the “FSA”) between Vanguard and the fund, Vanguard furnishes to the fund investment advisory, corporate management, administrative, marketing, and distribution services at Vanguard’s cost of operations (as defined by the FSA). These costs of operations are allocated to the fund based on methods and guidelines approved by the board of trustees and are generally settled twice a month.
Upon the request of Vanguard, the fund may invest up to 0.40% of its net assets as capital in Vanguard. At November 30, 2020, the fund had contributed to Vanguard capital in the amount of $2,000, representing less than 0.01% of the fund’s net assets and less than 0.01% of Vanguard’s capital received pursuant to the FSA. The fund’s trustees and officers are also directors and employees, respectively, of Vanguard.
24
U.S. Liquidity Factor ETF
C. Various inputs may be used to determine the value of the fund’s investments and derivatives. These inputs are summarized in three broad levels for financial statement purposes. The inputs or methodologies used to value securities are not necessarily an indication of the risk associated with investing in those securities.
Level 1—Quoted prices in active markets for identical securities.
Level 2—Other significant observable inputs (including quoted prices for similar securities, interest rates, prepayment speeds, credit risk, etc.).
Level 3—Significant unobservable inputs (including the fund’s own assumptions used to determine the fair value of investments). Any investments and derivatives valued with significant unobservable inputs are noted on the Schedule of Investments.
At November 30, 2020, 100% of the market value of the fund’s investments and derivatives was determined based on Level 1 inputs.
D. Permanent differences between book-basis and tax-basis components of net assets are reclassified among capital accounts in the financial statements to reflect their tax character. These reclassifications have no effect on net assets or net asset value per share. As of period end, permanent differences primarily attributable to the accounting for in-kind redemptions were reclassified between the following accounts:
| Amount | |
| ($000) | |
| Paid-in Capital | 427 |
| Total Distributable Earnings (Loss) | (427) |
Temporary differences between book-basis and tax-basis components of total distributable earnings (loss) arise when certain items of income, gain, or loss are recognized in different periods for financial statement and tax purposes; these differences will reverse at some time in the future. The differences are primarily related to the deferral of losses from wash sales; the recognition of unrealized gains or losses from certain derivative contracts; and the classification of securities for tax purposes. As of period end, the tax-basis components of total distributable earnings (loss) are detailed in the table as follows:
| Amount | |
| ($000) | |
| Undistributed Ordinary Income | 155 |
| Undistributed Long-Term Gains | — |
| Capital Loss Carryforwards | (2,566) |
| Qualified Late-Year Losses | — |
| Net Unrealized Gains (Losses) | 5,014 |
25
U.S. Liquidity Factor ETF
The tax character of distributions paid was as follows:
| Year Ended November 30, | ||
| 2020 | 2019 | |
| Amount | Amount | |
| ($000) | ($000) | |
| Ordinary Income* | 690 | 303 |
| Long-Term Capital Gains | — | — |
| Total | 690 | 303 |
* Includes short-term capital gains, if any.
As of November 30, 2020, gross unrealized appreciation and depreciation for investments and derivatives based on cost for U.S. federal income tax purposes were as follows:
| Amount | |
| ($000) | |
| Tax Cost | 35,140 |
| Gross Unrealized Appreciation | 6,832 |
| Gross Unrealized Depreciation | (1,819) |
| Net Unrealized Appreciation (Depreciation) | 5,013 |
E. During the year ended November 30, 2020, the fund purchased $20,946,000 of investment securities and sold $22,371,000 of investment securities, other than temporary cash investments. Purchases and sales include $0 and $2,210,000, respectively, in connection with in-kind purchases and redemptions of the fund’s capital shares.
F. Capital shares issued and redeemed were:
| Year Ended November 30, | ||
| 2020 | 2019 | |
| Shares | Shares | |
| (000) | (000) | |
| Issued | 25 | 325 |
| Issued in Lieu of Cash Distributions | — | — |
| Redeemed | (50) | (50) |
| Net Increase (Decrease) in Shares Outstanding | (25) | 275 |
At November 30, 2020, one shareholder, a subsidiary of Vanguard, was the record or beneficial owner of 56% of the fund’s net assets. If this shareholder were to redeem its investment in the fund, the redemption might result in an increase in the fund’s expense ratio, cause the fund to incur higher transaction costs, or lead to the realization of taxable capital gains.
G. Management has determined that no events or transactions occurred subsequent to November 30, 2020, that would require recognition or disclosure in these financial statements.
26
U.S. Minimum Volatility ETF
Performance Summary
All of the returns in this report represent past performance, which is not a guarantee of future results that may be achieved by the fund. (Current performance may be lower or higher than the performance data cited. For performance data current to the most recent month-end, visit our website at vanguard.com/performance.) Note, too, that both investment returns and principal value can fluctuate widely, so an investor’s shares, when sold, could be worth more or less than their original cost. The returns shown do not reflect taxes that a shareholder would pay on fund distributions or on the sale of fund shares.
Cumulative Performance: February 13, 2018, Through November 30, 2020
Initial Investment of $10,000
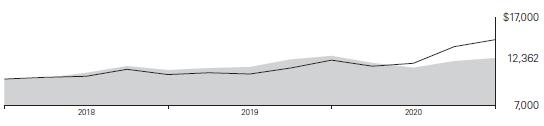
| Average Annual Total Returns | ||||
| Periods Ended November 30, 2020 | ||||
| Since | Final Value | |||
| One | Inception | of a $10,000 | ||
| Year | (2/13/2018) | Investment | ||
 |
U.S. Minimum Volatility ETF Net Asset Value | -1.99% | 7.88% | $12,362 |
| U.S. Minimum Volatility ETF Market Price | -2.03 | 7.89 | 12,363 | |
 |
Russell 3000 Index | 19.02 | 14.05 | 14,440 |
"Since Inception" performance is calculated from the ETF Shares’ inception date for both the fund and its comparative standard(s).
Cumulative Returns of ETF Shares: February 13, 2018, Through November 30, 2020
| Since | ||
| One | Inception | |
| Year | (2/13/2018) | |
| U.S. Minimum Volatility ETF Market Price | -2.03% | 23.63% |
| U.S. Minimum Volatility ETF Net Asset Value | -1.99 | 23.62 |
| Russell 3000 Index | 19.02 | 44.40 |
"Since Inception" performance is calculated from the ETF Shares’ inception date for both the fund and its comparative standard(s).
The market price is determined by the midpoint of the bid-offer spread as of the closing time of the New York Stock Exchange (generally 4 p.m., Eastern time). The net asset value is also determined as of the NYSE closing time. For more information about how the ETF Shares' market prices have compared with their net asset value, visit vanguard.com, select your ETF, and then select the Price and Performance tab. The ETF premium/discount analysis there shows the percentages of days on which the ETF Shares' market price was above or below the NAV.
See Financial Highlights for dividend and capital gains information.
27
U.S. Minimum Volatility ETF
Fund Allocation
As of November 30, 2020
| Basic Materials | 3.1% |
| Consumer Discretionary | 14.3 |
| Consumer Staples | 7.3 |
| Energy | 0.6 |
| Financials | 7.3 |
| Health Care | 17.5 |
| Industrials | 7.3 |
| Real Estate | 1.4 |
| Technology | 23.3 |
| Telecommunications | 8.6 |
| Utilities | 9.3 |
The table reflects the fund’s investments, except for short-term investments and derivatives. Sector categories are based on the Industry Classification Benchmark ("ICB"), except for the "Other" category (if applicable), which includes secur-ities that have not been provided an ICB classification as of the effective reporting period.
The Industry Classification Benchmark ("ICB") is owned by FTSE. FTSE does not accept any liability to any person for any loss or damage arising out of any error or omission in the ICB.
28
U.S. Minimum Volatility ETF
Financial Statements
Schedule of Investments
As of November 30, 2020
The fund files its complete schedule of portfolio holdings with the Securities and Exchange Commission (SEC) for the first and third quarters of each fiscal year as an exhibit to its reports on Form N-PORT. The fund’s Form N-PORT reports are available on the SEC’s website at www.sec.gov.
| Market | |||
| Value• | |||
| Shares | ($000) | ||
| Common Stocks (99.3%) | |||
| Basic Materials (3.1%) | |||
| Newmont Corp. | 13,239 | 778 | |
| NewMarket Corp. | 1,860 | 688 | |
| Fastenal Co. | 6,002 | 297 | |
| 1,763 | |||
| Consumer Discretionary (14.2%) | |||
| Service Corp. International | 19,562 | 951 | |
| Walmart Inc. | 6,129 | 936 | |
| * | Dollar Tree Inc. | 8,470 | 925 |
| Costco Wholesale Corp. | 2,208 | 865 | |
| * | Electronic Arts Inc. | 6,321 | 808 |
| Dollar General Corp. | 3,669 | 802 | |
| Activision Blizzard Inc. | 9,685 | 770 | |
| * | Amazon.com Inc. | 242 | 767 |
| * | Take-Two Interactive Software Inc. | 3,186 | 575 |
| Target Corp. | 1,701 | 305 | |
| Murphy USA Inc. | 1,222 | 157 | |
| National Presto Industries Inc. | 1,482 | 126 | |
| * | Terminix Global Holdings Inc. | 828 | 41 |
| 8,028 | |||
| Consumer Staples (7.2%) | |||
| Flowers Foods Inc. | 37,158 | 825 | |
| Procter & Gamble Co. | 4,723 | 656 | |
| Hormel Foods Corp. | 13,240 | 625 | |
| Weis Markets Inc. | 10,570 | 503 | |
| Colgate-Palmolive Co. | 4,201 | 360 | |
| Church & Dwight Co. Inc. | 4,045 | 355 | |
| ^ | Tootsie Roll Industries Inc. | 11,447 | 354 |
| John B Sanfilippo & Son Inc. | 2,377 | 176 | |
| Clorox Co. | 577 | 117 | |
| Lancaster Colony Corp. | 611 | 103 | |
| Village Super Market Inc. Class A | 630 | 15 | |
| 4,089 | |||
| Energy (0.6%) | |||
| * | REX American Resources Corp. | 4,352 | 342 |
| Financials (7.3%) | |||
| Houlihan Lokey Inc. Class A | 11,905 | 771 | |
| CME Group Inc. | 4,187 | 733 | |
| Broadridge Financial Solutions Inc. | 4,348 | 639 | |
| * | Columbia Financial Inc. | 36,295 | 521 |
| Erie Indemnity Co. Class A | 1,488 | 336 | |
| Waterstone Financial Inc. | 14,641 | 257 | |
| AMERISAFE Inc. | 4,562 | 250 | |
| HarborOne Bancorp Inc. | 25,220 | 247 | |
| Park National Corp. | 1,645 | 166 | |
| State Auto Financial Corp. | 5,792 | 87 | |
| Cboe Global Markets Inc. | 932 | 85 | |
| Bank of Princeton | 575 | 14 | |
| 4,106 | |||
| Health Care (17.4%) | |||
| Johnson & Johnson | 6,044 | 874 | |
| * | Veeva Systems Inc. Class A | 3,076 | 852 |
| Merck & Co. Inc. | 10,548 | 848 | |
| Eli Lilly and Co. | 5,477 | 798 | |
| Amgen Inc. | 3,538 | 786 | |
| Gilead Sciences Inc. | 12,291 | 746 | |
| * | Regeneron Pharmaceuticals Inc. | 1,398 | 721 |
| Danaher Corp. | 3,040 | 683 | |
| * | HealthStream Inc. | 35,672 | 666 |
| Pfizer Inc. | 14,759 | 565 | |
| Atrion Corp. | 583 | 350 | |
| National HealthCare Corp. | 4,431 | 276 | |
| * | Vertex Pharmaceuticals Inc. | 1,208 | 275 |
| National Research Corp. | 5,223 | 268 | |
| Bristol-Myers Squibb Co. | 4,273 | 267 | |
| * | Enanta Pharmaceuticals Inc. | 6,454 | 266 |
29
U.S. Minimum Volatility ETF
| Market | |||
| Value• | |||
| Shares | ($000) | ||
| Cerner Corp. | 2,393 | 179 | |
| * | Providence Service Corp. | 1,141 | 155 |
| * | Seagen Inc. | 676 | 115 |
| * | Akero Therapeutics Inc. | 2,069 | 59 |
| * | Amphastar Pharmaceuticals Inc. | 2,419 | 43 |
| Phibro Animal Health Corp. Class A | 1,912 | 36 | |
| * | Viatris Inc. | 1,829 | 31 |
| 9,859 | |||
| Industrials (7.3%) | |||
| Landstar System Inc. | 6,128 | 805 | |
| CH Robinson Worldwide Inc. | 8,090 | 760 | |
| Accenture plc Class A | 2,189 | 545 | |
| Jack Henry & Associates Inc. | 2,720 | 437 | |
| MAXIMUS Inc. | 5,955 | 428 | |
| Graco Inc. | 4,989 | 338 | |
| Cass Information Systems Inc. | 6,268 | 266 | |
| AptarGroup Inc. | 1,303 | 165 | |
| Fidelity National Information Services Inc. | 1,018 | 151 | |
| Heartland Express Inc. | 5,488 | 101 | |
| * | Lawson Products Inc. | 1,877 | 89 |
| Lindsay Corp. | 265 | 31 | |
| 4,116 | |||
| Real Estate (1.4%) | |||
| Equity Commonwealth | 28,536 | 756 | |
| Easterly Government Properties Inc. | 492 | 11 | |
| 767 | |||
| Technology (23.1%) | |||
| * | MicroStrategy Inc. Class A | 3,510 | 1,203 |
| Shutterstock Inc. | 14,667 | 1,009 | |
| * | Tyler Technologies Inc. | 2,293 | 980 |
| * | Alphabet Inc. Class A | 540 | 947 |
| Texas Instruments Inc. | 5,855 | 944 | |
| * | Adobe Inc. | 1,859 | 889 |
| Oracle Corp. | 14,832 | 856 | |
| Apple Inc. | 6,989 | 832 | |
| Microsoft Corp. | 3,790 | 811 | |
| * | Super Micro Computer Inc. | 27,887 | 787 |
| Citrix Systems Inc. | 5,746 | 712 | |
| * | Cadence Design Systems Inc. | 5,494 | 639 |
| Intuit Inc. | 1,256 | 442 | |
| * | Altair Engineering Inc. Class A | 7,859 | 424 |
| Amdocs Ltd. | 6,014 | 396 | |
| NIC Inc. | 16,291 | 382 | |
| * | Facebook Inc. Class A | 1,158 | 321 |
| * | Black Knight Inc. | 2,236 | 205 |
| QAD Inc. Class A | 3,427 | 196 | |
| American Software Inc. Class A | 3,411 | 56 | |
| * | DSP Group Inc. | 2,297 | 39 |
| * | Verint Systems Inc. | 331 | 19 |
| 13,089 | |||
| Telecommunications (8.5%) | |||
| * | T-Mobile US Inc. | 7,078 | 941 |
| Verizon Communications Inc. | 14,848 | 897 | |
| Shenandoah Telecommunications Co. | 16,074 | 714 | |
| Cable One Inc. | 353 | 699 | |
| ATN International Inc. | 7,480 | 366 | |
| * | Charter Communications Inc. Class A | 544 | 355 |
| * | Liberty Broadband Corp. Class A | 1,797 | 282 |
| AT&T Inc. | 7,045 | 203 | |
| * | Liberty Broadband Corp. | 1,039 | 164 |
| Cisco Systems Inc. | 2,559 | 110 | |
| Spok Holdings Inc. | 6,350 | 62 | |
| * | Anterix Inc. | 603 | 18 |
| 4,811 | |||
| Utilities (9.2%) | |||
| Republic Services Inc. Class A | 9,493 | 918 | |
| American Water Works Co. Inc. | 4,632 | 710 | |
| SJW Group | 10,436 | 685 | |
| Waste Management Inc. | 5,705 | 680 | |
| Clearway Energy Inc. Class A | 20,223 | 549 | |
| Clearway Energy Inc. | 12,403 | 363 | |
| WEC Energy Group Inc. | 2,651 | 252 | |
| Eversource Energy | 2,549 | 223 | |
| CMS Energy Corp. | 3,510 | 216 | |
| NextEra Energy Inc. | 2,360 | 174 | |
| Xcel Energy Inc. | 2,389 | 161 | |
| American States Water Co. | 1,983 | 146 | |
| Ameren Corp. | 1,181 | 92 | |
| Consolidated Edison Inc. | 539 | 41 | |
| Consolidated Water Co. Ltd. | 944 | 10 | |
| 5,220 | |||
| Total Common Stocks | |||
(Cost $49,873) |
56,190 | ||
30
U.S. Minimum Volatility ETF
| Shares | Market Value• ($000) | |
| Temporary Cash Investment (0.6%) | ||
| Money Market Fund (0.6%) | ||
| 1,2 Vanguard Market Liquidity Fund, 0.109% | ||
| (Cost $327) | 3,276 | 328 |
| Total Investments (99.9%) | ||
| (Cost $50,200) | 56,518 | |
| Other Asset and Liabilities—Net (0.1%) | 84 | |
| Net Assets (100%) | 56,602 |
Cost is in $000.
| • | See Note A in Notes to Financial Statements. |
| * | Non-income-producing security. |
| ^ | Includes partial security positions on loan to broker-dealers. The total value of securities on loan is $25,000. |
| 1 | Affiliated money market fund available only to Vanguard funds and certain trusts and accounts managed by Vanguard. Rate shown is the 7-day yield. |
| 2 | Collateral of $26,000 was received for securities on loan. |
Derivative Financial Instruments Outstanding as of Period End
Futures Contracts
| ($000) | |||||
| Value and | |||||
| Number of | Unrealized | ||||
| Long (Short) | Notional | Appreciation | |||
| Expiration | Contracts | Amount | (Depreciation) | ||
| Long Futures Contracts | |||||
| E-mini S&P 500 Index | December 2020 | 1 | 181 | 12 | |
| Micro E-mini S&P 500 Index | December 2020 | 2 | 36 | 2 | |
| 14 | |||||
See accompanying Notes, which are an integral part of the Financial Statements.
31
U.S. Minimum Volatility ETF
Statement of Assets and Liabilities
As of November 30, 2020
| ($000s, except shares and per-share amounts) | Amount |
| Assets | |
| Investments in Securities, at Value | |
| Unaffiliated Issuers (Cost $49,873) | 56,190 |
| Affiliated Issuers (Cost $327) | 328 |
| Total Investments in Securities | 56,518 |
| Investment in Vanguard | 3 |
| Cash | 4 |
| Cash Collateral Pledged—Futures Contracts | 15 |
| Receivables for Investment Securities Sold | 184 |
| Receivables for Accrued Income | 85 |
| Total Assets | 56,809 |
| Liabilities | |
| Payables for Investment Securities Purchased | 176 |
| Collateral for Securities on Loan | 26 |
| Payables to Vanguard | 4 |
| Variation Margin Payable—Futures Contracts | 1 |
| Total Liabilities | 207 |
| Net Assets | 56,602 |
| At November 30, 2020, net assets consisted of: | |
| Paid-in Capital | 61,208 |
| Total Distributable Earnings (Loss) | (4,606) |
| Net Assets | 56,602 |
| Net Assets | |
| Applicable to 650,000 outstanding $.001 par value shares of beneficial interest (unlimited authorization) | 56,602 |
| Net Asset Value Per Share | $87.08 |
See accompanying Notes, which are an integral part of the Financial Statements.
32
U.S. Minimum Volatility ETF
Statement of Operations
| Year Ended | |
| November 30, 2020 | |
| ($000) | |
| Investment Income | |
| Income | |
| Dividends | 1,908 |
| Interest1 | 5 |
| Securities Lending—Net | 46 |
| Total Income | 1,959 |
| Expenses | |
| The Vanguard Group—Note B | |
| Investment Advisory Services | 23 |
| Management and Administrative | 64 |
| Marketing and Distribution | 1 |
| Custodian Fees | 2 |
| Auditing Fees | 17 |
| Shareholders’ Reports | 5 |
| Trustees’ Fees and Expenses | — |
| Total Expenses | 112 |
| Net Investment Income | 1,847 |
| Realized Net Gain (Loss) | |
| Investment Securities Sold1,2 | (7,593) |
| Futures Contracts | 122 |
| Realized Net Gain (Loss) | (7,471) |
| Change in Unrealized Appreciation (Depreciation) | |
| Investment Securities1 | 681 |
| Futures Contracts | 7 |
| Change in Unrealized Appreciation (Depreciation) | 688 |
| Net Increase (Decrease) in Net Assets Resulting from Operations | (4,936) |
| 1 | Interest income, realized net gain (loss), and change in unrealized appreciation (depreciation) from an affiliated company of the fund were $5,000, $0, and $0, respectively. Purchases and sales are for temporary cash investment purposes. |
| 2 | Includes $3,442,000 of net gain (loss) resulting from in-kind redemptions. |
See accompanying Notes, which are an integral part of the Financial Statements.
33
U.S. Minimum Volatility ETF
Statement of Changes in Net Assets
| Year Ended November 30, | ||
| 2020 | 2019 | |
| ($000) | ($000) | |
| Increase (Decrease) in Net Assets | ||
| Operations | ||
| Net Investment Income | 1,847 | 1,332 |
| Realized Net Gain (Loss) | (7,471) | (270) |
| Change in Unrealized Appreciation (Depreciation) | 688 | 5,247 |
| Net Increase (Decrease) in Net Assets Resulting from Operations | (4,936) | 6,309 |
| Distributions1 | ||
| Total Distributions | (2,094) | (898) |
| Capital Share Transactions | ||
| Issued | 29,188 | 63,225 |
| Issued in Lieu of Cash Distributions | — | — |
| Redeemed | (56,656) | — |
| Net Increase (Decrease) from Capital Share Transactions | (27,468) | 63,225 |
| Total Increase (Decrease) | (34,498) | 68,636 |
| Net Assets | ||
| Beginning of Period | 91,100 | 22,464 |
| End of Period | 56,602 | 91,100 |
1 Certain prior-period numbers have been reclassified to conform with the current-period presentation.
See accompanying Notes, which are an integral part of the Financial Statements.
34
U.S. Minimum Volatility ETF
Financial Highlights
| Feb. 13, | |||
| Year Ended | 20181 to | ||
| Nov. 30, | Nov. 30, | ||
| For a Share Outstanding Throughout Each Period | 2020 | 2019 | 2018 |
| Net Asset Value, Beginning of Period | $91.10 | $81.69 | $75.00 |
| Investment Operations | |||
| Net Investment Income2 | 1.779 | 2.632 | 1.887 |
| Net Realized and Unrealized Gain (Loss) on Investments | (3.776) | 8.996 | 5.677 |
| Total from Investment Operations | (1.997) | 11.628 | 7.564 |
| Distributions | |||
| Dividends from Net Investment Income | (2.023) | (2.218) | (.874) |
| Distributions from Realized Capital Gains | — | — | — |
| Total Distributions | (2.023) | (2.218) | (.874) |
| Net Asset Value, End of Period | $87.08 | $91.10 | $81.69 |
| Total Return | -1.99% | 14.58% | 10.07% |
| Ratios/Supplemental Data | |||
| Net Assets, End of Period (Millions) | $57 | $91 | $22 |
| Ratio of Total Expenses to Average Net Assets | 0.13% | 0.13% | 0.13%3 |
| Ratio of Net Investment Income to Average Net Assets | 2.14% | 3.05% | 2.90%3 |
| Portfolio Turnover Rate | 83%4 | 23% | 5% |
| 1 | Inception. |
| 2 | Calculated based on average shares outstanding. |
| 3 | Annualized. |
| 4 | Excludes the value of portfolio securities received or delivered as a result of in-kind purchases or redemptions of the fund’s capital shares, including ETF Creation Units. |
See accompanying Notes, which are an integral part of the Financial Statements.
35
U.S. Minimum Volatility ETF
Notes to Financial Statements
Vanguard U.S. Minimum Volatility ETF is registered under the Investment Company Act of 1940 as an open-end investment company, or mutual fund. ETF Shares are listed for trading on Cboe BZX Exchange; they can be purchased and sold through a broker. Market disruptions associated with the COVID-19 pandemic have had a global impact, and uncertainty exists as to the long-term implications. Such disruptions can adversely affect assets of the fund and thus fund performance.
A. The following significant accounting policies conform to generally accepted accounting principles for U.S. investment companies. The fund consistently follows such policies in preparing its financial statements.
1. Security Valuation: Securities are valued as of the close of trading on the New York Stock Exchange (generally 4 p.m., Eastern time) on the valuation date. Equity securities are valued at the latest quoted sales prices or official closing prices taken from the primary market in which each security trades; such securities not traded on the valuation date are valued at the mean of the latest quoted bid and asked prices. Securities for which market quotations are not readily available, or whose values have been materially affected by events occurring before the fund’s pricing time but after the close of the securities’ primary markets, are valued by methods deemed by the board of trustees to represent fair value. Investments in Vanguard Market Liquidity Fund are valued at that fund’s net asset value.
2. Futures Contracts: The fund uses index futures contracts to a limited extent, with the objective of maintaining full exposure to the stock market while maintaining liquidity. The fund may purchase or sell futures contracts to achieve a desired level of investment, whether to accommodate portfolio turnover or cash flows from capital share transactions. The primary risks associated with the use of futures contracts are imperfect correlation between changes in market values of stocks held by the fund and the prices of futures contracts, and the possibility of an illiquid market. Counterparty risk involving futures is mitigated because a regulated clearinghouse is the counterparty instead of the clearing broker. To further mitigate counterparty risk, the fund trades futures contracts on an exchange, monitors the financial strength of its clearing brokers and clearinghouse, and has entered into clearing agreements with its clearing brokers. The clearinghouse imposes initial margin requirements to secure the fund’s performance and requires daily settlement of variation margin representing changes in the market value of each contract. Any securities pledged as initial margin for open contracts are noted in the Schedule of Investments.
Futures contracts are valued at their quoted daily settlement prices. The notional amounts of the contracts are not recorded in the Statement of Assets and Liabilities. Fluctuations in the value of the contracts are recorded in the Statement of Assets and Liabilities as an asset (liability) and in the Statement of Operations as unrealized appreciation (depreciation) until the contracts are closed, when they are recorded as realized gains (losses) on futures contracts.
During the year ended November 30, 2020, the fund’s average investments in long and short futures contracts represented less than 1% and 0% of net assets, respectively, based on the average of the notional amounts at each quarter-end during the period.
3. Federal Income Taxes: The fund intends to continue to qualify as a regulated investment company and distribute all of its taxable income. The fund’s tax returns are open to examination by the relevant tax authorities until expiration of the applicable statute of limitations, which is generally three years after the filing of the tax return. Management has analyzed the fund’s tax positions taken for all open federal and state income tax years, and has concluded that no provision for income tax is required in the fund’s financial statements.
36
U.S. Minimum Volatility ETF
4. Distributions: Distributions to shareholders are recorded on the ex-dividend date. Distributions are determined on a tax basis at the fiscal year-end and may differ from net investment income and realized capital gains for financial reporting purposes.
5. Securities Lending: To earn additional income, the fund lends its securities to qualified institutional borrowers. Security loans are subject to termination by the fund at any time, and are required to be secured at all times by collateral in an amount at least equal to the market value of securities loaned. Daily market fluctuations could cause the value of loaned securities to be more or less than the value of the collateral received. When this occurs, the collateral is adjusted and settled before the opening of the market on the next business day. The fund further mitigates its counterparty risk by entering into securities lending transactions only with a diverse group of prequalified counterparties, monitoring their financial strength, and entering into master securities lending agreements with its counterparties. The master securities lending agreements provide that, in the event of a counterparty’s default (including bankruptcy), the fund may terminate any loans with that borrower, determine the net amount owed, and sell or retain the collateral up to the net amount owed to the fund; however, such actions may be subject to legal proceedings. While collateral mitigates counterparty risk, in the event of a default, the fund may experience delays and costs in recovering the securities loaned. The fund invests cash collateral received in Vanguard Market Liquidity Fund, and records a liability in the Statement of Assets and Liabilities for the return of the collateral, during the period the securities are on loan. Collateral investments in Vanguard Market Liquidity Fund are subject to market appreciation or depreciation. Securities lending income represents fees charged to borrowers plus income earned on invested cash collateral, less expenses associated with the loan. During the term of the loan, the fund is entitled to all distributions made on or in respect of the loaned securities.
6. Credit Facilities and Interfund Lending Program: The fund and certain other funds managed by The Vanguard Group (“Vanguard”) participate in a $4.3 billion committed credit facility provided by a syndicate of lenders pursuant to a credit agreement and an uncommitted credit facility provided by Vanguard. Both facilities may be renewed annually. Each fund is individually liable for its borrowings, if any, under the credit facilities. Borrowings may be utilized for temporary or emergency purposes, subject to the fund’s regulatory and contractual borrowing restrictions. With respect to the committed credit facility, the participating funds are charged administrative fees and an annual commitment fee of 0.10% of the undrawn committed amount of the facility; these fees are allocated to the funds based on a method approved by the fund’s board of trustees and included in Management and Administrative expenses on the fund’s Statement of Operations. Any borrowings under either facility bear interest at a rate based upon the higher of the one-month London Interbank Offered Rate (or an acceptable alternate rate, if necessary), federal funds effective rate, or overnight bank funding rate plus an agreed-upon spread, except that borrowings under the uncommitted credit facility may bear interest based upon an alternative rate agreed to by the fund and Vanguard.
In accordance with an exemptive order (the “Order”) from the SEC, the fund may participate in a joint lending and borrowing program that allows registered open-end Vanguard funds to borrow money from and lend money to each other for temporary or emergency purposes (the “Interfund Lending Program”), subject to compliance with the terms and conditions of the Order, and to the extent permitted by the fund’s investment objective and investment policies. Interfund loans and borrowings normally extend overnight, but can have a maximum duration of seven days. Loans
37
U.S. Minimum Volatility ETF
may be called on one business day’s notice. The interest rate to be charged is governed by the conditions of the Order and internal procedures adopted by the board of trustees. The board of trustees is responsible for overseeing the Interfund Lending Program.
For the year ended November 30, 2020, the fund did not utilize the credit facilities or the Interfund Lending Program.
7. Other: Dividend income is recorded on the ex-dividend date. Non-cash dividends included in dividend income, if any, are recorded at the fair value of the securities received. Interest income includes income distributions received from Vanguard Market Liquidity Fund and is accrued daily. Security transactions are accounted for on the date securities are bought or sold. Costs used to determine realized gains (losses) on the sale of investment securities are those of the specific securities sold.
B. In accordance with the terms of a Funds’ Service Agreement (the “FSA”) between Vanguard and the fund, Vanguard furnishes to the fund investment advisory, corporate management, administrative, marketing, and distribution services at Vanguard’s cost of operations (as defined by the FSA). These costs of operations are allocated to the fund based on methods and guidelines approved by the board of trustees and are generally settled twice a month.
Upon the request of Vanguard, the fund may invest up to 0.40% of its net assets as capital in Vanguard. At November 30, 2020, the fund had contributed to Vanguard capital in the amount of $3,000, representing less than 0.01% of the fund’s net assets and less than 0.01% of Vanguard’s capital received pursuant to the FSA. The fund’s trustees and officers are also directors and employees, respectively, of Vanguard.
C. Various inputs may be used to determine the value of the fund’s investments and derivatives. These inputs are summarized in three broad levels for financial statement purposes. The inputs or methodologies used to value securities are not necessarily an indication of the risk associated with investing in those securities.
Level 1—Quoted prices in active markets for identical securities.
Level 2—Other significant observable inputs (including quoted prices for similar securities, interest rates, prepayment speeds, credit risk, etc.).
Level 3—Significant unobservable inputs (including the fund’s own assumptions used to determine the fair value of investments). Any investments and derivatives valued with significant unobservable inputs are noted on the Schedule of Investments.
At November 30, 2020, 100% of the market value of the fund’s investments and derivatives was determined based on Level 1 inputs.
38
U.S. Minimum Volatility ETF
D. Permanent differences between book-basis and tax-basis components of net assets are reclassified among capital accounts in the financial statements to reflect their tax character. These reclassifications have no effect on net assets or net asset value per share. As of period end, permanent differences primarily attributable to the accounting for in-kind redemptions were reclassified between the following accounts:
| Amount | |
| ($000) | |
| Paid-in Capital | 3,442 |
| Total Distributable Earnings (Loss) | (3,442) |
Temporary differences between book-basis and tax-basis components of total distributable earnings (loss) arise when certain items of income, gain, or loss are recognized in different periods for financial statement and tax purposes; these differences will reverse at some time in the future. The differences are primarily related to the deferral of losses from wash sales and the recognition of unrealized gains or losses from certain derivative contracts. As of period end, the tax-basis components of total distributable earnings (loss) are detailed in the table as follows::
| Amount | |
| ($000) | |
| Undistributed Ordinary Income | 337 |
| Undistributed Long-Term Gains | — |
| Capital Loss Carryforwards | (11,261) |
| Qualified Late-Year Losses | — |
| Net Unrealized Gains (Losses) | 6,318 |
The tax character of distributions paid was as follows:
| Year Ended November 30, | ||
| 2020 | 2019 | |
| Amount | Amount | |
| ($000) | ($000) | |
| Ordinary Income* | 2,094 | 898 |
| Long-Term Capital Gains | — | — |
| Total | 2,094 | 898 |
* Includes short-term capital gains, if any.
As of November 30, 2020, gross unrealized appreciation and depreciation for investments and derivatives based on cost for U.S. federal income tax purposes were as follows:
| Amount | |
| ($000) | |
| Tax Cost | 50,200 |
| Gross Unrealized Appreciation | 8,184 |
| Gross Unrealized Depreciation | (1,866) |
| Net Unrealized Appreciation (Depreciation) | 6,318 |
39
U.S. Minimum Volatility ETF
E. During the year ended November 30, 2020, the fund purchased $69,844,000 of investment securities and sold $96,932,000 of investment securities, other than temporary cash investments. Purchases and sales include $0 and $21,309,000, respectively, in connection with in-kind purchases and redemptions of the fund's capital shares.
F. Capital shares issued and redeemed were:
| Year Ended November 30, | ||
| 2020 | 2019 | |
| Shares | Shares | |
| (000) | (000) | |
| Issued | 350 | 725 |
| Issued in Lieu of Cash Distributions | — | — |
| Redeemed | (700) | — |
| Net Increase (Decrease) in Shares Outstanding | (350) | 725 |
G. Management has determined that no events or transactions occurred subsequent to November 30, 2020, that would require recognition or disclosure in these financial statements.
40
U.S. Momentum Factor ETF
Performance Summary
All of the returns in this report represent past performance, which is not a guarantee of future results that may be achieved by the fund. (Current performance may be lower or higher than the performance data cited. For performance data current to the most recent month-end, visit our website at vanguard.com/performance.) Note, too, that both investment returns and principal value can fluctuate widely, so an investor’s shares, when sold, could be worth more or less than their original cost. The returns shown do not reflect taxes that a shareholder would pay on fund distributions or on the sale of fund shares.
Cumulative Performance: February 13, 2018, Through November 30, 2020
Initial Investment of $10,000
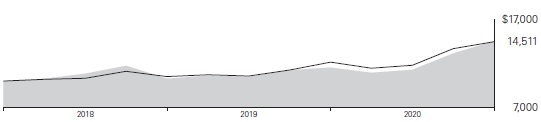
| Average Annual Total Returns | ||||
| Periods Ended November 30, 2020 | ||||
| Since | Final Value | |||
| One | Inception | of a $10,000 | ||
| Year | (2/13/2018) | Investment | ||
 |
U.S. Momentum Factor ETF Net Asset Value | 25.91% | 14.25% | $14,511 |
| U.S. Momentum Factor ETF Market Price | 25.91 | 14.26 | 14,513 | |
 |
Russell 3000 Index | 19.02 | 14.05 | 14,440 |
"Since Inception" performance is calculated from the ETF Shares’ inception date for both the fund and its comparative standard(s).
Cumulative Returns of ETF Shares: February 13, 2018, Through November 30, 2020
| Since | ||
| One | Inception | |
| Year | (2/13/2018) | |
| U.S. Momentum Factor ETF Market Price | 25.91% | 45.13% |
| U.S. Momentum Factor ETF Net Asset Value | 25.91 | 45.11 |
| Russell 3000 Index | 19.02 | 44.40 |
"Since Inception" performance is calculated from the ETF Shares’ inception date for both the fund and its comparative standard(s).
The market price is determined by the midpoint of the bid-offer spread as of the closing time of the New York Stock Exchange (generally 4 p.m., Eastern time). The net asset value is also determined as of the NYSE closing time. For more information about how the ETF Shares' market prices have compared with their net asset value, visit vanguard.com, select your ETF, and then select the Price and Performance tab. The ETF premium/discount analysis there shows the percentages of days on which the ETF Shares' market price was above or below the NAV.
See Financial Highlights for dividend and capital gains information.
41
U.S. Momentum Factor ETF
Fund Allocation
As of November 30, 2020
| Basic Materials | 2.0% |
| Consumer Discretionary | 24.7 |
| Consumer Staples | 2.3 |
| Energy | 2.6 |
| Financials | 4.3 |
| Health Care | 21.5 |
| Industrials | 13.2 |
| Real Estate | 1.8 |
| Technology | 25.0 |
| Telecommunications | 1.8 |
| Utilities | 0.8 |
The table reflects the fund’s investments, except for short-term investments and derivatives. Sector categories are based on the Industry Classification Benchmark ("ICB"), except for the "Other" category (if applicable), which includes secur-ities that have not been provided an ICB classification as of the effective reporting period.
The Industry Classification Benchmark ("ICB") is owned by FTSE. FTSE does not accept any liability to any person for any loss or damage arising out of any error or omission in the ICB.
42
U.S. Momentum Factor ETF
Financial Statements
Schedule of Investments
As of November 30, 2020
The fund files its complete schedule of portfolio holdings with the Securities and Exchange Commission (SEC) for the first and third quarters of each fiscal year as an exhibit to its reports on Form N-PORT. The fund’s Form N-PORT reports are available on the SEC’s website at www.sec.gov.
| Market | ||||
| Value• | ||||
| Shares | ($000) | |||
| Common Stocks (99.5%) | ||||
| Basic Materials (2.0%) | ||||
| Air Products & Chemicals Inc. | 788 | 221 | ||
| Southern Copper Corp. | 2,666 | 158 | ||
| Newmont Corp. | 2,505 | 147 | ||
| Tronox Holdings plc Class A | 6,096 | 77 | ||
| Chemours Co. | 3,000 | 73 | ||
| Scotts Miracle-Gro Co. | 375 | 66 | ||
| * | Clearwater Paper Corp. | 1,856 | 65 | |
| Hecla Mining Co. | 13,485 | 65 | ||
| * | Coeur Mining Inc. | 6,201 | 44 | |
| Albemarle Corp. | 301 | 41 | ||
| * | Kraton Corp. | 1,495 | 40 | |
| Reliance Steel & Aluminum Co. | 321 | 38 | ||
| * | Century Aluminum Co. | 3,493 | 35 | |
| Royal Gold Inc. | 290 | 32 | ||
| * | Novagold Resources Inc. | 2,774 | 28 | |
| Innospec Inc. | 219 | 18 | ||
| Commercial Metals Co. | 892 | 18 | ||
| UFP Industries Inc. | 229 | 12 | ||
| 1,178 | ||||
| Consumer Discretionary (24.6%) | ||||
| * | Tesla Inc. | 1,640 | 931 | |
| * | Amazon.com Inc. | 206 | 653 | |
| * | Netflix Inc. | 1,155 | 567 | |
| * | Lululemon Athletica Inc. | 1,511 | 559 | |
| Lowe’s Cos. Inc. | 2,569 | 400 | ||
| eBay Inc. | 7,511 | 379 | ||
| NIKE Inc. Class B | 2,794 | 376 | ||
| Target Corp. | 1,997 | 358 | ||
| * | Uber Technologies Inc. | 6,984 | 347 | |
| Dollar General Corp. | 1,182 | 258 | ||
| * | Spotify Technology SA | 783 | 228 | |
| Activision Blizzard Inc. | 2,716 | 216 | ||
| * | Caesars Entertainment Inc. | 3,047 | 208 | |
| * | Carvana Co. Class A | 791 | 198 | |
| * | Trade Desk Inc. Class A | 216 | 195 | |
| * | Etsy Inc. | 1,193 | 192 | |
| * | Electronic Arts Inc. | 1,494 | 191 | |
| * | Penn National Gaming Inc. | 2,581 | 181 | |
| * | Digital Turbine Inc. | 3,842 | 173 | |
| * | Copart Inc. | 1,436 | 166 | |
| * | Peloton Interactive Inc. Class A | 1,302 | 151 | |
| * | Tupperware Brands Corp. | 4,500 | 151 | |
| L Brands Inc. | 3,862 | 150 | ||
| * | Rh | 324 | 147 | |
| Toll Brothers Inc. | 2,795 | 132 | ||
| * | Chipotle Mexican Grill Inc. Class A | 95 | 122 | |
| Fortune Brands Home & Security Inc. | 1,465 | 122 | ||
| Home Depot Inc. | 432 | 120 | ||
| * | MercadoLibre Inc. | 77 | 120 | |
| * | Purple Innovation Inc. Class A | 3,960 | 118 | |
| Churchill Downs Inc. | 656 | 118 | ||
| * | Crocs Inc. | 1,949 | 115 | |
| * | Chegg Inc. | 1,455 | 113 | |
| * | SiteOne Landscape Supply Inc. | 814 | 112 | |
| * | At Home Group Inc. | 5,887 | 111 | |
| * | Wayfair Inc. | 435 | 111 | |
| * | Lumber Liquidators Holdings Inc. | 3,759 | 109 | |
| Rollins Inc. | 1,805 | 103 | ||
| * | CarParts.com Inc. | 6,808 | 103 | |
| * | Nautilus Inc. | 4,853 | 102 | |
| Lithia Motors Inc. Class A | 342 | 99 | ||
| Brinker International Inc. | 1,917 | 96 | ||
| * | Stamps.com Inc. | 508 | 95 | |
| * | Scientific Games Corp. | 2,509 | 93 | |
| Sonic Automotive Inc. Class A | 2,275 | 92 | ||
| * | BJ’s Wholesale Club Holdings Inc. | 2,221 | 91 | |
| * | Avis Budget Group Inc. | 2,574 | 90 | |
| Williams-Sonoma Inc. | 824 | 90 | ||
| * | Deckers Outdoor Corp. | 353 | 90 | |
| * | Meritage Homes Corp. | 993 | 89 | |
43
| U.S. Momentum Factor ETF | ||||
| Market | ||||
| Value• | ||||
| Shares | ($000) | |||
| Thor Industries Inc. | 910 | 88 | ||
| * | BJ’s Restaurants Inc. | 2,446 | 81 | |
| * | Michaels Cos. Inc. | 7,971 | 79 | |
| * | Tempur Sealy International Inc. | 3,120 | 79 | |
| * | Floor & Decor Holdings Inc. Class A | 981 | 79 | |
| Bally’s Corp. | 1,760 | 78 | ||
| * | Lovesac Co. | 2,412 | 77 | |
| Camping World Holdings Inc. Class A | 2,441 | 75 | ||
| Signet Jewelers Ltd. | 2,417 | 73 | ||
| Walmart Inc. | 471 | 72 | ||
| Estee Lauder Cos. Inc. Class A | 293 | 72 | ||
| Gap Inc. | 3,360 | 70 | ||
| Citi Trends Inc. | 2,045 | 69 | ||
| * | Sportsman’s Warehouse Holdings Inc. | 4,934 | 69 | |
| Big Lots Inc. | 1,292 | 67 | ||
| * | Monarch Casino & Resort Inc. | 1,208 | 67 | |
| Hanesbrands Inc. | 4,617 | 66 | ||
| * | Century Communities Inc. | 1,466 | 65 | |
| * | MarineMax Inc. | 1,980 | 65 | |
| Costco Wholesale Corp. | 165 | 65 | ||
| * | Green Brick Partners Inc. | 2,886 | 63 | |
| * | Container Store Group Inc. | 6,671 | 62 | |
| Bed Bath & Beyond Inc. | 2,950 | 62 | ||
| * | Turtle Beach Corp. | 3,288 | 61 | |
| * | MasterCraft Boat Holdings Inc. | 2,801 | 61 | |
| KB Home | 1,693 | 60 | ||
| Whirlpool Corp. | 306 | 60 | ||
| * | Hibbett Sports Inc. | 1,415 | 58 | |
| * | XPEL Inc. | 1,525 | 58 | |
| Wingstop Inc. | 448 | 57 | ||
| * | National Vision Holdings Inc. | 1,327 | 57 | |
| Qurate Retail Group Inc. QVC Group Class A | 5,346 | 56 | ||
| Pool Corp. | 158 | 55 | ||
| Lennar Corp. Class A | 718 | 54 | ||
| * | Golden Entertainment Inc | 3,262 | 54 | |
| * | El Pollo Loco Holdings Inc. | 3,452 | 54 | |
| * | Everi Holdings Inc. | 5,077 | 54 | |
| * | Zynga Inc. Class A | 6,363 | 52 | |
| Dick’s Sporting Goods Inc. | 920 | 52 | ||
| Best Buy Co. Inc. | 479 | 52 | ||
| * | YETI Holdings Inc. | 821 | 52 | |
| Winnebago Industries Inc. | 974 | 52 | ||
| * | Cardlytics Inc. | 423 | 50 | |
| * | Lakeland Industries Inc. | 2,479 | 49 | |
| * | 1-800-Flowers.com Inc. Class A | 2,071 | 48 | |
| * | Eros STX Global Corp. | 22,610 | 48 | |
| * | Duluth Holdings Inc. | 3,243 | 48 | |
| * | Malibu Boats Inc. Class A | 827 | 47 | |
| * | Ollie’s Bargain Outlet Holdings Inc. | 533 | 47 | |
| ODP Corp. | 1,607 | 46 | ||
| Franchise Group Inc. | 1,669 | 45 | ||
| * | Taylor Morrison Home Corp. Class A | 1,763 | 45 | |
| * | M/I Homes Inc. | 973 | 44 | |
| Collectors Universe Inc. | 566 | 44 | ||
| * | LGI Homes Inc. | 396 | 43 | |
| Tractor Supply Co. | 289 | 41 | ||
| * | Clean Energy Fuels Corp. | 8,806 | 40 | |
| Wendy’s Co. | 1,799 | 40 | ||
| * | Fox Factory Holding Corp. | 450 | 39 | |
| * | iRobot Corp. | 491 | 38 | |
| Papa John’s International Inc. | 478 | 38 | ||
| * | GoPro Inc. Class A | 5,392 | 38 | |
| * | Sleep Number Corp. | 516 | 36 | |
| Group 1 Automotive Inc. | 286 | 34 | ||
| * | Lands’ End Inc. | 1,359 | 34 | |
| * | Cavco Industries Inc. | 188 | 34 | |
| * | TRI Pointe Group Inc. | 1,863 | 33 | |
| * | Gentherm Inc. | 572 | 32 | |
| * | Stitch Fix Inc. Class A | 767 | 31 | |
| * | Glu Mobile Inc. | 3,038 | 31 | |
| * | 2U Inc. | 909 | 29 | |
| DR Horton Inc. | 389 | 29 | ||
| Acushnet Holdings Corp. | 757 | 28 | ||
| Yum China Holdings Inc. | 493 | 28 | ||
| Johnson Outdoors Inc. Class A | 330 | 28 | ||
| * | frontdoor Inc. | 550 | 26 | |
| Murphy USA Inc. | 201 | 26 | ||
| Cooper Tire & Rubber Co. | 643 | 25 | ||
| * | K12 Inc. | 1,025 | 24 | |
| * | Adient plc | 759 | 24 | |
| Haverty Furniture Cos. Inc. | 838 | 23 | ||
| Rent-A-Center Inc. | 674 | 23 | ||
| Domino’s Pizza Inc. | 49 | 19 | ||
| * | Take-Two Interactive Software Inc. | 103 | 19 | |
| Callaway Golf Co. | 813 | 17 | ||
| * | WW International Inc. | 478 | 14 | |
| * | CarMax Inc. | 143 | 13 | |
| * | Five Below Inc. | 73 | 11 | |
| 14,382 | ||||
| Consumer Staples (2.2%) | ||||
| * | Freshpet Inc. | 924 | 126 | |
| * | GrowGeneration Corp. | 3,436 | 121 | |
44
| U.S. Momentum Factor ETF | ||||
| Market | ||||
| Value• | ||||
| Shares | ($000) | |||
| * | Celsius Holdings Inc. | 3,576 | 115 | |
| * | Monster Beverage Corp. | 1,278 | 108 | |
| * | Beyond Meat Inc. | 615 | 86 | |
| Medifast Inc. | 401 | 82 | ||
| * | Helen of Troy Ltd. | 382 | 77 | |
| * | Boston Beer Co. Inc. Class A | 76 | 71 | |
| AmerisourceBergen Corp. Class A | 522 | 54 | ||
| * | United Natural Foods Inc. | 3,107 | 54 | |
| General Mills Inc. | 873 | 53 | ||
| PetMed Express Inc. | 1,702 | 52 | ||
| Ingles Markets Inc. Class A | 1,280 | 48 | ||
| * | Hain Celestial Group Inc. | 1,233 | 47 | |
| Flowers Foods Inc. | 2,077 | 46 | ||
| SpartanNash Co. | 2,379 | 45 | ||
| * | Darling Ingredients Inc. | 657 | 32 | |
| B&G Foods Inc. | 908 | 25 | ||
| Weis Markets Inc. | 493 | 24 | ||
| * | Simply Good Foods Co. | 995 | 22 | |
| Kroger Co. | 467 | 15 | ||
| 1,303 | ||||
| Energy (2.6%) | ||||
| * | FuelCell Energy Inc. | 27,029 | 276 | |
| * | SolarEdge Technologies Inc. | 837 | 233 | |
| * | Enphase Energy Inc. | 1,618 | 221 | |
| * | Plug Power Inc. | 4,827 | 127 | |
| * | Renewable Energy Group Inc. | 1,769 | 103 | |
| * | American Superconductor Corp. | 3,337 | 66 | |
| * | Ameresco Inc. Class A | 1,445 | 64 | |
| Range Resources Corp. | 8,574 | 63 | ||
| * | SunPower Corp. | 2,579 | 57 | |
| * | Antero Resources Corp. | 13,633 | 53 | |
| * | First Solar Inc. | 542 | 51 | |
| EQT Corp. | 3,213 | 48 | ||
| * | TPI Composites Inc. | 995 | 40 | |
| * | Southwestern Energy Co. | 11,721 | 36 | |
| * | Green Plains Inc. | 2,365 | 35 | |
| Antero Midstream Corp. | 3,398 | 23 | ||
| Arcosa Inc. | 331 | 17 | ||
| * | CNX Resources Corp. | 1,137 | 11 | |
| 1,524 | ||||
| Financials (4.2%) | ||||
| S&P Global Inc. | 784 | 276 | ||
| Moody’s Corp. | 724 | 204 | ||
| MSCI Inc. Class A | 386 | 158 | ||
| T. Rowe Price Group Inc. | 995 | 143 | ||
| Brown & Brown Inc. | 3,008 | 135 | ||
| MarketAxess Holdings Inc. | 211 | 114 | ||
| Cohen & Steers Inc. | 1,549 | 110 | ||
| BlackRock Inc. | 142 | 99 | ||
| Kinsale Capital Group Inc. | 346 | 83 | ||
| Ares Management Corp. Class A | 1,701 | 77 | ||
| Goosehead Insurance Inc. Class A | 602 | 74 | ||
| * | eXp World Holdings Inc. | 1,352 | 72 | |
| * | Mr Cooper Group Inc. | 2,690 | 72 | |
| PennyMac Financial Services Inc. | 995 | 57 | ||
| Arthur J Gallagher & Co. | 491 | 57 | ||
| * | Palomar Holdings Inc. | 842 | 56 | |
| Morningstar Inc. | 274 | 55 | ||
| * | Trupanion Inc. | 493 | 50 | |
| PJT Partners Inc. | 645 | 45 | ||
| * | Cannae Holdings Inc. | 1,090 | 43 | |
| Intercontinental Exchange Inc. | 404 | 43 | ||
| AMERISAFE Inc. | 755 | 41 | ||
| Hamilton Lane Inc. Class A | 568 | 40 | ||
| * | MoneyGram International Inc. | 5,585 | 38 | |
| * | Bancorp Inc. | 3,174 | 37 | |
| * | Triumph Bancorp Inc. | 755 | 34 | |
| * | Encore Capital Group Inc. | 799 | 27 | |
| * | PRA Group Inc. | 627 | 26 | |
| Apollo Global Management LLC | 584 | 25 | ||
| Brightsphere Investment Group Inc. | 1,405 | 25 | ||
| Virtus Investment Partners Inc. | 134 | 24 | ||
| Artisan Partners Asset Management Inc. Class A | 471 | 21 | ||
| * | eHealth Inc. | 273 | 21 | |
| Live Oak Bancshares Inc. | 438 | 18 | ||
| * | StoneX Group Inc. | 279 | 17 | |
| ServisFirst Bancshares Inc. | 426 | 16 | ||
| James River Group Holdings Ltd. | 352 | 16 | ||
| * | Silvergate Capital Corp. Class A | 417 | 15 | |
| * | BRP Group Inc. Class A | 348 | 10 | |
| 2,474 | ||||
| Health Care (21.4%) | ||||
| * | Veeva Systems Inc. Class A | 1,583 | 438 | |
| * | DexCom Inc. | 1,233 | 394 | |
| Thermo Fisher Scientific Inc. | 725 | 337 | ||
| Danaher Corp. | 1,104 | 248 | ||
| * | Moderna Inc. | 1,574 | 240 | |
| * | Horizon Therapeutics plc | 2,804 | 198 | |
| * | Mirati Therapeutics Inc. | 725 | 172 | |
| * | Novavax Inc. | 1,214 | 169 | |
45
| U.S. Momentum Factor ETF | ||||
| Market | ||||
| Value• | ||||
| Shares | ($000) | |||
| * | Acceleron Pharma Inc. | 1,432 | 169 | |
| * | Ultragenyx Pharmaceutical Inc. | 1,367 | 162 | |
| * | DaVita Inc. | 1,470 | 162 | |
| * | Intuitive Surgical Inc. | 219 | 159 | |
| Humana Inc. | 383 | 153 | ||
| * | Quidel Corp. | 767 | 150 | |
| * | Seagen Inc. | 875 | 149 | |
| * | Regeneron Pharmaceuticals Inc. | 285 | 147 | |
| * | Arcturus Therapeutics Holdings Inc. | 1,486 | 136 | |
| * | Ocular Therapeutix Inc. | 7,102 | 124 | |
| * | Teladoc Health Inc. | 616 | 122 | |
| * | Immunovant Inc. | 2,456 | 121 | |
| * | Amedisys Inc. | 490 | 120 | |
| * | Repligen Corp. | 627 | 119 | |
| * | Insulet Corp. | 455 | 117 | |
| * | iRhythm Technologies Inc. | 471 | 115 | |
| * | Natera Inc. | 1,291 | 114 | |
| * | Nevro Corp. | 666 | 107 | |
| * | Fate Therapeutics Inc. | 1,825 | 107 | |
| * | 10X Genomics Inc. Class A | 692 | 106 | |
| * | Surgery Partners Inc. | 4,264 | 104 | |
| * | TG Therapeutics Inc. | 3,532 | 104 | |
| * | Sarepta Therapeutics Inc. | 735 | 104 | |
| * | Inspire Medical Systems Inc. | 557 | 103 | |
| * | Kodiak Sciences Inc. | 754 | 103 | |
| *,^ | Vaxart Inc. | 11,949 | 95 | |
| * | Mersana Therapeutics Inc. | 3,704 | 94 | |
| * | Twist Bioscience Corp. | 837 | 94 | |
| * | Inovalon Holdings Inc. Class A | 4,991 | 93 | |
| * | Fulgent Genetics Inc. | 2,045 | 92 | |
| * | NantKwest Inc. | 9,428 | 90 | |
| * | Retractable Technologies Inc. | 7,763 | 90 | |
| * | ChemoCentryx Inc. | 1,599 | 88 | |
| Owens & Minor Inc. | 3,351 | 86 | ||
| * | Edwards Lifesciences Corp. | 1,007 | 85 | |
| * | Catalent Inc. | 875 | 84 | |
| * | Syndax Pharmaceuticals Inc. | 3,518 | 82 | |
| * | Replimune Group Inc. | 1,561 | 81 | |
| * | Rigel Pharmaceuticals Inc. | 26,609 | 81 | |
| * | Intra-Cellular Therapies Inc. | 3,354 | 79 | |
| * | Translate Bio Inc. | 3,512 | 78 | |
| * | Avid Bioservices Inc. | 8,552 | 78 | |
| * | Ovid therapeutics Inc. | 11,359 | 78 | |
| * | OPKO Health Inc. | 16,429 | 76 | |
| * | VBI Vaccines Inc. | 21,955 | 75 | |
| * | LHC Group Inc. | 382 | 75 | |
| * | NeoGenomics Inc. | 1,569 | 75 | |
| * | Tandem Diabetes Care Inc. | 793 | 74 | |
| * | Masimo Corp. | 292 | 74 | |
| * | Meridian Bioscience Inc. | 3,926 | 74 | |
| * | GenMark Diagnostics Inc. | 5,403 | 72 | |
| * | Protagonist Therapeutics Inc. | 2,790 | 67 | |
| * | Affimed NV | 12,590 | 67 | |
| * | Novocure Ltd. | 535 | 67 | |
| * | Castle Biosciences Inc. | 1,409 | 67 | |
| * | Revance Therapeutics Inc. | 2,763 | 67 | |
| * | Fluidigm Corp. | 10,609 | 66 | |
| * | Veracyte Inc. | 1,203 | 66 | |
| * | Vapotherm Inc. | 2,591 | 65 | |
| * | XBiotech Inc. | 3,380 | 64 | |
| * | Pacific Biosciences of California Inc. | 3,888 | 61 | |
| Eli Lilly and Co. | 420 | 61 | ||
| * | OraSure Technologies Inc. | 5,036 | 60 | |
| * | RAPT Therapeutics Inc. | 2,773 | 60 | |
| * | R1 RCM Inc. | 2,930 | 59 | |
| * | MannKind Corp. | 19,896 | 59 | |
| * | Bioxcel Therapeutics Inc. | 1,346 | 59 | |
| * | Axsome Therapeutics Inc. | 803 | 58 | |
| * | Immunic Inc. | 3,066 | 57 | |
| * | Adaptive Biotechnologies Corp. | 1,190 | 57 | |
| * | MacroGenics Inc. | 2,476 | 57 | |
| * | Emergent BioSolutions Inc. | 690 | 57 | |
| * | Personalis Inc. | 2,045 | 56 | |
| * | Select Medical Holdings Corp. | 2,327 | 56 | |
| * | Marinus Pharmaceuticals Inc. | 3,469 | 55 | |
| * | Pennant Group Inc. | 1,075 | 55 | |
| * | Iovance Biotherapeutics Inc. | 1,368 | 53 | |
| * | Cassava Sciences Inc. | 6,872 | 53 | |
| * | Alnylam Pharmaceuticals Inc. | 408 | 53 | |
| * | Denali Therapeutics Inc. | 861 | 53 | |
| * | CytoSorbents Corp. | 6,112 | 51 | |
| * | BioCryst Pharmaceuticals Inc. | 9,987 | 51 | |
| * | Agile Therapeutics Inc. | 17,989 | 51 | |
| * | Syneos Health Inc. | 764 | 50 | |
| * | Avantor Inc. | 1,839 | 50 | |
| * | Community Health Systems Inc. | 6,093 | 50 | |
46
| U.S. Momentum Factor ETF | ||||
| Market | ||||
| Value• | ||||
| Shares | ($000) | |||
| * | Seres Therapeutics Inc. | 1,805 | 50 | |
| * | Ontrak Inc. | 959 | 48 | |
| * | Deciphera Pharmaceuticals Inc. | 770 | 48 | |
| * | Allogene Therapeutics Inc. | 1,528 | 47 | |
| Chemed Corp. | 99 | 47 | ||
| * | Kiniksa Pharmaceuticals Ltd. Class A | 2,524 | 47 | |
| * | AtriCure Inc. | 1,083 | 47 | |
| * | BioLife Solutions Inc. | 1,292 | 47 | |
| West Pharmaceutical Services Inc. | 168 | 46 | ||
| * | RadNet Inc. | 2,458 | 46 | |
| * | ImmunoGen Inc. | 8,364 | 46 | |
| * | Quanterix Corp. | 1,040 | 45 | |
| * | Intellia Therapeutics Inc. | 1,139 | 45 | |
| * | Jounce Therapeutics Inc. | 6,185 | 44 | |
| * | STAAR Surgical Co. | 612 | 44 | |
| * | Invitae Corp. | 875 | 43 | |
| * | Cymabay Therapeutics Inc. | 5,773 | 43 | |
| * | SpringWorks Therapeutics Inc. | 660 | 43 | |
| * | NanoString Technologies Inc. | 836 | 42 | |
| * | Provention Bio Inc. | 2,744 | 41 | |
| STERIS plc | 212 | 41 | ||
| * | Insmed Inc. | 1,051 | 41 | |
| * | Bio-Rad Laboratories Inc. Class A | 76 | 41 | |
| * | Evolent Health Inc. Class A | 2,769 | 40 | |
| * | Vir Biotechnology Inc. | 1,262 | 40 | |
| ResMed Inc. | 189 | 40 | ||
| * | Halozyme Therapeutics Inc. | 1,005 | 39 | |
| * | Y-mAbs Therapeutics Inc. | 762 | 39 | |
| * | AdaptHealth Corp. Class A | 1,293 | 39 | |
| Zoetis Inc. | 238 | 38 | ||
| * | Medpace Holdings Inc. | 296 | 38 | |
| * | Amicus Therapeutics Inc. | 1,648 | 38 | |
| * | IGM Biosciences Inc. | 551 | 37 | |
| * | Align Technology Inc. | 75 | 36 | |
| * | ABIOMED Inc. | 131 | 36 | |
| Abbott Laboratories | 325 | 35 | ||
| * | NGM Biopharmaceuticals Inc. | 1,466 | 35 | |
| * | Charles River Laboratories International Inc. | 148 | 35 | |
| * | Anavex Life Sciences Corp. | 6,504 | 35 | |
| Invacare Corp. | 3,981 | 34 | ||
| * | Krystal Biotech Inc. | 618 | 34 | |
| * | Addus HomeCare Corp. | 339 | 34 | |
| National Research Corp. | 626 | 32 | ||
| * | Cytokinetics Inc. | 1,901 | 32 | |
| * | Rocket Pharmaceuticals Inc. | 1,021 | 32 | |
| * | Alphatec Holdings Inc. | 2,996 | 31 | |
| * | Turning Point Therapeutics Inc. | 291 | 31 | |
| * | Arena Pharmaceuticals Inc. | 468 | 31 | |
| * | Karuna Therapeutics Inc. | 306 | 31 | |
| * | MEI Pharma Inc. | 10,396 | 30 | |
| * | Geron Corp. | 15,635 | 29 | |
| * | Akero Therapeutics Inc. | 1,006 | 29 | |
| * | Cardiovascular Systems Inc. | 825 | 28 | |
| * | OrthoPediatrics Corp. | 621 | 28 | |
| * | Xencor Inc. | 659 | 28 | |
| * | Dicerna Pharmaceuticals Inc. | 1,080 | 27 | |
| * | Option Care Health Inc. | 1,689 | 27 | |
| * | Arrowhead Pharmaceuticals Inc. | 425 | 27 | |
| * | Agenus Inc. | 7,075 | 26 | |
| * | Neogen Corp. | 352 | 26 | |
| * | Bridgebio Pharma Inc. | 498 | 25 | |
| * | Antares Pharma Inc. | 7,801 | 24 | |
| * | Exact Sciences Corp. | 192 | 23 | |
| * | CareDx Inc. | 406 | 23 | |
| * | Adverum Biotechnologies Inc | 1,688 | 23 | |
| * | Albireo Pharma Inc. | 588 | 22 | |
| * | Arcus Biosciences Inc. | 803 | 22 | |
| * | PTC Therapeutics Inc. | 346 | 22 | |
| * | Amneal Pharmaceuticals Inc. | 5,437 | 22 | |
| * | Biohaven Pharmaceutical Holding Co. Ltd. | 239 | 21 | |
| * | Collegium Pharmaceutical Inc. | 1,137 | 21 | |
| * | Blueprint Medicines Corp. | 194 | 21 | |
| * | IVERIC bio Inc. | 3,051 | 21 | |
| * | Allakos Inc. | 189 | 20 | |
| * | Exelixis Inc. | 1,045 | 20 | |
| * | TCR2 Therapeutics Inc. | 704 | 19 | |
| * | AnaptysBio Inc. | 685 | 18 | |
| * | Cortexyme Inc. | 362 | 18 | |
| * | Axonics Modulation Technologies Inc. | 385 | 17 | |
| * | Apellis Pharmaceuticals Inc. | 336 | 16 | |
| * | Kura Oncology Inc. | 436 | 16 | |
| * | Editas Medicine Inc. | 515 | 16 | |
| * | Aquestive Therapeutics Inc. | 2,214 | 16 | |
| * | United Therapeutics Corp. | 117 | 16 | |
| * | Atreca Inc. Class A | 962 | 15 | |
47
| U.S. Momentum Factor ETF | ||||
| Market | ||||
| Value• | ||||
| Shares | ($000) | |||
| * | Neoleukin Therapeutics Inc. | 1,162 | 15 | |
| * | QIAGEN NV | 304 | 15 | |
| Luminex Corp. | 610 | 15 | ||
| * | Paratek Pharmaceuticals Inc. | 2,328 | 14 | |
| * | Cerus Corp. | 2,106 | 14 | |
| Encompass Health Corp. | 173 | 14 | ||
| * | Stoke Therapeutics Inc. | 266 | 14 | |
| * | ACADIA Pharmaceuticals Inc. | 242 | 14 | |
| * | Cue Biopharma Inc. | 961 | 13 | |
| * | Kala Pharmaceuticals Inc. | 1,772 | 13 | |
| Amgen Inc. | 58 | 13 | ||
| * | Prothena Corp. plc | 1,110 | 13 | |
| * | Athersys Inc. | 6,770 | 13 | |
| * | Karyopharm Therapeutics Inc. | 682 | 12 | |
| * | Zynex Inc. | 814 | 11 | |
| * | Avrobio Inc. | 778 | 11 | |
| * | Ardelyx Inc. | 92 | 1 | |
| 12,525 | ||||
| Industrials (13.2%) | ||||
| * | Square Inc. | 3,807 | 803 | |
| * | PayPal Holdings Inc. | 3,325 | 712 | |
| FedEx Corp. | 1,766 | 506 | ||
| United Parcel Service Inc. Class B | 2,554 | 437 | ||
| Deere & Co. | 1,367 | 358 | ||
| * | Generac Holdings Inc. | 1,018 | 219 | |
| * | Trex Co. Inc. | 2,307 | 173 | |
| * | Forterra Inc. | 7,701 | 143 | |
| Booz Allen Hamilton Holding Corp. Class A | 1,420 | 123 | ||
| Shyft Group Inc. | 4,655 | 121 | ||
| * | TopBuild Corp. | 674 | 117 | |
| * | XPO Logistics Inc. | 1,077 | 115 | |
| * | Virgin Galactic Holdings Inc. | 4,137 | 110 | |
| Maxar Technologies Inc. | 3,904 | 109 | ||
| * | Bloom Energy Corp. Class A | 4,367 | 107 | |
| Verisk Analytics Inc. Class A | 535 | 106 | ||
| Ball Corp. | 1,009 | 97 | ||
| MKS Instruments Inc. | 664 | 92 | ||
| * | Paylocity Holding Corp. | 448 | 88 | |
| * | Proto Labs Inc. | 621 | 86 | |
| Old Dominion Freight Line Inc. | 401 | 82 | ||
| * | Chart Industries Inc. | 779 | 80 | |
| * | CryoPort Inc. | 1,599 | 78 | |
| * | Saia Inc. | 443 | 77 | |
| * | Axon Enterprise Inc. | 608 | 76 | |
| Mastercard Inc. Class A | 227 | 76 | ||
| Kansas City Southern | 380 | 71 | ||
| * | Masonite International Corp. | 707 | 71 | |
| * | Fair Isaac Corp. | 147 | 69 | |
| * | Orion Energy Systems Inc. | 5,924 | 61 | |
| EVERTEC Inc. | 1,610 | 60 | ||
| Visa Inc. Class A | 274 | 58 | ||
| Cintas Corp. | 162 | 58 | ||
| * | Vivint Smart Home Inc. | 2,599 | 57 | |
| * | StoneCo Ltd. Class A | 755 | 55 | |
| * | Cornerstone Building Brands Inc. | 6,201 | 54 | |
| * | Atlas Air Worldwide Holdings Inc. | 952 | 53 | |
| * | JELD-WEN Holding Inc. | 2,155 | 52 | |
| * | Installed Building Products Inc. | 527 | 52 | |
| *,1 | API Group Corp. | 3,326 | 52 | |
| Knight-Swift Transportation Holdings Inc. | 1,243 | 51 | ||
| * | Alpha Pro Tech Ltd. | 3,985 | 50 | |
| Mesa Laboratories Inc. | 184 | 50 | ||
| ADT Inc. | 6,366 | 49 | ||
| * | US Xpress Enterprises Inc. Class A | 6,418 | 48 | |
| Advanced Drainage Systems Inc. | 690 | 48 | ||
| Brunswick Corp. | 643 | 48 | ||
| * | Textainer Group Holdings Ltd. | 2,600 | 48 | |
| * | Repay Holdings Corp. Class A | 1,943 | 47 | |
| * | Atkore International Group Inc. | 1,199 | 47 | |
| * | Vicor Corp. | 565 | 46 | |
| * | Resideo Technologies Inc. | 2,337 | 43 | |
| * | Construction Partners Inc. Class A | 1,590 | 42 | |
| * | FTI Consulting Inc. | 394 | 41 | |
| Marten Transport Ltd. | 2,335 | 41 | ||
| Sherwin-Williams Co. | 55 | 41 | ||
| Franklin Electric Co. Inc. | 581 | 39 | ||
| Patrick Industries Inc. | 604 | 38 | ||
| * | Green Dot Corp. Class A | 678 | 36 | |
| Cognex Corp. | 462 | 35 | ||
| * | Vectrus Inc. | 720 | 34 | |
| CAI International Inc. | 1,052 | 33 | ||
| Global Payments Inc. | 168 | 33 | ||
| Tetra Tech Inc. | 272 | 32 | ||
| Exponent Inc. | 379 | 31 | ||
| Astec Industries Inc. | 537 | 31 | ||
| * | Teledyne Technologies Inc. | 82 | 31 | |
| * | Dycom Industries Inc. | 492 | 31 | |
48
| U.S. Momentum Factor ETF | ||||
| Market | ||||
| Value• | ||||
| Shares | ($000) | |||
| * | Builders FirstSource Inc. | 821 | 31 | |
| * | Mercury Systems Inc. | 419 | 30 | |
| * | Tutor Perini Corp. | 2,155 | 29 | |
| CSW Industrials Inc. | 259 | 28 | ||
| * | Itron Inc. | 340 | 27 | |
| * | AeroVironment Inc. | 308 | 26 | |
| * | Donnelley Financial Solutions Inc. | 1,610 | 26 | |
| Greenbrier Cos. Inc. | 783 | 26 | ||
| Tennant Co. | 384 | 26 | ||
| Simpson Manufacturing Co. Inc. | 278 | 26 | ||
| * | Covenant Transportation Group Inc. Class A | 1,381 | 26 | |
| Federal Signal Corp. | 798 | 25 | ||
| * | Livent Corp. | 1,564 | 24 | |
| Triton International Ltd. | 519 | 23 | ||
| Badger Meter Inc. | 264 | 22 | ||
| Jacobs Engineering Group Inc. | 189 | 20 | ||
| Schneider National Inc. Class B | 927 | 19 | ||
| McGrath RentCorp | 291 | 19 | ||
| * | Zebra Technologies Corp. | 46 | 17 | |
| Quanta Services Inc. | 246 | 17 | ||
| Eaton Corp. plc | 137 | 17 | ||
| ICF International Inc. | 220 | 16 | ||
| AAON Inc. | 229 | 15 | ||
| Werner Enterprises Inc. | 341 | 14 | ||
| Costamare Inc. | 1,891 | 14 | ||
| * | AMN Healthcare Services Inc. | 208 | 14 | |
| O-I Glass Inc. | 1,050 | 12 | ||
| * | United Rentals Inc. | 52 | 12 | |
| Altra Industrial Motion Corp. | 203 | 12 | ||
| CoreLogic Inc. | 143 | 11 | ||
| 7,682 | ||||
| Real Estate (1.8%) | ||||
| * | Zillow Group Inc. Class C | 1,739 | 188 | |
| Equinix Inc. | 165 | 115 | ||
| * | Redfin Corp. | 2,243 | 107 | |
| Prologis Inc. | 943 | 94 | ||
| * | CoStar Group Inc. | 76 | 69 | |
| Crown Castle International Corp. | 317 | 53 | ||
| Safehold Inc. | 738 | 50 | ||
| Community Healthcare Trust Inc. | 1,018 | 46 | ||
| Global Medical REIT Inc. | 3,183 | 44 | ||
| SBA Communications Corp. Class A | 148 | 43 | ||
| * | Realogy Holdings Corp. | 3,270 | 40 | |
| QTS Realty Trust Inc. Class A | 592 | 35 | ||
| Rexford Industrial Realty Inc. | 641 | 31 | ||
| Lexington Realty Trust | 2,433 | 25 | ||
| Terreno Realty Corp. | 416 | 24 | ||
| EastGroup Properties Inc. | 169 | 23 | ||
| Uniti Group Inc. | 2,033 | 21 | ||
| Digital Realty Trust Inc. | 143 | 19 | ||
| CyrusOne Inc. | 198 | 14 | ||
| UMH Properties Inc. | 876 | 13 | ||
| 1,054 | ||||
| Technology (24.9%) | ||||
| NVIDIA Corp. | 1,628 | 873 | ||
| Apple Inc. | 7,264 | 865 | ||
| * | Advanced Micro Devices Inc. | 9,079 | 841 | |
| * | Zoom Video Communications Inc. Class A | 1,432 | 685 | |
| * | ServiceNow Inc. | 1,216 | 650 | |
| QUALCOMM Inc. | 2,908 | 428 | ||
| * | Adobe Inc. | 786 | 376 | |
| * | Autodesk Inc. | 1,247 | 349 | |
| * | Five9 Inc. | 2,010 | 312 | |
| * | salesforce.com Inc. | 1,227 | 302 | |
| Microsoft Corp. | 1,288 | 276 | ||
| * | Workday Inc. Class A | 1,188 | 267 | |
| * | DocuSign Inc. Class A | 1,127 | 257 | |
| Lam Research Corp. | 547 | 248 | ||
| * | Facebook Inc. Class A | 756 | 209 | |
| Entegris Inc. | 2,244 | 208 | ||
| * | Cloudflare Inc. Class A | 2,380 | 179 | |
| * | Coupa Software Inc. | 521 | 171 | |
| * | Nuance Communications Inc. | 3,927 | 169 | |
| * | Veritone Inc. | 6,342 | 169 | |
| * | Alphabet Inc. Class A | 95 | 167 | |
| * | RingCentral Inc. Class A | 550 | 163 | |
| * | Fastly Inc. Class A | 1,549 | 131 | |
| * | Avalara Inc. | 754 | 129 | |
| Teradyne Inc. | 1,099 | 121 | ||
| * | Crowdstrike Holdings Inc. Class A | 788 | 121 | |
| * | Zscaler Inc. | 764 | 119 | |
| * | IAC/InterActiveCorp | 825 | 117 | |
| * | II-VI Inc. | 1,709 | 116 | |
| * | Twilio Inc. Class A | 355 | 114 | |
| * | Cadence Design Systems Inc. | 949 | 110 | |
| * | FormFactor Inc. | 2,675 | 110 | |
| * | HubSpot Inc. | 271 | 107 | |
| * | MongoDB Inc. | 366 | 105 | |
| * | Okta Inc. | 426 | 104 | |
| * | Paycom Software Inc. | 246 | 103 | |
| * | Globant SA | 535 | 101 | |
49
| U.S. Momentum Factor ETF | ||||
| Market | ||||
| Value• | ||||
| Shares | ($000) | |||
| * | Lattice Semiconductor Corp. | 2,352 | 98 | |
| * | Cree Inc. | 1,048 | 95 | |
| * | Ultra Clean Holdings Inc. | 2,955 | 93 | |
| * | MACOM Technology Solutions Holdings Inc. | 2,072 | 93 | |
| * | Calix Inc. | 3,877 | 92 | |
| * | Datadog Inc. Class A | 924 | 91 | |
| * | Tyler Technologies Inc. | 213 | 91 | |
| Pegasystems Inc. | 690 | 90 | ||
| * | Waitr Holdings Inc. | 26,368 | 88 | |
| * | Dynatrace Inc. | 2,256 | 86 | |
| * | Ceridian HCM Holding Inc. | 860 | 83 | |
| * | Splunk Inc. | 399 | 81 | |
| * | Synaptics Inc. | 1,040 | 81 | |
| * | GAN Ltd. | 4,976 | 81 | |
| * | Vertiv Holdings Co. Class A | 4,298 | 80 | |
| * | Pinterest Inc. Class A | 1,136 | 80 | |
| NortonLifeLock Inc. | 4,321 | 79 | ||
| Broadcom Inc. | 196 | 79 | ||
| * | Qorvo Inc. | 485 | 76 | |
| * | Blackline Inc. | 573 | 70 | |
| * | Manhattan Associates Inc. | 669 | 68 | |
| * | EPAM Systems Inc. | 211 | 68 | |
| Monolithic Power Systems Inc. | 210 | 67 | ||
| Sapiens International Corp. NV | 2,192 | 65 | ||
| * | Cerence Inc. | 721 | 65 | |
| * | Atomera Inc. | 6,958 | 65 | |
| * | Fortinet Inc. | 515 | 63 | |
| * | Appfolio Inc. | 379 | 62 | |
| * | Alteryx Inc. Class A | 515 | 62 | |
| SYNNEX Corp. | 383 | 61 | ||
| * | Avaya Holdings Corp. | 3,261 | 61 | |
| * | Arlo Technologies Inc. | 11,351 | 60 | |
| * | CyberOptics Corp. | 2,201 | 59 | |
| * | nLight Inc. | 1,870 | 56 | |
| KLA Corp. | 214 | 54 | ||
| Skyworks Solutions Inc. | 375 | 53 | ||
| * | Model N Inc. | 1,531 | 53 | |
| * | Atlassian Corp. plc Class A | 227 | 51 | |
| * | LivePerson Inc. | 855 | 50 | |
| CDW Corp. | 382 | 50 | ||
| * | ANSYS Inc. | 144 | 49 | |
| * | SiTime Corp. | 551 | 48 | |
| * | Smartsheet Inc. Class A | 814 | 47 | |
| * | ChannelAdvisor Corp. | 3,054 | 45 | |
| * | Domo Inc. | 1,119 | 42 | |
| Pitney Bowes Inc. | 7,445 | 42 | ||
| Marvell Technology Group Ltd. | 885 | 41 | ||
| * | Upwork Inc. | 1,244 | 41 | |
| * | Magnite Inc. | 2,133 | 41 | |
| * | OneSpan Inc. | 2,033 | 40 | |
| * | CACI International Inc. Class A | 169 | 40 | |
| * | SPS Commerce Inc. | 387 | 40 | |
| * | Unisys Corp. | 2,735 | 40 | |
| * | Agilysys Inc. | 1,062 | 40 | |
| * | CEVA Inc. | 1,007 | 40 | |
| * | EverQuote Inc. Class A | 1,045 | 39 | |
| * | Novanta Inc. | 324 | 39 | |
| * | Qualys Inc. | 402 | 38 | |
| * | TechTarget Inc. | 726 | 38 | |
| * | Synopsys Inc. | 165 | 38 | |
| * | eGain Corp. | 3,249 | 37 | |
| * | Everbridge Inc. | 286 | 36 | |
| CMC Materials Inc. | 234 | 36 | ||
| * | Axcelis Technologies Inc. | 1,331 | 36 | |
| * | Bandwidth Inc. Class A | 229 | 35 | |
| Simulations Plus Inc. | 601 | 34 | ||
| * | Ambarella Inc. | 419 | 33 | |
| Leidos Holdings Inc. | 325 | 33 | ||
| * | SVMK Inc. | 1,469 | 31 | |
| * | Q2 Holdings Inc. | 273 | 31 | |
| * | Cloudera Inc. | 2,518 | 29 | |
| * | Alarm.com Holdings Inc. | 378 | 29 | |
| * | Appian Corp. Class A | 202 | 28 | |
| * | Diodes Inc. | 402 | 27 | |
| * | Varonis Systems Inc. | 226 | 27 | |
| * | Sailpoint Technologies Holdings Inc. | 579 | 27 | |
| Switch Inc. | 1,700 | 27 | ||
| * | PAR Technology Corp. | 481 | 26 | |
| NIC Inc. | 1,073 | 25 | ||
| * | TrueCar Inc. | 5,889 | 24 | |
| * | Covetrus Inc. | 866 | 23 | |
| * | Match Group Inc. | 165 | 23 | |
| Power Integrations Inc. | 310 | 22 | ||
| * | Elastic NV | 163 | 20 | |
| Shutterstock Inc. | 293 | 20 | ||
| * | LiveRamp Holdings Inc. | 344 | 20 | |
| Citrix Systems Inc. | 161 | 20 | ||
| * | PDF Solutions Inc. | 885 | 20 | |
| * | A10 Networks Inc. | 2,352 | 19 | |
| * | Bottomline Technologies DE Inc. | 406 | 19 | |
| PC Connection Inc. | 403 | 18 | ||
| * | Wix.com Ltd. | 69 | 18 | |
| * | Avid Technology Inc. | 1,430 | 17 | |
| Methode Electronics Inc. | 418 | 15 | ||
| * | Super Micro Computer Inc. | 490 | 14 | |
| * | Limelight Networks Inc. | 2,688 | 12 | |
50
| U.S. Momentum Factor ETF | ||||
| Market | ||||
| Value• | ||||
| Shares | ($000) | |||
| * | Box Inc. | 634 | 12 | |
| * | Ping Identity Holding Corp. | 523 | 12 | |
| * | IPG Photonics Corp. | 54 | 11 | |
| 14,546 | ||||
| Telecommunications (1.8%) | ||||
| * | T-Mobile US Inc. | 1,976 | 263 | |
| * | Charter Communications Inc. Class A | 377 | 246 | |
| * | Liberty Broadband Corp. | 839 | 132 | |
| Cable One Inc. | 53 | 105 | ||
| Ubiquiti Inc. | 269 | 67 | ||
| * | Lumentum Holdings Inc. | 635 | 55 | |
| * | Infinera Corp. | 6,173 | 52 | |
| * | Gogo Inc. | 4,885 | 51 | |
| * | Roku Inc. | 165 | 48 | |
| Shenandoah Telecommunications Co. | 601 | 27 | ||
| * | Consolidated Communications Holdings Inc. | 2,532 | 14 | |
| 1,060 | ||||
| Utilities (0.8%) | ||||
| * | Sunrun Inc. | 1,849 | 118 | |
| * | Sunnova Energy International Inc. | 2,429 | 98 | |
| Republic Services Inc. Class A | 776 | 75 | ||
| Clearway Energy Inc. | 2,448 | 72 | ||
| * | Casella Waste Systems Inc. Class A | 878 | 53 | |
| * | Stericycle Inc. | 548 | 39 | |
| * | Evoqua Water Technologies Corp. | 1,182 | 31 | |
| 486 | ||||
| Total
Common Stocks (Cost $42,774) |
58,214 | |||
| Temporary Cash Investment (0.7%) | ||||
| Money Market Fund (0.7%) | ||||
| 2,3 | Vanguard
Market Liquidity Fund, 0.109% (Cost $384) |
3,842 | 384 | |
| Total
Investments (100.2%) (Cost $43,158) |
58,598 | |||
| Other Asset and Liabilities—Net (-0.2%) | (118) | |||
| Net Assets (100%) | 58,480 | |||
Cost is in $000.
| • | See Note A in Notes to Financial Statements. |
| * | Non-income-producing security. |
| ^ | Includes partial security positions on loan to broker-dealers. The total value of securities on loan is $89,000. |
| 1 | Security exempt from registration under Rule 144A of the Securities Act of 1933. Such securities may be sold in transactions exempt from registration, normally to qualified institutional buyers. At November 30, 2020, the value of this security represented 0.1% of net assets. |
| 2 | Affiliated money market fund available only to Vanguard funds and certain trusts and accounts managed by Vanguard. Rate shown is the 7-day yield. |
| 3 | Collateral of $89,000 was received for securities on loan. REIT—Real Estate Investment Trust. |
| Derivative Financial Instruments Outstanding as of Period End | ||||
| Futures Contracts | ||||
| ($000) | ||||
| Value and | ||||
| Number of | Unrealized | |||
| Long (Short) | Notional | Appreciation | ||
| Expiration | Contracts | Amount | (Depreciation) | |
| Long Futures Contracts | ||||
| Micro E-mini S&P 500 Index | December 2020 | 12 | 217 | 16 |
See accompanying Notes, which are an integral part of the Financial Statements.
51
U.S. Momentum Factor ETF
Statement of Assets and Liabilities
As of November 30, 2020
| ($000s, except shares and per-share amounts) | Amount |
| Assets | |
| Investments in Securities, at Value | |
| Unaffiliated Issuers (Cost $42,774) | 58,214 |
| Affiliated Issuers (Cost $384) | 384 |
| Total Investments in Securities | 58,598 |
| Investment in Vanguard | 2 |
| Cash Collateral Pledged—Futures Contracts | 16 |
| Receivables for Accrued Income | 32 |
| Total Assets | 58,648 |
| Liabilities | |
| Due to Custodian | 74 |
| Collateral for Securities on Loan | 89 |
| Payables to Vanguard | 4 |
| Variation Margin Payable—Futures Contracts | 1 |
| Total Liabilities | 168 |
| Net Assets | 58,480 |
| At November 30, 2020, net assets consisted of: | |
| Paid-in Capital | 45,039 |
| Total Distributable Earnings (Loss) | 13,441 |
| Net Assets | 58,480 |
| Net Assets | |
| Applicable to 550,000 outstanding $.001 par value shares of beneficial interest (unlimited authorization) | 58,480 |
| Net Asset Value Per Share | $106.33 |
See accompanying Notes, which are an integral part of the Financial Statements.
52
U.S. Momentum Factor ETF
Statement of Operations
| Year Ended | |
| November 30, 2020 | |
| ($000) | |
| Investment Income | |
| Income | |
| Dividends | 331 |
| Interest1 | 1 |
| Securities Lending—Net | 4 |
| Total Income | 336 |
| Expenses | |
| The Vanguard Group—Note B | |
| Investment Advisory Services | — |
| Management and Administrative | 33 |
| Marketing and Distribution | — |
| Custodian Fees | 5 |
| Auditing Fees | 17 |
| Shareholders’ Reports | 3 |
| Trustees’ Fees and Expenses | — |
| Total Expenses | 58 |
| Net Investment Income | 278 |
| Realized Net Gain (Loss) | |
| Investment Securities Sold1,2 | 4,587 |
| Futures Contracts | 23 |
| Realized Net Gain (Loss) | 4,610 |
| Change in Unrealized Appreciation (Depreciation) | |
| Investment Securities1 | 10,401 |
| Futures Contracts | 13 |
| Change in Unrealized Appreciation (Depreciation) | 10,414 |
| Net Increase (Decrease) in Net Assets Resulting from Operations | 15,302 |
| 1 | Interest income, realized net gain (loss), and change in unrealized appreciation (depreciation) from an affiliated company of the fund were $1,000, $0, and $0, respectively. Purchases and sales are for temporary cash investment purposes. |
| 2 | Includes $3,179,000 of net gain (loss) resulting from in-kind redemptions. |
See accompanying Notes, which are an integral part of the Financial Statements.
53
U.S. Momentum Factor ETF
Statement of Changes in Net Assets
| Year Ended November 30, | ||
| 2020 | 2019 | |
| ($000) | ($000) | |
| Increase (Decrease) in Net Assets | ||
| Operations | ||
| Net Investment Income | 278 | 404 |
| Realized Net Gain (Loss) | 4,610 | (2,609) |
| Change in Unrealized Appreciation (Depreciation) | 10,414 | 5,813 |
| Net Increase (Decrease) in Net Assets Resulting from Operations | 15,302 | 3,608 |
| Distributions1 | ||
| Total Distributions | (299) | (358) |
| Capital Share Transactions | ||
| Issued | 25,852 | 4,083 |
| Issued in Lieu of Cash Distributions | — | — |
| Redeemed | (14,317) | (8,001) |
| Net Increase (Decrease) from Capital Share Transactions | 11,535 | (3,918) |
| Total Increase (Decrease) | 26,538 | (668) |
| Net Assets | ||
| Beginning of Period | 31,942 | 32,610 |
| End of Period | 58,480 | 31,942 |
| 1 | Certain prior-period numbers have been reclassified to conform with the current-period presentation. |
See accompanying Notes, which are an integral part of the Financial Statements.
54
U.S. Momentum Factor ETF
Financial Highlights
| Feb. 13, | |||
| Year Ended | 20181 to | ||
| Nov. 30, | Nov. 30, | ||
| For a Share Outstanding Throughout Each Period | 2020 | 2019 | 2018 |
| Net Asset Value, Beginning of Period | $85.18 | $76.73 | $75.00 |
| Investment Operations | |||
| Net Investment Income2 | .552 | .985 | .538 |
| Net Realized and Unrealized Gain (Loss) on Investments | 21.279 | 8.336 | 1.489 |
| Total from Investment Operations | 21.831 | 9.321 | 2.027 |
| Distributions | |||
| Dividends from Net Investment Income | (.681) | (.871) | (.297) |
| Distributions from Realized Capital Gains | — | — | — |
| Total Distributions | (.681) | (.871) | (.297) |
| Net Asset Value, End of Period | $106.33 | $85.18 | $76.73 |
| Total Return | 25.91% | 12.25% | 2.67% |
| Ratios/Supplemental Data | |||
| Net Assets, End of Period (Millions) | $58 | $32 | $33 |
| Ratio of Total Expenses to Average Net Assets | 0.13% | 0.13% | 0.13%4 |
| Ratio of Net Investment Income to Average Net Assets | 0.62% | 1.24% | 0.83%4 |
| Portfolio Turnover Rate | 115%3 | 118% | 53% |
| 1 | Inception. |
| 2 | Calculated based on average shares outstanding. |
| 3 | Excludes the value of portfolio securities received or delivered as a result of in-kind purchases or redemptions of the fund’s capital shares, including ETF Creation Units. |
| 4 | Annualized. |
See accompanying Notes, which are an integral part of the Financial Statements.
55
U.S. Momentum Factor ETF
Notes to Financial Statements
Vanguard U.S. Momentum Factor ETF is registered under the Investment Company Act of 1940 as an open-end investment company, or mutual fund. ETF Shares are listed for trading on Cboe BZX Exchange; they can be purchased and sold through a broker. Market disruptions associated with the COVID-19 pandemic have had a global impact, and uncertainty exists as to the long-term implications. Such disruptions can adversely affect assets of the fund and thus fund performance.
A. The following significant accounting policies conform to generally accepted accounting principles for U.S. investment companies. The fund consistently follows such policies in preparing its financial statements.
1. Security Valuation: Securities are valued as of the close of trading on the New York Stock Exchange (generally 4 p.m., Eastern time) on the valuation date. Equity securities are valued at the latest quoted sales prices or official closing prices taken from the primary market in which each security trades; such securities not traded on the valuation date are valued at the mean of the latest quoted bid and asked prices. Securities for which market quotations are not readily available, or whose values have been materially affected by events occurring before the fund’s pricing time but after the close of the securities’ primary markets, are valued by methods deemed by the board of trustees to represent fair value. Investments in Vanguard Market Liquidity Fund are valued at that fund’s net asset value.
2. Futures Contracts: The fund uses index futures contracts to a limited extent, with the objective of maintaining full exposure to the stock market while maintaining liquidity. The fund may purchase or sell futures contracts to achieve a desired level of investment, whether to accommodate portfolio turnover or cash flows from capital share transactions. The primary risks associated with the use of futures contracts are imperfect correlation between changes in market values of stocks held by the fund and the prices of futures contracts, and the possibility of an illiquid market. Counterparty risk involving futures is mitigated because a regulated clearinghouse is the counterparty instead of the clearing broker. To further mitigate counterparty risk, the fund trades futures contracts on an exchange, monitors the financial strength of its clearing brokers and clearinghouse, and has entered into clearing agreements with its clearing brokers. The clearinghouse imposes initial margin requirements to secure the fund’s performance and requires daily settlement of variation margin representing changes in the market value of each contract. Any securities pledged as initial margin for open contracts are noted in the Schedule of Investments.
Futures contracts are valued at their quoted daily settlement prices. The notional amounts of the contracts are not recorded in the Statement of Assets and Liabilities. Fluctuations in the value of the contracts are recorded in the Statement of Assets and Liabilities as an asset (liability) and in the Statement of Operations as unrealized appreciation (depreciation) until the contracts are closed, when they are recorded as realized gains (losses) on futures contracts.
During the year ended November 30, 2020, the fund’s average investments in long and short futures contracts represented less than 1% and 0% of net assets, respectively, based on the average of the notional amounts at each quarter-end during the period.
3. Federal Income Taxes: The fund intends to continue to qualify as a regulated investment company and distribute all of its taxable income. The fund’s tax returns are open to examination by the relevant tax authorities until expiration of the applicable statute of limitations, which is generally three years after the filing of the tax return. Management has analyzed the fund’s tax positions taken for all open federal and state income tax years, and has concluded that no provision for income tax is required in the fund’s financial statements.
56
U.S. Momentum Factor ETF
4. Distributions: Distributions to shareholders are recorded on the ex-dividend date. Distributions are determined on a tax basis at the fiscal year-end and may differ from net investment income and realized capital gains for financial reporting purposes.
5. Securities Lending: To earn additional income, the fund lends its securities to qualified institutional borrowers. Security loans are subject to termination by the fund at any time, and are required to be secured at all times by collateral in an amount at least equal to the market value of securities loaned. Daily market fluctuations could cause the value of loaned securities to be more or less than the value of the collateral received. When this occurs, the collateral is adjusted and settled before the opening of the market on the next business day. The fund further mitigates its counterparty risk by entering into securities lending transactions only with a diverse group of prequalified counterparties, monitoring their financial strength, and entering into master securities lending agreements with its counterparties. The master securities lending agreements provide that, in the event of a counterparty’s default (including bankruptcy), the fund may terminate any loans with that borrower, determine the net amount owed, and sell or retain the collateral up to the net amount owed to the fund; however, such actions may be subject to legal proceedings. While collateral mitigates counterparty risk, in the event of a default, the fund may experience delays and costs in recovering the securities loaned. The fund invests cash collateral received in Vanguard Market Liquidity Fund, and records a liability in the Statement of Assets and Liabilities for the return of the collateral, during the period the securities are on loan. Collateral investments in Vanguard Market Liquidity Fund are subject to market appreciation or depreciation. Securities lending income represents fees charged to borrowers plus income earned on invested cash collateral, less expenses associated with the loan. During the term of the loan, the fund is entitled to all distributions made on or in respect of the loaned securities.
6. Credit Facilities and Interfund Lending Program: The fund and certain other funds managed by The Vanguard Group (“Vanguard”) participate in a $4.3 billion committed credit facility provided by a syndicate of lenders pursuant to a credit agreement and an uncommitted credit facility provided by Vanguard. Both facilities may be renewed annually. Each fund is individually liable for its borrowings, if any, under the credit facilities. Borrowings may be utilized for temporary or emergency purposes, subject to the fund’s regulatory and contractual borrowing restrictions. With respect to the committed credit facility, the participating funds are charged administrative fees and an annual commitment fee of 0.10% of the undrawn committed amount of the facility; these fees are allocated to the funds based on a method approved by the fund’s board of trustees and included in Management and Administrative expenses on the fund’s Statement of Operations. Any borrowings under either facility bear interest at a rate based upon the higher of the one-month London Interbank Offered Rate (or an acceptable alternate rate, if necessary), federal funds effective rate, or overnight bank funding rate plus an agreed-upon spread, except that borrowings under the uncommitted credit facility may bear interest based upon an alternative rate agreed to by the fund and Vanguard.
In accordance with an exemptive order (the “Order”) from the SEC, the fund may participate in a joint lending and borrowing program that allows registered open-end Vanguard funds to borrow money from and lend money to each other for temporary or emergency purposes (the “Interfund Lending Program”), subject to compliance with the terms and conditions of the Order, and to the extent permitted by the fund’s investment objective and investment policies. Interfund loans and borrowings normally extend overnight, but can have a maximum duration of seven days. Loans may be called on one business day’s notice. The interest rate to be charged is governed by the conditions of the Order and internal procedures adopted by the board of trustees. The board of trustees is responsible for overseeing the Interfund Lending Program.
57
U.S. Momentum Factor ETF
For the year ended November 30, 2020, the fund did not utilize the credit facilities or the Interfund Lending Program.
7. Other: Dividend income is recorded on the ex-dividend date. Non-cash dividends included in dividend income, if any, are recorded at the fair value of the securities received. Interest income includes income distributions received from Vanguard Market Liquidity Fund and is accrued daily. Security transactions are accounted for on the date securities are bought or sold. Costs used to determine realized gains (losses) on the sale of investment securities are those of the specific securities sold.
B. In accordance with the terms of a Funds’ Service Agreement (the “FSA”) between Vanguard and the fund, Vanguard furnishes to the fund investment advisory, corporate management, administrative, marketing, and distribution services at Vanguard’s cost of operations (as defined by the FSA). These costs of operations are allocated to the fund based on methods and guidelines approved by the board of trustees and are generally settled twice a month.
Upon the request of Vanguard, the fund may invest up to 0.40% of its net assets as capital in Vanguard. At November 30, 2020, the fund had contributed to Vanguard capital in the amount of $2,000, representing less than 0.01% of the fund’s net assets and less than 0.01% of Vanguard’s capital received pursuant to the FSA. The fund’s trustees and officers are also directors and employees, respectively, of Vanguard.
C. Various inputs may be used to determine the value of the fund’s investments and derivatives. These inputs are summarized in three broad levels for financial statement purposes. The inputs or methodologies used to value securities are not necessarily an indication of the risk associated with investing in those securities.
Level 1—Quoted prices in active markets for identical securities.
Level 2—Other significant observable inputs (including quoted prices for similar securities, interest rates, prepayment speeds, credit risk, etc.).
Level 3—Significant unobservable inputs (including the fund’s own assumptions used to determine the fair value of investments). Any investments and derivatives valued with significant unobservable inputs are noted on the Schedule of Investments.
At November 30, 2020, 100% of the market value of the fund’s investments and derivatives was determined based on Level 1 inputs.
58
U.S. Momentum Factor ETF
D. Permanent differences between book-basis and tax-basis components of net assets are reclassified among capital accounts in the financial statements to reflect their tax character. These reclassifications have no effect on net assets or net asset value per share. As of period end, permanent differences primarily attributable to the accounting for in-kind redemptions and passive foreign investment companies were reclassified between the following accounts:
| Amount | |
| ($000) | |
| Paid-in Capital | 3,179 |
| Total Distributable Earnings (Loss) | (3,179) |
Temporary differences between book-basis and tax-basis components of total distributable earnings (loss) arise when certain items of income, gain, or loss are recognized in different periods for financial statement and tax purposes; these differences will reverse at some time in the future. The differences are primarily related to the deferral of losses from wash sales and the recognition of unrealized gains or losses from certain derivative contracts. As of period end, the tax-basis components of total distributable earnings (loss) are detailed in the table as follows:
| Amount | |
| ($000) | |
| Undistributed Ordinary Income | 81 |
| Undistributed Long-Term Gains | — |
| Capital Loss Carryforwards | (2,080) |
| Qualified Late-Year Losses | — |
| Net Unrealized Gains (Losses) | 15,440 |
The tax character of distributions paid was as follows:
| Year Ended November 30, | ||
| 2020 | 2019 | |
| Amount | Amount | |
| ($000) | ($000) | |
| Ordinary Income* | 299 | 358 |
| Long-Term Capital Gains | — | — |
| Total | 299 | 358 |
* Includes short-term capital gains, if any.
As of November 30, 2020, gross unrealized appreciation and depreciation for investments and derivatives based on cost for U.S. federal income tax purposes were as follows:
| Amount | |
| ($000) | |
| Tax Cost | 43,158 |
| Gross Unrealized Appreciation | 16,128 |
| Gross Unrealized Depreciation | (688) |
| Net Unrealized Appreciation (Depreciation) | 15,440 |
59
U.S. Momentum Factor ETF
E. During the year ended November 30, 2020, the fund purchased $73,088,000 of investment securities and sold $61,655,000 of investment securities, other than temporary cash investments. Purchases and sales include $0 and $10,084,000, respectively, in connection with in-kind purchases and redemptions of the fund’s capital shares.
F. Capital shares issued and redeemed were:
| Year Ended November 30, | ||
| 2020 | 2019 | |
| Shares | Shares | |
| (000) | (000) | |
| Issued | 325 | 50 |
| Issued in Lieu of Cash Distributions | — | — |
| Redeemed | (150) | (100) |
| Net Increase (Decrease) in Shares Outstanding | 175 | (50) |
At November 30, 2020, one shareholder was the record or beneficial owner of 50% of the fund’s net assets. If this shareholder were to redeem its investment in the fund, the redemption might result in an increase in the fund’s expense ratio, cause the fund to incur higher transaction costs, or lead to the realization of taxable capital gains.
G. Management has determined that no events or transactions occurred subsequent to November 30, 2020, that would require recognition or disclosure in these financial statements.
60
U.S. Multifactor ETF
Performance Summary
All of the returns in this report represent past performance, which is not a guarantee of future results that may be achieved by the fund. (Current performance may be lower or higher than the performance data cited. For performance data current to the most recent month-end, visit our website at vanguard.com/performance.) Note, too, that both investment returns and principal value can fluctuate widely, so an investor’s shares, when sold, could be worth more or less than their original cost. The returns shown do not reflect taxes that a shareholder would pay on fund distributions or on the sale of fund shares.
Cumulative Performance: February 13, 2018, Through November 30, 2020
Initial Investment of $10,000

| Average Annual Total Returns | ||||
| Periods Ended November 30, 2020 | ||||
| Since | Final Value | |||
| One | Inception | of a $10,000 | ||
| Year | (2/13/2018) | Investment | ||
|
U.S. Multifactor ETF Net Asset Value | 2.35% | 3.86% | $11,117 |
| U.S. Multifactor ETF Market Price | 2.42 | 3.91 | 11,130 | |
|
Russell 3000 Index | 19.02 | 14.05 | 14,440 |
"Since Inception" performance is calculated from the ETF Shares’ inception date for both the fund and its comparative standard(s).
Cumulative Returns of ETF Shares: February 13, 2018, Through November 30, 2020
| Since | ||
| One | Inception | |
| Year | (2/13/2018) | |
| U.S. Multifactor ETF Market Price | 2.42% | 11.30% |
| U.S. Multifactor ETF Net Asset Value | 2.35 | 11.17 |
| Russell 3000 Index | 19.02 | 44.40 |
"Since Inception" performance is calculated from the ETF Shares’ inception date for both the fund and its comparative standard(s).
The market price is determined by the midpoint of the bid-offer spread as of the closing time of the New York Stock Exchange (generally 4 p.m., Eastern time). The net asset value is also determined as of the NYSE closing time. For more information about how the ETF Shares' market prices have compared with their net asset value, visit vanguard.com, select your ETF, and then select the Price and Performance tab. The ETF premium/discount analysis there shows the percentages of days on which the ETF Shares' market price was above or below the NAV.
See Financial Highlights for dividend and capital gains information.
61
U.S. Multifactor ETF
Fund Allocation
As of November 30, 2020
| Basic Materials | 5.1% |
| Consumer Discretionary | 25.5 |
| Consumer Staples | 6.2 |
| Energy | 1.6 |
| Financials | 14.6 |
| Health Care | 10.4 |
| Industrials | 19.1 |
| Real Estate | 0.1 |
| Technology | 15.6 |
| Telecommunications | 1.8 |
| Utilities | 0.0 |
The table reflects the fund’s investments, except for short-term investments and derivatives. Sector categories are based on the Industry Classification Benchmark ("ICB"), except for the "Other" category (if applicable), which includes secur-ities that have not been provided an ICB classification as of the effective reporting period.
The Industry Classification Benchmark ("ICB") is owned by FTSE. FTSE does not accept any liability to any person for any loss or damage arising out of any error or omission in the ICB.
62
U.S. Multifactor ETF
Financial Statements
Schedule of Investments
As of November 30, 2020
The fund files its complete schedule of portfolio holdings with the Securities and Exchange Commission (SEC) for the first and third quarters of each fiscal year as an exhibit to its reports on Form N-PORT. The fund’s Form N-PORT reports are available on the SEC’s website at www.sec.gov.
| Market | ||||
| Value• | ||||
| Shares | ($000) | |||
| Common Stocks (99.5%) | ||||
| Basic Materials (5.1%) | ||||
| Newmont Corp. | 6,086 | 358 | ||
| Reliance Steel & Aluminum Co. | 2,539 | 299 | ||
| Southern Copper Corp. | 4,520 | 268 | ||
| UFP Industries Inc. | 3,960 | 213 | ||
| Boise Cascade Co. | 4,554 | 197 | ||
| Celanese Corp. Class A | 1,344 | 174 | ||
| Linde plc | 631 | 162 | ||
| Dow Inc. | 2,687 | 142 | ||
| Timken Co. | 1,902 | 140 | ||
| Freeport-McMoRan Inc. | 5,786 | 135 | ||
| FMC Corp. | 1,108 | 129 | ||
| Schweitzer-Mauduit International Inc. | 2,517 | 88 | ||
| Rexnord Corp. | 2,221 | 83 | ||
| Scotts Miracle-Gro Co. | 444 | 78 | ||
| Stepan Co. | 652 | 76 | ||
| Fastenal Co. | 1,487 | 74 | ||
| LyondellBasell Industries NV Class A | 666 | 57 | ||
| Materion Corp. | 948 | 55 | ||
| Gold Resource Corp. | 17,422 | 52 | ||
| Steel Dynamics Inc. | 1,394 | 51 | ||
| Commercial Metals Co. | 2,525 | 50 | ||
| Glatfelter Corp. | 2,774 | 45 | ||
| Cabot Corp. | 939 | 39 | ||
| International Paper Co. | 776 | 38 | ||
| Domtar Corp. | 1,040 | 31 | ||
| Worthington Industries Inc. | 569 | 29 | ||
| Valvoline Inc. 1,088 25 Compass Minerals International Inc. | 356 | 22 | ||
| * | GCP Applied Technologies Inc. | 603 | 14 | |
| Innospec Inc. | 151 | 12 | ||
| 3,136 | ||||
| Consumer Discretionary (25.3%) | ||||
| Target Corp. | 3,781 | 679 | ||
| eBay Inc. | 10,720 | 541 | ||
| Walmart Inc. | 3,396 | 519 | ||
| Lowe’s Cos. Inc. | 2,686 | 419 | ||
| * | Lululemon Athletica Inc. | 946 | 350 | |
| * | Etsy Inc. | 1,884 | 303 | |
| * | Electronic Arts Inc. | 2,369 | 303 | |
| Activision Blizzard Inc. | 3,570 | 284 | ||
| Home Depot Inc. | 1,000 | 277 | ||
| Lennar Corp. Class A | 3,545 | 269 | ||
| Dollar General Corp. | 1,122 | 245 | ||
| * | Amazon.com Inc. | 77 | 244 | |
| Williams-Sonoma Inc. | 2,047 | 224 | ||
| Whirlpool Corp. | 1,143 | 222 | ||
| Costco Wholesale Corp. | 566 | 222 | ||
| * | Hibbett Sports Inc. | 4,692 | 193 | |
| Rent-A-Center Inc. | 5,571 | 188 | ||
| Fortune Brands Home & Security Inc. | 2,234 | 187 | ||
| Lithia Motors Inc. Class A | 621 | 180 | ||
| Hanesbrands Inc. | 12,500 | 178 | ||
| General Motors Co. | 4,046 | 177 | ||
| Aaron’s Holdings Co. Inc. | 2,642 | 166 | ||
| Gentex Corp. | 5,014 | 163 | ||
| Lear Corp. | 1,118 | 160 | ||
| International Game Technology plc | 12,232 | 154 | ||
| * | Stamps.com Inc. | 797 | 149 | |
| Big Lots Inc. | 2,877 | 149 | ||
| * | Purple Innovation Inc. Class A | 4,920 | 147 | |
| L Brands Inc. | 3,729 | 145 | ||
| * | Deckers Outdoor Corp. | 554 | 141 | |
| * | Sleep Number Corp. | 1,967 | 137 | |
| Thor Industries Inc. | 1,404 | 136 | ||
| PulteGroup Inc. | 3,074 | 134 | ||
| * | RH | 294 | 133 | |
| Best Buy Co. Inc. | 1,186 | 129 | ||
| * | MarineMax Inc. | 3,924 | 129 | |
| * | Lakeland Industries Inc. | 6,449 | 128 | |
| * | Century Communities Inc. | 2,819 | 125 | |
63
| U.S. Multifactor ETF | ||||
| Market | ||||
| Value• | ||||
| Shares | ($000) | |||
| KB Home | 3,559 | 125 | ||
| Cooper Tire & Rubber Co. | 3,144 | 125 | ||
| Group 1 Automotive Inc. | 1,045 | 124 | ||
| Sonic Automotive Inc. Class A | 3,070 | 124 | ||
| * | Take-Two Interactive Software Inc. | 686 | 124 | |
| * | BJ’s Wholesale Club Holdings Inc. | 3,016 | 124 | |
| Qurate Retail Group Inc. QVC Group Class A | 11,742 | 123 | ||
| * | Peloton Interactive Inc. Class A | 1,048 | 122 | |
| * | AutoNation Inc. | 1,950 | 120 | |
| Garmin Ltd. | 1,018 | 119 | ||
| * | Sportsman’s Warehouse Holdings Inc. | 8,415 | 117 | |
| Buckle Inc. | 4,294 | 115 | ||
| * | Meritage Homes Corp. | 1,255 | 113 | |
| Citi Trends Inc. | 3,318 | 112 | ||
| Toll Brothers Inc. | 2,372 | 112 | ||
| Dick’s Sporting Goods Inc. | 1,961 | 111 | ||
| Murphy USA Inc. | 842 | 108 | ||
| La-Z-Boy Inc. | 2,871 | 106 | ||
| * | Malibu Boats Inc. Class A | 1,862 | 106 | |
| * | Turtle Beach Corp. | 5,641 | 105 | |
| * | CarParts.com Inc. | 6,912 | 104 | |
| * | NVR Inc. | 26 | 104 | |
| * | American Public Education Inc. | 3,221 | 100 | |
| * | Zumiez Inc. | 2,670 | 99 | |
| Johnson Outdoors Inc. Class A | 1,177 | 98 | ||
| * | Central Garden & Pet Co. Class A | 2,603 | 96 | |
| * | Gentherm Inc. | 1,676 | 95 | |
| Wyndham Destinations Inc. | 2,221 | 93 | ||
| ODP Corp. | 3,243 | 93 | ||
| Tractor Supply Co. | 652 | 92 | ||
| * | Ollie’s Bargain Outlet Holdings Inc. | 1,037 | 91 | |
| * | MasterCraft Boat Holdings Inc. | 4,112 | 89 | |
| * | TRI Pointe Group Inc. | 5,007 | 88 | |
| * | 1-800-Flowers.com Inc. Class A | 3,696 | 87 | |
| Dana Inc. | 4,914 | 83 | ||
| Polaris Inc. | 842 | 81 | ||
| Newell Brands Inc. | 3,802 | 81 | ||
| Foot Locker Inc. | 2,146 | 80 | ||
| * | Cavco Industries Inc. | 439 | 79 | |
| * | Universal Electronics Inc. | 1,495 | 79 | |
| Rollins Inc. | 1,335 | 76 | ||
| Haverty Furniture Cos. Inc. | 2,797 | 76 | ||
| NIKE Inc. Class B | 563 | 76 | ||
| Autoliv Inc. | 850 | 76 | ||
| Rush Enterprises Inc. Class A | 1,958 | 75 | ||
| * | Perdoceo Education Corp. | 6,594 | 75 | |
| Shoe Carnival Inc. | 1,979 | 72 | ||
| Acushnet Holdings Corp. | 1,916 | 72 | ||
| * | Crocs Inc. | 1,220 | 72 | |
| * | Clean Energy Fuels Corp. | 15,790 | 72 | |
| Standard Motor Products Inc. | 1,522 | 70 | ||
| Collectors Universe Inc. | 913 | 70 | ||
| * | GoPro Inc. Class A | 9,972 | 70 | |
| * | Discovery Inc. Class A | 2,566 | 69 | |
| * | Asbury Automotive Group Inc. | 598 | 67 | |
| Kontoor Brands Inc. | 1,612 | 67 | ||
| * | Vera Bradley Inc. | 7,630 | 65 | |
| New York Times Co. Class A | 1,506 | 65 | ||
| * | Beazer Homes USA Inc. | 4,243 | 63 | |
| * | Duluth Holdings Inc. | 4,274 | 63 | |
| Penske Automotive Group Inc. | 1,086 | 60 | ||
| * | Taylor Morrison Home Corp. Class A | 2,341 | 59 | |
| * | O’Reilly Automotive Inc. | 133 | 59 | |
| * | LKQ Corp. | 1,657 | 58 | |
| * | LGI Homes Inc. | 535 | 58 | |
| * | Green Brick Partners Inc. | 2,640 | 57 | |
| * | American Axle & Manufacturing Holdings Inc. | 6,976 | 56 | |
| Papa John’s International Inc. | 683 | 55 | ||
| * | K12 Inc. | 2,294 | 54 | |
| Advance Auto Parts Inc. | 354 | 52 | ||
| * | Mohawk Industries Inc. | 412 | 52 | |
| * | YETI Holdings Inc. | 810 | 51 | |
| PriceSmart Inc. | 629 | 51 | ||
| * | XPEL Inc. | 1,348 | 51 | |
| * | Copart Inc. | 434 | 50 | |
| Callaway Golf Co. | 2,328 | 49 | ||
| Ethan Allen Interiors Inc. | 2,657 | 49 | ||
| Steven Madden Ltd. | 1,482 | 47 | ||
| HNI Corp. | 1,256 | 46 | ||
| * | iRobot Corp. | 581 | 46 | |
| Strategic Education Inc. | 462 | 43 | ||
| * | Del Taco Restaurants Inc. | 4,739 | 42 | |
| BorgWarner Inc. | 996 | 39 | ||
| * | Dorman Products Inc. | 418 | 39 | |
| Abercrombie & Fitch Co. | 1,694 | 35 | ||
| MDC Holdings Inc. | 721 | 35 | ||
64
| U.S. Multifactor ETF | ||||
| Market | ||||
| Value• | ||||
| Shares | ($000) | |||
| News Corp. Class A | 1,889 | 33 | ||
| Movado Group Inc. | 1,936 | 33 | ||
| Pool Corp. | 78 | 27 | ||
| DR Horton Inc. | 314 | 23 | ||
| * | Skyline Champion Corp. | 726 | 22 | |
| * | Everi Holdings Inc. | 1,860 | 20 | |
| * | Laureate Education Inc. Class A | 1,154 | 16 | |
| * | Glu Mobile Inc. | 1,342 | 14 | |
| Gap Inc. | 642 | 13 | ||
| * | MSG Networks Inc. | 1,057 | 13 | |
| Carter’s Inc. | 138 | 12 | ||
| 15,706 | ||||
| Consumer Staples (6.2%) | ||||
| General Mills Inc. | 5,684 | 346 | ||
| Kraft Heinz Co. | 8,455 | 279 | ||
| * | Monster Beverage Corp. | 2,123 | 180 | |
| Procter & Gamble Co. | 1,240 | 172 | ||
| McKesson Corp. | 888 | 160 | ||
| Kellogg Co. | 2,343 | 150 | ||
| Clorox Co. | 693 | 141 | ||
| * | Helen of Troy Ltd. | 677 | 137 | |
| * | Boston Beer Co. Inc. Class A | 138 | 128 | |
| Campbell Soup Co. | 2,492 | 125 | ||
| AmerisourceBergen Corp. Class A | 1,154 | 119 | ||
| Lancaster Colony Corp. | 664 | 112 | ||
| Kroger Co. | 3,375 | 111 | ||
| * | National Beverage Corp. | 1,123 | 110 | |
| CVS Health Corp. | 1,575 | 107 | ||
| * | Darling Ingredients Inc. | 2,169 | 105 | |
| Weis Markets Inc. | 2,096 | 100 | ||
| * | Herbalife Nutrition Ltd. | 2,023 | 97 | |
| Philip Morris International Inc. | 1,272 | 96 | ||
| Flowers Foods Inc. | 4,238 | 94 | ||
| Ingredion Inc. | 1,168 | 90 | ||
| B&G Foods Inc. | 3,175 | 88 | ||
| * | Hain Celestial Group Inc. | 2,183 | 84 | |
| ACCO Brands Corp. | 9,678 | 74 | ||
| J M Smucker Co. | 600 | 70 | ||
| Vector Group Ltd. | 6,216 | 70 | ||
| Casey’s General Stores Inc. | 372 | 68 | ||
| Coca-Cola European Partners plc | 1,386 | 62 | ||
| * | Edgewell Personal Care Co. | 1,745 | 61 | |
| PetMed Express Inc. | 1,559 | 48 | ||
| Colgate-Palmolive Co. | 519 | 44 | ||
| Hormel Foods Corp. | 856 | 40 | ||
| Ingles Markets Inc. Class A | 1,062 | 40 | ||
| * | Sprouts Farmers Market Inc. | 1,361 | 29 | |
| SpartanNash Co. | 1,237 | 23 | ||
| Core-Mark Holding Co. Inc. | 732 | 23 | ||
| Corteva Inc. | 419 | 16 | ||
| Medifast Inc. | 71 | 14 | ||
| 3,813 | ||||
| Energy (1.6%) | ||||
| * | Renewable Energy Group Inc. | 2,553 | 148 | |
| * | SolarEdge Technologies Inc. | 525 | 146 | |
| * | First Solar Inc. | 1,173 | 110 | |
| * | Bonanza Creek Energy Inc. | 4,051 | 89 | |
| Range Resources Corp. | 11,309 | 82 | ||
| Antero Midstream Corp. | 12,152 | 82 | ||
| Arcosa Inc. | 1,542 | 80 | ||
| Cabot Oil & Gas Corp. | 3,769 | 66 | ||
| Warrior Met Coal Inc. | 3,043 | 53 | ||
| * | Green Plains Inc. | 2,447 | 36 | |
| EQT Corp. | 2,339 | 35 | ||
| * | CNX Resources Corp. | 2,228 | 21 | |
| SunCoke Energy Inc. | 2,822 | 13 | ||
| World Fuel Services Corp. | 413 | 12 | ||
| 973 | ||||
| Financials (14.5%) | ||||
| T. Rowe Price Group Inc. | 3,791 | 544 | ||
| S&P Global Inc. | 1,425 | 501 | ||
| Moody’s Corp. | 1,503 | 424 | ||
| JPMorgan Chase & Co. | 3,387 | 399 | ||
| BlackRock Inc. | 457 | 319 | ||
| Ameriprise Financial Inc. | 1,658 | 307 | ||
| Bank of New York Mellon Corp. | 6,887 | 269 | ||
| Allstate Corp. | 2,371 | 243 | ||
| Flagstar Bancorp Inc. | 5,997 | 210 | ||
| First Citizens BancShares Inc. Class A | 344 | 182 | ||
| Stifel Financial Corp. | 2,464 | 171 | ||
| Aon plc Class A | 808 | 166 | ||
| Primerica Inc. | 1,147 | 149 | ||
| HCI Group Inc. | 2,625 | 137 | ||
| Nelnet Inc. Class A | 2,015 | 137 | ||
| M&T Bank Corp. | 1,121 | 131 | ||
| CNO Financial Group Inc. | 5,999 | 128 | ||
| Cathay General Bancorp | 4,369 | 123 | ||
| * | StoneX Group Inc. | 1,925 | 119 | |
| First Hawaiian Inc. | 5,379 | 118 | ||
| Trustmark Corp. | 4,552 | 113 | ||
| First Bancorp | 3,567 | 112 | ||
| Bank of Hawaii Corp. | 1,467 | 110 | ||
| Western Alliance Bancorp | 2,120 | 109 | ||
| * | Triumph Bancorp Inc. | 2,371 | 108 | |
65
| U.S. Multifactor ETF | ||||
| Market | ||||
| Value• | ||||
| Shares | ($000) | |||
| Waddell & Reed Financial Inc. Class A | 6,072 | 100 | ||
| BankUnited Inc. | 3,457 | 99 | ||
| HomeStreet Inc. | 3,035 | 98 | ||
| Home BancShares Inc. | 5,278 | 98 | ||
| KeyCorp | 6,315 | 98 | ||
| Investors Bancorp Inc. | 9,936 | 96 | ||
| Northern Trust Corp. | 1,019 | 95 | ||
| Cohen & Steers Inc. | 1,314 | 93 | ||
| Federated Hermes Inc. Class B | 3,302 | 89 | ||
| Park National Corp. | 837 | 85 | ||
| Renasant Corp. | 2,715 | 84 | ||
| Hope Bancorp Inc. | 8,748 | 83 | ||
| Old National Bancorp | 5,211 | 82 | ||
| Univest Financial Corp. | 4,433 | 81 | ||
| Commerce Bancshares Inc. | 1,214 | 80 | ||
| Stewart Information Services Corp. | 1,893 | 79 | ||
| Washington Federal Inc. | 3,378 | 79 | ||
| Central Pacific Financial Corp. | 4,778 | 78 | ||
| TriCo Bancshares | 2,318 | 76 | ||
| First Commonwealth Financial Corp. | 7,606 | 73 | ||
| Jefferies Financial Group Inc. | 3,207 | 73 | ||
| Zions Bancorp NA | 1,864 | 72 | ||
| Globe Life Inc. | 752 | 70 | ||
| SLM Corp. | 6,559 | 70 | ||
| Raymond James Financial Inc. | 703 | 64 | ||
| * | SVB Financial Group | 172 | 59 | |
| Diamond Hill Investment Group Inc. | 430 | 59 | ||
| Voya Financial Inc. | 1,018 | 59 | ||
| Affiliated Managers Group Inc. | 670 | 58 | ||
| Citizens Financial Group Inc. | 1,681 | 55 | ||
| Popular Inc. | 1,120 | 54 | ||
| Meridian Bancorp Inc. | 3,970 | 54 | ||
| ServisFirst Bancshares Inc. | 1,432 | 54 | ||
| International Bancshares Corp. | 1,666 | 54 | ||
| Universal Insurance Holdings Inc. | 3,648 | 51 | ||
| Bryn Mawr Bank Corp. | 1,627 | 48 | ||
| Virtu Financial Inc. Class A | 2,078 | 47 | ||
| Atlantic Union Bankshares Corp. | 1,516 | 45 | ||
| BancFirst Corp. | 799 | 43 | ||
| State Street Corp. | 613 | 43 | ||
| FBL Financial Group Inc. Class A | 817 | 42 | ||
| Comerica Inc. | 858 | 42 | ||
| Federal Agricultural Mortgage Corp. Class C | 615 | 42 | ||
| Franklin Resources Inc. | 1,883 | 41 | ||
| Artisan Partners Asset Management Inc. Class A | 911 | 41 | ||
| City Holding Co. | 611 | 40 | ||
| AMERISAFE Inc. | 695 | 38 | ||
| Fulton Financial Corp. | 3,051 | 38 | ||
| Allegiance Bancshares Inc. | 1,124 | 36 | ||
| SEI Investments Co. | 674 | 36 | ||
| First Busey Corp. | 1,763 | 35 | ||
| TrustCo Bank Corp. NY | 5,384 | 33 | ||
| * | EZCORP Inc. Class A | 6,347 | 32 | |
| Hanover Insurance Group Inc. | 255 | 29 | ||
| FirstCash Inc. | 437 | 28 | ||
| * | Credit Acceptance Corp. | 91 | 27 | |
| Boston Private Financial Holdings Inc. | 3,415 | 24 | ||
| Equitable Holdings Inc. | 774 | 20 | ||
| Employers Holdings Inc. | 637 | 19 | ||
| Morningstar Inc. | 96 | 19 | ||
| Hilltop Holdings Inc. | 787 | 19 | ||
| Assurant Inc. | 146 | 19 | ||
| Radian Group Inc. | 973 | 18 | ||
| Eagle Bancorp Inc. | 410 | 15 | ||
| Erie Indemnity Co. Class A | 65 | 15 | ||
| Assured Guaranty Ltd. | 461 | 14 | ||
| Walker & Dunlop Inc. | 157 | 13 | ||
| US Bancorp | 284 | 12 | ||
| 8,994 | ||||
| Health Care (10.3%) | ||||
| Humana Inc. | 1,120 | 449 | ||
| * | Biogen Inc. | 1,540 | 370 | |
| Anthem Inc. | 1,179 | 367 | ||
| UnitedHealth Group Inc. | 1,069 | 359 | ||
| HCA Healthcare Inc. | 2,372 | 356 | ||
| Johnson & Johnson | 2,320 | 336 | ||
| * | Regeneron Pharmaceuticals Inc. | 554 | 286 | |
| * | United Therapeutics Corp. | 1,175 | 156 | |
| * | Medpace Holdings Inc. | 1,196 | 153 | |
| * | Vertex Pharmaceuticals Inc. | 642 | 146 | |
| * | Corcept Therapeutics Inc. | 6,391 | 145 | |
| AbbVie Inc. | 1,364 | 143 | ||
| * | Quidel Corp. | 692 | 135 | |
| * | Masimo Corp. | 495 | 126 | |
| * | Centene Corp. | 2,033 | 125 | |
| * | Emergent BioSolutions Inc. | 1,426 | 117 | |
66
| U.S. Multifactor ETF | ||||
| Market | ||||
| Value• | ||||
| Shares | ($000) | |||
| * | DaVita Inc. | 1,057 | 116 | |
| Eli Lilly and Co. | 772 | 112 | ||
| * | Molina Healthcare Inc. | 546 | 111 | |
| Cardinal Health Inc. | 1,879 | 103 | ||
| Cigna Corp. | 481 | 101 | ||
| * | Amedisys Inc. | 403 | 99 | |
| West Pharmaceutical Services Inc. | 351 | 97 | ||
| * | Jazz Pharmaceuticals plc | 675 | 95 | |
| Patterson Cos. Inc. | 3,367 | 93 | ||
| * | Providence Service Corp. | 685 | 93 | |
| Abbott Laboratories | 856 | 93 | ||
| Amgen Inc. | 408 | 91 | ||
| * | Henry Schein Inc. | 1,389 | 89 | |
| * | LHC Group Inc. | 427 | 84 | |
| Cerner Corp. | 1,116 | 83 | ||
| * | Amneal Pharmaceuticals Inc. | 19,915 | 79 | |
| * | Meridian Bioscience Inc. | 4,012 | 76 | |
| * | Retractable Technologies Inc. | 6,522 | 75 | |
| * | Exelixis Inc. | 3,896 | 75 | |
| Chemed Corp. | 150 | 72 | ||
| * | ABIOMED Inc. | 247 | 68 | |
| * | Catalyst Pharmaceuticals Inc. | 16,856 | 62 | |
| * | OPKO Health Inc. | 12,950 | 60 | |
| * | Align Technology Inc. | 111 | 53 | |
| * | Alexion Pharmaceuticals Inc. | 424 | 52 | |
| * | Triple-S Management Corp. Class B | 2,283 | 51 | |
| * | Bio-Rad Laboratories Inc. Class A | 92 | 49 | |
| * | AdaptHealth Corp. Class A | 1,406 | 42 | |
| * | Supernus Pharmaceuticals Inc. | 1,969 | 42 | |
| Quest Diagnostics Inc. | 322 | 40 | ||
| * | Addus HomeCare Corp. | 396 | 39 | |
| ResMed Inc. | 163 | 34 | ||
| * | XBiotech Inc. | 1,716 | 33 | |
| Luminex Corp. | 1,118 | 26 | ||
| * | OraSure Technologies Inc. | 1,913 | 23 | |
| Healthcare Services Group Inc. | 911 | 22 | ||
| * | Innoviva Inc. | 1,937 | 20 | |
| Premier Inc. Class A | 472 | 17 | ||
| Ensign Group Inc. | 192 | 14 | ||
| * | Merit Medical Systems Inc. | 246 | 13 | |
| Thermo Fisher Scientific Inc. | 29 | 13 | ||
| Merck & Co. Inc. | 152 | 12 | ||
| * | Viatris Inc. | 41 | 1 | |
| 6,392 | ||||
| Industrials (19.0%) | ||||
| FedEx Corp. | 1,503 | 431 | ||
| Eaton Corp. plc | 2,689 | 326 | ||
| United Parcel Service Inc. Class B | 1,532 | 262 | ||
| Simpson Manufacturing Co. Inc. | 2,529 | 232 | ||
| Accenture plc Class A | 810 | 202 | ||
| * | TopBuild Corp. | 1,147 | 200 | |
| Old Dominion Freight Line Inc. | 978 | 199 | ||
| * | Crown Holdings Inc. | 2,043 | 193 | |
| Cummins Inc. | 813 | 188 | ||
| * | Zebra Technologies Corp. | 465 | 176 | |
| Werner Enterprises Inc. | 4,330 | 173 | ||
| Emerson Electric Co. | 2,182 | 168 | ||
| AGCO Corp. | 1,793 | 166 | ||
| Illinois Tool Works Inc. | 754 | 159 | ||
| Caterpillar Inc. | 913 | 158 | ||
| Graphic Packaging Holding Co. | 10,228 | 157 | ||
| Kforce Inc. | 3,747 | 154 | ||
| Snap-on Inc. | 858 | 151 | ||
| Brunswick Corp. | 1,977 | 148 | ||
| * | Saia Inc. | 842 | 147 | |
| Regal Beloit Corp. | 1,181 | 141 | ||
| CSW Industrials Inc. | 1,298 | 139 | ||
| * | United Rentals Inc. | 608 | 138 | |
| PACCAR Inc. | 1,553 | 135 | ||
| Hubbell Inc. Class B | 834 | 135 | ||
| Dover Corp. | 1,101 | 134 | ||
| ManpowerGroup Inc. | 1,537 | 133 | ||
| * | Trex Co. Inc. | 1,769 | 132 | |
| ITT Inc. | 1,696 | 123 | ||
| * | Great Lakes Dredge & Dock Corp. | 10,874 | 123 | |
| * | Generac Holdings Inc. | 561 | 121 | |
| Schneider National Inc. Class B | 5,705 | 119 | ||
| * | TriNet Group Inc. | 1,588 | 119 | |
| * | Gibraltar Industries Inc. | 1,799 | 118 | |
| * | Echo Global Logistics Inc. | 4,146 | 118 | |
| Quanex Building Products Corp. | 5,662 | 117 | ||
| Sherwin-Williams Co. | 155 | 116 | ||
| Marten Transport Ltd. | 6,223 | 110 | ||
| Owens Corning | 1,450 | 106 | ||
| * | Keysight Technologies Inc. | 872 | 105 | |
| * | SPX Corp. | 1,990 | 102 | |
| Astec Industries Inc. | 1,705 | 99 | ||
| * | Hub Group Inc. Class A | 1,792 | 98 | |
| Watts Water Technologies Inc. Class A | 816 | 96 | ||
| Myers Industries Inc. | 5,510 | 94 | ||
67
| U.S. Multifactor ETF | ||||
| Market | ||||
| Value• | ||||
| Shares | ($000) | |||
| * | Textainer Group Holdings Ltd. | 5,072 | 93 | |
| * | Covenant Transportation Group Inc. Class A | 4,978 | 92 | |
| Columbus McKinnon Corp. | 2,409 | 91 | ||
| * | Modine Manufacturing Co. | 8,164 | 89 | |
| Franklin Electric Co. Inc. | 1,304 | 88 | ||
| Acuity Brands Inc. | 737 | 87 | ||
| Landstar System Inc. | 655 | 86 | ||
| * | FTI Consulting Inc. | 798 | 84 | |
| WW Grainger Inc. | 197 | 82 | ||
| Oshkosh Corp. | 1,018 | 82 | ||
| Encore Wire Corp. | 1,579 | 82 | ||
| *,1 | API Group Corp. | 5,245 | 81 | |
| CAI International Inc. | 2,563 | 81 | ||
| Kronos Worldwide Inc. | 5,846 | 80 | ||
| Knight-Swift Transportation Holdings Inc. | 1,942 | 80 | ||
| Quanta Services Inc. | 1,153 | 79 | ||
| * | Berry Global Group Inc. | 1,481 | 78 | |
| * | Construction Partners Inc. Class A | 2,981 | 78 | |
| JB Hunt Transport Services Inc. | 571 | 77 | ||
| Masco Corp. | 1,424 | 76 | ||
| CoreLogic Inc. | 972 | 75 | ||
| Nordic American Tankers Ltd. | 23,285 | 74 | ||
| Triton International Ltd. | 1,640 | 74 | ||
| * | Sykes Enterprises Inc. | 1,964 | 74 | |
| DHT Holdings Inc. | 14,343 | 73 | ||
| Watsco Inc. | 322 | 73 | ||
| AAON Inc. | 1,113 | 72 | ||
| * | FARO Technologies Inc. | 1,088 | 72 | |
| Argan Inc. | 1,559 | 72 | ||
| Resources Connection Inc. | 5,842 | 71 | ||
| * | MYR Group Inc. | 1,334 | 68 | |
| Rockwell Automation Inc. | 260 | 66 | ||
| MKS Instruments Inc. | 475 | 66 | ||
| Ennis Inc. | 3,996 | 65 | ||
| Shyft Group Inc. | 2,509 | 65 | ||
| Federal Signal Corp. | 2,069 | 64 | ||
| MSA Safety Inc. | 429 | 64 | ||
| * | Masonite International Corp. | 637 | 64 | |
| Badger Meter Inc. | 771 | 64 | ||
| * | XPO Logistics Inc. | 579 | 62 | |
| EVERTEC Inc. | 1,658 | 62 | ||
| UniFirst Corp. | 329 | 61 | ||
| Robert Half International Inc. | 940 | 60 | ||
| MSC Industrial Direct Co. Inc. Class A | 724 | 60 | ||
| ArcBest Corp. | 1,352 | 57 | ||
| Kadant Inc. | 435 | 56 | ||
| Northrop Grumman Corp. | 180 | 54 | ||
| Johnson Controls International plc | 1,181 | 54 | ||
| * | TrueBlue Inc. | 2,653 | 51 | |
| Primoris Services Corp. | 2,072 | 50 | ||
| Costamare Inc. | 6,904 | 50 | ||
| * | Sterling Construction Co. Inc. | 3,046 | 49 | |
| Kelly Services Inc. Class A | 2,332 | 48 | ||
| Powell Industries Inc. | 1,846 | 48 | ||
| Kansas City Southern | 255 | 47 | ||
| Patrick Industries Inc. | 732 | 46 | ||
| * | Vivint Smart Home Inc. | 2,070 | 46 | |
| McGrath RentCorp | 715 | 46 | ||
| * | Vectrus Inc. | 950 | 45 | |
| * | Proto Labs Inc. | 316 | 44 | |
| Kennametal Inc. | 1,152 | 40 | ||
| * | Installed Building Products Inc. | 405 | 40 | |
| Greenbrier Cos. Inc. | 1,185 | 40 | ||
| * | Ducommun Inc. | 794 | 39 | |
| ManTech International Corp. Class A | 486 | 37 | ||
| Standex International Corp. | 477 | 36 | ||
| * | MasTec Inc. | 626 | 35 | |
| Silgan Holdings Inc. | 879 | 30 | ||
| Packaging Corp. of America | 221 | 29 | ||
| Apogee Enterprises Inc. | 1,065 | 28 | ||
| Exponent Inc. | 325 | 27 | ||
| * | WESCO International Inc. | 404 | 26 | |
| ADT Inc. | 3,366 | 26 | ||
| ABM Industries Inc. | 676 | 26 | ||
| * | Atkore International Group Inc. | 578 | 23 | |
| Ryder System Inc. | 370 | 22 | ||
| MAXIMUS Inc. | 301 | 22 | ||
| Allison Transmission Holdings Inc. | 492 | 20 | ||
| Comfort Systems USA Inc. | 400 | 20 | ||
| Westrock Co. | 477 | 20 | ||
| * | Vicor Corp. | 235 | 19 | |
| Louisiana-Pacific Corp. | 556 | 19 | ||
| * | SPX FLOW Inc. | 348 | 19 | |
| * | Beacon Roofing Supply Inc. | 506 | 18 | |
| * | Dorian LPG Ltd. | 1,558 | 17 | |
| Deluxe Corp. | 643 | 17 | ||
| Valmont Industries Inc. | 91 | 15 | ||
| Jack Henry & Associates Inc. | 77 | 12 | ||
| * | Aerojet Rocketdyne Holdings Inc. | 321 | 12 | |
| 11,773 | ||||
68
U.S. Multifactor ETF
| Market | ||||
| Value• | ||||
| Shares | ($000) | |||
| Real Estate (0.1%) | ||||
| * | CBRE Group Inc. Class A | 706 | 43 | |
| GEO Group Inc. | 2,751 | 26 | ||
| St. Joe Co. | 566 | 19 | ||
| 88 | ||||
| Technology (15.5%) | ||||
| Apple Inc. | 4,796 | 571 | ||
| * | Facebook Inc. Class A | 1,554 | 430 | |
| Microsoft Corp. | 1,924 | 412 | ||
| * | Micron Technology Inc. | 5,926 | 380 | |
| * | Adobe Inc. | 741 | 355 | |
| * | Advanced Micro Devices Inc. | 3,542 | 328 | |
| Intel Corp. | 6,067 | 293 | ||
| * | Alphabet Inc. Class A | 161 | 282 | |
| Cognizant Technology Solutions Corp. Class A | 3,599 | 281 | ||
| KLA Corp. | 920 | 232 | ||
| * | Diodes Inc. | 3,333 | 227 | |
| Applied Materials Inc. | 2,682 | 221 | ||
| Teradyne Inc. | 1,774 | 196 | ||
| Vishay Intertechnology Inc. | 9,302 | 180 | ||
| Texas Instruments Inc. | 1,064 | 172 | ||
| NVIDIA Corp. | 303 | 162 | ||
| Seagate Technology plc | 2,722 | 160 | ||
| * | Qorvo Inc. | 948 | 149 | |
| * | Yandex NV Class A | 2,045 | 141 | |
| Jabil Inc. | 3,686 | 141 | ||
| NortonLifeLock Inc. | 7,250 | 132 | ||
| Skyworks Solutions Inc. | 897 | 127 | ||
| SYNNEX Corp. | 771 | 124 | ||
| PC Connection Inc. | 2,620 | 120 | ||
| * | Dell Technologies Inc. | 1,719 | 119 | |
| Shutterstock Inc. | 1,700 | 117 | ||
| Lam Research Corp. | 258 | 117 | ||
| TE Connectivity Ltd. | 965 | 110 | ||
| Intuit Inc. | 311 | 109 | ||
| Simulations Plus Inc. | 1,927 | 108 | ||
| * | FormFactor Inc. | 2,626 | 108 | |
| * | Synaptics Inc. | 1,368 | 106 | |
| * | Nuance Communications Inc. | 2,465 | 106 | |
| * | Lattice Semiconductor Corp. | 2,531 | 106 | |
| * | II-VI Inc. | 1,556 | 105 | |
| * | Check Point Software Technologies Ltd. | 866 | 102 | |
| * | Cirrus Logic Inc. | 1,215 | 97 | |
| * | TechTarget Inc. | 1,766 | 93 | |
| Methode Electronics Inc. | 2,638 | 92 | ||
| Monolithic Power Systems Inc. | 280 | 90 | ||
| * | Fortinet Inc. | 721 | 89 | |
| QUALCOMM Inc. | 586 | 86 | ||
| * | Super Micro Computer Inc. | 2,898 | 82 | |
| * | Photronics Inc. | 7,037 | 82 | |
| * | SPS Commerce Inc. | 744 | 77 | |
| * | Mitek Systems Inc. | 6,186 | 73 | |
| * | ePlus Inc. | 859 | 72 | |
| * | Cadence Design Systems Inc. | 600 | 70 | |
| Citrix Systems Inc. | 527 | 65 | ||
| * | NetScout Systems Inc. | 2,659 | 62 | |
| Avnet Inc. | 2,030 | 62 | ||
| * | Sanmina Corp. | 1,865 | 59 | |
| * | IPG Photonics Corp. | 279 | 58 | |
| * | F5 Networks Inc. | 353 | 57 | |
| * | Manhattan Associates Inc. | 547 | 56 | |
| * | Calix Inc. | 2,345 | 56 | |
| * | Qualys Inc. | 558 | 53 | |
| International Business Machines Corp. | 414 | 51 | ||
| Computer Programs and Systems Inc. | 1,767 | 50 | ||
| * | Plexus Corp. | 645 | 48 | |
| * | A10 Networks Inc. | 6,029 | 48 | |
| * | Fabrinet | 695 | 47 | |
| * | TrueCar Inc. | 11,590 | 47 | |
| HP Inc. | 2,115 | 46 | ||
| * | CACI International Inc. Class A | 191 | 45 | |
| * | Match Group Inc. | 323 | 45 | |
| Power Integrations Inc. | 613 | 44 | ||
| * | Rambus Inc. | 2,671 | 42 | |
| * | Paycom Software Inc. | 95 | 40 | |
| Sapiens International Corp. NV | 1,322 | 39 | ||
| * | Axcelis Technologies Inc. | 1,446 | 39 | |
| * | Perficient Inc. | 855 | 39 | |
| * | IAC/InterActiveCorp | 267 | 38 | |
| * | Covetrus Inc. | 1,377 | 37 | |
| * | OneSpan Inc. | 1,824 | 36 | |
| Amdocs Ltd. | 489 | 32 | ||
| * | DSP Group Inc. | 1,467 | 25 | |
| * | CyberOptics Corp. | 897 | 24 | |
| Oracle Corp. | 405 | 23 | ||
| Xerox Holdings Corp. | 930 | 20 | ||
| * | Vertiv Holdings Co. Class A | 1,068 | 20 | |
| CDW Corp. | 134 | 18 | ||
| CMC Materials Inc. | 107 | 17 | ||
| * | Amkor Technology Inc. | 1,041 | 15 | |
| 9,635 | ||||
69
| U.S. Multifactor ETF | ||||
| Market | ||||
| Value• | ||||
| Shares | ($000) | |||
| Telecommunications (1.8%) | ||||
| Verizon Communications Inc. | 4,577 | 277 | ||
| Cisco Systems Inc. | 4,121 | 177 | ||
| AT&T Inc. | 5,547 | 159 | ||
| * | Lumentum Holdings Inc. | 1,433 | 124 | |
| * | Charter Communications Inc. Class A | 173 | 113 | |
| * | NETGEAR Inc. | 3,071 | 98 | |
| * | Ciena Corp. | 1,883 | 84 | |
| CenturyLink Inc. | 5,200 | 54 | ||
| Shenandoah Telecommunications Co. | 349 | 16 | ||
| 1,102 | ||||
| Utilities (0.1%) | ||||
| Hawaiian Electric Industries Inc. | 1,012 | 36 | ||
| Total Common Stocks | ||||
| (Cost $53,012) | 61,648 | |||
| Temporary Cash Investment (0.4%) | ||
| Money Market Fund (0.4%) | ||
| 2 Vanguard Market Liquidity | ||
| Fund, 0.109% | ||
| (Cost $220) | 2,204 | 220 |
| Total Investments (99.9%) | ||
| (Cost $53,232) | 61,868 | |
| Other Asset and Liabilities—Net (0.1%) | 78 | |
| Net Assets (100%) | 61,946 | |
Cost is in $000.
• See Note A in Notes to Financial Statements.
* Non-income-producing security.
1 Security exempt from registration under Rule 144A of the Securities Act of 1933. Such securities may be sold in transactions exempt from registration, normally to qualified institutional buyers. At November 30, 2020, the value of this security represented 0.1% of net assets.
2 Affiliated money market fund available only to Vanguard funds and certain trusts and accounts managed by Vanguard. Rate shown is the 7-day yield.
Derivative Financial Instruments Outstanding as of Period End
Futures Contracts
| ($000 | ) | |||||
| Value and | ||||||
| Number of | Unrealized | |||||
| Long (Short | ) | Notional | Appreciation | |||
| Expiration | Contracts | Amount | (Depreciation | ) | ||
| Long Futures Contracts | ||||||
| Micro E-mini S&P 500 Index | December 2020 | 15 | 272 | 5 |
See accompanying Notes, which are an integral part of the Financial Statements.
70
U.S. Multifactor ETF
Statement of Assets and Liabilities
As of November 30, 2020
| ($000s, except shares and per-share amounts) | Amount | |
| Assets | ||
| Investments in Securities, at Value | ||
| Unaffiliated Issuers (Cost $53,012) | 61,648 | |
| Affiliated Issuers (Cost $220) | 220 | |
| Total Investments in Securities | 61,868 | |
| Investment in Vanguard | 2 | |
| Cash Collateral Pledged—Futures Contracts | 18 | |
| Receivables for Accrued Income | 113 | |
| Total Assets | 62,001 | |
| Liabilities | ||
| Payables for Investment Securities Purchased | 48 | |
| Payables to Vanguard | 6 | |
| Variation Margin Payable—Futures Contracts | 1 | |
| Total Liabilities | 55 | |
| Net Assets | 61,946 | |
| At November 30, 2020, net assets consisted of: | ||
| Paid-in Capital | 71,506 | |
| Total Distributable Earnings (Loss) | (9,560 | ) |
| Net Assets | 61,946 | |
| Net Assets | ||
| Applicable to 775,000 outstanding $.001 par value shares of | ||
| beneficial interest (unlimited authorization) | 61,946 | |
| Net Asset Value Per Share | $79.93 |
See accompanying Notes, which are an integral part of the Financial Statements.
71
U.S. Multifactor ETF
Statement of Operations
| Year Ended | ||
| November 30, 2020 | ||
| ($000 | ) | |
| Investment Income | ||
| Income | ||
| Dividends | 1,252 | |
| Interest1 | 2 | |
| Securities Lending—Net | 3 | |
| Total Income | 1,257 | |
| Expenses | ||
| The Vanguard Group—Note B | ||
| Investment Advisory Services | — | |
| Management and Administrative | 101 | |
| Marketing and Distribution | — | |
| Custodian Fees | 6 | |
| Auditing Fees | 17 | |
| Shareholders’ Reports | 5 | |
| Trustees' Fees and Expenses | — | |
| Total Expenses | 129 | |
| Expenses Paid Indirectly | (6 | ) |
| Net Expenses | 123 | |
| Net Investment Income | 1,134 | |
| Realized Net Gain (Loss) | ||
| Investment Securities Sold1,2 | (10,354 | ) |
| Futures Contracts | (16 | ) |
| Realized Net Gain (Loss) | (10,370 | ) |
| Change in Unrealized Appreciation (Depreciation) | ||
| Investment Securities1 | 1,588 | |
| Futures Contracts | (5 | ) |
| Change in Unrealized Appreciation (Depreciation) | 1,583 | |
| Net Increase (Decrease) in Net Assets Resulting from Operations | (7,653 | ) |
1 Interest income, realized net gain (loss), and change in unrealized appreciation (depreciation) from an affiliated company of the fund were $2,000, $0, and $0, respectively. Purchases and sales are for temporary cash investment purposes.
2 Includes $935,000 of net gain (loss) resulting from in-kind redemptions.
See accompanying Notes, which are an integral part of the Financial Statements.
72
U.S. Multifactor ETF
Statement of Changes in Net Assets
| Year Ended November 30, | ||||
| 2020 | 2019 | |||
| ($000 | ) | ($000 | ) | |
| Increase (Decrease) in Net Assets | ||||
| Operations | ||||
| Net Investment Income | 1,134 | 1,461 | ||
| Realized Net Gain (Loss) | (10,370 | ) | (5,751 | ) |
| Change in Unrealized Appreciation (Depreciation) | 1,583 | 9,364 | ||
| Net Increase (Decrease) in Net Assets Resulting from Operations | (7,653 | ) | 5,074 | |
| Distributions1 | ||||
| Total Distributions | (1,209 | ) | (1,366 | ) |
| Capital Share Transactions | ||||
| Issued | 12,089 | 17,158 | ||
| Issued in Lieu of Cash Distributions | — | — | ||
| Redeemed | (30,826 | ) | (7,392 | ) |
| Net Increase (Decrease) from Capital Share Transactions | (18,737 | ) | 9,766 | |
| Total Increase (Decrease) | (27,599 | ) | 13,474 | |
| Net Assets | ||||
| Beginning of Period | 89,545 | 76,071 | ||
| End of Period | 61,946 | 89,545 | ||
1 Certain prior-period numbers have been reclassified to conform with the current-period presentation.
See accompanying Notes, which are an integral part of the Financial Statements.
73
U.S. Multifactor ETF
Financial Highlights
| Feb. 13, | |||
| Year Ended | 20181 to | ||
| Nov. 30, | Nov. 30, | ||
| For a Share Outstanding Throughout Each Period | 2020 | 2019 | 2018 |
| Net Asset Value, Beginning of Period | $79.60 | $76.07 | $75.00 |
| Investment Operations | |||
| Net Investment Income2 | 1.191 | 1.340 | 1.007 |
| Net Realized and Unrealized Gain (Loss) on Investments | 0.372 | 3.458 | .543 |
| Total from Investment Operations | 1.563 | 4.798 | 1.550 |
| Distributions | |||
| Dividends from Net Investment Income | (1.233) | (1.268) | (.480) |
| Distributions from Realized Capital Gains | — | — | — |
| Total Distributions | (1.233) | (1.268) | (.480) |
| Net Asset Value, End of Period | $79.93 | $79.60 | $76.07 |
| Total Return | 2.35% | 6.46% | 2.03% |
| Ratios/Supplemental Data | |||
| Net Assets, End of Period (Millions) | $62 | $90 | $76 |
| Ratio of Total Expenses to Average Net Assets | 0.19%3 | 0.19%3 | 0.18%4 |
| Ratio of Net Investment Income to Average Net Assets | 1.66% | 1.79% | 1.59%4 |
| Portfolio Turnover Rate | 95%5 | 98% | 64% |
| 1 | Inception. |
| 2 | Calculated based on average shares outstanding. |
| 3 | The ratio of expenses to average net assets for the period net of reduction from custody fee offset arrangements was 0.18%. |
| 4 | Annualized. |
| 5 | Excludes the value of portfolio securities received or delivered as a result of in-kind purchases or redemptions of the fund’s capital shares, including ETF Creation Units. |
See accompanying Notes, which are an integral part of the Financial Statements.
74
U.S. Multifactor ETF
Notes to Financial Statements
Vanguard U.S. Multifactor ETF is registered under the Investment Company Act of 1940 as an open-end investment company, or mutual fund. ETF Shares are listed for trading on Cboe BZX Exchange; they can be purchased and sold through a broker. Market disruptions associated with the COVID-19 pandemic have had a global impact, and uncertainty exists as to the long-term implications. Such disruptions can adversely affect assets of the fund and thus fund performance.
A. The following significant accounting policies conform to generally accepted accounting principles for U.S. investment companies. The fund consistently follows such policies in preparing its financial statements.
1. Security Valuation: Securities are valued as of the close of trading on the New York Stock Exchange (generally 4 p.m., Eastern time) on the valuation date. Equity securities are valued at the latest quoted sales prices or official closing prices taken from the primary market in which each security trades; such securities not traded on the valuation date are valued at the mean of the latest quoted bid and asked prices. Securities for which market quotations are not readily available, or whose values have been materially affected by events occurring before the fund’s pricing time but after the close of the securities’ primary markets, are valued by methods deemed by the board of trustees to represent fair value. Investments in Vanguard Market Liquidity Fund are valued at that fund’s net asset value.
2. Futures Contracts: The fund uses index futures contracts to a limited extent, with the objective of maintaining full exposure to the stock market while maintaining liquidity. The fund may purchase or sell futures contracts to achieve a desired level of investment, whether to accommodate portfolio turnover or cash flows from capital share transactions. The primary risks associated with the use of futures contracts are imperfect correlation between changes in market values of stocks held by the fund and the prices of futures contracts, and the possibility of an illiquid market. Counterparty risk involving futures is mitigated because a regulated clearinghouse is the counterparty instead of the clearing broker. To further mitigate counterparty risk, the fund trades futures contracts on an exchange, monitors the financial strength of its clearing brokers and clearinghouse, and has entered into clearing agreements with its clearing brokers. The clearinghouse imposes initial margin requirements to secure the fund’s performance and requires daily settlement of variation margin representing changes in the market value of each contract. Any securities pledged as initial margin for open contracts are noted in the Schedule of Investments.
Futures contracts are valued at their quoted daily settlement prices. The notional amounts of the contracts are not recorded in the Statement of Assets and Liabilities. Fluctuations in the value of the contracts are recorded in the Statement of Assets and Liabilities as an asset (liability) and in the Statement of Operations as unrealized appreciation (depreciation) until the contracts are closed, when they are recorded as realized gains (losses) on futures contracts.
During the year ended November 30, 2020, the fund’s average investments in long and short futures contracts represented less than 1% and 0% of net assets, respectively, based on the average of the notional amounts at each quarter-end during the period.
3. Federal Income Taxes: The fund intends to continue to qualify as a regulated investment company and distribute all of its taxable income. The fund’s tax returns are open to examination by the relevant tax authorities until expiration of the applicable statute of limitations, which is generally three years after the filing of the tax return. Management has analyzed the fund’s tax positions taken for all open federal and state income tax years, and has concluded that no provision for income tax is required in the fund’s financial statements.
75
U.S. Multifactor ETF
4. Distributions: Distributions to shareholders are recorded on the ex-dividend date. Distributions are determined on a tax basis at the fiscal year-end and may differ from net investment income and realized capital gains for financial reporting purposes.
5. Securities Lending: To earn additional income, the fund lends its securities to qualified institutional borrowers. Security loans are subject to termination by the fund at any time, and are required to be secured at all times by collateral in an amount at least equal to the market value of securities loaned. Daily market fluctuations could cause the value of loaned securities to be more or less than the value of the collateral received. When this occurs, the collateral is adjusted and settled before the opening of the market on the next business day. The fund further mitigates its counterparty risk by entering into securities lending transactions only with a diverse group of prequalified counterparties, monitoring their financial strength, and entering into master securities lending agreements with its counterparties. The master securities lending agreements provide that, in the event of a counterparty’s default (including bankruptcy), the fund may terminate any loans with that borrower, determine the net amount owed, and sell or retain the collateral up to the net amount owed to the fund; however, such actions may be subject to legal proceedings. While collateral mitigates counterparty risk, in the event of a default, the fund may experience delays and costs in recovering the securities loaned. The fund invests cash collateral received in Vanguard Market Liquidity Fund, and records a liability in the Statement of Assets and Liabilities for the return of the collateral, during the period the securities are on loan. Collateral investments in Vanguard Market Liquidity Fund are subject to market appreciation or depreciation. Securities lending income represents fees charged to borrowers plus income earned on invested cash collateral, less expenses associated with the loan. During the term of the loan, the fund is entitled to all distributions made on or in respect of the loaned securities.
6. Credit Facilities and Interfund Lending Program: The fund and certain other funds managed by The Vanguard Group (“Vanguard”) participate in a $4.3 billion committed credit facility provided by a syndicate of lenders pursuant to a credit agreement and an uncommitted credit facility provided by Vanguard. Both facilities may be renewed annually. Each fund is individually liable for its borrowings, if any, under the credit facilities. Borrowings may be utilized for temporary or emergency purposes, subject to the fund’s regulatory and contractual borrowing restrictions. With respect to the committed credit facility, the participating funds are charged administrative fees and an annual commitment fee of 0.10% of the undrawn committed amount of the facility; these fees are allocated to the funds based on a method approved by the fund’s board of trustees and included in Management and Administrative expenses on the fund’s Statement of Operations. Any borrowings under either facility bear interest at a rate based upon the higher of the one-month London Interbank Offered Rate (or an acceptable alternate rate, if necessary), federal funds effective rate, or overnight bank funding rate plus an agreed-upon spread, except that borrowings under the uncommitted credit facility may bear interest based upon an alternative rate agreed to by the fund and Vanguard.
In accordance with an exemptive order (the “Order”) from the SEC, the fund may participate in a joint lending and borrowing program that allows registered open-end Vanguard funds to borrow money from and lend money to each other for temporary or emergency purposes (the “Interfund Lending Program”), subject to compliance with the terms and conditions of the Order, and to the extent permitted by the fund’s investment objective and investment policies. Interfund loans and borrowings normally extend overnight, but can have a maximum duration of seven days. Loans may be called on one business day’s notice. The interest rate to be charged is governed by the conditions of the Order and internal procedures adopted by the board of trustees. The board of trustees is responsible for overseeing the Interfund Lending Program.
76
U.S. Multifactor ETF
For the year ended November 30, 2020, the fund did not utilize the credit facilities or the Interfund Lending Program.
7. Other: Dividend income is recorded on the ex-dividend date. Non-cash dividends included in dividend income, if any, are recorded at the fair value of the securities received. Interest income includes income distributions received from Vanguard Market Liquidity Fund and is accrued daily. Security transactions are accounted for on the date securities are bought or sold. Costs used to determine realized gains (losses) on the sale of investment securities are those of the specific securities sold.
B. In accordance with the terms of a Funds’ Service Agreement (the “FSA”) between Vanguard and the fund, Vanguard furnishes to the fund investment advisory, corporate management, administrative, marketing, and distribution services at Vanguard’s cost of operations (as defined by the FSA). These costs of operations are allocated to the fund based on methods and guidelines approved by the board of trustees and are generally settled twice a month.
Upon the request of Vanguard, the fund may invest up to 0.40% of its net assets as capital in Vanguard. At November 30, 2020, the fund had contributed to Vanguard capital in the amount of $2,000, representing less than 0.01% of the fund’s net assets and less than 0.01% of Vanguard’s capital received pursuant to the FSA. The fund’s trustees and officers are also directors and employees, respectively, of Vanguard.
C. The fund’s custodian bank has agreed to reduce its fees when the fund maintains cash on deposit in the non-interest-bearing custody account. For the year ended November 30, 2020, custodian fee offset arrangements reduced the fund’s expenses by $6,000 (an annual rate of 0.01% of average net assets).
D. Various inputs may be used to determine the value of the fund’s investments and derivatives.
These inputs are summarized in three broad levels for financial statement purposes. The inputs or methodologies used to value securities are not necessarily an indication of the risk associated with investing in those securities.
Level 1—Quoted prices in active markets for identical securities.
Level 2—Other significant observable inputs (including quoted prices for similar securities, interest rates, prepayment speeds, credit risk, etc.).
Level 3—Significant unobservable inputs (including the fund’s own assumptions used to determine the fair value of investments). Any investments and derivatives valued with significant unobservable inputs are noted on the Schedule of Investments.
At November 30, 2020, 100% of the market value of the fund’s investments and derivatives was determined based on Level 1 inputs.
77
U.S. Multifactor ETF
E. Permanent differences between book-basis and tax-basis components of net assets are reclassified among capital accounts in the financial statements to reflect their tax character. These reclassifications have no effect on net assets or net asset value per share. As of period end, permanent differences primarily attributable to the accounting for in-kind redemptions were reclassified between the following accounts:
| Amount | |
| ($000) | |
| Paid-in Capital | 935 |
| Total Distributable Earnings (Loss) | (935) |
Temporary differences between book-basis and tax-basis components of total distributable earnings (loss) arise when certain items of income, gain, or loss are recognized in different periods for financial statement and tax purposes; these differences will reverse at some time in the future. The differences are primarily related to the deferral of losses from wash sales and the recognition of unrealized gains or losses from certain derivative contracts. As of period end, the tax-basis components of total distributable earnings (loss) are detailed in the table as follows:
| Amount | |
| ($000) | |
| Undistributed Ordinary Income | 254 |
| Undistributed Long-Term Gains | — |
| Capital Loss Carryforwards | (18,450) |
| Qualified Late-Year Losses | — |
| Net Unrealized Gains (Losses) | 8,636 |
The tax character of distributions paid was as follows:
| Year Ended November 30, | ||
| 2020 | 2019 | |
| Amount | Amount | |
| ($000) | ($000) | |
| Ordinary Income* | 1,209 | 1,366 |
| Long-Term Capital Gains | — | — |
| Total | 1,209 | 1,366 |
* Includes short-term capital gains, if any.
78
U.S. Multifactor ETF
As of November 30, 2020, gross unrealized appreciation and depreciation for investments and derivatives based on cost for U.S. federal income tax purposes were as follows:
| Amount | |
| ($000) | |
| Tax Cost | 53,232 |
| Gross Unrealized Appreciation | 10,675 |
| Gross Unrealized Depreciation | (2,039) |
| Net Unrealized Appreciation (Depreciation) | 8,636 |
F. During the year ended November 30, 2020, the fund purchased $64,511,000 of investment securities and sold $83,265,000 of investment securities, other than temporary cash investments. Purchases and sales include $0 and $5,814,000, respectively, in connection with in-kind purchases and redemptions of the fund’s capital shares.
G. Capital shares issued and redeemed were:
| Year Ended November 30, | ||
| 2020 | 2019 | |
| Shares | Shares | |
| (000) | (000) | |
| Issued | 150 | 225 |
| Issued in Lieu of Cash Distributions | — | — |
| Redeemed | (500) | (100) |
| Net Increase (Decrease) in Shares Outstanding | (350) | 125 |
H. Management has determined that no events or transactions occurred subsequent to November 30, 2020, that would require recognition or disclosure in these financial statements.
79
U.S. Quality Factor ETF
Performance Summary
All of the returns in this report represent past performance, which is not a guarantee of future results that may be achieved by the fund. (Current performance may be lower or higher than the performance data cited. For performance data current to the most recent month-end, visit our website at vanguard.com/performance.) Note, too, that both investment returns and principal value can fluctuate widely, so an investor’s shares, when sold, could be worth more or less than their original cost. The returns shown do not reflect taxes that a shareholder would pay on fund distributions or on the sale of fund shares.
Cumulative Performance: February 13, 2018, Through November 30, 2020
Initial Investment of $10,000
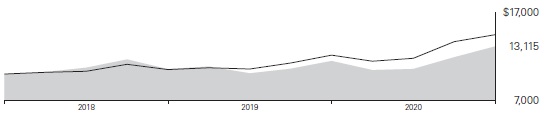
| Average Annual Total Returns | ||||
| Periods Ended November 30, 2020 | ||||
| Since | Final Value | |||
| One | Inception | of a $10,000 | ||
| Year | (2/13/2018) | Investment | ||
 |
U.S. Quality Factor ETF Net Asset Value | 14.29% | 10.19% | $13,115 |
| U.S. Quality Factor ETF Market Price | 14.30 | 10.20 | 13,120 | |
 |
Russell 3000 Index | 19.02 | 14.05 | 14,440 |
"Since Inception" performance is calculated from the ETF Shares’ inception date for both the fund and its comparative standard(s).
Cumulative Returns of ETF Shares: February 13, 2018, Through November 30, 2020
| Since | ||
| One | Inception | |
| Year | (2/13/2018) | |
| U.S. Quality Factor ETF Market Price | 14.30% | 31.20% |
| U.S. Quality Factor ETF Net Asset Value | 14.29 | 31.15 |
| Russell 3000 Index | 19.02 | 44.40 |
"Since Inception" performance is calculated from the ETF Shares’ inception date for both the fund and its comparative standard(s).
The market price is determined by the midpoint of the bid-offer spread as of the closing time of the New York Stock Exchange (generally 4 p.m., Eastern time). The net asset value is also determined as of the NYSE closing time. For more information about how the ETF Shares' market prices have compared with their net asset value, visit vanguard.com, select your ETF, and then select the Price and Performance tab. The ETF premium/discount analysis there shows the percentages of days on which the ETF Shares' market price was above or below the NAV.
See Financial Highlights for dividend and capital gains information.
80
U.S. Quality Factor ETF
Fund Allocation
As of November 30, 2020
| Basic Materials | 2.3% |
| Consumer Discretionary | 21.5 |
| Consumer Staples | 6.2 |
| Energy | 1.3 |
| Financials | 17.4 |
| Health Care | 11.1 |
| Industrials | 19.6 |
| Real Estate | 1.3 |
| Technology | 17.6 |
| Telecommunications | 1.5 |
| Utilities | 0.2 |
The table reflects the fund’s investments, except for short-term investments and derivatives. Sector categories are based on the Industry Classification Benchmark ("ICB"), except for the "Other" category (if applicable), which includes secur-ities that have not been provided an ICB classification as of the effective reporting period.
The Industry Classification Benchmark ("ICB") is owned by FTSE. FTSE does not accept any liability to any person for any loss or damage arising out of any error or omission in the ICB.
81
U.S. Quality Factor ETF
Financial Statements
Schedule of Investments
As of November 30, 2020
The fund files its complete schedule of portfolio holdings with the Securities and Exchange Commission (SEC) for the first and third quarters of each fiscal year as an exhibit to its reports on Form N-PORT. The fund’s Form N-PORT reports are available on the SEC’s website at www.sec.gov.
| Market | |||
| Value• | |||
| Shares | ($000) | ||
| Common Stocks (99.6%) | |||
| Basic Materials (2.3%) | |||
| * | Alcoa Corp. | 5,153 | 103 |
| Fastenal Co. | 1,955 | 97 | |
| Reliance Steel & Aluminum Co. | 689 | 81 | |
| Avery Dennison Corp. | 491 | 73 | |
| FMC Corp. | 629 | 73 | |
| Ecolab Inc. | 308 | 68 | |
| UFP Industries Inc. | 1,192 | 64 | |
| Orion Engineered Carbons SA | 3,841 | 60 | |
| Materion Corp. | 905 | 53 | |
| Innospec Inc. | 603 | 50 | |
| Mueller Industries Inc. | 1,263 | 41 | |
| Boise Cascade Co. | 938 | 41 | |
| * | Univar Solutions Inc. | 2,201 | 39 |
| Neenah Inc. | 797 | 39 | |
| Stepan Co. | 295 | 34 | |
| Sensient Technologies Corp. | 468 | 34 | |
| Worthington Industries Inc. | 643 | 33 | |
| * | GCP Applied Technologies Inc. | 1,364 | 32 |
| CF Industries Holdings Inc. | 854 | 32 | |
| Commercial Metals Co. | 1,560 | 31 | |
| Steel Dynamics Inc. | 803 | 29 | |
| Compass Minerals International Inc. | 448 | 28 | |
| Gold Resource Corp. | 8,477 | 25 | |
| Scotts Miracle-Gro Co. | 128 | 23 | |
| * | RBC Bearings Inc. | 126 | 21 |
| NewMarket Corp. | 55 | 20 | |
| International Paper Co. | 405 | 20 | |
| Verso Corp. | 1,099 | 12 | |
| 1,256 | |||
| Consumer Discretionary (21.4%) | |||
| Target Corp. | 3,525 | 633 | |
| Walmart Inc. | 3,168 | 484 | |
| eBay Inc. | 8,996 | 454 | |
| * | Booking Holdings Inc. | 209 | 424 |
| * | Electronic Arts Inc. | 3,021 | 386 |
| * | Lululemon Athletica Inc. | 1,041 | 385 |
| Lowe’s Cos. Inc. | 2,455 | 383 | |
| * | O’Reilly Automotive Inc. | 670 | 296 |
| Costco Wholesale Corp. | 606 | 237 | |
| NIKE Inc. Class B | 1,579 | 213 | |
| Aaron’s Holdings Co. Inc. | 3,171 | 200 | |
| Estee Lauder Cos. Inc. Class A | 744 | 183 | |
| VF Corp. | 2,002 | 167 | |
| Kontoor Brands Inc. | 3,405 | 142 | |
| * | Deckers Outdoor Corp. | 426 | 108 |
| Gentex Corp. | 3,088 | 101 | |
| Rollins Inc. | 1,654 | 95 | |
| * | Etsy Inc. | 579 | 93 |
| * | MasterCraft Boat Holdings Inc. | 4,262 | 92 |
| * | Tempur Sealy International Inc. | 3,636 | 92 |
| Best Buy Co. Inc. | 838 | 91 | |
| Carter’s Inc. | 1,022 | 91 | |
| Williams-Sonoma Inc. | 824 | 90 | |
| * | iRobot Corp. | 1,123 | 88 |
| * | Spotify Technology SA | 300 | 87 |
| Dolby Laboratories Inc. Class A | 980 | 87 | |
| Tractor Supply Co. | 602 | 85 | |
| BorgWarner Inc. | 2,170 | 84 | |
| Pool Corp. | 241 | 83 | |
| * | Turtle Beach Corp. | 4,417 | 83 |
| * | Discovery Inc. Class A | 3,053 | 82 |
| * | Lakeland Industries Inc. | 4,140 | 82 |
| * | NVR Inc. | 20 | 80 |
| H&R Block Inc. | 4,163 | 78 | |
| Hanesbrands Inc. | 5,498 | 78 | |
| * | Purple Innovation Inc. Class A | 2,557 | 76 |
| Children’s Place Inc. | 1,773 | 76 | |
| * | Lovesac Co. | 2,373 | 76 |
| Signet Jewelers Ltd. | 2,488 | 75 | |
| Polaris Inc. | 785 | 75 | |
| * | Grand Canyon Education Inc. | 902 | 75 |
| * | Stamps.com Inc. | 399 | 75 |
82
U.S. Quality Factor ETF
| Market | |||
| Value• | |||
| Shares | ($000) | ||
| Collectors Universe Inc. | 964 | 74 | |
| * | Nautilus Inc. | 3,369 | 71 |
| Genuine Parts Co. | 722 | 71 | |
| ODP Corp. | 2,459 | 71 | |
| Whirlpool Corp. | 359 | 70 | |
| La-Z-Boy Inc. | 1,882 | 70 | |
| Movado Group Inc. | 4,078 | 69 | |
| * | Take-Two Interactive Software Inc. | 372 | 67 |
| * | Gentherm Inc. | 1,173 | 67 |
| * | Digital Turbine Inc. | 1,479 | 67 |
| New York Times Co. Class A | 1,505 | 65 | |
| Garmin Ltd. | 549 | 64 | |
| Strategic Education Inc. | 661 | 62 | |
| * | Ulta Beauty Inc. | 225 | 62 |
| Buckle Inc. | 2,303 | 62 | |
| Omnicom Group Inc. | 976 | 61 | |
| * | Universal Electronics Inc. | 1,147 | 60 |
| Big Lots Inc. | 1,159 | 60 | |
| Murphy USA Inc. | 464 | 59 | |
| * | Lumber Liquidators Holdings Inc. | 2,048 | 59 |
| * | Hibbett Sports Inc. | 1,435 | 59 |
| Citi Trends Inc. | 1,741 | 59 | |
| * | CarParts.com Inc. | 3,880 | 58 |
| * | Adtalem Global Education Inc. | 2,042 | 58 |
| * | Mohawk Industries Inc. | 464 | 58 |
| Rent-A-Center Inc. | 1,721 | 58 | |
| HNI Corp. | 1,592 | 58 | |
| Abercrombie & Fitch Co. | 2,772 | 57 | |
| * | Ollie’s Bargain Outlet Holdings Inc. | 639 | 56 |
| News Corp. Class A | 3,186 | 56 | |
| * | AutoNation Inc. | 912 | 56 |
| * | Mattel Inc. | 3,559 | 55 |
| * | Malibu Boats Inc. Class A | 956 | 54 |
| * | Genesco Inc. | 1,728 | 54 |
| * | LKQ Corp. | 1,529 | 54 |
| Ethan Allen Interiors Inc. | 2,946 | 54 | |
| * | Zumiez Inc. | 1,447 | 54 |
| Johnson Outdoors Inc. Class A | 638 | 53 | |
| * | GoPro Inc. Class A | 7,527 | 53 |
| * | Skyline Champion Corp. | 1,693 | 52 |
| * | Cars.com Inc. | 4,588 | 51 |
| * | Sportsman’s Warehouse Holdings Inc. | 3,669 | 51 |
| Matthews International Corp. Class A | 1,872 | 50 | |
| * | Asbury Automotive Group Inc. | 438 | 49 |
| * | American Public Education Inc. | 1,588 | 49 |
| * | Dorman Products Inc. | 530 | 49 |
| * | elf Beauty Inc. | 2,248 | 49 |
| Group 1 Automotive Inc. | 388 | 46 | |
| * | 1-800-Flowers.com Inc. Class A | 1,963 | 46 |
| Standard Motor Products Inc. | 993 | 46 | |
| * | MarineMax Inc. | 1,399 | 46 |
| Yum China Holdings Inc. | 801 | 45 | |
| * | Under Armour Inc. Class A | 2,648 | 44 |
| * | Tenneco Inc. Class A | 4,089 | 44 |
| Advance Auto Parts Inc. | 294 | 43 | |
| Fortune Brands Home & Security Inc. | 504 | 42 | |
| * | Sonos Inc. | 1,856 | 41 |
| * | XPEL Inc. | 1,088 | 41 |
| Steven Madden Ltd. | 1,307 | 41 | |
| Lithia Motors Inc. Class A | 141 | 41 | |
| Sonic Automotive Inc. Class A | 1,009 | 41 | |
| Wolverine World Wide Inc. | 1,391 | 40 | |
| * | Copart Inc. | 338 | 39 |
| * | Glu Mobile Inc. | 3,764 | 38 |
| Haverty Furniture Cos. Inc. | 1,379 | 38 | |
| Acushnet Holdings Corp. | 991 | 37 | |
| * | YETI Holdings Inc. | 580 | 37 |
| Columbia Sportswear Co. | 446 | 37 | |
| John Wiley & Sons Inc. Class A | 1,038 | 36 | |
| * | Rh | 79 | 36 |
| * | SiteOne Landscape Supply Inc. | 256 | 35 |
| Steelcase Inc. Class A | 2,858 | 35 | |
| * | Zynga Inc. Class A | 4,186 | 35 |
| * | Crocs Inc. | 586 | 35 |
| Cooper Tire & Rubber Co. | 857 | 34 | |
| * | American Axle & Manufacturing Holdings Inc. | 4,229 | 34 |
| * | Dollar Tree Inc. | 305 | 33 |
| PVH Corp. | 417 | 33 | |
| PriceSmart Inc. | 394 | 32 | |
| Caleres Inc. | 2,712 | 32 | |
| Dick’s Sporting Goods Inc. | 542 | 31 | |
| Shoe Carnival Inc. | 828 | 30 | |
| Inter Parfums Inc. | 547 | 30 | |
| * | Cavco Industries Inc. | 164 | 30 |
| Herman Miller Inc. | 824 | 29 | |
| Copa Holdings SA Class A | 361 | 29 | |
| * | Amazon.com Inc. | 9 | 29 |
| * | Vera Bradley Inc. | 3,280 | 28 |
| * | Stoneridge Inc. | 988 | 27 |
83
U.S. Quality Factor ETF
| Market | |||
| Value• | |||
| Shares | ($000) | ||
| * | Container Store Group Inc. | 2,836 | 26 |
| Camping World Holdings Inc. Class A | 853 | 26 | |
| Ralph Lauren Corp. Class A | 304 | 26 | |
| Qurate Retail Group Inc. QVC Group Class A | 2,481 | 26 | |
| World Wrestling Entertainment Inc. Class A | 580 | 25 | |
| * | Visteon Corp. | 181 | 22 |
| Interface Inc. Class A | 2,530 | 21 | |
| * | Fossil Group Inc. | 1,881 | 20 |
| * | Perdoceo Education Corp. | 1,728 | 20 |
| Activision Blizzard Inc. | 223 | 18 | |
| National Presto Industries Inc. | 174 | 15 | |
| Rush Enterprises Inc. Class A | 385 | 15 | |
| Coty Inc. Class A | 2,020 | 15 | |
| PulteGroup Inc. | 319 | 14 | |
| Oxford Industries Inc. | 249 | 14 | |
| Autoliv Inc. | 141 | 13 | |
| * | AMC Networks Inc. Class A | 379 | 12 |
| Knoll Inc. | 861 | 12 | |
| Nielsen Holdings plc | 645 | 10 | |
| * | Accel Entertainment Inc. Class A | 962 | 10 |
| 11,646 | |||
| Consumer Staples (6.2%) | |||
| Procter & Gamble Co. | 2,826 | 392 | |
| Sysco Corp. | 4,720 | 336 | |
| * | Monster Beverage Corp. | 3,130 | 265 |
| Altria Group Inc. | 6,506 | 259 | |
| Kroger Co. | 3,999 | 132 | |
| * | Boston Beer Co. Inc. Class A | 106 | 99 |
| Medifast Inc. | 470 | 96 | |
| McKesson Corp. | 522 | 94 | |
| * | National Beverage Corp. | 911 | 89 |
| Clorox Co. | 391 | 79 | |
| Weis Markets Inc. | 1,660 | 79 | |
| Colgate-Palmolive Co. | 887 | 76 | |
| Casey’s General Stores Inc. | 418 | 76 | |
| AmerisourceBergen Corp. Class A | 714 | 74 | |
| PetMed Express Inc. | 2,362 | 73 | |
| Flowers Foods Inc. | 3,038 | 67 | |
| * | Helen of Troy Ltd. | 320 | 65 |
| Lancaster Colony Corp. | 364 | 62 | |
| WD-40 Co. | 224 | 57 | |
| SpartanNash Co. | 2,808 | 53 | |
| John B Sanfilippo & Son Inc. | 655 | 49 | |
| * | Rite Aid Corp. | 3,666 | 48 |
| Kellogg Co. | 745 | 48 | |
| * | Edgewell Personal Care Co. | 1,368 | 48 |
| Ingles Markets Inc. Class A | 1,246 | 47 | |
| Coca-Cola Consolidated Inc. | 177 | 46 | |
| * | Sprouts Farmers Market Inc. | 2,151 | 46 |
| Nu Skin Enterprises Inc. Class A | 880 | 45 | |
| Church & Dwight Co. Inc. | 508 | 45 | |
| * | USANA Health Sciences Inc. | 589 | 44 |
| Core-Mark Holding Co. Inc. | 1,412 | 44 | |
| Campbell Soup Co. | 825 | 41 | |
| J&J Snack Foods Corp. | 269 | 39 | |
| Hormel Foods Corp. | 793 | 37 | |
| PepsiCo Inc. | 251 | 36 | |
| Tootsie Roll Industries Inc. | 1,007 | 31 | |
| Hershey Co. | 180 | 27 | |
| * | Hain Celestial Group Inc. | 686 | 26 |
| * | United Natural Foods Inc. | 1,483 | 26 |
| MGP Ingredients Inc. | 545 | 24 | |
| Coca-Cola European Partners plc | 381 | 17 | |
| Brown-Forman Corp. Class B | 198 | 16 | |
| Energizer Holdings Inc. | 354 | 15 | |
| ACCO Brands Corp. | 1,747 | 13 | |
| 3,381 | |||
| Energy (1.3%) | |||
| * | SolarEdge Technologies Inc. | 310 | 86 |
| * | Enphase Energy Inc. | 515 | 70 |
| Baker Hughes Co. Class A | 3,442 | 64 | |
| * | Renewable Energy Group Inc. | 947 | 55 |
| * | ProPetro Holding Corp. | 9,157 | 53 |
| World Fuel Services Corp. | 1,600 | 45 | |
| Liberty Oilfield Services Inc. Class A | 4,555 | 42 | |
| Cactus Inc. | 1,617 | 38 | |
| DMC Global Inc | 884 | 36 | |
| Solaris Oilfield Infrastructure Inc. Class A | 5,091 | 34 | |
| Cabot Oil & Gas Corp. | 1,808 | 32 | |
| Warrior Met Coal Inc. | 1,713 | 30 | |
| * | NOW Inc. | 5,240 | 29 |
| * | RPC Inc. | 8,256 | 26 |
| * | MRC Global Inc. | 4,104 | 24 |
| Kosmos Energy Ltd. | 11,755 | 21 | |
| * | Frank’s International NV | 9,191 | 21 |
| SunCoke Energy Inc. | 3,064 | 14 | |
| 720 | |||
| Financials (17.3%) | |||
| Aon plc Class A | 2,153 | 441 | |
| S&P Global Inc. | 1,186 | 417 | |
| Moody’s Corp. | 1,221 | 345 | |
| Allstate Corp. | 3,342 | 342 | |
84
U.S. Quality Factor ETF
| Market | |||
| Value• | |||
| Shares | ($000) | ||
| Bank of New York Mellon Corp. | 7,695 | 301 | |
| T. Rowe Price Group Inc. | 2,084 | 299 | |
| First Citizens BancShares Inc. Class A | 278 | 147 | |
| Brightsphere Investment Group Inc. | 7,427 | 131 | |
| Ameriprise Financial Inc. | 639 | 118 | |
| SLM Corp. | 10,980 | 117 | |
| Popular Inc. | 2,301 | 112 | |
| Western Alliance Bancorp | 2,114 | 108 | |
| Equitable Holdings Inc. | 4,250 | 108 | |
| Assured Guaranty Ltd. | 3,493 | 105 | |
| Associated Banc-Corp | 6,579 | 101 | |
| First Merchants Corp. | 2,967 | 99 | |
| LPL Financial Holdings Inc. | 1,083 | 98 | |
| Northern Trust Corp. | 1,009 | 94 | |
| * | SVB Financial Group | 272 | 94 |
| Washington Trust Bancorp Inc. | 2,366 | 93 | |
| FactSet Research Systems Inc. | 277 | 92 | |
| State Street Corp. | 1,297 | 91 | |
| * | World Acceptance Corp. | 776 | 88 |
| Fulton Financial Corp. | 6,924 | 85 | |
| * | LendingClub Corp. | 10,554 | 84 |
| TriCo Bancshares | 2,509 | 82 | |
| * | Triumph Bancorp Inc. | 1,790 | 81 |
| Discover Financial Services | 1,066 | 81 | |
| WSFS Financial Corp. | 2,095 | 80 | |
| Primerica Inc. | 591 | 77 | |
| Cboe Global Markets Inc. | 832 | 76 | |
| JPMorgan Chase & Co. | 635 | 75 | |
| Park National Corp. | 737 | 75 | |
| PJT Partners Inc. | 1,067 | 74 | |
| First Busey Corp. | 3,677 | 74 | |
| Santander Consumer USA Holdings Inc. | 3,286 | 73 | |
| National Bank Holdings Corp. Class A | 2,247 | 72 | |
| Waddell & Reed Financial Inc. Class A | 4,372 | 72 | |
| HomeStreet Inc. | 2,209 | 71 | |
| East West Bancorp Inc. | 1,643 | 70 | |
| Diamond Hill Investment Group Inc. | 513 | 70 | |
| First Commonwealth Financial Corp. | 7,179 | 69 | |
| First Financial Bancorp | 4,260 | 68 | |
| Hilltop Holdings Inc. | 2,757 | 66 | |
| Sterling Bancorp | 4,127 | 66 | |
| Veritex Holdings Inc. | 3,039 | 66 | |
| HCI Group Inc. | 1,257 | 66 | |
| CNO Financial Group Inc. | 3,041 | 65 | |
| Federated Hermes Inc. Class B | 2,404 | 65 | |
| OneMain Holdings Inc | 1,645 | 64 | |
| Erie Indemnity Co. Class A | 277 | 63 | |
| Ally Financial Inc. | 2,098 | 62 | |
| Old National Bancorp | 3,875 | 61 | |
| Southside Bancshares Inc. | 2,086 | 61 | |
| Heritage Financial Corp. | 2,633 | 61 | |
| TrustCo Bank Corp. NY | 10,048 | 61 | |
| Nelnet Inc. Class A | 892 | 61 | |
| FirstCash Inc. | 935 | 60 | |
| Meta Financial Group Inc. | 1,813 | 60 | |
| CVB Financial Corp. | 3,113 | 59 | |
| MGIC Investment Corp. | 4,835 | 58 | |
| Lazard Ltd. Class A | 1,549 | 58 | |
| First Hawaiian Inc. | 2,634 | 58 | |
| Hope Bancorp Inc. | 5,972 | 57 | |
| Synovus Financial Corp. | 1,746 | 55 | |
| Affiliated Managers Group Inc. | 630 | 55 | |
| Fifth Third Bancorp | 2,149 | 54 | |
| Investors Bancorp Inc. | 5,622 | 54 | |
| City Holding Co. | 827 | 54 | |
| * | Axos Financial Inc. | 1,605 | 54 |
| Commerce Bancshares Inc. | 809 | 53 | |
| First Interstate BancSystem Inc. Class A | 1,376 | 52 | |
| Comerica Inc. | 1,058 | 52 | |
| First Foundation Inc. | 2,923 | 52 | |
| Walker & Dunlop Inc. | 645 | 52 | |
| PennyMac Financial Services Inc. | 893 | 51 | |
| Bank of NT Butterfield & Son Ltd. | 1,596 | 51 | |
| First Bancorp | 1,594 | 50 | |
| Cathay General Bancorp | 1,762 | 50 | |
| Boston Private Financial Holdings Inc. | 6,905 | 49 | |
| Eagle Bancorp Inc. | 1,342 | 49 | |
| Safety Insurance Group Inc. | 686 | 49 | |
| SEI Investments Co. | 924 | 49 | |
| OFG Bancorp | 2,886 | 48 | |
| UMB Financial Corp. | 675 | 46 | |
| Navient Corp. | 4,855 | 46 | |
| Ameris Bancorp | 1,332 | 45 | |
| Mercury General Corp. | 998 | 44 | |
| Artisan Partners Asset Management Inc. Class A | 984 | 44 | |
| Flagstar Bancorp Inc. | 1,255 | 44 | |
| Radian Group Inc. | 2,307 | 44 | |
| Independent Bank Corp. | 642 | 43 | |
| * | Brighthouse Financial Inc. | 1,224 | 43 |
| Greenhill & Co. Inc. | 3,279 | 43 | |
| MarketAxess Holdings Inc. | 79 | 43 |
85
U.S. Quality Factor ETF
| Market | |||
| Value• | |||
| Shares | ($000) | ||
| * | Credit Acceptance Corp. | 139 | 42 |
| BankUnited Inc. | 1,428 | 41 | |
| Federal Agricultural Mortgage Corp. Class C | 584 | 40 | |
| Interactive Brokers Group Inc. | 746 | 39 | |
| Cadence BanCorp Class A | 2,785 | 39 | |
| Great Western Bancorp Inc. | 2,305 | 38 | |
| Raymond James Financial Inc. | 410 | 37 | |
| B Riley Financial Inc. | 1,015 | 37 | |
| Curo Group Holdings Corp. | 4,188 | 36 | |
| M&T Bank Corp. | 305 | 36 | |
| Meridian Bancorp Inc. | 2,592 | 35 | |
| Atlantic Union Bankshares Corp. | 1,174 | 35 | |
| Cohen & Steers Inc. | 492 | 35 | |
| Washington Federal Inc. | 1,445 | 34 | |
| Zions Bancorp NA | 853 | 33 | |
| AMERISAFE Inc. | 557 | 31 | |
| Renasant Corp. | 979 | 30 | |
| Central Pacific Financial Corp. | 1,767 | 29 | |
| Spectrum Brands Holdings Inc | 433 | 29 | |
| Tompkins Financial Corp. | 453 | 29 | |
| BancFirst Corp. | 525 | 28 | |
| Columbia Banking System Inc. | 885 | 28 | |
| Lakeland Financial Corp. | 549 | 28 | |
| * | Encore Capital Group Inc. | 699 | 24 |
| * | Enova International Inc. | 1,127 | 24 |
| Morningstar Inc. | 114 | 23 | |
| Employers Holdings Inc. | 699 | 21 | |
| * | Customers Bancorp Inc. | 1,262 | 21 |
| Independent Bank Group Inc. | 368 | 21 | |
| Home BancShares Inc. | 1,090 | 20 | |
| * | Focus Financial Partners Inc. Class A | 486 | 19 |
| Hanmi Financial Corp. | 1,915 | 19 | |
| Hanover Insurance Group Inc. | 162 | 18 | |
| KeyCorp | 1,147 | 18 | |
| Virtu Financial Inc. Class A | 670 | 15 | |
| International Bancshares Corp. | 466 | 15 | |
| 1st Source Corp. | 390 | 15 | |
| Evercore Inc. Class A | 157 | 14 | |
| WisdomTree Investments Inc. | 3,300 | 14 | |
| Regions Financial Corp. | 854 | 13 | |
| Citizens Financial Group Inc. | 380 | 12 | |
| Huntington Bancshares Inc. | 985 | 12 | |
| Bryn Mawr Bank Corp. | 369 | 11 | |
| Trustmark Corp. | 428 | 11 | |
| Enterprise Financial Services Corp. | 299 | 10 | |
| Stock Yards Bancorp Inc. | 254 | 10 | |
| Westamerica BanCorp | 180 | 10 | |
| 9,445 | |||
| Health Care (11.1%) | |||
| * | Biogen Inc. | 1,873 | 450 |
| Humana Inc. | 1,093 | 438 | |
| * | Edwards Lifesciences Corp. | 4,873 | 409 |
| Johnson & Johnson | 2,693 | 390 | |
| * | Vertex Pharmaceuticals Inc. | 1,354 | 308 |
| * | Intuitive Surgical Inc. | 361 | 262 |
| Eli Lilly and Co. | 1,126 | 164 | |
| Merck & Co. Inc. | 2,010 | 162 | |
| Abbott Laboratories | 1,360 | 147 | |
| * | Align Technology Inc. | 286 | 138 |
| * | Masimo Corp. | 425 | 108 |
| Owens & Minor Inc. | 3,842 | 99 | |
| Cardinal Health Inc. | 1,807 | 99 | |
| * | Haemonetics Corp. | 784 | 88 |
| * | Molina Healthcare Inc. | 430 | 88 |
| * | Jazz Pharmaceuticals plc | 611 | 86 |
| * | Quidel Corp. | 437 | 85 |
| * | Henry Schein Inc. | 1,323 | 85 |
| * | Corcept Therapeutics Inc. | 3,647 | 83 |
| * | Alexion Pharmaceuticals Inc. | 665 | 81 |
| Cerner Corp. | 1,033 | 77 | |
| Chemed Corp. | 154 | 74 | |
| * | Globus Medical Inc. | 1,220 | 73 |
| * | Amedisys Inc. | 290 | 71 |
| * | Seagen Inc. | 416 | 71 |
| * | Veeva Systems Inc. Class A | 251 | 70 |
| * | Catalyst Pharmaceuticals Inc. | 18,465 | 68 |
| * | Providence Service Corp. | 496 | 67 |
| * | Tivity Health Inc. | 3,445 | 63 |
| * | ABIOMED Inc. | 231 | 63 |
| * | Exelixis Inc. | 3,288 | 63 |
| * | Omnicell Inc. | 576 | 60 |
| * | LHC Group Inc. | 303 | 59 |
| Patterson Cos. Inc. | 2,022 | 56 | |
| Bruker Corp. | 1,097 | 56 | |
| * | Emergent BioSolutions Inc. | 633 | 52 |
| * | Incyte Corp. | 612 | 52 |
| West Pharmaceutical Services Inc. | 172 | 47 | |
| * | STAAR Surgical Co. | 660 | 47 |
86
U.S. Quality Factor ETF
| Market | |||
| Value• | |||
| Shares | ($000) | ||
| * | Vanda Pharmaceuticals Inc. | 3,669 | 45 |
| * | Myriad Genetics Inc. | 2,508 | 44 |
| Premier Inc. Class A | 1,238 | 44 | |
| ResMed Inc. | 209 | 44 | |
| * | Medpace Holdings Inc. | 341 | 44 |
| * | Fulgent Genetics Inc. | 968 | 43 |
| * | DaVita Inc. | 395 | 43 |
| Dentsply Sirona Inc. | 843 | 43 | |
| * | CorVel Corp. | 455 | 41 |
| * | Hologic Inc. | 584 | 40 |
| * | Neogen Corp. | 524 | 39 |
| * | Zynex Inc. | 2,590 | 36 |
| Hill-Rom Holdings Inc. | 380 | 36 | |
| * | Akebia Therapeutics Inc. | 10,837 | 36 |
| * | BioDelivery Sciences International Inc. | 9,156 | 35 |
| * | Meridian Bioscience Inc. | 1,761 | 33 |
| * | MEI Pharma Inc. | 11,028 | 32 |
| * | Cutera Inc. | 1,242 | 31 |
| Atrion Corp. | 47 | 28 | |
| * | BioTelemetry Inc. | 503 | 28 |
| * | Natus Medical Inc. | 1,315 | 28 |
| * | AngioDynamics Inc. | 1,867 | 27 |
| * | NextGen Healthcare Inc. | 1,472 | 26 |
| Healthcare Services Group Inc. | 1,057 | 25 | |
| * | Repro-Med Systems Inc. | 4,968 | 22 |
| * | Antares Pharma Inc. | 6,606 | 21 |
| * | Retractable Technologies Inc. | 1,676 | 19 |
| * | United Therapeutics Corp. | 143 | 19 |
| * | Blueprint Medicines Corp. | 163 | 18 |
| * | Xencor Inc. | 400 | 17 |
| Luminex Corp. | 684 | 16 | |
| * | OraSure Technologies Inc. | 1,332 | 16 |
| * | Cardiovascular Systems Inc. | 442 | 15 |
| * | Orthofix Medical Inc. | 389 | 14 |
| * | ACADIA Pharmaceuticals Inc. | 250 | 14 |
| * | Eagle Pharmaceuticals Inc. | 250 | 11 |
| Phibro Animal Health Corp. Class A | 569 | 11 | |
| 6,043 | |||
| Industrials (19.5%) | |||
| Lockheed Martin Corp. | 1,082 | 395 | |
| Illinois Tool Works Inc. | 1,836 | 388 | |
| Accenture plc Class A | 1,447 | 360 | |
| Automatic Data Processing Inc. | 1,933 | 336 | |
| Sherwin-Williams Co. | 363 | 271 | |
| Paychex Inc. | 2,507 | 234 | |
| Visa Inc. Class A | 758 | 159 | |
| Emerson Electric Co. | 2,067 | 159 | |
| Graco Inc. | 1,794 | 122 | |
| AGCO Corp. | 1,267 | 117 | |
| Brunswick Corp. | 1,562 | 117 | |
| Robert Half International Inc. | 1,691 | 109 | |
| * | TriNet Group Inc. | 1,447 | 109 |
| Rockwell Automation Inc. | 419 | 107 | |
| WW Grainger Inc. | 246 | 103 | |
| CSW Industrials Inc. | 936 | 100 | |
| * | Zebra Technologies Corp. | 263 | 100 |
| EMCOR Group Inc. | 1,149 | 99 | |
| MSA Safety Inc. | 654 | 98 | |
| Trane Technologies plc | 660 | 97 | |
| * | Mettler-Toledo International Inc. | 83 | 95 |
| A O Smith Corp. | 1,658 | 93 | |
| Landstar System Inc. | 710 | 93 | |
| Cintas Corp. | 256 | 91 | |
| Snap-on Inc. | 508 | 89 | |
| * | Keysight Technologies Inc. | 741 | 89 |
| Lincoln Electric Holdings Inc. | 768 | 88 | |
| Cummins Inc. | 377 | 87 | |
| * | Trex Co. Inc. | 1,162 | 87 |
| Simpson Manufacturing Co. Inc. | 946 | 87 | |
| Quanex Building Products Corp. | 4,123 | 85 | |
| Donaldson Co. Inc. | 1,595 | 85 | |
| ManpowerGroup Inc. | 959 | 83 | |
| * | Donnelley Financial Solutions Inc. | 5,082 | 83 |
| Nordson Corp. | 404 | 82 | |
| Insperity Inc. | 932 | 80 | |
| PPG Industries Inc. | 537 | 79 | |
| Exponent Inc. | 929 | 77 | |
| * | Generac Holdings Inc. | 357 | 77 |
| Myers Industries Inc. | 4,510 | 77 | |
| Kforce Inc. | 1,865 | 77 | |
| Allegion plc | 669 | 76 | |
| Xylem Inc. | 793 | 76 | |
| Watsco Inc. | 328 | 75 | |
| * | Proto Labs Inc. | 524 | 72 |
| Watts Water Technologies Inc. Class A | 604 | 71 | |
| American Express Co. | 592 | 70 | |
| Toro Co. | 771 | 70 | |
| * | FARO Technologies Inc. | 1,053 | 70 |
| Ennis Inc. | 4,241 | 69 | |
| * | Franklin Covey Co. | 3,117 | 68 |
| JB Hunt Transport Services Inc. | 498 | 67 | |
| AAON Inc. | 1,018 | 66 | |
| Kelly Services Inc. Class A | 3,185 | 65 | |
| Quanta Services Inc. | 953 | 65 | |
87
| U.S. Quality Factor ETF | |||
| Market | |||
| Value• | |||
| Shares | ($000) | ||
| CH Robinson Worldwide Inc. | 679 | 64 | |
| Franklin Electric Co. Inc. | 938 | 63 | |
| H&E Equipment Services Inc. | 2,341 | 63 | |
| * | Alpha Pro Tech Ltd. | 4,971 | 63 |
| Hubbell Inc. Class B | 387 | 63 | |
| * | MYR Group Inc. | 1,211 | 62 |
| Astec Industries Inc. | 1,042 | 60 | |
| Badger Meter Inc. | 724 | 60 | |
| Expeditors International of Washington Inc. | 667 | 60 | |
| * | GMS Inc. | 1,869 | 58 |
| * | Vicor Corp. | 697 | 57 |
| * | Conduent Inc. | 13,530 | 57 |
| * | Hub Group Inc. Class A | 1,021 | 56 |
| * | TrueBlue Inc. | 2,889 | 55 |
| Synchrony Financial | 1,790 | 55 | |
| UniFirst Corp. | 295 | 55 | |
| * | Lydall Inc. | 1,979 | 54 |
| Powell Industries Inc. | 2,073 | 54 | |
| * | TopBuild Corp. | 307 | 53 |
| Primoris Services Corp. | 2,187 | 53 | |
| Old Dominion Freight Line Inc. | 260 | 53 | |
| Jack Henry & Associates Inc. | 322 | 52 | |
| * | ShotSpotter Inc. | 1,555 | 52 |
| * | FTI Consulting Inc. | 489 | 51 |
| Valmont Industries Inc. | 312 | 51 | |
| Kadant Inc. | 396 | 51 | |
| Wabash National Corp. | 2,860 | 51 | |
| MAXIMUS Inc. | 703 | 50 | |
| * | DXP Enterprises Inc. | 2,321 | 49 |
| Brady Corp. Class A | 1,081 | 48 | |
| * | Napco Security Technologies Inc. | 1,483 | 45 |
| * | Sykes Enterprises Inc. | 1,198 | 45 |
| Hyster-Yale Materials Handling Inc. | 802 | 44 | |
| * | Builders FirstSource Inc. | 1,157 | 43 |
| Flowserve Corp. | 1,267 | 43 | |
| Barrett Business Services Inc. | 646 | 43 | |
| AZZ Inc. | 963 | 43 | |
| Terex Corp. | 1,382 | 43 | |
| McGrath RentCorp | 673 | 43 | |
| * | Dycom Industries Inc. | 665 | 42 |
| Schneider National Inc. Class B | 1,997 | 42 | |
| Ryder System Inc. | 700 | 41 | |
| Dover Corp. | 336 | 41 | |
| * | Gibraltar Industries Inc. | 624 | 41 |
| MSC Industrial Direct Co. Inc. Class A | 490 | 41 | |
| ITT Inc. | 560 | 41 | |
| DHT Holdings Inc. | 7,934 | 41 | |
| Applied Industrial Technologies Inc. | 513 | 40 | |
| Huntington Ingalls Industries Inc. | 251 | 40 | |
| Howmet Aerospace Inc. | 1,669 | 39 | |
| Werner Enterprises Inc. | 979 | 39 | |
| * | Echo Global Logistics Inc. | 1,375 | 39 |
| AptarGroup Inc. | 307 | 39 | |
| * | Waters Corp. | 167 | 39 |
| Acuity Brands Inc. | 326 | 39 | |
| Packaging Corp. of America | 289 | 38 | |
| Tennant Co. | 543 | 36 | |
| FLIR Systems Inc. | 950 | 36 | |
| Comfort Systems USA Inc. | 705 | 36 | |
| * | OSI Systems Inc. | 403 | 36 |
| Apogee Enterprises Inc. | 1,344 | 35 | |
| Shyft Group Inc. | 1,356 | 35 | |
| Heidrick & Struggles International Inc. | 1,340 | 35 | |
| * | Modine Manufacturing Co. | 3,172 | 35 |
| * | Construction Partners Inc. Class A | 1,297 | 34 |
| ABM Industries Inc. | 865 | 33 | |
| * | ASGN Inc. | 423 | 33 |
| IDEX Corp. | 171 | 33 | |
| Mastercard Inc. Class A | 97 | 33 | |
| Stanley Black & Decker Inc. | 177 | 33 | |
| * | Axalta Coating Systems Ltd. | 1,135 | 32 |
| Helios Technologies Inc. | 656 | 32 | |
| * | Aerojet Rocketdyne Holdings Inc. | 861 | 32 |
| Marten Transport Ltd. | 1,767 | 31 | |
| Columbus McKinnon Corp. | 807 | 31 | |
| Regal Beloit Corp. | 253 | 30 | |
| Littelfuse Inc. | 122 | 29 | |
| * | United Rentals Inc. | 126 | 29 |
| Deluxe Corp. | 1,105 | 28 | |
| Forward Air Corp. | 383 | 28 | |
| Enerpac Tool Group Corp. Class A | 1,230 | 28 | |
| Louisiana-Pacific Corp. | 803 | 27 | |
| CoreLogic Inc. | 354 | 27 | |
| Argan Inc. | 593 | 27 | |
| * | Masonite International Corp. | 266 | 27 |
| * | Teledyne Technologies Inc. | 70 | 26 |
| Cass Information Systems Inc. | 622 | 26 | |
| EVERTEC Inc. | 709 | 26 | |
| * | Team Inc. | 2,990 | 26 |
| * | Coherent Inc. | 209 | 25 |
88
| U.S. Quality Factor ETF | ||||
| Market | ||||
| Value• | ||||
| Shares | ($000) | |||
| Kronos Worldwide Inc. | 1,770 | 24 | ||
| Owens Corning | 332 | 24 | ||
| * | JELD-WEN Holding Inc. | 945 | 23 | |
| O-I Glass Inc. | 1,999 | 23 | ||
| * | Huron Consulting Group Inc. | 511 | 23 | |
| Albany International Corp. Class A | 327 | 22 | ||
| * | Cimpress plc | 241 | 22 | |
| Raven Industries Inc. | 830 | 21 | ||
| Chase Corp. | 187 | 20 | ||
| * | Cornerstone Building Brands Inc. | 2,244 | 20 | |
| Crane Co. | 282 | 20 | ||
| Resources Connection Inc. | 1,560 | 19 | ||
| * | Great Lakes Dredge & Dock Corp. | 1,656 | 19 | |
| * | SPX FLOW Inc. | 344 | 18 | |
| John Bean Technologies Corp. | 166 | 18 | ||
| * | Installed Building Products Inc. | 183 | 18 | |
| Belden Inc. | 461 | 18 | ||
| HEICO Corp. | 132 | 16 | ||
| Heartland Express Inc. | 816 | 15 | ||
| Federal Signal Corp. | 485 | 15 | ||
| Oshkosh Corp. | 172 | 14 | ||
| * | Astronics Corp. | 1,212 | 14 | |
| Standex International Corp. | 164 | 12 | ||
| * | ExlService Holdings Inc. | 146 | 12 | |
| * | StoneCo Ltd. Class A | 164 | 12 | |
| * | SPX Corp. | 220 | 11 | |
| Barnes Group Inc. | 242 | 11 | ||
| Encore Wire Corp. | 200 | 10 | ||
| * | Manitowoc Co. Inc. | 922 | 10 | |
| 10,645 | ||||
| Real Estate (1.3%) | ||||
| Simon Property Group Inc. | 2,628 | 217 | ||
| Iron Mountain Inc. | 3,384 | 93 | ||
| Newmark Group Inc. Class A | 9,090 | 64 | ||
| Lamar Advertising Co. Class A | 756 | 60 | ||
| Empire State Realty Trust Inc. | 5,947 | 54 | ||
| Alexander’s Inc. | 178 | 49 | ||
| Paramount Group Inc. | 4,483 | 41 | ||
| GEO Group Inc. | 4,237 | 40 | ||
| * | CBRE Group Inc. Class A | 357 | 22 | |
| Urban Edge Properties | 1,575 | 20 | ||
| City Office REIT Inc. | 2,156 | 19 | ||
| RMR Group Inc. Class A | 419 | 15 | ||
| Saul Centers Inc. | 376 | 12 | ||
| 706 | ||||
| Technology (17.5%) | ||||
| * | Zoom Video | |||
| Communications Inc. Class A | 1,292 | 618 | ||
| Texas Instruments Inc. | 3,163 | 510 | ||
| * | Advanced Micro Devices Inc. | 5,309 | 492 | |
| Apple Inc. | 4,091 | 487 | ||
| Intuit Inc. | 1,327 | 467 | ||
| * | Adobe Inc. | 939 | 449 | |
| Intel Corp. | 6,425 | 311 | ||
| KLA Corp. | 1,051 | 265 | ||
| TE Connectivity Ltd. | 1,451 | 165 | ||
| Lam Research Corp. | 363 | 164 | ||
| Cognizant Technology Solutions Corp. Class A | 2,055 | 161 | ||
| QUALCOMM Inc. | 1,081 | 159 | ||
| Applied Materials Inc. | 1,897 | 156 | ||
| NVIDIA Corp. | 279 | 150 | ||
| * | Facebook Inc. Class A | 532 | 147 | |
| * | Yandex NV Class A | 1,898 | 131 | |
| Teradyne Inc. | 1,169 | 129 | ||
| * | Paycom Software Inc. | 292 | 122 | |
| * | Manhattan Associates Inc. | 1,117 | 114 | |
| Microsoft Corp. | 511 | 109 | ||
| * | Agilysys Inc. | 2,910 | 109 | |
| * | Fortinet Inc. | 790 | 97 | |
| Shutterstock Inc. | 1,366 | 94 | ||
| Monolithic Power Systems Inc. | 290 | 93 | ||
| * | Cadence Design Systems Inc. | 696 | 81 | |
| * | Check Point Software Technologies Ltd. | 685 | 81 | |
| * | Gartner Inc. | 530 | 81 | |
| Universal Display Corp. | 334 | 77 | ||
| * | MicroStrategy Inc. Class A | 216 | 74 | |
| * | A10 Networks Inc. | 9,185 | 73 | |
| Citrix Systems Inc. | 581 | 72 | ||
| * | Veritone Inc. | 2,618 | 70 | |
| * | Lattice Semiconductor Corp. | 1,629 | 68 | |
| * | Aspen Technology Inc. | 496 | 67 | |
| * | Qualys Inc. | 700 | 67 | |
| Skyworks Solutions Inc. | 445 | 63 | ||
| * | IPG Photonics Corp. | 303 | 63 | |
| Hackett Group Inc. | 4,415 | 62 | ||
| * | Upwork Inc. | 1,873 | 61 | |
| * | Crowdstrike Holdings Inc. Class A | 394 | 60 | |
| * | TechTarget Inc. | 1,141 | 60 | |
| * | SPS Commerce Inc. | 576 | 59 | |
| NetApp Inc. | 1,110 | 59 | ||
| * | EPAM Systems Inc. | 183 | 59 | |
| * | TrueCar Inc. | 14,301 | 58 | |
89
| U.S. Quality Factor ETF | ||||
| Market | ||||
| Value• | ||||
| Shares | ($000) | |||
| Simulations Plus Inc. | 1,022 | 57 | ||
| Pitney Bowes Inc. | 10,022 | 57 | ||
| * | F5 Networks Inc. | 344 | 56 | |
| * | Teradata Corp. | 2,515 | 55 | |
| SYNNEX Corp. | 341 | 55 | ||
| * | Avaya Holdings Corp. | 2,876 | 54 | |
| Xerox Holdings Corp. | 2,374 | 52 | ||
| NIC Inc. | 2,183 | 51 | ||
| * | Calix Inc. | 2,153 | 51 | |
| * | Anaplan Inc. | 717 | 50 | |
| * | ChannelAdvisor Corp. | 3,297 | 49 | |
| CDW Corp. | 367 | 48 | ||
| * | Arrow Electronics Inc. | 516 | 47 | |
| * | Cirrus Logic Inc. | 587 | 47 | |
| * | Yelp Inc. Class A | 1,440 | 46 | |
| PC Connection Inc. | 1,005 | 46 | ||
| * | Mitek Systems Inc. | 3,891 | 46 | |
| * | Arista Networks Inc. | 166 | 45 | |
| * | eGain Corp. | 3,957 | 45 | |
| * | Groupon Inc. Class A | 1,436 | 43 | |
| Blackbaud Inc. | 786 | 43 | ||
| American Software Inc. Class A | 2,557 | 42 | ||
| Power Integrations Inc. | 586 | 42 | ||
| * | Photronics Inc. | 3,503 | 41 | |
| Avnet Inc. | 1,298 | 39 | ||
| * | Sanmina Corp. | 1,235 | 39 | |
| National Instruments Corp. | 1,034 | 39 | ||
| * | OneSpan Inc. | 1,928 | 38 | |
| * | ScanSource Inc. | 1,498 | 38 | |
| * | Alarm.com Holdings Inc. | 494 | 38 | |
| * | Diodes Inc. | 542 | 37 | |
| * | Rogers Corp. | 242 | 36 | |
| * | Match Group Inc. | 255 | 35 | |
| * | Appfolio Inc. | 216 | 35 | |
| Jabil Inc. | 917 | 35 | ||
| * | ePlus Inc. | 415 | 35 | |
| * | Synopsys Inc. | 141 | 32 | |
| * | Semtech Corp. | 462 | 31 | |
| * | Pure Storage Inc. Class A | 1,680 | 31 | |
| * | FormFactor Inc. | 739 | 30 | |
| * | Synaptics Inc. | 378 | 29 | |
| * | Digimarc Corp. | 693 | 29 | |
| * | Intelligent Systems Corp. | 739 | 29 | |
| Brooks Automation Inc. | 393 | 29 | ||
| * | Zix Corp. | 3,950 | 28 | |
| * | Pinterest Inc. Class A | 400 | 28 | |
| * | EverQuote Inc. Class A | 734 | 28 | |
| * | NeoPhotonics Corp. | 3,379 | 27 | |
| Progress Software Corp. | 669 | 27 | ||
| QAD Inc. Class A | 460 | 26 | ||
| * | SMART Global Holdings Inc. | 829 | 25 | |
| * | CommVault Systems Inc. | 509 | 24 | |
| * | Altair Engineering Inc. Class A | 437 | 24 | |
| Computer Programs and Systems Inc. | 818 | 23 | ||
| * | Cargurus Inc. | 909 | 23 | |
| * | Blucora Inc. | 1,680 | 22 | |
| * | Nutanix Inc. | 752 | 21 | |
| * | Super Micro Computer Inc. | 693 | 20 | |
| * | Amkor Technology Inc. | 1,318 | 19 | |
| Vishay Intertechnology Inc. | 982 | 19 | ||
| * | Axcelis Technologies Inc. | 700 | 19 | |
| Amdocs Ltd. | 285 | 19 | ||
| * | Perficient Inc. | 382 | 17 | |
| NortonLifeLock Inc. | 951 | 17 | ||
| * | Smith Micro Software Inc. | 3,144 | 17 | |
| * | VMware Inc. Class A | 119 | 17 | |
| Methode Electronics Inc. | 411 | 14 | ||
| * | Plexus Corp. | 192 | 14 | |
| Seagate Technology plc | 214 | 13 | ||
| * | Covetrus Inc. | 454 | 12 | |
| * | Verint Systems Inc. | 211 | 12 | |
| * | GoDaddy Inc. Class A | 145 | 12 | |
| * | Synchronoss Technologies Inc. | 3,865 | 11 | |
| CSG Systems International Inc. | 250 | 11 | ||
| 9,555 | ||||
| Telecommunications (1.5%) | ||||
| Cisco Systems Inc. | 8,892 | 383 | ||
| Ubiquiti Inc. | 352 | 87 | ||
| * | Ciena Corp. | 1,400 | 63 | |
| * | Lumentum Holdings Inc. | 615 | 53 | |
| * | NETGEAR Inc. | 1,408 | 45 | |
| * | Viavi Solutions Inc. | 2,755 | 37 | |
| * | CommScope HoldingCo. Inc. | 2,453 | 29 | |
| * | Extreme Networks Inc. | 4,946 | 28 | |
| * | Vonage Holdings Corp. | 1,912 | 25 | |
| * | Boingo Wireless Inc. | 1,645 | 23 | |
| ADTRAN Inc. | 1,828 | 23 | ||
| * | Consolidated Communications Holdings Inc. | 2,746 | 15 | |
| 811 | ||||
| Utilities (0.2%) | ||||
| * | Clean Harbors Inc. | 708 | 51 | |
| * | Evoqua Water Technologies Corp. | 852 | 22 | |
| 73 | ||||
| Total Common Stocks | ||||
| (Cost $41,849) | 54,281 | |||
90
| U.S. Quality Factor ETF | ||
| Market | ||
| Value• | ||
| Shares | ($000) | |
| Temporary Cash Investment (0.3%) | ||
| Money Market Fund (0.3%) | ||
| 1 Vanguard Market Liquidity Fund, 0.109% (Cost $169) | 1,689 | 169 |
| Total Investments (99.9%) | ||
| (Cost $42,018) | 54,450 | |
Other Asset and Liabilities— Net (0.1%) |
54 | |
| Net Assets (100%) | 54,504 | |
Cost is in $000.
• See Note A in Notes to Financial Statements.
* Non-income-producing security.
1 Affiliated money market fund available only to Vanguard funds and certain trusts and accounts managed by Vanguard. Rate shown is the 7-day yield.
REIT—Real Estate Investment Trust.
Derivative Financial Instruments Outstanding as of Period End
Futures Contracts
| ($000) | ||||
| Value and | ||||
| Number of | Unrealized | |||
| Long (Short) | Notional | Appreciation | ||
| Expiration | Contracts | Amount | (Depreciation) | |
| Long Futures Contracts | ||||
| Micro E-Mini S&P 500 Index | December 2020 | 11 | 199 | 6 |
See accompanying Notes, which are an integral part of the Financial Statements.
91
U.S. Quality Factor ETF
Statement of Assets and Liabilities
As of November 30, 2020
| ($000s, except shares and per-share amounts) | Amount |
| Assets | |
| Investments in Securities, at Value | |
| Unaffiliated Issuers (Cost $41,849) | 54,281 |
| Affiliated Issuers (Cost $169) | 169 |
| Total Investments in Securities | 54,450 |
| Investment in Vanguard | 2 |
| Cash Collateral Pledged—Futures Contracts | 14 |
| Receivables for Accrued Income | 75 |
| Total Assets | 54,541 |
| Liabilities | |
| Payables for Investment Securities Purchased | 33 |
| Payables to Vanguard | 3 |
| Variation Margin Payable—Futures Contracts | 1 |
| Total Liabilities | 37 |
| Net Assets | 54,504 |
| At November 30, 2020, net assets consisted of: | |
| Paid-in Capital | 43,491 |
| Total Distributable Earnings (Loss) | 11,013 |
| Net Assets | 54,504 |
| Net Assets | |
| Applicable to 575,000 outstanding $.001 par value shares of beneficial interest (unlimited authorization) | 54,504 |
| Net Asset Value Per Share | $94.79 |
See accompanying Notes, which are an integral part of the Financial Statements.
92
U.S. Quality Factor ETF
Statement of Operations
| Year Ended | |
| November 30, 2020 | |
| ($000) | |
| Investment Income | |
| Income | |
| Dividends | 642 |
| Interest1 | 1 |
| Securities Lending—Net | — |
| Total Income | 643 |
| Expenses | |
| The Vanguard Group—Note B | |
| Investment Advisory Services | — |
| Management and Administrative | 24 |
| Marketing and Distribution | — |
| Custodian Fees | 5 |
| Auditing Fees | 17 |
| Shareholders’ Reports | 2 |
| Trustees’ Fees and Expenses | — |
| Total Expenses | 48 |
| Net Investment Income | 595 |
| Realized Net Gain (Loss) | |
| Investment Securities Sold1 | (1,393) |
| Futures Contracts | 18 |
| Realized Net Gain (Loss) | (1,375) |
| Change in Unrealized Appreciation (Depreciation) | |
| Investment Securities1 | 10,693 |
| Futures Contracts | 3 |
| Change in Unrealized Appreciation (Depreciation) | 10,696 |
| Net Increase (Decrease) in Net Assets Resulting from Operations | 9,916 |
| 1 | Interest income, realized net gain (loss), and change in unrealized appreciation (depreciation) from an affiliated company of the fund were $1,000, $0, and $0, respectively. Purchases and sales are for temporary cash investment purposes. |
See accompanying Notes, which are an integral part of the Financial Statements.
93
U.S. Quality Factor ETF
Statement of Changes in Net Assets
| Year Ended November 30, | ||
| 2020 | 2019 | |
| ($000) | ($000) | |
| Increase (Decrease) in Net Assets | ||
| Operations | ||
| Net Investment Income | 595 | 323 |
| Realized Net Gain (Loss) | (1,375) | (210) |
| Change in Unrealized Appreciation (Depreciation) | 10,696 | 1,968 |
| Net Increase (Decrease) in Net Assets Resulting from Operations | 9,916 | 2,081 |
| Distributions1 | ||
| Total Distributions | (495) | (294) |
| Capital Share Transactions | ||
| Issued | 26,166 | 5,436 |
| Issued in Lieu of Cash Distributions | — | — |
| Redeemed | (2,136) | (3,851) |
| Net Increase (Decrease) from Capital Share Transactions | 24,030 | 1,585 |
| Total Increase (Decrease) | 33,451 | 3,372 |
| Net Assets | ||
| Beginning of Period | 21,053 | 17,681 |
| End of Period | 54,504 | 21,053 |
1 Certain prior-period numbers have been reclassified to conform with the current-period presentation.
See accompanying Notes, which are an integral part of the Financial Statements.
94
U.S. Quality Factor ETF
Financial Highlights
| Feb. 13, | |||||
| Year Ended | 20181 to | ||||
| Nov. 30, | Nov. 30, | ||||
| For a Share Outstanding Throughout Each Period | 2020 | 2019 | 2018 | ||
| Net Asset Value, Beginning of Period | $84.21 | $78.58 | $75.00 | ||
| Investment Operations | |||||
| Net Investment Income2 | 1.291 | 1.199 | .899 | ||
| Net Realized and Unrealized Gain (Loss) on Investments | 10.428 | 5.559 | 3.266 | ||
| Total from Investment Operations | 11.719 | 6.758 | 4.165 | ||
| Distributions | |||||
| Dividends from Net Investment Income | (1.139) | (1.128) | (.585) | ||
| Distributions from Realized Capital Gains | — | — | — | ||
| Total Distributions | (1.139) | (1.128) | (.585) | ||
| Net Asset Value, End of Period | $94.79 | $84.21 | $78.58 | ||
| Total Return | 14.29% | 8.75% | 5.52% | ||
| Ratios/Supplemental Data | |||||
| Net Assets, End of Period (Millions) | $55 | $21 | $18 | ||
| Ratio of Total Expenses to Average Net Assets | 0.13% | 0.13% | 0.13%3,4 | ||
| Ratio of Net Investment Income to Average Net Assets | 1.59% | 1.52% | 1.40%3 | ||
| Portfolio Turnover Rate | 58% | 80% | 25% | ||
| 1 | Inception. |
| 2 | Calculated based on average shares outstanding. |
| 3 | Annualized. |
| 4 | The ratio of total expenses to average net assets before an expense reduction of 0.04% was 0.17%. The fund incurred higher than anticipated expenses, in which Vanguard voluntarily agreed to assume payment of certain expenses. The fund is not obligated to repay this amount to Vanguard. |
See accompanying Notes, which are an integral part of the Financial Statements.
95
U.S. Quality Factor ETF
Notes to Financial Statements
Vanguard U.S. Quality Factor ETF is registered under the Investment Company Act of 1940 as an open-end investment company, or mutual fund. ETF Shares are listed for trading on Cboe BZX Exchange; they can be purchased and sold through a broker. Market disruptions associated with the COVID-19 pandemic have had a global impact, and uncertainty exists as to the long-term implications. Such disruptions can adversely affect assets of the fund and thus fund performance.
A. The following significant accounting policies conform to generally accepted accounting principles for U.S. investment companies. The fund consistently follows such policies in preparing its financial statements.
1. Security Valuation: Securities are valued as of the close of trading on the New York Stock Exchange (generally 4 p.m., Eastern time) on the valuation date. Equity securities are valued at the latest quoted sales prices or official closing prices taken from the primary market in which each security trades; such securities not traded on the valuation date are valued at the mean of the latest quoted bid and asked prices. Securities for which market quotations are not readily available, or whose values have been materially affected by events occurring before the fund’s pricing time but after the close of the securities’ primary markets, are valued by methods deemed by the board of trustees to represent fair value. Investments in Vanguard Market Liquidity Fund are valued at that fund’s net asset value.
2. Futures Contracts: The fund uses index futures contracts to a limited extent, with the objective of maintaining full exposure to the stock market while maintaining liquidity. The fund may purchase or sell futures contracts to achieve a desired level of investment, whether to accommodate portfolio turnover or cash flows from capital share transactions. The primary risks associated with the use of futures contracts are imperfect correlation between changes in market values of stocks held by the fund and the prices of futures contracts, and the possibility of an illiquid market. Counterparty risk involving futures is mitigated because a regulated clearinghouse is the counterparty instead of the clearing broker. To further mitigate counterparty risk, the fund trades futures contracts on an exchange, monitors the financial strength of its clearing brokers and clearinghouse, and has entered into clearing agreements with its clearing brokers. The clearinghouse imposes initial margin requirements to secure the fund’s performance and requires daily settlement of variation margin representing changes in the market value of each contract. Any securities pledged as initial margin for open contracts are noted in the Schedule of Investments.
Futures contracts are valued at their quoted daily settlement prices. The notional amounts of the contracts are not recorded in the Statement of Assets and Liabilities. Fluctuations in the value of the contracts are recorded in the Statement of Assets and Liabilities as an asset (liability) and in the Statement of Operations as unrealized appreciation (depreciation) until the contracts are closed, when they are recorded as realized gains (losses) on futures contracts.
During the year ended November 30, 2020, the fund’s average investments in long and short futures contracts represented less than 1% and 0% of net assets, respectively, based on the average of the notional amounts at each quarter-end during the period.
3. Federal Income Taxes: The fund intends to continue to qualify as a regulated investment company and distribute all of its taxable income. The fund’s tax returns are open to examination by the relevant tax authorities until expiration of the applicable statute of limitations, which is generally three years after the filing of the tax return. Management has analyzed the fund’s tax positions taken for all open federal and state income tax years, and has concluded that no provision for income tax is required in the fund’s financial statements.
96
U.S. Quality Factor ETF
4. Distributions: Distributions to shareholders are recorded on the ex-dividend date. Distributions are determined on a tax basis at the fiscal year-end and may differ from net investment income and realized capital gains for financial reporting purposes.
5. Securities Lending: To earn additional income, the fund lends its securities to qualified institutional borrowers. Security loans are subject to termination by the fund at any time, and are required to be secured at all times by collateral in an amount at least equal to the market value of securities loaned. Daily market fluctuations could cause the value of loaned securities to be more or less than the value of the collateral received. When this occurs, the collateral is adjusted and settled before the opening of the market on the next business day. The fund further mitigates its counterparty risk by entering into securities lending transactions only with a diverse group of prequalified counterparties, monitoring their financial strength, and entering into master securities lending agreements with its counterparties. The master securities lending agreements provide that, in the event of a counterparty’s default (including bankruptcy), the fund may terminate any loans with that borrower, determine the net amount owed, and sell or retain the collateral up to the net amount owed to the fund; however, such actions may be subject to legal proceedings. While collateral mitigates counterparty risk, in the event of a default, the fund may experience delays and costs in recovering the securities loaned. The fund invests cash collateral received in Vanguard Market Liquidity Fund, and records a liability in the Statement of Assets and Liabilities for the return of the collateral, during the period the securities are on loan. Collateral investments in Vanguard Market Liquidity Fund are subject to market appreciation or depreciation. Securities lending income represents fees charged to borrowers plus income earned on invested cash collateral, less expenses associated with the loan. During the term of the loan, the fund is entitled to all distributions made on or in respect of the loaned securities.
6. Credit Facilities and Interfund Lending Program: The fund and certain other funds managed by The Vanguard Group (“Vanguard”) participate in a $4.3 billion committed credit facility provided by a syndicate of lenders pursuant to a credit agreement and an uncommitted credit facility provided by Vanguard. Both facilities may be renewed annually. Each fund is individually liable for its borrowings, if any, under the credit facilities. Borrowings may be utilized for temporary or emergency purposes, subject to the fund’s regulatory and contractual borrowing restrictions. With respect to the committed credit facility, the participating funds are charged administrative fees and an annual commitment fee of 0.10% of the undrawn committed amount of the facility; these fees are allocated to the funds based on a method approved by the fund’s board of trustees and included in Management and Administrative expenses on the fund’s Statement of Operations. Any borrowings under either facility bear interest at a rate based upon the higher of the one-month London Interbank Offered Rate (or an acceptable alternate rate, if necessary), federal funds effective rate, or overnight bank funding rate plus an agreed-upon spread, except that borrowings under the uncommitted credit facility may bear interest based upon an alternative rate agreed to by the fund and Vanguard.
In accordance with an exemptive order (the “Order”) from the SEC, the fund may participate in a joint lending and borrowing program that allows registered open-end Vanguard funds to borrow money from and lend money to each other for temporary or emergency purposes (the “Interfund Lending Program”), subject to compliance with the terms and conditions of the Order, and to the extent permitted by the fund’s investment objective and investment policies. Interfund loans and borrowings normally extend overnight, but can have a maximum duration of seven days. Loans may be called on one business day’s notice. The interest rate to be charged is governed by the conditions of the Order and internal procedures adopted by the board of trustees. The board of trustees is responsible for overseeing the Interfund Lending Program.
97
U.S. Quality Factor ETF
For the year ended November 30, 2020, the fund did not utilize the credit facilities or the Interfund Lending Program.
7. Other: Dividend income is recorded on the ex-dividend date. Non-cash dividends included in dividend income, if any, are recorded at the fair value of the securities received. Interest income includes income distributions received from Vanguard Market Liquidity Fund and is accrued daily. Security transactions are accounted for on the date securities are bought or sold. Costs used to determine realized gains (losses) on the sale of investment securities are those of the specific securities sold.
B. In accordance with the terms of a Funds’ Service Agreement (the “FSA”) between Vanguard and the fund, Vanguard furnishes to the fund investment advisory, corporate management, administrative, marketing, and distribution services at Vanguard’s cost of operations (as defined by the FSA). These costs of operations are allocated to the fund based on methods and guidelines approved by the board of trustees and are generally settled twice a month.
Upon the request of Vanguard, the fund may invest up to 0.40% of its net assets as capital in Vanguard. At November 30, 2020, the fund had contributed to Vanguard capital in the amount of $2,000, representing less than 0.01% of the fund’s net assets and less than 0.01% of Vanguard’s capital received pursuant to the FSA. The fund’s trustees and officers are also directors and employees, respectively, of Vanguard.
C. Various inputs may be used to determine the value of the fund’s investments and derivatives. These inputs are summarized in three broad levels for financial statement purposes. The inputs or methodologies used to value securities are not necessarily an indication of the risk associated with investing in those securities.
Level 1—Quoted prices in active markets for identical securities.
Level 2—Other significant observable inputs (including quoted prices for similar securities, interest rates, prepayment speeds, credit risk, etc.).
Level 3—Significant unobservable inputs (including the fund’s own assumptions used to determine the fair value of investments). Any investments and derivatives valued with significant unobservable inputs are noted on the Schedule of Investments.
At November 30, 2020, 100% of the market value of the fund’s investments and derivatives was determined based on Level 1 inputs.
98
U.S. Quality Factor ETF
D. Permanent differences between book-basis and tax-basis components of net assets, if any, are reclassified among capital accounts in the financial statements to reflect their tax character. These reclassifications have no effect on net assets or net asset value per share.
Temporary differences between book-basis and tax-basis components of total distributable earnings (loss) arise when certain items of income, gain, or loss are recognized in different periods for financial statement and tax purposes; these differences will reverse at some time in the future. The differences are primarily related to the deferral of losses from wash sales; the recognition of unrealized gains or losses from certain derivative contracts; and the classification of securities for tax purposes. As of period end, the tax-basis components of total distributable earnings (loss) are detailed in the table as follows:
| Amount | |
| ($000) | |
| Undistributed Ordinary Income | 175 |
| Undistributed Long-Term Gains | — |
| Capital Loss Carryforwards | (1,597) |
| Qualified Late-Year Losses | — |
| Net Unrealized Gains (Losses) | 12,435 |
The tax character of distributions paid was as follows:
| Year Ended November 30, | ||
| 2020 | 2019 | |
| Amount | Amount | |
| ($000) | ($000) | |
| Ordinary Income* | 495 | 294 |
| Long-Term Capital Gains | — | — |
| Total | 495 | 294 |
* Includes short-term capital gains, if any.
As of November 30, 2020, gross unrealized appreciation and depreciation for investments and derivatives based on cost for U.S. federal income tax purposes were as follows:
| Amount | |
| ($000) | |
| Tax Cost | 42,018 |
| Gross Unrealized Appreciation | 13,111 |
| Gross Unrealized Depreciation | (676) |
| Net Unrealized Appreciation (Depreciation) | 12,435 |
99
U.S. Quality Factor ETF
E. During the year ended November 30, 2020, the fund purchased $45,610,000 of investment securities and sold $21,539,000 of investment securities, other than temporary cash investments.
F. Capital shares issued and redeemed were:
| Year Ended November 30, | ||
| 2020 | 2019 | |
| Shares | Shares | |
| (000) | (000) | |
| Issued | 350 | 75 |
| Issued in Lieu of Cash Distributions | — | — |
| Redeemed | (25) | (50) |
| Net Increase (Decrease) in Shares Outstanding | 325 | 25 |
At November 30, 2020, one shareholder was the record or beneficial owner of 26% of the fund’s net assets. If this shareholder were to redeem its investment in the fund, the redemption might result in an increase in the fund’s expense ratio, cause the fund to incur higher transaction costs, or lead to the realization of taxable capital gains.
G. Management has determined that no events or transactions occurred subsequent to November 30, 2020, that would require recognition or disclosure in these financial statements.
100
U.S. Value Factor ETF
Performance Summary
All of the returns in this report represent past performance, which is not a guarantee of future results that may be achieved by the fund. (Current performance may be lower or higher than the performance data cited. For performance data current to the most recent month-end, visit our website at vanguard.com/performance.) Note, too, that both investment returns and principal value can fluctuate widely, so an investor’s shares, when sold, could be worth more or less than their original cost. The returns shown do not reflect taxes that a shareholder would pay on fund distributions or on the sale of fund shares.
Cumulative Performance: February 13, 2018, Through November 30, 2020
Initial Investment of $10,000
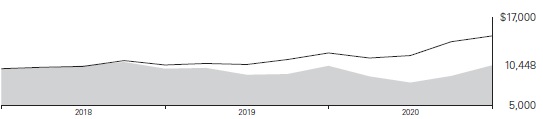
| Average Annual Total Returns | ||||
| Periods Ended November 30, 2020 | ||||
| Since | Final Value | |||
| One | Inception | of a $10,000 | ||
| Year | (2/13/2018) | Investment | ||
 |
U.S. Value Factor ETF Net Asset Value | 0.70% | 1.58% | $10,448 |
| U.S. Value Factor ETF Market Price | 0.69 | 1.60 | 10,453 | |
 |
Russell 3000 Index | 19.02 | 14.05 | 14,440 |
"Since Inception" performance is calculated from the ETF Shares’ inception date for both the fund and its comparative standard(s).
Cumulative Returns of ETF Shares: February 13, 2018, Through November 30, 2020
| Since | ||
| One | Inception | |
| Year | (2/13/2018) | |
| U.S. Value Factor ETF Market Price | 0.69% | 4.53% |
| U.S. Value Factor ETF Net Asset Value | 0.70 | 4.48 |
| Russell 3000 Index | 19.02 | 44.40 |
"Since Inception" performance is calculated from the ETF Shares’ inception date for both the fund and its comparative standard(s).
The market price is determined by the midpoint of the bid-offer spread as of the closing time of the New York Stock Exchange (generally 4 p.m., Eastern time). The net asset value is also determined as of the NYSE closing time. For more information about how the ETF Shares' market prices have compared with their net asset value, visit vanguard.com, select your ETF, and then select the Price and Performance tab. The ETF premium/discount analysis there shows the percentages of days on which the ETF Shares' market price was above or below the NAV.
See Financial Highlights for dividend and capital gains information.
101
U.S. Value Factor ETF
Fund Allocation
As of November 30, 2020
| Basic Materials | 4.5% |
| Consumer Discretionary | 15.0 |
| Consumer Staples | 5.7 |
| Energy | 7.0 |
| Financials | 26.5 |
| Health Care | 8.3 |
| Industrials | 14.3 |
| Real Estate | 1.1 |
| Technology | 7.3 |
| Telecommunications | 3.3 |
| Utilities | 7.0 |
The table reflects the fund’s investments, except for short-term investments and derivatives. Sector categories are based on the Industry Classification Benchmark ("ICB"), except for the "Other" category (if applicable), which includes secur-ities that have not been provided an ICB classification as of the effective reporting period.
The Industry Classification Benchmark ("ICB") is owned by FTSE. FTSE does not accept any liability to any person for any loss or damage arising out of any error or omission in the ICB.
102
U.S. Value Factor ETF
Financial Statements
Schedule of Investments
As of November 30, 2020
The fund files its complete schedule of portfolio holdings with the Securities and Exchange Commission (SEC) for the first and third quarters of each fiscal year as an exhibit to its reports on Form N-PORT. The fund’s Form N-PORT reports are available on the SEC’s website at www.sec.gov.
| Market | |||
| Value• | |||
| Shares | ($000) | ||
| Common Stocks (99.7%) | |||
| Basic Materials (4.5%) | |||
| International Paper Co. | 10,599 | 524 | |
| Newmont Corp. | 7,014 | 413 | |
| DuPont de Nemours Inc. | 6,031 | 383 | |
| LyondellBasell Industries NV Class A | 2,985 | 254 | |
| Eastman Chemical Co. | 2,591 | 252 | |
| Reliance Steel & Aluminum Co. | 2,052 | 242 | |
| Steel Dynamics Inc. | 5,990 | 217 | |
| Huntsman Corp. | 8,282 | 205 | |
| Timken Co. | 2,781 | 204 | |
| Freeport-McMoRan Inc. | 8,701 | 203 | |
| GrafTech International Ltd. | 22,861 | 181 | |
| Westlake Chemical Corp. | 2,296 | 172 | |
| Verso Corp. | 15,796 | 171 | |
| Mosaic Co. | 7,497 | 165 | |
| Schnitzer Steel Industries Inc. | 6,043 | 155 | |
| Commercial Metals Co. | 6,598 | 131 | |
| * | Univar Solutions Inc. | 7,040 | 126 |
| Nucor Corp. | 2,329 | 125 | |
| Minerals Technologies Inc. | 2,049 | 124 | |
| Trinseo SA | 3,247 | 123 | |
| * | Clearwater Paper Corp. | 3,512 | 123 |
| Element Solutions Inc. | 8,595 | 119 | |
| * | AdvanSix Inc. | 6,541 | 116 |
| Chemours Co. | 4,507 | 110 | |
| * | Koppers Holdings Inc. | 3,833 | 104 |
| * | Kraton Corp. | 3,794 | 102 |
| Orion Engineered Carbons SA | 6,542 | 102 | |
| Valvoline Inc. | 3,828 | 87 | |
| Worthington Industries Inc. | 1,458 | 75 | |
| Celanese Corp. Class A | 558 | 72 | |
| Cabot Corp. | 1,660 | 69 | |
| * | Ingevity Corp. | 999 | 66 |
| Domtar Corp. | 1,993 | 60 | |
| Schweitzer-Mauduit International Inc. | 1,613 | 56 | |
| Boise Cascade Co. | 1,193 | 52 | |
| Kaiser Aluminum Corp. | 612 | 48 | |
| Haynes International Inc. | 2,089 | 44 | |
| Ashland Global Holdings Inc. | 581 | 44 | |
| Albemarle Corp. | 309 | 42 | |
| CF Industries Holdings Inc. | 983 | 37 | |
| Avient Corp. | 915 | 33 | |
| Gold Resource Corp. | 9,306 | 28 | |
| Olin Corp. | 1,239 | 27 | |
| Carpenter Technology Corp. | 1,049 | 26 | |
| 6,012 | |||
| Consumer Discretionary (14.9%) | |||
| General Motors Co. | 24,927 | 1,093 | |
| Ford Motor Co. | 68,113 | 618 | |
| ViacomCBS Inc. Class B | 12,619 | 445 | |
| eBay Inc. | 8,152 | 411 | |
| * | AutoNation Inc. | 6,435 | 394 |
| PulteGroup Inc. | 8,935 | 390 | |
| * | Capri Holdings Ltd. | 10,615 | 376 |
| Lennar Corp. Class A | 4,786 | 363 | |
| Target Corp. | 1,965 | 353 | |
| Penske Automotive Group Inc. | 5,290 | 291 | |
| Strategic Education Inc. | 2,949 | 277 | |
| Nexstar Media Group Inc. Class A | 2,596 | 273 | |
| Toll Brothers Inc. | 5,601 | 265 | |
| Newell Brands Inc. | 12,233 | 260 | |
| Aaron’s Holdings Co. Inc. | 4,071 | 256 | |
| * | Discovery Inc. Class A | 9,355 | 252 |
| Harley-Davidson Inc. | 6,166 | 248 | |
| * | Adtalem Global Education Inc. | 8,615 | 247 |
| Foot Locker Inc. | 5,841 | 218 | |
| * | Mohawk Industries Inc. | 1,713 | 216 |
| Wyndham Destinations Inc. | 5,011 | 211 | |
| Group 1 Automotive Inc. | 1,753 | 208 | |
| Fox Corp. Class B | 7,112 | 202 | |
| BorgWarner Inc. | 5,186 | 201 | |
103
| U.S. Value Factor ETF | |||
| Market | |||
| Value• | |||
| Shares | ($000) | ||
| * | Sleep Number Corp. | 2,893 | 201 |
| * | TRI Pointe Group Inc. | 11,434 | 200 |
| Dana Inc. | 11,849 | 200 | |
| Lithia Motors Inc. Class A | 646 | 187 | |
| TEGNA Inc. | 12,806 | 185 | |
| * | Perdoceo Education Corp. | 16,253 | 184 |
| * | MarineMax Inc. | 5,596 | 184 |
| Tapestry Inc. | 6,280 | 178 | |
| * | Gray Television Inc. | 10,069 | 178 |
| KB Home | 5,039 | 177 | |
| * | Hibbett Sports Inc. | 4,303 | 177 |
| KAR Auction Services Inc. | 9,790 | 177 | |
| Whirlpool Corp. | 905 | 176 | |
| ODP Corp. | 6,086 | 174 | |
| Meredith Corp. | 8,368 | 170 | |
| * | Tupperware Brands Corp. | 5,057 | 170 |
| * | Mesa Air Group Inc. | 26,192 | 167 |
| Walmart Inc. | 1,066 | 163 | |
| Graham Holdings Co. Class B | 363 | 162 | |
| * | Meritage Homes Corp. | 1,799 | 162 |
| * | G-III Apparel Group Ltd. | 7,948 | 162 |
| Amerco | 385 | 159 | |
| Hanesbrands Inc. | 11,230 | 159 | |
| Lear Corp. | 1,103 | 158 | |
| Rent-A-Center Inc. | 4,656 | 157 | |
| Entercom Communications Corp. Class A | 64,298 | 156 | |
| * | MSG Networks Inc. | 12,598 | 153 |
| Movado Group Inc. | 9,019 | 153 | |
| Qurate Retail Group Inc. QVC Group Class A | 14,562 | 152 | |
| Kohl’s Corp. | 4,731 | 152 | |
| Big Lots Inc. | 2,946 | 152 | |
| * | Beazer Homes USA Inc. | 10,181 | 151 |
| * | Michaels Cos. Inc. | 15,119 | 150 |
| Ethan Allen Interiors Inc. | 7,931 | 145 | |
| * | Asbury Automotive Group Inc. | 1,279 | 144 |
| Signet Jewelers Ltd. | 4,749 | 144 | |
| Cooper Tire & Rubber Co. | 3,507 | 139 | |
| * | Conn’s Inc. | 12,527 | 139 |
| Ralph Lauren Corp. Class A | 1,594 | 137 | |
| Haverty Furniture Cos. Inc. | 4,980 | 136 | |
| * | Fossil Group Inc. | 12,648 | 134 |
| Brinker International Inc. | 2,582 | 129 | |
| * | WW International Inc. | 4,289 | 127 |
| Shoe Carnival Inc. | 3,422 | 125 | |
| * | Vera Bradley Inc. | 14,254 | 121 |
| * | AMC Networks Inc. Class A | 3,659 | 121 |
| * | Genesco Inc. | 3,804 | 119 |
| * | Zumiez Inc. | 3,211 | 119 |
| * | Discovery Communications Inc. Class C | 4,852 | 117 |
| Herman Miller Inc. | 3,270 | 117 | |
| * | LKQ Corp. | 3,249 | 114 |
| * | AutoZone Inc. | 96 | 109 |
| Goodyear Tire & Rubber Co. | 10,406 | 108 | |
| * | At Home Group Inc. | 5,714 | 108 |
| SkyWest Inc. | 2,489 | 107 | |
| Autoliv Inc. | 1,164 | 104 | |
| * | Century Communities Inc. | 2,285 | 102 |
| Nielsen Holdings plc | 6,025 | 97 | |
| * | Laureate Education Inc. Class A | 6,830 | 97 |
| Matthews International Corp. Class A | 3,617 | 97 | |
| * | Sally Beauty Holdings Inc. | 8,273 | 95 |
| * | M/I Homes Inc. | 2,041 | 93 |
| * | Urban Outfitters Inc. | 3,307 | 91 |
| * | Cars.com Inc. | 7,919 | 88 |
| * | American Axle & Manufacturing Holdings Inc. | 10,784 | 86 |
| Knoll Inc. | 6,162 | 84 | |
| International Game Technology plc | 6,644 | 84 | |
| Buckle Inc. | 3,089 | 83 | |
| Tilly’s Inc. Class A | 8,851 | 81 | |
| Jack in the Box Inc. | 857 | 79 | |
| PVH Corp. | 989 | 79 | |
| Interface Inc. Class A | 9,290 | 78 | |
| * | Universal Electronics Inc. | 1,463 | 77 |
| Sonic Automotive Inc. Class A | 1,900 | 77 | |
| * | Taylor Morrison Home Corp. Class A | 3,001 | 76 |
| Scholastic Corp. | 3,174 | 75 | |
| Winnebago Industries Inc. | 1,384 | 73 | |
| L Brands Inc. | 1,813 | 70 | |
| Fox Corp. Class A | 2,432 | 70 | |
| Caleres Inc. | 5,952 | 70 | |
| Polaris Inc. | 704 | 68 | |
| MDC Holdings Inc. | 1,397 | 67 | |
| * | Container Store Group Inc. | 7,175 | 67 |
| Steelcase Inc. Class A | 5,216 | 63 | |
| Extended Stay America Inc. | 4,398 | 60 | |
104
| U.S. Value Factor ETF | |||
| Market | |||
| Value• | |||
| Shares | ($000) | ||
| * | Liberty Media Corp-Liberty SiriusXM Class C | 1,432 | 59 |
| * | Lions Gate Entertainment Corp. Class A | 5,988 | 58 |
| Designer Brands Inc. Class A | 7,366 | 58 | |
| Sinclair Broadcast Group Inc. Class A | 2,115 | 58 | |
| * | Motorcar Parts of America Inc. | 2,835 | 57 |
| Carriage Services Inc. Class A | 1,989 | 54 | |
| * | American Public Education Inc. | 1,652 | 51 |
| Interpublic Group of Cos. Inc. | 2,247 | 50 | |
| * | Adient plc | 1,585 | 50 |
| Guess? Inc. | 2,543 | 43 | |
| EW Scripps Co. Class A | 3,323 | 42 | |
| * | Grand Canyon Education Inc. | 505 | 42 |
| * | Funko Inc. Class A | 4,621 | 41 |
| Wolverine World Wide Inc. | 1,326 | 38 | |
| National CineMedia Inc. | 10,972 | 37 | |
| Thor Industries Inc. | 360 | 35 | |
| Franchise Group Inc. | 1,232 | 33 | |
| * | iHeartMedia Inc. Class A | 2,663 | 32 |
| Advance Auto Parts Inc. | 201 | 30 | |
| * | Del Taco Restaurants Inc. | 3,153 | 28 |
| * | Tenneco Inc. Class A | 2,602 | 28 |
| Citi Trends Inc. | 811 | 27 | |
| * | Lions Gate Entertainment Corp. Class B | 2,998 | 27 |
| * | Sportsman’s Warehouse Holdings Inc. | 1,873 | 26 |
| 19,848 | |||
| Consumer Staples (5.6%) | |||
| CVS Health Corp. | 13,073 | 886 | |
| Walgreens Boots Alliance Inc. | 20,172 | 767 | |
| Kraft Heinz Co. | 19,065 | 628 | |
| Philip Morris International Inc. | 7,638 | 579 | |
| Archer-Daniels-Midland Co. | 6,998 | 348 | |
| Molson Coors Beverage Co. Class B | 6,999 | 322 | |
| General Mills Inc. | 4,216 | 256 | |
| Keurig Dr Pepper Inc. | 7,846 | 239 | |
| * | Darling Ingredients Inc. | 4,774 | 231 |
| Kroger Co. | 6,866 | 227 | |
| Tyson Foods Inc. Class A | 3,464 | 226 | |
| * | US Foods Holding Corp. | 6,585 | 207 |
| Ingredion Inc. | 2,659 | 205 | |
| ACCO Brands Corp. | 26,106 | 200 | |
| Ingles Markets Inc. Class A | 5,102 | 192 | |
| * | United Natural Foods Inc. | 10,349 | 179 |
| J M Smucker Co. | 1,521 | 178 | |
| SpartanNash Co. | 9,137 | 173 | |
| Andersons Inc. | 7,519 | 171 | |
| * | Pilgrim’s Pride Corp. | 7,578 | 143 |
| Fresh Del Monte Produce Inc. | 4,960 | 126 | |
| Universal Corp. | 2,665 | 121 | |
| * | Herbalife Nutrition Ltd. | 2,401 | 115 |
| * | Rite Aid Corp. | 8,506 | 112 |
| * | TreeHouse Foods Inc. | 2,596 | 107 |
| McKesson Corp. | 564 | 101 | |
| Weis Markets Inc. | 2,107 | 100 | |
| Bunge Ltd. | 1,649 | 97 | |
| * | Edgewell Personal Care Co. | 2,683 | 93 |
| Vector Group Ltd. | 7,658 | 86 | |
| B&G Foods Inc. | 1,759 | 49 | |
| AmerisourceBergen Corp. Class A | 368 | 38 | |
| 7,502 | |||
| Energy (7.0%) | |||
| Kinder Morgan Inc. | 59,693 | 858 | |
| EOG Resources Inc. | 16,592 | 778 | |
| Phillips 66 | 7,417 | 449 | |
| Exxon Mobil Corp. | 11,567 | 441 | |
| Chevron Corp. | 4,106 | 358 | |
| ConocoPhillips | 7,616 | 301 | |
| Cimarex Energy Co. | 7,624 | 274 | |
| ONEOK Inc. | 6,777 | 243 | |
| Diamondback Energy Inc. | 6,048 | 242 | |
| Arch Coal Inc. Class A | 6,468 | 216 | |
| EQT Corp. | 13,606 | 202 | |
| Equitrans Midstream Corp. | 24,754 | 202 | |
| Archrock Inc. | 25,581 | 199 | |
| World Fuel Services Corp. | 6,977 | 198 | |
| Valero Energy Corp. | 3,587 | 193 | |
| * | Bonanza Creek Energy Inc. | 8,466 | 187 |
| * | CNX Resources Corp. | 19,292 | 182 |
| Schlumberger Ltd. | 8,316 | 173 | |
| Range Resources Corp. | 23,568 | 172 | |
| * | First Solar Inc. | 1,805 | 169 |
| * | Comstock Resources Inc. | 33,691 | 164 |
| * | PDC Energy Inc. | 9,760 | 163 |
| Antero Midstream Corp. | 24,094 | 162 | |
105
| U.S. Value Factor ETF | |||
| Market | |||
| Value• | |||
| Shares | ($000) | ||
| * | Renewable Energy Group Inc. | 2,726 | 158 |
| Warrior Met Coal Inc. | 8,544 | 149 | |
| * | Matador Resources Co. | 14,026 | 143 |
| Arcosa Inc. | 2,725 | 141 | |
| Williams Cos. Inc. | 6,605 | 139 | |
| SunCoke Energy Inc. | 30,648 | 138 | |
| SM Energy Co. | 27,933 | 118 | |
| * | Southwestern Energy Co. | 37,197 | 116 |
| Cabot Oil & Gas Corp. | 6,246 | 109 | |
| Pioneer Natural Resources Co. | 1,003 | 101 | |
| * | Newpark Resources Inc. | 64,795 | 97 |
| * | Magnolia Oil & Gas Corp. Class A | 14,935 | 93 |
| Brigham Minerals Inc. Class A | 8,454 | 88 | |
| Nabors Industries Ltd. | 1,536 | 80 | |
| * | Green Plains Inc. | 5,423 | 80 |
| CVR Energy Inc. | 5,410 | 77 | |
| * | Antero Resources Corp. | 18,282 | 72 |
| Continental Resources Inc. | 4,577 | 70 | |
| Marathon Oil Corp. | 11,779 | 70 | |
| HollyFrontier Corp. | 2,833 | 66 | |
| * | Helix Energy Solutions Group Inc. | 17,402 | 65 |
| * | Peabody Energy Corp. | 48,302 | 65 |
| * | Whiting Petroleum Corp. | 2,845 | 64 |
| Berry Corp. | 16,094 | 62 | |
| * | ProPetro Holding Corp. | 10,672 | 62 |
| * | Talos Energy Inc. | 6,239 | 53 |
| * | MRC Global Inc. | 9,154 | 53 |
| * | REX American Resources Corp. | 661 | 52 |
| Patterson-UTI Energy Inc. | 10,823 | 47 | |
| Solaris Oilfield Infrastructure Inc. Class A | 6,738 | 45 | |
| Liberty Oilfield Services Inc. Class A | 4,462 | 42 | |
| * | CONSOL Energy Inc. | 7,660 | 41 |
| Devon Energy Corp. | 2,838 | 40 | |
| * | Golar LNG Ltd. | 2,699 | 25 |
| 9,347 | |||
| Financials (26.4%) | |||
| Morgan Stanley | 14,884 | 920 | |
| American International Group Inc. | 21,287 | 818 | |
| Citigroup Inc. | 14,806 | 815 | |
| MetLife Inc. | 17,603 | 813 | |
| Travelers Cos. Inc. | 6,060 | 786 | |
| Goldman Sachs Group Inc. | 3,266 | 753 | |
| Prudential Financial Inc. | 9,688 | 733 | |
| Chubb Ltd. | 4,636 | 685 | |
| Aflac Inc. | 15,304 | 672 | |
| Bank of America Corp. | 22,381 | 630 | |
| Allstate Corp. | 5,918 | 606 | |
| Bank of New York Mellon Corp. | 15,381 | 602 | |
| Truist Financial Corp. | 12,936 | 601 | |
| * | Berkshire Hathaway Inc. Class B | 2,620 | 600 |
| PNC Financial Services Group Inc. | 4,278 | 591 | |
| US Bancorp | 9,778 | 423 | |
| JPMorgan Chase & Co. | 3,567 | 420 | |
| Axis Capital Holdings Ltd. | 6,722 | 337 | |
| * | Enstar Group Ltd. | 1,579 | 299 |
| BlackRock Inc. | 423 | 295 | |
| * | Mr Cooper Group Inc. | 10,713 | 286 |
| Ally Financial Inc. | 9,612 | 285 | |
| Charles Schwab Corp. | 5,738 | 280 | |
| * | Athene Holding Ltd. Class A | 6,214 | 276 |
| Progressive Corp. | 3,155 | 275 | |
| Equitable Holdings Inc. | 10,446 | 265 | |
| Hartford Financial Services Group Inc. | 5,811 | 257 | |
| Invesco Ltd. | 15,315 | 249 | |
| Park National Corp. | 2,448 | 248 | |
| Popular Inc. | 5,068 | 246 | |
| Wells Fargo & Co. | 8,412 | 230 | |
| Citizens Financial Group Inc. | 6,746 | 220 | |
| SLM Corp. | 20,730 | 220 | |
| Unum Group | 9,809 | 218 | |
| Voya Financial Inc. | 3,735 | 215 | |
| Lincoln National Corp. | 4,435 | 209 | |
| MGIC Investment Corp. | 17,462 | 209 | |
| CNA Financial Corp. | 5,917 | 204 | |
| OneMain Holdings Inc | 5,187 | 202 | |
| Cowen Inc. Class A | 8,142 | 195 | |
| RenaissanceRe Holdings Ltd. | 1,179 | 194 | |
| PennyMac Financial Services Inc. | 3,332 | 192 | |
| Synovus Financial Corp. | 5,951 | 188 | |
| Associated Banc-Corp | 12,251 | 188 | |
| Independent Bank Group Inc. | 3,327 | 187 | |
| Fifth Third Bancorp | 7,300 | 185 | |
| First BanCorp | 22,952 | 182 | |
| First Interstate BancSystem Inc. Class A | 4,750 | 181 | |
| * | Customers Bancorp Inc. | 10,517 | 178 |
| Bank OZK | 6,305 | 176 | |
| State Street Corp. | 2,472 | 174 | |
| Webster Financial Corp. | 4,576 | 173 | |
106
| U.S. Value Factor ETF | |||
| Market | |||
| Value• | |||
| Shares | ($000) | ||
| Hanmi Financial Corp. | 17,619 | 172 | |
| First Merchants Corp. | 5,137 | 171 | |
| Wintrust Financial Corp. | 3,141 | 171 | |
| Reinsurance Group of America Inc. | 1,470 | 169 | |
| First Bancorp | 5,398 | 169 | |
| Cadence BanCorp Class A | 11,963 | 167 | |
| Sterling Bancorp | 10,426 | 167 | |
| * | Brighthouse Financial Inc. | 4,723 | 166 |
| First Horizon Corp. | 13,501 | 165 | |
| Stifel Financial Corp. | 2,354 | 163 | |
| Nelnet Inc. Class A | 2,402 | 163 | |
| Pinnacle Financial Partners Inc. | 2,986 | 162 | |
| Regions Financial Corp. | 10,523 | 161 | |
| Radian Group Inc. | 8,488 | 160 | |
| American Equity Investment Life Holding Co. | 6,020 | 158 | |
| FNB Corp. | 17,625 | 156 | |
| Valley National Bancorp | 16,765 | 153 | |
| Sandy Spring Bancorp Inc. | 5,175 | 152 | |
| Principal Financial Group Inc. | 3,051 | 152 | |
| Essent Group Ltd. | 3,415 | 150 | |
| Washington Trust Bancorp Inc. | 3,761 | 148 | |
| NBT Bancorp Inc. | 4,911 | 147 | |
| Assurant Inc. | 1,136 | 147 | |
| Everest Re Group Ltd. | 643 | 146 | |
| Kemper Corp. | 1,929 | 145 | |
| * | Bancorp Inc. | 12,115 | 143 |
| East West Bancorp Inc. | 3,343 | 143 | |
| KeyCorp | 9,190 | 142 | |
| Prosperity Bancshares Inc. | 2,227 | 140 | |
| PacWest Bancorp | 5,995 | 139 | |
| Navient Corp. | 14,835 | 139 | |
| People’s United Financial Inc. | 11,134 | 138 | |
| Hilltop Holdings Inc. | 5,716 | 138 | |
| M&T Bank Corp. | 1,182 | 138 | |
| Ameris Bancorp | 4,044 | 138 | |
| Globe Life Inc. | 1,463 | 136 | |
| Brookline Bancorp Inc. | 11,859 | 135 | |
| Huntington Bancshares Inc. | 11,118 | 134 | |
| S&T Bancorp Inc. | 5,921 | 133 | |
| WesBanco Inc. | 4,613 | 132 | |
| Franklin Resources Inc. | 5,992 | 132 | |
| Universal Insurance Holdings Inc. | 9,431 | 132 | |
| Hope Bancorp Inc. | 13,621 | 129 | |
| BankUnited Inc. | 4,525 | 129 | |
| HarborOne Bancorp Inc. | 12,887 | 126 | |
| First Commonwealth Financial Corp. | 13,068 | 126 | |
| Assured Guaranty Ltd. | 4,192 | 126 | |
| Meta Financial Group Inc. | 3,781 | 125 | |
| BOK Financial Corp. | 1,857 | 124 | |
| Zions Bancorp NA | 3,194 | 123 | |
| Old National Bancorp | 7,637 | 121 | |
| Flagstar Bancorp Inc. | 3,439 | 121 | |
| Santander Consumer USA Holdings Inc. | 5,425 | 120 | |
| Old Republic International Corp. | 6,660 | 119 | |
| Signature Bank | 1,060 | 119 | |
| Allegiance Bancshares Inc. | 3,738 | 118 | |
| South State Corp. | 1,773 | 118 | |
| First Midwest Bancorp Inc. | 8,417 | 118 | |
| New York Community Bancorp Inc. | 12,144 | 118 | |
| Trustmark Corp. | 4,734 | 118 | |
| Central Pacific Financial Corp. | 7,146 | 117 | |
| Jefferies Financial Group Inc. | 5,140 | 117 | |
| Affiliated Managers Group Inc. | 1,331 | 116 | |
| Discover Financial Services | 1,515 | 115 | |
| First Hawaiian Inc. | 5,255 | 115 | |
| TCF Financial Corp. | 3,415 | 115 | |
| WSFS Financial Corp. | 2,952 | 113 | |
| Great Western Bancorp Inc. | 6,777 | 111 | |
| BancorpSouth Bank | 4,256 | 108 | |
| Renasant Corp. | 3,476 | 107 | |
| Bryn Mawr Bank Corp. | 3,566 | 106 | |
| Boston Private Financial Holdings Inc. | 14,838 | 106 | |
| Pacific Premier Bancorp Inc. | 3,680 | 106 | |
| * | NMI Holdings Inc. Class A | 4,826 | 106 |
| Comerica Inc. | 2,141 | 105 | |
| * | TriState Capital Holdings Inc. | 7,021 | 105 |
| Virtus Investment Partners Inc. | 583 | 104 | |
| OceanFirst Financial Corp. | 6,603 | 104 | |
| Towne Bank | 4,718 | 103 | |
| Cathay General Bancorp | 3,613 | 102 | |
| * | EZCORP Inc. Class A | 20,047 | 102 |
| Argo Group International Holdings Ltd. | 2,545 | 100 | |
| Veritex Holdings Inc. | 4,535 | 98 | |
107
| U.S. Value Factor ETF | |||
| Market | |||
| Value• | |||
| Shares | ($000) | ||
| Provident Financial Services Inc. | 6,249 | 98 | |
| Southside Bancshares Inc. | 3,323 | 98 | |
| * | Encore Capital Group Inc. | 2,850 | 97 |
| Simmons First National Corp. Class A | 4,981 | 97 | |
| Walker & Dunlop Inc. | 1,213 | 97 | |
| TriCo Bancshares | 2,962 | 97 | |
| OFG Bancorp | 5,703 | 96 | |
| Heartland Financial USA Inc. | 2,435 | 95 | |
| Western Alliance Bancorp | 1,844 | 95 | |
| First Financial Bancorp | 5,882 | 94 | |
| iStar Inc. | 6,607 | 93 | |
| First Busey Corp. | 4,602 | 92 | |
| Enterprise Financial Services Corp. | 2,641 | 90 | |
| Heritage Commerce Corp. | 10,666 | 90 | |
| Fulton Financial Corp. | 7,196 | 89 | |
| Northfield Bancorp Inc. | 7,871 | 88 | |
| ConnectOne Bancorp Inc. | 4,907 | 87 | |
| * | World Acceptance Corp. | 768 | 87 |
| HomeStreet Inc. | 2,652 | 86 | |
| Kearny Financial Corp. | 8,638 | 85 | |
| CNO Financial Group Inc. | 4,005 | 85 | |
| * | Triumph Bancorp Inc. | 1,859 | 84 |
| Tompkins Financial Corp. | 1,262 | 80 | |
| 1st Source Corp. | 2,115 | 79 | |
| Investors Bancorp Inc. | 8,085 | 78 | |
| Safety Insurance Group Inc. | 1,082 | 77 | |
| Federal Agricultural Mortgage Corp. Class C | 1,129 | 76 | |
| * | SVB Financial Group | 219 | 76 |
| Preferred Bank | 2,012 | 74 | |
| FB Financial Corp. | 2,290 | 73 | |
| * | Enova International Inc. | 3,457 | 72 |
| Home BancShares Inc. | 3,905 | 72 | |
| Bank of NT Butterfield & Son Ltd. | 2,261 | 72 | |
| Atlantic Union Bankshares Corp. | 2,376 | 71 | |
| National Bank Holdings Corp. Class A | 2,164 | 70 | |
| American Financial Group Inc. | 741 | 66 | |
| Eagle Bancorp Inc. | 1,781 | 66 | |
| Cullen/Frost Bankers Inc. | 779 | 65 | |
| Employers Holdings Inc. | 2,127 | 65 | |
| First American Financial Corp. | 1,318 | 64 | |
| Hancock Whitney Corp. | 2,245 | 63 | |
| Selective Insurance Group Inc. | 984 | 61 | |
| United Bankshares Inc. | 2,065 | 60 | |
| Ameriprise Financial Inc. | 326 | 60 | |
| Intercontinental Exchange Inc. | 567 | 60 | |
| UMB Financial Corp. | 844 | 57 | |
| * | Third Point Reinsurance Ltd. | 5,824 | 56 |
| * | PRA Group Inc. | 1,316 | 55 |
| WisdomTree Investments Inc. | 12,464 | 53 | |
| BGC Partners Inc. Class A | 12,839 | 53 | |
| * | Arch Capital Group Ltd. | 1,617 | 52 |
| Meridian Bancorp Inc. | 3,805 | 52 | |
| Bank of Hawaii Corp. | 685 | 51 | |
| Hanover Insurance Group Inc. | 447 | 50 | |
| Raymond James Financial Inc. | 544 | 49 | |
| First Foundation Inc. | 2,659 | 47 | |
| United Community Banks Inc. | 1,895 | 45 | |
| Banner Corp. | 1,081 | 45 | |
| BancFirst Corp. | 748 | 41 | |
| TrustCo Bank Corp. NY | 6,458 | 39 | |
| Alleghany Corp. | 67 | 39 | |
| Columbia Banking System Inc. | 1,156 | 37 | |
| * | Texas Capital Bancshares Inc. | 650 | 36 |
| Piper Sandler Cos. | 394 | 36 | |
| * | MoneyGram International Inc. | 5,158 | 35 |
| Washington Federal Inc. | 1,445 | 34 | |
| Premier Financial Corp. | 1,625 | 34 | |
| Lazard Ltd. Class A | 878 | 33 | |
| Northwest Bancshares Inc. | 2,746 | 32 | |
| * | Axos Financial Inc. | 967 | 32 |
| Heritage Financial Corp. | 1,260 | 29 | |
| Mercury General Corp. | 594 | 26 | |
| 35,145 | |||
| Health Care (8.3%) | |||
| HCA Healthcare Inc. | 7,494 | 1,125 | |
| * | Viatris Inc. | 48,727 | 820 |
| Cigna Corp. | 3,860 | 807 | |
| Anthem Inc. | 2,424 | 755 | |
| * | Biogen Inc. | 3,062 | 735 |
| AbbVie Inc. | 6,947 | 727 | |
| Pfizer Inc. | 17,536 | 672 | |
| * | Centene Corp. | 10,727 | 661 |
| Gilead Sciences Inc. | 9,993 | 606 | |
| Bristol-Myers Squibb Co. | 8,535 | 533 | |
| Humana Inc. | 901 | 361 | |
108
| U.S. Value Factor ETF | |||
| Market | |||
| Value• | |||
| Shares | ($000) | ||
| Universal Health Services Inc. Class B | 1,639 | 214 | |
| * | Jazz Pharmaceuticals plc | 1,439 | 202 |
| Perrigo Co. plc | 4,029 | 194 | |
| Merck & Co. Inc. | 2,360 | 190 | |
| * | Tenet Healthcare Corp. | 5,985 | 188 |
| * | Alexion Pharmaceuticals Inc. | 1,497 | 183 |
| * | United Therapeutics Corp. | 1,374 | 182 |
| UnitedHealth Group Inc. | 498 | 168 | |
| * | Endo International plc | 32,670 | 166 |
| * | DaVita Inc. | 1,482 | 163 |
| * | Lannett Co. Inc. | 26,028 | 160 |
| * | Acadia Healthcare Co. Inc. | 3,523 | 150 |
| * | Triple-S Management Corp. Class B | 5,543 | 124 |
| * | Select Medical Holdings Corp. | 5,153 | 124 |
| * | Amneal Pharmaceuticals Inc. | 25,619 | 101 |
| * | ANI Pharmaceuticals Inc. | 3,217 | 95 |
| Phibro Animal Health Corp. Class A | 3,619 | 68 | |
| * | Prestige Consumer Healthcare Inc. | 1,921 | 68 |
| Owens & Minor Inc. | 2,596 | 67 | |
| * | Supernus Pharmaceuticals Inc. | 3,060 | 65 |
| * | Laboratory Corp. of America Holdings | 268 | 54 |
| National HealthCare Corp. | 847 | 53 | |
| * | Emergent BioSolutions Inc. | 634 | 52 |
| Quest Diagnostics Inc. | 412 | 51 | |
| * | XBiotech Inc. | 1,941 | 37 |
| * | Brookdale Senior Living Inc. | 7,538 | 32 |
| * | MEDNAX Inc. | 1,320 | 27 |
| 10,980 | |||
| Industrials (14.3%) | |||
| FedEx Corp. | 2,525 | 724 | |
| Capital One Financial Corp. | 6,413 | 549 | |
| Westrock Co. | 11,089 | 468 | |
| Johnson Controls International plc | 10,002 | 460 | |
| Raytheon Technologies Corp. | 6,328 | 454 | |
| * | Fiserv Inc. | 3,356 | 387 |
| Sonoco Products Co. | 6,554 | 381 | |
| General Dynamics Corp. | 2,490 | 372 | |
| * | United Rentals Inc. | 1,541 | 350 |
| ArcBest Corp. | 8,089 | 339 | |
| Alliance Data Systems Corp. | 3,947 | 289 | |
| * | WESCO International Inc. | 4,338 | 283 |
| Triton International Ltd. | 6,129 | 277 | |
| Air Lease Corp. Class A | 7,449 | 272 | |
| Quanta Services Inc. | 3,848 | 263 | |
| * | Modine Manufacturing Co. | 23,684 | 259 |
| Textron Inc. | 5,258 | 237 | |
| Owens Corning | 3,248 | 237 | |
| * | Ducommun Inc. | 4,453 | 221 |
| REV Group Inc. | 23,617 | 218 | |
| AGCO Corp. | 2,355 | 218 | |
| Northrop Grumman Corp. | 703 | 212 | |
| * | Herc Holdings Inc. | 3,701 | 212 |
| * | Dorian LPG Ltd. | 18,946 | 207 |
| Norfolk Southern Corp. | 873 | 207 | |
| MDU Resources Group Inc. | 8,179 | 204 | |
| Greif Inc. Class A | 4,186 | 203 | |
| * | Berry Global Group Inc. | 3,821 | 203 |
| nVent Electric plc | 8,434 | 194 | |
| Costamare Inc. | 26,727 | 192 | |
| International Seaways Inc. | 10,958 | 185 | |
| DHT Holdings Inc. | 34,998 | 179 | |
| Wabtec Corp. | 2,374 | 174 | |
| ADT Inc. | 22,247 | 173 | |
| AAR Corp. | 5,971 | 169 | |
| Kelly Services Inc. Class A | 8,244 | 169 | |
| * | Diamond S Shipping Inc. | 24,482 | 168 |
| * | MYR Group Inc. | 3,186 | 163 |
| Scorpio Tankers Inc. | 14,095 | 163 | |
| * | Beacon Roofing Supply Inc. | 4,443 | 162 |
| Regal Beloit Corp. | 1,333 | 159 | |
| SFL Corp. Ltd. | 22,615 | 153 | |
| Primoris Services Corp. | 6,179 | 150 | |
| Acuity Brands Inc. | 1,254 | 149 | |
| General Electric Co. | 14,588 | 149 | |
| Nordic American Tankers Ltd. | 46,503 | 148 | |
| * | MasTec Inc. | 2,604 | 148 |
| * | US Concrete Inc. | 4,100 | 145 |
| * | GMS Inc. | 4,653 | 145 |
| * | Atlas Air Worldwide Holdings Inc. | 2,596 | 145 |
| * | Tutor Perini Corp. | 10,576 | 143 |
| Greenbrier Cos. Inc. | 4,248 | 142 | |
| Trinity Industries Inc. | 6,076 | 139 | |
| Frontline Ltd. | 21,884 | 137 | |
| ManpowerGroup Inc. | 1,558 | 135 | |
| Fluor Corp. | 7,790 | 135 | |
| GATX Corp. | 1,659 | 132 | |
| * | Colfax Corp. | 3,641 | 131 |
| * | DXP Enterprises Inc. | 6,153 | 130 |
109
| U.S. Value Factor ETF | |||
| Market | |||
| Value• | |||
| Shares | ($000) | ||
| * | Donnelley Financial Solutions Inc. | 7,925 | 129 |
| 3M Co. | 721 | 125 | |
| * | Conduent Inc. | 28,695 | 121 |
| Altra Industrial Motion Corp. | 2,133 | 121 | |
| Huntington Ingalls Industries Inc. | 751 | 120 | |
| Knight-Swift Transportation Holdings Inc. | 2,867 | 118 | |
| Packaging Corp. of America | 871 | 113 | |
| Synchrony Financial | 3,575 | 109 | |
| * | PGT Innovations Inc. | 5,841 | 109 |
| Matson Inc. | 1,852 | 108 | |
| * | Builders FirstSource Inc. | 2,859 | 107 |
| Apogee Enterprises Inc. | 3,981 | 104 | |
| * | Great Lakes Dredge & Dock Corp. | 9,027 | 102 |
| * | American Woodmark Corp. | 1,143 | 100 |
| * | Hub Group Inc. Class A | 1,822 | 100 |
| * | Sykes Enterprises Inc. | 2,613 | 98 |
| * | BrightView Holdings Inc. | 7,141 | 97 |
| Silgan Holdings Inc. | 2,813 | 95 | |
| Sealed Air Corp. | 2,102 | 95 | |
| Schneider National Inc. Class B | 4,496 | 94 | |
| Ennis Inc. | 5,639 | 92 | |
| * | SEACOR Holdings Inc. | 2,778 | 92 |
| Resources Connection Inc. | 7,565 | 92 | |
| Ardmore Shipping Corp. | 27,191 | 90 | |
| Cummins Inc. | 382 | 88 | |
| * | JELD-WEN Holding Inc. | 3,626 | 88 |
| Ryder System Inc. | 1,481 | 88 | |
| * | Manitowoc Co. Inc. | 7,565 | 84 |
| * | Echo Global Logistics Inc. | 2,959 | 84 |
| * | Vectrus Inc. | 1,682 | 80 |
| Emerson Electric Co. | 1,039 | 80 | |
| * | Textainer Group Holdings Ltd. | 4,312 | 79 |
| Quanex Building Products Corp. | 3,742 | 77 | |
| * | Covenant Transportation Group Inc. Class A | 4,073 | 75 |
| PACCAR Inc. | 858 | 75 | |
| Hyster-Yale Materials Handling Inc. | 1,349 | 74 | |
| * | US Xpress Enterprises Inc. Class A | 9,685 | 73 |
| Oshkosh Corp. | 880 | 71 | |
| Heidrick & Struggles International Inc. | 2,711 | 71 | |
| CAI International Inc. | 2,218 | 70 | |
| Otter Tail Corp. | 1,702 | 68 | |
| * | Thermon Group Holdings Inc. | 4,717 | 67 |
| * | Middleby Corp. | 489 | 67 |
| Werner Enterprises Inc. | 1,648 | 66 | |
| H&E Equipment Services Inc. | 2,439 | 66 | |
| * | XPO Logistics Inc. | 611 | 65 |
| Snap-on Inc. | 365 | 64 | |
| * | Alpha Pro Tech Ltd. | 5,007 | 63 |
| * | Cardtronics plc Class A | 2,525 | 61 |
| * | Meritor Inc. | 2,317 | 61 |
| Graphic Packaging Holding Co. | 3,968 | 61 | |
| Deere & Co. | 226 | 59 | |
| Curtiss-Wright Corp. | 512 | 59 | |
| * | Sterling Construction Co. Inc. | 3,653 | 58 |
| Moog Inc. Class A | 745 | 58 | |
| Argan Inc. | 1,224 | 56 | |
| MTS Systems Corp. | 1,466 | 51 | |
| * | Axalta Coating Systems Ltd. | 1,794 | 51 |
| American Express Co. | 424 | 50 | |
| Powell Industries Inc. | 1,891 | 49 | |
| Belden Inc. | 1,250 | 48 | |
| Columbus McKinnon Corp. | 1,183 | 45 | |
| AZZ Inc. | 940 | 42 | |
| * | Atkore International Group Inc. | 1,057 | 41 |
| * | Masonite International Corp. | 403 | 40 |
| CSX Corp. | 425 | 38 | |
| * | TriNet Group Inc. | 459 | 34 |
| HB Fuller Co. | 657 | 34 | |
| Valmont Industries Inc. | 177 | 29 | |
| Brunswick Corp. | 363 | 27 | |
| Terex Corp. | 857 | 27 | |
| * | Allegheny Technologies Inc. | 1,956 | 26 |
| Granite Construction Inc. | 1,054 | 26 | |
| Macquarie Infrastructure Corp. | 801 | 26 | |
| Kronos Worldwide Inc. | 1,883 | 26 | |
| Deluxe Corp. | 992 | 26 | |
| 19,035 | |||
| Real Estate (1.2%) | |||
| * | Jones Lang LaSalle Inc. | 1,468 | 194 |
| * | Realogy Holdings Corp. | 15,213 | 187 |
| VICI Properties Inc. | 5,706 | 144 | |
| STORE Capital Corp. | 3,778 | 123 | |
| EPR Properties | 3,361 | 121 | |
| Preferred Apartment Communities Inc. Class A | 13,159 | 103 | |
110
| U.S. Value Factor ETF | |||
| Market | |||
| Value• | |||
| Shares | ($000) | ||
| Newmark Group Inc. Class A | 13,802 | 97 | |
| Brixmor Property Group Inc. | 5,485 | 84 | |
| Sabra Health Care REIT Inc. | 5,030 | 83 | |
| RE/MAX Holdings Inc. Class A | 2,540 | 80 | |
| American Finance Trust Inc. | 10,055 | 74 | |
| CoreCivic Inc. | 9,891 | 70 | |
| GEO Group Inc. | 6,882 | 65 | |
| * | Cushman & Wakefield plc | 3,729 | 56 |
| Industrial Logistics Properties Trust | 1,996 | 43 | |
| 1,524 | |||
| Technology (7.3%) | |||
| * | Micron Technology Inc. | 17,820 | 1,142 |
| Intel Corp. | 13,570 | 656 | |
| International Business Machines Corp. | 4,694 | 580 | |
| Broadcom Inc. | 1,134 | 455 | |
| HP Inc. | 17,739 | 389 | |
| Cognizant Technology Solutions Corp. Class A | 4,549 | 355 | |
| SYNNEX Corp. | 2,203 | 353 | |
| Avnet Inc. | 10,515 | 319 | |
| Hewlett Packard Enterprise Co. | 27,353 | 302 | |
| * | Dell Technologies Inc. | 4,320 | 298 |
| * | NCR Corp. | 8,469 | 234 |
| Xerox Holdings Corp. | 10,609 | 232 | |
| * | J2 Global Inc. | 2,545 | 228 |
| * | Arrow Electronics Inc. | 2,471 | 227 |
| Ebix Inc. | 6,243 | 212 | |
| DXC Technology Co. | 9,473 | 208 | |
| Oracle Corp. | 3,143 | 181 | |
| NortonLifeLock Inc. | 9,593 | 175 | |
| Jabil Inc. | 4,572 | 175 | |
| Western Digital Corp. | 3,445 | 155 | |
| Science Applications International Corp. | 1,661 | 154 | |
| CDK Global Inc. | 3,095 | 148 | |
| * | ScanSource Inc. | 5,705 | 143 |
| * | Qorvo Inc. | 854 | 134 |
| Perspecta Inc. | 5,960 | 134 | |
| * | Sanmina Corp. | 3,927 | 125 |
| * | Photronics Inc. | 10,683 | 124 |
| Applied Materials Inc. | 1,471 | 121 | |
| Benchmark Electronics Inc. | 4,909 | 119 | |
| * | TTM Technologies Inc. | 8,062 | 105 |
| * | Amkor Technology Inc. | 6,892 | 102 |
| Corning Inc. | 2,696 | 101 | |
| Computer Programs and Systems Inc. | 3,467 | 99 | |
| * | Flex Ltd. | 5,784 | 94 |
| Methode Electronics Inc. | 2,658 | 93 | |
| * | SMART Global Holdings Inc. | 2,999 | 92 |
| * | NetScout Systems Inc. | 3,904 | 91 |
| VirnetX Holding Corp. | 15,454 | 84 | |
| NXP Semiconductors NV | 527 | 84 | |
| * | Allscripts Healthcare Solutions Inc. | 6,013 | 82 |
| Vishay Intertechnology Inc. | 4,049 | 78 | |
| * | Super Micro Computer Inc. | 2,719 | 77 |
| Xperi Holding Corp | 3,910 | 75 | |
| * | Ultra Clean Holdings Inc. | 1,926 | 61 |
| * | Avaya Holdings Corp. | 3,069 | 57 |
| * | Unisys Corp. | 3,700 | 54 |
| * | Yandex NV Class A | 778 | 54 |
| * | Diebold Nixdorf Inc. | 5,610 | 53 |
| * | Blucora Inc. | 3,915 | 51 |
| Seagate Technology plc | 566 | 33 | |
| 9,698 | |||
| Telecommunications (3.3%) | |||
| AT&T Inc. | 29,206 | 840 | |
| Verizon Communications Inc. | 13,366 | 807 | |
| Comcast Corp. Class A | 14,631 | 735 | |
| Cisco Systems Inc. | 9,827 | 423 | |
| * | DISH Network Corp. Class A | 7,991 | 287 |
| * | CommScope Holding Co. Inc. | 17,666 | 209 |
| CenturyLink Inc. | 17,285 | 181 | |
| L3Harris Technologies Inc. | 891 | 171 | |
| * | United States Cellular Corp. | 5,304 | 166 |
| * | Consolidated Communications Holdings Inc. | 18,688 | 105 |
| Telephone and Data Systems Inc. | 5,398 | 102 | |
| Juniper Networks Inc. | 4,611 | 100 | |
| * | Liberty Global plc Class C | 4,197 | 91 |
| * | EchoStar Corp. Class A | 3,171 | 75 |
| Comtech Telecommunications Corp. | 3,541 | 68 | |
| 4,360 | |||
| Utilities (6.9%) | |||
| Exelon Corp. | 19,887 | 817 | |
| Duke Energy Corp. | 7,211 | 668 | |
| Southern Co. | 9,505 | 569 | |
| Sempra Energy | 4,442 | 566 | |
| American Electric Power Co. Inc. | 6,080 | 516 | |
| Dominion Energy Inc. | 5,912 | 464 | |
111
| U.S. Value Factor ETF | |||
| Market | |||
| Value• | |||
| Shares | ($000) | ||
| UGI Corp. | 12,759 | 453 | |
| Public Service Enterprise Group Inc. | 7,275 | 424 | |
| ALLETE Inc. | 6,636 | 373 | |
| Avangrid Inc. | 7,811 | 364 | |
| National Fuel Gas Co. | 7,831 | 322 | |
| ONE Gas Inc. | 3,404 | 270 | |
| Portland General Electric Co. | 5,562 | 230 | |
| Vistra Corp. | 11,691 | 218 | |
| Edison International | 3,554 | 218 | |
| DTE Energy Co. | 1,541 | 194 | |
| Pinnacle West Capital Corp. | 2,296 | 188 | |
| NRG Energy Inc. | 4,904 | 161 | |
| AES Corp. | 7,654 | 157 | |
| Consolidated Edison Inc. | 2,028 | 155 | |
| Black Hills Corp. | 2,532 | 154 | |
| FirstEnergy Corp. | 5,783 | 154 | |
| CenterPoint Energy Inc. | 6,547 | 152 | |
| Evergy Inc. | 2,711 | 150 | |
| Xcel Energy Inc. | 2,154 | 145 | |
| OGE Energy Corp. | 4,453 | 144 | |
| Spire Inc. | 2,216 | 142 | |
| PPL Corp. | 3,785 | 108 | |
| Hawaiian Electric Industries Inc. | 2,956 | 106 | |
| NorthWestern Corp. | 1,778 | 103 | |
| WEC Energy Group Inc. | 856 | 81 | |
| Unitil Corp. | 1,939 | 79 | |
| IDACORP Inc. | 873 | 79 | |
| Clearway Energy Inc. | 2,565 | 75 | |
| Avista Corp. | 1,756 | 66 | |
| Southwest Gas Holdings Inc. | 875 | 56 | |
| New Jersey Resources Corp. | 1,188 | 39 | |
| Chesapeake Utilities Corp. | 311 | 32 | |
| * | Harsco Corp. | 1,905 | 32 |
| 9,224 | |||
| Total
Common Stocks (Cost $114,232) |
132,675 | ||
| Temporary Cash Investment (0.1%) | |||
| Money Market Fund (0.1%) | |||
| 1 | Vanguard
Market Liquidity Fund, 0.109% (Cost $191) |
1,912 | 191 |
| Total
Investments (99.8%) (Cost $114,423) |
132,866 | ||
Other Assets and Liabilities— Net (0.2%) |
260 | ||
| Net Assets (100%) | 133,126 | ||
Cost is in $000.
• See Note A in Notes to Financial Statements.
* Non-income-producing security.
| 1 | Affiliated money market fund available only to Vanguard funds and certain trusts and accounts managed by Vanguard. Rate shown is the 7-day yield. |
REIT—Real Estate Investment Trust.
| Derivative Financial Instruments Outstanding as of Period End | |||||
| Futures Contracts | |||||
| ($000) | |||||
| Value and | |||||
| Number of | Unrealized | ||||
| Long (Short) | Notional | Appreciation | |||
| Expiration | Contracts | Amount | (Depreciation) | ||
| Long Futures Contracts | |||||
| E-mini S&P 500 Index | December 2020 | 2 | 362 | 13 | |
| Micro E-mini S&P 500 Index | December 2020 | 4 | 72 | — | |
| 13 | |||||
See accompanying Notes, which are an integral part of the Financial Statements.
112
U.S. Value Factor ETF
Statement of Assets and Liabilities
As of November 30, 2020
| ($000s, except shares and per-share amounts) | Amount |
| Assets | |
| Investments in Securities, at Value | |
| Unaffiliated Issuers (Cost $114,232) | 132,675 |
| Affiliated Issuers (Cost $191) | 191 |
| Total Investments in Securities | 132,866 |
| Investment in Vanguard | 5 |
| Cash | 3 |
| Cash Collateral Pledged—Futures Contracts | 34 |
| Receivables for Accrued Income | 316 |
| Total Assets | 133,224 |
| Liabilities | |
| Payables for Investment Securities Purchased | 88 |
| Payables to Vanguard | 8 |
| Variation Margin Payable—Futures Contracts | 2 |
| Total Liabilities | 98 |
| Net Assets | 133,126 |
| At November 30, 2020, net assets consisted of: | |
| Paid-in Capital | 124,167 |
| Total Distributable Earnings (Loss) | 8,959 |
| Net Assets | 133,126 |
| Net Assets | |
| Applicable to 1,800,000 outstanding $.001 par value shares of beneficial interest (unlimited authorization) | 133,126 |
| Net Asset Value Per Share | $73.96 |
See accompanying Notes, which are an integral part of the Financial Statements.
113
U.S. Value Factor ETF
Statement of Operations
| Year Ended | |
| November 30, 2020 | |
| ($000) | |
| Investment Income | |
| Income | |
| Dividends | 2,841 |
| Interest1 | 3 |
| Securities Lending—Net | 59 |
| Total Income | 2,903 |
| Expenses | |
| The Vanguard Group—Note B | |
| Investment Advisory Services | 67 |
| Management and Administrative | 33 |
| Marketing and Distribution | 4 |
| Custodian Fees | 20 |
| Auditing Fees | 17 |
| Shareholders’ Reports | 3 |
| Trustees’ Fees and Expenses | — |
| Total Expenses | 144 |
| Expenses Paid Indirectly | (10) |
| Net Expenses | 134 |
| Net Investment Income | 2,769 |
| Realized Net Gain (Loss) | |
| Investment Securities Sold1,2 | (5,345) |
| Futures Contracts | 91 |
| Realized Net Gain (Loss) | (5,254) |
| Change in Unrealized Appreciation (Depreciation) | |
| Investment Securities1 | 17,854 |
| Futures Contracts | 3 |
| Change in Unrealized Appreciation (Depreciation) | 17,857 |
| Net Increase (Decrease) in Net Assets Resulting from Operations | 15,372 |
| 1 | Interest income, realized net gain (loss), and change in unrealized appreciation (depreciation) from an affiliated company of the fund were $3,000, ($1,000), and $0, respectively. Purchases and sales are for temporary cash investment purposes. |
| 2 | Includes $2,763,000 of net gain (loss) resulting from in-kind redemptions. |
See accompanying Notes, which are an integral part of the Financial Statements.
114
U.S. Value Factor ETF
Statement of Changes in Net Assets
| Year Ended November 30, | ||
| 2020 | 2019 | |
| ($000) | ($000) | |
| Increase (Decrease) in Net Assets | ||
| Operations | ||
| Net Investment Income | 2,769 | 1,325 |
| Realized Net Gain (Loss) | (5,254) | (2,120) |
| Change in Unrealized Appreciation (Depreciation) | 17,857 | 2,437 |
| Net Increase (Decrease) in Net Assets Resulting from Operations | 15,372 | 1,642 |
| Distributions1 | ||
| Total Distributions | (2,473) | (1,121) |
| Capital Share Transactions | ||
| Issued | 63,070 | 65,325 |
| Issued in Lieu of Cash Distributions | — | — |
| Redeemed | (24,015) | (21,847) |
| Net Increase (Decrease) from Capital Share Transactions | 39,055 | 43,478 |
| Total Increase (Decrease) | 51,954 | 43,999 |
| Net Assets | ||
| Beginning of Period | 81,172 | 37,173 |
| End of Period | 133,126 | 81,172 |
1 Certain prior-period numbers have been reclassified to conform with the current-period presentation.
See accompanying Notes, which are an integral part of the Financial Statements.
115
U.S. Value Factor ETF
Financial Highlights
| Feb. 13, | |||
| Year Ended | 20181 to | ||
| Nov. 30, | Nov. 30, | ||
| For a Share Outstanding Throughout Each Period | 2020 | 2019 | 2018 |
| Net Asset Value, Beginning of Period | $75.51 | $74.35 | $75.00 |
| Investment Operations | |||
| Net Investment Income2 | 1.689 | 1.671 | 1.276 |
| Net Realized and Unrealized Gain (Loss) on Investments | (1.634) | 1.053 | (1.295) |
| Total from Investment Operations | .055 | 2.724 | (.019) |
| Distributions | |||
| Dividends from Net Investment Income | (1.605) | (1.564) | (.631) |
| Distributions from Realized Capital Gains | — | — | — |
| Total Distributions | (1.605) | (1.564) | (.631) |
| Net Asset Value, End of Period | $73.96 | $75.51 | $74.35 |
| Total Return | 0.70% | 3.83% | -0.08% |
| Ratios/Supplemental Data | |||
| Net Assets, End of Period (Millions) | $133 | $81 | $37 |
| Ratio of Total Expenses to Average Net Assets | 0.14%3 | 0.14%3 | 0.13%4 |
| Ratio of Net Investment Income to Average Net Assets | 2.68% | 2.32% | 2.05%4 |
| Portfolio Turnover Rate | 52%5 | 73% | 16% |
| 1 | Inception. |
| 2 | Calculated based on average shares outstanding. |
| 3 | The ratio of expenses to average net assets for the period net of reduction from custody fee offset arrangements was 0.13%. |
| 4 | Annualized. |
| 5 | Excludes the value of portfolio securities received or delivered as a result of in-kind purchases or redemptions of the fund’s capital shares, including ETF Creation Units. |
See accompanying Notes, which are an integral part of the Financial Statements.
116
U.S. Value Factor ETF
Notes to Financial Statements
Vanguard U.S. Value Factor ETF is registered under the Investment Company Act of 1940 as an open-end investment company, or mutual fund. ETF Shares are listed for trading on Cboe BZX Exchange; they can be purchased and sold through a broker. Market disruptions associated with the COVID-19 pandemic have had a global impact, and uncertainty exists as to the long-term implications. Such disruptions can adversely affect assets of the fund and thus fund performance.
A. The following significant accounting policies conform to generally accepted accounting principles for U.S. investment companies. The fund consistently follows such policies in preparing its financial statements.
1. Security Valuation: Securities are valued as of the close of trading on the New York Stock Exchange (generally 4 p.m., Eastern time) on the valuation date. Equity securities are valued at the latest quoted sales prices or official closing prices taken from the primary market in which each security trades; such securities not traded on the valuation date are valued at the mean of the latest quoted bid and asked prices. Securities for which market quotations are not readily available, or whose values have been materially affected by events occurring before the fund’s pricing time but after the close of the securities’ primary markets, are valued by methods deemed by the board of trustees to represent fair value. Investments in Vanguard Market Liquidity Fund are valued at that fund’s net asset value.
2. Futures Contracts: The fund uses index futures contracts to a limited extent, with the objective of maintaining full exposure to the stock market while maintaining liquidity. The fund may purchase or sell futures contracts to achieve a desired level of investment, whether to accommodate portfolio turnover or cash flows from capital share transactions. The primary risks associated with the use of futures contracts are imperfect correlation between changes in market values of stocks held by the fund and the prices of futures contracts, and the possibility of an illiquid market. Counterparty risk involving futures is mitigated because a regulated clearinghouse is the counterparty instead of the clearing broker. To further mitigate counterparty risk, the fund trades futures contracts on an exchange, monitors the financial strength of its clearing brokers and clearinghouse, and has entered into clearing agreements with its clearing brokers. The clearinghouse imposes initial margin requirements to secure the fund’s performance and requires daily settlement of variation margin representing changes in the market value of each contract. Any securities pledged as initial margin for open contracts are noted in the Schedule of Investments.
Futures contracts are valued at their quoted daily settlement prices. The notional amounts of the contracts are not recorded in the Statement of Assets and Liabilities. Fluctuations in the value of the contracts are recorded in the Statement of Assets and Liabilities as an asset (liability) and in the Statement of Operations as unrealized appreciation (depreciation) until the contracts are closed, when they are recorded as realized gains (losses) on futures contracts.
During the year ended November 30, 2020, the fund’s average investments in long and short futures contracts represented less than 1% and 0% of net assets, respectively, based on the average of the notional amounts at each quarter-end during the period.
3. Federal Income Taxes: The fund intends to continue to qualify as a regulated investment company and distribute all of its taxable income. The fund’s tax returns are open to examination by the relevant tax authorities until expiration of the applicable statute of limitations, which is generally three years after the filing of the tax return. Management has analyzed the fund’s tax positions taken for all open federal and state income tax years, and has concluded that no provision for income tax is required in the fund’s financial statements.
117
U.S. Value Factor ETF
4. Distributions: Distributions to shareholders are recorded on the ex-dividend date. Distributions are determined on a tax basis at the fiscal year-end and may differ from net investment income and realized capital gains for financial reporting purposes.
5. Securities Lending: To earn additional income, the fund lends its securities to qualified institutional borrowers. Security loans are subject to termination by the fund at any time, and are required to be secured at all times by collateral in an amount at least equal to the market value of securities loaned. Daily market fluctuations could cause the value of loaned securities to be more or less than the value of the collateral received. When this occurs, the collateral is adjusted and settled before the opening of the market on the next business day. The fund further mitigates its counterparty risk by entering into securities lending transactions only with a diverse group of prequalified counterparties, monitoring their financial strength, and entering into master securities lending agreements with its counterparties. The master securities lending agreements provide that, in the event of a counterparty’s default (including bankruptcy), the fund may terminate any loans with that borrower, determine the net amount owed, and sell or retain the collateral up to the net amount owed to the fund; however, such actions may be subject to legal proceedings. While collateral mitigates counterparty risk, in the event of a default, the fund may experience delays and costs in recovering the securities loaned. The fund invests cash collateral received in Vanguard Market Liquidity Fund, and records a liability in the Statement of Assets and Liabilities for the return of the collateral, during the period the securities are on loan. Collateral investments in Vanguard Market Liquidity Fund are subject to market appreciation or depreciation. Securities lending income represents fees charged to borrowers plus income earned on invested cash collateral, less expenses associated with the loan. During the term of the loan, the fund is entitled to all distributions made on or in respect of the loaned securities.
6. Credit Facilities and Interfund Lending Program: The fund and certain other funds managed by The Vanguard Group (“Vanguard”) participate in a $4.3 billion committed credit facility provided by a syndicate of lenders pursuant to a credit agreement and an uncommitted credit facility provided by Vanguard. Both facilities may be renewed annually. Each fund is individually liable for its borrowings, if any, under the credit facilities. Borrowings may be utilized for temporary or emergency purposes, subject to the fund’s regulatory and contractual borrowing restrictions. With respect to the committed credit facility, the participating funds are charged administrative fees and an annual commitment fee of 0.10% of the undrawn committed amount of the facility; these fees are allocated to the funds based on a method approved by the fund’s board of trustees and included in Management and Administrative expenses on the fund’s Statement of Operations. Any borrowings under either facility bear interest at a rate based upon the higher of the one-month London Interbank Offered Rate (or an acceptable alternate rate, if necessary), federal funds effective rate, or overnight bank funding rate plus an agreed-upon spread, except that borrowings under the uncommitted credit facility may bear interest based upon an alternative rate agreed to by the fund and Vanguard.
In accordance with an exemptive order (the “Order”) from the SEC, the fund may participate in a joint lending and borrowing program that allows registered open-end Vanguard funds to borrow money from and lend money to each other for temporary or emergency purposes (the “Interfund Lending Program”), subject to compliance with the terms and conditions of the Order, and to the extent permitted by the fund’s investment objective and investment policies. Interfund loans and borrowings normally extend overnight, but can have a maximum duration of seven days. Loans
118
U.S. Value Factor ETF
may be called on one business day’s notice. The interest rate to be charged is governed by the conditions of the Order and internal procedures adopted by the board of trustees. The board of trustees is responsible for overseeing the Interfund Lending Program.
For the year ended November 30, 2020, the fund did not utilize the credit facilities or the Interfund Lending Program.
7. Other: Dividend income is recorded on the ex-dividend date. Non-cash dividends included in dividend income, if any, are recorded at the fair value of the securities received. Interest income includes income distributions received from Vanguard Market Liquidity Fund and is accrued daily. Security transactions are accounted for on the date securities are bought or sold. Costs used to determine realized gains (losses) on the sale of investment securities are those of the specific securities sold.
B. In accordance with the terms of a Funds’ Service Agreement (the “FSA”) between Vanguard and the fund, Vanguard furnishes to the fund investment advisory, corporate management, administrative, marketing, and distribution services at Vanguard’s cost of operations (as defined by the FSA). These costs of operations are allocated to the fund based on methods and guidelines approved by the board of trustees and are generally settled twice a month.
Upon the request of Vanguard, the fund may invest up to 0.40% of its net assets as capital in Vanguard. At November 30, 2020, the fund had contributed to Vanguard capital in the amount of $5,000, representing less than 0.01% of the fund’s net assets and less than 0.01% of Vanguard’s capital received pursuant to the FSA. The fund’s trustees and officers are also directors and employees, respectively, of Vanguard.
C. The fund’s custodian bank has agreed to reduce its fees when the fund maintains cash on deposit in the non-interest-bearing custody account. For the year ended November 30, 2020, custodian fee offset arrangements reduced the fund’s expenses by $10,000 (an annual rate of 0.01% of average net assets).
D. Various inputs may be used to determine the value of the fund’s investments and derivatives. These inputs are summarized in three broad levels for financial statement purposes. The inputs or methodologies used to value securities are not necessarily an indication of the risk associated with investing in those securities.
Level 1—Quoted prices in active markets for identical securities.
Level 2—Other significant observable inputs (including quoted prices for similar securities, interest rates, prepayment speeds, credit risk, etc.).
Level 3—Significant unobservable inputs (including the fund’s own assumptions used to determine the fair value of investments). Any investments and derivatives valued with significant unobservable inputs are noted on the Schedule of Investments.
At November 30, 2020, 100% of the market value of the fund’s investments and derivatives was determined based on Level 1 inputs.
119
U.S. Value Factor ETF
E. Permanent differences between book-basis and tax-basis components of net assets are reclassified among capital accounts in the financial statements to reflect their tax character. These reclassifications have no effect on net assets or net asset value per share. As of period end, permanent differences primarily attributable to the accounting for in-kind redemptions and passive foreign investment companies were reclassified between the following accounts:
| Amount | |
| ($000) | |
| Paid-in Capital | 2,763 |
| Total Distributable Earnings (Loss) | (2,763) |
Temporary differences between book-basis and tax-basis components of total distributable earnings (loss) arise when certain items of income, gain, or loss are recognized in different periods for financial statement and tax purposes; these differences will reverse at some time in the future. The differences are primarily related to the deferral of losses from wash sales; the recognition of unrealized gains or losses from certain derivative contracts; and the recognition of unrealized gains from passive foreign investment companies. As of period end, the tax-basis components of total distributable earnings (loss) are detailed in the table as follows:
| Amount | |
| ($000) | |
| Undistributed Ordinary Income | 705 |
| Undistributed Long-Term Gains | — |
| Capital Loss Carryforwards | (10,178) |
| Qualified Late-Year Losses | — |
| Net Unrealized Gains (Losses) | 18,432 |
The tax character of distributions paid was as follows:
| Year Ended November 30, | ||
| 2020 | 2019 | |
| Amount | Amount | |
| ($000) | ($000) | |
| Ordinary Income* | 2,473 | 1,121 |
| Long-Term Capital Gains | — | — |
| Total | 2,473 | 1,121 |
* Includes short-term capital gains, if any.
120
U.S. Value Factor ETF
As of November 30, 2020, gross unrealized appreciation and depreciation for investments and derivatives based on cost for U.S. federal income tax purposes were as follows:
| Amount | |
| ($000) | |
| Tax Cost | 114,434 |
| Gross Unrealized Appreciation | 25,330 |
| Gross Unrealized Depreciation | (6,898) |
| Net Unrealized Appreciation (Depreciation) | 18,432 |
F. During the year ended November 30, 2020, the fund purchased $102,102,000 of investment securities and sold $62,685,000 of investment securities, other than temporary cash investments. Purchases and sales include $0 and $9,750,000, respectively, in connection with in-kind purchases and redemptions of the fund’s capital shares.
G. Capital shares issued and redeemed were:
| Year Ended November 30, | ||
| 2020 | 2019 | |
| Shares | Shares | |
| (000) | (000) | |
| Issued | 1,150 | 900 |
| Issued in Lieu of Cash Distributions | — | — |
| Redeemed | (425) | (325) |
| Net Increase (Decrease) in Shares Outstanding | 725 | 575 |
At November 30, 2020, one shareholder was the record or beneficial owner of 28% of the fund’s net assets. If this shareholder were to redeem its investment in the fund, the redemption might result in an increase in the fund’s expense ratio, cause the fund to incur higher transaction costs, or lead to the realization of taxable capital gains.
H. Management has determined that no events or transactions occurred subsequent to November 30, 2020, that would require recognition or disclosure in these financial statements.
121
Report of Independent Registered
Public Accounting Firm
To the Board of Trustees of Vanguard Wellington Fund and Shareholders of Vanguard U.S. Liquidity Factor ETF, Vanguard U.S. Minimum Volatility ETF, Vanguard U.S. Momentum Factor ETF, Vanguard U.S. Multifactor ETF, Vanguard U.S. Quality Factor ETF and Vanguard U.S. Value Factor ETF
Opinions on the Financial Statements
We have audited the accompanying statements of assets and liabilities, including the schedules of investments, of Vanguard U.S. Liquidity Factor ETF, Vanguard U.S. Minimum Volatility ETF, Vanguard U.S. Momentum Factor ETF, Vanguard U.S. Multifactor ETF, Vanguard U.S. Quality Factor ETF and Vanguard U.S. Value Factor ETF (six of the funds constituting Vanguard Wellington Fund, hereafter collectively referred to as the "Funds") as of November 30, 2020, the related statements of operations for the year ended November 30, 2020, the statements of changes in net assets for each of the two years in the period ended November 30, 2020, including the related notes, and the financial highlights for each of the two years in the period ended November 30, 2020 and for the period February 13, 2018 (inception) through November 30, 2018 (collectively referred to as the “financial statements”). In our opinion, the financial statements present fairly, in all material respects, the financial position of each of the Funds as of November 30, 2020, the results of each of their operations for the year then ended, the changes in each of their net assets for each of the two years in the period ended November 30, 2020 and each of the financial highlights for each of the two years in the period ended November 30, 2020 and for the period February 13, 2018 (inception) through November 30, 2018 in conformity with accounting principles generally accepted in the United States of America.
Basis for Opinions
These financial statements are the responsibility of the Funds’ management. Our responsibility is to express an opinion on the Funds’ financial statements based on our audits. We are a public accounting firm registered with the Public Company Accounting Oversight Board (United States) (PCAOB) and are required to be independent with respect to the Funds in accordance with the U.S. federal securities laws and the applicable rules and regulations of the Securities and Exchange Commission and the PCAOB.
We conducted our audits of these financial statements in accordance with the standards of the PCAOB. Those standards require that we plan and perform the audit to obtain reasonable assurance about whether the financial statements are free of material misstatement, whether due to error or fraud.
Our audits included performing procedures to assess the risks of material misstatement of the financial statements, whether due to error or fraud, and performing procedures that respond to those risks. Such procedures included examining, on a test basis, evidence regarding the amounts and disclosures in the financial statements. Our audits also included evaluating the accounting principles used and significant estimates made by management, as well as evaluating the overall presentation of the financial statements. Our procedures included confirmation of securities owned as of November 30, 2020 by correspondence with the custodian and brokers and by agreement to the underlying ownership records of the transfer agent; when replies were not received from brokers, we performed other auditing procedures. We believe that our audits provide a reasonable basis for our opinions.
/s/PricewaterhouseCoopers LLP
Philadelphia, Pennsylvania
January 14, 2021
We have served as the auditor of one or more investment companies in The Vanguard Group of Funds since 1975.
122
Special 2020 tax information (unaudited) for Vanguard U.S. Factor ETFs
This information for the fiscal year ended November 30, 2020, is included pursuant to provisions of the Internal Revenue Code.
The funds distributed qualified dividend income to shareholders during the fiscal year as follows:
| Fund | ($000) |
| U.S. Liquidity Factor ETF | 633 |
| U.S. Minimum Volatility ETF | 1,570 |
| U.S. Momentum Factor ETF | 404 |
| U.S. Multifactor ETF | 1,209 |
| U.S. Quality Factor ETF | 495 |
| U.S. Value Factor ETF | 2,473 |
For corporate shareholders, the percentage of investment income (dividend income plus short-term gains, if any) that qualifies for the dividends-received deduction is as follows:
| Fund | Percentage |
| U.S. Liquidity Factor ETF | 86.9% |
| U.S. Minimum Volatility ETF | 74.1 |
| U.S. Momentum Factor ETF | 98.4 |
| U.S. Multifactor ETF | 100.0 |
| U.S. Quality Factor ETF | 99.4 |
| U.S. Value Factor ETF | 92.5 |
The funds distributed qualified business income to shareholders during the fiscal year as follows:
| Fund | ($000) |
| U.S. Liquidity Factor ETF | 32 |
| U.S. Minimum Volatility ETF | 219 |
| U.S. Momentum Factor ETF | — |
| U.S. Multifactor ETF | — |
| U.S. Quality Factor ETF | — |
| U.S. Value Factor ETF | — |
123
This page intentionally left blank.
This page intentionally left blank.
This page intentionally left blank.
This page intentionally left blank.
This page intentionally left blank.
This page intentionally left blank.
This page intentionally left blank.
The People Who Govern Your Fund
The trustees of your mutual fund are there to see that the fund is operated and managed in your best interests since, as a shareholder, you are a part owner of the fund. Your fund’s trustees also serve on the board of directors of The Vanguard Group, Inc., which is owned by the Vanguard funds and provides services to them.
A majority of Vanguard’s board members are independent, meaning that they have no affiliation with Vanguard or the funds they oversee, apart from the sizable personal investments they have made as private individuals. The independent board members have distinguished backgrounds in business, academia, and public service. Each of the trustees and executive officers oversees 211 Vanguard funds.
Information for each trustee and executive officer of the fund appears below. That information, as well as the Vanguard fund count, is as of the date on the cover of this fund report. The mailing address of the trustees and officers is P.O. Box 876, Valley Forge, PA 19482. More information about the trustees is in the Statement of Additional Information, which can be obtained, without charge, by contacting Vanguard at 800-662-7447, or online at vanguard.com.
Interested Trustee1
Mortimer J. Buckley
Born in 1969. Trustee since January 2018. Principal occupation(s) during the past five years and other experience: chairman of the board (2019–present) of Vanguard and of each of the investment companies served by Vanguard; chief executive officer (2018– present) of Vanguard; chief executive officer, president, and trustee (2018–present) of each of the investment companies served by Vanguard; president and director (2017–present) of Vanguard; and president (2018–present) of Vanguard Marketing Corporation. Chief investment officer (2013–2017), managing director (2002–2017), head of the Retail Investor Group (2006–2012), and chief information officer (2001–2006) of Vanguard. Chairman of the board (2011–2017) and trustee (2009–2017) of the Children’s Hospital of Philadelphia; and trustee (2018–present) and vice chair (2019–present) of The Shipley School.
Independent Trustees
Emerson U. Fullwood
Born in 1948. Trustee since January 2008. Principal occupation(s) during the past five years and other experience: executive chief staff and marketing officer for North America and corporate vice president (retired 2008) of Xerox Corporation (document management products and services). Former president of the Worldwide Channels Group, Latin America, and Worldwide Customer Service and executive chief staff officer of Developing Markets of Xerox. Executive in residence and 2009–2010 Distinguished Minett Professor at the Rochester Institute of Technology. Director of SPX FLOW, Inc. (multi-industry manufac-turing). Director of the University of Rochester Medical Center, the Monroe Community College Foundation, the United Way of Rochester, North Carolina A&T University, and Roberts Wesleyan College. Trustee of the University of Rochester.
Amy Gutmann
Born in 1949. Trustee since June 2006. Principal occupation(s) during the past five years and other experience: president (2004–present) of the University of Pennsylvania. Christopher H. Browne Distinguished Professor of Political Science, School of Arts and Sciences, and professor of communication, Annenberg School for Communication, with secondary faculty appointments in the Department of Philosophy, School of Arts and Sciences, and at the Graduate School of Education, University of Pennsylvania.
F. Joseph Loughrey
Born in 1949. Trustee since October 2009. Principal occupation(s) during the past five years and other experience: president and chief operating officer (retired 2009) and vice chairman of the board (2008–2009) of Cummins Inc. (industrial machinery). Chairman of the board of Hillenbrand, Inc. (specialized consumer services) and the Lumina Foundation. Director of the V Foundation. Member of the advisory
| 1 | Mr. Buckley is considered an “interested person,” as defined in the Investment Company Act of 1940, because he is an officer of the Vanguard funds. |
council for the College of Arts and Letters and chair of the advisory board to the Kellogg Institute for International Studies, both at the University of Notre Dame.
Mark Loughridge
Born in 1953. Trustee since March 2012. Principal occupation(s) during the past five years and other experience: senior vice president and chief financial officer (retired 2013) of IBM (information technology services). Fiduciary member of IBM’s Retirement Plan Committee (2004–2013), senior vice president and general manager (2002–2004) of IBM Global Financing, vice president and controller (1998–2002) of IBM, and a variety of other prior management roles at IBM. Member of the Council on Chicago Booth.
Scott C. Malpass
Born in 1962. Trustee since March 2012. Principal occupation(s) during the past five years and other experience: chief investment officer (retired June 2020) and vice president (retired June 2020) of the University of Notre Dame. Assistant professor of finance at the Mendoza College of Business, University of Notre Dame, and member of the Notre Dame 403(b) Investment Committee (retired June 2020). Member of the board of Catholic Investment Services, Inc. (investment advisors) and the board of superintendence of the Institute for the Works of Religion.
Deanna Mulligan
Born in 1963. Trustee since January 2018. Principal occupation(s) during the past five years and other experience: board chair (2020–present), chief executive officer (2011–2020), and president (2010–2019) of The Guardian Life Insurance Company of America. Chief operating officer (2010–2011) and executive vice president (2008–2010) of the individual life and disability division of Guardian Life. Member of the board of the American Council of Life Insurers and the board of the Economic Club of New York. Trustee of the Partnership for New York City (business leadership), Chief Executives for Corporate Purpose, NewYork-Presbyterian Hospital, Catalyst, and the Bruce Museum (arts and science). Member of the Advisory Council for the Stanford Graduate School of Business.
André F. Perold
Born in 1952. Trustee since December 2004. Principal occupation(s) during the past five years and other experience: George Gund Professor of Finance and Banking, Emeritus at the Harvard Business School (retired 2011). Chief investment officer and co-managing partner of HighVista Strategies (private investment firm). Member of the board of advisors and member of the investment committee of the Museum of Fine Arts Boston. Member of the board (2018–present) of RIT Capital Partners (investment firm). Member of the investment committee of Partners Health Care System.
Sarah Bloom Raskin
Born in 1961. Trustee since January 2018. Principal occupation(s) during the past five years and other experience: deputy secretary (2014–2017) of the United States Department of the Treasury. Governor (2010–2014) of the Federal Reserve Board. Commissioner (2007–2010) of financial regulation for the State of Maryland. Member of the board of directors (2012–2014) of Neighborhood Reinvestment Corporation. Director (2017–present) of i(x) Investments, LLC; director (2017–present) of Reserve Trust. Rubenstein Fellow (2017–present) of Duke University; trustee (2017–present) of Amherst College, and trustee (2019–present) of the Folger Shakespeare Library.
Peter F. Volanakis
Born in 1955. Trustee since July 2009. Principal occupation(s) during the past five years and other experience: president and chief operating officer (retired 2010) of Corning Incorporated (communications equipment) and director of Corning Incorporated (2000–2010) and Dow Corning (2001–2010). Director (2012) of SPX Corporation (multi-industry manufacturing). Overseer of the Amos Tuck School of Business Administration, Dartmouth College (2001–2013). Chairman of the board of trustees of Colby-Sawyer College. Member of the board of Hypertherm Inc. (industrial cutting systems, software, and consumables).
Executive Officers
John Bendl
Born in 1970. Principal occupation(s) during the past five years and other experience: principal of Vanguard. Chief financial officer (2019–present) of each of the investment companies served by Vanguard. Chief accounting officer, treasurer, and controller of Vanguard (2017–present). Partner (2003–2016) at KPMG (audit, tax, and advisory services).
Christine M. Buchanan
Born in 1970. Principal occupation(s) during the past five years and other experience: principal of Vanguard. Treasurer (2017–present) of each of the investment companies served by Vanguard. Partner (2005–2017) at KPMG (audit, tax, and advisory services).
David Cermak
Born in 1960. Principal occupation(s) during the past five years and other experience: principal of Vanguard. Finance director (2019–present) of each of the investment companies served by Vanguard. Managing director and head (2017–present) of Vanguard Investments Singapore. Managing director and head (2017–2019) of Vanguard Investments Hong Kong. Representative director and head (2014–2017) of Vanguard Investments Japan.
John Galloway
Born in 1973. Principal occupation(s) during the past five years and other experience: principal of Vanguard. Investment stewardship officer (September 2020–present) of each of the investment companies served by Vanguard. Head of Investor Advocacy (February 2020–present) and head of Marketing Strategy and Planning (2017–2020) at Vanguard. Deputy assistant to the President of the United States (2015).
Thomas J. Higgins
Born in 1957. Principal occupation(s) during the past five years and other experience: principal of Vanguard. Finance director (2019–present), chief financial officer (2008–2019), and treasurer (1998–2008) of each of the investment companies served by Vanguard.
Peter Mahoney
Born in 1974. Principal occupation(s) during the past five years and other experience: principal of Vanguard. Controller (2015–present) of each of the investment companies served by Vanguard. Head of International Fund Services (2008–2014) at Vanguard.
Anne E. Robinson
Born in 1970. Principal occupation(s) during the past five years and other experience: general counsel (2016–present) of Vanguard. Secretary (2016–present) of Vanguard and of each of the investment companies served by Vanguard. Managing director (2016–present) of Vanguard. Managing director and general counsel of Global Cards and Consumer Services (2014–2016) at Citigroup. Counsel (2003–2014) at American Express.
Michael Rollings
Born in 1963. Principal occupation(s) during the past five years and other experience: finance director (2017–present) and treasurer (2017) of each of the investment companies served by Vanguard. Managing director (2016–present) of Vanguard. Chief financial officer (2016–present) of Vanguard. Director (2016–present) of Vanguard Marketing Corporation. Executive vice president and chief financial officer (2006–2016) of MassMutual Financial Group.
John E. Schadl
Born in 1972. Principal occupation(s) during the past five years and other experience: principal of Vanguard. Chief compliance officer (2019–present) of Vanguard and of each of the investment companies served by Vanguard. Assistant vice president (2019–present) of Vanguard Marketing Corporation.
Vanguard Senior Management Team
| Joseph Brennan | James M. Norris |
| Mortimer J. Buckley | Thomas M. Rampulla |
| Gregory Davis | Karin A. Risi |
| John James | Anne E. Robinson |
| John T. Marcante | Michael Rollings |
| Chris D. McIsaac | Lauren Valente |
Connect with Vanguard® > vanguard.com
Fund Information > 800-662-7447
Direct Investor Account Services > 800-662-2739
Institutional Investor Services > 800-523-1036
Text Telephone for People Who Are Deaf or Hard of Hearing > 800-749-7273
This material may be used in conjunction with the offering of shares of any Vanguard fund only if preceded or accompanied by the fund’s current prospectus.
All comparative mutual fund data are from Morningstar, Inc., unless otherwise noted.
You can obtain a free copy of Vanguard’s proxy voting guidelines by visiting vanguard.com/proxyreporting or by calling Vanguard at 800-662-2739. The guidelines are also available from the SEC’s website, www.sec.gov. In addition, you may obtain a free report on how your fund voted the proxies for securities it owned during the 12 months ended June 30. To get the report, visit either vanguard.com/proxyreporting or www.sec.gov.
You can review information about your fund on the SEC’s website, and you can receive copies of this information, for a fee, by sending a request via email addressed to publicinfo@sec.gov.
Source for Bloomberg Barclays indexes: Bloomberg Index Services Limited. Copyright 2021, Bloomberg. All rights reserved.
| © 2021 The Vanguard Group, Inc. | |
| All rights reserved. | |
| Vanguard Marketing Corporation, Distributor. | |
| Q44190 012021 |

| Annual Report | November 30, 2020 | |
| Vanguard U.S. Multifactor Fund | |
| Contents | |
| Your Fund’s Performance at a Glance | 1 |
| Advisor’s Report | 2 |
| About Your Fund’s Expenses | 4 |
| Performance Summary | 6 |
| Financial Statements | 8 |
Please note: The opinions expressed in this report are just that—informed opinions. They should not be considered promises or advice. Also, please keep in mind that the information and opinions cover the period through the date on the front of this report. Of course, the risks of investing in your fund are spelled out in the prospectus.
Your Fund’s Performance at a Glance
• Vanguard U.S. Multifactor Fund returned 0.97% for the 12 months ended November 30, 2020. It underperformed its benchmark, the Russell 3000 Index, which returned 19.02%.
• The fund seeks to provide long-term capital appreciation by investing in stocks that have relatively strong recent performance, strong fundamentals, and low prices relative to broad U.S. equity market fundamentals as determined by the advisor.
• Seven of the fund’s 11 industry sectors dampened relative performance, as the environment over the 12 months tended to favor momentum stocks over more balanced portfolios.
• Selection in consumer discretionary stocks drove much of the fund’s underperformance. Underweight positions and poor selection in technology and financials also hurt. The fund benefited from underweights in real estate and utilities.
| Market Barometer | |||
| Average Annual Total Returns | |||
| Periods Ended November 30, 2020 | |||
| One Year | Three Years | Five Years | |
| Stocks | |||
| Russell 1000 Index (Large-caps) | 19.41% | 13.66% | 14.23% |
| Russell 2000 Index (Small-caps) | 13.59 | 7.09 | 10.25 |
| Russell 3000 Index (Broad U.S. market) | 19.02 | 13.20 | 13.95 |
| FTSE All-World ex US Index (International) | 10.01 | 4.12 | 7.62 |
| Bonds | |||
| Bloomberg Barclays
U.S. Aggregate Bond Index (Broad taxable market) |
7.28% | 5.45% | 4.34% |
| Bloomberg Barclays
Municipal Bond Index (Broad tax-exempt market) |
4.89 | 4.80 | 3.93 |
| FTSE Three-Month U.S. Treasury Bill Index | 0.72 | 1.59 | 1.16 |
| CPI | |||
| Consumer Price Index | 1.17% | 1.80% | 1.86% |
1
Advisor’s Report
Vanguard U.S. Multifactor Fund returned 0.97% for the 12 months ended November 30, 2020. It underperformed its benchmark, the Russell 3000 Index, which returned 19.02%.
The fund seeks to create a portfolio with broad equity exposure and the potential for long-term capital appreciation by investing in stocks with relatively strong recent performance, strong fundamentals, and low prices relative to fundamentals. To promote diversification and to mitigate exposure to less liquid and more volatile stocks, a rules-based screen is applied to the universe of all U.S. large-, mid-, and small-capitalization stocks. We then evaluate the remaining securities based on exposure to momentum, quality, and value factors.
The investment environment
The fiscal year was marked by the global spread of COVID-19 and efforts to contain it. After a sharp, pandemic-related decline earlier in 2020, global stocks began a rebound in March that continued throughout most of the period.
Massive fiscal and monetary support from governments and central banks, signs of economic healing, and reported progress toward a COVID-19 vaccine all buoyed the markets. The U.S. Federal Reserve continued its supportive policy, cutting rates to near zero in March to help bolster the market. At the end of the fiscal year, the market reacted positively to the U.S. presidential election and COVID-19 vaccine development with strong performance throughout November.
For the 12 months, the FTSE Global All Cap Index returned 15.10%. The U.S. stock market returned 17.46%, as measured by the Standard & Poor’s 500 Index, outperforming emerging markets and especially developed markets outside the United States. Large-cap stocks bested small-caps, and growth stocks outpaced value.
The fund’s successes and shortfalls
The fund’s exposure to small-cap and value stocks dampened returns. Investors also tended to favor more concentrated positions in momentum and other factors at various points of the year. As a result, seven of the fund’s 11 industry sectors detracted from relative performance. Holdings in consumer discretionary, technology, and financial stocks retreated the most. Our underweight positions and poor selection in technology and financials were among the biggest reasons the fund underperformed, as was poor selection in consumer discretionary.
At the stock level, not holding Berkshire Hathaway (financials), Boeing (industrials), and ExxonMobil (energy) helped results, as did our underweight position in Coca Cola (consumer staples) and overweight in Target (consumer discretionary). Having no exposure to Tesla (consumer discretionary) during the period hurt results.
2
Underweights in Amazon (consumer discretionary), Microsoft (information technology), and Apple (information technology) also detracted, as did an overweight in Delta Air Lines (industrials).
We expect our approach to portfolio construction to produce long-term capital appreciation that reflects the factors emphasized by the fund. Results will vary over different periods across the different factors. However, we believe that focusing on the risk-adjusted returns of the portfolio relative to its targeted factors and the benchmark will serve investors well over time.
We thank you for your investment and look forward to serving you in the period ahead.
Antonio Picca, Senior Portfolio Manager,
Head of Factor-Based Strategies
Vanguard Quantitative Equity Group
December 14, 2020
3
About Your Fund’s Expenses
As a shareholder of the fund, you incur ongoing costs, which include costs for portfolio management, administrative services, and shareholder reports (like this one), among others. Operating expenses, which are deducted from a fund’s gross income, directly reduce the investment return of the fund.
A fund’s expenses are expressed as a percentage of its average net assets. This figure is known as the expense ratio. The following examples are intended to help you understand the ongoing costs (in dollars) of investing in your fund and to compare these costs with those of other mutual funds. The examples are based on an investment of $1,000 made at the beginning of the period shown and held for the entire period.
The accompanying table illustrates your fund’s costs in two ways:
• Based on actual fund return. This section helps you to estimate the actual expenses that you paid over the period. The “Ending Account Value” shown is derived from the fund’s actual return, and the third column shows the dollar amount that would have been paid by an investor who started with $1,000 in the fund. You may use the information here, together with the amount you invested, to estimate the expenses that you paid over the period.
To do so, simply divide your account value by $1,000 (for example, an $8,600 account value divided by $1,000 = 8.6), then multiply the result by the number given for your fund under the heading “Expenses Paid During Period.”
• Based on hypothetical 5% yearly return. This section is intended to help you compare your fund’s costs with those of other mutual funds. It assumes that the fund had a yearly return of 5% before expenses, but that the expense ratio is unchanged. In this case—because the return used is not the fund’s actual return—the results do not apply to your investment. The example is useful in making comparisons because the Securities and Exchange Commission requires all mutual funds to calculate expenses based on a 5% return. You can assess your fund’s costs by comparing this hypothetical example with the hypothetical examples that appear in shareholder reports of other funds.
Note that the expenses shown in the table are meant to highlight and help you compare ongoing costs only and do not reflect transaction costs incurred by the fund for buying and selling securities. Further, the expenses do not include any purchase, redemption, or account service fees described in the fund prospectus. If such fees were applied to your account, your costs would be higher. Your fund does not carry a “sales load.”
The calculations assume no shares were bought or sold during the period. Your actual costs may have been higher or lower, depending on the amount of your investment and the timing of any purchases or redemptions.
You can find more information about the fund’s expenses, including annual expense ratios, in the Financial Statements section of this report. For additional information on operating expenses and other shareholder costs, please refer to your fund’s current prospectus.
4
| Six Months Ended November 30, 2020 | |||
| Beginning | Ending | Expenses | |
| Account Value | Account Value | Paid During | |
| U.S. Multifactor Fund | 5/31/2020 | 11/30/2020 | Period |
| Based on Actual Fund Return | $1,000.00 | $1,199.06 | $0.99 |
| Based on Hypothetical 5% Yearly Return | 1,000.00 | 1,024.10 | 0.91 |
The calculations are based on expenses incurred in the most recent six-month period. The fund’s annualized six-month expense ratio for the period is 0.18%. The dollar amounts shown as “Expenses Paid” are equal to the annualized expense ratio multiplied by the average account value over the period, multiplied by the number of days in the most recent six-month period, then divided by the number of days in the most recent 12-month period (183/366).
5
U.S. Multifactor Fund
Performance Summary
All of the returns in this report represent past performance, which is not a guarantee of future results that may be achieved by the fund. (Current performance may be lower or higher than the performance data cited. For performance data current to the most recent month-end, visit our website at vanguard.com/performance.) Note, too, that both investment returns and principal value can fluctuate widely, so an investor’s shares, when sold, could be worth more or less than their original cost. The returns shown do not reflect taxes that a shareholder would pay on fund distributions or on the sale of fund shares.
Cumulative Performance: February 15, 2018, Through November 30, 2020
Initial Investment of $50,000

| Average Annual Total Returns | ||||
| Periods Ended November 30, 2020 | ||||
| Since | Final Value | |||
| One | Inception | of a $50,000 | ||
| Year | (2/15/2018) | Investment | ||
 |
U.S. Multifactor Fund | 0.97% | 2.24% | $53,192 |
 |
Russell 3000 Index | 19.02 | 13.01 | 70,329 |
“Since Inception” performance is calculated from the fund’s inception date for both the fund and its comparative standard(s).
See Financial Highlights for dividend and capital gains information.
6
U.S. Multifactor Fund
Fund Allocation
As of November 30, 2020
| Basic Materials | 4.9% |
| Consumer Discretionary | 25.7 |
| Consumer Staples | 5.4 |
| Energy | 1.7 |
| Financials | 14.7 |
| Health Care | 11.0 |
| Industrials | 19.6 |
| Real Estate | 0.2 |
| Technology | 15.3 |
| Telecommunications | 1.5 |
| Utilities | 0.0 |
The table reflects the fund’s investments, except for short-term investments and derivatives. Sector categories are based on the Industry Classification Benchmark (“ICB”), except for the “Other” category (if applicable), which includes securities that have not been provided an ICB classification as of the effective reporting period.
The Industry Classification Benchmark (“ICB”) is owned by FTSE. FTSE does not accept any liability to any person for any loss or damage arising out of any error or omission in the ICB.
7
U.S. Multifactor Fund
Financial Statements
Schedule of Investments
As of November 30, 2020
The fund files its complete schedule of portfolio holdings with the Securities and Exchange Commission (SEC) for the first and third quarters of each fiscal year as an exhibit to its reports on Form N-PORT. The fund’s Form N-PORT reports are available on the SEC’s website at www.sec.gov.
| Market | ||||
| Value• | ||||
| Shares | ($000) | |||
| Common Stocks (99.0%) | ||||
| Basic Materials (4.8%) | ||||
| Newmont Corp. | 2,734 | 161 | ||
| Southern Copper Corp. | 2,112 | 125 | ||
| Linde plc | 367 | 94 | ||
| Dow Inc. | 1,739 | 92 | ||
| UFP Industries Inc. | 1,477 | 79 | ||
| Reliance Steel & Aluminum Co. | 596 | 70 | ||
| Timken Co. | 823 | 60 | ||
| Commercial Metals Co. | 2,470 | 49 | ||
| FMC Corp. | 393 | 46 | ||
| Boise Cascade Co. | 954 | 41 | ||
| Freeport-McMoRan Inc. | 1,755 | 41 | ||
| Stepan Co. | 347 | 40 | ||
| Rexnord Corp. | 1,036 | 39 | ||
| Glatfelter Corp. | 2,123 | 34 | ||
| LyondellBasell Industries NV Class A | 371 | 32 | ||
| Steel Dynamics Inc. | 856 | 31 | ||
| Schweitzer-Mauduit International Inc. | 886 | 31 | ||
| Fastenal Co. | 556 | 28 | ||
| Scotts Miracle-Gro Co. | 156 | 27 | ||
| Gold Resource Corp. | 8,472 | 25 | ||
| Worthington Industries Inc. | 462 | 24 | ||
| * | GCP Applied Technologies Inc. | 707 | 17 | |
| Domtar Corp. | 525 | 16 | ||
| Compass Minerals International Inc. | 206 | 13 | ||
| CF Industries Holdings Inc. | 313 | 12 | ||
| Element Solutions Inc. | 783 | 11 | ||
| Innospec Inc. | 115 | 10 | ||
| GrafTech International Ltd. | 906 | 7 | ||
| Valvoline Inc. | 306 | 7 | ||
| Materion Corp. | 91 | 5 | ||
| 1,267 | ||||
| Consumer Discretionary (25.5%) | ||||
| Target Corp. | 1,683 | 302 | ||
| eBay Inc. | 4,677 | 236 | ||
| Walmart Inc. | 1,442 | 220 | ||
| Lowe’s Cos. Inc. | 1,212 | 189 | ||
| * | Electronic Arts Inc. | 1,260 | 161 | |
| * | Lululemon Athletica Inc. | 387 | 143 | |
| Activision Blizzard Inc. | 1,722 | 137 | ||
| * | Amazon.com Inc. | 43 | 136 | |
| Home Depot Inc. | 456 | 127 | ||
| Williams-Sonoma Inc. | 1,011 | 111 | ||
| * | Deckers Outdoor Corp. | 412 | 105 | |
| Dollar General Corp. | 478 | 104 | ||
| Lennar Corp. Class A | 1,353 | 103 | ||
| Acushnet Holdings Corp. | 2,663 | 100 | ||
| * | NVR Inc. | 23 | 92 | |
| Best Buy Co. Inc. | 760 | 83 | ||
| Whirlpool Corp. | 422 | 82 | ||
| PulteGroup Inc. | 1,747 | 76 | ||
| Rent-A-Center Inc. | 2,166 | 73 | ||
| International Game Technology plc | 5,477 | 69 | ||
| Hanesbrands Inc. | 4,845 | 69 | ||
| * | Stamps.com Inc. | 363 | 68 | |
| Gentex Corp. | 2,058 | 67 | ||
| Aaron’s Holdings Co. Inc. | 1,061 | 67 | ||
| Johnson Outdoors Inc. Class A | 784 | 66 | ||
| L Brands Inc. | 1,665 | 65 | ||
| Group 1 Automotive Inc. | 537 | 64 | ||
| Costco Wholesale Corp. | 162 | 63 | ||
| * | Discovery Inc. Class A | 2,358 | 63 | |
| Cooper Tire & Rubber Co. | 1,594 | 63 | ||
| KB Home | 1,757 | 62 | ||
| Fortune Brands Home & Security Inc. | 710 | 59 | ||
| * | Etsy Inc. | 366 | 59 | |
| * | 1-800-Flowers.com Inc. Class A | 2,502 | 59 | |
| Big Lots Inc. | 1,117 | 58 | ||
| Sonic Automotive Inc. Class A | 1,427 | 58 | ||
| Thor Industries Inc. | 592 | 57 | ||
| * | Peloton Interactive Inc. Class A | 488 | 57 | |
| * | Century Communities Inc. | 1,255 | 56 | |
8
U.S. Multifactor Fund
| Market | ||||
| Value• | ||||
| Shares | ($000) | |||
| Lithia Motors Inc. Class A | 191 | 55 | ||
| General Motors Co. | 1,256 | 55 | ||
| Garmin Ltd. | 469 | 55 | ||
| * | Rh | 118 | 53 | |
| * | Hibbett Sports Inc. | 1,297 | 53 | |
| Toll Brothers Inc. | 1,116 | 53 | ||
| * | Lakeland Industries Inc. | 2,583 | 51 | |
| HNI Corp. | 1,379 | 50 | ||
| * | Sleep Number Corp. | 713 | 49 | |
| Murphy USA Inc. | 384 | 49 | ||
| * | MarineMax Inc. | 1,486 | 49 | |
| Standard Motor Products Inc. | 1,037 | 48 | ||
| * | Gentherm Inc. | 825 | 47 | |
| * | BJ’s Wholesale Club Holdings Inc. | 1,143 | 47 | |
| * | Sportsman’s Warehouse Holdings Inc. | 3,316 | 46 | |
| * | Meritage Homes Corp. | 512 | 46 | |
| * | Turtle Beach Corp. | 2,448 | 46 | |
| * | Malibu Boats Inc. Class A | 802 | 46 | |
| Dick’s Sporting Goods Inc. | 796 | 45 | ||
| Wyndham Destinations Inc. | 1,059 | 45 | ||
| Buckle Inc. | 1,659 | 45 | ||
| * | Universal Electronics Inc. | 814 | 43 | |
| Citi Trends Inc. | 1,262 | 43 | ||
| ODP Corp. | 1,489 | 43 | ||
| DR Horton Inc. | 571 | 43 | ||
| * | AutoNation Inc. | 692 | 42 | |
| * | CarParts.com Inc. | 2,746 | 41 | |
| * | Perdoceo Education Corp. | 3,602 | 41 | |
| * | Zumiez Inc. | 1,019 | 38 | |
| * | MasterCraft Boat Holdings Inc. | 1,709 | 37 | |
| * | Ollie’s Bargain Outlet Holdings Inc. | 420 | 37 | |
| Tractor Supply Co. | 260 | 37 | ||
| Rush Enterprises Inc. Class A | 954 | 37 | ||
| * | Take-Two Interactive Software Inc. | 200 | 36 | |
| * | TRI Pointe Group Inc. | 2,047 | 36 | |
| * | Glu Mobile Inc. | 3,500 | 35 | |
| * | Purple Innovation Inc. Class A | 1,173 | 35 | |
| * | Clean Energy Fuels Corp. | 7,659 | 35 | |
| * | Beazer Homes USA Inc. | 2,325 | 34 | |
| Polaris Inc. | 355 | 34 | ||
| NIKE Inc. Class B | 247 | 33 | ||
| * | GoPro Inc. Class A | 4,757 | 33 | |
| Newell Brands Inc. | 1,558 | 33 | ||
| Foot Locker Inc. | 871 | 33 | ||
| * | American Public Education Inc. | 1,048 | 33 | |
| Shoe Carnival Inc. | 888 | 32 | ||
| Collectors Universe Inc. | 418 | 32 | ||
| * | LKQ Corp. | 910 | 32 | |
| Dana Inc. | 1,894 | 32 | ||
| * | Asbury Automotive Group Inc. | 275 | 31 | |
| * | Vera Bradley Inc. | 3,481 | 30 | |
| Autoliv Inc. | 330 | 29 | ||
| Haverty Furniture Cos. Inc. | 1,066 | 29 | ||
| * | American Axle & Manufacturing Holdings Inc. | 3,578 | 28 | |
| * | iRobot Corp. | 350 | 27 | |
| BorgWarner Inc. | 703 | 27 | ||
| Rollins Inc. | 474 | 27 | ||
| * | XPEL Inc. | 707 | 27 | |
| * | YETI Holdings Inc. | 423 | 27 | |
| * | O’Reilly Automotive Inc. | 60 | 27 | |
| Strategic Education Inc. | 278 | 26 | ||
| * | Duluth Holdings Inc. | 1,704 | 25 | |
| Advance Auto Parts Inc. | 164 | 24 | ||
| * | LGI Homes Inc. | 223 | 24 | |
| Papa John’s International Inc. | 290 | 23 | ||
| * | Central Garden & Pet Co. Class A | 615 | 23 | |
| New York Times Co. Class A | 511 | 22 | ||
| * | Copart Inc. | 183 | 21 | |
| John Wiley & Sons Inc. Class A | 590 | 20 | ||
| * | Crocs Inc. | 342 | 20 | |
| Ethan Allen Interiors Inc. | 1,086 | 20 | ||
| * | Green Brick Partners Inc. | 897 | 20 | |
| * | K12 Inc. | 787 | 18 | |
| Movado Group Inc. | 1,036 | 18 | ||
| * | Del Taco Restaurants Inc. | 1,922 | 17 | |
| * | Mohawk Industries Inc. | 134 | 17 | |
| PriceSmart Inc. | 190 | 15 | ||
| Callaway Golf Co. | 718 | 15 | ||
| Penske Automotive Group Inc. | 256 | 14 | ||
| Abercrombie & Fitch Co. | 615 | 13 | ||
| News Corp. Class A | 696 | 12 | ||
| * | Taylor Morrison Home Corp. Class A | 471 | 12 | |
| * | Dorman Products Inc. | 128 | 12 | |
| * | Lions Gate Entertainment Corp. Class A | 1,159 | 11 | |
| Steven Madden Ltd. | 312 | 10 | ||
| Pool Corp. | 28 | 10 | ||
| Gap Inc. | 320 | 7 | ||
| Steelcase Inc. Class A | 523 | 6 | ||
| PVH Corp. | 77 | 6 | ||
| 6,672 |
9
U.S. Multifactor Fund
| Market | ||||
| Value• | ||||
| Shares | ($000) | |||
| Consumer Staples (5.4%) | ||||
| * | Monster Beverage Corp. | 1,227 | 104 | |
| General Mills Inc. | 1,563 | 95 | ||
| Weis Markets Inc. | 1,751 | 83 | ||
| McKesson Corp. | 445 | 80 | ||
| Kraft Heinz Co. | 2,360 | 78 | ||
| Casey’s General Stores Inc. | 332 | 60 | ||
| Procter & Gamble Co. | 428 | 59 | ||
| Kroger Co. | 1,771 | 58 | ||
| Ingles Markets Inc. Class A | 1,468 | 55 | ||
| AmerisourceBergen Corp. Class A | 534 | 55 | ||
| * | Helen of Troy Ltd. | 253 | 51 | |
| * | Herbalife Nutrition Ltd. | 989 | 47 | |
| * | National Beverage Corp. | 475 | 47 | |
| * | Boston Beer Co. Inc. Class A | 46 | 43 | |
| Hormel Foods Corp. | 831 | 39 | ||
| * | Hain Celestial Group Inc. | 982 | 38 | |
| Vector Group Ltd. | 3,335 | 37 | ||
| B&G Foods Inc. | 1,323 | 37 | ||
| Clorox Co. | 167 | 34 | ||
| Flowers Foods Inc. | 1,466 | 33 | ||
| ACCO Brands Corp. | 4,200 | 32 | ||
| Lancaster Colony Corp. | 169 | 29 | ||
| Campbell Soup Co. | 479 | 24 | ||
| PetMed Express Inc. | 738 | 23 | ||
| Kellogg Co. | 329 | 21 | ||
| Conagra Brands Inc. | 569 | 21 | ||
| * | Edgewell Personal Care Co. | 591 | 21 | |
| Ingredion Inc. | 245 | 19 | ||
| SpartanNash Co. | 950 | 18 | ||
| * | Sprouts Farmers Market Inc. | 725 | 15 | |
| Core-Mark Holding Co. Inc. | 482 | 15 | ||
| * | Darling Ingredients Inc. | 283 | 14 | |
| Medifast Inc. | 62 | 13 | ||
| Fresh Del Monte Produce Inc. | . 432 | 11 | ||
| 1,409 | ||||
| Energy (1.7%) | ||||
| * | SolarEdge Technologies Inc. | 261 | 73 | |
| * | Renewable Energy Group Inc. | 1,183 | 69 | |
| Arcosa Inc. | 1,126 | 58 | ||
| * | Bonanza Creek Energy Inc. | 1,887 | 42 | |
| * | First Solar Inc. | 429 | 40 | |
| Cabot Oil & Gas Corp. | 1,960 | 34 | ||
| Range Resources Corp. | 3,976 | 29 | ||
| Antero Midstream Corp. | 4,212 | 28 | ||
| EQT Corp. | 1,813 | 27 | ||
| Warrior Met Coal Inc. | 1,146 | 20 | ||
| * | Green Plains Inc. | 1,122 | 17 | |
| * | CNX Resources Corp. | 1,160 | 11 | |
| World Fuel Services Corp. | 283 | 8 | ||
| 456 | ||||
| Financials (14.5%) | ||||
| S&P Global Inc. | 649 | 228 | ||
| Moody’s Corp. | 719 | 203 | ||
| T. Rowe Price Group Inc. | 1,261 | 181 | ||
| JPMorgan Chase & Co. | 1,401 | 165 | ||
| Primerica Inc. | 948 | 123 | ||
| Allstate Corp. | 1,136 | 116 | ||
| Ameriprise Financial Inc. | 519 | 96 | ||
| Progressive Corp. | 1,082 | 94 | ||
| Bank of New York Mellon Corp. | 2,065 | 81 | ||
| Aon plc Class A | 373 | 76 | ||
| First Citizens BancShares Inc. Class A | 137 | 72 | ||
| Nelnet Inc. Class A | 1,054 | 72 | ||
| Zions Bancorp NA | 1,738 | 67 | ||
| Flagstar Bancorp Inc. | 1,909 | 67 | ||
| Hilltop Holdings Inc. | 2,758 | 66 | ||
| CNO Financial Group Inc. | 3,061 | 65 | ||
| MarketAxess Holdings Inc. | 112 | 60 | ||
| M&T Bank Corp. | 510 | 59 | ||
| HomeStreet Inc. | 1,821 | 59 | ||
| Stifel Financial Corp. | 840 | 58 | ||
| Voya Financial Inc. | 958 | 55 | ||
| Federated Hermes Inc. Class B | 2,007 | 54 | ||
| Park National Corp. | 505 | 51 | ||
| Trustmark Corp. | 2,035 | 51 | ||
| Equitable Holdings Inc. | 1,938 | 49 | ||
| HCI Group Inc. | 886 | 46 | ||
| Hanover Insurance Group Inc. | 398 | 45 | ||
| Popular Inc. | 914 | 44 | ||
| Globe Life Inc. | 472 | 44 | ||
| Northern Trust Corp. | 449 | 42 | ||
| Fulton Financial Corp. | 3,152 | 39 | ||
| BancFirst Corp. | 696 | 38 | ||
| Allegiance Bancshares Inc. | 1,156 | 37 | ||
| Home BancShares Inc. | 1,919 | 36 | ||
| Hope Bancorp Inc. | 3,542 | 34 | ||
| BlackRock Inc. | 48 | 34 | ||
| SLM Corp. | 3,120 | 33 | ||
| Bryn Mawr Bank Corp. | 1,093 | 33 | ||
| Renasant Corp. | 1,053 | 33 | ||
| Boston Private Financial Holdings Inc. | 4,435 | 32 | ||
| Federal Agricultural Mortgage Corp. Class C | 461 | 31 | ||
| International Bancshares Corp. | 949 | 31 | ||
| Walker & Dunlop Inc. | 373 | 30 | ||
| Meridian Bancorp Inc. | 2,096 | 29 | ||
| City Holding Co. | 430 | 28 | ||
10
U.S. Multifactor Fund
| Market | ||||
| Value• | ||||
| Shares | ($000) | |||
| * | Triumph Bancorp Inc. | 616 | 28 | |
| NBT Bancorp Inc. | 908 | 27 | ||
| Washington Federal Inc. | 1,157 | 27 | ||
| First Bancorp | 856 | 27 | ||
| Employers Holdings Inc. | 840 | 26 | ||
| * | StoneX Group Inc. | 409 | 25 | |
| BankUnited Inc. | 865 | 25 | ||
| Evercore Inc. Class A | 269 | 24 | ||
| Cohen & Steers Inc. | 341 | 24 | ||
| Artisan Partners Asset Management Inc. Class A | 500 | 23 | ||
| Old National Bancorp | 1,380 | 22 | ||
| TrustCo Bank Corp. NY | 3,566 | 22 | ||
| Virtu Financial Inc. Class A | 837 | 19 | ||
| AMERISAFE Inc. | 347 | 19 | ||
| Waddell & Reed Financial Inc. Class A | 1,127 | 19 | ||
| Heritage Financial Corp. | 790 | 18 | ||
| Citizens Financial Group Inc. | 548 | 18 | ||
| ServisFirst Bancshares Inc. | 465 | 18 | ||
| Atlantic Union Bankshares Corp. | 587 | 18 | ||
| Southside Bancshares Inc. | 584 | 17 | ||
| Investors Bancorp Inc. | 1,753 | 17 | ||
| Columbia Banking System Inc. | 532 | 17 | ||
| Diamond Hill Investment Group Inc. | 121 | 17 | ||
| Universal Insurance Holdings Inc. | 1,177 | 16 | ||
| CVB Financial Corp. | 860 | 16 | ||
| Radian Group Inc. | 837 | 16 | ||
| Bank of Hawaii Corp. | 207 | 16 | ||
| Essent Group Ltd. | 349 | 15 | ||
| First Hawaiian Inc. | 698 | 15 | ||
| Raymond James Financial Inc. | 157 | 14 | ||
| Bank of NT Butterfield & Son Ltd. | 430 | 14 | ||
| KeyCorp | 871 | 13 | ||
| Great Western Bancorp Inc. | 819 | 13 | ||
| Tompkins Financial Corp. | 210 | 13 | ||
| * | SVB Financial Group | 37 | 13 | |
| PennyMac Financial Services Inc. | 219 | 13 | ||
| Affiliated Managers Group Inc. | 138 | 12 | ||
| First Foundation Inc. | 658 | 12 | ||
| Cathay General Bancorp | 410 | 12 | ||
| Credicorp Ltd. | 74 | 11 | ||
| Central Pacific Financial Corp. | 662 | 11 | ||
| WSFS Financial Corp. | 274 | 10 | ||
| FirstCash Inc. | 161 | 10 | ||
| Synovus Financial Corp. | 306 | 10 | ||
| * | Credit Acceptance Corp. | 31 | 9 | |
| Erie Indemnity Co. Class A | 41 | 9 | ||
| Assured Guaranty Ltd. | 306 | 9 | ||
| First Busey Corp. | 460 | 9 | ||
| Ameris Bancorp | 211 | 7 | ||
| Unum Group | 292 | 6 | ||
| 3,808 | ||||
| Health Care (10.9%) | ||||
| Humana Inc. | 499 | 200 | ||
| * | Biogen Inc. | 741 | 178 | |
| Johnson & Johnson | 1,180 | 171 | ||
| HCA Healthcare Inc. | 1,132 | 170 | ||
| UnitedHealth Group Inc. | 485 | 163 | ||
| Anthem Inc. | 453 | 141 | ||
| * | Regeneron Pharmaceuticals Inc. | 255 | 132 | |
| * | DaVita Inc. | 840 | 92 | |
| * | United Therapeutics Corp. | 593 | 79 | |
| Eli Lilly and Co. | 514 | 75 | ||
| * | Molina Healthcare Inc. | 334 | 68 | |
| * | Corcept Therapeutics Inc. | 2,997 | 68 | |
| * | Medpace Holdings Inc. | 521 | 67 | |
| * | Vertex Pharmaceuticals Inc. | 293 | 67 | |
| Abbott Laboratories | 558 | 60 | ||
| * | Masimo Corp. | 223 | 57 | |
| * | Quidel Corp. | 284 | 55 | |
| * | Providence Service Corp. | 378 | 51 | |
| * | Jazz Pharmaceuticals plc | 357 | 50 | |
| Chemed Corp. | 105 | 50 | ||
| * | Emergent BioSolutions Inc. | 565 | 46 | |
| * | LHC Group Inc. | 224 | 44 | |
| Patterson Cos. Inc. | 1,486 | 41 | ||
| Cardinal Health Inc. | 722 | 40 | ||
| * | Henry Schein Inc. | 612 | 39 | |
| * | Catalyst Pharmaceuticals Inc. | 10,662 | 39 | |
| Cerner Corp. | 473 | 35 | ||
| * | Amneal Pharmaceuticals Inc. | 8,928 | 35 | |
| AbbVie Inc. | 335 | 35 | ||
| * | Amedisys Inc. | 142 | 35 | |
| * | Meridian Bioscience Inc. | 1,798 | 34 | |
| Pfizer Inc. | 791 | 30 | ||
| * | Exelixis Inc. | 1,561 | 30 | |
| West Pharmaceutical Services Inc. | 96 | 27 | ||
| Thermo Fisher Scientific Inc. | 55 | 26 | ||
| * | ABIOMED Inc. | 89 | 24 | |
| * | OPKO Health Inc. | 5,041 | 23 | |
| Quest Diagnostics Inc. | 185 | 23 | ||
| * | Triple-S Management Corp. Class B | 1,021 | 23 | |
| * | Alexion Pharmaceuticals Inc. | 177 | 22 | |
11
U.S. Multifactor Fund
| Market | ||||
| Value• | ||||
| Shares | ($000) | |||
| * | Bio-Rad Laboratories Inc. Class A | 40 | 22 | |
| * | Retractable Technologies Inc. | 1,770 | 21 | |
| * | Tenet Healthcare Corp. | 568 | 18 | |
| Healthcare Services Group Inc. | 687 | 16 | ||
| * | OraSure Technologies Inc. | 1,336 | 16 | |
| * | Align Technology Inc. | 33 | 16 | |
| * | AdaptHealth Corp. Class A | 514 | 15 | |
| * | Prestige Consumer Healthcare Inc. | 369 | 13 | |
| * | Viatris Inc. | 600 | 10 | |
| ResMed Inc. | 48 | 10 | ||
| * | STAAR Surgical Co. | 139 | 10 | |
| Luminex Corp. | 320 | 8 | ||
| * | Merit Medical Systems Inc. | 121 | 7 | |
| Ensign Group Inc. | 87 | 6 | ||
| * | Globus Medical Inc. | 90 | 5 | |
| * | Innoviva Inc. | 496 | 5 | |
| 2,843 | ||||
| Industrials (19.4%) | ||||
| FedEx Corp. | 609 | 175 | ||
| Eaton Corp. plc | 1,080 | 131 | ||
| * | Zebra Technologies Corp. | 312 | 118 | |
| * | TopBuild Corp. | 639 | 111 | |
| United Parcel Service Inc. Class B | 614 | 105 | ||
| MSC Industrial Direct Co. Inc. Class A | 1,248 | 104 | ||
| Caterpillar Inc. | 458 | 79 | ||
| AGCO Corp. | 858 | 79 | ||
| Accenture plc Class A | 316 | 79 | ||
| Marten Transport Ltd. | 4,313 | 76 | ||
| * | Crown Holdings Inc. | 796 | 75 | |
| Cummins Inc. | 324 | 75 | ||
| Emerson Electric Co. | 959 | 74 | ||
| Schneider National Inc. Class B | 3,374 | 71 | ||
| Illinois Tool Works Inc. | 322 | 68 | ||
| ManpowerGroup Inc. | 780 | 68 | ||
| * | Hub Group Inc. Class A | 1,213 | 66 | |
| PACCAR Inc. | 747 | 65 | ||
| * | FTI Consulting Inc. | 615 | 65 | |
| * | Trex Co. Inc. | 840 | 63 | |
| CSW Industrials Inc. | 584 | 63 | ||
| Snap-on Inc. | 334 | 59 | ||
| * | Saia Inc. | 334 | 58 | |
| Badger Meter Inc. | 703 | 58 | ||
| Brunswick Corp. | 739 | 55 | ||
| Quanta Services Inc. | 782 | 53 | ||
| Dover Corp. | 425 | 52 | ||
| Regal Beloit Corp. | 431 | 51 | ||
| Knight-Swift Transportation Holdings Inc. | 1,207 | 50 | ||
| Quanex Building Products Corp. | 2,298 | 47 | ||
| Owens Corning | 649 | 47 | ||
| McGrath RentCorp | 742 | 47 | ||
| Louisiana-Pacific Corp. | 1,377 | 47 | ||
| * | Great Lakes Dredge & Dock Corp. | 4,171 | 47 | |
| ITT Inc. | 645 | 47 | ||
| Simpson Manufacturing Co. Inc. | 508 | 47 | ||
| Triton International Ltd. | 1,023 | 46 | ||
| * | MYR Group Inc. | 896 | 46 | |
| * | TriNet Group Inc. | 608 | 46 | |
| MSA Safety Inc. | 305 | 46 | ||
| Old Dominion Freight Line Inc. | 220 | 45 | ||
| Watts Water Technologies Inc. Class A | 380 | 45 | ||
| * | Generac Holdings Inc. | 206 | 44 | |
| * | Gibraltar Industries Inc. | 674 | 44 | |
| Hubbell Inc. Class B | 270 | 44 | ||
| * | United Rentals Inc. | 189 | 43 | |
| Astec Industries Inc. | 727 | 42 | ||
| Kforce Inc. | 1,003 | 41 | ||
| Kronos Worldwide Inc. | 2,989 | 41 | ||
| Landstar System Inc. | 301 | 40 | ||
| WW Grainger Inc. | 94 | 39 | ||
| * | Masonite International Corp. | 380 | 38 | |
| * | Modine Manufacturing Co. | 3,461 | 38 | |
| * | WESCO International Inc. | 570 | 37 | |
| Encore Wire Corp. | 715 | 37 | ||
| JB Hunt Transport Services Inc. | 271 | 37 | ||
| CoreLogic Inc. | 473 | 37 | ||
| Masco Corp. | 679 | 36 | ||
| Kansas City Southern | 195 | 36 | ||
| Argan Inc. | 782 | 36 | ||
| Ennis Inc. | 2,172 | 36 | ||
| Franklin Electric Co. Inc. | 516 | 35 | ||
| Silgan Holdings Inc. | 1,029 | 35 | ||
| Packaging Corp. of America | 264 | 34 | ||
| Acuity Brands Inc. | 288 | 34 | ||
| Columbus McKinnon Corp. | 875 | 33 | ||
| Nordic American Tankers Ltd. | 10,344 | 33 | ||
| * | Covenant Transportation Group Inc. Class A | 1,759 | 33 | |
| Jack Henry & Associates Inc. | 202 | 32 | ||
| DHT Holdings Inc. | 6,340 | 32 | ||
| Werner Enterprises Inc. | 789 | 32 | ||
| *,1 | API Group Corp. | 1,965 | 30 | |
| ArcBest Corp. | 725 | 30 | ||
12
U.S. Multifactor Fund
| Market | ||||
| Value• | ||||
| Shares | ($000) | |||
| * | XPO Logistics Inc. | 284 | 30 | |
| Lockheed Martin Corp. | 83 | 30 | ||
| Watsco Inc. | 132 | 30 | ||
| Rockwell Automation Inc. | 115 | 29 | ||
| * | Textainer Group Holdings Ltd. | 1,575 | 29 | |
| * | Sykes Enterprises Inc. | 753 | 28 | |
| AAON Inc. | 424 | 28 | ||
| Kadant Inc. | 215 | 27 | ||
| * | Berry Global Group Inc. | 510 | 27 | |
| Northrop Grumman Corp. | 88 | 27 | ||
| Apogee Enterprises Inc. | 1,006 | 26 | ||
| Graphic Packaging Holding Co. | 1,693 | 26 | ||
| * | Echo Global Logistics Inc. | 895 | 25 | |
| MKS Instruments Inc. | 170 | 23 | ||
| * | Vicor Corp. | 285 | 23 | |
| Kennametal Inc. | 661 | 23 | ||
| Primoris Services Corp. | 950 | 23 | ||
| Kelly Services Inc. Class A | 1,085 | 22 | ||
| Johnson Controls International plc | 463 | 21 | ||
| CAI International Inc. | 665 | 21 | ||
| * | FARO Technologies Inc. | 312 | 21 | |
| * | Construction Partners Inc. Class A | 762 | 20 | |
| Shyft Group Inc. | 771 | 20 | ||
| * | SPX Corp. | 386 | 20 | |
| Myers Industries Inc. | 1,162 | 20 | ||
| * | Builders FirstSource Inc. | 520 | 19 | |
| Valmont Industries Inc. | 115 | 19 | ||
| Costamare Inc. | 2,586 | 19 | ||
| * | Proto Labs Inc. | 134 | 19 | |
| * | MasTec Inc. | 326 | 18 | |
| UniFirst Corp. | 97 | 18 | ||
| Robert Half International Inc. | 266 | 17 | ||
| EMCOR Group Inc. | 195 | 17 | ||
| * | ASGN Inc. | 214 | 17 | |
| Patrick Industries Inc. | 264 | 17 | ||
| * | TrueBlue Inc. | 869 | 17 | |
| * | Vivint Smart Home Inc. | 748 | 16 | |
| Sonoco Products Co. | 276 | 16 | ||
| RPM International Inc. | 180 | 16 | ||
| ADT Inc. | 2,004 | 16 | ||
| ABM Industries Inc. | 403 | 16 | ||
| * | American Woodmark Corp. | 176 | 15 | |
| * | SPX FLOW Inc. | 283 | 15 | |
| Resources Connection Inc. | 1,178 | 14 | ||
| Heartland Express Inc. | 741 | 14 | ||
| Oshkosh Corp. | 157 | 13 | ||
| Federal Signal Corp. | 394 | 12 | ||
| CH Robinson Worldwide Inc. | 127 | 12 | ||
| Powell Industries Inc. | 444 | 11 | ||
| * | Aerojet Rocketdyne Holdings Inc. | 246 | 9 | |
| Greif Inc. Class A | 178 | 9 | ||
| Crane Co. | 124 | 9 | ||
| Comfort Systems USA Inc. | 150 | 8 | ||
| * | Ferro Corp. | 507 | 7 | |
| PPG Industries Inc. | 49 | 7 | ||
| * | Mettler-Toledo International Inc. | 6 | 7 | |
| * | Cimpress plc | 75 | 7 | |
| * | Meritor Inc. | 233 | 6 | |
| Sherwin-Williams Co. | 8 | 6 | ||
| * | Atkore International Group Inc. | 151 | 6 | |
| MAXIMUS Inc. | 76 | 5 | ||
| Exponent Inc. | 63 | 5 | ||
| Greenbrier Cos. Inc. | 155 | 5 | ||
| 5,086 | ||||
| Real Estate (0.2%) | ||||
| St. Joe Co. | 779 | 26 | ||
| GEO Group Inc. | 1,635 | 15 | ||
| Iron Mountain Inc. | 199 | 6 | ||
| 47 | ||||
| Technology (15.1%) | ||||
| Apple Inc. | 2,268 | 270 | ||
| Microsoft Corp. | 987 | 211 | ||
| * | Facebook Inc. Class A | 707 | 196 | |
| * | Advanced Micro Devices Inc. | 1,811 | 168 | |
| Intel Corp. | 3,057 | 148 | ||
| * | Micron Technology Inc. | 1,993 | 128 | |
| Teradyne Inc. | 1,086 | 120 | ||
| * | Adobe Inc. | 240 | 115 | |
| * | Qorvo Inc. | 729 | 114 | |
| Cognizant Technology Solutions Corp. Class A | 1,450 | 113 | ||
| * | Alphabet Inc. Class A | 62 | 109 | |
| * | Diodes Inc. | 1,304 | 89 | |
| KLA Corp. | 345 | 87 | ||
| Texas Instruments Inc. | 534 | 86 | ||
| SYNNEX Corp. | 494 | 79 | ||
| NVIDIA Corp. | 139 | 74 | ||
| * | Lattice Semiconductor Corp. | 1,579 | 66 | |
| Jabil Inc. | 1,428 | 55 | ||
| Applied Materials Inc. | 661 | 54 | ||
| Skyworks Solutions Inc. | 377 | 53 | ||
| PC Connection Inc. | 1,164 | 53 | ||
| * | Yandex NV Class A | 759 | 52 | |
| * | FormFactor Inc. | 1,207 | 49 | |
| * | Synaptics Inc. | 632 | 49 | |
| Vishay Intertechnology Inc. | 2,536 | 49 | ||
| NortonLifeLock Inc. | 2,658 | 48 | ||
13
U.S. Multifactor Fund
| Market | ||||
| Value• | ||||
| Shares | ($000) | |||
| International Business Machines Corp. | 375 | 46 | ||
| * | TechTarget Inc. | 839 | 44 | |
| * | Check Point Software Technologies Ltd. | 372 | 44 | |
| Lam Research Corp. | 96 | 43 | ||
| Seagate Technology plc | 700 | 41 | ||
| HP Inc. | 1,820 | 40 | ||
| TE Connectivity Ltd. | 342 | 39 | ||
| * | Fortinet Inc. | 310 | 38 | |
| * | II-VI Inc. | 560 | 38 | |
| * | Nuance Communications Inc. | 858 | 37 | |
| * | Super Micro Computer Inc. | 1,278 | 36 | |
| Intuit Inc. | 101 | 36 | ||
| Simulations Plus Inc. | 629 | 35 | ||
| * | SPS Commerce Inc. | 340 | 35 | |
| * | Qualys Inc. | 331 | 31 | |
| * | Fabrinet | 457 | 31 | |
| * | Photronics Inc. | 2,689 | 31 | |
| Avnet Inc. | 1,008 | 31 | ||
| Monolithic Power Systems Inc. | 94 | 30 | ||
| Computer Programs and Systems Inc. | 1,054 | 30 | ||
| Hackett Group Inc. | 2,074 | 29 | ||
| * | NetScout Systems Inc. | 1,173 | 27 | |
| Shutterstock Inc. | 392 | 27 | ||
| Methode Electronics Inc. | 734 | 26 | ||
| * | Cirrus Logic Inc. | 319 | 26 | |
| * | Calix Inc. | 1,079 | 26 | |
| Citrix Systems Inc. | 206 | 26 | ||
| Xerox Holdings Corp. | 1,127 | 25 | ||
| * | ePlus Inc. | 279 | 24 | |
| * | Sanmina Corp. | 735 | 23 | |
| * | Mitek Systems Inc. | 1,974 | 23 | |
| Power Integrations Inc. | 288 | 21 | ||
| * | CACI International Inc. Class A | 85 | 20 | |
| * | TrueCar Inc. | 4,892 | 20 | |
| * | Manhattan Associates Inc. | 192 | 20 | |
| * | Cadence Design Systems Inc. | 168 | 20 | |
| * | IPG Photonics Corp. | 94 | 19 | |
| QUALCOMM Inc. | 131 | 19 | ||
| * | Plexus Corp. | 250 | 19 | |
| * | Rambus Inc. | 1,178 | 18 | |
| * | OneSpan Inc. | 892 | 18 | |
| * | Paycom Software Inc. | 42 | 17 | |
| * | Axcelis Technologies Inc. | 630 | 17 | |
| * | Dell Technologies Inc. | 225 | 16 | |
| * | Perficient Inc. | 319 | 15 | |
| * | Covetrus Inc. | 482 | 13 | |
| * | Unisys Corp. | 863 | 13 | |
| * | Match Group Inc. | 78 | 11 | |
| * | A10 Networks Inc. | 984 | 8 | |
| * | Vertiv Holdings Co. Class A | 277 | 5 | |
| 3,962 | ||||
| Telecommunications (1.5%) | ||||
| Cisco Systems Inc. | 2,414 | 104 | ||
| AT&T Inc. | 2,649 | 76 | ||
| * | Lumentum Holdings Inc. | 632 | 54 | |
| Verizon Communications Inc. | 893 | 54 | ||
| * | Ciena Corp. | 795 | 36 | |
| CenturyLink Inc. | 2,826 | 29 | ||
| * | NETGEAR Inc. | 870 | 28 | |
| 381 | ||||
| Utilities (0.0%) | ||||
| * | Evoqua Water Technologies Corp. | 428 | 11 | |
| Total Common Stocks (Cost $21,656) |
25,942 | |||
| Temporary Cash Investment (1.0%) | ||||
| Money Market Fund (1.0%) | ||||
| 2 | Vanguard Market Liquidity Fund, 0.109% (Cost $255) | 2,550 | 255 | |
| Total Investments (100.0%) (Cost $21,911) |
26,197 | |||
| Other Assets and Liabilities — Net (0.0%) | (9) | |||
| Net Assets (100%) | 26,188 | |||
Cost is in $000.
| • | See Note A in Notes to Financial Statements. |
| * | Non-income-producing security. |
| 1 | Security exempt from registration under Rule 144A of the Securities Act of 1933. Such securities may be sold in transactions exempt from registration, normally to qualified institutional buyers. At November 30, 2020, the value of this security represented 0.1% of net assets. |
| 2 | Affiliated money market fund available only to Vanguard funds and certain trusts and accounts managed by Vanguard. Rate shown is the 7-day yield. |
14
U.S. Multifactor Fund
| Derivative Financial Instruments Outstanding as of Period End | ||||
| Futures Contracts | ||||
| ($000) | ||||
| Value and | ||||
| Number of | Unrealized | |||
| Long (Short) | Notional | Appreciation | ||
| Expiration | Contracts | Amount | (Depreciation) | |
| Long Futures Contracts | ||||
| Micro E-mini S&P 500 Index | December 2020 | 13 | 236 | 2 |
See accompanying Notes, which are an integral part of the Financial Statements.
15
U.S. Multifactor Fund
Statement of Assets and Liabilities
As of November 30, 2020
| ($000s, except shares and per-share amounts) | Amount |
| Assets | |
| Investments in Securities, at Value | |
| Unaffiliated Issuers (Cost $21,656) | 25,942 |
| Affiliated Issuers (Cost $255) | 255 |
| Total Investments in Securities | 26,197 |
| Investment in Vanguard | 1 |
| Cash Collateral Pledged—Futures Contracts | 21 |
| Receivables for Accrued Income | 40 |
| Receivables for Capital Shares Issued | 8 |
| Total Assets | 26,267 |
| Liabilities | |
| Due to Custodian | 1 |
| Payables for Capital Shares Redeemed | 75 |
| Payables to Vanguard | 2 |
| Variation Margin Payable—Futures Contracts | 1 |
| Total Liabilities | 79 |
| Net Assets | 26,188 |
| At November 30, 2020, net assets consisted of: | |
| Paid-in Capital | 27,302 |
| Total Distributable Earnings (Loss) | (1,114) |
| Net Assets | 26,188 |
| Net Assets | |
| Applicable to 1,028,223 outstanding $.001 par value shares of beneficial interest (unlimited authorization) | 26,188 |
| Net Asset Value Per Share | $25.47 |
See accompanying Notes, which are an integral part of the Financial Statements.
16
U.S. Multifactor Fund
Statement of Operations
| Year Ended | |
| November 30, 2020 | |
| ($000) | |
| Investment Income | |
| Income | |
| Dividends | 478 |
| Interest1 | 3 |
| Total Income | 481 |
| Expenses | |
| The Vanguard Group—Note B | |
| Investment Advisory Services | — |
| Management and Administrative | 11 |
| Marketing and Distribution | — |
| Custodian Fees | 5 |
| Auditing Fees | 30 |
| Shareholders’ Reports | 1 |
| Trustees’ Fees and Expenses | — |
| Total Expenses | 47 |
| Net Investment Income | 434 |
| Realized Net Gain (Loss) | |
| Investment Securities Sold1 | (2,753) |
| Futures Contracts | (8) |
| Realized Net Gain (Loss) | (2,761) |
| Change in Unrealized Appreciation (Depreciation) | |
| Investment Securities1 | 1,339 |
| Futures Contracts | (3) |
| Change in Unrealized Appreciation (Depreciation) | 1,336 |
| Net Increase (Decrease) in Net Assets Resulting from Operations | (991) |
| 1 | Interest income, realized net gain (loss), and change in unrealized appreciation (depreciation) from an affiliated company of the fund were $3,000, $0, and $0, respectively. Purchases and sales are for temporary cash investment purposes. |
See accompanying Notes, which are an integral part of the Financial Statements.
17
U.S. Multifactor Fund
Statement of Changes in Net Assets
| Year Ended November 30, | ||
| 2020 | 2019 | |
| ($000) | ($000) | |
| Increase (Decrease) in Net Assets | ||
| Operations | ||
| Net Investment Income | 434 | 591 |
| Realized Net Gain (Loss) | (2,761) | (2,236) |
| Change in Unrealized Appreciation (Depreciation) | 1,336 | 3,723 |
| Net Increase (Decrease) in Net Assets Resulting from Operations | (991) | 2,078 |
| Distributions1 | ||
| Total Distributions | (472) | (566) |
| Capital Share Transactions | ||
| Issued | 11,365 | 19,938 |
| Issued in Lieu of Cash Distributions | 380 | 459 |
| Redeemed | (17,034) | (24,560) |
| Net Increase (Decrease) from Capital Share Transactions | (5,289) | (4,163) |
| Total Increase (Decrease) | (6,752) | (2,651) |
| Net Assets | ||
| Beginning of Period | 32,940 | 35,591 |
| End of Period | 26,188 | 32,940 |
1 Certain prior-period numbers have been reclassified to conform with the current-period presentation.
See accompanying Notes, which are an integral part of the Financial Statements.
18
U.S. Multifactor Fund
Financial Highlights
| Feb. 15, | |||
| Year Ended | 20181 to | ||
| November 30, | Nov. 30, | ||
| For a Share Outstanding Throughout Each Period | 2020 | 2019 | 2018 |
| Net Asset Value, Beginning of Period | $25.70 | $24.53 | $25.00 |
| Investment Operations | |||
| Net Investment Income2 | .382 | .425 | .333 |
| Net Realized and Unrealized Gain (Loss) on Investments | (.214) | 1.143 | (.598) |
| Total from Investment Operations | .168 | 1.568 | (. 265) |
| Distributions | |||
| Dividends from Net Investment Income | (.398) | (.398) | (. 205) |
| Distributions from Realized Capital Gains | — | — | — |
| Total Distributions | (.398) | (.398) | (. 205) |
| Net Asset Value, End of Period | $25.47 | $25.70 | $24.53 |
| Total Return3 | 0.97% | 6.54% | -1.11% |
| Ratios/Supplemental Data | |||
| Net Assets, End of Period (Millions) | $26 | $33 | $36 |
| Ratio of Total Expenses to Average Net Assets | 0.18% | 0.18% | 0.18%4 |
| Ratio of Net Investment Income to Average Net Assets | 1.66% | 1.76% | 1.64%4 |
| Portfolio Turnover Rate | 74% | 96% | 58% |
| 1 | Inception. |
| 2 | Calculated based on average shares outstanding. |
| 3 | Total returns do not include account service fees that may have applied in the periods shown. Fund prospectuses provide information about any applicable account service fees. |
| 4 | Annualized. |
See accompanying Notes, which are an integral part of the Financial Statements.
19
U.S. Multifactor Fund
Notes to Financial Statements
Vanguard U.S. Multifactor Fund is registered under the Investment Company Act of 1940 as an open-end investment company, or mutual fund. Market disruptions associated with the COVID-19 pandemic have had a global impact, and uncertainty exists as to the long-term implications. Such disruptions can adversely affect assets of the fund and thus fund performance.
A. The following significant accounting policies conform to generally accepted accounting principles for U.S. investment companies. The fund consistently follows such policies in preparing its financial statements.
1. Security Valuation: Securities are valued as of the close of trading on the New York Stock Exchange (generally 4 p.m., Eastern time) on the valuation date. Equity securities are valued at the latest quoted sales prices or official closing prices taken from the primary market in which each security trades; such securities not traded on the valuation date are valued at the mean of the latest quoted bid and asked prices. Securities for which market quotations are not readily available, or whose values have been materially affected by events occurring before the fund’s pricing time but after the close of the securities’ primary markets, are valued by methods deemed by the board of trustees to represent fair value. Investments in Vanguard Market Liquidity Fund are valued at that fund’s net asset value.
2. Futures Contracts: The fund uses index futures contracts to a limited extent, with the objective of maintaining full exposure to the stock market while maintaining liquidity. The fund may purchase or sell futures contracts to achieve a desired level of investment, whether to accommodate portfolio turnover or cash flows from capital share transactions. The primary risks associated with the use of futures contracts are imperfect correlation between changes in market values of stocks held by the fund and the prices of futures contracts, and the possibility of an illiquid market. Counterparty risk involving futures is mitigated because a regulated clearinghouse is the counterparty instead of the clearing broker. To further mitigate counterparty risk, the fund trades futures contracts on an exchange, monitors the financial strength of its clearing brokers and clearinghouse, and has entered into clearing agreements with its clearing brokers. The clearinghouse imposes initial margin requirements to secure the fund’s performance and requires daily settlement of variation margin representing changes in the market value of each contract. Any securities pledged as initial margin for open contracts are noted in the Schedule of Investments.
Futures contracts are valued at their quoted daily settlement prices. The notional amounts of the contracts are not recorded in the Statement of Assets and Liabilities. Fluctuations in the value of the contracts are recorded in the Statement of Assets and Liabilities as an asset (liability) and in the Statement of Operations as unrealized appreciation (depreciation) until the contracts are closed, when they are recorded as realized gains (losses) on futures contracts.
During the year ended November 30, 2020, the fund’s average investments in long and short futures contracts represented 2% and 0% of net assets, respectively, based on the average of the notional amounts at each quarter-end during the period.
3. Federal Income Taxes: The fund intends to continue to qualify as a regulated investment company and distribute all of its taxable income. The fund’s tax returns are open to examination by the relevant tax authorities until expiration of the applicable statute of limitations, which is generally three years after the filing of the tax return. Management has analyzed the fund’s tax positions taken for all open federal and state income tax years, and has concluded that no provision for income tax is required in the fund’s financial statements.
20
U.S. Multifactor Fund
4. Distributions: Distributions to shareholders are recorded on the ex-dividend date. Distributions are determined on a tax basis at the fiscal year-end and may differ from net investment income and realized capital gains for financial reporting purposes.
5. Credit Facilities and Interfund Lending Program: The fund and certain other funds managed by The Vanguard Group (“Vanguard”) participate in a $4.3 billion committed credit facility provided by a syndicate of lenders pursuant to a credit agreement and an uncommitted credit facility provided by Vanguard. Both facilities may be renewed annually. Each fund is individually liable for its borrowings, if any, under the credit facilities. Borrowings may be utilized for temporary or emergency purposes, subject to the fund’s regulatory and contractual borrowing restrictions. With respect to the committed credit facility, the participating funds are charged administrative fees and an annual commitment fee of 0.10% of the undrawn committed amount of the facility; these fees are allocated to the funds based on a method approved by the fund’s board of trustees and included in Management and Administrative expenses on the fund’s Statement of Operations. Any borrowings under either facility bear interest at a rate based upon the higher of the one-month London Interbank Offered Rate (or an acceptable alternate rate, if necessary), federal funds effective rate, or overnight bank funding rate plus an agreed-upon spread, except that borrowings under the uncommitted credit facility may bear interest based upon an alternative rate agreed to by the fund and Vanguard.
In accordance with an exemptive order (the “Order”) from the SEC, the fund may participate in a joint lending and borrowing program that allows registered open-end Vanguard funds to borrow money from and lend money to each other for temporary or emergency purposes (the “Interfund Lending Program”), subject to compliance with the terms and conditions of the Order, and to the extent permitted by the fund’s investment objective and investment policies. Interfund loans and borrowings normally extend overnight, but can have a maximum duration of seven days. Loans may be called on one business day’s notice. The interest rate to be charged is governed by the conditions of the Order and internal procedures adopted by the board of trustees. The board of trustees is responsible for overseeing the Interfund Lending Program.
For the year ended November 30, 2020, the fund did not utilize the credit facilities or the Interfund Lending Program.
6. Other: Dividend income is recorded on the ex-dividend date. Non-cash dividends included in dividend income, if any, are recorded at the fair value of the securities received. Interest income includes income distributions received from Vanguard Market Liquidity Fund and is accrued daily. Security transactions are accounted for on the date securities are bought or sold. Costs used to determine realized gains (losses) on the sale of investment securities are those of the specific securities sold.
B. In accordance with the terms of a Funds’ Service Agreement (the “FSA”) between Vanguard and the fund, Vanguard furnishes to the fund investment advisory, corporate management, administrative, marketing, and distribution services at Vanguard’s cost of operations (as defined by the FSA). These costs of operations are allocated to the fund based on methods and guidelines approved by the board of trustees and are generally settled twice a month.
Upon the request of Vanguard, the fund may invest up to 0.40% of its net assets as capital in Vanguard. At November 30, 2020, the fund had contributed to Vanguard capital in the amount of $1,000, representing less than 0.01% of the fund’s net assets and less than 0.01% of Vanguard’s capital received pursuant to the FSA. The fund’s trustees and officers are also directors and employees, respectively, of Vanguard.
21
U.S. Multifactor Fund
C. Various inputs may be used to determine the value of the fund’s investments and derivatives. These inputs are summarized in three broad levels for financial statement purposes. The inputs or methodologies used to value securities are not necessarily an indication of the risk associated with investing in those securities.
Level 1—Quoted prices in active markets for identical securities.
Level 2—Other significant observable inputs (including quoted prices for similar securities, interest rates, prepayment speeds, credit risk, etc.).
Level 3—Significant unobservable inputs (including the fund’s own assumptions used to determine the fair value of investments). Any investments and derivatives valued with significant unobservable inputs are noted on the Schedule of Investments.
At November 30, 2020, 100% of the market value of the fund’s investments and derivatives was determined based on Level 1 inputs.
D. Permanent differences between book-basis and tax-basis components of net assets, if any, are reclassified among capital accounts in the financial statements to reflect their tax character. These reclassifications have no effect on net assets or net asset value per share.
Temporary differences between book-basis and tax-basis components of total distributable earnings (loss) arise when certain items of income, gain, or loss are recognized in different periods for financial statement and tax purposes; these differences will reverse at some time in the future. The differences are primarily related to the deferral of losses from wash sales, and the recognition of unrealized gains or losses from certain derivative contracts. As of period end, the tax-basis components of total distributable earnings (loss) are detailed in the table as follows:
| Amount | |
| ($000) | |
| Undistributed Ordinary Income | 102 |
| Undistributed Long-Term Gains | — |
| Capital Loss Carryforwards | (5,502) |
| Qualified Late-Year Losses | — |
| Net Unrealized Gains (Losses) | 4,286 |
The tax character of distributions paid was as follows:
| Year Ended November 30, | ||
| 2020 | 2019 | |
| Amount | Amount | |
| ($000) | ($000) | |
| Ordinary Income* | 472 | 566 |
| Long-Term Capital Gains | — | — |
| Total | 472 | 566 |
* Includes short-term capital gains, if any.
22
U.S. Multifactor Fund
As of November 30, 2020, gross unrealized appreciation and depreciation for investments and derivatives based on cost for U.S. federal income tax purposes were as follows:
| Amount | |
| ($000) | |
| Tax Cost | 21,911 |
| Gross Unrealized Appreciation | 5,110 |
| Gross Unrealized Depreciation | (824) |
| Net Unrealized Appreciation (Depreciation) | 4,286 |
E. During the year ended November 30, 2020, the fund purchased $19,114,000 of investment securities and sold $24,217,000 of investment securities, other than temporary cash investments.
F. Capital shares issued and redeemed were:
| Year Ended November 30, | ||
| 2020 | 2019 | |
| Shares | Shares | |
| (000) | (000) | |
| Issued | 524 | 841 |
| Issued in Lieu of Cash Distributions | 18 | 19 |
| Redeemed | (795) | (1,029) |
| Net Increase (Decrease) in Shares Outstanding | (253) | (169) |
G. Management has determined that no events or transactions occurred subsequent to November 30, 2020, that would require recognition or disclosure in these financial statements.
23
Report of Independent Registered Public Accounting Firm
To the Board of Trustees of Vanguard Wellington Fund and Shareholders of Vanguard U.S. Multifactor Fund
Opinion on the Financial Statements
We have audited the accompanying statement of assets and liabilities, including the schedule of investments, of Vanguard U.S. Multifactor Fund (one of the funds constituting Vanguard Wellington Fund, referred to hereafter as the “Fund”) as of November 30, 2020, the related statement of operations for the year ended November 30, 2020, the statement of changes in net assets for each of the two years in the period ended November 30, 2020, including the related notes, and the financial highlights for each of the two years in the period ended November 30, 2020 and for the period February 15, 2018 (inception) through November 30, 2018 (collectively referred to as the “financial statements”). In our opinion, the financial statements present fairly, in all material respects, the financial position of the Fund as of November 30, 2020, the results of its operations for the year then ended, the changes in its net assets for each of the two years in the period ended November 30, 2020 and the financial highlights for each of the two years in the period ended November 30, 2020 and for the period February 15, 2018 (inception) through November 30, 2018 in conformity with accounting principles generally accepted in the United States of America.
Basis for Opinion
These financial statements are the responsibility of the Fund’s management. Our responsibility is to express an opinion on the Fund’s financial statements based on our audits. We are a public accounting firm registered with the Public Company Accounting Oversight Board (United States) (PCAOB) and are required to be independent with respect to the Fund in accordance with the U.S. federal securities laws and the applicable rules and regulations of the Securities and Exchange Commission and the PCAOB.
We conducted our audits of these financial statements in accordance with the standards of the PCAOB. Those standards require that we plan and perform the audit to obtain reasonable assurance about whether the financial statements are free of material misstatement, whether due to error or fraud.
Our audits included performing procedures to assess the risks of material misstatement of the financial statements, whether due to error or fraud, and performing procedures that respond to those risks. Such procedures included examining, on a test basis, evidence regarding the amounts and disclosures in the financial statements. Our audits also included evaluating the accounting principles used and significant estimates made by management, as well as evaluating the overall presentation of the financial statements. Our procedures included confirmation of securities owned as of November 30, 2020 by correspondence with the custodian, transfer agent and brokers; when replies were not received from brokers, we performed other auditing procedures. We believe that our audits provide a reasonable basis for our opinion.
/s/PricewaterhouseCoopers LLP
Philadelphia, Pennsylvania
January 14, 2021
We have served as the auditor of one or more investment companies in The Vanguard Group of Funds since 1975.
24
Special 2020 tax information (unaudited) for Vanguard U.S. Multifactor Fund
This information for the fiscal year ended November 30, 2020, is included pursuant to provisions of the Internal Revenue Code.
The fund distributed $472,000 of qualified dividend income to shareholders during the fiscal year.
For corporate shareholders, 100% of investment income (dividend income plus short-term gains, if any) qualifies for the dividends-received deduction.
25
This page intentionally left blank.
The People Who Govern Your Fund
The trustees of your mutual fund are there to see that the fund is operated and managed in your best interests since, as a shareholder, you are a part owner of the fund. Your fund’s trustees also serve on the board of directors of The Vanguard Group, Inc., which is owned by the Vanguard funds and provides services to them.
A majority of Vanguard’s board members are independent, meaning that they have no affiliation with Vanguard or the funds they oversee, apart from the sizable personal investments they have made as private individuals. The independent board members have distinguished backgrounds in business, academia, and public service. Each of the trustees and executive officers oversees 211 Vanguard funds.
Information for each trustee and executive officer of the fund appears below. That information, as well as the Vanguard fund count, is as of the date on the cover of this fund report. The mailing address of the trustees and officers is P.O. Box 876, Valley Forge, PA 19482. More information about the trustees is in the Statement of Additional Information, which can be obtained, without charge, by contacting Vanguard at 800-662-7447, or online at vanguard.com.
Interested Trustee1
Mortimer J. Buckley
Born in 1969. Trustee since January 2018. Principal occupation(s) during the past five years and other experience: chairman of the board (2019–present) of Vanguard and of each of the investment companies served by Vanguard; chief executive officer (2018– present) of Vanguard; chief executive officer, president, and trustee (2018–present) of each of the investment companies served by Vanguard; president and director (2017–present) of Vanguard; and president (2018–present) of Vanguard Marketing Corporation. Chief investment officer (2013–2017), managing director (2002–2017), head of the Retail Investor Group (2006–2012), and chief information officer (2001–2006) of Vanguard. Chairman of the board (2011–2017) and trustee (2009–2017) of the Children’s Hospital of Philadelphia; and trustee (2018–present) and vice chair (2019–present) of The Shipley School.
Independent Trustees
Emerson U. Fullwood
Born in 1948. Trustee since January 2008. Principal occupation(s) during the past five years and other experience: executive chief staff and marketing officer for North America and corporate vice president (retired 2008) of Xerox Corporation (document management products and services). Former president of the Worldwide Channels Group, Latin America, and Worldwide Customer Service and executive chief staff officer of Developing Markets of Xerox. Executive in residence and 2009–2010 Distinguished Minett Professor at the Rochester Institute of Technology. Director of SPX FLOW, Inc. (multi-industry manufacturing). Director of the University of Rochester Medical Center, the Monroe Community College Foundation, the United Way of Rochester, North Carolina A&T University, and Roberts Wesleyan College. Trustee of the University of Rochester.
Amy Gutmann
Born in 1949. Trustee since June 2006. Principal occupation(s) during the past five years and other experience: president (2004–present) of the University of Pennsylvania. Christopher H. Browne Distinguished Professor of Political Science, School of Arts and Sciences, and professor of communication, Annenberg School for Communication, with secondary faculty appointments in the Department of Philosophy, School of Arts and Sciences, and at the Graduate School of Education, University of Pennsylvania.
F. Joseph Loughrey
Born in 1949. Trustee since October 2009. Principal occupation(s) during the past five years and other experience: president and chief operating officer (retired 2009) and vice chairman of the board (2008–2009) of Cummins Inc. (industrial machinery). Chairman of the board of Hillenbrand, Inc. (specialized consumer services) and the Lumina Foundation. Director of the V Foundation. Member of the advisory
| 1 | Mr. Buckley is considered an “interested person,” as defined in the Investment Company Act of 1940, because he is an officer of the Vanguard funds. |
council for the College of Arts and Letters and chair of the advisory board to the Kellogg Institute for International Studies, both at the University of Notre Dame.
Mark Loughridge
Born in 1953. Trustee since March 2012. Principal occupation(s) during the past five years and other experience: senior vice president and chief financial officer (retired 2013) of IBM (information technology services). Fiduciary member of IBM’s Retirement Plan Committee (2004–2013), senior vice president and general manager (2002–2004) of IBM Global Financing, vice president and controller (1998–2002) of IBM, and a variety of other prior management roles at IBM. Member of the Council on Chicago Booth.
Scott C. Malpass
Born in 1962. Trustee since March 2012. Principal occupation(s) during the past five years and other experience: chief investment officer (retired June 2020) and vice president (retired June 2020) of the University of Notre Dame. Assistant professor of finance at the Mendoza College of Business, University of Notre Dame, and member of the Notre Dame 403(b) Investment Committee (retired June 2020). Member of the board of Catholic Investment Services, Inc. (investment advisors) and the board of superintendence of the Institute for the Works of Religion.
Deanna Mulligan
Born in 1963. Trustee since January 2018. Principal occupation(s) during the past five years and other experience: board chair (2020–present), chief executive officer (2011–2020), and president (2010–2019) of The Guardian Life Insurance Company of America. Chief operating officer (2010–2011) and executive vice president (2008–2010) of the individual life and disability division of Guardian Life. Member of the board of the American Council of Life Insurers and the board of the Economic Club of New York. Trustee of the Partnership for New York City (business leadership), Chief Executives for Corporate Purpose, NewYork- Presbyterian Hospital, Catalyst, and the Bruce Museum (arts and science). Member of the Advisory Council for the Stanford Graduate School of Business.
André F. Perold
Born in 1952. Trustee since December 2004. Principal occupation(s) during the past five years and other experience: George Gund Professor of Finance and Banking, Emeritus at the Harvard Business School (retired 2011). Chief investment officer and co-managing partner of HighVista Strategies (private investment firm). Member of the board of advisors and member of the investment committee of the Museum of Fine Arts Boston. Member of the board (2018–present) of RIT Capital Partners (investment firm). Member of the investment committee of Partners Health Care System.
Sarah Bloom Raskin
Born in 1961. Trustee since January 2018. Principal occupation(s) during the past five years and other experience: deputy secretary (2014–2017) of the United States Department of the Treasury. Governor (2010–2014) of the Federal Reserve Board. Commissioner (2007–2010) of financial regulation for the State of Maryland. Member of the board of directors (2012–2014) of Neighborhood Reinvestment Corporation. Director (2017–present) of i(x) Investments, LLC; director (2017–present) of Reserve Trust. Rubenstein Fellow (2017–present) of Duke University; trustee (2017–present) of Amherst College, and trustee (2019–present) of the Folger Shakespeare Library.
Peter F. Volanakis
Born in 1955. Trustee since July 2009. Principal occupation(s) during the past five years and other experience: president and chief operating officer (retired 2010) of Corning Incorporated (communications equipment) and director of Corning Incorporated (2000–2010) and Dow Corning (2001–2010). Director (2012) of SPX Corporation (multi-industry manufacturing). Overseer of the Amos Tuck School of Business Administration, Dartmouth College (2001–2013). Chairman of the board of trustees of Colby-Sawyer College. Member of the board of Hypertherm Inc. (industrial cutting systems, software, and consumables).
Executive Officers
John Bendl
Born in 1970. Principal occupation(s) during the past five years and other experience: principal of Vanguard. Chief financial officer (2019–present) of each of the investment companies served by Vanguard. Chief accounting officer, treasurer, and controller of Vanguard (2017–present). Partner (2003–2016) at KPMG (audit, tax, and advisory services).
Christine M. Buchanan
Born in 1970. Principal occupation(s) during the past five years and other experience: principal of Vanguard. Treasurer (2017–present) of each of the investment companies served by Vanguard. Partner (2005–2017) at KPMG (audit, tax, and advisory services).
David Cermak
Born in 1960. Principal occupation(s) during the past five years and other experience: principal of Vanguard. Finance director (2019–present) of each of the investment companies served by Vanguard. Managing director and head (2017–present) of Vanguard Investments Singapore. Managing director and head (2017–2019) of Vanguard Investments Hong Kong. Representative director and head (2014–2017) of Vanguard Investments Japan.
John Galloway
Born in 1973. Principal occupation(s) during the past five years and other experience: principal of Vanguard. Investment stewardship officer (September 2020–present) of each of the investment companies served by Vanguard. Head of Investor Advocacy (February 2020–present) and head of Marketing Strategy and Planning (2017–2020) at Vanguard. Deputy assistant to the President of the United States (2015).
Thomas J. Higgins
Born in 1957. Principal occupation(s) during the past five years and other experience: principal of Vanguard. Finance director (2019–present), chief financial officer (2008–2019), and treasurer (1998–2008) of each of the investment companies served by Vanguard.
Peter Mahoney
Born in 1974. Principal occupation(s) during the past five years and other experience: principal of Vanguard. Controller (2015–present) of each of the investment companies served by Vanguard. Head of International Fund Services (2008–2014) at Vanguard.
Anne E. Robinson
Born in 1970. Principal occupation(s) during the past five years and other experience: general counsel (2016–present) of Vanguard. Secretary (2016–present) of Vanguard and of each of the investment companies served by Vanguard. Managing director (2016–present) of Vanguard. Managing director and general counsel of Global Cards and Consumer Services (2014–2016) at Citigroup. Counsel (2003–2014) at American Express.
Michael Rollings
Born in 1963. Principal occupation(s) during the past five years and other experience: finance director (2017–present) and treasurer (2017) of each of the investment companies served by Vanguard. Managing director (2016–present) of Vanguard. Chief financial officer (2016–present) of Vanguard. Director (2016–present) of Vanguard Marketing Corporation. Executive vice president and chief financial officer (2006–2016) of MassMutual Financial Group.
John E. Schadl
Born in 1972. Principal occupation(s) during the past five years and other experience: principal of Vanguard. Chief compliance officer (2019–present) of Vanguard and of each of the investment companies served by Vanguard. Assistant vice president (2019–present) of Vanguard Marketing Corporation.
| Vanguard Senior Management Team | |
| Joseph Brennan | James M. Norris |
| Mortimer J. Buckley | Thomas M. Rampulla |
| Gregory Davis | Karin A. Risi |
| John James | Anne E. Robinson |
| John T. Marcante | Michael Rollings |
| Chris D. McIsaac | Lauren Valente |

Connect with Vanguard® > vanguard.com
Fund Information > 800-662-7447
Direct Investor Account Services > 800-662-2739
Institutional Investor Services > 800-523-1036
Text Telephone for People
Who Are Deaf or Hard of Hearing > 800-749-7273
This material may be used in conjunction with the offering of shares of any Vanguard fund only if preceded or accompanied by the fund’s current prospectus.
All comparative mutual fund data are from Morningstar, Inc., unless otherwise noted.
You can obtain a free copy of Vanguard’s proxy voting guidelines by visiting vanguard.com/proxyreporting or by calling Vanguard at 800-662-2739. The guidelines are also available from the SEC’s website, www.sec.gov. In addition, you may obtain a free report on how your fund voted the proxies for securities it owned during the 12 months ended June 30. To get the report, visit either vanguard.com/proxyreporting or www.sec.gov.
You can review information about your fund on the SEC’s website, and you can receive copies of this information, for a fee, by sending a request via email addressed to publicinfo@sec.gov.
Source for Bloomberg Barclays indexes: Bloomberg Index Services Limited. Copyright 2021, Bloomberg. All rights reserved.
| © 2021 The Vanguard Group, Inc. | |
| All rights reserved. | |
| Vanguard Marketing Corporation, Distributor. | |
| Q5160 012021 |
Item 2: Code of Ethics. The Registrant has adopted a code of ethics that applies to the Registrant’s principal executive officer, principal financial officer, principal accounting officer or controller or persons performing similar functions. The Code of Ethics was amended during the reporting period covered by this report to make certain technical, non-material changes.
Item 3: Audit Committee Financial Expert. All members of the Audit Committee have been determined by the Registrant’s Board of Trustees to be Audit Committee Financial Experts and to be independent: F. Joseph Loughrey, Mark Loughridge, Sarah Bloom Raskin, and Peter F. Volanakis.
Item 4: Principal Accountant Fees and Services.
(a) Audit Fees.
Audit Fees of the Registrant.
Fiscal
Year Ended November 30, 2020: $168,000
Fiscal Year Ended November 30, 2019: $170,000
Aggregate Audit Fees of Registered Investment Companies in the Vanguard Group.
Fiscal
Year Ended November 30, 2020: $10,761,407
Fiscal Year Ended November 30, 2019: $9,568,215
Includes fees billed in connection with audits of the Registrant, other registered investment companies in the Vanguard complex, The Vanguard Group, Inc., and Vanguard Marketing Corporation.
(b) Audit-Related Fees.
Fiscal
Year Ended November 30, 2020: $2,915,863
Fiscal Year Ended November 30, 2019: $3,012,031
Includes fees billed in connection with assurance and related services provided to the Registrant, other registered investment companies in the Vanguard complex, The Vanguard Group, Inc., and Vanguard Marketing Corporation.
(c) Tax Fees.
Fiscal
Year Ended November 30, 2020: $247,168
Fiscal Year Ended November 30, 2019: $357,238
Includes fees billed in connection with tax compliance, planning, and advice services provided to the Registrant, other registered investment companies in the Vanguard complex, The Vanguard Group, Inc., and Vanguard Marketing Corporation.
(d) All Other Fees.
Fiscal
Year Ended November 30, 2020: $115,000
Fiscal Year Ended November 30, 2019: $0
Includes fees billed for services related to tax reported information provided to the Registrant, other registered investment companies in the Vanguard complex, The Vanguard Group, Inc., and Vanguard Marketing Corporation.
(e) (1) Pre-Approval Policies. The policy of the Registrant’s Audit Committee is to consider, and, if appropriate, approve before the principal accountant is engaged for such services, all specific audit and non-audit services provided to: the Registrant, other registered investment companies in the Vanguard complex, The Vanguard Group, Inc., and entities controlled by The Vanguard Group, Inc. that provide ongoing services to the Registrant. In making a determination, the Audit Committee considers whether the services are consistent with maintaining the principal accountant’s independence.
In the event of a contingency situation in which the principal accountant is needed to provide services in between scheduled Audit Committee meetings, the Chairman of the Audit Committee would be called on to consider and, if appropriate, pre-approve audit or permitted non-audit services in an amount sufficient to complete services through the next Audit Committee meeting, and to determine if such services would be consistent with maintaining the accountant’s independence. At the next scheduled Audit Committee meeting, services and fees would be presented to the Audit Committee for formal consideration, and, if appropriate, approval by the entire Audit Committee. The Audit Committee would again consider whether such services and fees are consistent with maintaining the principal accountant’s independence.
The Registrant’s Audit Committee is informed at least annually of all audit and non-audit services provided by the principal accountant to the Vanguard complex, whether such services are provided to: the Registrant, other registered investment companies in the Vanguard complex, The Vanguard Group, Inc., or other entities controlled by The Vanguard Group, Inc. that provide ongoing services to the Registrant.
(2) No percentage of the principal accountant’s fees or services were approved pursuant to the waiver provision of paragraph (c)(7)(i)(C) of Rule 2-01 of Regulation S-X.
(f) For the most recent fiscal year, over 50% of the hours worked under the principal accountant’s engagement were not performed by persons other than full-time, permanent employees of the principal accountant.
(g) Aggregate Non-Audit Fees.
Fiscal
Year Ended November 30, 2020: $362,168
Fiscal Year Ended November 30, 2019: $357,238
Includes fees billed for non-audit services provided to the Registrant, other registered investment companies in the Vanguard complex, The Vanguard Group, Inc., and Vanguard Marketing Corporation.
(h) For the most recent fiscal year, the Audit Committee has determined that the provision of all non-audit services was consistent with maintaining the principal accountant’s independence.
Item 5: Audit Committee of Listed Registrants.
The Registrant is a listed issuer as defined in rule 10A-3 under the Securities Exchange Act of 1934 (“Exchange Act”). The Registrant has a separately-designated standing audit committee established in accordance with Section 3(a)(58)(A) of the Exchange Act. The Registrant’s audit committee members are: F. Joseph Loughrey, Mark Loughridge, Sarah Bloom Raskin, and Peter F. Volanakis.
Item 6: Investments.
Vanguard® Wellington Fund
Schedule of Investments
November 30, 2020
| Shares | Market Value ($000) |
||||
| Common Stocks (66.8%) | |||||
| Communication Services (8.4%) | |||||
| * | Alphabet Inc. Class A | 2,833,345 | 4,970,820 | ||
| * | Facebook Inc. Class A | 10,050,356 | 2,783,647 | ||
| Comcast Corp. Class A | 32,147,844 | 1,615,108 | |||
| 9,369,575 | |||||
| Consumer Discretionary (6.9%) | |||||
| McDonald's Corp. | 12,475,407 | 2,712,653 | |||
| TJX Cos. Inc. | 27,918,492 | 1,773,103 | |||
| Home Depot Inc. | 6,179,195 | 1,714,170 | |||
| * | Alibaba Group Holding Ltd. ADR | 4,464,653 | 1,175,811 | ||
| Dollar General Corp. | 1,760,452 | 384,800 | |||
| 7,760,537 | |||||
| Consumer Staples (5.8%) | |||||
| Procter & Gamble Co. | 14,209,871 | 1,973,325 | |||
| Coca-Cola Co. | 29,325,690 | 1,513,206 | |||
| Nestle SA | 12,192,132 | 1,365,696 | |||
| Sysco Corp. | 18,014,737 | 1,284,270 | |||
| Diageo plc | 8,646,328 | 332,850 | |||
| 6,469,347 | |||||
| Energy (1.2%) | |||||
| TOTAL SE | 32,206,760 | 1,367,042 | |||
| Financials (9.5%) | |||||
| JPMorgan Chase & Co. | 17,811,116 | 2,099,574 | |||
| Charles Schwab Corp. | 40,719,889 | 1,986,316 | |||
| BlackRock Inc. | 2,130,798 | 1,488,043 | |||
| Bank of America Corp. | 47,083,838 | 1,325,881 | |||
| Progressive Corp. | 14,091,409 | 1,227,503 | |||
| American Express Co. | 8,293,198 | 983,490 | |||
| Blackstone Group LP Class A | 15,453,876 | 920,278 | |||
| Prudential plc | 26,834,247 | 412,652 | |||
| Morgan Stanley | 1,766,000 | 109,192 | |||
| 10,552,929 | |||||
| Health Care (10.3%) | |||||
| Pfizer Inc. | 44,106,059 | 1,689,703 | |||
| Becton Dickinson and Co. | 6,174,609 | 1,450,045 | |||
| UnitedHealth Group Inc. | 4,232,554 | 1,423,577 | |||
| Novartis AG | 13,565,475 | 1,228,158 | |||
| Abbott Laboratories | 11,260,203 | 1,218,579 | |||
| AstraZeneca plc ADR | 20,079,268 | 1,062,996 | |||
| HCA Healthcare Inc. | 5,985,122 | 898,427 | |||
| Anthem Inc. | 2,814,460 | 876,761 | |||
| Humana Inc. | 1,812,557 | 725,965 | |||
| Danaher Corp. | 2,724,971 | 612,110 | |||
| Baxter International Inc. | 4,667,209 | 355,035 | |||
| 11,541,356 | |||||
| Industrials (6.8%) | |||||
| Deere & Co. | 4,008,247 | 1,048,638 | |||
| Union Pacific Corp. | 4,865,499 | 992,951 | |||
| Trane Technologies plc | 6,118,754 | 894,807 | |||
| Northrop Grumman Corp. | 2,624,086 | 793,156 | |||
| Lockheed Martin Corp. | 2,136,555 | 779,842 | |||
| Raytheon Technologies Corp. | 9,598,266 | 688,388 | |||
| Schneider Electric SE | 4,770,563 | 664,668 | |||
| Fortive Corp. | 9,464,295 | 663,731 | |||
| Vinci SA | 5,331,257 | 541,647 | |||
| United Parcel Service Inc. Class B | 3,102,172 | 530,688 | |||
| 7,598,516 | |||||
| Information Technology (14.8%) | |||||
| Microsoft Corp. | 25,033,612 | 5,358,945 | |||
| Apple Inc. | 29,607,744 | 3,524,802 | |||
| Taiwan Semiconductor Manufacturing Co. Ltd. ADR | 17,392,543 | 1,687,424 | |||
1
Vanguard® Wellington Fund
Schedule of Investments
November 30, 2020
| Shares | Market Value ($000) |
||||
| Texas Instruments Inc. | 9,924,887 | 1,600,388 | |||
| Global Payments Inc. | 6,776,836 | 1,322,771 | |||
| Accenture plc Class A | 2,438,360 | 607,371 | |||
| Lam Research Corp. | 1,218,832 | 551,716 | |||
| KLA Corp. | 2,037,051 | 513,276 | |||
| Cisco Systems Inc. | 10,459,082 | 449,950 | |||
| * | salesforce.com Inc. | 1,567,179 | 385,213 | ||
| Fidelity National Information Services Inc. | 2,417,718 | 358,814 | |||
| * | Vontier Corp. | 3,549,487 | 117,736 | ||
| 16,478,406 | |||||
| Real Estate (1.0%) | |||||
| American Tower Corp. | 4,683,459 | 1,082,816 | |||
| Utilities (2.1%) | |||||
| Duke Energy Corp. | 12,947,378 | 1,199,704 | |||
| Exelon Corp. | 29,185,844 | 1,198,662 | |||
| 2,398,366 | |||||
| Total Common Stocks (Cost $46,901,108) | 74,618,890 | ||||
| Coupon | Maturity Date | Face Amount ($000) | |||||||
| U.S. Government and Agency Obligations (5.3%) | |||||||||
| U.S. Government Securities (4.4%) | |||||||||
| United States Treasury Note/Bond | 0.125% | 10/31/22 | 205,000 | 204,904 | |||||
| United States Treasury Note/Bond | 2.500% | 3/31/23 | 89,000 | 93,826 | |||||
| United States Treasury Note/Bond | 0.125% | 5/15/23 | 164,470 | 164,315 | |||||
| United States Treasury Note/Bond | 2.625% | 6/30/23 | 119,090 | 126,607 | |||||
| United States Treasury Note/Bond | 2.750% | 7/31/23 | 104,000 | 111,118 | |||||
| United States Treasury Note/Bond | 1.750% | 6/30/24 | 336,990 | 355,157 | |||||
| United States Treasury Note/Bond | 2.000% | 2/15/25 | 364,360 | 390,262 | |||||
| 1 | United States Treasury Note/Bond | 1.125% | 2/28/25 | 198,905 | 205,773 | ||||
| United States Treasury Note/Bond | 0.250% | 5/31/25 | 850,000 | 847,212 | |||||
| United States Treasury Note/Bond | 0.250% | 7/31/25 | 245,975 | 244,937 | |||||
| United States Treasury Note/Bond | 2.000% | 8/15/25 | 61,860 | 66,654 | |||||
| United States Treasury Note/Bond | 0.250% | 8/31/25 | 125,010 | 124,444 | |||||
| United States Treasury Note/Bond | 1.625% | 5/15/26 | 78,110 | 83,150 | |||||
| United States Treasury Note/Bond | 2.000% | 11/15/26 | 30,000 | 32,658 | |||||
| United States Treasury Note/Bond | 2.250% | 11/15/27 | 383,050 | 426,082 | |||||
| United States Treasury Note/Bond | 3.125% | 11/15/28 | 123,595 | 146,807 | |||||
| United States Treasury Note/Bond | 2.375% | 5/15/29 | 37,325 | 42,317 | |||||
| United States Treasury Note/Bond | 1.500% | 2/15/30 | 146,255 | 155,396 | |||||
| United States Treasury Note/Bond | 0.625% | 5/15/30 | 507,790 | 498,589 | |||||
| United States Treasury Note/Bond | 0.875% | 11/15/30 | 8,200 | 8,218 | |||||
| United States Treasury Note/Bond | 1.125% | 8/15/40 | 206,405 | 197,827 | |||||
| United States Treasury Note/Bond | 2.250% | 8/15/46 | 85,179 | 98,422 | |||||
| United States Treasury Note/Bond | 2.750% | 8/15/47 | 40,270 | 51,130 | |||||
| United States Treasury Note/Bond | 2.875% | 5/15/49 | 395 | 517 | |||||
| 1 | United States Treasury Note/Bond | 2.000% | 2/15/50 | 26,806 | 29,537 | ||||
| United States Treasury Note/Bond | 1.250% | 5/15/50 | 115,765 | 106,594 | |||||
| United States Treasury Note/Bond | 1.375% | 8/15/50 | 86,890 | 82,545 | |||||
| United States Treasury Note/Bond | 1.625% | 11/15/50 | 17,515 | 17,704 | |||||
| 4,912,702 | |||||||||
| Conventional Mortgage-Backed Securities (0.4%) | |||||||||
| 2,3 | Fannie Mae Pool | 2.500% | 9/1/27–4/1/38 | 52,615 | 55,087 | ||||
| 2,3 | Fannie Mae Pool | 2.780% | 6/1/26 | 29,166 | 31,983 | ||||
| 2,3 | Fannie Mae Pool | 3.000% | 8/1/42–11/1/46 | 491 | 519 | ||||
| 2,3 | Fannie Mae Pool | 3.070% | 2/1/25 | 11,700 | 12,713 | ||||
| 2,3 | Fannie Mae Pool | 3.500% | 11/1/45–6/1/46 | 126 | 134 | ||||
| 2,3 | Freddie Mac Gold Pool | 3.000% | 5/1/22–9/1/22 | 4 | 4 | ||||
| 3 | Ginnie Mae I Pool | 7.000% | 11/15/31–11/15/33 | 1,441 | 1,711 | ||||
2
Vanguard® Wellington Fund
Schedule of Investments
November 30, 2020
| Coupon | Maturity Date | Face Amount ($000) | Market Value ($000) |
||||||
| 2,3,4 | UMBS Pool | 1.500% | 12/1/35 | 90,000 | 92,278 | ||||
| 2,3,4 | UMBS Pool | 2.000% | 12/1/35–12/1/50 | 246,700 | 256,606 | ||||
| 451,035 | |||||||||
| Nonconventional Mortgage-Backed Securities (0.5%) | |||||||||
| 2,3 | Fannie Mae REMICS | 1.500% | 8/25/41–11/25/42 | 21,514 | 21,788 | ||||
| 2,3 | Fannie Mae REMICS | 1.700% | 6/25/43 | 3,882 | 3,942 | ||||
| 2,3 | Fannie Mae REMICS | 2.000% | 6/25/44 | 3,352 | 3,411 | ||||
| 2,3 | Fannie Mae REMICS | 3.000% | 2/25/49–9/25/57 | 89,345 | 92,434 | ||||
| 2,3 | Fannie Mae REMICS | 3.500% | 4/25/31–6/25/59 | 293,627 | 315,220 | ||||
| 2,3 | Fannie Mae REMICS | 4.000% | 5/25/31–7/25/53 | 16,498 | 17,655 | ||||
| 2,3 | Freddie Mac REMICS | 1.500% | 10/15/42 | 10,191 | 10,284 | ||||
| 2,3 | Freddie Mac REMICS | 1.750% | 3/15/41 | 13,649 | 13,902 | ||||
| 2,3 | Freddie Mac REMICS | 2.000% | 7/15/31 | 11,182 | 11,427 | ||||
| 2,3 | Freddie Mac REMICS | 3.000% | 12/15/39 | 4,045 | 4,096 | ||||
| 2,3 | Freddie Mac REMICS | 3.500% | 3/15/31 | 3,691 | 3,987 | ||||
| 2,3 | Freddie Mac REMICS | 4.000% | 12/15/30–4/15/31 | 72,833 | 79,911 | ||||
| 3 | Ginnie Mae REMICS | 1.700% | 10/20/45 | 7,081 | 7,152 | ||||
| 3 | Ginnie Mae REMICS | 1.800% | 5/20/41 | 6,952 | 7,054 | ||||
| 592,263 | |||||||||
| Total U.S. Government and Agency Obligations (Cost $5,738,186) | 5,956,000 | ||||||||
| Asset-Backed/Commercial Mortgage-Backed Securities (1.0%) | |||||||||
| 3,5 | Aaset 2019-1 Trust | 3.844% | 5/15/39 | 13,833 | 12,996 | ||||
| 3,5 | American Tower Trust I | 3.070% | 3/15/23 | 43,000 | 43,793 | ||||
| 3 | AmeriCredit Automobile Receivables Trust 2016-3 | 2.240% | 4/8/22 | 1,748 | 1,750 | ||||
| 3,5 | Angel Oak Mortgage Trust 2019-5 | 2.593% | 10/25/49 | 9,745 | 9,870 | ||||
| 3,5 | Angel Oak Mortgage Trust 2019-6 | 2.620% | 11/25/59 | 24,601 | 24,956 | ||||
| 3,5 | Angel Oak Mortgage Trust I LLC 2019-2 | 3.628% | 3/25/49 | 5,403 | 5,478 | ||||
| 3,5 | Angel Oak Mortgage Trust LLC | 2.993% | 7/26/49 | 19,155 | 19,323 | ||||
| 3,5,6 | Atlas Senior Loan Fund X Ltd., 3M USD LIBOR + 1.090% | 1.327% | 1/15/31 | 7,799 | 7,708 | ||||
| 3,5,6 | Avery Point IV CLO Ltd., 3M USD LIBOR + 1.100% | 1.315% | 4/25/26 | 4,767 | 4,764 | ||||
| 3,5,6 | Babson CLO Ltd. 2014-I, 3M USD LIBOR + 1.150% | 1.368% | 7/20/25 | 78 | 78 | ||||
| 5 | Bank of Montreal | 2.500% | 1/11/22 | 60,000 | 61,428 | ||||
| 3,5 | Canadian Pacer Auto Receivables Trust A Series 2018 | 3.270% | 12/19/22 | 3,463 | 3,486 | ||||
| 3,5 | Castlelake Aircraft Securitization Trust 2019-1 | 3.967% | 4/15/39 | 26,112 | 24,431 | ||||
| 3,5,6 | Cent CLO, 3M USD LIBOR + 1.150% | 1.365% | 10/25/28 | 16,895 | 16,844 | ||||
| 3,5 | Chesapeake Funding II LLC | 3.390% | 1/15/31 | 18,497 | 18,979 | ||||
| 3,5 | Chesapeake Funding II LLC 2017-2A | 1.990% | 5/15/29 | 547 | 548 | ||||
| 3,5 | Chesapeake Funding II LLC 2018-1 | 3.040% | 4/15/30 | 15,956 | 16,189 | ||||
| 3,5 | Cloud Pass-Through Trust 2019-1 | 3.554% | 12/5/22 | 14,165 | 14,350 | ||||
| 3,5 | COLT 2019-2 Mortgage Loan Trust | 3.337% | 5/25/49 | 7,778 | 7,838 | ||||
| 3,5 | COLT 2020-1 Mortgage Loan Trust | 2.488% | 2/25/50 | 13,908 | 14,066 | ||||
| 3 | COMM 2012-CCRE2 Mortgage Trust | 3.147% | 8/15/45 | 18,085 | 18,633 | ||||
| 3,5 | DB Master Finance LLC | 3.787% | 5/20/49 | 15,761 | 16,144 | ||||
| 3,5 | DB Master Finance LLC | 4.021% | 5/20/49 | 14,067 | 14,810 | ||||
| 3,5 | Deephave Residential Mortgage Trust 2019-2 | 3.558% | 4/25/59 | 7,635 | 7,690 | ||||
| 5 | DNB Boligkreditt AS | 2.500% | 3/28/22 | 47,550 | 48,822 | ||||
| 3,5 | Enterprise Fleet Financing LLC | 3.100% | 10/20/23 | 3,495 | 3,546 | ||||
| 3,5 | Enterprise Fleet Financing LLC | 2.290% | 2/20/25 | 24,786 | 25,235 | ||||
| 3,5 | Enterprise Fleet Financing LLC Series 2018-1 | 2.870% | 10/20/23 | 4,176 | 4,192 | ||||
| 3,5 | Enterprise Fleet Financing LLC Series 2018-3 | 3.380% | 5/20/24 | 8,253 | 8,361 | ||||
| 3,5 | Enterprise Fleet Financing LLC Series 2019-1 | 2.980% | 10/20/24 | 14,609 | 14,822 | ||||
| 3,5 | Enterprise Fleet Financing LLC Series 2019-3 | 2.060% | 5/20/25 | 17,124 | 17,406 | ||||
| 3,5 | Exeter Automobile Receivables Trust 2019-3 | 2.590% | 9/15/22 | 541 | 542 | ||||
| 3,5 | Exeter Automobile Receivables Trust 2019-4 | 2.180% | 1/17/23 | 2,812 | 2,816 | ||||
| 2,3,6 | Fannie Mae Connecticut Avenue Securities, 1M USD LIBOR + 5.900% | 6.050% | 10/25/28 | 5,005 | 5,257 | ||||
| 2,3 | Freddie Mac Multifamily Structured Pass Through Certificates | 2.610% | 1/25/26 | 20,000 | 21,570 | ||||
| 2,3 | Freddie Mac Multifamily Structured Pass Through Certificates | 2.282% | 7/25/26 | 30,375 | 32,686 | ||||
| 3,5 | Hertz Fleet Lease Funding LP 2019-1 | 2.700% | 1/10/33 | 20,577 | 20,851 | ||||
3
Vanguard® Wellington Fund
Schedule of Investments
November 30, 2020
| Coupon | Maturity Date | Face Amount ($000) | Market Value ($000) |
||||||
| 3,5 | Horizon Aircraft Finance Ltd. | 3.721% | 7/15/39 | 10,979 | 10,459 | ||||
| 3,5 | Horizon Aircraft Finance Ltd. | 3.425% | 11/15/39 | 10,831 | 10,319 | ||||
| 3,5 | MACH 1 Cayman 2019-1 Ltd. | 3.474% | 10/15/39 | 11,899 | 11,400 | ||||
| 3,5,6 | Madison Park Funding XII Ltd., 3M USD LIBOR + 1.260% | 1.478% | 7/20/26 | 3,136 | 3,136 | ||||
| 3,5,6 | Madison Park Funding XIII Ltd., 3M USD LIBOR + 0.950% | 1.168% | 4/19/30 | 33,570 | 33,217 | ||||
| 3,5 | MAPS Ltd. | 4.458% | 3/15/44 | 6,202 | 5,840 | ||||
| 3,5,6 | Master Credit Card Trust II Series 2018-1A, 1M USD LIBOR + 0.490% | 0.636% | 7/21/24 | 36,370 | 36,199 | ||||
| 3,5 | OneMain Direct Auto Receivables Trust | 3.430% | 12/16/24 | 26,352 | 26,616 | ||||
| 3,5 | OneMain Financial Issuance Trust 2017-1 | 2.370% | 9/14/32 | 5,448 | 5,457 | ||||
| 3,5 | OneMain Financial Issuance Trust 2019-1 | 3.480% | 2/14/31 | 35,250 | 35,545 | ||||
| 3,5 | Santander Retail Auto Lease Trust 2019-A | 2.720% | 1/20/22 | 6,495 | 6,516 | ||||
| 3,5 | Santander Retail Auto Lease Trust 2019-B | 2.300% | 1/20/23 | 12,145 | 12,380 | ||||
| 2,3 | Seasoned Credit Risk Transfer Trust Series 2018-4 | 3.500% | 3/25/58 | 18,447 | 19,728 | ||||
| 2,3 | Seasoned Credit Risk Transfer Trust Series 2019-1 | 3.500% | 7/25/58 | 31,141 | 33,429 | ||||
| 2,3 | Seasoned Credit Risk Transfer Trust Series 2019-3 | 3.500% | 10/25/58 | 48,841 | 52,669 | ||||
| 3,5 | Securitized Term Auto Receivables Trust 2018-2 | 3.325% | 8/25/22 | 9,413 | 9,493 | ||||
| 3,5,6 | Seneca Park CLO Ltd. 2014-1, 3M USD LIBOR + 1.120% | 1.338% | 7/17/26 | 407 | 406 | ||||
| 3,5 | SFAVE Commercial Mortgage Securities Trust 2015-5AVE | 4.144% | 1/5/43 | 27,300 | 25,784 | ||||
| 3,5 | SoFi Consumer Loan Program 2018-4 Trust | 3.540% | 11/26/27 | 3,035 | 3,055 | ||||
| 3,5 | SoFi Consumer Loan Program 2019-1 Trust | 3.240% | 2/25/28 | 5,727 | 5,780 | ||||
| 3,5 | SoFi Consumer Loan Program 2020-1 Trust | 2.020% | 1/25/29 | 12,989 | 13,115 | ||||
| 3,5 | Springleaf Funding Trust 2015-B | 3.480% | 5/15/28 | 11,032 | 11,033 | ||||
| 3,5 | Start III Ltd. | 3.536% | 11/15/44 | 1,004 | 945 | ||||
| 3,5 | START Ireland | 4.089% | 3/15/44 | 13,032 | 12,240 | ||||
| 3,5,6 | Symphony CLO XIV Ltd., 3M USD LIBOR + 0.950% | 1.179% | 7/14/26 | 34,309 | 34,146 | ||||
| 3,5,6 | Thacher Park CLO Ltd., 3M USD LIBOR + 1.160% | 1.378% | 10/20/26 | 3,312 | 3,311 | ||||
| 3,5 | Towd Point Mortgage Trust 2016-3 | 2.250% | 4/25/56 | 834 | 838 | ||||
| 3 | Utility Debt Securitization Authority Series 2013T | 3.435% | 12/15/25 | 8,625 | 9,053 | ||||
| 3,5 | Vantage Data Centers LLC | 1.645% | 9/15/45 | 29,505 | 29,217 | ||||
| 3,5 | Vantage Data Centers LLC 2019-1A | 3.188% | 7/15/44 | 8,986 | 9,407 | ||||
| 3,5 | Verus Securitization Trust 2019-2 | 3.211% | 5/25/59 | 9,550 | 9,669 | ||||
| 3,5,6 | Voya CLO 2014-1 Ltd., 3M USD LIBOR + 0.990% | 1.208% | 4/18/31 | 20,525 | 20,297 | ||||
| 3,5 | Westlake Automobile Receivables Trust | 2.150% | 2/15/23 | 7,889 | 7,941 | ||||
| Total Asset-Backed/Commercial Mortgage-Backed Securities (Cost $1,073,457) | 1,080,898 | ||||||||
| Corporate Bonds (21.0%) | |||||||||
| Finance (7.6%) | |||||||||
| Banking (6.0%) | |||||||||
| American Express Credit Corp. | 2.700% | 3/3/22 | 54,990 | 56,485 | |||||
| 5 | Australia & New Zealand Banking Group Ltd. | 2.570% | 11/25/35 | 22,135 | 22,384 | ||||
| Banco Santander SA | 3.125% | 2/23/23 | 28,400 | 29,915 | |||||
| Banco Santander SA | 3.848% | 4/12/23 | 16,400 | 17,590 | |||||
| Banco Santander SA | 2.749% | 12/3/30 | 15,600 | 15,600 | |||||
| Bank of America Corp. | 3.300% | 1/11/23 | 7,905 | 8,380 | |||||
| 3 | Bank of America Corp. | 2.816% | 7/21/23 | 60,525 | 62,801 | ||||
| Bank of America Corp. | 4.125% | 1/22/24 | 16,100 | 17,768 | |||||
| Bank of America Corp. | 4.000% | 1/22/25 | 32,900 | 36,760 | |||||
| Bank of America Corp. | 3.500% | 4/19/26 | 10,000 | 11,332 | |||||
| 3 | Bank of America Corp. | 3.559% | 4/23/27 | 86,705 | 97,173 | ||||
| 3 | Bank of America Corp. | 3.593% | 7/21/28 | 37,950 | 42,918 | ||||
| 3 | Bank of America Corp. | 3.419% | 12/20/28 | 8,681 | 9,757 | ||||
| 3 | Bank of America Corp. | 4.271% | 7/23/29 | 74,365 | 88,493 | ||||
| 3 | Bank of America Corp. | 3.974% | 2/7/30 | 120,185 | 140,905 | ||||
| 3 | Bank of America Corp. | 3.194% | 7/23/30 | 35,285 | 39,293 | ||||
| 3 | Bank of America Corp. | 2.496% | 2/13/31 | 50,870 | 53,783 | ||||
| Bank of America Corp. | 5.875% | 2/7/42 | 9,965 | 15,388 | |||||
| Bank of America Corp. | 5.000% | 1/21/44 | 39,433 | 56,340 | |||||
| 3 | Bank of America Corp. | 3.946% | 1/23/49 | 5,380 | 6,787 | ||||
4
Vanguard® Wellington Fund
Schedule of Investments
November 30, 2020
| Coupon | Maturity Date | Face Amount ($000) | Market Value ($000) |
||||||
| 3 | Bank of America Corp. | 4.330% | 3/15/50 | 78,120 | 102,932 | ||||
| Bank of New York Mellon Corp. | 3.000% | 2/24/25 | 27,990 | 30,557 | |||||
| Bank of Nova Scotia | 2.700% | 8/3/26 | 63,160 | 69,199 | |||||
| 3 | Barclays plc | 3.932% | 5/7/25 | 55,605 | 60,364 | ||||
| 6 | Barclays plc, 3M USD LIBOR + 1.380% | 1.601% | 5/16/24 | 36,385 | 36,789 | ||||
| 5 | BNP Paribas SA | 2.950% | 5/23/22 | 4,105 | 4,258 | ||||
| BNP Paribas SA | 3.250% | 3/3/23 | 7,620 | 8,114 | |||||
| 5 | BNP Paribas SA | 3.800% | 1/10/24 | 44,775 | 48,710 | ||||
| 5 | BNP Paribas SA | 3.375% | 1/9/25 | 60,670 | 66,089 | ||||
| 3,5 | BNP Paribas SA | 2.819% | 11/19/25 | 45,685 | 48,708 | ||||
| 5 | BNP Paribas SA | 3.500% | 11/16/27 | 69,325 | 77,807 | ||||
| 5 | BPCE SA | 5.700% | 10/22/23 | 6,225 | 7,009 | ||||
| BPCE SA | 4.000% | 4/15/24 | 30,615 | 33,953 | |||||
| 5 | BPCE SA | 5.150% | 7/21/24 | 43,790 | 49,598 | ||||
| 5 | BPCE SA | 3.500% | 10/23/27 | 64,230 | 71,498 | ||||
| 5 | BPCE SA | 2.700% | 10/1/29 | 50,000 | 53,935 | ||||
| 6 | Canadian Imperial Bank of Commerce, 3M USD LIBOR + 0.720% | 0.957% | 6/16/22 | 57,780 | 58,287 | ||||
| Capital One Financial Corp. | 3.750% | 4/24/24 | 55,460 | 60,442 | |||||
| Capital One Financial Corp. | 3.200% | 2/5/25 | 24,185 | 26,287 | |||||
| Citigroup Inc. | 4.500% | 1/14/22 | 33,920 | 35,447 | |||||
| Citigroup Inc. | 4.125% | 7/25/28 | 14,550 | 16,953 | |||||
| 3 | Citigroup Inc. | 3.520% | 10/27/28 | 72,550 | 81,918 | ||||
| Citigroup Inc. | 6.625% | 6/15/32 | 45,000 | 64,147 | |||||
| 3 | Citigroup Inc. | 3.878% | 1/24/39 | 37,030 | 44,455 | ||||
| Comerica Bank | 2.500% | 7/23/24 | 27,415 | 29,217 | |||||
| 5 | Credit Agricole SA | 3.750% | 4/24/23 | 31,675 | 34,028 | ||||
| 5 | Credit Agricole SA | 3.250% | 10/4/24 | 71,600 | 77,486 | ||||
| Credit Suisse AG | 3.000% | 10/29/21 | 18,325 | 18,761 | |||||
| Credit Suisse AG | 3.625% | 9/9/24 | 4,885 | 5,410 | |||||
| 5 | Credit Suisse Group AG | 3.574% | 1/9/23 | 20,675 | 21,342 | ||||
| 3,5 | Credit Suisse Group AG | 4.207% | 6/12/24 | 12,375 | 13,380 | ||||
| 3,5 | Credit Suisse Group AG | 2.593% | 9/11/25 | 17,585 | 18,513 | ||||
| 3,5 | Credit Suisse Group AG | 3.869% | 1/12/29 | 10,980 | 12,405 | ||||
| 5,6 | Credit Suisse Group AG, 3M USD LIBOR + 1.240% | 1.489% | 6/12/24 | 25,015 | 25,331 | ||||
| Credit Suisse Group Funding Guernsey Ltd. | 3.800% | 9/15/22 | 55,260 | 58,457 | |||||
| Credit Suisse Group Funding Guernsey Ltd. | 3.750% | 3/26/25 | 67,850 | 75,263 | |||||
| 5 | Danske Bank A/S | 5.000% | 1/12/22 | 21,605 | 22,591 | ||||
| 5 | Danske Bank A/S | 3.875% | 9/12/23 | 46,290 | 49,870 | ||||
| 5 | Danske Bank A/S | 5.375% | 1/12/24 | 28,240 | 31,715 | ||||
| 5 | Danske Bank A/S | 1.621% | 9/11/26 | 28,990 | 28,891 | ||||
| Deutsche Bank AG | 4.250% | 10/14/21 | 25,995 | 26,695 | |||||
| Fifth Third Bancorp | 2.550% | 5/5/27 | 19,150 | 20,684 | |||||
| Goldman Sachs Group Inc. | 5.750% | 1/24/22 | 40,725 | 43,222 | |||||
| 3 | Goldman Sachs Group Inc. | 2.876% | 10/31/22 | 64,880 | 66,254 | ||||
| Goldman Sachs Group Inc. | 3.625% | 1/22/23 | 35,320 | 37,708 | |||||
| Goldman Sachs Group Inc. | 3.500% | 1/23/25 | 17,545 | 19,326 | |||||
| 3 | Goldman Sachs Group Inc. | 3.272% | 9/29/25 | 46,260 | 50,325 | ||||
| Goldman Sachs Group Inc. | 3.850% | 1/26/27 | 17,980 | 20,495 | |||||
| 3 | Goldman Sachs Group Inc. | 3.691% | 6/5/28 | 15,055 | 17,180 | ||||
| 3 | Goldman Sachs Group Inc. | 3.814% | 4/23/29 | 23,795 | 27,488 | ||||
| 3 | Goldman Sachs Group Inc. | 4.223% | 5/1/29 | 67,740 | 80,349 | ||||
| Goldman Sachs Group Inc. | 3.800% | 3/15/30 | 19,490 | 22,845 | |||||
| Goldman Sachs Group Inc. | 6.750% | 10/1/37 | 43,995 | 67,500 | |||||
| Goldman Sachs Group Inc. | 6.250% | 2/1/41 | 20,135 | 31,794 | |||||
| Goldman Sachs Group Inc. | 4.800% | 7/8/44 | 25,675 | 35,664 | |||||
| 5 | HSBC Bank plc | 4.750% | 1/19/21 | 62,040 | 62,392 | ||||
| HSBC Holdings plc | 3.600% | 5/25/23 | 60,200 | 64,601 | |||||
| HSBC Holdings plc | 3.900% | 5/25/26 | 12,085 | 13,638 | |||||
| HSBC Holdings plc | 1.589% | 5/24/27 | 25,850 | 25,949 | |||||
| 3 | HSBC Holdings plc | 4.041% | 3/13/28 | 21,805 | 24,686 | ||||
| 3 | HSBC Holdings plc | 4.583% | 6/19/29 | 40,480 | 47,595 | ||||
| 3 | HSBC Holdings plc | 2.357% | 8/18/31 | 30,555 | 31,288 | ||||
| HSBC Holdings plc | 6.500% | 5/2/36 | 25,000 | 35,483 | |||||
5
Vanguard® Wellington Fund
Schedule of Investments
November 30, 2020
| Coupon | Maturity Date | Face Amount ($000) | Market Value ($000) | |||||||
| HSBC Holdings plc | 6.100% | 1/14/42 | 40,665 | 60,612 | ||||||
| HSBC Holdings plc | 5.250% | 3/14/44 | 13,210 | 17,835 | ||||||
| 6 | HSBC Holdings plc, 3M USD LIBOR + 1.000% | 1.220% | 5/18/24 | 26,340 | 26,457 | |||||
| HSBC USA Inc. | 3.500% | 6/23/24 | 28,025 | 30,580 | ||||||
| ING Groep NV | 3.150% | 3/29/22 | 12,955 | 13,413 | ||||||
| ING Groep NV | 3.950% | 3/29/27 | 44,565 | 51,120 | ||||||
| JPMorgan Chase & Co. | 3.375% | 5/1/23 | 27,610 | 29,507 | ||||||
| JPMorgan Chase & Co. | 3.875% | 2/1/24 | 39,000 | 42,947 | ||||||
| JPMorgan Chase & Co. | 3.900% | 7/15/25 | 13,870 | 15,672 | ||||||
| JPMorgan Chase & Co. | 4.125% | 12/15/26 | 29,835 | 34,866 | ||||||
| JPMorgan Chase & Co. | 4.250% | 10/1/27 | 13,420 | 15,777 | ||||||
| 3 | JPMorgan Chase & Co. | 4.452% | 12/5/29 | 64,735 | 78,368 | |||||
| 3 | JPMorgan Chase & Co. | 3.702% | 5/6/30 | 16,000 | 18,476 | |||||
| 3 | JPMorgan Chase & Co. | 3.109% | 4/22/41 | 19,440 | 21,584 | |||||
| JPMorgan Chase & Co. | 5.600% | 7/15/41 | 96,000 | 146,219 | ||||||
| JPMorgan Chase & Co. | 5.400% | 1/6/42 | 18,035 | 27,042 | ||||||
| JPMorgan Chase & Co. | 5.625% | 8/16/43 | 16,100 | 24,270 | ||||||
| JPMorgan Chase & Co. | 4.950% | 6/1/45 | 15,000 | 21,369 | ||||||
| 3 | JPMorgan Chase & Co. | 3.964% | 11/15/48 | 159,600 | 203,830 | |||||
| 3 | JPMorgan Chase & Co. | 3.109% | 4/22/51 | 19,885 | 22,358 | |||||
| 3,5 | Macquarie Group Ltd. | 4.150% | 3/27/24 | 49,500 | 53,030 | |||||
| Manufacturers & Traders Trust Co. | 2.900% | 2/6/25 | 24,685 | 26,815 | ||||||
| Mitsubishi UFJ Financial Group Inc. | 2.623% | 7/18/22 | 67,980 | 70,419 | ||||||
| Morgan Stanley | 5.750% | 1/25/21 | 79,825 | 80,424 | ||||||
| Morgan Stanley | 2.500% | 4/21/21 | 10,000 | 10,084 | ||||||
| Morgan Stanley | 3.875% | 4/29/24 | 97,010 | 107,192 | ||||||
| Morgan Stanley | 3.700% | 10/23/24 | 29,050 | 32,199 | ||||||
| 3 | Morgan Stanley | 2.720% | 7/22/25 | 53,860 | 57,641 | |||||
| Morgan Stanley | 4.000% | 7/23/25 | 29,455 | 33,734 | ||||||
| Morgan Stanley | 3.125% | 7/27/26 | 11,435 | 12,734 | ||||||
| Morgan Stanley | 6.250% | 8/9/26 | 20,000 | 25,466 | ||||||
| Morgan Stanley | 3.625% | 1/20/27 | 60,000 | 68,420 | ||||||
| 3 | Morgan Stanley | 3.772% | 1/24/29 | 56,905 | 65,746 | |||||
| 3 | Morgan Stanley | 2.699% | 1/22/31 | 74,290 | 80,392 | |||||
| Morgan Stanley | 4.300% | 1/27/45 | 18,360 | 24,973 | ||||||
| 5 | National Australia Bank Ltd. | 2.332% | 8/21/30 | 66,055 | 65,599 | |||||
| 3,5 | Nationwide Building Society | 3.622% | 4/26/23 | 23,975 | 24,963 | |||||
| 5 | NBK SPC Ltd. | 2.750% | 5/30/22 | 56,530 | 57,774 | |||||
| PNC Bank NA | 3.300% | 10/30/24 | 18,195 | 20,052 | ||||||
| PNC Bank NA | 4.200% | 11/1/25 | 16,650 | 19,152 | ||||||
| PNC Bank NA | 3.100% | 10/25/27 | 41,975 | 46,944 | ||||||
| PNC Bank NA | 3.250% | 1/22/28 | 60,465 | 68,416 | ||||||
| PNC Financial Services Group Inc. | 3.900% | 4/29/24 | 41,565 | 45,667 | ||||||
| PNC Financial Services Group Inc. | 2.550% | 1/22/30 | 54,405 | 59,516 | ||||||
| Santander Holdings USA Inc. | 3.700% | 3/28/22 | 33,065 | 34,189 | ||||||
| Santander Holdings USA Inc. | 3.400% | 1/18/23 | 20,375 | 21,382 | ||||||
| 5 | Societe Generale SA | 3.250% | 1/12/22 | 38,635 | 39,697 | |||||
| 3 | State Street Corp. | 2.653% | 5/15/23 | 30,770 | 31,666 | |||||
| Synchrony Bank | 3.650% | 5/24/21 | 46,195 | 46,771 | ||||||
| Truist Bank | 2.625% | 1/15/22 | 25,200 | 25,799 | ||||||
| Truist Bank | 3.300% | 5/15/26 | 12,895 | 14,419 | ||||||
| Truist Financial Corp. | 2.750% | 4/1/22 | 61,300 | 63,131 | ||||||
| Truist Financial Corp. | 2.200% | 3/16/23 | 31,045 | 32,250 | ||||||
| Truist Financial Corp. | 3.700% | 6/5/25 | 49,000 | 55,109 | ||||||
| Truist Financial Corp. | 1.950% | 6/5/30 | 22,005 | 22,909 | ||||||
| 3,5 | UBS Group AG | 3.126% | 8/13/30 | 16,000 | 17,849 | |||||
| 5 | UBS Group Funding Jersey Ltd. | 3.000% | 4/15/21 | 5,130 | 5,181 | |||||
| US Bancorp | 3.700% | 1/30/24 | 52,500 | 57,313 | ||||||
| Wells Fargo & Co. | 3.500% | 3/8/22 | 64,245 | 66,734 | ||||||
| Wells Fargo & Co. | 3.069% | 1/24/23 | 12,990 | 13,347 | ||||||
| Wells Fargo & Co. | 3.450% | 2/13/23 | 48,895 | 51,835 | ||||||
| Wells Fargo & Co. | 4.480% | 1/16/24 | 46,156 | 51,012 | ||||||
| Wells Fargo & Co. | 3.750% | 1/24/24 | 50,755 | 55,003 | ||||||
| Wells Fargo & Co. | 3.550% | 9/29/25 | 32,170 | 35,911 | ||||||
| 6 |
Vanguard® Wellington Fund
Schedule of Investments
November 30, 2020
| Coupon | Maturity Date | Face Amount ($000) | Market Value ($000) | |||||||
| Wells Fargo & Co. | 3.000% | 4/22/26 | 39,405 | 43,191 | ||||||
| 3 | Wells Fargo & Co. | 3.196% | 6/17/27 | 60,555 | 66,993 | |||||
| 3 | Wells Fargo & Co. | 2.879% | 10/30/30 | 15,000 | 16,250 | |||||
| 3 | Wells Fargo & Co. | 2.572% | 2/11/31 | 76,020 | 80,577 | |||||
| Wells Fargo & Co. | 5.606% | 1/15/44 | 68,281 | 97,825 | ||||||
| Wells Fargo & Co. | 4.650% | 11/4/44 | 10,315 | 13,341 | ||||||
| Wells Fargo & Co. | 4.900% | 11/17/45 | 19,160 | 25,702 | ||||||
| Wells Fargo & Co. | 4.400% | 6/14/46 | 73,300 | 92,760 | ||||||
| Wells Fargo & Co. | 4.750% | 12/7/46 | 23,150 | 30,692 | ||||||
| Brokerage (0.1%) | ||||||||||
| Charles Schwab Corp. | 3.200% | 3/2/27 | 19,665 | 22,043 | ||||||
| Intercontinental Exchange Inc. | 2.650% | 9/15/40 | 5,860 | 6,077 | ||||||
| Intercontinental Exchange Inc. | 3.000% | 6/15/50 | 12,730 | 13,855 | ||||||
| Intercontinental Exchange Inc. | 3.000% | 9/15/60 | 31,960 | 33,967 | ||||||
| Insurance (1.4%) | ||||||||||
| ACE Capital Trust II | 9.700% | 4/1/30 | 20,000 | 30,200 | ||||||
| Aetna Inc. | 2.800% | 6/15/23 | 25,660 | 26,984 | ||||||
| 5 | AIA Group Ltd. | 3.600% | 4/9/29 | 50,475 | 57,085 | |||||
| 5 | AIA Group Ltd. | 3.375% | 4/7/30 | 12,460 | 13,968 | |||||
| American International Group Inc. | 4.250% | 3/15/29 | 35,227 | 42,074 | ||||||
| American International Group Inc. | 4.500% | 7/16/44 | 6,907 | 8,849 | ||||||
| American International Group Inc. | 4.750% | 4/1/48 | 4,585 | 6,194 | ||||||
| Anthem Inc. | 3.700% | 8/15/21 | 10,000 | 10,158 | ||||||
| Anthem Inc. | 3.300% | 1/15/23 | 42,468 | 44,935 | ||||||
| Anthem Inc. | 3.650% | 12/1/27 | 26,975 | 30,905 | ||||||
| Anthem Inc. | 4.101% | 3/1/28 | 40,910 | 47,933 | ||||||
| Anthem Inc. | 4.650% | 8/15/44 | 2,876 | 3,793 | ||||||
| Chubb Corp. | 6.000% | 5/11/37 | 50,000 | 75,107 | ||||||
| Chubb INA Holdings Inc. | 3.350% | 5/15/24 | 22,345 | 24,395 | ||||||
| Chubb INA Holdings Inc. | 4.350% | 11/3/45 | 29,835 | 40,446 | ||||||
| 5 | Equitable Financial Life Global Funding | 1.400% | 7/7/25 | 10,395 | 10,626 | |||||
| 5 | Equitable Financial Life Global Funding | 1.400% | 8/27/27 | 18,220 | 18,229 | |||||
| 5 | Farmers Exchange Capital | 7.050% | 7/15/28 | 25,000 | 30,606 | |||||
| 5 | Five Corners Funding Trust | 4.419% | 11/15/23 | 5,935 | 6,603 | |||||
| 5 | Jackson National Life Global Funding | 3.250% | 1/30/24 | 24,070 | 25,767 | |||||
| 5 | Jackson National Life Insurance Co. | 8.150% | 3/15/27 | 18,890 | 25,099 | |||||
| 5 | Liberty Mutual Group Inc. | 4.250% | 6/15/23 | 3,160 | 3,432 | |||||
| 5 | Liberty Mutual Group Inc. | 4.569% | 2/1/29 | 11,170 | 13,641 | |||||
| 5 | Liberty Mutual Insurance Co. | 7.875% | 10/15/26 | 31,210 | 39,921 | |||||
| Marsh & McLennan Cos. Inc. | 4.375% | 3/15/29 | 23,405 | 28,581 | ||||||
| Marsh & McLennan Cos. Inc. | 4.900% | 3/15/49 | 10,915 | 16,081 | ||||||
| MetLife Inc. | 3.600% | 4/10/24 | 35,035 | 38,551 | ||||||
| MetLife Inc. | 4.125% | 8/13/42 | 5,565 | 7,021 | ||||||
| MetLife Inc. | 4.875% | 11/13/43 | 17,000 | 23,702 | ||||||
| 5 | Metropolitan Life Global Funding I | 2.650% | 4/8/22 | 13,770 | 14,192 | |||||
| 5 | Metropolitan Life Global Funding I | 3.450% | 12/18/26 | 23,660 | 27,038 | |||||
| 5 | Metropolitan Life Global Funding I | 3.000% | 9/19/27 | 21,455 | 23,815 | |||||
| 5 | Nationwide Financial Services Inc. | 3.900% | 11/30/49 | 48,905 | 52,667 | |||||
| 5 | Nationwide Mutual Insurance Co. | 4.350% | 4/30/50 | 27,345 | 31,934 | |||||
| 5 | New York Life Global Funding | 2.900% | 1/17/24 | 29,050 | 31,063 | |||||
| 5 | New York Life Insurance Co. | 5.875% | 5/15/33 | 55,395 | 76,289 | |||||
| 5 | New York Life Insurance Co. | 3.750% | 5/15/50 | 9,245 | 10,955 | |||||
| 5 | New York Life Insurance Co. | 4.450% | 5/15/69 | 15,270 | 20,741 | |||||
| 5 | Northwestern Mutual Life Insurance Co. | 3.850% | 9/30/47 | 24,134 | 28,364 | |||||
| 5 | Northwestern Mutual Life Insurance Co. | 3.625% | 9/30/59 | 9,324 | 10,609 | |||||
| 5 | Principal Financial Global Funding LLC | 2.500% | 9/16/29 | 25,000 | 27,052 | |||||
| Prudential plc | 3.125% | 4/14/30 | 14,640 | 16,665 | ||||||
| 5 | Teachers Insurance & Annuity Assn. of America | 4.900% | 9/15/44 | 24,830 | 33,024 | |||||
| 5 | Teachers Insurance & Annuity Assn. of America | 4.270% | 5/15/47 | 42,390 | 52,348 | |||||
| Torchmark Corp. | 7.875% | 5/15/23 | 45,000 | 52,597 | ||||||
| UnitedHealth Group Inc. | 2.875% | 3/15/22 | 4,696 | 4,821 | ||||||
| UnitedHealth Group Inc. | 2.875% | 3/15/23 | 16,000 | 16,892 | ||||||
| UnitedHealth Group Inc. | 3.100% | 3/15/26 | 15,350 | 17,237 | ||||||
| 7 |
Vanguard® Wellington Fund
Schedule of Investments
November 30, 2020
| Coupon | Maturity Date | Face Amount ($000) | Market Value ($000) | |||||||
| UnitedHealth Group Inc. | 3.850% | 6/15/28 | 34,565 | 41,030 | ||||||
| UnitedHealth Group Inc. | 2.000% | 5/15/30 | 7,515 | 7,977 | ||||||
| UnitedHealth Group Inc. | 4.625% | 7/15/35 | 9,595 | 12,980 | ||||||
| UnitedHealth Group Inc. | 2.750% | 5/15/40 | 8,505 | 9,321 | ||||||
| UnitedHealth Group Inc. | 4.250% | 3/15/43 | 67,400 | 88,059 | ||||||
| UnitedHealth Group Inc. | 4.750% | 7/15/45 | 24,520 | 34,881 | ||||||
| UnitedHealth Group Inc. | 4.200% | 1/15/47 | 8,620 | 11,467 | ||||||
| UnitedHealth Group Inc. | 4.250% | 6/15/48 | 22,215 | 30,138 | ||||||
| UnitedHealth Group Inc. | 4.450% | 12/15/48 | 4,970 | 6,952 | ||||||
| UnitedHealth Group Inc. | 3.700% | 8/15/49 | 23,160 | 28,971 | ||||||
| UnitedHealth Group Inc. | 2.900% | 5/15/50 | 26,720 | 29,690 | ||||||
| UnitedHealth Group Inc. | 3.875% | 8/15/59 | 4,125 | 5,457 | ||||||
| Real Estate Investment Trusts (0.1%) | ||||||||||
| Boston Properties LP | 3.125% | 9/1/23 | 13,275 | 14,089 | ||||||
| Boston Properties LP | 3.800% | 2/1/24 | 1,750 | 1,905 | ||||||
| Healthpeak Properties Inc. | 3.000% | 1/15/30 | 31,475 | 34,275 | ||||||
| Realty Income Corp. | 3.250% | 1/15/31 | 12,940 | 14,617 | ||||||
| 5 | Scentre Management Ltd / RE1 Ltd. | 4.375% | 5/28/30 | 19,110 | 21,702 | |||||
| Simon Property Group LP | 3.750% | 2/1/24 | 3,265 | 3,530 | ||||||
| Simon Property Group LP | 3.375% | 10/1/24 | 10,055 | 10,861 | ||||||
| Simon Property Group LP | 2.450% | 9/13/29 | 19,865 | 20,305 | ||||||
| VEREIT Operating Partnership LP | 3.400% | 1/15/28 | 5,900 | 6,379 | ||||||
| VEREIT Operating Partnership LP | 2.200% | 6/15/28 | 24,400 | 24,561 | ||||||
| VEREIT Operating Partnership LP | 2.850% | 12/15/32 | 13,205 | 13,530 | ||||||
| 8,499,429 | ||||||||||
| Industrial (10.4%) | ||||||||||
| Basic Industry (0.1%) | ||||||||||
| International Paper Co. | 4.350% | 8/15/48 | 45,400 | 59,491 | ||||||
| Capital Goods (0.6%) | ||||||||||
| 5 | BAE Systems Holdings Inc. | 2.850% | 12/15/20 | 6,060 | 6,052 | |||||
| 5 | BAE Systems Holdings Inc. | 3.850% | 12/15/25 | 11,010 | 12,481 | |||||
| 5 | BAE Systems plc | 3.400% | 4/15/30 | 7,335 | 8,274 | |||||
| Boeing Co. | 2.700% | 2/1/27 | 17,155 | 17,198 | ||||||
| Boeing Co. | 8.625% | 11/15/31 | 9,460 | 13,479 | ||||||
| 5 | Carrier Global Corp. | 2.722% | 2/15/30 | 15,418 | 16,399 | |||||
| Caterpillar Inc. | 2.600% | 6/26/22 | 11,345 | 11,686 | ||||||
| Caterpillar Inc. | 3.400% | 5/15/24 | 14,200 | 15,449 | ||||||
| Deere & Co. | 7.125% | 3/3/31 | 17,500 | 25,822 | ||||||
| General Electric Co. | 3.100% | 1/9/23 | 8,635 | 9,074 | ||||||
| Illinois Tool Works Inc. | 3.500% | 3/1/24 | 52,955 | 57,653 | ||||||
| John Deere Capital Corp. | 3.450% | 3/13/25 | 43,145 | 48,160 | ||||||
| Lockheed Martin Corp. | 2.900% | 3/1/25 | 10,450 | 11,391 | ||||||
| Lockheed Martin Corp. | 1.850% | 6/15/30 | 1,700 | 1,778 | ||||||
| Lockheed Martin Corp. | 4.500% | 5/15/36 | 8,015 | 10,517 | ||||||
| Lockheed Martin Corp. | 4.700% | 5/15/46 | 14,370 | 20,158 | ||||||
| Lockheed Martin Corp. | 2.800% | 6/15/50 | 7,285 | 7,930 | ||||||
| Lockheed Martin Corp. | 4.090% | 9/15/52 | 5,500 | 7,463 | ||||||
| Otis Worldwide Corp. | 2.565% | 2/15/30 | 8,000 | 8,599 | ||||||
| Otis Worldwide Corp. | 3.112% | 2/15/40 | 17,030 | 18,657 | ||||||
| Otis Worldwide Corp. | 3.362% | 2/15/50 | 30,240 | 34,961 | ||||||
| Parker-Hannifin Corp. | 3.250% | 6/14/29 | 9,650 | 10,934 | ||||||
| Parker-Hannifin Corp. | 4.450% | 11/21/44 | 17,735 | 22,655 | ||||||
| Raytheon Technologies Corp. | 4.125% | 11/16/28 | 16,675 | 19,858 | ||||||
| Raytheon Technologies Corp. | 6.050% | 6/1/36 | 20,325 | 29,639 | ||||||
| Raytheon Technologies Corp. | 6.125% | 7/15/38 | 37,300 | 55,995 | ||||||
| Raytheon Technologies Corp. | 4.450% | 11/16/38 | 9,325 | 11,841 | ||||||
| Raytheon Technologies Corp. | 4.500% | 6/1/42 | 16,902 | 22,286 | ||||||
| Raytheon Technologies Corp. | 3.750% | 11/1/46 | 5,923 | 7,174 | ||||||
| 5 | Siemens Financieringsmaatschappij NV | 2.900% | 5/27/22 | 15,000 | 15,561 | |||||
| 5 | Siemens Financieringsmaatschappij NV | 3.125% | 3/16/24 | 61,400 | 66,159 | |||||
| 5 | Siemens Financieringsmaatschappij NV | 4.400% | 5/27/45 | 34,365 | 46,346 | |||||
| Stanley Black & Decker Inc. | 4.850% | 11/15/48 | 24,455 | 34,527 | ||||||
| 8 |
Vanguard® Wellington Fund
Schedule of Investments
November 30, 2020
| Coupon | Maturity Date | Face Amount ($000) | Market Value ($000) | |||||||
| Communication (1.8%) | ||||||||||
| America Movil SAB de CV | 3.125% | 7/16/22 | 84,600 | 88,093 | ||||||
| America Movil SAB de CV | 3.625% | 4/22/29 | 26,990 | 30,852 | ||||||
| America Movil SAB de CV | 6.125% | 3/30/40 | 7,380 | 10,931 | ||||||
| American Tower Corp. | 5.000% | 2/15/24 | 2,770 | 3,134 | ||||||
| American Tower Corp. | 4.400% | 2/15/26 | 7,315 | 8,444 | ||||||
| American Tower Corp. | 3.800% | 8/15/29 | 33,804 | 39,106 | ||||||
| AT&T Inc. | 2.750% | 6/1/31 | 36,795 | 38,924 | ||||||
| AT&T Inc. | 3.650% | 6/1/51 | 6,253 | 6,610 | ||||||
| AT&T Inc. | 3.850% | 6/1/60 | 23,037 | 24,399 | ||||||
| 5 | British Telecommunications plc | 3.250% | 11/8/29 | 29,620 | 32,577 | |||||
| Charter Communications Operating LLC / Charter Communications Operating Capital | 5.375% | 5/1/47 | 3,455 | 4,348 | ||||||
| Charter Communications Operating LLC / Charter Communications Operating Capital | 5.125% | 7/1/49 | 2,904 | 3,559 | ||||||
| Charter Communications Operating LLC / Charter Communications Operating Capital | 4.800% | 3/1/50 | 3,777 | 4,525 | ||||||
| Charter Communications Operating LLC / Charter Communications Operating Capital | 3.700% | 4/1/51 | 17,760 | 18,544 | ||||||
| Comcast Corp. | 3.000% | 2/1/24 | 25,345 | 27,251 | ||||||
| Comcast Corp. | 3.600% | 3/1/24 | 50,730 | 55,681 | ||||||
| Comcast Corp. | 3.375% | 2/15/25 | 2,540 | 2,803 | ||||||
| Comcast Corp. | 4.250% | 1/15/33 | 42,890 | 53,570 | ||||||
| Comcast Corp. | 4.200% | 8/15/34 | 26,890 | 33,700 | ||||||
| Comcast Corp. | 5.650% | 6/15/35 | 4,725 | 6,736 | ||||||
| Comcast Corp. | 4.400% | 8/15/35 | 32,325 | 41,282 | ||||||
| Comcast Corp. | 6.500% | 11/15/35 | 4,720 | 7,311 | ||||||
| Comcast Corp. | 6.400% | 5/15/38 | 968 | 1,492 | ||||||
| Comcast Corp. | 4.600% | 10/15/38 | 48,045 | 63,480 | ||||||
| Comcast Corp. | 4.650% | 7/15/42 | 47,970 | 64,912 | ||||||
| Comcast Corp. | 4.500% | 1/15/43 | 22,000 | 29,310 | ||||||
| Comcast Corp. | 4.750% | 3/1/44 | 34,643 | 47,719 | ||||||
| Comcast Corp. | 4.600% | 8/15/45 | 43,296 | 58,473 | ||||||
| Comcast Corp. | 3.969% | 11/1/47 | 8,452 | 10,601 | ||||||
| Comcast Corp. | 4.000% | 3/1/48 | 12,180 | 15,183 | ||||||
| Comcast Corp. | 4.700% | 10/15/48 | 40,520 | 57,130 | ||||||
| Comcast Corp. | 3.999% | 11/1/49 | 23,162 | 29,562 | ||||||
| Comcast Corp. | 4.049% | 11/1/52 | 19,920 | 25,807 | ||||||
| Comcast Corp. | 4.950% | 10/15/58 | 17,925 | 27,431 | ||||||
| 5 | Cox Communications Inc. | 3.250% | 12/15/22 | 27,995 | 29,465 | |||||
| 5 | Cox Communications Inc. | 2.950% | 6/30/23 | 5,870 | 6,176 | |||||
| 5 | Cox Communications Inc. | 3.150% | 8/15/24 | 7,268 | 7,846 | |||||
| 5 | Cox Communications Inc. | 4.800% | 2/1/35 | 30,000 | 37,514 | |||||
| 5 | Cox Communications Inc. | 6.450% | 12/1/36 | 5,850 | 8,068 | |||||
| 5 | Cox Communications Inc. | 4.600% | 8/15/47 | 4,435 | 5,778 | |||||
| Crown Castle International Corp. | 3.650% | 9/1/27 | 10,215 | 11,528 | ||||||
| Crown Castle International Corp. | 3.800% | 2/15/28 | 8,435 | 9,607 | ||||||
| 5 | Deutsche Telekom International Finance BV | 3.600% | 1/19/27 | 10,918 | 12,281 | |||||
| 5 | Deutsche Telekom International Finance BV | 4.375% | 6/21/28 | 21,754 | 25,910 | |||||
| 5 | Meituan Dianping | 3.050% | 10/28/30 | 7,755 | 8,022 | |||||
| NBCUniversal Media LLC | 4.450% | 1/15/43 | 10,370 | 13,724 | ||||||
| Orange SA | 4.125% | 9/14/21 | 60,990 | 62,742 | ||||||
| Orange SA | 9.000% | 3/1/31 | 20,280 | 33,292 | ||||||
| 5 | SK Telecom Co. Ltd. | 3.750% | 4/16/23 | 11,995 | 12,805 | |||||
| 5 | Sky Ltd. | 3.750% | 9/16/24 | 45,046 | 50,123 | |||||
| 3,5 | Sprint Spectrum Co LLC / Sprint Spectrum Co II LLC / Sprint Spectrum Co III LLC | 4.738% | 3/20/25 | 46,090 | 49,741 | |||||
| 5 | T-Mobile USA Inc. | 2.050% | 2/15/28 | 24,985 | 25,659 | |||||
| 5 | T-Mobile USA Inc. | 3.875% | 4/15/30 | 24,165 | 27,658 | |||||
| 5 | T-Mobile USA Inc. | 3.300% | 2/15/51 | 19,300 | 20,132 | |||||
| Telefonica Emisiones SAU | 5.213% | 3/8/47 | 35,120 | 44,778 | ||||||
| Telefonica Emisiones SAU | 5.520% | 3/1/49 | 29,047 | 38,448 | ||||||
| Time Warner Entertainment Co. LP | 8.375% | 3/15/23 | 3,925 | 4,592 | ||||||
| 9 |
Vanguard® Wellington Fund
Schedule of Investments
November 30, 2020
| Coupon | Maturity Date | Face Amount ($000) | Market Value ($000) | |||||||
| Verizon Communications Inc. | 4.329% | 9/21/28 | 23,335 | 28,303 | ||||||
| Verizon Communications Inc. | 4.812% | 3/15/39 | 85,963 | 114,305 | ||||||
| Verizon Communications Inc. | 4.750% | 11/1/41 | 11,880 | 16,026 | ||||||
| Verizon Communications Inc. | 4.862% | 8/21/46 | 36,117 | 49,632 | ||||||
| Verizon Communications Inc. | 5.012% | 4/15/49 | 2,301 | 3,232 | ||||||
| Verizon Communications Inc. | 4.672% | 3/15/55 | 11,007 | 15,108 | ||||||
| 5 | Verizon Communications Inc. | 2.987% | 10/30/56 | 24,607 | 25,973 | |||||
| ViacomCBS Inc. | 3.700% | 6/1/28 | 15,190 | 17,206 | ||||||
| Vodafone Group plc | 5.000% | 5/30/38 | 1,895 | 2,467 | ||||||
| Vodafone Group plc | 5.250% | 5/30/48 | 45,220 | 61,592 | ||||||
| Walt Disney Co. | 3.000% | 9/15/22 | 11,891 | 12,438 | ||||||
| Walt Disney Co. | 2.650% | 1/13/31 | 3,850 | 4,192 | ||||||
| Walt Disney Co. | 3.500% | 5/13/40 | 50,260 | 58,640 | ||||||
| Walt Disney Co. | 4.125% | 6/1/44 | 6,280 | 7,878 | ||||||
| Walt Disney Co. | 2.750% | 9/1/49 | 16,835 | 17,317 | ||||||
| Walt Disney Co. | 3.600% | 1/13/51 | 27,250 | 32,253 | ||||||
| Walt Disney Co. | 3.800% | 5/13/60 | 28,415 | 35,240 | ||||||
| Consumer Cyclical (0.9%) | ||||||||||
| Alibaba Group Holding Ltd. | 3.125% | 11/28/21 | 2,515 | 2,570 | ||||||
| Alibaba Group Holding Ltd. | 3.600% | 11/28/24 | 39,860 | 43,887 | ||||||
| Alibaba Group Holding Ltd. | 3.400% | 12/6/27 | 85,240 | 95,475 | ||||||
| Amazon.com Inc. | 2.800% | 8/22/24 | 14,010 | 15,159 | ||||||
| Amazon.com Inc. | 4.800% | 12/5/34 | 37,370 | 51,555 | ||||||
| Amazon.com Inc. | 4.950% | 12/5/44 | 22,605 | 33,292 | ||||||
| Amazon.com Inc. | 4.250% | 8/22/57 | 41,385 | 58,737 | ||||||
| AutoZone Inc. | 3.700% | 4/15/22 | 46,136 | 47,888 | ||||||
| 5 | BMW US Capital LLC | 2.000% | 4/11/21 | 21,300 | 21,380 | |||||
| 5 | Daimler Finance North America LLC | 2.300% | 2/12/21 | 34,470 | 34,591 | |||||
| 5 | Daimler Finance North America LLC | 3.875% | 9/15/21 | 3,961 | 4,064 | |||||
| 5 | Daimler Finance North America LLC | 3.250% | 8/1/24 | 5,870 | 6,355 | |||||
| General Motors Financial Co. Inc. | 3.550% | 4/9/21 | 16,395 | 16,554 | ||||||
| General Motors Financial Co. Inc. | 3.950% | 4/13/24 | 57,810 | 62,643 | ||||||
| Home Depot Inc. | 3.900% | 12/6/28 | 10,250 | 12,287 | ||||||
| Home Depot Inc. | 3.300% | 4/15/40 | 18,410 | 21,609 | ||||||
| Home Depot Inc. | 4.400% | 3/15/45 | 28,655 | 38,071 | ||||||
| Home Depot Inc. | 4.500% | 12/6/48 | 12,215 | 17,031 | ||||||
| 5,6 | Hyundai Capital America, 3M USD LIBOR + 0.940% | 1.170% | 7/8/21 | 50,400 | 50,476 | |||||
| Lowe's Cos. Inc. | 3.100% | 5/3/27 | 68,700 | 76,920 | ||||||
| Lowe's Cos. Inc. | 6.500% | 3/15/29 | 13,301 | 18,010 | ||||||
| McDonald's Corp. | 3.250% | 6/10/24 | 5,460 | 5,950 | ||||||
| McDonald's Corp. | 4.875% | 12/9/45 | 9,940 | 13,579 | ||||||
| McDonald's Corp. | 3.625% | 9/1/49 | 37,735 | 44,251 | ||||||
| Starbucks Corp. | 4.500% | 11/15/48 | 51,181 | 66,347 | ||||||
| VF Corp. | 2.800% | 4/23/27 | 17,615 | 19,161 | ||||||
| VF Corp. | 2.950% | 4/23/30 | 37,015 | 40,512 | ||||||
| Walmart Inc. | 3.550% | 6/26/25 | 56,910 | 64,377 | ||||||
| Walmart Inc. | 3.625% | 12/15/47 | 14,215 | 18,221 | ||||||
| Consumer Noncyclical (3.1%) | ||||||||||
| AbbVie Inc. | 3.450% | 3/15/22 | 18,695 | 19,335 | ||||||
| AbbVie Inc. | 3.800% | 3/15/25 | 15,725 | 17,578 | ||||||
| AbbVie Inc. | 4.050% | 11/21/39 | 20,255 | 23,824 | ||||||
| AbbVie Inc. | 4.850% | 6/15/44 | 18,000 | 23,848 | ||||||
| AbbVie Inc. | 4.450% | 5/14/46 | 29,520 | 37,285 | ||||||
| Advocate Health & Hospitals Corp. | 2.211% | 6/15/30 | 7,210 | 7,536 | ||||||
| Advocate Health & Hospitals Corp. | 3.008% | 6/15/50 | 8,980 | 9,636 | ||||||
| 5 | Alcon Finance Corp. | 2.750% | 9/23/26 | 5,830 | 6,345 | |||||
| 5 | Alcon Finance Corp. | 2.600% | 5/27/30 | 4,690 | 4,982 | |||||
| 5 | Alcon Finance Corp. | 3.800% | 9/23/49 | 22,830 | 26,804 | |||||
| Altria Group Inc. | 2.850% | 8/9/22 | 18,810 | 19,567 | ||||||
| Altria Group Inc. | 5.800% | 2/14/39 | 26,150 | 34,580 | ||||||
| Altria Group Inc. | 4.500% | 5/2/43 | 10,705 | 12,269 | ||||||
| Altria Group Inc. | 3.875% | 9/16/46 | 22,775 | 24,519 | ||||||
| Amgen Inc. | 2.300% | 2/25/31 | 43,075 | 45,514 | ||||||
| 10 |
Vanguard® Wellington Fund
Schedule of Investments
November 30, 2020
| Coupon | Maturity Date | Face Amount ($000) | Market Value ($000) | |||||||
| Amgen Inc. | 3.150% | 2/21/40 | 29,570 | 31,961 | ||||||
| Amgen Inc. | 5.150% | 11/15/41 | 10,583 | 14,653 | ||||||
| 5 | Amgen Inc. | 2.770% | 9/1/53 | 14,741 | 14,773 | |||||
| Anheuser-Busch Cos. LLC | 6.500% | 1/1/28 | 19,550 | 25,428 | ||||||
| Anheuser-Busch Cos. LLC / Anheuser-Busch InBev Worldwide Inc. | 4.700% | 2/1/36 | 35,700 | 45,384 | ||||||
| Anheuser-Busch Cos. LLC / Anheuser-Busch InBev Worldwide Inc. | 4.900% | 2/1/46 | 61,085 | 79,496 | ||||||
| Anheuser-Busch InBev Worldwide Inc. | 4.950% | 1/15/42 | 4,100 | 5,335 | ||||||
| Anheuser-Busch InBev Worldwide Inc. | 3.750% | 7/15/42 | 19,610 | 22,233 | ||||||
| Anheuser-Busch InBev Worldwide Inc. | 4.600% | 4/15/48 | 9,225 | 11,674 | ||||||
| Archer-Daniels-Midland Co. | 4.500% | 3/15/49 | 35,045 | 50,092 | ||||||
| Ascension Health | 2.532% | 11/15/29 | 22,515 | 24,329 | ||||||
| 3 | Ascension Health | 4.847% | 11/15/53 | 23,970 | 36,047 | |||||
| AstraZeneca plc | 4.000% | 1/17/29 | 47,000 | 56,459 | ||||||
| AstraZeneca plc | 6.450% | 9/15/37 | 23,385 | 36,153 | ||||||
| BAT Capital Corp. | 3.557% | 8/15/27 | 63,450 | 70,183 | ||||||
| 5 | Bayer US Finance II LLC | 4.250% | 12/15/25 | 46,665 | 53,367 | |||||
| 5 | Bayer US Finance LLC | 3.000% | 10/8/21 | 46,850 | 47,842 | |||||
| 5 | Bayer US Finance LLC | 3.375% | 10/8/24 | 33,220 | 36,239 | |||||
| 3 | Bon Secours Mercy Health Inc. | 3.464% | 6/1/30 | 17,085 | 19,135 | |||||
| Bon Secours Mercy Health Inc. | 2.095% | 6/1/31 | 11,305 | 11,359 | ||||||
| Boston Scientific Corp. | 4.000% | 3/1/29 | 6,810 | 7,984 | ||||||
| Bristol-Myers Squibb Co. | 2.750% | 2/15/23 | 4,553 | 4,775 | ||||||
| Bristol-Myers Squibb Co. | 3.250% | 2/20/23 | 7,830 | 8,302 | ||||||
| Bristol-Myers Squibb Co. | 4.000% | 8/15/23 | 1,500 | 1,637 | ||||||
| Bristol-Myers Squibb Co. | 3.400% | 7/26/29 | 31,020 | 36,025 | ||||||
| Bristol-Myers Squibb Co. | 4.125% | 6/15/39 | 17,720 | 22,509 | ||||||
| Bristol-Myers Squibb Co. | 4.550% | 2/20/48 | 7,347 | 10,141 | ||||||
| Bristol-Myers Squibb Co. | 4.250% | 10/26/49 | 20,963 | 28,032 | ||||||
| 5 | Cargill Inc. | 4.307% | 5/14/21 | 60,532 | 61,612 | |||||
| 5 | Cargill Inc. | 6.875% | 5/1/28 | 19,355 | 25,347 | |||||
| 5 | Cargill Inc. | 2.125% | 4/23/30 | 5,265 | 5,599 | |||||
| 5 | Cargill Inc. | 4.760% | 11/23/45 | 28,190 | 38,030 | |||||
| Children's Hospital Corp. | 2.585% | 2/1/50 | 5,460 | 5,484 | ||||||
| Cigna Corp. | 3.250% | 4/15/25 | 31,655 | 34,713 | ||||||
| Cigna Corp. | 4.375% | 10/15/28 | 18,600 | 22,349 | ||||||
| Coca-Cola Co. | 4.500% | 9/1/21 | 8,430 | 8,559 | ||||||
| Colgate-Palmolive Co. | 7.600% | 5/19/25 | 13,920 | 17,919 | ||||||
| CommonSpirit Health | 2.950% | 11/1/22 | 18,735 | 19,438 | ||||||
| CommonSpirit Health | 4.200% | 8/1/23 | 9,885 | 10,639 | ||||||
| CommonSpirit Health | 2.760% | 10/1/24 | 29,395 | 31,035 | ||||||
| CommonSpirit Health | 3.347% | 10/1/29 | 44,320 | 48,009 | ||||||
| CommonSpirit Health | 2.782% | 10/1/30 | 15,890 | 16,387 | ||||||
| 3 | CommonSpirit Health | 4.350% | 11/1/42 | 23,365 | 26,582 | |||||
| CommonSpirit Health | 4.187% | 10/1/49 | 40,235 | 44,662 | ||||||
| Conagra Brands Inc. | 4.600% | 11/1/25 | 7,855 | 9,153 | ||||||
| Conagra Brands Inc. | 1.375% | 11/1/27 | 11,765 | 11,857 | ||||||
| Conagra Brands Inc. | 5.300% | 11/1/38 | 6,410 | 8,609 | ||||||
| Constellation Brands Inc. | 2.700% | 5/9/22 | 2,385 | 2,456 | ||||||
| Constellation Brands Inc. | 3.750% | 5/1/50 | 2,415 | 2,843 | ||||||
| Cottage Health Obligated Group | 3.304% | 11/1/49 | 15,870 | 17,622 | ||||||
| CVS Health Corp. | 4.300% | 3/25/28 | 4,349 | 5,095 | ||||||
| CVS Health Corp. | 4.875% | 7/20/35 | 6,900 | 8,858 | ||||||
| CVS Health Corp. | 4.125% | 4/1/40 | 11,570 | 13,862 | ||||||
| CVS Health Corp. | 5.125% | 7/20/45 | 31,100 | 41,864 | ||||||
| 5 | Danone SA | 2.947% | 11/2/26 | 30,550 | 33,598 | |||||
| Diageo Capital plc | 2.625% | 4/29/23 | 48,310 | 50,544 | ||||||
| Diageo Capital plc | 2.375% | 10/24/29 | 20,000 | 21,553 | ||||||
| Diageo Capital plc | 2.000% | 4/29/30 | 5,830 | 6,079 | ||||||
| Diageo Capital plc | 2.125% | 4/29/32 | 1,845 | 1,951 | ||||||
| Diageo Investment Corp. | 2.875% | 5/11/22 | 26,991 | 27,934 | ||||||
| Dignity Health | 3.812% | 11/1/24 | 20,780 | 22,432 | ||||||
| Eli Lilly & Co. | 4.150% | 3/15/59 | 2,810 | 3,871 | ||||||
| 11 |
Vanguard® Wellington Fund
Schedule of Investments
November 30, 2020
| Coupon | Maturity Date | Face Amount ($000) | Market Value ($000) | |||||||
| 5 | EMD Finance LLC | 2.950% | 3/19/22 | 23,660 | 24,311 | |||||
| Estee Lauder Cos. Inc. | 2.375% | 12/1/29 | 12,615 | 13,718 | ||||||
| Gilead Sciences Inc. | 3.700% | 4/1/24 | 26,895 | 29,282 | ||||||
| Gilead Sciences Inc. | 3.500% | 2/1/25 | 22,335 | 24,663 | ||||||
| Gilead Sciences Inc. | 4.500% | 2/1/45 | 35,895 | 45,527 | ||||||
| Gilead Sciences Inc. | 4.750% | 3/1/46 | 19,970 | 26,375 | ||||||
| Gilead Sciences Inc. | 2.800% | 10/1/50 | 38,610 | 38,576 | ||||||
| GlaxoSmithKline Capital Inc. | 2.800% | 3/18/23 | 31,740 | 33,480 | ||||||
| GlaxoSmithKline Capital Inc. | 5.375% | 4/15/34 | 45,000 | 64,370 | ||||||
| HCA Inc. | 5.125% | 6/15/39 | 4,970 | 6,343 | ||||||
| 5 | Imperial Tobacco Finance plc | 3.750% | 7/21/22 | 34,745 | 36,175 | |||||
| 5 | JAB Holdings BV | 2.200% | 11/23/30 | 9,385 | 9,383 | |||||
| Kaiser Foundation Hospitals | 3.500% | 4/1/22 | 4,945 | 5,151 | ||||||
| Kaiser Foundation Hospitals | 3.150% | 5/1/27 | 14,823 | 16,536 | ||||||
| Kaiser Foundation Hospitals | 4.875% | 4/1/42 | 14,250 | 18,999 | ||||||
| Kroger Co. | 3.850% | 8/1/23 | 10,770 | 11,644 | ||||||
| Kroger Co. | 4.000% | 2/1/24 | 22,290 | 24,494 | ||||||
| McCormick & Co. Inc. | 2.500% | 4/15/30 | 3,205 | 3,427 | ||||||
| Medtronic Inc. | 3.500% | 3/15/25 | 13,468 | 15,094 | ||||||
| Memorial Sloan-Kettering Cancer Center | 2.955% | 1/1/50 | 18,985 | 20,347 | ||||||
| Memorial Sloan-Kettering Cancer Center | 4.125% | 7/1/52 | 12,320 | 15,973 | ||||||
| Memorial Sloan-Kettering Cancer Center | 4.200% | 7/1/55 | 10,630 | 14,142 | ||||||
| Merck & Co. Inc. | 2.750% | 2/10/25 | 47,090 | 50,971 | ||||||
| Merck & Co. Inc. | 3.400% | 3/7/29 | 49,240 | 57,469 | ||||||
| Merck & Co. Inc. | 4.150% | 5/18/43 | 22,090 | 28,974 | ||||||
| Merck & Co. Inc. | 4.000% | 3/7/49 | 52,385 | 69,069 | ||||||
| Mercy Health | 4.302% | 7/1/28 | 20,339 | 23,189 | ||||||
| Molson Coors Beverage Co. | 3.500% | 5/1/22 | 16,525 | 17,192 | ||||||
| Molson Coors Beverage Co. | 3.000% | 7/15/26 | 54,900 | 59,797 | ||||||
| Novartis Capital Corp. | 3.400% | 5/6/24 | 16,695 | 18,305 | ||||||
| Novartis Capital Corp. | 4.400% | 5/6/44 | 25,896 | 35,839 | ||||||
| Partners Healthcare System Inc. | 3.192% | 7/1/49 | 24,480 | 25,955 | ||||||
| Partners Healthcare System Inc. | 3.342% | 7/1/60 | 32,045 | 35,449 | ||||||
| PepsiCo Inc. | 4.000% | 3/5/42 | 51,391 | 65,650 | ||||||
| Pfizer Inc. | 3.450% | 3/15/29 | 70,335 | 82,402 | ||||||
| Pfizer Inc. | 1.700% | 5/28/30 | 6,065 | 6,239 | ||||||
| Pfizer Inc. | 4.100% | 9/15/38 | 53,995 | 69,032 | ||||||
| Pfizer Inc. | 2.550% | 5/28/40 | 7,535 | 7,958 | ||||||
| Pfizer Inc. | 2.700% | 5/28/50 | 8,330 | 8,918 | ||||||
| Philip Morris International Inc. | 2.500% | 8/22/22 | 21,645 | 22,443 | ||||||
| Philip Morris International Inc. | 3.600% | 11/15/23 | 7,000 | 7,653 | ||||||
| Philip Morris International Inc. | 3.375% | 8/11/25 | 14,440 | 16,086 | ||||||
| Philip Morris International Inc. | 4.875% | 11/15/43 | 6,185 | 8,318 | ||||||
| 3 | Procter & Gamble - Esop | 9.360% | 1/1/21 | 3,727 | 3,742 | |||||
| Providence St. Joseph Health Obligated Group | 2.532% | 10/1/29 | 17,470 | 18,608 | ||||||
| 3 | Providence St. Joseph Health Obligated Group | 3.930% | 10/1/48 | 11,805 | 14,211 | |||||
| 5 | Royalty Pharma plc | 3.300% | 9/2/40 | 14,550 | 15,215 | |||||
| 5 | Royalty Pharma plc | 3.550% | 9/2/50 | 39,091 | 40,297 | |||||
| RUSH Obligated Group | 3.922% | 11/15/29 | 11,880 | 13,739 | ||||||
| 5 | Sigma Alimentos SA de CV | 4.125% | 5/2/26 | 14,750 | 16,293 | |||||
| SSM Health Care Corp. | 3.823% | 6/1/27 | 34,910 | 39,008 | ||||||
| Sutter Health | 2.294% | 8/15/30 | 18,345 | 18,722 | ||||||
| Takeda Pharmaceutical Co. Ltd. | 2.050% | 3/31/30 | 30,355 | 30,955 | ||||||
| Takeda Pharmaceutical Co. Ltd. | 3.025% | 7/9/40 | 18,255 | 19,277 | ||||||
| Toledo Hospital | 5.750% | 11/15/38 | 18,910 | 22,164 | ||||||
| 5 | Upjohn Inc. | 3.850% | 6/22/40 | 14,665 | 16,514 | |||||
| 5 | Upjohn Inc. | 4.000% | 6/22/50 | 19,716 | 22,457 | |||||
| Wyeth LLC | 5.950% | 4/1/37 | 25,000 | 37,605 | ||||||
| Zeneca Wilmington Inc. | 7.000% | 11/15/23 | 29,000 | 34,179 | ||||||
| Energy (1.0%) | ||||||||||
| 5 | BG Energy Capital plc | 4.000% | 10/15/21 | 5,000 | 5,151 | |||||
| BP Capital Markets America Inc. | 3.245% | 5/6/22 | 35,000 | 36,443 | ||||||
| BP Capital Markets America Inc. | 1.749% | 8/10/30 | 7,780 | 7,682 | ||||||
| 12 |
Vanguard® Wellington Fund
Schedule of Investments
November 30, 2020
| Coupon | Maturity Date | Face Amount ($000) | Market Value ($000) | |||||||
| BP Capital Markets plc | 3.062% | 3/17/22 | 43,130 | 44,634 | ||||||
| BP Capital Markets plc | 2.500% | 11/6/22 | 22,000 | 22,897 | ||||||
| BP Capital Markets plc | 3.994% | 9/26/23 | 16,185 | 17,743 | ||||||
| BP Capital Markets plc | 3.814% | 2/10/24 | 38,938 | 42,655 | ||||||
| BP Capital Markets plc | 3.506% | 3/17/25 | 50,285 | 55,959 | ||||||
| Chevron Corp. | 3.191% | 6/24/23 | 25,330 | 27,003 | ||||||
| Cimarex Energy Co. | 4.375% | 6/1/24 | 31,555 | 34,001 | ||||||
| ConocoPhillips Co. | 4.950% | 3/15/26 | 4,385 | 5,246 | ||||||
| Dominion Energy Gas Holdings LLC | 3.550% | 11/1/23 | 21,445 | 23,102 | ||||||
| Dominion Energy Gas Holdings LLC | 3.000% | 11/15/29 | 19,580 | 21,644 | ||||||
| Dominion Energy Gas Holdings LLC | 4.800% | 11/1/43 | 4,185 | 5,419 | ||||||
| Dominion Energy Gas Holdings LLC | 4.600% | 12/15/44 | 24,863 | 31,508 | ||||||
| Energy Transfer Operating LP | 5.250% | 4/15/29 | 40,000 | 45,300 | ||||||
| Energy Transfer Operating LP | 5.000% | 5/15/50 | 14,445 | 15,167 | ||||||
| Energy Transfer Partners LP | 5.300% | 4/15/47 | 5,745 | 6,025 | ||||||
| Enterprise Products Operating LLC | 4.250% | 2/15/48 | 26,420 | 30,784 | ||||||
| Enterprise Products Operating LLC | 3.700% | 1/31/51 | 5,935 | 6,443 | ||||||
| Exxon Mobil Corp. | 2.726% | 3/1/23 | 11,910 | 12,491 | ||||||
| Exxon Mobil Corp. | 3.043% | 3/1/26 | 8,115 | 8,948 | ||||||
| Exxon Mobil Corp. | 2.275% | 8/16/26 | 36,735 | 39,354 | ||||||
| Exxon Mobil Corp. | 2.440% | 8/16/29 | 25,195 | 27,046 | ||||||
| Exxon Mobil Corp. | 2.610% | 10/15/30 | 35,925 | 39,047 | ||||||
| Exxon Mobil Corp. | 4.114% | 3/1/46 | 12,060 | 14,800 | ||||||
| Plains All American Pipeline LP / PAA Finance Corp. | 3.850% | 10/15/23 | 36,775 | 38,707 | ||||||
| 5 | Schlumberger Holdings Corp. | 3.900% | 5/17/28 | 31,025 | 34,458 | |||||
| 5 | Schlumberger Investment SA | 2.400% | 8/1/22 | 23,925 | 24,494 | |||||
| Schlumberger Investment SA | 3.650% | 12/1/23 | 44,520 | 48,015 | ||||||
| Shell International Finance BV | 3.250% | 5/11/25 | 11,051 | 12,226 | ||||||
| Shell International Finance BV | 4.125% | 5/11/35 | 43,465 | 53,857 | ||||||
| Shell International Finance BV | 5.500% | 3/25/40 | 12,990 | 18,708 | ||||||
| Shell International Finance BV | 4.375% | 5/11/45 | 96,700 | 124,825 | ||||||
| Suncor Energy Inc. | 5.950% | 12/1/34 | 20,700 | 25,593 | ||||||
| Sunoco Logistics Partners Operations LP | 5.350% | 5/15/45 | 3,500 | 3,671 | ||||||
| Sunoco Logistics Partners Operations LP | 5.400% | 10/1/47 | 750 | 801 | ||||||
| Total Capital International SA | 2.700% | 1/25/23 | 36,510 | 38,291 | ||||||
| Total Capital International SA | 3.750% | 4/10/24 | 41,500 | 45,814 | ||||||
| TransCanada PipeLines Ltd. | 4.875% | 1/15/26 | 47,256 | 55,838 | ||||||
| TransCanada PipeLines Ltd. | 4.100% | 4/15/30 | 7,125 | 8,303 | ||||||
| Other Industrial (0.3%) | ||||||||||
| 5 | CK Hutchison International 20 Ltd. | 3.375% | 5/8/50 | 22,015 | 24,590 | |||||
| 3 | Duke University | 2.832% | 10/1/55 | 25,700 | 27,672 | |||||
| Emory University | 2.143% | 9/1/30 | 25,475 | 26,610 | ||||||
| Georgetown University | 4.315% | 4/1/49 | 5,405 | 6,673 | ||||||
| Georgetown University | 2.943% | 4/1/50 | 9,430 | 9,147 | ||||||
| 3 | Johns Hopkins University | 4.083% | 7/1/53 | 7,805 | 10,434 | |||||
| 3 | Johns Hopkins University | 2.813% | 1/1/60 | 6,420 | 6,639 | |||||
| 3 | Northeastern University | 2.894% | 10/1/50 | 6,995 | 7,427 | |||||
| President & Fellows of Harvard College | 2.517% | 10/15/50 | 18,355 | 19,375 | ||||||
| 5 | SBA Tower Trust | 3.168% | 4/11/22 | 48,960 | 49,438 | |||||
| 5 | SBA Tower Trust | 3.448% | 3/15/23 | 23,770 | 25,173 | |||||
| 5 | SBA Tower Trust | 2.836% | 1/15/25 | 25,075 | 26,612 | |||||
| 5 | SBA Tower Trust | 1.884% | 1/15/26 | 8,960 | 9,110 | |||||
| 3 | University of Chicago | 2.761% | 4/1/45 | 5,825 | 6,006 | |||||
| Yale University | 1.482% | 4/15/30 | 12,135 | 12,263 | ||||||
| Yale University | 2.402% | 4/15/50 | 14,740 | 14,778 | ||||||
| Technology (2.1%) | ||||||||||
| Apple Inc. | 3.000% | 2/9/24 | 22,535 | 24,234 | ||||||
| Apple Inc. | 3.450% | 5/6/24 | 39,950 | 43,932 | ||||||
| Apple Inc. | 2.850% | 5/11/24 | 44,990 | 48,354 | ||||||
| Apple Inc. | 2.750% | 1/13/25 | 21,495 | 23,277 | ||||||
| Apple Inc. | 3.250% | 2/23/26 | 37,631 | 42,174 | ||||||
| Apple Inc. | 2.450% | 8/4/26 | 43,466 | 47,261 | ||||||
| Apple Inc. | 3.350% | 2/9/27 | 55,925 | 63,763 | ||||||
| 13 |
Vanguard® Wellington Fund
Schedule of Investments
November 30, 2020
| Coupon | Maturity Date | Face Amount ($000) | Market Value ($000) | |||||||
| Apple Inc. | 3.200% | 5/11/27 | 39,185 | 44,408 | ||||||
| Apple Inc. | 2.900% | 9/12/27 | 55,355 | 61,823 | ||||||
| Apple Inc. | 3.850% | 5/4/43 | 17,000 | 21,778 | ||||||
| Apple Inc. | 4.450% | 5/6/44 | 5,075 | 7,075 | ||||||
| Apple Inc. | 3.850% | 8/4/46 | 36,890 | 47,130 | ||||||
| Apple Inc. | 2.650% | 5/11/50 | 17,660 | 18,980 | ||||||
| Apple Inc. | 2.550% | 8/20/60 | 48,290 | 49,814 | ||||||
| Broadcom Corp. / Broadcom Cayman Finance Ltd. | 3.875% | 1/15/27 | 11,385 | 12,792 | ||||||
| Broadcom Inc. | 4.250% | 4/15/26 | 3,505 | 3,951 | ||||||
| Broadcom Inc. | 4.110% | 9/15/28 | 37,859 | 43,161 | ||||||
| Broadcom Inc. | 4.150% | 11/15/30 | 4,480 | 5,203 | ||||||
| Cisco Systems Inc. | 2.500% | 9/20/26 | 15,676 | 17,240 | ||||||
| Equinix Inc. | 3.000% | 7/15/50 | 34,420 | 35,331 | ||||||
| Fiserv Inc. | 3.200% | 7/1/26 | 23,105 | 25,888 | ||||||
| Global Payments Inc. | 2.900% | 5/15/30 | 14,680 | 15,994 | ||||||
| Intel Corp. | 2.875% | 5/11/24 | 29,395 | 31,651 | ||||||
| Intel Corp. | 4.100% | 5/19/46 | 51,605 | 66,444 | ||||||
| International Business Machines Corp. | 3.375% | 8/1/23 | 60,000 | 64,697 | ||||||
| International Business Machines Corp. | 3.625% | 2/12/24 | 35,000 | 38,334 | ||||||
| International Business Machines Corp. | 3.000% | 5/15/24 | 86,100 | 93,129 | ||||||
| International Business Machines Corp. | 3.300% | 5/15/26 | 155,985 | 175,765 | ||||||
| International Business Machines Corp. | 3.500% | 5/15/29 | 103,700 | 119,941 | ||||||
| International Business Machines Corp. | 5.875% | 11/29/32 | 20,240 | 29,135 | ||||||
| International Business Machines Corp. | 2.850% | 5/15/40 | 11,490 | 12,299 | ||||||
| International Business Machines Corp. | 2.950% | 5/15/50 | 4,545 | 4,899 | ||||||
| Microsoft Corp. | 2.875% | 2/6/24 | 57,005 | 61,186 | ||||||
| Microsoft Corp. | 3.125% | 11/3/25 | 17,700 | 19,751 | ||||||
| Microsoft Corp. | 3.500% | 2/12/35 | 23,520 | 29,243 | ||||||
| Microsoft Corp. | 3.450% | 8/8/36 | 65,320 | 81,069 | ||||||
| Microsoft Corp. | 4.100% | 2/6/37 | 28,491 | 37,531 | ||||||
| Microsoft Corp. | 3.700% | 8/8/46 | 61,115 | 78,960 | ||||||
| Microsoft Corp. | 2.525% | 6/1/50 | 122,844 | 131,469 | ||||||
| Oracle Corp. | 2.500% | 5/15/22 | 46,930 | 48,237 | ||||||
| Oracle Corp. | 2.950% | 11/15/24 | 79,830 | 86,600 | ||||||
| Oracle Corp. | 2.950% | 5/15/25 | 13,635 | 14,854 | ||||||
| Oracle Corp. | 3.250% | 11/15/27 | 111,485 | 126,495 | ||||||
| Oracle Corp. | 4.000% | 11/15/47 | 32,175 | 39,361 | ||||||
| Oracle Corp. | 3.600% | 4/1/50 | 47,245 | 54,971 | ||||||
| Oracle Corp. | 3.850% | 4/1/60 | 18,200 | 22,429 | ||||||
| 5 | QUALCOMM Inc. | 1.300% | 5/20/28 | 27,474 | 27,528 | |||||
| QUALCOMM Inc. | 2.150% | 5/20/30 | 29,475 | 31,288 | ||||||
| 5 | QUALCOMM Inc. | 1.650% | 5/20/32 | 41,155 | 41,104 | |||||
| QUALCOMM Inc. | 3.250% | 5/20/50 | 10,605 | 12,527 | ||||||
| 5 | Tencent Holdings Ltd. | 3.575% | 4/11/26 | 6,595 | 7,286 | |||||
| 5 | Tencent Holdings Ltd. | 3.595% | 1/19/28 | 57,300 | 62,937 | |||||
| 5 | Tencent Holdings Ltd. | 3.975% | 4/11/29 | 32,420 | 36,875 | |||||
| Transportation (0.5%) | ||||||||||
| 3,5 | British Airways 2020-1 Class A Pass Through Trust | 4.250% | 11/15/32 | 4,755 | 4,990 | |||||
| Burlington Northern Santa Fe LLC | 3.050% | 3/15/22 | 7,595 | 7,810 | ||||||
| Burlington Northern Santa Fe LLC | 3.000% | 3/15/23 | 21,397 | 22,511 | ||||||
| Burlington Northern Santa Fe LLC | 3.850% | 9/1/23 | 20,891 | 22,670 | ||||||
| Burlington Northern Santa Fe LLC | 4.550% | 9/1/44 | 6,000 | 8,204 | ||||||
| Burlington Northern Santa Fe LLC | 4.150% | 4/1/45 | 13,365 | 17,694 | ||||||
| Burlington Northern Santa Fe LLC | 4.050% | 6/15/48 | 2,715 | 3,604 | ||||||
| Burlington Northern Santa Fe LLC | 3.050% | 2/15/51 | 9,950 | 11,550 | ||||||
| Canadian National Railway Co. | 2.450% | 5/1/50 | 6,870 | 7,075 | ||||||
| 3 | Continental Airlines 2007-1 Class A Pass Through Trust | 5.983% | 10/19/23 | 16,323 | 16,011 | |||||
| CSX Corp. | 4.300% | 3/1/48 | 16,150 | 21,250 | ||||||
| CSX Corp. | 3.350% | 9/15/49 | 5,535 | 6,427 | ||||||
| 5 | ERAC USA Finance LLC | 4.500% | 8/16/21 | 9,295 | 9,555 | |||||
| 5 | ERAC USA Finance LLC | 7.000% | 10/15/37 | 32,995 | 50,579 | |||||
| 5 | ERAC USA Finance LLC | 5.625% | 3/15/42 | 21,787 | 30,020 | |||||
| 3 | Federal Express Corp. 1998 Pass Through Trust | 6.720% | 1/15/22 | 5,385 | 5,511 | |||||
| 14 |
Vanguard® Wellington Fund
Schedule of Investments
November 30, 2020
| Coupon | Maturity Date | Face Amount ($000) | Market Value ($000) | |||||||
| FedEx Corp. | 2.700% | 4/15/23 | 23,430 | 24,624 | ||||||
| FedEx Corp. | 4.100% | 2/1/45 | 4,455 | 5,292 | ||||||
| FedEx Corp. | 4.750% | 11/15/45 | 12,168 | 15,819 | ||||||
| FedEx Corp. | 4.550% | 4/1/46 | 6,073 | 7,667 | ||||||
| FedEx Corp. | 4.050% | 2/15/48 | 1,705 | 2,047 | ||||||
| FedEx Corp. | 4.950% | 10/17/48 | 11,474 | 15,511 | ||||||
| Kansas City Southern | 4.950% | 8/15/45 | 16,985 | 21,691 | ||||||
| 5 | Penske Truck Leasing Co. LP / PTL Finance Corp. | 3.450% | 7/1/24 | 16,420 | 17,862 | |||||
| 5 | Penske Truck Leasing Co. LP / PTL Finance Corp. | 2.700% | 11/1/24 | 10,220 | 10,892 | |||||
| 5 | Penske Truck Leasing Co. LP / PTL Finance Corp. | 3.950% | 3/10/25 | 52,010 | 57,965 | |||||
| 5 | Penske Truck Leasing Co. LP / PTL Finance Corp. | 4.450% | 1/29/26 | 16,450 | 18,837 | |||||
| 3 | Southwest Airlines Co. 2007-1 Pass Through Trust | 6.150% | 2/1/24 | 6,746 | 6,912 | |||||
| Union Pacific Corp. | 3.700% | 3/1/29 | 17,470 | 20,484 | ||||||
| Union Pacific Corp. | 3.250% | 2/5/50 | 14,495 | 16,601 | ||||||
| Union Pacific Corp. | 3.799% | 10/1/51 | 23,191 | 28,591 | ||||||
| Union Pacific Corp. | 3.839% | 3/20/60 | 9,530 | 11,647 | ||||||
| 5 | Union Pacific Corp. | 2.973% | 9/16/62 | 22,015 | 23,385 | |||||
| Union Pacific Corp. | 3.750% | 2/5/70 | 10,510 | 12,482 | ||||||
| 3 | United Airlines 2018-1 Class B Pass Through Trust | 4.600% | 3/1/26 | 6,407 | 5,644 | |||||
| 11,600,400 | ||||||||||
| Utilities (3.0%) | ||||||||||
| Electric (2.6%) | ||||||||||
| AEP Texas Inc. | 4.150% | 5/1/49 | 5,065 | 6,274 | ||||||
| AEP Texas Inc. | 3.450% | 1/15/50 | 16,810 | 19,148 | ||||||
| Alabama Power Co. | 5.700% | 2/15/33 | 15,000 | 20,704 | ||||||
| Alabama Power Co. | 3.750% | 3/1/45 | 24,430 | 29,502 | ||||||
| Alabama Power Co. | 4.300% | 7/15/48 | 28,015 | 37,616 | ||||||
| Ameren Illinois Co. | 3.800% | 5/15/28 | 22,215 | 26,144 | ||||||
| Ameren Illinois Co. | 6.125% | 12/15/28 | 54,000 | 67,759 | ||||||
| Ameren Illinois Co. | 3.700% | 12/1/47 | 5,045 | 6,229 | ||||||
| Arizona Public Service Co. | 3.350% | 5/15/50 | 11,220 | 13,149 | ||||||
| Baltimore Gas and Electric Co. | 2.900% | 6/15/50 | 6,549 | 7,066 | ||||||
| Berkshire Hathaway Energy Co. | 6.125% | 4/1/36 | 41,185 | 61,407 | ||||||
| Berkshire Hathaway Energy Co. | 5.950% | 5/15/37 | 830 | 1,216 | ||||||
| Berkshire Hathaway Energy Co. | 5.150% | 11/15/43 | 10,715 | 14,892 | ||||||
| 5 | Berkshire Hathaway Energy Co. | 4.250% | 10/15/50 | 15,865 | 20,731 | |||||
| Cleco Corporate Holdings LLC | 3.375% | 9/15/29 | 9,180 | 9,300 | ||||||
| Commonwealth Edison Co. | 4.350% | 11/15/45 | 13,610 | 17,727 | ||||||
| Commonwealth Edison Co. | 3.650% | 6/15/46 | 6,365 | 7,594 | ||||||
| Commonwealth Edison Co. | 4.000% | 3/1/48 | 17,455 | 22,185 | ||||||
| Consolidated Edison Co. of New York Inc. | 4.500% | 12/1/45 | 36,735 | 47,235 | ||||||
| Consolidated Edison Co. of New York Inc. | 3.850% | 6/15/46 | 2,729 | 3,238 | ||||||
| Consolidated Edison Co. of New York Inc. | 3.950% | 4/1/50 | 1,690 | 2,081 | ||||||
| Consolidated Edison Co. of New York Inc. | 4.625% | 12/1/54 | 66,625 | 90,482 | ||||||
| Consolidated Edison Co. of New York Inc. | 4.500% | 5/15/58 | 22,530 | 30,606 | ||||||
| Delmarva Power & Light Co. | 3.500% | 11/15/23 | 11,816 | 12,788 | ||||||
| Dominion Energy Inc. | 2.715% | 8/15/21 | 15,805 | 16,034 | ||||||
| 5 | Dominion Energy Inc. | 2.450% | 1/15/23 | 111,320 | 115,623 | |||||
| Dominion Energy Inc. | 5.250% | 8/1/33 | 5,706 | 7,319 | ||||||
| Dominion Energy Inc. | 4.600% | 3/15/49 | 27,385 | 37,023 | ||||||
| Dominion Energy South Carolina Inc. | 6.625% | 2/1/32 | 4,886 | 7,020 | ||||||
| Dominion Energy South Carolina Inc. | 5.300% | 5/15/33 | 1,438 | 1,928 | ||||||
| Dominion Energy South Carolina Inc. | 6.050% | 1/15/38 | 44,155 | 65,135 | ||||||
| Dominion Energy South Carolina Inc. | 5.450% | 2/1/41 | 2,945 | 4,186 | ||||||
| Dominion Energy South Carolina Inc. | 4.600% | 6/15/43 | 7,251 | 9,630 | ||||||
| Dominion Energy South Carolina Inc. | 5.100% | 6/1/65 | 29,850 | 46,625 | ||||||
| DTE Energy Co. | 3.800% | 3/15/27 | 9,550 | 10,880 | ||||||
| Duke Energy Carolinas LLC | 6.050% | 4/15/38 | 4,000 | 6,049 | ||||||
| Duke Energy Carolinas LLC | 3.700% | 12/1/47 | 17,085 | 20,721 | ||||||
| Duke Energy Corp. | 2.650% | 9/1/26 | 11,775 | 12,808 | ||||||
| Duke Energy Corp. | 3.400% | 6/15/29 | 12,030 | 13,667 | ||||||
| Duke Energy Corp. | 4.800% | 12/15/45 | 44,700 | 60,813 | ||||||
| Duke Energy Corp. | 3.750% | 9/1/46 | 9,940 | 11,862 | ||||||
| 15 |
Vanguard® Wellington Fund
Schedule of Investments
November 30, 2020
| Coupon | Maturity Date | Face Amount ($000) | Market Value ($000) | |||||||
| Duke Energy Florida LLC | 6.350% | 9/15/37 | 8,000 | 12,233 | ||||||
| Duke Energy Florida LLC | 6.400% | 6/15/38 | 27,055 | 42,216 | ||||||
| Duke Energy Progress LLC | 6.300% | 4/1/38 | 14,705 | 22,364 | ||||||
| Duke Energy Progress LLC | 4.100% | 3/15/43 | 615 | 769 | ||||||
| Duke Energy Progress LLC | 4.200% | 8/15/45 | 40,400 | 51,776 | ||||||
| Emera US Finance LP | 3.550% | 6/15/26 | 34,050 | 37,926 | ||||||
| Entergy Louisiana LLC | 3.120% | 9/1/27 | 14,935 | 16,621 | ||||||
| Evergy Inc. | 2.450% | 9/15/24 | 10,420 | 11,042 | ||||||
| Evergy Inc. | 2.900% | 9/15/29 | 15,865 | 17,221 | ||||||
| Evergy Metro Inc. | 2.250% | 6/1/30 | 5,680 | 6,044 | ||||||
| Eversource Energy | 2.900% | 10/1/24 | 17,450 | 18,846 | ||||||
| Eversource Energy | 3.150% | 1/15/25 | 5,025 | 5,465 | ||||||
| Eversource Energy | 3.300% | 1/15/28 | 14,410 | 16,039 | ||||||
| Florida Power & Light Co. | 5.650% | 2/1/35 | 50,000 | 69,838 | ||||||
| Florida Power & Light Co. | 4.950% | 6/1/35 | 10,000 | 13,938 | ||||||
| Florida Power & Light Co. | 5.650% | 2/1/37 | 5,000 | 7,170 | ||||||
| Florida Power & Light Co. | 5.950% | 2/1/38 | 39,215 | 58,635 | ||||||
| Florida Power & Light Co. | 5.690% | 3/1/40 | 4,000 | 5,995 | ||||||
| Florida Power & Light Co. | 3.700% | 12/1/47 | 17,370 | 21,568 | ||||||
| Fortis Inc. | 3.055% | 10/4/26 | 28,565 | 31,267 | ||||||
| Georgia Power Co. | 5.400% | 6/1/40 | 6,665 | 8,978 | ||||||
| Georgia Power Co. | 4.750% | 9/1/40 | 25,858 | 33,606 | ||||||
| Georgia Power Co. | 4.300% | 3/15/42 | 9,934 | 12,347 | ||||||
| Indiana Michigan Power Co. | 4.250% | 8/15/48 | 14,980 | 19,102 | ||||||
| Kansas City Power & Light Co. | 4.200% | 3/15/48 | 3,419 | 4,325 | ||||||
| 5 | Massachusetts Electric Co. | 5.900% | 11/15/39 | 21,565 | 31,749 | |||||
| 5 | Metropolitan Edison Co. | 4.300% | 1/15/29 | 6,572 | 7,497 | |||||
| 5 | Mid-Atlantic Interstate Transmission LLC | 4.100% | 5/15/28 | 2,345 | 2,639 | |||||
| MidAmerican Energy Co. | 4.250% | 5/1/46 | 5,485 | 7,070 | ||||||
| MidAmerican Energy Co. | 4.250% | 7/15/49 | 11,545 | 15,709 | ||||||
| MidAmerican Energy Co. | 3.150% | 4/15/50 | 45,450 | 52,787 | ||||||
| 5 | Monongahela Power Co. | 5.400% | 12/15/43 | 4,570 | 6,264 | |||||
| National Rural Utilities Cooperative Finance Corp. | 2.950% | 2/7/24 | 15,255 | 16,292 | ||||||
| National Rural Utilities Cooperative Finance Corp. | 2.850% | 1/27/25 | 40,345 | 43,760 | ||||||
| Nevada Power Co. | 3.125% | 8/1/50 | 17,790 | 19,792 | ||||||
| NextEra Energy Capital Holdings Inc. | 2.403% | 9/1/21 | 43,950 | 44,633 | ||||||
| NextEra Energy Capital Holdings Inc. | 3.250% | 4/1/26 | 9,260 | 10,336 | ||||||
| NextEra Energy Capital Holdings Inc. | 3.550% | 5/1/27 | 32,275 | 36,415 | ||||||
| NextEra Energy Capital Holdings Inc. | 3.500% | 4/1/29 | 14,165 | 16,130 | ||||||
| NextEra Energy Capital Holdings Inc. | 2.250% | 6/1/30 | 40,110 | 41,958 | ||||||
| 5 | Niagara Mohawk Power Corp. | 4.278% | 12/15/28 | 35,970 | 43,111 | |||||
| 5 | Niagara Mohawk Power Corp. | 3.025% | 6/27/50 | 14,840 | 15,813 | |||||
| Northern States Power Co. | 6.250% | 6/1/36 | 50,000 | 74,952 | ||||||
| 3,5 | Oglethorpe Power Corp. | 6.191% | 1/1/31 | 36,565 | 45,078 | |||||
| Oglethorpe Power Corp. | 5.950% | 11/1/39 | 6,075 | 8,011 | ||||||
| Oglethorpe Power Corp. | 4.550% | 6/1/44 | 1,825 | 2,021 | ||||||
| Oglethorpe Power Corp. | 4.250% | 4/1/46 | 19,060 | 19,939 | ||||||
| Oglethorpe Power Corp. | 5.050% | 10/1/48 | 5,640 | 7,036 | ||||||
| 5 | Oglethorpe Power Corp. | 3.750% | 8/1/50 | 8,520 | 9,042 | |||||
| Oglethorpe Power Corp. | 5.250% | 9/1/50 | 17,220 | 21,611 | ||||||
| Oncor Electric Delivery Co. LLC | 4.550% | 12/1/41 | 2,675 | 3,454 | ||||||
| PacifiCorp | 2.950% | 6/1/23 | 29,675 | 31,339 | ||||||
| PacifiCorp | 2.700% | 9/15/30 | 5,025 | 5,547 | ||||||
| PacifiCorp | 5.900% | 8/15/34 | 12,500 | 16,864 | ||||||
| PacifiCorp | 6.250% | 10/15/37 | 36,635 | 54,725 | ||||||
| PacifiCorp | 4.125% | 1/15/49 | 2,141 | 2,769 | ||||||
| PacifiCorp | 4.150% | 2/15/50 | 11,625 | 15,004 | ||||||
| PacifiCorp | 3.300% | 3/15/51 | 11,806 | 13,531 | ||||||
| Potomac Electric Power Co. | 3.050% | 4/1/22 | 3,765 | 3,890 | ||||||
| Potomac Electric Power Co. | 6.500% | 11/15/37 | 25,000 | 37,900 | ||||||
| San Diego Gas & Electric Co. | 6.000% | 6/1/26 | 3,600 | 4,423 | ||||||
| San Diego Gas & Electric Co. | 3.750% | 6/1/47 | 5,390 | 6,334 | ||||||
| San Diego Gas & Electric Co. | 4.150% | 5/15/48 | 5,940 | 7,446 | ||||||
| Sierra Pacific Power Co. | 3.375% | 8/15/23 | 34,040 | 36,379 | ||||||
16
Vanguard® Wellington Fund
Schedule of Investments
November 30, 2020
| Coupon | Maturity Date | Face Amount ($000) | Market Value ($000) | |||||||
| Sierra Pacific Power Co. | 2.600% | 5/1/26 | 7,857 | 8,541 | ||||||
| South Carolina Electric & Gas Co. | 5.800% | 1/15/33 | 9,000 | 11,735 | ||||||
| Southern California Edison Co. | 2.400% | 2/1/22 | 4,295 | 4,373 | ||||||
| Southern California Edison Co. | 3.700% | 8/1/25 | 3,315 | 3,703 | ||||||
| Southern California Edison Co. | 6.000% | 1/15/34 | 7,695 | 10,503 | ||||||
| Southern California Edison Co. | 5.550% | 1/15/37 | 50,475 | 64,220 | ||||||
| Southern California Edison Co. | 5.950% | 2/1/38 | 40,000 | 53,617 | ||||||
| Southern California Edison Co. | 6.050% | 3/15/39 | 1,980 | 2,678 | ||||||
| Southern California Edison Co. | 4.000% | 4/1/47 | 6,530 | 7,760 | ||||||
| Southern California Edison Co. | 4.125% | 3/1/48 | 11,495 | 13,954 | ||||||
| Southern California Edison Co. | 3.650% | 2/1/50 | 5,405 | 6,277 | ||||||
| Southern Co. | 3.250% | 7/1/26 | 30,885 | 34,576 | ||||||
| Southern Co. | 4.400% | 7/1/46 | 41,137 | 53,104 | ||||||
| Southwestern Electric Power Co. | 6.200% | 3/15/40 | 9,800 | 14,149 | ||||||
| Southwestern Public Service Co. | 3.700% | 8/15/47 | 3,756 | 4,476 | ||||||
| Union Electric Co. | 4.000% | 4/1/48 | 14,316 | 18,072 | ||||||
| Virginia Electric & Power Co. | 2.750% | 3/15/23 | 34,540 | 36,182 | ||||||
| Virginia Electric & Power Co. | 3.500% | 3/15/27 | 16,025 | 18,332 | ||||||
| Virginia Electric & Power Co. | 6.000% | 5/15/37 | 1,740 | 2,549 | ||||||
| Westar Energy Inc. | 3.250% | 9/1/49 | 9,000 | 10,111 | ||||||
| Wisconsin Electric Power Co. | 5.700% | 12/1/36 | 17,280 | 24,283 | ||||||
| Wisconsin Public Service Corp. | 6.080% | 12/1/28 | 45,000 | 57,694 | ||||||
| Natural Gas (0.3%) | ||||||||||
| 5 | Boston Gas Co. | 3.150% | 8/1/27 | 5,385 | 5,913 | |||||
| 5 | Boston Gas Co. | 3.001% | 8/1/29 | 5,970 | 6,577 | |||||
| 5 | Brooklyn Union Gas Co. | 3.407% | 3/10/26 | 2,685 | 2,990 | |||||
| 5 | Brooklyn Union Gas Co. | 4.273% | 3/15/48 | 61,265 | 77,391 | |||||
| CenterPoint Energy Resources Corp. | 4.000% | 4/1/28 | 8,068 | 9,493 | ||||||
| 5 | East Ohio Gas Co. | 2.000% | 6/15/30 | 8,960 | 9,298 | |||||
| 5 | East Ohio Gas Co. | 3.000% | 6/15/50 | 13,050 | 14,264 | |||||
| 5 | Infraestructura Energetica Nova SAB de CV | 4.875% | 1/14/48 | 16,565 | 16,379 | |||||
| 5 | KeySpan Gas East Corp. | 2.742% | 8/15/26 | 25,345 | 27,816 | |||||
| NiSource Finance Corp. | 5.250% | 2/15/43 | 14,588 | 20,028 | ||||||
| NiSource Finance Corp. | 4.800% | 2/15/44 | 10,370 | 13,713 | ||||||
| Sempra Energy | 2.875% | 10/1/22 | 27,530 | 28,457 | ||||||
| Sempra Energy | 3.250% | 6/15/27 | 80,765 | 88,898 | ||||||
| Sempra Energy | 6.000% | 10/15/39 | 14,800 | 21,225 | ||||||
| Southwest Gas Corp. | 2.200% | 6/15/30 | 6,310 | 6,620 | ||||||
| Other Utility (0.1%) | ||||||||||
| American Water Capital Corp. | 2.950% | 9/1/27 | 9,975 | 11,009 | ||||||
| American Water Capital Corp. | 3.750% | 9/1/47 | 1,435 | 1,764 | ||||||
| American Water Capital Corp. | 4.200% | 9/1/48 | 30,403 | 39,947 | ||||||
| American Water Capital Corp. | 4.150% | 6/1/49 | 850 | 1,121 | ||||||
| American Water Capital Corp. | 3.450% | 5/1/50 | 2,280 | 2,699 | ||||||
| 3,273,468 | ||||||||||
| Total Corporate Bonds (Cost $20,221,804) | 23,373,297 | |||||||||
| Sovereign Bonds (0.8%) | ||||||||||
| 3,5 | Bermuda | 2.375% | 8/20/30 | 6,730 | 6,999 | |||||
| 3,5 | Bermuda | 3.375% | 8/20/50 | 6,835 | 7,226 | |||||
| 5 | Electricite de France SA | 4.875% | 9/21/38 | 69,680 | 87,593 | |||||
| 5 | Electricite de France SA | 4.950% | 10/13/45 | 15,100 | 19,595 | |||||
| Equinor ASA | 2.450% | 1/17/23 | 15,017 | 15,657 | ||||||
| Equinor ASA | 2.650% | 1/15/24 | 14,000 | 14,856 | ||||||
| Equinor ASA | 3.700% | 3/1/24 | 25,320 | 27,783 | ||||||
| Equinor ASA | 3.250% | 11/10/24 | 25,200 | 27,655 | ||||||
| Equinor ASA | 2.875% | 4/6/25 | 4,775 | 5,181 | ||||||
| Equinor ASA | 3.125% | 4/6/30 | 80,155 | 89,969 | ||||||
| Equinor ASA | 2.375% | 5/22/30 | 7,585 | 8,043 | ||||||
| International Bank for Reconstruction & Development | 4.750% | 2/15/35 | 40,000 | 57,446 | ||||||
| 5 | Kingdom of Saudi Arabia | 2.875% | 3/4/23 | 30,195 | 31,562 | |||||
| 3 | Republic of Colombia | 4.000% | 2/26/24 | 30,240 | 32,433 | |||||
17
Vanguard® Wellington Fund
Schedule of Investments
November 30, 2020
| Coupon | Maturity Date | Face Amount ($000) | Market Value ($000) | |||||||
| 5 | Saudi Arabian Oil Co. | 3.500% | 4/16/29 | 28,670 | 31,715 | |||||
| 5 | Sinopec Group Overseas Development 2015 Ltd. | 3.250% | 4/28/25 | 62,500 | 67,103 | |||||
| 5 | Sinopec Group Overseas Development 2017 Ltd. | 3.000% | 4/12/22 | 31,000 | 31,817 | |||||
| 5 | State Grid Overseas Investment 2016 Ltd. | 2.750% | 5/4/22 | 62,480 | 63,980 | |||||
| 5 | State Grid Overseas Investment 2016 Ltd. | 3.500% | 5/4/27 | 28,630 | 31,859 | |||||
| 5 | State of Kuwait | 2.750% | 3/20/22 | 4,255 | 4,373 | |||||
| 5 | State of Qatar | 2.375% | 6/2/21 | 25,190 | 25,443 | |||||
| 5 | State of Qatar | 3.875% | 4/23/23 | 56,160 | 60,318 | |||||
| 5 | State of Qatar | 3.375% | 3/14/24 | 3,360 | 3,629 | |||||
| 5 | State of Qatar | 4.400% | 4/16/50 | 14,035 | 18,613 | |||||
| 5 | Temasek Financial I Ltd. | 2.375% | 1/23/23 | 45,150 | 46,956 | |||||
| 5 | Temasek Financial I Ltd. | 3.625% | 8/1/28 | 36,800 | 43,243 | |||||
| 5 | Temasek Financial I Ltd. | 2.250% | 4/6/51 | 39,210 | 39,640 | |||||
| 5 | Temasek Financial I Ltd. | 2.500% | 10/6/70 | 22,880 | 23,208 | |||||
| Total Sovereign Bonds (Cost $828,556) | 923,895 | |||||||||
| Taxable Municipal Bonds (1.9%) | ||||||||||
| Atlanta GA Downtown Development Authority Revenue | 6.875% | 2/1/21 | 1,510 | 1,527 | ||||||
| Atlanta GA Water & Wastewater Revenue | 2.257% | 11/1/35 | 7,620 | 7,851 | ||||||
| Bay Area Toll Authority California Toll Bridge Revenue (San Francisco Bay Area) | 2.574% | 4/1/31 | 14,455 | 15,554 | ||||||
| Bay Area Toll Authority California Toll Bridge Revenue (San Francisco Bay Area) | 6.263% | 4/1/49 | 1,965 | 3,397 | ||||||
| Bay Area Toll Authority California Toll Bridge Revenue (San Francisco Bay Area) | 7.043% | 4/1/50 | 29,920 | 54,459 | ||||||
| Broward County FL Airport System Revenue | 3.477% | 10/1/43 | 10,370 | 10,782 | ||||||
| California GO | 7.350% | 11/1/39 | 56,970 | 94,327 | ||||||
| Chicago IL Metropolitan Water Reclamation District GO | 5.720% | 12/1/38 | 8,545 | 12,113 | ||||||
| Chicago IL O'Hare International Airport Revenue | 6.395% | 1/1/40 | 3,205 | 4,813 | ||||||
| Chicago IL Transit Authority Sales Tax Receipts Revenue | 6.200% | 12/1/40 | 2,260 | 3,079 | ||||||
| Chicago IL Transit Authority Sales Tax Receipts Revenue | 6.899% | 12/1/40 | 57,835 | 81,997 | ||||||
| Chicago IL Transit Authority Transfer Tax Receipts Revenue | 6.899% | 12/1/40 | 33,870 | 48,020 | ||||||
| City of Riverside CA Revenue | 3.857% | 6/1/45 | 8,775 | 9,400 | ||||||
| City of San Antonio TX Electric & Gas Systems Revenue | 2.905% | 2/1/48 | 8,220 | 8,422 | ||||||
| Dallas Fort Worth TX International Airport Revenue | 3.089% | 11/1/40 | 7,405 | 7,524 | ||||||
| Dallas Fort Worth TX International Airport Revenue | 2.919% | 11/1/50 | 5,565 | 5,539 | ||||||
| Foothill-Eastern Transportation Corridor Agency CA Toll Road Revenue | 4.094% | 1/15/49 | 5,345 | 5,619 | ||||||
| 7 | Foothill-Eastern Transportation Corridor Agency CA Toll Road Revenue | 3.924% | 1/15/53 | 39,440 | 41,759 | |||||
| Georgia Municipal Electric Power Authority Revenue | 6.637% | 4/1/57 | 66,616 | 99,925 | ||||||
| Georgia Municipal Electric Power Authority Revenue | 6.655% | 4/1/57 | 10,164 | 15,473 | ||||||
| Grand Parkway Transportation Corp. Texas System Toll Revenue | 5.184% | 10/1/42 | 40,435 | 57,309 | ||||||
| Grand Parkway Transportation Corp. Texas System Toll Revenue | 3.236% | 10/1/52 | 28,900 | 29,913 | ||||||
| Great Lakes Water Authority Sewage Disposal System Revenue | 3.056% | 7/1/39 | 8,495 | 9,029 | ||||||
| Houston TX GO | 6.290% | 3/1/32 | 16,850 | 21,424 | ||||||
| Illinois GO | 5.100% | 6/1/33 | 30,560 | 30,659 | ||||||
| Illinois Toll Highway Authority Revenue | 6.184% | 1/1/34 | 29,200 | 41,966 | ||||||
| JobsOhio Beverage System Statewide Liquor Profits Revenue | 2.833% | 1/1/38 | 5,480 | 5,901 | ||||||
| Kansas Development Finance Authority Revenue | 4.927% | 4/15/45 | 7,745 | 10,481 | ||||||
| 7 | Kansas Development Finance Authority Revenue (Public Employees Retirement System) | 5.501% | 5/1/34 | 50,000 | 65,390 | |||||
| Louisville & Jefferson County KY Metropolitan Sewer District Sewer & Drainage System Revenue | 6.250% | 5/15/43 | 19,000 | 29,395 | ||||||
18
Vanguard® Wellington Fund
Schedule of Investments
November 30, 2020
| Coupon | Maturity Date | Face Amount ($000) | Market Value ($000) | |||||||
| Maryland Transportation Authority Facilities Projects Revenue | 5.888% | 7/1/43 | 18,985 | 27,837 | ||||||
| Massachusetts GO | 2.514% | 7/1/41 | 8,175 | 8,321 | ||||||
| Massachusetts School Building Authority Revenue | 1.753% | 8/15/30 | 41,345 | 41,911 | ||||||
| Massachusetts School Building Authority Revenue | 2.950% | 5/15/43 | 21,350 | 22,114 | ||||||
| Massachusetts School Building Authority Dedicated Sales Tax Revenue | 5.715% | 8/15/39 | 22,105 | 31,875 | ||||||
| Massachusetts School Building Authority Dedicated Sales Tax Revenue | 3.395% | 10/15/40 | 17,040 | 17,927 | ||||||
| Michigan Finance Authority Revenue (Trinity Health Credit Group) | 3.084% | 12/1/34 | 11,320 | 12,211 | ||||||
| New Jersey Turnpike Authority Revenue | 7.414% | 1/1/40 | 35,285 | 59,093 | ||||||
| New Jersey Turnpike Authority Revenue | 7.102% | 1/1/41 | 1,705 | 2,779 | ||||||
| New York Metropolitan Transportation Authority Revenue | 6.200% | 11/15/26 | 2,195 | 2,415 | ||||||
| New York Metropolitan Transportation Authority Revenue | 5.175% | 11/15/49 | 23,665 | 26,535 | ||||||
| New York Metropolitan Transportation Authority Revenue | 6.814% | 11/15/40 | 27,295 | 34,984 | ||||||
| New York Metropolitan Transportation Authority Revenue (Dedicated Tax Fund) | 7.336% | 11/15/39 | 10,860 | 17,412 | ||||||
| New York Metropolitan Transportation Authority Revenue (Dedicated Tax Fund) | 6.089% | 11/15/40 | 16,085 | 22,410 | ||||||
| New York State Dormitory Authority Revenue (Personal Income Tax) | 3.110% | 2/15/39 | 21,260 | 22,800 | ||||||
| New York State Dormitory Authority Revenue (Personal Income Tax) | 3.190% | 2/15/43 | 12,095 | 13,101 | ||||||
| New York State Thruway Authority Revenue | 2.900% | 1/1/35 | 16,730 | 18,171 | ||||||
| New York State Thruway Authority Revenue | 3.500% | 1/1/42 | 9,430 | 9,831 | ||||||
| New York State Urban Development Corp. Revenue | 2.100% | 3/15/22 | 57,115 | 57,653 | ||||||
| North Texas Tollway Authority System Revenue | 6.718% | 1/1/49 | 44,035 | 76,280 | ||||||
| Oregon Department of Transportation Highway User Tax Revenue | 5.834% | 11/15/34 | 25,930 | 37,778 | ||||||
| 7 | Oregon School Boards Association GO | 5.528% | 6/30/28 | 50,000 | 60,399 | |||||
| 8 | Oregon State University Revenue | 3.424% | 3/1/60 | 28,000 | 28,484 | |||||
| Pennsylvania State University Revenue | 2.790% | 9/1/43 | 18,660 | 19,430 | ||||||
| Pennsylvania State University Revenue | 2.840% | 9/1/50 | 4,385 | 4,480 | ||||||
| 9 | Philadelphia PA Authority for Industrial Development Authority Revenue | 6.550% | 10/15/28 | 66,810 | 85,872 | |||||
| Port Authority of New York & New Jersey Revenue | 1.086% | 7/1/23 | 18,690 | 18,903 | ||||||
| Port Authority of New York & New Jersey Revenue | 5.859% | 12/1/24 | 2,600 | 3,067 | ||||||
| Port Authority of New York & New Jersey Revenue | 6.040% | 12/1/29 | 10,455 | 13,904 | ||||||
| Port Authority of New York & New Jersey Revenue | 4.458% | 10/1/62 | 44,055 | 57,396 | ||||||
| Port Authority of New York & New Jersey Revenue | 4.810% | 10/15/65 | 21,985 | 30,071 | ||||||
| Regents of the University of California Medical Center Pooled Revenue | 3.006% | 5/15/50 | 15,445 | 16,544 | ||||||
| Regents of the University of California Medical Center Pooled Revenue | 3.256% | 5/15/60 | 29,920 | 32,425 | ||||||
| Riverside County CA Pension Revenue | 3.818% | 2/15/38 | 9,585 | 10,578 | ||||||
| Rutgers The State University of New Jersey Revenue | 3.270% | 5/1/43 | 11,960 | 12,785 | ||||||
| Sales Tax Securitization Corp. Illinois Revenue | 4.787% | 1/1/48 | 20,690 | 24,983 | ||||||
| Stanford University Revenue | 6.875% | 2/1/24 | 13,685 | 16,185 | ||||||
| Stanford University Revenue | 7.650% | 6/15/26 | 29,000 | 39,053 | ||||||
| State Board of Administration Finance Corp. Revenue | 1.705% | 7/1/27 | 34,055 | 35,010 | ||||||
| Texas Transportation Commission Revenue | 2.562% | 4/1/42 | 7,310 | 7,427 | ||||||
| Texas Transportation Commission State Highway Fund | 4.000% | 10/1/33 | 16,665 | 20,932 | ||||||
| University of California Revenue | 1.316% | 5/15/27 | 13,075 | 13,211 | ||||||
| University of California Revenue | 1.614% | 5/15/30 | 21,900 | 21,771 | ||||||
| University of California Revenue | 3.931% | 5/15/45 | 22,370 | 26,017 | ||||||
| University of California Revenue | 4.601% | 5/15/31 | 21,975 | 26,276 | ||||||
| University of California Revenue | 4.765% | 5/15/44 | 5,980 | 6,610 | ||||||
| University of California Regents Medical Center Revenue | 6.548% | 5/15/48 | 10,400 | 16,754 | ||||||
| University of California Regents Medical Center Revenue | 6.583% | 5/15/49 | 15,225 | 24,411 | ||||||
| University of Michigan Revenue | 2.437% | 4/1/40 | 13,955 | 14,640 | ||||||
19
Vanguard® Wellington Fund
Schedule of Investments
November 30, 2020
| Coupon | Maturity Date |
Face Amount ($000) |
Market Value ($000) | |||||||
| University of Michigan Revenue | 2.562% | 4/1/50 | 10,105 | 10,836 | ||||||
| University of Virginia Revenue | 2.256% | 9/1/50 | 15,335 | 15,170 | ||||||
| Total Taxable Municipal Bonds (Cost $1,767,626) | 2,110,109 | |||||||||
| Shares | |||||||||
| Temporary Cash Investments (3.2%) | |||||||||
| Money Market Fund (0.0%) | |||||||||
| 10 | Vanguard Market Liquidity Fund | 0.109% | 1,886 | 188 | |||||
| Maturity Date | Face Amount ($000) | |||||||||
| Repurchase Agreements (1.8%) | ||||||||||
| Bank of America Securities, LLC (Dated 11/30/20, Repurchase Value $21,700,000, collateralized by Federal Home Loan Bank 3.840%-4.250%, 9/28/28-10/19/38, with a value of $22,138,000) | 0.090% | 12/1/20 | 21,700 | 21,700 | ||||||
| Citigroup Global Markets Inc. (Dated 11/30/20, Repurchase Value $240,900,000, collateralized by U.S. Treasury Note/Bond 2.500%-6.500%, 11/15/26-2/15/48, and U.S. Treasury Bill 0.000%, 1/19/21-2/23/21, with a value of $245,718,000) | 0.070% | 12/1/20 | 240,900 | 240,900 | ||||||
| Credit Agricole Securities (USA) Inc. (Dated 11/30/20, Repurchase Value $447,501,000, collateralized by U.S. Treasury Note/Bond 1.250%-4.375%, 5/15/41-8/15/50, with a value of $456,450,000) | 0.070% | 12/1/20 | 447,500 | 447,500 | ||||||
| Deutsche Bank Securities, Inc. (Dated 11/30/20, Repurchase Value $152,300,000, collateralized by U.S. Treasury Note/Bond 0.375%, 11/30/25, with a value of $155,346,000) | 0.090% | 12/1/20 | 152,300 | 152,300 | ||||||
| HSBC Bank USA (Dated 11/30/20, Repurchase Value $57,800,000, collateralized by U.S. Treasury Note/Bond 0.625%-4.625%, 2/28/22-8/15/50, with a value of $58,956,000) | 0.070% | 12/1/20 | 57,800 | 57,800 | ||||||
| HSBC Bank USA (Dated 11/30/20, Repurchase Value $100,400,000, collateralized by Federal Home Loan Mortgage Corp. 3.000%-4.000%, 9/1/42-7/1/50, and Federal National Mortgage Assn. 2.500%-4.500%, 7/1/35-10/1/50, with a value of $102,408,000) | 0.090% | 12/1/20 | 100,400 | 100,400 | ||||||
| Nomura International plc (Dated 11/30/20, Repurchase Value $562,101,000, collateralized by U.S. Treasury Note/Bond 0.125%-3.375%, 2/28/21-2/15/43, with a value of $573,342,000) | 0.070% | 12/1/20 | 562,100 | 562,100 | ||||||
| RBC Capital Markets LLC (Dated 11/30/20, Repurchase Value $155,600,000, collateralized by Federal Home Loan Mortgage Corp. 2.500%, 9/1/50-11/1/50, and Federal National Mortgage Assn. 2.000%-3.000%, 2/1/50-12/1/50, with a value of $158,712,000) | 0.080% | 12/1/20 | 155,600 | 155,600 | ||||||
| TD Securities (USA) LLC (Dated 11/30/20, Repurchase Value $80,200,000, collateralized by U.S. Treasury Bill 0.000%, 3/2/21, with a value of $81,804,000) | 0.090% | 12/1/20 | 80,200 | 80,200 | ||||||
| Wells Fargo & Co. (Dated 11/30/20, Repurchase Value $144,200,000, collateralized by Federal National Mortgage Assn. 2.500%-5.500%, 7/1/33-12/1/50, with a value of $147,084,000) | 0.090% | 12/1/20 | 144,200 | 144,200 | ||||||
| 1,962,700 | ||||||||||
| U.S. Government and Agency Obligations (1.4%) | ||||||||||
| United States Cash Management Bill | 0.090% | 4/13/21 | 152,800 | 152,750 | ||||||
| 1 | United States Treasury Bill | 0.108% | 3/25/21 | 1,000,000 | 999,700 | |||||
| United States Treasury Bill | 0.096% | 4/15/21 | 424,000 | 423,864 | ||||||
| 1,576,314 | ||||||||||
20
Vanguard® Wellington Fund
Schedule of Investments
November 30, 2020
| Amount ($000) | |
| Total Temporary Cash Investments (Cost $3,539,107) | 3,539,202 |
| Total Investments (100.0%) (Cost $80,069,844) | 111,602,291 |
| Other Assets and Liabilities—Net (0.0%) | 42,101 |
| Net Assets (100%) | 111,644,392 |
Cost is in $000.
| * | Non-income-producing security. |
| 1 | Securities with a value of $11,880,000 have been segregated as initial margin for open futures contracts. |
| 2 | The issuer was placed under federal conservatorship in September 2008; since that time, its daily operations have been managed by the Federal Housing Finance Agency and it receives capital from the U.S. Treasury, as needed to maintain a positive net worth, in exchange for senior preferred stock. |
| 3 | The average or expected maturity is shorter than the final maturity shown because of the possibility of interim principal payments and prepayments or the possibility of the issue being called. |
| 4 | Includes securities purchased on a when-issued or delayed-delivery basis for which the fund has not taken delivery as of November 30, 2020. |
| 5 | Security exempt from registration under Rule 144A of the Securities Act of 1933. Such securities may be sold in transactions exempt from registration, normally to qualified institutional buyers. At November 30, 2020, the aggregate value of these securities was $5,615,863,000, representing 5.0% of net assets. |
| 6 | Variable rate security; rate shown is effective rate at period end. Certain variable rate securities are not based on a published reference rate and spread but are determined by the issuer or agent based on current market conditions. |
| 7 | Scheduled principal and interest payments are guaranteed by AGM (Assured Guaranty Municipal Corporation). |
| 8 | Scheduled principal and interest payments are guaranteed by Build America Mutual Assurance Co. |
| 9 | Scheduled principal and interest payments are guaranteed by National Public Finance Guarantee Corp. |
| 10 | Affiliated money market fund available only to Vanguard funds and certain trusts and accounts managed by Vanguard. Rate shown is the 7-day yield. |
| 1M—1-month. | |
| 3M—3-month. | |
| ADR—American Depositary Receipt. | |
| GO—General Obligation Bond. | |
| LIBOR—London Interbank Offered Rate. | |
| REMICS—Real Estate Mortgage Investment Conduits. | |
| UMBS—Uniform Mortgage-Backed Securities. |
21
| © 2021 The Vanguard Group, Inc. | |
| All rights reserved. | |
| Vanguard Marketing Corporation, Distributor. | |
| SNA210_012021 | |

Report of Independent Registered Public Accounting Firm
To the Board of Trustees and Shareholders of Vanguard Wellington Fund
Opinion on the Financial Statements
We have audited the accompanying statement of assets and liabilities, including the schedule of investments—investments summary, of Vanguard Wellington Fund (one of the funds constituting Vanguard Wellington Fund, referred to hereafter as the “Fund”) as of November 30, 2020, the related statement of operations for the year ended November 30, 2020, the statement of changes in net assets for each of the two years in the period ended November 30, 2020, including the related notes, and the financial highlights for each of the five years in the period ended November 30, 2020 (included in Item 1 of this Form N-CSR) and the schedule of investments (included in Item 6 of this Form N-CSR) as of November 30, 2020 (collectively referred to as the “financial statements”). In our opinion, the financial statements present fairly, in all material respects, the financial position of the Fund as of November 30, 2020, the results of its operations for the year then ended, the changes in its net assets for each of the two years in the period ended November 30, 2020 and the financial highlights for each of the five years in the period ended November 30, 2020 in conformity with accounting principles generally accepted in the United States of America.
Basis for Opinion
These financial statements are the responsibility of the Fund’s management. Our responsibility is to express an opinion on the Fund’s financial statements based on our audits. We are a public accounting firm registered with the Public Company Accounting Oversight Board (United States) (PCAOB) and are required to be independent with respect to the Fund in accordance with the U.S. federal securities laws and the applicable rules and regulations of the Securities and Exchange Commission and the PCAOB.
We conducted our audits of these financial statements in accordance with the standards of the PCAOB. Those standards require that we plan and perform the audit to obtain reasonable assurance about whether the financial statements are free of material misstatement, whether due to error or fraud.
Our audits included performing procedures to assess the risks of material misstatement of the financial statements, whether due to error or fraud, and performing procedures that respond to those risks. Such procedures included examining, on a test basis, evidence regarding the amounts and disclosures in the financial statements. Our audits also included evaluating the accounting principles used and significant estimates made by management, as well as evaluating the overall presentation of the financial statements. Our procedures included confirmation of securities owned as of November 30, 2020 by correspondence with the custodian and brokers and by agreement to the underlying ownership records of the transfer agent; when replies were not received from brokers, we performed other auditing procedures. We believe that our audits provide a reasonable basis for our opinion.

January 14, 2021
We have served as the auditor of one or more investment companies in The Vanguard Group of Funds since 1975.
PricewaterhouseCoopers LLP, Two Commerce Square, Suite 1800, 2001 Market Street, Philadelphia, PA 19103-7042 T: (267) 330 3000, F: (267) 330 3300, www.pwc.com/us
Item 7: Disclosure of Proxy Voting Policies and Procedures for Closed-End Management Investment Companies.
Not applicable.
Item 8: Portfolio Managers of Closed-End Management Investment Companies.
Not applicable.
Item 9: Purchase of Equity Securities by Closed-End Management Investment Company and Affiliated Purchasers.
Not applicable.
Item 10: Submission of Matters to a Vote of Security Holders.
Not applicable.
Item 11: Controls and Procedures.
(a) Disclosure Controls and Procedures. The Principal Executive and Financial Officers concluded that the Registrant’s Disclosure Controls and Procedures are effective based on their evaluation of the Disclosure Controls and Procedures as of a date within 90 days of the filing date of this report.
(b) Internal Control Over Financial Reporting. There were no significant changes in the Registrant’s Internal Control Over Financial Reporting or in other factors that could significantly affect this control subsequent to the date of the evaluation, including any corrective actions with regard to significant deficiencies and material weaknesses.
Item 12: Disclosure of Securities Lending Activities for Closed-End Management Investment Companies.
Not applicable.
Item 13: Exhibits.
| (a) | Code of Ethics. |
| (b) | Certifications. |
Pursuant to the requirements of the Securities Exchange Act of 1934 and the Investment Company Act of 1940, the registrant has duly caused this report to be signed on its behalf by the undersigned, thereunto duly authorized.
| VANGUARD WELLINGTON FUND | ||
| BY: | /s/ MORTIMER J. BUCKLEY* | |
| MORTIMER J. BUCKLEY | ||
| CHIEF EXECUTIVE OFFICER |
Date: January 20, 2021
Pursuant to the requirements of the Securities Exchange Act of 1934 and the Investment Company Act of 1940, this report has been signed below by the following persons on behalf of the registrant and in the capacities and on the dates indicated.
| VANGUARD WELLINGTON FUND | ||
| BY: | /s/ MORTIMER J. BUCKLEY* | |
| MORTIMER J. BUCKLEY | ||
| CHIEF EXECUTIVE OFFICER |
Date: January 20, 2021
| VANGUARD WELLINGTON FUND | ||
| BY: | /s/ JOHN BENDL* | |
| JOHN BENDL | ||
| CHIEF FINANCIAL OFFICER |
Date: January 20, 2021
* By: /s/ Anne E. Robinson
Anne E. Robinson, pursuant to a Power of Attorney filed on December 18, 2020 (see File Number 33-64845), Incorporated by Reference.