UNITED STATES
SECURITIES AND EXCHANGE COMMISSION
Washington, D.C. 20549
_________________
FORM
_________________
CURRENT REPORT
Pursuant to Section 13 or 15(d)
of the Securities Exchange Act of 1934
Date of Report (Date of earliest event reported):
_______________________________
(Exact name of registrant as specified in its charter)
_______________________________
(State or Other Jurisdiction of Incorporation) | (Commission File Number) | (I.R.S. Employer Identification No.) |
(Address of Principal Executive Offices) (Zip Code)
(
(Registrant's telephone number, including area code)
Not applicable
(Former name or former address, if changed since last report)
_______________________________
Check the appropriate box below if the Form 8-K filing is intended to simultaneously satisfy the filing obligation of the registrant under any of the following provisions:
Written communications pursuant to Rule 425 under the Securities Act (17 CFR 230.425) | |
Soliciting material pursuant to Rule 14a-12 under the Exchange Act (17 CFR 240.14a-12) | |
Pre-commencement communications pursuant to Rule 14d-2(b) under the Exchange Act (17 CFR 240.14d-2(b)) | |
Pre-commencement communications pursuant to Rule 13e-4(c) under the Exchange Act (17 CFR 240.13e-4(c)) |
Securities registered pursuant to Section 12(b) of the Act:
Title of each class | Trading Symbol(s) | Name of each exchange on which registered |
Indicate by check mark whether the registrant is an emerging growth company as defined in Rule 405 of the Securities Act of 1933 (§230.405 of this chapter) or Rule 12b-2 of the Securities Exchange Act of 1934 (§240.12b-2 of this chapter).
Emerging growth company
If an emerging growth company,indicate by check mark if the registrant has elected not to use the extended transition period for complying with any new or revised financial accounting standards provided pursuant to Section 13(a) of the Exchange Act. ☐
On January 25, 2023, the Board of Directors of Brookline Bancorp, Inc. (the “Company”) issued a press release announcing its earnings for the quarter ended December 31, 2022. Additionally, the Company announced the approval by its Board of Directors of a regular quarterly dividend of $0.135 per share payable on February 24, 2023 to stockholders of record on February 10, 2023. A copy of that press release is attached hereto as Exhibit 99.1 and is hereby incorporated by reference herein.
In connection with the press release announcing the Company’s first quarter earnings, the Company posted an investor presentation to its website at www.brooklinebancorp.com. A copy of the investor presentation is attached hereto as Exhibit 99.2 and is hereby incorporated by reference herein.
99.1 | Press release of Brookline Bancorp, Inc. reporting earnings and dividend approval, issued January 25, 2023 | |||
99.2 | Investor Presentation of Brookline Bancorp, Inc., issued January 25, 2023 | |||
104 | Cover Page Interactive Data File (embedded within the Inline XBRL document) |
SIGNATURE
Pursuant to the requirements of the Securities Exchange Act of 1934, the registrant has duly caused this report to be signed on its behalf by the undersigned hereunto duly authorized.
BROOKLINE BANCORP, INC. | ||
Date: January 25, 2023 | By: | /s/ Carl M. Carlson |
Carl M. Carlson | ||
Co-President, Chief Financial & Strategy Officer | ||
EXHIBIT INDEX
The following exhibits are furnished as part of this report:
Exhibit No. | Description | |||
99.1 | Press release of Brookline Bancorp, Inc. reporting earnings and dividend approval, issued January 25, 2023 | |||
99.2 | Investor Presentation of Brookline Bancorp, Inc., issued January 25, 2023 | |||
104 | Cover Page Interactive Data File (embedded within the Inline XBRL document) |
EXHIBIT 99.1
Brookline Bancorp Announces Fourth Quarter Results
Net Income of $29.7 million, EPS of $0.39
BOSTON, Jan. 25, 2023 (GLOBE NEWSWIRE) -- Brookline Bancorp, Inc. (NASDAQ: BRKL) (the “Company”) today announced net income of $29.7 million, or $0.39 per basic and diluted share, for the fourth quarter of 2022, compared to $30.1 million, or $0.39 per basic and diluted share, for the third quarter of 2022, and $28.5 million, or $0.37 per basic and diluted share, for the fourth quarter of 2021.
For the year ended December 31, 2022, the Company reported net income of $109.7 million, or $1.42 per basic and diluted share. This compared to $115.4 million, or $1.48 per basic and diluted share, for the year ended December 31, 2021.
Paul Perrault, Chairman and Chief Executive Officer, commented on the Company’s performance, “Brookline Bancorp had an excellent year in 2022. We again finished the year with exceptional loan growth and are well positioned as we look forward to 2023. We are pleased to welcome PCSB Bank to our family of banks and look forward to their contributions to our Company in the years to come. I would like to recognize the continued contributions of our colleagues to our Company in 2022."
BALANCE SHEET
Total assets at December 31, 2022 increased $526.8 million to $9.2 billion from $8.7 billion at September 30, 2022, and increased $619.9 million from $8.6 billion at December 31, 2021.
At December 31, 2022, total loans and leases were $7.6 billion, representing an increase of $223.1 million from September 30, 2022, and an increase of $489.9 million from December 31, 2021. The loan portfolio grew $223.1 million in the fourth quarter compared to growth of $129.4 million in the third quarter.
Total investment securities at December 31, 2022 decreased $18.9 million to $656.8 million from $675.7 million at September 30, 2022, and decreased $64.1 million from $720.9 million at December 31, 2021. Total cash and cash equivalents at December 31, 2022 increased $270.5 million to $383.0 million from $112.5 million at September 30, 2022, and increased $55.3 million from $327.7 million at December 31, 2021. As of December 31, 2022, total investment securities and total cash and cash equivalents represented 11.3 percent of total assets as compared to 9.1 percent and 12.2 percent as of September 30, 2022 and December 31, 2021, respectively.
Total deposits at December 31, 2022 decreased $213.5 million to $6.5 billion from $6.7 billion at September 30, 2022 and decreased $527.8 million from $7.0 billion at December 31, 2021.
Total borrowed funds at December 31, 2022 increased $673.9 million to $1.4 billion from $0.8 billion at September 30, 2022 and increased $1.0 billion from $0.4 billion at December 31, 2021.
The ratio of stockholders’ equity to total assets was 10.76 percent at December 31, 2022, as compared to 11.08 percent at September 30, 2022, and 11.57 percent at December 31, 2021. The ratio of tangible stockholders’ equity to tangible assets (non-GAAP) was 9.16 percent at December 31, 2022, as compared to 9.39 percent at September 30, 2022, and 9.87 percent at December 31, 2021. Tangible book value per common share (non-GAAP) increased $0.37 from $10.43 at September 30, 2022 to $10.80 at December 31, 2022, compared to $10.73 at December 31, 2021.
NET INTEREST INCOME
Net interest income increased $2.0 million to $80.0 million during the fourth quarter of 2022 from $78.0 million for the quarter ended September 30, 2022. The net interest margin increased 1 basis point to 3.81 percent for the three months ended December 31, 2022 from 3.80 percent for the three months ended September 30, 2022.
NON-INTEREST INCOME
Total non-interest income for the quarter ended December 31, 2022 increased $2.3 million to $9.1 million from $6.8 million for the quarter ended September 30, 2022. The increase was primarily driven by increases of $1.7 million in gain on sales of loans and leases, $0.5 million in other non-interest income, $0.3 million in gain on securities, net, $0.2 million in deposit fees, and $0.1 million in loan fees, partially offset by a decrease of $0.6 million in loan level derivative income, net.
PROVISION FOR CREDIT LOSSES
The Company recorded a provision for credit losses of $5.7 million for the quarter ended December 31, 2022, compared to $2.8 million for the quarter ended September 30, 2022. The $2.9 million increase in provision for credit losses, or 3 cents per share after tax, was due to strong growth in loans and commitments.
Total net charge-offs for the fourth quarter of 2022 were $0.3 million compared to total net recoveries of $0.2 million in the third quarter of 2022. The increase was primarily driven by an increase in net charge-offs on equipment financing loans of $0.5 million. The ratio of net loan and lease charge-offs to average loans and leases on an annualized basis increased to 2 basis points for the fourth quarter of 2022 from a negative 1 basis point for the third quarter of 2022.
The allowance for loan and lease losses represented 1.29 percent of total loans and leases at December 31, 2022, compared to 1.27 percent at September 30, 2022, and 1.38 percent at December 31, 2021.
ASSET QUALITY
The ratio of total nonperforming loans and leases to total loans and leases was 0.19 percent at December 31, 2022 as compared to 0.24 percent at September 30, 2022. Total nonaccrual loans and leases decreased $2.8 million to $14.9 million at December 31, 2022 from $17.7 million at September 30, 2022. The ratio of nonperforming assets to total assets was 0.17 percent at December 31, 2022 as compared to 0.21 percent at September 30, 2022. Total nonperforming assets decreased $3.0 million to $15.3 million at December 31, 2022 from $18.3 million at September 30, 2022.
NON-INTEREST EXPENSE
Non-interest expense for the quarter ended December 31, 2022 increased $2.2 million to $47.2 million from $45.0 million for the quarter ended September 30, 2022. The increase was primarily driven by increases of $1.2 million in compensation and employee benefits, $0.7 million in equipment and data processing expense, $0.5 million in professional services expense, $0.3 million in FDIC insurance expense, $0.2 million in other non-interest expense, and $0.1 million in occupancy expense, partially offset by a decrease of $0.4 million in merger and acquisition expense and a decrease of $0.3 million in advertising and marketing expense.
PROVISION FOR INCOME TAXES
The effective tax rate was 17.8 percent and 21.6 percent for the three and twelve months ended December 31, 2022 compared to 18.7 percent for the three months ended September 30, 2022 and 25.9 percent and 25.3 percent for the three and twelve months ended December 31, 2021.
RETURNS ON AVERAGE ASSETS AND AVERAGE EQUITY
The annualized return on average assets decreased to 1.34 percent during the fourth quarter of 2022 compared to 1.40 percent for the third quarter of 2022; and was 1.27 percent for the year ended December 31, 2022, compared to 1.36 percent for the year ended December 31, 2021.
The annualized return on average tangible stockholders' equity decreased to 14.48 percent during the fourth quarter of 2022 compared to 14.72 percent for the third quarter of 2022; and was 13.35 percent for the year ended December 31, 2022 compared to 14.35 percent for the year ended December 31, 2021.
DIVIDEND DECLARED
The Company’s Board approved a dividend of $0.135 per share for the quarter ended December 31, 2022. The dividend will be paid on February 24, 2023 to stockholders of record on February 10, 2023.
PCSB ACQUISITION
On January 1, 2023, the Company completed its previously announced acquisition (the “merger”) of PCSB Financial Corporation (“PCSB”). Pursuant to the merger agreement, each share of PCSB common stock outstanding at the effective time of the merger was converted into the right to receive, at the holder’s election, either $22.00 in cash consideration or 1.3284 shares of Company common stock for each share of PCSB common stock, subject to allocation procedures to ensure that 60% of the outstanding shares of PCSB common stock was converted to Company common stock. PCSB’s bank subsidiary, PCSB Bank, now operates as a separate subsidiary of the Company and has 15 banking offices throughout the Lower Hudson Valley of New York State.
CONFERENCE CALL
The Company will conduct a conference call/webcast at 1:30 PM Eastern Time on Thursday, January 26, 2023 to discuss the results for the quarter, business highlights and outlook. A copy of the Earnings Presentation is available on the Company’s website, www.brooklinebancorp.com. To listen to the call and view the Company’s Earnings Presentation, please join the call via https://events.q4inc.com/attendee/914981409. To listen to the call without access to the slides, please dial 844-200-6205 (United States) or 929-526-1599 (internationally) and ask for the Brookline Bancorp, Inc. call (Access Code 718736). A recording of the call will be available for one week following the call on the Company’s website under “Investor Relations” or by dialing 866-813-9403 (United States) or 929-458-6194 (internationally) and entering the passcode: 959089.
ABOUT BROOKLINE BANCORP, INC.
Brookline Bancorp, Inc., a bank holding company with approximately $11 billion in assets and branch locations in eastern Massachusetts, Rhode Island and the Lower Hudson Valley of New York State, is headquartered in Boston, Massachusetts and operates as the holding company for Brookline Bank, Bank Rhode Island, and PCSB Bank. The Company provides commercial and retail banking services and cash management and investment services to customers throughout Central New England and the Lower Hudson Valley of New York State. More information about Brookline Bancorp, Inc. and its banks can be found at the following websites: www.brooklinebank.com, www.bankri.com and www.pcsb.com.
FORWARD-LOOKING STATEMENTS
Certain statements contained in this press release that are not historical facts may constitute forward-looking statements within the meaning of Section 27A of the Securities Act of 1933, as amended, and Section 21E of the Securities Exchange Act of 1934, as amended, and are intended to be covered by the safe harbor provisions of the Private Securities Litigation Reform Act of 1995. We may also make forward-looking statements in other documents we file with the Securities and Exchange Commission ("SEC"), in our annual reports to shareholders, in press releases and other written materials, and in oral statements made by our officers, directors or employees. You can identify forward looking statements by the use of the words “believe,” “expect,” “anticipate,” “intend,” “estimate,” “assume,” “outlook,” “will,” “should,” and other expressions that predict or indicate future events and trends and which do not relate to historical matters, including statements regarding the Company’s business, credit quality, financial condition, liquidity and results of operations. Forward-looking statements may differ, possibly materially, from what is included in this press release due to factors and future developments that are uncertain and beyond the scope of the Company’s control. These include, but are not limited to, the Company’s ability to achieve the synergies and value creation contemplated by the acquisition of PCSB; turbulence in the capital and debt markets; changes in interest rates; competitive pressures from other financial institutions; general economic conditions (including inflation) on a national basis or in the local markets in which the Company operates; changes in consumer behavior due to changing political, business and economic conditions, or legislative or regulatory initiatives; changes in the value of securities and other assets in the Company’s investment portfolio; increases in loan and lease default and charge-off rates; the adequacy of allowances for loan and lease losses; decreases in deposit levels that necessitate increases in borrowing to fund loans and investments; operational risks including, but not limited to, cybersecurity incidents, fraud, natural disasters, the ongoing COVID-19 pandemic and future pandemics; changes in regulation; the possibility that future credit losses may be higher than currently expected due to changes in economic assumptions and adverse economic developments; the risk that goodwill and intangibles recorded in the Company’s financial statements will become impaired; and changes in assumptions used in making such forward-looking statements. Forward-looking statements involve risks and uncertainties which are difficult to predict. The Company’s actual results could differ materially from those projected in the forward-looking statements as a result of, among others, the risks outlined in the Company’s Annual Report on Form 10-K, as updated by its Quarterly Reports on Form 10-Q and other filings submitted to the SEC. The Company does not undertake any obligation to update any forward-looking statement to reflect circumstances or events that occur after the date the forward-looking statements are made.
BASIS OF PRESENTATION
The Company's consolidated financial statements have been prepared in conformity with generally accepted accounting principles (“GAAP”) as set forth by the Financial Accounting Standards Board in its Accounting Standards Codification and through the rules and interpretive releases of the SEC under the authority of federal securities laws. Certain amounts previously reported have been reclassified to conform to the current period's presentation.
NON-GAAP FINANCIAL MEASURES
The Company uses certain non-GAAP financial measures, such as operating earnings, operating earnings per common share, operating return on average assets, operating return on average tangible assets, operating return on average stockholders' equity, operating return on average tangible stockholders' equity, tangible book value per common share, tangible stockholders’ equity to tangible assets, return on average tangible assets (annualized) and return on average tangible stockholders' equity (annualized). These non-GAAP financial measures provide information for investors to effectively analyze financial trends of ongoing business activities, and to enhance comparability with peers across the financial services sector. A detailed reconciliation table of the Company's GAAP to the non-GAAP measures is attached.
INVESTOR RELATIONS:
Contact: | Carl M. Carlson |
Brookline Bancorp, Inc. | |
Co-President and Chief Financial Officer | |
(617) 425-5331 | |
ccarlson@brkl.com |
BROOKLINE BANCORP, INC. AND SUBSIDIARIES | |||||||||||||||||||||
Selected Financial Highlights (Unaudited) | |||||||||||||||||||||
At and for the Three Months Ended | At and for the Twelve Months Ended | ||||||||||||||||||||
December 31, 2022 | September 30, 2022 | June 30, 2022 | March 31, 2022 | December 31, 2021 | December 31, 2022 | December 31, 2021 | |||||||||||||||
(Dollars In Thousands Except per Share Data) | |||||||||||||||||||||
Earnings Data: | |||||||||||||||||||||
Net interest income | $ | 80,030 | $ | 78,026 | $ | 71,867 | $ | 69,848 | $ | 71,461 | $ | 299,771 | $ | 282,373 | |||||||
Provision (credit) for credit losses | 5,725 | 2,835 | 227 | (160 | ) | 751 | 8,627 | (7,837 | ) | ||||||||||||
Non-interest income | 9,056 | 6,834 | 6,928 | 5,529 | 10,699 | 28,347 | 26,989 | ||||||||||||||
Non-interest expense | 47,225 | 44,959 | 44,871 | 42,487 | 42,909 | 179,542 | 162,608 | ||||||||||||||
Income before provision for income taxes | 36,136 | 37,066 | 33,697 | 33,050 | 38,500 | 139,949 | 154,591 | ||||||||||||||
Net income | 29,695 | 30,149 | 25,195 | 24,705 | 28,545 | 109,744 | 115,440 | ||||||||||||||
Performance Ratios: | |||||||||||||||||||||
Net interest margin (1) | 3.81 | % | 3.80 | % | 3.56 | % | 3.49 | % | 3.52 | % | 3.67 | % | 3.49 | % | |||||||
Interest-rate spread (1) | 3.35 | % | 3.58 | % | 3.41 | % | 3.31 | % | 3.42 | % | 3.40 | % | 3.32 | % | |||||||
Return on average assets (annualized) | 1.34 | % | 1.40 | % | 1.18 | % | 1.16 | % | 1.35 | % | 1.27 | % | 1.36 | % | |||||||
Return on average tangible assets (annualized) (non-GAAP) | 1.37 | % | 1.43 | % | 1.21 | % | 1.18 | % | 1.38 | % | 1.30 | % | 1.38 | % | |||||||
Return on average stockholders' equity (annualized) | 12.09 | % | 12.29 | % | 10.32 | % | 9.91 | % | 11.56 | % | 11.15 | % | 11.93 | % | |||||||
Return on average tangible stockholders' equity (annualized) (non-GAAP) | 14.48 | % | 14.72 | % | 12.39 | % | 11.84 | % | 13.84 | % | 13.35 | % | 14.35 | % | |||||||
Efficiency ratio (2) | 53.01 | % | 52.98 | % | 56.95 | % | 56.37 | % | 52.23 | % | 54.72 | % | 52.56 | % | |||||||
Per Common Share Data: | |||||||||||||||||||||
Net income — Basic | $ | 0.39 | $ | 0.39 | $ | 0.33 | $ | 0.32 | $ | 0.37 | $ | 1.42 | $ | 1.48 | |||||||
Net income — Diluted | 0.39 | 0.39 | 0.33 | 0.32 | 0.37 | 1.42 | 1.48 | ||||||||||||||
Cash dividends declared | 0.135 | 0.135 | 0.130 | 0.130 | 0.125 | 0.530 | 0.490 | ||||||||||||||
Book value per share (end of period) | 12.91 | 12.54 | 12.63 | 12.65 | 12.82 | 12.91 | 12.82 | ||||||||||||||
Tangible book value per common share (end of period) (non-GAAP) | 10.80 | 10.43 | 10.51 | 10.56 | 10.73 | 10.80 | 10.73 | ||||||||||||||
Stock price (end of period) | 14.15 | 11.65 | 13.31 | 15.82 | 16.19 | 14.15 | 16.19 | ||||||||||||||
Balance Sheet: | |||||||||||||||||||||
Total assets | $ | 9,222,553 | $ | 8,695,708 | $ | 8,514,230 | $ | 8,633,736 | $ | 8,602,622 | $ | 9,222,553 | $ | 8,602,622 | |||||||
Total loans and leases | 7,644,388 | 7,421,304 | 7,291,912 | 7,223,130 | 7,154,457 | 7,644,388 | 7,154,457 | ||||||||||||||
Total deposits | 6,522,146 | 6,735,605 | 6,894,457 | 7,094,378 | 7,049,906 | 6,522,146 | 7,049,906 | ||||||||||||||
Total stockholders’ equity | 992,125 | 963,618 | 968,496 | 981,935 | 995,342 | 992,125 | 995,342 | ||||||||||||||
Asset Quality: | |||||||||||||||||||||
Nonperforming assets | $ | 15,302 | $ | 18,312 | $ | 21,259 | $ | 26,506 | $ | 33,177 | $ | 15,302 | $ | 33,177 | |||||||
Nonperforming assets as a percentage of total assets | 0.17 | % | 0.21 | % | 0.25 | % | 0.31 | % | 0.39 | % | 0.17 | % | 0.39 | % | |||||||
Allowance for loan and lease losses | $ | 98,482 | $ | 94,169 | $ | 93,188 | $ | 95,463 | $ | 99,084 | $ | 98,482 | $ | 99,084 | |||||||
Allowance for loan and lease losses as a percentage of total loans and leases | 1.29 | % | 1.27 | % | 1.28 | % | 1.32 | % | 1.38 | % | 1.29 | % | 1.38 | % | |||||||
Net loan and lease charge-offs (recoveries) | $ | 310 | $ | (179 | ) | $ | 1,242 | $ | 1,947 | $ | 2,124 | $ | 3,320 | $ | 5,734 | ||||||
Net loan and lease charge-offs as a percentage of average loans and leases (annualized) | 0.02 | % | (0.01 | )% | 0.07 | % | 0.11 | % | 0.12 | % | 0.05 | % | 0.08 | % | |||||||
Capital Ratios: | |||||||||||||||||||||
Stockholders’ equity to total assets | 10.76 | % | 11.08 | % | 11.38 | % | 11.37 | % | 11.57 | % | 10.76 | % | 11.57 | % | |||||||
Tangible stockholders’ equity to tangible assets (non-GAAP) | 9.16 | % | 9.39 | % | 9.65 | % | 9.67 | % | 9.87 | % | 9.16 | % | 9.87 | % | |||||||
(1) Calculated on a fully tax-equivalent basis. | |||||||||||||||||||||
(2) Calculated as non-interest expense as a percentage of net interest income plus non-interest income. | |||||||||||||||||||||
BROOKLINE BANCORP, INC. AND SUBSIDIARIES | ||||||||||
Consolidated Balance Sheets (Unaudited) | ||||||||||
December 31, 2022 | September 30, 2022 | June 30, 2022 | March 31, 2022 | December 31, 2021 | ||||||
ASSETS | (In Thousands Except Share Data) | |||||||||
Cash and due from banks | $ | 191,767 | $ | 65,638 | $ | 50,429 | $ | 89,032 | $ | 66,265 |
Short-term investments | 191,192 | 46,873 | 39,900 | 204,239 | 261,472 | |||||
Total cash and cash equivalents | 382,959 | 112,511 | 90,329 | 293,271 | 327,737 | |||||
Investment securities available-for-sale | 656,766 | 675,692 | 717,818 | 730,562 | 720,866 | |||||
Total investment securities | 656,766 | 675,692 | 717,818 | 730,562 | 720,866 | |||||
Loans and leases: | ||||||||||
Commercial real estate loans | 4,404,148 | 4,269,512 | 4,225,754 | 4,235,325 | 4,103,040 | |||||
Commercial loans and leases | 2,016,499 | 1,933,645 | 1,860,182 | 1,800,383 | 1,887,136 | |||||
Consumer loans | 1,223,741 | 1,218,147 | 1,205,976 | 1,187,422 | 1,164,281 | |||||
Total loans and leases | 7,644,388 | 7,421,304 | 7,291,912 | 7,223,130 | 7,154,457 | |||||
Allowance for loan and lease losses | (98,482) | (94,169) | (93,188) | (95,463) | (99,084) | |||||
Net loans and leases | 7,545,906 | 7,327,135 | 7,198,724 | 7,127,667 | 7,055,373 | |||||
Restricted equity securities | 71,307 | 44,760 | 35,406 | 29,066 | 28,981 | |||||
Premises and equipment, net of accumulated depreciation | 71,391 | 69,912 | 69,557 | 69,365 | 70,359 | |||||
Right-of-use asset operating leases | 19,484 | 18,614 | 18,226 | 19,571 | 20,508 | |||||
Deferred tax asset | 52,237 | 56,894 | 50,736 | 46,886 | 38,987 | |||||
Goodwill | 160,427 | 160,427 | 160,427 | 160,427 | 160,427 | |||||
Identified intangible assets, net of accumulated amortization | 1,781 | 1,902 | 2,022 | 2,142 | 2,276 | |||||
Other real estate owned and repossessed assets | 408 | 591 | 507 | 990 | 718 | |||||
Other assets | 259,887 | 227,270 | 170,478 | 153,789 | 176,390 | |||||
Total assets | $ | 9,222,553 | $ | 8,695,708 | $ | 8,514,230 | $ | 8,633,736 | $ | 8,602,622 |
LIABILITIES AND STOCKHOLDERS' EQUITY | ||||||||||
Deposits: | ||||||||||
Demand checking accounts | $ | 1,802,518 | $ | 1,848,562 | $ | 1,845,365 | $ | 1,903,331 | $ | 1,888,462 |
NOW accounts | 544,118 | 597,870 | 628,791 | 627,904 | 604,097 | |||||
Savings accounts | 762,271 | 824,789 | 894,926 | 967,183 | 915,804 | |||||
Money market accounts | 2,174,952 | 2,405,680 | 2,402,992 | 2,432,377 | 2,358,306 | |||||
Certificate of deposit accounts | 928,143 | 924,771 | 1,006,786 | 1,048,036 | 1,117,695 | |||||
Brokered deposit accounts | 310,144 | 133,933 | 115,597 | 115,547 | 165,542 | |||||
Total deposits | 6,522,146 | 6,735,605 | 6,894,457 | 7,094,378 | 7,049,906 | |||||
Borrowed funds: | ||||||||||
Advances from the FHLBB | 1,237,823 | 557,895 | 307,967 | 201,236 | 147,907 | |||||
Subordinated debentures and notes | 84,044 | 84,008 | 83,970 | 83,934 | 83,897 | |||||
Other borrowed funds | 110,785 | 116,865 | 86,263 | 107,727 | 125,517 | |||||
Total borrowed funds | 1,432,652 | 758,768 | 478,200 | 392,897 | 357,321 | |||||
Operating lease liabilities | 19,484 | 18,614 | 18,226 | 19,571 | 20,508 | |||||
Mortgagors’ escrow accounts | 5,607 | 5,785 | 5,771 | 5,780 | 6,296 | |||||
Reserve for unfunded credits | 20,602 | 19,555 | 17,511 | 16,305 | 14,794 | |||||
Accrued expenses and other liabilities | 229,937 | 193,763 | 131,569 | 122,870 | 158,455 | |||||
Total liabilities | 8,230,428 | 7,732,090 | 7,545,734 | 7,651,801 | 7,607,280 | |||||
Stockholders' equity: | ||||||||||
Common stock, $0.01 par value; 200,000,000 shares authorized; 85,177,172 shares issued, 85,177,172 shares issued, 85,177,172 shares issued, 85,177,172 shares issued, and 85,177,172 shares issued, respectively | 852 | 852 | 852 | 852 | 852 | |||||
Additional paid-in capital | 736,074 | 735,119 | 738,544 | 737,658 | 736,826 | |||||
Retained earnings, partially restricted | 412,019 | 392,779 | 372,677 | 357,576 | 342,639 | |||||
Accumulated other comprehensive income | (61,947) | (70,227) | (44,977) | (29,322) | (110) | |||||
Treasury stock, at cost; | ||||||||||
7,731,445 shares, 7,730,945 shares, 7,995,888 shares, 7,037,464 shares, and 7,037,464 shares, respectively | (94,873) | (94,866) | (98,525) | (84,718) | (84,718) | |||||
Unallocated common stock held by the Employee Stock Ownership Plan; | ||||||||||
0 shares, 4,833 shares, 11,442 shares, 18,051 shares, and 24,660 shares, respectively | 0 | (39) | (75) | (111) | (147) | |||||
Total stockholders' equity | 992,125 | 963,618 | 968,496 | 981,935 | 995,342 | |||||
Total liabilities and stockholders' equity | $ | 9,222,553 | $ | 8,695,708 | $ | 8,514,230 | $ | 8,633,736 | $ | 8,602,622 |
BROOKLINE BANCORP, INC. AND SUBSIDIARIES | ||||||||||||
Consolidated Statements of Income (Unaudited) | ||||||||||||
Three Months Ended | ||||||||||||
December 31, 2022 | September 30, 2022 | June 30, 2022 | March 31, 2022 | December 31, 2021 | ||||||||
(In Thousands Except Share Data) | ||||||||||||
Interest and dividend income: | ||||||||||||
Loans and leases | $ | 98,386 | $ | 84,375 | $ | 74,287 | $ | 71,721 | $ | 73,560 | ||
Debt securities | 3,497 | 3,337 | 3,249 | 2,996 | 2,972 | |||||||
Marketable and restricted equity securities | 766 | 467 | 337 | 328 | 325 | |||||||
Short-term investments | 754 | 464 | 156 | 66 | 88 | |||||||
Total interest and dividend income | 103,403 | 88,643 | 78,029 | 75,111 | 76,945 | |||||||
Interest expense: | ||||||||||||
Deposits | 14,185 | 7,354 | 4,282 | 3,771 | 4,055 | |||||||
Borrowed funds | 9,188 | 3,263 | 1,880 | 1,492 | 1,429 | |||||||
Total interest expense | 23,373 | 10,617 | 6,162 | 5,263 | 5,484 | |||||||
Net interest income | 80,030 | 78,026 | 71,867 | 69,848 | 71,461 | |||||||
Provision (credit) for credit losses | 5,725 | 2,835 | 227 | (160 | ) | 751 | ||||||
Net interest income after provision for credit losses | 74,305 | 75,191 | 71,640 | 70,008 | 70,710 | |||||||
Non-interest income: | ||||||||||||
Deposit fees | 2,916 | 2,759 | 2,744 | 2,500 | 2,653 | |||||||
Loan fees | 446 | 349 | 666 | 747 | 448 | |||||||
Loan level derivative income, net | 670 | 1,275 | 1,615 | 686 | 3,981 | |||||||
Gain (loss) on investment securities, net | 321 | — | — | — | (32 | ) | ||||||
Gain on sales of loans and leases held-for-sale | 2,612 | 889 | 291 | 344 | 1,933 | |||||||
Other | 2,091 | 1,562 | 1,612 | 1,252 | 1,716 | |||||||
Total non-interest income | 9,056 | 6,834 | 6,928 | 5,529 | 10,699 | |||||||
Non-interest expense: | ||||||||||||
Compensation and employee benefits | 29,525 | 28,306 | 28,772 | 26,884 | 28,598 | |||||||
Occupancy | 4,005 | 3,906 | 3,807 | 4,284 | 3,558 | |||||||
Equipment and data processing | 5,758 | 5,066 | 4,931 | 5,078 | 4,576 | |||||||
Professional services | 1,546 | 1,069 | 1,219 | 1,226 | 1,151 | |||||||
FDIC insurance | 1,001 | 709 | 739 | 728 | 617 | |||||||
Advertising and marketing | 1,052 | 1,337 | 1,319 | 1,272 | 880 | |||||||
Amortization of identified intangible assets | 120 | 120 | 120 | 134 | 208 | |||||||
Merger and acquisition expense | 641 | 1,073 | 535 | — | — | |||||||
Other | 3,577 | 3,373 | 3,429 | 2,881 | 3,321 | |||||||
Total non-interest expense | 47,225 | 44,959 | 44,871 | 42,487 | 42,909 | |||||||
Income before provision for income taxes | 36,136 | 37,066 | 33,697 | 33,050 | 38,500 | |||||||
Provision for income taxes | 6,441 | 6,917 | 8,502 | 8,345 | 9,955 | |||||||
Net income | $ | 29,695 | $ | 30,149 | $ | 25,195 | $ | 24,705 | $ | 28,545 | ||
Earnings per common share: | ||||||||||||
Basic | $ | 0.39 | $ | 0.39 | $ | 0.33 | $ | 0.32 | $ | 0.37 | ||
Diluted | $ | 0.39 | $ | 0.39 | $ | 0.33 | $ | 0.32 | $ | 0.37 | ||
Weighted average common shares outstanding during the period: | ||||||||||||
Basic | 76,841,655 | 76,779,038 | 77,091,013 | 77,617,227 | 77,610,608 | |||||||
Diluted | 77,065,076 | 77,007,971 | 77,419,288 | 77,926,822 | 77,864,097 | |||||||
Dividends paid per common share | $ | 0.135 | $ | 0.130 | $ | 0.130 | $ | 0.125 | $ | 0.125 | ||
BROOKLINE BANCORP, INC. AND SUBSIDIARIES | |||||
Consolidated Statements of Income (Unaudited) | |||||
Twelve Months Ended December 31, | |||||
2022 | 2021 | ||||
(In Thousands Except Share Data) | |||||
Interest and dividend income: | |||||
Loans and leases | $ | 328,769 | $ | 297,927 | |
Debt securities | 13,079 | 12,178 | |||
Marketable and restricted equity securities | 1,898 | 1,172 | |||
Short-term investments | 1,440 | 252 | |||
Total interest and dividend income | 345,186 | 311,529 | |||
Interest expense: | |||||
Deposits | 29,592 | 20,713 | |||
Borrowed funds | 15,823 | 8,443 | |||
Total interest expense | 45,415 | 29,156 | |||
Net interest income | 299,771 | 282,373 | |||
Provision (credit) for credit losses | 8,627 | (7,837 | ) | ||
Net interest income after provision for credit losses | 291,144 | 290,210 | |||
Non-interest income: | |||||
Deposit fees | 10,919 | 10,578 | |||
Loan fees | 2,208 | 2,095 | |||
Loan level derivative income, net | 4,246 | 4,680 | |||
Gain (loss) on investment securities, net | 321 | (38 | ) | ||
Gain on sales of loans and leases held-for-sale | 4,136 | 3,737 | |||
Other | 6,517 | 5,937 | |||
Total non-interest income | 28,347 | 26,989 | |||
Non-interest expense: | |||||
Compensation and employee benefits | 113,487 | 106,786 | |||
Occupancy | 16,002 | 14,961 | |||
Equipment and data processing | 20,833 | 18,322 | |||
Professional services | 5,060 | 4,694 | |||
FDIC insurance | 3,177 | 2,980 | |||
Advertising and marketing | 4,980 | 4,167 | |||
Amortization of identified intangible assets | 494 | 876 | |||
Merger and acquisition expense | 2,249 | — | |||
Other | 13,260 | 9,822 | |||
Total non-interest expense | 179,542 | 162,608 | |||
Income before provision for income taxes | 139,949 | 154,591 | |||
Provision for income taxes | 30,205 | 39,151 | |||
Net income | $ | 109,744 | $ | 115,440 | |
Earnings per common share: | |||||
Basic | $ | 1.42 | $ | 1.48 | |
Diluted | $ | 1.42 | $ | 1.48 | |
Weighted average common shares outstanding during the period: | |||||
Basic | 77,079,278 | 77,974,851 | |||
Diluted | 77,351,834 | 78,243,416 | |||
Dividends paid per common share | $ | 0.520 | $ | 0.480 | |
BROOKLINE BANCORP, INC. AND SUBSIDIARIES | |||||||||||||||
Asset Quality Analysis (Unaudited) | |||||||||||||||
At and for the Three Months Ended | |||||||||||||||
December 31, 2022 | September 30, 2022 | June 30, 2022 | March 31, 2022 | December 31, 2021 | |||||||||||
(Dollars in Thousands) | |||||||||||||||
NONPERFORMING ASSETS: | |||||||||||||||
Loans and leases accounted for on a nonaccrual basis: | |||||||||||||||
Commercial real estate mortgage | $ | 607 | $ | 3,136 | $ | 6,470 | $ | 8,313 | $ | 10,848 | |||||
Construction | 707 | — | — | — | — | ||||||||||
Total commercial real estate loans | 1,314 | 3,136 | 6,470 | 8,313 | 10,848 | ||||||||||
Commercial | 464 | 618 | 892 | 1,366 | 2,318 | ||||||||||
Equipment financing | 9,653 | 10,544 | 10,183 | 11,685 | 15,014 | ||||||||||
Condominium association | 58 | 64 | 71 | 77 | 84 | ||||||||||
Total commercial loans and leases | 10,175 | 11,226 | 11,146 | 13,128 | 17,416 | ||||||||||
Residential mortgage | 2,680 | 2,741 | 2,412 | 3,394 | 3,909 | ||||||||||
Home equity | 723 | 616 | 721 | 680 | 285 | ||||||||||
Other consumer | 2 | 2 | 3 | 1 | 1 | ||||||||||
Total consumer loans | 3,405 | 3,359 | 3,136 | 4,075 | 4,195 | ||||||||||
Total nonaccrual loans and leases | 14,894 | 17,721 | 20,752 | 25,516 | 32,459 | ||||||||||
Other repossessed assets | 408 | 591 | 507 | 990 | 718 | ||||||||||
Total nonperforming assets | $ | 15,302 | $ | 18,312 | $ | 21,259 | $ | 26,506 | $ | 33,177 | |||||
Loans and leases past due greater than 90 days and still accruing | $ | 33 | $ | 9,583 | $ | 266 | $ | 4 | $ | 1 | |||||
Troubled debt restructurings on accrual | 16,385 | 9,728 | 11,524 | 10,858 | 12,580 | ||||||||||
Troubled debt restructurings on nonaccrual | 3,527 | 4,449 | 5,097 | 5,189 | 6,709 | ||||||||||
Total troubled debt restructurings | $ | 19,912 | $ | 14,177 | $ | 16,621 | $ | 16,047 | $ | 19,289 | |||||
Nonperforming loans and leases as a percentage of total loans and leases | 0.19 | % | 0.24 | % | 0.28 | % | 0.35 | % | 0.45 | % | |||||
Nonperforming assets as a percentage of total assets | 0.17 | % | 0.21 | % | 0.25 | % | 0.31 | % | 0.39 | % | |||||
PROVISION AND ALLOWANCE FOR LOAN AND LEASE LOSSES: | |||||||||||||||
Allowance for loan and lease losses at beginning of period | $ | 94,169 | $ | 93,188 | $ | 95,463 | $ | 99,084 | $ | 102,515 | |||||
Charge-offs | (658 | ) | (598 | ) | (1,533 | ) | (2,344 | ) | (2,562 | ) | |||||
Recoveries | 348 | 777 | 291 | 397 | 438 | ||||||||||
Net (charge-offs) recoveries | (310 | ) | 179 | (1,242 | ) | (1,947 | ) | (2,124 | ) | ||||||
Provision (credit) for loan and lease losses excluding unfunded commitments * | 4,623 | 802 | (1,033 | ) | (1,674 | ) | (1,307 | ) | |||||||
Allowance for loan and lease losses at end of period | $ | 98,482 | $ | 94,169 | $ | 93,188 | $ | 95,463 | $ | 99,084 | |||||
Allowance for loan and lease losses as a percentage of total loans and leases | 1.29 | % | 1.27 | % | 1.28 | % | 1.32 | % | 1.38 | % | |||||
NET CHARGE-OFFS (RECOVERIES): | |||||||||||||||
Commercial real estate loans | $ | (6 | ) | $ | (6 | ) | $ | (6 | ) | $ | 31 | $ | — | ||
Commercial loans and leases | 320 | (179 | ) | 1,254 | 1,948 | 2,143 | |||||||||
Consumer loans | (4 | ) | 6 | (6 | ) | (32 | ) | (19 | ) | ||||||
Total net charge-offs (recoveries) | $ | 310 | $ | (179 | ) | $ | 1,242 | $ | 1,947 | $ | 2,124 | ||||
Net loan and lease charge-offs as a percentage of average loans and leases (annualized) | 0.02 | % | (0.01 | )% | 0.07 | % | 0.11 | % | 0.12 | % | |||||
*Provision for loan and lease losses does not include provision of $1.0 million, $2.0 million, $1.2 million, $1.5 million, and $2.1 million for credit losses on unfunded commitments during the three months ended December 31, 2022, September 30, 2022, June 30, 2022, March 31, 2022, and December 31, 2021 respectively. | |||||||||||||||
BROOKLINE BANCORP, INC. AND SUBSIDIARIES | ||||||||||||||||||
Average Yields / Costs (Unaudited) | ||||||||||||||||||
Three Months Ended | ||||||||||||||||||
December 31, 2022 | September 30, 2022 | December 31, 2021 | ||||||||||||||||
Average Balance | Interest (1) | Average Yield/ Cost | Average Balance | Interest (1) | Average Yield/ Cost | Average Balance | Interest (1) | Average Yield/ Cost | ||||||||||
(Dollars in Thousands) | ||||||||||||||||||
Assets: | ||||||||||||||||||
Interest-earning assets: | ||||||||||||||||||
Investments: | ||||||||||||||||||
Debt securities (2) | $ | 665,969 | $ | 3,497 | 2.10 | % | $ | 714,226 | $ | 3,337 | 1.87 | % | $ | 727,734 | $ | 2,972 | 1.63 | % |
Marketable and restricted equity securities (2) | 52,093 | 766 | 5.88 | % | 36,525 | 467 | 5.12 | % | 27,019 | 325 | 4.81 | % | ||||||
Short-term investments | 60,385 | 754 | 5.00 | % | 66,257 | 464 | 2.80 | % | 224,573 | 88 | 0.16 | % | ||||||
Total investments | 778,447 | 5,017 | 2.58 | % | 817,008 | 4,268 | 2.09 | % | 979,326 | 3,385 | 1.38 | % | ||||||
Loans and Leases: | ||||||||||||||||||
Commercial real estate loans (3) | 4,341,929 | 53,088 | 4.78 | % | 4,239,155 | 44,729 | 4.13 | % | 3,996,647 | 35,762 | 3.50 | % | ||||||
Commercial loans (3) | 797,312 | 10,541 | 5.18 | % | 731,095 | 8,492 | 4.55 | % | 820,932 | 10,146 | 4.84 | % | ||||||
Equipment financing (3) | 1,200,911 | 20,816 | 6.93 | % | 1,157,829 | 19,042 | 6.58 | % | 1,092,457 | 18,175 | 6.65 | % | ||||||
Residential mortgage loans (3) | 842,860 | 8,051 | 3.82 | % | 826,969 | 7,560 | 3.66 | % | 796,326 | 6,785 | 3.41 | % | ||||||
Other consumer loans (3) | 382,196 | 5,940 | 6.15 | % | 379,999 | 4,605 | 4.80 | % | 368,087 | 2,751 | 2.96 | % | ||||||
Total loans and leases | 7,565,208 | 98,436 | 5.20 | % | 7,335,047 | 84,428 | 4.60 | % | 7,074,449 | 73,619 | 4.16 | % | ||||||
Total interest-earning assets | 8,343,655 | 103,453 | 4.96 | % | 8,152,055 | 88,696 | 4.35 | % | 8,053,775 | 77,004 | 3.82 | % | ||||||
Non-interest-earning assets | 513,976 | 434,365 | 408,456 | |||||||||||||||
Total assets | $ | 8,857,631 | $ | 8,586,420 | $ | 8,462,231 | ||||||||||||
Liabilities and Stockholders' Equity: | ||||||||||||||||||
Interest-bearing liabilities: | ||||||||||||||||||
Deposits: | ||||||||||||||||||
NOW accounts | $ | 583,499 | 257 | 0.18 | % | $ | 607,210 | 579 | 0.38 | % | $ | 528,335 | 101 | 0.08 | % | |||
Savings accounts | 787,021 | 1,155 | 0.58 | % | 881,988 | 664 | 0.30 | % | 897,821 | 219 | 0.10 | % | ||||||
Money market accounts | 2,282,217 | 7,711 | 1.34 | % | 2,423,920 | 4,038 | 0.66 | % | 2,430,496 | 1,615 | 0.26 | % | ||||||
Certificates of deposit | 922,250 | 2,865 | 1.23 | % | 964,112 | 1,803 | 0.74 | % | 1,129,645 | 2,072 | 0.73 | % | ||||||
Brokered deposit accounts | 218,188 | 2,197 | 3.99 | % | 117,058 | 270 | 0.92 | % | 116,611 | 48 | 0.16 | % | ||||||
Total interest-bearing deposits | 4,793,175 | 14,185 | 1.17 | % | 4,994,288 | 7,354 | 0.58 | % | 5,102,908 | 4,055 | 0.32 | % | ||||||
Borrowings: | ||||||||||||||||||
Advances from the FHLBB | 736,652 | 6,979 | 3.71 | % | 331,840 | 1,700 | 2.00 | % | 76,786 | 117 | 0.59 | % | ||||||
Subordinated debentures and notes | 84,025 | 1,332 | 6.34 | % | 83,989 | 1,295 | 6.17 | % | 83,878 | 1,241 | 5.92 | % | ||||||
Other borrowed funds | 148,195 | 877 | 2.35 | % | 89,019 | 268 | 1.20 | % | 112,137 | 71 | 0.25 | % | ||||||
Total borrowings | 968,872 | 9,188 | 3.71 | % | 504,848 | 3,263 | 2.53 | % | 272,801 | 1,429 | 2.05 | % | ||||||
Total interest-bearing liabilities | 5,762,047 | 23,373 | 1.61 | % | 5,499,136 | 10,617 | 0.77 | % | 5,375,709 | 5,484 | 0.40 | % | ||||||
Non-interest-bearing liabilities: | ||||||||||||||||||
Demand checking accounts | 1,843,780 | 1,908,459 | 1,892,763 | |||||||||||||||
Other non-interest-bearing liabilities | 269,498 | 197,446 | 206,237 | |||||||||||||||
Total liabilities | 7,875,325 | 7,605,041 | 7,474,709 | |||||||||||||||
Stockholders’ equity | 982,306 | 981,379 | 987,522 | |||||||||||||||
Total liabilities and equity | $ | 8,857,631 | $ | 8,586,420 | $ | 8,462,231 | ||||||||||||
Net interest income (tax-equivalent basis) /Interest-rate spread (4) | 80,080 | 3.35 | % | 78,079 | 3.58 | % | 71,520 | 3.42 | % | |||||||||
Less adjustment of tax-exempt income | 50 | 53 | 59 | |||||||||||||||
Net interest income | $ | 80,030 | $ | 78,026 | $ | 71,461 | ||||||||||||
Net interest margin (5) | 3.81 | % | 3.80 | % | 3.52 | % | ||||||||||||
(1) Tax-exempt income on debt securities, equity securities and revenue bonds included in commercial real estate loans is included on a tax-equivalent basis. | ||||||||||||||||||
(2) Average balances include unrealized gains (losses) on investment securities. Dividend payments may not be consistent and average yield on equity securities may vary from month to month. | ||||||||||||||||||
(3) Loans on nonaccrual status are included in the average balances. | ||||||||||||||||||
(4) Interest rate spread represents the difference between the yield on interest-earning assets and the cost of interest-bearing liabilities. | ||||||||||||||||||
(5) Net interest margin represents net interest income (tax-equivalent basis) divided by average interest-earning assets. | ||||||||||||||||||
BROOKLINE BANCORP, INC. AND SUBSIDIARIES | ||||||||||||
Average Yields / Costs (Unaudited) | ||||||||||||
Twelve Months Ended | ||||||||||||
December 31, 2022 | December 31, 2021 | |||||||||||
Average Balance | Interest (1) | Average Yield/ Cost | Average Balance | Interest (1) | Average Yield/ Cost | |||||||
(Dollars in Thousands) | ||||||||||||
Assets: | ||||||||||||
Interest-earning assets: | ||||||||||||
Investments: | ||||||||||||
Debt securities (2) | $ | 706,580 | $ | 13,079 | 1.85 | % | $ | 729,147 | $ | 12,178 | 1.67 | % |
Marketable and restricted equity securities (2) | 36,813 | 1,898 | 5.15 | % | 34,074 | 1,172 | 3.44 | % | ||||
Short-term investments | 104,288 | 1,440 | 1.38 | % | 217,784 | 252 | 0.12 | % | ||||
Total investments | 847,681 | 16,417 | 1.94 | % | 981,005 | 13,602 | 1.39 | % | ||||
Loans and Leases: | ||||||||||||
Commercial real estate loans (3) | 4,238,960 | 172,811 | 4.02 | % | 3,854,357 | 139,451 | 3.57 | % | ||||
Commercial loans (3) | 744,972 | 34,105 | 4.52 | % | 1,020,627 | 47,647 | 4.61 | % | ||||
Equipment financing (3) | 1,148,673 | 75,767 | 6.60 | % | 1,081,287 | 71,906 | 6.65 | % | ||||
Residential mortgage loans (3) | 823,512 | 29,726 | 3.61 | % | 788,614 | 27,933 | 3.54 | % | ||||
Other consumer loans (3) | 376,292 | 16,569 | 4.40 | % | 369,326 | 11,209 | 3.03 | % | ||||
Total loans and leases | 7,332,409 | 328,978 | 4.49 | % | 7,114,211 | 298,146 | 4.19 | % | ||||
Total interest-earning assets | 8,180,090 | 345,395 | 4.22 | % | 8,095,216 | 311,748 | 3.85 | % | ||||
Non-interest-earning assets | 443,313 | 422,984 | ||||||||||
Total assets | $ | 8,623,403 | $ | 8,518,200 | ||||||||
Liabilities and Stockholders' Equity: | ||||||||||||
Interest-bearing liabilities: | ||||||||||||
Deposits: | ||||||||||||
NOW accounts | $ | 598,267 | 853 | 0.14 | % | $ | 502,189 | 493 | 0.10 | % | ||
Savings accounts | 882,881 | 2,228 | 0.25 | % | 793,141 | 950 | 0.12 | % | ||||
Money market accounts | 2,387,670 | 15,392 | 0.64 | % | 2,288,740 | 6,214 | 0.27 | % | ||||
Certificates of deposit | 998,580 | 8,210 | 0.82 | % | 1,210,451 | 11,758 | 0.97 | % | ||||
Brokered deposit accounts | 146,038 | 2,909 | 1.99 | % | 338,734 | 1,298 | 0.38 | % | ||||
Total interest-bearing deposits | 5,013,436 | 29,592 | 0.59 | % | 5,133,255 | 20,713 | 0.40 | % | ||||
Borrowings: | ||||||||||||
Advances from the FHLBB | 340,569 | 9,355 | 2.71 | % | 232,175 | 3,302 | 1.40 | % | ||||
Subordinated debentures and notes | 83,971 | 5,133 | 6.11 | % | 83,821 | 4,967 | 5.93 | % | ||||
Other borrowed funds | 118,383 | 1,335 | 1.13 | % | 88,818 | 174 | 0.20 | % | ||||
Total borrowings | 542,923 | 15,823 | 2.87 | % | 404,814 | 8,443 | 2.06 | % | ||||
Total interest-bearing liabilities | 5,556,359 | 45,415 | 0.82 | % | 5,538,069 | 29,156 | 0.53 | % | ||||
Non-interest-bearing liabilities: | ||||||||||||
Demand checking accounts | 1,879,620 | 1,787,959 | ||||||||||
Other non-interest-bearing liabilities | 203,187 | 224,634 | ||||||||||
Total liabilities | 7,639,166 | 7,550,662 | ||||||||||
Stockholders’ equity | 984,237 | 967,538 | ||||||||||
Total liabilities and equity | $ | 8,623,403 | $ | 8,518,200 | ||||||||
Net interest income (tax-equivalent basis) /Interest-rate spread (4) | 299,980 | 3.40 | % | 282,592 | 3.32 | % | ||||||
Less adjustment of tax-exempt income | 209 | 219 | ||||||||||
Net interest income | $ | 299,771 | $ | 282,373 | ||||||||
Net interest margin (5) | 3.67 | % | 3.49 | % | ||||||||
(1) Tax-exempt income on debt securities, equity securities and revenue bonds included in commercial real estate loans is included on a tax-equivalent basis. | ||||||||||||
(2) Average balances include unrealized gains (losses) on investment securities. Dividend payments may not be consistent and average yield on equity securities may vary from month to month. | ||||||||||||
(3) Loans on nonaccrual status are included in the average balances. | ||||||||||||
(4) Interest rate spread represents the difference between the yield on interest-earning assets and the cost of interest-bearing liabilities. | ||||||||||||
(5) Net interest margin represents net interest income (tax-equivalent basis) divided by average interest-earning assets. | ||||||||||||
BROOKLINE BANCORP, INC. AND SUBSIDIARIES | |||||||||||||||||||||
Non-GAAP Financial Information (Unaudited) | |||||||||||||||||||||
At and for the Three Months Ended December 31, | At and for the Twelve Months Ended December 31, | ||||||||||||||||||||
2022 | 2021 | 2022 | 2021 | ||||||||||||||||||
Reconciliation Table - Non-GAAP Financial Information | (Dollars in Thousands Except Share Data) | ||||||||||||||||||||
Net income | $ | 29,695 | $ | 28,545 | $ | 109,744 | $ | 115,440 | |||||||||||||
Less: | |||||||||||||||||||||
Security gains (losses) (after-tax) | 264 | (24 | ) | 252 | (28 | ) | |||||||||||||||
Add: | |||||||||||||||||||||
Merger and acquisition expenses (after-tax) | 527 | — | 1,763 | — | |||||||||||||||||
Operating earnings | $ | 29,958 | $ | 28,569 | $ | 111,255 | $ | 115,468 | |||||||||||||
Operating earnings per common share: | |||||||||||||||||||||
Basic | $ | 0.39 | $ | 0.37 | $ | 1.44 | $ | 1.48 | |||||||||||||
Diluted | 0.39 | 0.37 | 1.44 | 1.48 | |||||||||||||||||
Weighted average common shares outstanding during the period: | |||||||||||||||||||||
Basic | 76,841,655 | 77,610,608 | 77,079,278 | 77,974,851 | |||||||||||||||||
Diluted | 77,065,076 | 77,864,097 | 77,351,834 | 78,243,416 | |||||||||||||||||
Return on average assets * | 1.34 | % | 1.35 | % | 1.27 | % | 1.36 | % | |||||||||||||
Less: | |||||||||||||||||||||
Security gains (after-tax) * | 0.01 | % | — | % | — | % | — | % | |||||||||||||
Add: | |||||||||||||||||||||
Merger and acquisition expenses (after-tax) * | 0.02 | % | — | % | 0.02 | % | — | % | |||||||||||||
Operating return on average assets * | 1.35 | % | 1.35 | % | 1.29 | % | 1.36 | % | |||||||||||||
Return on average tangible assets * | 1.37 | % | 1.38 | % | 1.30 | % | 1.38 | % | |||||||||||||
Less: | |||||||||||||||||||||
Security gains (after-tax) * | 0.01 | % | — | % | — | % | — | % | |||||||||||||
Add: | |||||||||||||||||||||
Merger and acquisition expenses (after-tax) * | 0.02 | % | — | % | 0.02 | % | — | % | |||||||||||||
Operating return on average tangible assets * | 1.38 | % | 1.38 | % | 1.32 | % | 1.38 | % | |||||||||||||
Return on average stockholders' equity * | 12.09 | % | 11.56 | % | 11.15 | % | 11.93 | % | |||||||||||||
Less: | |||||||||||||||||||||
Security gains (losses) (after-tax) * | 0.11 | % | (0.01 | )% | 0.03 | % | — | % | |||||||||||||
Add: | |||||||||||||||||||||
Merger and acquisition expenses (after-tax) * | 0.21 | % | — | % | 0.18 | % | — | % | |||||||||||||
Operating return on average stockholders' equity * | 12.19 | % | 11.57 | % | 11.30 | % | 11.93 | % | |||||||||||||
Return on average tangible stockholders' equity * | 14.48 | % | 13.84 | % | 13.35 | % | 14.35 | % | |||||||||||||
Less: | |||||||||||||||||||||
Security gains (losses) (after-tax) * | 0.13 | % | (0.01 | )% | 0.03 | % | — | % | |||||||||||||
Add: | |||||||||||||||||||||
Merger and acquisition expenses (after-tax) * | 0.26 | % | — | % | 0.21 | % | — | % | |||||||||||||
Operating return on average tangible stockholders' equity * | 14.61 | % | 13.85 | % | 13.53 | % | 14.35 | % | |||||||||||||
* Ratios at and for the three months ended are annualized. | |||||||||||||||||||||
BROOKLINE BANCORP, INC. AND SUBSIDIARIES | |||||||||||||||||||||
Non-GAAP Financial Information (Unaudited) | |||||||||||||||||||||
At and for the Three Months Ended | At and for the Twelve Months Ended | ||||||||||||||||||||
December 31, 2022 | September 30, 2022 | June 30, 2022 | March 31, 2022 | December 31, 2021 | December 31, 2022 | December 31, 2021 | |||||||||||||||
(Dollars in Thousands) | |||||||||||||||||||||
Net income, as reported | $ | 29,695 | $ | 30,149 | $ | 25,195 | $ | 24,705 | $ | 28,545 | $ | 109,744 | $ | 115,440 | |||||||
Average total assets | $ | 8,857,631 | $ | 8,586,420 | $ | 8,515,330 | $ | 8,531,043 | $ | 8,462,231 | $ | 8,623,403 | $ | 8,518,200 | |||||||
Less: Average goodwill and average identified intangible assets, net | 162,266 | 162,387 | 162,507 | 162,632 | 162,804 | 162,447 | 163,122 | ||||||||||||||
Average tangible assets | $ | 8,695,365 | $ | 8,424,033 | $ | 8,352,823 | $ | 8,368,411 | $ | 8,299,427 | $ | 8,460,956 | $ | 8,355,078 | |||||||
Return on average tangible assets (annualized) | 1.37 | % | 1.43 | % | 1.21 | % | 1.18 | % | 1.38 | % | 1.30 | % | 1.38 | % | |||||||
Average total stockholders’ equity | $ | 982,306 | $ | 981,379 | $ | 976,167 | $ | 997,293 | $ | 987,522 | $ | 984,237 | $ | 967,538 | |||||||
Less: Average goodwill and average identified intangible assets, net | 162,266 | 162,387 | 162,507 | 162,632 | 162,804 | 162,447 | 163,122 | ||||||||||||||
Average tangible stockholders’ equity | $ | 820,040 | $ | 818,992 | $ | 813,660 | $ | 834,661 | $ | 824,718 | $ | 821,790 | $ | 804,416 | |||||||
Return on average tangible stockholders’ equity (annualized) | 14.48 | % | 14.72 | % | 12.39 | % | 11.84 | % | 13.84 | % | 13.35 | % | 14.35 | % | |||||||
Total stockholders’ equity | $ | 992,125 | $ | 963,618 | $ | 968,496 | $ | 981,935 | $ | 995,342 | $ | 992,125 | $ | 995,342 | |||||||
Less: | |||||||||||||||||||||
Goodwill | 160,427 | 160,427 | 160,427 | 160,427 | 160,427 | 160,427 | 160,427 | ||||||||||||||
Identified intangible assets, net | 1,781 | 1,902 | 2,022 | 2,142 | 2,276 | 1,781 | 2,276 | ||||||||||||||
Tangible stockholders' equity | $ | 829,917 | $ | 801,289 | $ | 806,047 | $ | 819,366 | $ | 832,639 | $ | 829,917 | $ | 832,639 | |||||||
Total assets | $ | 9,222,553 | $ | 8,695,708 | $ | 8,514,230 | $ | 8,633,736 | $ | 8,602,622 | $ | 9,222,553 | $ | 8,602,622 | |||||||
Less: | |||||||||||||||||||||
Goodwill | 160,427 | 160,427 | 160,427 | 160,427 | 160,427 | 160,427 | 160,427 | ||||||||||||||
Identified intangible assets, net | 1,781 | 1,902 | 2,022 | 2,142 | 2,276 | 1,781 | 2,276 | ||||||||||||||
Tangible assets | $ | 9,060,345 | $ | 8,533,379 | $ | 8,351,781 | $ | 8,471,167 | $ | 8,439,919 | $ | 9,060,345 | $ | 8,439,919 | |||||||
Tangible stockholders’ equity to tangible assets | 9.16 | % | 9.39 | % | 9.65 | % | 9.67 | % | 9.87 | % | 9.16 | % | 9.87 | % | |||||||
Tangible stockholders' equity | $ | 829,917 | $ | 801,289 | $ | 806,047 | $ | 819,366 | $ | 832,639 | $ | 829,917 | $ | 832,639 | |||||||
Number of common shares issued | 85,177,172 | 85,177,172 | 85,177,172 | 85,177,172 | 85,177,172 | 85,177,172 | 85,177,172 | ||||||||||||||
Less: | |||||||||||||||||||||
Treasury shares | 7,731,445 | 7,730,945 | 7,995,888 | 7,037,464 | 7,037,464 | 7,731,445 | 7,037,464 | ||||||||||||||
Unallocated ESOP shares | 0 | 4,833 | 11,442 | 18,051 | 24,660 | 0 | 24,660 | ||||||||||||||
Unvested restricted shares | 601,495 | 601,995 | 497,297 | 500,098 | 500,098 | 601,495 | 500,098 | ||||||||||||||
Number of common shares outstanding | 76,844,232 | 76,839,399 | 76,672,545 | 77,621,559 | 77,614,950 | 76,844,232 | 77,614,950 | ||||||||||||||
Tangible book value per common share | $ | 10.80 | $ | 10.43 | $ | 10.51 | $ | 10.56 | $ | 10.73 | $ | 10.80 | $ | 10.73 | |||||||
PDF available: http://ml.globenewswire.com/Resource/Download/036fc9de-39d2-47b2-8dfa-114a241599ec
Exhibit 99.2
January 25, 2023 1 4Q 2022 Financial Results
Forward Looking Statements 2 Certain statements contained in this press release that are not historical facts may constitute forward - looking statements within the meaning of Section 27A of the Securities Act of 1933, as amended, and Section 21E of the Securities Exchange Act of 1934, as amended, and are intended to be covered by the safe harbor provisions of the Private Securities Litigation Reform Act of 1995. We may also make forward - looking statements in other documents we file with the Securities and Exchange Commission ("SEC"), in our annual reports to shareholders, in press releases and other written materials, and in oral statements made by our officers, directors or employees. You can identify forward looking statements by the use of the words “believe,” “expect,” “anticipate,” “intend,” “estimate,” “assume,” “outlook,” “will,” “should,” and other expressions that predict or indicate future events and trends and which do not relate to historical matters, including statements regarding the Company’s business, credit quality, financial condition, liquidity and results of operations. Forward - looking statements may differ, possibly materially, from what is included in this press release due to factors and future developments that are uncertain and beyond the scope of the Company’s control. These include, but are not limited to, the Company’s ability to achieve the synergies and value creation contemplated by the acquisition of PCSB; turbulence in the capital and debt markets; changes in interest rates; competitive pressures from other financial institutions; general economic conditions (including inflation) on a national basis or in the local markets in which the Company operates; changes in consumer behavior due to changing political, business and economic conditions, or legislative or regulatory initiatives; changes in the value of securities and other assets in the Company’s investment portfolio; increases in loan and lease default and charge - off rates; the adequacy of allowances for loan and lease losses; decreases in deposit levels that necessitate increases in borrowing to fund loans and investments; operational risks including, but not limited to, cybersecurity incidents, fraud, natural disasters, the ongoing COVID - 19 pandemic and future pandemics; changes in regulation; the possibility that future credit losses may be higher than currently expected due to changes in economic assumptions and adverse economic developments; the risk that goodwill and intangibles recorded in the Company’s financial statements will become impaired; and changes in assumptions used in making such forward - looking statements. Forward - looking statements involve risks and uncertainties which are difficult to predict. The Company’s actual results could differ materially from those projected in the forward - looking statements as a result of, among others, the risks outlined in the Company’s Annual Report on Form 10 - K, as updated by its Quarterly Reports on Form 10 - Q and other filings submitted to the SEC. The Company does not undertake any obligation to update any forward - looking statement to reflect circumstances or events that occur after the date the forward - looking statements are made.
x Loans grew $223 million or 12% annualized. x Net interest margin of 3.80%. x ROA of 1.34% and ROTCE of 14.48%. x Q3 Efficiency ratio of 53.01%. x Revenues up $4.2 million; Operating Expenses up $2.7 million. x Merger charges down $0.5 million. 3 Fortress Balance Sheet / Asset Quality x NPAs to total assets of 0.17%. x Net charge - offs of 0.02% annualized. x The reserve for loan losses represents a coverage ratio of 129 basis points. x Loan growth required provision for credit losses of $5.7 million, up $2.9 million from Q3, or $0.03 EPS impact. Quarterly net income of $29.7 million and earnings per share of $0.39. Dividend of $0.135 per share. PCSB Financial acquisition closed January 1, 2023.
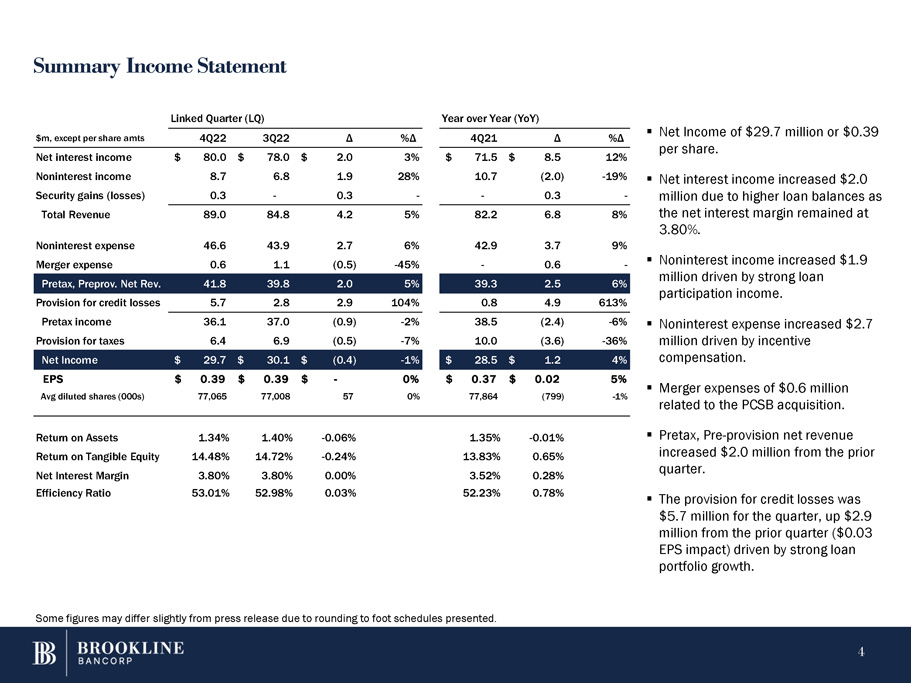
Summary Income Statement Some figures may differ slightly from press release due to rounding to foot schedules presented. 4 ▪ Net Income of $29.7 million or $0.39 per share. ▪ Net interest income increased $2.0 Security gains (losses) 0.3 - 0.3 - - 0.3 - million due to higher loan balances as Total Revenue 89.0 84.8 4.2 5% 82.2 6.8 8% the net interest margin remained at 3.80%. ▪ Noninterest income increased $1.9 million driven by strong loan participation income. compensation. ▪ Merger expenses of $0.6 million related to the PCSB acquisition. ▪ Pretax, Pre - provision net revenue increased $2.0 million from the prior quarter. ▪ The provision for credit losses was $5.7 million for the quarter, up $2.9 million from the prior quarter ($0.03 EPS impact) driven by strong loan portfolio growth. Noninterest expense 46.6 43.9 2.7 6% 42.9 3.7 9% Merger expense 0.6 1.1 (0.5) - 45% - 0.6 - Pretax, Preprov. Net Rev. 41.8 39.8 2.0 5% 39.3 2.5 6% Provision for credit losses 5.7 2.8 2.9 104% 0.8 4.9 613% Pretax income 36.1 37.0 (0.9) - 2% 38.5 (2.4) - 6% ▪ Noninterest expense increased $2.7 Provision for taxes 6.4 6.9 (0.5) - 7% 10.0 (3.6) - 36% million driven by incentive Net Income $ 29.7 $ 30.1 $ (0.4) - 1% $ 28.5 $ 1.2 4% EPS $ 0.39 $ 0.39 $ - 0% $ 0.37 $ 0.02 5% Avg diluted shares (000s) 77,065 77,008 57 0% 77,864 (799) - 1% Return on Assets 1.34% 1.40% - 0.06% 1.35% - 0.01% Return on Tangible Equity 14.48% 14.72% - 0.24% 13.83% 0.65% Net Interest Margin 3.80% 3.80% 0.00% 3.52% 0.28% Efficiency Ratio 53.01% 52.98% 0.03% 52.23% 0.78% Linked Quarter (LQ) Year over Year (YoY) $m, except per share amts 4Q22 3Q22 Δ %Δ 4Q21 Δ %Δ Net interest income $ 80.0 $ 78.0 $ 2.0 3% $ 71.5 $ 8.5 12% Noninterest income 8.7 6.8 1.9 28% 10.7 (2.0) - 19%
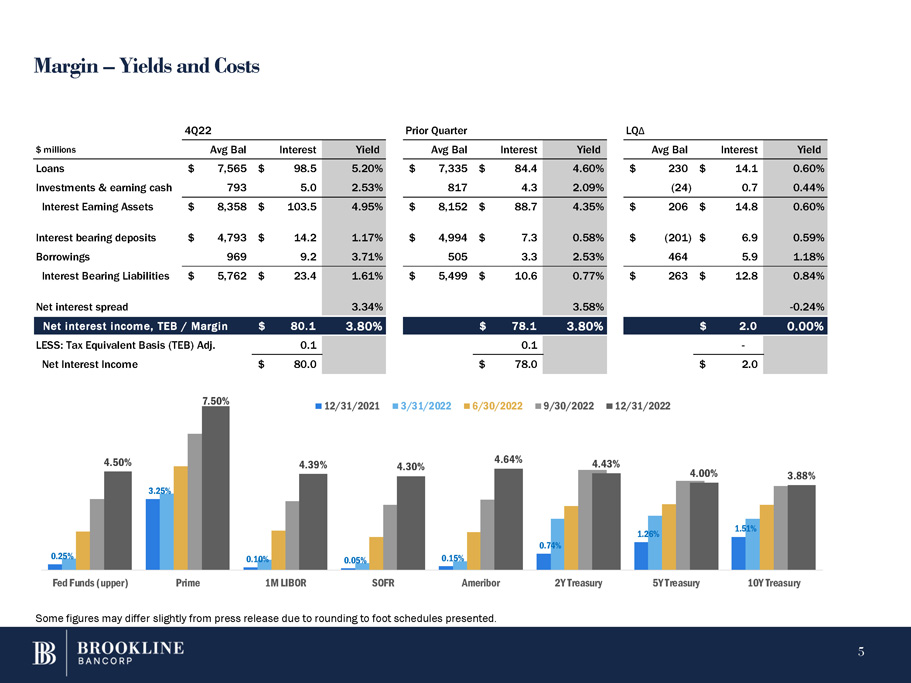
Margin – Yields and Costs 0.25% 3.25% 0.10% 0.05% 0.15% 0.74% 1.26% 1.51% 4.50% 4.39% 4.30% 4.64% 4.43% 4.00% 3.88% Fed Funds (upper) Prime 1M LIBOR SOFR Ameribor 2Y Treasury 5Y Treasury 10Y Treasury 4Q22 Prior Quarter LQ Δ $ millions Avg Bal Interest Yield Avg Bal Interest Yield Avg Bal Interest Yield Loans $ 7,565 $ 98.5 5.20% $ 7,335 $ 84.4 4.60% $ 230 $ 14.1 0.60% Investments & earning cash 793 5.0 2.53% 817 4.3 2.09% (24) 0.7 0.44% Interest Earning Assets $ 8,358 $ 103.5 4.95% $ 8,152 $ 88.7 4.35% $ 206 $ 14.8 0.60% Interest bearing deposits $ 4,793 $ 14.2 1.17% $ 4,994 $ 7.3 0.58% $ (201) $ 6.9 0.59% Borrowings 969 9.2 3.71% 505 3.3 2.53% 464 5.9 1.18% Interest Bearing Liabilities $ 5,762 $ 23.4 1.61% $ 5,499 $ 10.6 0.77% $ 263 $ 12.8 0.84% Net interest spread 3.34% 3.58% - 0.24% Net interest income, TEB / Margin $ 80.1 3.80% $ 78.1 3.80% $ 2.0 0.00% LESS: Tax Equivalent Basis (TEB) Adj. 0.1 0.1 - Net Interest Income $ 80.0 $ 78.0 $ 2.0 7.50% 12/31/2021 3/31/2022 6/30/2022 9/30/2022 12/31/2022 Some figures may differ slightly from press release due to rounding to foot schedules presented. 5
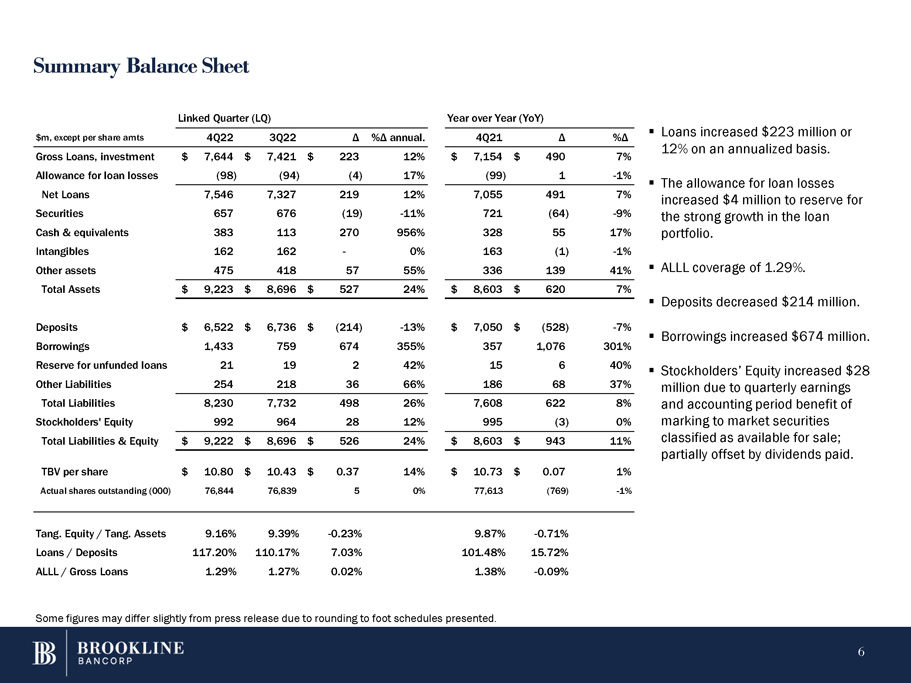
Summary Balance Sheet ▪ Loans increased $223 million or 12% on an annualized basis. ▪ The allowance for loan losses increased $4 million to reserve for the strong growth in the loan portfolio. ▪ ALLL coverage of 1.29%. ▪ Deposits decreased $214 million. ▪ Borrowings increased $674 million. ▪ Stockholders’ Equity increased $28 million due to quarterly earnings Total Liabilities 8,230 7,732 498 26% 7,608 622 8% and accounting period benefit of Stockholders' Equity 992 964 28 12% 995 (3) 0% marking to market securities Total Liabilities & Equity $ 9,222 $ 8,696 $ 526 24% $ 8,603 $ 943 11% classified as available for sale; partially offset by dividends paid. TBV per share $ 10.80 $ 10.43 $ 0.37 14% $ 10.73 $ 0.07 1% Actual shares outstanding (000) 76,844 76,839 5 0% 77,613 (769) - 1% Linked Quarter (LQ) Year over Year (YoY) $m, except per share amts 4Q22 3Q22 Δ %Δ annual. 4Q21 Δ %Δ Gross Loans, investment $ 7,644 $ 7,421 $ 223 12% $ 7,154 $ 490 7% Allowance for loan losses (98) (94) (4) 17% (99) 1 - 1% Net Loans 7,546 7,327 219 12% 7,055 491 7% Securities 657 676 (19) - 11% 721 (64) - 9% Cash & equivalents 383 113 270 956% 328 55 17% Intangibles 162 162 - 0% 163 (1) - 1% Other assets 475 418 57 55% 336 139 41% Total Assets $ 9,223 $ 8,696 $ 527 24% $ 8,603 $ 620 7% Deposits $ 6,522 $ 6,736 $ (214) - 13% $ 7,050 $ (528) - 7% Borrowings 1,433 759 674 355% 357 1,076 301% Reserve for unfunded loans 21 19 2 42% 15 6 40% Other Liabilities 254 218 36 66% 186 68 37% Tang. Equity / Tang. Assets 9.16% 9.39% - 0.23% 9.87% - 0.71% Loans / Deposits 117.20% 110.17% 7.03% 101.48% 15.72% ALLL / Gross Loans 1.29% 1.27% 0.02% 1.38% - 0.09% Some figures may differ slightly from press release due to rounding to foot schedules presented. 6
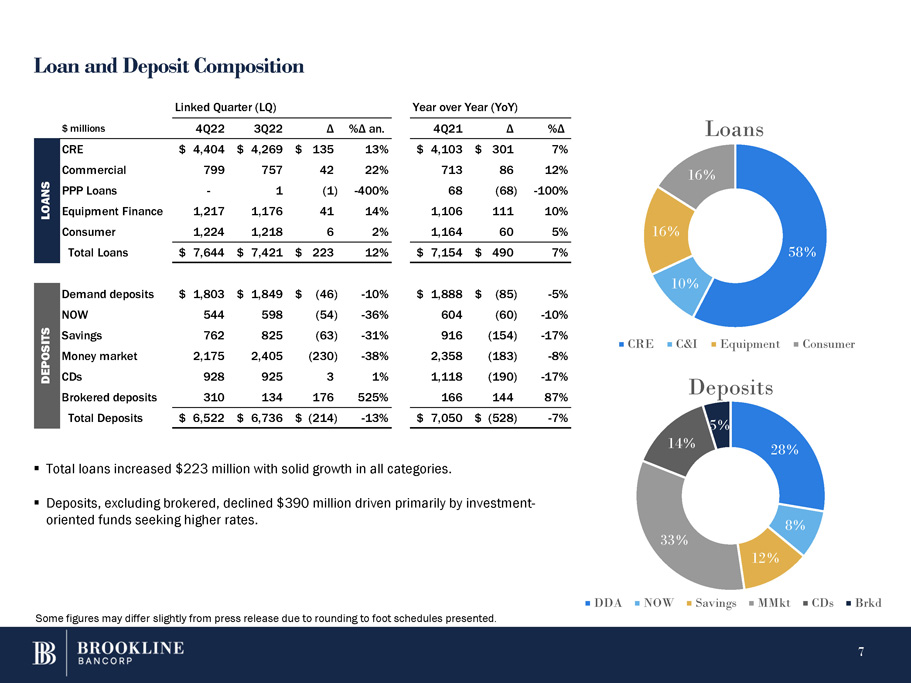
Loan and Deposit Composition 58% 10% 16% Loans 16% CRE C&I Equipment Consumer 28% 8% 14% Deposits 5% 33% 12% DDA NOW Savings MMkt CDs Brkd $ millions 4Q22 3Q22 Δ %Δ an. 4Q21 Δ %Δ CRE $ 4,404 $ 4,269 $ 135 13% $ 4,103 $ 301 7% Commercial 799 757 42 22% 713 86 12% Demand deposits $ 1,803 $ 1,849 $ (46) - 10% $ 1,888 $ (85) - 5% NOW 544 598 (54) - 36% 604 (60) - 10% ITS Savings 762 825 (63) - 31% 916 (154) - 17% PO S Money market 2,175 2,405 (230) - 38% 2,358 (183) - 8% D E CDs 928 925 3 1% 1,118 (190) - 17% Brokered deposits 310 134 176 525% 166 144 87% Total Deposits $ 6,522 $ 6,736 $ (214) - 13% $ 7,050 $ (528) - 7% - 1,217 1,224 1 1,176 1,218 (1) - 400% 41 14% 6 2% 68 1,106 1,164 (68) - 100% 111 10% 60 5% PPP Loans Equipment Finance Consumer Total Loans $ 7,644 $ 7,421 $ 223 12% $ 7,154 $ 490 7% Linked Quarter (LQ) Year over Year (YoY) LOANS ▪ Total loans increased $223 million with solid growth in all categories. Some figures may differ slightly from press release due to rounding to foot schedules presented. 7 ▪ Deposits, excluding brokered, declined $390 million driven primarily by investment - oriented funds seeking higher rates.
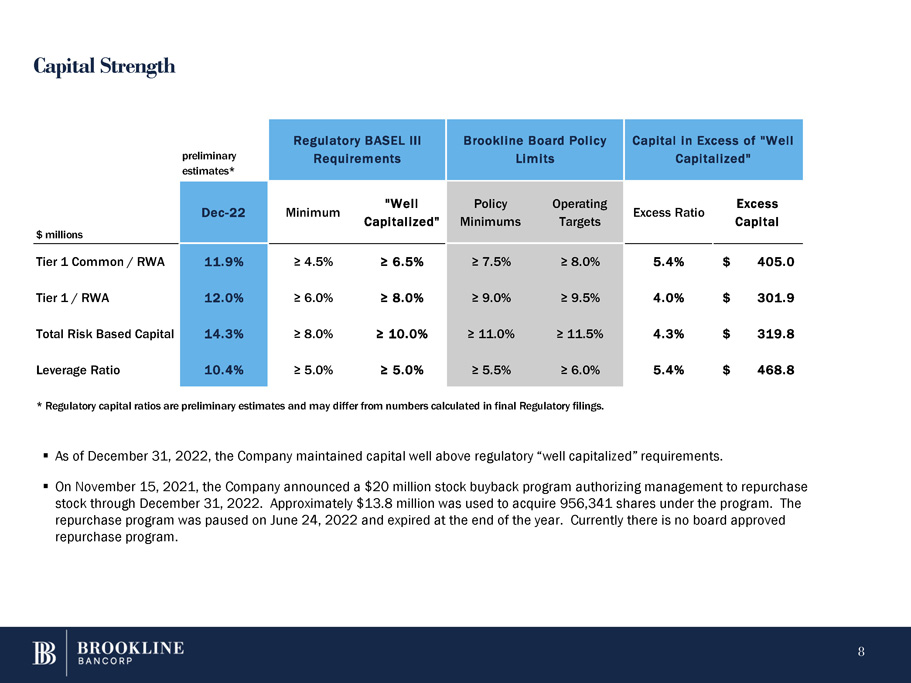
Capital Strength 8 ▪ As of December 31, 2022, the Company maintained capital well above regulatory “well capitalized” requirements. ▪ On November 15, 2021, the Company announced a $20 million stock buyback program authorizing management to repurchase stock through December 31, 2022. Approximately $13.8 million was used to acquire 956,341 shares under the program. The repurchase program was paused on June 24, 2022 and expired at the end of the year. Currently there is no board approved repurchase program. preliminary estimates* Regulatory BASEL III Requirements Brookline Board Policy Limits Capital in Excess of "Well Capitalized" $ millions Dec - 22 Minimum "Well Capitalized" Policy Minimums Operating Targets Excess Ratio Excess Capital Tier 1 Common / RWA 11.9% ≥ 4.5% ≥ 6.5% ≥ 7.5% ≥ 8.0% 5.4% $ 405.0 Tier 1 / RWA 12.0% ≥ 6.0% ≥ 8.0% ≥ 9.0% ≥ 9.5% 4.0% $ 301.9 Total Risk Based Capital 14.3% ≥ 8.0% ≥ 10.0% ≥ 11.0% ≥ 11.5% 4.3% $ 319.8 Leverage Ratio 10.4% ≥ 5.0% ≥ 5.0% ≥ 5.5% ≥ 6.0% 5.4% $ 468.8 * Regulatory capital ratios are preliminary estimates and may differ from numbers calculated in final Regulatory filings.
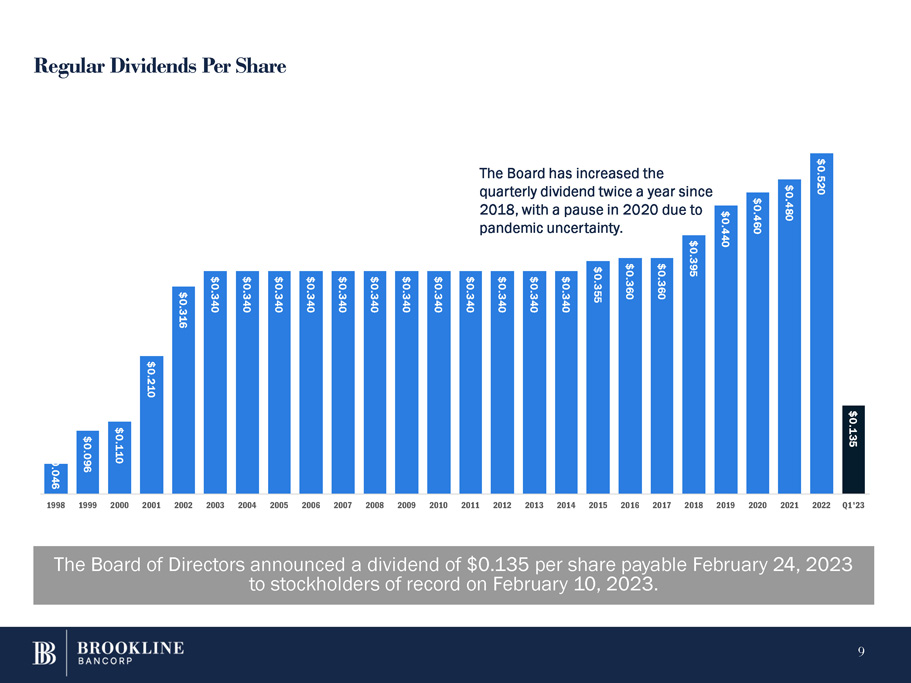
Regular Dividends Per Share The Board of Directors announced a dividend of $0.135 per share payable February 24, 2023 to stockholders of record on February 10, 2023. 0.046 9 $0.096 $0.110 $0.210 $0.316 $0.340 $0.340 $0.340 $0.340 $0.340 $0.340 $0.340 $0.340 $0.340 $0.340 $0.340 $0.340 $0.355 $0.360 $0.360 $0.395 $0.440 $0.460 $0.480 $0.520 $0.135 1998 1999 2000 2001 2002 2003 2004 2005 2006 2007 2008 2009 2010 2011 2012 2013 2014 2015 2016 2017 2018 2019 2020 2021 2022 Q1'23 The Board has increased the quarterly dividend twice a year since 2018, with a pause in 2020 due to pandemic uncertainty.
QUESTIONS Paul A. Perrault, Chairman and Chief Executive Officer Carl M. Carlson, Co - President and Chief Financial Officer Thank You. 10
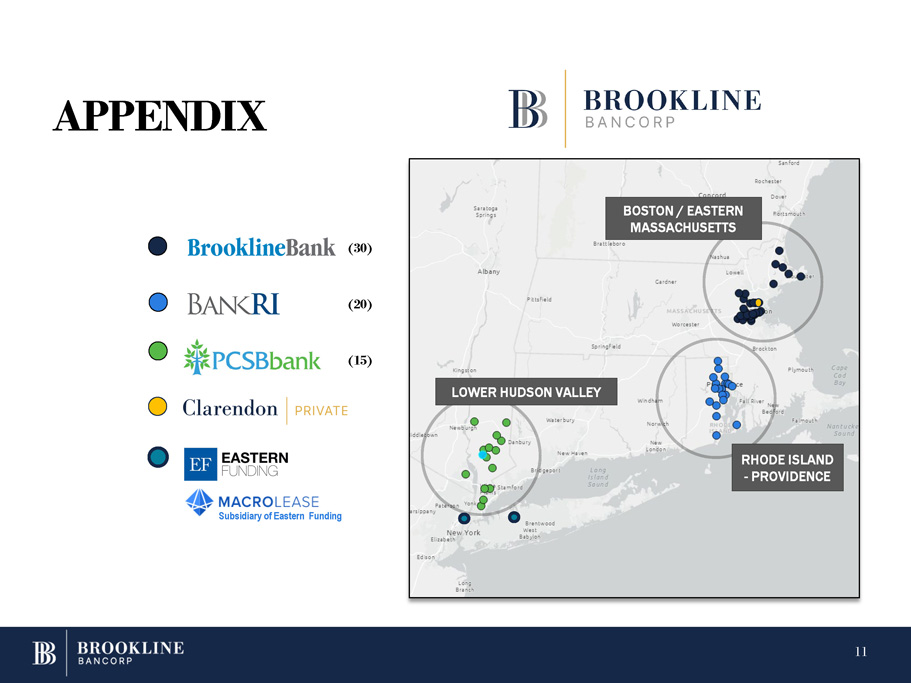
APPENDIX RHODE ISLAND - PROVIDENCE LOWER HUDSON VALLEY BOSTON / EASTERN MASSACHUSETTS (30) (20) (15) Subsidiary of Eastern Funding 11
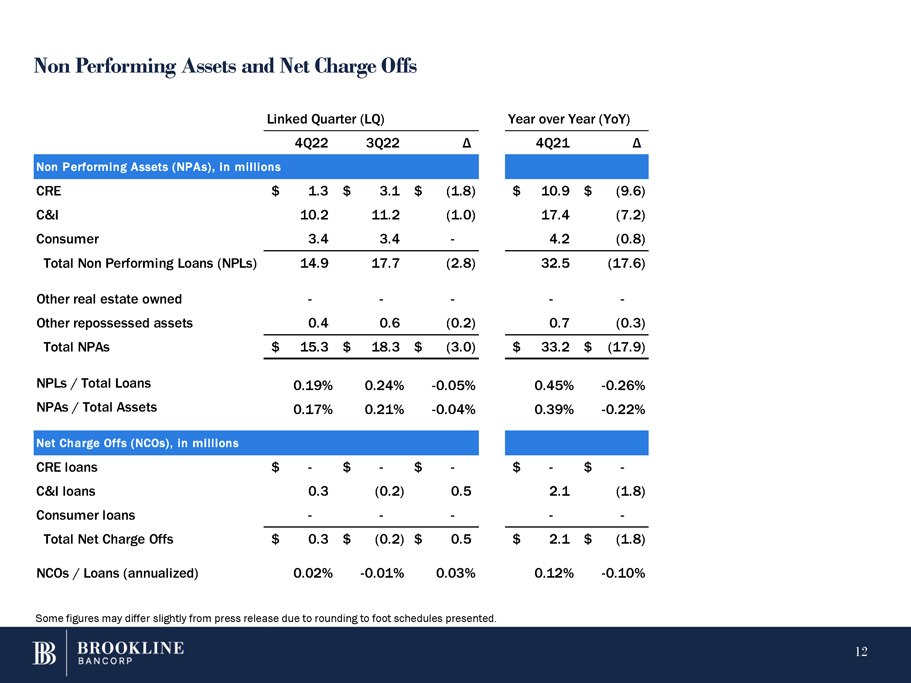
Non Performing Assets and Net Charge Offs Some figures may differ slightly from press release due to rounding to foot schedules presented. 12 4Q22 3Q22 Δ 4Q21 Δ Non Performing Assets (NPAs), in milli ons CRE $ 1.3 $ 3.1 $ (1.8) $ 10.9 $ (9.6) C&I 10.2 11.2 (1.0) 17.4 (7.2) Consumer 3.4 3.4 - 4.2 (0.8) Total Non Performing Loans (NPLs) 14.9 17.7 (2.8) 32.5 (17.6) Other real estate owned - - - - - Other repossessed assets 0.4 0.6 (0.2) 0.7 (0.3) Total NPAs $ 15.3 $ 18.3 $ (3.0) $ 33.2 $ (17.9) NPLs / Total Loans 0.19% 0.24% - 0.05% 0.45% - 0.26% NPAs / Total Assets 0.17% 0.21% - 0.04% 0.39% - 0.22% Net Charge Offs (NCOs), in millions CRE loans $ - $ - $ - $ - $ - C&I loans 0.3 (0.2) 0.5 2.1 (1.8) Consumer loans - - - - - Total Net Charge Offs $ 0.3 $ (0.2) $ 0.5 $ 2.1 $ (1.8) NCOs / Loans (annualized) 0.02% - 0.01% 0.03% 0.12% - 0.10% Linked Quarter (LQ) Year over Year (YoY)
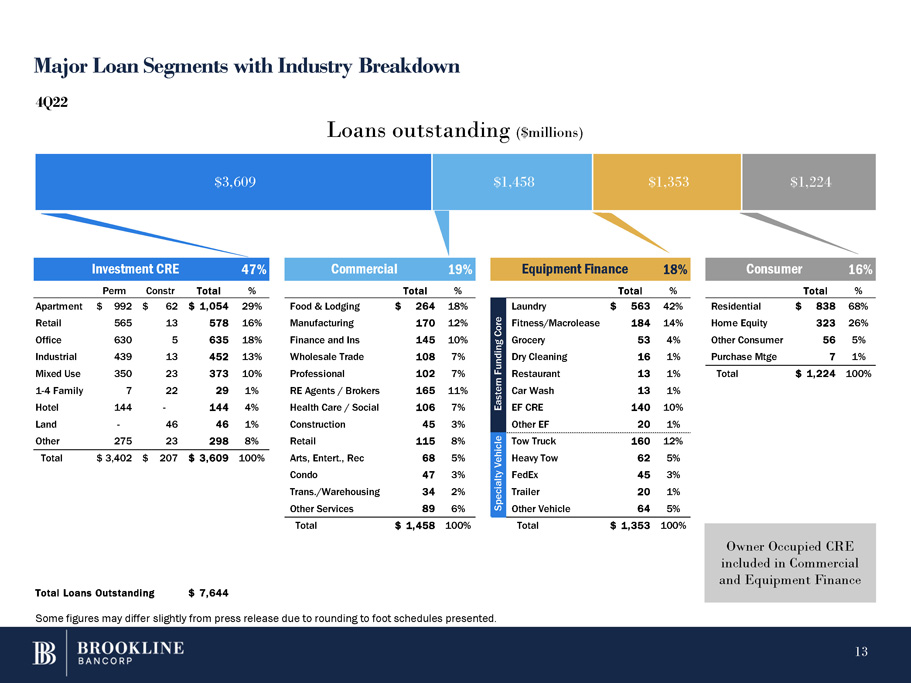
Investment CRE 47% Commercial 19% Equipment Finance 18% Consumer 16% Perm Constr Total % Total % Total % Total % Apartment $ 992 $ 62 $ 1,054 29% Food & Lodging $ 264 18% Retail 565 13 578 16% Manufacturing 170 12% Office 630 5 635 18% Finance and Ins 145 10% Industrial 439 13 452 13% Wholesale Trade 108 7% Mixed Use 350 23 373 10% Professional 102 7% 1 - 4 Family 7 22 29 1% RE Agents / Brokers 165 11% Hotel 144 - 144 4% Health Care / Social 106 7% Land - 46 46 1% Construction 45 3% Other 275 23 298 8% Retail 115 8% Total $ 3,402 $ 207 $ 3,609 100% Arts, Entert., Rec 68 5% Condo 47 3% Trans./Warehousing 34 2% Other Services 89 6% Residential Home Equity Other Consumer Purchase Mtge $ 838 68% 323 26% 56 5% 7 1% Total $ 1,224 100% Total $ 1,458 100% Total $ 1,353 100% Eastern Funding Core Laundry $ 563 42% Fitness/Macrolease 184 14% Grocery 53 4% Dry Cleaning 16 1% Restaurant 13 1% Car Wash 13 1% EF CRE 140 10% Other EF 20 1% Specialty Vehicle Tow Truck 160 12% Heavy Tow 62 5% FedEx 45 3% Trailer 20 1% Other Vehicle 64 5% Total Loans Outstanding $ 7,644 Major Loan Segments with Industry Breakdown $3,609 $1,458 $1,353 $1,224 4Q22 Loans outstanding ($millions) Owner Occupied CRE included in Commercial and Equipment Finance Some figures may differ slightly from press release due to rounding to foot schedules presented. 13
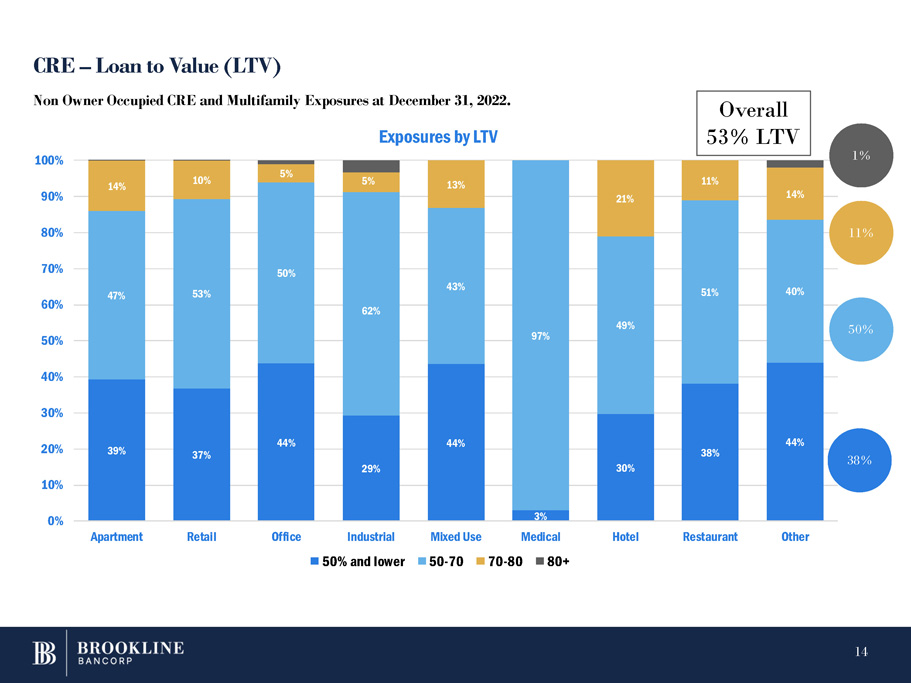
CRE – Loan to Value (LTV) 39% 37% 44% 29% 44% 3% 30% 38% 44% 47% 53% 50% 62% 43% 97% 49% 51% 40% 14% 10% 5% 5% 13% 21% 11% 14% 0% 10% 20% 30% 40% 50% 60% 70% 80% 90% 100% Apartment Retail Office Medical Hotel Restaurant Other Exposures by LTV Industrial 50% and lower Mixed Use 50 - 70 70 - 80 80+ Non Owner Occupied CRE and Multifamily Exposures at December 31, 2022. 38% 50% 1% 11% 14 Overall 53% LTV
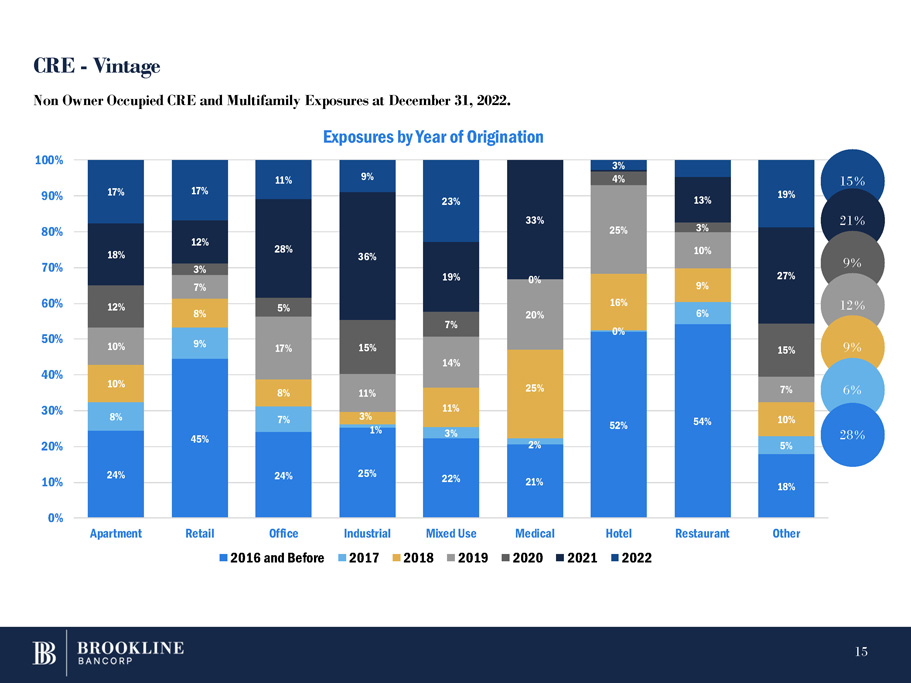
24% 45% 24% 25% 22% 21% 52% 54% 18% 8% 9% 7% 1% 3% 2% 0% 6% 5% 10% 8% 8% 11% 25% 16% 9% 10% 10% 7% 17% 11% 3% 14% 20% 25% 10% 7% 12% 3% 5% 15% 7% 0% 4% 3% 15% 18% 12% 28% 36% 19% 33% 13% 27% 17% 17% 11% 9% 23% 3% 19% 0% 10% 20% 30% 40% 50% 60% 70% 80% 90% 100% Apartment Retail Office 2016 and Before Restaurant Other Non Owner Occupied CRE and Multifamily Exposures at December 31, 2022. Exposures by Year of Origination Industrial Mixed Use Medical Hotel 2017 2018 2019 2020 2021 2022 15 % CRE - Vintage 21 % 9 % 12 % 9 % 6 % 28 % 15
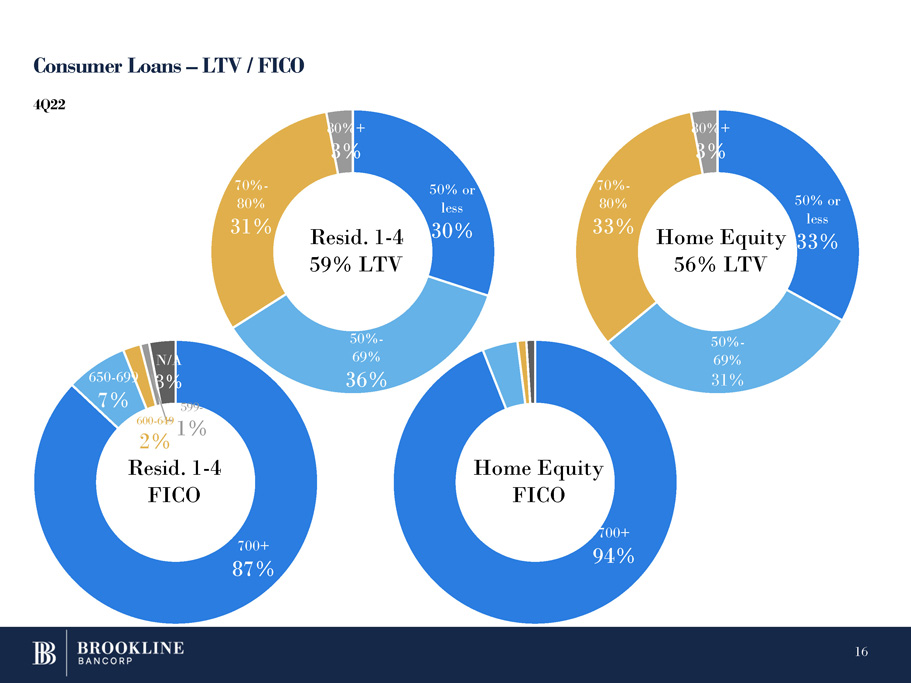
Consumer Loans – LTV / FICO 16 700+ 87% 650 - 699 7% 599 - 600 - 649 1% N/A 3% 50% or less 30% 50% - 69% 36% 70% - 80% 31% 80%+ 3% 50% or less 33% 50% - 69% 31% 70% - 80% 33% 80%+ 3% Resid. 1 - 4 59% LTV 2% Resid. 1 - 4 FICO Home Equity FICO 700+ 94% Home Equity 56% LTV 4Q22
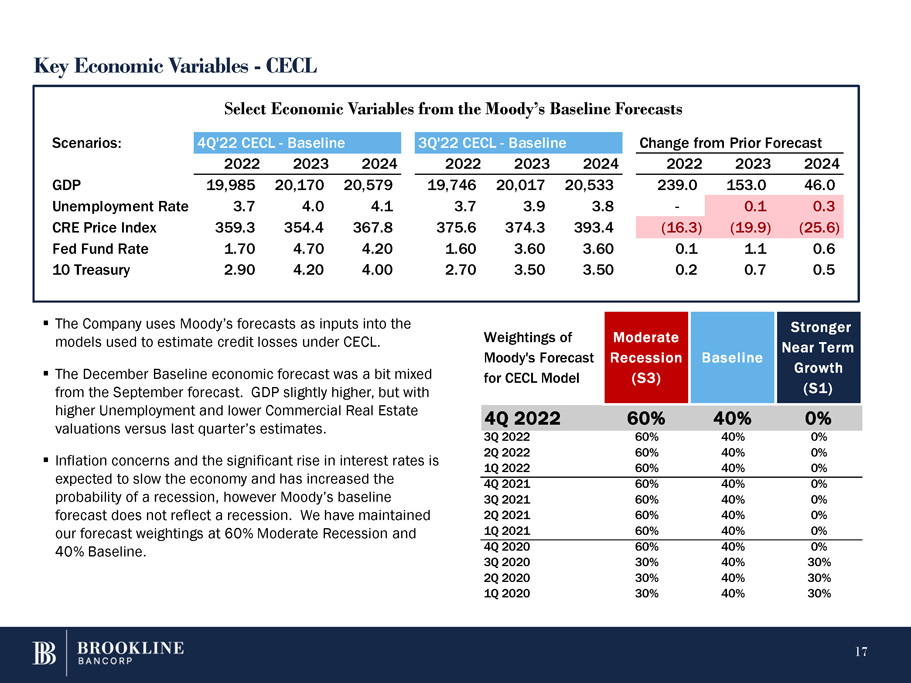
Key Economic Variables - CECL Select Economic Variables from the Moody’s Baseline Forecasts ▪ The Company uses Moody’s forecasts as inputs into the models used to estimate credit losses under CECL. ▪ The December Baseline economic forecast was a bit mixed from the September forecast. GDP slightly higher, but with higher Unemployment and lower Commercial Real Estate valuations versus last quarter’s estimates. ▪ Inflation concerns and the significant rise in interest rates is expected to slow the economy and has increased the probability of a recession, however Moody’s baseline forecast does not reflect a recession. We have maintained our forecast weightings at 60% Moderate Recession and 40% Baseline. 17 Scenarios: 4Q'22 CEC L - Baselin e 3Q'22 CEC L - Baselin e Change from Prior Fore cast 2022 2023 2024 2022 2023 2024 2022 2023 2024 GDP 19,985 20,170 20,579 19,746 20,017 20,533 239.0 153.0 46.0 Unemployment Rate 3.7 4.0 4.1 3.7 3.9 3.8 - 0.1 0.3 CRE Price Index 359.3 354.4 367.8 375.6 374.3 393.4 (16.3) (19.9) (25.6) Fed Fund Rate 1.70 4.70 4.20 1.60 3.60 3.60 0.1 1.1 0.6 10 Treasury 2.90 4.20 4.00 2.70 3.50 3.50 0.2 0.7 0.5 Weightings of Moody's Forecast for CECL Model Moderate Recession (S3) Baseline Stronger Near Term Growth (S1) 4Q 2022 60% 40% 0% 3Q 2022 60% 40% 0% 2Q 2022 60% 40% 0% 1Q 2022 60% 40% 0% 4Q 2021 60% 40% 0% 3Q 2021 60% 40% 0% 2Q 2021 60% 40% 0% 1Q 2021 60% 40% 0% 4Q 2020 60% 40% 0% 3Q 2020 30% 40% 30% 2Q 2020 30% 40% 30% 1Q 2020 30% 40% 30%
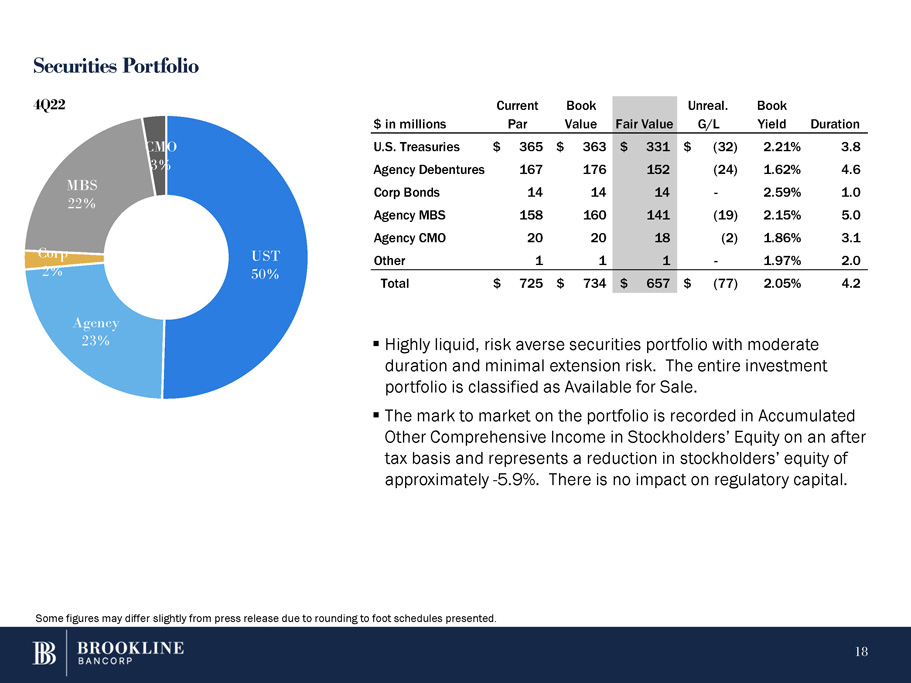
Securities Portfolio ▪ Highly liquid, risk averse securities portfolio with moderate duration and minimal extension risk. The entire investment portfolio is classified as Available for Sale. ▪ The mark to market on the portfolio is recorded in Accumulated Other Comprehensive Income in Stockholders’ Equity on an after tax basis and represents a reduction in stockholders’ equity of approximately - 5.9%. There is no impact on regulatory capital. UST 50% 18 Agency 23% Corp 2% CMO 3% MBS 22% 4Q22 $ in millions Current Par Book Value Fair Value Unreal. G/L Book Yield Duration U.S. Treasuries $ 365 $ 363 $ 331 $ (32) 2.21% 3.8 Agency Debentures 167 176 152 (24) 1.62% 4.6 Corp Bonds 14 14 14 - 2.59% 1.0 Agency MBS 158 160 141 (19) 2.15% 5.0 Agency CMO 20 20 18 (2) 1.86% 3.1 Other 1 1 1 - 1.97% 2.0 Total $ 725 $ 734 $ 657 $ (77) 2.05% 4.2 Some figures may differ slightly from press release due to rounding to foot schedules presented.
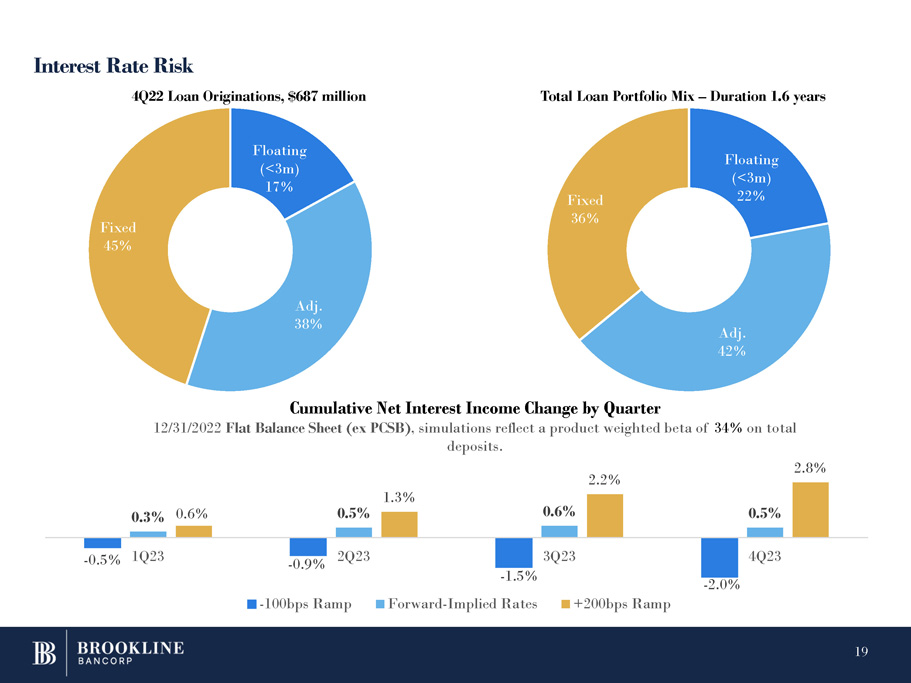
Interest Rate Risk Floating (<3m) 17% Adj. 38% Fixed 45% 4Q22 Loan Originations, $687 million Total Loan Portfolio Mix – Duration 1.6 years - 0.9% - 1.5% - 2.0% 0.3% 0.5% 0.6% 0.5% 0.6% 1.3% 2.2% - 0.5% 1Q23 2.8% 2Q23 3Q23 4Q23 Cumulative Net Interest Income Change by Quarter 12/31/2022 Flat Balance Sheet (ex PCSB) , simulations reflect a product weighted beta of 34% on total deposits. - 100bps Ramp Forward - Implied Rates +200bps Ramp Floating (<3m) 22% 19 Adj. 42% Fixed 36%
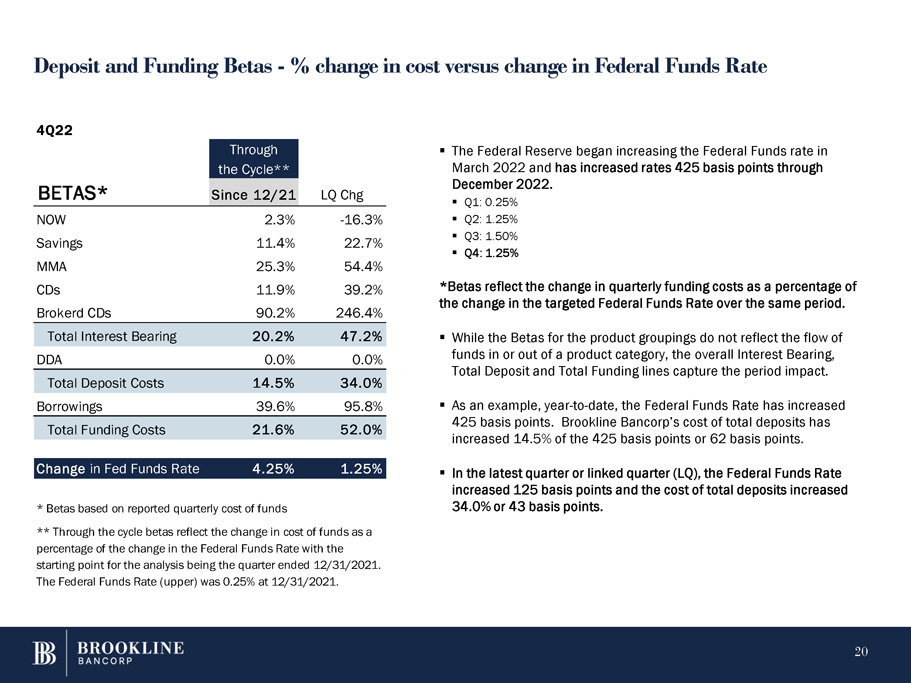
Deposit and Funding Betas - % change in cost versus change in Federal Funds Rate ▪ The Federal Reserve began increasing the Federal Funds rate in March 2022 and has increased rates 425 basis points through December 2022. ▪ Q1: 0.25% ▪ Q2: 1.25% ▪ Q3: 1.50% ▪ Q4: 1.25% *Betas reflect the change in quarterly funding costs as a percentage of the change in the targeted Federal Funds Rate over the same period. ▪ While the Betas for the product groupings do not reflect the flow of funds in or out of a product category, the overall Interest Bearing, Total Deposit and Total Funding lines capture the period impact. ▪ As an example, year - to - date, the Federal Funds Rate has increased 425 basis points. Brookline Bancorp’s cost of total deposits has increased 14.5% of the 425 basis points or 62 basis points. ▪ In the latest quarter or linked quarter (LQ), the Federal Funds Rate increased 125 basis points and the cost of total deposits increased 34.0% or 43 basis points. Through the Cycle** BETAS* Since 12/21 LQ Chg NOW 2.3% - 16.3% Savings 11.4% 22.7% MMA 25.3% 54.4% CDs 11.9% 39.2% Brokerd CDs 90.2% 246.4% Total Interest Bearing 20.2% 47.2% DDA 0.0% 0.0% Total Deposit Costs 14.5% 34.0% 4Q22 Borrowings 39.6% 95.8% Total Funding Costs 21.6% 52.0% Change in Fed Funds Rate 4.25% 1.25% * Betas based on reported quarterly cost of funds ** Through the cycle betas reflect the change in cost of funds as a percentage of the change in the Federal Funds Rate with the starting point for the analysis being the quarter ended 12/31/2021. The Federal Funds Rate (upper) was 0.25% at 12/31/2021. 20
3)0;UZ>V*LFL(F0HRIN-Q3%61P2_[]2G'N1BJ.BXL=FJY/;P\,
M5:<%2Q%:#OA5$P-R(4_$NVYP*M>&I8[<>Q';&E0A1P>!/PD[8JN//<4)/3%5
M3EQH"H<$=#BJK& >2TXK^SWQ50G5N+(>IJ!BJE K*0LGA0$^.*H*^MFE+-R+
M2)]FN^V*L><."W(&O\V*K54;'N:[8VJ!13+/(_9**#^O J84*K4;FF%74*M1
M3]KJ/#%6C0&A&_MBJJ-C6O/IMB%6\4H6#<:'<'QQM6F8FE/IQ5+YK(5:2V;T
MY'^VA^P_^LN-JD0@N+25I+ _5;EC633Y#^XE/^2?V<*M2)I>N ;?(ND^:+4&XC"7*#_1=2CVD0]JD=1BKSN]T&^T6UM+
M35T#E(D2WU2,522B@ -BJ?>7?.%]H12SOPUU8 UC>M70$]5/<>V!7N^EZO::
ME;QW%O,)8I!\,@_4? X0J<5_VQA5=D57C;Y8JM?H?EA5XKYA7AYSME/^[8I/
MQ6N*H/6K6\FL94L$YW,9$BI_,%ZC[L5>:RQ6FM1R+Q-O=Q;2QN*$$;&H[C&E
M89>6-Q83D4IQ/S!'\1CR5*I+9)!(;>/FDE3 SU
M*(WWEJ^4HU6:"NU>M*=5^6!6.)=WNCS&*_MGB<[!]Z ]B"-L59GIGF0NM)#R
M/9JUK].$JS>PUD. 4?FH'3%60P7<-R#P81O6N_\ #%4'(MPCE61J&O$KN#BJ
MH":<7'PTQ5L@;[<@NU?#%7E#T8'J#@5+FBMWB?3;P<;65B-.N6ZV\QVXL>RDX:5&:?ZR0FVN12YLV,
M4W>M.A!]QBK(]'NS;7L98D1S?NY*>_0_0S*:C%4@;1KV[,
MUEK>GQ^K" T=U&?@?W'<'"K&;W0K_04EU;3;MH8X/M@]:':G@>O? J97L\WF
M#RS!JAH;W2WK-QVJ4.YH/$;XJOU736\RZ7I^IV;+]9@3TYU/<&A_##2O/IHK
MZPF'K(\$JGX21M7V/0X%9+HOFN_L)']6Y(5MQL*'#:O7=$\X6=]$LUD;4/+TXM9W'[P+O'(#V=.A^>!4J#V-_
T(1F$ML^Q'8CP(\?;#2I^DX0?6+-R\%*O'6K)[4
M\,BJL;V&9 X(YD5VZ'Y857VZ,\D;$5!:J_1B%>I-I_JVL%S9(K),@::V/0FG
M5? XJ@()I+5^<3$Q%J$'JI_E88JC[F>*YEY(1S5%)3OB%2VYM8IT].50RTIO
MXX%8ZQ>R=K>\/.U V(5*Y=-L]2>0VH-G=Q;SV[_"=^_O\QBJ7P7>H:5,() 0 ?B0[J17L<"IY
M)!INNP%9(AR/0'8@^QPD*D\PO=,5['6;
!7H7EM^>B6)
M_D#+_P "Q&%7F/F#SUJ7DGSE
6JCX%'Q$*.VVQQ59IWF.6)@EP/3EJ>49J""/$'"K/].UI6 ;EQ/:AQI68V
M^J17"J)V#$C[8VIBJ,>W$D9:*DR'9J=1BJ=:?1;>./EQ]->G;J<53,!&0U4,
M:#WQM4JGT@S7[VQB^KQWERMH
M#=>L99-DJIK0GL<"LMU::.ZU">:%UDBD(*2J:J0% V.*I2\*MVJ1T.$*@WME
M+<2-]\53C0I&ATKSA&CE.:0@E30BE.A^G%6+32FWBDF,;R^F*LJ[L0/ 8;5,
M3#*D-M.R,+:\3U+::FSCVP6JFI%6%=]S0X%99;;VT K0^FM?NQ57H!2N%50=
MZ_=B%2^:Q2191$%3U:^I$PK&_P#K+_$8JDDD#QQ^AZ0,8J#IDQJ&'C#(=_D#
MA5)+C2XG5I+#DS@#UK)ZB1/HP)6+%*=3'RKMMN,5332_.-_IWI6>HJE_9N=K@UYD
M5['I4>%,2K/;7S%:(D