UNITED STATES
SECURITIES AND EXCHANGE COMMISSION
Washington, D.C. 20549
_________________
FORM
_________________
CURRENT REPORT
Pursuant to Section 13 or 15(d)
of the Securities Exchange Act of 1934
Date of Report (Date of earliest event reported):
_______________________________
(Exact name of registrant as specified in its charter)
_______________________________
(State or Other Jurisdiction of Incorporation) | (Commission File Number) | (I.R.S. Employer Identification No.) |
(Address of Principal Executive Offices) (Zip Code)
(
(Registrant's telephone number, including area code)
Not applicable
(Former name or former address, if changed since last report)
_______________________________
Check the appropriate box below if the Form 8-K filing is intended to simultaneously satisfy the filing obligation of the registrant under any of the following provisions:
Written communications pursuant to Rule 425 under the Securities Act (17 CFR 230.425) | |
Soliciting material pursuant to Rule 14a-12 under the Exchange Act (17 CFR 240.14a-12) | |
Pre-commencement communications pursuant to Rule 14d-2(b) under the Exchange Act (17 CFR 240.14d-2(b)) | |
Pre-commencement communications pursuant to Rule 13e-4(c) under the Exchange Act (17 CFR 240.13e-4(c)) |
Securities registered pursuant to Section 12(b) of the Act:
Title of each class | Trading Symbol(s) | Name of each exchange on which registered |
Indicate by check mark whether the registrant is an emerging growth company as defined in Rule 405 of the Securities Act of 1933 (§230.405 of this chapter) or Rule 12b-2 of the Securities Exchange Act of 1934 (§240.12b-2 of this chapter).
Emerging growth company
If an emerging growth company,indicate by check mark if the registrant has elected not to use the extended transition period for complying with any new or revised financial accounting standards provided pursuant to Section 13(a) of the Exchange Act. ☐
On January 26, 2022, the Board of Directors of Brookline Bancorp, Inc. (the “Company”) issued a press release announcing its earnings for the quarter ended December 31, 2021. Additionally, the Company announced the approval by its Board of Directors of a regular quarterly dividend of $0.125 per share payable on February 25, 2022 to stockholders of record on February 11, 2022. A copy of that press release is attached hereto as Exhibit 99.1 and is hereby incorporated by reference herein.
In connection with the press release announcing the Company’s second quarter earnings, the Company posted an investor presentation to its website at www.brooklinebancorp.com. A copy of the investor presentation is attached hereto as Exhibit 99.2 and is hereby incorporated by reference herein.
99.1 | Press release of Brookline Bancorp, Inc. reporting earnings and dividend approval, issued January 26, 2022 | |||
99.2 | Investor Presentation of Brookline Bancorp, Inc., issued January 26, 2022 | |||
104 | Cover Page Interactive Data File (embedded within the Inline XBRL document) |
SIGNATURE
Pursuant to the requirements of the Securities Exchange Act of 1934, the registrant has duly caused this report to be signed on its behalf by the undersigned hereunto duly authorized.
BROOKLINE BANCORP, INC. | ||
Date: January 26, 2022 | By: | /s/ Carl M. Carlson |
Carl M. Carlson | ||
Co-President, Chief Financial & Strategy Officer | ||
EXHIBIT INDEX
The following exhibits are furnished as part of this report:
Exhibit No. | Description | |||
99.1 | Press release of Brookline Bancorp, Inc. reporting earnings and dividend approval, issued January 26, 2022 | |||
99.2 | Investor Presentation of Brookline Bancorp, Inc., issued January 26, 2022 | |||
104 | Cover Page Interactive Data File (embedded within the Inline XBRL document) |
EXHIBIT 99.1
Brookline Bancorp Announces Fourth Quarter Results
Net Income of $28.5 million, EPS of $0.37
BOSTON, Jan. 26, 2022 (GLOBE NEWSWIRE) -- Brookline Bancorp, Inc. (NASDAQ: BRKL) (the “Company”) today announced net income of $28.5 million, or $0.37 per basic and diluted share, for the fourth quarter of 2021, compared to $28.8 million, or $0.37 per basic and diluted share, for the third quarter of 2021, and $26.7 million, or $0.34 per basic and diluted share, for the fourth quarter of 2020.
For the year ended December 31, 2021, the Company reported record net income of $115.4 million, or $1.48 per basic and diluted share. This compared to $47.6 million, or $0.60 per basic and diluted share, for the year ended December 31, 2020.
Paul Perrault, Chairman and Chief Executive Officer commented on the Company’s performance, “I am pleased with our strong financial performance and earnings growth in 2021. We finished the year with exceptional loan growth and we are well positioned as we look forward to the coming year. In the fourth quarter we continued to build on our legacy of providing our customers with an array of robust financial offerings by launching Clarendon Private, an investment and wealth management company. This past year was challenging in many respects, and I would like to recognize our employees for their hard work and dedication throughout the year providing exceptional service to our customers. As we continue to navigate these challenging times, we remain cautiously optimistic for the future.”
BALANCE SHEET
Total assets at December 31, 2021 increased $290.0 million to $8.6 billion from $8.3 billion at September 30, 2021, and decreased $339.8 million from $8.9 billion at December 31, 2020. At December 31, 2021, total loans and leases were $7.2 billion, representing an increase of $222.8 million from September 30, 2021, and a decrease of $115.1 million from December 31, 2020.
The Company funded a total of 4,700 of Small Business Administration's Paycheck Protection Program ("PPP") loans in the aggregate amount of $872.1 million. As of December 31, 2021, $67.7 million in PPP loans remain outstanding, net of deferred fees and costs of $1.7 million. Excluding PPP loan activity, the core loan portfolio grew $315.6 million in the fourth quarter compared to growth of $99.2 million in the third quarter.
Total investment securities at December 31, 2021 decreased $11.2 million to $720.9 million from $732.0 million at September 30, 2021, and decreased $25.5 million from $746.3 million at December 31, 2020. Total cash and cash equivalents at December 31, 2021 increased $88.6 million to $327.7 million from $239.1 million at September 30, 2021, and decreased $107.2 million from $434.9 million at December 31, 2020. As of December 31, 2021, total investment securities and total cash and cash equivalents represented 12.2 percent of total assets as compared to 11.7 percent and 13.2 percent as of September 30, 2021 and December 31, 2020, respectively.
Total deposits at December 31, 2021 increased $176.9 million to $7.05 billion from $6.87 billion at September 30, 2021 and increased $139.2 million from $6.91 billion at December 31, 2020.
Total borrowed funds at December 31, 2021 increased $89.8 million to $357.3 million from $267.5 million at September 30, 2021 and decreased $462.9 million from $820.2 million at December 31, 2020.
The ratio of stockholders’ equity to total assets was 11.57 percent at December 31, 2021, as compared to 11.77 percent at September 30, 2021, and 10.53 percent at December 31, 2020. The ratio of tangible stockholders’ equity to tangible assets (non-GAAP) was 9.87 percent at December 31, 2021, as compared to 10.01 percent at September 30, 2021, and 8.86 percent at December 31, 2020. Tangible book value per common share (non-GAAP) increased $0.22 from $10.51 at September 30, 2021 to $10.73 at December 31, 2021, compared to $9.96 at December 31, 2020.
NET INTEREST INCOME
Net interest income increased $0.8 million to $71.5 million during the fourth quarter of 2021 from $70.7 million for the quarter ended September 30, 2021. The net interest margin decreased 1 basis point to 3.52 percent for the three months ended December 31, 2021 from 3.53 percent for the three months ended September 30, 2021.
NON-INTEREST INCOME
Total non-interest income for the quarter ended December 31, 2021 increased $5.1 million to $10.7 million from $5.6 million for the quarter ended September 30, 2021. The increase was primarily driven by increases of $3.8 million in loan level derivative income, net, and $1.4 million in gain on sales of loans and leases.
PROVISION FOR CREDIT LOSSES
The Company recorded a provision for credit losses of $0.8 million for the quarter ended December 31, 2021, compared to a negative provision of $3.1 million for the quarter ended September 30, 2021. Total net charge-offs for the fourth quarter of 2021 were $2.1 million compared to $1.3 million in the third quarter of 2021. The increase was primarily driven by an increase in net charge-offs on equipment financing loans of $0.9 million, partially offset by a decrease in net charge-offs on commercial loans of $0.1 million. The ratio of net loan and lease charge-offs to average loans and leases on an annualized basis increased to 12 basis points for the fourth quarter of 2021 from 7 basis points for the third quarter of 2021.
The allowance for loan and lease losses represented 1.38 percent of total loans and leases at December 31, 2021, compared to 1.48 percent at September 30, 2021, and 1.57 percent at December 31, 2020. Excluding PPP loans, the allowance for loan and lease losses represents 1.40 percent coverage at December 31, 2021 compared to 1.51 percent at September 30, 2021, and 1.69 percent at December 31, 2020.
ASSET QUALITY
The ratio of total nonperforming loans and leases to total loans and leases was 0.45 percent at December 31, 2021 as compared to 0.52 percent at September 30, 2021. Nonperforming loans and leases decreased $3.4 million to $32.5 million at December 31, 2021 from $35.9 million at September 30, 2021. The ratio of nonperforming assets to total assets was 0.39 percent at December 31, 2021 as compared to 0.44 percent at September 30, 2021. Nonperforming assets decreased $3.3 million to $33.2 million at December 31, 2021 from $36.5 million at September 30, 2021.
From March 1, 2020 through the earlier of January 1, 2022 or 60 days after the termination date of the national emergency declared by the President on March 13, 2020 concerning the COVID-19 outbreak, a financial institution may elect to suspend the requirements under accounting principles generally accepted in the U.S. for loan modifications related to the COVID-19 pandemic that would otherwise be categorized as a troubled debt restructured, including impairment accounting. This troubled debt restructuring relief applies for the term of the loan modification that occurs during the applicable period for a loan that was not more than 30 days past due as of December 31, 2019. Financial institutions are required to maintain records of the volume of loans involved in modifications to which troubled debt restructuring relief is applicable. As of December 31, 2021, approximately 96 percent of loans granted an initial loan payment deferral have returned to payment status and 98 credits totaling $38.1 million or 0.5 percent of total loans outstanding have been modified.
NON-INTEREST EXPENSE
Non-interest expense for the quarter ended December 31, 2021 increased $2.0 million to $42.9 million from $40.9 million for the quarter ended September 30, 2021. The increase was primarily driven by increases of $1.4 million in compensation and employee benefits and $0.7 million in other non-interest expense, partially offset by a decrease of $0.2 million in advertising and marketing expense.
PROVISION FOR INCOME TAXES
The effective tax rate was 25.9 percent and 25.3 percent for the three and twelve months ended December 31, 2021, respectively.
RETURNS ON AVERAGE ASSETS AND AVERAGE EQUITY
The annualized return on average assets decreased to 1.35 percent during the fourth quarter of 2021 compared to 1.38 percent for the third quarter of 2021; and was 1.36 percent for the year ended December 31, 2021, compared to 0.55 percent for the year ended December 31, 2020.
The annualized return on average tangible stockholders' equity decreased to 13.84 percent during the fourth quarter of 2021 compared to 14.15 percent for the third quarter of 2021; and was 14.35 percent for the year ended December 31, 2021 compared to 6.17 percent for the year ended December 31, 2020.
DIVIDEND DECLARED
The Company’s Board approved a dividend of $0.125 per share for the quarter ended December 31, 2021. The dividend will be paid on February 25, 2022 to stockholders of record on February 11, 2022.
CONFERENCE CALL
The Company will conduct a conference call/webcast at 1:30 PM Eastern Time on Thursday, January 27, 2022 to discuss the results for the quarter, business highlights and outlook. A copy of the Earnings Presentation is available on the Company’s website, www.brooklinebancorp.com. To listen to the call and view the Company’s Earnings Presentation, please join the call via https://services.choruscall.com/links/brkl220127.html. To listen to the call without access to the slides, please dial 844-200-6205 (United States) or 929-526-1599 (internationally) and ask for the Brookline Bancorp, Inc. call (Access Code 817809). A recording of the call will be available for one week following the call on the Company’s website under “Investor Relations” or by dialing 866-813-9403 (United States) or 1-929-458-6194 (internationally) and entering the passcode: 342504.
ABOUT BROOKLINE BANCORP, INC.
Brookline Bancorp, Inc., a bank holding company with $8.6 billion in assets and branch locations in Massachusetts and Rhode Island, is headquartered in Boston, Massachusetts and operates as the holding company for Brookline Bank and Bank Rhode Island (the "banks"). The Company provides commercial and retail banking services, cash management and investment services to customers throughout Central New England. More information about Brookline Bancorp, Inc. and its banks can be found at the following websites: www.brooklinebank.com and www.bankri.com.
FORWARD-LOOKING STATEMENTS
Certain statements contained in this press release that are not historical facts may constitute forward-looking statements within the meaning of Section 27A of the Securities Act of 1933, as amended, and Section 21E of the Securities Exchange Act of 1934, as amended, and are intended to be covered by the safe harbor provisions of the Private Securities Litigation Reform Act of 1995. We may also make forward-looking statements in other documents we file with the Securities and Exchange Commission ("SEC"), in our annual reports to shareholders, in press releases and other written materials, and in oral statements made by our officers, directors or employees. You can identify forward looking statements by the use of the words “believe,” “expect,” “anticipate,” “intend,” “estimate,” “assume,” “outlook,” “will,” “should,” and other expressions that predict or indicate future events and trends and which do not relate to historical matters, including statements regard the potential effects of the COVID-19 pandemic on the Company’s business, credit quality, financial condition, liquidity and results of operations. Forward-looking statements involve risks and uncertainties. The Company’s actual results could differ materially from those projected in the forward-looking statements as a result of, among other factors, ongoing disruptions due to the COVID-19 pandemic, general business and economic conditions on a national basis and in the local markets in which the Company operates; changes in consumer behavior due to changing political business and economic conditions or legislative or regulatory initiatives; the possibility that future credit losses may be higher than currently expected; reputational risk relating to the Company’s participation in the Paycheck Protection Program and other pandemic-related legislative and regulatory initiatives and programs; turbulence in capital and debt markets; and the risks outlined in the Company’s Annual Report on Form 10-K, as updated by its Quarterly Reports on Form 10-Q and other filings submitted to the SEC. The Company does not undertake any obligation to update any forward-looking statement to reflect circumstances or events that occur after the date the forward-looking statements are made.
BASIS OF PRESENTATION
The Company's consolidated financial statements have been prepared in conformity with generally accepted accounting principles (“GAAP”) as set forth by the Financial Accounting Standards Board in its Accounting Standards Codification and through the rules and interpretive releases of the SEC under the authority of federal securities laws. Certain amounts previously reported have been reclassified to conform to the current period's presentation.
NON-GAAP FINANCIAL MEASURES
The Company uses certain non-GAAP financial measures, such as operating earnings, operating return on average assets, operating return on average tangible assets, operating return on average stockholders' equity, operating return on average tangible stockholders' equity, the allowance for loan and lease losses as a percentage of total loans and leases less PPP loans, tangible book value per common share, tangible stockholders’ equity to tangible assets, return on average tangible assets (annualized) and return on average tangible stockholders' equity (annualized). These non-GAAP financial measures provide information for investors to effectively analyze financial trends of ongoing business activities, and to enhance comparability with peers across the financial services sector. A detailed reconciliation table of the Company's GAAP to the non-GAAP measures is attached.
INVESTOR RELATIONS: | |
Contact: | Carl M. Carlson Brookline Bancorp, Inc. Co-President and Chief Financial Officer (617) 425-5331 ccarlson@brkl.com |
BROOKLINE BANCORP, INC. AND SUBSIDIARIES | ||||||||||||||||||||||
Selected Financial Highlights (Unaudited) | ||||||||||||||||||||||
At and for the Three Months Ended | At and for the Twelve Months Ended | |||||||||||||||||||||
December 31, 2021 | September 30, 2021 | June 30, 2021 | March 31, 2021 | December 31, 2020 | December 31, 2021 | December 31, 2020 | ||||||||||||||||
(Dollars In Thousands Except per Share Data) | ||||||||||||||||||||||
Earnings Data: | ||||||||||||||||||||||
Net interest income | $ | 71,461 | $ | 70,697 | $ | 71,106 | $ | 69,109 | $ | 68,225 | $ | 282,373 | $ | 260,163 | ||||||||
Provision (credit) for credit losses | 751 | (3,110 | ) | (3,331 | ) | (2,147 | ) | (2,103 | ) | (7,837 | ) | 61,886 | ||||||||||
Non-interest income | 10,699 | 5,586 | 5,910 | 4,794 | 4,219 | 26,989 | 24,644 | |||||||||||||||
Non-interest expense | 42,909 | 40,922 | 37,966 | 40,811 | 40,038 | 162,608 | 160,844 | |||||||||||||||
Income before provision for income taxes | 38,500 | 38,471 | 42,381 | 35,239 | 34,509 | 154,591 | 62,077 | |||||||||||||||
Net income | 28,545 | 28,839 | 31,602 | 26,454 | 26,663 | 115,440 | 47,635 | |||||||||||||||
Performance Ratios: | ||||||||||||||||||||||
Net interest margin (1) | 3.52 | % | 3.53 | % | 3.52 | % | 3.39 | % | 3.23 | % | 3.49 | % | 3.17 | % | ||||||||
Interest-rate spread (1) | 3.42 | % | 3.39 | % | 3.34 | % | 3.15 | % | 3.03 | % | 3.32 | % | 2.88 | % | ||||||||
Return on average assets (annualized) | 1.35 | % | 1.38 | % | 1.48 | % | 1.21 | % | 1.20 | % | 1.36 | % | 0.55 | % | ||||||||
Return on average tangible assets (annualized) (non-GAAP) | 1.38 | % | 1.41 | % | 1.51 | % | 1.24 | % | 1.22 | % | 1.38 | % | 0.56 | % | ||||||||
Return on average stockholders' equity (annualized) | 11.56 | % | 11.79 | % | 13.21 | % | 11.18 | % | 11.38 | % | 11.93 | % | 5.09 | % | ||||||||
Return on average tangible stockholders' equity (annualized) (non-GAAP) | 13.84 | % | 14.15 | % | 15.92 | % | 13.51 | % | 13.79 | % | 14.35 | % | 6.17 | % | ||||||||
Efficiency ratio (2) | 52.23 | % | 53.64 | % | 49.30 | % | 55.22 | % | 55.27 | % | 52.56 | % | 56.47 | % | ||||||||
Per Common Share Data: | ||||||||||||||||||||||
Net income — Basic | $ | 0.37 | $ | 0.37 | $ | 0.40 | $ | 0.34 | $ | 0.34 | $ | 1.48 | $ | 0.60 | ||||||||
Net income — Diluted | 0.37 | 0.37 | 0.40 | 0.34 | 0.34 | 1.48 | 0.60 | |||||||||||||||
Cash dividends declared | 0.125 | 0.125 | 0.120 | 0.120 | 0.115 | 0.490 | 0.460 | |||||||||||||||
Book value per share (end of period) | 12.82 | 12.61 | 12.44 | 12.10 | 12.05 | 12.82 | 12.05 | |||||||||||||||
Tangible book value per common share (end of period) (non-GAAP) | 10.73 | 10.51 | 10.35 | 10.01 | 9.96 | 10.73 | 9.96 | |||||||||||||||
Stock price (end of period) | 16.19 | 15.26 | 14.95 | 15.00 | 12.04 | 16.19 | 12.04 | |||||||||||||||
Balance Sheet: | ||||||||||||||||||||||
Total assets | $ | 8,602,622 | $ | 8,312,649 | $ | 8,461,964 | $ | 8,559,810 | $ | 8,942,424 | $ | 8,602,622 | $ | 8,942,424 | ||||||||
Total loans and leases | 7,154,457 | 6,931,694 | 7,020,275 | 7,267,552 | 7,269,553 | 7,154,457 | 7,269,553 | |||||||||||||||
Total deposits | 7,049,906 | 6,873,010 | 6,894,701 | 6,866,786 | 6,910,696 | 7,049,906 | 6,910,696 | |||||||||||||||
Total stockholders’ equity | 995,342 | 978,452 | 972,252 | 945,399 | 941,778 | 995,342 | 941,778 | |||||||||||||||
Asset Quality: | ||||||||||||||||||||||
Nonperforming assets | $ | 33,177 | $ | 36,461 | $ | 34,588 | $ | 37,403 | $ | 44,963 | $ | 33,177 | $ | 44,963 | ||||||||
Nonperforming assets as a percentage of total assets | 0.39 | % | 0.44 | % | 0.41 | % | 0.44 | % | 0.50 | % | 0.39 | % | 0.50 | % | ||||||||
Allowance for loan and lease losses | $ | 99,084 | $ | 102,515 | $ | 106,474 | $ | 109,837 | $ | 114,379 | $ | 99,084 | $ | 114,379 | ||||||||
Allowance for loan and lease losses as a percentage of total loans and leases | 1.38 | % | 1.48 | % | 1.52 | % | 1.51 | % | 1.57 | % | 1.38 | % | 1.57 | % | ||||||||
Net loan and lease charge-offs | $ | 2,124 | $ | 1,255 | $ | 595 | $ | 1,760 | $ | 4,381 | $ | 5,734 | $ | 12,961 | ||||||||
Net loan and lease charge-offs as a percentage of average loans and leases (annualized) | 0.12 | % | 0.07 | % | 0.03 | % | 0.10 | % | 0.24 | % | 0.08 | % | 0.18 | % | ||||||||
Capital Ratios: | ||||||||||||||||||||||
Stockholders’ equity to total assets | 11.57 | % | 11.77 | % | 11.49 | % | 11.04 | % | 10.53 | % | 11.57 | % | 10.53 | % | ||||||||
Tangible stockholders’ equity to tangible assets (non-GAAP) | 9.87 | % | 10.01 | % | 9.75 | % | 9.31 | % | 8.86 | % | 9.87 | % | 8.86 | % | ||||||||
(1) Calculated on a fully tax-equivalent basis. | ||||||||||||||||||||||
(2) Calculated as non-interest expense as a percentage of net interest income plus non-interest income. | ||||||||||||||||||||||
BROOKLINE BANCORP, INC. AND SUBSIDIARIES | |||||||||||||||||
Consolidated Balance Sheets (Unaudited) | |||||||||||||||||
December 31, 2021 | September 30, 2021 | June 30, 2021 | March 31, 2021 | December 31, 2020 | |||||||||||||
ASSETS | (In Thousands Except Share Data) | ||||||||||||||||
Cash and due from banks | $ | 66,265 | $ | 28,865 | $ | 36,079 | $ | 41,284 | $ | 36,069 | |||||||
Short-term investments | 261,472 | 210,279 | 284,370 | 89,643 | 398,848 | ||||||||||||
Total cash and cash equivalents | 327,737 | 239,144 | 320,449 | 130,927 | 434,917 | ||||||||||||
Investment securities available-for-sale | 720,866 | 732,020 | 694,151 | 729,901 | 745,822 | ||||||||||||
Equity securities held-for-trading | - | - | - | 518 | 526 | ||||||||||||
Total investment securities | 720,866 | 732,020 | 694,151 | 730,419 | 746,348 | ||||||||||||
Loans and leases: | |||||||||||||||||
Commercial real estate loans | 4,103,040 | 3,909,011 | 3,815,581 | 3,790,341 | 3,823,826 | ||||||||||||
Commercial loans and leases | 1,887,136 | 1,869,686 | 2,038,851 | 2,324,202 | 2,274,899 | ||||||||||||
Consumer loans | 1,164,281 | 1,152,997 | 1,165,843 | 1,153,009 | 1,170,828 | ||||||||||||
Total loans and leases | 7,154,457 | 6,931,694 | 7,020,275 | 7,267,552 | 7,269,553 | ||||||||||||
Allowance for loan and lease losses | (99,084) | (102,515) | (106,474) | (109,837) | (114,379) | ||||||||||||
Net loans and leases | 7,055,373 | 6,829,179 | 6,913,801 | 7,157,715 | 7,155,174 | ||||||||||||
Restricted equity securities | 28,981 | 28,098 | 31,627 | 40,400 | 49,786 | ||||||||||||
Premises and equipment, net of accumulated depreciation | 70,359 | 70,811 | 71,240 | 72,524 | 71,568 | ||||||||||||
Right-of-use asset operating leases | 20,508 | 21,879 | 22,682 | 23,180 | 24,143 | ||||||||||||
Deferred tax asset | 38,987 | 39,643 | 41,324 | 42,857 | 40,129 | ||||||||||||
Goodwill | 160,427 | 160,427 | 160,427 | 160,427 | 160,427 | ||||||||||||
Identified intangible assets, net of accumulated amortization | 2,276 | 2,484 | 2,692 | 2,920 | 3,152 | ||||||||||||
Other real estate owned and repossessed assets | 718 | 601 | 372 | 6,383 | 6,515 | ||||||||||||
Other assets | 176,390 | 188,363 | 203,199 | 192,058 | 250,265 | ||||||||||||
Total assets | $ | 8,602,622 | $ | 8,312,649 | $ | 8,461,964 | $ | 8,559,810 | $ | 8,942,424 | |||||||
LIABILITIES AND STOCKHOLDERS' EQUITY | |||||||||||||||||
Deposits: | |||||||||||||||||
Demand checking accounts | $ | 1,888,462 | $ | 1,816,116 | $ | 1,926,713 | $ | 1,724,170 | $ | 1,592,205 | |||||||
NOW accounts | 604,097 | 513,032 | 495,598 | 481,988 | 513,948 | ||||||||||||
Savings accounts | 915,804 | 823,095 | 782,482 | 724,504 | 701,659 | ||||||||||||
Money market accounts | 2,358,306 | 2,393,362 | 2,250,651 | 2,192,468 | 2,018,977 | ||||||||||||
Certificate of deposit accounts | 1,117,695 | 1,141,861 | 1,178,131 | 1,273,105 | 1,389,998 | ||||||||||||
Brokered deposit accounts | 165,542 | 185,544 | 261,126 | 470,551 | 693,909 | ||||||||||||
Total deposits | 7,049,906 | 6,873,010 | 6,894,701 | 6,866,786 | 6,910,696 | ||||||||||||
Borrowed funds: | |||||||||||||||||
Advances from the FHLBB | 147,907 | 113,977 | 204,154 | 378,646 | 648,849 | ||||||||||||
Subordinated debentures and notes | 83,897 | 83,859 | 83,821 | 83,783 | 83,746 | ||||||||||||
Other borrowed funds | 125,517 | 69,703 | 75,039 | 83,574 | 87,652 | ||||||||||||
Total borrowed funds | 357,321 | 267,539 | 363,014 | 546,003 | 820,247 | ||||||||||||
Operating lease liabilities | 20,508 | 21,879 | 22,682 | 23,180 | 24,143 | ||||||||||||
Mortgagors’ escrow accounts | 6,296 | 6,455 | 6,231 | 6,483 | 5,901 | ||||||||||||
Reserve for unfunded credits | 14,794 | 12,736 | 13,142 | 13,705 | 13,071 | ||||||||||||
Accrued expenses and other liabilities | 158,455 | 152,578 | 189,942 | 158,254 | 226,588 | ||||||||||||
Total liabilities | 7,607,280 | 7,334,197 | 7,489,712 | 7,614,411 | 8,000,646 | ||||||||||||
Stockholders' equity: | |||||||||||||||||
Common stock, $0.01 par value; 200,000,000 shares authorized; 85,177,172 shares issued, 85,177,172 shares issued, 85,177,172 shares issued, 85,177,172 shares issued, and 85,177,172 shares issued, respectively | 852 | 852 | 852 | 852 | 852 | ||||||||||||
Additional paid-in capital | 736,826 | 735,990 | 738,557 | 737,882 | 737,178 | ||||||||||||
Retained earnings, partially restricted | 342,639 | 323,862 | 304,466 | 282,301 | 264,892 | ||||||||||||
Accumulated other comprehensive income | (110) | 2,615 | 6,089 | 2,082 | 16,490 | ||||||||||||
Treasury stock, at cost; | |||||||||||||||||
7,037,464 shares, 7,034,754 shares, 6,536,478 shares, 6,534,602 shares, and 6,525,783 shares, respectively | (84,718) | (84,684) | (77,493) | (77,463) | (77,343) | ||||||||||||
Unallocated common stock held by the Employee Stock Ownership Plan; | |||||||||||||||||
24,660 shares, 31,278 shares, 37,890 shares, 44,502 shares, and 51,114 shares, respectively | (147) | (183) | (219) | (255) | (291) | ||||||||||||
Total stockholders' equity | 995,342 | 978,452 | 972,252 | 945,399 | 941,778 | ||||||||||||
Total liabilities and stockholders' equity | $ | 8,602,622 | $ | 8,312,649 | $ | 8,461,964 | $ | 8,559,810 | $ | 8,942,424 | |||||||
BROOKLINE BANCORP, INC. AND SUBSIDIARIES | ||||||||||||||||
Consolidated Statements of Income (Unaudited) | ||||||||||||||||
Three Months Ended | ||||||||||||||||
December 31, 2021 | September 30, 2021 | June 30, 2021 | March 31, 2021 | December 31, 2020 | ||||||||||||
(In Thousands Except Share Data) | ||||||||||||||||
Interest and dividend income: | ||||||||||||||||
Loans and leases | $ | 73,560 | $ | 74,332 | $ | 75,026 | $ | 75,009 | $ | 76,583 | ||||||
Debt securities | 2,972 | 2,967 | 3,121 | 3,118 | 3,335 | |||||||||||
Marketable and restricted equity securities | 325 | 313 | 233 | 301 | 490 | |||||||||||
Short-term investments | 88 | 83 | 42 | 39 | 59 | |||||||||||
Total interest and dividend income | 76,945 | 77,695 | 78,422 | 78,467 | 80,467 | |||||||||||
Interest expense: | ||||||||||||||||
Deposits | 4,055 | 4,571 | 5,380 | 6,707 | 8,825 | |||||||||||
Borrowed funds | 1,429 | 2,427 | 1,936 | 2,651 | 3,417 | |||||||||||
Total interest expense | 5,484 | 6,998 | 7,316 | 9,358 | 12,242 | |||||||||||
Net interest income | 71,461 | 70,697 | 71,106 | 69,109 | 68,225 | |||||||||||
Provision (credit) for credit losses | 751 | (3,110 | ) | (3,331 | ) | (2,147 | ) | (2,103 | ) | |||||||
Net interest income after provision for credit losses | 70,710 | 73,807 | 74,437 | 71,256 | 70,328 | |||||||||||
Non-interest income: | ||||||||||||||||
Deposit fees | 2,653 | 2,629 | 3,015 | 2,281 | 2,358 | |||||||||||
Loan fees | 448 | 487 | 607 | 599 | 588 | |||||||||||
Loan level derivative income, net | 3,981 | 218 | 7 | 474 | 145 | |||||||||||
(Loss) gain on investment securities, net | (32 | ) | - | 1 | (7 | ) | - | |||||||||
Gain on sales of loans and leases held-for-sale | 1,933 | 557 | 538 | 709 | 67 | |||||||||||
Other | 1,716 | 1,695 | 1,742 | 738 | 1,061 | |||||||||||
Total non-interest income | 10,699 | 5,586 | 5,910 | 4,794 | 4,219 | |||||||||||
Non-interest expense: | ||||||||||||||||
Compensation and employee benefits | 28,598 | 27,206 | 25,161 | 25,821 | 25,054 | |||||||||||
Occupancy | 3,558 | 3,567 | 3,832 | 4,004 | 3,806 | |||||||||||
Equipment and data processing | 4,576 | 4,556 | 4,697 | 4,493 | 4,193 | |||||||||||
Professional services | 1,151 | 1,072 | 1,245 | 1,226 | 1,338 | |||||||||||
FDIC insurance | 617 | 662 | 657 | 1,044 | 1,630 | |||||||||||
Advertising and marketing | 880 | 1,077 | 1,110 | 1,100 | 1,010 | |||||||||||
Amortization of identified intangible assets | 208 | 208 | 228 | 232 | 312 | |||||||||||
Other | 3,321 | 2,574 | 1,036 | 2,891 | 2,695 | |||||||||||
Total non-interest expense | 42,909 | 40,922 | 37,966 | 40,811 | 40,038 | |||||||||||
Income before provision for income taxes | 38,500 | 38,471 | 42,381 | 35,239 | 34,509 | |||||||||||
Provision for income taxes | 9,955 | 9,632 | 10,779 | 8,785 | 7,846 | |||||||||||
Net income | $ | 28,545 | $ | 28,839 | $ | 31,602 | $ | 26,454 | $ | 26,663 | ||||||
Earnings per common share: | ||||||||||||||||
Basic | $ | 0.37 | $ | 0.37 | $ | 0.40 | $ | 0.34 | $ | 0.34 | ||||||
Diluted | $ | 0.37 | $ | 0.37 | $ | 0.40 | $ | 0.34 | $ | 0.34 | ||||||
Weighted average common shares outstanding during the period: | ||||||||||||||||
Basic | 77,610,608 | 78,000,261 | 78,150,364 | 78,143,752 | 78,533,351 | |||||||||||
Diluted | 77,864,097 | 78,240,633 | 78,470,451 | 78,404,063 | 78,680,873 | |||||||||||
Dividends paid per common share | $ | 0.125 | $ | 0.120 | $ | 0.120 | $ | 0.115 | $ | 0.115 | ||||||
BROOKLINE BANCORP, INC. AND SUBSIDIARIES | |||||
Consolidated Statements of Income (Unaudited) | |||||
Twelve Months Ended December 31, | |||||
2021 | 2020 | ||||
(In Thousands Except Share Data) | |||||
Interest and dividend income: | |||||
Loans and leases | $ | 297,927 | $ | 309,798 | |
Debt securities | 12,178 | 13,758 | |||
Marketable and restricted equity securities | 1,172 | 2,848 | |||
Short-term investments | 252 | 413 | |||
Total interest and dividend income | 311,529 | 326,817 | |||
Interest expense: | |||||
Deposits | 20,713 | 48,426 | |||
Borrowed funds | 8,443 | 18,228 | |||
Total interest expense | 29,156 | 66,654 | |||
Net interest income | 282,373 | 260,163 | |||
(Credit) provision for credit losses | (7,837 | ) | 61,886 | ||
Net interest income after provision for credit losses | 290,210 | 198,277 | |||
Non-interest income: | |||||
Deposit fees | 10,578 | 9,050 | |||
Loan fees | 2,095 | 2,048 | |||
Loan level derivative income, net | 4,680 | 4,268 | |||
(Loss) gain on investment securities, net | (38 | ) | 1,970 | ||
Gain on sales of loans and leases held-for-sale | 3,737 | 1,118 | |||
Other | 5,937 | 6,190 | |||
Total non-interest income | 26,989 | 24,644 | |||
Non-interest expense: | |||||
Compensation and employee benefits | 106,786 | 100,985 | |||
Occupancy | 14,961 | 15,386 | |||
Equipment and data processing | 18,322 | 17,345 | |||
Professional services | 4,694 | 5,157 | |||
FDIC insurance | 2,980 | 4,229 | |||
Advertising and marketing | 4,167 | 4,126 | |||
Amortization of identified intangible assets | 876 | 1,271 | |||
Other | 9,822 | 12,345 | |||
Total non-interest expense | 162,608 | 160,844 | |||
Income before provision for income taxes | 154,591 | 62,077 | |||
Provision for income taxes | 39,151 | 14,442 | |||
Net income | $ | 115,440 | $ | 47,635 | |
Earnings per common share: | |||||
Basic | $ | 1.48 | $ | 0.60 | |
Diluted | $ | 1.48 | $ | 0.60 | |
Weighted average common shares outstanding during the period: | |||||
Basic | 77,974,851 | 78,951,892 | |||
Diluted | 78,243,416 | 79,103,289 | |||
Dividends paid per common share | $ | 0.480 | $ | 0.460 | |
BROOKLINE BANCORP, INC. AND SUBSIDIARIES | |||||||||||||||
Asset Quality Analysis (Unaudited) | |||||||||||||||
At and for the Three Months Ended | |||||||||||||||
December 31, 2021 | September 30, 2021 | June 30, 2021 | March 31, 2021 | December 31, 2020 | |||||||||||
(Dollars in Thousands) | |||||||||||||||
NONPERFORMING ASSETS: | |||||||||||||||
Loans and leases accounted for on a nonaccrual basis: | |||||||||||||||
Commercial real estate mortgage | $ | 10,848 | $ | 10,963 | $ | 11,657 | $ | 3,611 | $ | 3,300 | |||||
Multi-family mortgage | - | - | - | - | - | ||||||||||
Construction | - | - | - | 3,853 | 3,853 | ||||||||||
Total commercial real estate loans | 10,848 | 10,963 | 11,657 | 7,464 | 7,153 | ||||||||||
Commercial | 2,318 | 2,539 | 3,207 | 3,161 | 7,702 | ||||||||||
Equipment financing | 15,014 | 17,655 | 14,872 | 15,772 | 16,757 | ||||||||||
Condominium association | 84 | 91 | 97 | 106 | 112 | ||||||||||
Total commercial loans and leases | 17,416 | 20,285 | 18,176 | 19,039 | 24,571 | ||||||||||
Residential mortgage | 3,909 | 4,150 | 3,638 | 3,722 | 5,587 | ||||||||||
Home equity | 285 | 461 | 744 | 793 | 1,136 | ||||||||||
Other consumer | 1 | 1 | 1 | 2 | 1 | ||||||||||
Total consumer loans | 4,195 | 4,612 | 4,383 | 4,517 | 6,724 | ||||||||||
Total nonaccrual loans and leases | 32,459 | 35,860 | 34,216 | 31,020 | 38,448 | ||||||||||
Other real estate owned | - | - | - | 5,328 | 5,415 | ||||||||||
Other repossessed assets | 718 | 601 | 372 | 1,055 | 1,100 | ||||||||||
Total nonperforming assets | $ | 33,177 | $ | 36,461 | $ | 34,588 | $ | 37,403 | $ | 44,963 | |||||
Loans and leases past due greater than 90 days and still accruing | $ | 1 | $ | 838 | $ | 3,154 | $ | 1,179 | $ | 11,975 | |||||
Troubled debt restructurings on accrual | 12,580 | 13,526 | 14,387 | 16,770 | 11,483 | ||||||||||
Troubled debt restructurings on nonaccrual | 6,709 | 6,655 | 6,410 | 6,293 | 7,476 | ||||||||||
Total troubled debt restructurings | $ | 19,289 | $ | 20,181 | $ | 20,797 | $ | 23,063 | $ | 18,959 | |||||
Nonperforming loans and leases as a percentage of total loans and leases | 0.45 | % | 0.52 | % | 0.49 | % | 0.43 | % | 0.53 | % | |||||
Nonperforming assets as a percentage of total assets | 0.39 | % | 0.44 | % | 0.41 | % | 0.44 | % | 0.50 | % | |||||
PROVISION AND ALLOWANCE FOR LOAN AND LEASE LOSSES: | |||||||||||||||
Allowance for loan and lease losses at beginning of period | $ | 102,515 | $ | 106,474 | $ | 109,837 | $ | 114,379 | $ | 119,971 | |||||
Charge-offs | (2,562 | ) | (1,600 | ) | (1,221 | ) | (2,143 | ) | (4,810 | ) | |||||
Recoveries | 438 | 345 | 626 | 383 | 429 | ||||||||||
Net charge-offs | (2,124 | ) | (1,255 | ) | (595 | ) | (1,760 | ) | (4,381 | ) | |||||
Provision (credit) for loan and lease losses excluding unfunded commitments * | (1,307 | ) | (2,704 | ) | (2,768 | ) | (2,782 | ) | (1,211 | ) | |||||
Allowance for loan and lease losses at end of period | $ | 99,084 | $ | 102,515 | $ | 106,474 | $ | 109,837 | $ | 114,379 | |||||
Allowance for loan and lease losses as a percentage of total loans and leases | 1.38 | % | 1.48 | % | 1.52 | % | 1.51 | % | 1.57 | % | |||||
NET CHARGE-OFFS: | |||||||||||||||
Commercial real estate loans | $ | - | $ | (1 | ) | $ | 17 | $ | - | $ | 3,444 | ||||
Commercial loans and leases | 2,143 | 1,276 | 695 | 1,809 | 1,011 | ||||||||||
Consumer loans | (19 | ) | (20 | ) | (117 | ) | (49 | ) | (74 | ) | |||||
Total net charge-offs | $ | 2,124 | $ | 1,255 | $ | 595 | $ | 1,760 | $ | 4,381 | |||||
Net loan and lease charge-offs as a percentage of average loans and leases (annualized) | 0.12 | % | 0.07 | % | 0.03 | % | 0.10 | % | 0.24 | % | |||||
*Provision for loan and lease losses does not include provision (credit) of $2.1 million, $(0.4) million, $(0.6) million, $0.6 million, and $(0.9) million for credit losses on unfunded commitments during the three months ended December 31, 2021, September 30, 2021, June 30, 2021, March 31, 2021, and December 31, 2020 respectively. | |||||||||||||||
BROOKLINE BANCORP, INC. AND SUBSIDIARIES | ||||||||||||||||||
Average Yields / Costs (Unaudited) | ||||||||||||||||||
Three Months Ended | ||||||||||||||||||
December 31, 2021 | September 30, 2021 | December 31, 2020 | ||||||||||||||||
Average Balance | Interest (1) | Average Yield/ Cost | Average Balance | Interest (1) | Average Yield/ Cost | Average Balance | Interest (1) | Average Yield/ Cost | ||||||||||
(Dollars in Thousands) | ||||||||||||||||||
Assets: | ||||||||||||||||||
Interest-earning assets: | ||||||||||||||||||
Investments: | ||||||||||||||||||
Debt securities (2) | $ | 727,734 | $ | 2,972 | 1.63 | % | $ | 713,593 | $ | 2,967 | 1.66 | % | $ | 770,414 | $ | 3,334 | 1.73 | % |
Marketable and restricted equity securities (2) | 27,019 | 325 | 4.81 | % | 28,877 | 313 | 4.33 | % | 51,469 | 491 | 3.81 | % | ||||||
Short-term investments | 224,573 | 88 | 0.16 | % | 220,110 | 83 | 0.15 | % | 223,665 | 59 | 0.10 | % | ||||||
Total investments | 979,326 | 3,385 | 1.38 | % | 962,580 | 3,363 | 1.40 | % | 1,045,548 | 3,884 | 1.49 | % | ||||||
Loans and Leases: | ||||||||||||||||||
Commercial real estate loans (3) | 3,996,647 | 35,762 | 3.50 | % | 3,851,677 | 35,124 | 3.57 | % | 3,833,172 | 35,526 | 3.63 | % | ||||||
Commercial loans (3) | 820,932 | 10,146 | 4.84 | % | 901,862 | 11,715 | 5.09 | % | 1,260,883 | 11,936 | 3.71 | % | ||||||
Equipment financing (3) | 1,092,457 | 18,175 | 6.65 | % | 1,079,059 | 17,725 | 6.57 | % | 1,086,855 | 18,626 | 6.86 | % | ||||||
Residential mortgage loans (3) | 796,326 | 6,785 | 3.41 | % | 788,874 | 6,989 | 3.54 | % | 803,884 | 7,530 | 3.75 | % | ||||||
Other consumer loans (3) | 368,087 | 2,751 | 2.96 | % | 364,914 | 2,830 | 3.07 | % | 385,818 | 3,020 | 3.10 | % | ||||||
Total loans and leases | 7,074,449 | 73,619 | 4.16 | % | 6,986,386 | 74,383 | 4.26 | % | 7,370,612 | 76,638 | 4.16 | % | ||||||
Total interest-earning assets | 8,053,775 | 77,004 | 3.82 | % | 7,948,966 | 77,746 | 3.91 | % | 8,416,160 | 80,522 | 3.83 | % | ||||||
Non-interest-earning assets | 408,456 | 411,669 | 458,307 | |||||||||||||||
Total assets | $ | 8,462,231 | $ | 8,360,635 | $ | 8,874,467 | ||||||||||||
Liabilities and Stockholders' Equity: | ||||||||||||||||||
Interest-bearing liabilities: | ||||||||||||||||||
Deposits: | ||||||||||||||||||
NOW accounts | $ | 528,335 | 101 | 0.08 | % | $ | 502,093 | 116 | 0.09 | % | $ | 451,014 | 126 | 0.11 | % | |||
Savings accounts | 897,821 | 219 | 0.10 | % | 785,657 | 248 | 0.12 | % | 701,378 | 245 | 0.14 | % | ||||||
Money market accounts | 2,430,496 | 1,615 | 0.26 | % | 2,387,080 | 1,616 | 0.27 | % | 1,947,686 | 1,546 | 0.32 | % | ||||||
Certificates of deposit | 1,129,645 | 2,072 | 0.73 | % | 1,160,113 | 2,430 | 0.83 | % | 1,452,867 | 5,718 | 1.57 | % | ||||||
Brokered deposit accounts | 116,611 | 48 | 0.16 | % | 216,112 | 161 | 0.30 | % | 746,281 | 1,190 | 0.63 | % | ||||||
Total interest-bearing deposits | 5,102,908 | 4,055 | 0.32 | % | 5,051,055 | 4,571 | 0.36 | % | 5,299,226 | 8,825 | 0.66 | % | ||||||
Borrowings: | ||||||||||||||||||
Advances from the FHLBB | 76,786 | 117 | 0.59 | % | 119,043 | 1,152 | 3.79 | % | 619,844 | 2,118 | 1.34 | % | ||||||
Subordinated debentures and notes | 83,878 | 1,241 | 5.92 | % | 83,840 | 1,242 | 5.92 | % | 83,725 | 1,245 | 5.95 | % | ||||||
Other borrowed funds | 112,137 | 71 | 0.25 | % | 76,380 | 33 | 0.17 | % | 81,320 | 54 | 0.26 | % | ||||||
Total borrowings | 272,801 | 1,429 | 2.05 | % | 279,263 | 2,427 | 3.40 | % | 784,889 | 3,417 | 1.70 | % | ||||||
Total interest-bearing liabilities | 5,375,709 | 5,484 | 0.40 | % | 5,330,318 | 6,998 | 0.52 | % | 6,084,115 | 12,242 | 0.80 | % | ||||||
Non-interest-bearing liabilities: | ||||||||||||||||||
Demand checking accounts | 1,892,763 | 1,827,501 | 1,587,618 | |||||||||||||||
Other non-interest-bearing liabilities | 206,237 | 224,445 | 265,440 | |||||||||||||||
Total liabilities | 7,474,709 | 7,382,264 | 7,937,173 | |||||||||||||||
Stockholders’ equity | 987,522 | 978,371 | 937,294 | |||||||||||||||
Total liabilities and equity | $ | 8,462,231 | $ | 8,360,635 | $ | 8,874,467 | ||||||||||||
Net interest income (tax-equivalent basis) /Interest-rate spread (4) | 71,520 | 3.42 | % | 70,748 | 3.39 | % | 68,280 | 3.03 | % | |||||||||
Less adjustment of tax-exempt income | 59 | 51 | 55 | |||||||||||||||
Net interest income | $ | 71,461 | $ | 70,697 | $ | 68,225 | ||||||||||||
Net interest margin (5) | 3.52 | % | 3.53 | % | 3.23 | % | ||||||||||||
(1) Tax-exempt income on debt securities, equity securities and revenue bonds included in commercial real estate loans is included on a tax-equivalent basis. | ||||||||||||||||||
(2) Average balances include unrealized gains (losses) on investment securities. Dividend payments may not be consistent and average yield on equity securities may vary from month to month. | ||||||||||||||||||
(3) Loans on nonaccrual status are included in the average balances. | ||||||||||||||||||
(4) Interest rate spread represents the difference between the yield on interest-earning assets and the cost of interest-bearing liabilities. | ||||||||||||||||||
(5) Net interest margin represents net interest income (tax-equivalent basis) divided by average interest-earning assets. | ||||||||||||||||||
BROOKLINE BANCORP, INC. AND SUBSIDIARIES | ||||||||||||
Average Yields / Costs (Unaudited) | ||||||||||||
Twelve Months Ended | ||||||||||||
December 31, 2021 | December 31, 2020 | |||||||||||
Average Balance | Interest (1) | Average Yield/ Cost | Average Balance | Interest (1) | Average Yield/ Cost | |||||||
(Dollars in Thousands) | ||||||||||||
Assets: | ||||||||||||
Interest-earning assets: | ||||||||||||
Investments: | ||||||||||||
Debt securities (2) | $ | 729,147 | $ | 12,178 | 1.67 | % | $ | 750,689 | $ | 13,823 | 1.84 | % |
Marketable and restricted equity securities (2) | 34,074 | 1,172 | 3.44 | % | 61,873 | 2,862 | 4.63 | % | ||||
Short-term investments | 217,784 | 252 | 0.12 | % | 186,617 | 413 | 0.22 | % | ||||
Total investments | 981,005 | 13,602 | 1.39 | % | 999,179 | 17,098 | 1.71 | % | ||||
Loans and Leases: | ||||||||||||
Commercial real estate loans (3) | 3,854,357 | 139,451 | 3.57 | % | 3,781,201 | 148,438 | 3.86 | % | ||||
Commercial loans (3) | 1,020,627 | 47,647 | 4.61 | % | 1,140,699 | 41,391 | 3.57 | % | ||||
Equipment financing (3) | 1,081,287 | 71,906 | 6.65 | % | 1,074,561 | 75,563 | 7.03 | % | ||||
Residential mortgage loans (3) | 788,614 | 27,933 | 3.54 | % | 810,855 | 31,392 | 3.87 | % | ||||
Other consumer loans (3) | 369,326 | 11,209 | 3.03 | % | 402,672 | 13,255 | 3.28 | % | ||||
Total loans and leases | 7,114,211 | 298,146 | 4.19 | % | 7,209,988 | 310,039 | 4.30 | % | ||||
Total interest-earning assets | 8,095,216 | 311,748 | 3.85 | % | 8,209,167 | 327,137 | 3.99 | % | ||||
Non-interest-earning assets | 422,984 | 474,402 | ||||||||||
Total assets | $ | 8,518,200 | $ | 8,683,569 | ||||||||
Liabilities and Stockholders' Equity: | ||||||||||||
Interest-bearing liabilities: | ||||||||||||
Deposits: | ||||||||||||
NOW accounts | $ | 502,189 | 493 | 0.10 | % | $ | 408,374 | 484 | 0.12 | % | ||
Savings accounts | 793,141 | 950 | 0.12 | % | 670,217 | 1,503 | 0.22 | % | ||||
Money market accounts | 2,288,740 | 6,214 | 0.27 | % | 1,817,085 | 9,519 | 0.52 | % | ||||
Certificates of deposit | 1,210,451 | 11,758 | 0.97 | % | 1,577,104 | 30,355 | 1.92 | % | ||||
Brokered deposit accounts | 338,734 | 1,298 | 0.38 | % | 512,803 | 6,565 | 1.28 | % | ||||
Total interest-bearing deposits | 5,133,255 | 20,713 | 0.40 | % | 4,985,583 | 48,426 | 0.97 | % | ||||
Borrowings: | ||||||||||||
Advances from the FHLBB | 232,175 | 3,302 | 1.40 | % | 859,389 | 12,842 | 1.47 | % | ||||
Subordinated debentures and notes | 83,821 | 4,967 | 5.93 | % | 83,667 | 5,038 | 6.02 | % | ||||
Other borrowed funds | 88,818 | 174 | 0.20 | % | 90,587 | 348 | 0.38 | % | ||||
Total borrowings | 404,814 | 8,443 | 2.06 | % | 1,033,643 | 18,228 | 1.73 | % | ||||
Total interest-bearing liabilities | 5,538,069 | 29,156 | 0.53 | % | 6,019,226 | 66,654 | 1.11 | % | ||||
Non-interest-bearing liabilities: | ||||||||||||
Demand checking accounts | 1,787,959 | 1,451,556 | ||||||||||
Other non-interest-bearing liabilities | 224,634 | 276,712 | ||||||||||
Total liabilities | 7,550,662 | 7,747,494 | ||||||||||
Stockholders’ equity | 967,538 | 936,075 | ||||||||||
Total liabilities and equity | $ | 8,518,200 | $ | 8,683,569 | ||||||||
Net interest income (tax-equivalent basis) /Interest-rate spread (4) | 282,592 | 3.32 | % | 260,483 | 2.88 | % | ||||||
Less adjustment of tax-exempt income | 219 | 320 | ||||||||||
Net interest income | $ | 282,373 | $ | 260,163 | ||||||||
Net interest margin (5) | 3.49 | % | 3.17 | % | ||||||||
(1) Tax-exempt income on debt securities, equity securities and revenue bonds included in commercial real estate loans is included on a tax-equivalent basis. | ||||||||||||
(2) Average balances include unrealized gains (losses) on investment securities. Dividend payments may not be consistent and average yield on equity securities may vary from month to month. | ||||||||||||
(3) Loans on nonaccrual status are included in the average balances. | ||||||||||||
(4) Interest rate spread represents the difference between the yield on interest-earning assets and the cost of interest-bearing liabilities. | ||||||||||||
(5) Net interest margin represents net interest income (tax-equivalent basis) divided by average interest-earning assets. | ||||||||||||
BROOKLINE BANCORP, INC. AND SUBSIDIARIES | ||||||||||||||||||||||
Non-GAAP Financial Information (Unaudited) | ||||||||||||||||||||||
At and for the Three Months Ended December 31, | At and for the Twelve Months Ended December 31, | |||||||||||||||||||||
2021 | 2020 | 2021 | 2020 | |||||||||||||||||||
Reconciliation Table - Non-GAAP Financial Information | (Dollars in Thousands Except Share Data) | |||||||||||||||||||||
Net income | $ | 28,545 | $ | 26,663 | $ | 115,440 | $ | 47,635 | ||||||||||||||
Less: | ||||||||||||||||||||||
Security (losses) gains (after-tax) | (24 | ) | - | (28 | ) | 1,511 | ||||||||||||||||
Operating earnings | $ | 28,569 | $ | 26,663 | $ | 115,468 | $ | 46,124 | ||||||||||||||
Operating earnings per common share: | ||||||||||||||||||||||
Basic | $ | 0.37 | $ | 0.34 | $ | 1.48 | $ | 0.58 | ||||||||||||||
Diluted | 0.37 | 0.34 | 1.48 | 0.58 | ||||||||||||||||||
Weighted average common shares outstanding during the period: | ||||||||||||||||||||||
Basic | 77,610,608 | 78,533,351 | 77,974,851 | 78,951,892 | ||||||||||||||||||
Diluted | 77,864,097 | 78,680,873 | 78,243,416 | 79,103,289 | ||||||||||||||||||
Return on average assets * | 1.35 | % | 1.20 | % | 1.36 | % | 0.55 | % | ||||||||||||||
Less: | ||||||||||||||||||||||
Security gains (after-tax) * | - | % | - | % | - | % | 0.02 | % | ||||||||||||||
Operating return on average assets * | 1.35 | % | 1.20 | % | 1.36 | % | 0.53 | % | ||||||||||||||
Return on average tangible assets * | 1.38 | % | 1.22 | % | 1.38 | % | 0.56 | % | ||||||||||||||
Less: | ||||||||||||||||||||||
Security gains (after-tax) * | - | % | - | % | - | % | 0.02 | % | ||||||||||||||
Operating return on average tangible assets * | 1.38 | % | 1.22 | % | 1.38 | % | 0.54 | % | ||||||||||||||
Return on average stockholders' equity * | 11.56 | % | 11.38 | % | 11.93 | % | 5.09 | % | ||||||||||||||
Less: | ||||||||||||||||||||||
Security (losses) gains (after-tax) * | (0.01 | )% | - | % | - | % | 0.16 | % | ||||||||||||||
Operating return on average stockholders' equity * | 11.57 | % | 11.38 | % | 11.93 | % | 4.93 | % | ||||||||||||||
Return on average tangible stockholders' equity * | 13.84 | % | 13.79 | % | 14.35 | % | 6.17 | % | ||||||||||||||
Less: | ||||||||||||||||||||||
Security (losses) gains (after-tax) * | (0.01 | )% | - | % | - | % | 0.20 | % | ||||||||||||||
Operating return on average tangible stockholders' equity * | 13.85 | % | 13.79 | % | 14.35 | % | 5.97 | % | ||||||||||||||
* Ratios at and for the three months ended are annualized. | ||||||||||||||||||||||
BROOKLINE BANCORP, INC. AND SUBSIDIARIES | ||||||||||||||||||||||
Non-GAAP Financial Information (Unaudited) | ||||||||||||||||||||||
At and for the Three Months Ended | At and for the Twelve Months Ended | |||||||||||||||||||||
December 31, 2021 | September 30, 2021 | June 30, 2021 | March 31, 2021 | December 31, 2020 | December 31, 2021 | December 31, 2020 | ||||||||||||||||
(Dollars in Thousands) | ||||||||||||||||||||||
Net income, as reported | $ | 28,545 | $ | 28,839 | $ | 31,602 | $ | 26,454 | $ | 26,663 | $ | 115,440 | $ | 47,635 | ||||||||
Average total assets | $ | 8,462,231 | $ | 8,360,635 | $ | 8,540,228 | $ | 8,714,158 | $ | 8,874,467 | $ | 8,518,200 | $ | 8,683,569 | ||||||||
Less: Average goodwill and average identified intangible assets, net | 162,804 | 163,011 | 163,224 | 163,457 | 163,758 | 163,122 | 164,227 | |||||||||||||||
Average tangible assets | $ | 8,299,427 | $ | 8,197,624 | $ | 8,377,004 | $ | 8,550,701 | $ | 8,710,709 | $ | 8,355,078 | $ | 8,519,342 | ||||||||
Return on average tangible assets (annualized) | 1.38 | % | 1.41 | % | 1.51 | % | 1.24 | % | 1.22 | % | 1.38 | % | 0.56 | % | ||||||||
Average total stockholders’ equity | $ | 987,522 | $ | 978,371 | $ | 957,207 | $ | 946,482 | $ | 937,294 | $ | 967,538 | $ | 936,075 | ||||||||
Less: Average goodwill and average identified intangible assets, net | 162,804 | 163,011 | 163,224 | 163,457 | 163,758 | 163,122 | 164,227 | |||||||||||||||
Average tangible stockholders’ equity | $ | 824,718 | $ | 815,360 | $ | 793,983 | $ | 783,025 | $ | 773,536 | $ | 804,416 | $ | 771,848 | ||||||||
Return on average tangible stockholders’ equity (annualized) | 13.84 | % | 14.15 | % | 15.92 | % | 13.51 | % | 13.79 | % | 14.35 | % | 6.17 | % | ||||||||
Total stockholders’ equity | $ | 995,342 | $ | 978,452 | $ | 972,252 | $ | 945,399 | $ | 941,778 | $ | 995,342 | $ | 941,778 | ||||||||
Less: | ||||||||||||||||||||||
Goodwill | 160,427 | 160,427 | 160,427 | 160,427 | 160,427 | 160,427 | 160,427 | |||||||||||||||
Identified intangible assets, net | 2,276 | 2,484 | 2,692 | 2,920 | 3,152 | 2,276 | 3,152 | |||||||||||||||
Tangible stockholders' equity | $ | 832,639 | $ | 815,541 | $ | 809,133 | $ | 782,052 | $ | 778,199 | $ | 832,639 | $ | 778,199 | ||||||||
Total assets | $ | 8,602,622 | $ | 8,312,649 | $ | 8,461,964 | $ | 8,559,810 | $ | 8,942,424 | $ | 8,602,622 | $ | 8,942,424 | ||||||||
Less: | ||||||||||||||||||||||
Goodwill | 160,427 | 160,427 | 160,427 | 160,427 | 160,427 | 160,427 | 160,427 | |||||||||||||||
Identified intangible assets, net | 2,276 | 2,484 | 2,692 | 2,920 | 3,152 | 2,276 | 3,152 | |||||||||||||||
Tangible assets | $ | 8,439,919 | $ | 8,149,738 | $ | 8,298,845 | $ | 8,396,463 | $ | 8,778,845 | $ | 8,439,919 | $ | 8,778,845 | ||||||||
Tangible stockholders’ equity to tangible assets | 9.87 | % | 10.01 | % | 9.75 | % | 9.31 | % | 8.86 | % | 9.87 | % | 8.86 | % | ||||||||
Tangible stockholders' equity | $ | 832,639 | $ | 815,541 | $ | 809,133 | $ | 782,052 | $ | 778,199 | $ | 832,639 | $ | 778,199 | ||||||||
Number of common shares issued | 85,177,172 | 85,177,172 | 85,177,172 | 85,177,172 | 85,177,172 | 85,177,172 | 85,177,172 | |||||||||||||||
Less: | ||||||||||||||||||||||
Treasury shares | 7,037,464 | 7,034,754 | 6,536,478 | 6,534,602 | 6,525,783 | 7,037,464 | 6,525,783 | |||||||||||||||
Unallocated ESOP shares | 24,660 | 31,278 | 37,890 | 44,502 | 51,114 | 24,660 | 51,114 | |||||||||||||||
Unvested restricted shares | 500,098 | 502,808 | 448,105 | 449,981 | 458,800 | 500,098 | 458,800 | |||||||||||||||
Number of common shares outstanding | 77,614,950 | 77,608,332 | 78,154,699 | 78,148,087 | 78,141,475 | 77,614,950 | 78,141,475 | |||||||||||||||
Tangible book value per common share | $ | 10.73 | $ | 10.51 | $ | 10.35 | $ | 10.01 | $ | 9.96 | $ | 10.73 | $ | 9.96 | ||||||||
Allowance for loan and lease losses | $ | 99,084 | $ | 102,515 | $ | 106,474 | $ | 109,837 | $ | 114,379 | $ | 99,084 | $ | 114,379 | ||||||||
Total loans and leases | $ | 7,154,457 | $ | 6,931,694 | $ | 7,020,275 | $ | 7,267,552 | $ | 7,269,553 | $ | 7,154,457 | $ | 7,269,553 | ||||||||
Less: | ||||||||||||||||||||||
Total PPP loans | 67,711 | 160,586 | 348,411 | 604,790 | 489,216 | 67,711 | 489,216 | |||||||||||||||
Total loans and leases excluding PPP loans | $ | 7,086,746 | $ | 6,771,108 | $ | 6,671,864 | $ | 6,662,762 | $ | 6,780,337 | $ | 7,086,746 | $ | 6,780,337 | ||||||||
Allowance for loan and lease losses as a percentage of total loans and leases less PPP loans | 1.40 | % | 1.51 | % | 1.60 | % | 1.65 | % | 1.69 | % | 1.40 | % | 1.69 | % | ||||||||
PDF available: http://ml.globenewswire.com/Resource/Download/de5148c8-c3cc-4089-8a1a-49cc07b34eff
Exhibit 99.2
January 27, 2022 1 4Q 2021 Financial Results
F o r w a r d L oo k i n g S t a t eme nt s 2 Certain statements contained in this presentation are not historical facts and may constitute forward - looking statements within the meaning of Section 27A of the Securities Act of 1933, as amended, and Section 21E of the Securities Exchange Act of 1934, as amended, and are intended to be covered by the safe harbor provisions of the Private Securities Litigation Reform Act of 1995. We may also make forward - looking statements in other documents we file with the Securities and Exchange Commission ("SEC"), in our annual reports to shareholders, in press releases and other written materials, and in oral statements made by our officers, directors or employees. You can identify forward looking statements by the use of the words “believe,” “expect,” “anticipate,” “intend,” “estimate, ”assume,” “outlook,” “will,” “should,” and other expressions that predict or indicate future events and trends and which do not relate to historical matters, including statements regard the potential effects of the COVID - 19 pandemic on the Company’s business, credit quality, financial condition, liquidity and results of operations. Forward - looking statements involve risks and uncertainties. The Company’s actual results could differ materially from those projected in the forward - looking statements as a result of, among other factors, ongoing disruptions due to the COVID - 19 pandemic, general business and economic conditions on a national basis and in the local markets in which the Company operates; changes in consumer behavior due to changing political business and economic conditions or legislative or regulatory initiatives; the possibility that future credit losses may be higher than currently expected; reputational risk relating to the Company’s participation in the Paycheck Protection Program and other pandemic - related legislative and regulatory initiatives and programs; and turbulence in capital and debt markets; and the risks outlined in the Company’s Annual Report on Form 10 - K, as updated by its Quarterly Reports on Form 10 - Q and other filings submitted to the SEC. The Company does not undertake any obligation to update any forward - looking statement to reflect circumstances or events that occur after the date the forward - looking statements are made.
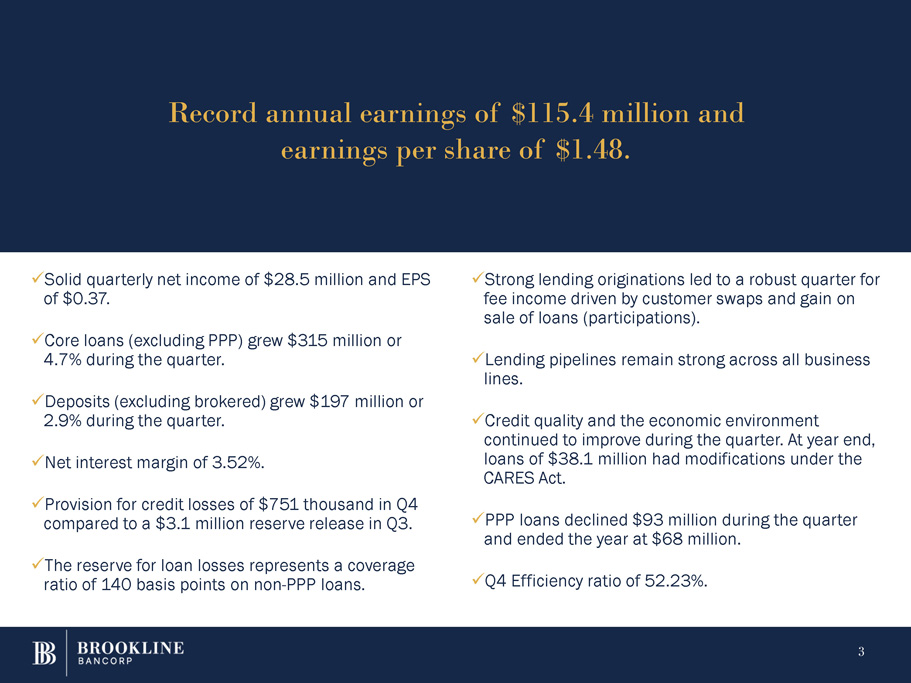
x Solid quarterly net income of $28.5 million and EPS of $0.37. x Core loans (excluding PPP) grew $315 million or 4.7% during the quarter. x Deposits (excluding brokered) grew $197 million or 2.9% during the quarter. x Net interest margin of 3.52%. x Provision for credit losses of $751 thousand in Q4 compared to a $3.1 million reserve release in Q3. x The reserve for loan losses represents a coverage ratio of 140 basis points on non - PPP loans. 3 x Strong lending originations led to a robust quarter for fee income driven by customer swaps and gain on sale of loans (participations). x Lending pipelines remain strong across all business lines. x Credit quality and the economic environment continued to improve during the quarter. At year end, loans of $38.1 million had modifications under the CARES Act. x PPP loans declined $93 million during the quarter and ended the year at $68 million. x Q4 Efficiency ratio of 52.23%. Record annual earnings of $115.4 million and earnings per share of $1.48.
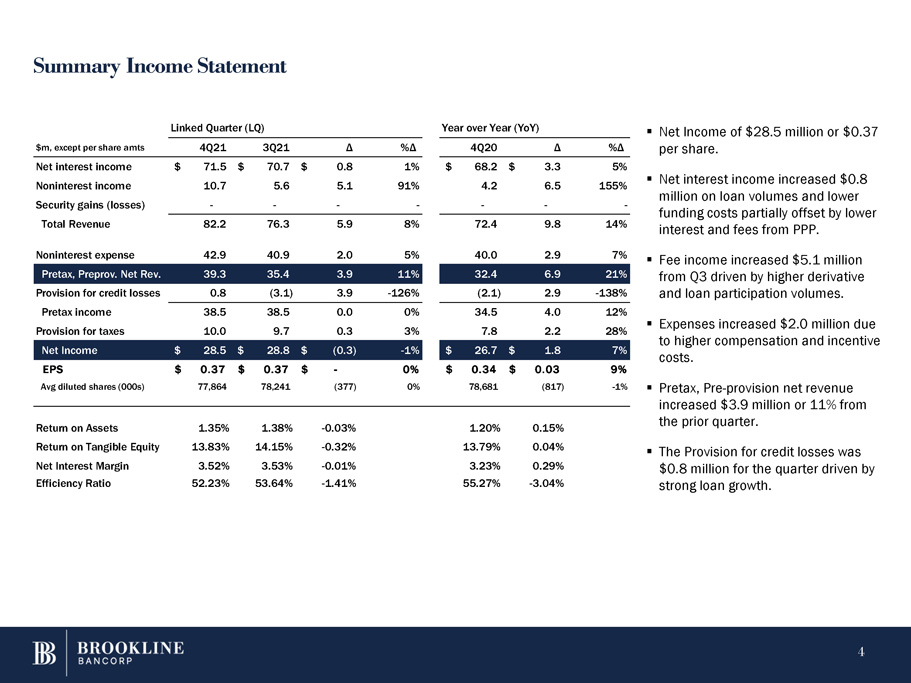
S u mm a r y In c o m e S t a t eme n t 4 ▪ Net Income of $28.5 million or $0.37 per share. ▪ Net interest income increased $0.8 million on loan volumes and lower funding costs partially offset by lower interest and fees from PPP. ▪ Fee income increased $ 5 . 1 million from Q 3 driven by higher derivative and loan participation volumes . ▪ Expenses increased $2.0 million due to higher compensation and incentive costs. Pretax, Pre - provision net revenue increased $3.9 million or 11% from the prior quarter. Net Income $ 28.5 $ 28.8 $ (0.3) - 1% $ 26.7 $ 1.8 7% EPS $ 0.37 $ 0.37 $ - 0% $ 0.34 $ 0.03 9% Avg diluted shares (000s) 77,864 78,241 (377) 0% 78,681 (817) - 1% ▪ Linked Quarter (LQ) Year over Year (YoY) $m, except per share amts 4Q21 3Q21 Δ %Δ 4Q20 Δ %Δ Net interest income $ 71.5 $ 70.7 $ 0.8 1% $ 68.2 $ 3.3 5% Noninterest income 10.7 5.6 5.1 91% 4.2 6.5 155% Security gains (losses) - - - - - - - Total Revenue 82.2 76.3 5.9 8% 72.4 9.8 14% Noninterest expense 42.9 40.9 2.0 5% 40.0 2.9 7% Pretax, Preprov. Net Rev. 39.3 35.4 3.9 11% 32.4 6.9 21% Provision for credit losses 0.8 (3.1) 3.9 - 126% (2.1) 2.9 - 138% Pretax income 38.5 38.5 0.0 0% 34.5 4.0 12% Provision for taxes 10.0 9.7 0.3 3% 7.8 2.2 28% Return on Assets 1.35% 1.38% - 0.03% 1.20% 0.15% Return on Tangible Equity 13.83% 14.15% - 0.32% 13.79% 0.04% Net Interest Margin 3.52% 3.53% - 0.01% 3.23% 0.29% ▪ The Provision for credit losses was $0.8 million for the quarter driven by Efficiency Ratio 52.23% 53.64% - 1.41% 55.27% - 3.04% strong loan growth.
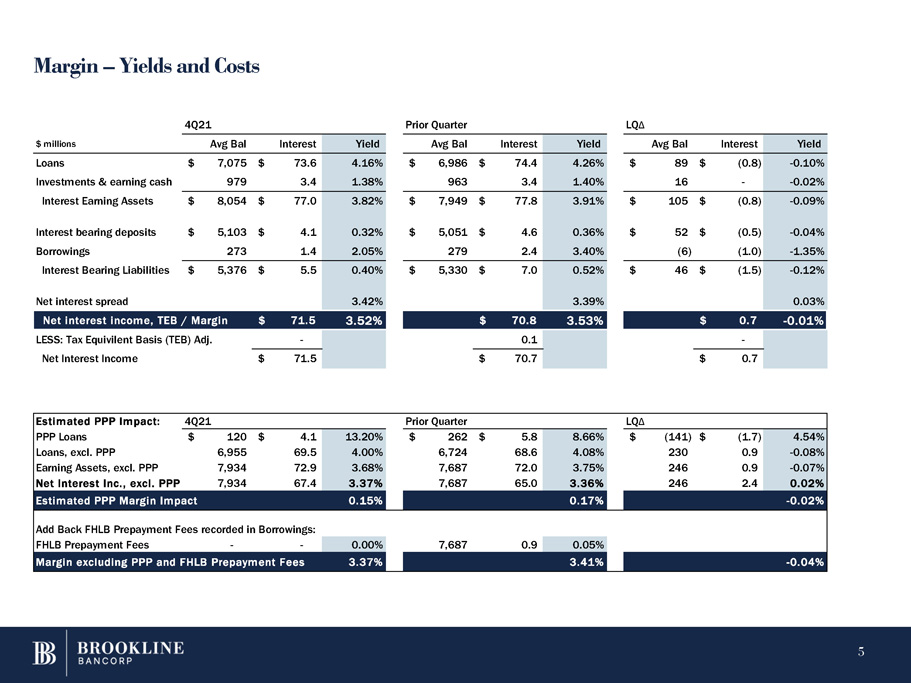
M a r gi n – Y i e ld s a n d C o st s 4 Q 21 Prior Quarter L Q Δ $ milli o n s Avg Bal Interest Yield Avg Bal Interest Yield A v g B a l Interest Yield Loans $ 7,075 $ 73.6 4.16% $ 6,986 $ 74.4 4.26% $ 8 9 $ (0.8) - 0.10% Investments & earning cash 979 3.4 1.38% 963 3.4 1.40% 1 6 - - 0.02% Interest Earning Assets $ 8 , 05 4 $ 77.0 3.82% $ 7 , 94 9 $ 77.8 3.91% $ 105 $ (0.8) - 0.09% Interest bearing deposits $ 5 , 10 3 $ 4.1 0.32% $ 5 , 05 1 $ 4.6 0.36% $ 52 $ (0.5) - 0.04% Borrowings 27 3 1.4 2.05% 27 9 2.4 3.40% (6) (1.0) - 1.35% Interest Bearing Liabilities $ 5 , 37 6 $ 5.5 0.40% $ 5 , 33 0 $ 7.0 0.52% $ 46 $ (1.5) - 0.12% Net interest spread 3.42% 3.39% 0.03% Net interest income, TEB / Margin $ 71.5 3.52% $ 70.8 3.53% $ 0.7 - 0.01% LESS: Tax Equivilent Basis (TEB) Adj. - 0.1 - Net Interest Income $ 71.5 $ 70.7 $ 0.7 Estimated PPP Impact: 4Q21 P r i o r Q ua r t er L Q Δ PP P L o an s $ 120 $ 4.1 13.20% $ 2 6 2 $ 5.8 8.66% $ ( 1 41 ) $ (1.7) 4.54% Loans, excl. PPP 6,955 69.5 4.00% 6 , 7 2 4 68.6 4.08% 2 3 0 0.9 - 0.08% Earning Assets, excl. PPP 7,934 72.9 3.68% 7 , 6 8 7 72.0 3.75% 2 4 6 0.9 - 0.07% 5 Estimated PPP Margin Impact 0.15% 0.17% - 0.02% Add Back FHLB Prepayment Fees recorded in Borrowings: FHLB Prepayment Fees - - 0.00% 7,687 0.9 0.05% Margin excluding PPP and FHLB Prepayment Fees 3.37% 3.41% - 0.04%
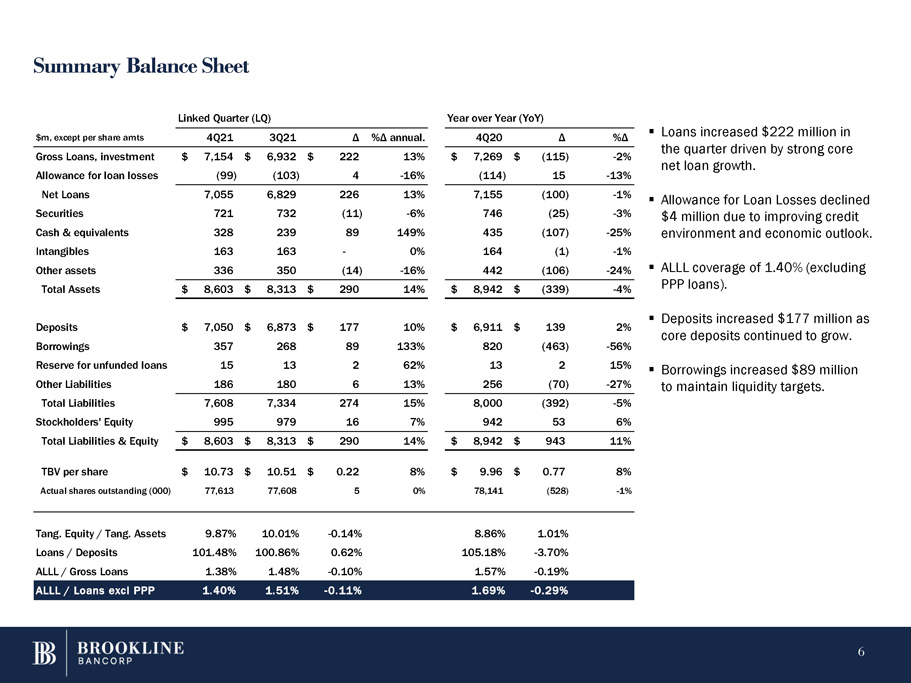
S u mm a r y B ala n c e S h ee t 6 ▪ Loans increased $ 222 million in the quarter driven by strong core net loan growth . ▪ Allowance for Loan Losses declined $4 million due to improving credit PPP loans). ▪ Deposits increased $177 million as core deposits continued to grow. ▪ Borrowings increased $89 million to maintain liquidity targets. Cash & equivalents 328 239 89 149% 435 (107) - 25% environment and economic outlook. Intangibles 163 163 - 0% 164 (1) - 1% Other assets 336 350 (14) - 16% 442 (106) - 24% ▪ ALLL coverage of 1.40% (excluding Total Assets $ 8,603 $ 8,313 $ 290 14% $ 8,942 $ (339) - 4% Deposits $ 7,050 $ 6,873 $ 177 10% $ 6,911 $ 139 2% Borrowings 357 268 89 133% 820 (463) - 56% Reserve for unfunded loans 15 13 2 62% 13 2 15% Other Liabilities 186 180 6 13% 256 (70) - 27% Total Liabilities 7,608 7,334 274 15% 8,000 (392) - 5% Stockholders' Equity 995 979 16 7% 942 53 6% Total Liabilities & Equity $ 8,603 $ 8,313 $ 290 14% $ 8,942 $ 943 11% TBV per share $ 10.73 $ 10.51 $ 0.22 8% $ 9.96 $ 0.77 8% Actual shares outstanding (000) 77,613 77,608 5 0% 78,141 (528) - 1% Tang. Equity / Tang. Assets 9.87% 10.01% - 0.14% 8.86% 1.01% Loans / Deposits 101.48% 100.86% 0.62% 105.18% - 3.70% ALLL / Gross Loans 1.38% 1.48% - 0.10% 1.57% - 0.19% ALLL / Loans excl PPP 1.40% 1.51% - 0.11% 1.69% - 0.29% Linked Quarter (LQ) Year over Year (YoY) $m, except per share amts 4Q21 3Q21 Δ %Δ annual. 4Q20 Δ %Δ Gross Loans, investment $ 7,154 $ 6,932 $ 222 13% $ 7,269 $ (115) - 2% Allowance for loan losses (99) (103) 4 - 16% (114) 15 - 13% Net Loans 7,055 6,829 226 13% 7,155 (100) - 1% Securities 721 732 (11) - 6% 746 (25) - 3%
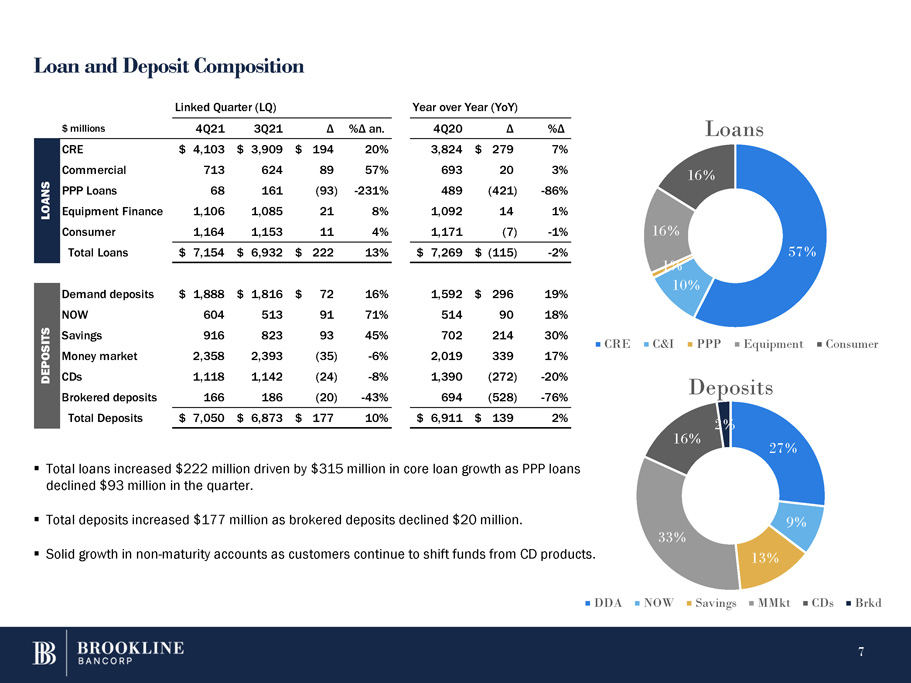
L oa n a n d D e po s i t C o m po s i t io n Loans 16% 16% 57% 1% 10% C R E C &I P P P Eq u i p me nt C o n s u m e r 27% 9% 13% 33% 16% D e po s i t s 2% D D A N OW Sav i ngs M M k t C D s B r k d 7 $ milli o n s 4Q21 3Q21 Δ %Δ an. 4Q20 Δ %Δ CRE $ 4,103 $ 3,909 $ 194 20% 3,824 $ 279 7% Commercial 713 624 89 57% 693 20 3% N S PPP Loans 68 161 (93) - 231% 489 (421) - 86% L O A Equipment Finance 1,106 1,085 21 8% 1,092 14 1% Consumer 1,164 1,153 11 4% 1,171 (7) - 1% Total Loans $ 7,154 $ 6,932 $ 222 13% $ 7,269 $ (115) - 2% Demand deposits $ 1,888 $ 1,816 $ 72 16% 1,592 $ 296 19% NOW 604 513 91 71% 514 90 18% IT S Savings 916 823 93 45% 702 214 30% P O S Money market 2,358 2,393 (35) - 6% 2,019 339 17% D E CDs 1,118 1,142 (24) - 8% 1,390 (272) - 20% Brokered deposits 166 186 (20) - 43% 694 (528) - 76% Total Deposits $ 7,050 $ 6,873 $ 177 10% $ 6,911 $ 139 2% Linked Quarter (LQ) Year over Year (YoY) ▪ Total loans increased $222 million driven by $315 million in core loan growth as PPP loans declined $93 million in the quarter. ▪ Total deposits increased $177 million as brokered deposits declined $20 million. ▪ Solid growth in non - maturity accounts as customers continue to shift funds from CD products.
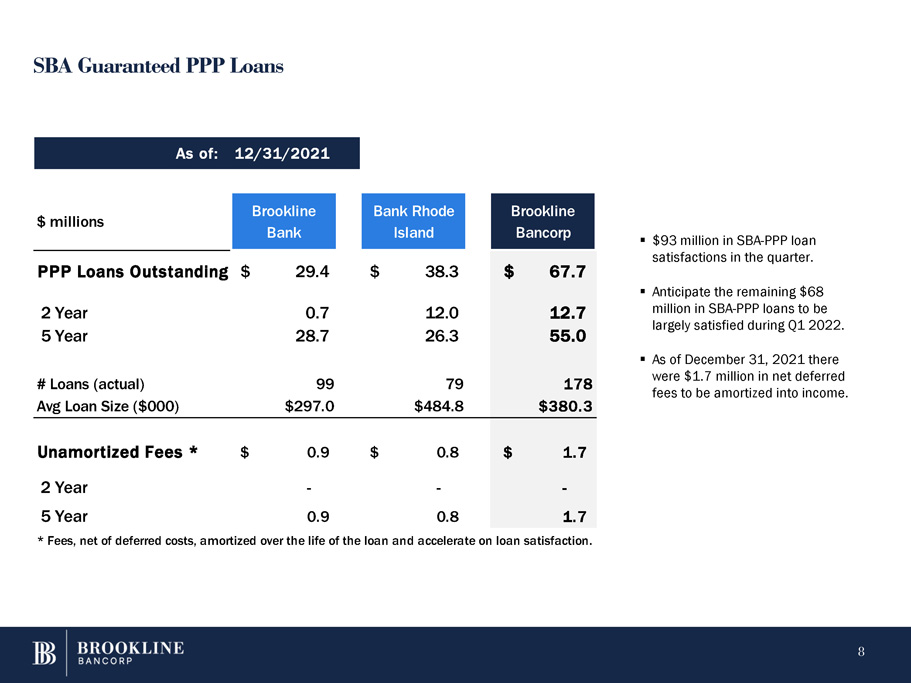
S B A G u a r a nt ee d PP P L oa n s ▪ $93 million in SBA - PPP loan satisfactions in the quarter. ▪ Anticipate the remaining $68 million in SBA - PPP loans to be largely satisfied during Q1 2022. ▪ As of December 31, 2021 there were $1.7 million in net deferred fees to be amortized into income. As of: 12/31/2021 * Fees, net of deferred costs, amortized over the life of the loan and accelerate on loan satisfaction. $ millions Brookline Bank Bank Rhode Island B r oo k li n e Bancorp PPP Loans Outstanding $ 29.4 $ 38.3 $ 67.7 2 Year 0.7 12.0 12.7 5 Year 28.7 26.3 55.0 # Loans (actual) 99 79 178 Avg Loan Size ($000) $297.0 $484.8 $380.3 Unamortized Fees * $ 0.9 $ 0.8 $ 1.7 2 Year - - - 5 Year 0.9 0.8 1.7 8
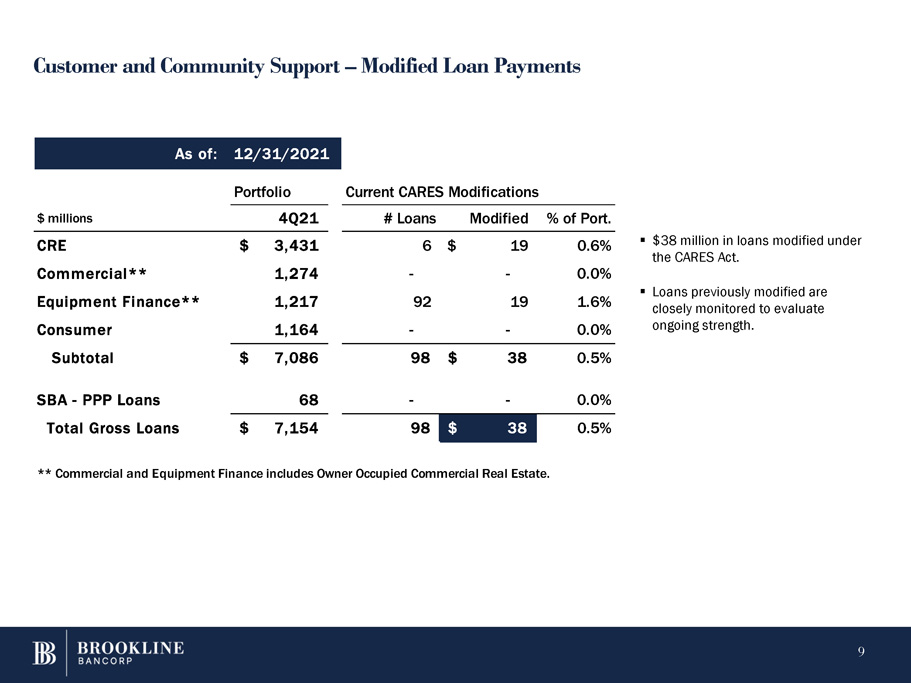
Customer and Community Support – Modified Loan Payments As of: 12/31/2021 Portfolio Current CARES Modifications $ millions 4Q21 # Loans Modified % of Port. CRE $ 3,431 6 $ 19 0.6% Commercial** 1,274 - - 0.0% Equipment Finance** 1,217 92 19 1.6% Consumer 1,164 - - 0.0% Subtotal $ 7,086 98 $ 38 0.5% 0 . 0% 0 . 5% SBA - PPP Loans 68 - - Total Gross Loans $ 7,154 98 $ 38 ** Commercial and Equipment Finance includes Owner Occupied Commercial Real Estate. ▪ $38 million in loans modified under the CARES Act. ▪ Loans previously modified are closely monitored to evaluate ongoing strength . 9
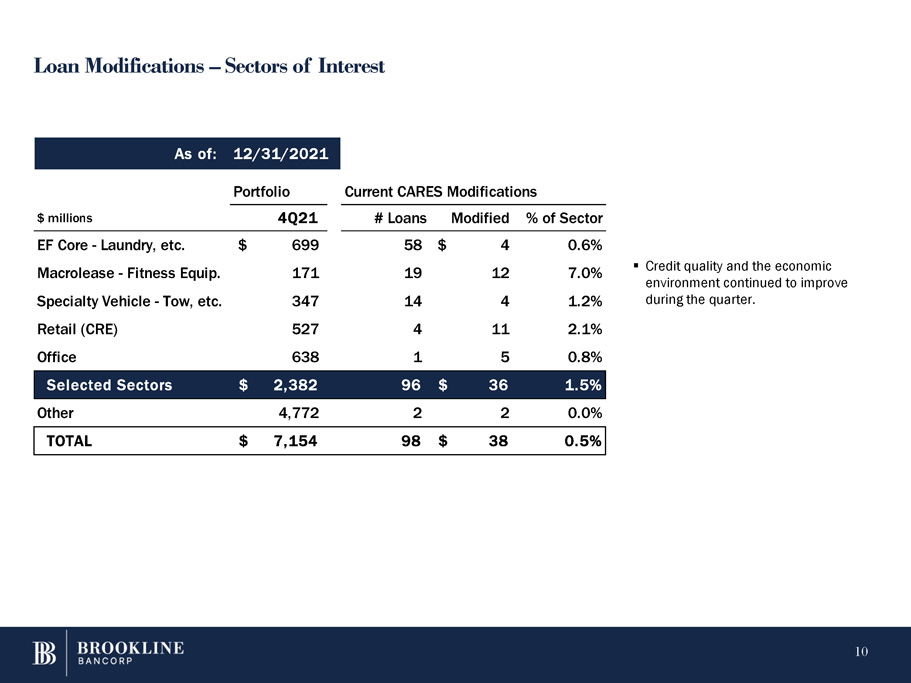
L oa n M odi f i c a t io n s – S ec t o r s o f Int e r e st ▪ Credit quality and the economic environment continued to improve during the quarter. $ millions 4Q21 # Loans Modified % of Sector EF Core - Laundry, etc. $ 699 58 $ 4 0.6% Macrolease - Fitness Equip. 171 19 12 7.0% Specialty Vehicle - Tow, etc. 347 14 4 1.2% Retail (CRE) 527 4 11 2.1% Office 638 1 5 0.8% Selected Sectors $ 2,382 96 $ 36 1.5% Other 4,772 2 2 0.0% TOTAL $ 7,154 98 $ 38 0.5% As of: 12/31/2021 P o r t fo li o Current CARES Modifications 10
C api t a l S tr e n g t h 11 ▪ As of December 31, 2021, the Company maintained capital well above regulatory “well capitalized” requirements. ▪ On November 15, 2021, the Company announced a $20 million stock buyback program authorizing management to repurchase stock through December 31, 2022. During the fourth quarter no shares were repurchased. p r e limi na r y e s t im a t e s * Regulatory BASEL III Requirements Brookline Board Policy Limits Capital in Excess of "Well Capitalized" $ milli o n s Dec - 21 Minimum "Well C ap i t a li ze d " Policy M i n i m u m s Op e r a t i n g Targets Excess Ratio E x c e ss C ap i t al Tier 1 Common / RWA 12.0% ≥ 4.5% ≥ 6.5% ≥ 7.5% ≥ 8.0% 5.5% $ 381.3 Tier 1 / RWA 12.1% ≥ 6.0% ≥ 8.0% ≥ 9.0% ≥ 9.5% 4.1% $ 286.2 Total Risk Based Capital 14.4% ≥ 8.0% ≥ 10.0% ≥ 11.0% ≥ 11.5% 4.4% $ 308.1 Leverage Ratio 10.2% ≥ 5.0% ≥ 5.0% ≥ 5.5% ≥ 6.0% 5.2% $ 429.6 * Regulatory capital ratios are preliminary estimates and may differ from numbers calculated in final Regulatory filings.
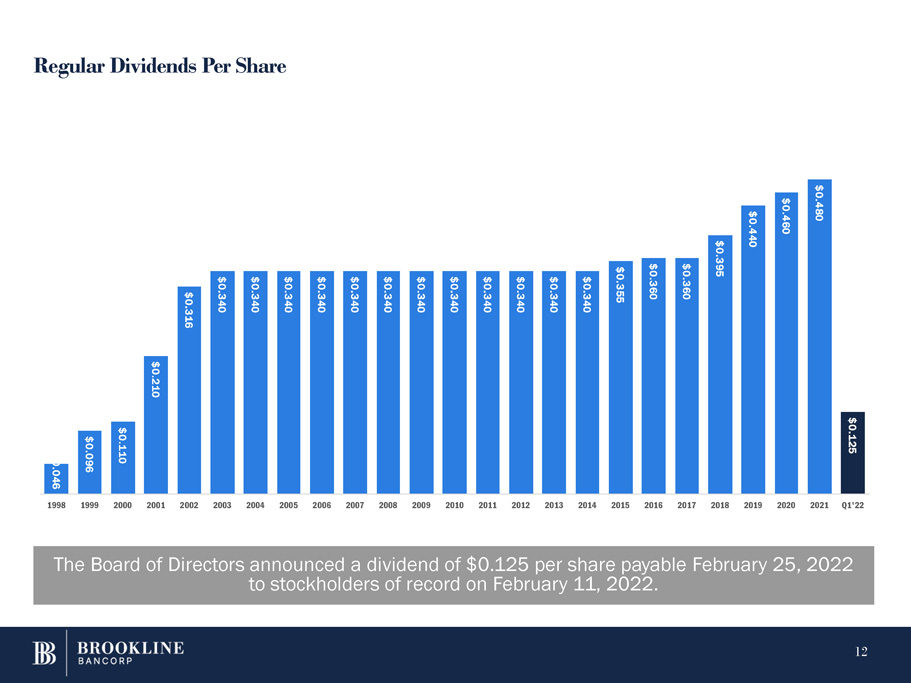
R e g u la r Di v id e n d s P e r S h a r e The Board of Directors announced a dividend of $0.125 per share payable February 25, 2022 to stockholders of record on February 11, 2022. 0 . 0 4 6 12 $0 . 0 9 6 $0 . 1 1 0 $0 . 2 1 0 $0 . 3 1 6 $0 . 3 4 0 $0 . 3 4 0 $0 . 3 4 0 $0 . 3 4 0 $0 . 3 4 0 $0 . 3 4 0 $0 . 3 4 0 $0 . 3 4 0 $0 . 3 4 0 $0 . 3 4 0 $0 . 3 4 0 $0 . 3 4 0 $0 . 3 5 5 $0 . 3 6 0 $0 . 3 6 0 $0 . 3 9 5 $0 . 4 4 0 $0 . 4 6 0 $0 . 4 8 0 $0 . 1 2 5 199 8 199 9 200 0 200 1 200 2 200 3 200 4 200 5 200 6 200 7 200 8 200 9 201 0 201 1 201 2 201 3 201 4 201 5 201 6 201 7 201 8 201 9 202 0 202 1 Q 1'22
QUESTIONS Paul A. Perrault, Chairman and Chief Executive Officer Carl M. Carlson, Co - President and Chief Financial Officer Thank You. 13
APP EN D I X 14
N o n P e r f o r m i n g A ss e t s a n d Ne t Ch a r g e O f f s 15 4Q21 3Q21 Δ 4Q20 Δ Non Performing Assets (NPAs), in milli ons CRE $ 10.9 $ 11.0 $ (0.1) $ 7.2 $ 3.7 C&I 17.4 20.3 (2.9) 24.6 (7.2) Consumer 4.2 4.6 (0.4) 6.7 (2.5) Total Non Performing Loans (NPLs) 32.5 35.9 (3.4) 38.5 (6.0) Other real estate owned - - - 5.4 (5.4) Other repossessed assets 0.7 0.6 0.1 1.1 (0.4) Total NPAs $ 33.2 $ 36.5 $ (3.3) $ 45.0 $ (11.8) NPLs / Total Loans 0.45% 0.52% - 0.07% 0.53% - 0.08% NPAs / Total Assets 0.39% 0.44% - 0.05% 0.50% - 0.11% Net Charge Offs (NCOs), in millions CRE loans $ - $ - $ - $ 3.4 $ (3.4) C&I loans 2.1 1.3 0.8 1.1 1.0 Consumer loans - - - (0.1) 0.1 Total Net Charge Offs $ 2.1 $ 1.3 $ 0.8 $ 4.4 $ (2.3) NCOs / Loans (annualized) 0.12% 0.07% 0.05% 0.24% - 0.12% Linked Quarter (LQ) Year over Year (YoY)
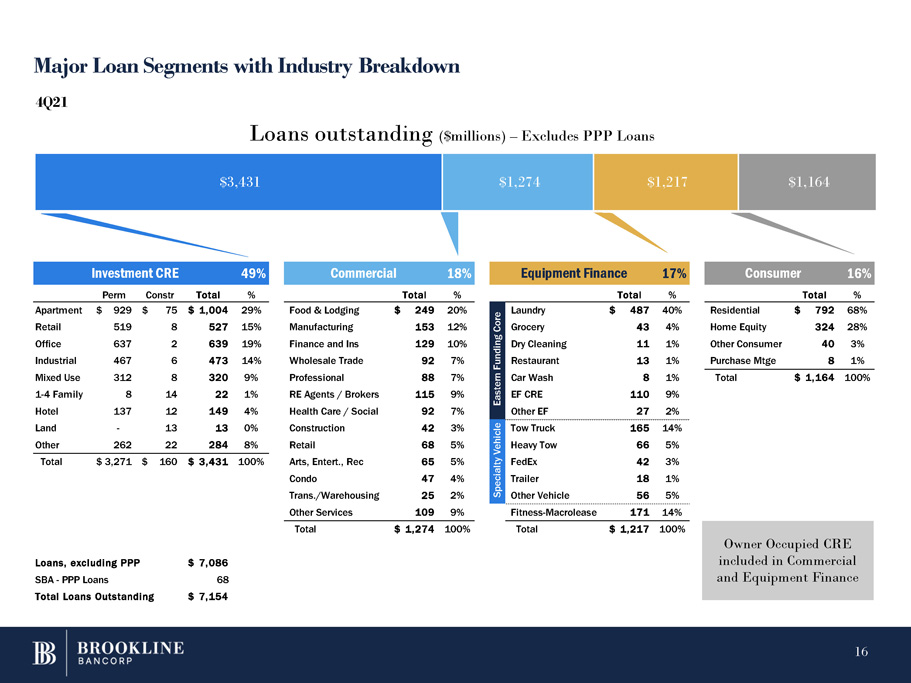
M a j o r L oa n S e g me nt s wi t h In d ustr y B r e a k d o w n $3,431 $1,274 $1,217 $1,164 4Q21 Loans outstanding ($millions) – Excludes PPP Loans Investment CRE 49% Commercial 18% Equipment Finance 17% Consumer 16% P e r m Co n s t r T o t a l % T o t a l % T o t a l % T o t a l % Food & Lodging Manufacturing Finance and Ins W h o l e s a l e T ra d e Professional RE Agents / Brokers Health Care / Social Construction Retail Arts, Entert., Rec Condo T ran s. / W ar e h o u si ng Other Services $ 24 9 20% 153 12% 129 10% 92 7% 88 7% 115 9% 92 7% 42 3% 68 5% 65 5% 47 4% 25 2% 109 9% Residential Home Equity Ot h er Co n s u m er Purchase Mtge $ 79 2 68% 324 28% 40 3% 8 1% Total $ 1,164 100% - Apar t m e n t Retail Office Industrial Mixed Use 1 - 4 F a m il y Hotel Land Ot h er 262 $ 92 9 $ 7 5 $ 1 , 00 4 29% 519 8 527 15% 637 2 639 19% 467 6 473 14% 312 8 320 9% 8 14 22 1% 137 12 149 4% 13 13 0% 22 284 8% Total $ 3,271 $ 160 $ 3,431 100% Fitness - Macrolease 17 1 14% Eastern Funding Core Laundry $ 487 40% Grocery 43 4% Dry Cleaning 11 1% Restaurant 13 1% Car Wash 8 1% EF CRE 110 9% Other EF 27 2% Specialty Vehicle Tow Truck 165 14% Heavy Tow 66 5% FedEx 42 3% Trailer 18 1% Other Vehicle 56 5% Total $ 1,274 100% Total $ 1,217 100% Loans, excluding PPP SBA - PPP Loans Total Loans Outstanding $ 7,086 68 $ 7,154 Owner Occupied CRE included in Commercial and Equipment Finance 16
C R E – L oa n t o V al u e ( L TV ) 29% 41% 30% 31% 44% 5% 22% 30% 37% 5 1 % 49% 59% 57% 42% 66% 57% 56% 39% 17% 10% 9% 6% 14% 29% 21% 14% 18% 0% 0% 1 0 % 2 0 % 3 0 % 4 0 % 5 0 % 6 0 % 7 0 % 8 0 % 9 0 % 1 0 0% A p a rt m e nt R e t a i l O f f i c e Medical H o t e l R e s t au r a n t O t h e r Exposures by LTV Industrial 50% and lower M i x e d U s e 50 - 70 70 - 8 0 80+ Non Owner Occupied CRE and Multifamily Exposures at December 31, 2021. 33 % 52 % 2 % 13 % 17 Overall 53% LTV
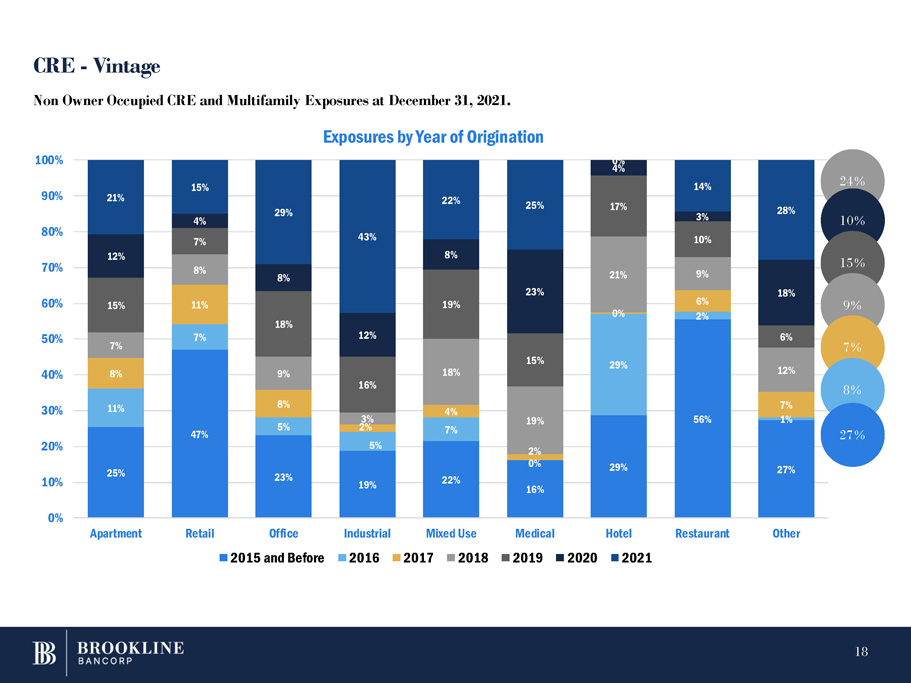
25% 4 7 % 23% 19% 22% 16% 29% 56% 27% 1 1 % 7% 5% 5% 7% 0% 29% 8% 1 1 % 8% 2% 4% 2% 0% 6% 2% 7% 1% 7% 8% 9% 3% 18% 19% 2 1 % 9% 12% 15% 7% 18% 16% 19% 15% 1 7 % 10% 6% 12% 4% 8% 12% 8% 23% 4% 3% 18% 2 1 % 15% 29% 43% 22% 25% 0% 14% 28% 0% 1 0 % 2 0 % 3 0 % 4 0 % 5 0 % 6 0 % 7 0 % 8 0 % 9 0 % 1 0 0% Apartment R e t a i l Office 2015 and Before Restaurant O t h e r Non Owner Occupied CRE and Multifamily Exposures at December 31, 2021. Exposures by Year of Origination Industrial Mixed Use Medical Hotel 201 6 201 7 201 8 201 9 202 0 2021 24 % C R E - V i nt a g e 10 % 15 % 9 % 7 % 8 % 27 % 18
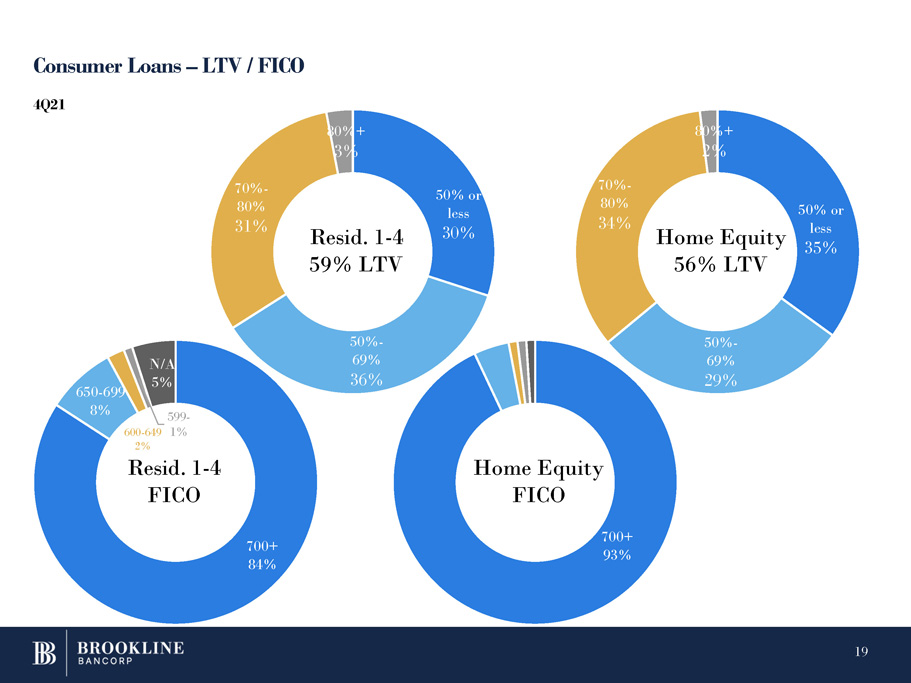
C o nsu me r L oa n s – L T V / F IC O 19 700+ 84% 650 - 699 8% 599 - 600 - 649 1% 2% N /A 5% 50 % or less 30% 50 % - 69% 36% 70 % - 80% 31% 80 %+ 3% 700+ 93% 50 % or less 35% 50 % - 69% 29% 70 % - 80% 34% 80 %+ 2% R es id. 1 - 4 59% LTV R es id. 1 - 4 FICO Home Equity FICO Home Equity 56% LTV 4 Q 21
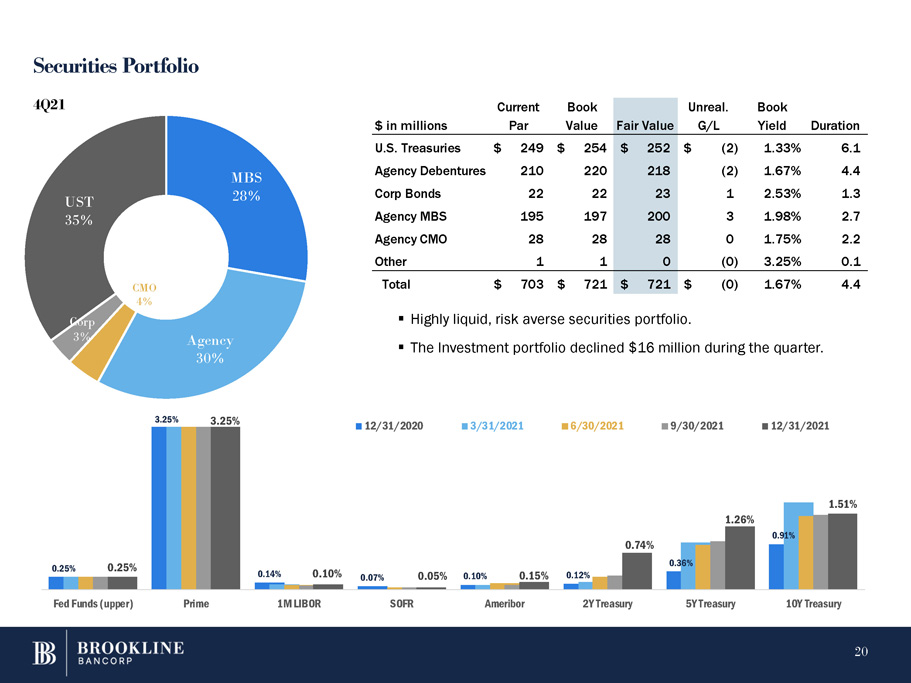
S ec ur i t i e s P o r t f olio ▪ Highly liquid, risk averse securities portfolio. ▪ The Investment portfolio declined $16 million during the quarter. 0.25 % 3.25 % 0.14 % 0.07 % 0.10 % 0.12 % 0.36 % 0 . 25 % 3 . 25 % 0 . 10 % 0 . 05 % 0 . 15 % 0 . 7 4 % 1.26% 0. 9 1 % 1 . 5 1 % F e d F u nd s ( up p e r ) P r i m e 1 M L I B OR S O F R Ameribor 2 Y T r e a s u r y 5 Y T r e a s u r y 10Y Treasury 1 2 / 3 1 / 2 0 2 0 3/31/2021 6/30/2021 9/30/2021 1 2 / 3 1 / 2 0 2 1 $ in millions Current Par Book Value Fair Value Unreal. G/L Book Yield Duration U.S. Treasuries $ 249 $ 254 $ 252 $ (2) 1.33% 6.1 Agency Debentures 210 220 218 (2) 1.67% 4.4 Corp Bonds 22 22 23 1 2.53% 1.3 Agency MBS 195 197 200 3 1.98% 2.7 Agency CMO 28 28 28 0 1.75% 2.2 Other 1 1 0 (0) 3.25% 0.1 Total $ 703 $ 721 $ 721 $ (0) 1.67% 4.4 M BS 28% 20 A g e n cy 30% C MO 4% C o r p 3% U ST 35% 4 Q 21
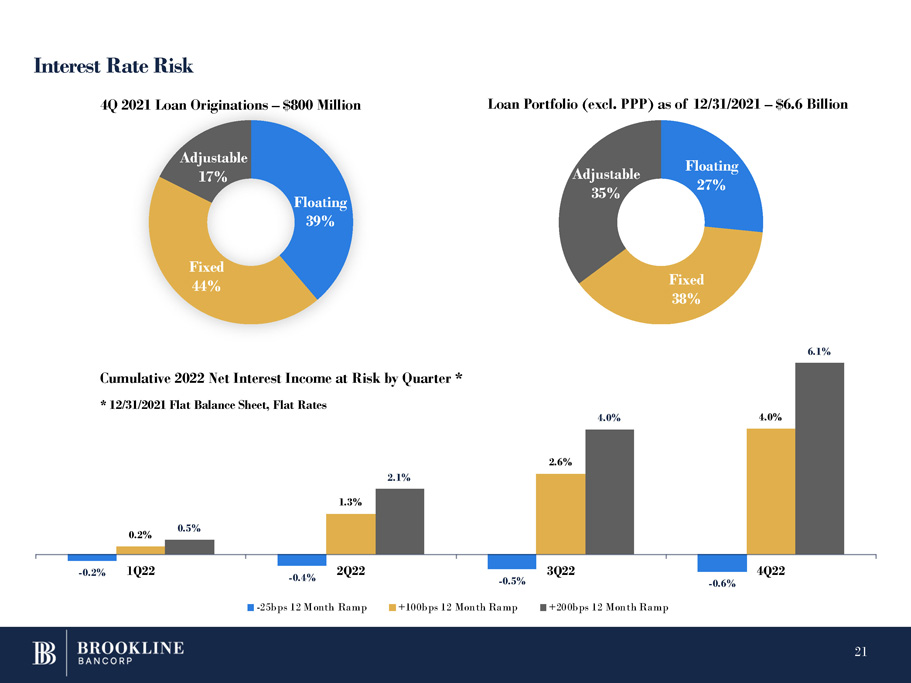
F l oa ti ng 27% F i x e d 38% A d j u st ab l e 35% - 0 . 2 % - 0 . 4 % - 0 . 5 % - 0 . 6 % 0 . 2 % 2 . 6 % 4 . 0 % 0 . 5 % 2.1% 1.3% 4 . 0 % 6 . 1 % 1 Q 22 2 Q 22 3 Q 22 4 Q 22 - 25bps 12 Month Ramp +100bps 12 Month Ramp +200bps 12 Month Ramp F l oa ti n g 39% 21 F i x e d 44% A d j u st ab l e 17% Int e r e s t R a t e Ri sk 4Q 2021 Loan Originations – $800 Million Loan Portfolio (excl. PPP) as of 12/31/2021 – $6.6 Billion Cumulative 2022 Net Interest Income at Risk by Quarter * * 12/31/2021 Flat Balance Sheet, Flat Rates
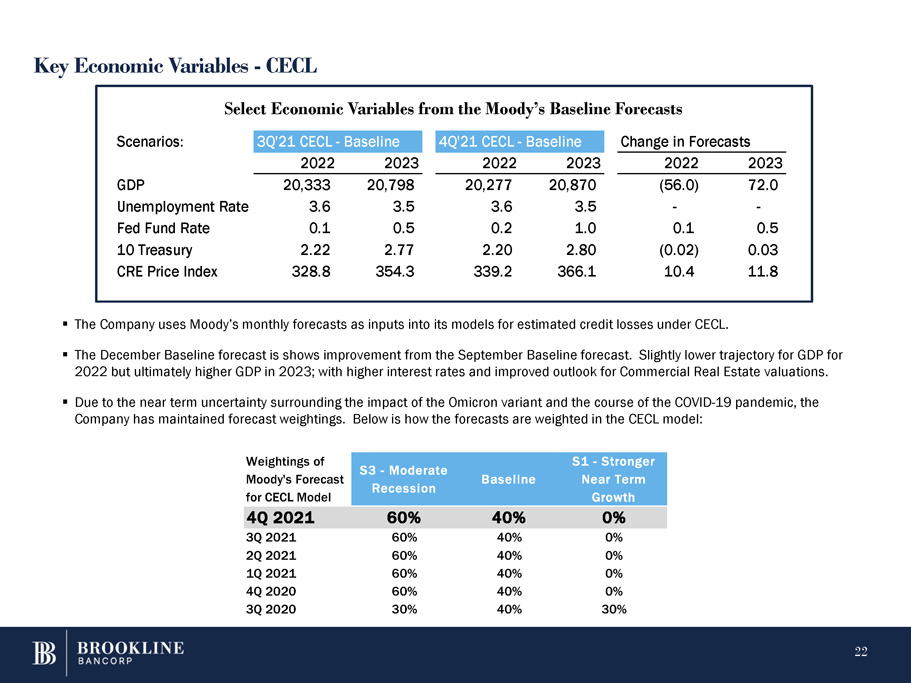
Ke y Ec o n o m i c V a r iabl e s - C E CL Sele Scenarios: ct Economic Variables f 3 Q ' 2 1 C E C L - B a s e li n e rom the Moody 4 Q ' 2 1 C E C L - B ’ s B a selin aseline e Forecasts Change in Forecasts 2022 2023 2022 2023 2022 2023 GDP 20,333 20,798 20,277 20,870 (56.0) 72.0 Unemployment Rate 3.6 3.5 3.6 3.5 - - Fed Fund Rate 0.1 0.5 0.2 1.0 0.1 0.5 1 0 T r e a s ury 2.22 2.77 2.20 2.80 (0.02) 0.03 CRE Price Index 328.8 354.3 339.2 366.1 10.4 11.8 ▪ The Company uses Moody’s monthly forecasts as inputs into its models for estimated credit losses under CECL. ▪ The December Baseline forecast is shows improvement from the September Baseline forecast. Slightly lower trajectory for GDP for 2022 but ultimately higher GDP in 2023; with higher interest rates and improved outlook for Commercial Real Estate valuations. ▪ Due to the near term uncertainty surrounding the impact of the Omicron variant and the course of the COVID - 19 pandemic, the Company has maintained forecast weightings. Below is how the forecasts are weighted in the CECL model: 22 Weightings of Moody's Forecast for CECL Model S3 - Moderate Recession Baseline S1 - Stronger Near Term Growth 4Q 2021 60% 40% 0% 3Q 2021 60% 40% 0% 2Q 2021 60% 40% 0% 1Q 2021 60% 40% 0% 4Q 2020 60% 40% 0% 3Q 2020 30% 40% 30%
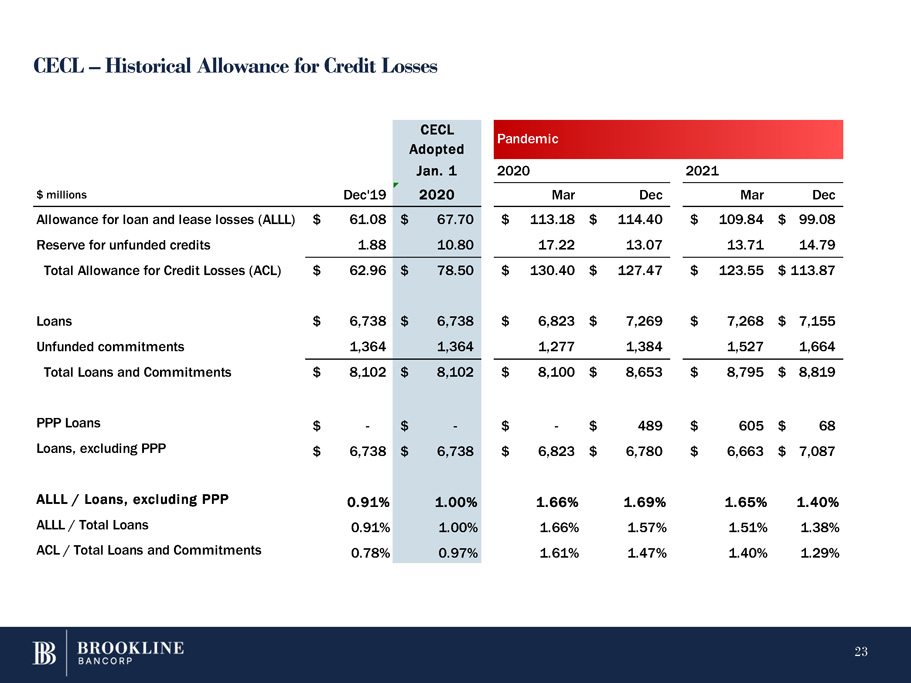
C E C L – H i st o r i c a l All o w a n c e f o r Cr e di t L o ss e s $ milli o n s Dec'19 CECL Adopted Jan. 1 2020 Allowance for loan and lease losses (ALLL) Reserve for unfunded credits Total Allowance for Credit Losses (ACL) Loans Unfunded commitments $ 61.08 1.88 $ 67.70 10.80 $ 62.96 $ 6,738 1,364 $ 78.50 $ 6,738 1,364 Total Loans and Commitments $ 8,102 $ 8,102 PPP Loans $ - $ - Loans, excluding PPP $ 6,738 $ 6,738 ALLL / Loans, excluding PPP 0.91% 1.00% ALLL / Total Loans 0.91% 1.00% ACL / Total Loans and Commitments 0.78% 0.97% 23 Pandemic 2020 2021 Mar Dec Mar Dec $ 113.18 $ 114.40 $ 109.84 $ 99.08 17.22 13.07 13.71 14.79 $ 130.40 $ 127.47 $ 123.55 $ 113.87 $ 6,823 $ 7,269 $ 7,268 $ 7,155 1,277 1,384 1,527 1,664 $ 8,100 $ 8,653 $ 8,795 $ 8,819 $ - $ 489 $ 605 $ 68 $ 6,823 $ 6,780 $ 6,663 $ 7,087 1.66% 1.69% 1.65% 1.40% 1.66% 1.57% 1.51% 1.38% 1.61% 1.47% 1.40% 1.29%
D!\@'Z
M @,"# (4 AT")@(O C@"00)+ E0"70)G G$">@*$ HX"F *B JP"M@+! LL"
MU0+@ NL"]0, PL#%@,A RT#. -# T\#6@-F W(#?@.* Y8#H@.N [H#QP/3
M ^ #[ /Y! 8$$P0@!"T$.P1(!%4$8P1Q!'X$C 2:!*@$M@3$!-,$X03P!/X%
M#044%]@8&!A8&)P8W!D@&609J
M!GL&C :=!J\&P ;1!N,&]0<'!QD'*P<]!T\'80=T!X8'F0>L![\'T@?E!_@(
M"P@?"#((1@A:"&X(@@B6"*H(O@C2".<(^PD0"24).@E/"60)>0F/":0)N@G/
M">4)^PH1"B<*/0I4"FH*@0J8"JX*Q0K<"O,+"PLB"SD+40MI"X +F NP"\@+
MX0OY#!(,*@Q##%P,=0R.#*<,P S9#/,-#0TF#4 -6@UT#8X-J0W##=X-^ X3
M#BX.20YD#G\.FPZV#M(.[@\)#R4/00]>#WH/E@^S#\\/[! )$"800Q!A$'X0
MFQ"Y$-<0]1$3$3$13Q%M$8P1JA')$>@2!Q(F$D429!*$$J,2PQ+C$P,3(Q-#
M$V,3@Q.D$\43Y10&%"<4211J%(L4K13.%/ 5$A4T%585>!6;%;T5X!8#%B86
M219L%H\6LA;6%OH7'1=!%V47B1>N%](7]Q@;&$ 891B*&*\8U1CZ&2 911EK
M&9$9MQG=&@0:*AI1&G<:GAK%&NP;%!L[&V,;BANR&]H< APJ'%(<>QRC',P<
M]1T>'4<=:AZ4'KX>Z1\3'SX?:1^4'[\?ZB 5($$@;""8
M(,0@\"$<(4@A=2&A( &YXS'DJ>8EYYWI&>J5[
M!'MC>\)\(7R!?.%]07VA?@%^8G["?R-_A'_E@$> J($*@6N!S8(P@I*"](-7
M@[J$'82 A..%1X6KA@Z&