UNITED STATES
SECURITIES AND EXCHANGE COMMISSION
Washington, D.C. 20549
_________________
FORM
_________________
CURRENT REPORT
Pursuant to Section 13 or 15(d)
of the Securities Exchange Act of 1934
Date of Report (Date of earliest event reported):
_______________________________
(Exact name of registrant as specified in its charter)
_______________________________
(State or Other Jurisdiction of Incorporation) | (Commission File Number) | (I.R.S. Employer Identification No.) |
(Address of Principal Executive Offices) (Zip Code)
(
(Registrant's telephone number, including area code)
Not applicable
(Former name or former address, if changed since last report)
_______________________________
Check the appropriate box below if the Form 8-K filing is intended to simultaneously satisfy the filing obligation of the registrant under any of the following provisions:
Written communications pursuant to Rule 425 under the Securities Act (17 CFR 230.425) | |
Soliciting material pursuant to Rule 14a-12 under the Exchange Act (17 CFR 240.14a-12) | |
Pre-commencement communications pursuant to Rule 14d-2(b) under the Exchange Act (17 CFR 240.14d-2(b)) | |
Pre-commencement communications pursuant to Rule 13e-4(c) under the Exchange Act (17 CFR 240.13e-4(c)) |
Securities registered pursuant to Section 12(b) of the Act:
Title of each class | Trading Symbol(s) | Name of each exchange on which registered |
Indicate by check mark whether the registrant is an emerging growth company as defined in Rule 405 of the Securities Act of 1933 (§230.405 of this chapter) or Rule 12b-2 of the Securities Exchange Act of 1934 (§240.12b-2 of this chapter).
Emerging growth company
If an emerging growth company,indicate by check mark if the registrant has elected not to use the extended transition period for complying with any new or revised financial accounting standards provided pursuant to Section 13(a) of the Exchange Act. ☐
On July 28, 2021, the Board of Directors of Brookline Bancorp, Inc. (the “Company”) issued a press release announcing its earnings for the quarter ended June 30, 2021. Additionally, the Company announced the approval by its Board of Directors of a regular quarterly dividend of $0.12 per share payable on August 27, 2021 to stockholders of record on August 13, 2021. A copy of that press release is attached hereto as Exhibit 99.1 and is hereby incorporated by reference herein.
In connection with the press release announcing the Company’s second quarter earnings, the Company posted an investor presentation to its website at www.brooklinebancorp.com. A copy of the investor presentation is attached hereto as Exhibit 99.2 and is hereby incorporated by reference herein.
99.1 | Press release of Brookline Bancorp, Inc. reporting earnings and dividend approval, issued July 28, 2021 | |||
99.2 | Investor Presentation of Brookline Bancorp, Inc., issued July 28, 2021 | |||
104 | Cover Page Interactive Data File (embedded within the Inline XBRL document) |
SIGNATURE
Pursuant to the requirements of the Securities Exchange Act of 1934, the registrant has duly caused this report to be signed on its behalf by the undersigned hereunto duly authorized.
BROOKLINE BANCORP, INC. | ||
Date: July 28, 2021 | By: | /s/ Carl M. Carlson |
Carl M. Carlson | ||
Co-President, Chief Financial & Strategy Officer | ||
EXHIBIT INDEX
The following exhibits are furnished as part of this report:
Exhibit No. | Description | |||
99.1 | Press release of Brookline Bancorp, Inc. reporting earnings and dividend approval, issued July 28, 2021 | |||
99.2 | Investor Presentation of Brookline Bancorp, Inc., issued July 28, 2021 | |||
104 | Cover Page Interactive Data File (embedded within the Inline XBRL document) |
EXHIBIT 99.1
Brookline Bancorp Announces Record Second Quarter Results
Net Income of $31.6 million, EPS of $0.40
BOSTON, July 28, 2021 (GLOBE NEWSWIRE) -- Brookline Bancorp, Inc. (NASDAQ: BRKL) (the “Company”) today announced record net income of $31.6 million, or $0.40 per basic and diluted share, for the second quarter of 2021, compared to net income of $26.5 million, or $0.34 per basic and diluted share, for the first quarter of 2021, and net income of $19.6 million, or $0.25 per basic and diluted share, for the second quarter of 2020.
“We are pleased to report earnings of $31.6 million for the second quarter of 2021 representing $0.40 per share,” Paul Perrault, Chairman and Chief Executive Officer of the Company continued, “Brookline Bancorp and its employees continue to execute on our strategy of high performance for both our customers and our stockholders. We look forward to continued success in the second half of 2021.”
BALANCE SHEET
Total assets at June 30, 2021 decreased $97.8 million to $8.5 billion from $8.6 billion at March 31, 2021, and decreased $607.7 million from $9.1 billion at June 30, 2020. At June 30, 2021, total loans and leases were $7.0 billion, representing a decrease of $247.3 million from March 31, 2021, and a decrease of $387.4 million from June 30, 2020.
The Company funded a total of 4,700 of SBA Paycheck Protection Program ("PPP") loans in the aggregate amount of $872.1 million. As of June 30, 2021, $348.4 million in PPP loans remain outstanding, net of deferred fees and costs of $10.3 million. Excluding PPP loan activity, the core loan portfolio grew $9.1 million in the quarter compared to a decline of $117.6 million in the first quarter.
Total investment securities at June 30, 2021 decreased $36.3 million to $694.2 million from $730.4 million at March 31, 2021, and decreased $162.3 million from $856.5 million at June 30, 2020. Total cash and cash equivalents at June 30, 2021 increased $189.5 million to $320.4 million from $130.9 million at March 31, 2021, and increased $65.5 million from $254.9 million at June 30, 2020. As of June 30, 2021, total investment securities and total cash and cash equivalents represented 12.0 percent of total assets as compared to 10.1 percent and 12.3 percent as of March 31, 2021 and June 30, 2020, respectively.
Total deposits at June 30, 2021 increased $27.9 million to $6.89 billion from $6.87 billion at March 31, 2021 and increased $454.5 million from $6.4 billion at June 30, 2020.
Total borrowed funds at June 30, 2021 decreased $183.0 million to $363.0 million from $546.0 million at March 31, 2021 and decreased $1.0 billion from $1.4 billion at June 30, 2020.
The ratio of stockholders’ equity to total assets was 11.49 percent at June 30, 2021, as compared to 11.04 percent at March 31, 2021, and 10.21 percent at June 30, 2020. The ratio of tangible stockholders’ equity to tangible assets (non-GAAP) was 9.75 percent at June 30, 2021, as compared to 9.31 percent at March 31, 2021, and 8.56 percent at June 30, 2020. Tangible book value per share (non-GAAP) increased $0.34 from $10.01 at March 31, 2021 to $10.35 at June 30, 2021, compared to $9.67 at June 30, 2020.
NET INTEREST INCOME
Net interest income increased $2.0 million to $71.1 million for the second quarter of 2021 from $69.1 million at the quarter ended March 31, 2021. The net interest margin increased 13 basis points to 3.52 percent for the three months ended June 30, 2021 from 3.39 percent for the three months ended March 31, 2021.
NON-INTEREST INCOME
Total non-interest income for the quarter ended June 30, 2021 increased $1.1 million to $5.9 million from $4.8 million for the quarter ended March 31, 2021. The increase was primarily driven by an increase of $0.7 million in deposit fees and an increase of $1.0 million in other non-interest income, partially offset by a decrease of $0.4 million in loan level derivative income, net and a decrease of $0.2 million in gain on sales of loans and leases.
PROVISION FOR CREDIT LOSSES
The Company recorded a negative provision for credit losses of $3.3 million for the quarter ended June 30, 2021, compared to a negative provision for credit losses of $2.1 million for the quarter ended March 31, 2021. Total net charge-offs for the second quarter of 2021 were $0.6 million compared to $1.8 million in the first quarter of 2021. The decrease is primarily driven by a combination of a decrease in charge-offs of equipment financing loans and commercial loans of $0.6 million and $0.3 million, respectively, and an increase in recoveries of equipment financing loans and home equity loans of $0.2 million and $0.1 million, respectively. The ratio of net loan and lease charge-offs to average loans and leases on an annualized basis decreased to 3 basis points for the second quarter of 2021 from 10 basis points for the first quarter of 2021.
The allowance for loan and lease losses represented 1.52 percent of total loans and leases at June 30, 2021, compared to 1.51 percent at March 31, 2021, and 1.61 percent at June 30, 2020. Excluding PPP loans, the allowance for loan and lease losses represents 1.60 percent of total loans and leases at June 30, 2021 compared to 1.65 percent at March 31, 2021, and 1.75 percent at June 30, 2020.
ASSET QUALITY
The ratio of nonperforming loans and leases to total loans and leases was 0.49 percent at June 30, 2021, an increase from 0.43 percent at March 31, 2021. Total nonaccrual loans and leases increased $3.2 million to $34.2 million at June 30, 2021 from $31.0 million at March 31, 2021. The ratio of nonperforming assets to total assets was 0.41 percent at June 30, 2021, a decrease from 0.44 percent at March 31, 2021. Total nonperforming assets decreased $2.8 million to $34.6 million at June 30, 2021 from $37.4 million at March 31, 2021.
From March 1, 2020 through the earlier of January 1, 2022 or 60 days after the termination date of the national emergency declared by the President on March 13, 2020 concerning the COVID-19 outbreak, a financial institution may elect to suspend the requirements under accounting principles generally accepted in the U.S. for loan modifications related to the COVID-19 pandemic that would otherwise be categorized as a troubled debt restructured, including impairment accounting. This troubled debt restructuring relief applies for the term of the loan modification that occurs during the applicable period for a loan that was not more than 30 days past due as of December 31, 2019. Financial institutions are required to maintain records of the volume of loans involved in modifications to which troubled debt restructuring relief is applicable. As of June 30, 2021, approximately 90 percent of loans granted an initial loan payment deferral have returned to payment status and 151 credits totaling $96.0 million or 1.4 percent of total loans outstanding are operating under modified terms.
NON-INTEREST EXPENSE
Non-interest expense for the quarter ended June 30, 2021 decreased $2.8 million to $38.0 million from $40.8 million for the quarter ended March 31, 2021. The decrease was primarily driven by decreases of $0.6 million in compensation and employee benefits expense, $0.4 million in FDIC insurance expense and $1.8 million in other non-interest expense due to a $2.1 million gain on sale of other real estate owned.
PROVISION FOR INCOME TAXES
The effective tax rate was 25.4 percent and 25.2 percent for the three and six months ended June 30, 2021 compared to 24.9 percent for the three months ended March 31, 2021 and 24.9 percent and a negative 2.2 percent for the three and six months ended June 30, 2020.
RETURNS ON AVERAGE ASSETS AND AVERAGE EQUITY
The annualized return on average assets increased to 1.48 percent during the second quarter 2021 from 1.21 percent for the first quarter of 2021.
The annualized return on average stockholders' equity increased to 13.21 percent during the second quarter of 2021 from 11.18 percent for the first quarter of 2021. The annualized return on average tangible stockholders’ equity increased to 15.92 percent for the second quarter of 2021 from 13.51 percent for the first quarter of 2021.
DIVIDEND DECLARED
The Company’s Board of Directors approved a dividend of $0.12 per share for the quarter ended June 30, 2021. The dividend will be paid on August 27, 2021 to stockholders of record on August 13, 2021.
CONFERENCE CALL
The Company will conduct a conference call/webcast at 1:30 PM Eastern Daylight Time on Thursday, July 29, 2021 to discuss the results for the quarter, business highlights and outlook. A copy of the Earnings Presentation is available on the Company’s website, www.brooklinebancorp.com. To listen to the call and view the Company’s Earnings Presentation, please join the call via https://services.choruscall.com/links/brkl1210729.html. To listen to the call without access to the slides, interested parties may dial 877-504-4120 (United States) or 412-902-6650 (internationally) and ask for the Brookline Bancorp, Inc. conference call. A recorded playback of the call will be available for one week following the call on the Company’s website under “Investor Relations” or by dialing 877-344-7529 (United States) or 412-317-0088 (internationally) and entering the passcode: 10157750.
ABOUT BROOKLINE BANCORP, INC.
Brookline Bancorp, Inc., a bank holding company with $8.5 billion in assets and branch locations in Massachusetts and Rhode Island, is headquartered in Boston, Massachusetts and operates as the holding company for Brookline Bank and Bank Rhode Island (the "banks"). The Company provides commercial and retail banking services, cash management and investment services to customers throughout Central New England. More information about Brookline Bancorp, Inc. and its banks can be found at the following websites: www.brooklinebank.com and www.bankri.com.
FORWARD-LOOKING STATEMENTS
Certain statements contained in this press release that are not historical facts may constitute forward-looking statements within the meaning of Section 27A of the Securities Act of 1933, as amended, and Section 21E of the Securities Exchange Act of 1934, as amended, and are intended to be covered by the safe harbor provisions of the Private Securities Litigation Reform Act of 1995. Statements contained in this press release that do not describe historical or current facts are forward-looking statements, including statements regard the potential effects of COVID-19 on the Company’s business, credit quality, financial condition, liquidity and results of operations. Forward-looking statements made with regard to the potential effects of the COVID-19 pandemic on the Company’s business, financial condition, credit quality, liquidity and results of operation may differ, possibly materially, from what is included in this press release due to factors and future developments that are uncertain and beyond the scope of the Company’s control. These included, but are not limited to, general business and economic conditions on a national basis and in the local markets in which the Company operates; changes in consumer behavior due to changing political business and economic conditions or legislative or regulatory initiatives; the possibility that future credit losses may be higher than currently expected; reputational risk relating to the Company’s participation in the Paycheck Protection Program and other pandemic-related legislative and regulatory initiatives and programs; and turbulence in capital and debt markets. Forward-looking statements involve risks and uncertainties which are difficult to predict. The Company’s actual results could differ materially from those projected in the forward-looking statements as a result of, among others, the risks outlined in the Company’s Annual Report on Form 10-K, as updated by its Quarterly Reports on Form 10-Q and other filings submitted to the Securities and Exchange Commission ("SEC"). The Company does not undertake any obligation to update any forward-looking statement to reflect circumstances or events that occur after the date the forward-looking statements are made.
BASIS OF PRESENTATION
The Company's consolidated financial statements have been prepared in conformity with generally accepted accounting principles (“GAAP”) as set forth by the Financial Accounting Standards Board in its Accounting Standards Codification and through the rules and interpretive releases of the SEC under the authority of federal securities laws. Certain amounts previously reported have been reclassified to conform to the current period's presentation.
NON-GAAP FINANCIAL MEASURES
The Company uses certain non-GAAP financial measures, such as operating earnings, operating return on average assets, operating return on average tangible assets, operating return on average stockholders' equity, operating return on average tangible stockholders' equity, the allowance for loan and lease losses as a percentage of total loans and leases less PPP loans, tangible book value per common share, tangible stockholders’ equity to tangible assets, return on average tangible assets (annualized) and return on average tangible stockholders' equity (annualized). These non-GAAP financial measures provide information for investors to effectively analyze financial trends of ongoing business activities, and to enhance comparability with peers across the financial services sector. A detailed reconciliation table of the Company's GAAP to the non-GAAP measures is attached.
INVESTOR RELATIONS:
Contact:
Carl M. Carlson
Brookline Bancorp, Inc.
Co-President and Chief Financial Officer
(617) 425-5331
ccarlson@brkl.com
BROOKLINE BANCORP, INC. AND SUBSIDIARIES | |||||||||||||||||||
Selected Financial Highlights (Unaudited) | |||||||||||||||||||
At and for the Three Months Ended | |||||||||||||||||||
June 30, 2021 | March 31, 2021 | December 31, 2020 | September 30, 2020 | June 30, 2020 | |||||||||||||||
(Dollars In Thousands Except per Share Data) | |||||||||||||||||||
Earnings Data: | |||||||||||||||||||
Net interest income | $ | 71,106 | $ | 69,109 | $ | 68,225 | $ | 65,938 | $ | 64,288 | |||||||||
(Credit) provision for credit losses | (3,331 | ) | (2,147 | ) | (2,103 | ) | 4,528 | 5,347 | |||||||||||
Non-interest income | 5,910 | 4,794 | 4,219 | 4,862 | 6,235 | ||||||||||||||
Non-interest expense | 37,966 | 40,811 | 40,038 | 40,947 | 39,109 | ||||||||||||||
Income before provision for income taxes | 42,381 | 35,239 | 34,509 | 25,325 | 26,067 | ||||||||||||||
Net income | 31,602 | 26,454 | 26,663 | 18,679 | 19,571 | ||||||||||||||
Performance Ratios: | |||||||||||||||||||
Net interest margin (1) | 3.52 | % | 3.39 | % | 3.23 | % | 3.08 | % | 3.09 | % | |||||||||
Interest-rate spread (1) | 3.34 | % | 3.15 | % | 3.03 | % | 2.85 | % | 2.75 | % | |||||||||
Return on average assets (annualized) | 1.48 | % | 1.21 | % | 1.20 | % | 0.83 | % | 0.88 | % | |||||||||
Return on average tangible assets (annualized) (non-GAAP) | 1.51 | % | 1.24 | % | 1.22 | % | 0.84 | % | 0.90 | % | |||||||||
Return on average stockholders' equity (annualized) | 13.21 | % | 11.18 | % | 11.38 | % | 7.99 | % | 8.45 | % | |||||||||
Return on average tangible stockholders' equity (annualized) (non-GAAP) | 15.92 | % | 13.51 | % | 13.79 | % | 9.70 | % | 10.28 | % | |||||||||
Efficiency ratio (2) | 49.30 | % | 55.22 | % | 55.27 | % | 57.83 | % | 55.46 | % | |||||||||
Per Common Share Data: | |||||||||||||||||||
Net income (loss) — Basic | $ | 0.40 | $ | 0.34 | $ | 0.34 | $ | 0.24 | $ | 0.25 | |||||||||
Net income (loss) — Diluted | 0.40 | 0.34 | 0.34 | 0.24 | 0.25 | ||||||||||||||
Cash dividends declared | 0.120 | 0.120 | 0.115 | 0.115 | 0.115 | ||||||||||||||
Book value per share (end of period) | 12.44 | 12.10 | 12.05 | 11.84 | 11.75 | ||||||||||||||
Tangible book value per share (end of period) (non-GAAP) | 10.35 | 10.01 | 9.96 | 9.77 | 9.67 | ||||||||||||||
Stock price (end of period) | 14.95 | 15.00 | 12.04 | 8.65 | 10.08 | ||||||||||||||
Balance Sheet: | |||||||||||||||||||
Total assets | $ | 8,461,964 | $ | 8,559,810 | $ | 8,942,424 | $ | 9,000,192 | $ | 9,069,667 | |||||||||
Total loans and leases | 7,020,275 | 7,267,552 | 7,269,553 | 7,396,358 | 7,407,697 | ||||||||||||||
Total deposits | 6,894,701 | 6,866,786 | 6,910,696 | 6,792,523 | 6,440,233 | ||||||||||||||
Total stockholders’ equity | 972,252 | 945,399 | 941,778 | 935,558 | 926,413 | ||||||||||||||
Asset Quality: | |||||||||||||||||||
Nonperforming assets | $ | 34,588 | $ | 37,403 | $ | 44,963 | $ | 39,365 | $ | 42,754 | |||||||||
Nonperforming assets as a percentage of total assets | 0.41 | % | 0.44 | % | 0.50 | % | 0.44 | % | 0.47 | % | |||||||||
Allowance for loan and lease losses | $ | 106,474 | $ | 109,837 | $ | 114,379 | $ | 119,971 | $ | 119,553 | |||||||||
Allowance for loan and lease losses as a percentage of total loans and leases | 1.52 | % | 1.51 | % | 1.57 | % | 1.62 | % | 1.61 | % | |||||||||
Net loan and lease charge-offs | $ | 595 | $ | 1,760 | $ | 4,381 | $ | 4,963 | $ | 1,383 | |||||||||
Net loan and lease charge-offs as a percentage of average loans and leases (annualized) | 0.03 | % | 0.10 | % | 0.24 | % | 0.27 | % | 0.08 | % | |||||||||
Capital Ratios: | |||||||||||||||||||
Stockholders’ equity to total assets | 11.49 | % | 11.04 | % | 10.53 | % | 10.39 | % | 10.21 | % | |||||||||
Tangible stockholders’ equity to tangible assets (non-GAAP) | 9.75 | % | 9.31 | % | 8.86 | % | 8.73 | % | 8.56 | % | |||||||||
(1) Calculated on a fully tax-equivalent basis. | |||||||||||||||||||
(2) Calculated as non-interest expense as a percentage of net interest income plus non-interest income. | |||||||||||||||||||
BROOKLINE BANCORP, INC. AND SUBSIDIARIES | |||||||||||||||||||
Consolidated Balance Sheets (Unaudited) | |||||||||||||||||||
June 30, 2021 | March 31, 2021 | December 31, 2020 | September 30, 2020 | June 30, 2020 | |||||||||||||||
ASSETS | (In Thousands Except Share Data) | ||||||||||||||||||
Cash and due from banks | $ | 36,079 | $ | 41,284 | $ | 36,069 | $ | 33,818 | $ | 38,522 | |||||||||
Short-term investments | 284,370 | 89,643 | 398,848 | 283,515 | 216,394 | ||||||||||||||
Total cash and cash equivalents | 320,449 | 130,927 | 434,917 | 317,333 | 254,916 | ||||||||||||||
Investment securities available-for-sale | 694,151 | 729,901 | 745,822 | 783,867 | 854,505 | ||||||||||||||
Investment securities held-to-maturity | - | - | - | - | - | ||||||||||||||
Equity securities held-for-trading | - | 518 | 526 | 525 | 1,992 | ||||||||||||||
Total investment securities | 694,151 | 730,419 | 746,348 | 784,392 | 856,497 | ||||||||||||||
Loans and leases: | |||||||||||||||||||
Commercial real estate loans | 3,815,581 | 3,790,341 | 3,823,826 | 3,835,372 | 3,837,703 | ||||||||||||||
Commercial loans and leases | 2,038,851 | 2,324,202 | 2,274,899 | 2,354,613 | 2,361,463 | ||||||||||||||
Consumer loans | 1,165,843 | 1,153,009 | 1,170,828 | 1,206,373 | 1,208,531 | ||||||||||||||
Total loans and leases | 7,020,275 | 7,267,552 | 7,269,553 | 7,396,358 | 7,407,697 | ||||||||||||||
Allowance for loan and lease losses | (106,474 | ) | (109,837 | ) | (114,379 | ) | (119,971 | ) | (119,553 | ) | |||||||||
Net loans and leases | 6,913,801 | 7,157,715 | 7,155,174 | 7,276,387 | 7,288,144 | ||||||||||||||
Restricted equity securities | 31,627 | 40,400 | 49,786 | 61,715 | 71,638 | ||||||||||||||
Premises and equipment, net of accumulated depreciation | 71,240 | 72,524 | 71,568 | 72,441 | 73,127 | ||||||||||||||
Right-of-use asset operating leases | 22,682 | 23,180 | 24,143 | 23,492 | 24,343 | ||||||||||||||
Deferred tax asset | 41,324 | 42,857 | 40,129 | 42,269 | 42,683 | ||||||||||||||
Goodwill | 160,427 | 160,427 | 160,427 | 160,427 | 160,427 | ||||||||||||||
Identified intangible assets, net of accumulated amortization | 2,692 | 2,920 | 3,152 | 3,464 | 3,775 | ||||||||||||||
Other real estate owned and repossessed assets | 372 | 6,383 | 6,515 | 1,413 | 1,454 | ||||||||||||||
Other assets | 203,199 | 192,058 | 250,265 | 256,859 | 292,663 | ||||||||||||||
Total assets | $ | 8,461,964 | $ | 8,559,810 | $ | 8,942,424 | $ | 9,000,192 | $ | 9,069,667 | |||||||||
LIABILITIES AND STOCKHOLDERS' EQUITY | |||||||||||||||||||
Deposits: | |||||||||||||||||||
Demand checking accounts | $ | 1,926,713 | $ | 1,724,170 | $ | 1,592,205 | $ | 1,550,267 | $ | 1,603,037 | |||||||||
NOW accounts | 495,598 | 481,988 | 513,948 | 459,902 | 417,622 | ||||||||||||||
Savings accounts | 782,482 | 724,504 | 701,659 | 716,630 | 657,758 | ||||||||||||||
Money market accounts | 2,250,651 | 2,192,468 | 2,018,977 | 1,878,258 | 1,809,868 | ||||||||||||||
Certificate of deposit accounts | 1,178,131 | 1,273,105 | 1,389,998 | 1,492,913 | 1,601,768 | ||||||||||||||
Brokered deposit accounts | 261,126 | 470,551 | 693,909 | 694,553 | 350,180 | ||||||||||||||
Total deposits | 6,894,701 | 6,866,786 | 6,910,696 | 6,792,523 | 6,440,233 | ||||||||||||||
Borrowed funds: | |||||||||||||||||||
Advances from the FHLBB | 204,154 | 378,646 | 648,849 | 841,169 | 1,267,570 | ||||||||||||||
Subordinated debentures and notes | 83,821 | 83,783 | 83,746 | 83,707 | 83,668 | ||||||||||||||
Other borrowed funds | 75,039 | 83,574 | 87,652 | 80,169 | 55,431 | ||||||||||||||
Total borrowed funds | 363,014 | 546,003 | 820,247 | 1,005,045 | 1,406,669 | ||||||||||||||
Operating lease liabilities | 22,682 | 23,180 | 24,143 | 23,492 | 24,343 | ||||||||||||||
Mortgagors’ escrow accounts | 6,231 | 6,483 | 5,901 | 6,429 | 6,467 | ||||||||||||||
Reserve for unfunded credits | 13,142 | 13,705 | 13,071 | 13,964 | 14,816 | ||||||||||||||
Accrued expenses and other liabilities | 189,942 | 158,254 | 226,588 | 223,181 | 250,726 | ||||||||||||||
Total liabilities | 7,489,712 | 7,614,411 | 8,000,646 | 8,064,634 | 8,143,254 | ||||||||||||||
Stockholders' equity: | |||||||||||||||||||
Common stock, $0.01 par value; 200,000,000 shares authorized; 85,177,172 shares issued, 85,177,172 shares issued, 85,177,172 shares issued, 85,177,172 shares issued, and 85,177,172 shares issued, respectively | 852 | 852 | 852 | 852 | 852 | ||||||||||||||
Additional paid-in capital | 738,557 | 737,882 | 737,178 | 736,294 | 738,155 | ||||||||||||||
Retained earnings, partially restricted | 304,466 | 282,301 | 264,892 | 247,336 | 237,808 | ||||||||||||||
Accumulated other comprehensive income | 6,089 | 2,082 | 16,490 | 18,782 | 19,538 | ||||||||||||||
Treasury stock, at cost; | |||||||||||||||||||
6,536,478, 6,534,602, 6,525,783, 5,629,854, and 5,859,708 shares, respectively | (77,493 | ) | (77,463 | ) | (77,343 | ) | (67,376 | ) | (69,572 | ) | |||||||||
Unallocated common stock held by the Employee Stock Ownership Plan; | |||||||||||||||||||
37,890, 44,502, 51,114, 58,227, and 65,334 shares, respectively | (219 | ) | (255 | ) | (291 | ) | (330 | ) | (368 | ) | |||||||||
Total stockholders' equity | 972,252 | 945,399 | 941,778 | 935,558 | 926,413 | ||||||||||||||
Total liabilities and stockholders' equity | $ | 8,461,964 | $ | 8,559,810 | $ | 8,942,424 | $ | 9,000,192 | $ | 9,069,667 |
BROOKLINE BANCORP, INC. AND SUBSIDIARIES | |||||||||||||||||||
Consolidated Statements of Income (Unaudited) | |||||||||||||||||||
Three Months Ended | |||||||||||||||||||
June 30, 2021 | March 31, 2021 | December 31, 2020 | September 30, 2020 | June 30, 2020 | |||||||||||||||
(In Thousands Except Share Data) | |||||||||||||||||||
Interest and dividend income: | |||||||||||||||||||
Loans and leases | $ | 75,026 | $ | 75,009 | $ | 76,583 | $ | 76,240 | $ | 77,416 | |||||||||
Debt securities | 3,121 | 3,118 | 3,335 | 3,746 | 3,701 | ||||||||||||||
Marketable and restricted equity securities | 233 | 301 | 490 | 672 | 908 | ||||||||||||||
Short-term investments | 42 | 39 | 59 | 46 | 99 | ||||||||||||||
Total interest and dividend income | 78,422 | 78,467 | 80,467 | 80,704 | 82,124 | ||||||||||||||
Interest expense: | |||||||||||||||||||
Deposits | 5,380 | 6,707 | 8,825 | 10,583 | 12,778 | ||||||||||||||
Borrowed funds | 1,936 | 2,651 | 3,417 | 4,183 | 5,058 | ||||||||||||||
Total interest expense | 7,316 | 9,358 | 12,242 | 14,766 | 17,836 | ||||||||||||||
Net interest income | 71,106 | 69,109 | 68,225 | 65,938 | 64,288 | ||||||||||||||
(Credit) provision for credit losses | (3,331 | ) | (2,147 | ) | (2,103 | ) | 4,528 | 5,347 | |||||||||||
Net interest income after provision for credit losses | 74,437 | 71,256 | 70,328 | 61,410 | 58,941 | ||||||||||||||
Non-interest income: | |||||||||||||||||||
Deposit fees | 3,015 | 2,281 | 2,358 | 2,305 | 1,929 | ||||||||||||||
Loan fees | 607 | 599 | 588 | 397 | 513 | ||||||||||||||
Loan level derivative income, net | 7 | 474 | 145 | 527 | 1,440 | ||||||||||||||
Gain (loss) on investment securities, net | 1 | (7 | ) | - | 54 | 586 | |||||||||||||
Gain on sales of loans and leases held-for-sale | 538 | 709 | 67 | 632 | 299 | ||||||||||||||
Other | 1,742 | 738 | 1,061 | 947 | 1,468 | ||||||||||||||
Total non-interest income | 5,910 | 4,794 | 4,219 | 4,862 | 6,235 | ||||||||||||||
Non-interest expense: | |||||||||||||||||||
Compensation and employee benefits | 25,161 | 25,821 | 25,054 | 26,092 | 24,619 | ||||||||||||||
Occupancy | 3,832 | 4,004 | 3,806 | 3,802 | 3,825 | ||||||||||||||
Equipment and data processing | 4,697 | 4,493 | 4,193 | 4,293 | 4,155 | ||||||||||||||
Professional services | 1,245 | 1,226 | 1,338 | 1,112 | 1,056 | ||||||||||||||
FDIC insurance | 657 | 1,044 | 1,630 | 1,363 | 858 | ||||||||||||||
Advertising and marketing | 1,110 | 1,100 | 1,010 | 1,024 | 1,017 | ||||||||||||||
Amortization of identified intangible assets | 228 | 232 | 312 | 312 | 311 | ||||||||||||||
Other | 1,036 | 2,891 | 2,695 | 2,949 | 3,268 | ||||||||||||||
Total non-interest expense | 37,966 | 40,811 | 40,038 | 40,947 | 39,109 | ||||||||||||||
Income before provision for income taxes | 42,381 | 35,239 | 34,509 | 25,325 | 26,067 | ||||||||||||||
Provision for income taxes | 10,779 | 8,785 | 7,846 | 6,646 | 6,496 | ||||||||||||||
Net income | $ | 31,602 | $ | 26,454 | $ | 26,663 | $ | 18,679 | $ | 19,571 | |||||||||
Earnings per common share: | |||||||||||||||||||
Basic | $ | 0.40 | $ | 0.34 | $ | 0.34 | $ | 0.24 | $ | 0.25 | |||||||||
Diluted | $ | 0.40 | $ | 0.34 | $ | 0.34 | $ | 0.24 | $ | 0.25 | |||||||||
Weighted average common shares outstanding during the period: | |||||||||||||||||||
Basic | 78,150,364 | 78,143,752 | 78,533,351 | 78,948,139 | 78,849,282 | ||||||||||||||
Diluted | 78,470,451 | 78,404,063 | 78,680,873 | 79,055,901 | 79,015,274 | ||||||||||||||
Dividends paid per common share | $ | 0.120 | $ | 0.115 | $ | 0.115 | $ | 0.115 | $ | 0.115 | |||||||||
BROOKLINE BANCORP, INC. AND SUBSIDIARIES | |||||||
Consolidated Statements of Income (Unaudited) | |||||||
Six Months Ended June 30, | |||||||
2021 | 2020 | ||||||
(In Thousands Except Share Data) | |||||||
Interest and dividend income: | |||||||
Loans and leases | $ | 150,035 | $ | 156,975 | |||
Debt securities | 6,239 | 6,677 | |||||
Marketable and restricted equity securities | 534 | 1,686 | |||||
Short-term investments | 81 | 308 | |||||
Total interest and dividend income | 156,889 | 165,646 | |||||
Interest expense: | |||||||
Deposits | 12,087 | 29,018 | |||||
Borrowed funds | 4,587 | 10,628 | |||||
Total interest expense | 16,674 | 39,646 | |||||
Net interest income | 140,215 | 126,000 | |||||
(Credit) provision for credit losses | (5,478 | ) | 59,461 | ||||
Net interest income after provision for credit losses | 145,693 | 66,539 | |||||
Non-interest income: | |||||||
Deposit Fees | 5,296 | 4,387 | |||||
Loan Fees | 1,160 | 1,063 | |||||
Loan level derivative income, net | 481 | 3,596 | |||||
(Loss) gain on investment securities, net | (6 | ) | 1,916 | ||||
Gain on sales of loans and leases held-for-sale | 1,247 | 419 | |||||
Other | 2,526 | 4,182 | |||||
Total non-interest income | 10,704 | 15,563 | |||||
Non-interest expense: | |||||||
Compensation and employee benefits | 50,982 | 49,838 | |||||
Occupancy | 7,836 | 7,778 | |||||
Equipment and data processing | 9,190 | 8,858 | |||||
Professional services | 2,471 | 2,707 | |||||
FDIC insurance | 1,701 | 1,236 | |||||
Advertising and marketing | 2,210 | 2,092 | |||||
Amortization of identified intangible assets | 460 | 647 | |||||
Other | 3,927 | 6,701 | |||||
Total non-interest expense | 78,777 | 79,857 | |||||
Income before provision for income taxes | 77,620 | 2,245 | |||||
Provision (benefit) for income taxes | 19,564 | (50 | ) | ||||
Net income | $ | 58,056 | $ | 2,295 | |||
Earnings per common share: | |||||||
Basic | $ | 0.74 | $ | 0.03 | |||
Diluted | $ | 0.74 | $ | 0.03 | |||
Weighted average common shares outstanding during the period: | |||||||
Basic | 78,147,076 | 79,165,372 | |||||
Diluted | 78,437,275 | 79,340,524 | |||||
Dividends paid per common share | $ | 0.235 | $ | 0.230 | |||
BROOKLINE BANCORP, INC. AND SUBSIDIARIES | |||||||||||||||||||
Asset Quality Analysis (Unaudited) | |||||||||||||||||||
At and for the Three Months Ended | |||||||||||||||||||
June 30, 2021 | March 31, 2021 | December 31, 2020 | September 30, 2020 | June 30, 2020 | |||||||||||||||
(Dollars in Thousands) | |||||||||||||||||||
NONPERFORMING ASSETS: | |||||||||||||||||||
Loans and leases accounted for on a nonaccrual basis: | |||||||||||||||||||
Commercial real estate mortgage | $ | 11,657 | $ | 3,611 | $ | 3,300 | $ | 10,841 | $ | 10,139 | |||||||||
Multi-family mortgage | - | - | - | - | - | ||||||||||||||
Construction | - | 3,853 | 3,853 | - | - | ||||||||||||||
Total commercial real estate loans | 11,657 | 7,464 | 7,153 | 10,841 | 10,139 | ||||||||||||||
Commercial | 3,207 | 3,161 | 7,702 | 7,751 | 12,427 | ||||||||||||||
Equipment financing | 14,872 | 15,772 | 16,757 | 13,372 | 13,100 | ||||||||||||||
Condominium association | 97 | 106 | 112 | 117 | 190 | ||||||||||||||
Total commercial loans and leases | 18,176 | 19,039 | 24,571 | 21,240 | 25,717 | ||||||||||||||
Residential mortgage | 3,638 | 3,722 | 5,587 | 4,634 | 4,157 | ||||||||||||||
Home equity | 744 | 793 | 1,136 | 1,235 | 1,278 | ||||||||||||||
Other consumer | 1 | 2 | 1 | 2 | 9 | ||||||||||||||
Total consumer loans | 4,383 | 4,517 | 6,724 | 5,871 | 5,444 | ||||||||||||||
Total nonaccrual loans and leases | 34,216 | 31,020 | 38,448 | 37,952 | 41,300 | ||||||||||||||
Other real estate owned | - | 5,328 | 5,415 | - | - | ||||||||||||||
Other repossessed assets | 372 | 1,055 | 1,100 | 1,413 | 1,454 | ||||||||||||||
Total nonperforming assets | $ | 34,588 | $ | 37,403 | $ | 44,963 | $ | 39,365 | $ | 42,754 | |||||||||
Loans and leases past due greater than 90 days and still accruing | $ | 3,154 | $ | 1,179 | $ | 11,975 | $ | 1,180 | $ | 1,974 | |||||||||
Troubled debt restructurings on accrual | 14,387 | 16,770 | 11,483 | 11,309 | 10,172 | ||||||||||||||
Troubled debt restructurings on nonaccrual | 6,410 | 6,293 | 7,476 | 5,742 | 5,972 | ||||||||||||||
Total troubled debt restructurings | $ | 20,797 | $ | 23,063 | $ | 18,959 | $ | 17,051 | $ | 16,144 | |||||||||
Nonperforming loans and leases as a percentage of total loans and leases | 0.49 | % | 0.43 | % | 0.53 | % | 0.51 | % | 0.56 | % | |||||||||
Nonperforming assets as a percentage of total assets | 0.41 | % | 0.44 | % | 0.50 | % | 0.44 | % | 0.47 | % | |||||||||
PROVISION AND ALLOWANCE FOR LOAN AND LEASE LOSSES: | |||||||||||||||||||
Allowance for loan and lease losses at beginning of period | $ | 109,837 | $ | 114,379 | $ | 119,971 | $ | 119,553 | $ | 113,181 | |||||||||
CECL adjustment to retained earnings | - | - | - | - | - | ||||||||||||||
Charge-offs | (1,221 | ) | (2,143 | ) | (4,810 | ) | (5,511 | ) | (1,803 | ) | |||||||||
Recoveries | 626 | 383 | 429 | 548 | 420 | ||||||||||||||
Net charge-offs | (595 | ) | (1,760 | ) | (4,381 | ) | (4,963 | ) | (1,383 | ) | |||||||||
(Credit) provision for loan and lease losses excluding unfunded commitments * | (2,768 | ) | (2,782 | ) | (1,211 | ) | 5,381 | 7,755 | |||||||||||
Allowance for loan and lease losses at end of period | $ | 106,474 | $ | 109,837 | $ | 114,379 | $ | 119,971 | $ | 119,553 | |||||||||
Allowance for loan and lease losses as a percentage of total loans and leases | 1.52 | % | 1.51 | % | 1.57 | % | 1.62 | % | 1.61 | % | |||||||||
NET CHARGE-OFFS: | |||||||||||||||||||
Commercial real estate loans | $ | 17 | $ | - | $ | 3,444 | $ | 70 | $ | (94 | ) | ||||||||
Commercial loans and leases | 695 | 1,809 | 1,011 | 4,917 | 1,498 | ||||||||||||||
Consumer loans | (117 | ) | (49 | ) | (74 | ) | (24 | ) | (21 | ) | |||||||||
Total net charge-offs | $ | 595 | $ | 1,760 | $ | 4,381 | $ | 4,963 | $ | 1,383 | |||||||||
Net loan and lease charge-offs as a percentage of average loans and leases (annualized) | 0.03 | % | 0.10 | % | 0.24 | % | 0.27 | % | 0.08 | % | |||||||||
*Provision for loan and lease losses does not include (credit) provision of $(0.6) million, $0.6 million, $(0.9) million, $(0.9) million and $2.4 million for credit losses on unfunded commitments during the three months ended June 30, 2021, March 31, 2021, December 31, 2020, September 30, 2020 and June 30, 2020, respectively. | |||||||||||||||||||
BROOKLINE BANCORP, INC. AND SUBSIDIARIES | ||||||||||||||||||||||||||
Average Yields / Costs (Unaudited) | ||||||||||||||||||||||||||
Three Months Ended | ||||||||||||||||||||||||||
June 30, 2021 | March 31, 2021 | June 30, 2020 | ||||||||||||||||||||||||
Average Balance | Interest (1) | Average Yield/ Cost | Average Balance | Interest (1) | Average Yield/ Cost | Average Balance | Interest (1) | Average Yield/ Cost | ||||||||||||||||||
(Dollars in Thousands) | ||||||||||||||||||||||||||
Assets: | ||||||||||||||||||||||||||
Interest-earning assets: | ||||||||||||||||||||||||||
Investments: | ||||||||||||||||||||||||||
Debt securities (2) | $ | 721,029 | $ | 3,121 | 1.73 | % | $ | 754,699 | $ | 3,118 | 1.65 | % | $ | 773,523 | $ | 3,719 | 1.92 | % | ||||||||
Marketable and restricted equity securities (2) | 34,989 | 233 | 2.67 | % | 45,673 | 301 | 2.64 | % | 71,058 | 915 | 5.15 | % | ||||||||||||||
Short-term investments | 234,317 | 42 | 0.07 | % | 191,751 | 39 | 0.08 | % | 245,577 | 99 | 0.16 | % | ||||||||||||||
Total investments | 990,335 | 3,396 | 1.37 | % | 992,123 | 3,458 | 1.39 | % | 1,090,158 | 4,733 | 1.74 | % | ||||||||||||||
Loans and Leases: | ||||||||||||||||||||||||||
Commercial real estate loans (3) | 3,780,920 | 34,320 | 3.59 | % | 3,785,897 | 34,245 | 3.62 | % | 3,761,667 | 36,829 | 3.87 | % | ||||||||||||||
Commercial loans (3) | 1,115,910 | 13,040 | 4.62 | % | 1,249,824 | 12,746 | 4.08 | % | 1,234,537 | 10,450 | 3.35 | % | ||||||||||||||
Equipment financing (3) | 1,074,469 | 17,963 | 6.69 | % | 1,079,039 | 18,043 | 6.69 | % | 1,069,192 | 18,973 | 7.10 | % | ||||||||||||||
Residential mortgage loans (3) | 788,296 | 6,927 | 3.51 | % | 780,785 | 7,232 | 3.71 | % | 814,431 | 8,068 | 3.96 | % | ||||||||||||||
Other consumer loans (3) | 368,845 | 2,833 | 3.08 | % | 375,590 | 2,795 | 3.02 | % | 411,326 | 3,153 | 3.07 | % | ||||||||||||||
Total loans and leases | 7,128,440 | 75,083 | 4.21 | % | 7,271,135 | 75,061 | 4.13 | % | 7,291,153 | 77,473 | 4.25 | % | ||||||||||||||
Total interest-earning assets | 8,118,775 | 78,479 | 3.87 | % | 8,263,258 | 78,519 | 3.80 | % | 8,381,311 | 82,206 | 3.92 | % | ||||||||||||||
Non-interest-earning assets | 421,453 | 450,900 | 488,229 | |||||||||||||||||||||||
Total assets | $ | 8,540,228 | $ | 8,714,158 | $ | 8,869,540 | ||||||||||||||||||||
Liabilities and Stockholders' Equity: | ||||||||||||||||||||||||||
Interest-bearing liabilities: | ||||||||||||||||||||||||||
Deposits: | ||||||||||||||||||||||||||
NOW accounts | $ | 499,883 | 146 | 0.12 | % | $ | 477,893 | 130 | 0.11 | % | $ | 395,158 | 114 | 0.12 | % | |||||||||||
Savings accounts | 774,406 | 248 | 0.13 | % | 712,728 | 235 | 0.13 | % | 663,782 | 357 | 0.22 | % | ||||||||||||||
Money market accounts | 2,247,997 | 1,497 | 0.27 | % | 2,084,503 | 1,486 | 0.29 | % | 1,784,343 | 2,074 | 0.47 | % | ||||||||||||||
Certificates of deposit | 1,226,668 | 3,102 | 1.01 | % | 1,328,112 | 4,154 | 1.27 | % | 1,637,486 | 8,364 | 2.05 | % | ||||||||||||||
Brokered deposit accounts | 418,166 | 387 | 0.37 | % | 610,824 | 702 | 0.47 | % | 381,709 | 1,869 | 1.97 | % | ||||||||||||||
Total interest-bearing deposits | 5,167,120 | 5,380 | 0.42 | % | 5,214,060 | 6,707 | 0.52 | % | 4,862,478 | 12,778 | 1.06 | % | ||||||||||||||
Borrowings | ||||||||||||||||||||||||||
Advances from the FHLBB | 250,102 | 663 | 1.05 | % | 488,537 | 1,370 | 1.12 | % | 1,102,079 | 3,751 | 1.35 | % | ||||||||||||||
Subordinated debentures and notes | 83,802 | 1,242 | 5.93 | % | 83,764 | 1,242 | 5.93 | % | 83,647 | 1,263 | 6.04 | % | ||||||||||||||
Other borrowed funds | 74,285 | 31 | 0.17 | % | 92,391 | 39 | 0.17 | % | 70,795 | 44 | 0.25 | % | ||||||||||||||
Total borrowings | 408,189 | 1,936 | 1.88 | % | 664,692 | 2,651 | 1.60 | % | 1,256,521 | 5,058 | 1.59 | % | ||||||||||||||
Total interest-bearing liabilities | 5,575,309 | 7,316 | 0.53 | % | 5,878,752 | 9,358 | 0.65 | % | 6,118,999 | 17,836 | 1.17 | % | ||||||||||||||
Non-interest-bearing liabilities: | ||||||||||||||||||||||||||
Demand checking accounts | 1,785,023 | 1,643,373 | 1,512,089 | |||||||||||||||||||||||
Other non-interest-bearing liabilities | 222,689 | 245,551 | 312,213 | |||||||||||||||||||||||
Total liabilities | 7,583,021 | 7,767,676 | 7,943,301 | |||||||||||||||||||||||
Stockholders’ equity | 957,207 | 946,482 | 926,239 | |||||||||||||||||||||||
Total liabilities and equity | $ | 8,540,228 | $ | 8,714,158 | $ | 8,869,540 | ||||||||||||||||||||
Net interest income (tax-equivalent basis) /Interest-rate spread (4) | 71,163 | 3.34 | % | 69,161 | 3.15 | % | 64,370 | 2.75 | % | |||||||||||||||||
Less adjustment of tax-exempt income | 57 | 52 | 82 | |||||||||||||||||||||||
Net interest income | $ | 71,106 | $ | 69,109 | $ | 64,288 | ||||||||||||||||||||
Net interest margin (5) | 3.52 | % | 3.39 | % | 3.09 | % | ||||||||||||||||||||
(1) Tax-exempt income on debt securities, equity securities and revenue bonds included in commercial real estate loans is included on a tax-equivalent basis. | ||||||||||||||||||||||||||
(2) Average balances include unrealized gains (losses) on investment securities. Dividend payments may not be consistent and average yield on equity securities may vary from month to month. | ||||||||||||||||||||||||||
(3) Loans on nonaccrual status are included in the average balances. | ||||||||||||||||||||||||||
(4) Interest rate spread represents the difference between the yield on interest-earning assets and the cost of interest-bearing liabilities. | ||||||||||||||||||||||||||
(5) Net interest margin represents net interest income (tax-equivalent basis) divided by average interest-earning assets on an actual/actual basis. | ||||||||||||||||||||||||||
BROOKLINE BANCORP, INC. AND SUBSIDIARIES | |||||||||||||||||
Average Yields / Costs (Unaudited) | |||||||||||||||||
Six Months Ended | |||||||||||||||||
June 30, 2021 | June 30, 2020 | ||||||||||||||||
Average Balance | Interest (1) | Average Yield/ Cost | Average Balance | Interest (1) | Average Yield/ Cost | ||||||||||||
(Dollars in Thousands) | |||||||||||||||||
Assets: | |||||||||||||||||
Interest-earning assets: | |||||||||||||||||
Investments: | |||||||||||||||||
Debt securities (2) | $ | 737,771 | $ | 6,239 | 1.69 | % | $ | 689,704 | $ | 6,743 | 1.96 | % | |||||
Marketable and restricted equity securities (2) | 40,302 | 534 | 2.65 | % | 64,968 | 1,701 | 5.24 | % | |||||||||
Short-term investments | 213,152 | 81 | 0.08 | % | 164,943 | 308 | 0.37 | % | |||||||||
Total investments | 991,225 | 6,854 | 1.38 | % | 919,615 | 8,752 | 1.90 | % | |||||||||
Loans and Leases: | |||||||||||||||||
Commercial real estate loans (3) | 3,783,394 | 68,565 | 3.60 | % | 3,729,339 | 77,297 | 4.10 | % | |||||||||
Commercial loans (3) | 1,182,498 | 25,786 | 4.34 | % | 1,008,923 | 18,778 | 3.68 | % | |||||||||
Equipment financing (3) | 1,076,741 | 36,006 | 6.69 | % | 1,061,019 | 37,919 | 7.15 | % | |||||||||
Residential mortgage loans (3) | 784,562 | 14,159 | 3.61 | % | 812,507 | 16,002 | 3.94 | % | |||||||||
Other consumer loans (3) | 372,198 | 5,628 | 3.05 | % | 414,570 | 7,108 | 3.43 | % | |||||||||
Total loans and leases | 7,199,393 | 150,144 | 4.17 | % | 7,026,358 | 157,104 | 4.47 | % | |||||||||
Total interest-earning assets | 8,190,618 | 156,998 | 3.83 | % | 7,945,973 | 165,856 | 4.17 | % | |||||||||
Non-interest-earning assets | 436,121 | 471,710 | |||||||||||||||
Total assets | $ | 8,626,739 | $ | 8,417,683 | |||||||||||||
Liabilities and Stockholders' Equity: | |||||||||||||||||
Interest-bearing liabilities: | |||||||||||||||||
Deposits: | |||||||||||||||||
NOW accounts | $ | 488,949 | 276 | 0.11 | % | $ | 377,399 | 230 | 0.12 | % | |||||||
Savings accounts | 743,738 | 483 | 0.13 | % | 645,363 | 1,000 | 0.31 | % | |||||||||
Money market accounts | 2,166,702 | 2,983 | 0.28 | % | 1,731,496 | 6,315 | 0.73 | % | |||||||||
Certificates of deposit | 1,277,110 | 7,256 | 1.15 | % | 1,660,193 | 17,615 | 2.13 | % | |||||||||
Brokered deposit accounts | 513,963 | 1,089 | 0.43 | % | 369,856 | 3,858 | 2.10 | % | |||||||||
Total interest-bearing deposits | 5,190,462 | 12,087 | 0.47 | % | 4,784,307 | 29,018 | 1.22 | % | |||||||||
Borrowings | |||||||||||||||||
Advances from the FHLBB | 368,661 | 2,033 | 1.10 | % | 937,271 | 7,848 | 1.66 | % | |||||||||
Subordinated debentures and notes | 83,783 | 2,484 | 5.93 | % | 83,628 | 2,547 | 6.09 | % | |||||||||
Other borrowed funds | 83,288 | 70 | 0.17 | % | 80,924 | 233 | 0.58 | % | |||||||||
Total borrowings | 535,732 | 4,587 | 1.70 | % | 1,101,823 | 10,628 | 1.91 | % | |||||||||
Total interest-bearing liabilities | 5,726,194 | 16,674 | 0.59 | % | 5,886,130 | 39,646 | 1.35 | % | |||||||||
Non-interest-bearing liabilities: | |||||||||||||||||
Demand checking accounts | 1,714,589 | 1,323,202 | |||||||||||||||
Other non-interest-bearing liabilities | 234,082 | 272,162 | |||||||||||||||
Total liabilities | 7,674,865 | 7,481,494 | |||||||||||||||
Stockholders’ equity | 951,874 | 936,189 | |||||||||||||||
Total liabilities and equity | $ | 8,626,739 | $ | 8,417,683 | |||||||||||||
Net interest income (tax-equivalent basis) /Interest-rate spread (4) | 140,324 | 3.24 | % | 126,210 | 2.82 | % | |||||||||||
Less adjustment of tax-exempt income | 109 | 210 | |||||||||||||||
Net interest income | $ | 140,215 | $ | 126,000 | |||||||||||||
Net interest margin (5) | 3.45 | % | 3.19 | % | |||||||||||||
(1) Tax-exempt income on debt securities, equity securities and revenue bonds included in commercial real estate loans is included on a tax-equivalent basis. | |||||||||||||||||
(2) Average balances include unrealized gains (losses) on investment securities. Dividend payments may not be consistent and average yield on equity securities may vary from month to month. | |||||||||||||||||
(3) Loans on nonaccrual status are included in the average balances. | |||||||||||||||||
(4) Interest rate spread represents the difference between the yield on interest-earning assets and the cost of interest-bearing liabilities. | |||||||||||||||||
(5) Net interest margin represents net interest income (tax-equivalent basis) divided by average interest-earning assets on an actual/actual basis. | |||||||||||||||||
BROOKLINE BANCORP, INC. AND SUBSIDIARIES | ||||||||||||||||||
Non-GAAP Financial Information (Unaudited) | ||||||||||||||||||
Three Months Ended June 30, | Six Months Ended June 30, | |||||||||||||||||
2021 | 2020 | 2021 | 2020 | |||||||||||||||
Reconciliation Table - Non-GAAP Financial Information | (Dollars in Thousands Except Share Data) | |||||||||||||||||
Net income attributable to Brookline Bancorp, Inc. | $ | 31,602 | $ | 19,571 | $ | 58,056 | $ | 2,295 | ||||||||||
Less: | ||||||||||||||||||
Security gains (losses) (after-tax) | 1 | 440 | (4 | ) | 1,958 | |||||||||||||
Operating earnings | $ | 31,601 | $ | 19,131 | $ | 58,060 | $ | 337 | ||||||||||
Operating earnings per common share: | ||||||||||||||||||
Basic | $ | 0.40 | $ | 0.24 | $ | 0.74 | $ | - | ||||||||||
Diluted | 0.40 | 0.24 | 0.74 | - | ||||||||||||||
Weighted average common shares outstanding during the period: | ||||||||||||||||||
Basic | 78,150,364 | 78,849,282 | 78,147,076 | 79,165,372 | ||||||||||||||
Diluted | 78,470,451 | 79,015,274 | 78,437,275 | 79,340,524 | ||||||||||||||
Return on average assets * | 1.48 | % | 0.88 | % | 1.35 | % | 0.05 | % | ||||||||||
Less: | ||||||||||||||||||
Security gains (losses) (after-tax) * | - | % | 0.02 | % | - | % | 0.04 | % | ||||||||||
Operating return on average assets * | 1.48 | % | 0.86 | % | 1.35 | % | 0.01 | % | ||||||||||
Return on average tangible assets * | 1.51 | % | 0.90 | % | 1.37 | % | 0.06 | % | ||||||||||
Less: | ||||||||||||||||||
Security gains (losses) (after-tax) * | - | % | 0.02 | % | - | % | 0.05 | % | ||||||||||
Operating return on average tangible assets * | 1.51 | % | 0.88 | % | 1.37 | % | 0.01 | % | ||||||||||
Return on average stockholders' equity * | 13.21 | % | 8.45 | % | 12.20 | % | 0.49 | % | ||||||||||
Less: | ||||||||||||||||||
Security gains (losses) (after-tax) * | - | % | 0.19 | % | - | % | 0.42 | % | ||||||||||
Operating return on average stockholders' equity * | 13.21 | % | 8.26 | % | 12.20 | % | 0.07 | % | ||||||||||
Return on average tangible stockholders' equity * | 15.92 | % | 10.28 | % | 14.73 | % | 0.59 | % | ||||||||||
Less: | ||||||||||||||||||
Security gains (losses) (after-tax) * | - | % | 0.24 | % | - | % | 0.50 | % | ||||||||||
Operating return on average tangible stockholders' equity * | 15.92 | % | 10.04 | % | 14.73 | % | 0.09 | % | ||||||||||
* Ratios at and for the three and six months ended are annualized. |
At and for the Three Months Ended | |||||||||||||||||||
June 30, 2021 | March 31, 2021 | December 31, 2020 | September 30, 2020 | June 30, 2020 | |||||||||||||||
(Dollars in Thousands) | |||||||||||||||||||
Net income, as reported | $ | 31,602 | $ | 26,454 | $ | 26,663 | $ | 18,679 | $ | 19,571 | |||||||||
Average total assets | $ | 8,540,228 | $ | 8,714,158 | $ | 8,874,467 | $ | 9,018,672 | $ | 8,869,540 | |||||||||
Less: Average goodwill and average identified intangible assets, net | 163,224 | 163,457 | 163,758 | 164,072 | 164,385 | ||||||||||||||
Average tangible assets | $ | 8,377,004 | $ | 8,550,701 | $ | 8,710,709 | $ | 8,854,600 | $ | 8,705,155 | |||||||||
Return on average tangible assets (annualized) | 1.51 | % | 1.24 | % | 1.22 | % | 0.84 | % | 0.90 | % | |||||||||
Average total stockholders’ equity | $ | 957,207 | $ | 946,482 | $ | 937,294 | $ | 934,632 | $ | 926,239 | |||||||||
Less: Average goodwill and average identified intangible assets, net | 163,224 | 163,457 | 163,758 | 164,072 | 164,385 | ||||||||||||||
Average tangible stockholders’ equity | $ | 793,983 | $ | 783,025 | $ | 773,536 | $ | 770,560 | $ | 761,854 | |||||||||
Return on average tangible stockholders’ equity (annualized) | 15.92 | % | 13.51 | % | 13.79 | % | 9.70 | % | 10.28 | % | |||||||||
Total stockholders’ equity | $ | 972,252 | $ | 945,399 | $ | 941,778 | $ | 935,558 | $ | 926,413 | |||||||||
Less: | |||||||||||||||||||
Goodwill | 160,427 | 160,427 | 160,427 | 160,427 | 160,427 | ||||||||||||||
Identified intangible assets, net | 2,692 | 2,920 | 3,152 | 3,464 | 3,775 | ||||||||||||||
Tangible stockholders' equity | $ | 809,133 | $ | 782,052 | $ | 778,199 | $ | 771,667 | $ | 762,211 | |||||||||
Total assets | $ | 8,461,964 | $ | 8,559,810 | $ | 8,942,424 | $ | 9,000,192 | $ | 9,069,667 | |||||||||
Less: | |||||||||||||||||||
Goodwill | 160,427 | 160,427 | 160,427 | 160,427 | 160,427 | ||||||||||||||
Identified intangible assets, net | 2,692 | 2,920 | 3,152 | 3,464 | 3,775 | ||||||||||||||
Tangible assets | $ | 8,298,845 | $ | 8,396,463 | $ | 8,778,845 | $ | 8,836,301 | $ | 8,905,465 | |||||||||
Tangible stockholders’ equity to tangible assets | 9.75 | % | 9.31 | % | 8.86 | % | 8.73 | % | 8.56 | % | |||||||||
Tangible stockholders' equity | $ | 809,133 | $ | 782,052 | $ | 778,199 | $ | 771,667 | $ | 762,211 | |||||||||
Number of common shares issued | 85,177,172 | 85,177,172 | 85,177,172 | 85,177,172 | 85,177,172 | ||||||||||||||
Less: | |||||||||||||||||||
Treasury shares | 6,536,478 | 6,534,602 | 6,525,783 | 5,629,854 | 5,859,708 | ||||||||||||||
Unallocated ESOP shares | 37,890 | 44,502 | 51,114 | 58,227 | 65,334 | ||||||||||||||
Unvested restricted shares | 448,105 | 449,981 | 458,800 | 487,318 | 398,188 | ||||||||||||||
Number of common shares outstanding | 78,154,699 | 78,148,087 | 78,141,475 | 79,001,773 | 78,853,942 | ||||||||||||||
Tangible book value per common share | $ | 10.35 | $ | 10.01 | $ | 9.96 | $ | 9.77 | $ | 9.67 | |||||||||
Allowance for loan and lease losses | $ | 106,474 | $ | 109,837 | $ | 114,379 | $ | 119,971 | $ | 119,553 | |||||||||
Total loans and leases | $ | 7,020,275 | $ | 7,267,552 | $ | 7,269,553 | $ | 7,396,358 | $ | 7,407,697 | |||||||||
Less: | |||||||||||||||||||
Total PPP loans | 348,411 | 604,790 | 489,216 | 568,383 | 565,768 | ||||||||||||||
Total loans and leases excluding PPP loans | $ | 6,671,864 | $ | 6,662,762 | $ | 6,780,337 | $ | 6,827,975 | $ | 6,841,929 | |||||||||
Allowance for loan and lease losses as a percentage of total loans and leases less PPP loans | 1.60 | % | 1.65 | % | 1.69 | % | 1.76 | % | 1.75 | % | |||||||||
PDF available: http://ml.globenewswire.com/Resource/Download/3f779060-7808-4880-a3fd-8d7f736854e2
Exhibit 99.2
Q2 2021 FINANCIAL RESULTS July 29, 2021 1
F O R W A R D L OO K I N G S T A T E M E N T S 2 Certain statements in this presentation that are not historical facts may constitute forward - looking statements within the meaning of Section 27A of the Securities Act of 1933, as amended, and Section 21E of the Securities Exchange Act of 1934, as amended, and are intended to be covered by the safe harbor provisions of the Private Securities Litigation Reform Act of 1995. Statements contained in this presentation that do not describe historical or current facts are forward - looking statements, including statements regard the potential effects of the COVID - 19 pandemic on the Company’s business, credit quality, financial condition, liquidity and results of operations. Forward - looking statements made with regard to the potential effects of COVID - 19 on the Company’s business, credit quality, financial condition, liquidity and results of operation may differ, possibly materially, from what is included in this presentation due to factors and future developments that are uncertain and beyond the scope of the Company’s control. These included, but are not limited to the length and extent of the economic contraction as a result of the COVID - 19 pandemic; continued deterioration in employment levels, general business and economic conditions on a national basis and in the local markets in which the Company and its banking subsidiaries operate; changes in consumer behavior due to changing political, business and economic conditions or legislative or regulatory initiatives; the possibility that future credit losses may be higher than currently expected; reputational risk relating to the Company’s participation in the Paycheck Protection Program and other pandemic - related legislative and regulatory initiatives and programs; and turbulence in capital and debt markets. Forward - looking statements involve risks and uncertainties which are difficult to predict. Forward - looking statements involve risks and uncertainties. These statements include, among others, statements regarding our strategy, evaluations of future interest rate trends and liquidity, expectations as to growth in assets, deposits and results of operations, success of acquisitions, future operations, market position, financial position, and prospects, plans and objectives of management. You should not place undue reliance on the Company’s forward - looking statements. You should exercise caution in interpreting and relying on forward - looking statements because they are subject to significant risks, uncertainties and other factors which are, in some cases, beyond the Company’s control. Forward - looking statements are based on the current assumptions and beliefs of management and are only expectations of future results. The Company’s actual results could differ materially from those projected in the forward - looking statements as a result of, among other factors, changes in interest rates; competitive pressures from other financial institutions; the effects of continued weakness in general economic conditions and the impact of the COVID - 19 pandemic on a national basis or in the local markets in which the Company operates, including changes that adversely affect borrowers’ ability to service and repay our loans; changes in the value of securities in the Company’s investment portfolio, changes in loan default and charge - off rates, the adequacy of loan loss reserves, decreases in deposit levels necessitating increased borrowing to fund loans and investments; changes in government regulation, as well as the other risks and uncertainties detailed in the Company’s Annual Report on Form 10 - K, as updated by the Company’s Quarterly Reports on Form 10 - Q and other filings submitted to the Securities and Exchange Commission. Forward looking statements speak only as of the date on which they are made. The Company does not undertake any obligation to update any forward - looking statement to reflect circumstances or events that occur after the date the forward - looking statements are made.
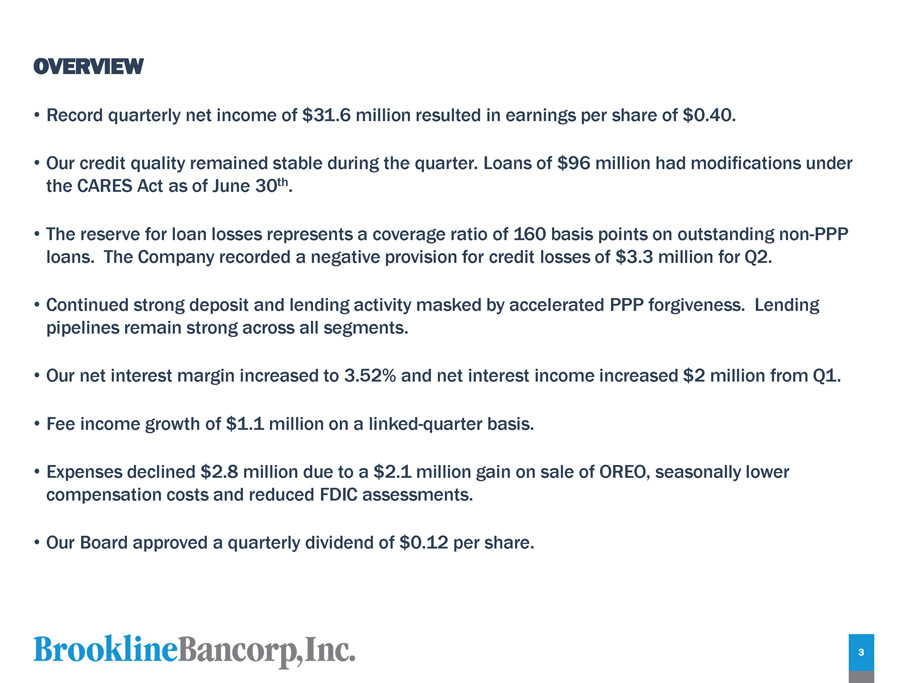
OVERVIEW 3 • Record quarterly net income of $31.6 million resulted in earnings per share of $0.40. • Our credit quality remained stable during the quarter. Loans of $96 million had modifications under the CARES Act as of June 30 th . • The reserve for loan losses represents a coverage ratio of 160 basis points on outstanding non - PPP loans. The Company recorded a negative provision for credit losses of $3.3 million for Q2. • Continued strong deposit and lending activity masked by accelerated PPP forgiveness. Lending pipelines remain strong across all segments. • Our net interest margin increased to 3.52% and net interest income increased $2 million from Q1. • Fee income growth of $1.1 million on a linked - quarter basis. • Expenses declined $2.8 million due to a $2.1 million gain on sale of OREO, seasonally lower compensation costs and reduced FDIC assessments. • Our Board approved a quarterly dividend of $0.12 per share.
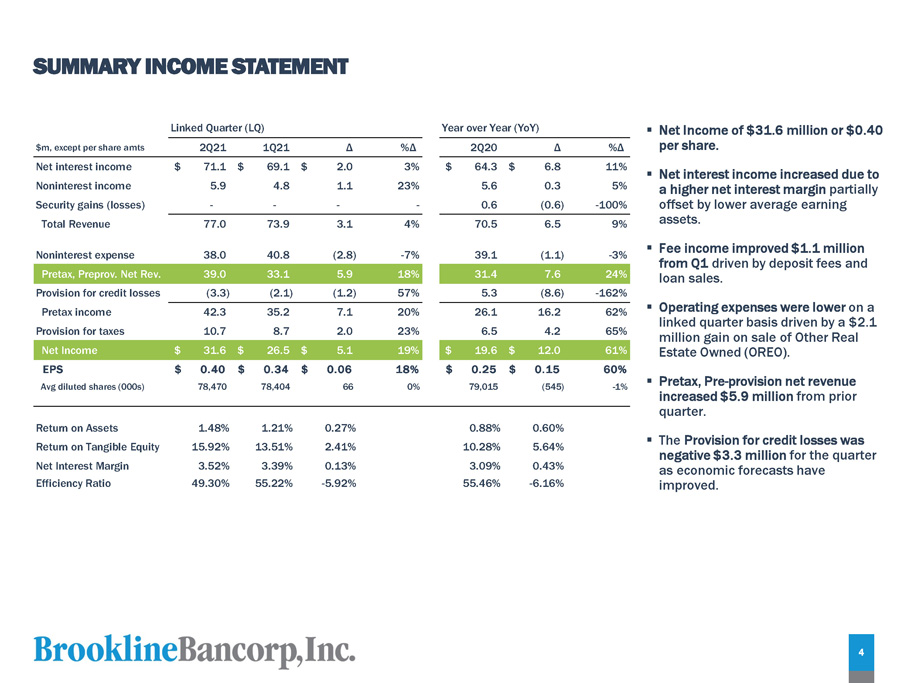
S U MM A R Y I N C O M E S T A T E M E N T ▪ Net Income of $31.6 million or $0.40 per share. ▪ Net interest income increased due to a higher net interest margin partially offset by lower average earning assets. ▪ Fee income improved $ 1 . 1 million from Q 1 driven by deposit fees and loan sales . ▪ Operating expenses were lower on a linked quarter basis driven by a $2.1 million gain on sale of Other Real Estate Owned (OREO). ▪ Pretax, Pre - provision net revenue increased $ 5 . 9 million from prior quarter . ▪ The Provision for credit losses was negative $3.3 million for the quarter as economic forecasts have improved. $m, except per share amts 2Q21 1Q21 Δ %Δ 2Q20 Δ %Δ Net interest income $ 71.1 $ 69.1 $ 2.0 3% $ 64.3 $ 6.8 11% Noninterest income 5.9 4.8 1.1 23% 5.6 0.3 5% Security gains (losses) - - - - 0.6 (0.6) - 100% Total Revenue 77.0 73.9 3.1 4% 70.5 6.5 9% Noninterest expense 38.0 40.8 (2.8) - 7% 39.1 (1.1) - 3% Pretax, Preprov. Net Rev. 39.0 33.1 5.9 18% 31.4 7.6 24% Provision for credit losses (3.3) (2.1) (1.2) 57% 5.3 (8.6) - 162% Pretax income 42.3 35.2 7.1 20% 26.1 16.2 62% Provision for taxes 10.7 8.7 2.0 23% 6.5 4.2 65% Net Income $ 31.6 $ 26.5 $ 5.1 19% $ 19.6 $ 12.0 61% EPS $ 0.40 $ 0.34 $ 0.06 18% $ 0.25 $ 0.15 60% Avg diluted shares (000s) 78,470 78,404 66 0% 79,015 (545) - 1% Return on Assets 1.48% 1.21% 0.27% 0.88% 0.60% Return on Tangible Equity 15.92% 13.51% 2.41% 10.28% 5.64% Net Interest Margin 3.52% 3.39% 0.13% 3.09% 0.43% Efficiency Ratio 49.30% 55.22% - 5.92% 55.46% - 6.16% Linked Quarter (LQ) Year over Year (YoY) 4
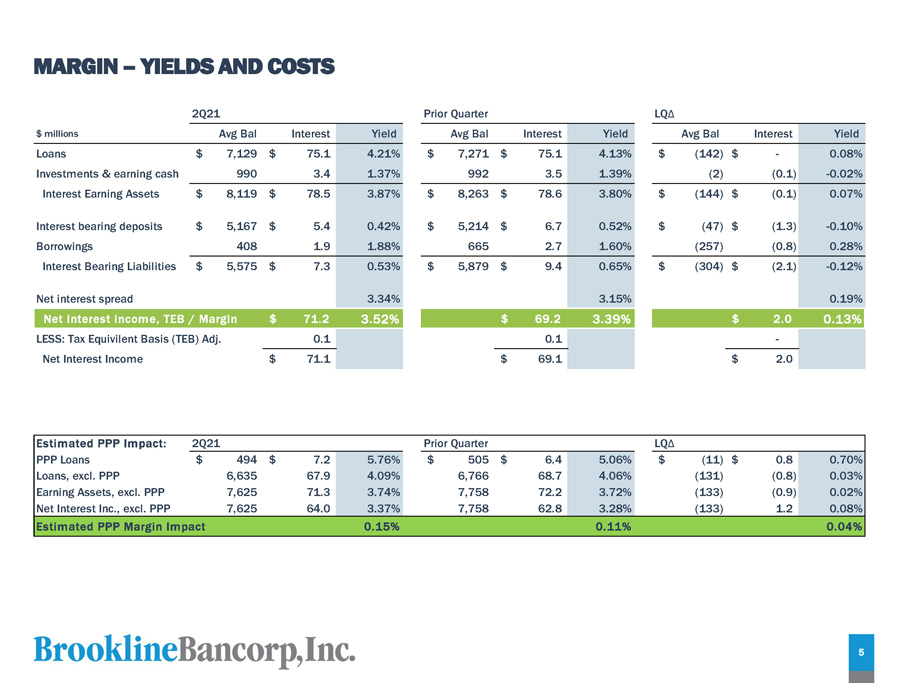
M A R G I N – Y I E L D S AN D C O S T S Estimated PPP Impact: 2Q21 Prior Quarter LQ Δ PPP Loans $ 494 $ 7.2 5.76% $ 505 $ 6.4 5.06% $ (11) $ 0.8 0.70% Loans, excl. PPP 6,635 67.9 4.09% 6,766 68.7 4.06% (131) (0.8) 0.03% Earning Assets, excl. PPP 7,625 71.3 3.74% 7,758 72.2 3.72% (133) (0.9) 0.02% Net Interest Inc., excl. PPP 7,625 64.0 3.37% 7,758 62.8 3.28% (133) 1.2 0.08% Estimated PPP Margin Impact 0.15% 0.11% 0.04% 2Q21 Prior Quarter L Q Δ $ milli o n s Avg Bal Interest Yield Avg Bal Interest Yield Avg Bal Interest Yield Loans $ 7,129 $ 75.1 4.21% $ 7,271 $ 75.1 4.13% $ (142) $ - 0.08% Investments & earning cash 990 3.4 1.37% 992 3.5 1.39% (2) (0.1) - 0.02% Interest Earning Assets $ 8,119 $ 78.5 3.87% $ 8,263 $ 78.6 3.80% $ (144) $ (0.1) 0.07% Interest bearing deposits $ 5,167 $ 5.4 0.42% $ 5,214 $ 6.7 0.52% $ (47) $ (1.3) - 0.10% Borrowings 408 1.9 1.88% 665 2.7 1.60% (257) (0.8) 0.28% Interest Bearing Liabilities $ 5,575 $ 7.3 0.53% $ 5,879 $ 9.4 0.65% $ (304) $ (2.1) - 0.12% Net interest spread 3.34% 3.15% 0.19% Net interest income, TEB / Margin $ 71.2 3.52% $ 69.2 3.39% $ 2.0 0.13% LESS: Tax Equivilent Basis (TEB) Adj. 0.1 0.1 - Net Interest Income $ 71.1 $ 69.1 $ 2.0 5
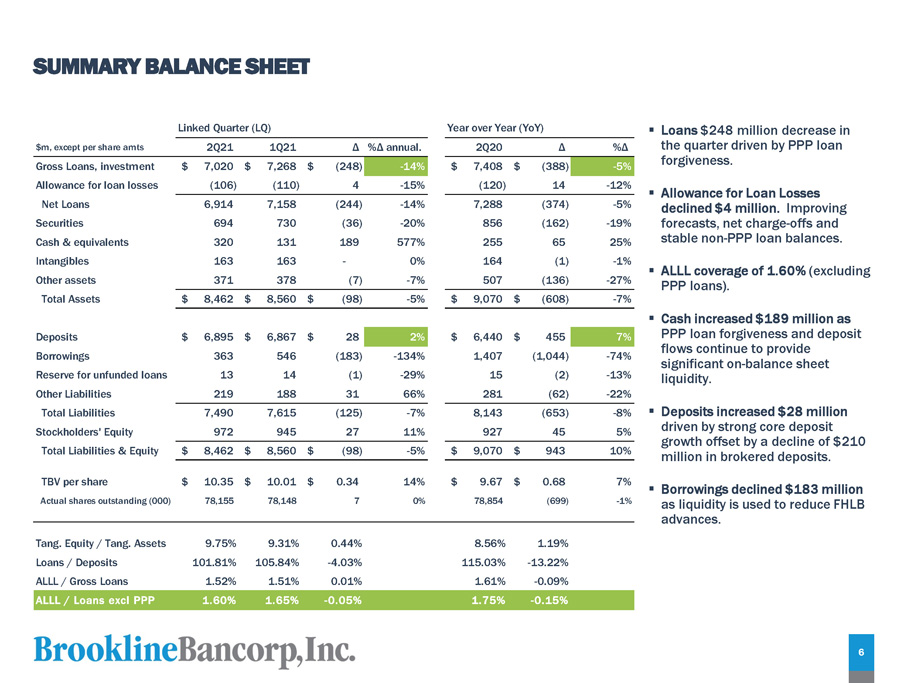
S U MM A R Y B ALAN C E SH EE T ▪ Loans $248 million decrease in the quarter driven by PPP loan forgiveness. ▪ Allowance for Loan Losses declined $4 million. Improving forecasts, net charge - offs and stable non - PPP loan balances. ▪ ALLL coverage of 1.60% (excluding PPP loans). ▪ Cash increased $189 million as PPP loan forgiveness and deposit flows continue to provide significant on - balance sheet liquidity. driven by strong core deposit growth offset by a decline of $210 million in brokered deposits. ▪ Borrowings declined $183 million as liquidity is used to reduce FHLB Deposits $ 6,895 $ 6,867 $ 28 2% $ 6,440 $ 455 7% Borrowings 363 546 (183) - 134% 1,407 (1,044) - 74% Reserve for unfunded loans 13 14 (1) - 29% 15 (2) - 13% Other Liabilities 219 188 31 66% 281 (62) - 22% Total Liabilities 7,490 7,615 (125) - 7% 8,143 (653) - 8% ▪ Deposits increased $28 million advances. Tang. Equity / Tang. Assets 9.75% 9.31% 0.44% 8.56% 1.19% Loans / Deposits 101.81% 105.84% - 4.03% 115.03% - 13.22% ALLL / Gross Loans 1.52% 1.51% 0.01% 1.61% - 0.09% ALLL / Loans excl PPP 1.60% 1.65% - 0.05% 1.75% - 0.15% $m, except per share amts Linked Quarter (LQ) 2 Q 2 1 1 Q 21 Δ %Δ annual. 2 Q 20 Δ %Δ Gross Loans, investment $ 7,020 $ 7,268 $ (248) - 14% $ 7,408 Allowance for loan losses (106) (110) Net Loans 6,914 7,158 Securities 694 730 Cash & equivalents 320 131 Intangibles 163 163 Other assets 371 378 Total Assets $ 8,462 $ 8,560 Stockholders' Equity 972 945 27 11% 927 45 5% Total Liabilities & Equity $ 8,462 $ 8,560 $ (98) - 5% $ 9,070 $ 943 10% TBV per share $ 10.35 $ 10.01 $ 0.34 14% $ 9.67 $ 0.68 7% Actual shares outstanding (000) 78,155 78,148 7 0% 78,854 (699) - 1% Year over Year (YoY) 6
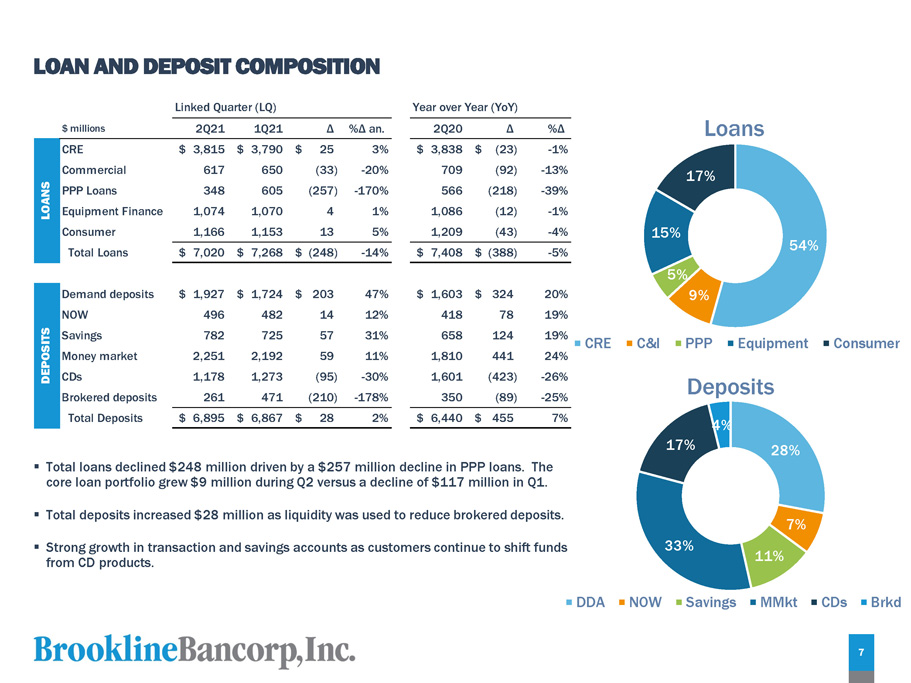
L O A N AN D D EP O SI T C O M P O SI T I O N 54% 5% 9% 15% 17% L oans Demand deposits $ 1,927 $ 1,724 $ 203 47% $ 1,603 $ 324 20% NOW 496 482 14 12% 418 78 19% IT S Savings 782 725 57 31% 658 124 19% P O S Money market 2,251 2,192 59 11% 1,810 441 24% D E CDs 1,178 1,273 (95) - 30% 1,601 (423) - 26% Brokered deposits 261 471 (210) - 178% 350 (89) - 25% Total Deposits $ 6,895 $ 6,867 $ 28 2% $ 6,440 $ 455 7% Co ns u m e r 28% 7% 11% 33% 17% CRE C&I PPP Equipment Deposits 4% D D A N O W Sa v i n g s MMk t C D s B rkd $ milli o n s 2Q21 1Q21 Δ %Δ an. 2 Q 2 0 Δ %Δ $ 3,815 617 348 1,074 1,166 $ 3,790 650 605 1,070 1,153 $ 2 5 3% (33) - 20% (257) - 170% 4 1% 13 5% CRE Co mm e r c i a l PPP Loans Equipment Finance Consumer Total Loans $ 3,838 709 566 1,086 1,209 $ ( 23 ) - 1% (92) - 13% (218) - 39% (12) - 1% (43) - 4% $ 7,020 $ 7,268 $ (248) - 14% $ 7,408 $ (388) - 5% Linked Quarter (LQ) Year over Year (YoY) LOANS ▪ Total loans declined $248 million driven by a $257 million decline in PPP loans. The core loan portfolio grew $9 million during Q2 versus a decline of $117 million in Q1. 7 ▪ Total deposits increased $28 million as liquidity was used to reduce brokered deposits. ▪ Strong growth in transaction and savings accounts as customers continue to shift funds from CD products.
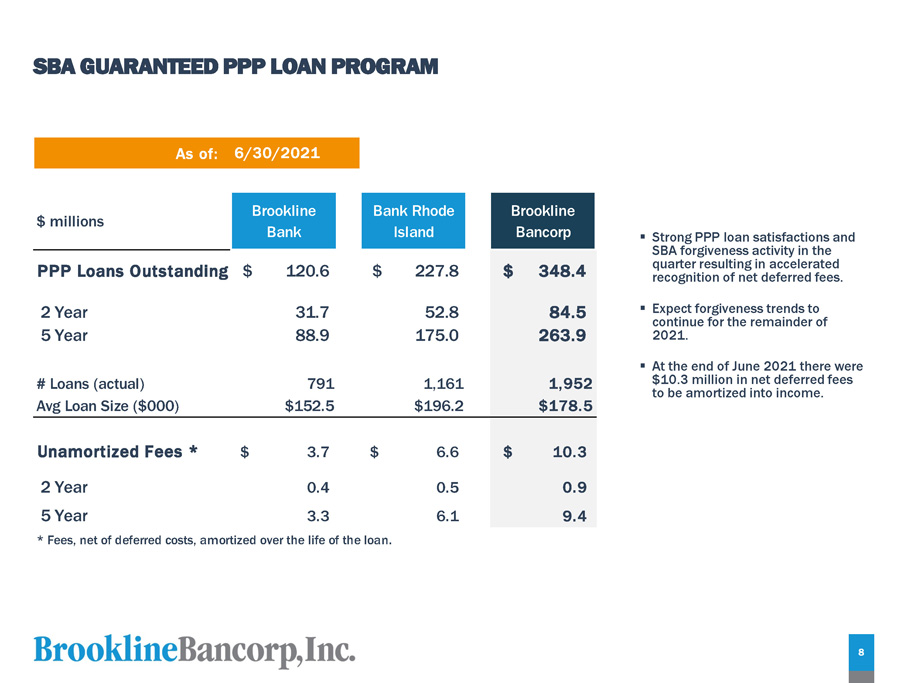
S B A G U A R A N TEE D PP P L O A N P R OG RA M ▪ Strong PPP loan satisfactions and SBA forgiveness activity in the quarter resulting in accelerated recognition of net deferred fees. ▪ Expect forgiveness trends to continue for the remainder of 2021. ▪ At the end of June 2021 there were $10.3 million in net deferred fees to be amortized into income. As of: 6/30/2021 * Fees, net of deferred costs, amortized over the life of the loan. $ millions B r oo k li n e Bank Bank Rhode Island B r oo k li n e Bancorp PPP Loans Outstanding $ 120.6 $ 227.8 $ 348.4 2 Year 31.7 52.8 84.5 5 Year 88.9 175.0 263.9 # Loans (actual) 791 1,161 1,952 Avg Loan Size ($000) $152.5 $196.2 $178.5 Unamortized Fees * $ 3.7 $ 6.6 $ 10.3 2 Year 0.4 0.5 0.9 5 Year 3.3 6.1 9.4 8
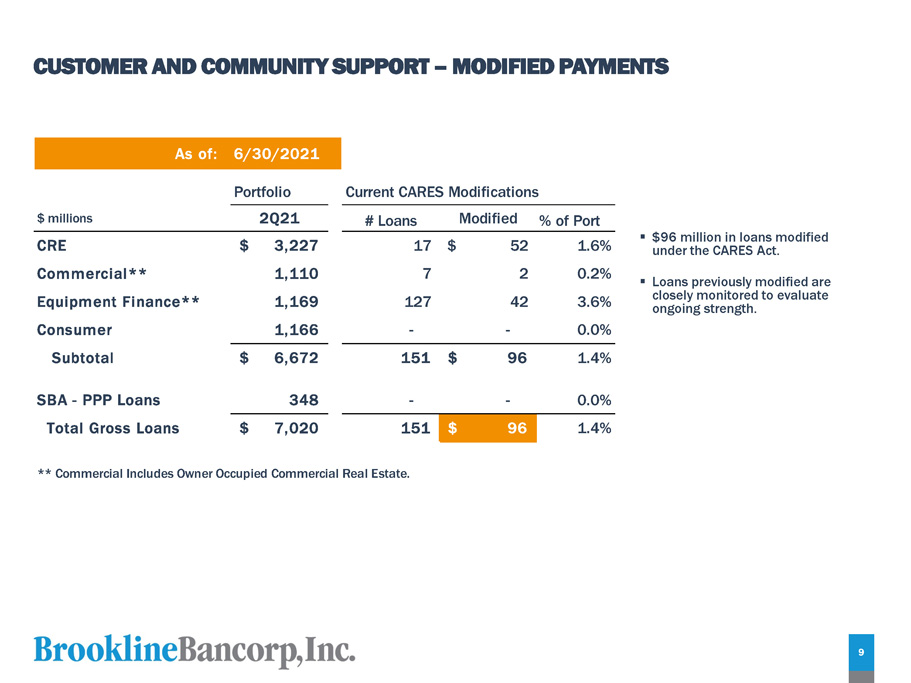
CUSTOMER AND COMMUNITY SUPPORT – MODIFIED PAYMENTS As of: 6/30/2021 Portfolio Current CARES Modifications $ millions 2Q21 # Loans Modified % of Port CRE $ 3,227 17 $ 52 1.6% Commercial** 1,110 7 2 0.2% Equipment Finance** 1,169 127 42 3.6% Consumer 1,166 - - 0.0% Subtotal $ 6,672 151 $ 96 1.4% - 0 . 0% 9 6 1 . 4% SBA - PPP Loans 348 - T o t a l Gr o s s L o an s $ 7 , 02 0 15 1 $ ** Commercial Includes Owner Occupied Commercial Real Estate. ▪ $ 96 million in loans modified under the CARES Act . ▪ Loans previously modified are closely monitored to evaluate ongoing strength . 9
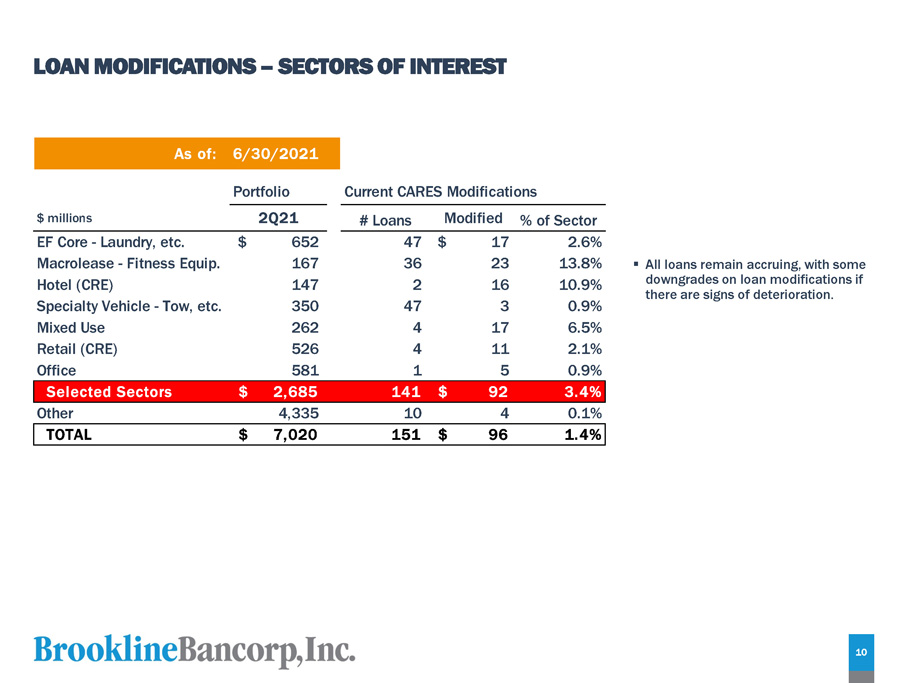
LOAN MODIFICATIONS – SECTORS OF INTEREST $ millions 2Q21 # Loans Modified % of Sector EF Core - Laundry, etc. $ 652 47 $ 17 2.6% Macrolease - Fitness Equip. 167 36 23 13.8% Hotel (CRE) 147 2 16 10.9% Specialty Vehicle - Tow, etc. 350 47 3 0.9% Mixed Use 262 4 17 6.5% Retail (CRE) 526 4 11 2.1% Office 581 1 5 0.9% Selected Sectors $ 2,685 141 $ 92 3.4% Other 4,335 10 4 0.1% TOTAL $ 7,020 151 $ 96 1.4% As of: 6/30/2021 Portfolio Current CARES Modifications ▪ All loans remain accruing, with some downgrades on loan modifications if there are signs of deterioration . 10
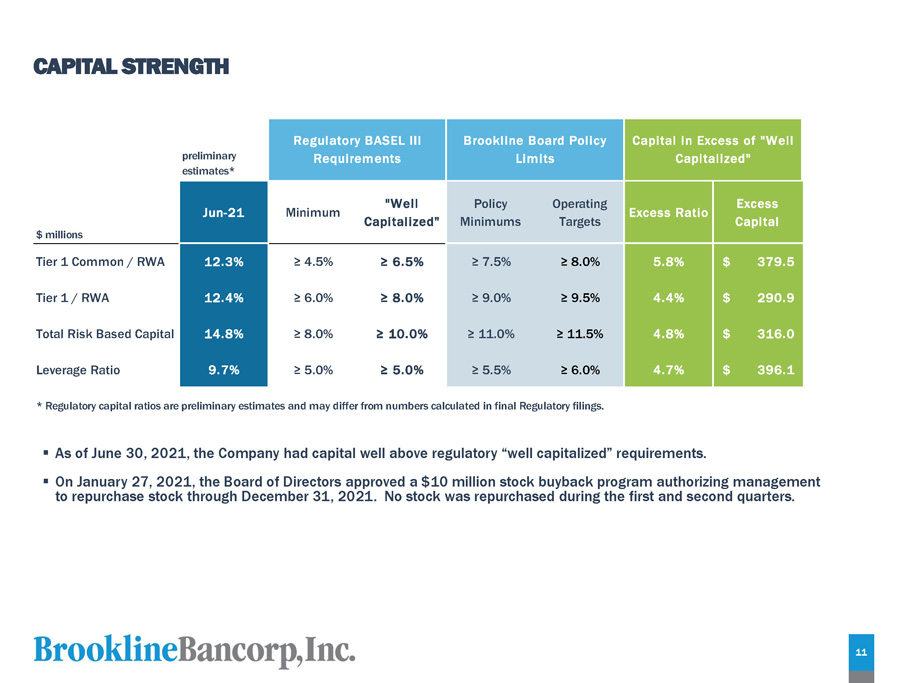
C A P I T A L S T RE N GTH 11 * Regulatory capital ratios are preliminary estimates and may differ from numbers calculated in final Regulatory filings. ▪ As of June 30, 2021, the Company had capital well above regulatory “well capitalized” requirements. ▪ On January 27, 2021, the Board of Directors approved a $10 million stock buyback program authorizing management to repurchase stock through December 31, 2021. No stock was repurchased during the first and second quarters. p r e limi na r y e s t im a t e s * Regulatory BASEL III Requirements Brookline Board Policy Limits Capital in Excess of "Well Capitalized" $ milli o n s Jun - 21 Minimum "Well C ap i t a li ze d " Policy M i n i m u m s Op e r a t i n g Targets Excess Ratio E x c e ss C ap i t al Tier 1 Common / RWA 12.3% ≥ 4.5% ≥ 6.5% ≥ 7.5% ≥ 8.0% 5.8% $ 379.5 Tier 1 / RWA 12.4% ≥ 6.0% ≥ 8.0% ≥ 9.0% ≥ 9.5% 4.4% $ 290.9 Total Risk Based Capital 14.8% ≥ 8.0% ≥ 10.0% ≥ 11.0% ≥ 11.5% 4.8% $ 316.0 Leverage Ratio 9.7% ≥ 5.0% ≥ 5.0% ≥ 5.5% ≥ 6.0% 4.7% $ 396.1
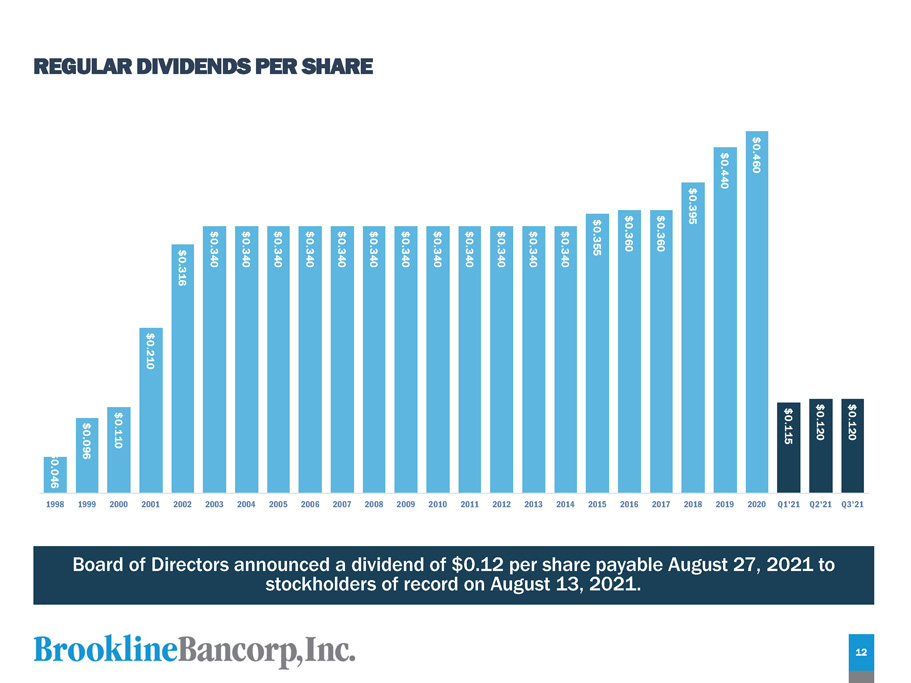
RE G U LA R D I V I D E N D S PE R SH A RE Board of Directors announced a dividend of $0.12 per share payable August 27, 2021 to stockholders of record on August 13, 2021. $0 . 0 4 6 12 $0 . 0 9 6 $0 . 1 1 0 $0 . 2 1 0 $0 . 3 1 6 $0 . 3 4 0 $0 . 3 4 0 $0 . 3 4 0 $0 . 3 4 0 $0 . 3 4 0 $0 . 3 4 0 $0 . 3 4 0 $0 . 3 4 0 $0 . 3 4 0 $0 . 3 4 0 $0 . 3 4 0 $0 . 3 4 0 $0 . 3 5 5 $0 . 3 6 0 $0 . 3 6 0 $0 . 3 9 5 $0 . 4 4 0 $0 . 4 6 0 $0 . 1 1 5 $0 . 1 2 0 $0 . 1 2 0 1998 1999 2000 2001 2002 2003 2004 2005 2006 2007 2008 2009 2010 2011 2012 2013 2014 2015 2016 2017 2018 2019 2020 Q1'21 Q2'21 Q3'21
QUESTIONS Paul A. Perrault, Chairman and Chief Executive Officer Carl M. Carlson, Chief Financial Officer M. Robert Rose, Chief Credit Officer 13 13
APPENDIX 13 14
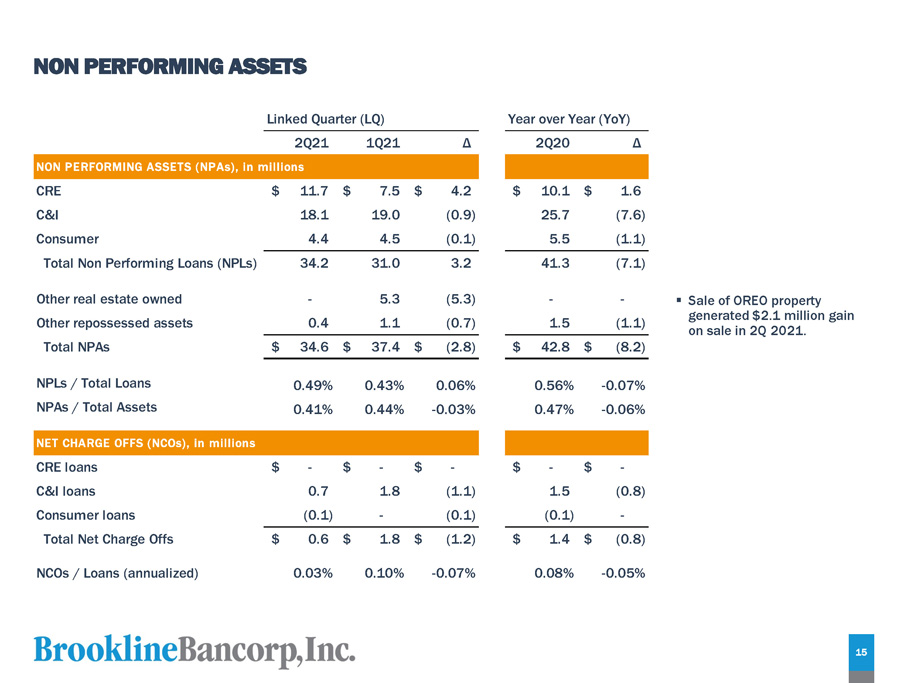
NO N PER F O R M IN G A SS E T S NON PERFORMING ASSETS (NPAs), in millions CRE $ 11.7 $ 7.5 $ 4.2 $ 10.1 $ 1.6 C&I 18.1 19.0 (0.9) 25.7 (7.6) Consumer 4.4 4.5 (0.1) 5.5 (1.1) Total Non Performing Loans (NPLs) 34.2 31.0 3.2 41.3 (7.1) Other real estate owned - 5.3 (5.3) - - ▪ Other repossessed assets 0.4 1.1 (0.7) 1.5 (1.1) Total NPAs $ 34.6 $ 37.4 $ (2.8) $ 42.8 $ (8.2) NPLs / Total Loans 0.49% 0.43% 0.06% 0.56% - 0.07% NPAs / Total Assets 0.41% 0.44% - 0.03% 0.47% - 0.06% NET CHARGE OFFS (NCOs), in millions CRE loans $ - $ - $ - $ - $ - C&I loans 0.7 1.8 (1.1) 1.5 (0.8) Consumer loans (0.1) - (0.1) (0.1) - Total Net Charge Offs $ 0.6 $ 1.8 $ (1.2) $ 1.4 $ (0.8) NCOs / Loans (annualized) 0.03% 0.10% - 0.07% 0.08% - 0.05% Linked Quarter (LQ) 2 Q 2 1 1 Q 21 Year over Year (YoY) Δ 2 Q 20 Δ Sale of OREO property generated $2.1 million gain on sale in 2Q 2021. 15
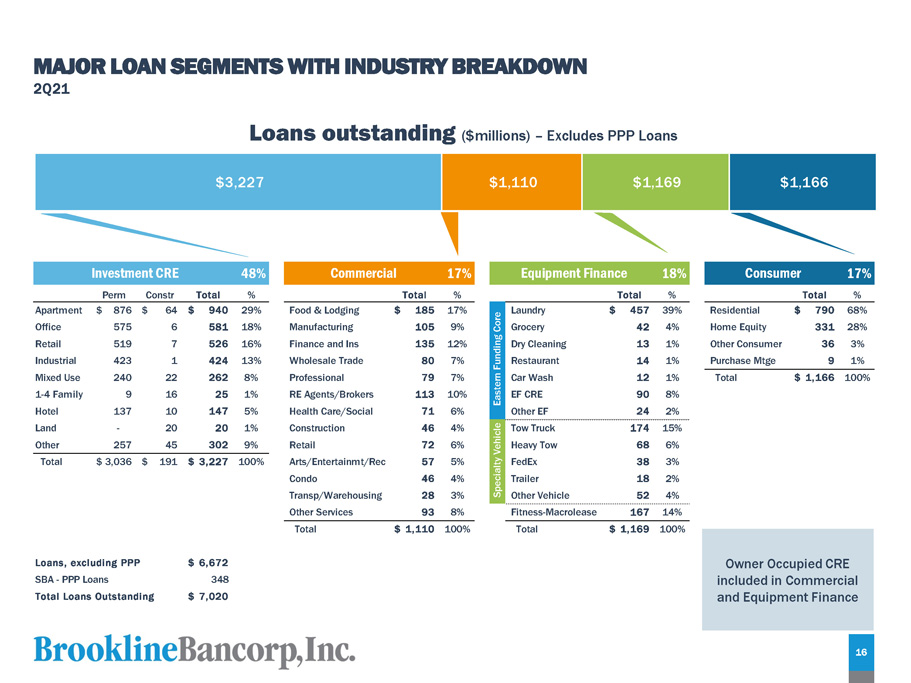
M A J O R L O A N S E G M E N T S WI T H I ND U S T R Y BRE A K D O W N 2Q21 $3,227 $1,110 $1,169 $1,166 Loans outstanding ($millions) – Excludes PPP Loans Investment CRE 48% Commercial 17% Equipment Finance 18% Consumer 17% P e r m Co n s t r T o t a l % T o t a l % T o t a l % T o t a l % Food & Lodging Manufacturing Finance and Ins W h o l e s a l e T ra d e Professional RE Agents/Brokers Health Care/Social Construction Retail Ar t s / E n t e r t a i n m t /R ec Condo Transp/Warehousing Other Services $ 18 5 17% 105 9% 135 12% 80 7% 79 7% 113 10% 71 6% 46 4% 72 6% 57 5% 46 4% 28 3% 93 8% Residential Home Equity Ot h er Co n s u m er Purchase Mtge $ 79 0 68% 331 28% 36 3% 9 1% Total $ 1,166 100% - Apar t m e n t Office Retail Industrial Mixed Use 1 - 4 F a m il y Hotel Land Ot h er 257 $ 87 6 $ 6 4 $ 94 0 29% 575 6 581 18% 519 7 526 16% 423 1 424 13% 240 22 262 8% 9 16 25 1% 137 10 147 5% 20 20 1% 45 302 9% Total $ 3,036 $ 191 $ 3,227 100% Fitness - Macrolease 16 7 14% Eastern Funding Core Laundry $ 457 39% Grocery 42 4% Dry Cleaning 13 1% Restaurant 14 1% Car Wash 12 1% EF CRE 90 8% Other EF 24 2% Specialty Vehicle Tow Truck 174 15% Heavy Tow 68 6% FedEx 38 3% Trailer 18 2% Other Vehicle 52 4% Total $ 1,110 100% Total $ 1,169 100% Loans, excluding PPP SBA - PPP Loans Total Loans Outstanding $ 6,672 348 $ 7,020 Owner Occupied CRE included in Commercial and Equipment Finance 16
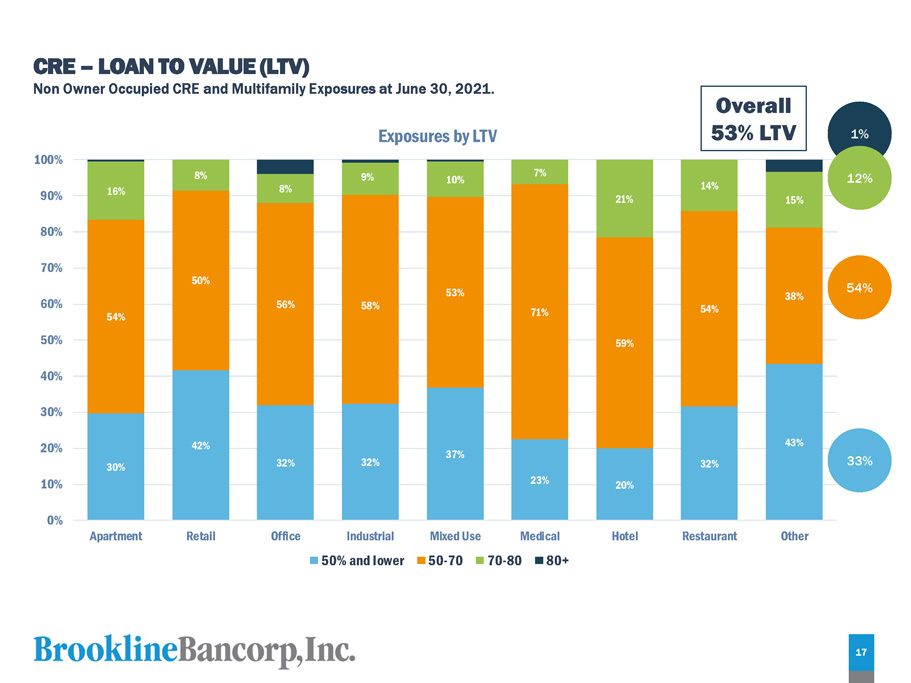
C R E – L O A N T O V A L U E ( L T V) Non Owner Occupied CRE and Multifamily Exposures at June 30, 2021. 30% 42% 32% 32% 37% 23% 20% 32% 43% 54% 50% 56% 58% 53% 7 1 % 59% 54% 38% 16% 8% 8% 9% 10% 7% 21% 14% 15% 0% 1 0 % 2 0 % 3 0 % 4 0 % 5 0 % 6 0 % 7 0 % 8 0 % 9 0 % 1 0 0% A p a rt m e nt R e t a i l O f f i c e Medical H o t e l R e s t au r a n t O t h e r Exposures by LTV Industrial 50% and lower M i x e d U s e 50 - 70 70 - 8 0 80+ 33% 54% 1% 12% 17 Overall 53% LTV
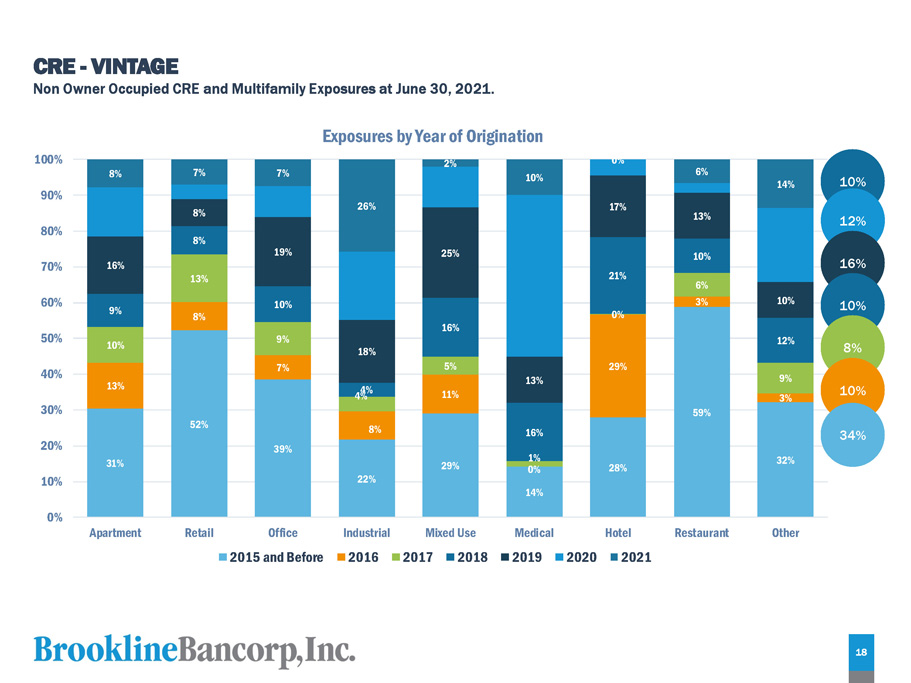
3 1 % 52% 39% 22% 29% 14% 28% 59% 32% 13% 8% 7% 8% 1 1 % 0% 29% 3% 10% 13% 9% 4% 5% 1% 0% 6% 9% 3% 9% 8% 10% 4% 16% 16% 2 1 % 10% 12% 16% 8% 19% 18% 25% 13% 1 7 % 13% 10% 8% 7% 7% 26% 2% 10% 0% 6% 14% 0% 1 0 % 2 0 % 3 0 % 4 0 % 5 0 % 6 0 % 7 0 % 8 0 % 9 0 % 1 0 0% Apartment R e t a i l Office 2015 and Before Restaurant O t h e r Exposures by Year of Origination Industrial Mixed Use Medical Hotel 201 6 201 7 201 8 201 9 202 0 2021 10 % C R E - V I N T A G E Non Owner Occupied CRE and Multifamily Exposures at June 30, 2021. 12 % 16 % 10 % 8 % 10 % 34 % 18
C ON S U M E R L O AN S – L T V / FIC O 2Q21 700+ 88% 19 650 - 699 8% 50% or less 29% 70 % - 80% 28% 80 %+ 4% 50% or less 37% 50% - 50% - N/A 69% 69% 1% 39% 30% 600 - 649 599 - 1% 2% 70 % - 80% 22% 80 % + 11% Resid. 1 - 4 59% LTV Resid. 1 - 4 FICO Home Equity FICO 700+ 93% Home Equity 56% LTV
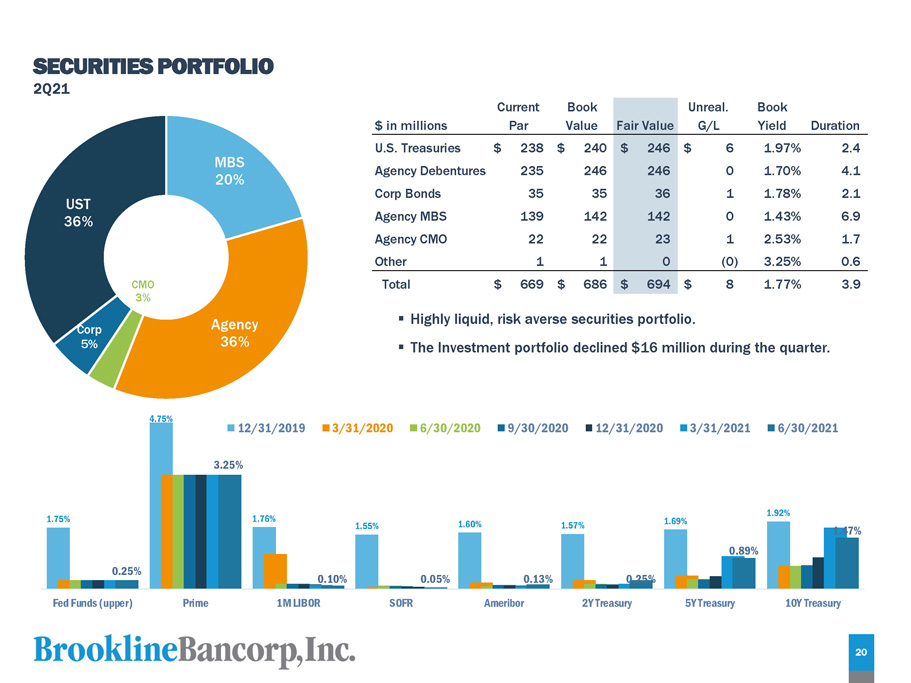
S E C UR I T I E S P O R T F OL I O 2Q21 ▪ Highly liquid, risk averse securities portfolio. ▪ The Investment portfolio declined $16 million during the quarter. 1.75 % 4.75 % 1.76 % 1.55 % 1.60 % 1.57 % 1.69 % 1.92 % 0 . 25 % 3 . 25 % 0 . 10 % 0 . 05 % 0 . 13 % 0 . 25 % 0 . 89 % 1 .4 7% F e d F u nd s ( up p e r ) P r i m e 1 M L I B OR S O F R Ameribor 2 Y T r e a s u r y 5 Y T r e a s u r y 10Y Treasury 12/31/2019 3/31/2020 6/30/2020 9/30/2020 12/31/2020 3/31/2021 6/30/2021 $ in millions Current Par Book Value Fair Value Unreal. G/L Book Yield Duration U.S. Treasuries $ 238 $ 240 $ 246 $ 6 1.97% 2.4 Agency Debentures 235 246 246 0 1.70% 4.1 Corp Bonds 35 35 36 1 1.78% 2.1 Agency MBS 139 142 142 0 1.43% 6.9 Agency CMO 22 22 23 1 2.53% 1.7 Other 1 1 0 (0) 3.25% 0.6 Total $ 669 $ 686 $ 694 $ 8 1.77% 3.9 M BS 20% 20 A g e n c y 36% C M O 3% C o r p 5% UST 36%
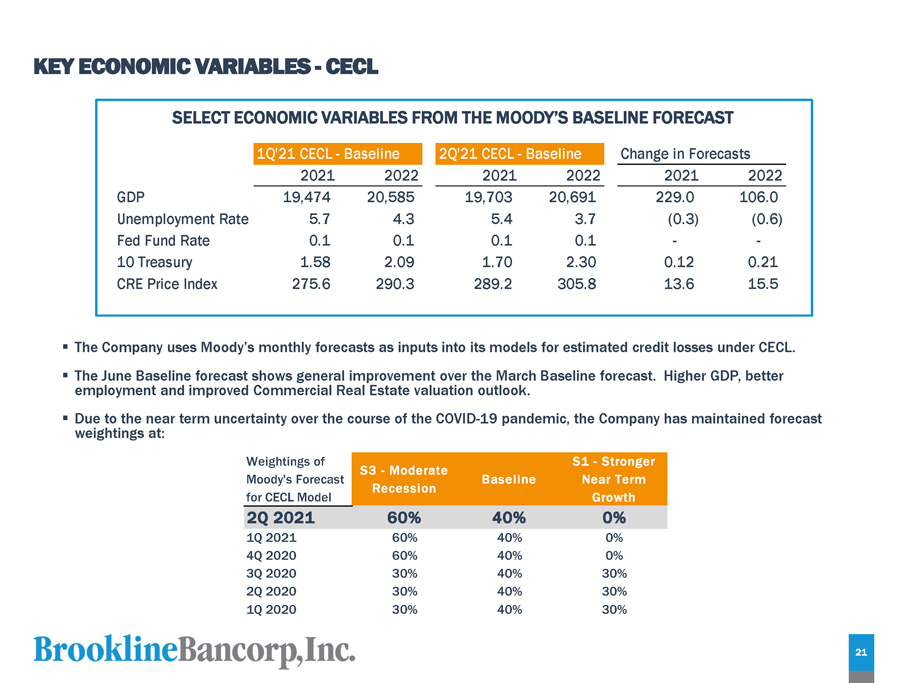
KE Y E C ONO MI C V A R I AB L E S - C E C L SE L ECT E C ONOMIC VARIABLES F 1 Q ' 2 1 C E C L - B a s e li n e ROM THE MOO 2 Q ' 2 1 C E C L - B D Y ’ S B A SE aseline LINE FORECAST Change in Forecasts 2021 2022 2021 2022 2021 2022 GDP 19,474 20,585 19,703 20,691 229.0 106.0 Unemployment Rate 5.7 4.3 5.4 3.7 (0.3) (0.6) Fed Fund Rate 0.1 0.1 0.1 0.1 - - 1 0 T r e a s ury 1.58 2.09 1.70 2.30 0.12 0.21 CRE Price Index 275.6 290.3 289.2 305.8 13.6 15.5 ▪ The Company uses Moody’s monthly forecasts as inputs into its models for estimated credit losses under CECL. ▪ The June Baseline forecast shows general improvement over the March Baseline forecast. Higher GDP, better employment and improved Commercial Real Estate valuation outlook. ▪ Due to the near term uncertainty over the course of the COVID - 19 pandemic, the Company has maintained forecast weightings at: 21 Weightings of Moody's Forecast for CECL Model S3 - Moderate Recession Baseline S1 - Stronger Near Term Growth 2Q 2021 60% 40% 0% 1Q 2021 60% 40% 0% 4Q 2020 60% 40% 0% 3Q 2020 30% 40% 30% 2Q 2020 30% 40% 30% 1Q 2020 30% 40% 30%
VQV$ZEE!K:&NH;AF
MF[(/TG,=D.ZG5G?I;/\ O*9_VHKZJZEEP:'S#'->(TU:=S55LZ358^QYOO\
MTH>"T6':!8'-=LK^@WZ6YJ$14I$]0/P13D]4L^M8S'?86V_9QC-WEK,:"\OI
M]8X;;K7VMS68_P!J]/[7ZF#ZGHT^G_VH59U_UX8U[W4VN>!A%U=;<4M+@X.Z
ML,1]E['-I=0'5_K6^Y^1_,?9JENNZ+BN977ZEP;5ZA9%AT]1PL=[C[G[7-_1
M[_H*UBXS,6D4L D!\@'Z @,"# (4 AT")@(O C@"00)+ E0"
M70)G G$">@*$ HX"F *B JP"M@+! LL"U0+@ NL"]0, PL#%@,A RT#. -#
M T\#6@-F W(#?@.* Y8#H@.N [H#QP/3 ^ #[ /Y! 8$$P0@!"T$.P1(!%4$
M8P1Q!'X$C 2:!*@$M@3$!-,$X03P!/X%#044%]@8&!A8&)P8W!D@&609J!GL&C :=!J\&P ;1!N,&]0<'!QD'
M*P<]!T\'80=T!X8'F0>L![\'T@?E!_@("P@?"#((1@A:"&X(@@B6"*H(O@C2
M".<(^PD0"24).@E/"60)>0F/":0)N@G/">4)^PH1"B<*/0I4"FH*@0J8"JX*
MQ0K<"O,+"PLB"SD+40MI"X +F NP"\@+X0OY#!(,*@Q##%P,=0R.#*<,P S9
M#/,-#0TF#4 -6@UT#8X-J0W##=X-^ X3#BX.20YD#G\.FPZV#M(.[@\)#R4/
M00]>#WH/E@^S#\\/[! )$"800Q!A$'X0FQ"Y$-<0]1$3$3$13Q%M$8P1JA')
M$>@2!Q(F$D429!*$$J,2PQ+C$P,3(Q-#$V,3@Q.D$\43Y10&%"<4211J%(L4
MK13.%/ 5$A4T%585>!6;%;T5X!8#%B86219L%H\6LA;6%OH7'1=!%V47B1>N
M%](7]Q@;&$ 891B*&*\8U1CZ&2 911EK&9$9MQG=&@0:*AI1&G<:GAK%&NP;
M%!L[&V,;BANR&]H< APJ'%(<>QRC',P<]1T>'4<=:AZ4
M'KX>Z1\3'SX?:1^4'[\?ZB 5($$@;""8(,0@\"$<(4@A=2&A( &YXS'DJ>8EYYWI&>J5[!'MC>\)\(7R!?.%]07VA?@%^8G["
M?R-_A'_E@$> J($*@6N!S8(P@I*"](-7@[J$'82 A..%1X6KA@Z& 09O/
M?FWS?K=MHNGF7U4TG2UFJ7O]5GA5WC@C IL*L2!49+%",B>(T!^-F.21'(62
M\ _Z&YUGR9Y/_/Z7\T_)UBOG[\@KW3+&_P!.\N74DFFZR^O!1I;VTMPGJ0"1
MFI() 2@WW^SEWY82,>$[2_1S:_'H2XAN&5^7_P \/S4\J?F#^6WD3\^_*GEC
M11^
US7N]3])[$GX>02YNRU\N)#FTX4
M/$_3;O=N]S?SK$OL4K[3DNL+&VW[VNC;ZN'[7"0:_H.?N;]!S4WVNUTEEUP$
MR2+L-TPV>'RVKU-O^"1!1EV6M=95D;PZ#:ZK#);(],/T>Y^RI_Z7V-_ST/[+
MD.WQ3=4.0&U87$,;M]UC_<[W6>]+[%,F9N1#2;;B 8_GL/WD.Y=#1X^G[$FY
M.2*6D77$V?1>;<(D.:YS;&M?LVN^DUW_ *33VX^0]S0RB]H)
D!\@'Z @,"# (4 AT")@(O C@"00)+ E0"70)G G$">@*$ HX"
MF *B JP"M@+! LL"U0+@ NL"]0, PL#%@,A RT#. -# T\#6@-F W(#?@.*
M Y8#H@.N [H#QP/3 ^ #[ /Y! 8$$P0@!"T$.P1(!%4$8P1Q!'X$C 2:!*@$
MM@3$!-,$X03P!/X%#044%]@8&
M!A8&)P8W!D@&609J!GL&C :=!J\&P ;1!N,&]0<'!QD'*P<]!T\'80=T!X8'
MF0>L![\'T@?E!_@("P@?"#((1@A:"&X(@@B6"*H(O@C2".<(^PD0"24).@E/
M"60)>0F/":0)N@G/">4)^PH1"B<*/0I4"FH*@0J8"JX*Q0K<"O,+"PLB"SD+
M40MI"X +F NP"\@+X0OY#!(,*@Q##%P,=0R.#*<,P S9#/,-#0TF#4 -6@UT
M#8X-J0W##=X-^ X3#BX.20YD#G\.FPZV#M(.[@\)#R4/00]>#WH/E@^S#\\/
M[! )$"800Q!A$'X0FQ"Y$-<0]1$3$3$13Q%M$8P1JA')$>@2!Q(F$D429!*$
M$J,2PQ+C$P,3(Q-#$V,3@Q.D$\43Y10&%"<4211J%(L4K13.%/ 5$A4T%585
M>!6;%;T5X!8#%B86219L%H\6LA;6%OH7'1=!%V47B1>N%](7]Q@;&$ 891B*
M&*\8U1CZ&2 911EK&9$9MQG=&@0:*AI1&G<:GAK%&NP;%!L[&V,;BANR&]H<
M APJ'%(<>QRC',P<]1T>'4<=:AZ4'KX>Z1\3'SX?:1^4
M'[\?ZB 5($$@;""8(,0@\"$<(4@A=2&A( &YX
MS'DJ>8EYYWI&>J5[!'MC>\)\(7R!?.%]07VA?@%^8G["?R-_A'_E@$> J($*
M@6N!S8(P@I*"](-7@[J$'82 A..%1X6KA@Z& _S1_.
M;R)?^1[S1='_ "VU2WL-*\Q,UNT5P)+.WGI/PNI'YS>MZT/"/CZ-.;+)\.#)
MB$8Q-\UAD,I$5R>?^1/^ *G*\?!?J_M9SXOX7@ODWS[^;GYF
M?E!/YPT_\R_*_D>7R7KWF"PU[\Q#H+ZEH^OZ3HLDD2ZK9V[WL)MXW]-F)$DB
MU5N)XTRZ4(0G5$V!M?*^C5&4I1NP*ZI#-O^1'Y *5 O%EKPXDKA.HLFQ8-;
M>Y1AH;'??[4\U#_G&^\?5/-][HWYK:YIMKYZ\LZ+H7F6*^L['5[FZN=!0Q6E
M]-<7T4@D]6-F6XB>-EEY-NNU ,^PL(#=/-.$!?U%C?Y,?\Y=_P#.2'YM?E+^
\QB6^MS-^A[N2>ZTY9;".259+F.3B@8!&((9ACFAQ&)J
MP+7'*@1=/MS_ )]J_F/^8/F[\W?.ND^:O.^O>8M*M/)CW%KI6IZA/=6\4RW]
MI&KI%([(K*C%00-@2.F8>OQQC $ #=R-).1D;/1*/^
_,ORUK^HWNM>3/*\^G-Y
M;N[Z5IFM+JZ6=KFTBDD)8IP2.3A6B$[ <\U_:$(Q((YES-'*1!!Y/U9S7.:[
M%78J[%78J[%78J[%78J[%78J[%78J[%78J[%78J[%78J[%78J[%78J[%78J[
M%78J[%78J[%78J[%78J[%78J[%78J[%78J[%78J[%78J_P#_T/OYBKL5=BKL
M5?//G?\ YQ6_(W\Q?/J?F9YO\G/JGG2.2QE35AJ%] VG<3;'T89TB^#@/V=
M^]
?_+_YB"UMKHH+^QO+V&YFLI;ZW9XG6%4BBHKF59!(8T*ODAI]A9W)
MJD'-N:Y5;.+K_G)ORCH,]CI^J:9KVK6NEZ?Y>E_,#SS9V4":5H6=-B36_+GFOS ^@>5/+'F;SMYHTS2[=
M;*TLO,,7P7DR&[)C"N"7B0NX%>'-49A'\L3R(W) ^"?' &]\@] _/7\X->_*
MF+\LI/+WDN[\YGSUYOL?+]U':F -'#<))(4A]>YMA]8E"$1
]VPSS1_SB'+YI%Q+J/YP:]J&I:WY/N/*/FS7-7L;#5+VYCN)K
MJX:XLI;F,BP)>[962!:&-40<2H?)QU-?PCG?X[T'!?7H]L_+?\H;;\N_,GFK
MS)%KLVJS>:=%\LZ//:R0+$D(\M6UACBTR!M/B=Y%-G,'N.4E%#-\%23
M1.?T2[Y'Y(&+U1[@'L?YF?DU?^=?,NF^=/*?Y@:G^6GFZVT.\\KZCKFFVUO=
MR7&CWTL<\D2+<@B&:.6(/#,NZ$FJMM2K'EX11%CFV3QV;!HL//\ SC#IO^)9
M+H>>M9D\B7OF32O.FM>0KB."PEHW
MMI8D?XI(94=6C5_B9>*MN#D1C$
5_.7F*]\L
M:WI]WY2T+3O-$?ESUM-N[V_T;5+M+."Y@^I7EPB.LC@202LDJ$J"M6&2_*RL
M"^>R/S HGN9%)_SE%H%K8^<(]2\A>:=*\X>5M>T;RY:^0+B*S.I:G>^8D$ND
MK:M'=/;CUXZLWJ2KZ85N=*9'\N=MQ1Z^[FGQAOL;8-Y=_P"F8QQJ.)'!"._>[1VH_\XQ6D]MHC:1^9/F/0M