false2021FYMARRIOTT INTERNATIONAL INC /MD/0001048286http://fasb.org/us-gaap/2021-01-31#AccountingStandardsUpdate201602Memberhttp://fasb.org/us-gaap/2021-01-31#AccountingStandardsUpdate201613Member4 years, 5 months1 year, 5 monthsP3YP5Yhttp://fasb.org/us-gaap/2021-01-31#OtherLiabilitiesCurrenthttp://fasb.org/us-gaap/2021-01-31#OtherLiabilitiesCurrenthttp://fasb.org/us-gaap/2021-01-31#LongTermDebtAndCapitalLeaseObligationsCurrenthttp://fasb.org/us-gaap/2021-01-31#LongTermDebtAndCapitalLeaseObligationsCurrenthttp://fasb.org/us-gaap/2021-01-31#LongTermDebtAndCapitalLeaseObligationshttp://fasb.org/us-gaap/2021-01-31#LongTermDebtAndCapitalLeaseObligationsP3Y00010482862021-01-012021-12-3100010482862021-06-30iso4217:USD00010482862022-02-08xbrli:shares0001048286mar:LoyaltyProgramMember2021-01-012021-12-310001048286mar:LoyaltyProgramMember2021-12-310001048286mar:ReimbursementsMember2021-01-012021-12-310001048286us-gaap:ManagementServiceBaseMember2021-01-012021-12-310001048286us-gaap:ManagementServiceBaseMember2020-01-012020-12-310001048286us-gaap:ManagementServiceBaseMember2019-01-012019-12-310001048286us-gaap:FranchiseMember2021-01-012021-12-310001048286us-gaap:FranchiseMember2020-01-012020-12-310001048286us-gaap:FranchiseMember2019-01-012019-12-310001048286us-gaap:ManagementServiceIncentiveMember2021-01-012021-12-310001048286us-gaap:ManagementServiceIncentiveMember2020-01-012020-12-310001048286us-gaap:ManagementServiceIncentiveMember2019-01-012019-12-310001048286mar:FeeServiceMember2021-01-012021-12-310001048286mar:FeeServiceMember2020-01-012020-12-310001048286mar:FeeServiceMember2019-01-012019-12-310001048286mar:OwnedLeasedandOtherMember2021-01-012021-12-310001048286mar:OwnedLeasedandOtherMember2020-01-012020-12-310001048286mar:OwnedLeasedandOtherMember2019-01-012019-12-310001048286mar:ReimbursementsMember2020-01-012020-12-310001048286mar:ReimbursementsMember2019-01-012019-12-3100010482862020-01-012020-12-3100010482862019-01-012019-12-3100010482862020-10-012020-12-31iso4217:USDxbrli:shares00010482862021-12-3100010482862020-12-310001048286us-gaap:TrademarksAndTradeNamesMember2021-12-310001048286us-gaap:TrademarksAndTradeNamesMember2020-12-310001048286mar:ContractAcquisitionCostsAndOtherMember2021-12-310001048286mar:ContractAcquisitionCostsAndOtherMember2020-12-310001048286mar:LoyaltyProgramMember2020-12-310001048286mar:ContractServicesExcludingLoyaltyProgramMember2021-12-310001048286mar:ContractServicesExcludingLoyaltyProgramMember2020-12-310001048286mar:LoyaltyProgramMember2020-01-012020-12-310001048286mar:LoyaltyProgramMember2019-01-012019-12-3100010482862019-12-3100010482862018-12-310001048286us-gaap:CommonStockMemberus-gaap:CommonClassAMember2018-12-310001048286us-gaap:AdditionalPaidInCapitalMember2018-12-310001048286us-gaap:RetainedEarningsMember2018-12-310001048286us-gaap:TreasuryStockMember2018-12-310001048286us-gaap:AccumulatedOtherComprehensiveIncomeMember2018-12-3100010482862018-01-012018-12-310001048286srt:CumulativeEffectPeriodOfAdoptionAdjustmentMember2018-12-310001048286us-gaap:RetainedEarningsMembersrt:CumulativeEffectPeriodOfAdoptionAdjustmentMember2018-12-310001048286srt:CumulativeEffectPeriodOfAdoptionAdjustmentMemberus-gaap:AccumulatedOtherComprehensiveIncomeMember2018-12-310001048286us-gaap:RetainedEarningsMember2019-01-012019-12-310001048286us-gaap:AccumulatedOtherComprehensiveIncomeMember2019-01-012019-12-310001048286us-gaap:CommonStockMemberus-gaap:CommonClassAMember2019-01-012019-12-310001048286us-gaap:AdditionalPaidInCapitalMember2019-01-012019-12-310001048286us-gaap:TreasuryStockMember2019-01-012019-12-310001048286us-gaap:CommonStockMemberus-gaap:CommonClassAMember2019-12-310001048286us-gaap:AdditionalPaidInCapitalMember2019-12-310001048286us-gaap:RetainedEarningsMember2019-12-310001048286us-gaap:TreasuryStockMember2019-12-310001048286us-gaap:AccumulatedOtherComprehensiveIncomeMember2019-12-310001048286srt:CumulativeEffectPeriodOfAdoptionAdjustmentMember2019-12-310001048286us-gaap:RetainedEarningsMembersrt:CumulativeEffectPeriodOfAdoptionAdjustmentMember2019-12-310001048286us-gaap:RetainedEarningsMember2020-01-012020-12-310001048286us-gaap:AccumulatedOtherComprehensiveIncomeMember2020-01-012020-12-310001048286us-gaap:CommonStockMemberus-gaap:CommonClassAMember2020-01-012020-12-310001048286us-gaap:AdditionalPaidInCapitalMember2020-01-012020-12-310001048286us-gaap:TreasuryStockMember2020-01-012020-12-310001048286us-gaap:CommonStockMemberus-gaap:CommonClassAMember2020-12-310001048286us-gaap:AdditionalPaidInCapitalMember2020-12-310001048286us-gaap:RetainedEarningsMember2020-12-310001048286us-gaap:TreasuryStockMember2020-12-310001048286us-gaap:AccumulatedOtherComprehensiveIncomeMember2020-12-310001048286us-gaap:RetainedEarningsMember2021-01-012021-12-310001048286us-gaap:AccumulatedOtherComprehensiveIncomeMember2021-01-012021-12-310001048286us-gaap:CommonStockMemberus-gaap:CommonClassAMember2021-01-012021-12-310001048286us-gaap:AdditionalPaidInCapitalMember2021-01-012021-12-310001048286us-gaap:TreasuryStockMember2021-01-012021-12-310001048286us-gaap:CommonStockMemberus-gaap:CommonClassAMember2021-12-310001048286us-gaap:AdditionalPaidInCapitalMember2021-12-310001048286us-gaap:RetainedEarningsMember2021-12-310001048286us-gaap:TreasuryStockMember2021-12-310001048286us-gaap:AccumulatedOtherComprehensiveIncomeMember2021-12-310001048286mar:AvendraLLCMemberus-gaap:DisposalGroupDisposedOfBySaleNotDiscontinuedOperationsMember2017-01-012017-12-310001048286mar:AvendraLLCMembermar:ReimbursementsMemberus-gaap:DisposalGroupDisposedOfBySaleNotDiscontinuedOperationsMember2021-01-012021-12-310001048286mar:AvendraLLCMembermar:ReimbursementsMemberus-gaap:DisposalGroupDisposedOfBySaleNotDiscontinuedOperationsMember2020-01-012020-12-310001048286mar:AvendraLLCMembermar:ReimbursementsMemberus-gaap:DisposalGroupDisposedOfBySaleNotDiscontinuedOperationsMember2019-01-012019-12-310001048286mar:ContractServicesExcludingLoyaltyProgramMember2021-01-012021-12-310001048286mar:AccruedExpensesandOtherMember2021-12-310001048286mar:AccruedExpensesandOtherMember2020-12-310001048286mar:CostsIncurredtoFulfillContractsMember2021-12-310001048286mar:CostsIncurredtoFulfillContractsMember2020-12-310001048286us-gaap:ValuationTechniqueDiscountedCashFlowMemberus-gaap:MeasurementInputDiscountRateMember2021-12-31xbrli:pure0001048286us-gaap:OneTimeTerminationBenefitsMember2020-12-310001048286us-gaap:OneTimeTerminationBenefitsMember2021-01-012021-12-310001048286us-gaap:OneTimeTerminationBenefitsMember2021-12-310001048286us-gaap:RestrictedStockUnitsRSUMember2021-01-012021-12-310001048286us-gaap:RestrictedStockUnitsRSUMember2021-12-310001048286us-gaap:RestrictedStockUnitsRSUMember2020-12-310001048286us-gaap:RestrictedStockUnitsRSUMember2020-01-012020-12-310001048286us-gaap:RestrictedStockUnitsRSUMember2019-01-012019-12-310001048286us-gaap:RestrictedStockUnitsRSUMemberus-gaap:ShareBasedCompensationAwardTrancheOneMember2020-01-012020-12-310001048286us-gaap:ShareBasedCompensationAwardTrancheTwoMemberus-gaap:RestrictedStockUnitsRSUMember2020-01-012020-12-310001048286mar:SwissFederalTaxAdministrationInlandRevenueAuthorityofSingaporeandLuxembourgInlandRevenueMember2021-01-012021-12-310001048286mar:SwissFederalTaxAdministrationInlandRevenueAuthorityofSingaporeandLuxembourgInlandRevenueMember2020-01-012020-12-310001048286mar:SwissFederalTaxAdministrationInlandRevenueAuthorityofSingaporeandLuxembourgInlandRevenueMember2019-01-012019-12-310001048286us-gaap:NonUsMemberus-gaap:InternalRevenueServiceIRSMember2021-01-012021-12-310001048286us-gaap:NonUsMemberus-gaap:InternalRevenueServiceIRSMember2020-01-012020-12-310001048286us-gaap:NonUsMember2019-01-012019-12-310001048286srt:MinimumMember2021-01-012021-12-310001048286srt:MaximumMember2021-01-012021-12-310001048286us-gaap:GuaranteeOfIndebtednessOfOthersMember2021-12-310001048286mar:GuaranteeOperatingProfitMember2021-12-310001048286us-gaap:GuaranteeTypeOtherMember2021-12-310001048286us-gaap:OtherCurrentLiabilitiesMember2021-12-310001048286us-gaap:OtherNoncurrentLiabilitiesMember2021-12-310001048286mar:GuaranteeOperatingProfitMembermar:NotYetInEffectConditionMember2021-12-310001048286mar:NotYetInEffectConditionMemberus-gaap:GuaranteeTypeOtherMember2021-12-310001048286mar:BuildingandLandLeaseholdMembermar:SheratonGrandChicagoHotelMember2017-12-310001048286mar:SheratonGrandChicagoHotelMemberus-gaap:LandMember2017-12-310001048286mar:SheratonGrandChicagoHotelMember2021-12-310001048286mar:SheratonGrandChicagoHotelMember2020-12-310001048286mar:DataSecurityIncidentMember2021-01-012021-12-310001048286mar:DataSecurityIncidentMember2020-01-012020-12-310001048286mar:DataSecurityIncidentMember2019-01-012019-12-310001048286mar:ClassActionLawsuitsRelatedToDataSecurityIncidentMember2021-12-31mar:lawsuit0001048286mar:ShareholderDerivativeComplaintsRelatedtoDataSecurityIncidentMember2019-02-262019-03-15mar:renewal_option0001048286mar:USAndCanadaLeasedHotelsMember2020-01-012020-12-310001048286mar:USAndCanadaLeasedHotelsMember2019-01-012019-12-310001048286mar:LegacyStarwoodOfficeBuildingMember2019-01-012019-12-310001048286us-gaap:SeniorNotesMembermar:SeriesLSeniorNotesMember2021-12-310001048286mar:SeriesLSeniorNotesMember2021-12-310001048286mar:SeriesLSeniorNotesMember2020-12-310001048286us-gaap:SeniorNotesMembermar:SeriesNSeniorNotesMember2021-12-310001048286mar:SeriesNSeniorNotesMember2021-12-310001048286mar:SeriesNSeniorNotesMember2020-12-310001048286us-gaap:SeniorNotesMembermar:SeriesOSeniorNotesMember2021-12-310001048286mar:SeriesOSeniorNotesMember2021-12-310001048286mar:SeriesOSeniorNotesMember2020-12-310001048286us-gaap:SeniorNotesMembermar:SeriesPSeniorNotesMember2021-12-310001048286mar:SeriesPSeniorNotesMember2021-12-310001048286mar:SeriesPSeniorNotesMember2020-12-310001048286us-gaap:SeniorNotesMembermar:SeriesQNotesMember2021-12-310001048286mar:SeriesQNotesMember2021-12-310001048286mar:SeriesQNotesMember2020-12-310001048286us-gaap:SeniorNotesMembermar:SeriesRNotesMember2021-12-310001048286mar:SeriesRNotesMember2021-12-310001048286mar:SeriesRNotesMember2020-12-310001048286us-gaap:SeniorNotesMembermar:SeriesUNotesMember2021-12-310001048286mar:SeriesUNotesMember2021-12-310001048286mar:SeriesUNotesMember2020-12-310001048286us-gaap:SeniorNotesMembermar:SeriesVNotesMember2021-12-310001048286mar:SeriesVNotesMember2021-12-310001048286mar:SeriesVNotesMember2020-12-310001048286us-gaap:SeniorNotesMembermar:SeriesWNotesMember2021-12-310001048286mar:SeriesWNotesMember2021-12-310001048286mar:SeriesWNotesMember2020-12-310001048286us-gaap:SeniorNotesMembermar:SeriesXNotesMember2021-12-310001048286mar:SeriesXNotesMember2021-12-310001048286mar:SeriesXNotesMember2020-12-310001048286us-gaap:SeniorNotesMembermar:SeriesZNotesMember2021-12-310001048286mar:SeriesZNotesMember2021-12-310001048286mar:SeriesZNotesMember2020-12-310001048286us-gaap:SeniorNotesMembermar:SeriesAANotesMember2021-12-310001048286mar:SeriesAANotesMember2021-12-310001048286mar:SeriesAANotesMember2020-12-310001048286mar:SeriesBBNotesMemberus-gaap:SeniorNotesMember2021-12-310001048286mar:SeriesBBNotesMember2021-12-310001048286mar:SeriesBBNotesMember2020-12-310001048286us-gaap:SeniorNotesMembermar:SeriesCCNotesMember2021-12-310001048286mar:SeriesCCNotesMember2021-12-310001048286mar:SeriesCCNotesMember2020-12-310001048286us-gaap:SeniorNotesMembermar:SeriesDDNotesMember2021-12-310001048286mar:SeriesDDNotesMember2021-12-310001048286mar:SeriesDDNotesMember2020-12-310001048286us-gaap:SeniorNotesMembermar:SeriesEENotesMember2021-12-310001048286mar:SeriesEENotesMember2021-12-310001048286mar:SeriesEENotesMember2020-12-310001048286us-gaap:SeniorNotesMembermar:SeriesFFNotesMember2021-12-310001048286mar:SeriesFFNotesMember2021-12-310001048286mar:SeriesFFNotesMember2020-12-310001048286us-gaap:SeniorNotesMembermar:SeriesGGNotesMember2021-12-310001048286mar:SeriesGGNotesMember2021-12-310001048286mar:SeriesGGNotesMember2020-12-310001048286us-gaap:SeniorNotesMembermar:SeriesHHNotesMember2021-12-310001048286mar:SeriesHHNotesMember2021-12-310001048286mar:SeriesHHNotesMember2020-12-310001048286mar:SeriesIINotesMemberus-gaap:SeniorNotesMember2021-12-310001048286mar:SeriesIINotesMember2021-12-310001048286mar:SeriesIINotesMember2020-12-310001048286us-gaap:SeniorNotesMembermar:SeriesQNotesMemberus-gaap:SubsequentEventMember2022-01-012022-01-310001048286us-gaap:SeniorNotesMembermar:SeriesEENotesMember2021-09-012021-09-300001048286us-gaap:SeniorNotesMembermar:SeriesEENotesMember2021-09-3000010482862021-07-012021-09-300001048286mar:SeriesIINotesMemberus-gaap:SeniorNotesMember2021-09-300001048286mar:SeriesIINotesMemberus-gaap:SeniorNotesMember2021-09-012021-09-300001048286mar:SeriesNSeniorNotesMember2021-08-012021-08-310001048286us-gaap:SeniorNotesMembermar:SeriesHHNotesMember2021-03-310001048286us-gaap:SeniorNotesMembermar:SeriesHHNotesMember2021-03-012021-03-310001048286us-gaap:RevolvingCreditFacilityMember2021-01-012021-12-310001048286us-gaap:RevolvingCreditFacilityMember2021-12-310001048286us-gaap:LineOfCreditMembersrt:MaximumMemberus-gaap:RevolvingCreditFacilityMember2021-01-310001048286us-gaap:LineOfCreditMembersrt:MinimumMemberus-gaap:RevolvingCreditFacilityMember2021-01-310001048286mar:CostsIncurredtoObtainContractsMember2021-12-310001048286mar:CostsIncurredtoObtainContractsMember2020-12-310001048286us-gaap:ContractBasedIntangibleAssetsMember2021-12-310001048286us-gaap:ContractBasedIntangibleAssetsMember2020-12-310001048286us-gaap:TrademarksAndTradeNamesMember2021-12-310001048286us-gaap:TrademarksAndTradeNamesMember2020-12-310001048286us-gaap:ContractBasedIntangibleAssetsMember2021-01-012021-12-310001048286us-gaap:ContractBasedIntangibleAssetsMember2020-01-012020-12-310001048286us-gaap:ContractBasedIntangibleAssetsMember2019-01-012019-12-310001048286mar:ReimbursedExpensesMemberus-gaap:ContractBasedIntangibleAssetsMember2021-01-012021-12-310001048286mar:ReimbursedExpensesMemberus-gaap:ContractBasedIntangibleAssetsMember2020-01-012020-12-310001048286mar:ReimbursedExpensesMemberus-gaap:ContractBasedIntangibleAssetsMember2019-01-012019-12-310001048286mar:USAndCanadaSegmentMember2020-12-310001048286mar:InternationalSegmentMember2020-12-310001048286mar:USAndCanadaSegmentMember2021-01-012021-12-310001048286mar:InternationalSegmentMember2021-01-012021-12-310001048286mar:USAndCanadaSegmentMember2021-12-310001048286mar:InternationalSegmentMember2021-12-310001048286us-gaap:LandMember2021-12-310001048286us-gaap:LandMember2020-12-310001048286mar:BuildingAndLeaseholdImprovementsMember2021-12-310001048286mar:BuildingAndLeaseholdImprovementsMember2020-12-310001048286us-gaap:FurnitureAndFixturesMember2021-12-310001048286us-gaap:FurnitureAndFixturesMember2020-12-310001048286us-gaap:ConstructionInProgressMember2021-12-310001048286us-gaap:ConstructionInProgressMember2020-12-310001048286mar:ReimbursedCostsMember2021-01-012021-12-310001048286mar:ReimbursedCostsMember2020-01-012020-12-310001048286mar:ReimbursedCostsMember2019-01-012019-12-310001048286mar:InternationalOperationsMember2021-12-310001048286mar:InternationalOperationsMember2020-12-310001048286us-gaap:CarryingReportedAmountFairValueDisclosureMember2021-12-310001048286us-gaap:EstimateOfFairValueFairValueDisclosureMember2021-12-310001048286us-gaap:CarryingReportedAmountFairValueDisclosureMember2020-12-310001048286us-gaap:EstimateOfFairValueFairValueDisclosureMember2020-12-310001048286us-gaap:AccumulatedTranslationAdjustmentMember2018-12-310001048286us-gaap:AccumulatedGainLossNetCashFlowHedgeParentMember2018-12-310001048286us-gaap:AccumulatedTranslationAdjustmentMember2019-01-012019-12-310001048286us-gaap:AccumulatedGainLossNetCashFlowHedgeParentMember2019-01-012019-12-310001048286us-gaap:AccumulatedTranslationAdjustmentMember2019-12-310001048286us-gaap:AccumulatedGainLossNetCashFlowHedgeParentMember2019-12-310001048286us-gaap:AccumulatedTranslationAdjustmentMember2020-01-012020-12-310001048286us-gaap:AccumulatedGainLossNetCashFlowHedgeParentMember2020-01-012020-12-310001048286us-gaap:AccumulatedTranslationAdjustmentMember2020-12-310001048286us-gaap:AccumulatedGainLossNetCashFlowHedgeParentMember2020-12-310001048286us-gaap:AccumulatedTranslationAdjustmentMember2021-01-012021-12-310001048286us-gaap:AccumulatedGainLossNetCashFlowHedgeParentMember2021-01-012021-12-310001048286us-gaap:AccumulatedTranslationAdjustmentMember2021-12-310001048286us-gaap:AccumulatedGainLossNetCashFlowHedgeParentMember2021-12-31mar:segment0001048286us-gaap:OperatingSegmentsMembermar:USAndCanadaSegmentMembermar:FeeServiceMember2021-01-012021-12-310001048286us-gaap:OperatingSegmentsMembermar:InternationalSegmentMembermar:FeeServiceMember2021-01-012021-12-310001048286us-gaap:OperatingSegmentsMembermar:FeeServiceMember2021-01-012021-12-310001048286us-gaap:OperatingSegmentsMembermar:USAndCanadaSegmentMembermar:FeeServiceMember2020-01-012020-12-310001048286us-gaap:OperatingSegmentsMembermar:InternationalSegmentMembermar:FeeServiceMember2020-01-012020-12-310001048286us-gaap:OperatingSegmentsMembermar:FeeServiceMember2020-01-012020-12-310001048286us-gaap:OperatingSegmentsMembermar:USAndCanadaSegmentMembermar:FeeServiceMember2019-01-012019-12-310001048286us-gaap:OperatingSegmentsMembermar:InternationalSegmentMembermar:FeeServiceMember2019-01-012019-12-310001048286us-gaap:OperatingSegmentsMembermar:FeeServiceMember2019-01-012019-12-310001048286us-gaap:OperatingSegmentsMembermar:OwnedLeasedandOtherMembermar:USAndCanadaSegmentMember2021-01-012021-12-310001048286us-gaap:OperatingSegmentsMembermar:InternationalSegmentMembermar:OwnedLeasedandOtherMember2021-01-012021-12-310001048286us-gaap:OperatingSegmentsMembermar:OwnedLeasedandOtherMember2021-01-012021-12-310001048286us-gaap:OperatingSegmentsMembermar:OwnedLeasedandOtherMembermar:USAndCanadaSegmentMember2020-01-012020-12-310001048286us-gaap:OperatingSegmentsMembermar:InternationalSegmentMembermar:OwnedLeasedandOtherMember2020-01-012020-12-310001048286us-gaap:OperatingSegmentsMembermar:OwnedLeasedandOtherMember2020-01-012020-12-310001048286us-gaap:OperatingSegmentsMembermar:OwnedLeasedandOtherMembermar:USAndCanadaSegmentMember2019-01-012019-12-310001048286us-gaap:OperatingSegmentsMembermar:InternationalSegmentMembermar:OwnedLeasedandOtherMember2019-01-012019-12-310001048286us-gaap:OperatingSegmentsMembermar:OwnedLeasedandOtherMember2019-01-012019-12-310001048286mar:ReimbursementsMemberus-gaap:OperatingSegmentsMembermar:USAndCanadaSegmentMember2021-01-012021-12-310001048286mar:ReimbursementsMemberus-gaap:OperatingSegmentsMembermar:InternationalSegmentMember2021-01-012021-12-310001048286mar:ReimbursementsMemberus-gaap:OperatingSegmentsMember2021-01-012021-12-310001048286mar:ReimbursementsMemberus-gaap:OperatingSegmentsMembermar:USAndCanadaSegmentMember2020-01-012020-12-310001048286mar:ReimbursementsMemberus-gaap:OperatingSegmentsMembermar:InternationalSegmentMember2020-01-012020-12-310001048286mar:ReimbursementsMemberus-gaap:OperatingSegmentsMember2020-01-012020-12-310001048286mar:ReimbursementsMemberus-gaap:OperatingSegmentsMembermar:USAndCanadaSegmentMember2019-01-012019-12-310001048286mar:ReimbursementsMemberus-gaap:OperatingSegmentsMembermar:InternationalSegmentMember2019-01-012019-12-310001048286mar:ReimbursementsMemberus-gaap:OperatingSegmentsMember2019-01-012019-12-310001048286us-gaap:OperatingSegmentsMembermar:USAndCanadaSegmentMember2021-01-012021-12-310001048286us-gaap:OperatingSegmentsMembermar:InternationalSegmentMember2021-01-012021-12-310001048286us-gaap:OperatingSegmentsMember2021-01-012021-12-310001048286us-gaap:OperatingSegmentsMembermar:USAndCanadaSegmentMember2020-01-012020-12-310001048286us-gaap:OperatingSegmentsMembermar:InternationalSegmentMember2020-01-012020-12-310001048286us-gaap:OperatingSegmentsMember2020-01-012020-12-310001048286us-gaap:OperatingSegmentsMembermar:USAndCanadaSegmentMember2019-01-012019-12-310001048286us-gaap:OperatingSegmentsMembermar:InternationalSegmentMember2019-01-012019-12-310001048286us-gaap:OperatingSegmentsMember2019-01-012019-12-310001048286us-gaap:CorporateNonSegmentMember2021-01-012021-12-310001048286us-gaap:CorporateNonSegmentMember2020-01-012020-12-310001048286us-gaap:CorporateNonSegmentMember2019-01-012019-12-310001048286us-gaap:NonUsMemberus-gaap:OperatingSegmentsMember2021-01-012021-12-310001048286us-gaap:NonUsMemberus-gaap:OperatingSegmentsMember2020-01-012020-12-310001048286us-gaap:NonUsMemberus-gaap:OperatingSegmentsMember2019-01-012019-12-310001048286mar:ReimbursementsMemberus-gaap:NonUsMemberus-gaap:OperatingSegmentsMember2021-01-012021-12-310001048286mar:ReimbursementsMemberus-gaap:NonUsMemberus-gaap:OperatingSegmentsMember2020-01-012020-12-310001048286mar:ReimbursementsMemberus-gaap:NonUsMemberus-gaap:OperatingSegmentsMember2019-01-012019-12-310001048286mar:ReimbursementsMemberus-gaap:NonUsMember2021-01-012021-12-310001048286mar:ReimbursementsMemberus-gaap:NonUsMember2020-01-012020-12-310001048286mar:ReimbursementsMemberus-gaap:NonUsMember2019-01-012019-12-310001048286mar:ReimbursementsMemberus-gaap:EquityMethodInvesteeMember2021-01-012021-12-310001048286mar:ReimbursementsMemberus-gaap:EquityMethodInvesteeMember2020-01-012020-12-310001048286mar:ReimbursementsMemberus-gaap:EquityMethodInvesteeMember2019-01-012019-12-310001048286us-gaap:EquityMethodInvesteeMember2021-01-012021-12-310001048286us-gaap:EquityMethodInvesteeMember2020-01-012020-12-310001048286us-gaap:EquityMethodInvesteeMember2019-01-012019-12-310001048286us-gaap:EquityMethodInvestmentNonconsolidatedInvesteeOrGroupOfInvesteesMember2021-01-012021-12-310001048286us-gaap:EquityMethodInvestmentNonconsolidatedInvesteeOrGroupOfInvesteesMember2020-01-012020-12-310001048286us-gaap:EquityMethodInvestmentNonconsolidatedInvesteeOrGroupOfInvesteesMember2019-01-012019-12-310001048286us-gaap:EquityMethodInvestmentNonconsolidatedInvesteeOrGroupOfInvesteesMember2021-12-310001048286us-gaap:EquityMethodInvestmentNonconsolidatedInvesteeOrGroupOfInvesteesMember2020-12-310001048286mar:JWMFamilyEnterpriseL.P.Member2021-01-012021-12-310001048286mar:JWMFamilyEnterpriseL.P.Member2020-01-012020-12-310001048286mar:JWMFamilyEnterpriseL.P.Member2019-01-012019-12-310001048286mar:AffiliatedMembersOfTheMarriottFamilyMember2021-01-012021-12-310001048286mar:AffiliatedMembersOfTheMarriottFamilyMember2019-01-012019-12-310001048286mar:AffiliatedMembersOfTheMarriottFamilyMember2020-01-012020-12-310001048286mar:HostHotelsResortsIncMember2021-12-31mar:property0001048286mar:HostHotelsResortsIncMember2020-12-310001048286mar:HostHotelsResortsIncMember2021-01-012021-12-310001048286mar:HostHotelsResortsIncMember2020-01-012020-12-310001048286mar:HostHotelsResortsIncMember2019-01-012019-12-31
UNITED STATES
SECURITIES AND EXCHANGE COMMISSION
Washington, D.C. 20549
FORM 10-K
| | | | | |
| ☒ | ANNUAL REPORT PURSUANT TO SECTION 13 OR 15(d) OF THE SECURITIES EXCHANGE ACT OF 1934 |
For the Fiscal Year Ended December 31, 2021
or
| | | | | |
| ☐ | TRANSITION REPORT PURSUANT TO SECTION 13 OR 15(d) OF THE SECURITIES EXCHANGE ACT OF 1934 |
For the transition period from to
Commission File No. 1-13881
MARRIOTT INTERNATIONAL, INC.
(Exact name of registrant as specified in its charter)
| | | | | | | | | | | | | | | | | | | | |
| Delaware | | 52-2055918 |
(State or other jurisdiction of
incorporation or organization) | | (IRS Employer
Identification No.) |
| | | | | | |
| 10400 Fernwood Road | | Bethesda | | Maryland | | 20817 |
| (Address of Principal Executive Offices) | | (Zip Code) |
Registrant’s Telephone Number, Including Area Code (301) 380-3000
Securities registered pursuant to Section 12(b) of the Act:
| | | | | | | | | | | | | | |
| Title of Each Class | | Trading Symbol(s) | | Name of Each Exchange on Which Registered |
| Class A Common Stock, $0.01 par value | | MAR | | Nasdaq Global Select Market |
Securities registered pursuant to Section 12(g) of the Act: NONE
Indicate by check mark if the registrant is a well-known seasoned issuer, as defined in Rule 405 of the Securities Act. Yes ☒ No o
Indicate by check mark if the registrant is not required to file reports pursuant to Section 13 or Section 15(d) of the Act. Yes o No ☒
Indicate by check mark whether the registrant: (1) has filed all reports required to be filed by Section 13 or 15(d) of the Securities Exchange Act of 1934 during the preceding 12 months (or for such shorter period that the registrant was required to file such reports), and (2) has been subject to such filing requirements for the past 90 days. Yes ☒ No o
Indicate by check mark whether the registrant has submitted electronically every Interactive Data File required to be submitted pursuant to Rule 405 of Regulation S-T (§ 232.405 of this chapter) during the preceding 12 months (or for such shorter period that the registrant was required to submit such files). Yes ☒ No o
Indicate by check mark whether the registrant is a large accelerated filer, an accelerated filer, a non-accelerated filer, a smaller reporting company, or an emerging growth company. See the definitions of “large accelerated filer,” “accelerated filer,” “smaller reporting company,” and “emerging growth company” in Rule 12b-2 of the Exchange Act.
| | | | | | | | | | | | | | |
| Large accelerated filer | ☒ | | Accelerated filer | o |
| Non-accelerated filer | o | Smaller reporting company | ☐ |
| | | Emerging growth company | ☐ |
If an emerging growth company, indicate by check mark if the registrant has elected not to use the extended transition period for complying with any new or revised financial accounting standards provided pursuant to Section 13(a) of the Exchange Act. o |
Indicate by check mark whether the registrant has filed a report on and attestation to its management's assessment of the effectiveness of its internal control over financial reporting under Section 404(b) of the Sarbanes-Oxley Act (15 U.S.C. 7262(b)) by the registered public accounting firm that prepared or issued its audit report. ☒
Indicate by check mark whether the registrant is a shell company (as defined in Rule 12b-2 of the Act). Yes ☐ No ☒
The aggregate market value of shares of common stock held by non-affiliates at June 30, 2021, was $37,430,276,528.
There were 326,311,111 shares of Class A Common Stock, par value $0.01 per share, outstanding at February 8, 2022.
DOCUMENTS INCORPORATED BY REFERENCE
Portions of the Proxy Statement prepared for the 2022 Annual Meeting of Stockholders are incorporated by reference into Part III of this report.
MARRIOTT INTERNATIONAL, INC.
FORM 10-K TABLE OF CONTENTS
FISCAL YEAR ENDED DECEMBER 31, 2021
Throughout this report, we refer to Marriott International, Inc., together with its consolidated subsidiaries, as “we,” “us,” “Marriott,” or the “Company.” In order to make this report easier to read, we also refer throughout to (1) our Consolidated Financial Statements as our “Financial Statements,” (2) our Consolidated Statements of Income (Loss) as our “Income Statements,” (3) our Consolidated Balance Sheets as our “Balance Sheets,” (4) our Consolidated Statements of Cash Flows as our “Statements of Cash Flows,” (5) our properties, brands, or markets in the United States and Canada as “U.S. & Canada,” and (6) our properties, brands, or markets in our Caribbean and Latin America, Europe, Middle East and Africa, Greater China, and Asia Pacific excluding China regions, as “International.” In addition, references throughout to numbered “Notes” refer to the Notes to our Financial Statements, unless otherwise stated.
Cautionary Statement
All statements in this report are made as of the date this Form 10-K is filed with the U.S. Securities and Exchange Commission (the “SEC”). We undertake no obligation to publicly update or revise these statements, whether as a result of new information, future events or otherwise. We make forward-looking statements in Management’s Discussion and Analysis of Financial Condition and Results of Operations and elsewhere in this report based on the beliefs and assumptions of our management and on information available to us through the date this Form 10-K is filed with the SEC. Forward-looking statements include information related to the future effects on our business of the coronavirus pandemic (“COVID-19”); Revenue per Available Room (“RevPAR”), occupancy and other future demand and recovery trends and expectations; our expectations regarding rooms growth; our expectations regarding the receipt of certain credits and refunds under certain U.S. federal legislation; our expectations regarding our ability to meet our liquidity requirements; our expectations regarding our cash from operations; our capital expenditures and other investment spending expectations; our expectations regarding capital returns; and other statements that are preceded by, followed by, or include the words “believes,” “expects,” “anticipates,” “intends,” “plans,” “estimates,” “foresees,” or similar expressions; and similar statements concerning anticipated future events and expectations that are not historical facts.
We caution you that these statements are not guarantees of future performance and are subject to numerous evolving risks and uncertainties that we may not be able to accurately predict or assess, including the risks and uncertainties we describe in Part I, Item 1A of this report and other factors we describe from time to time in our periodic filings with the SEC.
PART I
Item 1. Business.
Corporate Structure and Business
We are a worldwide operator, franchisor, and licensor of hotel, residential, and timeshare properties under numerous brand names at different price and service points. Consistent with our focus on management, franchising, and licensing, we own very few of our lodging properties.
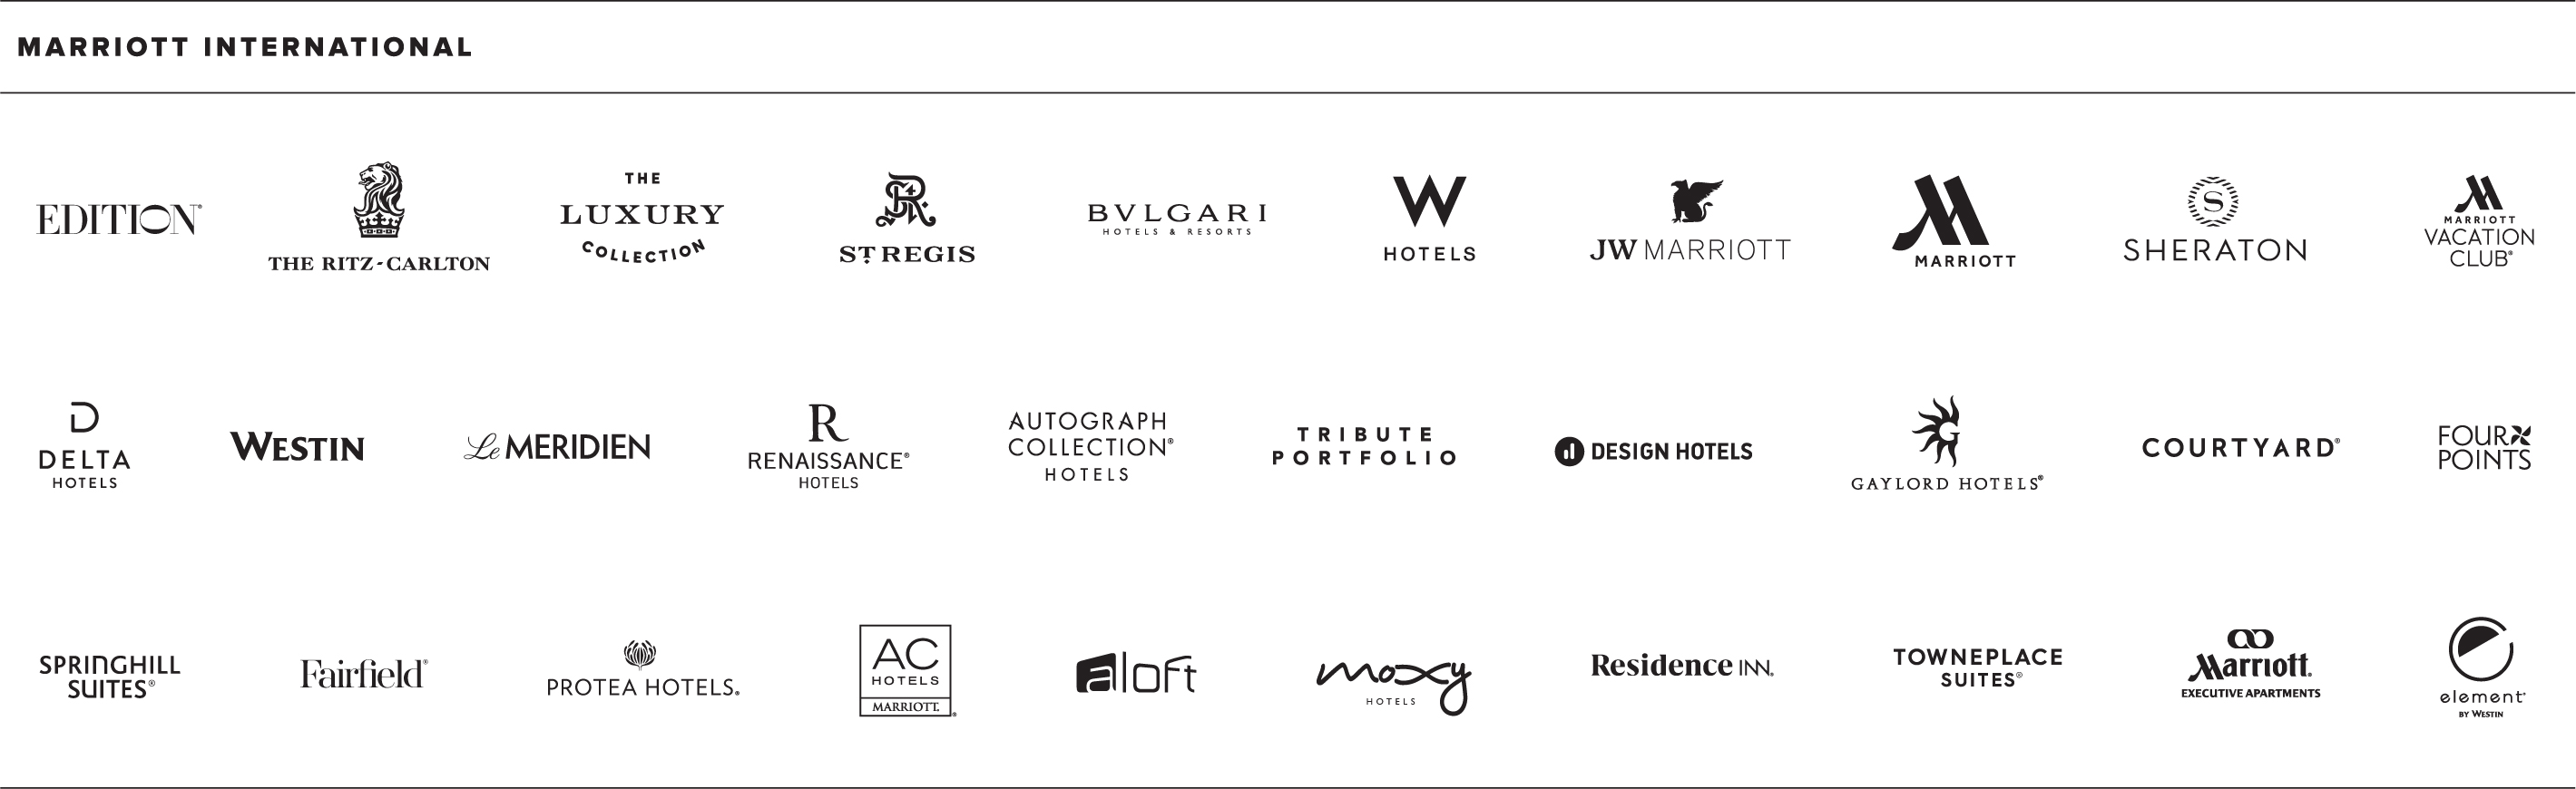
The following table shows our portfolio of brands at year-end 2021.
We discuss our operations in the following two operating segments, both of which meet the applicable accounting criteria for separate disclosure as a reportable business segment: U.S. & Canada and International. See Note 14 for more information.
COVID-19
COVID-19 has had an unprecedented impact on the travel industry and the Company, and it will continue to have a material negative impact on our future results for a period of time that we are currently unable to predict. For further information about COVID-19’s impact to our business, see Part I, Item 1A, “Risk Factors,” and Part II, Item 7, “Management’s Discussion and Analysis of Financial Condition and Results of Operations.”
Company-Operated Properties
At year-end 2021, we had 2,007 company-operated properties (568,864 rooms), which included properties under long-term management or lease agreements with property owners (management and lease agreements together, the “Operating Agreements”) and properties that we own. This does not include branded residential communities for which we manage the related owners’ association.
Terms of our management agreements vary, but we earn a management fee that is typically composed of a base management fee, which is a percentage of the revenues of the hotel, and an incentive management fee, which is based on the profits of the hotel. Our management agreements also typically include reimbursement of costs of operations (both direct and indirect). Such agreements are generally for initial periods of 15 to 30 years, with options for us to renew for up to 10 or more additional years. Our lease agreements also vary, but may include fixed annual rentals plus additional rentals based on a specified percentage of annual revenues that exceed a fixed amount. Many of our Operating Agreements are subordinated to mortgages or other liens securing indebtedness of the owners. Many of our Operating Agreements also permit the owners to terminate the agreement if we do not meet certain performance metrics, financial returns fail to meet defined levels for a period of time, and we have not cured those deficiencies. In certain circumstances, some of our management agreements allow owners to convert company-operated properties to franchised properties under our brands.
For the lodging facilities we operate, we generally are responsible for hiring, training, and supervising the managers and employees needed to operate the facilities and for purchasing supplies, and owners are required to reimburse us for those costs. We provide centralized programs and services, such as the Loyalty Program, reservations, and marketing, as well as various accounting and data processing services, and owners are also required to reimburse us for those costs.
Franchised and Licensed Properties
We have franchising and licensing arrangements that permit hotel owners and operators to use many of our lodging brand names and systems. Under our hotel franchising arrangements, we generally receive an initial application fee and continuing royalty fees, which typically range from four to seven percent of room revenues for all brands, plus two to three percent of food and beverage revenues for certain full-service brands. Franchisees contribute to our centralized programs and services, such as the Loyalty Program, reservations, and marketing.
We also receive royalty fees under license agreements with Marriott Vacations Worldwide Corporation (“MVW”), our former timeshare subsidiary that we spun off in 2011, and its affiliates for certain brands, including Marriott Vacation Club, Grand Residences by Marriott, The Ritz-Carlton Destination Club, Westin, Sheraton, and for certain existing properties, St. Regis and The Luxury Collection. We receive license fees from MVW consisting of a fixed annual fee, adjusted for inflation, plus certain variable fees based on sales volumes.
At year-end 2021, we had 5,880 franchised and licensed properties (900,437 rooms).
Residential
We use or license our trademarks for the sale of residential real estate, often in conjunction with hotel development, and receive branding fees for sales of such branded residential real estate by others. Third-party owners typically construct and sell residences with limited amounts, if any, of our capital at risk. We have used or licensed the JW Marriott, The Ritz-Carlton, Ritz-Carlton Reserve, W, The Luxury Collection, St. Regis, EDITION, Bvlgari, Renaissance, Le Méridien, Marriott, Sheraton, Westin, Four Points, Delta Hotels, and Autograph Collection brand names and trademarks for residential real estate sales. At year-end 2021, we had 102 branded residential communities (9,878 rooms).
Intellectual Property
We operate in a highly competitive industry and our brand names, trademarks, service marks, trade names, and logos are very important to the development, sales and marketing of our properties and services. We believe that our brand names and other intellectual property have come to represent the highest standards of quality, care, service, and value to our customers, guests, and the traveling public. Accordingly, we register and protect our intellectual property where we deem appropriate and otherwise protect against its unauthorized use.
Brand Portfolio
We believe that our brand portfolio offers the most compelling range of brands and hotels in hospitality. Our brands are categorized by style of offering - Classic and Distinctive. Our Classic brands offer time-honored hospitality for the modern traveler, and our Distinctive brands offer memorable experiences with a unique perspective - each of which we group into three quality tiers: Luxury, Premium, and Select.
Luxury offers bespoke and superb amenities and services. Our Classic Luxury hotel brands include JW Marriott, The Ritz-Carlton, and St. Regis. Distinctive Luxury hotel brands in our portfolio include W Hotels, The Luxury Collection, EDITION, and Bvlgari.
Premium offers sophisticated and thoughtful amenities and services. Our Classic Premium hotel brands include Marriott Hotels, Sheraton, Delta Hotels, Marriott Executive Apartments, and Marriott Vacation Club. Our Distinctive Premium hotel brands include Westin, Renaissance Hotels, Le Méridien, Autograph Collection Hotels, Gaylord Hotels, Tribute Portfolio, and Design Hotels.
Select offers smart and easy amenities and services, with our longer stay brands offering amenities that mirror the comforts of home. Our Classic Select hotel brands include Courtyard, Residence Inn, Fairfield, SpringHill Suites, Four Points, TownePlace Suites, and Protea Hotels. Our Distinctive Select hotel brands include Aloft Hotels, AC Hotels by Marriott, Element Hotels, and Moxy Hotels.
The following table shows the geographic distribution of our brands at year-end 2021:
| | | | | | | | | | | | | | | | | | | | | | | |
| | U.S. & Canada | Europe | Middle East & Africa | Asia Pacific | Caribbean & Latin America | Total |
| Luxury |
JW Marriott® | Properties | 35 | 6 | 9 | 43 | 14 | 107 |
| Rooms | 19,155 | 2,169 | 4,039 | 15,846 | 3,847 | 45,056 |
The Ritz-Carlton® | Properties | 39 | 12 | 14 | 38 | 10 | 113 |
| Rooms | 11,839 | 2,835 | 3,763 | 9,222 | 2,372 | 30,031 |
W® Hotels | Properties | 24 | 6 | 6 | 20 | 7 | 63 |
| Rooms | 7,041 | 1,354 | 1,989 | 5,514 | 1,752 | 17,650 |
The Luxury Collection® (1) | Properties | 17 | 47 | 13 | 31 | 15 | 123 |
| Rooms | 5,285 | 6,999 | 2,643 | 7,983 | 1,252 | 24,162 |
St. Regis® | Properties | 10 | 6 | 9 | 21 | 4 | 50 |
| Rooms | 1,968 | 883 | 2,755 | 5,044 | 568 | 11,218 |
EDITION® | Properties | 4 | 3 | 3 | 3 | — | 13 |
| Rooms | 1,207 | 432 | 638 | 852 | — | 3,129 |
Bvlgari® | Properties | — | 3 | 1 | 3 | — | 7 |
| Rooms | — | 222 | 121 | 260 | — | 603 |
| Premium |
Marriott® Hotels | Properties | 340 | 103 | 26 | 96 | 29 | 594 |
| Rooms | 132,791 | 26,719 | 7,968 | 32,119 | 7,789 | 207,386 |
Sheraton® | Properties | 178 | 57 | 33 | 139 | 30 | 437 |
| Rooms | 68,824 | 16,008 | 9,699 | 50,315 | 8,396 | 153,242 |
Westin® | Properties | 133 | 18 | 7 | 61 | 13 | 232 |
| Rooms | 54,009 | 5,973 | 1,838 | 18,478 | 3,813 | 84,111 |
Renaissance® Hotels | Properties | 85 | 31 | 5 | 43 | 9 | 173 |
| Rooms | 28,091 | 7,262 | 1,293 | 14,733 | 2,745 | 54,124 |
Le Méridien® | Properties | 24 | 16 | 21 | 47 | 2 | 110 |
| Rooms | 5,287 | 5,156 | 6,124 | 12,446 | 271 | 29,284 |
Autograph Collection® Hotels (2) | Properties | 136 | 58 | 8 | 16 | 35 | 253 |
| Rooms | 27,807 | 7,298 | 1,629 | 3,706 | 11,154 | 51,594 |
Delta Hotels by Marriott® (Delta Hotels®) | Properties | 82 | 6 | 3 | 2 | 1 | 94 |
| Rooms | 19,312 | 1,078 | 718 | 978 | 117 | 22,203 |
Gaylord® Hotels | Properties | 6 | — | — | — | — | 6 |
| Rooms | 10,220 | — | — | — | — | 10,220 |
Marriott Executive Apartments® | Properties | — | 4 | 10 | 18 | 2 | 34 |
| Rooms | — | 361 | 1,326 | 2,742 | 240 | 4,669 |
Tribute Portfolio® | Properties | 40 | 13 | 1 | 11 | 4 | 69 |
| Rooms | 6,554 | 1,398 | 249 | 1,708 | 193 | 10,102 |
Design HotelsTM | Properties | 9 | 7 | 3 | — | — | 19 |
| Rooms | 1,313 | 796 | 266 | — | — | 2,375 |
| | | | | | | | | | | | | | | | | | | | | | | |
| | U.S. & Canada | Europe | Middle East & Africa | Asia Pacific | Caribbean & Latin America | Total |
| Select |
Courtyard by Marriott® (Courtyard®) | Properties | 1,038 | 76 | 10 | 89 | 43 | 1,256 |
| Rooms | 143,376 | 14,484 | 2,162 | 20,314 | 7,063 | 187,399 |
Residence Inn by Marriott® (Residence Inn®) | Properties | 846 | 17 | 6 | — | 7 | 876 |
| Rooms | 104,167 | 1,975 | 983 | — | 982 | 108,107 |
Fairfield by Marriott® (Fairfield®) | Properties | 1,112 | — | — | 78 | 14 | 1,204 |
| Rooms | 105,330 | — | — | 11,970 | 1,971 | 119,271 |
SpringHill Suites by Marriott® (SpringHill Suites®) | Properties | 512 | — | — | — | — | 512 |
| Rooms | 60,617 | — | — | — | — | 60,617 |
Four Points by Sheraton® (Four Points®) | Properties | 160 | 19 | 18 | 84 | 19 | 300 |
| Rooms | 24,146 | 3,070 | 4,500 | 22,040 | 2,513 | 56,269 |
TownePlace Suites by Marriott® (TownePlace Suites®) | Properties | 475 | — | — | — | — | 475 |
| Rooms | 48,595 | — | — | — | — | 48,595 |
Aloft® Hotels | Properties | 148 | 10 | 11 | 31 | 12 | 212 |
| Rooms | 21,507 | 1,676 | 2,559 | 6,816 | 1,971 | 34,529 |
AC Hotels by Marriott® | Properties | 95 | 87 | 2 | 4 | 15 | 203 |
| Rooms | 15,692 | 11,508 | 286 | 1,296 | 2,383 | 31,165 |
Protea Hotels® by Marriott (Protea Hotels®) | Properties | — | 1 | 66 | — | — | 67 |
| Rooms | — | 72 | 6,783 | — | — | 6,855 |
Element® Hotels | Properties | 73 | 1 | 5 | 8 | — | 87 |
| Rooms | 10,016 | 160 | 731 | 1,651 | — | 12,558 |
Moxy® Hotels | Properties | 26 | 68 | — | 12 | — | 106 |
| Rooms | 4,913 | 12,897 | — | 2,266 | — | 20,076 |
| Residences |
| Residences | Properties | 65 | 7 | 6 | 13 | 11 | 102 |
| Rooms | 6,925 | 234 | 461 | 1,700 | 558 | 9,878 |
| Subtotal Properties | 5,712 | 682 | 296 | 911 | 296 | 7,897 |
| Subtotal Rooms | 945,987 | 133,019 | 65,523 | 249,999 | 61,950 | 1,456,478 |
| | | | | | | |
Timeshare (3) | Properties | | | | | | 92 |
| Rooms | | | | | | 22,701 |
| Total Properties | | | | | | 7,989 |
| Total Rooms | | | | | | 1,479,179 |
(1)Includes two properties acquired when we purchased Elegant Hotels Group plc in December 2019, which we currently intend to re-brand under The Luxury Collection brand following the completion of planned renovations.
(2)Includes five properties acquired when we purchased Elegant Hotels Group plc in December 2019, which we currently intend to re-brand under the Autograph Collection brand following the completion of planned renovations.
(3)We exclude geographical data for Timeshare as its results are recorded within “Unallocated corporate and other.”
Loyalty and Credit Card Programs
Marriott BonvoyTM is our customer loyalty program through which members have access to our diverse brand portfolio, rich benefits, and travel experiences. We refer to Marriott Bonvoy throughout this report as our “Loyalty Program.”
Our Loyalty Program rewards members with points toward free hotel stays, access to travel experiences through our Marriott Bonvoy Tours & Activities program, miles with participating airline programs, and other benefits. We believe that our Loyalty Program generates substantial repeat business that might otherwise go to competing hotels. In each of 2021 and 2020, approximately 50 percent of our global room nights were booked by Loyalty Program members. We strategically market to this large and growing guest base to generate revenue. See the “Loyalty Program” caption in Note 2 for more information.
We have multi-year agreements with JPMorgan Chase and American Express for our U.S.-issued, co-brand credit cards associated with our Loyalty Program. We also license credit card programs internationally, including in Japan, Canada, the United Kingdom, United Arab Emirates, South Korea, and Mexico. We generally earn fixed amounts that are payable at contract inception and variable amounts that are paid to us monthly over the term of the agreements primarily based on card usage, and we believe that our co-brand credit cards contribute to the success of our Loyalty Program and reflect the quality and value of our portfolio of brands.
Sales and Marketing and Reservation Systems
Marriott.com, our international websites, and our mobile application allow for a seamless booking experience and easy enrollment in our Loyalty Program to book our exclusive Member Rates and participate in program benefits. Our Look No Further® Best Rate Guarantee ensures best rate integrity, strengthening consumer confidence in our brand and giving guests access to the best rates when they book hotel rooms through our direct channels. We also remain focused on growing engagement levels with millions of guests by interacting with them through a variety of channels, including our mobile application and digital guest services – contactless check-in and check-out, chat, service requests, mobile key, and more – across our hotel portfolio. Our digital strategy continues to focus on growing direct engagement with our customers through more destination content for leisure travelers and improved search optimization, as well as driving bookings to our direct channels, which generally deliver more profitable business to hotels in our system compared to bookings made through intermediary channels. Through our direct channels, we aim to create a simple and efficient digital shopping and booking experience, while elevating our service through digitally-enabled guest services to generate superior guest satisfaction and enable more frictionless and memorable stays at our properties. We are also expanding the languages with which we serve guests around the world on our digital channels.
At year-end 2021, we operated 20 hotel reservation centers, seven in the U.S. and 13 in other countries and territories, which handle reservation requests for our lodging brands worldwide, including franchised properties. We own two of the U.S. facilities and either lease the others or share space with a company-operated property. Our reservation system manages inventory and allows us to utilize third-party agents where cost effective. Economies of scale enable us to minimize costs per occupied room.
We believe our global sales and revenue management organizations are a key competitive advantage due to our focus on optimizing our investment in people, processes, and systems. Our above-property sales deployment strategy aligns our sales efforts around how the customer wants to buy, reducing duplication of efforts by individual hotels and allowing us to cover a larger number of accounts. We also utilize innovative and sophisticated revenue management systems, many of which are proprietary, which we believe provide a competitive advantage in pricing decisions, increasing efficiency and optimizing property-level revenue for hotels in our portfolio. Most of the hotels in our portfolio utilize web-based programs to effectively manage the rate set-up and modification processes. The use of these web-based programs provides for greater pricing flexibility, reduces time spent on rate program creation and maintenance, and increases the speed to market of new products and services.
Competition
We encounter strong competition both as a lodging operator and as a franchisor. Other lodging management companies are primarily private management firms, but also include several large national and international chains that own and operate their own hotels, operate hotels on behalf of third-party owners, and also franchise their brands. Management contracts are typically long-term in nature, but most allow the hotel owner to replace the management firm if it does not meet certain financial or performance criteria.
Our direct digital channels also compete for guests with large companies that offer online travel services as part of their business model such as Expedia.com, Priceline.com, Booking.com, Travelocity.com, and Orbitz.com and search engines such as Google, Bing, Yahoo, and Baidu. Our hotels compete for guests with other hotels and online platforms, including Airbnb and Vrbo, that allow travelers to book short-term rentals of homes and apartments as an alternative to hotel rooms. We compete for guests in many areas, including brand recognition and reputation, location, guest satisfaction, room rates, quality of service, amenities, quality of accommodations, safety and security, and the ability to earn and redeem loyalty program points.
Affiliation with a brand is common in the U.S. lodging industry, and we believe that our strong brand recognition assists us in attracting and retaining guests, owners, and franchisees. In 2021, approximately 72 percent of U.S. hotel rooms were brand-affiliated. Most of the branded properties are franchises, under which the owner pays the franchisor a fee for use of its hotel name and reservation system. In the franchising business, we face many competitors that have strong brands and guest appeal, including Hilton, IHG Hotels & Resorts, Hyatt, Wyndham Hotels & Resorts, Accor, Choice Hotels, Radisson Hotels, Best Western Hotels & Resorts, and others.
Outside the U.S., branding is much less prevalent, and most markets are served primarily by independent operators, although branding is more common for new hotel development compared to the past. We believe that chain affiliation will continue to become more attractive in many overseas markets as local economies grow, trade barriers decline, international travel accelerates, and hotel owners seek the benefits of centralized reservation systems, marketing programs, and loyalty programs.
Based on lodging industry data, we have an approximately 16 percent share of the U.S. hotel market and a four percent share of the hotel market outside the U.S. (based on number of rooms). We believe that our hotel brands are attractive to hotel owners seeking a management company or franchise affiliation because our hotels typically generate higher RevPAR than our direct competitors in most market areas. We attribute this performance premium to our success in achieving and maintaining strong guest preference. We believe that the location and quality of our lodging facilities, our marketing programs, our reservation systems, our Loyalty Program, and our emphasis on guest service and guest and associate satisfaction contribute to guest preference across all our brands.
Seasonality
In general, business at company-operated and franchised properties fluctuates moderately with the seasons. However, COVID-19 has impacted, and may continue to impact, our typical seasonal patterns. In addition, business at some resort properties may be more seasonal depending on location.
Human Capital Management
Marriott’s long history of service, innovation and growth is built on a commitment to putting people first. We are committed to investing in our associates, with a focus on leadership development, recognition, compensation, career opportunity, and skills training.
At year-end 2021, Marriott employed approximately 120,000 associates at properties, customer care centers, and above-property operations. Approximately 97,000 of these associates are located in the U.S., of which approximately 19,000 belong to labor unions. Outside the U.S., some of our associates are represented by trade unions, works councils, or employee associations. These numbers do not include associates who are employed by our hotel owners but whose employment is managed by Marriott (which is common outside the U.S.) or hotel personnel employed by our franchisees or other management companies hired by our franchisees. Marriott manages approximately 205,000 associates who are employed by hotel owners. Marriott encourages franchisees to develop responsible business practices for human capital management; however, franchisees and management companies hired by franchisees are responsible for establishing their own labor and employment practices.
The impact of COVID-19 on the hospitality industry, and actions that we and others in the hospitality industry took in response to COVID-19 (including implementing furloughs, reduced work week schedules, and voluntary transition programs, and eliminating a significant number of above-property and on-property positions) have adversely affected our ability to attract and retain associates. As lodging demand recovers from the lows seen in the early months of the pandemic, we have seen and continue to see industry-wide labor shortages causing challenges in hiring or re-hiring for certain positions, primarily in certain high-demand U.S. markets. In response, we have enhanced our recruitment and retention efforts and increased compensation where needed to maintain competitiveness.
We have taken, and continue to take, numerous steps to address the safety and well-being of our associates in light of COVID-19. For example, at our U.S. headquarters and above-property locations, we instituted a COVID-19 vaccination requirement. For our U.S. property-level associates, we instituted a multi-pronged approach to encourage and support associate vaccination, including financial incentives, schedule flexibility, and health education. We also provided quarantine pay to allow eligible associates with COVID-19 paid time to recover. In other geographies, we took legally permissible steps, dependent on the jurisdiction, including instituting vaccination requirements and offering incentives and education. In addition, we continue to implement policies and protocols designed to help minimize the spread of COVID-19 at our hotels, such as our enhanced rigorous cleaning procedures, as well as safety guidelines from the U.S. Centers for Disease Control and Prevention, the World Health Organization, and various local health departments.
We are focused on providing our associates with the tools, resources and support they need to thrive – both personally and professionally. We have comprehensive compensation and benefits packages designed to invest in our associates and enrich their physical, mental and financial well-being. Our policies and practices are designed to support pay equity throughout an associate’s career. Salary history inquiries are prohibited during our hiring process and in the U.S. pay equity audits are conducted periodically. In addition, Marriott is focused on the health and well-being of not only our associates, but of their families as well. In the U.S., we provide our associates with access to health care coverage, work/life support benefits, and other benefits that support families, including paid time off, paid parental leave, and financial assistance to help with adoption fees. We also offer comprehensive benefits programs for associates outside the U.S., the terms of which vary based on the geographic market. In addition, we offer all associates free access to a digital tool designed to help with stress management and resiliency.
In addition to offering comprehensive compensation and benefits, we place an emphasis on supporting associates through access to career growth opportunities. Through skills training programs, professional development opportunities, and other learning experiences, we provide associates with a multitude of choices for career and personal growth. Associates have access
to the Digital Learning Zone, which is focused on providing personalized learning paths. Our Leadership Performance Acceleration program encourages managers and associates to have ongoing performance and development conversations throughout the year as well as periodic formal reviews to help associates develop career plans, chart a course for achieving those plans, and monitor progress. Annually, we also conduct an Associate Engagement Survey, which gives all associates the opportunity to provide feedback about their work experience. Leaders prepare action plans in response to survey results, which in turn fosters associate engagement, enhances the employment experience, and drives improvement in our Company’s culture. Despite the impact of the pandemic on our industry, Marriott’s engagement survey scores continue to be best-in-class and demonstrate satisfaction with the Marriott employment experience and pride in the Company.
Our company-wide diversity, equity, and inclusion efforts include a range of initiatives and programs to support our goal to make all stakeholders – associates, guests, owners, and suppliers – feel welcome and valued. We have oversight and accountability measures in place to support our focus on diversity, equity, and inclusion. The Inclusion and Social Impact Committee of our Board of Directors (the “ISI Committee”) helps drive accountability across the Company. Established in 2003, the ISI Committee is chaired by a member of our Board of Directors and comprised of certain other members of the Board and certain Company senior leaders. The ISI Committee assists the Board in carrying out its commitment and responsibilities relating to Marriott’s people-first culture and the Company’s efforts to foster associate well-being and inclusion. In 2021, we advanced our objectives to diversify our leadership (at the vice president level and above) by (1) accelerating our efforts to achieve global gender parity in Company leadership by 2023, which is two years earlier than our original goal, and (2) establishing a new objective to increase the representation of people of color in executive positions in the U.S. to 25 percent by 2025.
Sustainability and Social Impact
Guided by our 2025 sustainability and social impact goals, as well as the United Nations Sustainable Development Goals, we are focused on creating a positive and sustainable impact wherever we do business. Our sustainability and social impact platform, Serve 360: Doing Good in Every Direction, is built around four focus areas: Nurture Our World; Sustain Responsible Operations; Empower Through Opportunity; and Welcome All and Advance Human Rights – each with targets to drive our efforts through 2025. These targets reflect our goals to (1) support the resiliency and sustainable development of the communities and environments where we do business, (2) work to reduce our environmental impacts, design and operate sustainable hotels, and source responsibly, while mitigating climate-related risk, (3) facilitate workplace readiness and access to opportunity in our business, and (4) create a safe, welcoming world, including by working with organizations to educate and advocate on issues related to human rights throughout and beyond our business. Although our progress in some areas has been impacted by the COVID-19 pandemic, we remain focused on advancing our sustainability and social impact goals and initiatives.
In September 2021, we submitted a letter to the Science Based Targets initiative (SBTi), committing to (1) set science-based emissions reduction targets across all scopes, in line with 1.5°C emissions scenarios, and (2) set a long-term science-based target to reach net-zero value chain greenhouse gas (GHG) emissions by no later than 2050, in line with the criteria and recommendations of SBTi. We are currently preparing our submission to SBTi for our near-term targets and developing longer-term strategies to support those targets.
Our sustainability strategy and initiatives are focused on a wide range of issues, including designing resource-efficient hotels, implementing technologies to track and reduce energy and water consumption, increasing the use of renewable energy, managing climate and water-related risks, reducing waste and food waste, supporting innovative ecosystem restoration initiatives, and focusing on responsible and local sourcing.
In response to the pandemic, our hotels continued to support their local communities in need by donating food, supplies, and volunteer hours. We also deployed our Marriott Disaster Relief Fund to provide essential items, such as food vouchers, to Marriott associates in need due to the impact of the pandemic. Also in 2021, to further our human rights efforts, we launched an updated version of our human trafficking awareness training and made further progress toward our goal to train 100 percent of on-property associates in human trafficking awareness by 2025. This year, in collaboration with a leading anti-trafficking organization, we plan to make our updated training open-sourced for free access to our industry and beyond, as we currently do with the original training.
Government Regulations
As a company with global operations, we are subject to a wide variety of laws, regulations, and government policies in the U.S. and in jurisdictions around the world. Some of the regulations that most affect us include those related to employment practices; environment, health, and safety; trade and economic sanctions; competition; anti-bribery and anti-corruption; cybersecurity; data privacy, data localization, and the handling of personally identifiable information; the offer and sale of franchises; and liquor sales.
Internet Address and Company SEC Filings
Our primary Internet address is Marriott.com. On the investor relations portion of our website, Marriott.com/investor, we provide a link to our electronic filings with the SEC, including our annual report on Form 10-K, our quarterly reports on Form 10-Q, our current reports on Form 8-K, and any amendments to these reports. We make all such filings available free of charge as soon as reasonably practicable after filing. The information found on our website is not part of this or any other report we file with or furnish to the SEC.
Item 1A. Risk Factors.
We are subject to various risks that make an investment in our securities risky. The events and consequences discussed in these risk factors could, in circumstances we may or may not be able to accurately predict, recognize, or control, have a material adverse effect on our business, liquidity, financial condition, and results of operations. In addition, these risks could cause results to differ materially from those we express in forward-looking statements contained in this report or in other Company communications. These risk factors do not identify all risks that we face; our operations could also be affected by factors, events, or uncertainties that are not presently known to us or that we currently do not consider to present significant risks to our operations.
Risks Relating to COVID-19
COVID-19 has had a material detrimental impact on our business and financial results, and such impact could continue and may worsen for an unknown period of time.
COVID-19 has been and continues to be a complex and evolving situation, with governments, public institutions and other organizations imposing or recommending, and businesses and individuals implementing, at various times and to varying degrees, restrictions on various activities or other actions to combat its spread, such as warnings, restrictions and bans on travel, transportation or in-person gatherings; closures of, or occupancy or other operating limitations on, work facilities, lodging facilities, food and beverage establishments, schools, public buildings and businesses; cancellation of events, including sporting events, conferences and meetings; and quarantines and lock-downs. COVID-19 has dramatically reduced travel and demand for hotel rooms, and has negatively impacted, in some cases is continuing to negatively impact and may in the future negatively impact, our business, operations, and financial results, including, but not limited to, as follows:
•reducing revenues at our managed and franchised hotels, owned and leased hotels, and properties in which we have an investment;
•impacting the ability of our managed and franchised hotels, owned and leased hotels, and properties in which we have an investment to meet expenses, including payment of amounts owed to us;
•adversely affecting the value of our owned and leased properties or investments;
•affecting the ability or willingness of hotel owners and franchisees to service, repay or refinance existing indebtedness or similar obligations, including loans or guaranty advances we have made to or for them;
•making it more difficult for hotel owners and franchisees to obtain financing on commercially acceptable terms, or at all;
•causing hotel construction and opening delays;
•decreasing the rate at which new projects enter our pipeline;
•causing a significant number of hotels to exit our system;
•requiring us to borrow or otherwise raise a significant amount of cash in order to preserve financial flexibility, repay maturing debt and manage debt maturities;
•causing the terms of our borrowing to be more expensive or more restrictive; and
•adversely affecting our ability to attract and retain associates.
The extent to which COVID-19 impacts our business, operations, and financial results will depend on the factors described above and numerous other evolving factors that we may not be able to accurately predict or assess, including the continued duration and scope of COVID-19; the availability, effectiveness and acceptance of vaccines and treatments; COVID-19’s impact on global and regional economies and economic activity, unemployment rates and consumer discretionary spending; COVID-19’s short and longer-term impact on the demand for travel, including business transient and group business, and levels of consumer confidence; and the extent to which the recovery of travel and lodging demand is disrupted by new COVID-19 variants or other dislocations in pandemic recovery. COVID-19, and the volatile regional and global economic conditions stemming from COVID-19, as well as additional or unforeseen effects from the COVID-19 pandemic or future pandemics, could also give rise to, aggravate, and impact our ability to allocate resources to mitigate the other risks that we identify below, which in turn could materially adversely affect our business, liquidity, financial condition, and results of operations. Further, COVID-19 may also affect our operating and financial results in a manner that is not presently known to us or that we currently do not consider to present significant risks to our operations.
Risks Relating to Our Industry
Our industry is highly competitive, which may impact our ability to compete successfully for guests. We operate in markets that contain many competitors. Each of our hotel brands and our home rental offering competes with major hotel chains, regional hotel chains, independent hotels, and home sharing and rental services across national and international venues. Our ability to remain competitive and attract and retain business and leisure travelers depends on our success in distinguishing the quality and value of, and driving preference for, our lodging products and services, including our Loyalty Program, direct booking channels, consumer-facing technology platforms and services, and other offerings (including our co-branded credit cards), from those offered by others. If we cannot compete successfully in these areas, our operating margins could contract, our market share could decrease, and our earnings could decline. Further, new lodging supply in individual markets could have a negative impact on the hotel industry and hamper our ability to maintain or increase room rates or occupancy in those markets.
Economic downturns and other global, national, and regional conditions could further impact our financial results and growth. Because we conduct our business on a global platform, changes in global, national, or regional economies, governmental policies (including in areas such as trade, travel, immigration, healthcare, and related issues), and geopolitical and social conditions impact our activities. Our business is impacted by decreases in travel resulting from weak economic conditions, changes in energy prices and currency values, technologies that provide alternatives to in-person meetings and events, political instability, geopolitical conflict, heightened travel security measures, travel advisories, disruptions in air travel, and concerns over disease, violence, war, or terrorism.
As discussed in “Risks Relating to COVID-19,” our performance has been materially affected by some of these conditions and could be further materially affected if these conditions worsen, arise in the future, or extend longer than anticipated, or in other circumstances that we are not able to predict or mitigate. Even after COVID-19 subsides, our business, markets, growth prospects, and business model could continue to be materially impacted or altered.
Risks Relating to Our Business
Operational Risks
Premature termination of our management or franchise agreements could hurt our financial performance. Our hotel management and franchise agreements may be subject to premature termination in certain circumstances, such as the bankruptcy of a hotel owner or franchisee, the failure of the hotel owner or franchisee to comply with its payment or other obligations under the agreement, a failure under some agreements to meet specified financial or performance criteria which we do not cure, or in certain limited cases, other negotiated contractual termination rights. Some courts have also applied agency law principles and related fiduciary standards to managers of third-party hotel properties, including us (or have interpreted hotel management agreements to be “personal services contracts”). Property owners may assert the right to terminate management agreements even where the agreements provide otherwise, and some courts have upheld such assertions about our management agreements and may do so in the future. When terminations occur for certain of these or other reasons, we may need to enforce our right to damages for breach of contract and related claims, which may cause us to incur significant legal fees and expenses. We may have difficulty collecting damages from the hotel owner or franchisee, and any damages we ultimately collect could be less than the projected future value of the fees and other amounts we would have otherwise collected under the management or franchise agreement. A significant loss of these agreements could hurt our financial performance or our ability to grow our business.
Disagreements with owners of hotels that we manage or franchise may result in arbitration or litigation or delay implementation of product or service initiatives. Consistent with our focus on management and franchising, we own very few of our lodging properties. The nature of our responsibilities under our management agreements to manage each hotel and enforce the standards required for our brands under both management and franchise agreements may be subject to interpretation and will, from time to time, give rise to disagreements, which may include disagreements over the need for or payment for new product, service or systems initiatives, the timing and amount of capital investments, and reimbursement for operating costs, system costs, or other amounts. In the months following the onset of the COVID-19 pandemic, we saw an increase in such disagreements, and an increase in disagreements may become more likely again in the future during other periods when hotel returns are weaker. We seek to resolve any disagreements and to develop and maintain positive relations with current and potential hotel owners, franchisees, and real estate investment partners, but we cannot always do so. Failure to resolve such disagreements has resulted in arbitration or litigation, and could do so in the future. If any such dispute resolution process results in an adverse outcome, we could suffer significant losses, our profits could be reduced, or our future ability to operate our business could be constrained.
An increase in the use of third-party Internet services to book online hotel reservations could adversely impact our business. Some of our hotel rooms are booked through Internet travel intermediaries such as Expedia.com, Priceline.com,
Booking.com, Travelocity.com, and Orbitz.com, as well as lesser-known online travel service providers. These intermediaries initially focused on leisure travel, but now also provide offerings for corporate travel and group meetings. Although our Best Rate Guarantee and Member Rate programs have helped limit guest preference shift to intermediaries and greatly reduced the ability of intermediaries to undercut the published rates at our hotels, intermediaries continue to use a variety of aggressive online marketing methods to attract guests, including the purchase by certain companies of trademarked online keywords such as “Marriott” from Internet search engines such as Google, Bing, Yahoo, and Baidu to steer guests toward their websites. Our business and profitability could be harmed to the extent that online intermediaries succeed in significantly shifting loyalties from our lodging brands to their travel services, diverting bookings away from our direct online channels, or through their fees, increasing the overall cost of Internet bookings for our hotels. In addition, if we are not able to negotiate new agreements on satisfactory terms when our existing contracts with intermediaries (which generally have 2- to 3- year terms) come up for renewal, our business and prospects could be negatively impacted in a number of ways. For example, if newly negotiated agreements are on terms less favorable to our hotels than the expiring agreements, or if we are not able to negotiate new agreements and our hotels no longer appear on intermediary websites, our bookings could decline, our profits (and the operating profits of hotels in our system) could decline, and customers and owners may be less attracted to our brands. We may not be able to recapture or offset any such loss of business through actions we take to enhance our direct marketing and reservation channels or to rely on other channels or other intermediary websites.
Our growth strategy depends upon attracting third-party owners and franchisees to our platform, and future arrangements with these third parties may be less favorable to us, depending on the terms offered by our competitors. Our growth strategy for adding lodging facilities entails entering into and maintaining various arrangements with property owners. The terms of our management agreements and franchise agreements for each of our lodging facilities are influenced by contract terms offered by our competitors, among other things. We cannot assure you that any of our current arrangements will continue or that we will be able to renew agreements or enter into new agreements in the future on terms that are as favorable to us as those that exist today.
Our failure to comply with applicable laws and regulations may increase our costs, reduce our profits, or limit our growth. We and the hotels that we franchise or manage are subject to a variety of laws and regulations around the globe, including, among others, laws related to employment practices; marketing and advertising efforts; trade and economic sanctions; anti-bribery and anti-corruption; cybersecurity, data privacy, data localization and the handling of personally identifiable information; competition; the environment; health and safety; liquor sales; and the offer and sale of franchises. The compliance programs, internal controls, and policies we maintain and enforce to promote compliance with laws and regulations may not prevent our associates, contractors, or agents from materially violating these laws and regulations. The failure to meet the requirements of applicable laws or regulations, or publicity resulting from actual or alleged failures, could have a significant adverse effect on our results of operations or reputation.
The significance of our operations outside of the U.S. makes us susceptible to the risks of doing business internationally, which could lower our revenues, increase our costs, reduce our profits, disrupt our business, or damage our reputation. A significant number of rooms in our system are located outside of the U.S. and its territories, which exposes us to certain challenges and risks, many of which are outside of our control, and which could materially reduce our revenues or profits, materially increase our costs, result in significant liabilities or sanctions, significantly disrupt our business, or significantly damage our reputation. These challenges and risks include: (1) compliance with complex and changing laws, regulations, and government policies, including sanctions, that could have a material negative impact on our operations or our ability to pursue development opportunities, cause reputational damage, or otherwise affect us; (2) the difficulties involved in managing an organization doing business in many different countries; (3) uncertainties regarding the interpretation of local laws and the enforceability of contract and intellectual property rights under local laws; and (4) rapid changes in government policy, political or civil unrest, acts of terrorism, war, pandemics or other health emergencies, border control measures or other travel restrictions, or the threat of international boycotts or U.S. anti-boycott legislation.
Exchange rate fluctuations and foreign exchange hedging arrangements could result in significant foreign currency gains and losses and affect our business results. We earn revenues and incur expenses in foreign currencies as part of our operations outside of the U.S. Accordingly, fluctuations in currency exchange rates may significantly increase the amount of U.S. dollars required for foreign currency expenses or significantly decrease the U.S. dollars we receive from foreign currency revenues. We are also exposed to currency translation risk because the results of our non-U.S. business are generally reported in local currency, which we then translate to U.S. dollars for inclusion in our Financial Statements. As a result, exchange rate changes between foreign currencies and the U.S. dollar affect the amounts we record for our foreign assets, liabilities, revenues and expenses, and could have a negative effect on our financial results. To the extent that our international operations continue to grow, our exposure to foreign currency exchange rate fluctuations will grow. We enter into foreign exchange hedging agreements with financial institutions to mitigate exposure to some of the foreign currency fluctuations, but these efforts may not be successful. These hedging agreements also do not cover all currencies in which we do business, do not eliminate foreign
currency risk entirely for the currencies that they do cover, and involve costs and risks of their own in the form of transaction costs, credit requirements, and counterparty risk.
Our business depends on the quality and reputation of our Company and our brands, and any deterioration could adversely impact our market share, reputation, business, financial condition, or results of operations. Many factors can affect the reputation and value of our Company or one or more of our properties or brands, including our ability to protect and use our brands and trademarks; our hotels’ adherence to service and other brand standards; our approach to, or incidents involving, matters related to food quality and safety, guest and associate safety, health and cleanliness, managing and reducing our carbon footprint and our use of scarce natural resources, supply chain management, and diversity, human rights, and support for local communities; and our compliance with applicable laws. Reputational value is also based on perceptions, and broad access to social media makes it easy for anyone to provide public feedback that can influence perceptions of us, our brands, and our hotels, and it may be difficult to control or effectively manage negative publicity, regardless of whether it is accurate. While reputations may take decades to build, negative incidents can quickly erode trust and confidence, particularly if they result in adverse mainstream and social media publicity, governmental investigations, proceedings or penalties, or litigation. Negative incidents could lead to tangible adverse effects on our business, including lost sales, boycotts, reduced enrollment and/or participation in our Loyalty Program, loss of development opportunities, adverse government attention, or associate retention and recruiting difficulties. Any material decline in the reputation or perceived quality of our brands or corporate image could affect our market share, reputation, business, financial condition, or results of operations.
Actions by our franchisees and licensees or others could adversely affect our image and reputation. We franchise and license many of our brand names and trademarks to third parties for lodging, timeshare, and residential properties, and with respect to our credit card programs. Under the terms of their agreements with us, these third parties interact directly with guests and others under our brand and trade names. If these third parties fail to maintain or act in accordance with applicable brand standards; experience operational problems, including any data or privacy incident, or a circumstance involving guest or associate health or safety; or project a brand image inconsistent with ours, then our image and reputation could suffer. Although our agreements with these parties provide us with recourse and remedies in the event of a breach, including termination of the agreements under certain circumstances, it could be expensive or time-consuming for us to pursue such remedies and even if we are successful in pursuing such remedies, that may not be sufficient to mitigate reputational harm to us. We also cannot assure you that in every instance a court would ultimately enforce our contractual termination rights or that we could collect any awarded damages from the defaulting party.
Collective bargaining activity and strikes could disrupt our operations, increase our labor costs, and interfere with the ability of our management to focus on executing our business strategies. A significant number of associates at our managed, leased, and owned hotels are covered by collective bargaining agreements. If relationships with our organized associates or the unions that represent them become adverse, then the properties we operate could experience labor disruptions such as strikes, lockouts, boycotts, and public demonstrations. Numerous collective bargaining agreements are typically subject to negotiation each year, and our ability in the past to resolve such negotiations does not mean that we will be able to resolve future negotiations without strikes, disruptions, or on terms that we consider reasonable. Labor disputes and disruptions have in the past, and could in the future, result in adverse publicity or regulatory investigations and adversely affect operations and revenues at affected hotels. In addition, labor disputes and disruptions or increased demands from labor unions could harm our relationship with our associates, result in increased regulatory requirements or inquiries and enforcement by governmental authorities, harm our relationships with our guests and customers, divert management attention, and reduce customer demand for our services, all of which could have an adverse effect on our reputation, business, financial condition, or results of operations.
In addition, labor regulation and the negotiation of new or existing collective bargaining agreements could lead to higher wage and benefit costs, changes in work rules that raise operating expenses and legal costs, and could impose limitations on our ability or the ability of our third-party property owners to take cost saving measures during economic downturns. We do not have the ability to control the negotiations of collective bargaining agreements covering unionized labor employed by the operators of our franchised properties. Increased unionization of our workforce, new labor legislation, or changes in regulations could disrupt our operations, reduce our profitability, or interfere with the ability of our management to focus on executing our business strategies.
Our business could suffer if we cannot attract and retain associates or as the result of the loss of the services of our senior executives. We compete with other companies both within and outside of our industry for personnel. We have experienced challenges hiring for certain positions due to various factors, such as increasing wage expectations and competition for labor from other industries, and these circumstances could continue or worsen in the future to an extent and for durations that we are not able to predict. If we cannot recruit, train, develop, and retain sufficient numbers of associates, we could experience significant negative impacts on our operations, associate morale and turnover, guest satisfaction, or our internal control environment. Insufficient numbers of associates could also limit our ability to grow and expand our businesses. Labor
shortages have resulted and could continue to result in higher wages and initial hiring costs, increasing our labor costs and labor costs at our hotels, which could reduce our revenues and profits. In addition, the efforts and abilities of our senior executives are important elements of maintaining our competitive position and driving future growth, and the loss of the services of one or more of our senior executives could result in challenges executing our business strategies or other adverse effects on our business. The impact of COVID-19 on the hospitality industry, and actions that we and others in the hospitality industry have taken and may take in the future with respect to our associates and executives in response to COVID-19, have adversely affected and may in the future continue to adversely affect our ability to attract and retain associates and executives.
Risks relating to natural or man-made disasters, contagious diseases, violence, or war have reduced the demand for lodging, which has adversely affected our revenues. We have seen a decline in travel and reduced demand for lodging due to so-called “Acts of God,” such as severe storms, hurricanes, earthquakes, tsunamis, floods, volcanic activity, wildfires, and other natural disasters, as well as man-made disasters and the spread of contagious diseases in locations where we own, manage, or franchise properties and areas of the world from which we draw a large number of guests, and these circumstances could continue or worsen in the future to an extent and for durations that we are not able to predict. Actual or threatened war, terrorist activity, political unrest, civil or geopolitical strife, and other acts of violence could have a similar effect. As with the effects we have already experienced from the COVID-19 pandemic, any one or more of these events may reduce the overall demand for lodging, limit the room rates that can be charged, affect our growth, and/or increase our operating costs, all of which could adversely affect our profits. If a terrorist event or other incident of violence were to involve one or more of our branded properties, demand for our properties in particular could suffer disproportionately, which could further hurt our revenues and profits.
Climate change and sustainability related concerns could have a material adverse effect on our business and results of operations. We are subject to the risks associated with the physical effects of climate change (including changes in sea levels, water shortages, droughts, and the natural disasters discussed in the preceding paragraph) and with changes in laws and regulations related to climate change and sustainability. Compliance with future climate-related legislation and regulation, and our efforts to achieve science-based emissions reduction targets, could be difficult and costly. Consumer travel preferences may also shift due to sustainability related concerns or costs. As a result of the foregoing, we may experience significant increased operating and compliance costs, operating disruptions or limitations, reduced demand, constraints on our growth, and physical damage to our hotels, all of which could adversely affect our profits.
Insurance may not cover damage to, or losses involving, properties that we own, manage, or franchise, or other aspects of our business, and the cost of such insurance could increase. We require comprehensive property and liability insurance policies for our managed, leased, and owned properties with coverage features and insured limits that we believe are customary. We also require our franchisees to maintain similar levels of insurance. Market forces beyond our control may nonetheless limit the scope of the insurance coverage we, our hotel owners, or our franchisees can obtain, or our or their ability to obtain coverage at reasonable rates. Certain types of losses, generally of a catastrophic nature, such as earthquakes, hurricanes and floods, terrorist acts, pandemics, or liabilities that result from incidents involving the security of information systems, may result in high deductibles, low limits, or may be uninsurable, or the cost of obtaining insurance may be unacceptably high. As a result, we, our hotel owners, and our franchisees may not be successful in obtaining insurance without increases in cost or decreases in coverage levels, or may not be successful in obtaining insurance at all. For example, over the past several years following the severe and widespread damage caused by natural disasters, coupled with continued large global losses, the property, liability and other insurance markets have seen significant cost increases. Also, due to the data security incident involving unauthorized access to the Starwood reservations database, which we initially reported in November 2018 (the “Data Security Incident”), and the state of the cyber insurance market generally, the costs for our cyber insurance increased with each of our renewals over the last several years, and the cost of such insurance could continue to increase for future policy periods. Further, in the event of a substantial loss, the insurance coverage we, our hotel owners, or our franchisees carry may not be sufficient to pay the full market value or replacement cost of any lost investment or in some cases could result in certain losses being totally uninsured. As a result, our revenues and profits could be adversely affected, and for properties we own or lease, we could lose some or all of the capital that we have invested in the property and we could remain obligated for guarantees, debt, or other financial obligations.
If our brands, goodwill, or other intangible assets become impaired, we may be required to record significant non-cash charges to earnings. As of December 31, 2021, we had $18.0 billion of goodwill and other intangible assets. We review goodwill and indefinite-lived intangible assets for impairment annually or whenever events or circumstances indicate impairment may have occurred. Estimated fair values of our brands or reporting units could change if, for example, there are changes in the business climate, unanticipated changes in the competitive environment, adverse legal or regulatory actions or developments, changes in guests’ perception and the reputation of our brands, or changes in interest rates, operating cash flows, or market capitalization. Because of the significance of our goodwill and other intangible assets, any future impairment of these assets could require material non-cash charges to our results of operations, which could have a material adverse effect on our reported financial condition and results of operations.
Development and Financing Risks
Our hotel owners and franchisees depend on capital to buy, develop, and improve hotels, and they may be unable to access capital when necessary. Current and potential hotel owners and franchisees must periodically spend money to fund new hotel investments, as well as to refurbish and improve existing hotels. The availability of funds for new investments and improvement of existing hotels by our current and potential hotel owners and franchisees depends in large measure on their ability to access the capital markets, over which we have little control. Obtaining financing on attractive terms has been, and may in the future be further, constrained by the capital markets for hotel and real estate investments. In addition, owners of existing hotels that we franchise or manage may have difficulty meeting required debt service payments or refinancing loans at maturity.
Our ability to grow our management and franchise systems is subject to the range of risks associated with real estate investments. Our ability to sustain continued growth through management or franchise agreements for new hotels and the conversion of existing facilities to managed or franchised Marriott brands is affected, and may potentially be limited, by a variety of factors influencing real estate development generally. These include site availability, financing availability, planning, zoning and other local approvals, and other limitations that may be imposed by market and submarket factors, such as projected room occupancy and rate, changes in growth in demand compared to projected supply, territorial restrictions in our management and franchise agreements, costs of construction, demand for and availability of construction resources, and other disruptive conditions in global, regional, or local markets.
Our renovation activities expose us to project cost, completion, and resale risks. We occasionally acquire and renovate hotel properties, both directly and through partnerships and other business structures with third parties. This presents a number of risks, including that: (1) weakness in the capital markets may limit our ability, or that of third parties with whom we partner, to raise capital for completion of projects; (2) properties that we renovate could become less attractive due to decreases in demand for hotel properties, market absorption or oversupply, with the result that we may not be able to sell such properties for a profit or at the prices or time we anticipate, or we may be required to record additional impairment charges; and (3) construction delays or cost overruns, including those due to general market conditions, shortages or increased costs of skilled labor and/or materials, lender financial defaults, or so-called “Acts of God” such as earthquakes, hurricanes, floods, or fires may increase project costs. We could face similar risks to the extent we undertake development activities again in the future.
Our owned properties and other real estate investments subject us to numerous risks. We have a number of owned and leased properties, which are subject to the risks that generally relate to investments in real property. We may seek to sell some of these properties over time; however, equity real estate investments can be difficult to sell quickly and COVID-19 has disrupted the transaction markets for some hospitality assets. We may not be able to complete asset sales at prices we find acceptable, or at all. Moreover, the investment returns available from equity investments in real estate depend in large part on the amount of income earned and capital appreciation generated, if any, by the related properties, and the expenses incurred. A variety of other factors also affect income from properties and real estate values, including local market conditions and new supply of hotels, availability and costs of staffing, governmental regulations, insurance, zoning, tax and eminent domain laws, interest rate levels, and the availability of financing. Our real estate properties have been, and could in the future be, impacted by any of these factors, resulting in a material adverse impact on our results of operations or financial condition. If our properties continue to not generate revenue sufficient to meet operating expenses, including needed capital expenditures, our income could be further adversely affected, and we could be required to record additional significant non-cash impairment charges to our results of operations.
Risks associated with development and sale of residential properties associated with our lodging properties or brands may reduce our profits. We participate, through licensing agreements, in the development and sale of residential properties associated with our brands, including residences and condominiums under many of our luxury and premium brand names and trademarks. Such projects pose further risks beyond those generally associated with our lodging business, which may reduce our profits or compromise our brand equity, including risks that: (1) changes in residential real estate demand generally may reduce our profits and could make it more difficult to convince future project developers of the value added by our brands; (2) increases in interest rates, reductions in mortgage availability or the tax benefits of mortgage financing or residential ownership generally, or increases in the costs of residential ownership could prevent potential customers from buying residential products or reduce the prices they are willing to pay; and (3) residential construction may be subject to warranty and liability claims or claims related to purchaser deposits, and the costs of resolving such claims may be significant.
More hotel projects in our development pipeline may be cancelled or delayed in opening, which could adversely affect our growth prospects. We report a significant number of hotels in our development pipeline, including hotels under construction, hotels subject to signed contracts, and hotels approved for development but not yet under contract. The eventual opening of such pipeline hotels and, in particular, the approved hotels that are not yet under contract, is subject to numerous risks, including the risks described above in the risk factors entitled “Our ability to grow our management and franchise systems
is subject to the range of risks associated with real estate investments” and “COVID-19 has had a material detrimental impact on our business and financial results, and such impact could continue and may worsen for an unknown period of time.” We have seen construction timelines for pipeline hotels lengthen due to various factors, including competition for skilled construction labor, challenges related to financing, disruption in the supply chain for materials, and the impact of COVID-19 generally, and these circumstances could continue or worsen in the future. Accordingly, we cannot assure you that all of our development pipeline will result in new hotels entering our system, or that those hotels will open when we anticipate.
Losses on loans or loan guarantees that we have made to third parties impact our profits. At times, we make loans for hotel development, acquisition or renovation expenditures when we enter into or amend management or franchise agreements. From time to time we also provide third-party lenders with financial guarantees for the timely repayment of all or a portion of debt related to hotels that we manage or franchise, generally subject to an obligation that the owner reimburse us for any fundings. We have suffered losses, and could suffer losses in the future, when hotel owners or franchisees default on loans that we provide or fail to reimburse us for loan guarantees that we have funded.
If owners of hotels that we manage or franchise cannot repay or refinance mortgage loans secured by their properties, our revenues and profits could decrease and our business could be harmed. The owners of many of our managed or franchised properties have pledged their hotels as collateral for mortgage loans that they entered into when those properties were purchased or refinanced. If those owners cannot repay or refinance maturing indebtedness on favorable terms or at all, the lenders could declare a default, accelerate the related debt, and foreclose on the property, or the owners could declare bankruptcy, as we have seen in the past and could see in the future. Such foreclosures or bankruptcies have in the past and could in the future, in some cases, result in the termination of our management or franchise agreements and eliminate our anticipated income and cash flows, which could have a significant negative effect on our results of operations.
Changes affecting the availability of the London Interbank Offered Rate (“LIBOR”) may have consequences that we cannot yet fully predict. We are a party to various agreements, such as our multicurrency revolving credit agreement (as amended, the “Credit Facility”), and other instruments where obligations by or to us are calculated based on or otherwise dependent on LIBOR, many of which have not yet replaced LIBOR with an alternative benchmark rate. Effective January 1, 2022, the one week and two month USD LIBOR tenors and all tenors for EUR, CHF, JPY and GBP LIBOR are no longer being published, and all other USD LIBOR tenors will cease to be published after June 30, 2023. At this time, it is difficult for us to predict the full effect of any changes from LIBOR to an alternative benchmark rate upon or prior to the final LIBOR cessation date, the phase out of LIBOR generally, or the establishment and use of particular alternative benchmark rates to replace LIBOR. There continues to be uncertainty about how we, the financial markets, applicable law, and the courts will address the replacement of LIBOR with alternative benchmark rates for contracts that do not include fallback provisions to provide for such alternative benchmark rates. In addition, any changes from LIBOR to an alternative benchmark rate may have an uncertain impact on our cost of funds, our receipts or payments under agreements that reference LIBOR, and the valuation of derivative or other contracts to which we are a party, any of which could impact our results of operations and cash flows.
Technology, Information Protection, and Privacy Risks
Any disruption in the functioning of our reservation systems could adversely affect our performance and results. We manage global reservation systems or use third-party service providers’ reservation systems that communicate reservations to our properties from individuals who book reservations directly with us online, through our mobile apps, through our telephone call centers, or through intermediaries like travel agents, Internet travel websites, and other distribution channels. The cost, speed, accuracy, and efficiency of our reservation systems are critical aspects of our business and are important considerations for hotel owners when choosing our brands. Our business may suffer if we fail to maintain, upgrade, or prevent disruption to our reservation systems. Disruptions in or changes to our reservation systems could result in a disruption to our business and the loss of important data.
A failure to keep pace with developments in technology could impair our operations or competitive position. The lodging industry continues to demand the use of sophisticated technology and systems, including those used for our reservation, revenue management, property management, human resources and payroll systems, our Loyalty Program, and technologies we make available to our guests and for our associates. These technologies and systems must be refined, updated, and/or replaced with more advanced systems on a regular basis, and our business could suffer if we cannot do that as quickly or effectively as our competitors or within budgeted costs and time frames. We also may not achieve the benefits that we anticipate from any new technology or system, and a failure to do so could result in higher than anticipated costs or lower guest satisfaction or could impair our operating results.
We are exposed to risks and costs associated with protecting the integrity and security of Company, associate, and guest data. In the operation of our business, we collect, store, use, and transmit large volumes of data regarding associates, guests, customers, owners, licensees, franchisees, and our own business operations, including credit card numbers, reservation
and loyalty data, and other personal information, in various information systems that we maintain and in systems maintained by third parties, including our owners, franchisees, licensees, and service providers. The integrity and protection of this data is critical to our business. Our guests and associates also have a high expectation that we, as well as our owners, franchisees, licensees, and service providers, will adequately protect and appropriately use their personal information. The information, security, and privacy requirements imposed by global laws and governmental regulation, our contractual obligations, and the requirements of the payment card industry continue to become increasingly stringent in many jurisdictions in which we operate. Our systems and the systems maintained or used by our owners, franchisees, licensees, and service providers may not be able to satisfy these changing legal and regulatory requirements and associate and guest expectations, or may require significant additional investments or time to do so. We have incurred and may in the future incur significant additional costs to meet these requirements, obligations, and expectations, and in the event of alleged or actual noncompliance, we may experience increased operating costs, increased exposure to fines and litigation, and increased risk of damage to our reputation and brand.
The Data Security Incident, and other information security incidents, could have numerous adverse effects on our business. As a result of the Data Security Incident, numerous lawsuits were filed against us, as described further in Note 7. We may be named as a party in additional lawsuits and other claims may be asserted by or on behalf of guests, customers, hotel owners, stockholders, or others seeking monetary damages or other relief related to the Data Security Incident. A number of federal, state, and foreign governmental authorities have also made inquiries, opened investigations, or requested information and/or documents related to the Data Security Incident, including under various data protection and privacy regulations. Responding to and resolving these lawsuits, claims, and/or investigations has resulted in fines and other expenses, such as the £18.4 million fine imposed by the Information Commissioner’s Office in the United Kingdom (the “ICO”) in connection with the ICO’s final decision issued in October 2020, and could result in material additional fines or remedial or other expenses. Other governmental authorities investigating or seeking information about the Data Security Incident may impose undertakings, injunctive relief, consent decrees, or other civil or criminal penalties, which could, among other things, materially increase our costs or otherwise require us to alter how we operate our business. Significant management time and Company resources have been, and will continue to be, devoted to the Data Security Incident. Future publicity or developments related to the Data Security Incident, including as a result of subsequent reports or regulatory actions or developments, could have a range of other adverse effects on our business or prospects, including causing or contributing to loss of consumer confidence, reduced consumer demand, reduced enrollment and/or participation in our Loyalty Program, and associate retention and recruiting difficulties. Insurance coverage designed to limit our exposure to losses such as those related to the Data Security Incident may not be sufficient or available to cover all of our expenses or other losses (including the final fine imposed by the ICO and any other fines or penalties) related to the Data Security Incident, and certain expenses by their nature (such as, for example, expenses related to enhancing our cybersecurity program) are not covered by our insurance program. In addition, following our March 31, 2020 announcement of an incident involving information for approximately 5.5 million guests that we believe may have been improperly accessed through an application using the login credentials of two franchise employees at a franchise property (the “Unauthorized Application Access Incident”), various governmental authorities opened investigations or requested information about the incident, and two lawsuits were filed against us related to the incident which have since been dismissed or otherwise resolved. The Unauthorized Application Access Incident or publicity related to it could negatively affect our business or reputation.
Additional cybersecurity incidents could have adverse effects on our business. We have implemented enhanced security measures to safeguard our systems and data, and we intend to continue implementing additional measures in the future, but, as we have seen in the past, our measures may not be sufficient to maintain the confidentiality, security, or availability of the data we collect, store, and use to operate our business. Measures taken by our service providers or our owners, franchisees, licensees, other business partners or their service providers also, as we have seen in the past, may not be sufficient. Efforts to hack or circumvent security measures, efforts to gain unauthorized access to, exploit or disrupt the operation or integrity of our data or systems, failures of systems or software to operate as designed or intended, viruses, “ransomware” or other malware, “supply chain” attacks, “phishing” or other types of business communications compromises, operator error, or inadvertent releases of data have impacted, and may in the future impact, our information systems and records or those of our owners, franchisees, licensees, other business partners, or service providers. Our reliance on computer, Internet-based, and mobile systems and communications, and the frequency and sophistication of efforts by third parties to gain unauthorized access or prevent authorized access to such systems, have greatly increased in recent years. Our increased reliance on cloud-based services and on remote access to information systems in response to COVID-19 increases the Company’s exposure to potential cybersecurity incidents. We have experienced cyberattacks, attempts to disrupt access to our systems and data, and attempts to affect the operation or integrity of our data or systems, and the frequency and sophistication of such efforts could continue to increase. Any additional significant theft of, unauthorized access to, compromise or loss of, loss of access to, or fraudulent use of guest, associate, owner, franchisee, licensee, or Company data could adversely impact our reputation and could result in legal, regulatory and other consequences, including remedial and other expenses, fines, or litigation. Depending on the nature and scope of the event, future compromises in the security of our information systems or those of our owners, franchisees, licensees, other business partners, or service providers or other future disruptions or compromises of data or systems could lead
to future interruptions in or other adverse effects on the operation of our systems or those of our owners, franchisees, licensees, other business partners, or service providers, resulting in operational inefficiencies and a loss of profits, and could result in negative publicity and other adverse effects on our business, including lost sales, loss of consumer confidence, boycotts, reduced enrollment and/or participation in our Loyalty Program, litigation, or associate satisfaction, retention and recruiting difficulties, all of which could materially affect our market share, reputation, business, financial condition, or results of operations.
Because we have experienced cybersecurity incidents in the past, additional incidents or the failure to detect and appropriately respond to additional incidents could magnify the severity of the adverse effects on our business. The techniques used to obtain unauthorized access, disable or degrade service, or sabotage information systems change frequently, can be difficult to detect for long periods of time, and can involve difficult or prolonged assessment or remediation periods even once detected, which could also magnify the severity of these adverse effects. We cannot assure you that all potential causes of past significant incidents have been identified and remediated; additional measures may be needed to prevent significant incidents in the future. The steps we take may not be sufficient to prevent future significant incidents and as a result, such incidents may occur again. Although we carry cyber insurance that is designed to protect us against certain losses related to cyber risks, that insurance coverage may not be sufficient or available to cover all expenses or other losses (including fines) or all types of claims that may arise in connection with cyberattacks, security compromises, and other related incidents. Furthermore, in the future such insurance may not be available on commercially reasonable terms, or at all.
Changes in privacy and data security laws could increase our operating costs and increase our exposure to fines and litigation. We are subject to numerous, complex, and frequently changing laws, regulations, and contractual obligations designed to protect personal information. Non-U.S. data privacy and data security laws, various U.S. federal and state laws, payment card industry security standards, and other information privacy and security standards are all applicable to us. Significant legislative, judicial, or regulatory changes have been and could be issued in the future. Compliance with changes in applicable data security and privacy laws and regulations and contractual obligations, including responding to investigations into our compliance, has increased and may in the future increase our operating costs, and may restrict our business operations, increase our exposure to fines and litigation in the event of alleged noncompliance, and adversely affect our reputation. Following the Data Security Incident, certain regulators also opened investigations into our privacy and security policies and practices. As a result of these investigations, we could be exposed to significant fines and remediation costs in addition to those imposed as a result of the Data Security Incident, and adverse publicity related to the investigations could adversely affect our reputation.
Changes in laws could adversely affect our ability to market our products effectively. We rely on a variety of direct marketing techniques, including email marketing, online advertising, and postal mailings. Any further restrictions in laws such as the proposed ePrivacy Regulation (EU) and the proposed Bill C-11 for the Digital Charter Implementation Act 2020 (Canada), various U.S. state laws, or new federal or state laws on marketing and solicitation or international privacy, e-privacy, and anti-spam laws that govern these activities could adversely affect the continuing effectiveness of email, online advertising, and postal mailing techniques and could force further changes in our marketing strategy. If this occurs, we may not be able to develop adequate alternative marketing strategies, which could impact the amount and timing of our sales of certain products. We also obtain access to potential guests and customers from travel service providers or other companies with whom we have substantial relationships, and we market to some individuals on these lists directly or by including our marketing message in the other companies’ marketing materials. If access to these lists were to be prohibited or otherwise restricted, our ability to develop new guests and customers and introduce them to our products could be impaired.
Governance Risk
Delaware law and our governing corporate documents contain, and our Board of Directors could implement, anti-takeover provisions that could deter takeover attempts. Under the Delaware business combination statute, a stockholder holding 15 percent or more of our outstanding voting stock could not acquire us without Board of Directors’ consent for at least three years after the date the stockholder first held 15 percent or more of the voting stock. Our governing corporate documents also, among other things, require supermajority votes for mergers and similar transactions. In addition, our Board of Directors could, without stockholder approval, implement other anti-takeover defenses, such as a stockholder rights plan.
Item 1B. Unresolved Staff Comments.
None.
Item 2. Properties.
We describe our company-operated properties in Part I, Item 1, “Business,” earlier in this report, and under the “Properties and Rooms” caption in Part II, Item 7, “Management’s Discussion and Analysis of Financial Condition and Results
of Operations.” We believe our owned and leased properties are in generally good physical condition with the need for only routine repairs and maintenance and periodic capital improvements. Most of our regional offices, reservation centers, and sales offices, as well as our corporate headquarters, are in leased facilities, both domestically and internationally.
As of December 31, 2021, we owned or leased the following hotel properties:
| | | | | | | | | | | | | | | | |
| Properties | | | | Location | | Rooms |
U.S. & Canada Owned Hotels | | | | | | |
| | | | | | |
| Courtyard Las Vegas Convention Center | | | | Las Vegas, NV | | 149 | |
| Las Vegas Marriott | | | | Las Vegas, NV | | 278 | |
| Residence Inn Las Vegas Convention Center | | | | Las Vegas, NV | | 192 | |
| The Westin Peachtree Plaza, Atlanta | | | | Atlanta, GA | | 1,073 | |
| W New York – Union Square | | | | New York, NY | | 270 | |
U.S. & Canada Leased Hotels | | | | | | |
| Albuquerque Airport Courtyard | | | | Albuquerque, NM | | 150 | |
| Anaheim Marriott | | | | Anaheim, CA | | 1,030 | |
| Baltimore BWI Airport Courtyard | | | | Linthicum, MD | | 149 | |
| Baton Rouge Acadian Centre/LSU Area Courtyard | | | | Baton Rouge, LA | | 149 | |
| Chicago O'Hare Courtyard | | | | Des Plaines, IL | | 180 | |
| Des Moines West/Clive Courtyard | | | | Clive, IA | | 108 | |
| Fort Worth University Drive Courtyard | | | | Fort Worth, TX | | 130 | |
| Greensboro Courtyard | | | | Greensboro, NC | | 149 | |
| Indianapolis Airport Courtyard | | | | Indianapolis, IN | | 151 | |
| Irvine John Wayne Airport/Orange County Courtyard | | | | Irvine, CA | | 153 | |
| | | | | | |
| Louisville East Courtyard | | | | Louisville, KY | | 151 | |
| Mt. Laurel Courtyard | | | | Mt. Laurel, NJ | | 151 | |
| Newark Liberty International Airport Courtyard | | | | Newark, NJ | | 146 | |
| Orlando Airport Courtyard | | | | Orlando, FL | | 149 | |
| Orlando International Drive/Convention Center Courtyard | | | | Orlando, FL | | 151 | |
| Renaissance New York Times Square Hotel | | | | New York, NY | | 317 | |
| Sacramento Airport Natomas Courtyard | | | | Sacramento, CA | | 149 | |
| San Diego Sorrento Valley Courtyard | | | | San Diego, CA | | 149 | |
| Spokane Downtown at the Convention Center Courtyard | | | | Spokane, WA | | 149 | |
| St. Louis Downtown West Courtyard | | | | St. Louis, MO | | 151 | |
| W New York – Times Square | | | | New York, NY | | 509 | |
| | | | | | |
| International Owned Hotels | | | | | | |
| | | | | | |
| Courtyard by Marriott Aberdeen Airport | | | | Aberdeen, United Kingdom | | 194 | |
| Courtyard by Marriott Rio de Janeiro Barra da Tijuca | | | | Barra da Tijuca, Brazil | | 264 | |
| Courtyard by Marriott Toulouse Airport | | | | Toulouse, France | | 187 | |
| Colony Club, Barbados | | | | Barbados | | 96 | |
| Crystal Cove, Barbados | | | | Barbados | | 88 | |
| Marriott Puerto Vallarta Resort & Spa | | | | Puerto Vallarta, Mexico | | 433 | |
| Residence Inn Rio de Janeiro Barra da Tijuca | | | | Barra da Tijuca, Brazil | | 140 | |
| Sheraton Grand Rio Hotel & Resort | | | | Rio de Janeiro, Brazil | | 538 | |
| Sheraton Lima Hotel & Convention Center | | | | Lima, Peru | | 431 | |
| Sheraton Mexico City Maria Isabel Hotel | | | | Mexico City, Mexico | | 755 | |
| Tamarind, Barbados | | | | Barbados | | 104 | |
| The House, Barbados | | | | Barbados | | 34 | |
| Treasure Beach, Barbados | | | | Barbados | | 35 | |
| Turtle Beach, Barbados | | | | Barbados | | 161 | |
| Waves, Barbados | | | | Barbados | | 70 | |
| International Leased Hotels | | | | | | |
| | | | | | |
| African Pride Melrose Arch, Autograph Collection | | | | Johannesburg, South Africa | | 118 | |
| Berlin Marriott Hotel | | | | Berlin, Germany | | 379 | |
| Cape Town Marriott Hotel Crystal Towers | | | | Cape Town, South Africa | | 180 | |
| | | | | | | | | | | | | | | | |
| Properties | | | | Location | | Rooms |
| Courtyard by Marriott Paris Gare de Lyon | | | | Paris, France | | 249 | |
| Frankfurt Marriott Hotel | | | | Frankfurt, Germany | | 593 | |
| Grosvenor House, A JW Marriott Hotel | | | | London, United Kingdom | | 496 | |
| Heidelberg Marriott Hotel | | | | Heidelberg, Germany | | 248 | |
| Hotel Alfonso XIII, a Luxury Collection Hotel, Seville | | | | Seville, Spain | | 148 | |
| Hotel Maria Cristina, San Sebastian | | | | San Sebastian, Spain | | 139 | |
| Leipzig Marriott Hotel | | | | Leipzig, Germany | | 231 | |
| Protea Hotel by Marriott Cape Town Sea Point | | | | Cape Town, South Africa | | 124 | |
| Protea Hotel by Marriott Midrand | | | | Midrand, South Africa | | 177 | |
| Protea Hotel by Marriott O.R. Tambo Airport | | | | Johannesburg, South Africa | | 213 | |
| | | | | | |
| | | | | | |
| Protea Hotel Fire & Ice! by Marriott Cape Town | | | | Cape Town, South Africa | | 201 | |
| Protea Hotel Fire & Ice! by Marriott Johannesburg Melrose Arch | | | | Johannesburg, South Africa | | 197 | |
| | | | | | |
| Renaissance Hamburg Hotel | | | | Hamburg, Germany | | 205 | |
| Renaissance Santo Domingo Jaragua Hotel & Casino | | | | Santo Domingo, Dominican Republic | | 300 | |
| Sheraton Diana Majestic, Milan | | | | Milan, Italy | | 106 | |
| The Ritz-Carlton, Berlin | | | | Berlin, Germany | | 303 | |
| The Ritz-Carlton, Tokyo | | | | Tokyo, Japan | | 247 | |
| The St. Regis Osaka | | | | Osaka, Japan | | 160 | |
| W Barcelona | | | | Barcelona, Spain | | 473 | |
| W London – Leicester Square | | | | London, United Kingdom | | 192 | |
| | | | | | |
Item 3. Legal Proceedings.
See the information under the “Litigation, Claims, and Government Investigations” caption in Note 7, which we incorporate here by reference. Within this section, we use a threshold of $1 million in disclosing material environmental proceedings involving a governmental authority.
In May 2020, we received a notice from the District Attorneys of the Counties of Placer, Riverside, San Francisco and San Mateo in California asserting that nine properties in California have failed to comply with certain state statutes regulating hazardous and other waste handling and disposal. We are cooperating with the District Attorneys’ requests for information and have entered into a tolling agreement with the District Attorneys. Management does not believe that the ultimate outcome of this matter will have a material adverse effect on the Company.
From time to time, we are also subject to other legal proceedings and claims in the ordinary course of business, including adjustments proposed during governmental examinations of the various tax returns we file. While management presently believes that the ultimate outcome of these other proceedings, individually and in aggregate, will not materially harm our financial position, cash flows, or overall trends in results of operations, legal proceedings are inherently uncertain, and unfavorable rulings could, individually or in aggregate, have a material adverse effect on our business, financial condition, or operating results.
Item 4. Mine Safety Disclosures.
Not applicable.
Information about our Executive Officers
See the information under “Information about our Executive Officers” in Part III, Item 10 of this report for information about our executive officers, which we incorporate here by reference.
PART II
Item 5. Market for Registrant’s Common Equity, Related Stockholder Matters, and Issuer Purchases of Equity Securities.
Market Information
At February 8, 2022, 326,311,111 shares of our Class A Common Stock (our “common stock”) were outstanding and were held by 33,148 stockholders of record. Our common stock trades on the Nasdaq Global Select Market (“Nasdaq”) under the trading symbol MAR.
Fourth Quarter 2021 Issuer Purchases of Equity Securities
| | | | | | | | | | | | | | | | | | | | | | | |
| (in millions, except per share amounts) | | | | | | | |
| Period | Total Number
of Shares
Purchased | | Average Price
per Share | | Total Number of Shares Purchased as Part of Publicly Announced Plans or Programs (1) | | Maximum Number of Shares That May Yet Be Purchased Under the Plans or Programs (1) |
| October 1, 2021-October 31, 2021 | — | | | $ | — | | | — | | | 17.4 | |
| November 1, 2021-November 30, 2021 | — | | | $ | — | | | — | | | 17.4 | |
| December 1, 2021-December 31, 2021 | — | | | $ | — | | | — | | | 17.4 | |
(1)On February 28, 2019, we announced that our Board of Directors increased our common stock repurchase authorization by 25 million shares. At year-end 2021, 17.4 million shares remained available for repurchase under Board approved authorizations. We repurchase shares in the open market and in privately negotiated transactions. We do not anticipate repurchasing additional shares until our leverage ratios further improve.
Item 6. [Reserved]
Item 7. Management’s Discussion and Analysis of Financial Condition and Results of Operations.
A discussion regarding our financial condition and results of operations for year-end 2020 compared to year-end 2019 can be found in Part II, Item 7, “Management’s Discussion and Analysis of Financial Condition and Results of Operations,” of our Annual Report on Form 10-K/A for the fiscal year ended December 31, 2020, as filed with the SEC on April 2, 2021 (“2020 Form 10-K”).
BUSINESS AND OVERVIEW
Overview
We are a worldwide operator, franchisor, and licensor of hotel, residential, and timeshare properties in 139 countries and territories under 30 brand names. Under our asset-light business model, we typically manage or franchise hotels, rather than own them. We discuss our operations in the following reportable business segments: U.S. & Canada and International.
We earn base management fees and, under many agreements, incentive management fees from the properties that we manage, and we earn franchise fees on the properties that others operate under franchise agreements with us. In most markets, base management and franchise fees typically consist of a percentage of property-level revenue, or certain property-level revenue in the case of franchise fees, while incentive management fees typically consist of a percentage of net house profit after a specified owner return. For our hotels in the Middle East and Africa, Asia Pacific excluding China, and Greater China regions, incentive management fees typically consist of a percentage of gross operating profit without adjustment for a specified owner return. Net house profit is calculated as gross operating profit (also referred to as “house profit”) less non-controllable expenses such as property insurance, real estate taxes, and furniture, fixtures, and equipment (FF&E) reserves. Additionally, we earn franchise fees for use of our intellectual property, including fees from our co-brand credit card, timeshare, and residential programs.
On September 23, 2016, we completed the acquisition of Starwood Hotels & Resorts Worldwide, LLC, formerly known as Starwood Hotels & Resorts Worldwide, Inc. (“Starwood”), through a series of transactions, after which Starwood became an indirect wholly-owned subsidiary of the Company. We refer to the Starwood business and brands that we acquired as “Legacy-Starwood.”
Performance Measures
We believe Revenue per Available Room (“RevPAR”), which we calculate by dividing room sales for comparable properties by room nights available for the period, is a meaningful indicator of our performance because it measures the period-over-period change in room revenues for comparable properties. RevPAR may not be comparable to similarly titled measures, such as revenues, and should not be viewed as necessarily correlating with our fee revenue. We also believe occupancy and average daily rate (“ADR”), which are components of calculating RevPAR, are meaningful indicators of our performance. Occupancy, which we calculate by dividing occupied rooms by total rooms available (including rooms in hotels temporarily closed due to issues related to COVID-19), measures the utilization of a property’s available capacity. ADR, which we calculate by dividing property room revenue by total rooms sold, measures average room price and is useful in assessing pricing levels. Comparisons to prior periods are on a constant U.S. dollar basis. We calculate constant dollar statistics by applying exchange rates for the current period to the prior comparable period.
We define our comparable properties as our properties that were open and operating under one of our brands since the beginning of the last full calendar year (since January 1, 2020 for the current period) and have not, in either the current or previous year: (1) undergone significant room or public space renovations or expansions, (2) been converted between company-operated and franchised, or (3) sustained substantial property damage or business interruption, with the exception of properties closed or otherwise experiencing interruptions related to COVID-19, which we continue to classify as comparable. For 2021 compared to 2020, we had 4,906 comparable U.S. & Canada properties and 1,510 comparable International properties. The RevPAR, ADR, and occupancy comparisons between 2021 and 2019, which we discuss under the “Impact of COVID-19” caption below, reflect properties that are defined as comparable as of December 31, 2021, even if in 2019 they were not open and operating for the full year or did not meet all the other criteria listed above.
Impact of COVID-19
COVID-19 continues to have a material impact on our business and industry. However, the recovery of both global demand and ADR continued in 2021, led primarily by robust leisure demand, which we expect to continue in 2022, and travelers who continue to embrace multi-purpose trips, mixing remote work and vacation time. The spread of COVID-19 variants, such as Delta and Omicron, constrained the pace of the recovery in the latter half of 2021 and continues to constrain the pace of recovery in the beginning of 2022. Business transient and group demand continued to slowly improve in 2021 when
compared to 2020, though this demand still remains meaningfully below pre-pandemic 2019 levels. Although we have seen delays in the recovery of business transient and group demand as a result of the emergence of COVID-19 variants, we expect this demand to gradually strengthen from current levels as more workers return to the office and travel again. We have been encouraged by the swift improvement in ADR, which in the 2021 second half returned to pre-pandemic 2019 levels in certain U.S. and International markets and are optimistic about sustaining strong ADR in 2022. However, we believe COVID-19 will continue to have a material negative impact on our future results for a period of time that we are currently unable to predict.
Comparable systemwide constant dollar RevPAR in 2021 compared to 2020 improved 67.7 percent in our U.S. & Canada segment, 40.6 percent in our International segment, and 60.4 percent worldwide. Comparable systemwide constant dollar RevPAR in 2021 compared to pre-pandemic 2019 levels declined 32.5 percent in our U.S. & Canada segment, 46.6 percent in our International segment, and 36.5 percent worldwide, with improvement in the decline each succeeding quarter during 2021 for each of our segments and worldwide. Worldwide comparable systemwide occupancy and constant dollar ADR were down only 11.9 percentage points and 2.3 percent, respectively, in the 2021 fourth quarter compared to the 2019 fourth quarter, leading to RevPAR 19.0 percent below pre-pandemic 2019 levels.
In the U.S. & Canada, demand continued to recover in 2021, driven by strong leisure demand particularly at our luxury and resort hotels and in tertiary markets. Occupancy peaked in the 2021 third quarter before decreasing slightly in the 2021 fourth quarter primarily due to seasonality. Urban destinations, where we have a large presence in the U.S. & Canada, experienced meaningful improvement in demand in 2021, though they continue to lag the recovery. In other parts of the world, RevPAR continues to vary greatly by geographic market, and demand is heavily impacted by the number of COVID-19 cases, vaccination rates, and the nature and degree of government restrictions. In the 2021 fourth quarter, the decline of comparable systemwide constant dollar RevPAR when compared to pre-pandemic 2019 levels improved compared to the decline seen in the 2021 third quarter in all our International regions except for Greater China, which remained flat as a result of strict government restrictions in response to COVID-19 outbreaks in several regions.
We continue to take measures to mitigate the negative financial and operational impacts of COVID-19 for our hotel owners and our own business. At the corporate level, we remain focused on managing our corporate general and administrative costs and are being disciplined with respect to our capital expenditures and other investment spending. Share repurchases and cash dividends remain suspended until our leverage ratios further improve, although assuming there is no meaningful setback in the global recovery from COVID-19, we could restart some level of capital returns in the second half of 2022 and more meaningful levels of capital returns in 2023 and beyond. In 2021, we substantially completed restructuring plans to achieve cost savings specific to our company-operated properties. In addition, we continue to work with owners and franchisees by adjusting renovation requirements for certain properties, deferring certain hotel initiatives, and supporting owners and franchisees who are working with their lenders to utilize FF&E reserves to meet working capital needs.
We continue to evaluate the availability of stimulus tax credits under the Coronavirus Aid, Relief, and Economic Security Act, the Taxpayer Certainty and Disaster Tax Relief Act of 2020 enacted as part of the Consolidated Appropriations Act, 2021, the American Rescue Plan Act of 2021 (“ARPA”), and other legislation. As of February 1, 2022, we have received Employee Retention Tax Credit (“ERTC”) refunds from the U.S. Treasury totaling $170 million, including $119 million in 2020 and $51 million in 2021, of which we passed through $94 million and $48 million, respectively, to the related hotels that we manage on behalf of owners. We have received from the U.S. Treasury substantially all expected ERTC refunds based on applications that we have submitted as of February 1, 2022. Additionally, as of December 31, 2021, we have received or expect to receive, through Medicare tax offsets and payments from the U.S. Treasury pursuant to ARPA, a total of $35 million as reimbursement for the cost of health coverage continuation provided to eligible former associates and furloughed or part-time associates (and their eligible enrolled dependents) in accordance with requirements under the Consolidated Omnibus Budget Reconciliation Act of 1985 for the period of April 1, 2021 to September 30, 2021. Finally, in 2021, we received subsidies totaling $28 million from German government COVID-19 assistance programs for certain of our leased hotels and equity method investments in Germany.
The impact of COVID-19 on the Company remains fluid, as does our corporate and property-level response. We expect to continue to assess the situation and may implement additional measures to adapt our operations and plans to address the implications of COVID-19 on our business. The overall operational and financial impact is highly dependent on the breadth and duration of COVID-19 and could be affected by other factors we are not currently able to predict.
Starwood Data Security Incident
On November 30, 2018, we announced a data security incident involving unauthorized access to the Starwood reservations database (the “Data Security Incident”). The Starwood reservations database is no longer used for business operations.
We are currently unable to estimate the range of total possible financial impact to the Company from the Data Security Incident in excess of the expenses already incurred. However, we do not believe this incident will impact our long-term financial health. Although our insurance program includes coverage designed to limit our exposure to losses such as those related to the Data Security Incident, that insurance may not be sufficient or available to cover all of our expenses or other losses (including fines and penalties) related to the Data Security Incident. In addition, certain expenses by their nature (such as, for example, expenses related to enhancing our cybersecurity program) are not covered by our insurance program. We expect to incur significant expenses associated with the Data Security Incident in future periods, primarily related to legal proceedings and regulatory investigations (including possible additional fines and penalties), increased expenses and capital investments for information technology and information security and data privacy, and increased expenses for compliance activities and to meet increased legal and regulatory requirements. See Note 7 for additional information related to expenses incurred in 2021, insurance recoveries, and legal proceedings and governmental investigations related to the Data Security Incident.
System Growth and Pipeline
In 2021, our system grew from 7,642 properties (1,423,044 rooms) at year-end 2020 to 7,989 properties (1,479,179 rooms) at year-end 2021, reflecting gross additions of 517 properties (86,372 rooms) and deletions of 171 properties (30,236 rooms), including 88 properties from a primarily select-service portfolio which left our system in the 2021 first quarter. Approximately 50 percent of our 2021 gross room additions are located outside U.S. & Canada, and 21 percent were conversions from competitor brands.
At year-end 2021, we had roughly 485,000 rooms in our development pipeline, which includes more than 202,000 hotel rooms under construction and approximately 19,000 hotel rooms approved for development but not yet under signed contracts. Over half of the rooms in our development pipeline are outside U.S. & Canada. In 2021, we signed management and franchise agreements for 599 properties, representing approximately 92,000 rooms, of which more than half of the rooms are located outside U.S. & Canada. Contracts signed in 2021 reflected the Company’s strength in the luxury tier, with 40 properties signed (resulting in a total of nearly 50,000 luxury rooms in our development pipeline at year-end 2021), as well as strong momentum in all-inclusive resort signings, with 22 properties signed in 2021. In addition, in 2021, longer stay brands, which include Element Hotels, Residence Inn, and TownePlace Suites, accounted for 37 percent of the Company's rooms signings in U.S. & Canada. Conversions accounted for 27 percent of rooms signings in 2021.
In 2022, we expect total gross rooms growth to approach 5.0 percent and net rooms growth of 3.5 to 4.0 percent.
Properties and Rooms
At year-end 2021, we operated, franchised, and licensed the following properties and rooms:
| | | | | | | | | | | | | | | | | | | | | | | | | | | | | | | | | | | | | | | | | | | | | | | | | | | | | | | | | | | | | | | |
| | Managed | | Franchised/Licensed | | Owned/Leased | | | | Residential | | Total |
| Properties | | Rooms | | Properties | | Rooms | | Properties | | Rooms | | | | | | Properties | | Rooms | | Properties | | Rooms |
U.S. & Canada | 638 | | | 218,798 | | | 4,983 | | | 713,781 | | | 26 | | | 6,483 | | | | | | | 65 | | | 6,925 | | | 5,712 | | | 945,987 | |
International | 1,305 | | | 334,374 | | | 805 | | | 163,955 | | | 38 | | | 9,209 | | | | | | | 37 | | | 2,953 | | | 2,185 | | | 510,491 | |
| | | | | | | | | | | | | | | | | | | | | | | |
| | | | | | | | | | | | | | | | | | | | | | | |
| Timeshare | — | | | — | | | 92 | | | 22,701 | | | — | | | — | | | | | | | — | | | — | | | 92 | | | 22,701 | |
| Total | 1,943 | | | 553,172 | | | 5,880 | | | 900,437 | | | 64 | | | 15,692 | | | | | | | 102 | | | 9,878 | | | 7,989 | | | 1,479,179 | |
Lodging Statistics
The following tables present RevPAR, occupancy, and ADR statistics for comparable properties for 2021 and 2021 compared to 2020. Systemwide statistics include data from our franchised properties, in addition to our company-operated properties. | | | | | | | | | | | | | | | | | | | | | | | | | | | | | | | | | | | | | | |
| |
| RevPAR | | Occupancy | | Average Daily Rate |
| 2021 | | vs. 2020 | | 2021 | | vs. 2020 | | | 2021 | | vs. 2020 |
| | | | | | | | | | | | |
| | | | | | | | | | | | |
| | | | | | | | | | | | |
| | | | | | | | | | | | |
| Comparable Company-Operated Properties | | | | | | | | | | | | |
U.S. & Canada | $ | 95.79 | | | 85.1 | % | | 47.1 | % | | 19.9 | % | pts. | | $ | 203.44 | | | 6.8 | % |
| Greater China | $ | 67.01 | | | 28.5 | % | | 55.5 | % | | 9.7 | % | pts. | | $ | 120.67 | | | 6.0 | % |
| | | | | | | | | | | | |
| Asia Pacific excluding China | $ | 40.45 | | | 0.7 | % | | 36.4 | % | | 5.5 | % | pts. | | $ | 111.05 | | | (14.5) | % |
| Caribbean & Latin America | $ | 78.07 | | | 63.3 | % | | 43.6 | % | | 15.6 | % | pts. | | $ | 179.04 | | | 4.8 | % |
| Europe | $ | 64.63 | | | 81.5 | % | | 33.4 | % | | 12.8 | % | pts. | | $ | 193.55 | | | 11.8 | % |
| Middle East & Africa | $ | 84.18 | | | 59.6 | % | | 51.5 | % | | 15.7 | % | pts. | | $ | 163.51 | | | 10.8 | % |
| | | | | | | | | | | | |
International - All (1) | $ | 63.17 | | | 39.1 | % | | 44.5 | % | | 10.7 | % | pts. | | $ | 142.01 | | | 5.8 | % |
Worldwide (2) | $ | 78.01 | | | 61.5 | % | | 45.7 | % | | 14.9 | % | pts. | | $ | 170.83 | | | 8.9 | % |
| Comparable Systemwide Properties | | | | | | | | | | | | |
U.S. & Canada | $ | 81.55 | | | 67.7 | % | | 55.2 | % | | 18.4 | % | pts. | | $ | 147.84 | | | 11.7 | % |
| Greater China | $ | 64.06 | | | 26.9 | % | | 54.2 | % | | 9.0 | % | pts. | | $ | 118.09 | | | 5.8 | % |
| Asia Pacific excluding China | $ | 43.23 | | | 2.2 | % | | 37.8 | % | | 6.1 | % | pts. | | $ | 114.50 | | | (14.3) | % |
| Caribbean & Latin America | $ | 63.98 | | | 74.3 | % | | 41.8 | % | | 16.6 | % | pts. | | $ | 152.94 | | | 5.0 | % |
| Europe | $ | 56.23 | | | 71.3 | % | | 32.6 | % | | 11.5 | % | pts. | | $ | 172.71 | | | 10.7 | % |
| Middle East & Africa | $ | 77.69 | | | 60.3 | % | | 50.6 | % | | 15.5 | % | pts. | | $ | 153.52 | | | 11.2 | % |
| | | | | | | | | | | | |
International - All (1) | $ | 58.75 | | | 40.6 | % | | 42.4 | % | | 10.8 | % | pts. | | $ | 138.71 | | | 4.8 | % |
Worldwide (2) | $ | 74.66 | | | 60.4 | % | | 51.3 | % | | 16.1 | % | pts. | | $ | 145.56 | | | 10.0 | % |
(1)Includes Greater China, Asia Pacific excluding China, Caribbean & Latin America, Europe, and Middle East & Africa.
(2)Includes U.S. & Canada and International - All.
CONSOLIDATED RESULTS
Our results in 2021 continued to be impacted by COVID-19. See the “Impact of COVID-19” section above for more information about the impact to our business during 2021, and the discussion below for additional analysis of our consolidated results of operations for 2021 compared to 2020.
Fee Revenues
| | | | | | | | | | | | | | | | | | | | | | | | | | | | | |
| ($ in millions) | 2021 | | 2020 | | | | Change 2021 vs. 2020 | | |
| Base management fees | $ | 669 | | | $ | 443 | | | | | $ | 226 | | | 51 | % | | | | |
| Franchise fees | 1,790 | | | 1,153 | | | | | 637 | | | 55 | % | | | | |
| Incentive management fees | 235 | | | 87 | | | | | 148 | | | 170 | % | | | | |
| Gross fee revenues | 2,694 | | | 1,683 | | | | | 1,011 | | | 60 | % | | | | |
| Contract investment amortization | (75) | | | (132) | | | | | 57 | | | 43 | % | | | | |
| Net fee revenues | $ | 2,619 | | | $ | 1,551 | | | | | $ | 1,068 | | | 69 | % | | | | |
The increase in base management fees primarily reflected higher RevPAR due to the ongoing recovery in lodging demand from the impacts of COVID-19.
The increase in franchise fees primarily reflected higher RevPAR due to the ongoing recovery in lodging demand from the impacts of COVID-19, higher co-brand credit card fees ($102 million), unit growth ($89 million), and higher residential branding fees ($39 million).
The increase in incentive management fees primarily reflected higher profits at certain managed hotels due to the ongoing recovery in lodging demand from the impacts of COVID-19. In 2021, we earned incentive management fees from 47 percent of our managed properties worldwide, compared to 37 percent in 2020. We earned incentive management fees from 13 percent of our U.S. & Canada managed properties and 63 percent of our International managed properties in 2021, compared to 3 percent in U.S. & Canada and 56 percent in International in 2020. In addition, 71 percent of our total incentive management fees in 2021 came from our International managed properties versus 92 percent in 2020.
Contract investment amortization changed primarily due to lower impairments of investments in management and franchise contracts.
Owned, Leased, and Other
| | | | | | | | | | | | | | | | | | | | | | | | | | | | | |
| ($ in millions) | 2021 | | 2020 | | | | Change 2021 vs. 2020 | | |
| Owned, leased, and other revenue | $ | 796 | | | $ | 568 | | | | | $ | 228 | | | 40 | % | | | | |
| Owned, leased, and other - direct expenses | 734 | | | 677 | | | | | 57 | | | 8 | % | | | | |
| Owned, leased, and other, net | $ | 62 | | | $ | (109) | | | | | $ | 171 | | | nm* | | | | |
* Percentage change is not meaningful.
Owned, leased, and other revenue, net of direct expenses increased primarily due to net stronger results at our owned and leased properties driven by the ongoing recovery in lodging demand from the impacts of COVID-19, higher termination fees of $20 million, and $18 million of subsidies under German government COVID-19 assistance programs for certain of our leased hotels.
Cost Reimbursements
| | | | | | | | | | | | | | | | | | | | | | | | | | | | | |
| ($ in millions) | 2021 | | 2020 | | | | Change 2021 vs. 2020 | | |
| Cost reimbursement revenue | $ | 10,442 | | | $ | 8,452 | | | | | $ | 1,990 | | | 24 | % | | | | |
| Reimbursed expenses | 10,322 | | | 8,435 | | | | | 1,887 | | | 22 | % | | | | |
| Cost reimbursements, net | $ | 120 | | | $ | 17 | | | | | $ | 103 | | | nm* | | | | |
* Percentage change is not meaningful.
Cost reimbursements, net (cost reimbursement revenue, net of reimbursed expenses) varies due to timing differences between the costs we incur for centralized programs and services and the related reimbursements we receive from hotel owners and franchisees. Over the long term, our centralized programs and services are not designed to impact our economics, either positively or negatively. See Note 2 for more information about the accounting for cost reimbursements, including our Loyalty Program.
The increase in cost reimbursements, net primarily reflects higher revenues, net of expenses, for our centralized programs and services. This increase is partially offset by higher expenses for our Loyalty Program.
Other Operating Expenses
| | | | | | | | | | | | | | | | | | | | | | | | | | | | | |
| ($ in millions) | 2021 | | 2020 | | | | Change 2021 vs. 2020 | | |
| Depreciation, amortization, and other | $ | 220 | | | $ | 346 | | | | | $ | (126) | | | (36) | % | | | | |
| General, administrative, and other | 823 | | | 762 | | | | | 61 | | | 8 | % | | | | |
| Restructuring and merger-related charges | 8 | | | 267 | | | | | (259) | | | (97) | % | | | | |
Depreciation, amortization, and other expenses decreased primarily due to lower impairment charges. See Note 8 for more information about the operating lease impairment charges.
General, administrative, and other expenses increased primarily due to higher compensation costs compared to our 2020 cost reduction measures, which included reducing compensation, implementing reduced work weeks for many of our corporate associates, and furloughing a substantial number of associates, as well as higher legal expenses ($34 million). The increase was partially offset by a lower provision for credit losses ($76 million) and a favorable litigation settlement ($18 million).
Restructuring and merger-related charges decreased primarily due to the prior year increase to the put option liability discussed in Note 7 ($243 million) and 2020 restructuring charges ($56 million), partially offset by the 2020 partial reversal of the liability related to the ICO fine, which was reduced to £18.4 million in October 2020 ($39 million).
Non-Operating Income (Expense)
| | | | | | | | | | | | | | | | | | | | | | | | | | | | | |
| ($ in millions) | 2021 | | 2020 | | | | Change 2021 vs. 2020 | | |
| Gains and other income, net | $ | 10 | | | $ | 9 | | | | | $ | 1 | | | 11 | % | | | | |
| Loss on extinguishment of debt | (164) | | | — | | | | | (164) | | | nm* | | | | |
| Interest expense | (420) | | | (445) | | | | | 25 | | | 6 | % | | | | |
| Interest income | 28 | | | 27 | | | | | 1 | | | 4 | % | | | | |
| Equity in losses | (24) | | | (141) | | | | | 117 | | | 83 | % | | | | |
* Percentage change is not meaningful.
In the 2021 third quarter, we recorded a loss on extinguishment of debt due to the Tender Offer discussed in Note 9.
Interest expense changed, primarily due to lower Credit Facility and commercial paper average borrowings and interest rates, partially offset by higher interest on Senior Note issuances, net of maturities.
Equity in losses changed, primarily due to 2020 impairment losses ($77 million) and the ongoing recovery in lodging demand from the impacts of COVID-19.
Income Taxes
| | | | | | | | | | | | | | | | | | | | | | | | | | | | | |
| ($ in millions) | 2021 | | 2020 | | | | Change 2021 vs. 2020 | | |
(Provision) benefit for income taxes | $ | (81) | | | $ | 199 | | | | | $ | (280) | | | (141) | % | | | | |
Our tax provision in 2021, compared to our tax benefit in 2020, primarily reflected the increase in operating income ($256 million), lower tax benefit from impairment charges ($64 million) and the prior year tax benefit from the Sheraton Grand Chicago put option reserve ($61 million). The change was partially offset by the current year release of tax reserves due to favorable audit resolutions during 2021 ($43 million) and a current year tax benefit from the loss on extinguishment of debt ($42 million).
BUSINESS SEGMENTS
Our segment results in 2021 continued to be impacted by COVID-19. See the “Impact of COVID-19” section above for more information about the impact to our business during 2021 and the discussion below for additional analysis of the operating results of our reportable business segments.
| | | | | | | | | | | | | | | | | | | | | | | | | | | | | |
| ($ in millions) | 2021 | | 2020 | | | | Change 2021 vs. 2020 | | |
U.S. & Canada | | | | | | | | | | | | | |
| Segment revenues | $ | 10,356 | | | $ | 7,905 | | | | | $ | 2,451 | | | 31 | % | | | | |
| Segment profit | 1,394 | | | 198 | | | | | 1,196 | | | 604 | % | | | | |
International | | | | | | | | | | | | | |
| Segment revenues | 2,254 | | | 1,597 | | | | | 657 | | | 41 | % | | | | |
| Segment profit (loss) | 258 | | | (222) | | | | | 480 | | | 216 | % | | | | |
| | | | | | | | | | | | | |
| | | | | | | | | | | | | |
| | | | | | | | | | | | | |
| | | | | | | | | | | | | | | | | | | | | | | | | | | | | | | | | | | | | | | | | | | | | | | |
| Properties | | Rooms |
| December 31, 2021 | | December 31, 2020 | | vs. December 31, 2020 | | December 31, 2021 | | December 31, 2020 | | vs. December 31, 2020 |
U.S. & Canada | 5,712 | | | 5,534 | | | 178 | | | 3 | % | | 945,987 | | | 924,090 | | | 21,897 | | | 2 | % |
International | 2,185 | | | 2,017 | | | 168 | | | 8 | % | | 510,491 | | | 476,199 | | | 34,292 | | | 7 | % |
U.S. & Canada
U.S. & Canada segment profit increased primarily due to the following:
•$666 million of higher gross fee revenues, primarily reflecting higher comparable systemwide RevPAR driven by increases in both occupancy and ADR as well as higher profits at certain managed hotels due to the ongoing recovery in lodging demand from the impacts of COVID-19, unit growth, and higher residential branding fees, partially offset by lower fees from properties that were terminated;
•$131 million of higher cost reimbursement revenue, net of reimbursed expenses;
•$117 million of lower depreciation, amortization, and other expenses, primarily reflecting lower operating lease impairment charges;
•$84 million of lower equity in losses, primarily reflecting prior year impairment charges ($60 million) and lower losses recorded by investees due to the ongoing recovery in lodging demand from the impacts of COVID-19;
•$62 million of higher owned, leased, and other revenue, net of direct expenses, primarily reflecting net stronger results at owned and leased properties due to the ongoing recovery in lodging demand from the impacts of COVID-19;
•$55 million of lower general, administrative, and other expenses, primarily reflecting lower provision for credit losses ($34 million) and a favorable litigation settlement ($18 million);
•$53 million of lower contract investment amortization costs, primarily reflecting lower contract impairment charges; and
•$28 million of lower restructuring and merger-related charges.
International
International 2021 segment profit, compared to the 2020 segment loss, primarily reflected:
•$230 million of higher gross fee revenues, primarily reflecting higher comparable systemwide RevPAR driven by increases in both occupancy and ADR as well as higher profits at certain managed hotels due to the ongoing recovery in lodging demand from the impacts of COVID-19, unit growth, and higher residential branding fees;
•$108 million of higher owned, leased, and other revenue, net of direct expenses, primarily reflecting net stronger results at owned and leased properties due to the ongoing recovery in lodging demand from the impacts of COVID-19, subsidies under German government COVID-19 assistance programs for certain of our leased hotels, and higher termination fees;
•$69 million of higher cost reimbursement revenue, net of reimbursed expenses;
•$27 million of lower general, administrative, and other expenses primarily reflecting lower provision for credit losses; and
•$18 million of lower equity in losses primarily due to the ongoing recovery in lodging demand from the impacts of COVID-19.
STOCK-BASED COMPENSATION
See Note 5 for more information.
NEW ACCOUNTING STANDARDS
We do not expect that accounting standard updates issued to date and that are effective after December 31, 2021 will have a material effect on our Financial Statements.
LIQUIDITY AND CAPITAL RESOURCES
Our long-term financial objectives include diversifying our financing sources, optimizing the mix and maturity of our long-term debt, and reducing our working capital. At year-end 2021, our long-term debt had a weighted average interest rate of 3.4 percent and a weighted average maturity of approximately 6.5 years. Including the effect of interest rate swaps, the ratio of our fixed-rate long-term debt to our total long-term debt was 0.8 to 1.0 at year-end 2021.
In response to the negative impact COVID-19 had on our cash from operations in 2021 and 2020, which we expect to continue to be negatively impacted, we remain focused on preserving our financial flexibility and managing our debt maturities. We also remain focused on managing our corporate general and administrative costs and our capital expenditures and other investment spending. Share repurchases and dividends remain suspended until our leverage ratios further improve, although assuming there is no meaningful setback in the global recovery from COVID-19, we could restart some level of capital returns in the second half of 2022 and more meaningful levels of capital returns in 2023 and beyond. In 2021, we issued $1.8 billion aggregate principal amount of senior notes, redeemed all $400 million aggregate principal amount of our Series N Notes, and repurchased and retired $1 billion aggregate principal amount of our Series EE Notes maturing in 2025, which we discuss further under the “Sources of Liquidity - Senior Notes Issuances, Redemptions, and Repurchases” section below and in Note 9.
We monitor the status of the capital markets and regularly evaluate the effect that changes in capital market conditions may have on our ability to fund our liquidity needs. We currently believe the Credit Facility, our cash on hand, and our access to capital markets remain adequate to meet our liquidity requirements.
Sources of Liquidity
Our Credit Facility
Our Credit Facility provides for up to $4.5 billion of aggregate borrowings for general corporate needs, including working capital, capital expenditures, letters of credit, acquisitions, and to support our commercial paper program if and when we resume issuing commercial paper. Borrowings under the Credit Facility generally bear interest at LIBOR (the London Interbank Offered Rate) plus a spread, based on our public debt rating. We also pay quarterly fees on the Credit Facility at a rate based on our public debt rating. We classify outstanding borrowings under the Credit Facility and outstanding commercial paper borrowings (if any) as long-term based on our ability and intent to refinance the outstanding borrowings on a long-term basis. The Credit Facility expires on June 28, 2024. As of December 31, 2021, we had total outstanding borrowings under the Credit Facility of $1.1 billion and remaining borrowing capacity of $3.4 billion.
We entered into amendments to the Credit Facility in April 2020 and January 2021 (the “Credit Facility Amendments”), as described in our Annual Report on Form 10-K for the fiscal year ended December 31, 2020, as amended. The debt leverage covenant in the Credit Facility, which is tested each quarter and was waived pursuant to the Credit Facility Amendments through and including the fourth quarter of 2021, resumes beginning with the quarter ending March 31, 2022. The Credit Facility Amendments adjusted the required leverage levels for this covenant when it is re-imposed (starting at 5.50 to 1.00 for the test period ending on March 31, 2022 and gradually stepping down to 4.00 to 1.00 over the succeeding five fiscal quarters, as further described in the Credit Facility). The Credit Facility Amendments also amended certain other terms of the Credit Facility, including reducing the rate floor for the LIBOR Daily Floating Rate and the Eurocurrency Rate.
Our outstanding public debt does not contain a corresponding financial covenant or a requirement that we maintain certain financial ratios. We currently satisfy the covenants in our Credit Facility.
Senior Notes Issuances, Redemptions, and Repurchases
In January 2022, we made a $404 million cash payment of principal and interest to retire, at maturity, all of our outstanding Series Q Notes.
In September 2021, we completed a tender offer (the “Tender Offer”) and purchased and retired $1 billion aggregate principal amount of our 5.750 percent Series EE Notes maturing May 1, 2025. We used the net proceeds from our Series II Notes offering described below and cash on hand to complete the repurchase of such Series EE Notes, including the payment of accrued interest and other costs incurred. As a result of the Tender Offer, in the 2021 third quarter, we recorded a loss of $164 million in the “Loss on extinguishment of debt” caption of our Income Statements.
In September 2021, we issued $700 million aggregate principal amount of 2.750 percent Series II Notes due October 15, 2033 (the “Series II Notes”). We will pay interest on the Series II Notes in April and October of each year, commencing in April 2022. We received net proceeds of approximately $693 million from the offering of the Series II Notes, after deducting the underwriting discount and estimated expenses. We used the net proceeds to fund the Tender Offer, as further described above.
In August 2021, we redeemed all $400 million aggregate principal amount of our Series N Notes due in October 2021.
In March 2021, we issued $1.1 billion aggregate principal amount of 2.850 percent Series HH Notes due April 15, 2031 (the “Series HH Notes”). We pay interest on the Series HH Notes in April and October of each year. We received net proceeds of approximately $1,089 million from the offering of the Series HH Notes, after deducting the underwriting discount and estimated expenses, which were made available for general corporate purposes, including the repayment of a portion of our outstanding borrowings under the Credit Facility.
Commercial Paper
Due to changes to our credit ratings as a result of the impact of COVID-19 on our business, we currently are not issuing commercial paper. As a result, we have had to rely more on borrowings under the Credit Facility and issuance of senior notes, which carry higher interest costs than commercial paper.
Uses of Cash
Cash, cash equivalents, and restricted cash totaled $1,421 million at December 31, 2021, an increase of $527 million from year-end 2020, primarily due to net cash provided by operating activities ($1,177 million) and Credit Facility borrowings, net of repayments ($150 million), partially offset by Senior Notes repayments, net of issuances ($368 million), capital and technology expenditures ($183 million), cash paid for debt extinguishment costs associated with the Tender Offer ($155 million), and financing outflows for employee stock-based compensation withholding taxes ($90 million).
Cash from Operations
Net cash provided by operating activities decreased by $462 million in 2021 compared to 2020, primarily due to net cash inflow from our Loyalty Program in 2020 and higher cash paid for income taxes, partially offset by higher net income recorded in 2021 (adjusted for non-cash items and the loss on extinguishment of debt). Cash inflow from our Loyalty Program in 2020 included $920 million of cash received from the prepayment of certain future revenues under the amendments to our existing U.S.-issued co-brand credit card agreements, which reduced in 2021 and will in the future reduce the amount of cash we receive from these card issuers.
Our ratio of current assets to current liabilities was 0.6 to 1.0 at year-end 2021 and 0.5 to 1.0 at year-end 2020. We have significant borrowing capacity under our Credit Facility should we need additional working capital.
Investing Activities Cash Flows
Capital Expenditures and Other Investments. We made capital and technology expenditures of $183 million in 2021 and $135 million in 2020. Capital expenditures in 2021 increased by $48 million compared to 2020, primarily reflecting higher spending on our new headquarters.
We expect capital expenditures and other investments will total approximately $600 million to $700 million for 2022, including capital and technology expenditures, loan advances, contract acquisition costs, and other investing activities (including approximately $250 million for maintenance capital spending and our new headquarters).
Over time, we have sold lodging properties, both completed and under development, subject to long-term management agreements. The ability of third-party purchasers to raise the debt and equity capital necessary to acquire such properties depends in part on the perceived risks in the lodging industry and other constraints inherent in the capital markets. We monitor the status of the capital markets and regularly evaluate the potential impact of changes in capital market conditions on our business operations. We have made, and expect to continue making, selective and opportunistic investments to add units to our lodging business, which may include property acquisitions and renovations, new construction, loans, guarantees, and equity investments. Over time, we seek to minimize capital invested in our business through asset sales subject to long-term management or franchise agreements.
Dispositions. Property and asset sales generated $12 million cash proceeds in 2021 and $260 million in 2020.
Loan Activity. From time to time, we make loans to owners of hotels that we operate or franchise. Loan collections, net of loan advances, amounted to $27 million in 2021, compared to net advances of $33 million in 2020. At year-end 2021, we had $153 million of senior, mezzanine, and other loans outstanding, compared to $163 million outstanding at year-end 2020.
Financing Activities Cash Flows
Debt. Debt decreased by $238 million in 2021, to $10,138 million at year-end 2021 from $10,376 million at year-end 2020. See “Sources of Liquidity,” caption in this “Liquidity and Capital Resources” section and Note 9 for additional information on the Senior Note and Credit Facility transactions in 2021.
Share Repurchases and Dividends. We did not repurchase any shares of our common stock in 2021. At year-end 2021, 17.4 million shares remained available for repurchase under Board approved authorizations. We also did not declare any cash dividends in 2021. We do not anticipate repurchasing additional shares or declaring cash dividends until our leverage ratios further improve. Assuming there is no meaningful setback in the global recovery from COVID-19, we could restart some level of capital returns in the second half of 2022 and more meaningful levels of capital returns in 2023 and beyond.
Material Cash Requirements
Our material cash requirements include the following contractual obligations and off-balance sheet arrangements.
•At year-end 2021, we had $12,169 million of debt, including principal and future interest payments, of which $1,134 million is payable within the next 12 months from year-end 2021. See Note 9 for further information about our long-term debt.
•We enter into operating and finance leases primarily for hotels, offices, and equipment, which are discussed in Note 8.
•At December 31, 2021, projected Deemed Repatriation Transition Tax payments under the U.S. tax legislation enacted on December 22, 2017, commonly referred to as the 2017 Tax Cuts and Jobs Act, totaled $349 million, of which $43 million is payable within the next 12 months from year-end 2021.
•The Company also had guarantees, a contingent purchase obligation, commitments, and letters of credit as of year-end 2021, which are discussed in Note 7. The majority of our guarantee commitments are not expected to be funded within the next 12 months from year-end 2021. In addition to the purchase obligations discussed in Note 7, in the normal course of business, we enter into purchase commitments and incur other obligations to manage the daily operating needs of the hotels that we manage. Since our contracts with owners require reimbursement for these amounts, these obligations are expected to have minimal impact on our net income and cash flow.
CRITICAL ACCOUNTING POLICIES AND ESTIMATES
Our preparation of financial statements in accordance with GAAP requires management to make estimates and assumptions that affect reported amounts and related disclosures. Management considers an accounting policy and estimate to be critical if: (1) we must make assumptions that were uncertain when the estimate was made; and (2) changes in the estimate, or selection of a different estimate methodology could have a material effect on our consolidated results of operations or financial condition. Management has discussed the development and selection of its critical accounting policies and estimates with the Audit Committee of our Board of Directors.
While we believe that our estimates, assumptions, and judgments are reasonable, they are based on information available when the estimate or assumption was made. Actual results may differ significantly. Additionally, changes in our assumptions, estimates or assessments due to unforeseen events or otherwise could have a material impact on our financial position or results of operations.
See Note 2 for further information related to our critical accounting policies and estimates, which are as follows:
Loyalty Program, including how we estimate the breakage of hotel points, credit card points, and free night certificates, the volume of points and free night certificates that will be issued under our co-brand credit card agreements, the amount of consideration to which we will be entitled under our co-brand credit card agreements, and the stand-alone selling prices of goods and services provided under our co-brand credit card agreements. Changes in these estimates could result in material changes to our liability for guest loyalty program and Loyalty Program revenue. Based on the conditions existing at December 31, 2021 and holding other factors constant, a one percent decrease in our estimate of the breakage of points could result in an increase in the liability for guest loyalty program of approximately $40 million. The breakage impact may vary significantly depending on the specific Loyalty Program points for which the anticipated breakage changes.
Goodwill, including how we evaluate the fair value of reporting units and when we record an impairment loss on goodwill. During the 2021 fourth quarter, we conducted our annual goodwill impairment test and no impairment charges were recorded. The estimated fair values of all our reporting units significantly exceeded their carrying values at the date of their most recent estimated fair value determination.
Intangibles and Long-Lived Assets, including how we evaluate the fair value of intangibles and long-lived assets and when we record impairment losses on intangibles and long-lived assets. During 2021, we evaluated our intangibles and long-lived asset groups for impairment and did not record any material impairment charges. The estimated fair values of all our indefinite-lived intangible assets significantly exceeded their carrying values at the date of their most recent estimated fair value determination.
Investments, including information on how we evaluate the fair value of investments and when we record impairment losses on investments. During 2021, we evaluated our investments for impairment and did not record any material impairment charges.
Item 7A. Quantitative and Qualitative Disclosures About Market Risk.
We are exposed to market risk from changes in interest rates, stock prices, currency exchange rates, and debt prices. We manage our exposure to these risks by monitoring available financing alternatives, through the development and application of credit granting policies, and by entering into derivative arrangements. We do not foresee any significant changes in either our exposure to fluctuations in interest rates or currency rates or how we manage such exposure in the future.
We are exposed to interest rate risk on our floating-rate notes receivable and floating-rate debt. Changes in interest rates also impact the fair value of our fixed-rate notes receivable and the fair value of our fixed-rate long-term debt.
We use derivative instruments, including cash flow hedges, fair value hedges, net investment in non-U.S. operations hedges, and other derivative instruments, as part of our overall strategy to manage our exposure to market risks associated with fluctuations in interest rates and currency exchange rates. As a matter of policy, we only enter into transactions that we believe will be highly effective at offsetting the underlying risk, and we do not use derivatives for trading or speculative purposes. See Note 2 for more information on derivative instruments.
The following table sets forth the scheduled maturities and the total fair value as of year-end 2021 for our financial instruments that are impacted by market risks:
| | | | | | | | | | | | | | | | | | | | | | | | | | | | | | | | | | | | | | | | | | | | | | | |
| | Maturities by Period | | | | |
| ($ in millions) | 2022 | | 2023 | | 2024 | | 2025 | | 2026 | | There-
after | | Total
Carrying
Amount | | Total
Fair
Value |
Assets - Maturities represent expected principal receipts. Fair values represent assets. |
| Fixed-rate notes receivable | $ | 6 | | | $ | 2 | | | $ | 9 | | | $ | 2 | | | $ | 2 | | | $ | 28 | | | $ | 49 | | | $ | 43 | |
| Average interest rate | | | | | | | | | | | | | 1.03 | % | | |
| Floating-rate notes receivable | $ | 3 | | | $ | 42 | | | $ | 16 | | | $ | 1 | | | $ | 3 | | | $ | 39 | | | $ | 104 | | | $ | 97 | |
| Average interest rate | | | | | | | | | | | | | 3.06 | % | | |
Liabilities - Maturities represent expected principal payments. Fair values represent liabilities. |
| Fixed-rate debt | $ | (572) | | | $ | (675) | | | $ | — | | | $ | (1,302) | | | $ | (746) | | | $ | (4,855) | | | $ | (8,150) | | | $ | (8,615) | |
| Average interest rate | | | | | | | | | | | | | 3.69 | % | | |
| Floating-rate debt | $ | (226) | | | $ | — | | | $ | (1,616) | | | $ | — | | | $ | — | | | $ | — | | | $ | (1,842) | | | $ | (1,853) | |
| Average interest rate | | | | | | | | | | | | | 1.52 | % | | |
Item 8. Financial Statements and Supplementary Data.
The following financial information is included on the pages indicated:
MANAGEMENT’S REPORT ON
INTERNAL CONTROL OVER FINANCIAL REPORTING
Management of Marriott International, Inc. (the “Company”) is responsible for establishing and maintaining adequate internal control over financial reporting and for assessing the effectiveness of internal control over financial reporting. The Company has designed its internal control over financial reporting to provide reasonable assurance on the reliability of financial reporting and the preparation of the consolidated financial statements in accordance with U.S. generally accepted accounting principles.
The Company’s internal control over financial reporting includes those policies and procedures that: (1) pertain to the maintenance of records that, in reasonable detail, accurately and fairly reflect the Company’s transactions and dispositions of the Company’s assets; (2) provide reasonable assurance that transactions are recorded as necessary to permit preparation of the consolidated financial statements in accordance with U.S. generally accepted accounting principles, and that receipts and expenditures of the Company are being made only in accordance with authorizations of the Company’s management and directors; and (3) provide reasonable assurance regarding prevention or timely detection of unauthorized acquisition, use, or disposition of the Company’s assets that could have a material effect on the consolidated financial statements.
Because of inherent limitations in internal control over financial reporting, such controls may not prevent or detect misstatements. Also, projections of any evaluation of the effectiveness of internal controls to future periods are subject to the risk that controls may become inadequate because of changes in conditions, or that the degree of compliance with the policies or procedures may deteriorate.
In connection with the preparation of the Company’s annual consolidated financial statements, management assessed the effectiveness of the Company’s internal control over financial reporting as of December 31, 2021, based on criteria established in the Internal Control-Integrated Framework issued by the Committee of Sponsoring Organizations of the Treadway Commission (2013 Framework) (the “COSO criteria”).
Based on this assessment, management has concluded that, applying the COSO criteria, as of December 31, 2021, the Company’s internal control over financial reporting was effective to provide reasonable assurance of the reliability of financial reporting and the preparation of financial statements for external purposes in accordance with U.S. generally accepted accounting principles.
Ernst & Young LLP, the independent registered public accounting firm that audited the Company’s consolidated financial statements included in this report, has issued an attestation report on the effectiveness of the Company’s internal control over financial reporting, a copy of which appears on the following page.
REPORT OF INDEPENDENT REGISTERED PUBLIC ACCOUNTING FIRM
To the Stockholders and Board of Directors of Marriott International, Inc.
Opinion on Internal Control over Financial Reporting
We have audited Marriott International, Inc.’s internal control over financial reporting as of December 31, 2021, based on criteria established in Internal Control-Integrated Framework issued by the Committee of Sponsoring Organizations of the Treadway Commission (2013 Framework) (the COSO criteria). In our opinion, Marriott International, Inc. (the Company) maintained, in all material respects, effective internal control over financial reporting as of December 31, 2021, based on the COSO criteria.
We also have audited, in accordance with the standards of the Public Company Accounting Oversight Board (United States) (PCAOB), the consolidated balance sheets of the Company as of December 31, 2021 and 2020, and the related consolidated statements of income (loss), comprehensive income (loss), stockholders’ equity and cash flows for each of the three fiscal years in the period ended December 31, 2021, and the related notes, and our report dated February 15, 2022 expressed an unqualified opinion thereon.
Basis for Opinion
The Company’s management is responsible for maintaining effective internal control over financial reporting and for its assessment of the effectiveness of internal control over financial reporting included in the accompanying Management’s Report on Internal Control Over Financial Reporting. Our responsibility is to express an opinion on the Company’s internal control over financial reporting based on our audit. We are a public accounting firm registered with the PCAOB and are required to be independent with respect to the Company in accordance with the U.S. federal securities laws and the applicable rules and regulations of the Securities and Exchange Commission and the PCAOB.
We conducted our audit in accordance with the standards of the PCAOB. Those standards require that we plan and perform the audit to obtain reasonable assurance about whether effective internal control over financial reporting was maintained in all material respects.
Our audit included obtaining an understanding of internal control over financial reporting, assessing the risk that a material weakness exists, testing and evaluating the design and operating effectiveness of internal control based on the assessed risk, and performing such other procedures as we considered necessary in the circumstances. We believe that our audit provides a reasonable basis for our opinion.
Definition and Limitations of Internal Control Over Financial Reporting
A company’s internal control over financial reporting is a process designed to provide reasonable assurance regarding the reliability of financial reporting and the preparation of financial statements for external purposes in accordance with generally accepted accounting principles. A company’s internal control over financial reporting includes those policies and procedures that (1) pertain to the maintenance of records that, in reasonable detail, accurately and fairly reflect the transactions and dispositions of the assets of the company; (2) provide reasonable assurance that transactions are recorded as necessary to permit preparation of financial statements in accordance with generally accepted accounting principles, and that receipts and expenditures of the company are being made only in accordance with authorizations of management and directors of the company; and (3) provide reasonable assurance regarding prevention or timely detection of unauthorized acquisition, use, or disposition of the company’s assets that could have a material effect on the financial statements.
Because of its inherent limitations, internal control over financial reporting may not prevent or detect misstatements. Also, projections of any evaluation of effectiveness to future periods are subject to the risk that controls may become inadequate because of changes in conditions, or that the degree of compliance with the policies or procedures may deteriorate.
Tysons, Virginia
February 15, 2022
REPORT OF INDEPENDENT REGISTERED PUBLIC ACCOUNTING FIRM
To the Stockholders and Board of Directors of Marriott International, Inc.
Opinion on the Financial Statements
We have audited the accompanying consolidated balance sheets of Marriott International, Inc. (the Company) as of December 31, 2021 and 2020, the related consolidated statements of income (loss), comprehensive income (loss), stockholders’ equity and cash flows for each of the three fiscal years in the period ended December 31, 2021, and the related notes (collectively referred to as the “financial statements”). In our opinion, the financial statements present fairly, in all material respects, the financial position of the Company at December 31, 2021 and 2020, and the results of its operations and its cash flows for each of the three years in the period ended December 31, 2021, in conformity with U.S. generally accepted accounting principles.
We also have audited, in accordance with the standards of the Public Company Accounting Oversight Board (United States) (PCAOB), the Company’s internal control over financial reporting as of December 31, 2021, based on criteria established in Internal Control-Integrated Framework issued by the Committee of Sponsoring Organizations of the Treadway Commission (2013 Framework) and our report dated February 15, 2022 expressed an unqualified opinion thereon.
Basis for Opinion
These financial statements are the responsibility of the Company’s management. Our responsibility is to express an opinion on these financial statements based on our audits. We are a public accounting firm registered with the PCAOB and are required to be independent with respect to the Company in accordance with the U.S. federal securities laws and the applicable rules and regulations of the Securities and Exchange Commission and the PCAOB.
We conducted our audits in accordance with the standards of the PCAOB. Those standards require that we plan and perform the audit to obtain reasonable assurance about whether the financial statements are free of material misstatement, whether due to error or fraud. Our audits included performing procedures to assess the risks of material misstatement of the financial statements, whether due to error or fraud, and performing procedures that respond to those risks. Such procedures included examining, on a test basis, evidence regarding the amounts and disclosures in the financial statements. Our audits also included evaluating the accounting principles used and significant estimates made by management, as well as evaluating the overall presentation of the financial statements. We believe that our audits provide a reasonable basis for our opinion.
Critical Audit Matters
The critical audit matters communicated below are matters arising from the current period audit of the financial statements that were communicated or required to be communicated to the audit committee and that: (1) relate to accounts or disclosures that are material to the financial statements and (2) involved our especially challenging, subjective or complex judgments. The communication of critical audit matters does not alter in any way our opinion on the consolidated financial statements, taken as a whole, and we are not, by communicating the critical audit matters below, providing separate opinions on the critical audit matters or on the accounts or disclosures to which they relate.
| | | | | | | | |
| | Accounting for the Loyalty Program |
| Description of the Matter | | During 2021 the Company recognized $1,966 million of revenues previously deferred as of December 31, 2020 and had deferred revenue of $6,471 million as of December 31, 2021 associated with the Marriott Bonvoy guest loyalty program (the “Loyalty Program”). As discussed in Note 2 to the financial statements, the Company recognizes revenue for performance obligations relating to Loyalty Program points and free night certificates as they are redeemed and the related performance obligations are satisfied. The Company recognizes a portion of revenue for the Licensed IP performance obligation under the sales-based royalty criteria, with the remaining portion recognized on a straight-line basis over the contract term. Revenue is recognized utilizing complex models based upon the estimated standalone selling price per point and per free night certificate, which includes judgment in making the estimates of variable consideration and breakage of points. |
| | |
| | Auditing Loyalty Program results is complex due to: (1) the complexity of models and high volume of data used to monitor and account for Loyalty Program results, and (2) the complexity and judgment of estimating the standalone selling price per Loyalty Program point, including both the estimate of variable consideration under the Company’s co-brand credit card agreements which has significant estimation uncertainty associated with projecting future cardholder spending and redemption activity, and the estimated breakage of Loyalty Program points which requires the use of specialists. |
| | |
| How We Addressed the Matter in Our Audit | | We obtained an understanding, evaluated the design and tested the operating effectiveness of controls over the Company’s process of accounting for the Loyalty Program. For example, we tested controls over the accounting methods and model used in reporting results of the Loyalty Program, management’s review of the assumptions and data inputs utilized in estimating the standalone selling price per Loyalty Program point, as well as the development of the estimated breakage. |
| | |
| | To test the recognition of revenues and costs associated with the Loyalty Program, we performed audit procedures that included, among others, testing the clerical accuracy and consistency with US GAAP of the accounting model developed by the Company to recognize revenue and costs associated with the Loyalty Program, and testing significant inputs into the accounting model, including the estimated standalone selling price and recognition of points earned and redeemed during the period. We involved our actuarial professionals to assist in our testing procedures with respect to the estimate of the breakage of Loyalty Program points. We evaluated management’s methodology for estimating the breakage of Loyalty Program points, and we tested underlying data and actuarial assumptions used in estimating the breakage. We evaluated the reasonableness of management’s assumptions, including projections of cash flows, used to estimate variable consideration under the Company’s co-brand credit cards. |
| | |
| | | | | | | | |
| | Accounting for General and Administrative Expenses and Reimbursed Expenses |
| Description of the Matter | | During 2021 the Company recognized $823 million of general and administrative expenses and $10,322 million of reimbursed expenses. As discussed in Note 2 to the financial statements, the Company incurs certain expenses that are for the benefit of, and reimbursable from, hotel owners and franchisees. Such amounts are recorded in the period in which the expense is incurred and include judgment with respect to the allocation of certain costs between general and administrative expenses, which are non-reimbursable, and reimbursed expenses. |
| | |
| | Auditing the classification of general and administrative expenses and reimbursed expenses is complex due to: (1) judgment associated with testing management’s conclusions regarding the allocation of costs between reimbursable and non-reimbursable expenses, (2) the complexity associated with allocating above-property expenses to hotel owners and franchisees due to the high volume of data used to monitor and account for reimbursed expenses and (3) incentives within management’s compensation structure designed to achieve certain financial targets that exclude the impact of reimbursed expenses. |
| | |
| How We Addressed the Matter in Our Audit | | We obtained an understanding, evaluated the design and tested the operating effectiveness of controls over the Company’s process of accounting for reimbursed expenses, general and administrative expenses, and the process for allocating expenses. For example, we tested management’s controls over the review of the allocation of certain costs to determine if they were reasonably classified. |
| | |
| | To test the recognition of reimbursed expenses for appropriate classification, we performed audit procedures that included, among others, (1) testing a sample of transactions that were classified within reimbursed expenses in order to evaluate the appropriate accounting treatment and financial statement classification pursuant to the terms of the management and franchise agreements, (2) performed analytical procedures over total reimbursed expenses and general and administrative expenses in order to identify any trends or indicators of material errors in the classification of expenses, (3) tested manual journal entries made to reimbursed expenses and general and administrative expenses and (4) evaluated the methodology of cost allocations, including any material changes to allocations during the period. |
| | |
We have served as the Company’s auditor since 2002.
Tysons, Virginia
February 15, 2022
MARRIOTT INTERNATIONAL, INC.
CONSOLIDATED STATEMENTS OF INCOME (LOSS)
Fiscal Years 2021, 2020, and 2019
($ in millions, except per share amounts)
| | | | | | | | | | | | | | | | | |
| | 2021 | | 2020 | | 2019 |
| REVENUES | | | | | |
| Base management fees | $ | 669 | | | $ | 443 | | | $ | 1,180 | |
| Franchise fees | 1,790 | | | 1,153 | | | 2,006 | |
| Incentive management fees | 235 | | | 87 | | | 637 | |
| Gross fee revenues | 2,694 | | | 1,683 | | | 3,823 | |
| Contract investment amortization | (75) | | | (132) | | | (62) | |
| Net fee revenues | 2,619 | | | 1,551 | | | 3,761 | |
| Owned, leased, and other revenue | 796 | | | 568 | | | 1,612 | |
Cost reimbursement revenue (1) | 10,442 | | | 8,452 | | | 15,599 | |
| 13,857 | | | 10,571 | | | 20,972 | |
| OPERATING COSTS AND EXPENSES | | | | | |
| Owned, leased, and other-direct | 734 | | | 677 | | | 1,316 | |
| Depreciation, amortization, and other | 220 | | | 346 | | | 341 | |
| General, administrative, and other | 823 | | | 762 | | | 938 | |
| Restructuring and merger-related charges | 8 | | | 267 | | | 138 | |
Reimbursed expenses (1) | 10,322 | | | 8,435 | | | 16,439 | |
| 12,107 | | | 10,487 | | | 19,172 | |
| OPERATING INCOME | 1,750 | | | 84 | | | 1,800 | |
| Gains and other income, net | 10 | | | 9 | | | 154 | |
| Loss on extinguishment of debt | (164) | | | — | | | — | |
| Interest expense | (420) | | | (445) | | | (394) | |
| Interest income | 28 | | | 27 | | | 26 | |
Equity in (losses) earnings (1) | (24) | | | (141) | | | 13 | |
| INCOME (LOSS) BEFORE INCOME TAXES | 1,180 | | | (466) | | | 1,599 | |
| (Provision) benefit for income taxes | (81) | | | 199 | | | (326) | |
| NET INCOME (LOSS) | $ | 1,099 | | | $ | (267) | | | $ | 1,273 | |
| EARNINGS (LOSS) PER SHARE | | | | | |
| Earnings (loss) per share - basic | $ | 3.36 | | | $ | (0.82) | | | $ | 3.83 | |
| Earnings (loss) per share - diluted | $ | 3.34 | | | $ | (0.82) | | | $ | 3.80 | |
(1)See Note 15 for disclosure of related party amounts.
See Notes to Consolidated Financial Statements.
MARRIOTT INTERNATIONAL, INC.
CONSOLIDATED STATEMENTS OF COMPREHENSIVE INCOME (LOSS)
Fiscal Years 2021, 2020, and 2019
($ in millions)
| | | | | | | | | | | | | | | | | |
| | 2021 | | 2020 | | 2019 |
| Net income (loss) | $ | 1,099 | | | $ | (267) | | | $ | 1,273 | |
| Other comprehensive income (loss): | | | | | |
| Foreign currency translation adjustments | (212) | | | 229 | | | 35 | |
| Derivative instrument adjustments and other, net of tax | 5 | | | (3) | | | (5) | |
| | | | | |
| | | | | |
| | | | | |
| Total other comprehensive (loss) income, net of tax | (207) | | | 226 | | | 30 | |
| Comprehensive income (loss) | $ | 892 | | | $ | (41) | | | $ | 1,303 | |
See Notes to Consolidated Financial Statements.
MARRIOTT INTERNATIONAL, INC.
CONSOLIDATED BALANCE SHEETS
Fiscal Years-Ended 2021 and 2020
($ in millions)
| | | | | | | | | | | |
| December 31,
2021 | | December 31,
2020 |
| ASSETS | | | |
| Current assets | | | |
| Cash and equivalents | $ | 1,393 | | | $ | 877 | |
| Accounts and notes receivable, net | 1,982 | | | 1,768 | |
| Prepaid expenses and other | 251 | | | 180 | |
| | | |
| 3,626 | | | 2,825 | |
| Property and equipment, net | 1,503 | | | 1,514 | |
| Intangible assets | | | |
| Brands | 5,979 | | | 6,059 | |
| Contract acquisition costs and other | 2,947 | | | 2,930 | |
| Goodwill | 9,073 | | | 9,175 | |
| 17,999 | | | 18,164 | |
| Equity method investments | 387 | | | 422 | |
| Notes receivable, net | 144 | | | 159 | |
| Deferred tax assets | 228 | | | 249 | |
| Operating lease assets | 1,062 | | | 752 | |
| Other noncurrent assets | 604 | | | 616 | |
| $ | 25,553 | | | $ | 24,701 | |
| LIABILITIES AND STOCKHOLDERS’ EQUITY | | | |
| Current liabilities | | | |
| Current portion of long-term debt | $ | 805 | | | $ | 1,173 | |
| Accounts payable | 726 | | | 527 | |
| Accrued payroll and benefits | 1,187 | | | 831 | |
| Liability for guest loyalty program | 2,522 | | | 1,769 | |
| Accrued expenses and other | 1,167 | | | 1,452 | |
| 6,407 | | | 5,752 | |
| Long-term debt | 9,333 | | | 9,203 | |
| Liability for guest loyalty program | 3,949 | | | 4,502 | |
| Deferred tax liabilities | 169 | | | 83 | |
| Deferred revenue | 1,181 | | | 1,542 | |
| Operating lease liabilities | 1,098 | | | 823 | |
| Other noncurrent liabilities | 2,002 | | | 2,366 | |
| Stockholders’ equity | | | |
| Class A Common Stock | 5 | | | 5 | |
| Additional paid-in-capital | 5,892 | | | 5,851 | |
| Retained earnings | 10,305 | | | 9,206 | |
| Treasury stock, at cost | (14,446) | | | (14,497) | |
| Accumulated other comprehensive loss | (342) | | | (135) | |
| 1,414 | | | 430 | |
| $ | 25,553 | | | $ | 24,701 | |
See Notes to Consolidated Financial Statements.
MARRIOTT INTERNATIONAL, INC.
CONSOLIDATED STATEMENTS OF CASH FLOWS
Fiscal Years 2021, 2020, and 2019
($ in millions)
| | | | | | | | | | | | | | | | | |
| | 2021 | | 2020 | | 2019 |
| OPERATING ACTIVITIES | | | | | |
| Net income (loss) | $ | 1,099 | | | $ | (267) | | | $ | 1,273 | |
| Adjustments to reconcile to cash provided by operating activities: | | | | | |
| Depreciation, amortization, and other | 295 | | | 478 | | | 403 | |
| Stock-based compensation | 182 | | | 201 | | | 187 | |
| Income taxes | (281) | | | (478) | | | (200) | |
| Liability for guest loyalty program | (28) | | | 535 | | | 257 | |
| Contract acquisition costs | (210) | | | (142) | | | (195) | |
| Restructuring and merger-related charges | (10) | | | 200 | | | 86 | |
| Working capital changes | 110 | | | (28) | | | (273) | |
| (Gain) loss on asset dispositions | (3) | | | 3 | | | (147) | |
| Loss on extinguishment of debt | 164 | | | — | | | — | |
| Deferred revenue changes and other | (141) | | | 1,137 | | | 294 | |
| Net cash provided by operating activities | 1,177 | | | 1,639 | | | 1,685 | |
| INVESTING ACTIVITIES | | | | | |
| Capital and technology expenditures | (183) | | | (135) | | | (653) | |
| Dispositions | 12 | | | 260 | | | 395 | |
| Loan advances | (13) | | | (41) | | | (30) | |
| Loan collections | 40 | | | 8 | | | 51 | |
| Other | (43) | | | (57) | | | (47) | |
| Net cash (used in) provided by investing activities | (187) | | | 35 | | | (284) | |
| FINANCING ACTIVITIES | | | | | |
| Commercial paper/Credit Facility, net | 150 | | | (2,290) | | | 951 | |
| Issuance of long-term debt | 1,793 | | | 3,561 | | | 1,397 | |
| Repayment of long-term debt | (2,174) | | | (1,887) | | | (835) | |
| Issuance of Class A Common Stock | 2 | | | — | | | 7 | |
| Debt extinguishment costs | (155) | | | — | | | — | |
| Dividends paid | — | | | (156) | | | (612) | |
| Purchase of treasury stock | — | | | (150) | | | (2,260) | |
| Stock-based compensation withholding taxes | (90) | | | (103) | | | (148) | |
| Other | 11 | | | (8) | | | (8) | |
| Net cash used in financing activities | (463) | | | (1,033) | | | (1,508) | |
| INCREASE (DECREASE) IN CASH, CASH EQUIVALENTS, AND RESTRICTED CASH | 527 | | | 641 | | | (107) | |
CASH, CASH EQUIVALENTS, AND RESTRICTED CASH, beginning of period (1) | 894 | | | 253 | | | 360 | |
CASH, CASH EQUIVALENTS, AND RESTRICTED CASH, end of period (1) | $ | 1,421 | | | $ | 894 | | | $ | 253 | |
| | | | | |
| | | | | |
| | | | | |
| | | | | |
| | | | | |
(1)The 2021 amounts include beginning restricted cash of $17 million at December 31, 2020 and ending restricted cash of $28 million at December 31, 2021, which we present in the “Prepaid expenses and other” and “Other noncurrent assets” captions of our Balance Sheets.
See Notes to Consolidated Financial Statements.
MARRIOTT INTERNATIONAL, INC.
CONSOLIDATED STATEMENTS OF STOCKHOLDERS’ EQUITY
Fiscal Years 2021, 2020, and 2019
(in millions, except per share amounts)
| | | | | | | | | | | | | | | | | | | | | | | | | | | | | | | | | | | | | | | | | |
Common
Shares
Outstanding | | | Total | | Class A
Common
Stock | | Additional
Paid-in-
Capital | | Retained
Earnings | | Treasury
Stock, at
Cost | | Accumulated
Other
Comprehensive Loss |
| 339.1 | | | Balance at December 31, 2018 | $ | 2,225 | | | $ | 5 | | | $ | 5,814 | | | $ | 8,982 | | | $ | (12,185) | | | $ | (391) | |
| — | | | Adoption of ASU 2016-02 | 1 | | | — | | | — | | | 1 | | | — | | | — | |
| — | | | Net income | 1,273 | | | — | | | — | | | 1,273 | | | — | | | — | |
| — | | | Other comprehensive income | 30 | | | — | | | — | | | — | | | — | | | 30 | |
| — | | | Dividends ($1.85 per share) | (612) | | | — | | | — | | | (612) | | | — | | | — | |
| 2.2 | | | Stock-based compensation plans | 46 | | | — | | | (14) | | | — | | | 60 | | | — | |
| (17.3) | | | Purchase of treasury stock | (2,260) | | | — | | | — | | | — | | | (2,260) | | | — | |
| 324.0 | | | Balance at December 31, 2019 | 703 | | | 5 | | | 5,800 | | | 9,644 | | | (14,385) | | | (361) | |
| — | | | Adoption of ASU 2016-13 | (15) | | | — | | | — | | | (15) | | | — | | | — | |
| — | | | Net loss | (267) | | | — | | | — | | | (267) | | | — | | | — | |
| — | | | Other comprehensive income | 226 | | | — | | | — | | | — | | | — | | | 226 | |
| — | | | Dividends ($0.48 per share) | (156) | | | — | | | — | | | (156) | | | — | | | — | |
| 1.4 | | | Stock-based compensation plans | 89 | | | — | | | 51 | | | — | | | 38 | | | — | |
| (1.0) | | | Purchase of treasury stock | (150) | | | — | | | — | | | — | | | (150) | | | — | |
| 324.4 | | | Balance at December 31, 2020 | 430 | | | 5 | | | 5,851 | | | 9,206 | | | (14,497) | | | (135) | |
| | | | | | | | | | | | | |
| — | | | Net income | 1,099 | | | — | | | — | | | 1,099 | | | — | | | — | |
| — | | | Other comprehensive loss | (207) | | | — | | | — | | | — | | | — | | | (207) | |
| | | | | | | | | | | | | |
| 1.9 | | | Stock-based compensation plans | 92 | | | — | | | 41 | | | — | | | 51 | | | — | |
| | | | | | | | | | | | | |
| 326.3 | | (1) | Balance at December 31, 2021 | $ | 1,414 | | | $ | 5 | | | $ | 5,892 | | | $ | 10,305 | | | $ | (14,446) | | | $ | (342) | |
(1)Our restated certificate of incorporation authorizes 800 million shares of our common stock, with a par value of $0.01 per share and 10 million shares of preferred stock, without par value. At year-end 2021, we had 326.3 million of these authorized shares of our common stock and no preferred stock outstanding.
See Notes to Consolidated Financial Statements.
MARRIOTT INTERNATIONAL, INC.
NOTES TO CONSOLIDATED FINANCIAL STATEMENTS
NOTE 1. BASIS OF PRESENTATION
The consolidated financial statements present the results of operations, financial position, and cash flows of Marriott International, Inc. and subsidiaries (referred to in this report as “we,” “us,” “Marriott,” or the “Company”). In order to make this report easier to read, we also refer throughout to (1) our Consolidated Financial Statements as our “Financial Statements,” (2) our Consolidated Statements of Income (Loss) as our “Income Statements,” (3) our Consolidated Balance Sheets as our “Balance Sheets,” (4) our Consolidated Statements of Cash Flows as our “Statements of Cash Flows,” (5) our properties, brands, or markets in the United States and Canada as “U.S. & Canada,” and (6) our properties, brands, or markets in our Caribbean and Latin America, Europe, Middle East and Africa, Greater China, and Asia Pacific excluding China regions, as “International.” In addition, references throughout to numbered “Notes” refer to these Notes to Consolidated Financial Statements, unless otherwise stated.
Preparation of financial statements that conform with U.S. generally accepted accounting principles (“GAAP”) requires management to make estimates and assumptions that affect the reported amounts of assets and liabilities as of the date of the financial statements, the reported amounts of revenues and expenses during the reporting periods, and the disclosures of contingent liabilities. The uncertainty created by the coronavirus pandemic and efforts to contain it (“COVID-19”) has made such estimates more difficult and subjective. Accordingly, ultimate results could differ from those estimates.
The accompanying Financial Statements reflect all normal and recurring adjustments necessary to present fairly our financial position at fiscal year-end 2021 and fiscal year-end 2020 and the results of our operations and cash flows for fiscal years 2021, 2020, and 2019. We have eliminated all material intercompany transactions and balances between entities consolidated in these Financial Statements.
NOTE 2. SUMMARY OF SIGNIFICANT ACCOUNTING POLICIES
Revenue Recognition
Base Management and Incentive Management Fees: For our managed hotels, we have performance obligations to provide hotel management services and a license to our intellectual property for the use of our brand names. As compensation for such services, we are generally entitled to receive base fees, which are a percentage of the revenues of hotels, and incentive management fees, which are generally based on a measure of hotel profitability. Both the base and incentive management fees are variable consideration, as the transaction price is based on a percentage of revenue or profit, as defined in each contract. We recognize base management fees on a monthly basis over the term of the agreement as those amounts become payable. We recognize incentive management fees on a monthly basis over the term of the agreement based on each property’s financial results, as long as we do not expect a significant reversal due to projected future hotel performance or cash flows in future periods.
Franchise Fee and Royalty Fee Revenue: For our franchised hotels, we have a performance obligation to provide franchisees and operators a license to our intellectual property for use of certain of our brand names. As compensation for such services, we are typically entitled to initial application fees and ongoing royalty fees. Our ongoing royalty fees represent variable consideration, as the transaction price is based on a percentage of certain revenues of the hotels, as defined in each contract. We recognize royalty fees on a monthly basis over the term of the agreement as those amounts become payable. Initial application and relicensing fees are fixed consideration payable upon submission of a franchise application or renewal and are recognized on a straight-line basis over the initial or renewal term of the franchise agreements.
Owned and Leased Hotel Revenue: At our owned and leased hotels, we have performance obligations to provide accommodations and other ancillary services to hotel guests. As compensation for such goods and services, we are typically entitled to a fixed nightly fee for an agreed upon period and additional fixed fees for any ancillary services purchased. These fees are generally payable at the time the hotel guest checks out of the hotel. We generally satisfy the performance obligations over time, and we recognize the revenue from room sales and from other ancillary guest services on a daily basis, as the rooms are occupied and we have rendered the services.
Cost Reimbursements: Under our management and franchise agreements, we are entitled to be reimbursed for certain costs we incur on behalf of the managed, franchised, and licensed properties, with no added mark-up. These costs primarily consist of payroll and related expenses at managed properties where we are the employer of the employees at the properties and include certain operational and administrative costs as provided for in our contracts with the owners. We are entitled to reimbursement in the period we incur the related reimbursable costs, which we recognize within the “Cost reimbursement revenue” caption of our Income Statements.
Under our management and franchise agreements, hotel owners and franchisees participate in certain centralized programs and services, such as marketing, sales, reservations, and insurance programs. We operate these programs and services for the benefit of our hotel owners. We do not operate these programs and services to generate a profit over the long term, and accordingly, when we recover the costs that we incur for these programs and services from our hotel owners, we do not seek a mark-up. The amounts we charge for these programs and services are generally a combination of fixed fees and variable fees based on sales or other metrics and are payable on a monthly basis. We generally recognize revenue within the “Cost reimbursement revenue” caption of our Income Statements when the amounts may be billed to hotel owners, and we recognize expenses within the “Reimbursed expenses” caption as they are incurred. This pattern of recognition results in timing differences between the costs incurred for centralized programs and services and the related reimbursement from hotel owners in our operating and net income. Over the long term, these programs and services are not designed to impact our economics, either positively or negatively. In addition, we present in the “Reimbursed expenses” caption of our Income Statements spending funded by the proceeds ($664 million, $425 million after-tax) from the 2017 sale of our interest in Avendra LLC, which we committed would be used for the benefit of hotels in our system. Such spending totaled $56 million ($42 million after-tax) in 2021, $62 million ($46 million after-tax) in 2020, and $118 million ($87 million after-tax) in 2019.
Other Revenue: Includes Global Design fees, which we describe below, termination fees, and other property and brand revenues. We generally recognize termination fees when collection is probable and other revenue as services are rendered. Amounts received in advance are deferred as liabilities.
We provide certain hotel design and construction review (“Global Design”) services to our managed and franchised hotel owners, generally during the period prior to a hotel’s opening or during the period a hotel is converting to a Marriott brand (the “pre-opening period”). As compensation for such services, we may be entitled to receive a one-time fixed fee that is payable during the pre-opening period of the hotel. As these services are not a distinct performance obligation, we recognize the fees on a straight-line basis over the initial term of the management or franchise agreement within the “Owned, leased, and other revenue” caption of our Income Statements.
Practical Expedients and Exemptions: We do not disclose the amount of variable consideration that we expect to recognize in future periods in the following circumstances:
(1) if we recognize the revenue based on the amount invoiced or services performed;
(2) for sales-based or usage-based royalty promised in exchange for a license of intellectual property; or
(3) if the consideration is allocated entirely to a wholly unsatisfied promise to transfer a distinct service that forms part of a single performance obligation, and the terms of the consideration relate specifically to our efforts to transfer, or to a specific outcome from transferring the service.
We are required to collect certain taxes and fees from customers on behalf of governmental agencies and remit these to the applicable governmental agencies on a periodic basis. We do not include these taxes in determining the transaction price.
Loyalty Program: Loyalty Program members earn points based on the money they spend at our hotels; the exchange of timeshare ownership interests; purchases of timeshare interval, fractional ownership, and residential products; and through participation in travel experiences and affiliated partners’ programs, such as those offered by credit card, car rental, airline, and other companies. Members can redeem points for stays at most of our hotels, airline tickets, airline frequent flyer program miles, rental cars, merchandise, and a variety of other awards. Points cannot be redeemed for cash.
Under our Loyalty Program, we have a performance obligation to provide or arrange for the provision of goods or services for free or at a discount to Loyalty Program members in exchange for the redemption of points earned from past activities. We operate our Loyalty Program as a cross-brand marketing program to participating properties. Our management and franchise agreements require that properties reimburse us for a portion of the costs of operating the Loyalty Program, including costs for marketing, promotion, communication with, and performing member services for Loyalty Program members, with no added mark-up. We generally receive monthly cash contributions from managed, franchised, owned, and leased hotels based on a portion of qualified spend by Loyalty Program members (when the points are earned). We recognize these contributions into revenue as we provide the related service (when the points are redeemed). The amount of revenue we recognize upon point redemption is based on a blend of historical funding rates and is impacted by our estimate of the “breakage” for points that members will never redeem. We estimate breakage based on our historical experience and expectations of future member behavior. We recognize revenue net of the redemption cost within our “Cost reimbursement revenue” caption on our Income Statements, as our performance obligation is to facilitate the transaction between the Loyalty Program member and the managed or franchised property or program partner. Our redemption cost, which is generally based on redemption rates that can increase in periods in which occupancy at the property exceeds a certain threshold, could be higher or lower than our revenue recognized in any given period. We recognize all other Loyalty Program costs as incurred in our “Reimbursed expenses” caption.
We have multi-year agreements for our co-brand credit cards associated with our Loyalty Program. Under these agreements, we have performance obligations to provide a license to the intellectual property associated with our brands and marketing lists (“Licensed IP”) to the financial institutions that issue the credit cards, to arrange for the redemption of Loyalty Program points as discussed in the preceding paragraph, and to arrange for the redemption of free night certificates provided to cardholders. We receive fees from these agreements, including fixed amounts that are primarily payable at contract inception, and variable amounts that are paid to us monthly over the term of the agreements, based on: (1) the number of free night certificates issued or redeemed; (2) the number of Loyalty Program points purchased; and (3) the volume of cardholder spend. We allocate those fees among the performance obligations, including the Licensed IP, our Loyalty Program points, and free night certificates provided to cardholders based on their estimated standalone selling prices. The estimation of the standalone selling prices requires significant judgments based upon generally accepted valuation methodologies regarding the value of our Licensed IP, the amount of funding we will receive, and the number of Loyalty Program points and free night certificates cardholders will redeem over the term of the agreements. We base our estimates of these amounts on our historical experience and expectation of future cardholder behavior. We recognize the portion of the Licensed IP revenue that meets the sales-based royalty criteria as the credit cards are used and the remaining portion of the Licensed IP revenue on a straight-line basis over the contract term. In our Income Statements, we primarily recognize Licensed IP revenue in the “Franchise fees” caption, and we recognize a portion in the “Cost reimbursement revenue” caption. We recognize the revenue related to the Loyalty Program points as discussed in the preceding paragraph. We recognize the revenue related to the free night certificates when the related service is provided. We recognize revenue net of the redemption cost, as our performance obligation is to facilitate the transaction between the Loyalty Program member and the managed or franchised property.
Contract Balances: We generally receive payments from customers as we satisfy our performance obligations. We record a receivable when we have an unconditional right to receive payment and only the passage of time is required before payment is due. We record deferred revenue when we receive payment, or have the unconditional right to receive payment, in advance of the satisfaction of our performance obligations related to franchise application and relicensing fees, Global Design fees, credit card branding license fees, and our Loyalty Program.
Current and noncurrent deferred revenue decreased by $340 million, to $1,527 million at December 31, 2021 from $1,867 million at December 31, 2020, primarily as a result of $334 million of revenue recognized in 2021 that was deferred as of December 31, 2020, as well as the reclassification from deferred revenue to the liability for guest loyalty program, which we discuss below. The decrease was partially offset by deferred cash received for free night certificates related to the co-brand credit cards and gift cards, as well as an increase in franchise application and relicensing fees. Our current deferred revenue, which we present in the “Accrued expenses and other” caption of our Balance Sheets, was $346 million at year-end 2021 and $325 million at year-end 2020.
Our current and noncurrent liability for guest loyalty program increased by $200 million, to $6,471 million at December 31, 2021, from $6,271 million at December 31, 2020, primarily reflecting an increase in points earned by members. This includes a $228 million reclassification from deferred revenue to the liability for guest loyalty program as a result of points that were earned during the period by members using our U.S.-issued co-brand credit cards, which were prepaid by the financial institutions in 2020. The increase was partially offset by $1,966 million of revenue recognized in 2021, that was deferred as of December 31, 2020. The current portion of our liability for guest loyalty program increased compared to December 31, 2020, due to higher estimated redemptions in the short-term. At each reporting period, we evaluate the estimates used in the recognition of Loyalty Program revenues, including estimates of the breakage of points that members will never redeem and the amount of funding we expect to receive over the life of the agreements with various third parties. In 2021, the updated estimates resulted in a net increase in revenue, and a corresponding reduction in the liability for guest loyalty program of approximately $58 million.
Costs Incurred to Obtain and Fulfill Contracts with Customers
We incur certain costs to obtain and fulfill contracts with customers, which we capitalize and amortize on a straight-line basis over the initial, non-cancellable term of the contract. We classify incremental costs of obtaining a contract with a customer in the “Contract acquisition costs and other” caption of our Balance Sheets, the related amortization in the “Contract investment amortization” caption of our Income Statements, and the cash flow impact in the “Contract acquisition costs” caption of our Statements of Cash Flows. We assess the assets for impairment when events or changes in circumstances indicate that we may not be able to recover the carrying value. We recognize an impairment loss for the amount by which the carrying value exceeds the expected net future cash flows. We classify certain direct costs to fulfill a contract with a customer in the “Other noncurrent assets” and “Prepaid expenses and other” captions of our Balance Sheets, and the related amortization in the “Owned, leased, and other - direct expenses” caption of our Income Statements. We had capitalized costs to fulfill contracts with customers of $368 million at December 31, 2021 and $366 million at December 31, 2020. See Note 10 for information on capitalized costs incurred to obtain contracts with customers.
Real Estate Sales
We recognize a gain or loss on real estate transactions when control of the asset transfers to the buyer, generally at the time the sale closes. In sales transactions where we retain a management contract, the terms and conditions of the management contract are generally comparable to the terms and conditions of the management contracts obtained directly with third-party owners in competitive processes.
Retirement Savings Plan
We contribute to tax-qualified retirement plans for the benefit of U.S. employees who meet certain eligibility requirements and choose to participate in the plans. Participating employees specify the percentage or amount of salary they wish to contribute from their compensation, and the Company typically makes discretionary and certain other matching or supplemental contributions. We recognized compensation costs from Company contributions of $80 million in 2021, $75 million in 2020, and $128 million in 2019.
Non-U.S. Operations
The U.S. dollar is the functional currency of our consolidated and unconsolidated entities operating in the U.S. The functional currency of our consolidated and unconsolidated entities operating outside of the U.S. is generally the principal currency of the economic environment in which the entity primarily generates and expends cash. We translate the financial statements of consolidated entities whose functional currency is not the U.S. dollar into U.S. dollars, and we do the same, as needed, for unconsolidated entities whose functional currency is not the U.S. dollar. We translate assets and liabilities at the exchange rate in effect as of the financial statement date and translate income statement accounts using the weighted average exchange rate for the period. We include translation adjustments from currency exchange and the effect of exchange rate changes on intercompany transactions of a long-term investment nature as a separate component of stockholders’ equity. We report gains and losses from currency exchange rate changes for intercompany receivables and payables that are not of a long-term investment nature, as well as for third-party transactions, currently in operating costs and expenses.
Stock-Based Compensation
Our stock-based compensation awards primarily consist of restricted stock units (“RSUs”). We measure compensation costs for our stock-based payment transactions at fair value based on the average of the high and low stock price on the grant date (discounted for the lack of marketability and dividends), and we recognize those costs in our Financial Statements over the vesting period during which the employee provides service in exchange for the award.
Advertising Costs
We expense costs to produce advertising as they are incurred and to communicate advertising as the communication occurs and record such amounts in reimbursed expenses to the extent undertaken on behalf of our owners and franchisees. We recognized advertising costs of $470 million in 2021, $276 million in 2020, and $851 million in 2019.
Income Taxes
We record the amounts of taxes payable or refundable for the current year, as well as deferred tax liabilities and assets for the future tax consequences of events we have recognized in our Financial Statements or tax returns, using judgment in assessing future profitability and the likely future tax consequences of those events. We base our estimates of deferred tax assets and liabilities on current tax laws, rates and interpretations, and, in certain cases, business plans and other expectations about future outcomes. We develop our estimates of future profitability based on our historical data and experience, industry projections, micro and macro general economic condition projections, and our expectations. We account for U.S. tax on Global Intangible Low-Taxed Income in the period incurred.
We generally recognize the effect of the tax law changes in the period of enactment. Changes in existing tax laws and rates, their related interpretations, and the uncertainty generated by the current economic environment may affect the amounts of our deferred tax liabilities or the valuations of our deferred tax assets over time. Our accounting for deferred tax consequences represents management’s best estimate of future events that can be appropriately reflected in the accounting estimates.
For tax positions we have taken or expect to take in a tax return, we apply a more likely than not threshold (that is, a likelihood of more than 50 percent), under which we must conclude a tax position is more likely than not to be sustained, assuming that the position will be examined by the appropriate taxing authority that has full knowledge of all relevant information, to continue to recognize the benefit. In determining our provision for income taxes, we use judgment, reflecting our estimates and assumptions, in applying the more likely than not threshold. We recognize accrued interest and penalties for our unrecognized tax benefits as a component of tax expense. See Note 6 for further information.
Cash and Equivalents
We consider all highly liquid investments with an initial maturity of three months or less at date of purchase to be cash equivalents.
Accounts Receivable
Our accounts receivable primarily consist of amounts due from hotel owners with whom we have management and franchise agreements and include reimbursements of costs we incurred on behalf of managed and franchised properties. We record an allowance for credit losses measured over the contractual life of the instrument based on an assessment of historical collection activity and current and forecasted future economic conditions by region. Our allowance for credit losses was $187 million at December 31, 2021 and $207 million at December 31, 2020. The decrease during 2021 was primarily due to the write-off of amounts deemed uncollectible, partially offset by the provision for credit losses. Our provision for credit losses totaled $22 million in 2021 and $136 million in 2020.
Assets Held for Sale
We consider properties to be assets held for sale when (1) management commits to a plan to sell the property; (2) it is unlikely that the disposal plan will be significantly modified or discontinued; (3) the property is available for immediate sale in its present condition; (4) actions required to complete the sale of the property have been initiated; (5) sale of the property is probable and we expect the completed sale will occur within one year; and (6) the property is actively being marketed for sale at a price that is reasonable given our estimate of current market value. Upon designation of a property as an asset held for sale, we record the property’s value at the lower of its carrying value or its estimated fair value, less estimated costs to sell, and we cease depreciation.
Goodwill
We test goodwill for potential impairment at least annually in the fourth quarter, or more frequently if an event or other circumstance indicates that we may not be able to recover the carrying amount of the net assets of the reporting unit. In evaluating goodwill for impairment, we may assess qualitative factors to determine whether it is more likely than not that the fair value of a reporting unit is less than its carrying amount. Factors we consider when making this determination include, but are not limited to, assessing general economic conditions, hospitality industry trends, and overall financial performance of the reporting unit. If we bypass the qualitative assessment, or if we conclude that it is more likely than not that the fair value of a reporting unit is less than its carrying value, then we perform a quantitative impairment test by comparing the fair value of a reporting unit with its carrying amount.
We calculate the estimated fair value of a reporting unit using a combination of the income and market approaches. For the income approach, we use internally developed discounted cash flow models that include the following assumptions, among others: projections of revenues, expenses, and related cash flows based on assumed long-term growth rates and demand trends;
expected future investments to grow new units; and estimated discount rates. For the market approach, we use internal analyses based primarily on market comparables. We base these assumptions on our historical data and experience, third-party appraisals, industry projections, micro and macro general economic condition projections, and our expectations.
We have had no goodwill impairment charges for the last three fiscal years.
Intangibles and Long-Lived Assets
We assess indefinite-lived intangible assets for continued indefinite use and for potential impairment annually, or more frequently if an event or other circumstance indicates that we may not be able to recover the carrying amount of the asset. Like goodwill, we may first assess qualitative factors to determine whether it is more likely than not that the fair value of the indefinite-lived intangible is less than its carrying amount. If the carrying value of the asset exceeds the fair value, we recognize an impairment loss in the amount of that excess.
We test definite-lived intangibles and long-lived asset groups for recoverability when changes in circumstances indicate that we may not be able to recover the carrying value; for example, when there are material adverse changes in projected revenues or expenses, significant underperformance relative to historical or projected operating results, or significant negative industry or economic trends. We also test recoverability when management has committed to a plan to sell or otherwise dispose of an asset group and we expect to complete the plan within a year. We evaluate recoverability of an asset group by comparing its carrying value, including right-of-use assets, to the future net undiscounted cash flows that we expect the asset group will generate. If the comparison indicates that we will not be able to recover the carrying value of an asset group, we recognize an impairment loss for the amount by which the carrying value exceeds the estimated fair value. When we recognize an impairment loss for assets to be held and used, we depreciate the adjusted carrying amount of those assets over their remaining useful life.
We calculate the estimated fair value of an intangible asset or asset group using the income approach or the market approach. We utilize the same assumptions and methodology for the income approach that we describe in the “Goodwill” caption. For the market approach, we use internal analyses based primarily on market comparables and assumptions about market capitalization rates, growth rates, and inflation. See Note 8 for additional information.
Investments
We hold equity interests in ventures established to develop or acquire and own hotel properties or that otherwise support our hospitality operations. We account for these investments as either an equity method investment, a financial asset, or a controlled subsidiary. We apply the equity method of accounting if we have significant influence over the entity, typically when we hold 20 percent or more of the voting common stock (or equivalent) of an investee but do not have a controlling financial interest. In certain circumstances, such as with investments in limited liability companies or limited partnerships, we apply the equity method of accounting when we own as little as three to five percent. We account for financial assets at fair value if it is readily determinable, or using the fair value alternative method, whereby investments are measured at cost less impairment, adjusted for observable price changes. We consolidate entities that we control.
When we acquire an investment that qualifies for the equity method of accounting, we determine the acquisition date fair value of the identifiable assets and liabilities. If our carrying amount exceeds our proportional share in the equity of the investee, we amortize the difference on a straight-line basis over the underlying assets’ estimated useful lives when calculating equity method earnings attributable to us, excluding the difference attributable to land, which we do not amortize.
We evaluate an investment for impairment when circumstances indicate that we may not be able to recover the carrying value. When evaluating our ventures, we consider loan defaults, significant underperformance relative to historical or projected operating performance, or significant negative industry or economic trends. Additionally, a venture’s commitment to a plan to sell some or all of its assets could cause us to evaluate the recoverability of the venture’s individual long-lived assets and possibly the venture itself. We impair investments we account for using the equity method of accounting when we determine that there has been an “other-than-temporary” decline in the venture’s estimated fair value compared to its carrying value. We perform qualitative assessments for investments we account for using the fair value alternative method and we record any associated impairment when the fair value is less than the carrying value.
Under the accounting guidance for the consolidation of variable interest entities, we analyze our variable interests, including equity investments, loans, and guarantees, to determine if an entity in which we have a variable interest is a variable interest entity. Our analysis includes both quantitative and qualitative reviews. We base our quantitative analysis on the forecasted cash flows of the entity, and our qualitative analysis on our review of the design of the entity, its organizational structure including decision-making ability, and relevant financial agreements. We also use our qualitative analysis to determine if we must consolidate a variable interest entity as its primary beneficiary.
Fair Value Measurements
We have various financial instruments we must measure at fair value on a recurring basis, including certain marketable securities and derivatives. See Note 12 for further information. We also apply the provisions of fair value measurement to various nonrecurring measurements for our financial and nonfinancial assets and liabilities.
Accounting standards define fair value as the price that would be received to sell an asset or paid to transfer a liability in an orderly transaction between market participants at the measurement date (an exit price). We measure our assets and liabilities using inputs from the following three levels of the fair value hierarchy:
Level 1 inputs are unadjusted quoted prices in active markets for identical assets or liabilities that we have the ability to access at the measurement date.
Level 2 inputs include quoted prices for similar assets and liabilities in active markets, quoted prices for identical or similar assets or liabilities in markets that are not active, inputs other than quoted prices that are observable for the asset or liability (i.e., interest rates, yield curves, etc.), and inputs that are derived principally from or corroborated by observable market data by correlation or other means (market corroborated inputs).
Level 3 inputs include unobservable inputs that reflect our assumptions about what factors market participants would use in pricing the asset or liability. We develop these inputs based on the best information available, including our own data.
Derivative Instruments
We record derivatives at fair value. The designation of a derivative instrument as a hedge and its ability to meet the hedge accounting criteria determine how we reflect the change in fair value of the derivative instrument in our Financial Statements. A derivative qualifies for hedge accounting if, at inception, we expect the derivative will be highly effective in offsetting the underlying hedged cash flows or fair value and we fulfill the hedge documentation standards at the time we enter into the derivative contract. We designate a hedge as a cash flow hedge, fair value hedge, or a hedge of the net investment in non-U.S. operations based on the exposure we are hedging. For the effective portion of qualifying cash flow hedges, we record changes in fair value in accumulated other comprehensive income (“AOCI”). We release the derivative’s gain or loss from AOCI to match the timing of the underlying hedged items’ effect on earnings. The change in fair value of qualifying fair value hedges as well as changes in fair value of the underlying hedged items to the hedged risks are recorded concurrently in earnings.
We review the effectiveness of our hedging instruments quarterly and discontinue hedge accounting for any hedge that we no longer consider to be highly effective. We recognize changes in fair value for derivatives not designated as hedges or those not qualifying for hedge accounting in current period earnings. Upon termination of cash flow hedges, we release gains and losses from AOCI based on the timing of the underlying cash flows or revenue recognized, unless the termination results from the failure of the intended transaction to occur in the expected time frame. Such untimely transactions require us to immediately recognize in earnings the gains and/or losses that we previously recorded in AOCI.
Changes in interest rates, currency exchange rates, and equity securities expose us to market risk. We manage our exposure to these risks by monitoring available financing alternatives, as well as through development and application of credit granting policies. We also use derivative instruments as part of our overall strategy to manage our exposure to market risks. As a matter of policy, we only enter into transactions that we believe will be highly effective at offsetting the underlying risk, and we do not use derivatives for trading or speculative purposes.
Loan Loss Reserves
We may make senior, mezzanine, and other loans to owners of hotels that we operate or franchise, generally to facilitate the development or renovation of a hotel and sometimes to facilitate brand programs or initiatives. We expect the owners to repay the loans in accordance with the loan agreements, or earlier as the hotels mature and capital markets permit. We use metrics such as loan-to-value ratios and debt service coverage, and other information about collateral and from third-party rating agencies to assess the credit quality of the loan receivable, both upon entering into the loan agreement and on an ongoing basis as applicable.
At inception and throughout the term of the loan agreement, we individually assess loans for impairment. We consider current and forecasted future economic conditions in addition to our historical experience. We use internally generated cash flow projections to determine the likelihood that the loans will be repaid under the terms of the loan agreements. To measure impairment, we calculate the present value of expected future cash flows discounted at the loan’s original effective interest rate or the estimated fair value of the collateral. If the present value or the estimated collateral is less than the carrying value of the loan receivable, we establish a specific impairment reserve for the difference.
Leases
We determine if an arrangement is a lease or contains a lease at the inception of the contract. We evaluate leases for classification as operating or financing upon lease commencement. Our leases generally contain fixed and variable components. The variable components of our leases are primarily based on operating performance of the leased property. Our lease agreements may also include non-lease components, such as common area maintenance, which we combine with the lease component to account for both as a single lease component.
Lease liabilities, which represent our obligation to make lease payments arising from the lease, and corresponding right-of-use assets, which represent our right to use an underlying asset for the lease term, are recognized at the commencement date of the lease based on the present value of fixed future payments over the lease term. We calculate the present value of future payments using the discount rate implicit in the lease, if available, or our incremental borrowing rate.
For operating leases, lease expense relating to fixed payments is recognized on a straight-line basis over the lease term and lease expense relating to variable payments is expensed as incurred. For finance leases, the amortization of the asset is recognized over the shorter of the lease term or useful life of the underlying asset.
Guarantees
We measure and record our liability for the fair value of a guarantee on a nonrecurring basis, that is when we issue or modify a guarantee, using Level 3 internally developed inputs, as described above in this footnote under the caption “Fair Value Measurements.” We base our calculation of the estimated fair value of a guarantee on the income approach or the market approach, depending on the type of guarantee. For the income approach, we use internally developed discounted cash flow and Monte Carlo simulation models that include the following assumptions, among others: projections of revenues and expenses and related cash flows based on assumed growth rates and demand trends; historical volatility of projected performance; the guaranteed obligations; and applicable discount rates. We base these assumptions on our historical data and experience, industry projections, micro and macro general economic condition projections, and our expectations. For the market approach, we use internal analyses based primarily on market comparable data and our assumptions about market capitalization rates, credit spreads, growth rates, and inflation.
The offsetting entry for the guarantee liability depends on the circumstances in which the guarantee was issued. Funding under the guarantee reduces the recorded liability. In most cases, when we do not forecast any funding, we amortize the liability into income on a straight-line basis over the remaining term of the guarantee. On a quarterly basis, we evaluate all material estimated liabilities based on the operating results and the terms of the guarantee. If we conclude that it is probable that we will be required to fund a greater amount than previously estimated, we record a loss except to the extent that the applicable contracts provide that the advance can be recovered as a loan.
Self-Insurance Programs
We self-insure for certain levels of liability, workers’ compensation, property insurance and employee medical coverage. We accrue estimated costs of these self-insurance programs at the present value of projected settlements for known and incurred but not reported claims. We use a discount rate of two percent to determine the present value of the projected settlements, which we consider to be reasonable given our history of settled claims, including payment patterns and the fixed nature of the individual settlements. We classify the current portion of our self-insurance reserve in the “Accrued expenses and other” caption and the noncurrent portion in the “Other noncurrent liabilities” caption of our Balance Sheets. The current portion of our self-insurance reserve was $124 million at December 31, 2021 and $121 million at December 31, 2020. The noncurrent portion of our self-insurance reserve was $290 million at December 31, 2021 and $341 million at December 31, 2020.
Legal Contingencies
We are subject to various legal proceedings and claims, the outcomes of which are uncertain. We record an accrual for legal contingencies when we determine that it is probable that we have incurred a liability and we can reasonably estimate the amount of the loss. In making such determinations we evaluate, among other things, the probability of an unfavorable outcome and, when we believe it probable that a liability has been incurred, our ability to make a reasonable estimate of the loss. We review these accruals each reporting period and make revisions based on changes in facts and circumstances.
Business Combinations
We allocate the purchase price of an acquisition to the tangible and intangible assets acquired and liabilities assumed based on their estimated fair values at the acquisition date. We recognize as goodwill the amount by which the purchase price of an acquired entity exceeds the net of the fair values assigned to the assets acquired and liabilities assumed. In determining the fair values of assets acquired and liabilities assumed, we use various recognized valuation methods including the income and market approaches. Further, we make assumptions within certain valuation techniques, including discount rates, royalty rates, and the amount and timing of future cash flows. We record the net assets and results of operations of an acquired entity in our Financial Statements from the acquisition date. We initially perform these valuations based upon preliminary estimates and assumptions by management or independent valuation specialists under our supervision, where appropriate, and make revisions as estimates and assumptions are finalized. We expense acquisition-related costs as we incur them.
Asset Acquisitions
Acquisitions that do not meet the definition of a business are accounted for as asset acquisitions. We allocate the cost of the acquisition, including direct and incremental transaction costs, to the individual assets acquired and liabilities assumed on a relative fair value basis. Goodwill is not recognized in an asset acquisition.
NOTE 3. RESTRUCTURING CHARGES
Beginning in the 2020 second quarter, we initiated several regional restructuring plans to achieve cost savings in response to the decline in lodging demand caused by COVID-19. We substantially completed our above-property programs as of December 31, 2020 and our property-level programs as of September 30, 2021.
The following table presents our restructuring liability activity during the period:
| | | | | | | | | |
| ($ in millions) | Employee termination benefits | | | | |
| Balance at December 31, 2020 | $ | 143 | | | | | |
| Charges | — | | | | | |
| Cash payments | (122) | | | | | |
| Other | (6) | | | | | |
| Balance at December 31, 2021, classified in “Accrued expenses and other” | $ | 15 | | | | | |
NOTE 4. EARNINGS PER SHARE
The table below illustrates the reconciliation of the earnings and number of shares used in our calculations of basic and diluted earnings per share, the latter of which uses the treasury stock method in order to calculate the dilutive effect of the Company’s potential common stock:
| | | | | | | | | | | | | | | | | |
| (in millions, except per share amounts) | 2021 | | 2020 | | 2019 |
| Computation of Basic Earnings Per Share | | | | | |
| Net income (loss) | $ | 1,099 | | | $ | (267) | | | $ | 1,273 | |
| Shares for basic earnings per share | 327.2 | | | 325.8 | | | 332.7 | |
| Basic earnings (loss) per share | $ | 3.36 | | | $ | (0.82) | | | $ | 3.83 | |
| Computation of Diluted Earnings Per Share | | | | | |
| Net income (loss) | $ | 1,099 | | | $ | (267) | | | $ | 1,273 | |
| Shares for basic earnings per share | 327.2 | | | 325.8 | | | 332.7 | |
| Effect of dilutive securities | | | | | |
Stock-based compensation(1) | 2.1 | | | — | | | 2.8 | |
| Shares for diluted earnings per share | 329.3 | | | 325.8 | | | 335.5 | |
| Diluted earnings (loss) per share | $ | 3.34 | | | $ | (0.82) | | | $ | 3.80 | |
(1) For the calculation of diluted loss per share for 2020, we excluded share-based compensation securities of 1.4 million because the effect was anti-dilutive.
NOTE 5. STOCK-BASED COMPENSATION
RSUs and PSUs
We granted RSUs in 2021 to certain officers and employees, and those units vest generally over four years in equal annual installments commencing one year after the grant date. We also granted performance-based RSUs (“PSUs”) in 2021 to certain executives, which are earned, subject to continued employment and the satisfaction of certain performance and market conditions based on the degree of achievement of pre-established targets for 2023 adjusted EBITDA performance and relative total stockholder return over the 2021 to 2023 performance period.
In the 2020 third quarter, as part of our effort to encourage associate retention in response to the severe impact of COVID-19 on our industry and the Company, we accelerated the issuance of RSU awards to certain officers and employees that ordinarily would have been made in the 2021 first quarter, and those units generally vest over four years and five months, with one quarter of the units vesting one year and five months after the grant date and the remaining units vesting in equal annual installments thereafter. We did not accelerate the issuance of awards for our most senior executives.
We had deferred compensation costs for unvested awards for RSUs, including PSUs, of approximately $189 million at year-end 2021 and $301 million at year-end 2020. The weighted average remaining term for RSUs outstanding at year-end 2021 was 2.2 years.
The following table provides additional information on RSUs, including PSUs, for the last three fiscal years:
| | | | | | | | | | | | | | | | | |
| 2021 | | 2020 | | 2019 |
| Stock-based compensation expense (in millions) | $ | 171 | | | $ | 188 | | | $ | 177 | |
| Weighted average grant-date fair value (per unit) | $ | 141 | | | $ | 101 | | | $ | 117 | |
| Aggregate intrinsic value of distributed RSUs (in millions) | $ | 205 | | | $ | 234 | | | $ | 276 | |
The following table presents the changes in our outstanding RSUs, including PSUs, during 2021 and the associated weighted average grant-date fair values:
| | | | | | | | | | | |
| Number of RSUs (in millions) | | Weighted Average Grant-Date Fair Value (per unit) |
| Outstanding at year-end 2020 | 5.8 | | | $ | 107 | |
| Granted | 0.5 | | | $ | 141 | |
| Distributed | (1.7) | | | $ | 113 | |
| Forfeited | (0.2) | | | $ | 106 | |
| Outstanding at year-end 2021 | 4.4 | | | $ | 109 | |
Other Information
At year-end 2021, we had 25 million remaining shares authorized under the Marriott and Starwood Hotels & Resorts Worldwide, LLC, formerly known as Starwood Hotels & Resorts Worldwide, Inc. (“Starwood”) stock plans.
NOTE 6. INCOME TAXES
The components of our earnings (losses) before income taxes for the last three fiscal years consisted of:
| | | | | | | | | | | | | | | | | |
| ($ in millions) | 2021 | | 2020 | | 2019 |
| U.S. | $ | 890 | | | $ | (320) | | | $ | 549 | |
| Non-U.S. | 290 | | | (146) | | | 1,050 | |
| $ | 1,180 | | | $ | (466) | | | $ | 1,599 | |
Our (provision) benefit for income taxes for the last three fiscal years consisted of:
| | | | | | | | | | | | | | | | | | | | |
| ($ in millions) | 2021 | | 2020 | | 2019 |
| Current | -U.S. Federal | $ | 99 | | | $ | 9 | | | $ | (272) | |
| -U.S. State | 24 | | | (41) | | | (57) | |
| -Non-U.S. | (86) | | | (78) | | | (161) | |
| | 37 | | | (110) | | | (490) | |
| | | | | | |
| Deferred | -U.S. Federal | (122) | | | 180 | | | 141 | |
| -U.S. State | (37) | | | 81 | | | 39 | |
| -Non-U.S. | 41 | | | 48 | | | (16) | |
| | (118) | | | 309 | | | 164 | |
| | $ | (81) | | | $ | 199 | | | $ | (326) | |
Unrecognized Tax Benefits
The following table reconciles our unrecognized tax benefit balance for each year from the beginning of 2019 to the end of 2021:
| | | | | |
| ($ in millions) | Amount |
Unrecognized tax benefit at beginning of 2019 | $ | 623 | |
| |
| Change attributable to tax positions taken in prior years | (13) | |
| Change attributable to tax positions taken during the current period | 13 | |
| Decrease attributable to settlements with taxing authorities | (54) | |
| |
Unrecognized tax benefit at year-end 2019 | 569 | |
| Change attributable to tax positions taken in prior years | (66) | |
| Change attributable to tax positions taken during the current period | 4 | |
| Decrease attributable to settlements with taxing authorities | (43) | |
| |
Unrecognized tax benefit at year-end 2020 | 464 | |
| Change attributable to tax positions taken in prior years | (134) | |
| Change attributable to tax positions taken during the current period | — | |
| Decrease attributable to settlements with taxing authorities | (48) | |
| |
Unrecognized tax benefit at year-end 2021 | $ | 282 | |
Our unrecognized tax benefit balances included $266 million at year-end 2021, $410 million at year-end 2020, and $498 million at year-end 2019 of tax positions that, if recognized, would impact our effective tax rate. It is reasonably possible that within the next 12 months we will reach resolution of income tax examinations in one or more jurisdictions. The actual amount of any change to our unrecognized tax benefits could vary depending on the timing and nature of the settlement. Therefore, an estimate of the change cannot be provided. We recognize accrued interest and penalties for our unrecognized tax benefits as a component of tax expenses. Related interest (benefit) expense totaled $(21) million in 2021, $(15) million in 2020, and $28 million in 2019. We accrued interest and penalties related to our unrecognized tax benefits of approximately $45 million at year-end 2021 and $85 million at year-end 2020.
We file income tax returns, including returns for our subsidiaries, in various jurisdictions around the world. The U.S. Internal Revenue Service (“IRS”) has examined our federal income tax returns, and as of year-end 2021, we have settled all issues for Marriott for tax years through 2015 and for tax year 2018. For Starwood, we have settled all tax years through 2016, the year the acquisition was completed. Our Marriott 2016, 2017, and 2019 through 2021 tax year audits are currently ongoing. Various foreign, state, and local income tax returns are also under examination by the applicable taxing authorities.
Deferred Income Taxes
Deferred income tax balances reflect the effects of temporary differences between the carrying amounts of assets and liabilities and their tax bases, as well as from net operating loss and tax credit carry-forwards. We state those balances at the enacted tax rates we expect will be in effect when we pay or recover the taxes. Deferred income tax assets represent amounts available to reduce income taxes we will pay on taxable income in future years. We evaluate our ability to realize these future tax deductions and credits by assessing whether we expect to have sufficient future taxable income from all sources, including reversal of taxable temporary differences, forecasted operating earnings, and available tax planning strategies to utilize these future deductions and credits. We establish a valuation allowance when we no longer consider it more likely than not that a deferred tax asset will be realized.
The following table presents the tax effect of each type of temporary difference and carry-forward that gave rise to significant portions of our deferred tax assets and liabilities as of year-end 2021 and year-end 2020:
| | | | | | | | | | | |
| ($ in millions) | At Year-End 2021 | | At Year-End 2020 |
| Deferred Tax Assets | | | |
| Employee benefits | $ | 235 | | | $ | 262 | |
| Net operating loss carry-forwards | 771 | | | 818 | |
| Accrued expenses and other reserves | 191 | | | 214 | |
| Receivables, net | 11 | | | 12 | |
| Tax credits | 53 | | | 49 | |
| Loyalty Program | 181 | | | 367 | |
| Deferred income | 98 | | | 69 | |
| Lease liabilities | 336 | | | 252 | |
| Interest Limitation | 163 | | | — | |
| Other | 34 | | | 82 | |
| Deferred tax assets | 2,073 | | | 2,125 | |
| Valuation allowance | (984) | | | (1,009) | |
| Deferred tax assets after valuation allowance | 1,089 | | | 1,116 | |
| Deferred Tax Liabilities | | | |
| Equity method investments | (40) | | | (29) | |
| Property and equipment | (9) | | | (42) | |
| Intangibles | (666) | | | (663) | |
| Right-of-use assets | (290) | | | (197) | |
| Self-insurance | (25) | | | (19) | |
| | | |
| Deferred tax liabilities | (1,030) | | | (950) | |
| Net deferred taxes | $ | 59 | | | $ | 166 | |
Our valuation allowance is primarily attributable to non-U.S. net operating loss carry-forwards.
At year-end 2021, we had approximately $36 million of tax credits that will expire through 2031 and $18 million of tax credits that do not expire. We recorded $51 million of net operating loss benefits in 2021 and $44 million in 2020. At year-end 2021, we had approximately $3,778 million of primarily state and foreign net operating losses, of which $1,738 million will expire through 2041.
We made no provision for U.S. income taxes or additional non-U.S. taxes on certain undistributed earnings of non-U.S. subsidiaries. These earnings could become subject to additional taxes if the non-U.S. subsidiaries dividend or loan those earnings to an affiliate or if we sell our interests in the non-U.S. subsidiaries. We cannot practically estimate the amount of additional taxes that might be payable on the undistributed earnings.
Reconciliation of U.S. Federal Statutory Income Tax Rate to Actual Income Tax Rate
The following table reconciles the U.S. statutory tax rate to our effective income tax rate for the last three fiscal years:
| | | | | | | | | | | | | | | | | |
| 2021 | | 2020 | | 2019 |
| U.S. statutory tax rate | 21.0 | % | | 21.0 | % | | 21.0 | % |
| U.S. state income taxes, net of U.S. federal tax benefit | 2.7 | | | 3.8 | | | 1.6 | |
| Non-U.S. income | (0.5) | | | 12.5 | | | (3.3) | |
| Change in valuation allowance | (0.7) | | | (20.0) | | | 3.4 | |
| Change in uncertain tax positions | (12.0) | | | 12.2 | | | 1.9 | |
| | | | | |
| Permanent items | (0.5) | | | 9.4 | | | 1.3 | |
| Tax on asset dispositions | (0.7) | | | 0.0 | | | (0.7) | |
| | | | | |
| Excess tax benefits related to equity awards | (2.8) | | | 6.4 | | | (3.2) | |
| U.S. tax on foreign earnings | 0.4 | | | (3.0) | | | 0.1 | |
| Other, net | (0.1) | | | 0.6 | | | (1.7) | |
| Effective rate | 6.8 | % | | 42.9 | % | | 20.4 | % |
The non-U.S. income tax benefit presented in the table above includes tax-exempt income in Hong Kong and Singapore, and a deemed interest deduction in Switzerland, which collectively represented 3.2% in 2021, 12.9% in 2020, and 8.8% in 2019. We included the impact of these items in the non-U.S. income line above because we consider them to be equivalent to a reduction of the statutory tax rates in these jurisdictions. Pre-tax income in Switzerland, Singapore, and Hong Kong totaled $255 million in 2021, $314 million in 2020, and $709 million in 2019.
The non-U.S. income tax benefit also includes U.S. income tax expense on non-U.S. operations, which represents (0.5)% in 2021, 0.8% in 2020, and 2.0% in 2019. We included the impact of this tax in the non-U.S. income line above because we consider this tax to be an integral part of the foreign taxes.
Other Information
We paid cash for income taxes, net of refunds, of $362 million in 2021, $279 million in 2020, and $526 million in 2019.
NOTE 7. COMMITMENTS AND CONTINGENCIES
Guarantees
We issue guarantees to certain lenders and hotel owners, chiefly to obtain long-term management and franchise contracts. The guarantees generally have a stated maximum funding amount and a term of three to ten years. The terms of guarantees to lenders generally require us to fund if cash flows from hotel operations are inadequate to cover annual debt service or to repay the loan at maturity. The terms of the guarantees to hotel owners generally require us to fund if the hotels do not attain specified levels of operating profit. Guarantee fundings to lenders and hotel owners are generally recoverable out of future hotel cash flows and/or proceeds from the sale or refinancing of hotels.
We present the maximum potential amount of our future guarantee fundings and the carrying amount of our liability for our debt service, operating profit, and other guarantees (excluding contingent purchase obligations) for which we are the primary obligor at year-end 2021 in the following table:
| | | | | | | | | | | |
($ in millions) Guarantee Type | Maximum Potential
Amount
of Future Fundings | | Recorded Liability for
Guarantees |
| Debt service | $ | 20 | | | $ | 5 | |
| Operating profit | 189 | | | 118 | |
| Other | 18 | | | 4 | |
| $ | 227 | | | $ | 127 | |
Our liability at year-end 2021 for guarantees for which we are the primary obligor is reflected in our Balance Sheets as $17 million of “Accrued expenses and other” and $110 million of “Other noncurrent liabilities.”
Our maximum potential guarantees listed in the preceding table include $42 million of operating profit guarantees and $3 million of other guarantees that will not be in effect until the underlying properties open and we begin to operate the properties or certain other events occur.
In conjunction with financing obtained for specific projects or properties owned by us or entities in which we have an investment, we may provide industry standard indemnifications to the lender for loss, liability, or damage occurring as a result of the actions of the entity or our own actions.
Contingent Purchase Obligation
Sheraton Grand Chicago. In 2017, we granted the owner a one-time right to require us to purchase the leasehold interest in the land and the hotel for $300 million in cash (the “put option”). In the 2021 third quarter, we entered into an amendment with the owner to move the exercise period of the put option from the 2022 first half to the 2024 first half. If the owner exercises the put option, the closing is expected to occur in the 2024 fourth quarter, and we have the option to purchase, at the same time the put transaction closes, the fee simple interest in the underlying land for an additional $200 million in cash. We account for the put option as a guarantee, and our recorded liability was $300 million at year-end 2021 and 2020.
We concluded that the entity that owns the Sheraton Grand Chicago hotel is a variable interest entity. We did not consolidate the entity because we do not have the power to direct the activities that most significantly impact the entity’s economic performance. Our maximum exposure to loss related to the entity is equal to the difference between the purchase price and the fair value of the hotel at the time that the put option is exercised, plus the maximum funding amount of an operating profit guarantee that we provided for the hotel.
Commitments
At year-end 2021, we had various purchase commitments for goods and services in the normal course of business, primarily for programs and services for which we are reimbursed by third-party owners, totaling $409 million. We expect to purchase goods and services subject to these commitments as follows: $227 million in 2022, $71 million in 2023, $88 million in 2024, and $23 million thereafter.
Letters of Credit
At year-end 2021, we had $148 million of letters of credit outstanding (all outside the Credit Facility, as defined in Note 9), most of which were for our self-insurance programs. Surety bonds issued as of year-end 2021 totaled $162 million, most of which state governments requested in connection with our self-insurance programs.
Starwood Data Security Incident
Description of Event
On November 30, 2018, we announced a data security incident involving unauthorized access to the Starwood reservations database (the “Data Security Incident”). Working with leading security experts, we determined that there was unauthorized access to the Starwood network since 2014 and that an unauthorized party had copied information from the Starwood reservations database and taken steps towards removing it. The Starwood reservations database is no longer used for business operations.
Expenses and Insurance Recoveries
In 2021, we recorded $24 million of expenses and $19 million of accrued insurance recoveries related to the Data Security Incident; in 2020, we recorded an $11 million net reversal of expenses and $29 million of accrued insurance recoveries related to the Data Security Incident; and in 2019, we recorded $148 million of expenses and $84 million of accrued insurance recoveries related to the Data Security Incident. We received insurance recoveries of $23 million in 2021 and $47 million in 2020. We recognize insurance recoveries when they are probable of receipt and present them in our Income Statements in the same caption as the related expense, up to the amount of total expense incurred in prior and current periods. We present expenses and insurance recoveries related to the Data Security Incident in either the “Reimbursed expenses” or “Restructuring and merger-related charges” captions of our Income Statements.
Litigation, Claims, and Government Investigations
Following our announcement of the Data Security Incident, approximately 100 lawsuits were filed by consumers and others against us in U.S. federal, U.S. state and Canadian courts related to the incident. All but one of the U.S. cases were consolidated and transferred to the U.S. District Court for the District of Maryland, pursuant to orders of the U.S. Judicial Panel
on Multidistrict Litigation (the “MDL”). The plaintiffs in the U.S. and Canadian cases, who generally purport to represent various classes of consumers, generally claim to have been harmed by alleged actions and/or omissions by the Company in connection with the Data Security Incident and assert a variety of common law and statutory claims seeking monetary damages, injunctive relief, costs and attorneys’ fees, and other related relief. Among the U.S. cases consolidated in the MDL proceeding is a putative class action lawsuit that was filed on December 1, 2018 against the Company and certain of our current and former officers and directors, alleging violations of the federal securities laws in connection with statements regarding our cybersecurity systems and controls, and seeking certification of a class of affected persons, unspecified monetary damages, costs and attorneys’ fees, and other related relief (the “Securities Case”). The MDL proceeding also included two shareholder derivative complaints that were filed on February 26, 2019 and March 15, 2019, respectively, against the Company and certain of our current and former officers and directors, alleging, among other claims, breach of fiduciary duty, corporate waste, unjust enrichment, mismanagement and violations of the federal securities laws, and seeking unspecified monetary damages and restitution, changes to the Company’s corporate governance and internal procedures, costs and attorneys’ fees, and other related relief (the “MDL Derivative Cases”). A separate shareholder derivative complaint was filed in the Delaware Court of Chancery on December 3, 2019 against the Company and certain of our current and former officers and directors, alleging claims and seeking relief generally similar to the claims made and relief sought in the other two derivative cases. This case was not consolidated with the MDL proceeding. We filed motions to dismiss in connection with all of the U.S. cases. Our motions to dismiss the Securities Case and the MDL Derivative Cases were granted in June 2021. The plaintiff in the Securities Case has appealed the dismissal and that appeal is still pending. The plaintiffs in the MDL Derivative Cases have not appealed. Motions to dismiss in the other MDL cases have been denied in part or in whole and these cases remain at varying stages. Our motion to dismiss the Delaware derivative case was granted in October 2021 and no appeal was filed. A putative class action lawsuit brought on behalf of financial institutions has been voluntarily dismissed. The Canadian cases have effectively been consolidated into a single case in the province of Ontario. We dispute the allegations in the lawsuits described above and are vigorously defending against such claims. In April 2019, we received a letter purportedly on behalf of a stockholder of the Company (also one of the named plaintiffs in the Securities Case described above) demanding that our Board of Directors take action against certain of the Company’s current and former officers and directors to recover damages for alleged breaches of fiduciary duties and related claims arising from the Data Security Incident. In October 2021, we received a letter purportedly on behalf of another stockholder of the Company (also one of the named plaintiffs in one of the dismissed MDL Derivative Cases described above) demanding that our Board of Directors take action against certain of the Company’s current and former officers and directors to recover damages for alleged breaches of fiduciary duties and other claims related to the Data Security Incident or associated disclosures. The Board of Directors has constituted a demand review committee to investigate the claims made in these demand letters, and the committee has retained independent counsel to assist with the investigations. The committee has completed its investigation and reported its findings and recommendations to our Board of Directors, which thereafter resolved, in February 2022, to reject the demands in their entirety. In addition, on August 18, 2020, a purported representative action was brought against us in the High Court of Justice for England and Wales on behalf of an alleged claimant class of English and Welsh residents alleging breaches of the General Data Protection Regulation and/or the U.K. Data Protection Act 2018 (the “U.K. DPA”) in connection with the Data Security Incident. We dispute all of the allegations in this purported action and will vigorously defend against any such claims. On November 5, 2020, the court issued an order with the consent of all parties staying this action pending resolution of another case raising similar issues, but not involving the Company. That other case was decided by the U.K. Supreme Court on November 10, 2021 and we are assessing next steps in light of the decision.
In addition, numerous U.S. federal, U.S. state and foreign governmental authorities made inquiries, opened investigations, or requested information and/or documents related to the Data Security Incident and related matters, including Attorneys General offices from all 50 states and the District of Columbia, the Federal Trade Commission, the Securities and Exchange Commission, certain committees of the U.S. Senate and House of Representatives, the Information Commissioner’s Office in the United Kingdom (the “ICO”) as lead supervisory authority in the European Economic Area, and regulatory authorities in various other jurisdictions. With the exception of the ICO proceeding, which was resolved in October 2020, these matters generally remain open. We are in discussions with the U.S. state Attorneys General, the U.S. Federal Trade Commission, and certain regulatory authorities in other jurisdictions to resolve their investigations and requests.
While we believe it is reasonably possible that we may incur additional losses associated with the above described proceedings and investigations related to the Data Security Incident, it is not possible to estimate the amount of loss or range of loss, if any, in excess of the amounts already incurred that might result from adverse judgments, settlements, fines, penalties or other resolution of these proceedings and investigations based on the current stage of these proceedings and investigations, the absence of specific allegations as to alleged damages, the uncertainty as to the certification of a class or classes and the size of any certified class, if applicable, and/or the lack of resolution of significant factual and legal issues.
NOTE 8. LEASES
We enter into operating and finance leases primarily for hotels, offices, and equipment. Most leases have initial terms of up to 20 years, and contain one or more renewals at our option, generally for five- or 10-year periods. We have generally not included these renewal periods in the lease term as it is not reasonably certain that we will exercise the renewal option.
The following table details the composition of lease expense for 2021, 2020, and 2019:
| | | | | | | | | | | | | | |
| ($ in millions) | | 2021 | 2020 | 2019 |
| | | | |
| | | | |
| | | | |
Operating lease cost | | $ | 149 | | $ | 157 | | $ | 185 | |
| Variable lease cost | | 51 | | 60 | | 113 | |
We recorded impairment charges of $116 million in 2020 and $99 million in 2019 in the “Depreciation, amortization, and other” caption of our Income Statements to reduce the carrying amount of certain U.S. & Canada hotel leases right-of-use assets and property and equipment, including leasehold improvements. The impairment charges recorded in 2020 were due to the impact of COVID-19. We determined that we may not be able to fully recover the carrying amount of these U.S. & Canada hotel leases after evaluating the assets for recovery due to declines in market performance and future cash flow projections. We estimated the fair value using an income approach reflecting internally developed Level 3 discounted cash flows that included, among other things, our expectations of future cash flows based on historical experience and projected growth rates, usage estimates and demand trends. Additionally, during the year ended 2019, we recorded an expense of $34 million in the “Restructuring and merger-related charges” caption of our Income Statements due to the impairment of a Legacy-Starwood office building accounted for as a finance lease.
The following table presents our future minimum lease payments at year-end 2021:
| | | | | | | | | | | |
| ($ in millions) | Operating Leases | | Finance Leases |
| 2022 | $ | 191 | | $ | 13 |
| 2023 | 150 | | 14 |
| 2024 | 141 | | 14 |
| 2025 | 133 | | 14 |
| 2026 | 109 | | 15 |
| Thereafter | 942 | | 122 |
| Total minimum lease payments | $ | 1,666 | | $ | 192 |
| Less: Amount representing interest | 418 | | 46 |
| Present value of minimum lease payments | $ | 1,248 | | $ | 146 |
| | | |
| | | |
| | | |
| | | |
| | | |
| | | |
| | | |
| | | |
The following table presents the composition of our current and noncurrent lease liability at year-end 2021 and 2020:
| | | | | | | | | | | | | | | | | | | | | | | |
| ($ in millions) | December 31, 2021 | | December 31, 2020 |
| Operating Leases | | Finance Leases | | Operating Leases | | Finance Leases |
Current (1) | $ | 150 | | | $ | 7 | | | $ | 147 | | | $ | 7 | |
Noncurrent (2) | 1,098 | | | 139 | | | 823 | | | 146 | |
| $ | 1,248 | | | $ | 146 | | | $ | 970 | | | $ | 153 | |
(1)Operating leases are recorded in the “Accrued expenses and other” and finance leases are recorded in the “Current portion of long-term debt” captions of our Balance Sheets.
(2)Operating leases are recorded in the “Operating lease liabilities” and finance leases are recorded in the “Long-term debt” captions of our Balance Sheets.
The following table presents additional information about our lease obligations at year-end 2021 and 2020:
| | | | | | | | | | | | | | | | | | | | | | | | | | |
| | 2021 | | 2020 |
| | Operating leases | | Finance leases | | Operating leases | | Finance leases |
| | | | | | | | |
| Weighted Average Remaining Lease Term (in years) | | 14 | | 12 | | 10 | | 13 |
| Weighted Average Discount Rate | | 4.2 | % | | 4.4 | % | | 4.6 | % | | 4.4 | % |
The following table presents supplemental cash flow information for 2021 and 2020:
| | | | | | | | | |
| ($ in millions) | | 2021 | 2020 |
| Cash paid for amounts included in the measurement of lease liabilities: | | | |
| Operating cash outflows for operating leases | | $ | 181 | | $ | 162 | |
| | | |
| | | |
| Lease assets obtained in exchange for lease obligations: | | | |
| Operating leases | | 463 | | 35 | |
| | | |
NOTE 9. LONG-TERM DEBT
We provide detail on our long-term debt balances, net of discounts, premiums, and debt issuance costs, in the following table at year-end 2021 and 2020:
| | | | | | | | | | | |
| ($ in millions) | At Year-End 2021 | | At Year-End 2020 |
| Senior Notes: | | | |
Series L Notes, interest rate of 3.3%, face amount of $173, maturing September 15, 2022 (effective interest rate of 3.4%) | $ | 173 | | | $ | 173 | |
Series N Notes, interest rate of 3.1%, face amount of $400, redeemed August 9, 2021 (effective interest rate of 3.4%) | — | | | 399 | |
Series O Notes, interest rate of 2.9%, face amount of $450, matured March 1, 2021 (effective interest rate of 3.1%) | — | | | 450 | |
Series P Notes, interest rate of 3.8%, face amount of $350, maturing October 1, 2025 (effective interest rate of 4.0%) | 347 | | | 346 | |
Series Q Notes, interest rate of 2.3%, face amount of $399, matured January 15, 2022 (effective interest rate of 2.5%) | 399 | | | 398 | |
Series R Notes, interest rate of 3.1%, face amount of $750, maturing June 15, 2026 (effective interest rate of 3.3%) | 746 | | | 745 | |
Series U Notes, interest rate of 3.1%, face amount of $291, maturing February 15, 2023 (effective interest rate of 3.1%) | 291 | | | 291 | |
Series V Notes, interest rate of 3.8%, face amount of $318, maturing March 15, 2025 (effective interest rate of 2.8%) | 327 | | | 330 | |
Series W Notes, interest rate of 4.5%, face amount of $278, maturing October 1, 2034 (effective interest rate of 4.1%) | 290 | | | 290 | |
Series X Notes, interest rate of 4.0%, face amount of $450, maturing April 15, 2028 (effective interest rate of 4.2%) | 445 | | | 445 | |
Series Z Notes, interest rate of 4.2%, face amount of $350, maturing December 1, 2023 (effective interest rate of 4.4%) | 349 | | | 348 | |
Series AA Notes, interest rate of 4.7%, face amount of $300, maturing December 1, 2028 (effective interest rate of 4.8%) | 297 | | | 297 | |
Series BB Notes, floating rate, face amount of $300, matured March 8, 2021 | — | | | 300 | |
Series CC Notes, interest rate of 3.6%, face amount of $550, maturing April 15, 2024 (effective interest rate of 3.9%) | 566 | | | 586 | |
Series DD Notes, interest rate of 2.1%, face amount of $224, maturing October 3, 2022 (effective interest rate of 1.2%) | 226 | | | 228 | |
Series EE Notes, interest rate of 5.8%, face amount of $600, maturing May 1, 2025 (effective interest rate of 6.0%) | 595 | | | 1,583 | |
Series FF Notes, interest rate of 4.6%, face amount of $1,000, maturing June 15, 2030 (effective interest rate of 4.8%) | 987 | | | 986 | |
Series GG Notes, interest rate of 3.5%, face amount of $1,000, maturing October 15, 2032 (effective interest rate of 3.7%) | 986 | | | 985 | |
Series HH Notes, interest rate of 2.9%, face amount of $1,100, maturing April 15, 2031 (effective interest rate of 3.0%) | 1,090 | | | — | |
Series II Notes, interest rate of 2.8%, face amount of $700, maturing October 15, 2033 (effective interest rate of 2.8%) | 693 | | | — | |
| | | |
| | | |
| Credit Facility | 1,050 | | | 900 | |
| Finance lease obligations | 146 | | | 153 | |
| Other | 135 | | | 143 | |
| $ | 10,138 | | | $ | 10,376 | |
| Less current portion | (805) | | | (1,173) | |
| $ | 9,333 | | | $ | 9,203 | |
All our long-term debt is recourse to us but unsecured. All the Senior Notes shown in the table above are our unsecured and unsubordinated obligations, which rank equally with our other Senior Notes and all other unsecured and unsubordinated indebtedness that we have issued or will issue from time to time, and are governed by the terms of an indenture, dated as of November 16, 1998, between us and The Bank of New York Mellon (formerly The Bank of New York), as trustee. We may redeem some or all of each series of the Senior Notes before maturity under the terms provided in the applicable form of Senior Note.
In January 2022, we made a $404 million cash payment of principal and interest to retire, at maturity, all of our outstanding Series Q Notes.
In September 2021, we completed a tender offer (the “Tender Offer”) and purchased and retired $1 billion aggregate principal amount of our 5.750 percent Series EE Notes maturing May 1, 2025. We used the net proceeds from our Series II Notes offering described below and cash on hand to complete the repurchase of such Series EE Notes, including the payment of accrued interest and other costs incurred. As a result of the Tender Offer, in the 2021 third quarter, we recorded a loss of $164 million in the “Loss on extinguishment of debt” caption of our Income Statements.
In September 2021, we issued $700 million aggregate principal amount of 2.750 percent Series II Notes due October 15, 2033 (the “Series II Notes”). We will pay interest on the Series II Notes in April and October of each year, commencing in April 2022. We received net proceeds of approximately $693 million from the offering of the Series II Notes, after deducting the underwriting discount and estimated expenses. We used the net proceeds to fund the Tender Offer, as further described above.
In August 2021, we redeemed all $400 million aggregate principal amount of our Series N Notes due in October 2021.
In March 2021, we issued $1.1 billion aggregate principal amount of 2.850 percent Series HH Notes due April 15, 2031 (the “Series HH Notes”). We pay interest on the Series HH Notes in April and October of each year. We received net proceeds of approximately $1.089 billion from the offering of the Series HH Notes, after deducting the underwriting discount and estimated expenses, which were made available for general corporate purposes, including the repayment of a portion of our outstanding borrowings under the Credit Facility.
We are party to a multicurrency revolving credit agreement (as amended, the “Credit Facility”) that provides for up to $4.5 billion of aggregate borrowings for general corporate needs, including working capital, capital expenditures, letters of credit, acquisitions, and to support our commercial paper program if and when we resume issuing commercial paper. Borrowings under the Credit Facility generally bear interest at LIBOR (the London Interbank Offered Rate) plus a spread, based on our public debt rating. We also pay quarterly fees on the Credit Facility at a rate based on our public debt rating. We classify outstanding borrowings under the Credit Facility and outstanding commercial paper borrowings (if any) as long-term based on our ability and intent to refinance the outstanding borrowings on a long-term basis. The Credit Facility expires on June 28, 2024. In 2021, we made borrowings of $1.7 billion and repayments of $1.5 billion. Our total outstanding borrowings under the Credit Facility were $1.1 billion as of year-end 2021.
We entered into amendments to the Credit Facility in April 2020 and January 2021 (the “Credit Facility Amendments”). The debt leverage covenant in the Credit Facility, which is tested each quarter and was waived pursuant to the Credit Facility Amendments through and including the fourth quarter of 2021, resumes beginning with the quarter ending March 31, 2022. The Credit Facility Amendments adjusted the required leverage levels for this covenant when it is re-imposed (starting at 5.50 to 1.00 for the test period ending on March 31, 2022 and gradually stepping down to 4.00 to 1.00 over the succeeding five fiscal quarters, as further described in the Credit Facility). The Credit Facility Amendments also amended certain other terms of the Credit Facility, including reducing the rate floor for the LIBOR Daily Floating Rate and the Eurocurrency Rate.
The following table presents future principal payments, net of discounts, premiums, and debt issuance costs, for our debt at year-end 2021:
| | | | | |
Debt Principal Payments ($ in millions) | Amount |
| 2022 | $ | 805 | |
| 2023 | 683 | |
| 2024 | 1,624 | |
| 2025 | 1,311 | |
| 2026 | 756 | |
| Thereafter | 4,959 | |
| Balance at year-end 2021 | $ | 10,138 | |
We paid cash for interest, net of amounts capitalized, of $391 million in 2021, $377 million in 2020, and $348 million in 2019.
NOTE 10. INTANGIBLE ASSETS AND GOODWILL
The following table details the composition of our intangible assets at year-end 2021 and 2020:
| | | | | | | | | | | |
| ($ in millions) | At Year-End 2021 | | At Year-End 2020 |
| Definite-lived Intangible Assets | | | |
| Costs incurred to obtain contracts with customers | $ | 1,875 | | | $ | 1,674 | |
| Contracts acquired in business combinations and other | 2,187 | | | 2,257 | |
| 4,062 | | | 3,931 | |
| Accumulated amortization | (1,052) | | | (937) | |
| 3,010 | | | 2,994 | |
| Indefinite-lived Intangible Brand Assets | 5,916 | | | 5,995 | |
| $ | 8,926 | | | $ | 8,989 | |
We capitalize direct costs that we incur to obtain management, franchise, and license agreements. We amortize these costs on a straight-line basis over the initial term of the agreements, ranging from 15 to 30 years. In 2020, we recorded impairment charges totaling $64 million in the “Contract investment amortization” caption of our Income Statements to reduce the carrying amount of certain capitalized costs incurred to obtain contracts with customers, primarily due to the impact of COVID-19, most of which we recorded in our U.S. & Canada business segment.
For contracts acquired in business combinations and other intangible assets, we recorded amortization expense of $165 million in 2021, $97 million in 2020, and $105 million in 2019 (of which $62 million in 2021 and none in 2020 and 2019 was included in the “Reimbursed expenses” caption of our Income Statements). For these assets, we estimate that our aggregate amortization expense will be $163 million in 2022, $147 million in 2023, $134 million in 2024, $122 million in 2025, and $110 million in 2026.
The following table details the carrying amount of our goodwill at year-end 2021 and 2020:
| | | | | | | | | | | | | | | | | | | | | |
| ($ in millions) | U.S. & Canada | | International | | | | | | Total
Goodwill |
| | | | | | | | | |
| | | | | | | | | |
| | | | | | | | | |
| | | | | | | | | |
| | | | | | | | | |
| | | | | | | | | |
| | | | | | | | | |
| | | | | | | | | |
| | | | | | | | | |
| | | | | | | | | |
| Balance at year-end 2020 | $ | 5,347 | | | $ | 3,828 | | | | | | | $ | 9,175 | |
| | | | | | | | | |
| | | | | | | | | |
| | | | | | | | | |
| Foreign currency translation | 1 | | | (103) | | | | | | | (102) | |
| | | | | | | | | |
| | | | | | | | | |
| | | | | | | | | |
| | | | | | | | | |
| Balance at year-end 2021 | $ | 5,348 | | | $ | 3,725 | | | | | | | $ | 9,073 | |
NOTE 11. PROPERTY AND EQUIPMENT
The following table presents the composition of our property and equipment balances at year-end 2021 and 2020:
| | | | | | | | | | | |
| ($ in millions) | At Year-End 2021 | | At Year-End 2020 |
| Land | $ | 686 | | | $ | 688 | |
| Buildings and leasehold improvements | 985 | | | 1,045 | |
| Furniture and equipment | 545 | | | 640 | |
| Construction in progress | 137 | | | 29 | |
| 2,353 | | | 2,402 | |
| Accumulated depreciation | (850) | | | (888) | |
| $ | 1,503 | | | $ | 1,514 | |
We record property and equipment at cost, including interest and real estate taxes we incur during development and construction. We capitalize the cost of improvements that extend the useful life of property and equipment when we incur them. These capitalized costs may include structural costs, equipment, fixtures, floor, and wall coverings. We expense all repair and maintenance costs when we incur them. We compute depreciation using the straight-line method over the estimated useful lives of the assets (generally three to 40 years), and we amortize leasehold improvements over the shorter of the asset life or lease term. Our gross depreciation expense totaled $138 million in 2021, $322 million in 2020, and $346 million in 2019 (of which $49 million in 2021, $109 million in 2020, and $121 million in 2019 was included in the “Reimbursed expenses” caption of our Income Statements). Fixed assets attributed to operations located outside the U.S. were $623 million at year-end 2021 and $679 million at year-end 2020. Our gross depreciation expense included impairment charges for property and equipment, including
leasehold improvements, and right-of-use assets on several U.S. & Canada leased hotels in 2020 and 2019, which we discussed in Note 8.
NOTE 12. FAIR VALUE OF FINANCIAL INSTRUMENTS
We believe that the fair values of our current assets and current liabilities approximate their reported carrying amounts. We present the carrying values and the fair values of noncurrent financial assets and liabilities that qualify as financial instruments, determined under current guidance for disclosures on the fair value of financial instruments, in the following table:
| | | | | | | | | | | | | | | | | | | | | | | |
| | At Year-End 2021 | | At Year-End 2020 |
| ($ in millions) | Carrying
Amount | | Fair Value | | Carrying
Amount | | Fair Value |
| Senior, mezzanine, and other loans | $ | 144 | | | $ | 131 | | | $ | 159 | | | $ | 142 | |
| Total noncurrent financial assets | $ | 144 | | | $ | 131 | | | $ | 159 | | | $ | 142 | |
| | | | | | | |
| Senior Notes | $ | (8,009) | | | $ | (8,480) | | | $ | (8,031) | | | $ | (8,941) | |
| Credit Facility | (1,050) | | | (1,050) | | | (900) | | | (900) | |
| Other long-term debt | (135) | | | (140) | | | (126) | | | (128) | |
| Other noncurrent liabilities | (414) | | | (414) | | | (426) | | | (426) | |
| Total noncurrent financial liabilities | $ | (9,608) | | | $ | (10,084) | | | $ | (9,483) | | | $ | (10,395) | |
We estimate the fair value of our senior, mezzanine, and other loans by discounting cash flows using risk-adjusted rates, both of which are Level 3 inputs.
We determine the fair value of our Senior Notes using quoted market prices, which are directly observable Level 1 inputs. When we have outstanding commercial paper, we use pricing from recent transactions as Level 2 inputs in estimating fair value. The carrying value of our Credit Facility borrowings approximate fair value because they bear interest at a market rate. We estimate the fair value of our other long-term debt, excluding leases, using expected future payments discounted at risk-adjusted rates, which are Level 3 inputs. Our other noncurrent liabilities consist of guarantees. As we note in the “Guarantees” caption of Note 2, we measure our liability for guarantees at fair value on a nonrecurring basis, which is when we issue or modify a guarantee using Level 3 internally developed inputs. At year-end 2021 and year-end 2020, we determined that the carrying values of our guarantee liabilities approximated their fair values based on Level 3 inputs.
See the “Fair Value Measurements” caption of Note 2 for more information on the input levels we use in determining fair value.
NOTE 13. ACCUMULATED OTHER COMPREHENSIVE LOSS
The following table details the accumulated other comprehensive loss activity for 2021, 2020, and 2019:
| | | | | | | | | | | | | | | | | |
| ($ in millions) | Foreign Currency Translation Adjustments | | Derivative Instrument and Other Adjustments | | Accumulated Other Comprehensive Loss |
| Balance at year-end 2018 | $ | (403) | | | $ | 12 | | | $ | (391) | |
Other comprehensive income before reclassifications (1) | 35 | | | 2 | | | 37 | |
| Reclassification adjustments | — | | | (7) | | | (7) | |
| Net other comprehensive income (loss) | 35 | | | (5) | | | 30 | |
| Balance at year-end 2019 | $ | (368) | | | $ | 7 | | | $ | (361) | |
Other comprehensive income before reclassifications (1) | 229 | | | 7 | | | 236 | |
| Reclassification adjustments | — | | | (10) | | | (10) | |
| Net other comprehensive income (loss) | 229 | | | (3) | | | 226 | |
| Balance at year-end 2020 | $ | (139) | | | $ | 4 | | | $ | (135) | |
Other comprehensive (loss) income before reclassifications (1) | (212) | | | 5 | | | (207) | |
| Reclassification adjustments | — | | | — | | | — | |
| Net other comprehensive (loss) income | (212) | | | 5 | | | (207) | |
| Balance at year-end 2021 | $ | (351) | | | $ | 9 | | | $ | (342) | |
(1)Other comprehensive income (loss) before reclassifications for foreign currency translation adjustments includes intra-entity foreign currency transactions that are of a long-term investment nature, which resulted in gains (losses) of $40 million for 2021, $(44) million for 2020, and $6 million for 2019.
NOTE 14. BUSINESS SEGMENTS
Beginning in the 2021 first quarter, we modified our segment structure due to a change in the way our chief operating decision maker evaluates results and allocates resources within the Company, resulting in the following two operating segments, both of which meet the applicable accounting criteria for separate disclosure as a reportable business segment: United States and Canada (“U.S. & Canada”) and International. We revised the prior period amounts shown in the tables below to conform to our current presentation.
We evaluate the performance of our operating segments using “segment profits/loss” which is based largely on the results of the segment without allocating corporate expenses, income taxes, indirect general, administrative, and other expenses, merger-related costs, or most above-property restructuring charges. We assign gains and losses, equity in earnings or losses, direct general, administrative, and other expenses, and other restructuring charges to each of our segments. “Unallocated corporate and other” includes a portion of our revenues (including license fees we receive from our credit card programs and fees from vacation ownership licensing agreements), revenues and expenses for our Loyalty Program, general, administrative, and other expenses, restructuring and merger-related charges, equity in earnings or losses, and other gains or losses that we do not allocate to our segments.
Our chief operating decision maker monitors assets for the consolidated Company but does not use assets by operating segment when assessing performance or making operating segment resource allocations.
Segment Revenues
The following table presents our revenues disaggregated by segment and major revenue stream for the last three fiscal years:
| | | | | | | | | | | | | | | | | | | | | | | | | | | | | | | | | | | | | |
| 2021 | | 2020 | | 2019 |
| ($ in millions) | U.S. & Canada | International | | | Total | | U.S. & Canada | International | Total | | U.S. & Canada | International | Total |
| Gross fee revenues | $ | 1,580 | | $ | 568 | | | | $ | 2,148 | | | $ | 914 | | $ | 338 | | $ | 1,252 | | | $ | 2,265 | | $ | 1,032 | | $ | 3,297 | |
| Contract investment amortization | (55) | | (20) | | | | (75) | | | (108) | | (24) | | (132) | | | (48) | | (14) | | (62) | |
| Net fee revenues | 1,525 | | 548 | | | | 2,073 | | | 806 | | 314 | | 1,120 | | | 2,217 | | 1,018 | | 3,235 | |
| Owned, leased, and other revenue | 282 | | 467 | | | | 749 | | | 198 | | 317 | | 515 | | | 715 | | 841 | | 1,556 | |
| Cost reimbursement revenue | 8,549 | | 1,239 | | | | 9,788 | | | 6,901 | | 966 | | 7,867 | | | 13,901 | | 1,685 | | 15,586 | |
| Total reportable segment revenue | $ | 10,356 | | $ | 2,254 | | | | $ | 12,610 | | | $ | 7,905 | | $ | 1,597 | | $ | 9,502 | | | $ | 16,833 | | $ | 3,544 | | $ | 20,377 | |
| Unallocated corporate and other | | | | | 1,247 | | | | | 1,069 | | | | | 595 | |
| Total revenue | | | | | $ | 13,857 | | | | | $ | 10,571 | | | | | $ | 20,972 | |
Revenues attributed to operations located outside the U.S. were $2,615 million in 2021, $1,910 million in 2020, and $4,400 million in 2019, including cost reimbursement revenue outside the U.S. of $1,553 million in 2021, $1,247 million in 2020, and $2,394 million in 2019.
Segment Profits and Losses
| | | | | | | | | | | | | | | | | |
| ($ in millions) | 2021 | | 2020 | | 2019 |
U.S. & Canada (1) | $ | 1,394 | | | $ | 198 | | | $ | 2,000 | |
International (2) | 258 | | | (222) | | | 804 | |
| Unallocated corporate and other | (80) | | | (24) | | | (837) | |
| Interest expense, net of interest income | (392) | | | (418) | | | (368) | |
| (Provision) benefit for income taxes | (81) | | | 199 | | | (326) | |
| Net income (loss) | $ | 1,099 | | | $ | (267) | | | $ | 1,273 | |
(1) Includes cost reimbursements, net of $51 million in 2021, $(80) million in 2020, and $(129) million in 2019.
(2) Includes cost reimbursements, net of $14 million in 2021, $(55) million in 2020, and $(18) million in 2019.
Segment profits (losses) attributed to operations located outside the U.S. were $297 million in 2021, $(198) million in 2020, and $982 million in 2019, including cost reimbursements, net (cost reimbursement revenue, net of reimbursed expenses) outside the U.S. of $14 million in 2021, $(62) million in 2020, and $(18) million in 2019.
Depreciation, Amortization, and Other
| | | | | | | | | | | | | | | | | |
| ($ in millions) | 2021 | | 2020 | | 2019 |
U.S. & Canada | $ | 92 | | | $ | 209 | | | $ | 218 | |
International | 106 | | | 113 | | | 96 | |
| | | | | |
Unallocated corporate and other | 22 | | | 24 | | | 27 | |
| $ | 220 | | | $ | 346 | | | $ | 341 | |
Capital Expenditures
| | | | | | | | | | | | | | | | | |
| ($ in millions) | 2021 | | 2020 | | 2019 |
U.S. & Canada | $ | 13 | | | $ | 12 | | | $ | 287 | |
International | 12 | | | 17 | | | 166 | |
| | | | | |
Unallocated corporate and other | 158 | | | 106 | | | 200 | |
| $ | 183 | | | $ | 135 | | | $ | 653 | |
NOTE 15. RELATED PARTY TRANSACTIONS
Equity Method Investments
We have equity method investments in entities that own or lease properties for which we provide management services and receive fees. In addition, in some cases we provide loans, preferred equity, or guarantees to these entities.
The following table presents Income Statement data resulting from transactions with these related parties. This table does not include our Financial Statement captions with insignificant related party activity.
| | | | | | | | | | | | | | | | | |
| ($ in millions) | 2021 | | 2020 | | 2019 |
| | | | | |
| | | | | |
| | | | | |
| | | | | |
| Cost reimbursement revenue | $ | 104 | | | $ | 107 | | | $ | 233 | |
| | | | | |
| | | | | |
| Reimbursed expenses | (105) | | | (110) | | | (236) | |
| | | | | |
| | | | | |
| | | | | |
| Equity in (losses) earnings | (24) | | | (141) | | | 13 | |
Summarized Financial Information for Investees
The following tables present summarized financial information for the entities in which we have equity method investments:
| | | | | | | | | | | | | | | | | |
| ($ in millions) | 2021 | | 2020 | | 2019 |
| Sales | $ | 283 | | | $ | 259 | | | $ | 815 | |
| Net (loss) income | (37) | | | (212) | | | 80 | |
| | | | | | | | | | | |
| ($ in millions) | At Year-End 2021 | | At Year-End 2020 |
| | | |
| Total Assets (primarily composed of hotel real estate managed by us) | $ | 1,229 | | | $ | 2,348 | |
| | | |
| Total Liabilities | 865 | | | 1,623 | |
The carrying amount of our equity method investments was $387 million at year-end 2021 and $422 million at year-end 2020. This value exceeded our share of the book value of the investees’ net assets by $257 million at year-end 2021 and $294 million at year-end 2020, primarily due to the value that we assigned to land, contracts, and buildings owned by the investees.
In 2020, we recorded impairment charges of $77 million in the “Equity in (losses) earnings” caption of our Income Statements to reduce the carrying amount of certain investments, primarily due to the impact of COVID-19, most of which we recorded in our U.S. & Canada business segment.
Other Related Parties
We earned management fees of approximately $6 million in 2021, $3 million in 2020, and $12 million in 2019, plus reimbursement of certain expenses, from our operation of properties in which JWM Family Enterprises, L.P., which is beneficially owned and controlled by J.W. Marriott, Jr., Deborah Marriott Harrison, David S. Marriott, and other members of the Marriott family, indirectly holds varying percentages of ownership. We earned gross fee revenues of approximately $1 million in 2021, plus reimbursement of certain expenses, and no revenues in 2020 and 2019 from managed and franchised properties in which other members of the Marriott family hold varying interests.
NOTE 16. RELATIONSHIP WITH MAJOR CUSTOMER
Host Hotels & Resorts, Inc., formerly known as Host Marriott Corporation, and its affiliates (“Host”) owned or leased 56 lodging properties at year-end 2021 and 59 at year-end 2020 that we operated or franchised. Over the last three years, we recognized revenues, including cost reimbursement revenue, of $1,192 million in 2021, $1,037 million in 2020, and $2,406 million in 2019 from those lodging properties, and included those revenues in our U.S. & Canada and International reportable business segments.
Item 9. Changes in and Disagreements with Accountants on Accounting and Financial Disclosure.
None.
Item 9A. Controls and Procedures.
Disclosure Controls and Procedures
We evaluated the effectiveness of our disclosure controls and procedures (as such term is defined in Rules 13a-15(e) and 15d-15(e) under the Securities Exchange Act of 1934 (the “Exchange Act”)) as of the end of the period covered by this annual report under the supervision and with the participation of our management, including our Chief Executive Officer and Chief Financial Officer. Management necessarily applied its judgment in assessing the costs and benefits of those controls and procedures, which by their nature, can provide only reasonable assurance about management’s control objectives. You should note that the design of any system of controls is based in part upon certain assumptions about the likelihood of future events,
and we cannot assure you that any design will succeed in achieving its stated goals under all potential future conditions, regardless of how remote. Based upon this evaluation, our Chief Executive Officer and Chief Financial Officer concluded that our disclosure controls and procedures were effective and operating to provide reasonable assurance that we record, process, summarize, and report the information we are required to disclose in the reports that we file or submit under the Exchange Act within the time periods specified in the rules and forms of the SEC, and to provide reasonable assurance that we accumulate and communicate such information to our management, including our Chief Executive Officer and Chief Financial Officer, as appropriate to allow timely decisions about required disclosure.
Internal Control Over Financial Reporting
We have set forth management’s report on internal control over financial reporting and the attestation report of our independent registered public accounting firm on our internal control over financial reporting in Part II, Item 8 of this Form 10-K, and we incorporate those reports here by reference.
We made no changes in internal control over financial reporting during the fourth quarter of 2021 that materially affected, or are reasonably likely to materially affect, our internal control over financial reporting.
Item 9B. Other Information.
None.
Item 9C. Disclosure Regarding Foreign Jurisdictions that Prevent Inspections.
Not applicable.
PART III
Items 10, 11, 12, 13, 14.
As described below, we incorporate by reference in this Annual Report on Form 10-K certain information appearing in the Proxy Statement that we will furnish to our stockholders for our 2022 Annual Meeting of Stockholders.
| | | | | |
| Item 10. Directors, Executive Officers, and Corporate Governance. | We incorporate this information by reference to “Nominees to our Board of Directors,” “Committees of the Board — Audit Committee,” “Transactions with Related Persons,” “Delinquent Section 16(a) Reports,” and “Selection of Director Nominees” sections of our Proxy Statement. We have included information regarding our executive officers and our Code of Ethics below. |
| |
| Item 11. Executive Compensation. | We incorporate this information by reference to the “Executive and Director Compensation” and “Compensation Committee Interlocks and Insider Participation” sections of our Proxy Statement. |
| |
| Item 12. Security Ownership of Certain Beneficial Owners and Management and Related Stockholder Matters. | We incorporate this information by reference to the “Securities Authorized for Issuance Under Equity Compensation Plans” and the “Stock Ownership” sections of our Proxy Statement. |
| |
| Item 13. Certain Relationships and Related Transactions, and Director Independence. | We incorporate this information by reference to the “Transactions with Related Persons” and “Director Independence” sections of our Proxy Statement. |
| |
| Item 14. Principal Accountant Fees and Services. | We incorporate this information by reference to the “Independent Registered Public Accounting Firm Fee Disclosure” and the “Pre-Approval of Independent Auditor Fees and Services Policy” sections of our Proxy Statement. |
INFORMATION ABOUT OUR EXECUTIVE OFFICERS
We include below certain information on our executive officers. This information is as of February 1, 2022, except where indicated.
| | | | | | | | | | | | | | |
| Name and Title | | Age | | Business Experience |
J.W. Marriott, Jr.
Executive Chairman and
Chairman of the Board | | 89 | | | J.W. Marriott, Jr. was elected Executive Chairman effective March 31, 2012, having relinquished his position as Chief Executive Officer. He served as Chief Executive Officer of the Company and its predecessors since 1972. He joined Marriott in 1956, became President and a Director in 1964, Chief Executive Officer in 1972, and Chairman of the Board in 1985. Mr. Marriott serves on the Board of Trustees of The J. Willard & Alice S. Marriott Foundation and is an honorary member of the World Travel & Tourism Council. Mr. Marriott has served as a Director of the Company and its predecessors since 1964. He holds a Bachelor of Science degree in Banking and Finance from the University of Utah. Mr. Marriott plans to transition to the role of Chairman Emeritus in 2022. |
| | | | |
Anthony G. Capuano
Chief Executive Officer | | 56 | | | Anthony G. Capuano was appointed Chief Executive Officer (“CEO”) effective February 21, 2021. Prior to his appointment as CEO, Mr. Capuano was Group President, Global Development, Design and Operations Services, a role he assumed in January 2020. In that role, he was responsible for leading the Company’s global development and design efforts and overseeing the Company’s Global Operations discipline. Mr. Capuano began his Marriott career in 1995 as part of the Market Planning and Feasibility team. Between 1997 and 2005, he led Marriott’s full-service development efforts in the Western U.S. and Canada. From 2005 to 2008, Mr. Capuano served as Senior Vice President of full-service development for North America. In 2008, his responsibilities expanded to include all of U.S. and Canada and the Caribbean and Latin America, and he became Executive Vice President and Global Chief Development Officer in 2009. Mr. Capuano began his professional career in Laventhol and Horwath’s Boston-based Leisure Time Advisory Group. He then joined Kenneth Leventhal and Company’s hospitality consulting group in Los Angeles, CA. Mr. Capuano earned his bachelor’s degree in Hotel Administration from Cornell University. He is an active member of the Cornell Hotel Society and a member of The Cornell School of Hotel Administration Dean’s Advisory Board. Mr. Capuano is also a member of the American Hotel and Lodging Association’s Industry Real Estate Financial Advisory Council. |
| | | | |
Ty Breland
Executive Vice President
and Chief Human Resources Officer | | 46 | | | Ty Breland was appointed Executive Vice President and Chief Human Resources Officer effective October 29, 2021. Prior to that appointment, Mr. Breland served as Global HR Officer for Talent Development & Organizational Capability, a role he assumed in 2016. In that role, Mr. Breland had executive oversight for talent management, including leadership development, organizational capability, and change management. Mr. Breland also oversaw The Ritz-Carlton Leadership Center, including its business strategy and sales efforts, and served as the senior Human Resources leader for the company’s Global Development, Design & Operations Services disciplines. Mr. Breland joined Marriott in 2004 as a member of the Company’s Talent Management and Analytics group and held a variety of other senior human resources leadership positions, including Global HR Integration Officer, responsible for the Human Resources integration for Marriott’s merger with Starwood Hotels & Resorts. From 2011-2015, Mr. Breland served as Regional Vice President of Human Resources for the Eastern Region of the U.S. Before joining Marriott, Mr. Breland worked for the Human Resources Research Organization as a research consultant. He earned his Bachelor of Science in Psychology and Ph.D. in Industrial/Organizational Psychology from Virginia Tech, where he is a board member for the Virginia Tech Hospitality Business School. |
| | | | |
| | | | | | | | | | | | | | |
| Name and Title | | Age | | Business Experience |
Liam Brown
Group President, United States and Canada | | 61 | | | Liam Brown became Group President, United States and Canada effective in January 2021. Prior to this role, Mr. Brown served as the President and Managing Director of Europe from 2018 to 2019, followed by Group President of Europe, Middle East & Africa in 2020. Mr. Brown joined Marriott in 1989 and served as President for Franchising, Owner Services and Managed by Marriott Select Brands, North America from 2012 to 2018. Other key positions held by Mr. Brown include Chief Operations Officer for the Americas for Select Service & Extended Stay Lodging and Owner & Franchise Services, as well as Senior Vice President and Executive Vice President of Development for Marriott’s Select Service & Extended Stay lodging products. Mr. Brown also serves on the Board of Directors of the American Hotel and Lodging Association. He holds a Hotel Diploma and Business Degree from the Dublin Institute of Technology, Trinity College and earned his Master of Business Administration from the Robert H. Smith School of Management at the University of Maryland. |
| | | | |
Felitia Lee
Controller and
Chief Accounting Officer | | 60 | | | Felitia Lee became Marriott’s Controller and Chief Accounting Officer and principal accounting officer in August 2020, with responsibility for the accounting operations of the Company including oversight of Financial Reporting & Analysis, Accounting Policy, General Accounting, Governance, Risk Management (Insurance, Claims, Business Continuity, Fire & Life Safety), Global Finance Shared Services, and Finance Contract Compliance. Ms. Lee joined Marriott in May 2020, supporting the management of the Company’s accounting operations. Prior to joining Marriott, Ms. Lee was the Senior Vice President and Controller for Kohl’s Corporation, a publicly-traded retailer, since 2018, where she was responsible for financial reporting, Sarbanes-Oxley processes, capital management, tax planning and compliance. Prior to joining Kohl’s Corporation, Ms. Lee held numerous positions with PepsiCo, Inc., a publicly-traded global food and beverage company, culminating in Vice President and Controller of the Pepsi Beverage Company after the merger of PepsiCo with two of its largest bottlers in 2010. Earlier in her career, Ms. Lee held a variety of financial leadership positions with such organizations as Pilkington, plc and Coopers & Lybrand (an accounting firm now part of PricewaterhouseCoopers). She earned her Bachelor of Science in Accounting from Santa Clara University. She is a Certified Public Accountant and a member of the American Institute of Certified Public Accountants. |
| | | | |
Stephanie Linnartz
President | | 53 | | | Stephanie Linnartz was appointed President of Marriott effective February 22, 2021. In her role, she is responsible for developing and executing all aspects of the Company’s global consumer strategy, including brand, marketing, sales, revenue management, customer engagement, technology, emerging businesses, and Marriott Bonvoy, the Company’s loyalty program. In addition, she oversees Marriott’s global development, design, and operations services functions. Before that, Ms. Linnartz was Group President, Consumer Operations, Technology and Emerging Businesses beginning in January 2020. Before assuming her position as Group President, Ms. Linnartz, who began her Marriott career in 1997, served as Global Chief Commercial Officer from 2013 to 2019; Global Officer, Sales and Revenue Management from 2009 to 2013; Senior Vice President, Global Sales from 2008 to 2009; Senior Vice President, Sales and Marketing Planning and Support from 2005 to 2008; and prior to that, various roles in Marriott’s Finance and Business Development Department. She currently serves on the Board of Directors of The Home Depot. She holds a bachelor’s degree in Political Science and Government from the College of the Holy Cross, where she sits on the Board of Trustees, and earned her Master of Business Administration from the College of William and Mary. |
| | | | |
| | | | | | | | | | | | | | |
| Name and Title | | Age | | Business Experience |
Kathleen K. Oberg
Chief Financial Officer and Executive Vice President, Business Operations | | 61 | | | Kathleen (“Leeny”) K. Oberg was appointed as Marriott’s Executive Vice President and Chief Financial Officer effective January 1, 2016 and was additionally designated Executive Vice President, Business Operations beginning October 2021. Previously, Ms. Oberg was the Chief Financial Officer for The Ritz-Carlton since 2013, where she contributed significantly to the brand’s performance, growth, and organizational effectiveness. Prior to assuming that role, Ms. Oberg served in a range of financial leadership positions with Marriott. From 2008 to 2013, she was the Company’s Senior Vice President, Corporate and Development Finance, where she led a team that valued new hotel development projects and merger and acquisition opportunities, prepared the Company’s long-range plans and annual budgets, and made recommendations for the Company’s financial and capital allocation strategy. From 2006 to 2008, Ms. Oberg served in London as Senior Vice President, International Project Finance and Asset Management for Europe and the Middle East and Africa, and as the region’s senior finance executive. Ms. Oberg first joined Marriott as part of its Investor Relations group in 1999. Before joining Marriott, Ms. Oberg held a variety of financial leadership positions with such organizations as Sodexo (previously Sodexo Marriott Services), Sallie Mae, Goldman Sachs, and Chase Manhattan Bank. She currently serves on the Adobe Board of Directors. She earned her Bachelor of Science in Commerce, with concentrations in Finance and Management Information Systems from the University of Virginia, McIntire School of Commerce and received her Master of Business Administration from Stanford University Graduate School of Business. |
| | | | |
Rena Hozore Reiss
Executive Vice President and
General Counsel
| | 62 | | | Rena Hozore Reiss became Executive Vice President and General Counsel in December 2017. Ms. Reiss previously held the position of Executive Vice President, General Counsel and Corporate Secretary at Hyatt Hotels where she led the global legal team and oversaw Hyatt’s risk management team and corporate transactions group. Prior to her position with Hyatt, Ms. Reiss was an attorney in Marriott’s law department from 2000 to 2010 building her career in roles with increasing responsibility, ultimately holding the position of Senior Vice President and Associate General Counsel in which she led Marriott’s managed development efforts in the Americas region. Before joining Marriott, Ms. Reiss was a partner at Counts & Kanne, Chartered, in Washington, D.C. and Associate General Counsel at the Miami Herald Publishing Company. Ms. Reiss also serves on the Board of Directors of the American Hotel and Lodging Association. She earned her A.B. from Princeton University and her J.D. from Harvard Law School. |
| | | | |
Craig S. Smith
Group President, International | | 59 | | | Craig S. Smith became Group President, International effective in January 2021. From October 2019 until December 2020, Mr. Smith was Group President and Managing Director of Asia Pacific, and he previously served as President and Managing Director of Asia Pacific since June 2015, assuming the responsibility for the strategic leadership of all operational and development functions spanning the region. Mr. Smith began his career with Marriott in 1988. Before becoming President and Managing Director of Asia Pacific, Mr. Smith served as President of Marriott’s Caribbean and Latin America region from 2013 to 2015. Before moving to the Caribbean and Latin America region in 2013, he was Executive Vice President and Chief Operations Officer for Asia Pacific. As the son of an American diplomat, Mr. Smith has lived in 13 countries, working in North America, the Caribbean, Latin America, Asia Pacific, and Australia. Mr. Smith is chair of the US-ASEAN Business Council. He is also on the board of the US-India Strategic Partnership Forum (USISPF). He is fluent in Spanish and conversant in Portuguese. Mr. Smith earned his Master of Business Administration from the Rotman School of Management at the University of Toronto and a Bachelor of Science from Brigham Young University. |
Code of Ethics and Business Conduct Guide
The Company has long maintained and enforced a Code of Ethics that applies to all Marriott associates, including our Chairman of the Board, Chief Executive Officer, Chief Financial Officer, and Principal Accounting Officer, and to each member of the Board. The Code of Ethics is encompassed in our Business Conduct Guide, which is available in the Investor Relations section of our website (Marriott.com/investor) by clicking on “Governance” and then “Documents & Charters.” We intend to post on that website any future changes or amendments to our Code of Ethics, and any waiver of our Code of Ethics that applies to our Chairman of the Board, any of our executive officers, or a member of our Board within four business days following the date of the amendment or waiver.
PART IV
Item 15. Exhibits and Financial Statement Schedules.
LIST OF DOCUMENTS FILED AS PART OF THIS REPORT
(1) FINANCIAL STATEMENTS
We include this portion of Item 15 under Part II, Item 8 of this Annual Report on Form 10-K.
(2) FINANCIAL STATEMENT SCHEDULES
We include the financial statement schedule information required by the applicable accounting regulations of the SEC in the notes to our financial statements and incorporate that information in this Item 15 by reference.
(3) EXHIBITS
Any stockholder who wants a copy of the following Exhibits may obtain one from us upon request at a charge that reflects the reproduction cost of such Exhibits. Requests should be made to the Secretary, Marriott International, Inc., 10400 Fernwood Road, Department 52/862, Bethesda, MD 20817.
We have not filed as exhibits certain instruments defining the rights of holders of the long-term debt of Marriott or its subsidiary Starwood Hotels & Resorts Worldwide, LLC, pursuant to Item 601(b)(4)(iii) of Regulation S-K promulgated under the Exchange Act, because the amount of debt authorized and outstanding under each such instrument does not exceed 10 percent of the total assets of the Company’s and its consolidated subsidiaries. The Company agrees to furnish a copy of any such instrument to the Commission upon request.
| | | | | | | | | | | | | | |
| Exhibit No. | | Description | | Incorporation by Reference (where a report is indicated below, that document has been previously filed with the SEC and the applicable exhibit is incorporated by reference thereto) |
| | |
| 3.1 | | Restated Certificate of Incorporation. | | |
| | |
| 3.2 | | Amended and Restated Bylaws. | | |
| | |
| 4.1 | | Form of Common Stock Certificate. | | |
| | |
| 4.2 | | Indenture, dated as of November 16, 1998, between the Company and The Bank of New York Mellon, as successor to JPMorgan Chase Bank, N.A., formerly known as The Chase Manhattan Bank. | | |
| | | | |
| 4.3 | | Description of Registrant’s Securities. | | |
| | | | |
| 10.1.1 | | U.S. $4,500,000 Fifth Amended and Restated Credit Agreement dated as of June 28, 2019 with Bank of America, N.A. as administrative agent and certain banks. | | |
| | | | |
| 10.1.2 | | First Amendment, dated as of April 13, 2020, to the Fifth Amended and Restated Credit Agreement with Bank of America, N.A. as administrative agent, and certain banks, dated as of June 28, 2019. | | |
| | | | |
| | | | | | | | | | | | | | |
| Exhibit No. | | Description | | Incorporation by Reference (where a report is indicated below, that document has been previously filed with the SEC and the applicable exhibit is incorporated by reference thereto) |
| 10.1.3 | | Second Amendment, dated as of January 26, 2021, to the Fifth Amended and Restated Credit Agreement with Bank of America, N.A., as administrative agent, and certain banks, dated as of June 28, 2019. | | |
| | | | |
| 10.1.4 | | Third Amendment, dated as of January 26, 2021, to the Fifth Amended and Restated Credit Agreement with Bank of America, N.A., as administrative agent, and certain banks, dated as of June 28, 2019. | | |
| | |
| 10.2.1 | | License, Services and Development Agreement entered into on November 17, 2011, among the Company, Marriott Worldwide Corporation, Marriott Vacations Worldwide Corporation, and the other signatories thereto. | | |
| | | | |
| 10.2.2 | | First Amendment to License, Services, and Development Agreement for Marriott Projects, dated February 26, 2018, among the Company, Marriott Worldwide Corporation, Marriott Vacations Worldwide Corporation, and the other signatories thereto. | | |
| | | | |
| 10.2.3 | | Letter of Agreement, effective as of September 1, 2018, among the Company, Marriott Worldwide Corporation, Marriott Rewards, LLC, Starwood Hotels & Resorts Worldwide, LLC, Marriott Vacations Worldwide Corporation, Marriott Ownership Resorts, Inc., Vistana Signature Experiences, Inc. and ILG, LLC. | | |
| | | | |
| 10.2.4 | | Letter of Agreement, effective as of January 1, 2022, among the Company, Marriott Worldwide Corporation, Marriott Vacations Worldwide Corporation, Starwood Hotels & Resorts Worldwide, LLC, Marriott Ownership Resorts, Inc., Vistana Signature Experiences, Inc. and ILG, LLC. | | |
| | | | |
| 10.3.1 | | License, Services and Development Agreement entered into on November 17, 2011, among The Ritz-Carlton Hotel Company, L.L.C., Marriott Vacations Worldwide Corporation, and the other signatories thereto. | | |
| | | | |
| 10.3.2 | | First Amendment to License, Services, and Development Agreement for Ritz-Carlton Projects, dated February 26, 2018, among The Ritz-Carlton Hotel Company, L.L.C., Marriott Vacations Worldwide Corporation, and the other signatories thereto. | | |
| 10.4.1 | | Marriott Bonvoy Affiliation Agreement entered into on November 10, 2021, among the Company, Marriott Rewards, L.L.C., Marriott Vacations Worldwide Corporation and certain of its subsidiaries, Marriott Ownership Resorts, Inc., and the other signatories thereto. | | |
| | | | |
| *10.5.1 | | Marriott International, Inc. Stock and Cash Incentive Plan, as Amended Through February 13, 2014. | | |
| | | | |
| *10.5.2 | | Amendment dated August 7, 2014 to the Marriott International, Inc. Stock and Cash Incentive Plan. | | |
| | |
| *10.5.3 | | Amendment dated September 23, 2016 to the Marriott International, Inc. Stock and Cash Incentive Plan. | | |
| | | | |
| *10.5.4 | | Amendment dated May 5, 2017 to the Marriott International, Inc. Stock and Cash Incentive Plan. | | |
| | | | |
| | | | | | | | | | | | | | |
| Exhibit No. | | Description | | Incorporation by Reference (where a report is indicated below, that document has been previously filed with the SEC and the applicable exhibit is incorporated by reference thereto) |
| *10.5.5 | | Amendment dated February 15, 2019 to the Marriott International, Inc. Stock and Cash Incentive Plan. | | |
| | | | |
| *10.5.6 | | Amendment dated May 10, 2019 to the Marriott International, Inc. Stock and Cash Incentive Plan. | | |
| | | | |
| *10.5.7 | | Amendment dated May 8, 2020 to the Marriott International, Inc. Stock and Cash Incentive Plan. | | |
| | | | |
| *10.6.1 | | Marriott International, Inc. Executive Deferred Compensation Plan, amended and restated as of February 11, 2022. | | |
| | | | |
| *10.7.1 | | Form of Executive Restricted Stock Unit/MI Shares Agreement for the Marriott International, Inc. Stock and Cash Incentive Plan (February 2018). | | |
| | | | |
| *10.7.2 | | Form of MI Shares Agreement for the Marriott International, Inc. Stock and Cash Incentive Plan (March 2019). | | |
| | | | |
| *10.7.3 | | Form of Retention Executive Restricted Stock Unit Agreement for the Marriott International, Inc. Stock and Cash Incentive Plan (March 2019). | | |
| | | | |
| *10.7.4 | | Form of Executive Restricted Stock Unit/MI Shares Agreement for the Marriott International, Inc. Stock and Cash Incentive Plan (February 2021). | | |
| | | | |
| *10.8.1 | | Form of Stock Appreciation Rights Agreement for the Marriott International, Inc. Stock and Cash Incentive Plan (pre-February 2018). | | |
| | | | |
| *10.8.2 | | Form of Stock Appreciation Right Agreement for the Marriott International, Inc. Stock and Cash Incentive Plan (For Non-Employee Directors). | | |
| | | | |
| *10.8.3 | | Form of Stock Appreciation Rights Agreement for the Marriott International, Inc. Stock and Cash Incentive Plan (February 2018). | | |
| | | | |
| *10.8.4 | | Form of Stock Appreciation Rights Agreement for the Marriott International, Inc. Stock and Cash Incentive Plan (March 2019). | | |
| | | | |
| *10.8.5 | | Form of Stock Appreciation Rights Agreement for the Marriott International, Inc. Stock and Cash Incentive Plan (February 2021). | | |
| | | | |
| *10.9.1 | | Form of Performance Share Unit Award Agreement for the Marriott International, Inc. Stock and Cash Incentive Plan (March 2019). | | |
| | | | |
| *10.9.2 | | Form of Performance Share Unit Award Agreement for the Marriott International, Inc. Stock and Cash Incentive Plan (February 2021). | | |
| | | | |
| *10.10.1 | | Starwood 2013 Long-Term Incentive Compensation Plan. | | |
| | | | |
| *10.10.2 | | Amendment dated May 5, 2017 to the Starwood 2013 Long-Term Incentive Compensation Plan. | | |
| | | | |
| *10.11 | | Amendment dated June 29, 2016 to the Starwood 2013 Long-Term Incentive Compensation Plan. | | |
| | | | |
| | | | | | | | | | | | | | |
| Exhibit No. | | Description | | Incorporation by Reference (where a report is indicated below, that document has been previously filed with the SEC and the applicable exhibit is incorporated by reference thereto) |
| *10.12 | | Amendment dated September 23, 2016 to the Starwood 2013 Long-Term Incentive Compensation Plan. | | |
| | | | |
| *10.13 | | Amendment dated November 10, 2016 to the Marriott International, Inc. Stock and Cash Incentive Plan. | | |
| | | | |
| †10.14 | | Amended and Restated Side Letter Agreement - Program Affiliation, dated February 26, 2018, among the Company, Marriott Vacations Worldwide, and certain of their subsidiaries. | | |
| | | | |
| 10.15 | | Aircraft Time Sharing Agreement, effective as of September 20, 2018, between Marriott International Administrative Services, Inc. and J. Willard Marriott Jr. | | |
| | | | |
| 21 | | Subsidiaries of Marriott International, Inc. | | |
| | |
| 23 | | Consent of Ernst & Young LLP. | | |
| | |
| 31.1 | | Certification of Chief Executive Officer Pursuant to Rule 13a-14(a). | | |
| | | | |
| 31.2 | | Certification of Chief Financial Officer Pursuant to Rule 13a-14(a). | | |
| | |
| 32 | | Section 1350 Certifications. | | |
| | |
| 101 | | The following financial statements from Marriott International, Inc.’s Annual Report on Form 10-K for the year ended December 31, 2021, formatted in Inline XBRL (Extensible Business Reporting Language): (i) the Consolidated Statements of Income (Loss) for the year ended December 31, 2021, December 31, 2020, and December 31, 2019; (ii) the Consolidated Balance Sheets at December 31, 2021, and December 31, 2020; (iii) the Consolidated Statements of Cash Flows for the year ended December 31, 2021, December 31, 2020, and December 31, 2019; (iv) the Consolidated Statements of Comprehensive Income (Loss) for the year ended December 31, 2021, December 31, 2020, and December 31, 2019; (v) the Consolidated Statements of Stockholders’ Equity for the year ended December 31, 2021, December 31, 2020, and December 31, 2019; and (vi) Notes to Consolidated Financial Statements. | | Submitted electronically with this report. |
| | | | |
| 101.INS | | XBRL Instance Document. | | Submitted electronically with this report. |
| | |
| 101.SCH | | XBRL Taxonomy Extension Schema Document. | | Submitted electronically with this report. |
| | |
| 101.CAL | | XBRL Taxonomy Calculation Linkbase Document. | | Submitted electronically with this report. |
| | |
| 101.DEF | | XBRL Taxonomy Extension Definition Linkbase. | | Submitted electronically with this report. |
| | |
| 101.LAB | | XBRL Taxonomy Label Linkbase Document. | | Submitted electronically with this report. |
| | |
| 101.PRE | | XBRL Taxonomy Presentation Linkbase Document. | | Submitted electronically with this report. |
| | | | |
| 104 | | The cover page from Marriott International, Inc.’s Annual Report on Form 10-K for the year ended December 31, 2021, formatted in Inline XBRL (included as Exhibit 101). | | Submitted electronically with this report. |
* Denotes management contract or compensatory plan.
† Portions of this exhibit were redacted pursuant to a confidential treatment request filed with the Securities and Exchange Commission pursuant to Rule 24b-2 under the Exchange Act. The redacted portions of this exhibit have been filed with the Securities and Exchange Commission.
Item 16. Form 10-K Summary.
None.
SIGNATURES
Pursuant to the requirements of Section 13 or 15(d) of the Exchange Act, we have duly caused this Form 10-K to be signed on our behalf by the undersigned, thereunto duly authorized, on this 15th day of February 2022.
MARRIOTT INTERNATIONAL, INC.
| | | | | | | | | | | | | | |
| By: | | /s/Anthony G. Capuano | | |
| | Anthony G. Capuano | | |
| | Chief Executive Officer | | |
Pursuant to the requirements of the Exchange Act, this Form 10-K has been signed by the following persons on our behalf in the capacities indicated and on the date indicated above.
| | | | | | | | |
| PRINCIPAL EXECUTIVE OFFICER: |
| | |
| /s/Anthony G. Capuano | | Chief Executive Officer and Director |
| Anthony G. Capuano | |
| | |
| PRINCIPAL FINANCIAL OFFICER: | | |
| | |
| /s/Kathleen K. Oberg | | Chief Financial Officer and Executive Vice President, Business Operations |
| Kathleen K. Oberg | |
| | |
| PRINCIPAL ACCOUNTING OFFICER: | | |
| | |
| /s/Felitia Lee | | Controller and Chief Accounting Officer |
| Felitia Lee | |
| | |
| DIRECTORS: | | |
| | |
/s/J.W. Marriott, Jr. | | /s/Aylwin B. Lewis |
J.W. Marriott, Jr., Executive Chairman and Chairman of the Board | | Aylwin B. Lewis, Director |
| | |
/s/Deborah Marriott Harrison | | /s/David S. Marriott |
Deborah Marriott Harrison, Director | | David S. Marriott, Director |
| | |
/s/Frederick A. Henderson | | /s/Margaret M. McCarthy |
Frederick A. Henderson, Director | | Margaret M. McCarthy, Director |
| | |
| /s/Eric Hippeau | | /s/George Muñoz |
| Eric Hippeau, Director | | George Muñoz, Director |
| | |
/s/Lawrence W. Kellner | | /s/Horacio D. Rozanski |
Lawrence W. Kellner, Director | | Horacio D. Rozanski, Director |
| | |
/s/Debra L. Lee | | /s/Susan C. Schwab |
Debra L. Lee, Director | | Susan C. Schwab, Director |
| | |
| | |
| | |