
UNITED STATES SECURITIES AND EXCHANGE COMMISSION
Washington, D.C. 20549
FORM
(Mark One)
|
|
ANNUAL REPORT PURSUANT TO SECTION 13 OR 15(d) OF THE SECURITIES EXCHANGE ACT OF 1934 |
For the fiscal year ended
or
|
|
TRANSITION REPORT PURSUANT TO SECTION 13 OR 15(d) OF THE SECURITIES EXCHANGE ACT OF 1934 |
For the transition period from ______________ to ______________
Commission File Number:
(Exact name of registrant as specified in its charter)
|
|
|
|
|
(State or other jurisdiction of incorporation or organization) |
(I.R.S. Employer Identification No.) |
|
|
|
|
|
|
|
|
|
|
(Address or principal executive offices) |
(Zip Code) |
(
(Registrant’s telephone number, including area code)
Securities registered pursuant to Section 12(b) of the Act:
|
|
|
Title of Each Class |
|
Trading Symbol(s) |
|
Name of Each Exchange on Which Registered |
|
Prologis, Inc. |
|
|
|
|
|
|
|
Prologis, L.P. |
|
|
|
|
|
|
|
Prologis, L.P. |
|
|
|
|
|
|
|
Prologis, L.P. |
|
|
|
|
|
|
|
|
|
|
|
|
|
|
Securities registered pursuant to Section 12(g) of the Act:
Prologis, Inc. – NONE
Prologis, L.P. – NONE
Indicate by check mark if the registrant is a well-known seasoned issuer, as defined in Rule 405 of the Securities Act.
|
Prologis, Inc.: |
Prologis, L.P.: |
Indicate by check mark if the registrant is not required to file reports pursuant to Section 13 or Section 15(d) of the Act.
|
Prologis, Inc.: Yes ☐ |
Prologis, L.P.: Yes ☐ |
|
|
Indicate by check mark whether the registrant: (1) has filed all reports required to be filed by Section 13 or 15(d) of the Securities Exchange Act of 1934 during the preceding 12 months (or for such shorter period that the registrant was required to file such reports), and (2) has been subject to such filing requirements for the past 90 days. Prologis, Inc.:
|
||
|
Indicate by check mark whether the registrant has submitted electronically every Interactive Data File required to be submitted pursuant to Rule 405 of Regulation S-T during the preceding 12 months (or for such shorter periods that the registrant was required to submit such files). Prologis, Inc.:
|
||
Indicate by check mark whether the registrant is a large accelerated filer, an accelerated filer, a non-accelerated filer, a smaller reporting company, or an emerging growth company. See the definitions of “large accelerated filer,” “accelerated filer,” “smaller reporting company,” and “emerging growth company” in Rule 12b-2 of the Exchange Act (check one):
|
Prologis, Inc.: |
☑ |
|
☐ |
Accelerated filer |
|
Smaller reporting company |
|
|
☐ |
Non-accelerated filer |
|
|
Emerging growth company |
|
|
Prologis, L.P.: |
☐ |
Large accelerated filer |
☐ |
Accelerated filer |
|
Smaller reporting company |
|
|
☑ |
|
|
|
Emerging growth company |
|
If an emerging growth company, indicate by check mark if the registrant has elected not to use the extended transition period for complying with any new or revised financial accounting standards provided pursuant to Section 13(a) of the Exchange Act. ☐
Indicate by check mark whether the registrant has filed a report on and attestation to its management’s assessment of the effectiveness of its internal control over financial reporting under Section 404(b) of the Sarbanes-Oxley Act (15 U.S.C. 7262(b)) by the registered public accounting firm that prepared or issued its audit report.
Indicate by check mark whether the registrant is a shell company (as defined in Rule 12b-2 of the Securities Exchange Act of 1934).
|
Prologis, Inc.: Yes |
Prologis, L.P.: Yes |
Based on the closing price of Prologis, Inc.’s common stock on June 30, 2020, the aggregate market value of the voting common equity held by nonaffiliates of Prologis, Inc. was $
The number of shares of Prologis, Inc.’s common stock outstanding at February 5, 2021, was approximately
DOCUMENTS INCORPORATED BY REFERENCE
Portions of Part III of this report are incorporated by reference to the registrant’s definitive proxy statement for the 2021 annual meeting of its stockholders or will be provided in an amendment filed on Form 10-K/A.
EXPLANATORY NOTE
This report combines the annual reports on Form 10-K for the year ended December 31, 2020, of Prologis, Inc. and Prologis, L.P. Unless stated otherwise or the context otherwise requires, references to “Prologis, Inc.” or the “Parent” mean Prologis, Inc. and its consolidated subsidiaries; and references to “Prologis, L.P.” or the “Operating Partnership” or the “OP” mean Prologis, L.P., and its consolidated subsidiaries. The terms “the Company,” “Prologis,” “we,” “our” or “us” means the Parent and the OP collectively.
The Parent is a real estate investment trust (a “REIT”) and the general partner of the OP. At December 31, 2020, the Parent owned 97.35% common general partnership interest in the OP and 100% of the preferred units in the OP. The remaining 2.65% common limited partnership interests are owned by unaffiliated investors and certain current and former directors and officers of the Parent.
We operate the Parent and the OP as one enterprise. The management of the Parent consists of the same members as the management of the OP. These members are officers of the Parent and employees of the OP or one of its subsidiaries. As sole general partner, the Parent has control of the OP through complete responsibility and discretion in the day-to-day management and therefore, consolidates the OP for financial reporting purposes. Because the only significant asset of the Parent is its investment in the OP, the assets and liabilities of the Parent and the OP are the same on their respective financial statements.
We believe combining the annual reports on Form 10-K of the Parent and the OP into this single report results in the following benefits:
|
• |
enhances investors’ understanding of the Parent and the OP by enabling investors to view the business as a whole in the same manner as management views and operates the business; |
|
• |
eliminates duplicative disclosure and provides a more streamlined and readable presentation as a substantial portion of the Company’s disclosure applies to both the Parent and the OP; and |
|
• |
creates time and cost efficiencies through the preparation of one combined report instead of two separate reports. |
It is important to understand the few differences between the Parent and the OP in the context of how we operate the Company. The Parent does not conduct business itself, other than acting as the sole general partner of the OP and issuing public equity from time to time. The OP holds substantially all the assets of the business, directly or indirectly. The OP conducts the operations of the business and is structured as a partnership with no publicly traded equity. Except for net proceeds from equity issuances by the Parent, which are contributed to the OP in exchange for partnership units, the OP generates capital required by the business through the OP’s operations, incurrence of indebtedness and issuance of partnership units to third parties.
The presentation of noncontrolling interests, stockholders’ equity and partners’ capital are the main areas of difference between the consolidated financial statements of the Parent and those of the OP. The differences in the presentations between stockholders’ equity and partners’ capital result from the differences in the equity and capital issuances in the Parent and in the OP.
The preferred stock, common stock, additional paid-in capital, accumulated other comprehensive income (loss) and distributions in excess of net earnings of the Parent are presented as stockholders’ equity in the Parent’s consolidated financial statements. These items represent the common and preferred general partnership interests held by the Parent in the OP and are presented as general partner’s capital within partners’ capital in the OP’s consolidated financial statements. The common limited partnership interests held by the limited partners in the OP are presented as noncontrolling interest within equity in the Parent’s consolidated financial statements and as limited partners’ capital within partners’ capital in the OP’s consolidated financial statements.
To highlight the differences between the Parent and the OP, separate sections in this report, as applicable, individually discuss the Parent and the OP, including separate financial statements and separate Exhibit 31 and 32 certifications. In the sections that combine disclosure of the Parent and the OP, this report refers to actions or holdings as being actions or holdings of Prologis.
TABLE OF CONTENTS
|
Item |
|
Description |
|
Page |
|
|
|
|
|
|
|
1. |
|
|
3 |
|
|
|
|
|
3 |
|
|
|
|
|
5 |
|
|
|
|
|
6 |
|
|
|
|
|
9 |
|
|
|
|
Environmental Stewardship, Social Responsibility and Governance |
|
9 |
|
|
|
|
10 |
|
|
|
|
|
10 |
|
|
|
|
|
10 |
|
|
1A. |
|
|
10 |
|
|
1B. |
|
|
19 |
|
|
2. |
|
|
19 |
|
|
|
|
|
19 |
|
|
|
|
|
22 |
|
|
|
|
|
23 |
|
|
3. |
|
|
23 |
|
|
4. |
|
|
23 |
|
|
|
|
|
|
|
|
5. |
|
|
23 |
|
|
|
|
|
23 |
|
|
|
|
|
24 |
|
|
|
|
|
24 |
|
|
|
|
|
25 |
|
|
|
|
Securities Authorized for Issuance Under Equity Compensation Plans |
|
25 |
|
|
|
|
25 |
|
|
6. |
|
|
25 |
|
|
7. |
|
Management’s Discussion and Analysis of Financial Condition and Results of Operations |
|
25 |
|
|
|
|
26 |
|
|
|
|
|
27 |
|
|
|
|
|
36 |
|
|
|
|
|
36 |
|
|
|
|
|
40 |
|
|
|
|
|
41 |
|
|
|
|
Funds from Operations Attributable to Common Stockholders/Unitholders |
|
41 |
|
7A. |
|
|
43 |
|
|
8. |
|
|
44 |
|
|
9. |
|
Changes in and Disagreements with Accountants on Accounting and Financial Disclosure |
|
44 |
|
9A. |
|
|
44 |
|
|
9B. |
|
|
46 |
|
|
|
|
|
|
|
|
10. |
|
|
46 |
|
|
11. |
|
|
46 |
|
|
12. |
|
Security Ownership of Certain Beneficial Owners and Management and Related Stockholder Matters |
|
46 |
|
13. |
|
Certain Relationships and Related Transactions, and Director Independence |
|
46 |
|
14. |
|
|
46 |
|
|
|
|
|
|
|
|
15. |
|
|
46 |
|
|
16. |
|
|
47 |
2
The statements in this report that are not historical facts are forward-looking statements within the meaning of Section 27A of the Securities Act of 1933, as amended, and Section 21E of the Securities Exchange Act of 1934, as amended. These forward-looking statements are based on current expectations, estimates and projections about the industry and markets in which we operate as well as management’s beliefs and assumptions. Such statements involve uncertainties that could significantly impact our financial results. Words such as “expects,” “anticipates,” “intends,” “plans,” “believes,” “seeks,” and “estimates” including variations of such words and similar expressions are intended to identify such forward-looking statements, which generally are not historical in nature. All statements that address operating performance, events or developments that we expect or anticipate will occur in the future — including statements relating to rent and occupancy growth, acquisition and development activity, contribution and disposition activity, general conditions in the geographic areas where we operate, our debt, capital structure and financial position, our ability to form new co-investment ventures and the availability of capital in existing or new co-investment ventures — are forward-looking statements. These statements are not guarantees of future performance and involve certain risks, uncertainties and assumptions that are difficult to predict. Although we believe the expectations reflected in any forward-looking statements are based on reasonable assumptions, we can give no assurance that our expectations will be attained, and therefore actual outcomes and results may differ materially from what is expressed or forecasted in such forward-looking statements. Some of the factors that may affect outcomes and results include, but are not limited to: (i) national, international, regional and local economic and political climates; (ii) changes in global financial markets, interest rates and foreign currency exchange rates; (iii) increased or unanticipated competition for our properties; (iv) risks associated with acquisitions, dispositions and development of properties; (v) maintenance of Real Estate Investment Trust (“REIT”) status, tax structuring and changes in income tax laws and rates; (vi) availability of financing and capital, the levels of debt that we maintain and our credit ratings; (vii) risks related to our investments in our co-investment ventures, including our ability to establish new co-investment ventures; (viii) risks of doing business internationally, including currency risks; (ix) environmental uncertainties, including risks of natural disasters; (x) risks related to the coronavirus (“COVID-19”) pandemic; and (xi) those additional factors discussed under Item 1A. Risk Factors in this report. We undertake no duty to update any forward-looking statements appearing in this report except as may be required by law.
PART I
ITEM 1. Business
Prologis, Inc. is a self-administered and self-managed REIT and is the sole general partner of Prologis, L.P. through which it holds substantially all of its assets. We operate Prologis, Inc. and Prologis, L.P. as one enterprise and, therefore, our discussion and analysis refers to Prologis, Inc. and its consolidated subsidiaries, including Prologis, L.P. We invest in real estate through wholly owned subsidiaries and other entities through which we co-invest with partners and investors. We have a significant ownership interest in the co-investment ventures, which may be consolidated or unconsolidated based on our level of control of the entity.
Prologis, Inc. began operating as a fully integrated real estate company in 1997 and elected to be taxed as a REIT under the Internal Revenue Code of 1986, as amended (“Internal Revenue Code” or “IRC”). We believe the current organization and method of operation will enable Prologis, Inc. to maintain its status as a REIT. Prologis, L.P. was also formed in 1997.
We operate and manage our business on an owned and managed (“O&M”) basis and therefore evaluate the operating performance of the properties in our O&M portfolio, which includes our consolidated properties and properties owned by our unconsolidated co-investment ventures, which we manage. We make operating decisions based on our total O&M portfolio, as we manage the properties similarly regardless of ownership. We evaluate our results based on our proportionate economic ownership of each property included in the O&M portfolio (“our share”) to reflect our share of the financial results of the O&M portfolio.
Included in our discussion below are references to funds from operations (“FFO”) and net operating income (“NOI”), neither of which are U.S. generally accepted accounting principles (“GAAP”). See Item 7. Management’s Discussion and Analysis of Financial Condition and Results of Operations for a reconciliation of Net Earnings Attributable to Common Stockholders in the Consolidated Statements of Income to our FFO measures and a reconciliation of NOI to Operating Income, the most directly comparable GAAP measures.
Our corporate headquarters is located at Pier 1, Bay 1, San Francisco, California 94111, and our other principal office locations are in Amsterdam, Denver, Luxembourg, Mexico City, Shanghai, Singapore and Tokyo.
Our Internet address is www.prologis.com. All reports required to be filed with the Securities and Exchange Commission (“SEC”) are available and can be accessed free of charge through the Investor Relations section of our website. The common stock of Prologis, Inc. is listed on the New York Stock Exchange (“NYSE”) under the ticker “PLD” and is a component of the Standard & Poor’s (“S&P”) 500.
THE COMPANY
We are the global leader in logistics real estate with a focus on high-barrier, high growth markets. We own, manage and develop well-located, high-quality logistics facilities in 19 countries across four continents. Our local teams actively manage our portfolio, which encompasses leasing, property management, capital deployment and opportunistic dispositions. Our disposition activities allow us to recycle capital and largely self-fund our development and acquisition activities. The majority of our properties in the United States (“U.S.”) are wholly owned, while our international properties are primarily held in our co-investment ventures, which has the benefit of mitigating our exposure to foreign currency movements.
Our portfolio is focused on the world’s most vibrant centers of commerce and our scale allows us to respond to our customers’ needs for the highest-quality buildings across these locations. There is an emergence of two new structural demand drivers for our real estate: (i) the need for more inventory as supply chains emphasize resilience over efficiency and (ii) the acceleration of e-commerce adoption.
3
As service time increasingly moves to the forefront of the global supply chain, it drives demand for logistics real estate close to the end-consumer. We have invested in properties located within infill and urban areas in our largest global markets with same day access (defined as Last Touch®) and next day access (defined as city distribution), to the consumer population. This positioning gives us the unique ability to provide our customers with the right real estate solutions for their supply chains that, in turn, allows them to meet end-consumer delivery expectations.
As we look to the future of logistics real estate, we are focused on solving our customers’ pain points, innovating in pursuit of creative solutions and operational excellence. We are listening and responding to our customers’ needs for skilled labor through initiatives to create community workforce programs to develop their talent pool, utilize our proprietary data and analytics to ensure efficient distribution solutions and negotiate better pricing on common products and services that our customers need. Our customers turn to us because they know that a strategic partnership with Prologis is a competitive advantage. We accomplish all of this by employing individuals who continue to grow, embrace change and draw strength from inclusion and diversity.
At December 31, 2020, we owned or had investments in properties, on a wholly-owned basis or through ventures, in the following geographies (dollars in billions, based on gross book value and total expected investment (as defined below) and square feet in millions):

2020 Significant Events
On January 8, 2020, our two U.S. co-investment ventures, Prologis U.S. Logistics Venture, LLC (“USLV”) and Prologis Targeted U.S. Logistics Fund (“USLF”), acquired the wholly-owned real estate assets of Industrial Property Trust Inc. (“IPT”) for approximately $2.0 billion each, which we refer to as the “IPT Transaction” and is detailed in Notes 4, 5, 8 and 11 to the Consolidated Financial Statements. The portfolio included 235 properties, aggregating 37 million square feet and were highly complementary to our U.S. portfolio in terms of product quality, location and growth potential. Our aggregate investment in the IPT Transaction was $1.6 billion.
On February 4, 2020, we acquired Liberty Property Trust and Liberty Property Limited Partnership (collectively “Liberty”) through a merger transaction that we refer to as the “Liberty Transaction” and is detailed in Note 3 to the Consolidated Financial Statements. The Liberty portfolio was primarily comprised of logistics real estate assets, including 519 operating properties, aggregating 100 million square feet and were highly complementary to our U.S. portfolio in terms of product quality, location and growth potential. The portfolio also included properties under development, land for future development and office properties. The acquisition expanded our presence in target markets such as Lehigh Valley, Chicago, Houston, Central Pennsylvania, New Jersey and Southern California. The total acquisition price, including transaction costs, was approximately $13 billion and was funded through the issuance of equity and the assumption of debt. As a result of the closely aligned portfolios and similar business strategy, we integrated the IPT and Liberty properties while adding minimal property management and general and administrative expenses, further scaling our operations.
On a combined basis, there were 42 million square feet of non-strategic industrial properties with a gross book value of approximately $3 billion acquired in both the Liberty Transaction and the IPT Transaction that we do not intend to operate long-term. Depending on the expected hold period, these assets were either classified as Assets Held for Sale or Contribution or other real estate investments within Investments in Real Estate Properties at the time of acquisition in the Consolidated Balance Sheets. Since acquisition some of these non-strategic industrial properties have been sold.
4
In early 2020, COVID-19 was characterized as a global pandemic by the World Health Organization. The COVID-19 outbreak has disrupted financial markets and global, national and local economies since this time. Our operating results have remained strong in the COVID-19 environment and our business has been resilient. We expect operating conditions in our portfolio to continue to strengthen in 2021. However, with the continued uncertainty across the globe, we cannot predict the impact on our business, future financial condition or operating results. For discussion on current operating results and our operational and financial outlook, as well as our response to help protect employees and customers, see the Summary of 2020 section in Item 7. Management’s Discussion and Analysis of Financial Condition and Results of Operations.
Throughout this discussion, we reflect amounts in U.S. dollars, our reporting currency. Included in these amounts are consolidated and unconsolidated investments denominated in foreign currencies, principally the British pound sterling, euro and Japanese yen that are impacted by fluctuations in exchange rates when translated to U.S. dollars. We mitigate our exposure to foreign currency fluctuations by investing outside the U.S. through co-investment ventures, borrowing in the functional currency of our subsidiaries and utilizing derivative financial instruments.
OPERATING SEGMENTS
Our business comprises two operating segments: Real Estate Operations and Strategic Capital.
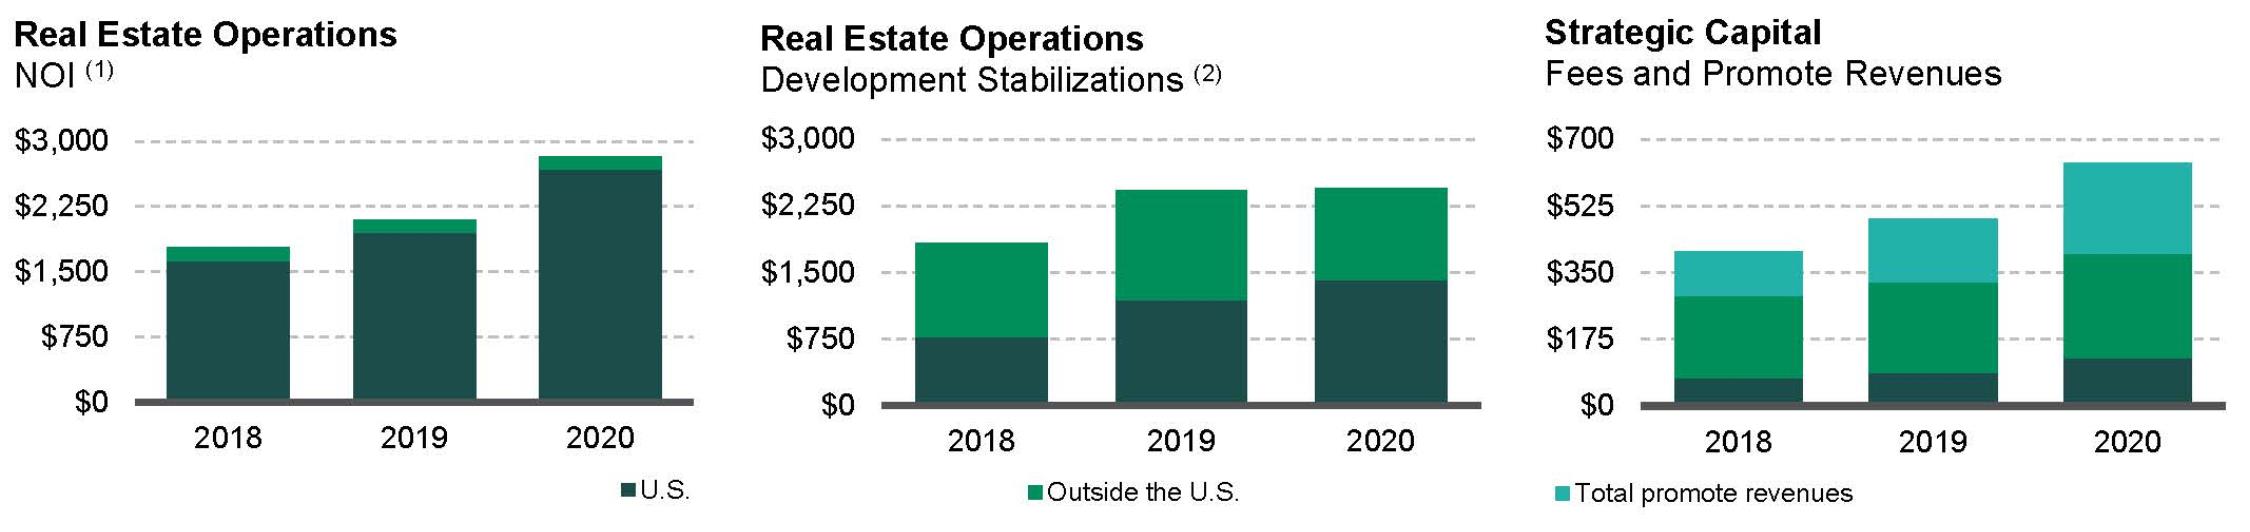
Below is information summarizing consolidated activity within our segments over the last three years (in millions):
|
(1) |
NOI from Real Estate Operations is calculated directly from our Consolidated Financial Statements as Rental Revenues and Development Management and Other Revenues less Rental Expenses and Other Expenses. |
|
(2) |
A developed property moves into the operating portfolio when it meets our definition of stabilization, which is the earlier of one year after completion or 90% occupancy. Amounts represent our total expected investment (“TEI”), which includes the estimated cost of development, land, construction and leasing costs. |
Real Estate Operations
Rental. Rental operations comprise the largest component of our operating segments and generally contribute 85% to 90% of our consolidated revenues, earnings and funds from operations (“FFO”). We collect rent from our customers through operating leases, including reimbursements for the majority of our property operating costs. We expect to generate internal growth by increasing rents, maintaining high occupancy rates and controlling expenses. The primary driver of our revenue growth will be rolling in-place leases to current market rents as leases expire. We believe our active portfolio management, combined with the skills of our property, leasing, maintenance, capital, energy, sustainability and risk management teams allow us to maximize NOI across our portfolio. A majority of our consolidated rental revenue, NOI and cash flows are generated in the U.S.
Development. Given the scarcity of modern logistics facilities in our target markets, our development business provides us the opportunity to build what our customers need. We develop properties to meet these needs, deepen our market presence and maintain a modern portfolio. We believe we have a competitive advantage due to (i) the strategic locations of our land bank and redevelopment sites; (ii) the development expertise of our local teams; and (iii) the depth of our customer relationships. Successful development and redevelopment efforts provide significant earnings growth as projects are leased, generate income and increase the net asset value of our Real Estate Operations segment. Based on our current estimates, our consolidated land, including options, has the potential to support the development of $11.8 billion of TEI of new logistics space. In addition to our land portfolio, we have also made investments in other properties that have the potential to be redeveloped to increase value. Generally, we develop properties in the U.S. for long-term hold and outside the U.S. for contribution to our unconsolidated co-investment ventures.
Strategic Capital
Our strategic capital segment allows us to partner with many of the world’s largest institutional investors and capitalize our business through private equity, principally perpetual open-ended or long-term ventures. We also access capital in this segment through two publicly traded vehicles: Nippon Prologis REIT, Inc. in Japan and FIBRA Prologis in Mexico. We align our interests with our partners by holding significant ownership interests in all of our 9 unconsolidated co-investment ventures (ranging from 15% to 50%), which allows us to reduce our exposure to foreign currency movements for investments outside the U.S.
5
This segment produces stable, long-term cash flows and generally contributes 10% to 15% of our recurring consolidated revenues, earnings and FFO. We generate strategic capital revenues from our unconsolidated co-investment ventures, principally through asset and property management services. We earn additional revenues by providing leasing, acquisition, construction, development and disposition services. In certain ventures, we also have the ability to earn revenues through incentive fees (“promotes” or “promote revenues”) periodically during the life of a venture or upon liquidation. We plan to profitably grow this business by increasing our assets under management in existing or new ventures. Most of the strategic capital revenues are generated outside the U.S. NOI in this segment is calculated directly from our Consolidated Financial Statements as Strategic Capital Revenues less Strategic Capital Expenses and excludes property-related NOI.
FUTURE GROWTH
We believe the quality and scale of our global portfolio, the expertise of our team, the depth of our customer relationships and the strength of our balance sheet give us unique competitive advantages to grow revenues, NOI, earnings, FFO and cash flows.
|
(1) |
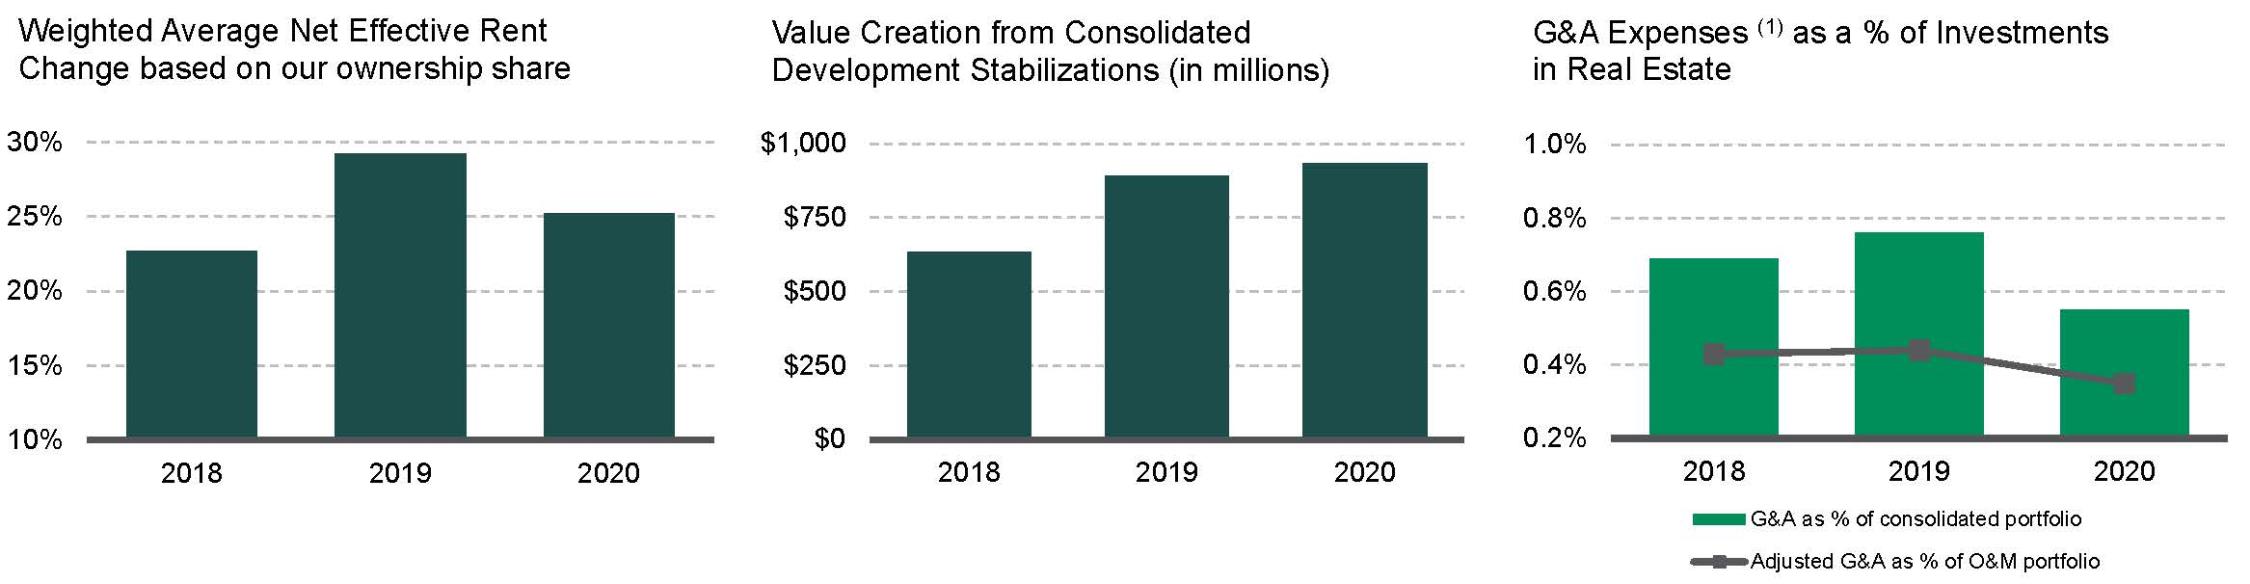
General and Administrative (“G&A”) Expenses is a line item in the Consolidated Financial Statements. Adjusted G&A expenses is calculated from our Consolidated Financial Statements as G&A Expenses and Strategic Capital Expenses, less expenses under the Prologis Promote Plan (“PPP”) and property-level management expenses for the properties owned by the ventures. |
|
• |
Rent Growth. Despite the COVID-19 pandemic and the current economic environment, we expect rents in our markets to increase due to demand for the location and quality of our properties. In addition, due to strong market rent growth over the last several years, our in-place leases have considerable upside potential. We estimate that the rental rates of our leases are 13% below current market on the basis of our weighted average ownership at December 31, 2020. Therefore, even if market rent growth is flat, a lease renewal will likely translate into increased future rental income, on a consolidated basis or through the earnings we recognize from our unconsolidated co-investment ventures based on our ownership. We have experienced positive rent change on rollover (comparing the net effective rent (“NER”) of the new lease to the prior lease for the same space) in every quarter since 2013. We expect this trend to continue for several more years due to our current in-place rents being below market. We also expect future growth in market rents to further contribute to increased rental income. |
|
• |
Value Creation from Development. A successful development and redevelopment program involves maintaining control of well-located and entitled land and redevelopment sites. We believe that the carrying value of our land bank is below its current fair value. Due to the strategic nature of our land bank, development expertise of our teams and strength of our customer relationships, we expect to create value as we build new properties. We measure the estimated value creation of a development project as the margin above our anticipated cost to develop. As properties under development stabilize, we expect to realize the value creation principally through contributions to the unconsolidated co-investment ventures and increases in the NOI of our operating portfolio. |
|
• |
Balance Sheet Strength. Through the acquisitions of Liberty and IPT and execution of several opportunistic debt refinancings at historically low rates, we further enhanced our financial position during 2020 while maintaining low leverage. At December 31, 2020, we had total available liquidity of $4.8 billion. As a result of our low leverage and available liquidity, we have significant capacity to capitalize on value-added investment opportunities that will translate into future earnings growth. |
|
• |
Economies of Scale from Growth. We use adjusted G&A expenses as a percentage of the O&M portfolio to measure and evaluate our overhead costs. We have scalable systems and infrastructure in place to grow both our consolidated and O&M portfolios with limited incremental G&A expense. We believe we can continue to grow NOI and strategic capital revenues organically and through accretive development and acquisition activity while further reducing G&A as a percentage of our investments in real estate. As noted in the graph above, the acquisitions of the Liberty and IPT portfolios are key examples of this effort, where we increased our investments in real estate in the O&M portfolio by over 20% in the first quarter of 2020 and had minimal increases to G&A expenses, which results in lower G&A expenses as a percentage of the investments in real estate. |
|
• |
Staying “Ahead of What’s Next™”. We are working on initiatives to create value beyond the real estate by enhancing our customers’ experience, utilizing our scale to streamline our procurement activities and negotiating better pricing on products and services for us and our customers, as well as delivering improvements to our business through innovation, data analytics and |
6
|
digitization efforts. Underlying our future strategy for growth is our ongoing commitment to, and initiatives in, environmental stewardship, social responsibility and governance (“ESG”). |
Competition
Real estate ownership is highly fragmented, and we therefore face competition from many owners and operators. Competitively priced logistics space could impact our occupancy rates and have an adverse effect on how much rent we can charge, which in turn could affect our operating results. We may face competition regarding our capital deployment activities, including local, regional and national operators or developers. We also face competition from investment managers for institutional capital within our strategic capital business.
Despite the competition we may face, our strategic focus over the years has given us distinct competitive advantages, including the following:
|
• |
a portfolio of properties strategically located in markets characterized by large population densities, growing consumption and high barriers to entry, typically near large labor pools and extensive transportation infrastructure, including our Last Touch® facilities; |
|
• |
an investment in ESG practices that enhances asset values while improving sustainability performance, including the development of logistics facilities with sustainable design features that meet customer needs for high-quality buildings; |
|
• |
established relationships with customers served by our experienced and responsive local and regional teams; |
|
• |
the ability to leverage our organizational scale and structure to provide a single point of contact for our focus customers to address their needs through our in-house global customer solutions team; |
|
• |
proven property management and leasing expertise; |
|
• |
relationships and successful track record with current and prospective investors in our strategic capital business; |
|
• |
a strategically located land bank and redevelopment sites; |
|
• |
local teams with development expertise; and |
|
• |
a strong balance sheet and credit ratings, coupled with significant liquidity and borrowing capacity. |
Customers
Our broad customer base represents a spectrum of international, national, regional and local logistics users. At December 31, 2020, in our Real Estate Operations segment representing our consolidated properties, we had more than 3,400 customers occupying 446 million square feet of logistics operating properties.
7
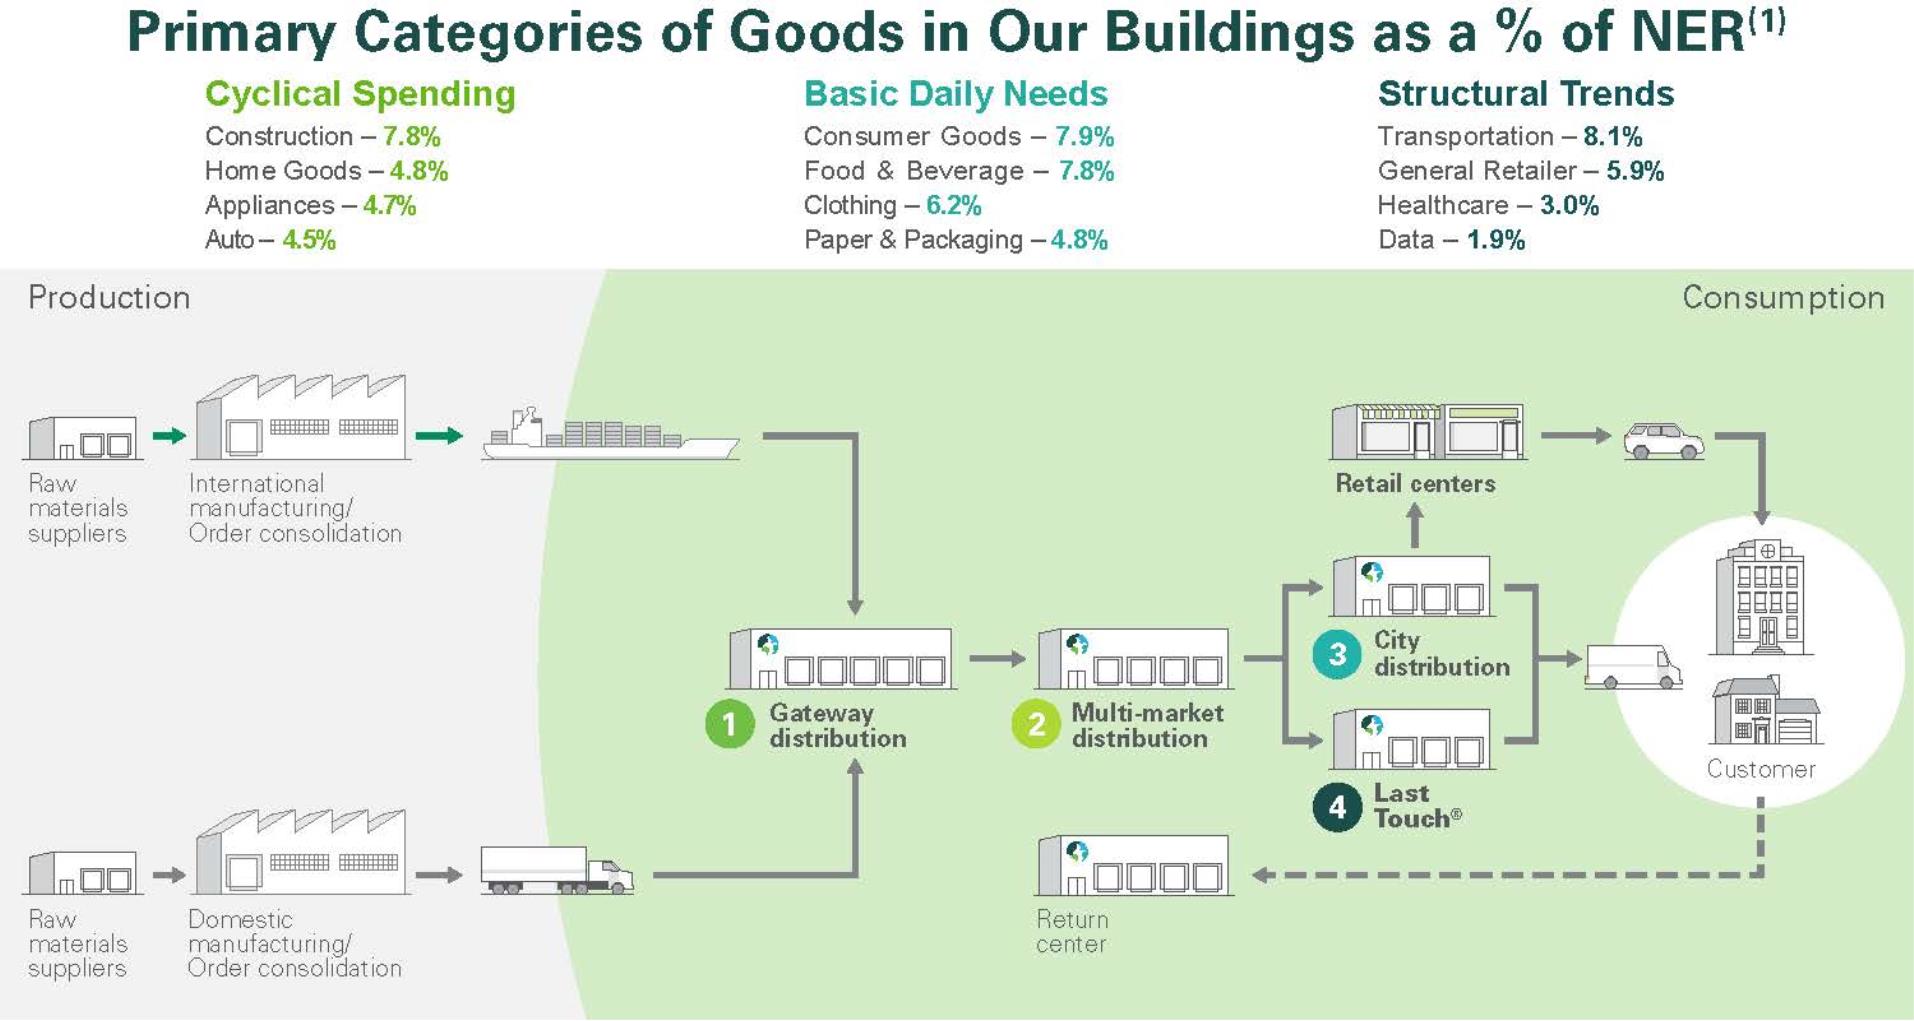
In order to provide for a customer-centric location strategy, we have invested in properties located within infill and urban areas in our largest global markets with same day and next day access to the consumer population, these are our Last Touch® and city distribution facilities, respectively. To support these distribution facilities, we utilize multi-market facilities located at key transportation hubs on the edge of these major infill and urban areas and gateway distribution facilities that incorporate access to major sea and intermodal ports. Below are the primary categories of goods in our buildings for our consolidated real estate properties at December 31, 2020.
|
(1) |
NER is calculated using the estimated total cash to be received over the term of the lease divided by the lease term to determine the average amount of cash rent payments received per year. Amounts derived in a currency other than the U.S. dollar have been translated using the average rate from the previous year. |
The following table details our top 25 customers for our consolidated real estate properties at December 31, 2020 (square feet in millions):
|
Top Customers |
% of NER |
|
|
Total Occupied Square Feet |
|
||
|
1. Amazon |
|
6.1 |
|
|
|
22 |
|
|
2. Home Depot |
|
1.9 |
|
|
|
9 |
|
|
3. FedEx |
|
1.9 |
|
|
|
6 |
|
|
4. UPS |
|
1.2 |
|
|
|
5 |
|
|
5. XPO Logistics |
|
1.1 |
|
|
|
5 |
|
|
6. Geodis |
|
1.0 |
|
|
|
5 |
|
|
7. Wal-Mart |
|
0.9 |
|
|
|
4 |
|
|
8. U.S. Government |
|
0.9 |
|
|
|
1 |
|
|
9. DHL |
|
0.7 |
|
|
|
3 |
|
|
10. PepsiCo |
|
0.6 |
|
|
|
3 |
|
|
Top 10 Customers |
|
16.3 |
|
|
|
63 |
|
|
11. DSV Panalpina A/S |
|
0.6 |
|
|
|
3 |
|
|
12. Office Depot |
|
0.5 |
|
|
|
3 |
|
|
13. Kellogg Company |
|
0.5 |
|
|
|
2 |
|
|
14. Staples |
|
0.4 |
|
|
|
3 |
|
|
15. Ryder System Inc. |
|
0.4 |
|
|
|
2 |
|
|
16. VF Corporation |
|
0.4 |
|
|
|
1 |
|
|
17. Berkshire Hathaway Inc. |
|
0.4 |
|
|
|
1 |
|
|
18. ZOZO, Inc. |
|
0.4 |
|
|
|
1 |
|
|
19. Westrock Company |
|
0.4 |
|
|
|
1 |
|
|
20. Kuehne + Nagel |
|
0.3 |
|
|
|
1 |
|
|
21. Express Messenger |
|
0.3 |
|
|
|
1 |
|
|
22. Mondelez International |
|
0.3 |
|
|
|
2 |
|
|
23. Bed Bath & Beyond, Inc. |
|
0.3 |
|
|
|
2 |
|
|
24. Sysco Guest Supply, LLC |
|
0.3 |
|
|
|
2 |
|
|
25. NFI |
|
0.3 |
|
|
|
1 |
|
|
Top 25 Customers |
|
22.1 |
|
|
|
89 |
|
8
In our Strategic Capital segment, we view our partners and investors as our customers. At December 31, 2020, we had approximately 128 investors in our private equity ventures, several of which invest in multiple ventures.
Employees
We believe our employees are the most important part of our business. When attracting, developing and retaining talent, we seek individuals who hold varied experiences and viewpoints to create an inclusive and diverse culture and workplace that allows each employee to do their best work and drive our collective success. We focus on leadership development at every level of the organization. We align employees’ goals with our overall strategic direction to create a clear link between individual efforts and the long-term success of the company and then provide effective feedback on their performance towards goals to ensure their growth. We believe a commitment to our employees’ learning and development through training, educational opportunities and mentorship is critical to our ability to continue to innovate. Through performance plans, talent recognition and individual development planning, along with reward packages, we advance our talent pool and create a sustainable and long-term enterprise. For additional discussion on the impact of COVID-19 on our employees, see the Summary of 2020 section in Item 7. Management’s Discussion and Analysis of Financial Condition and Results of Operations.
The following table summarizes our total number of employees at December 31, 2020:
|
Geographies |
|
|
|
|
|
U.S. (1) |
|
|
1,091 |
|
|
Other Americas |
|
|
146 |
|
|
Europe |
|
|
458 |
|
|
Asia |
|
|
250 |
|
|
Total |
|
|
1,945 |
|
|
(1) |
This includes employees who were based in the U.S. but also support other geographies. |
We allocate the personnel costs related to providing property management and leasing functions to our Real Estate Operations and Strategic Capital segments based on the square footage of the respective portfolios. The personnel costs to perform only Strategic Capital functions are allocated directly to that segment.
We believe we have good relationships with our employees. Prologis employees are not organized under collective bargaining agreements, other than in Brazil, although some employees in Europe are represented by statutory Works Councils and as such, benefit from applicable labor agreements.
CODE OF ETHICS AND BUSINESS CONDUCT
We maintain a Code of Ethics and Business Conduct applicable to our board of directors (the “Board”) and all of our officers and employees, including the principal executive officer, the principal financial officer and the principal accounting officer, and other people performing similar functions. A copy of our Code of Ethics and Business Conduct is available on our website, www.prologis.com. In addition to being accessible through our website, copies of our Code of Ethics and Business Conduct can be obtained, free of charge, upon written request to Investor Relations, Pier 1, Bay 1, San Francisco, California 94111. Any amendments to or waivers of our Code of Ethics and Business Conduct that apply to the principal executive officer, the principal financial officer, the principal accounting officer, or other people performing similar functions, and that relate to any matter enumerated in Item 406(b) of Regulation S-K, will be disclosed on our website.
ENVIRONMENTAL STEWARDSHIP, SOCIAL RESPONSIBILITY AND GOVERNANCE (“ESG”)
Our long-standing dedication to ESG creates value for our company by strengthening our relationships with our customers, investors, employees and the communities in which we do business. The principles of ESG are an important aspect of our business strategy, delivering a strategic business advantage while positively impacting the environment. We develop modern and efficient building designs with state-of-the-art technology to stay ahead of our customers’ needs while advancing structural, transportation, and energy requirements. We invest in sustainable design features and practices, such as the addition of solar panels, cool roofs, light emitting diode (“LED”) lighting, electric vehicle charging stations, waste diversion, recycling and xeriscaping, that result in cost-savings and operational efficiency for our customers and reduce energy and water consumption, as well as decrease greenhouse gas emissions across our portfolio and corporate operations. We have a comprehensive carbon strategy that includes science-based targets to address our global carbon footprint.
We are committed to social responsibility and strengthening relationships important to our business through customer partnerships, investor outreach, community involvement, labor solutions, and inclusion and diversity initiatives, as well as a focus on our employees and our customers’ employees through health and wellness programs and building design. Through our community workforce initiative, for example, we are helping build a talent pipeline for our customers with an emphasis on revitalizing career pathways and creating economic opportunities in the communities where we operate. We set an ambitious goal to train 25,000 individuals by 2025 by partnering with leading public sector organizations and leveraging learning technologies to develop innovative training solutions.
Our strong governance and oversight creates a culture of uncompromising integrity. Our Board independence and diversity, open communication with our stockholders and a risk management framework that supports our investment and process decisions all serve
9
to mitigate risk and preserve value for our company. The strength of our balance sheet and credit ratings, ability to stay ahead of customer needs, and engagement with our employees through ethics and anti-corruption training, along with stockholder outreach ensures the financial, operational and reputational resilience of our organization for the long-term. Our approach is reinforced by our Code of Ethics and Business Conduct, as described above.
ENVIRONMENTAL MATTERS
We are exposed to various environmental risks that may result in unanticipated losses and affect our operating results and financial condition. Either the previous owners or we have conducted environmental reviews on a majority of the properties we have acquired, including land. While some of these assessments have led to further investigation and sampling, none of the environmental assessments have revealed an environmental liability that we think would have a material adverse effect beyond amounts recorded as of December 31, 2020. See further discussion in Item 1A. Risk Factors and Note 16 to the Consolidated Financial Statements in Item 8. Financial Statements and Supplementary Data.
GOVERNMENTAL MATTERS
We are exposed to various regulatory requirements, taxes, tariffs, trade wars and laws within the countries in which we operate and unexpected changes in these items may result in unanticipated losses, adverse tax consequences and affect our operating results and financial condition. In addition, we may be impacted by the ability of our non-U.S. subsidiaries to distribute or otherwise transfer cash among our subsidiaries due to currency exchange control regulations and transfer pricing regulations. The impact of regional or country-specific economic instability, including government shutdowns or other internal trade alliances or agreements could also have a material adverse effect on our business, financial condition or results of operations. See further discussion in Item 1A. Risk Factors.
INSURANCE COVERAGE
We carry insurance coverage on our properties. We determine the type of coverage and the policy specifications and limits based on what we deem to be the risks associated with our ownership of properties and our business operations in specific markets. Such coverage typically includes property damage and rental loss insurance resulting from such perils as fire, windstorm, flood, earthquake and terrorism; commercial general liability insurance; and environmental insurance. Insurance is maintained through a combination of commercial insurance, self-insurance and a wholly-owned captive insurance entity. The costs to insure our properties are primarily covered through expense reimbursements from our customers. We believe our insurance coverage contains policy specifications and insured limits that are customary for similar properties, business activities and markets and we believe our properties are adequately insured. See further discussion in Item 1A. Risk Factors.
ITEM 1A. Risk Factors
Our operations and structure involve various risks that could adversely affect our business and financial condition, including but not limited to, our financial position, results of operations, cash flow, ability to make distributions and payments to security holders and the market value of our securities. These risks relate to Prologis as well as our investments in consolidated and unconsolidated entities and include among others, (i) risks related to our global operations (ii) risks related to our business; (iii) risks related to financing and capital; (iv) risks related to income taxes; and (v) general risks.
Risks Related to our Global Operations
As a global company, we are subject to social, political and economic risks of doing business in many countries.
We conduct a significant portion of our business and employ a substantial number of people outside of the U.S. During 2020, we generated approximately $484 million or 10.9% of our consolidated revenues from operations outside the U.S. Circumstances and developments related to international operations that could negatively affect us include, but are not limited to, the following factors:
|
• |
difficulties and costs of staffing and managing international operations in certain geographies, including differing employment practices and labor issues; |
|
• |
local businesses and cultural factors that differ from our usual standards and practices; |
|
• |
volatility in currencies and currency restrictions, which may prevent the transfer of capital and profits to the U.S.; |
|
• |
challenges in establishing effective controls and procedures to regulate operations in different geographies and to monitor compliance with applicable regulations, such as the Foreign Corrupt Practices Act, the United Kingdom (“U.K.”) Bribery Act and other similar laws; |
|
• |
unexpected changes in regulatory requirements, taxes, tariffs, trade wars and laws within the countries in which we operate; |
|
• |
potentially adverse tax consequences; |
|
• |
the responsibility of complying with multiple and potentially conflicting laws, e.g., with respect to corrupt practices, employment and licensing; |
10
|
• |
the impact of regional or country-specific business cycles and economic instability, including government shutdowns, uncertainty in the U.K., or further withdrawals from the European Union or other international trade alliances or agreements; |
|
• |
political instability, uncertainty over property rights, civil unrest, drug trafficking, political activism or the continuation or escalation of terrorist or gang activities; |
|
• |
foreign ownership restrictions in operations with the respective countries; and |
|
• |
access to capital may be more restricted, or unavailable on favorable terms or at all in certain locations. |
In addition, we may be impacted by the ability of our non-U.S. subsidiaries to dividend or otherwise transfer cash among our subsidiaries due to currency exchange control regulations, transfer pricing regulations and potentially adverse tax consequences, among other factors.
Compliance or failure to comply with regulatory requirements could result in substantial costs.
We are required to comply with many regulations in different countries, including (but not limited to) the Foreign Corrupt Practices Act, the U.K. Bribery Act and similar laws and regulations. Our properties are also subject to various federal, state and local regulatory requirements, such as the Americans with Disabilities Act and state and local fire and life-safety requirements. Noncompliance could result in the imposition of governmental fines or the award of damages to private litigants. While we believe that we are currently in material compliance with these regulatory requirements, the requirements may change or new requirements may be imposed that could require significant unanticipated expenditures by us.
Disruptions in the global capital and credit markets may adversely affect our operating results and financial condition.
To the extent there is turmoil in the global financial markets, this turmoil has the potential to adversely affect (i) the value of our properties; (ii) the availability or the terms of financing that we have or may anticipate utilizing; (iii) our ability to make principal and interest payments on, or refinance any outstanding debt when due; and (iv) the ability of our customers to enter into new leasing transactions or satisfy rental payments under existing leases. Disruptions in the capital and credit markets may also adversely affect the market price of our securities and our ability to make distributions and payments to our security holders.
The depreciation in the value of the foreign currency in countries where we have a significant investment may adversely affect our results of operations and financial position.
We hold significant real estate investments in international markets where the U.S. dollar is not the functional currency. At December 31, 2020, approximately $8.6 billion or 15.3% of our total consolidated assets were invested in a currency other than the U.S. dollar, principally the British pound sterling, euro and Japanese yen. For the year ended December 31, 2020, $289 million or 8.9% of our total consolidated segment NOI, as disclosed in Note 17 to the Consolidated Financial Statements in Item 8. Financial Statements and Supplementary Data, was denominated in a currency other than the U.S. dollar. As a result, we are subject to foreign currency risk due to potential fluctuations in exchange rates between foreign currencies and the U.S. dollar. A significant change in the value of the foreign currency of one or more countries where we have a significant investment may have a material adverse effect on our business and, specifically, our U.S. dollar reported financial position and results of operations.
Our hedging of foreign currency and interest rate risk may not effectively limit our exposure to other risks.
We attempt to mitigate our risk by borrowing in the currencies in which we have significant investments thereby providing a natural hedge. We may also enter into derivative financial instruments that we designate as net investment hedges, as these amounts offset the translation adjustments on the underlying net assets of our foreign investments. We enter into other foreign currency contracts, such as forwards, to reduce fluctuations in foreign currency cash flow associated with the translation of future earnings of our international subsidiaries. Although we attempt to mitigate the potential adverse effects of changes in foreign currency rates there can be no assurance that those attempts will be successful. Hedging arrangements involve risks, such as the risk of fluctuation in the relative value of the foreign currency or interest rates and the risk that counterparties may fail to honor their obligations under these arrangements. The funds required to settle such arrangements could be significant depending on the stability and movement of the hedged foreign currency or the size of the underlying financing and the applicable interest rates at the time of the breakage. The failure to hedge effectively against foreign exchange changes or interest rate changes may adversely affect our business.
Risks Related to our Business
General economic conditions and other events or occurrences that affect areas in which our properties are geographically concentrated, may impact financial results.
We are exposed to the economic conditions and other events and occurrences in the local, regional, national and international geographies in which we own properties. Our operating performance is further impacted by the economic conditions of the specific markets in which we have concentrations of properties.
At December 31, 2020, 30.9% of our consolidated operating properties or $13.6 billion (based on consolidated gross book value, or investment before depreciation) were located in California (Central Valley, San Francisco Bay Area and Southern California markets),
11
which represented 26.2% of the aggregate square footage of our operating properties and 27.1% of our NOI. Our revenues from, and the value of, our properties located in California may be affected by local real estate conditions (such as an oversupply of or reduced demand for logistics properties) and the local economic climate. Business layoffs, downsizing, industry slowdowns, changing demographics and other factors may adversely impact California’s economic climate. Because of the investment we have located in California, a downturn in California’s economy or real estate conditions, including state income tax and property tax laws, could adversely affect our business.
In addition to California, we also have significant holdings (defined as more than 3% of total consolidated investment before depreciation) in operating properties in certain markets located in Atlanta, Chicago, Dallas/Fort Worth, Houston, Lehigh Valley, New Jersey/New York City, Seattle and South Florida. Of these markets, no single market contributed more than 10% of our total consolidated investment before depreciation. Our operating performance could be adversely affected if conditions become less favorable in any of the markets in which we have a concentration of properties. Conditions such as an oversupply of logistics space or a reduction in demand for logistics space, among other factors, may impact operating conditions. Any material oversupply of logistics space or material reduction in demand for logistics space could adversely affect our overall business.
Our O&M portfolio, which includes our wholly-owned properties and properties included in our co-investment ventures, has concentrations of properties in the same markets mentioned above, as well as in markets in France, Japan, Mexico and the U.K., and are subject to the economic conditions in those markets.
Real estate investments are not as liquid as certain other types of assets, which may reduce economic returns to investors.
Real estate investments are not as liquid as certain other types of investments and this lack of liquidity may limit our ability to react promptly to changes in economic or other conditions. Significant expenditures associated with real estate investments, such as secured mortgage debt payments, real estate taxes and maintenance costs, are generally not reduced when circumstances cause a reduction in income from the investments. As a REIT, under the IRC, we are only able to hold property for sale in the ordinary course of business through taxable REIT subsidiaries in order to not incur punitive taxation on any tax gain from the sale of such property. We may dispose of certain properties that have been held for investment to generate liquidity. If we do not satisfy certain safe harbors or we believe there is too much risk of incurring the punitive tax on any tax gain from the sale, we may not pursue such sales.
We may decide to sell or contribute properties to certain of our unconsolidated co-investment ventures or sell properties to third parties to generate proceeds to fund our capital deployment activities. Our ability to sell or contribute properties on advantageous terms is affected by: (i) competition from other owners of properties that are trying to dispose of their properties; (ii) economic and market conditions, including the capitalization rates applicable to our properties; and (iii) other factors beyond our control. If our competitors sell assets similar to assets we intend to divest in the same markets or at valuations below our valuations for comparable assets, we may be unable to divest our assets at favorable pricing or at all. The unconsolidated co-investment ventures or third parties who might acquire our properties may need to have access to debt and equity capital, in the private and public markets, in order to acquire properties from us. Should they have limited or no access to capital on favorable terms, then dispositions and contributions could be delayed.
If we do not have sufficient cash available to us through our operations, sales or contributions of properties or available credit facilities to continue operating our business as usual, we may need to find alternative ways to increase our liquidity. Such alternatives may include, without limitation, divesting properties at less than optimal terms, incurring debt, entering into leases with new customers at lower rental rates or less than optimal terms or entering into lease renewals with our existing customers without an increase in rental rates. There can be no assurance, however, that such alternative ways to increase our liquidity will be available to us. Additionally, taking such measures to increase our liquidity may adversely affect our business, and in particular, our distributable cash flow and debt covenants.
Our investments are concentrated in the logistics sector and our business would be adversely affected by an economic downturn in that sector.
Our investments in real estate assets are concentrated in the logistics sector. This concentration may expose us to the risk of economic downturns in this sector to a greater extent than if our business activities were more diversified.
Investments in real estate properties are subject to risks that could adversely affect our business.
Investments in real estate properties are subject to varying degrees of risk. While we seek to minimize these risks through geographic diversification of our portfolio, market research and our asset management capabilities, these risks cannot be eliminated. Factors that may affect real estate values and cash flows include:
|
• |
local conditions, such as oversupply or a reduction in demand; |
|
• |
technological changes, such as reconfiguration of supply chains, autonomous vehicles, robotics, 3D printing or other technologies; |
|
• |
the attractiveness of our properties to potential customers and competition from other available properties; |
|
• |
increasing costs of maintaining, insuring, renovating and making improvements to our properties; |
12
|
• |
our ability to reposition our properties due to changes in the business and logistics needs of our customers; |
|
• |
our ability to lease the properties at favorable rates and control variable operating costs; and |
|
• |
governmental regulations and the associated potential liability under, and changes in, environmental, zoning, usage, tax, tariffs and other laws. |
These factors may affect our ability to recover our investment in the properties and result in impairment charges.
Our customers may be unable to meet their lease obligations or we may be unable to lease vacant space or renew leases or re-lease space on favorable terms as leases expire.
Our operating results and distributable cash flow would be adversely affected if a significant number of our customers were unable to meet their lease obligations. At December 31, 2020, our top 10 customers accounted for 16.3% of our consolidated NER. In the event of default by a significant number of customers, we may experience delays and incur substantial costs in enforcing our rights as landlord, and we may be unable to re-lease spaces. A customer may experience a downturn in its business, which may cause the loss of the customer or may weaken its financial condition, resulting in the customer’s failure to make rental payments when due or requiring a restructuring that might reduce cash flow from the lease. In addition, a customer may seek the protection of bankruptcy, insolvency or similar laws, which could result in the rejection and termination of such customer’s lease and thereby cause a reduction in our available cash flow.
We are also subject to the risk that, upon the expiration of leases they may not be renewed by existing customers, the space may not be re-leased to new customers or the terms of renewal or re-leasing (including the cost of required renovations or concessions to customers) may be less favorable to us than current lease terms. Our competitors may offer space at rental rates below current market rates or below the rental rates we currently charge our customers and we may be pressured to reduce our rental rates below those we currently charge to retain customers when leases expire or we may lose potential customers.
We may acquire properties and companies that involves risks which could adversely affect our business and financial condition.
We have acquired properties and will continue to acquire properties through the direct acquisition of real estate, the acquisition of entities that own real estate or through additional investments in co-investment ventures that acquire properties. The acquisition of properties involves risks, including the risk that the acquired property will not perform as anticipated and that any actual costs for rehabilitation, repositioning, renovation and improvements identified in the pre-acquisition due diligence process will exceed estimates. When we acquire properties, we may face risks associated with a lack of market knowledge or understanding of the local economy, forging new business relationships in the area and unfamiliarity with local government and permitting procedures. Additionally, there is, and it is expected there will continue to be, significant competition for properties that meet our investment criteria as well as risks associated with obtaining financing for acquisition activities. The acquired properties or entities may be subject to liabilities, including tax liabilities, which may be without any recourse, or with only limited recourse, with respect to unknown liabilities. As a result, if a liability were asserted against us based on our new ownership of any of these entities or properties, then we may have to pay substantial sums to settle it.
We may be unable to integrate the operations of newly acquired companies and realize the anticipated synergies and other benefits or do so within the anticipated timeframe. Potential difficulties we may encounter in the integration process include: (i) the inability to dispose of non-industrial assets or operations that are outside of our area of expertise; (ii) potential unknown liabilities and unforeseen increased expenses, delays or regulatory conditions associated with these transactions; and (iii) performance shortfalls as a result of the diversion of management’s attention caused by completing these transactions and integrating the companies’ operations.
Our real estate development and redevelopment strategies may not be successful.
Our real estate development and redevelopment strategy is focused on monetizing land in the future through development of logistics facilities to hold for long-term investment, contribution or sale to a co-investment venture or third party, depending on market conditions, our liquidity needs and other factors. We may increase our investment in the development, renovation and redevelopment business and we expect to complete the build-out and leasing of our current development portfolio. We may also develop, renovate and redevelop properties within existing or newly formed co-investment ventures. The real estate development, renovation and redevelopment business includes the following significant risks:
|
• |
we may not be able to obtain financing for development projects on favorable terms or at all; |
|
• |
we may explore development opportunities that may be abandoned and the related investment impaired; |
|
• |
we may not be able to obtain, or may experience delays in obtaining, all necessary zoning, land-use, building, occupancy and other governmental permits and authorizations; |
|
• |
we may have construction costs that exceed our estimates and projects may not be completed, delivered or stabilized as planned due to defects or other issues; |
|
• |
we may not be able to attract third-party investment in new development co-investment ventures or sufficient customer demand for our product; |
13
|
• |
we may have properties that perform below anticipated levels, producing cash flows below budgeted amounts; |
|
• |
we may seek to sell certain land parcels and not be able to find a third party to acquire such land or the sales price will not allow us to recover our investment, resulting in impairment charges; |
|
• |
we may not be able to lease properties we develop on favorable terms or at all; |
|
• |
we may not be able to capture the anticipated enhanced value created by our value-added properties on expected timetables or at all; |
|
• |
we may experience delays (temporary or permanent) if there is public or government opposition to our activities; and |
|
• |
we may have substantial renovation, new development and redevelopment activities, regardless of their ultimate success, that require a significant amount of management’s time and attention, diverting their attention from our day-to-day operations. |
We are subject to risks and liabilities in connection with forming co-investment ventures, investing in new or existing co-investment ventures, attracting third-party investment and managing properties through co-investment ventures.
At December 31, 2020, we had investments in co-investment ventures, both public and private, that owned operating properties with a gross book value of approximately $49 billion. Our organizational documents do not limit the amount of available funds that we may invest in these ventures, and we may and currently intend to develop and acquire properties through co-investment ventures and investments in other entities when warranted by the circumstances. However, there can be no assurance that we will be able to form new co-investment ventures, or attract third-party investment or that additional investments in new or existing ventures to develop or acquire properties will be successful. Further, there can be no assurance that we are able to realize value from our existing or future investments. The same factors that impact the valuation of our consolidated portfolio, as discussed above, also impact the portfolios held by the co-investment ventures and could result in other than temporary impairment of our investment and a reduction in fee revenues.
Our co-investment ventures involve certain additional risks that we do not otherwise face, including:
|
• |
our partners may share certain approval rights over major decisions made on behalf of the ventures; |
|
• |
if our partners fail to fund their share of any required capital contributions, then we may choose to contribute such capital; |
|
• |
our partners might have economic or other business interests or goals that are inconsistent with our business interests or goals that would affect our ability to operate the property; |
|
• |
the venture or other governing agreements often restrict the transfer of an interest in the co-investment venture or may otherwise restrict our ability to sell the interest when we desire or on advantageous terms; |
|
• |
our relationships with our partners are generally contractual in nature and may be terminated or dissolved under the terms of the agreements, and in such event, we may not continue to manage or invest in the assets underlying such relationships resulting in reduced fee revenues or we may elect to acquire the properties in order to maintain an investment in the portfolio; and |
|
• |
disputes between us and our partners may result in litigation or arbitration that would increase our expenses and prevent our officers and directors from focusing their time and effort on our business and result in subjecting the properties owned by the applicable co-investment venture to additional risk. |
We generally seek to maintain sufficient influence over our co-investment ventures to permit us to achieve our business objectives; however, we may not be able to continue to do so indefinitely. We have formed publicly traded investment vehicles, such as NPR and FIBRA Prologis, for which we serve as sponsor or manager. These entities bear their own risks related to trading markets, foreign currency exchange rates and market demand. We have contributed, and may continue to contribute, assets into such vehicles. There is a risk that our managerial relationship may be terminated.
We are exposed to various environmental risks, which may result in unanticipated losses that could affect our business and financial condition.
Under various federal, state and local laws, ordinances and regulations, a current or previous owner, developer or operator of real estate may be liable for the costs of removal or remediation of certain hazardous or toxic substances. The costs of removal or remediation of such substances could be substantial. Such laws often impose liability without regard to whether the owner or operator knew of, or was responsible for, the release or presence of such hazardous substances. In addition, third parties may sue the owner or operator of a site for damages based on personal injury, property damage or other costs, including investigation and clean-up costs, resulting from the environmental contamination.
14
Environmental laws in some countries, including the U.S., also require that owners or operators of buildings containing asbestos properly manage and maintain the asbestos, adequately inform or train those who may come into contact with asbestos and undertake special precautions, including removal or other abatement, in the event that asbestos is disturbed during building renovation or demolition. These laws may impose fines and penalties on building owners or operators who fail to comply with these requirements and may allow third parties to seek recovery from owners or operators for personal injury associated with exposure to asbestos. Some of our properties are known to contain asbestos-containing building materials.
In addition, some of our properties are leased or have been leased, in part, to owners and operators of businesses that use, store or otherwise handle petroleum products or other hazardous or toxic substances, creating a potential for the release of such hazardous or toxic substances. Furthermore, certain of our properties are on, adjacent to or near other properties that have contained or currently contain petroleum products or other hazardous or toxic substances, or upon which others have engaged, are engaged or may engage in activities that may release such hazardous or toxic substances. From time to time, we may acquire properties, or interests in properties, with known adverse environmental conditions for which we believe that the environmental liabilities associated with these conditions are quantifiable and that the acquisition will yield a superior risk-adjusted return. In connection with certain divested properties, we have agreed to remain responsible for, and to bear the cost of, remediating or monitoring certain environmental conditions on the properties.
Our insurance coverage does not cover all potential losses.
We and our unconsolidated co-investment ventures carry insurance coverage including property damage and rental loss insurance resulting from certain perils such as fire and additional perils as covered under an extended coverage policy, namely windstorm, flood, earthquake and terrorism; commercial general liability insurance; and environmental insurance, as appropriate for the markets where each of our properties and business operations are located. The insurance coverage contains policy specifications and insured limits customarily carried for similar properties, business activities and markets. We believe our properties and the properties of our co-investment ventures are adequately insured. Certain losses, however, including losses from floods, earthquakes, acts of war, acts of terrorism or riots and pandemics, generally are not insured against or not fully insured against because it is not deemed economically feasible or prudent to do so. If an uninsured loss or a loss in excess of insured limits occurs with respect to one or more of our properties, we could experience a significant loss of capital invested and future revenues in these properties and could potentially remain obligated under any recourse debt associated with the property.
Furthermore, we cannot be sure that the insurance companies will be able to continue to offer products with sufficient coverage at commercially reasonable rates. If we experience a loss that is uninsured or that exceeds insured limits with respect to one or more of our properties or if the insurance companies fail to meet their coverage commitments to us in the event of an insured loss, then we could lose the capital invested in the damaged properties, as well as the anticipated future revenues from those properties and, if there is recourse debt, then we would remain obligated for any mortgage debt or other financial obligations related to the properties. Any such losses or higher insurance costs could adversely affect our business.
A number of our investments, both wholly-owned and owned through co-investment ventures, are located in areas that are known to be subject to earthquake activity. U.S. properties located in active seismic areas include properties in our markets in California and Seattle. International properties located in active seismic areas include Japan and Mexico. We generally carry earthquake insurance on our properties located in areas historically subject to seismic activity, subject to coverage limitations and deductibles, if we believe it is commercially reasonable. We evaluate our earthquake insurance coverage annually in light of current industry practice through an analysis prepared by outside consultants and in some specific instances have elected to self-insure our earthquake exposure based on this analysis. We have elected not to carry earthquake insurance for our assets in Japan based on this analysis.
Furthermore, a number of our properties are located in areas that are known to be subject to hurricane or flood risk. We carry hurricane and flood hazard insurance on all of our properties located in areas historically subject to such activity, subject to coverage limitations and deductibles, if we believe it is commercially reasonable. We evaluate our insurance coverage annually in light of current industry practice through an analysis prepared by outside consultants.
Risks Related to Financing and Capital
We may be unable to refinance our debt or our cash flow may be insufficient to make required debt payments.
We are subject to risks normally associated with debt financing, including the risk that our cash flow will be insufficient to meet required payments of principal and interest. There can be no assurance that we will be able to refinance any maturing indebtedness, that such refinancing would be on terms as favorable as the terms of the maturing indebtedness, or that we will be able to otherwise obtain funds by selling assets or raising equity to make required payments on maturing indebtedness. If we are unable to refinance our indebtedness at maturity or meet our payment obligations, our business and financial condition will be negatively impacted and, if the maturing debt is secured, the lender may foreclose on the property securing such indebtedness. Our credit facilities and certain other debt bears interest at variable rates. Increases in market interest rates would increase our interest expense under these agreements.
Covenants in our credit agreements could limit our flexibility and breaches of these covenants could adversely affect our financial condition.
The terms of our various credit agreements, including our credit facilities, the indentures under which our senior notes and term loans are issued and other note agreements, require us to comply with a number of customary financial covenants, such as maintaining debt service coverage ratios, leverage ratios, fixed charge coverage ratios and other operating covenants including maintaining insurance
15
coverage. These covenants may limit our flexibility to run our business, and breaches of these covenants could result in defaults under the instruments governing the applicable indebtedness. If we default under the covenant provisions and are unable to cure the default, refinance the indebtedness or meet payment obligations, our business and financial condition generally and, in particular, the amount of our distributable cash flow could be adversely affected.
Adverse changes in our credit ratings could negatively affect our financing activity.
At December 31, 2020, our credit ratings from Moody’s and S&P were A3 and A-, respectively, both with stable outlook. A securities rating is not a recommendation to buy, sell or hold securities and is subject to revision or withdrawal at any time by the rating organization.
The credit ratings of our senior notes and preferred stock are based on our operating performance, liquidity and leverage ratios, overall financial position and other factors employed by the credit rating agencies in their rating analyses of us. Our credit ratings can affect the amount of capital we can access, as well as the terms and pricing of any debt we may incur. There can be no assurance that we will be able to maintain our current credit ratings, and in the event our credit ratings are downgraded, we would likely incur higher borrowing costs and may encounter difficulty in obtaining additional financing. Also, a downgrade in our credit ratings may trigger additional payments or other negative consequences under our credit facilities and other debt instruments. Adverse changes in our credit ratings could negatively impact our business and, in particular, our refinancing and other capital market activities, our ability to manage debt maturities, our future growth and our development and acquisition activity.
In order to meet REIT distribution requirements we may need access to external sources of capital.
To qualify as a REIT, we are required each year to distribute at least 90% of our REIT taxable income (determined without regard to the dividends-paid deduction and by excluding any net capital gain) to our stockholders and we may be subject to tax to the extent our taxable income is not fully distributed. Historically, we have satisfied these distribution requirements by making cash distributions to our stockholders, however, we may elect to pay a portion of the distribution in shares of our stock. Assuming we continue to satisfy these distribution requirements with cash, we may not be able to fund all future capital needs, including acquisition and development activities, from cash retained from operations and may have to rely on third-party sources of capital. Furthermore, to maintain our REIT status and not have to pay federal income and excise taxes, we may need to borrow funds on a short-term basis to meet the REIT distribution requirements even if the then-prevailing market conditions are not favorable for these borrowings. These short-term borrowing needs could result from differences in timing between the actual receipt of cash and inclusion of income for federal income tax purposes, or the effect of nondeductible capital expenditures, the creation of reserves or required debt or amortization payments. Our ability to access debt and equity capital on favorable terms or at all depends on a number of factors, including general market conditions, the market’s perception of our growth potential, our current and potential future earnings and cash distributions and the market price of our securities.
The Financial Conduct Authority (“FCA”), the authority that regulates the London Inter-bank Offered Rate (“LIBOR”), announced that it intends to stop compelling banks to submit rates for the calculation of LIBOR after 2021 which will require transition to an alternative reference rate that could have a negative impact on our required debt payments and the value of our related debt and derivative financial instruments.
In July 2017, the FCA announced it intended to stop compelling banks to submit rates for the calculation of LIBOR after 2021. As a result, in the U.S., the Federal Reserve Board and the Federal Reserve Bank of New York identified the Secured Overnight Financing Rate (“SOFR”) as its preferred alternative rate for USD LIBOR for debt and derivative financial instruments. In November 2020, the Federal Reserve Board along with various independent groups announced the potential for certain USD LIBOR tenors to continue to be published until June 2023. This change would allow most legacy USD LIBOR contracts to mature before disruptions occur in the USD LIBOR market, without the need to transition those contracts to SOFR. The expected transition of GBP LIBOR and Yen LIBOR at the end of 2021 was not impacted by this announcement. Additionally, other global regulators have undertaken reference rate reform initiatives to identify a preferred alternative rate for other interbank offered rates (“IBORs”). We refer to these rates collectively as “IBOR-indexed”. At December 31, 2020 we had variable rate debt of $2.0 billion, excluding borrowings that are hedged through interest rate swap agreements. See Item 7A. Quantitative and Qualitative Disclosures About Market Risk for additional discussion regarding our variable rate debt.
Our loan documents contain provisions that contemplate alternative methods to determine the base rate applicable to our IBOR-indexed debt to the extent IBOR-indexed rates are not available. Additionally, no mandatory prepayment or redemption provisions would be triggered under our loan documents in the event that the IBOR-indexed rates are not available. If a contract is not transitioned to a preferred alternative rate and IBOR-indexed rates are discontinued, the impact on our debt and derivative financial instruments is likely to vary by contract. If IBOR-indexed rates are discontinued or if the methods of calculating the rates change, interest rates on our current or future indebtedness may be adversely affected. While we currently expect IBOR-indexed rates to be available until the end of 2021, it is possible that they will become unavailable prior to that time.
We anticipate managing the transition to a preferred alternative rate using the language set out in our agreements and through potentially modifying our debt and derivative instruments, however future market conditions may not allow immediate implementation of desired modifications and we may incur significant associated costs in doing so. We will continue to monitor and evaluate the potential impact on our debt payments and value of our related debt and derivative financial instruments, however, we are not able to predict when IBOR-indexed rates will cease to be available.
16
Our stockholders may experience dilution if we issue additional common stock or units in the OP.
Any additional future issuance of common stock or OP units will reduce the percentage of our common stock and units owned by investors. In most circumstances, stockholders and unitholders will not be entitled to vote on whether or not we issue additional common stock or units. In addition, depending on the terms and pricing of any additional offering of our common stock or OP units and the utilization of the proceeds, our stockholders and unitholders may experience dilution in both book value and fair value of their common stock or units.
Risks Related to Income Tax
The failure of Prologis, Inc. to qualify as a REIT would have serious adverse consequences.
Prologis, Inc. elected to be taxed as a REIT under Sections 856 through 860 of the IRC commencing with the taxable year ended December 31, 1997. We believe Prologis, Inc. has been organized and operated to qualify as a REIT under the IRC and believe that the current organization and method of operation comply with the rules and regulations promulgated under the IRC to enable Prologis, Inc. to continue to qualify as a REIT. However, it is possible that we are organized or have operated in a manner that would not allow Prologis, Inc. to qualify as a REIT, or that our future operations could cause Prologis, Inc. to fail to qualify. Qualification as a REIT requires us to satisfy numerous requirements (some annually and others on a quarterly basis) established under highly technical and complex sections of the IRC for which there are only limited judicial and administrative interpretations and involves the determination of various factual matters and circumstances not entirely within our control. For example, to qualify as a REIT, Prologis, Inc. must derive at least 95% of its gross income in any year from qualifying sources. In addition, Prologis, Inc. must pay dividends to its stockholders aggregating annually at least 90% of its taxable income (determined without regard to the dividends paid deduction and by excluding capital gains) and must satisfy specified asset tests on a quarterly basis. Historically, we have satisfied these distribution requirements by making cash distributions to our stockholders, but we may choose to satisfy these requirements by making distributions of cash or other property, including, in limited circumstances, our own stock. The provisions of the IRC and applicable Treasury regulations regarding qualification as a REIT are more complicated for Prologis, Inc. because we hold substantially all of our assets through the OP.
If Prologis, Inc. fails to qualify as a REIT in any taxable year, we will be required to pay federal income tax (including, for taxable years prior to 2018, any applicable alternative minimum tax) on taxable income at regular corporate rates. Unless we are entitled to relief under certain statutory provisions, Prologis, Inc. would be disqualified from treatment as a REIT for the four taxable years following the year in which it lost the qualification and would be subject to corporate tax on built-in gains that exist at the time of REIT re-election if recognized within the five-year period after re-election, and potentially 10 years for certain states. If Prologis, Inc. lost its REIT status, our net earnings would be significantly reduced for each of the years involved. In addition, we may need to borrow additional funds or liquidate some investments to pay any additional tax liability. Accordingly, funds available for investment, operations and distributions would be reduced.
Furthermore, we own a direct or indirect interest in certain subsidiary REITs that elected to be taxed as REITs under Sections 856 through 860 of the IRC. Provided that each subsidiary REIT qualifies as a REIT, our interest in such subsidiary REIT will be treated as a qualifying real estate asset for purposes of the REIT asset tests, and any dividend income or gains derived by us from such subsidiary REIT will generally be treated as income that qualifies for purposes of the REIT 95% and 75% gross income tests. To qualify as a REIT, the subsidiary REIT must independently satisfy all of the REIT qualification requirements. If such subsidiary REIT were to fail to qualify as a REIT, and certain relief provisions did not apply, it would be treated as a regular taxable corporation and its income would be subject to U.S. federal income tax. In addition, a failure of the subsidiary REIT to qualify as a REIT would have an adverse effect on the ability of Prologis, Inc. to comply with the REIT income and asset tests, and thus its ability to qualify as a REIT.
In addition, we may acquire properties through the acquisition of REIT entities that own the real estate. If a gain in such assets is not otherwise recognized by the seller or target in such acquisitions, and such entities were to fail to satisfy the REIT requirements for any year, they would be disqualified from treatment as a REIT for the four taxable years following the year in which the REIT qualification was lost and the acquired assets would be subject to corporate tax on built-in gains that exist at the time of REIT re-election or, if earlier, at the time of Prologis’ acquisition of the assets. A sale of such assets within the 5-year recognition period, and potentially 10 years for certain states, could result in corporate tax liabilities that could be significant.
Certain property transfers may generate prohibited transaction income, resulting in a penalty tax on gain attributable to the transaction.
From time to time, we may transfer or otherwise dispose of some of our properties, including by contributing properties to our co-investment ventures. Under the IRC, any gain resulting from transfers of properties we hold as inventory or primarily for sale to customers in the ordinary course of business is treated as income from a prohibited transaction subject to a 100% penalty tax. We do not believe that our transfers or disposals of property or our contributions of properties into our co-investment ventures are prohibited transactions. However, whether property is held for investment purposes is a question of fact that depends on all the facts and circumstances surrounding the particular transaction. The Internal Revenue Service (“IRS”) may contend that certain transfers or dispositions of properties by us or contributions of properties into our co-investment ventures are prohibited transactions. While we believe that the IRS would not prevail in any such dispute, if the IRS were to argue successfully that a transfer, disposition or contribution of property constituted a prohibited transaction, we would be required to pay a 100% penalty tax on any gain allocable to us from the prohibited transaction. In addition, income from a prohibited transaction might adversely affect our ability to satisfy the income tests for qualification as a REIT.
17
Legislative or regulatory action could adversely affect us.
In recent years, numerous legislative, judicial and administrative changes have been made to the U.S., state, local and foreign income tax laws applicable to investments in real estate, REITs, similar entities and investments. Additional changes are likely to continue to occur in the future, both in and outside of the U.S. and may impact our taxation or that of our stockholders. Any increases in tax liability could be substantial and would reduce the amount of cash available for other purposes.
Complying with REIT requirements may limit our flexibility or cause us to forego otherwise attractive opportunities.
Our use of taxable REIT subsidiaries (“TRSs”) enables us to engage in non-REIT qualifying business activities. Under the IRC, no more than 20% of the value of the assets of a REIT may be represented by securities of one or more TRSs and other non-qualifying assets. This limitation may hinder our ability to make certain attractive investments, including the purchase of non-qualifying assets, the expansion of non-real estate activities and investments in the businesses to be conducted by our TRSs, and to that extent limit our opportunities.
General Risks
Our business may be materially and adversely affected by the impact of the global pandemic of COVID-19.
The World Health Organization and certain national and local governments characterized COVID-19 as a pandemic in March 2020. The COVID-19 outbreak has disrupted financial markets and global, national and local economies. There are government restrictions on activities across the globe. The impact of the COVID-19 outbreak on our business, that of our unconsolidated co-investment ventures, and our customers for the long-term continues to be uncertain.
Given the ongoing and dynamic nature of these circumstances, we cannot predict the extent to which the continuation of the COVID-19 pandemic may impact our business, but its impact may include the following:
|
• |
Existing customers and potential customers of our logistics facilities may be adversely affected by the decrease in economic activity, which in turn could disrupt their business and their ability to enter into new leasing transactions or satisfy rental payments; |
|
• |
Government, labor or other restrictions may prevent us from completing the development or leasing of properties currently under development or making our properties ready for our customers to move in; |
|
• |
Our ability to recover our investments in real estate assets may be impacted by current market conditions; and |
|
• |
Our workforce, including our executives, may become ill or have difficulty working remotely, caring for our properties and/or customers. |
Any prolonged economic downturn, escalation of the outbreak or disruption in the financial markets may also impact our ability to access capital markets to issue debt or equity securities and to complete real estate transactions at attractive pricing or at all.
These items may materially and adversely affect our financial condition, results of operations, cash flows and real estate values.
Our business and operations could suffer in the event of system failures or cyber security attacks.
Despite system redundancy, the implementation of security measures and the existence of a disaster recovery plan for our internal and hosted information technology systems, our systems are vulnerable to damages from any number of sources, including energy blackouts, natural disasters, terrorism, war, telecommunication failures and cyber security attacks, such as computer viruses or unauthorized access. Any system failure or accident that causes interruptions in our operations could result in a material disruption to our business. We may also incur additional costs to remedy damages caused by such disruptions. Any compromise of our security could result in a violation of applicable privacy and other laws, unauthorized access to information of ours and others, significant legal and financial exposure, damage to our reputation, loss or misuse of the information and a loss of confidence in our security measures, which could harm our business.
Risks associated with our dependence on key personnel.
We depend on the deep industry knowledge and the efforts of our executive officers and other key employees. From time to time, our personnel and their roles may change. While we believe that we are able to retain our key talent and find suitable employees to meet our needs, the loss of key personnel, any change in their roles or the limitation of their availability could adversely affect our business. If we are unable to continue to attract and retain our executive officers, or if compensation costs required to attract and retain key employees become more expensive, our performance and competitive position could be materially adversely affected.
Our business could be adversely impacted if we have deficiencies in our disclosure controls and procedures or internal control over financial reporting.
The design and effectiveness of our disclosure controls and procedures and internal control over financial reporting may not prevent all errors, misstatements or misrepresentations. While management continually reviews the effectiveness of our disclosure controls and
18
procedures and internal control over financial reporting, there can be no guarantee that our internal control over financial reporting will be effective in accomplishing all control objectives all of the time. Deficiencies, including any material weakness, in our internal control over financial reporting that may occur in the future could result in misstatements or restatements of our financial statements or a decline in the price of our securities.
We are exposed to the potential impacts of future climate change, which may result in unanticipated losses that could affect our business and financial condition.
We are also exposed to potential physical risks from possible future changes in climate. Our logistics facilities may be exposed to catastrophic weather events, such as severe storms, fires or floods. If the frequency of extreme weather events increases, our exposure to these events could increase. We do not currently consider ourselves to be exposed to regulatory risks related to climate change, as the operation of our buildings typically does not generate a significant amount of greenhouse gas emissions. However, we may be adversely impacted as a real estate developer in the future by potential impacts to the supply chain or stricter energy efficiency standards or greenhouse gas regulations for the commercial building sectors. We cannot give any assurance that other such conditions do not exist or may not arise in the future. The potential impacts of future climate change on our real estate properties could adversely affect our ability to lease, develop or sell such properties or to borrow using such properties as collateral.
ITEM 1B. Unresolved Staff Comments
None.
ITEM 2. Properties
GEOGRAPHIC DISTRIBUTION
We predominately invest in logistics facilities. Our properties are typically used for distribution, storage, packaging, assembly and light manufacturing of consumer products. The vast majority of our operating properties are used by our customers for retail and online fulfillment and business-to-business transactions.
The following tables provide details of our consolidated operating properties, investment in land and development portfolio and our O&M portfolio. The O&M portfolio includes the properties we consolidate and the properties owned by our unconsolidated co-investment ventures reflected at 100% of the amount included in the ventures’ financial statements as calculated on a GAAP basis, not our proportionate share.
19
Included in the operating property information below for our consolidated operating properties are 482 buildings owned primarily by one co-investment venture that we consolidate but of which we own less than 100% of the equity. No individual property or market amounted to 10% or more of our consolidated total assets at December 31, 2020, or generated revenue equal to 10% or more of our consolidated total revenues for the year ended December 31, 2020, with the exception of the Southern California market. Dollars and square feet in the following tables are in millions:
|
|
|
Consolidated Operating Properties |
|
|
O&M |
|
||||||||||||||
|
Geographies |
|
Rentable Square Footage |
|
|
Gross Book Value |
|
|
Encumbrances (1) |
|
|
Rentable Square Footage |
|
|
Gross Book Value |
|
|||||
|
U.S.: |
|
|
|
|
|
|
|
|
|
|
|
|
|
|
|
|
|
|
|
|
|
Atlanta |
|
|
24 |
|
|
$ |
1,549 |
|
|
$ |
14 |
|
|
|
30 |
|
|
$ |
1,996 |
|
|
Baltimore/Washington D.C. |
|
|
10 |
|
|
|
1,210 |
|
|
|
12 |
|
|
|
14 |
|
|
|
1,603 |
|
|
Central PA |
|
|
16 |
|
|
|
1,309 |
|
|
|
- |
|
|
|
17 |
|
|
|
1,403 |
|
|
Central Valley |
|
|
17 |
|
|
|
1,306 |
|
|
|
10 |
|
|
|
19 |
|
|
|
1,440 |
|
|
Chicago |
|
|
39 |
|
|
|
3,201 |
|
|
|
9 |
|
|
|
52 |
|
|
|
4,359 |
|
|
Dallas/Ft. Worth |
|
|
31 |
|
|
|
2,205 |
|
|
|
8 |
|
|
|
38 |
|
|
|
2,732 |
|
|
Houston |
|
|
24 |
|
|
|
2,454 |
|
|
|
5 |
|
|
|
30 |
|
|
|
2,963 |
|
|
Lehigh Valley |
|
|
24 |
|
|
|
2,951 |
|
|
|
- |
|
|
|
27 |
|
|
|
3,228 |
|
|
New Jersey/New York City |
|
|
32 |
|
|
|
3,798 |
|
|
|
45 |
|
|
|
41 |
|
|
|
5,059 |
|
|
San Francisco Bay Area |
|
|
21 |
|
|
|
2,909 |
|
|
|
9 |
|
|
|
26 |
|
|
|
3,562 |
|
|
Seattle |
|
|
13 |
|
|
|
2,016 |
|
|
|
- |
|
|
|
22 |
|
|
|
2,873 |
|
|
South Florida |
|
|
13 |
|
|
|
1,677 |
|
|
|
29 |
|
|
|
18 |
|
|
|
2,220 |
|
|
Southern California |
|
|
78 |
|
|
|
9,151 |
|
|
|
16 |
|
|
|
97 |
|
|
|
11,227 |
|
|
Remaining Markets – U.S. (15 markets) (2) |
|
|
80 |
|
|
|
5,728 |
|
|
|
39 |
|
|
|
107 |
|
|
|
7,630 |
|
|
Subtotal U.S. |
|
|
422 |
|
|
|
41,464 |
|
|
|
196 |
|
|
|
538 |
|
|
|
52,295 |
|
|
Other Americas: |
|
|
|
|
|
|
|
|
|
|
|
|
|
|
|
|
|
|
|
|
|
Brazil |
|
|
- |
|
|
|
- |
|
|
|
- |
|
|
|
10 |
|
|
|
506 |
|
|
Canada |
|
|
10 |
|
|
|
882 |
|
|
|
153 |
|
|
|
10 |
|
|
|
882 |
|
|
Mexico |
|
|
1 |
|
|
|
53 |
|
|
|
- |
|
|
|
41 |
|
|
|
2,597 |
|
|
Subtotal Other Americas |
|
|
11 |
|
|
|
935 |
|
|
|
153 |
|
|
|
61 |
|
|
|
3,985 |
|
|
Europe: |
|
|
|
|
|
|
|
|
|
|
|
|
|
|
|
|
|
|
|
|
|
France |
|
|
1 |
|
|
|
92 |
|
|
|
- |
|
|
|
32 |
|
|
|
2,861 |
|
|
Germany |
|
* |
|
|
|
18 |
|
|
|
- |
|
|
|
25 |
|
|
|
2,397 |
|
|
|
Netherlands |
|
* |
|
|
|
19 |
|
|
|
- |
|
|
|
23 |
|
|
|
2,314 |
|
|
|
U.K. |
|
|
1 |
|
|
|
103 |
|
|
|
- |
|
|
|
26 |
|
|
|
4,031 |
|
|
Remaining Countries – Europe (8 countries) (3) |
|
|
3 |
|
|
|
178 |
|
|
|
- |
|
|
|
82 |
|
|
|
6,675 |
|
|
Subtotal Europe |
|
|
5 |
|
|
|
410 |
|
|
|
- |
|
|
|
188 |
|
|
|
18,278 |
|
|
Asia: |
|
|
|
|
|
|
|
|
|
|
|
|
|
|
|
|
|
|
|
|
|
China |
|
|
- |
|
|
|
- |
|
|
|
- |
|
|
|
32 |
|
|
|
2,504 |
|
|
Japan |
|
|
2 |
|
|
|
348 |
|
|
|
199 |
|
|
|
37 |
|
|
|
7,179 |
|
|
Singapore |
|
|
1 |
|
|
|
144 |
|
|
|
- |
|
|
|
1 |
|
|
|
144 |
|
|
Subtotal Asia |
|
|
3 |
|
|
|
492 |
|
|
|
199 |
|
|
|
70 |
|
|
|
9,827 |
|
|
Total operating portfolio (4) |
|
|
441 |
|
|
|
43,301 |
|
|
|
548 |
|
|
|
857 |
|
|
|
84,385 |
|
|
Value-added properties (5) |
|
|
5 |
|
|
|
594 |
|
|
|
- |
|
|
|
9 |
|
|
|
983 |
|
|
Total operating properties |
|
|
446 |
|
|
$ |
43,895 |
|
|
$ |
548 |
|
|
|
866 |
|
|
$ |
85,368 |
|
|
|
|
|
|
|
|
|
|
|
|
|
|
|
|
|
|
|
|
|
|
|
|
Items notated by ‘*’ indicate an amount less than one million that rounds to zero. |
|
|||||||||||||||||||
20
|
|
|
Consolidated – Investment in Land |
|
|
Consolidated – Development Portfolio |
|
||||||||||||||
|
Geographies |
|
Acres |
|
|
Estimated Build Out Potential (square feet) (6) |
|
|
Current Investment |
|
|
Rentable Square Footage Upon Completion |
|
|
TEI (7) |
|
|||||
|
U.S.: |
|
|
|
|
|
|
|
|
|
|
|
|
|
|
|
|
|
|
|
|
|
Atlanta |
|
|
344 |
|
|
|
3 |
|
|
$ |
34 |
|
|
* |
|
|
$ |
17 |
|
|
|
Baltimore/Washington D.C. |
|
|
41 |
|
|
|
1 |
|
|
|
16 |
|
|
|
1 |
|
|
|
120 |
|
|
Central PA |
|
|
29 |
|
|
|
1 |
|
|
|
8 |
|
|
|
- |
|
|
|
- |
|
|
Central Valley |
|
|
934 |
|
|
|
16 |
|
|
|
185 |
|
|
|
1 |
|
|
|
80 |
|
|
Chicago |
|
|
182 |
|
|
|
3 |
|
|
|
64 |
|
|
|
1 |
|
|
|
36 |
|
|
Dallas/Ft. Worth |
|
|
108 |
|
|
|
2 |
|
|
|
25 |
|
|
|
1 |
|
|
|
98 |
|
|
Houston |
|
|
197 |
|
|
|
3 |
|
|
|
44 |
|
|
* |
|
|
|
13 |
|
|
|
Lehigh Valley |
|
|
208 |
|
|
|
2 |
|
|
|
82 |
|
|
|
2 |
|
|
|
197 |
|
|
New Jersey/New York City |
|
|
26 |
|
|
|
1 |
|
|
|
34 |
|
|
|
1 |
|
|
|
16 |
|
|
San Francisco Bay Area |
|
|
- |
|
|
|
- |
|
|
|
- |
|
|
* |
|
|
|
96 |
|
|
|
Seattle |
|
|
41 |
|
|
|
1 |
|
|
|
67 |
|
|
* |
|
|
|
62 |
|
|
|
South Florida |
|
|
183 |
|
|
|
3 |
|
|
|
148 |
|
|
* |
|
|
|
24 |
|
|
|
Southern California |
|
|
116 |
|
|
|
2 |
|
|
|
108 |
|
|
* |
|
|
|
62 |
|
|
|
Remaining Markets – U.S. (15 markets) |
|
|
620 |
|
|
|
9 |
|
|
|
106 |
|
|
|
6 |
|
|
|
633 |
|
|
Subtotal U.S. |
|
|
3,029 |
|
|
|
47 |
|
|
|
921 |
|
|
|
13 |
|
|
|
1,454 |
|
|
Other Americas: |
|
|
|
|
|
|
|
|
|
|
|
|
|
|
|
|
|
|
|
|
|
Brazil |
|
|
196 |
|
|
|
4 |
|
|
|
16 |
|
|
|
- |
|
|
|
- |
|
|
Canada |
|
|
162 |
|
|
|
3 |
|
|
|
89 |
|
|
* |
|
|
|
72 |
|
|
|
Mexico |
|
|
414 |
|
|
|
7 |
|
|
|
76 |
|
|
|
1 |
|
|
|
44 |
|
|
Subtotal Other Americas |
|
|
772 |
|
|
|
14 |
|
|
|
181 |
|
|
|
1 |
|
|
|
116 |
|
|
Europe: |
|
|
|
|
|
|
|
|
|
|
|
|
|
|
|
|
|
|
|
|
|
France |
|
|
263 |
|
|
|
5 |
|
|
|
28 |
|
|
|
1 |
|
|
|
126 |
|
|
Germany |
|
|
66 |
|
|
|
2 |
|
|
|
39 |
|
|
* |
|
|
|
76 |
|
|
|
Netherlands |
|
|
31 |
|
|
|
1 |
|
|
|
15 |
|
|
|
1 |
|
|
|
98 |
|
|
U.K. |
|
|
198 |
|
|
|
4 |
|
|
|
120 |
|
|
|
2 |
|
|
|
328 |
|
|
Remaining Countries – Europe (8 countries) |
|
|
869 |
|
|
|
17 |
|
|
|
183 |
|
|
|
3 |
|
|
|
251 |
|
|
Subtotal Europe |
|
|
1,427 |
|
|
|
29 |
|
|
|
385 |
|
|
|
7 |
|
|
|
879 |
|
|
Asia: |
|
|
|
|
|
|
|
|
|
|
|
|
|
|
|
|
|
|
|
|
|
Japan |
|
|
76 |
|
|
|
4 |
|
|
|
119 |
|
|
|
7 |
|
|
|
1,320 |
|
|
Subtotal Asia |
|
|
76 |
|
|
|
4 |
|
|
|
119 |
|
|
|
7 |
|
|
|
1,320 |
|
|
Total land and development portfolio |
|
|
5,304 |
|
|
|
94 |
|
|
$ |
1,606 |
|
|
|
28 |
|
|
$ |
3,769 |
|
|
|
|
|
|
|
|
|
|
|
|
|
|
|
|
|
|
|
|
|
|
|
|
Items notated by ‘*’ indicate an amount less than one million that rounds to zero. |
|
|||||||||||||||||||
|
(1) |
Certain of our consolidated properties are pledged as security under secured mortgage debt and assessment bonds. For purposes of this table, the total principal balance of a debt issuance that is secured by a pool of properties is allocated among the properties in the pool based on each property’s investment balance. In addition to the amounts reflected here, we also have $101 million of encumbrances related to one prestabilized property included in the consolidated development portfolio. |
|
(2) |
No remaining market within the U.S. represented more than 2% of the total gross book value of the consolidated operating properties. |
|
(3) |
No remaining country within Europe represented more than 2% of the total gross book value of the O&M operating properties. |
|
(4) |
Included in our consolidated operating properties are properties that we consider to be held for contribution and are presented within Assets Held for Sale or Contribution in the Consolidated Balance Sheets. We include these properties in our operating portfolio as they are expected to be contributed to our co-investment ventures and remain in our O&M operating portfolio. At December 31, 2020, we had investments in real estate properties that were expected to be contributed to our unconsolidated co-investment ventures totaling $454 million and aggregating 5 million square feet. See Note 6 to the Consolidated Financial Statements in Item 8. Financial Statements and Supplementary Data for further information on our Assets Held for Sale or Contribution. |
|
(5) |
Value-added properties are properties we have either acquired at a discount and believe we could provide greater returns post-stabilization or properties we expect to repurpose to a higher and better use. |
|
(6) |
Represents the estimated finished square feet available for lease upon completion of a building on existing parcels of land. |
|
(7) |
TEI is based on current projections and is subject to change. In the first quarter of 2020, we suspended several recently started speculative development projects for the short-term. Most of the suspended projects were restarted by the fourth quarter of 2020. At December 31, 2020, the outstanding suspended development projects had a TEI of $82 million and remain within our consolidated development portfolio. As noted in the table below, our current investment in our active development portfolio, excluding suspended development projects, was $1.9 billion, leaving approximately $1.8 billion of additional required investment. At December 31, 2020, based on TEI, approximately 17% of the properties in the development portfolio were completed but not |
21
|
yet stabilized, 69% of the properties were expected to be completed before December 31, 2021 and the remaining properties were expected to be completed before August 2022. We expect our development activities to accelerate in 2021. |
The following table summarizes our investment in consolidated real estate properties at December 31, 2020 (in millions):
|
|
|
Investment Before Depreciation |
|
|
|
Operating properties, excluding assets held for sale or contribution |
|
$ |
43,508 |
|
|
Development portfolio, including cost of land |
|
|
1,882 |
|
|
Land |
|
|
1,606 |
|
|
Other real estate investments (1) |
|
|
3,388 |
|
|
Total consolidated real estate properties |
|
$ |
50,384 |
|
|
(1) |
Included in other real estate investments were: (i) non-strategic real estate assets acquired in the Liberty Transaction that we do not intend to operate long-term; (ii) land parcels we own and lease to third parties; (iii) real estate assets that we intend to redevelop into industrial properties; and (iv) costs associated with potential acquisitions and future development projects, including purchase options on land. |
LEASE EXPIRATIONS
We generally lease our properties on a long-term basis (the average term for leases commenced, including new leases and renewals, in 2020 was 64 months). The following table summarizes the lease expirations of our consolidated operating portfolio for leases in place at December 31, 2020 (dollars and square feet in millions):
|
|
|
|
|
|
|
|
|
|
|
|
|
|
|
|
|
|
|
|
|
|
|
|
|
|
|
|
|
|
|
|
|
NER |
|
|||||||||
|
|
|
Number of Leases |
|
|
Occupied Square Feet |
|
|
Dollars |
|
|
% of Total |
|
|
Dollars Per Square Foot (1) |
|
|||||
|
2021 |
|
|
857 |
|
|
|
51 |
|
|
$ |
298 |
|
|
|
11.2 |
% |
|
$ |
5.84 |
|
|
2022 |
|
|
899 |
|
|
|
68 |
|
|
|
391 |
|
|
|
14.7 |
% |
|
|
5.75 |
|
|
2023 |
|
|
876 |
|
|
|
61 |
|
|
|
368 |
|
|
|
13.8 |
% |
|
|
6.03 |
|
|
2024 |
|
|
759 |
|
|
|
57 |
|
|
|
361 |
|
|
|
13.5 |
% |
|
|
6.33 |
|
|
2025 |
|
|
558 |
|
|
|
50 |
|
|
|
328 |
|
|
|
12.3 |
% |
|
|
6.56 |
|
|
2026 |
|
|
351 |
|
|
|
38 |
|
|
|
242 |
|
|
|
9.1 |
% |
|
|
6.37 |
|
|
2027 |
|
|
171 |
|
|
|
22 |
|
|
|
144 |
|
|
|
5.4 |
% |
|
|
6.55 |
|
|
2028 |
|
|
104 |
|
|
|
15 |
|
|
|
108 |
|
|
|
4.1 |
% |
|
|
7.20 |
|
|
2029 |
|
|
95 |
|
|
|
18 |
|
|
|
119 |
|
|
|
4.5 |
% |
|
|
6.61 |
|
|
2030 |
|
|
73 |
|
|
|
17 |
|
|
|
117 |
|
|
|
4.4 |
% |
|
|
6.88 |
|
|
Thereafter |
|
|
76 |
|
|
|
25 |
|
|
|
186 |
|
|
|
7.0 |
% |
|
|
7.44 |
|
|
|
|
|
4,819 |
|
|
|
422 |
|
|
$ |
2,662 |
|
|
|
100.0 |
% |
|
$ |
6.31 |
|
|
Month to month |
|
|
121 |
|
|
|
4 |
|
|
|
|
|
|
|
|
|
|
|
|
|
|
Total consolidated |
|
|
4,940 |
|
|
|
426 |
|
|
|
|
|
|
|
|
|
|
|
|
|
|
(1) |
Dollars per square foot was calculated by dividing NER by the occupied square feet of the lease. |
22
CO-INVESTMENT VENTURES
Included in our O&M portfolio are consolidated and unconsolidated co-investment ventures that hold investments in real estate properties, primarily logistics facilities that we also manage. Our unconsolidated co-investment ventures are accounted for under the equity method. The amounts included for the unconsolidated ventures are reflected at 100% of the amount included in the ventures’ financial statements as calculated on a GAAP basis, not our proportionate share. The following table summarizes our consolidated and unconsolidated co-investment ventures at December 31, 2020 (in millions):
|
|
|
Operating Properties |
|
|
|
|
|
|
|
|
|
|||||
|
|
|
Square Feet |
|
|
Gross Book Value |
|
|
Investment in Land |
|
|
Development Portfolio – TEI |
|
||||
|
Consolidated Co-Investment Venture |
|
|
|
|
|
|
|
|
|
|
|
|
|
|
|
|
|
U.S.: |
|
|
|
|
|
|
|
|
|
|
|
|
|
|
|
|
|
Prologis U.S. Logistics Venture (“USLV”) |
|
|
78 |
|
|
$ |
7,772 |
|
|
$ |
12 |
|
|
$ |
21 |
|
|
Total |
|
|
78 |
|
|
$ |
7,772 |
|
|
$ |
12 |
|
|
$ |
21 |
|
|
|
|
|
|
|
|
|
|
|
|
|
|
|
|
|
|
|
|
Unconsolidated Co-Investment Ventures |
|
|
|
|
|
|
|
|
|
|
|
|
|
|
|
|
|
U.S.: |
|
|
|
|
|
|
|
|
|
|
|
|
|
|
|
|
|
Prologis Targeted U.S. Logistics Fund (“USLF”) |
|
|
117 |
|
|
$ |
10,987 |
|
|
$ |
43 |
|
|
$ |
37 |
|
|
Other Americas: |
|
|
|
|
|
|
|
|
|
|
|
|
|
|
|
|
|
FIBRA Prologis |
|
|
40 |
|
|
|
2,549 |
|
|
|
6 |
|
|
|
6 |
|
|
Prologis Brazil Logistics Venture ("PBLV") and other joint ventures |
|
|
11 |
|
|
|
507 |
|
|
|
47 |
|
|
|
188 |
|
|
Subtotal Other Americas |
|
|
51 |
|
|
|
3,056 |
|
|
|
53 |
|
|
|
194 |
|
|
Europe: |
|
|
|
|
|
|
|
|
|
|
|
|
|
|
|
|
|
Prologis European Logistics Fund (“PELF”) |
|
|
127 |
|
|
|
12,916 |
|
|
|
10 |
|
|
|
87 |
|
|
Prologis European Logistics Partners Sàrl (“PELP”) |
|
|
53 |
|
|
|
4,400 |
|
|
|
25 |
|
|
|
- |
|
|
Prologis UK Logistics Venture (“UKLV”) |
|
|
5 |
|
|
|
779 |
|
|
|
68 |
|
|
|
246 |
|
|
Subtotal Europe |
|
|
185 |
|
|
|
18,095 |
|
|
|
103 |
|
|
|
333 |
|
|
Asia: |
|
|
|
|
|
|
|
|
|
|
|
|
|
|
|
|
|
Nippon Prologis REIT (“NPR”) |
|
|
35 |
|
|
|
6,831 |
|
|
|
- |
|
|
|
- |
|
|
Prologis China Core Logistics Fund (“PCCLF”) |
|
|
25 |
|
|
|
2,128 |
|
|
|
- |
|
|
|
- |
|
|
Prologis China Logistics Venture |
|
|
7 |
|
|
|
376 |
|
|
|
13 |
|
|
|
1,276 |
|
|
Subtotal Asia |
|
|
67 |
|
|
|
9,335 |
|
|
|
13 |
|
|
|
1,276 |
|
|
Total |
|
|
420 |
|
|
$ |
41,473 |
|
|
$ |
212 |
|
|
$ |
1,840 |
|
|
|
|
|
|
|
|
|
|
|
|
|
|
|
|
|
|
|
For more information regarding our unconsolidated and consolidated co-investment ventures, see Notes 5 and 11 to the Consolidated Financial Statements in Item 8. Financial Statements and Supplementary Data.
ITEM 3. Legal Proceedings
From time to time, we and our co-investment ventures are parties to a variety of legal proceedings arising in the ordinary course of business. We believe that, with respect to any such matters to which we are currently a party, the ultimate disposition of any such matter will not result in a material adverse effect on our business, financial position or results of operations.
ITEM 4. Mine Safety Disclosures
Not Applicable.
PART II
ITEM 5. Market for Registrant’s Common Equity, Related Stockholder Matters and Issuer Purchases of Equity Securities
MARKET INFORMATION AND HOLDERS
Our common stock is listed on the NYSE under the symbol “PLD.”
Stock Performance Graph
The following line graph compares the change in Prologis, Inc. cumulative total stockholder’s return on shares of its common stock from December 31, 2015, to the cumulative total return of the S&P 500 Stock Index and the Financial Times and Stock Exchange NAREIT Equity REITs Index from December 31, 2015, to December 31, 2020. The graph assumes an initial investment of $100 in our common
23
stock and each of the indices on December 31, 2015, and, as required by the SEC, the reinvestment of all dividends. The return shown on the graph is not necessarily indicative of future performance.
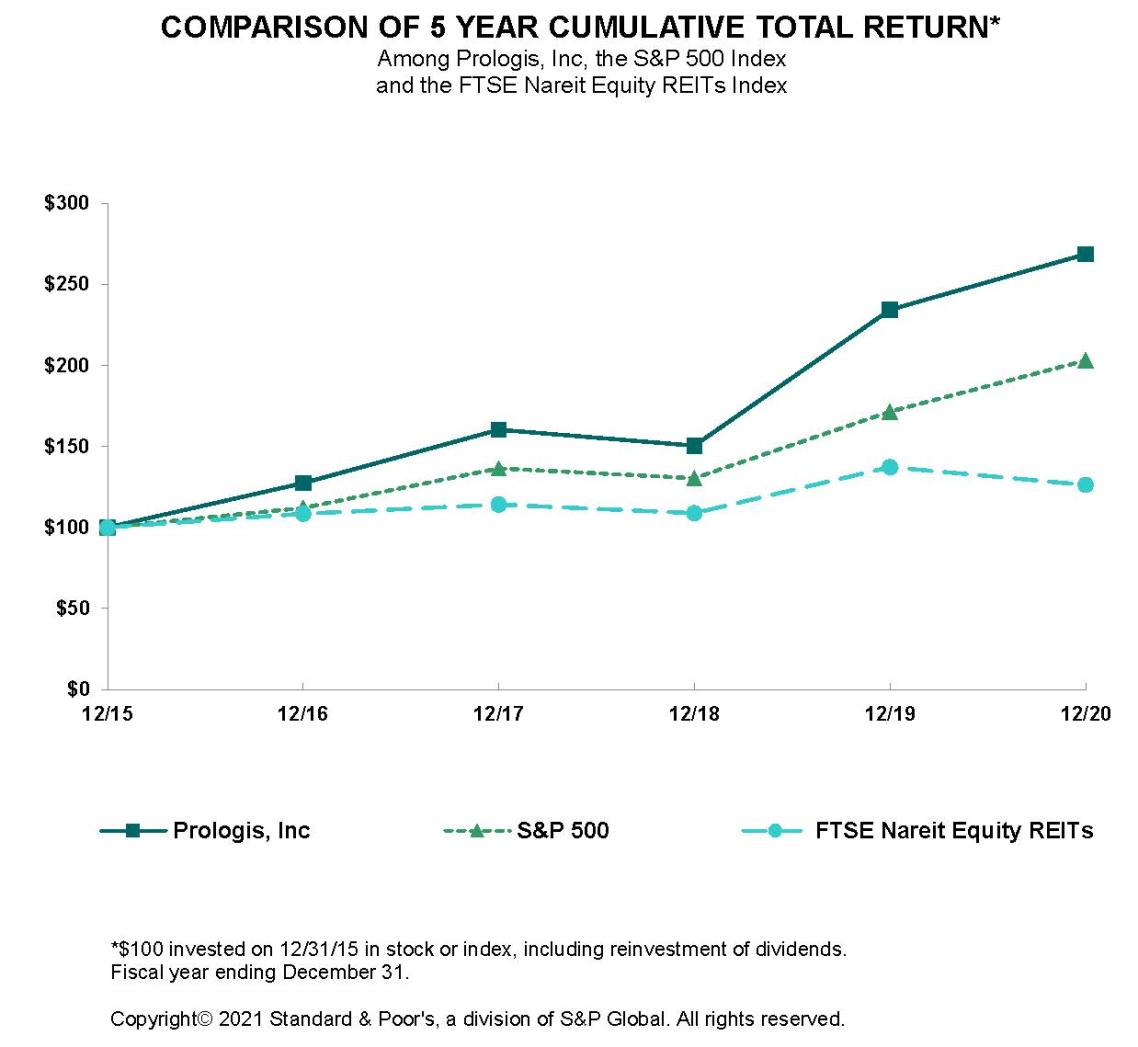
This graph and the accompanying text are not “soliciting material,” are not deemed filed with the SEC and are not to be incorporated by reference in any filing by the Company under the Securities Act of 1933, as amended, or the Securities Exchange Act of 1934, as amended, whether made before or after the date hereof and irrespective of any general incorporation language in any such filing.
PREFERRED STOCK DIVIDENDS
At December 31, 2020 and 2019, we had 1.3 million and 1.4 million shares of the Series Q preferred stock, respectively, with a liquidation preference of $50 per share that will be redeemable at our option on or after November 13, 2026. Dividends payable per share were $4.27 for the years ended December 31, 2020 and 2019.
For more information regarding dividends, see Note 9 to the Consolidated Financial Statements in Item 8. Financial Statements and Supplementary Data.
SALES OF UNREGISTERED SECURITIES
During 2020, we issued 0.7 million shares of common stock of Prologis, Inc. in connection with the redemption of common units of Prologis, L.P. and 0.5 million common units of Prologis, L.P. in connection with the acquisition of properties (see Note 11 to the Consolidated Financial Statements in Item 8. Financial Statements and Supplementary Data) in reliance on the exemption from registration requirements of the Securities Act of 1933, as amended, afforded by Section 4(a)(2) thereof.
24
PURCHASES OF EQUITY SECURITIES
The table below sets forth the information with respect to purchases by Prologis, Inc. of its common stock during the year ended December 31, 2020:
|
Period |
Total Number of Shares Purchased (1) |
|
|
Average Price Paid per Share (2) |
|
|
Total Number of Shares Purchased as Part of Publicly Announced Plan (3) |
|
|
Approximate Dollar Value of Shares that May Yet Be Purchased Under the Plan (in millions) (4) |
|
||||
|
January 1 – January 31 |
|
- |
|
|
$ |
- |
|
|
|
- |
|
|
$ |
- |
|
|
February 1 – February 29 |
|
- |
|
|
|
- |
|
|
|
- |
|
|
|
- |
|
|
March 1 – March 31 |
|
539,000 |
|
|
|
64.66 |
|
|
|
539,000 |
|
|
|
965 |
|
|
April 1 – April 30 |
|
- |
|
|
|
- |
|
|
|
- |
|
|
|
- |
|
|
May 1 – May 31 |
|
- |
|
|
|
- |
|
|
|
- |
|
|
|
- |
|
|
June 1 – June 30 |
|
- |
|
|
|
- |
|
|
|
- |
|
|
|
- |
|
|
July 1 – July 31 |
|
- |
|
|
|
- |
|
|
|
- |
|
|
|
- |
|
|
August 1 – August 31 |
|
- |
|
|
|
- |
|
|
|
- |
|
|
|
- |
|
|
September 1 – September 30 |
|
- |
|
|
|
- |
|
|
|
- |
|
|
|
- |
|
|
October 1 – October 31 |
|
- |
|
|
|
- |
|
|
|
- |
|
|
|
- |
|
|
November 1 – November 30 |
|
- |
|
|
|
- |
|
|
|
- |
|
|
|
- |
|
|
December 1 – December 31 |
|
- |
|
|
|
- |
|
|
|
- |
|
|
|
- |
|
|
Total |
|
539,000 |
|
|
$ |
64.66 |
|
|
|
539,000 |
|
|
$ |
965 |
|
|
(1) |
In March 2020, the Board of Directors authorized a new share purchase program to repurchase up to $1.0 billion of common stock on the open market or in privately negotiated transactions. This column primarily represents open market share repurchases. |
|
(2) |
Average price paid per share is a weighted average calculation using the aggregate price, excluding commissions and fees. |
|
(3) |
The aggregate value of shares purchased in the year ended December 31, 2020 as part of the publicly announced plan was $35 million. |
|
(4) |
As of February 5, 2021, $965 million in share repurchase authorization remained. There is no scheduled expiration date for the program, but the program may be discontinued at any time. |
SECURITIES AUTHORIZED FOR ISSUANCE UNDER EQUITY COMPENSATION PLANS
For information regarding securities authorized for issuance under our equity compensation plans, see Notes 9 and 12 to the Consolidated Financial Statements in Item 8. Financial Statements and Supplementary Data.
OTHER STOCKHOLDER MATTERS
Common Stock Plans
Further information relative to our equity compensation plans will be provided in our 2021 Proxy Statement or in an amendment filed on Form 10-K/A.
ITEM 6. Selected Financial Data
None.
ITEM 7. Management’s Discussion and Analysis of Financial Condition and Results of Operations
The following discussion should be read in conjunction with the Consolidated Financial Statements included in Item 8. Financial Statements and Supplementary Data of this report and the matters described under Item 1A. Risk Factors.
A discussion regarding our financial condition and results of operations for 2020 compared to 2019 is presented below. Information on 2018 is included in graphs only to show year over year trends in our results of operations and operating metrics. Our financial condition for 2018 and results of operations for 2018 and 2019 compared to 2018 can be found under Item 7. Management’s Discussion and Analysis of Financial Condition and Results of Operations, which is incorporated by reference herein to our Annual Report on Form 10-K for the fiscal year ended December 31, 2019, filed with the SEC on February 11, 2020, and is available on the SEC’s website at www.sec.gov and our Investor Relations website at www.ir.prologis.com.
25
MANAGEMENT’S OVERVIEW
Summary of 2020
Our financial condition and operating results remain strong in the COVID-19 environment and, in combination with the demand we see in our proprietary data, the pace of rent collections and dialogue with our customers, our outlook continues to improve in the first quarter of 2021. However, with the continued uncertainty across the globe until we put COVID-19 behind us, we cannot predict the impact on our business, future financial condition, and operating results.
We experienced minimal impacts from the current environment on our O&M portfolio operating fundamentals in 2020. This is the result of the high quality and location of our real estate portfolio, our customer base, favorable market fundamentals in the logistics real estate sector and significant in-place-to-market rent spreads. E-commerce continues to grow well above its historical average and customers that serve essential daily needs are thriving. Customers that have been negatively impacted by the current economy represent a minimal percentage of our annual rent. Leasing activity remained strong for the O&M portfolio throughout 2020 with the commencement of 150 million square feet of leases with an average term of 66 months, including 37 million square feet in the fourth quarter. Rent change in our O&M portfolio was 21.3% during 2020 and 23.8% in the fourth quarter. We expect market rents to continue to increase in 2021. The average number of days from lease proposal to commencement decreased since 2019 as some customers have increased the pace of activity.
We received requests from certain customers for rent concessions during 2020 and for those granted, we deferred the rental payments to a later period in 2020 or 2021. The deferral of rental payments did not impact revenue recognized from those leases. During 2020, on an O&M basis we deferred $45 million of rental payments which represented less than 1% of our total O&M annualized rental revenue. At January 25, 2021, we had collected $33 million, or 98%, of the deferred payments due at December 31st, with the remainder due in 2021. Although COVID-19 continues to have a minimal impact on our rent collections and bad debt is trending lower than we initially anticipated, we may experience an increase in bad debt.
Our capital deployment and disposition activities have continued throughout this time and we expect the volume of these activities to accelerate in 2021. By the fourth quarter of 2020, we restarted the majority of the speculative development projects that we suspended in the first quarter.
Our business continuity, communication plans and technology are allowing all functions of our business to work smoothly during this time. Generally, our employees have continued working remotely or in certain locations in our offices under protocols to keep a safe working environment. We have not had any lay-offs and we have extended financial assistance to employees in need. Our local property and leasing teams have continued to maintain our properties and work with our customers to help them navigate the new environment while following established measures to help keep them and our customers safe. In addition, we are providing assistance across the globe in the form of direct cash grants, supplies and donation of over one million square feet through our Space for Good program. In 2020, through the Prologis Foundation, we pledged $5 million to COVID-19 relief organizations and $1 million in support of racial equality causes.
We completed the following significant activities in 2020 as described in the Notes to the Consolidated Financial Statements:
|
• |
In January, our U.S. co-investment ventures, USLV and USLF, acquired the wholly owned real estate assets of IPT for $2.0 billion each, including the assumption and repayment of debt. As USLV is a consolidated co-investment venture, our Results of Operations section includes a discussion of the acquired properties. USLF is an unconsolidated co-investment venture and therefore the acquisition is included in the discussion of our O&M Operating Portfolio. |
|
• |
In February, we completed the Liberty Transaction for $13.0 billion through the issuance of equity and the assumption of debt. We assumed $2.8 billion of debt with a weighted average stated interest rate of 3.8%. We paid down $1.8 billion of the assumed debt with senior notes we issued at lower rates in February 2020, as detailed below. |
|
• |
We earned promotes aggregating $241 million ($164 million net of related expenses), primarily in June from our unconsolidated co-investment venture in the U.S. |
|
• |
We generated net proceeds of $3.0 billion and realized net gains of $717 million, principally from the contribution of properties to our unconsolidated co-investment ventures in the U.S., Europe, Mexico and Japan and dispositions to third parties in the U.S. and Europe, including a majority of the U.K. portfolio acquired in the Liberty Transaction. |
26
|
• |
Additionally, we completed the following consolidated financing activities that included the issuance of $6.2 billion and redemption of $3.0 billion of senior notes, with aggregate principal in U.S. dollars. This resulted in extending our weighted average remaining maturity to 10 years and lowering our weighted average effective interest rate to approximately 1.9% (principal in millions): |
|
|
|
|
Aggregate Principal |
|
|
Issuance Date Weighted Average |
|
|
|
||||||||||
|
|
Initial Borrowing Date |
|
Borrowing Currency |
|
|
USD (1) |
|
|
Interest Rate (2) |
|
|
Term (3) |
|
|
Maturity Dates |
||||
|
|
February (4) |
|
€ |
1,350 |
|
|
$ |
1,485 |
|
|
0.6% |
|
|
10.7 |
|
|
February 2022 – 2035 |
||
|
|
February |
|
$ |
2,200 |
|
|
$ |
2,200 |
|
|
2.4% |
|
|
|
15.0 |
|
|
April 2027 – 2050 |
|
|
|
February |
|
£ |
250 |
|
|
$ |
322 |
|
|
1.9% |
|
|
|
15.8 |
|
|
February 2035 |
|
|
|
June (4) |
|
¥ |
41,200 |
|
|
$ |
386 |
|
|
1.0% |
|
|
|
12.4 |
|
|
June 2027 – 2050 |
|
|
|
August (4) |
|
$ |
1,250 |
|
|
$ |
1,250 |
|
|
1.6% |
|
|
|
18.2 |
|
|
October 2030 – 2050 |
|
|
|
September |
|
¥ |
19,700 |
|
|
$ |
187 |
|
|
1.0% |
|
|
|
14.1 |
|
|
September 2032 – 2040 |
|
|
|
December |
|
€ |
300 |
|
|
$ |
365 |
|
|
0.0% |
|
|
|
2.0 |
|
|
December 2022 |
|
|
|
|
|
|
|
|
|
|
|
|
|
|
|
|
|
|
|
|
|
|
|
|
|
|
Aggregate Principal |
|
|
Redemption Date Weighted Average |
|
|
|
||||||||||
|
|
Redemption Date |
|
Borrowing Currency |
|
|
USD (1) |
|
|
Interest Rate (2) |
|
|
Term (3) |
|
|
Maturity Date |
||||
|
|
January |
|
€ |
400 |
|
|
$ |
446 |
|
|
0.0% |
|
|
0.1 |
|
|
January 2020 |
||
|
|
March |
|
€ |
700 |
|
|
$ |
783 |
|
|
1.4% |
|
|
1.2 |
|
|
May 2021 |
||
|
|
June |
|
€ |
213 |
|
|
$ |
238 |
|
|
3.0% |
|
|
1.6 |
|
|
January 2022 |
||
|
|
June |
|
€ |
100 |
|
|
$ |
113 |
|
|
3.4% |
|
|
3.6 |
|
|
February 2024 |
||
|
|
September |
|
$ |
850 |
|
|
$ |
850 |
|
|
4.3% |
|
|
2.9 |
|
|
August 2023 |
||
|
|
December |
|
€ |
485 |
|
|
$ |
596 |
|
|
3.0% |
|
|
1.1 |
|
|
January 2022 |
||
|
|
(1) |
The exchange rate used to calculate into U.S. dollars was the spot rate at the settlement date. |
|
|
(2) |
The interest rate represents the fixed or variable interest rate at the issuance or redemption date of the related debt. |
|
|
(3) |
The issuance date and redemption date weighted average term represent the remaining maturity in years on the related debt at the issuance or redemption date, respectively. |
|
|
(4) |
Approximately $1.5 billion of the proceeds from the issuance of these notes were to fund sustainable and environmentally beneficial projects and buildings in accordance with our green bond framework. |
In February 2020, we completed an exchange offer for two series of Liberty’s senior notes for an aggregate amount of $750 million, with $690 million, or 92.0%, of the aggregate principal amount being validly tendered for exchange. These senior notes are included in the aggregate principal amounts of $400 million due in October 2026 with an interest rate of 3.3% and $350 million due in February 2029 with an interest rate of 4.4%. The senior notes were exchanged for notes issued by a wholly owned subsidiary and guaranteed by the OP. All other terms of the exchanged Liberty senior notes remained substantially the same.
At December 31, 2020, we had total available liquidity of $4.8 billion, principally due to current aggregate availability under our credit facilities of $3.9 billion and unrestricted cash balances of $598 million.
RESULTS OF OPERATIONS
We evaluate our business operations based on the NOI of our two operating segments: Real Estate Operations and Strategic Capital. NOI by segment is a non-GAAP performance measure that is calculated using revenues and expenses directly from our financial statements. We consider NOI by segment to be an appropriate supplemental measure of our performance because it helps management and investors understand our operating results.
27
Below is a reconciliation of our NOI by segment to Operating Income per the Consolidated Financial Statements (in millions). Each segment’s NOI is reconciled to a line item in the Consolidated Financial Statements in their respective segment discussions below.
|
|
|
2020 |
|
|
2019 |
|
||
|
Real Estate Operations – NOI |
|
$ |
2,820 |
|
|
$ |
2,091 |
|
|
Strategic Capital – NOI |
|
|
419 |
|
|
|
307 |
|
|
General and administrative expenses |
|
|
(275 |
) |
|
|
(266 |
) |
|
Depreciation and amortization expenses |
|
|
(1,562 |
) |
|
|
(1,140 |
) |
|
Operating income before gains on real estate transactions, net |
|
|
1,402 |
|
|
|
992 |
|
|
Gains on dispositions of development properties and land, net |
|
|
465 |
|
|
|
468 |
|
|
Gains on other dispositions of investments in real estate, net |
|
|
252 |
|
|
|
390 |
|
|
Operating income |
|
$ |
2,119 |
|
|
$ |
1,850 |
|
|
|
|
|
|
|
|
|
|
|
See Note 17 to the Consolidated Financial Statements for more information on our segments and a reconciliation of each business segment’s NOI to Operating Income and Earnings Before Income Taxes.
Real Estate Operations
This operating segment principally includes rental revenue and rental expenses recognized from our consolidated properties. We allocate the costs of our property management and leasing functions to the Real Estate Operations segment through Rental Expenses and the Strategic Capital segment through Strategic Capital Expenses based on the square footage of the relative portfolios. In addition, this segment is impacted by our development, acquisition and disposition activities.
Below are the components of Real Estate Operations revenues, expenses and NOI (in millions), derived directly from the Consolidated Financial Statements.
|
|
|
2020 |
|
|
2019 |
|
||
|
Rental revenues |
|
$ |
3,791 |
|
|
$ |
2,832 |
|
|
Development management and other revenues |
|
|
11 |
|
|
|
6 |
|
|
Rental expenses |
|
|
(952 |
) |
|
|
(734 |
) |
|
Other expenses |
|
|
(30 |
) |
|
|
(13 |
) |
|
Real Estate Operations – NOI |
|
$ |
2,820 |
|
|
$ |
2,091 |
|
The change in Real Estate Operations NOI in 2020 compared to 2019 was impacted by the following items (dollars in millions):
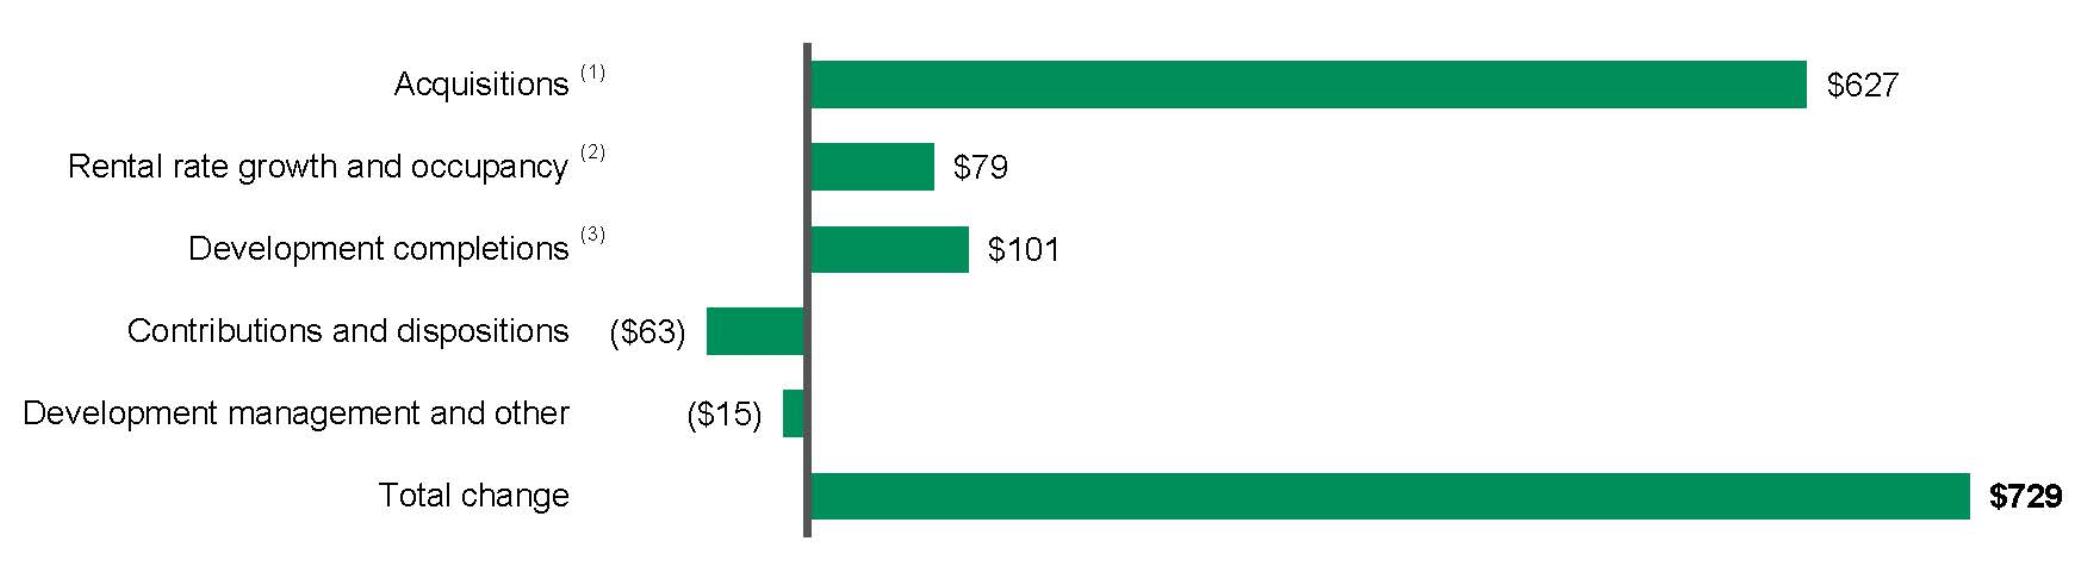
|
(1) |
Acquisition activity increased NOI in 2020, compared to 2019, principally due to the IPT Transaction and the Liberty Transaction. |
|
(2) |
During both years, we experienced positive rental rate growth. Rental rate growth is a combination of higher rental rates on rollover of leases (or rent change) and contractual rent increases on existing leases. If a lease has a contractual rent increase driven by a metric that is not known at the time the lease commences, such as the consumer price index or a similar metric, the rent increase is not included in rent leveling and therefore, impacts the rental revenue we recognize. See below for key metrics on rent change on rollover and occupancy for the consolidated operating portfolio. |
|
(3) |
We calculate changes in NOI from development completions period over period by comparing the change in NOI generated on the pool of developments that completed on or after January 1, 2019 through December 31, 2020. |
28
Below are key operating metrics of our consolidated operating portfolio, which excludes non-strategic industrial properties.
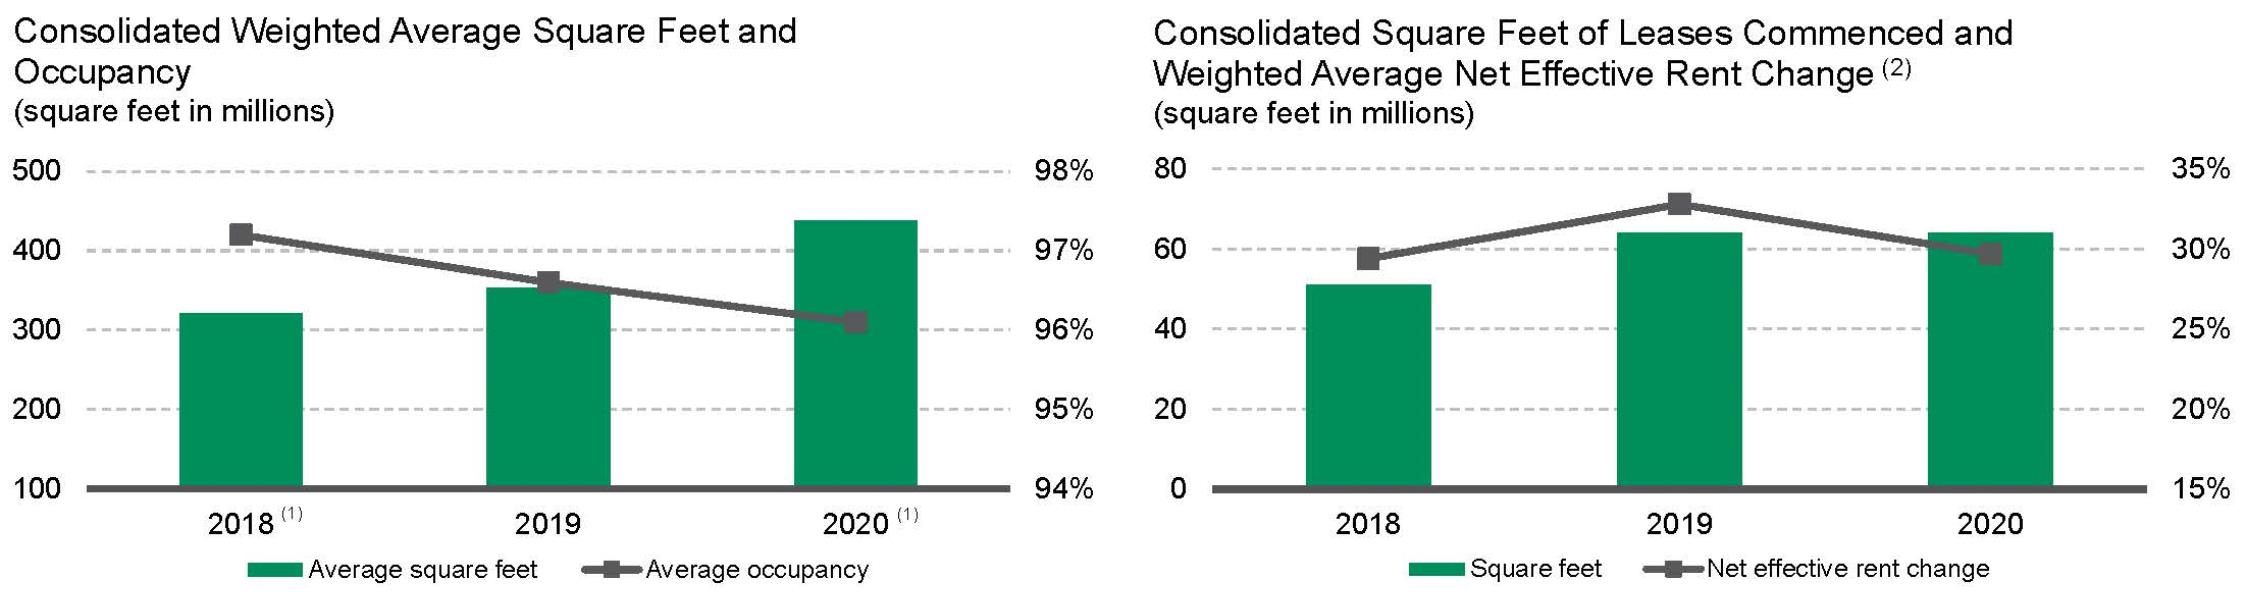
|
(1) |
In August 2018, we completed the acquisition of DCT Industrial Trust Inc. and DCT Industrial Operating Partnership LP (collectively “DCT” or the “DCT Transaction”) and acquired a portfolio of logistics real estate assets aggregating 68 million square feet. In January and February 2020, we completed the IPT Transaction and the Liberty Transaction, respectively. |
|
(2) |
Consolidated square feet of leases commenced and weighted average net effective rent change were calculated for leases with initial terms of one year or greater. |
Development Activity
The following table summarizes consolidated development activity (dollars and square feet in millions):
|
|
|
2020 |
|
|
2019 |
|
||
|
Starts: |
|
|
|
|
|
|
|
|
|
Number of new development projects during the period |
|
|
42 |
|
|
|
74 |
|
|
Square feet |
|
|
14 |
|
|
|
25 |
|
|
TEI |
|
$ |
1,997 |
|
|
$ |
2,741 |
|
|
Percentage of build-to-suits based on TEI |
|
|
40.0 |
% |
|
|
44.0 |
% |
|
|
|
|
|
|
|
|
|
|
|
Stabilizations: |
|
|
|
|
|
|
|
|
|
Number of development projects stabilized during the period |
|
|
66 |
|
|
|
72 |
|
|
Square feet |
|
|
23 |
|
|
|
26 |
|
|
TEI |
|
$ |
2,451 |
|
|
$ |
2,422 |
|
|
Percentage of build-to-suits based on TEI |
|
|
48.9 |
% |
|
|
36.9 |
% |
|
Weighted average stabilized yield (1) |
|
|
6.3 |
% |
|
|
6.3 |
% |
|
Estimated value at completion |
|
$ |
3,383 |
|
|
$ |
3,313 |
|
|
Estimated weighted average margin |
|
|
38.0 |
% |
|
|
36.8 |
% |
|
(1) |
We calculate the weighted average stabilized yield as estimated NOI assuming stabilized occupancy divided by TEI. |
In the first quarter of 2020, we suspended several recently started speculative development projects for the short-term. Most of the suspended projects were restarted by the fourth quarter of 2020. At December 31, 2020, the outstanding suspended development projects had a TEI of $82 million and remain within our consolidated development portfolio. The remaining active consolidated development portfolio, including properties under development and prestabilized properties, is expected to be completed before August 2022 with a TEI of $3.7 billion, leaving $1.8 billion remaining to be spent, and was 61.6% leased. We expect our development activities to accelerate in 2021. For additional information on our development portfolio at December 31, 2020, see Item 2. Properties.
29
Capital Expenditures
We capitalize costs incurred in renovating, improving and leasing our operating properties as part of the investment basis or within other assets. The following graph summarizes our total capital expenditures, excluding development costs, and property improvements per average square foot of our consolidated operating properties during each year:
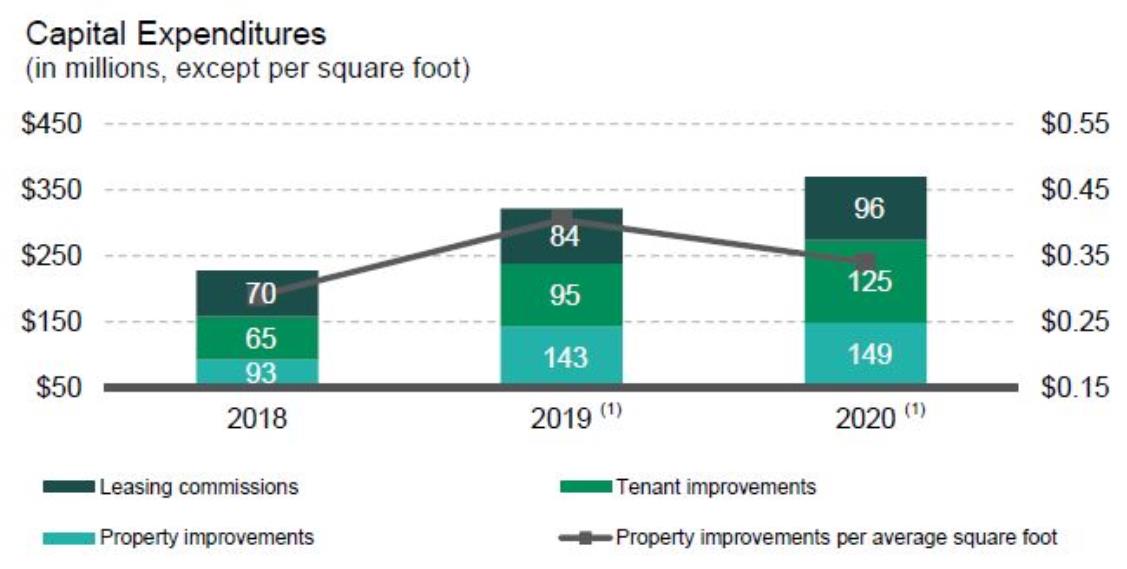
|
(1) |
Our capital expenditures have increased due to our larger portfolio as a result of acquisition activity discussed above. |
Strategic Capital
This operating segment includes revenues from asset and property management, other fees for services performed and promote revenue earned from the unconsolidated entities. Revenues associated with the Strategic Capital segment fluctuate because of changes in the size of the portfolios through acquisitions and dispositions, the fair value of the properties and other transactional activity including foreign currency exchange rates and timing of promotes. These revenues are reduced by the direct costs associated with the asset and property-level management expenses for the properties owned by these ventures. We allocate the costs of our property management and leasing functions to the Strategic Capital segment through Strategic Capital Expenses and to the Real Estate Operations segment through Rental Expenses based on the square footage of the relative portfolios.
Below are the components of Strategic Capital revenues, expenses and NOI, derived directly from the Consolidated Financial Statements (in millions):
|
|
|
2020 |
|
|
2019 |
|
||
|
Strategic capital revenues |
|
$ |
637 |
|
|
$ |
492 |
|
|
Strategic capital expenses |
|
|
(218 |
) |
|
|
(185 |
) |
|
Strategic Capital – NOI |
|
$ |
419 |
|
|
$ |
307 |
|
|
|
|
|
|
|
|
|
|
|
Below is additional detail of our Strategic Capital revenues, expenses and NOI (in millions):
|
|
|
U.S. (1) |
Other Americas |
Europe |
Asia |
Total |
|||||||||||||||||||||||||||||||||||
|
|
|
2020 |
|
|
2019 |
|
|
2020 |
|
|
2019 |
|
|
2020 |
|
|
2019 |
|
|
2020 |
|
|
2019 |
|
|
2020 |
|
|
2019 |
|
|
||||||||||
|
Strategic capital revenues ($) |
|
|
|
|
|
|
|
|
|
|
|
|
|
|
|
|
|
|
|
|
|
|
|
|
|
|
|
|
|
|
|
|
|
|
|
|
|
|
|
|
|
|
Recurring fees (2) |
|
|
111 |
|
|
|
75 |
|
|
|
32 |
|
|
|
31 |
|
|
|
120 |
|
|
|
106 |
|
|
|
68 |
|
|
|
56 |
|
|
|
331 |
|
|
|
268 |
|
|
|
Transactional fees (3) |
|
|
16 |
|
|
|
11 |
|
|
|
5 |
|
|
|
5 |
|
|
|
20 |
|
|
|
17 |
|
|
|
26 |
|
|
|
25 |
|
|
|
67 |
|
|
|
58 |
|
|
|
Promote revenue (4) |
|
|
228 |
|
|
|
- |
|
|
|
1 |
|
|
|
5 |
|
|
|
5 |
|
|
|
161 |
|
|
|
5 |
|
|
|
- |
|
|
|
239 |
|
|
|
166 |
|
|
|
Total strategic capital revenues ($) |
|
|
355 |
|
|
|
86 |
|
|
|
38 |
|
|
|
41 |
|
|
|
145 |
|
|
|
284 |
|
|
|
99 |
|
|
|
81 |
|
|
|
637 |
|
|
|
492 |
|
|
|
Strategic capital expenses ($) (4) |
|
|
(118 |
) |
|
|
(97 |
) |
|
|
(13 |
) |
|
|
(14 |
) |
|
|
(45 |
) |
|
|
(38 |
) |
|
|
(42 |
) |
|
|
(36 |
) |
|
|
(218 |
) |
|
|
(185 |
) |
|
|
Strategic Capital - NOI ($) |
|
|
237 |
|
|
|
(11 |
) |
|
|
25 |
|
|
|
27 |
|
|
|
100 |
|
|
|
246 |
|
|
|
57 |
|
|
|
45 |
|
|
|
419 |
|
|
|
307 |
|
|
|
|
|
|
|
|
|
|
|
|
|
|
|
|
|
|
|
|
|
|
|
|
|
|
|
|
|
|
|
|
|
|
|
|
|
|
|
|
|
|
|
|
|
|
(1) |
The U.S. expenses include compensation, personnel costs and PPP awards for employees who were based in the U.S. but also support other geographies. |
|
(2) |
Recurring fees include asset and property management fees. The increase in the U.S. is primarily due to the IPT Transaction. |
|
(3) |
Transactional fees include leasing commissions and acquisition, disposition, development and other fees. |
|
(4) |
We generally earn promote revenue directly from third-party investors in the co-investment ventures based on cumulative returns over a three-year period. Approximately 40% of the promote earned by us is paid to our employees as a combination of cash and stock awards pursuant to the terms of the PPP and expensed through Strategic Capital Expenses, as vested. For discussion on PPP awards, see Note 12 to the Consolidated Financial Statements. |
30
The following real estate investments were held through our unconsolidated co-investment ventures based on the historical cost at December 31 (dollars and square feet in millions):
|
|
|
U.S. |
Other Americas (1) |
Europe |
Asia |
Total |
|
|||||||||||||||||||||||||||||||||
|
|
|
2020 |
|
|
2019 |
|
|
2020 |
|
|
2019 |
|
|
2020 |
|
|
2019 |
|
|
2020 |
|
|
2019 |
|
|
2020 |
|
|
2019 |
|
||||||||||
|
Ventures |
|
|
1 |
|
|
|
1 |
|
|
|
2 |
|
|
|
2 |
|
|
|
3 |
|
|
|
3 |
|
|
|
3 |
|
|
|
3 |
|
|
|
9 |
|
|
|
9 |
|
|
Operating properties |
|
|
706 |
|
|
|
605 |
|
|
|
229 |
|
|
|
214 |
|
|
|
768 |
|
|
|
731 |
|
|
|
167 |
|
|
|
144 |
|
|
|
1,870 |
|
|
|
1,694 |
|
|
Square feet |
|
|
117 |
|
|
|
99 |
|
|
|
51 |
|
|
|
44 |
|
|
|
185 |
|
|
|
176 |
|
|
|
67 |
|
|
|
59 |
|
|
|
420 |
|
|
|
378 |
|
|
Total assets ($) (2) |
|
|
10,840 |
|
|
|
8,408 |
|
|
|
3,023 |
|
|
|
2,707 |
|
|
|
16,918 |
|
|
|
14,677 |
|
|
|
10,209 |
|
|
|
8,758 |
|
|
|
40,990 |
|
|
|
34,550 |
|
|
|
|
|
|
|
|
|
|
|
|
|
|
|
|
|
|
|
|
|
|
|
|
|
|
|
|
|
|
|
|
|
|
|
|
|
|
|
|
|
|
|
|
(1) |
PBLV and our other Brazilian joint ventures are combined as one venture for the purpose of this table. |
|
(2) |
The increase in total assets across all geographies was principally due to acquisitions, including IPT in the U.S., and movement in foreign currency exchange rates. |
See Note 5 to the Consolidated Financial Statements for additional information on our unconsolidated co-investment ventures.
G&A Expenses
G&A expenses were $275 million and $266 million for 2020 and 2019, respectively. Included in 2020 was a contribution of $5 million to the Prologis Foundation for donations to COVID-19 relief organizations. We capitalize certain internal costs, including salaries and related expenses, directly related to our development activities.
The following table summarizes capitalized G&A amounts (in millions):
|
|
|
2020 |
|
|
2019 |
|
||
|
Building and land development activities |
|
$ |
73 |
|
|
$ |
68 |
|
|
Operating building improvements and other |
|
|
23 |
|
|
|
20 |
|
|
Total capitalized G&A expenses |
|
$ |
96 |
|
|
$ |
88 |
|
|
Capitalized salaries and related costs as a percent of total salaries and related costs |
|
|
20.2 |
% |
|
|
19.5 |
% |
Depreciation and Amortization Expenses
Depreciation and amortization expenses were $1.6 billion and $1.1 billion for 2020 and 2019, respectively.
The following table highlights the key changes in depreciation and amortization expenses in 2020 as compared to 2019 (dollars in millions):
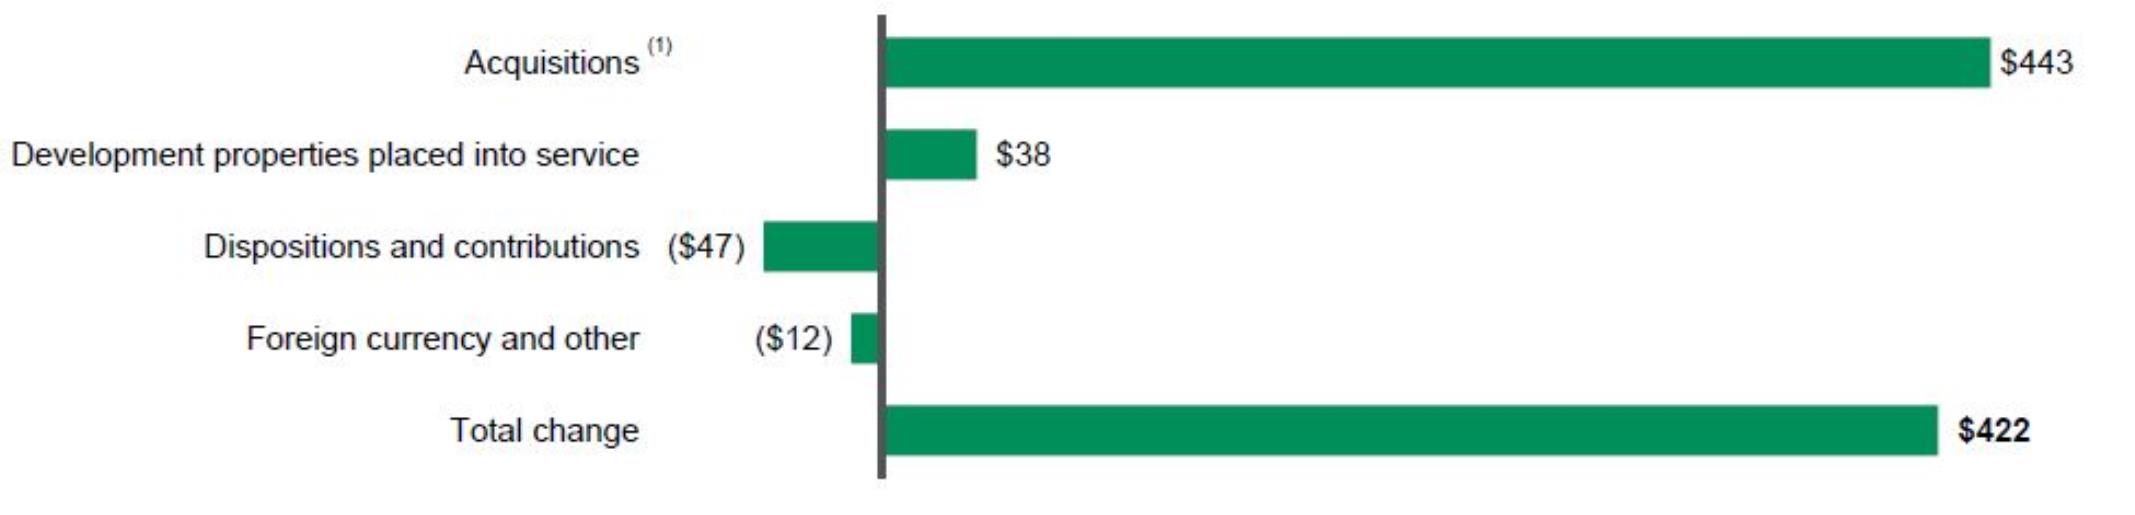
|
(1) |
Included in acquisitions are the operating properties, other real estate properties and related lease intangible assets acquired in the Liberty Transaction and the IPT Transaction. |
31
Gains on Real Estate Transactions, Net
The following table summarizes our Gains on Dispositions of Development Properties and Land, Net, which primarily includes contributions to our unconsolidated entities, and Gains on Other Dispositions of Investments in Real Estate, Net, which includes sales of operating properties and other real estate transactions, for the years ended December 31 (in millions):
|
|
|
2020 |
|
|
2019 |
|
||
|
Gains on dispositions of development properties and land, net |
|
|
|
|
|
|
|
|
|
Contributions to unconsolidated entities and dispositions to third parties |
|
$ |
465 |
|
|
$ |
468 |
|
|
Total gains on dispositions of development properties and land, net |
|
$ |
465 |
|
|
$ |
468 |
|
|
|
|
|
|
|
|
|
|
|
|
Gains on other dispositions of investments in real estate, net |
|
|
|
|
|
|
|
|
|
Contributions to unconsolidated entities and dispositions to third parties |
|
$ |
252 |
|
|
$ |
255 |
|
|
Gains on partial redemption of investment in an unconsolidated co-investment venture |
|
|
- |
|
|
|
135 |
|
|
Total gains on other dispositions of investments in real estate, net |
|
$ |
252 |
|
|
$ |
390 |
|
We utilized the proceeds from these transactions primarily to fund our capital investments during both periods. See Note 4 to the Consolidated Financial Statements for further information on these transactions.
Our Owned and Managed (“O&M”) Operating Portfolio
We manage our business and review our operating fundamentals on an O&M basis, which includes properties wholly owned by us or owned by one of our co-investment ventures. We believe reviewing the fundamentals this way allows management to understand the entire impact to the financial statements, as it will affect both the Real Estate Operations and Strategic Capital segments, as well as the net earnings we recognize from our unconsolidated co-investment ventures based on our ownership. We do not control the unconsolidated co-investment ventures for purposes of GAAP and the presentation of the ventures’ operating information does not represent a legal claim.
Our O&M operating portfolio does not include our development portfolio, value-added properties, non-industrial properties or properties we do not have the intent to hold long-term that are classified as either held for sale or within other real estate investments. Value-added properties are properties that are expected to be repurposed or redeveloped to a higher and better use and recently acquired properties that present opportunities to create greater value. See below for information on our O&M operating portfolio at December 31 (square feet in millions):
|
|
2020 |
|
|
2019 |
|
||||||||||||||||||
|
|
Number of Properties |
|
|
Square Feet |
|
|
Percentage Occupied |
|
|
Number of Properties |
|
|
Square Feet |
|
|
Percentage Occupied |
|
||||||
|
Consolidated |
|
2,252 |
|
|
|
441 |
|
|
|
96.6 |
% |
|
|
1,882 |
|
|
|
359 |
|
|
|
96.1 |
% |
|
Unconsolidated |
|
1,849 |
|
|
|
416 |
|
|
|
95.9 |
% |
|
|
1,676 |
|
|
|
376 |
|
|
|
96.8 |
% |
|
Total |
|
4,101 |
|
|
|
857 |
|
|
|
96.2 |
% |
|
|
3,558 |
|
|
|
735 |
|
|
|
96.5 |
% |
32
Below are the key operating metrics summarizing the leasing activity of our O&M operating portfolio.

|
(1) |
Square feet of leases commenced and weighted average net effective rent change were calculated for leases with initial terms of one year or greater. We retained more than 70% of our customers, based on the total square feet of leases commenced, for each year. |
|
(2) |
Turnover costs include external leasing commissions and tenant improvements and represent the obligations incurred in connection with the lease commencement for leases greater than one year. In 2020 and 2019, turnover costs per square foot increased, however, due to the longer terms and higher rents on leases commenced, this resulted in a lower cost as a percentage of lease value. |
Same Store Analysis
Our same store metrics are non-GAAP financial measures, which are commonly used in the real estate industry and expected from the financial community, on both a net effective and cash basis. We evaluate the performance of the operating properties we own and manage using a “same store” analysis because the population of properties in this analysis is consistent from period to period, which allows us and investors to analyze our ongoing business operations. We determine our same store metrics on property NOI, which is calculated as rental revenue less rental expense for the applicable properties in the same store population for both consolidated and unconsolidated properties based on our ownership interest, as further defined below.
We define our same store population for the three months ended December 31, 2020 as the properties in our O&M operating portfolio, including the property NOI for both consolidated properties and properties owned by the unconsolidated co-investment ventures at January 1, 2019 and owned throughout the same three-month period in both 2019 and 2020. We believe the drivers of property NOI for the consolidated portfolio are generally the same for the properties owned by the ventures in which we invest and therefore we evaluate the same store metrics of the O&M portfolio based on Prologis’ ownership in the properties (“Prologis Share”). The same store population excludes properties held for sale to third parties, along with development properties that were not stabilized at the beginning of the period (January 1, 2019) and properties acquired or disposed of to third parties during the period. To derive an appropriate measure of period-to-period operating performance, we remove the effects of foreign currency exchange rate movements by using the reported period-end exchange rate to translate from local currency into the U.S. dollar, for both periods.
As non-GAAP financial measures, the same store metrics have certain limitations as an analytical tool and may vary among real estate companies. As a result, we provide a reconciliation of Rental Revenues less Rental Expenses (“Property NOI”) (from our Consolidated Financial Statements prepared in accordance with U.S. GAAP) to our Same Store Property NOI measures.
We evaluate the results of our same store portfolio on a quarterly basis. The following is a reconciliation of our consolidated rental revenues, rental expenses and property NOI for each quarter in 2020 and 2019 to the full year, as included in the Consolidated Statements of Income and within Note 19 to the Consolidated Financial Statements and to the respective amounts in our same store portfolio analysis for the three months ended December 31 (dollars in millions):
|
|
|
Three Months Ended |
|
|
|
|
|
|||||||||||||
|
|
|
March 31, |
|
|
June 30, |
|
|
September 30, |
|
|
December 31, |
|
|
Full Year |
|
|||||
|
2020 |
|
|
|
|
|
|
|
|
|
|
|
|
|
|
|
|
|
|
|
|
|
Rental revenues |
|
$ |
879 |
|
|
$ |
944 |
|
|
$ |
980 |
|
|
$ |
988 |
|
|
$ |
3,791 |
|
|
Rental expenses |
|
|
(228 |
) |
|
|
(232 |
) |
|
|
(245 |
) |
|
|
(247 |
) |
|
|
(952 |
) |
|
Property NOI |
|
$ |
651 |
|
|
$ |
712 |
|
|
$ |
735 |
|
|
$ |
741 |
|
|
$ |
2,839 |
|
|
2019 |
|
|
|
|
|
|
|
|
|
|
|
|
|
|
|
|
|
|
|
|
|
Rental revenues |
|
$ |
697 |
|
|
$ |
701 |
|
|
$ |
711 |
|
|
$ |
723 |
|
|
$ |
2,832 |
|
|
Rental expenses |
|
|
(188 |
) |
|
|
(181 |
) |
|
|
(181 |
) |
|
|
(184 |
) |
|
|
(734 |
) |
|
Property NOI |
|
$ |
509 |
|
|
$ |
520 |
|
|
$ |
530 |
|
|
$ |
539 |
|
|
$ |
2,098 |
|
33
|
|
Three Months Ended December 31, |
|
|
|
|
|
|||||
|
|
2020 |
|
|
2019 |
|
|
% Change |
|
|||
|
Reconciliation of Consolidated Property NOI to Same Store Property NOI measures: |
|
||||||||||
|
|
|
|
|
|
|
|
|
|
|
|
|
|
Rental revenues |
$ |
988 |
|
|
$ |
723 |
|
|
|
|
|
|
Rental expenses |
|
(247 |
) |
|
|
(184 |
) |
|
|
|
|
|
Consolidated Property NOI |
$ |
741 |
|
|
$ |
539 |
|
|
|
|
|
|
|
|
|
|
|
|
|
|
|
|
|
|
|
Adjustments to derive same store results: |
|
|
|
|
|
|
|
|
|
|
|
|
Property NOI from consolidated properties not included in same store portfolio and other adjustments (1)(2) |
|
(253 |
) |
|
|
(61 |
) |
|
|
|
|
|
Property NOI from unconsolidated co-investment ventures included in same store portfolio (1)(2) |
|
515 |
|
|
|
493 |
|
|
|
|
|
|
Third parties' share of Property NOI from properties included in same store portfolio (1)(2) |
|
(415 |
) |
|
|
(403 |
) |
|
|
|
|
|
Prologis Share of Same Store Property NOI – Net Effective (2) |
$ |
588 |
|
|
$ |
568 |
|
|
|
3.5 |
% |
|
Consolidated properties straight-line rent and fair value lease adjustments included in same store portfolio (3) |
|
(11 |
) |
|
|
(9 |
) |
|
|
|
|
|
Unconsolidated co-investment ventures straight-line rent and fair value lease adjustments included in same store portfolio (3) |
|
(11 |
) |
|
|
(7 |
) |
|
|
|
|
|
Third parties' share of straight-line rent and fair value lease adjustments included in same store portfolio (2)(3) |
|
9 |
|
|
|
6 |
|
|
|
|
|
|
Prologis Share of Same Store Property NOI – Cash (2)(3) |
$ |
575 |
|
|
$ |
558 |
|
|
|
3.0 |
% |
|
|
(1) |
We exclude properties held for sale to third parties, along with development properties that were not stabilized at the beginning of the period and properties acquired or disposed of to third parties during the period. We also exclude net termination and renegotiation fees to allow us to evaluate the growth or decline in each property’s rental revenues without regard to one-time items that are not indicative of the property’s recurring operating performance. Net termination and renegotiation fees represent the gross fee negotiated to allow a customer to terminate or renegotiate their lease, offset by the write-off of the asset recorded due to the adjustment to straight-line rents over the lease term. Same Store Property NOI is adjusted to include an allocation of property management expenses for our consolidated properties based on the property management services provided to each property (generally, based on a percentage of revenues). On consolidation, these amounts are eliminated and the actual costs of providing property management services are recognized as part of our consolidated rental expense. |
|
|
(2) |
We include the Property NOI for the same store portfolio for both consolidated properties and properties owned by the co-investment ventures based on our investment in the underlying properties. In order to calculate our share of Same Store Property NOI from the co-investment ventures in which we own less than 100%, we use the co-investment ventures’ underlying Property NOI for the same store portfolio and apply our ownership percentage at December 31, 2020 to the Property NOI for both periods, including the properties contributed during the period. We adjust the total Property NOI from the same store portfolio of the co-investment ventures by subtracting the third parties’ share of both consolidated and unconsolidated co-investment ventures. |
During the periods presented, certain wholly owned properties were contributed to a co-investment venture and are included in the same store portfolio. Neither our consolidated results nor those of the co-investment ventures, when viewed individually, would be comparable on a same store basis because of the changes in composition of the respective portfolios from period to period (e.g. the results of a contributed property are included in our consolidated results through the contribution date and in the results of the venture subsequent to the contribution date based on our ownership interest at the end of the period). As a result, only line items labeled “Prologis Share of Same Store Property NOI” are comparable period over period.
|
|
(3) |
We further remove certain noncash items (straight-line rent and amortization of fair value lease adjustments) included in the financial statements prepared in accordance with U.S. GAAP to reflect a Same Store Property NOI – Cash measure. |
We manage our business and compensate our executives based on the same store results of our O&M portfolio at 100% as we manage our portfolio on an ownership blind basis. We calculate those results by including 100% of the properties included in our same store portfolio.
Other Components of Income (Expense)
Earnings from Unconsolidated Entities, Net
We recognized net earnings from unconsolidated entities, which are accounted for using the equity method, of $297 million and $200 million during 2020 and 2019, respectively. The earnings we recognize can be impacted by: (i) variances in revenues and expenses of each venture; (ii) the size and occupancy rate of the portfolio of properties owned by each venture; (iii) gains or losses from the dispositions of properties and extinguishment of debt; (iv) our ownership interest in each venture; and (v) fluctuations in foreign currency exchange rates used to translate our share of net earnings to U.S. dollars.
34
See the discussion of our unconsolidated entities above in the Strategic Capital segment discussion and in Note 5 to the Consolidated Financial Statements for a further breakdown of our share of net earnings recognized.
Interest Expense
The following table details our net interest expense (dollars in millions):
|
|
|
2020 |
|
|
2019 |
|
||
|
Gross interest expense |
|
$ |
348 |
|
|
$ |
271 |
|
|
Amortization of debt discount and debt issuance costs, net |
|
|
9 |
|
|
|
17 |
|
|
Capitalized amounts |
|
|
(42 |
) |
|
|
(48 |
) |
|
Net interest expense |
|
$ |
315 |
|
|
$ |
240 |
|
|
Weighted average effective interest rate during the year |
|
|
2.2 |
% |
|
|
2.4 |
% |
Interest expense increased due to higher debt balances in 2020 as compared to 2019, driven primarily by the issuance of senior notes and debt assumed in the Liberty Transaction, reduced partially by lower interest rates as a result of our refinancing activities as discussed under the Summary of 2020 section.
See Note 8 to the Consolidated Financial Statements and the Liquidity and Capital Resources section, for further discussion of our debt and borrowing costs.
Foreign Currency and Derivative Gains (Losses), Net
We are exposed to foreign currency exchange risk related to investments in and earnings from our foreign investments. We may use derivative financial instruments to manage foreign currency exchange rate risk. We recognize the change in fair value of the undesignated derivative contracts in unrealized gains and losses. Upon settlement of these transactions, we recognize realized gains or losses.
We primarily hedge our foreign currency risk by borrowing in the currencies in which we invest thereby providing a natural hedge. We have issued debt in a currency that is not the same functional currency of the borrowing entity and have designated a portion of the debt as a nonderivative net investment hedge. We recognize the remeasurement and settlement of the unhedged portion of the debt and accrued interest in unrealized gains or losses.
The following table details our foreign currency and derivative gains (losses), net included in earnings (in millions):
|
|
|
2020 |
|
|
2019 |
|
||
|
Realized foreign currency and derivative gains (losses), net: |
|
|
|
|
|
|
|
|
|
Gains (losses) on the settlement of undesignated derivatives |
|
$ |
(6 |
) |
|
$ |
28 |
|
|
Gains on the settlement of transactions with third parties |
|
|
- |
|
|
|
1 |
|
|
Total realized foreign currency and derivative gains (losses), net |
|
|
(6 |
) |
|
|
29 |
|
|
|
|
|
|
|
|
|
|
|
|
Unrealized foreign currency and derivative gains (losses), net: |
|
|
|
|
|
|
|
|
|
Losses on the change in fair value of undesignated derivatives and unhedged debt |
|
|
(152 |
) |
|
|
(74 |
) |
|
Gains (losses) on remeasurement of certain assets and liabilities |
|
|
(9 |
) |
|
|
3 |
|
|
Total unrealized foreign currency and derivative losses, net |
|
|
(161 |
) |
|
|
(71 |
) |
|
Total foreign currency and derivative losses, net |
|
$ |
(167 |
) |
|
$ |
(42 |
) |
See Note 2 to the Consolidated Financial Statements for more information about our foreign currency and derivative financial instrument policies and Note 15 to the Consolidated Financial Statements for more information about our derivative and nonderivative transactions.
Losses on Early Extinguishment of Debt, Net
As discussed above, during 2020 we issued $6.2 billion of senior notes, aggregate principal in U.S. dollars, and used the proceeds to redeem certain higher interest rate debt before maturity. This resulted in extending our weighted average remaining maturity to 10 years and lowering our weighted average effective interest rate to approximately 1.9% at December 31, 2020 and the recognition of losses on early extinguishment of debt of $188 million during 2020. The losses included the extinguishment of debt assumed in the Liberty Transaction and the IPT Transaction, which represented the excess of the prepayment penalties over the premium recorded upon assumption of the debt. During 2019 we recognized $16 million of losses on early extinguishment of debt. See Note 8 to the Consolidated Financial Statements and the Liquidity and Capital Resources section, for more information regarding our debt repurchases.
Income Tax Expense
We recognize income tax expense related to our taxable REIT subsidiaries and in the local, state and foreign jurisdictions in which we operate. Our current income tax expense fluctuates from period to period based primarily on the timing of our taxable income, including
35
gains on the disposition and contribution of properties and fees earned from the co-investment ventures. Deferred income tax expense (benefit) is generally a function of the period’s temporary differences and the utilization of net operating losses generated in prior years that had been previously recognized as deferred income tax assets in taxable subsidiaries.
The following table summarizes our income tax expense (benefit) (in millions):
|
|
|
2020 |
|
|
2019 |
|
||
|
Current income tax expense: |
|
|
|
|
|
|
|
|
|
Income tax expense |
|
$ |
83 |
|
|
$ |
48 |
|
|
Income tax expense on dispositions |
|
|
41 |
|
|
|
15 |
|
|
Income tax expense on dispositions related to acquired tax liabilities |
|
|
6 |
|
|
|
- |
|
|
Total current income tax expense |
|
|
130 |
|
|
|
63 |
|
|
|
|
|
|
|
|
|
|
|
|
Deferred income tax expense (benefit): |
|
|
|
|
|
|
|
|
|
Income tax expense |
|
|
6 |
|
|
|
12 |
|
|
Income tax benefit on dispositions related to acquired tax liabilities |
|
|
(6 |
) |
|
|
- |
|
|
Total deferred income tax expense |
|
|
- |
|
|
|
12 |
|
|
Total income tax expense |
|
$ |
130 |
|
|
$ |
75 |
|
Our income taxes are discussed in more detail in Note 13 to the Consolidated Financial Statements.
Net Earnings Attributable to Noncontrolling Interests
This amount represents the third-party investors’ share of the earnings generated in consolidated entities in which we do not own 100% of the equity, reduced by the third-party share of fees or promotes payable to us and earned during the period. We had net earnings attributable to noncontrolling interests of $135 million and $129 million in 2020 and 2019, respectively. Included in these amounts were $42 million and $47 million in 2020 and 2019, respectively, of net earnings attributable to the common limited partnership unitholders of Prologis, L.P.
See Note 11 to the Consolidated Financial Statements for further information on our noncontrolling interests.
Other Comprehensive Income (Loss)
See Note 2 to the Consolidated Financial Statements for more information about our foreign currency and derivative financial instrument policies and Note 15 to the Consolidated Financial Statements for more information about our derivative and nonderivative transactions and other comprehensive income (loss).
ENVIRONMENTAL MATTERS
See Note 16 in the Consolidated Financial Statements for further information about environmental liabilities.
LIQUIDITY AND CAPITAL RESOURCES
Overview
We consider our ability to generate cash from operating activities, distributions from our co-investment ventures, contributions and dispositions of properties and available financing sources to be adequate to meet our anticipated future development, acquisition, operating, debt service, dividend and distribution requirements.
Near-Term Principal Cash Sources and Uses
In addition to dividends and distributions, we expect our primary cash needs will consist of the following:
|
• |
completion of the development and leasing of the properties in our active consolidated development portfolio (at December 31, 2020, 82 properties in our development portfolio were 61.6% leased with a current investment of $1.9 billion and a TEI of $3.7 billion when completed and leased, leaving $1.8 billion of estimated additional required investment); |
|
• |
development of new properties that we may hold for long-term investment or subsequently contribute to unconsolidated co-investment ventures, including the acquisition of land in certain markets; |
|
• |
capital expenditures and leasing costs on properties in our operating portfolio; |
|
• |
repayment of debt and scheduled principal payments of $376 million in 2021; |
|
• |
additional investments in current and future unconsolidated co-investment ventures and other ventures; |
36
|
• |
acquisition of operating properties or portfolios of operating properties, (depending on market and other conditions) for direct, long-term investment in our consolidated portfolio (this might include acquisitions from our co-investment ventures); and |
|
• |
repurchase of our outstanding debt or equity securities (depending on prevailing market conditions, our liquidity, contractual restrictions and other factors) through cash purchases, open-market purchases, privately negotiated transactions, tender offers or otherwise. |
We expect to fund our cash needs principally from the following sources (subject to market conditions):
|
• |
net cash flow from property operations; |
|
• |
fees earned for services performed on behalf of co-investment ventures, including promotes; |
|
• |
distributions received from co-investment ventures; |
|
• |
proceeds from disposition of properties, land parcels or other investments to third parties; |
|
• |
proceeds from contributions of properties to current or future co-investment ventures; |
|
• |
available unrestricted cash balances ($598 million at December 31, 2020); |
|
• |
borrowing capacity under our current credit facility arrangements and multi-currency term loan ($4.2 billion available at December 31, 2020); |
|
• |
proceeds from issuance of debt; and |
|
• |
proceeds from the sale of a portion of our investments in co-investment ventures to achieve long-term ownership targets. |
We may also generate proceeds from the issuance of equity securities, subject to market conditions.
Debt
The following table summarizes information about our consolidated debt by currency at December 31 (dollars in millions):
|
|
|
2020 |
|
|
2019 |
|
||||||||||||||||||
|
|
|
Weighted Average Interest Rate |
|
|
Amount Outstanding |
|
|
% of Total |
|
|
Weighted Average Interest Rate |
|
|
Amount Outstanding |
|
|
% of Total |
|
||||||
|
British pound sterling |
|
|
2.2 |
% |
|
$ |
1,019 |
|
|
|
6.1 |
% |
|
|
2.3 |
% |
|
$ |
657 |
|
|
|
5.5 |
% |
|
Canadian dollar |
|
|
2.7 |
% |
|
|
286 |
|
|
|
1.7 |
% |
|
|
3.4 |
% |
|
|
280 |
|
|
|
2.3 |
% |
|
Euro |
|
|
1.4 |
% |
|
|
6,550 |
|
|
|
38.8 |
% |
|
|
1.9 |
% |
|
|
6,129 |
|
|
|
51.5 |
% |
|
Japanese yen |
|
|
0.8 |
% |
|
|
2,877 |
|
|
|
17.1 |
% |
|
|
0.7 |
% |
|
|
2,329 |
|
|
|
19.6 |
% |
|
U.S. dollar |
|
|
2.8 |
% |
|
|
6,117 |
|
|
|
36.3 |
% |
|
|
4.4 |
% |
|
|
2,511 |
|
|
|
21.1 |
% |
|
Total debt (1) |
|
|
1.9 |
% |
|
$ |
16,849 |
|
|
|
|
|
|
|
2.2 |
% |
|
$ |
11,906 |
|
|
|
|
|
|
(1) |
The weighted average maturity for total debt outstanding at December 31, 2020 and 2019 was 122 and 94 months, respectively. Of the amount of debt outstanding at December 31, 2020, $13.6 billion matures after 2025. Our refinancing activities in 2020 significantly lengthened the maturity of our senior notes. |
Our credit ratings at December 31, 2020, were A3 from Moody’s and A- from Standard & Poor’s, both with stable outlook. These ratings allow us to borrow at an advantageous interest rate. Adverse changes in our credit ratings could negatively impact our business and, in particular, our refinancing and other capital market activities, our ability to manage debt maturities, our future growth and our development and acquisition activity. A securities rating is not a recommendation to buy, sell or hold securities and is subject to revision or withdrawal at any time by the rating organization.
At December 31, 2020, we were in compliance with all of our financial debt covenants. These covenants include customary financial covenants for total debt, encumbered debt and fixed charge coverage ratios.
See Note 8 to the Consolidated Financial Statements for further discussion on our debt.
Equity Commitments Related to Certain Co-Investment Ventures
Certain co-investment ventures have equity commitments from us and our venture partners. Our venture partners fulfill their equity commitment with cash. We may fulfill our equity commitment through contributions of properties or cash.
37
The following table summarizes the remaining equity commitments at December 31, 2020 (in millions):
|
|
|
Equity Commitments (1) |
|
|
|
|||||||||
|
|
|
Prologis |
|
|
Venture Partners |
|
|
Total |
|
|
Expiration Date |
|||
|
Prologis Targeted U.S. Logistics Fund |
|
$ |
- |
|
|
$ |
763 |
|
|
$ |
763 |
|
|
2023 (2) |
|
Prologis European Logistics Fund |
|
|
- |
|
|
|
1,813 |
|
|
|
1,813 |
|
|
2022 – 2023 (2) |
|
Prologis UK Logistics Venture |
|
|
8 |
|
|
|
49 |
|
|
|
57 |
|
|
2024 |
|
Prologis China Core Logistics Fund |
|
|
- |
|
|
|
115 |
|
|
|
115 |
|
|
2022 – 2023 |
|
Prologis China Logistics Venture |
|
|
289 |
|
|
|
1,636 |
|
|
|
1,925 |
|
|
2021 – 2028 |
|
Prologis Brazil Logistics Venture |
|
|
49 |
|
|
|
195 |
|
|
|
244 |
|
|
2026 – 2027 |
|
Total |
|
$ |
346 |
|
|
$ |
4,571 |
|
|
$ |
4,917 |
|
|
|
|
(1) |
The equity commitments for co-investment ventures that operate in a different functional currency than the U.S. dollar are calculated using the foreign currency exchange rate at December 31, 2020. |
|
(2) |
Venture partners have the option to cancel their equity commitment up to 18 months after the initial commitment date. |
See the Cash Flow Summary below for more information about our investment activity in the unconsolidated co-investment ventures.
Unconsolidated Co-Investment Venture Debt
We had investments in and advances to our unconsolidated co-investment ventures, at December 31, 2020, of $6.7 billion. The ventures listed below had total third-party debt of $11.8 billion at December 31, 2020. Certain of our ventures do not have third-party debt and are therefore excluded. This debt is non-recourse to Prologis and other investors in the co-investment ventures and matures and bears interest as follows at December 31, 2020 (dollars in millions):
|
|
|
Total (1) |
|
|
Weighted Average Interest Rate |
|
|
Gross Book Value (1) |
|
|
Ownership % |
|
||||
|
Prologis Targeted U.S. Logistics Fund |
|
$ |
3,129 |
|
|
3.2% |
|
|
$ |
11,395 |
|
|
25.6% |
|
||
|
FIBRA Prologis |
|
|
854 |
|
|
3.4% |
|
|
|
2,573 |
|
|
46.8% |
|
||
|
Prologis European Logistics Fund |
|
|
3,389 |
|
|
2.1% |
|
|
|
12,941 |
|
|
24.3% |
|
||
|
Prologis UK Logistics Venture |
|
|
613 |
|
|
3.1% |
|
|
|
990 |
|
|
15.0% |
|
||
|
Nippon Prologis REIT |
|
|
2,504 |
|
|
0.7% |
|
|
|
6,831 |
|
|
15.1% |
|
||
|
Prologis China Core Logistics Fund |
|
|
721 |
|
|
5.6% |
|
|
|
2,128 |
|
|
15.8% |
|
||
|
Prologis China Logistics Venture |
|
|
606 |
|
|
2.9% |
|
|
|
1,208 |
|
|
15.0% |
|
||
|
Total |
|
$ |
11,816 |
|
|
|
|
|
|
$ |
38,066 |
|
|
|
|
|
|
(1) |
The weighted average loan-to-value ratio for all unconsolidated co-investment ventures was 27.4% at December 31, 2020. Loan-to-value, a non-GAAP measure, was calculated as the percentage of total third-party debt to the gross book value of real estate for each venture and weighted based on the cumulative gross book value of all unconsolidated co-investment ventures. |
At December 31, 2020, we did not guarantee any third-party debt of the unconsolidated co-investment ventures. In our role as the manager or sponsor, we work with the co-investment ventures to maintain sufficient liquidity and refinance their maturing debt. There can be no assurance that the co-investment ventures will be able to refinance any maturing indebtedness on terms as favorable as the maturing debt, or at all. If the ventures are unable to refinance the maturing indebtedness with newly issued debt, they may be able to obtain funds by voluntary capital contributions from us and our partners or by selling assets. Certain of our ventures also have credit facilities, or unencumbered properties, both of which may be used to obtain funds.
Cash Flow Summary
The following table summarizes our cash flow activity (in millions):
|
|
|
2020 |
|
|
2019 |
|
||
|
Net cash provided by operating activities |
|
$ |
2,937 |
|
|
$ |
2,264 |
|
|
Net cash used in investing activities |
|
$ |
(3,074 |
) |
|
$ |
(685 |
) |
|
Net cash used in financing activities |
|
$ |
(372 |
) |
|
$ |
(840 |
) |
|
Net increase (decrease) in cash and cash equivalents, including the effect of foreign currency exchange rates |
|
$ |
(491 |
) |
|
$ |
745 |
|
38
Operating Activities
Cash provided by operating activities, exclusive of changes in receivables and payables, was impacted by the following significant activities:
|
• |
Real estate operations. We receive the majority of our operating cash through the net revenues of our Real Estate Operations segment. See the Results of Operations section above for further explanation on our Real Estate Operations segment. The revenues from this segment include noncash adjustments for straight-lined rents and amortization of above and below market leases of $126 million and $98 million for 2020 and 2019, respectively. |
|
• |
Strategic capital. We also generate operating cash through our Strategic Capital segment by providing asset and property management and other services to our unconsolidated co-investment ventures. See the Results of Operations section above for the key drivers of the net revenues from our Strategic Capital segment. Included in Strategic Capital Revenues is the third-party investors’ share that is owed for promotes, which is recognized in operating activities in the period the cash is received. |
|
• |
G&A expenses and equity-based compensation awards. We incurred $275 million and $266 million of G&A costs in 2020 and 2019, respectively. We recognized equity-based, noncash compensation expenses of $110 million and $98 million in 2020 and 2019, respectively, which were recorded to Rental Expenses in the Real Estate Operations segment, Strategic Capital Expenses in the Strategic Capital segment and G&A Expenses. |
|
• |
Operating distributions from unconsolidated entities. We received $451 million and $347 million of distributions as a return on our investment from the cash flows generated from the operations of our unconsolidated entities in 2020 and 2019, respectively. |
|
• |
Cash paid for interest, net of amounts capitalized. We paid interest, net of amounts capitalized, of $309 million and $214 million in 2020 and 2019, respectively. See Note 8 to the Consolidated Financial Statements for further information on this activity. |
|
• |
Cash paid for income taxes, net of refunds. We paid income taxes, net of refunds, of $101 million and $62 million in 2020 and 2019, respectively. See Note 13 to the Consolidated Financial Statements for further information on this activity. |
Investing Activities
Cash provided by investing activities is driven by proceeds from contributions and dispositions of real estate properties. Cash used in investing activities is primarily driven by our capital deployment activities of investing in real estate development, acquisitions and capital expenditures. See Note 4 to the Consolidated Financial Statements for further information on these activities. In addition, the following significant transactions also impacted our cash provided by or used in investing activities:
|
|
|
• |
Liberty Transaction, net of cash acquired. We paid net cash of $29 million to complete the Liberty Transaction in 2020, primarily due to transaction costs. The acquisition was financed through the issuance of equity and the assumption of debt. A portion of this debt was paid down subsequent to the acquisition, as noted in the Financing Activities section below. See Note 3 to the Consolidated Financial Statements for more information on this transaction. |
|
• |
IPT Transaction, net of cash acquired. Our consolidated co-investment venture, USLV, acquired real estate assets from IPT for a cash purchase price of $1.7 billion. Our partner in USLV contributed their share of the purchase price, $917 million, which is presented in Noncontrolling Interests Contributions in financing activities. All of the debt assumed was paid down subsequent to the acquisition, as noted in the Financing Activities section below. See Notes 4 and 11 to the Consolidated Financial Statements for more information on this transaction. |
|
• |
Investments in and advances to our unconsolidated entities. We invested cash in our unconsolidated entities that represented our proportionate share, of $386 million and $276 million in 2020 and 2019, respectively. The ventures used the funds for the acquisition of properties, development and repayment of debt. See Note 5 to the Consolidated Financial Statements for more detail on our unconsolidated co-investment ventures. |
|
• |
Return of investment. We received distributions from unconsolidated entities as a return of investment of $257 million and $389 million during 2020 and 2019, respectively. Included in these amounts were distributions from venture activities including proceeds from property sales, debt refinancing and the redemption of our investment in certain unconsolidated entities. |
|
• |
Settlement of net investment hedges. We paid net cash of $7 million for the settlement of net investment hedges in each of 2020 and 2019. See Note 15 to the Consolidated Financial Statements for further information on our derivative transactions. |
39
Financing Activities
Cash provided by and used in financing activities is principally driven by proceeds from and payments on credit facilities and other debt, along with dividends paid on common and preferred stock and noncontrolling interest contributions and distributions. In addition, the following significant transactions also impacted our cash provided by or used in financing activities:
|
• |
Repurchase of common and preferred stock. We paid $35 million and $7 million to repurchase common shares and shares of Series Q preferred stock, respectively, during 2020. |
Our repurchase of and payments on debt and proceeds from the issuance of debt consisted of the following activity (in millions):
|
|
|
2020 (1) |
|
|
2019 |
|
||
|
Repurchase of and payments on debt (including extinguishment costs) |
|
|
|
|
|
|
|
|
|
Regularly scheduled debt principal payments and payments at maturity |
|
$ |
10 |
|
|
$ |
29 |
|
|
Secured mortgage debt |
|
|
565 |
|
|
|
433 |
|
|
Senior notes |
|
|
4,856 |
|
|
|
669 |
|
|
Term loans |
|
|
1,351 |
|
|
|
2,171 |
|
|
Total |
|
$ |
6,782 |
|
|
$ |
3,302 |
|
|
|
|
|
|
|
|
|
|
|
|
Proceeds from the issuance of debt |
|
|
|
|
|
|
|
|
|
Secured mortgage debt |
|
$ |
155 |
|
|
$ |
250 |
|
|
Senior notes |
|
|
6,170 |
|
|
|
2,053 |
|
|
Term loans |
|
|
1,500 |
|
|
|
1,674 |
|
|
Total |
|
$ |
7,825 |
|
|
$ |
3,977 |
|
|
(1) |
We completed the Liberty Transaction in 2020 and assumed $2.8 billion of debt, of which $1.8 billion was paid off with the proceeds from the issuance of senior notes. USLV assumed $342 million of debt in the IPT Transaction, all of which was paid off at closing. The assumption of debt was excluded from the table above. See Note 8 to the Consolidated Financial Statements for more information. |
Distribution and Dividend Requirements
Our dividend policy on our common stock is to distribute a percentage of our cash flow to ensure that we will meet the dividend requirements of the IRC, relative to maintaining our REIT status, while still allowing us to retain cash to fund capital improvements and other investment activities.
Under the IRC, REITs may be subject to certain federal income and excise taxes on undistributed taxable income.
We paid quarterly cash dividends of $0.58 and $0.53 per common share in 2020 and 2019, respectively. Our future common stock dividends, if and as declared, may vary and will be determined by the Board based upon the circumstances prevailing at the time, including our financial condition, operating results and REIT distribution requirements, and may be adjusted at the discretion of the Board during the year.
We make distributions on the common limited partnership units outstanding at the same per unit amount as our common stock dividend. The Class A Units in the OP are entitled to a quarterly distribution equal to $0.64665 per unit so long as the common units receive a quarterly distribution of at least $0.40 per unit. We paid a quarterly cash distribution of $0.64665 per Class A Unit in 2020 and 2019.
At December 31, 2020, we had 1.3 million shares of Series Q preferred stock outstanding with a liquidation preference of $50 per share. The annual dividend rate is 8.54% per share and dividends are payable quarterly in arrears. Pursuant to the terms of our preferred stock, we are restricted from declaring or paying any dividend with respect to our common stock unless and until all cumulative dividends with respect to the preferred stock have been paid and sufficient funds have been set aside for dividends that have been declared for the relevant dividend period with respect to the preferred stock.
Other Commitments
On an ongoing basis, we are engaged in various stages of negotiations for the acquisition or disposition of individual properties or portfolios of properties.
CRITICAL ACCOUNTING POLICIES
A critical accounting policy is one that involves an estimate or assumption that is subjective and requires management judgment about the effect of a matter that is inherently uncertain and material to an entity’s financial condition and results of operations. Management’s judgment considers historical and current economic conditions and expectations for the future. Changes in estimates could affect our financial position and specific items in our results of operations that are used by stockholders, potential investors, industry analysts and lenders in their evaluation of our performance. Of the significant accounting policies discussed in Note 2 to the Consolidated Financial
40
Statements, those presented below have been identified by us as meeting the criteria to be considered critical accounting policies. Refer to Note 2 for more information on these critical accounting policies.
Asset Acquisitions
We generally account for an acquisition of a single property or portfolio of properties as an asset acquisition. We measure the real estate assets acquired through an asset acquisition based on their cost or total consideration exchanged and any excess consideration or bargain purchase amount is allocated to the real estate properties and related lease intangibles on a relative fair value basis. Assets we do not intend to hold long-term are recorded at fair value. At a property-level, we allocate the fair value to the components which include building, land, improvements, and intangible assets or liabilities related to acquired leases. The most significant portion of the allocation is to building and land and requires the use of market based estimates and assumptions.
The purchase price allocation is based on the expected future cash flows of the property and various characteristics of the markets where the property is located utilizing an income approach methodology, which may be a discounted cash flow analysis or applying a capitalization rate to the estimated NOI of a property. Key assumptions include market rents, growth rates, and discount and capitalization rates. Estimates of future cash flows are based on a number of factors including historical operating results, known trends and market and economic conditions. We determine discount and capitalization rates by market based on recent transactions and other market data and adjust if necessary, based on the property characteristics. The fair value of land is generally based on relevant market data, such as a comparison of the subject site to similar parcels that have recently been sold or are currently being offered on the market for sale. The use of different assumptions to value the acquired properties and allocate the most significant portion of the property value between the building and land could affect the expenses we recognize over the estimated remaining useful life.
Recoverability of Real Estate Assets
We assess the carrying values of our respective long-lived assets whenever events or changes in circumstances indicate that the carrying amounts of these assets may not be fully recoverable. This assessment is primarily triggered based on the shortening of the expected hold period due to our change in intent to sell a property in the near term. We have processes to monitor our intent with regard to our investments and the estimated disposition value in comparison to the current carrying value. If our assessment of potential triggering events indicates that the carrying value of a property that we expect to sell in the near term is not recoverable, we recognize an impairment charge for the amount by which the carrying value exceeds the current estimated fair value of the property. We determine the fair value of the property based on the proceeds from disposition that are estimated based on quoted market values, third-party appraisals or discounted cash flow models that utilize the future net rental income of the property and expected market capitalization rates. The use of projected future cash flows is based on assumptions that are consistent with our estimates of future expectations and the strategic plan we use to manage our underlying business. Changes in economic and operating conditions could impact our intent and the assumptions used in determining the fair value that could result in future impairment.
NEW ACCOUNTING PRONOUNCEMENTS
See Note 2 to the Consolidated Financial Statements.
FUNDS FROM OPERATIONS ATTRIBUTABLE TO COMMON STOCKHOLDERS/UNITHOLDERS (“FFO”)
FFO is a non-GAAP financial measure that is commonly used in the real estate industry. The most directly comparable GAAP measure to FFO is net earnings.
The National Association of Real Estate Investment Trusts (“NAREIT”) defines FFO as earnings computed under GAAP to exclude historical cost depreciation and gains and losses from the sales, along with impairment charges, of previously depreciated properties. We also exclude the gains on revaluation of equity investments upon acquisition of a controlling interest and the gain recognized from a partial sale of our investment, as these are similar to gains from the sales of previously depreciated properties. We exclude similar adjustments from our unconsolidated entities and the third parties’ share of our consolidated co-investment ventures.
Our FFO Measures
Our FFO measures begin with NAREIT’s definition and we make certain adjustments to reflect our business and the way that management plans and executes our business strategy. While not infrequent or unusual, the additional items we adjust for in calculating FFO, as modified by Prologis and Core FFO, both as defined below, are subject to significant fluctuations from period to period. Although these items may have a material impact on our operations and are reflected in our financial statements, the removal of the effects of these items allows us to better understand the core operating performance of our properties over the long term. These items have both positive and negative short-term effects on our results of operations in inconsistent and unpredictable directions that are not relevant to our long-term outlook.
We calculate our FFO measures, as defined below, based on our proportionate ownership share of both our unconsolidated and consolidated ventures. We reflect our share of our FFO measures for unconsolidated ventures by applying our average ownership percentage for the period to the applicable reconciling items on an entity by entity basis. We reflect our share for consolidated ventures in which we do not own 100% of the equity by adjusting our FFO measures to remove the noncontrolling interests share of the applicable reconciling items based on our average ownership percentage for the applicable periods.
41
These FFO measures are used by management as supplemental financial measures of operating performance and we believe that it is important that stockholders, potential investors and financial analysts understand the measures management uses. We do not use our FFO measures as, nor should they be considered to be, alternatives to net earnings computed under GAAP, as indicators of our operating performance, as alternatives to cash from operating activities computed under GAAP or as indicators of our ability to fund our cash needs.
We analyze our operating performance principally by the rental revenue of our real estate and the revenues from our strategic capital business, net of operating, administrative and financing expenses. This income stream is not directly impacted by fluctuations in the market value of our investments in real estate or debt securities.
FFO, as modified by Prologis attributable to common stockholders/unitholders (“FFO, as modified by Prologis”)
To arrive at FFO, as modified by Prologis, we adjust the NAREIT defined FFO measure to exclude the impact of foreign currency related items and deferred tax, specifically:
|
• |
deferred income tax benefits and deferred income tax expenses recognized by our subsidiaries; |
|
• |
current income tax expense related to acquired tax liabilities that were recorded as deferred tax liabilities in an acquisition, to the extent the expense is offset with a deferred income tax benefit in earnings that is excluded from our defined FFO measure; and |
|
• |
foreign currency exchange gains and losses resulting from (i) debt transactions between us and our foreign entities, (ii) third-party debt that is used to hedge our investment in foreign entities, (iii) derivative financial instruments related to any such debt transactions, and (iv) mark-to-market adjustments associated with other derivative financial instruments. |
We use FFO, as modified by Prologis, so that management, analysts and investors are able to evaluate our performance against other REITs that do not have similar operations or operations in jurisdictions outside the U.S.
Core FFO attributable to common stockholders/unitholders (“Core FFO”)
In addition to FFO, as modified by Prologis, we also use Core FFO. To arrive at Core FFO, we adjust FFO, as modified by Prologis, to exclude the following recurring and nonrecurring items that we recognized directly in FFO, as modified by Prologis:
|
• |
gains or losses from the disposition of land and development properties that were developed with the intent to contribute or sell; |
|
• |
income tax expense related to the sale of investments in real estate; |
|
• |
impairment charges recognized related to our investments in real estate generally as a result of our change in intent to contribute or sell these properties; |
|
• |
gains or losses from the early extinguishment of debt and redemption and repurchase of preferred stock; and |
|
• |
expenses related to natural disasters. |
We use Core FFO, including by segment and geographies, to: (i) assess our operating performance as compared to other real estate companies; (ii) evaluate our performance and the performance of our properties in comparison with expected results and results of previous periods; (iii) evaluate the performance of our management; (iv) budget and forecast future results to assist in the allocation of resources; (v) provide guidance to the financial markets to understand our expected operating performance; and (vi) evaluate how a specific potential investment will impact our future results.
Limitations on the use of our FFO measures
While we believe our modified FFO measures are important supplemental measures, neither NAREIT’s nor our measures of FFO should be used alone because they exclude significant economic components of net earnings computed under GAAP and are, therefore, limited as an analytical tool. Accordingly, these are only a few of the many measures we use when analyzing our business. Some of the limitations are:
|
• |
The current income tax expenses that are excluded from our modified FFO measures represent the taxes that are payable. |
|
• |
Depreciation and amortization of real estate assets are economic costs that are excluded from FFO. FFO is limited, as it does not reflect the cash requirements that may be necessary for future replacements of the real estate assets. Furthermore, the amortization of capital expenditures and leasing costs necessary to maintain the operating performance of logistics facilities are not reflected in FFO. |
|
• |
Gains or losses from property dispositions and impairment charges related to expected dispositions represent changes in value of the properties. By excluding these gains and losses, FFO does not capture realized changes in the value of disposed properties arising from changes in market conditions. |
42
|
• |
The deferred income tax benefits and expenses that are excluded from our modified FFO measures result from the creation of a deferred income tax asset or liability that may have to be settled at some future point. Our modified FFO measures do not currently reflect any income or expense that may result from such settlement. |
|
• |
The foreign currency exchange gains and losses that are excluded from our modified FFO measures are generally recognized based on movements in foreign currency exchange rates through a specific point in time. The ultimate settlement of our foreign currency-denominated net assets is indefinite as to timing and amount. Our FFO measures are limited in that they do not reflect the current period changes in these net assets that result from periodic foreign currency exchange rate movements. |
|
• |
The gains and losses on extinguishment of debt or preferred stock that we exclude from our Core FFO, may provide a benefit or cost to us as we may be settling our obligation at less or more than our future obligation. |
|
• |
The natural disaster expenses that we exclude from Core FFO are costs that we have incurred. |
We compensate for these limitations by using our FFO measures only in conjunction with net earnings computed under GAAP when making our decisions. This information should be read with our complete Consolidated Financial Statements prepared under GAAP. To assist investors in compensating for these limitations, we reconcile our modified FFO measures to our net earnings computed under GAAP as follows (in millions):
|
|
|
2020 |
|
|
2019 |
|
||
|
Reconciliation of net earnings attributable to common stockholders to FFO measures: |
|
|
|
|
|
|
|
|
|
Net earnings attributable to common stockholders |
|
$ |
1,473 |
|
|
$ |
1,567 |
|
|
|
|
|
|
|
|
|
|
|
|
Add (deduct) NAREIT defined adjustments: |
|
|
|
|
|
|
|
|
|
Real estate related depreciation and amortization |
|
|
1,523 |
|
|
|
1,102 |
|
|
Gains on other dispositions of investments in real estate, net |
|
|
(252 |
) |
|
|
(390 |
) |
|
Reconciling items related to noncontrolling interests |
|
|
(57 |
) |
|
|
(8 |
) |
|
Our share of reconciling items included in earnings related to unconsolidated entities |
|
|
268 |
|
|
|
246 |
|
|
NAREIT defined FFO attributable to common stockholders/unitholders |
|
|
2,955 |
|
|
|
2,517 |
|
|
|
|
|
|
|
|
|
|
|
|
Add (deduct) our defined adjustments: |
|
|
|
|
|
|
|
|
|
Unrealized foreign currency and derivative losses, net |
|
|
161 |
|
|
|
69 |
|
|
Deferred income tax expense |
|
|
- |
|
|
|
12 |
|
|
Current income tax expense on dispositions related to acquired tax liabilities |
|
|
6 |
|
|
|
- |
|
|
Reconciling items related to noncontrolling interests |
|
|
(2 |
) |
|
|
- |
|
|
Our share of reconciling items included in earnings related to unconsolidated entities |
|
|
- |
|
|
|
(7 |
) |
|
FFO, as modified by Prologis attributable to common stockholders/unitholders |
|
|
3,120 |
|
|
|
2,591 |
|
|
|
|
|
|
|
|
|
|
|
|
Adjustments to arrive at Core FFO: |
|
|
|
|
|
|
|
|
|
Gains on dispositions of development properties and land, net |
|
|
(465 |
) |
|
|
(468 |
) |
|
Current income tax expense on dispositions |
|
|
41 |
|
|
|
15 |
|
|
Losses on early extinguishment of debt, preferred stock repurchase and other, net |
|
|
199 |
|
|
|
16 |
|
|
Reconciling items related to noncontrolling interests |
|
|
(3 |
) |
|
|
- |
|
|
Our share of reconciling items included in earnings related to unconsolidated entities |
|
|
(28 |
) |
|
|
10 |
|
|
Core FFO attributable to common stockholders/unitholders |
|
$ |
2,864 |
|
|
$ |
2,164 |
|
ITEM 7A. Quantitative and Qualitative Disclosures About Market Risk
We are exposed to the impact of foreign exchange-related variability and earnings volatility on our foreign investments and interest rate changes. See our risk factors in Item 1A. Risk Factors, specifically Risks Related to our Global Operations and Risks Related to Financing and Capital. See also Notes 2 and 15 in the Consolidated Financial Statements in Item 8. Financial Statements and Supplementary Data for more information about our foreign operations and derivative financial instruments.
We monitor our market risk exposures using a sensitivity analysis. Our sensitivity analysis estimates the exposure to market risk sensitive instruments assuming a hypothetical 10% adverse change in foreign currency exchange rates or interest rates at December 31, 2020. The results of the sensitivity analysis are summarized in the following sections. The sensitivity analysis is of limited predictive value. As a result, revenues and expenses, as well as our ultimate realized gains or losses with respect to foreign currency exchange rate and interest rate fluctuations will depend on the exposures that arise during a future period, hedging strategies at the time and the prevailing foreign currency exchange rates and interest rates.
Foreign Currency Risk
We are exposed to foreign currency exchange variability related to investments in and earnings from our foreign investments. Foreign currency market risk is the possibility that our results of operations or financial position could be better or worse than planned because of changes in foreign currency exchange rates. We primarily hedge our foreign currency risk by borrowing in the currencies in which we invest thereby providing a natural hedge. Additionally, we hedge our foreign currency risk by entering into derivative financial
43
instruments that we designate as net investment hedges, as these amounts offset the translation adjustments on the underlying net assets of our foreign investments. At December 31, 2020, after consideration of our ability to borrow in the foreign currencies in which we invest and also derivative and nonderivative financial instruments as discussed in Note 15 to the Consolidated Financial Statements, we had minimal net equity denominated in a currency other than the U.S. dollar.
For the year ended December 31, 2020, $442 million or 10.0% of our total consolidated revenue was denominated in foreign currencies. We enter into other foreign currency contracts, such as forwards, to reduce fluctuations in foreign currency associated with the translation of the future earnings of our international subsidiaries. We have forward contracts that were not designated as hedges, denominated principally in British pound sterling, Canadian dollar, euro and Japanese yen, and have an aggregate notional amount of $1.2 billion to mitigate risk associated with the translation of the future earnings of our subsidiaries denominated in these currencies. The gain or loss on settlement of these contracts is included in our earnings and offsets the lower or higher translation of earnings from our investments denominated in currencies other than the U.S. dollar. Although the impact to net earnings is mitigated through higher translated U.S. dollar earnings from these currencies, a weakening of the U.S. dollar against these currencies by 10% could result in a $116 million cash payment on settlement of these contracts.
Interest Rate Risk
We are also exposed to the impact of interest rate changes on future earnings and cash flows. To mitigate that risk, we generally borrow with fixed rate debt and we may use derivative instruments to fix the interest rate on our variable rate debt. At December 31, 2020, $14.9 billion of our debt bore interest at fixed rates and therefore the fair value of these instruments was affected by changes in market interest rates. At December 31, 2020, $2.0 billion of our debt bore interest at variable rates. The following table summarizes the future repayment of debt and scheduled principal payments at December 31, 2020 (dollars in millions):
|
|
2021 |
|
|
2022 |
|
|
2023 |
|
|
2024 |
|
|
Thereafter |
|
|
Total |
|
|
Fair Value |
|
|||||||
|
Fixed rate debt (1) |
$ |
271 |
|
|
$ |
196 |
|
|
$ |
34 |
|
|
$ |
869 |
|
|
$ |
13,505 |
|
|
$ |
14,875 |
|
|
$ |
16,034 |
|
|
Weighted average interest rate (2) |
|
1.8 |
% |
|
|
0.6 |
% |
|
|
4.5 |
% |
|
|
4.2 |
% |
|
|
2.0 |
% |
|
|
2.1 |
% |
|
|
|
|
|
|
|
|
|
|
|
|
|
|
|
|
|
|
|
|
|
|
|
|
|
|
|
|
|
|
|
|
|
|
Variable rate debt |
|
|
|
|
|
|
|
|
|
|
|
|
|
|
|
|
|
|
|
|
|
|
|
|
|
|
|
|
Credit facilities |
$ |
- |
|
|
$ |
- |
|
|
$ |
172 |
|
|
$ |
- |
|
|
$ |
- |
|
|
$ |
172 |
|
|
$ |
172 |
|
|
Secured mortgage debt |
|
105 |
|
|
|
63 |
|
|
|
- |
|
|
|
136 |
|
|
|
- |
|
|
|
304 |
|
|
|
304 |
|
|
Senior notes |
|
- |
|
|
|
368 |
|
|
|
- |
|
|
|
- |
|
|
|
- |
|
|
|
368 |
|
|
|
370 |
|
|
Term loans |
|
- |
|
|
|
- |
|
|
|
134 |
|
|
|
- |
|
|
|
1,067 |
|
|
|
1,201 |
|
|
|
1,204 |
|
|
Total variable rate debt |
$ |
105 |
|
|
$ |
431 |
|
|
$ |
306 |
|
|
$ |
136 |
|
|
$ |
1,067 |
|
|
$ |
2,045 |
|
|
$ |
2,050 |
|
|
(1) |
At December 31, 2020, we had interest rate swap agreements to fix €150 million ($165 million) of our floating rate euro senior notes and $250 million of our multi-currency term loan, both of which were included in fixed rate debt. |
|
(2) |
The interest rates represent the effective interest rates (including amortization of the debt issuance costs and the noncash premiums and discounts) at December 31, 2020 for the debt outstanding. |
At December 31, 2020, the weighted average effective interest rate on our variable rate debt was 0.5%. Changes in interest rates can cause interest expense to fluctuate on our variable rate debt. On the basis of our sensitivity analysis, a 10% increase in interest rates on our average outstanding variable rate debt balances would result in additional annual interest expense of $1 million for the year ended December 31, 2020, which equates to a change in interest rates of 5 basis points on our average outstanding variable rate debt balances and 1 basis point on our average total debt portfolio balances.
ITEM 8. Financial Statements and Supplementary Data
The Consolidated Balance Sheets of Prologis, Inc. and Prologis, L.P. at December 31, 2020 and 2019, the Consolidated Statements of Income of Prologis, Inc. and Prologis, L.P., the Consolidated Statements of Comprehensive Income of Prologis, Inc. and Prologis, L.P., the Consolidated Statements of Equity of Prologis, Inc., the Consolidated Statements of Capital of Prologis, L.P. and the Consolidated Statements of Cash Flows of Prologis, Inc. and Prologis, L.P. for each of the years in the three-year period ended December 31, 2020, Notes to Consolidated Financial Statements and Schedule III — Real Estate and Accumulated Depreciation, together with the reports of KPMG LLP, independent registered public accounting firm, are included under Item 15 of this report and are incorporated herein by reference. Selected unaudited quarterly financial data are voluntarily presented in Note 19 of the Consolidated Financial Statements.
ITEM 9. Changes in and Disagreements with Accountants on Accounting and Financial Disclosure
None.
ITEM 9A. Controls and Procedures
Controls and Procedures (Prologis, Inc.)
Prologis, Inc. carried out an evaluation under the supervision and with the participation of management, including the Chief Executive Officer and Chief Financial Officer, of the effectiveness of the disclosure controls and procedures (as defined in Rule 13a-15(e) under the Securities and Exchange Act of 1934 (the “Exchange Act”)) at December 31, 2020. Based on this evaluation, the Chief Executive
44
Officer and the Chief Financial Officer have concluded that the disclosure controls and procedures are effective to ensure that information required to be disclosed by us in reports that we file or submit under the Exchange Act is recorded, processed, summarized and reported within the time periods specified in the SEC rules and forms. Subsequent to December 31, 2020, there were no significant changes in the internal controls or in other factors that could significantly affect these controls, including any corrective actions with regard to significant deficiencies and material weaknesses.
Changes in Internal Control over Financial Reporting
There has been no change in our internal control over financial reporting (as such term is defined in Rules 13a-15(f) and 15(d)-15(f) under the Exchange Act) that occurred during the quarter ended December 31, 2020, that has materially affected, or is reasonably likely to materially affect, our internal control over financial reporting.
Management’s Annual Report on Internal Control over Financial Reporting
We are responsible for establishing and maintaining adequate internal control over financial reporting as defined in Rules 13a-15(f) and 15d-15(f) under the Exchange Act.
Under the supervision and with the participation of management, including the Chief Executive Officer and Chief Financial Officer, an evaluation of the effectiveness of the internal control over financial reporting was conducted at December 31, 2020, based on the criteria described in “Internal Control — Integrated Framework” (2013) issued by the Committee of Sponsoring Organizations of the Treadway Commission. Based on this assessment, management determined that, at December 31, 2020, the internal control over financial reporting was effective.
Our internal control over financial reporting at December 31, 2020, has been audited by KPMG LLP, an independent registered public accounting firm, as stated in their attestation report, which is included herein.
Limitations of the Effectiveness of Controls
Management’s assessment included an evaluation of the design of the internal control over financial reporting and testing of the operational effectiveness of the internal control over financial reporting. The internal control over financial reporting is a process designed to provide reasonable assurance regarding the reliability of financial reporting and the preparation of financial statements for external purposes in accordance with GAAP. Because of its inherent limitations, internal control over financial reporting may not prevent or detect misstatements. Also, projections of any evaluation of effectiveness to future periods are subject to the risk that controls may become inadequate because of changes in conditions, or that the degree of compliance with the policies or procedures may deteriorate.
Controls and Procedures (Prologis, L.P.)
Prologis, L.P. carried out an evaluation under the supervision and with the participation of management, including the Chief Executive Officer and Chief Financial Officer, of the effectiveness of the disclosure controls and procedures (as defined in Rule 13a-15(e) under the Exchange Act) at December 31, 2020. Based on this evaluation, the Chief Executive Officer and the Chief Financial Officer have concluded that the disclosure controls and procedures are effective to ensure that information required to be disclosed by us in reports that we file or submit under the Exchange Act is recorded, processed, summarized and reported within the time periods specified in the SEC rules and forms. Subsequent to December 31, 2020, there were no significant changes in the internal controls or in other factors that could significantly affect these controls, including any corrective actions with regard to significant deficiencies and material weaknesses.
Changes in Internal Control over Financial Reporting
There has been no change in our internal control over financial reporting (as such term is defined in Rules 13a-15(f) and 15(d)-15(f) under the Exchange Act) that occurred during the quarter ended December 31, 2020, that has materially affected, or is reasonably likely to materially affect, our internal control over financial reporting.
Management’s Annual Report on Internal Control over Financial Reporting
We are responsible for establishing and maintaining adequate internal control over financial reporting as defined in Rules 13a-15(f) and 15d-15(f) under the Exchange Act.
Under the supervision and with the participation of management, including the Chief Executive Officer and Chief Financial Officer, an evaluation of the effectiveness of the internal control over financial reporting was conducted at December 31, 2020, based on the criteria described in “Internal Control — Integrated Framework” (2013) issued by the Committee of Sponsoring Organizations of the Treadway Commission. Based on this assessment, management determined that, at December 31, 2020, the internal control over financial reporting was effective.
Limitations of the Effectiveness of Controls
Management’s assessment included an evaluation of the design of the internal control over financial reporting and testing of the operational effectiveness of the internal control over financial reporting. The internal control over financial reporting is a process
45
designed to provide reasonable assurance regarding the reliability of financial reporting and the preparation of financial statements for external purposes in accordance with GAAP. Because of its inherent limitations, internal control over financial reporting may not prevent or detect misstatements. Also, projections of any evaluation of effectiveness to future periods are subject to the risk that controls may become inadequate because of changes in conditions, or that the degree of compliance with the policies or procedures may deteriorate.
ITEM 9B. Other Information
None.
PART III
ITEM 10. Directors, Executive Officers and Corporate Governance
The information required by this item is incorporated herein by reference to, including relevant sections in our 2021 Proxy Statement, under the captions entitled Board of Directors and Corporate Governance; Executive Officers; Executive Compensation; Director Compensation; Security Ownership; Equity Compensation Plans and Additional Information or will be provided in an amendment filed on Form 10-K/A.
ITEM 11. Executive Compensation
The information required by this item is incorporated herein by reference to the relevant sections in our 2021 Proxy Statement, under the captions entitled Board of Directors and Corporate Governance; Executive Officers; Executive Compensation and Director Compensation or will be provided in an amendment filed on Form 10-K/A.
ITEM 12. Security Ownership of Certain Beneficial Owners and Management and Related Stockholder Matters
The information required by this item is incorporated herein by reference to the relevant sections in our 2021 Proxy Statement, under the captions entitled Security Ownership and Equity Compensation Plans or will be provided in an amendment filed on Form 10-K/A.
ITEM 13. Certain Relationships and Related Transactions, and Director Independence
The information required by this item is incorporated herein by reference to the relevant sections in our 2021 Proxy Statement, under the caption entitled Board of Directors and Corporate Governance or will be provided in an amendment filed on Form 10-K/A.
ITEM 14. Principal Accounting Fees and Services
The information required by this item is incorporated herein by reference to the relevant sections in our 2021 Proxy Statement, under the caption entitled Audit Matters or will be provided in an amendment filed on Form 10-K/A.
PART IV
ITEM 15. Exhibits, Financial Statements and Schedules
The following documents are filed as a part of this report:
(a) Financial Statements and Schedules:
1. Financial Statements:
See Index to the Consolidated Financial Statements and Schedule III on page 48 of this report, which is incorporated herein by reference.
2. Financial Statement Schedules:
Schedule III — Real Estate and Accumulated Depreciation
All other schedules have been omitted since the required information is presented in the Consolidated Financial Statements and the related notes or is not applicable.
(b) Exhibits: The Exhibits required by Item 601 of Regulation S-K are listed in the Index to the Exhibits on pages 103 to 112 of this report, which is incorporated herein by reference.
(c) Financial Statements: See Index to the Consolidated Financial Statements and Schedule III on page 48 of this report, which is incorporated by reference.
46
ITEM 16. Form 10-K Summary
Not Applicable.
47
INDEX TO THE CONSOLIDATED FINANCIAL STATEMENTS AND SCHEDULE III
|
|
Page Number |
|
Prologis, Inc. and Prologis, L.P.: |
|
|
49 |
|
|
Prologis, Inc.: |
|
|
52 |
|
|
53 |
|
|
54 |
|
|
55 |
|
|
56 |
|
|
Prologis, L.P.: |
|
|
57 |
|
|
58 |
|
|
59 |
|
|
60 |
|
|
61 |
|
|
Prologis, Inc. and Prologis, L.P.: |
|
|
62 |
|
|
62 |
|
|
62 |
|
|
69 |
|
|
71 |
|
|
73 |
|
|
76 |
|
|
76 |
|
|
77 |
|
|
81 |
|
|
82 |
|
|
82 |
|
|
83 |
|
|
86 |
|
|
89 |
|
|
90 |
|
|
93 |
|
|
94 |
|
|
96 |
|
|
98 |
|
|
100 |
48
REPORT OF INDEPENDENT REGISTERED PUBLIC ACCOUNTING FIRM
To the Stockholders and Board of Directors
Prologis, Inc.:
Opinion on the Consolidated Financial Statements
We have audited the accompanying consolidated balance sheets of Prologis, Inc. and subsidiaries (the Company) as of December 31, 2020 and 2019, the related consolidated statements of income, comprehensive income, equity, and cash flows for each of the years in the three-year period ended December 31, 2020, and the related notes and financial statement schedule III (collectively, the consolidated financial statements). In our opinion, the consolidated financial statements present fairly, in all material respects, the financial position of the Company as of December 31, 2020 and 2019, and the results of its operations and its cash flows for each of the years in the three-year period ended December 31, 2020, in conformity with U.S. generally accepted accounting principles.
We also have audited, in accordance with the standards of the Public Company Accounting Oversight Board (United States) (PCAOB), the Company’s internal control over financial reporting as of December 31, 2020, based on criteria established in Internal Control – Integrated Framework (2013) issued by the Committee of Sponsoring Organizations of the Treadway Commission, and our report dated February 10, 2021 expressed an unqualified opinion on the effectiveness of the Company’s internal control over financial reporting.
Change in Accounting Principle
As discussed in Notes 2 and 4 to the consolidated financial statements, the Company has changed its method of accounting for leases as of January 1, 2019 due to the adoption of Accounting Standards Codification Topic 842, Leases.
Basis for Opinion
These consolidated financial statements are the responsibility of the Company’s management. Our responsibility is to express an opinion on these consolidated financial statements based on our audits. We are a public accounting firm registered with the PCAOB and are required to be independent with respect to the Company in accordance with the U.S. federal securities laws and the applicable rules and regulations of the Securities and Exchange Commission and the PCAOB.
We conducted our audits in accordance with the standards of the PCAOB. Those standards require that we plan and perform the audit to obtain reasonable assurance about whether the consolidated financial statements are free of material misstatement, whether due to error or fraud. Our audits included performing procedures to assess the risks of material misstatement of the consolidated financial statements, whether due to error or fraud, and performing procedures that respond to those risks. Such procedures included examining, on a test basis, evidence regarding the amounts and disclosures in the consolidated financial statements. Our audits also included evaluating the accounting principles used and significant estimates made by management, as well as evaluating the overall presentation of the consolidated financial statements. We believe that our audits provide a reasonable basis for our opinion.
Critical Audit Matters
The critical audit matters communicated below are matters arising from the current period audit of the consolidated financial statements that were communicated or required to be communicated to the audit committee and that: (1) relate to accounts or disclosures that are material to the consolidated financial statements and (2) involved our especially challenging, subjective, or complex judgments. The communication of critical audit matters does not alter in any way our opinion on the consolidated financial statements, taken as a whole, and we are not, by communicating the critical audit matters below, providing separate opinions on the critical audit matters or on the accounts or disclosures to which they relate.
Liberty Transaction
As discussed in Note 3 to the consolidated financial statements, on February 4, 2020 Prologis, Inc. and Prologis, L.P. acquired Liberty Property Trust and Liberty Property Limited Partnership (collectively the “Liberty Transaction”) for $13.0 billion and the transaction was accounted for as an asset acquisition. In asset acquisitions, the Company measures the real estate assets acquired based on their cost or total consideration exchanged and any excess consideration is allocated to the real estate properties, excluding those identified as held for sale, on a relative fair value basis. The components of the acquisition include an initial allocation to investments in real estate properties acquired based on fair value and an initial allocation of that fair value to buildings and land.
We identified the evaluation of the fair value allocated to investments in real estate properties acquired, including the allocation of the property fair value to land and building, in the Liberty Transaction as a critical audit matter. Evaluating the fair value amounts estimated by the Company in the allocation, which have measurement uncertainty, required specialized skill and knowledge. Specifically, testing significant assumptions of market rents and capitalization rates in relation to investments in real estate and testing the allocation of property fair value to land and building.
The following are the primary procedures we performed to address this critical audit matter. We evaluated the design and tested the operating effectiveness of certain internal controls over the Company’s fair value estimation process for investments in real estate properties, land and building. This included controls related to the determination of amounts allocated to land and building and significant assumptions used to estimate the fair value of investments in real estate properties. For a selection of investments in real estate properties we involved valuation professionals with specialized skills and knowledge, who assisted in 1) comparing the Company’s determination of the fair value of investments in real estate properties to sales prices from available property sales, 2) comparing the Company’s significant assumptions used in the determination of the fair value of investments in real estate properties to available leasing information, industry research publications and inquiries of market participants, 3) comparing the Company’s determination of the fair value of land to sales prices from available land sales and 4) comparing the Company’s determination of fair value of building to developed ranges of estimates based on market data, such as industry guides used for developing replacement building values.
Assessment of the Company’s evaluation of the expected holding period for operating properties
As discussed in Notes 2 and 4, the Company had $43,508 million of operating properties as of December 31, 2020. The Company tests the recoverability of operating properties whenever events or changes in circumstances, including shortening the expected holding period of such assets, indicate that the carrying amount of these assets may not be recoverable.
We identified the assessment of the Company’s evaluation of the expected holding period for operating properties as a critical audit matter. Subjective auditor judgment was required to assess the relevant events or changes in circumstances that the Company used to evaluate its expected holding period. A shortening of the expected holding period could indicate a potential impairment.
The following are the primary procedures we performed to address this critical audit matter. We evaluated the design and tested the operating effectiveness of certain internal controls over the Company’s recoverability of operating properties process including controls related to determining the expected holding period and any related changes. We evaluated the Company’s expected holding period by inquiring of the Company regarding changes to the expected holding period, considering certain factors related to the current economic environment, reading minutes of the meetings of the Company’s Board of Directors, reading external communications with investors and analysts, and analyzing documents prepared by the Company regarding proposed real estate transactions and potential triggering events.
/s/ KPMG LLP
We have served as the Company’s auditor since 2002.
Denver, Colorado
February 10, 2021
49
REPORT OF INDEPENDENT REGISTERED PUBLIC ACCOUNTING FIRM
To the Partners of Prologis, L.P. and the Board of Directors of Prologis, Inc.:
Opinion on the Consolidated Financial Statements
We have audited the accompanying consolidated balance sheets of Prologis, L.P. and subsidiaries (the Operating Partnership) as of December 31, 2020 and 2019, the related consolidated statements of income, comprehensive income, capital, and cash flows for each of the years in the three‑year period ended December 31, 2020, and the related notes and financial statement schedule III (collectively, the consolidated financial statements). In our opinion, the consolidated financial statements present fairly, in all material respects, the financial position of the Operating Partnership as of December 31, 2020 and 2019, and the results of its operations and its cash flows for each of the years in the three‑year period ended December 31, 2020, in conformity with U.S. generally accepted accounting principles.
Change in Accounting Principle
As discussed in Notes 2 and 4 to the consolidated financial statements, the Operating Partnership has changed its method of accounting for leases as of January 1, 2019 due to the adoption of Accounting Standards Codification Topic 842, Leases.
Basis for Opinion
These consolidated financial statements are the responsibility of the Operating Partnership’s management. Our responsibility is to express an opinion on these consolidated financial statements based on our audits. We are a public accounting firm registered with the Public Company Accounting Oversight Board (United States) (PCAOB) and are required to be independent with respect to the Company in accordance with the U.S. federal securities laws and the applicable rules and regulations of the Securities and Exchange Commission and the PCAOB.
We conducted our audits in accordance with the standards of the PCAOB. Those standards require that we plan and perform the audit to obtain reasonable assurance about whether the consolidated financial statements are free of material misstatement, whether due to error or fraud. The Operating Partnership is not required to have, nor were we engaged to perform, an audit of its internal control over financial reporting. As part of our audits, we are required to obtain an understanding of internal control over financial reporting but not for the purpose of expressing an opinion on the effectiveness of the Operating Partnership’s internal control over financial reporting. Accordingly, we express no such opinion.
Our audits included performing procedures to assess the risks of material misstatement of the consolidated financial statements, whether due to error or fraud, and performing procedures that respond to those risks. Such procedures included examining, on a test basis, evidence regarding the amounts and disclosures in the consolidated financial statements. Our audits also included evaluating the accounting principles used and significant estimates made by management, as well as evaluating the overall presentation of the consolidated financial statements. We believe that our audits provide a reasonable basis for our opinion.
Critical Audit Matters
The critical audit matters communicated below are matters arising from the current period audit of the consolidated financial statements that were communicated or required to be communicated to the audit committee and that: (1) relate to accounts or disclosures that are material to the consolidated financial statements and (2) involved our especially challenging, subjective, or complex judgments. The communication of critical audit matters does not alter in any way our opinion on the consolidated financial statements, taken as a whole, and we are not, by communicating the critical audit matters below, providing separate opinions on the critical audit matters or on the accounts or disclosures to which they relate.
Liberty Transaction
As discussed in Note 3 to the consolidated financial statements, on February 4, 2020 Prologis, Inc. and Prologis, L.P. acquired Liberty Property Trust and Liberty Property Limited Partnership (collectively the “Liberty Transaction”) for $13.0 billion and the transaction was accounted for as an asset acquisition. In asset acquisitions, the Operating Partnership measures the real estate assets acquired based on their cost or total consideration exchanged and any excess consideration is allocated to the real estate properties, excluding those identified as held for sale, on a relative fair value basis. The components of the acquisition include an initial allocation to investments in real estate properties acquired based on fair value and an initial allocation of that fair value to buildings and land.
We identified the evaluation of the fair value allocated to investments in real estate properties acquired, including the allocation of the property fair value to land and building, in the Liberty Transaction as a critical audit matter. Evaluating the fair value amounts estimated by the Operating Partnership in the allocation, which have measurement uncertainty, required specialized skill and knowledge. Specifically, testing significant assumptions of market rents and capitalization rates in relation to investments in real estate and testing the allocation of property fair value to land and building.
The following are the primary procedures we performed to address this critical audit matter. We evaluated the design and tested the operating effectiveness of certain internal controls over the Operating Partnership’s fair value estimation process for investments in real estate properties, land and building. This included controls related to the determination of amounts allocated to land and building and significant assumptions used to estimate the fair value of investments in real estate properties. For a selection of investments in real estate properties we involved valuation professionals with specialized skills and knowledge, who assisted in 1) comparing the Operating Partnership’s determination of the fair value of investments in real estate properties to sales prices from available property sales, 2) comparing the Operating Partnership’s significant assumptions used in the determination of the fair value of investments in real estate properties to available leasing information, industry research publications and inquiries of market participants, 3) comparing the Operating Partnership’s determination of the fair value of land to sales prices from available land sales and 4) comparing the Operating Partnership’s determination of fair value of building to developed ranges of estimates based on market data, such as industry guides used for developing replacement building values.
Assessment of the Operating Partnership’s evaluation of the expected holding period for operating properties
As discussed in Notes 2 and 4, the Operating Partnership had $43,508 million of operating properties as of December 31, 2020. The Operating Partnership tests the recoverability of operating properties whenever events or changes in circumstances, including shortening the expected holding period of such assets, indicate that the carrying amount of these assets may not be recoverable.
We identified the assessment of the Operating Partnership’s evaluation of the expected holding period for operating properties as a critical audit matter. Subjective auditor judgment was required to assess the relevant events or changes in circumstances that the Operating Partnership used to evaluate its expected holding period. A shortening of the expected holding period could indicate a potential impairment.
The following are the primary procedures we performed to address this critical audit matter. We evaluated the design and tested the operating effectiveness of certain internal controls over the Operating Partnership’s recoverability of operating properties process including controls related to determining the expected holding period and any related changes. We evaluated the Operating Partnership’s expected holding period by inquiring of the Operating Partnership regarding changes to the expected holding period, considering certain factors related to the current economic environment, reading minutes of the meetings of the Board of Directors of Prologis, Inc., reading external communications with investors and analysts, and analyzing documents prepared by the Operating Partnership regarding proposed real estate transactions and potential triggering events.
/s/ KPMG LLP
We have served as the Operating Partnership’s auditor since 2002.
Denver, Colorado
February 10, 2021
50
REPORT OF INDEPENDENT REGISTERED PUBLIC ACCOUNTING FIRM
To the Stockholders and Board of Directors
Prologis, Inc.:
Opinion on Internal Control Over Financial Reporting
We have audited Prologis, Inc. and subsidiaries' (the Company) internal control over financial reporting as of December 31, 2020, based on criteria established in Internal Control – Integrated Framework (2013) issued by the Committee of Sponsoring Organizations of the Treadway Commission. In our opinion, the Company maintained, in all material respects, effective internal control over financial reporting as of December 31, 2020, based on criteria established in Internal Control – Integrated Framework (2013) issued by the Committee of Sponsoring Organizations of the Treadway Commission.
We also have audited, in accordance with the standards of the Public Company Accounting Oversight Board (United States) (PCAOB), the consolidated balance sheets of the Company as of December 31, 2020 and 2019, the related consolidated statements of income, comprehensive income, equity, and cash flows for each of the years in the three-year period ended December 31, 2020, and the related notes and financial statement schedule III (collectively, the consolidated financial statements), and our report dated February 10, 2021 expressed an unqualified opinion on those consolidated financial statements.
Basis for Opinion
The Company’s management is responsible for maintaining effective internal control over financial reporting and for its assessment of the effectiveness of internal control over financial reporting, included in the accompanying Management's Annual Report on Internal Control over Financial Reporting. Our responsibility is to express an opinion on the Company’s internal control over financial reporting based on our audit. We are a public accounting firm registered with the PCAOB and are required to be independent with respect to the Company in accordance with the U.S. federal securities laws and the applicable rules and regulations of the Securities and Exchange Commission and the PCAOB.
We conducted our audit in accordance with the standards of the PCAOB. Those standards require that we plan and perform the audit to obtain reasonable assurance about whether effective internal control over financial reporting was maintained in all material respects. Our audit of internal control over financial reporting included obtaining an understanding of internal control over financial reporting, assessing the risk that a material weakness exists, and testing and evaluating the design and operating effectiveness of internal control based on the assessed risk. Our audit also included performing such other procedures as we considered necessary in the circumstances. We believe that our audit provides a reasonable basis for our opinion.
Definition and Limitations of Internal Control Over Financial Reporting
A company’s internal control over financial reporting is a process designed to provide reasonable assurance regarding the reliability of financial reporting and the preparation of financial statements for external purposes in accordance with generally accepted accounting principles. A company’s internal control over financial reporting includes those policies and procedures that (1) pertain to the maintenance of records that, in reasonable detail, accurately and fairly reflect the transactions and dispositions of the assets of the company; (2) provide reasonable assurance that transactions are recorded as necessary to permit preparation of financial statements in accordance with generally accepted accounting principles, and that receipts and expenditures of the company are being made only in accordance with authorizations of management and directors of the company; and (3) provide reasonable assurance regarding prevention or timely detection of unauthorized acquisition, use, or disposition of the company’s assets that could have a material effect on the financial statements.
Because of its inherent limitations, internal control over financial reporting may not prevent or detect misstatements. Also, projections of any evaluation of effectiveness to future periods are subject to the risk that controls may become inadequate because of changes in conditions, or that the degree of compliance with the policies or procedures may deteriorate.
/s/ KPMG LLP
Denver, Colorado
February 10, 2021
51
PROLOGIS, INC.
CONSOLIDATED BALANCE SHEETS
(In thousands, except per share data)
|
|
December 31, |
|
|||||
|
|
2020 |
|
|
2019 |
|
||
|
ASSETS |
|
|
|
|
|
|
|
|
Investments in real estate properties |
$ |
|
|
|
$ |
|
|
|
Less accumulated depreciation |
|
|
|
|
|
|
|
|
Net investments in real estate properties |
|
|
|
|
|
|
|
|
Investments in and advances to unconsolidated entities |
|
|
|
|
|
|
|
|
Assets held for sale or contribution |
|
|
|
|
|
|
|
|
Net investments in real estate |
|
|
|
|
|
|
|
|
|
|
|
|
|
|
|
|
|
Lease right-of-use assets |
|
|
|
|
|
|
|
|
Cash and cash equivalents |
|
|
|
|
|
|
|
|
Other assets |
|
|
|
|
|
|
|
|
Total assets |
$ |
|
|
|
$ |
|
|
|
|
|
|
|
|
|
|
|
|
LIABILITIES AND EQUITY |
|
|
|
|
|
|
|
|
Liabilities: |
|
|
|
|
|
|
|
|
Debt |
$ |
|
|
|
$ |
|
|
|
Lease liabilities |
|
|
|
|
|
|
|
|
Accounts payable and accrued expenses |
|
|
|
|
|
|
|
|
Other liabilities |
|
|
|
|
|
|
|
|
Total liabilities |
|
|
|
|
|
|
|
|
|
|
|
|
|
|
|
|
|
Equity: |
|
|
|
|
|
|
|
|
Prologis, Inc. stockholders’ equity: |
|
|
|
|
|
|
|
|
Series Q preferred stock at stated liquidation preference of $ 2019, respectively |
|
|
|
|
|
|
|
|
Common stock; $ and 2019, respectively |
|
|
|
|
|
|
|
|
Additional paid-in capital |
|
|
|
|
|
|
|
|
Accumulated other comprehensive loss |
|
( |
) |
|
|
( |
) |
|
Distributions in excess of net earnings |
|
( |
) |
|
|
( |
) |
|
Total Prologis, Inc. stockholders’ equity |
|
|
|
|
|
|
|
|
Noncontrolling interests |
|
|
|
|
|
|
|
|
Total equity |
|
|
|
|
|
|
|
|
Total liabilities and equity |
$ |
|
|
|
$ |
|
|
The accompanying notes are an integral part of these Consolidated Financial Statements.
52
PROLOGIS, INC.
CONSOLIDATED STATEMENTS OF INCOME
(In thousands, except per share amounts)
|
|
|
Years Ended December 31, |
|
|||||||||
|
|
|
2020 |
|
|
2019 |
|
|
2018 |
|
|||
|
Revenues: |
|
|
|
|
|
|
|
|
|
|
|
|
|
Rental |
|
$ |
|
|
|
$ |
|
|
|
$ |
|
|
|
Strategic capital |
|
|
|
|
|
|
|
|
|
|
|
|
|
Development management and other |
|
|
|
|
|
|
|
|
|
|
|
|
|
Total revenues |
|
|
|
|
|
|
|
|
|
|
|
|
|
Expenses: |
|
|
|
|
|
|
|
|
|
|
|
|
|
Rental |
|
|
|
|
|
|
|
|
|
|
|
|
|
Strategic capital |
|
|
|
|
|
|
|
|
|
|
|
|
|
General and administrative |
|
|
|
|
|
|
|
|
|
|
|
|
|
Depreciation and amortization |
|
|
|
|
|
|
|
|
|
|
|
|
|
Other |
|
|
|
|
|
|
|
|
|
|
|
|
|
Total expenses |
|
|
|
|
|
|
|
|
|
|
|
|
|
|
|
|
|
|
|
|
|
|
|
|
|
|
|
Operating income before gains on real estate transactions, net |
|
|
|
|
|
|
|
|
|
|
|
|
|
Gains on dispositions of development properties and land, net |
|
|
|
|
|
|
|
|
|
|
|
|
|
Gains on other dispositions of investments in real estate, net |
|
|
|
|
|
|
|
|
|
|
|
|
|
Operating income |
|
|
|
|
|
|
|
|
|
|
|
|
|
|
|
|
|
|
|
|
|
|
|
|
|
|
|
Other income (expense): |
|
|
|
|
|
|
|
|
|
|
|
|
|
Earnings from unconsolidated entities, net |
|
|
|
|
|
|
|
|
|
|
|
|
|
Interest expense |
|
|
( |
) |
|
|
( |
) |
|
|
( |
) |
|
Interest and other income, net |
|
|
|
|
|
|
|
|
|
|
|
|
|
Foreign currency and derivative gains (losses), net |
|
|
( |
) |
|
|
( |
) |
|
|
|
|
|
Losses on early extinguishment of debt, net |
|
|
( |
) |
|
|
( |
) |
|
|
( |
) |
|
Total other income (expense) |
|
|
( |
) |
|
|
( |
) |
|
|
|
|
|
Earnings before income taxes |
|
|
|
|
|
|
|
|
|
|
|
|
|
Total income tax expense |
|
|
|
|
|
|
|
|
|
|
|
|
|
Consolidated net earnings |
|
|
|
|
|
|
|
|
|
|
|
|
|
Less net earnings attributable to noncontrolling interests |
|
|
|
|
|
|
|
|
|
|
|
|
|
Net earnings attributable to controlling interests |
|
|
|
|
|
|
|
|
|
|
|
|
|
Less preferred stock dividends |
|
|
|
|
|
|
|
|
|
|
|
|
|
Loss on preferred stock repurchase |
|
|
|
|
|
|
|
|
|
|
|
|
|
Net earnings attributable to common stockholders |
|
$ |
|
|
|
$ |
|
|
|
$ |
|
|
|
|
|
|
|
|
|
|
|
|
|
|
|
|
|
Weighted average common shares outstanding – Basic |
|
|
|
|
|
|
|
|
|
|
|
|
|
Weighted average common shares outstanding – Diluted |
|
|
|
|
|
|
|
|
|
|
|
|
|
|
|
|
|
|
|
|
|
|
|
|
|
|
|
Net earnings per share attributable to common stockholders – Basic |
|
$ |
|
|
|
$ |
|
|
|
$ |
|
|
|
|
|
|
|
|
|
|
|
|
|
|
|
|
|
Net earnings per share attributable to common stockholders – Diluted |
|
$ |
|
|
|
$ |
|
|
|
$ |
|
|
The accompanying notes are an integral part of these Consolidated Financial Statements.
53
PROLOGIS, INC.
CONSOLIDATED STATEMENTS OF COMPREHENSIVE INCOME
(In thousands)
|
|
|
Years Ended December 31, |
|
|||||||||
|
|
|
2020 |
|
|
2019 |
|
|
2018 |
|
|||
|
Consolidated net earnings |
|
$ |
|
|
|
$ |
|
|
|
$ |
|
|
|
Other comprehensive income (loss): |
|
|
|
|
|
|
|
|
|
|
|
|
|
Foreign currency translation gains (losses), net |
|
|
( |
) |
|
|
|
|
|
|
( |
) |
|
Unrealized losses on derivative contracts, net |
|
|
( |
) |
|
|
( |
) |
|
|
( |
) |
|
Comprehensive income |
|
|
|
|
|
|
|
|
|
|
|
|
|
Net earnings attributable to noncontrolling interests |
|
|
( |
) |
|
|
( |
) |
|
|
( |
) |
|
Other comprehensive loss (income) attributable to noncontrolling interests |
|
|
|
|
|
|
( |
) |
|
|
|
|
|
Comprehensive income attributable to common stockholders |
|
$ |
|
|
|
$ |
|
|
|
$ |
|
|
The accompanying notes are an integral part of these Consolidated Financial Statements.
54
PROLOGIS, INC.
CONSOLIDATED STATEMENTS OF EQUITY
(In thousands)
|
|
|
|
|
|
Common Stock |
|
|
|
|
|
|
Accumulated |
|
|
Distributions |
|
|
|
|
|
|
|
|
|
|||||||
|
|
|
|
|
|
Number |
|
|
|
|
|
|
Additional |
|
|
Other |
|
|
in Excess of |
|
|
Non- |
|
|
|
|
|
|||||
|
|
Preferred |
|
|
of |
|
|
Par |
|
|
Paid-in |
|
|
Comprehensive |
|
|
Net |
|
|
controlling |
|
|
Total |
|
||||||||
|
|
Stock |
|
|
Shares |
|
|
Value |
|
|
Capital |
|
|
Income (Loss) |
|
|
Earnings |
|
|
Interests |
|
|
Equity |
|
||||||||
|
Balance at January 1, 2018 |
$ |
|
|
|
|
|
|
|
$ |
|
|
|
$ |
|
|
|
$ |
( |
) |
|
$ |
( |
) |
|
$ |
|
|
|
$ |
|
|
|
Consolidated net earnings |
|
- |
|
|
|
- |
|
|
|
- |
|
|
|
- |
|
|
|
- |
|
|
|
|
|
|
|
|
|
|
|
|
|
|
Effect of equity compensation plans |
|
- |
|
|
|
|
|
|
|
|
|
|
|
|
|
|
|
- |
|
|
|
- |
|
|
|
|
|
|
|
|
|
|
DCT Transaction, net of issuance costs |
|
- |
|
|
|
|
|
|
|
|
|
|
|
|
|
|
|
- |
|
|
|
- |
|
|
|
|
|
|
|
|
|
|
Capital contributions |
|
- |
|
|
|
- |
|
|
|
- |
|
|
|
- |
|
|
|
- |
|
|
|
- |
|
|
|
|
|
|
|
|
|
|
Redemption of noncontrolling interests |
|
- |
|
|
|
- |
|
|
|
- |
|
|
|
( |
) |
|
|
- |
|
|
|
- |
|
|
|
( |
) |
|
|
( |
) |
|
Foreign currency translation losses, net |
|
- |
|
|
|
- |
|
|
|
- |
|
|
|
- |
|
|
|
( |
) |
|
|
- |
|
|
|
( |
) |
|
|
( |
) |
|
Unrealized losses on derivative contracts, net |
|
- |
|
|
|
- |
|
|
|
- |
|
|
|
- |
|
|
|
( |
) |
|
|
- |
|
|
|
( |
) |
|
|
( |
) |
|
Reallocation of equity |
|
- |
|
|
|
- |
|
|
|
- |
|
|
|
( |
) |
|
|
- |
|
|
|
- |
|
|
|
|
|
|
|
- |
|
|
Dividends ($ other distributions |
|
- |
|
|
|
- |
|
|
|
- |
|
|
|
( |
) |
|
|
- |
|
|
|
( |
) |
|
|
( |
) |
|
|
( |
) |
|
Balance at December 31, 2018 |
$ |
|
|
|
|
|
|
|
$ |
|
|
|
$ |
|
|
|
$ |
( |
) |
|
$ |
( |
) |
|
$ |
|
|
|
$ |
|
|
|
Consolidated net earnings |
|
- |
|
|
|
- |
|
|
|
- |
|
|
|
- |
|
|
|
- |
|
|
|
|
|
|
|
|
|
|
|
|
|
|
Effect of equity compensation plans |
|
- |
|
|
|
|
|
|
|
|
|
|
|
|
|
|
|
- |
|
|
|
- |
|
|
|
|
|
|
|
|
|
|
Capital contributions |
|
- |
|
|
|
- |
|
|
|
- |
|
|
|
- |
|
|
|
- |
|
|
|
- |
|
|
|
|
|
|
|
|
|
|
Purchase of noncontrolling interests |
|
- |
|
|
|
- |
|
|
|
- |
|
|
|
|
|
|
|
- |
|
|
|
- |
|
|
|
( |
) |
|
|
( |
) |
|
Redemption of noncontrolling interests |
|
- |
|
|
|
|
|
|
|
|
|
|
|
|
|
|
|
- |
|
|
|
- |
|
|
|
( |
) |
|
|
( |
) |
|
Contribution to Brazil venture |
|
- |
|
|
|
- |
|
|
|
- |
|
|
|
- |
|
|
|
- |
|
|
|
- |
|
|
|
( |
) |
|
|
( |
) |
|
Foreign currency translation gains, net |
|
- |
|
|
|
- |
|
|
|
- |
|
|
|
- |
|
|
|
|
|
|
|
- |
|
|
|
|
|
|
|
|
|
|
Unrealized losses on derivative contracts, net |
|
- |
|
|
|
- |
|
|
|
- |
|
|
|
- |
|
|
|
( |
) |
|
|
- |
|
|
|
( |
) |
|
|
( |
) |
|
Reallocation of equity |
|
- |
|
|
|
- |
|
|
|
- |
|
|
|
( |
) |
|
|
- |
|
|
|
- |
|
|
|
|
|
|
|
- |
|
|
Dividends ($ other distributions |
|
- |
|
|
|
- |
|
|
|
- |
|
|
|
( |
) |
|
|
- |
|
|
|
( |
) |
|
|
( |
) |
|
|
( |
) |
|
Balance at December 31, 2019 |
$ |
|
|
|
|
|
|
|
$ |
|
|
|
$ |
|
|
|
$ |
( |
) |
|
$ |
( |
) |
|
$ |
|
|
|
$ |
|
|
|
Consolidated net earnings |
|
- |
|
|
|
- |
|
|
|
- |
|
|
|
- |
|
|
|
- |
|
|
|
|
|
|
|
|
|
|
|
|
|
|
Effect of equity compensation plans |
|
- |
|
|
|
|
|
|
|
|
|
|
|
|
|
|
|
- |
|
|
|
- |
|
|
|
|
|
|
|
|
|
|
Liberty Transaction, net of issuance costs |
|
- |
|
|
|
|
|
|
|
|
|
|
|
|
|
|
|
- |
|
|
|
- |
|
|
|
|
|
|
|
|
|
|
Issuance of units related to acquisitions |
|
- |
|
|
|
- |
|
|
|
- |
|
|
|
- |
|
|
|
- |
|
|
|
- |
|
|
|
|
|
|
|
|
|
|
Repurchase of common shares |
|
- |
|
|
|
( |
) |
|
|
( |
) |
|
|
( |
) |
|
|
- |
|
|
|
- |
|
|
|
- |
|
|
|
( |
) |
|
Repurchase of preferred stock |
|
( |
) |
|
|
- |
|
|
|
- |
|
|
|
|
|
|
|
- |
|
|
|
( |
) |
|
|
- |
|
|
|
( |
) |
|
Capital contributions |
|
- |
|
|
|
- |
|
|
|
- |
|
|
|
- |
|
|
|
- |
|
|
|
- |
|
|
|
|
|
|
|
|
|
|
Redemption of noncontrolling interests |
|
- |
|
|
|
|
|
|
|
|
|
|
|
|
|
|
|
- |
|
|
|
- |
|
|
|
( |
) |
|
|
( |
) |
|
Foreign currency translation losses, net |
|
- |
|
|
|
- |
|
|
|
- |
|
|
|
- |
|
|
|
( |
) |
|
|
- |
|
|
|
( |
) |
|
|
( |
) |
|
Unrealized losses on derivative contracts, net |
|
- |
|
|
|
- |
|
|
|
- |
|
|
|
- |
|
|
|
( |
) |
|
|
- |
|
|
|
( |
) |
|
|
( |
) |
|
Reallocation of equity |
|
- |
|
|
|
- |
|
|
|
- |
|
|
|
( |
) |
|
|
- |
|
|
|
- |
|
|
|
|
|
|
|
- |
|
|
Dividends ($ other distributions |
|
- |
|
|
|
- |
|
|
|
- |
|
|
|
( |
) |
|
|
- |
|
|
|
( |
) |
|
|
( |
) |
|
|
( |
) |
|
Balance at December 31, 2020 |
$ |
|
|
|
|
|
|
|
$ |
|
|
|
$ |
|
|
|
$ |
( |
) |
|
$ |
( |
) |
|
$ |
|
|
|
$ |
|
|
The accompanying notes are an integral part of these Consolidated Financial Statements.
55
PROLOGIS, INC.
CONSOLIDATED STATEMENTS OF CASH FLOWS
(In thousands)
|
|
|
Years Ended December 31, |
|
|||||||||
|
|
|
2020 |
|
|
2019 |
|
|
2018 |
|
|||
|
Operating activities: |
|
|
|
|
|
|
|
|
|
|
|
|
|
Consolidated net earnings |
|
$ |
|
|
|
$ |
|
|
|
$ |
|
|
|
Adjustments to reconcile net earnings to net cash provided by operating activities: |
|
|
|
|
|
|
|
|
|
|
|
|
|
Straight-lined rents and amortization of above and below market leases |
|
|
( |
) |
|
|
( |
) |
|
|
( |
) |
|
Equity-based compensation awards |
|
|
|
|
|
|
|
|
|
|
|
|
|
Depreciation and amortization |
|
|
|
|
|
|
|
|
|
|
|
|
|
Earnings from unconsolidated entities, net |
|
|
( |
) |
|
|
( |
) |
|
|
( |
) |
|
Operating distributions from unconsolidated entities |
|
|
|
|
|
|
|
|
|
|
|
|
|
Decrease (increase) in operating receivables from unconsolidated entities |
|
|
|
|
|
|
|
|
|
|
( |
) |
|
Amortization of debt discounts and debt issuance costs, net |
|
|
|
|
|
|
|
|
|
|
|
|
|
Gains on dispositions of development properties and land, net |
|
|
( |
) |
|
|
( |
) |
|
|
( |
) |
|
Gains on other dispositions of investments in real estate, net |
|
|
( |
) |
|
|
( |
) |
|
|
( |
) |
|
Unrealized foreign currency and derivative losses (gains), net |
|
|
|
|
|
|
|
|
|
|
( |
) |
|
Losses on early extinguishment of debt, net |
|
|
|
|
|
|
|
|
|
|
|
|
|
Deferred income tax expense |
|
|
|
|
|
|
|
|
|
|
|
|
|
Increase in accounts receivable, lease right-of-use assets and other assets |
|
|
( |
) |
|
|
( |
) |
|
|
( |
) |
|
Increase in accounts payable and accrued expenses, lease liabilities and other liabilities |
|
|
|
|
|
|
|
|
|
|
|
|
|
Net cash provided by operating activities |
|
|
|
|
|
|
|
|
|
|
|
|
|
Investing activities: |
|
|
|
|
|
|
|
|
|
|
|
|
|
Real estate development |
|
|
( |
) |
|
|
( |
) |
|
|
( |
) |
|
Real estate acquisitions |
|
|
( |
) |
|
|
( |
) |
|
|
( |
) |
|
Liberty Transaction, net of cash acquired |
|
|
( |
) |
|
|
|
|
|
|
|
|
|
IPT Transaction, net of cash acquired |
|
|
( |
) |
|
|
|
|
|
|
|
|
|
DCT Transaction, net of cash acquired |
|
|
|
|
|
|
|
|
|
|
( |
) |
|
Tenant improvements and lease commissions on previously leased space |
|
|
( |
) |
|
|
( |
) |
|
|
( |
) |
|
Property improvements |
|
|
( |
) |
|
|
( |
) |
|
|
( |
) |
|
Proceeds from dispositions and contributions of real estate properties |
|
|
|
|
|
|
|
|
|
|
|
|
|
Investments in and advances to unconsolidated entities |
|
|
( |
) |
|
|
( |
) |
|
|
( |
) |
|
Return of investment from unconsolidated entities |
|
|
|
|
|
|
|
|
|
|
|
|
|
Proceeds from repayment of notes receivable backed by real estate |
|
|
|
|
|
|
|
|
|
|
|
|
|
Proceeds from the settlement of net investment hedges |
|
|
|
|
|
|
|
|
|
|
|
|
|
Payments on the settlement of net investment hedges |
|
|
( |
) |
|
|
( |
) |
|
|
( |
) |
|
Net cash used in investing activities |
|
|
( |
) |
|
|
( |
) |
|
|
( |
) |
|
Financing activities: |
|
|
|
|
|
|
|
|
|
|
|
|
|
Proceeds from issuance of common stock |
|
|
|
|
|
|
|
|
|
|
|
|
|
Repurchase and retirement of common stock |
|
|
( |
) |
|
|
|
|
|
|
|
|
|
Repurchase of preferred stock |
|
|
( |
) |
|
|
|
|
|
|
|
|
|
Dividends paid on common and preferred stock |
|
|
( |
) |
|
|
( |
) |
|
|
( |
) |
|
Noncontrolling interests contributions |
|
|
|
|
|
|
|
|
|
|
|
|
|
Noncontrolling interests distributions |
|
|
( |
) |
|
|
( |
) |
|
|
( |
) |
|
Settlement of noncontrolling interests |
|
|
( |
) |
|
|
( |
) |
|
|
( |
) |
|
Tax paid for shares withheld |
|
|
( |
) |
|
|
( |
) |
|
|
( |
) |
|
Debt and equity issuance costs paid |
|
|
( |
) |
|
|
( |
) |
|
|
( |
) |
|
Net proceeds from (payments on) credit facilities |
|
|
( |
) |
|
|
|
|
|
|
( |
) |
|
Repurchase of and payments on debt |
|
|
( |
) |
|
|
( |
) |
|
|
( |
) |
|
Proceeds from the issuance of debt |
|
|
|
|
|
|
|
|
|
|
|
|
|
Net cash used in financing activities |
|
|
( |
) |
|
|
( |
) |
|
|
( |
) |
|
|
|
|
|
|
|
|
|
|
|
|
|
|
|
Effect of foreign currency exchange rate changes on cash |
|
|
|
|
|
|
|
|
|
|
( |
) |
|
Net increase (decrease) in cash and cash equivalents |
|
|
( |
) |
|
|
|
|
|
|
( |
) |
|
Cash and cash equivalents, beginning of year |
|
|
|
|
|
|
|
|
|
|
|
|
|
Cash and cash equivalents, end of year |
|
$ |
|
|
|
$ |
|
|
|
$ |
|
|
See Note 18 for information on noncash investing and financing activities and other information.
The accompanying notes are an integral part of these Consolidated Financial Statements.
56
PROLOGIS, L.P.
CONSOLIDATED BALANCE SHEETS
(In thousands)
|
|
December 31, |
|
|||||
|
|
2020 |
|
|
2019 |
|
||
|
ASSETS |
|
|
|
|
|
|
|
|
Investments in real estate properties |
$ |
|
|
|
$ |
|
|
|
Less accumulated depreciation |
|
|
|
|
|
|
|
|
Net investments in real estate properties |
|
|
|
|
|
|
|
|
Investments in and advances to unconsolidated entities |
|
|
|
|
|
|
|
|
Assets held for sale or contribution |
|
|
|
|
|
|
|
|
Net investments in real estate |
|
|
|
|
|
|
|
|
|
|
|
|
|
|
|
|
|
Lease right-of-use assets |
|
|
|
|
|
|
|
|
Cash and cash equivalents |
|
|
|
|
|
|
|
|
Other assets |
|
|
|
|
|
|
|
|
Total assets |
$ |
|
|
|
$ |
|
|
|
|
|
|
|
|
|
|
|
|
LIABILITIES AND CAPITAL |
|
|
|
|
|
|
|
|
Liabilities: |
|
|
|
|
|
|
|
|
Debt |
$ |
|
|
|
$ |
|
|
|
Lease liabilities |
|
|
|
|
|
|
|
|
Accounts payable and accrued expenses |
|
|
|
|
|
|
|
|
Other liabilities |
|
|
|
|
|
|
|
|
Total liabilities |
|
|
|
|
|
|
|
|
|
|
|
|
|
|
|
|
|
Capital: |
|
|
|
|
|
|
|
|
Partners’ capital: |
|
|
|
|
|
|
|
|
General partner – preferred |
|
|
|
|
|
|
|
|
General partner – common |
|
|
|
|
|
|
|
|
Limited partners – common |
|
|
|
|
|
|
|
|
Limited partners – Class A common |
|
|
|
|
|
|
|
|
Total partners’ capital |
|
|
|
|
|
|
|
|
Noncontrolling interests |
|
|
|
|
|
|
|
|
Total capital |
|
|
|
|
|
|
|
|
Total liabilities and capital |
$ |
|
|
|
$ |
|
|
The accompanying notes are an integral part of these Consolidated Financial Statements.
57
PROLOGIS, L.P.
CONSOLIDATED STATEMENTS OF INCOME
(In thousands, except per unit amounts)
|
|
|
Years Ended December 31, |
|
|||||||||
|
|
|
2020 |
|
|
2019 |
|
|
2018 |
|
|||
|
Revenues: |
|
|
|
|
|
|
|
|
|
|
|
|
|
Rental |
|
$ |
|
|
|
$ |
|
|
|
$ |
|
|
|
Strategic capital |
|
|
|
|
|
|
|
|
|
|
|
|
|
Development management and other |
|
|
|
|
|
|
|
|
|
|
|
|
|
Total revenues |
|
|
|
|
|
|
|
|
|
|
|
|
|
Expenses: |
|
|
|
|
|
|
|
|
|
|
|
|
|
Rental |
|
|
|
|
|
|
|
|
|
|
|
|
|
Strategic capital |
|
|
|
|
|
|
|
|
|
|
|
|
|
General and administrative |
|
|
|
|
|
|
|
|
|
|
|
|
|
Depreciation and amortization |
|
|
|
|
|
|
|
|
|
|
|
|
|
Other |
|
|
|
|
|
|
|
|
|
|
|
|
|
Total expenses |
|
|
|
|
|
|
|
|
|
|
|
|
|
|
|
|
|
|
|
|
|
|
|
|
|
|
|
Operating income before gains on real estate transactions, net |
|
|
|
|
|
|
|
|
|
|
|
|
|
Gains on dispositions of development properties and land, net |
|
|
|
|
|
|
|
|
|
|
|
|
|
Gains on other dispositions of investments in real estate, net |
|
|||||||||||