
|
FEBRUARY 29, 2020 |
| 2020 Semi-Annual Report (Unaudited) | ||
BlackRock Municipal Bond Trust (BBK)
BlackRock Municipal Income Investment Quality Trust (BAF)
BlackRock Municipal Income Quality Trust (BYM)
BlackRock Municipal Income Trust II (BLE)
BlackRock MuniHoldings Investment Quality Fund (MFL)
BlackRock MuniVest Fund, Inc. (MVF)
Beginning on January 1, 2021, as permitted by regulations adopted by the Securities and Exchange Commission, paper copies of each Trust’s shareholder reports will no longer be sent by mail, unless you specifically request paper copies of the reports from BlackRock or from your financial intermediary, such as a broker-dealer or bank. Instead, the reports will be made available on a website, and you will be notified by mail each time a report is posted and provided with a website link to access the report.
You may elect to receive all future reports in paper free of charge. If you hold accounts directly with BlackRock, you can call Computershare at (800) 699-1236 to request that you continue receiving paper copies of your shareholder reports. If you hold accounts through a financial intermediary, you can follow the instructions included with this disclosure, if applicable, or contact your financial intermediary to request that you continue to receive paper copies of your shareholder reports. Please note that not all financial intermediaries may offer this service. Your election to receive reports in paper will apply to all funds advised by BlackRock Advisors, LLC or its affiliates, or all funds held with your financial intermediary, as applicable.
If you already elected to receive shareholder reports electronically, you will not be affected by this change and you need not take any action. You may elect to receive electronic delivery of shareholder reports and other communications by contacting your financial intermediary, if you hold accounts through a financial intermediary. Please note that not all financial intermediaries may offer this service.
| Not FDIC Insured • May Lose Value • No Bank Guarantee |


| 2 | THIS PAGE IS NOT PART OF YOUR FUND REPORT |
| Page | ||||
| 2 | ||||
| Semi-Annual Report: |
||||
| 4 | ||||
| 5 | ||||
| 5 | ||||
| 6 | ||||
| Financial Statements: |
||||
| 18 | ||||
| 57 | ||||
| 59 | ||||
| 61 | ||||
| 64 | ||||
| 66 | ||||
| 72 | ||||
| 82 | ||||
| 83 | ||||
| 85 | ||||
| 3 |
Municipal Market Overview For the Reporting Period Ended February 29, 2020
Municipal Market Conditions
| Municipal bonds posted strong total returns during the period, buoyed by a combination of rallying interest rates and a favorable technical backdrop. Interest rates moved lower in 2019 as the Fed turned more dovish on the back of slowing global growth and trade uncertainties, indicated a commitment to sustain the current economic expansion, and executed a mid-cycle adjustment consisting of three 0.25% rate cuts. This dynamic was compounded in early 2020 as elevated event risks, led by a coronavirus epidemic, spurred a flight to quality and pushed interest rates to new all-time lows. At the same |
S&P Municipal Bond Index | |
| Total Returns as of February 29, 2020 | ||
| 6 months: 2.85% | ||
| 12 months: 8.94% | ||
time, municipal technicals remained supportive with historically robust demand outpacing supply. During the 12 months ended February 29, 2020, municipal bond funds experienced net inflows totaling $97 billion (based on data from the Investment Company Institute). Broadly, investors favored the tax-exempt income, diversification, quality, and value of municipal bonds given that tax reform ultimately lowered the top individual tax rate just 2.6% while eliminating deductions. For the same 12-month period, total new issuance was elevated from a historical perspective at $424 billion, but was boosted by robust taxable municipal supply. Taxable municipal issuance picked up late in 2019, as issuers advance refunded tax-exempt debt using taxable municipal bonds for cost savings. While increasing issuance totals, this dynamic ultimately shrinks the size of the tax-exempt market and provides a positive technical tailwind for the natural buyer of the asset class.
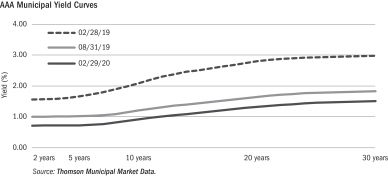
A Closer Look at Yields
|
|
From February 28, 2019 to February 29, 2020, yields on AAA-rated 30-year municipal bonds decreased by 146 basis points (“bps”) from 2.98% to 1.52%, while ten-year rates decreased by 117 bps from 2.10% to 0.93% and five-year rates decreased by 94 bps from 1.67% to 0.73% (as measured by Thomson Municipal Market Data). As a result, the municipal yield curve flattened over the 12-month period with the spread between two- and 30-year maturities flattening by 61 bps, compared to 22 bps of steepening in the comparable U.S. Treasury curve. |
During the same time period, tax-exempt municipal bonds modestly underperformed duration matched U.S. Treasuries, most notably in the front and intermediate part of the yield curve. However, relative valuations remained broadly stretched versus history. Given that the corporate tax rate was lowered much more than the individual rate, institutions have less incentive to own tax-exempt municipal bonds, while individuals are more incentivized. In a more retail-driven market, lower municipal-to-Treasury ratios are likely sustainable as individuals are focused more on generating tax-free income and less concerned with relative valuations. The asset class is known for its lower relative volatility and preservation of principal with an emphasis on income as tax rates rise.
Financial Conditions of Municipal Issuers
Most states and localities are on solid footing as tax receipts are increasing steadily and spending levels are rebounding from post-recession lows. Rising healthcare expenditures and legacy pension costs are plaguing a handful of high-profile credits. Essential service revenue bonds continue to benefit from deleveraging. Several private-public-partnerships and off-balance sheet projects have made headlines for cost-overruns that are calling into question their value-add. More caution is warranted in the non-profit sectors, especially less-selective private education credits that are dealing with competitive pressures and are burdened with outsized debt. Merger and acquisition activity has been elevated in the hospital sector, providing opportunities to generate performance. Additionally, high yield remains an important driver of performance. BlackRock maintains the view that municipal bond defaults will remain minimal and the overall market is fundamentally sound. However, we continue to advocate careful credit research and believe that a thoughtful approach to structure and security selection remains imperative amid uncertainty in a modestly improving economic environment.
The opinions expressed are those of BlackRock as of February 29, 2020 and are subject to change at any time due to changes in market or economic conditions. The comments should not be construed as a recommendation of any individual holdings or market sectors. Investing involves risk including loss of principal. Bond values fluctuate in price so the value of your investment can go down depending on market conditions. Fixed income risks include interest-rate and credit risk. Typically, when interest rates rise, there is a corresponding decline in bond values. Credit risk refers to the possibility that the bond issuer will not be able to make principal and interest payments. There may be less information on the financial condition of municipal issuers than for public corporations. The market for municipal bonds may be less liquid than for taxable bonds. Some investors may be subject to Alternative Minimum Tax (“AMT”). Capital gains distributions, if any, are taxable.
The S&P Municipal Bond Index, a broad, market value-weighted index, seeks to measure the performance of the U.S. municipal bond market. All bonds in the index are exempt from U.S. federal income taxes or subject to the AMT. Past performance is no guarantee of future results. Index performance is shown for illustrative purposes only. It is not possible to invest directly in an index.
| 4 | 2020 BLACKROCK SEMI-ANNUAL REPORT TO SHAREHOLDERS |
The Benefits and Risks of Leveraging
The Trusts may utilize leverage to seek to enhance the distribution rate on, and net asset value (“NAV”) of, their common shares (“Common Shares”). However, there is no guarantee that these objectives can be achieved in all interest rate environments.
In general, the concept of leveraging is based on the premise that the financing cost of leverage, which is based on short-term interest rates, is normally lower than the income earned by a Trust on its longer-term portfolio investments purchased with the proceeds from leverage. To the extent that the total assets of each Trust (including the assets obtained from leverage) are invested in higher-yielding portfolio investments, each Trust’s shareholders benefit from the incremental net income. The interest earned on securities purchased with the proceeds from leverage (after paying the leverage costs) is paid to shareholders in the form of dividends, and the value of these portfolio holdings (less the leverage liability) is reflected in the per share NAV.
To illustrate these concepts, assume a Trust’s Common Shares capitalization is $100 million and it utilizes leverage for an additional $30 million, creating a total value of $130 million available for investment in longer-term income securities. If prevailing short-term interest rates are 3% and longer-term interest rates are 6%, the yield curve has a strongly positive slope. In this case, a Trust’s financing costs on the $30 million of proceeds obtained from leverage are based on the lower short-term interest rates. At the same time, the securities purchased by a Trust with the proceeds from leverage earn income based on longer-term interest rates. In this case, a Trust’s financing cost of leverage is significantly lower than the income earned on a Trust’s longer-term investments acquired from such leverage proceeds, and therefore the holders of Common Shares (“Common Shareholders”) are the beneficiaries of the incremental net income.
However, in order to benefit Common Shareholders, the return on assets purchased with leverage proceeds must exceed the ongoing costs associated with the leverage. If interest and other costs of leverage exceed the Trust’s return on assets purchased with leverage proceeds, income to shareholders is lower than if the Trust had not used leverage. Furthermore, the value of the Trusts’ portfolio investments generally varies inversely with the direction of long-term interest rates, although other factors can influence the value of portfolio investments. In contrast, the value of each Trust’s obligations under its respective leverage arrangement generally does not fluctuate in relation to interest rates. As a result, changes in interest rates can influence the Trusts’ NAVs positively or negatively. Changes in the future direction of interest rates are very difficult to predict accurately, and there is no assurance that the Trust’s intended leveraging strategy will be successful.
The use of leverage also generally causes greater changes in each Trust’s NAV, market price and dividend rates than comparable portfolios without leverage. In a declining market, leverage is likely to cause a greater decline in the NAV and market price of a Trust’s Common Shares than if the Trust were not leveraged. In addition, each Trust may be required to sell portfolio securities at inopportune times or at distressed values in order to comply with regulatory requirements applicable to the use of leverage or as required by the terms of leverage instruments, which may cause the Trust to incur losses. The use of leverage may limit a Trust’s ability to invest in certain types of securities or use certain types of hedging strategies. Each Trust incurs expenses in connection with the use of leverage, all of which are borne by Common Shareholders and may reduce income to the Common Shares. Moreover, to the extent the calculation of each Trust’s investment advisory fees includes assets purchased with the proceeds of leverage, the investment advisory fees payable to the Trusts’ investment adviser will be higher than if the Trusts did not use leverage.
To obtain leverage, each Trust has issued Variable Rate Demand Preferred Shares (“VRDP Shares”) or Variable Rate Muni Term Preferred Shares (“VMTP Shares”) (collectively, “Preferred Shares”) and/or leveraged its assets through the use of tender option bond trusts (“TOB Trusts”) as described in the Notes to Financial Statements.
Under the Investment Company Act of 1940, as amended (the “1940 Act”), each Trust is permitted to issue debt up to 33 1/3% of its total managed assets or equity securities (e.g., Preferred Shares) up to 50% of its total managed assets. A Trust may voluntarily elect to limit its leverage to less than the maximum amount permitted under the 1940 Act. In addition, a Trust may also be subject to certain asset coverage, leverage or portfolio composition requirements imposed by the Preferred Shares’ governing instruments or by agencies rating the Preferred Shares, which may be more stringent than those imposed by the 1940 Act.
If a Trust segregates or designates on its books and records cash or liquid assets having a value not less than the value of a Trust’s obligations under the TOB Trust (including accrued interest), then the TOB Trust is not considered a senior security and is not subject to the foregoing limitations and requirements imposed by the 1940 Act.
Derivative Financial Instruments
The Trusts may invest in various derivative financial instruments. These instruments are used to obtain exposure to a security, commodity, index, market, and/or other assets without owning or taking physical custody of securities, commodities and/or other referenced assets or to manage market, equity, credit, interest rate, foreign currency exchange rate, commodity and/or other risks. Derivative financial instruments may give rise to a form of economic leverage and involve risks, including the imperfect correlation between the value of a derivative financial instrument and the underlying asset, possible default of the counterparty to the transaction or illiquidity of the instrument. The Trusts’ successful use of a derivative financial instrument depends on the investment adviser’s ability to predict pertinent market movements accurately, which cannot be assured. The use of these instruments may result in losses greater than if they had not been used, may limit the amount of appreciation a Trust can realize on an investment and/or may result in lower distributions paid to shareholders. The Trusts’ investments in these instruments, if any, are discussed in detail in the Notes to Financial Statements.
| THE BENEFITS AND RISKS OF LEVERAGING / DERIVATIVE FINANCIAL INSTRUMENTS | 5 |
| Trust Summary as of February 29, 2020 | BlackRock Municipal Bond Trust |
Trust Overview
BlackRock Municipal Bond Trust’s (BBK) (the “Trust”) investment objective is to provide current income exempt from regular U.S. federal income tax. The Trust seeks to achieve its investment objective by investing primarily in municipal bonds exempt from regular U.S. federal income taxes (except that the interest may be subject to the U.S. federal alternative minimum tax). The Trust invests, under normal market conditions, at least 80% of its managed assets in municipal bonds that are investment grade quality or, if unrated, determined to be of comparable quality by the investment adviser at the time of investment. The Trust may invest directly in securities or synthetically through the use of derivatives.
No assurance can be given that the Trust’s investment objective will be achieved.
Trust Information
| Symbol on New York Stock Exchange (“NYSE”) |
BBK | |
| Initial Offering Date |
April 30, 2002 | |
| Yield on Closing Market Price as of February 29, 2020 ($15.94)(a) |
4.10% | |
| Tax Equivalent Yield(b) |
6.93% | |
| Current Monthly Distribution per Common Share(c) |
$0.0545 | |
| Current Annualized Distribution per Common Share(c) |
$0.6540 | |
| Leverage as of February 29, 2020(d) |
38% |
| (a) | Yield on closing market price is calculated by dividing the current annualized distribution per share by the closing market price. Past performance does not guarantee future results. |
| (b) | Tax equivalent yield assumes the maximum marginal U.S. federal tax rate of 40.8%, which includes the 3.8% Medicare tax. Actual tax rates will vary based on income, exemptions and deductions. Lower taxes will result in lower tax equivalent yields. |
| (c) | The monthly distribution per Common Share, declared on March 2, 2020, was increased to $0.0560 per share. The yield on closing market price, tax equivalent yield, current monthly distribution per Common Share, and current annualized distribution per Common Share do not reflect the new distribution rate. The new distribution rate is not constant and is subject to change in the future. |
| (d) | Represents VMTP Shares and TOB Trusts as a percentage of total managed assets, which is the total assets of the Trust, including any assets attributable to VMTP Shares and TOB Trusts, minus the sum of accrued liabilities. Does not reflect derivatives or other instruments that may give rise to economic leverage. For a discussion of leveraging techniques utilized by the Trust, please see The Benefits and Risks of Leveraging and Derivative Financial Instruments on page 5. |
Performance
Returns for the six months ended February 29, 2020 were as follows:
| Returns Based On | ||||||||
| Market Price | NAV | |||||||
| BBK(a)(b) |
2.02 | % | 4.58 | % | ||||
| Lipper General & Insured Municipal Debt Funds (Leveraged)(c) |
1.89 | 4.82 | ||||||
| (a) | All returns reflect reinvestment of dividends and/or distributions at actual reinvestment prices. |
| (b) | The Trust’s discount to NAV widened during the period, which accounts for the difference between performance based on market price and performance based on NAV. |
| (c) | Average return. Returns reflect reinvestment of dividends and/or distributions at NAV on the ex-dividend date as calculated by Lipper. |
Performance results may include adjustments made for financial reporting purposes in accordance with U.S. generally accepted accounting principles.
Past performance is not indicative of future results.
The following discussion relates to the Trust’s absolute performance based on NAV:
After moving sideways for much of the period, municipal bonds finished with positive returns thanks to their rally in January and February. The gains for the broader bond market reflected the likelihood of an economic downturn caused by the spread of coronavirus, together with expectations for interest rate cuts by the Fed. (Bond prices rise as yields fall.) The favorable combination of robust investor demand and relatively limited new-issue supply provided an additional tailwind for tax-exempt securities.
Portfolio income, enhanced by leverage, exceeded the contribution from price appreciation. At the sector level, the Trust benefited from its positions in school district, state tax-backed and health care issues. Holdings in longer-term bonds, particularly those with lower coupons, were also strong performers. A meaningful position in securities rated below investment grade, which outperformed the broader market as a group, was a further positive.
The Trust actively sought to manage interest rate risk using U.S. Treasury futures. Since U.S. Treasury yields fell, as prices rose, this strategy detracted from Trust performance. The trend of net negative issuance exacerbated reinvestment risk as the proceeds from bonds that matured or were called needed to be reinvested at lower prevailing yields compared to bonds that were issued when yields were higher.
The views expressed reflect the opinions of BlackRock as of the date of this report and are subject to change based on changes in market, economic or other conditions. These views are not intended to be a forecast of future events and are no guarantee of future results.
| 6 | 2020 BLACKROCK SEMI-ANNUAL REPORT TO SHAREHOLDERS |
| Trust Summary as of February 29, 2020 (continued) | BlackRock Municipal Bond Trust |
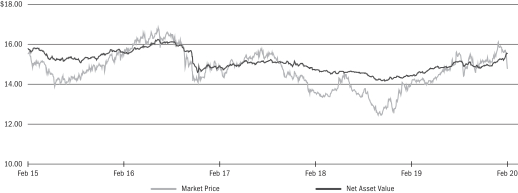
Market Price and Net Asset Value Per Share Summary
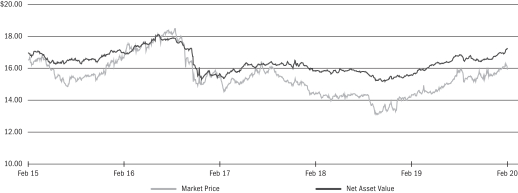
| 02/29/20 | 08/31/19 | Change | High | Low | ||||||||||||||||
| Market Price |
$ | 15.94 | $ | 15.95 | (0.06 | )% | $ | 16.50 | $ | 15.07 | ||||||||||
| Net Asset Value |
17.23 | 16.82 | 2.44 | 17.24 | 16.42 | |||||||||||||||
Market Price and Net Asset Value History For the Past Five Years
Overview of the Trust’s Total Investments *
| * | Excludes short-term securities. |
| TRUST SUMMARY | 7 |
| Trust Summary as of February 29, 2020 | BlackRock Municipal Income Investment Quality Trust |
Trust Overview
BlackRock Municipal Income Investment Quality Trust’s (BAF) (the “Trust”) investment objective is to provide current income exempt from U.S. federal income tax, including the alternative minimum tax and Florida intangible property tax. The Trust seeks to achieve its investment objective by investing, under normal circumstances, at least 80% of its managed assets in municipal bonds exempt from U.S. federal income taxes, including the alternative minimum tax. The Trust also invests at least 80% of its managed assets in municipal bonds that are investment grade quality at the time of investment or, if unrated, determined to be of comparable quality by the investment adviser at the time of investment. Effective July 31, 2019, the Trust may invest up to 20% of its managed assets in securities that are rated below investment grade, or are considered by BlackRock to be of comparable quality, at the time of purchase. The Trust may invest directly in securities or synthetically through the use of derivatives. Due to the repeal of the Florida intangible personal property tax, in September 2008, the Board gave approval to permit the Trust the flexibility to invest in municipal obligations regardless of geographic location since municipal obligations issued by any state or municipality that provides income exempt from regular U.S. federal income tax would now satisfy the foregoing objective and policy.
No assurance can be given that the Trust’s investment objective will be achieved.
Trust Information
| Symbol on NYSE |
BAF | |
| Initial Offering Date |
October 31, 2002 | |
| Yield on Closing Market Price as of February 29, 2020 ($14.36)(a) |
4.30% | |
| Tax Equivalent Yield(b) |
7.26% | |
| Current Monthly Distribution per Common Share(c) |
$0.0515 | |
| Current Annualized Distribution per Common Share(c) |
$0.6180 | |
| Leverage as of February 29, 2020(d) |
41% |
| (a) | Yield on closing market price is calculated by dividing the current annualized distribution per share by the closing market price. Past performance does not guarantee future results. |
| (b) | Tax equivalent yield assumes the maximum marginal U.S. federal tax rate of 40.8%, which includes the 3.8% Medicare tax. Actual tax rates will vary based on income, exemptions and deductions. Lower taxes will result in lower tax equivalent yields. |
| (c) | The distribution rate is not constant and is subject to change. |
| (d) | Represents VMTP Shares and TOB Trusts as a percentage of total managed assets, which is the total assets of the Trust, including any assets attributable to VMTP Shares and TOB Trusts, minus the sum of accrued liabilities. Does not reflect derivatives or other instruments that may give rise to economic leverage. For a discussion of leveraging techniques utilized by the Trust, please see The Benefits and Risks of Leveraging and Derivative Financial Instruments on page 5. |
Performance
Returns for the six months ended February 29, 2020 were as follows:
| Returns Based On | ||||||||
| Market Price | NAV | |||||||
| BAF(a)(b) |
0.95 | % | 4.17 | % | ||||
| Lipper General & Insured Municipal Debt Funds (Leveraged)(c) |
1.89 | 4.82 | ||||||
| (a) | All returns reflect reinvestment of dividends and/or distributions at actual reinvestment prices. |
| (b) | The Trust’s discount to NAV widened during the period, which accounts for the difference between performance based on market price and performance based on NAV. |
| (c) | Average return. Returns reflect reinvestment of dividends and/or distributions at NAV on the ex-dividend date as calculated by Lipper. |
Performance results may include adjustments made for financial reporting purposes in accordance with U.S. generally accepted accounting principles.
Past performance is not indicative of future results.
The following discussion relates to the Trust’s absolute performance based on NAV:
After moving sideways for much of the period, municipal bonds finished with positive returns thanks to their rally in January and February. The gains for the broader bond market reflected the likelihood of an economic downturn caused by the spread of coronavirus, together with expectations for interest rate cuts by the Fed. (Bond prices rise as yields fall.) The favorable combination of robust investor demand and relatively limited new-issue supply provided an additional tailwind for tax-exempt securities.
Holdings in longer-dated securities with maturities of greater than 20 years generated the strongest returns, as longer-term bonds outpaced short-term issues. The Trust’s use of leverage, which enhanced portfolio income and amplified the impact of rising prices, also contributed to results. The Trust further benefited from its positions in the state tax-backed and transportation sectors, as well as its holdings in Puerto Rico sales tax bonds.
The Trust actively sought to manage interest rate risk using U.S. Treasury futures. Since U.S. Treasury yields fell, as prices rose, this strategy detracted from Trust performance. The trend of net negative issuance exacerbated reinvestment risk as the proceeds from bonds that matured or were called needed to be reinvested at lower prevailing yields compared to bonds that were issued when yields were higher. Positions in pre-refunded bonds and short duration issues, while producing positive absolute returns, lagged somewhat in the rising market.
The views expressed reflect the opinions of BlackRock as of the date of this report and are subject to change based on changes in market, economic or other conditions. These views are not intended to be a forecast of future events and are no guarantee of future results.
| 8 | 2020 BLACKROCK SEMI-ANNUAL REPORT TO SHAREHOLDERS |
| Trust Summary as of February 29, 2020 (continued) | BlackRock Municipal Income Investment Quality Trust |
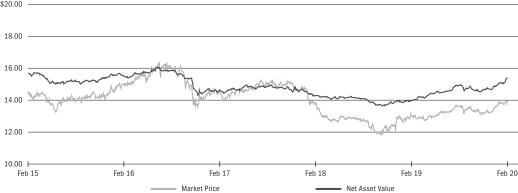
Market Price and Net Asset Value Per Share Summary
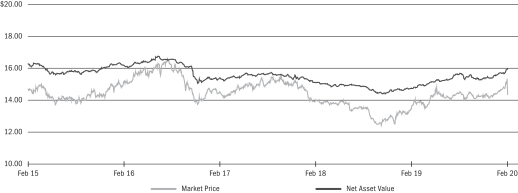
| 02/29/20 | 08/31/19 | Change | High | Low | ||||||||||||||||
| Market Price |
$ | 14.36 | $ | 14.53 | (1.17 | )% | $ | 15.43 | $ | 14.02 | ||||||||||
| Net Asset Value |
15.99 | 15.68 | 1.98 | 15.99 | 15.28 | |||||||||||||||
Market Price and Net Asset Value History For the Past Five Years
Overview of the Trust’s Total Investments *
| TRUST SUMMARY | 9 |
| Trust Summary as of February 29, 2020 | BlackRock Municipal Income Quality Trust |
Trust Overview
BlackRock Municipal Income Quality Trust’s (BYM) (the “Trust”) investment objective is to provide current income exempt from U.S. federal income taxes, including the alternative minimum tax. The Trust seeks to achieve its investment objective by investing, under normal circumstances, at least 80% of its managed assets in municipal bonds exempt from U.S. federal income taxes, including the U.S. federal alternative minimum tax. The Trust also invests at least 80% of its managed assets in municipal bonds that are investment grade quality at the time of investment or, if unrated, determined to be of comparable quality by the investment adviser at the time of investment. Effective July 31, 2019, the Trust may invest up to 20% of its managed assets in securities that are rated below investment grade, or are considered by BlackRock to be of comparable quality, at the time of purchase. The Trust may invest directly in securities or synthetically through the use of derivatives.
No assurance can be given that the Trust’s investment objective will be achieved.
Trust Information
| Symbol on NYSE |
BYM | |
| Initial Offering Date |
October 31, 2002 | |
| Yield on Closing Market Price as of February 29, 2020 ($14.39)(a) |
4.00% | |
| Tax Equivalent Yield(b) |
6.76% | |
| Current Monthly Distribution per Common Share(c) |
$0.0480 | |
| Current Annualized Distribution per Common Share(c) |
$0.5760 | |
| Leverage as of February 29, 2020(d) |
38% |
| (a) | Yield on closing market price is calculated by dividing the current annualized distribution per share by the closing market price. Past performance does not guarantee future results. |
| (b) | Tax equivalent yield assumes the maximum marginal U.S. federal tax rate of 40.8%, which includes the 3.8% Medicare tax. Actual tax rates will vary based on income, exemptions and deductions. Lower taxes will result in lower tax equivalent yields. |
| (c) | The distribution rate is not constant and is subject to change. A portion of the distribution may be deemed a return of capital or net realized gain. |
| (d) | Represents VMTP Shares and TOB Trusts as a percentage of total managed assets, which is the total assets of the Trust, including any assets attributable to VMTP Shares and TOB Trusts, minus the sum of accrued liabilities. Does not reflect derivatives or other instruments that may give rise to economic leverage. For a discussion of leveraging techniques utilized by the Trust, please see The Benefits and Risks of Leveraging and Derivative Financial Instruments on page 5. |
Performance
Returns for the six months ended February 29, 2020 were as follows:
| Returns Based On | ||||||||
| Market Price | NAV | |||||||
| BYM(a)(b) |
3.48 | % | 4.44 | % | ||||
| Lipper General & Insured Municipal Debt Funds (Leveraged)(c) |
1.89 | 4.82 | ||||||
| (a) | All returns reflect reinvestment of dividends and/or distributions at actual reinvestment prices. |
| (b) | The Trust’s discount to NAV widened during the period, which accounts for the difference between performance based on market price and performance based on NAV. |
| (c) | Average return. Returns reflect reinvestment of dividends and/or distributions at NAV on the ex-dividend date as calculated by Lipper. |
Performance results may include adjustments made for financial reporting purposes in accordance with U.S. generally accepted accounting principles.
Past performance is not indicative of future results.
The following discussion relates to the Trust’s absolute performance based on NAV:
After moving sideways for much of the period, municipal bonds finished with positive returns thanks to their rally in January and February. The gains for the broader bond market reflected the likelihood of an economic downturn caused by the spread of coronavirus, together with expectations for interest rate cuts by the Fed. (Bond prices rise as yields fall.) The favorable combination of robust investor demand and relatively limited new-issue supply provided an additional tailwind for tax-exempt securities.
Holdings in longer-term bonds, particularly those with lower coupons, were key contributors to the Trust’s six-month results. AA rated issues also performed very well and added to returns. The Trust’s use of leverage contributed to results by enhancing portfolio income and amplifying the impact of rising prices. At the sector level, the Trust benefited from its positions in state tax-backed, health care and school district issues.
The Trust actively sought to manage interest rate risk using U.S. Treasury futures. Since U.S. Treasury yields fell, as prices rose, this strategy detracted from Trust performance. The trend of net negative issuance exacerbated reinvestment risk as the proceeds from bonds that matured or were called needed to be reinvested at lower prevailing yields compared to bonds that were issued when yields were higher. The Trust’s higher-quality focus also detracted at a time in which high yield bonds (those rated BBB and below) outperformed the rest of the market. However, the investment adviser began adding to high yield debt during the period as a result of a change in the Trust’s quality designation.
The views expressed reflect the opinions of BlackRock as of the date of this report and are subject to change based on changes in market, economic or other conditions. These views are not intended to be a forecast of future events and are no guarantee of future results.
| 10 | 2020 BLACKROCK SEMI-ANNUAL REPORT TO SHAREHOLDERS |
| Trust Summary as of February 29, 2020 (continued) | BlackRock Municipal Income Quality Trust |
Market Price and Net Asset Value Per Share Summary
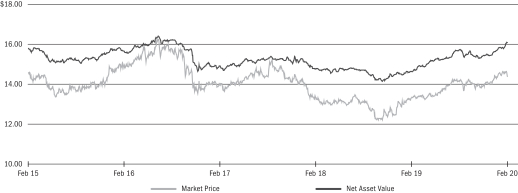
| 02/29/20 | 08/31/19 | Change | High | Low | ||||||||||||||||
| Market Price |
$ | 14.39 | $ | 14.19 | 1.41 | % | $ | 14.68 | $ | 13.63 | ||||||||||
| Net Asset Value |
16.09 | 15.72 | 2.35 | 16.10 | 15.30 | |||||||||||||||
Market Price and Net Asset Value History For the Past Five Years
Overview of the Trust’s Total Investments *
| TRUST SUMMARY | 11 |
| Trust Summary as of February 29, 2020 | BlackRock Municipal Income Trust II |
Trust Overview
BlackRock Municipal Income Trust II’s (BLE) (the “Trust”) investment objective is to provide current income exempt from regular U.S. federal income tax. The Trust seeks to achieve its investment objective by investing primarily in municipal bonds exempt from U.S. federal income taxes (except that the interest may be subject to the U.S. federal alternative minimum tax). The Trust invests, under normal market conditions, at least 80% of its managed assets in municipal bonds that are investment grade quality at the time of investment or, if unrated, determined to be of comparable quality by the investment adviser at the time of investment. The Trust may invest directly in securities or synthetically through the use of derivatives.
No assurance can be given that the Trust’s investment objective will be achieved.
Trust Information
| Symbol on NYSE |
BLE | |
| Initial Offering Date |
July 30, 2002 | |
| Yield on Closing Market Price as of February 29, 2020 ($14.78)(a) |
4.71% | |
| Tax Equivalent Yield(b) |
7.96% | |
| Current Monthly Distribution per Common Share(c) |
$0.0580 | |
| Current Annualized Distribution per Common Share(c) |
$0.6960 | |
| Leverage as of February 29, 2020(d) |
38% |
| (a) | Yield on closing market price is calculated by dividing the current annualized distribution per share by the closing market price. Past performance does not guarantee future results. |
| (b) | Tax equivalent yield assumes the maximum marginal U.S. federal tax rate of 40.8%, which includes the 3.8% Medicare tax. Actual tax rates will vary based on income, exemptions and deductions. Lower taxes will result in lower tax equivalent yields. |
| (c) | The distribution rate is not constant and is subject to change. |
| (d) | Represents VMTP Shares and TOB Trusts as a percentage of total managed assets, which is the total assets of the Trust, including any assets attributable to VMTP Shares and TOB Trusts, minus the sum of accrued liabilities. Does not reflect derivatives or other instruments that may give rise to economic leverage. For a discussion of leveraging techniques utilized by the Trust, please see The Benefits and Risks of Leveraging and Derivative Financial Instruments on page 5. |
Performance
Returns for the six months ended February 29, 2020 were as follows:
| Returns Based On | ||||||||
| Market Price | NAV | |||||||
| BLE(a)(b) |
(2.29 | )% | 4.90 | % | ||||
| Lipper General & Insured Municipal Debt Funds (Leveraged)(c) |
1.89 | 4.82 | ||||||
| (a) | All returns reflect reinvestment of dividends and/or distributions at actual reinvestment prices. |
| (b) | The Trust moved from a premium to NAV to a discount during the period, which accounts for the difference between performance based on market price and performance based on NAV. |
| (c) | Average return. Returns reflect reinvestment of dividends and/or distributions at NAV on the ex-dividend date as calculated by Lipper. |
Performance results may include adjustments made for financial reporting purposes in accordance with U.S. generally accepted accounting principles.
Past performance is not indicative of future results.
The following discussion relates to the Trust’s absolute performance based on NAV:
After moving sideways for much of the period, municipal bonds finished with positive returns thanks to their rally in January and February. The gains for the broader bond market reflected the likelihood of an economic downturn caused by the spread of coronavirus, together with expectations for interest rate cuts by the Fed. (Bond prices rise as yields fall.) The favorable combination of robust investor demand and relatively limited new-issue supply provided an additional tailwind for tax-exempt securities.
Portfolio income, enhanced by leverage, was a key contributor to total returns in the six-month period. The Trust’s significant allocation to investment-grade bonds was also a key driver of overall performance, with more muted contributions coming from non-investment grade and unrated positions. Longer-dated investments with maturities of greater than 20 years performed very well and helped Trust performance. At the sector level, tobacco, state tax-backed, transportation and health care issues were the largest contributors.
The Trust actively sought to manage interest rate risk using U.S. Treasury futures. Since U.S. Treasury yields fell, as prices rose, this strategy detracted from Trust performance.
The views expressed reflect the opinions of BlackRock as of the date of this report and are subject to change based on changes in market, economic or other conditions. These views are not intended to be a forecast of future events and are no guarantee of future results.
| 12 | 2020 BLACKROCK SEMI-ANNUAL REPORT TO SHAREHOLDERS |
| Trust Summary as of February 29, 2020 (continued) | BlackRock Municipal Income Trust II |
Market Price and Net Asset Value Per Share Summary
| 02/29/20 | 08/31/19 | Change | High | Low | ||||||||||||||||
| Market Price |
$ | 14.78 | $ | 15.48 | (4.52 | )% | $ | 16.12 | $ | 14.23 | ||||||||||
| Net Asset Value |
15.54 | 15.16 | 2.51 | 15.55 | 14.81 | |||||||||||||||
Market Price and Net Asset Value History For the Past Five Years
Overview of the Trust’s Total Investments *
| TRUST SUMMARY | 13 |
| Trust Summary as of February 29, 2020 | BlackRock MuniHoldings Investment Quality Fund |
Trust Overview
BlackRock MuniHoldings Investment Quality Fund’s (MFL) (the “Trust”) investment objective is to provide shareholders with current income exempt from U.S. federal income tax and to provide shareholders with the opportunity to own shares the value of which is exempt from Florida intangible personal property tax. The Trust seeks to achieve its investment objective by investing primarily in long-term, investment grade (as rated or, if unrated, determined to be of comparable quality by the investment adviser at the time of investment) municipal obligations exempt from U.S. federal income taxes (except that the interest may be subject to the U.S. federal alternative minimum tax). Under normal market conditions, the Trust invests at least 80% of its assets in municipal obligations with remaining maturities of one year or more at the time of investment. Effective July 31, 2019, the Trust may invest up to 20% of its managed assets in securities that are rated below investment grade, or are considered by BlackRock to be of comparable quality, at the time of purchase. The Trust may invest directly in securities or synthetically through the use of derivatives. Due to the repeal of the Florida intangible personal property tax, in September 2008, the Board gave approval to permit the Trust the flexibility to invest in municipal obligations regardless of geographic location since municipal obligations issued by any state or municipality that provides income exempt from regular U.S. federal income tax would now satisfy the foregoing objective and policy.
No assurance can be given that the Trust’s investment objective will be achieved.
Trust Information
| Symbol on NYSE |
MFL | |
| Initial Offering Date |
September 26, 1997 | |
| Yield on Closing Market Price as of February 29, 2020 ($13.75)(a) |
3.97% | |
| Tax Equivalent Yield(b) |
6.71% | |
| Current Monthly Distribution per Common Share(c) |
$0.0455 | |
| Current Annualized Distribution per Common Share(c) |
$0.5460 | |
| Leverage as of February 29, 2020(d) |
39% |
| (a) | Yield on closing market price is calculated by dividing the current annualized distribution per share by the closing market price. Past performance does not guarantee future results. |
| (b) | Tax equivalent yield assumes the maximum marginal U.S. federal tax rate of 40.8%, which includes the 3.8% Medicare tax. Actual tax rates will vary based on income, exemptions and deductions. Lower taxes will result in lower tax equivalent yields. |
| (c) | The distribution rate is not constant and is subject to change. |
| (d) | Represents VRDP Shares and TOB Trusts as a percentage of total managed assets, which is the total assets of the Trust, including any assets attributable to VRDP Shares and TOB Trusts, minus the sum of accrued liabilities. Does not reflect derivatives or other instruments that may give rise to economic leverage. For a discussion of leveraging techniques utilized by the Trust, please see The Benefits and Risks of Leveraging and Derivative Financial Instruments on page 5. |
Performance
Returns for the six months ended February 29, 2020 were as follows:
| Returns Based On | ||||||||
| Market Price | NAV | |||||||
| MFL(a)(b) |
3.15 | % | 5.24 | % | ||||
| Lipper General & Insured Municipal Debt Funds (Leveraged)(c) |
1.89 | 4.82 | ||||||
| (a) | All returns reflect reinvestment of dividends and/or distributions at actual reinvestment prices. |
| (b) | The Trust’s discount to NAV widened during the period, which accounts for the difference between performance based on market price and performance based on NAV. |
| (c) | Average return. Returns reflect reinvestment of dividends and/or distributions at NAV on the ex-dividend date as calculated by Lipper. |
Performance results may include adjustments made for financial reporting purposes in accordance with U.S. generally accepted accounting principles.
Past performance is not indicative of future results.
The following discussion relates to the Trust’s absolute performance based on NAV:
After moving sideways for much of the period, municipal bonds finished with positive returns thanks to their rally in January and February. The gains for the broader bond market reflected the likelihood of an economic downturn caused by the spread of coronavirus, together with expectations for interest rate cuts by the Fed. (Bond prices rise as yields fall.) The favorable combination of robust investor demand and relatively limited new-issue supply provided an additional tailwind for tax-exempt securities.
Positions in AA rated securities made a meaningful contribution to Trust performance, as did holdings in lower coupon, longer-dated issues. The Trust’s use of leverage added value by boosting income and augmenting the effect of rising prices. At the sector level, the Trust benefited from its positions in state tax-backed, transportation and health care issues.
The Trust actively sought to manage interest rate risk using U.S. Treasury futures. Since U.S. Treasury yields fell, as prices rose, this strategy detracted from Trust performance. The trend of net negative issuance exacerbated reinvestment risk as the proceeds from bonds that matured or were called needed to be reinvested at lower prevailing yields compared to bonds that were issued when yields were higher. The Trust’s higher-quality focus also detracted at a time in which high yield bonds (those rated BBB and below) outperformed the rest of the market. However, the investment adviser began adding to high yield debt during the period as a result of a change in the Trust’s quality designation.
The views expressed reflect the opinions of BlackRock as of the date of this report and are subject to change based on changes in market, economic or other conditions. These views are not intended to be a forecast of future events and are no guarantee of future results.
| 14 | 2020 BLACKROCK SEMI-ANNUAL REPORT TO SHAREHOLDERS |
| Trust Summary as of February 29, 2020 (continued) | BlackRock MuniHoldings Investment Quality Fund |
Market Price and Net Asset Value Per Share Summary
| 02/29/20 | 08/31/19 | Change | High | Low | ||||||||||||||||
| Market Price |
$ | 13.75 | $ | 13.60 | 1.10 | % | $ | 13.98 | $ | 13.11 | ||||||||||
| Net Asset Value |
15.41 | 14.94 | 3.15 | 15.41 | 14.54 | |||||||||||||||
Market Price and Net Asset Value History For the Past Five Years
Overview of the Trust’s Total Investments *
| TRUST SUMMARY | 15 |
| Trust Summary as of February 29, 2020 | BlackRock MuniVest Fund, Inc. |
Trust Overview
BlackRock MuniVest Fund, Inc.’s (MVF) (the “Trust”) investment objective is to provide shareholders with as high a level of current income exempt from U.S. federal income taxes as is consistent with its investment policies and prudent investment management. The Trust seeks to achieve its investment objective by investing at least 80% of an aggregate of the Trust’s net assets (including proceeds from the issuance of any preferred shares) and the proceeds of any borrowing for investment purposes, in municipal obligations exempt from U.S. federal income taxes (except that the interest may be subject to the U.S. federal alternative minimum tax). Under normal market conditions, the Trust primarily invests in long term municipal obligations rated investment grade at the time of investment (or, if unrated, are considered by the Trust’s investment adviser to be of comparable quality at the time of investment) and in long term municipal obligations with maturities of more than ten years at the time of investment. The Trust may invest up to 20% of its total assets in securities rated below investment grade or deemed equivalent at the time of purchase. The Trust may invest directly in securities or synthetically through the use of derivatives.
No assurance can be given that the Trust’s investment objective will be achieved.
Trust Information
| Symbol on NYSE |
MVF | |
| Initial Offering Date |
September 29, 1988 | |
| Yield on Closing Market Price as of February 29, 2020 ($9.24)(a) |
4.35% | |
| Tax Equivalent Yield(b) |
7.35% | |
| Current Monthly Distribution per Common Share(c) |
$0.0335 | |
| Current Annualized Distribution per Common Share(c) |
$0.4020 | |
| Leverage as of February 29, 2020(d) |
34% |
| (a) | Yield on closing market price is calculated by dividing the current annualized distribution per share by the closing market price. Past performance does not guarantee future results. |
| (b) | Tax equivalent yield assumes the maximum marginal U.S. federal tax rate of 40.8%, which includes the 3.8% Medicare tax. Actual tax rates will vary based on income, exemptions and deductions. Lower taxes will result in lower tax equivalent yields. |
| (c) | The distribution rate is not constant and is subject to change. A portion of the distribution may be deemed a return of capital or net realized gain. |
| (d) | Represents VMTP Shares and TOB Trusts as a percentage of total managed assets, which is the total assets of the Trust, including any assets attributable to VMTP Shares and TOB Trusts, minus the sum of accrued liabilities. Does not reflect derivatives or other instruments that may give rise to economic leverage. For a discussion of leveraging techniques utilized by the Trust, please see The Benefits and Risks of Leveraging and Derivative Financial Instruments on page 5. |
Performance
Returns for the six months ended February 29, 2020 were as follows:
| Returns Based On | ||||||||
| Market Price | NAV | |||||||
| MVF(a)(b) |
(0.40 | )% | 5.41 | % | ||||
| Lipper General & Insured Municipal Debt Funds (Leveraged)(c) |
1.89 | 4.82 | ||||||
| (a) | All returns reflect reinvestment of dividends and/or distributions at actual reinvestment prices. |
| (b) | The Trust’s discount to NAV widened during the period, which accounts for the difference between performance based on market price and performance based on NAV. |
| (c) | Average return. Returns reflect reinvestment of dividends and/or distributions at NAV on the ex-dividend date as calculated by Lipper. |
Performance results may include adjustments made for financial reporting purposes in accordance with U.S. generally accepted accounting principles.
Past performance is not indicative of future results.
The following discussion relates to the Trust’s absolute performance based on NAV:
After moving sideways for much of the period, municipal bonds finished with positive returns thanks to their rally in January and February. The gains for the broader bond market reflected the likelihood of an economic downturn caused by the spread of coronavirus, together with expectations for interest rate cuts by the Fed. (Bond prices rise as yields fall.) The favorable combination of robust investor demand and relatively limited new-issue supply provided an additional tailwind for tax-exempt securities.
Positions in high yield issues, which outpaced the investment-grade market, were key contributors to the Trust’s performance. Puerto Rico and tobacco issues were particularly strong performers in this area. The Trust’s allocations to longer-duration and longer-maturity bonds also benefited results. (Duration is a measure of interest rate sensitivity.) At the sector level, revenue sectors such as transportation and health care were large contributors. The Trust’s use of leverage also added value by boosting income and augmenting the effect of rising prices.
The Trust actively sought to manage interest rate risk using U.S. Treasury futures. Since U.S. Treasury yields fell, as prices rose, this strategy detracted from Trust performance. Positions in pre-refunded bonds and short duration issues, while producing positive absolute returns, lagged somewhat in the rising market. The trend of net negative issuance exacerbated reinvestment risk as the proceeds from bonds that matured or were called needed to be reinvested at lower prevailing yields compared to bonds that were issued when yields were higher.
The views expressed reflect the opinions of BlackRock as of the date of this report and are subject to change based on changes in market, economic or other conditions. These views are not intended to be a forecast of future events and are no guarantee of future results.
| 16 | 2020 BLACKROCK SEMI-ANNUAL REPORT TO SHAREHOLDERS |
| Trust Summary as of February 29, 2020 (continued) | BlackRock MuniVest Fund, Inc. |
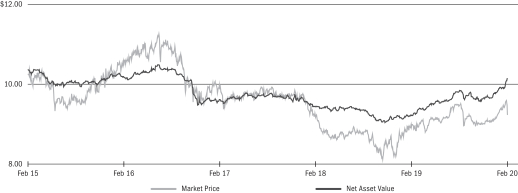
Market Price and Net Asset Value Per Share Summary
| 02/29/20 | 08/31/19 | Change | High | Low | ||||||||||||||||
| Market Price |
$ | 9.24 | $ | 9.49 | (2.63 | )% | $ | 9.60 | $ | 8.93 | ||||||||||
| Net Asset Value |
10.13 | 9.83 | 3.05 | 10.14 | 9.58 | |||||||||||||||
Market Price and Net Asset Value History For the Past Five Years
Overview of the Trust’s Total Investments *
| TRUST SUMMARY | 17 |
| Schedule of Investments (unaudited) February 29, 2020 |
BlackRock Municipal Bond Trust (BBK) (Percentages shown are based on Net Assets) |
| 18 | 2020 BLACKROCK SEMI-ANNUAL REPORT TO SHAREHOLDERS |
| Schedule of Investments (unaudited) (continued) February 29, 2020 |
BlackRock Municipal Bond Trust (BBK) (Percentages shown are based on Net Assets) |
| SCHEDULES OF INVESTMENTS | 19 |
| Schedule of Investments (unaudited) (continued) February 29, 2020 |
BlackRock Municipal Bond Trust (BBK) (Percentages shown are based on Net Assets) |
| 20 | 2020 BLACKROCK SEMI-ANNUAL REPORT TO SHAREHOLDERS |
| Schedule of Investments (unaudited) (continued) February 29, 2020 |
BlackRock Municipal Bond Trust (BBK) (Percentages shown are based on Net Assets) |
| SCHEDULES OF INVESTMENTS | 21 |
| Schedule of Investments (unaudited) (continued) February 29, 2020 |
BlackRock Municipal Bond Trust (BBK) (Percentages shown are based on Net Assets) |
| 22 | 2020 BLACKROCK SEMI-ANNUAL REPORT TO SHAREHOLDERS |
| Schedule of Investments (unaudited) (continued) February 29, 2020 |
BlackRock Municipal Bond Trust (BBK) |
| (m) | During the six months ended February 29, 2020, investments in issuers considered to be an affiliate/affiliates of the Trust for purposes of Section 2(a)(3) of the Investment Company Act of 1940, as amended, were as follows: |
| Affiliate | Shares Held at 08/31/19 |
Net Activity |
Shares Held at 02/29/20 |
Value at 02/29/20 |
Income | Net Realized Gain (Loss) (a) |
Change in Unrealized Appreciation (Depreciation) |
|||||||||||||||||||||
| BlackRock Liquidity Funds, MuniCash, Institutional Class |
7,802 | 1,769,109 | 1,776,911 | $ | 1,777,266 | $ | 4,852 | $ | (95 | ) | $ | — | ||||||||||||||||
|
|
|
|
|
|
|
|
|
|||||||||||||||||||||
| (a) | Includes net capital gain distributions, if applicable. |
Derivative Financial Instruments Outstanding as of Period End
Futures Contracts
| Description | Number of Contracts |
Expiration Date |
Notional Amount (000) |
Value/ Unrealized Appreciation (Depreciation) |
||||||||||||
| Short Contracts |
||||||||||||||||
| 10-Year U.S. Treasury Note |
31 | 06/19/20 | $ | 4,177 | $ | (52,355 | ) | |||||||||
| U.S. Long Treasury Bond |
60 | 06/19/20 | 10,215 | (201,753 | ) | |||||||||||
| 5-Year U.S. Treasury Note |
24 | 06/30/20 | 2,946 | (27,235 | ) | |||||||||||
|
|
|
|||||||||||||||
| $ | (281,343 | ) | ||||||||||||||
|
|
|
|||||||||||||||
Derivative Financial Instruments Categorized by Risk Exposure
As of period end, the fair values of derivative financial instruments located in the Statements of Assets and Liabilities were as follows:
| Commodity Contracts |
Credit Contracts |
Equity Contracts |
Foreign Currency Exchange Contracts |
Interest Rate Contracts |
Other Contracts |
Total | ||||||||||||||||||||||
| Liabilities — Derivative Financial Instruments |
||||||||||||||||||||||||||||
| Futures contracts |
||||||||||||||||||||||||||||
| Unrealized depreciation on futures contracts(a) |
$ | — | $ | — | $ | — | $ | — | $ | 281,343 | $ | — | $ | 281,343 | ||||||||||||||
|
|
|
|
|
|
|
|
|
|
|
|
|
|
|
|||||||||||||||
| (a) | Net cumulative unrealized appreciation (depreciation) on futures contracts and centrally cleared swaps, if any, are reported in the Schedule of Investments. In the Statements of Assets and Liabilities, only current day’s variation margin is reported in receivables or payables and the net cumulative unrealized appreciation (depreciation) is included in accumulated earnings (loss). |
For the six months ended February 29, 2020, the effect of derivative financial instruments in the Statements of Operations were as follows:
| Commodity Contracts |
Credit Contracts |
Equity Contracts |
Foreign Currency Exchange Contracts |
Interest Rate Contracts |
Other Contracts |
Total | ||||||||||||||||||||||
| Net Realized Gain (Loss) from: |
||||||||||||||||||||||||||||
| Futures contracts |
$ | — | $ | — | $ | — | $ | — | $ | (466,370 | ) | $ | — | $ | (466,370 | ) | ||||||||||||
|
|
|
|
|
|
|
|
|
|
|
|
|
|
|
|||||||||||||||
| Net Change in Unrealized Appreciation (Depreciation) on: | ||||||||||||||||||||||||||||
| Futures contracts |
$ | — | $ | — | $ | — | $ | — | $ | (246,962 | ) | $ | — | $ | (246,962 | ) | ||||||||||||
|
|
|
|
|
|
|
|
|
|
|
|
|
|
|
|||||||||||||||
Average Quarterly Balances of Outstanding Derivative Financial Instruments
| Futures contracts: |
||||
| Average notional value of contracts — long |
$ | — | (a) | |
| Average notional value of contracts — short |
16,120,969 |
| (a) | Derivative not held at any quarter-end. The risk exposure table serves as an indicator of activity during the period. |
For more information about the Trust’s investment risks regarding derivative financial instruments, refer to the Notes to Financial Statements.
| SCHEDULES OF INVESTMENTS | 23 |
| Schedule of Investments (unaudited) (continued) February 29, 2020 |
BlackRock Municipal Bond Trust (BBK) |
Fair Value Hierarchy as of Period End
Various inputs are used in determining the fair value of investments and derivative financial instruments. For information about the Trust’s policy regarding valuation of investments and derivative financial instruments, refer to the Notes to Financial Statements.
The following tables summarize the Trust’s investments and derivative financial instruments categorized in the disclosure hierarchy:
| Level 1 | Level 2 | Level 3 | Total | |||||||||||||
| Assets: |
| |||||||||||||||
| Investments: |
| |||||||||||||||
| Long-Term Investments(a) |
$ | — | $ | 292,792,340 | $ | 412,800 | $ | 293,205,140 | ||||||||
| Short-Term Securities |
1,777,266 | — | — | 1,777,266 | ||||||||||||
|
|
|
|
|
|
|
|
|
|||||||||
| $ | 1,777,266 | $ | 292,792,340 | $ | 412,800 | $ | 294,982,406 | |||||||||
|
|
|
|
|
|
|
|
|
|||||||||
| Derivative Financial Instruments(b) |
| |||||||||||||||
| Liabilities: |
| |||||||||||||||
| Interest rate contracts |
$ | (281,343 | ) | $ | — | $ | — | $ | (281,343 | ) | ||||||
|
|
|
|
|
|
|
|
|
|||||||||
| (a) | See above Schedule of Investments for values in each state or political subdivision. |
| (b) | Derivative financial instruments are futures contracts. Futures contracts are valued at the unrealized appreciation (depreciation) on the instrument. |
The Trust may hold assets and/or liabilities in which the fair value approximates the carrying amount for financial statement purposes. As of period end, such assets and/or liabilities are categorized within the disclosure hierarchy as follows:
| Level 1 | Level 2 | Level 3 | Total | |||||||||||||
| Liabilities: |
| |||||||||||||||
| TOB Trust Certificates |
$ | — | $ | (33,442,766 | ) | $ | — | $ | (33,442,766 | ) | ||||||
| VMTP Shares at Liquidation Value |
— | (79,900,000 | ) | — | (79,900,000 | ) | ||||||||||
|
|
|
|
|
|
|
|
|
|||||||||
| $ | — | $ | (113,342,766 | ) | $ | — | $ | (113,342,766 | ) | |||||||
|
|
|
|
|
|
|
|
|
|||||||||
See notes to financial statements.
| 24 | 2020 BLACKROCK SEMI-ANNUAL REPORT TO SHAREHOLDERS |
| Schedule of Investments (unaudited) February 29, 2020 |
BlackRock Municipal Income Investment Quality Trust (BAF) (Percentages shown are based on Net Assets) |
| SCHEDULES OF INVESTMENTS | 25 |
| Schedule of Investments (unaudited) (continued) February 29, 2020 |
BlackRock Municipal Income Investment Quality Trust (BAF) (Percentages shown are based on Net Assets) |
| 26 | 2020 BLACKROCK SEMI-ANNUAL REPORT TO SHAREHOLDERS |
| Schedule of Investments (unaudited) (continued) February 29, 2020 |
BlackRock Municipal Income Investment Quality Trust (BAF) (Percentages shown are based on Net Assets) |
| SCHEDULES OF INVESTMENTS | 27 |
| Schedule of Investments (unaudited) (continued) February 29, 2020 |
BlackRock Municipal Income Investment Quality Trust (BAF) (Percentages shown are based on Net Assets) |
| 28 | 2020 BLACKROCK SEMI-ANNUAL REPORT TO SHAREHOLDERS |
| Schedule of Investments (unaudited) (continued) February 29, 2020 |
BlackRock Municipal Income Investment Quality Trust (BAF) |
| (h) | During the six months ended February 29, 2020, investments in issuers considered to be an affiliate/affiliates of the Trust for purposes of Section 2(a)(3) of the Investment Company Act of 1940, as amended, were as follows: |
| Affiliate | Shares Held at 08/31/19 |
Net Activity |
Shares Held at 02/29/20 |
Value at 02/29/20 |
Income | Net Gain (Loss) (a) |
Change in Unrealized Appreciation (Depreciation) |
|||||||||||||||||||||
| BlackRock Liquidity Funds, MuniCash, Institutional Class |
466,968 | 627,017 | 1,093,985 | $ | 1,094,204 | $ | 1,461 | $ | (79 | ) | $ | — | ||||||||||||||||
|
|
|
|
|
|
|
|
|
|||||||||||||||||||||
| (a) | Includes net capital gain distributions, if applicable. |
Derivative Financial Instruments Outstanding as of Period End
Futures Contracts
| Description | Number of Contracts |
Expiration Date |
Notional Amount (000) |
Value/ Unrealized Appreciation (Depreciation) |
||||||||||||
| Short Contracts |
||||||||||||||||
| 10-Year U.S. Treasury Note |
13 | 06/19/20 | $ | 1,752 | $ | (22,393 | ) | |||||||||
| U.S. Long Treasury Bond |
49 | 06/19/20 | 8,342 | (164,765 | ) | |||||||||||
| 5-Year U.S. Treasury Note |
21 | 06/30/20 | 2,578 | (23,957 | ) | |||||||||||
|
|
|
|||||||||||||||
| $ | (211,115 | ) | ||||||||||||||
|
|
|
|||||||||||||||
Derivative Financial Instruments Categorized by Risk Exposure
As of period end, the fair values of derivative financial instruments located in the Statements of Assets and Liabilities were as follows:
| Commodity Contracts |
Credit Contracts |
Equity Contracts |
Foreign Currency Exchange Contracts |
Interest Rate Contracts |
Other Contracts |
Total | ||||||||||||||||||||||
| Liabilities — Derivative Financial Instruments |
||||||||||||||||||||||||||||
| Futures contracts |
||||||||||||||||||||||||||||
| Unrealized depreciation on futures contracts(a) |
$ | — | $ | — | $ | — | $ | — | $ | 211,115 | $ | — | $ | 211,115 | ||||||||||||||
|
|
|
|
|
|
|
|
|
|
|
|
|
|
|
|||||||||||||||
| (a) | Net cumulative unrealized appreciation (depreciation) on futures contracts and centrally cleared swaps, if any, are reported in the Schedule of Investments. In the Statements of Assets and Liabilities, only current day’s variation margin is reported in receivables or payables and the net cumulative unrealized appreciation (depreciation) is included in accumulated earnings (loss). |
For the six months ended February 29, 2020, the effect of derivative financial instruments in the Statements of Operations was as follows:
| Commodity Contracts |
Credit Contracts |
Equity Contracts |
Foreign Currency Exchange Contracts |
Interest Rate Contracts |
Other Contracts |
Total | ||||||||||||||||||||||
| Net Realized Gain (Loss) from: |
||||||||||||||||||||||||||||
| Futures contracts |
$ | — | $ | — | $ | — | $ | — | $ | (372,684 | ) | $ | — | $ | (372,684 | ) | ||||||||||||
|
|
|
|
|
|
|
|
|
|
|
|
|
|
|
|||||||||||||||
| Net Change in Unrealized Appreciation (Depreciation) on: |
||||||||||||||||||||||||||||
| Futures contracts |
$ | — | $ | — | $ | — | $ | — | $ | (187,429 | ) | $ | — | $ | (187,429 | ) | ||||||||||||
|
|
|
|
|
|
|
|
|
|
|
|
|
|
|
|||||||||||||||
Average Quarterly Balances of Outstanding Derivative Financial Instruments
| Futures contracts: |
| |||
| Average notional value of contracts — long |
$ | — | (a) | |
| Average notional value of contracts — short |
12,003,195 | |||
| (a) | Derivative not held at any quarter-end. The risk exposure table serves as an indicator of activity during the period. |
For more information about the Trust’s investment risks regarding derivative financial instruments, refer to the Notes to Financial Statements.
| SCHEDULES OF INVESTMENTS | 29 |
| Schedule of Investments (unaudited) (continued) February 29, 2020 |
BlackRock Municipal Income Investment Quality Trust (BAF) |
Fair Value Hierarchy as of Period End
Various inputs are used in determining the fair value of investments and derivative financial instruments. For information about the Trust’s policy regarding valuation of investments and derivative financial instruments, refer to the Notes to Financial Statements.
The following tables summarize the Trust’s investments and derivative financial instruments categorized in the disclosure hierarchy:
| Level 1 | Level 2 | Level 3 | Total | |||||||||||||
| Assets: |
| |||||||||||||||
| Investments: |
| |||||||||||||||
| Long-Term Investments(a) |
$ | — | $ | 242,679,906 | $ | — | $ | 242,679,906 | ||||||||
| Short-Term Securities |
1,094,204 | — | — | 1,094,204 | ||||||||||||
|
|
|
|
|
|
|
|
|
|||||||||
| $ | 1,094,204 | $ | 242,679,906 | $ | — | $ | 243,774,110 | |||||||||
|
|
|
|
|
|
|
|
|
|||||||||
| Derivative Financial Instruments(b) |
| |||||||||||||||
| Liabilities: |
| |||||||||||||||
| Interest rate contracts |
$ | (211,115 | ) | $ | — | $ | — | $ | (211,115 | ) | ||||||
|
|
|
|
|
|
|
|
|
|||||||||
| (a) | See above Schedule of Investments for values in each state or political subdivision. |
| (b) | Derivative financial instruments are futures contracts. Future contracts are valued at the unrealized appreciation (depreciation) on the instrument. |
The Trust may hold assets and/or liabilities in which the fair value approximates the carrying amount for financial statement purposes. As of period end, such assets and/or liabilities are categorized within the disclosure hierarchy as follows:
| Level 1 | Level 2 | Level 3 | Total | |||||||||||||
| Liabilities: |
| |||||||||||||||
| TOB Trust Certificates |
$ | — | $ | (56,448,869 | ) | $ | — | $ | (56,448,869 | ) | ||||||
| VMTP Shares at Liquidation Value |
— | (42,200,000 | ) | — | (42,200,000 | ) | ||||||||||
|
|
|
|
|
|
|
|
|
|||||||||
| $ | — | $ | (98,648,869 | ) | $ | — | $ | (98,648,869 | ) | |||||||
|
|
|
|
|
|
|
|
|
|||||||||
See notes to financial statements.
| 30 | 2020 BLACKROCK SEMI-ANNUAL REPORT TO SHAREHOLDERS |
| Schedule of Investments (unaudited) February 29, 2020 |
BlackRock Municipal Income Quality Trust (BYM) (Percentages shown are based on Net Assets) |
| SCHEDULES OF INVESTMENTS | 31 |
| Schedule of Investments (unaudited) (continued) February 29, 2020 |
BlackRock Municipal Income Quality Trust (BYM) (Percentages shown are based on Net Assets) |
| 32 | 2020 BLACKROCK SEMI-ANNUAL REPORT TO SHAREHOLDERS |
| Schedule of Investments (unaudited) (continued) February 29, 2020 |
BlackRock Municipal Income Quality Trust (BYM) (Percentages shown are based on Net Assets) |
| SCHEDULES OF INVESTMENTS | 33 |
| Schedule of Investments (unaudited) (continued) February 29, 2020 |
BlackRock Municipal Income Quality Trust (BYM) (Percentages shown are based on Net Assets) |
| 34 | 2020 BLACKROCK SEMI-ANNUAL REPORT TO SHAREHOLDERS |
| Schedule of Investments (unaudited) (continued) February 29, 2020 |
BlackRock Municipal Income Quality Trust (BYM) (Percentages shown are based on Net Assets) |
| SCHEDULES OF INVESTMENTS | 35 |
| Schedule of Investments (unaudited) (continued) February 29, 2020 |
BlackRock Municipal Income Quality Trust (BYM) |
| (i) | During the six months ended February 29, 2020, investments in issuers considered to be an affiliate/affiliates of the Trust for purposes of Section 2(a)(3) of the Investment Company Act of 1940, as amended, were as follows: |
| Affiliate | Shares Held at 08/31/19 |
Net Activity |
Shares Held at 02/29/20 |
Value at 02/29/20 |
Income | Net Realized Gain (Loss) (a) |
Change in Unrealized Appreciation (Depreciation) |
|||||||||||||||||||||
| BlackRock Liquidity Funds, MuniCash, Institutional Class |
971,958 | 4,287,397 | 5,259,355 | $ | 5,260,407 | $ | 17,051 | $ | (118 | ) | $ | 40 | ||||||||||||||||
|
|
|
|
|
|
|
|
|
|||||||||||||||||||||
| (a) | Includes net capital gain distributions, if applicable. |
Derivative Financial Instruments Outstanding as of Period End
Futures Contracts
| Description | Number of Contracts |
Expiration Date |
Notional Amount (000) |
Value/ Unrealized Appreciation (Depreciation) |
||||||||||||
| Short Contracts |
||||||||||||||||
| 10-Year U.S. Treasury Note |
79 | 06/19/20 | $ | 10,645 | $ | (133,421 | ) | |||||||||
| U.S. Long Treasury Bond |
125 | 06/19/20 | 21,281 | (420,318 | ) | |||||||||||
| 5-Year U.S. Treasury Note |
85 | 06/30/20 | 10,434 | (96,144 | ) | |||||||||||
|
|
|
|||||||||||||||
| $ | (649,883 | ) | ||||||||||||||
|
|
|
|||||||||||||||
Derivative Financial Instruments Categorized by Risk Exposure
As of period end, the fair values of derivative financial instruments located in the Statements of Assets and Liabilities were as follows:
| Commodity Contracts |
Credit Contracts |
Equity Contracts |
Foreign Currency Exchange Contracts |
Interest Rate Contracts |
Other Contracts |
Total | ||||||||||||||||||||||
| Liabilities — Derivative Financial Instruments |
||||||||||||||||||||||||||||
| Futures contracts |
||||||||||||||||||||||||||||
| Unrealized depreciation on futures contracts(a) |
$ | — | $ | — | $ | — | $ | — | $ | 649,883 | $ | — | $ | 649,883 | ||||||||||||||
|
|
|
|
|
|
|
|
|
|
|
|
|
|
|
|||||||||||||||
| (a) | Net cumulative unrealized appreciation (depreciation) on futures contracts and centrally cleared swaps, if any, are reported in the Schedule of Investments. In the Statements of Assets and Liabilities, only current day’s variation margin is reported in receivables or payables and the net cumulative unrealized appreciation (depreciation) is included in accumulated earnings (loss). |
For the six months ended February 29, 2020, the effect of derivative financial instruments in the Statements of Operations was as follows:
| Commodity Contracts |
Credit Contracts |
Equity Contracts |
Foreign Currency Exchange Contracts |
Interest Rate Contracts |
Other Contracts |
Total | ||||||||||||||||||||||
| Net Realized Gain (Loss) from: |
||||||||||||||||||||||||||||
| Futures contracts |
$ | — | $ | — | $ | — | $ | — | $ | (1,042,481 | ) | $ | — | $ | (1,042,481 | ) | ||||||||||||
|
|
|
|
|
|
|
|
|
|
|
|
|
|
|
|||||||||||||||
| Net Change in Unrealized Appreciation (Depreciation) on: |
||||||||||||||||||||||||||||
| Futures contracts |
$ | — | $ | — | $ | — | $ | — | $ | (568,874 | ) | $ | — | $ | (568,874 | ) | ||||||||||||
|
|
|
|
|
|
|
|
|
|
|
|
|
|
|
|||||||||||||||
| 36 | 2020 BLACKROCK SEMI-ANNUAL REPORT TO SHAREHOLDERS |
| Schedule of Investments (unaudited) (continued) February 29, 2020 |
BlackRock Municipal Income Quality Trust (BYM) |
Average Quarterly Balances of Outstanding Derivative Financial Instruments:
| Futures contracts: |
| |||
| Average notional value of contracts — long |
$ | — | (a) | |
| Average notional value of contracts — short |
39,500,641 | |||
| (a) | Derivative not held at any quarter-end. The risk exposure table serves as an indicator of activity during the period. |
For more information about the Trust’s investment risks regarding derivative financial instruments, refer to the Notes to Financial Statements.
Fair Value Hierarchy as of Period End
Various inputs are used in determining the fair value of investments and derivative financial instruments. For information about the Trust’s policy regarding valuation of investments and derivative financial instruments, refer to the Notes to Financial Statements.
The following tables summarize the Trust’s investments and derivative financial instruments categorized in the disclosure hierarchy:
| Level 1 | Level 2 | Level 3 | Total | |||||||||||||
| Assets: |
| |||||||||||||||
| Investments: |
| |||||||||||||||
| Long-Term Investments(a) |
$ | — | $ | 686,877,262 | $ | — | $ | 686,877,262 | ||||||||
| Short-Term Securities |
5,260,407 | — | — | 5,260,407 | ||||||||||||
|
|
|
|
|
|
|
|
|
|||||||||
| $ | 5,260,407 | $ | 686,877,262 | $ | — | $ | 692,137,669 | |||||||||
|
|
|
|
|
|
|
|
|
|||||||||
| Derivative Financial Instruments(b) |
| |||||||||||||||
| Liabilities: |
| |||||||||||||||
| Interest rate contracts |
$ | (649,883 | ) | $ | — | $ | — | $ | (649,883 | ) | ||||||
|
|
|
|
|
|
|
|
|
|||||||||
| (a) | See above Schedule of Investments for values in each state or political subdivision. |
| (b) | Derivative financial instruments are futures contracts. Futures contracts are valued at the unrealized appreciation (depreciation) on the instrument. |
The Trust may hold assets and/or liabilities in which the fair value approximates the carrying amount for financial statement purposes. As of period end, such assets and/or liabilities are categorized within the disclosure hierarchy as follows:
| Level 1 | Level 2 | Level 3 | Total | |||||||||||||
| Liabilities: |
| |||||||||||||||
| TOB Trust Certificates |
$ | — | $ | (127,922,497 | ) | $ | — | $ | (127,922,497 | ) | ||||||
| VMTP Shares at Liquidation Value |
— | (137,200,000 | ) | — | (137,200,000 | ) | ||||||||||
|
|
|
|
|
|
|
|
|
|||||||||
| $ | — | $ | (265,122,497 | ) | $ | — | $ | (265,122,497 | ) | |||||||
|
|
|
|
|
|
|
|
|
|||||||||
See notes to financial statements.
| SCHEDULES OF INVESTMENTS | 37 |
| Schedule of Investments (unaudited) February 29, 2020 |
BlackRock Municipal Income Trust II (BLE) (Percentages shown are based on Net Assets) |
| 38 | 2020 BLACKROCK SEMI-ANNUAL REPORT TO SHAREHOLDERS |
| Schedule of Investments (unaudited) (continued) February 29, 2020 |
BlackRock Municipal Income Trust II (BLE) (Percentages shown are based on Net Assets) |
| SCHEDULES OF INVESTMENTS | 39 |
| Schedule of Investments (unaudited) (continued) February 29, 2020 |
BlackRock Municipal Income Trust II (BLE) (Percentages shown are based on Net Assets) |
| 40 | 2020 BLACKROCK SEMI-ANNUAL REPORT TO SHAREHOLDERS |
| Schedule of Investments (unaudited) (continued) February 29, 2020 |
BlackRock Municipal Income Trust II (BLE) (Percentages shown are based on Net Assets) |
| SCHEDULES OF INVESTMENTS | 41 |
| Schedule of Investments (unaudited) (continued) February 29, 2020 |
BlackRock Municipal Income Trust II (BLE) (Percentages shown are based on Net Assets) |
| 42 | 2020 BLACKROCK SEMI-ANNUAL REPORT TO SHAREHOLDERS |
| Schedule of Investments (unaudited) (continued) February 29, 2020 |
BlackRock Municipal Income Trust II (BLE) (Percentages shown are based on Net Assets) |
| (m) | During the six months ended February 29, 2020, investments in issuers considered to be an affiliate/affiliates of the Trust for purposes of Section 2(a)(3) of the Investment Company Act of 1940, as amended, were as follows: |
| Affiliate | Shares Held at 08/31/19 |
Net Activity |
Shares Held at 02/29/20 |
Value at 02/29/20 |
Income | Net Realized Gain (Loss) (a) |
Change in Unrealized Appreciation (Depreciation) |
|||||||||||||||||||||
| BlackRock Liquidity Funds, MuniCash, Institutional Class |
7,110,938 | 3,823,005 | 10,933,943 | $ | 10,936,129 | $ | 40,172 | $ | 471 | $ | 1,104 | |||||||||||||||||
|
|
|
|
|
|
|
|
|
|||||||||||||||||||||
| (a) | Includes net capital gain distributions, if applicable. |
Derivative Financial Instruments Outstanding as of Period End
Futures Contracts
| Description | Number of Contracts |
Expiration Date |
Notional Amount (000) |
Value/ Unrealized Appreciation (Depreciation) |
||||||||||||
| Short Contracts |
||||||||||||||||
| 10-Year U.S. Treasury Note |
27 | 06/19/20 | $ | 3,638 | $ | (45,599 | ) | |||||||||
| U.S. Long Treasury Bond |
101 | 06/19/20 | 17,195 | (341,249 | ) | |||||||||||
| 5-Year U.S. Treasury Note |
29 | 06/30/20 | 3,560 | (33,273 | ) | |||||||||||
|
|
|
|||||||||||||||
| $ | (420,121 | ) | ||||||||||||||
|
|
|
|||||||||||||||
| SCHEDULES OF INVESTMENTS | 43 |
| Schedule of Investments (unaudited) (continued) February 29, 2020 |
BlackRock Municipal Income Trust II (BLE) |
Derivative Financial Instruments Categorized by Risk Exposure
As of period end, the fair values of derivative financial instruments located in the Statements of Assets and Liabilities were as follows:
| Commodity Contracts |
Credit Contracts |
Equity Contracts |
Foreign Currency Exchange Contracts |
Interest Rate Contracts |
Other Contracts |
Total | ||||||||||||||||||||||
| Liabilities — Derivative Financial Instruments |
||||||||||||||||||||||||||||
| Futures contracts |
||||||||||||||||||||||||||||
| Unrealized depreciation on futures contracts(a) |
$ | — | $ | — | $ | — | $ | — | $ | 420,121 | $ | — | $ | 420,121 | ||||||||||||||
|
|
|
|
|
|
|
|
|
|
|
|
|
|
|
|||||||||||||||
| (a) | Net cumulative unrealized appreciation (depreciation) on futures contracts and centrally cleared swaps, if any, are reported in the Schedule of Investments. In the Statements of Assets and Liabilities, only current day’s variation margin is reported in receivables or payables and the net cumulative unrealized appreciation (depreciation) is included in accumulated earnings (loss). |
For the six months ended February 29, 2020, the effect of derivative financial instruments in the Statements of Operations was as follows:
| Commodity Contracts |
Credit Contracts |
Equity Contracts |
Foreign Currency Exchange Contracts |
Interest Rate Contracts |
Other Contracts |
Total | ||||||||||||||||||||||
| Net Realized Gain (Loss) from: |
||||||||||||||||||||||||||||
| Futures contracts |
$ | — | $ | — | $ | — | $ | — | $ | (518,947 | ) | $ | — | $ | (518,947 | ) | ||||||||||||
|
|
|
|
|
|
|
|
|
|
|
|
|
|
|
|||||||||||||||
| Net Change in Unrealized Appreciation (Depreciation) on: | ||||||||||||||||||||||||||||
| Futures contracts |
$ | — | $ | — | $ | — | $ | — | $ | (370,030 | ) | $ | — | $ | (370,030 | ) | ||||||||||||
|
|
|
|
|
|
|
|
|
|
|
|
|
|
|
|||||||||||||||
Average Quarterly Balances of Outstanding Derivative Financial Instruments
| Futures contracts: |
| |||
| Average notional value of contracts — long |
$ | — | (a) | |
| Average notional value of contracts — short |
21,977,930 | |||
| (a) | Derivative not held at any quarter-end. The risk exposure table serves as an indicator of activity during the period. |
For more information about the Trust’s investment risks regarding derivative financial instruments, refer to the Notes to Financial Statements.
Fair Value Hierarchy as of Period End
Various inputs are used in determining the fair value of investments and derivative financial instruments. For information about the Trust’s policy regarding valuation of investments and derivative financial instruments, refer to the Notes to Financial Statements.
The following tables summarize the Trust’s investments and derivative financial instruments categorized in the disclosure hierarchy:
| Level 1 | Level 2 | Level 3 | Total | |||||||||||||
| Assets: |
| |||||||||||||||
| Investments: |
| |||||||||||||||
| Long-Term Investments(a) |
$ | — | $ | 578,553,806 | $ | 861,600 | $ | 579,415,406 | ||||||||
| Short-Term Securities |
10,936,129 | — | — | 10,936,129 | ||||||||||||
|
|
|
|
|
|
|
|
|
|||||||||
| $ | 10,936,129 | $ | 578,553,806 | $ | 861,600 | $ | 590,351,535 | |||||||||
|
|
|
|
|
|
|
|
|
|||||||||
| Derivative Financial Instruments(b) |
| |||||||||||||||
| Liabilities: |
| |||||||||||||||
| Interest rate contracts |
$ | (420,121 | ) | $ | — | $ | — | $ | (420,121 | ) | ||||||
|
|
|
|
|
|
|
|
|
|||||||||
| (a) | See above Schedule of Investments for values in each state or political subdivision. |
| (b) | Derivative financial instruments are futures contracts. Futures contracts are valued at the unrealized appreciation (depreciation) on the instrument. |
The Trust may hold assets and/or liabilities in which the fair value approximates the carrying amount for financial statement purposes. As of period end, such assets and/or liabilities are categorized within the disclosure hierarchy as follows:
| Level 1 | Level 2 | Level 3 | Total | |||||||||||||
| Liabilities: |
| |||||||||||||||
| TOB Trust Certificates |
$ | — | $ | (69,294,759 | ) | $ | — | $ | (69,294,759 | ) | ||||||
| VMTP Shares at Liquidation Value |
— | (151,300,000 | ) | — | (151,300,000 | ) | ||||||||||
|
|
|
|
|
|
|
|
|
|||||||||
| $ | — | $ | (220,594,759 | ) | $ | — | $ | (220,594,759 | ) | |||||||
|
|
|
|
|
|
|
|
|
|||||||||
See notes to financial statements.
| 44 | 2020 BLACKROCK SEMI-ANNUAL REPORT TO SHAREHOLDERS |
| Schedule of Investments (unaudited) February 29, 2020 |
BlackRock MuniHoldings Investment Quality Fund (MFL) (Percentages shown are based on Net Assets) |
| SCHEDULES OF INVESTMENTS | 45 |
| Schedule of Investments (unaudited) (continued) February 29, 2020 |
BlackRock MuniHoldings Investment Quality Fund (MFL) (Percentages shown are based on Net Assets) |
| 46 | 2020 BLACKROCK SEMI-ANNUAL REPORT TO SHAREHOLDERS |
| Schedule of Investments (unaudited) (continued) February 29, 2020 |
BlackRock MuniHoldings Investment Quality Fund (MFL) (Percentages shown are based on Net Assets) |
| SCHEDULES OF INVESTMENTS | 47 |
| Schedule of Investments (unaudited) (continued) February 29, 2020 |
BlackRock MuniHoldings Investment Quality Fund (MFL) (Percentages shown are based on Net Assets) |
| (h) | During the six months ended February 29, 2020, investments in issuers considered to be an affiliate/affiliates of the Trust for purposes of Section 2(a)(3) of the Investment Company Act of 1940, as amended, were as follows: |
| Affiliate | Shares Held at 08/31/19 |
Net Activity |
Shares Held at 02/29/20 |
Value at 02/29/20 |
Income | Net Realized Gain (Loss) (a) |
Change in Unrealized Appreciation (Depreciation) |
|||||||||||||||||||||
| BlackRock Liquidity Funds, MuniCash, Institutional Class |
3,255,767 | (2,830,839 | ) | 424,928 | $ | 425,013 | $ | 19,229 | $ | (438 | ) | $ | 5 | |||||||||||||||
|
|
|
|
|
|
|
|
|
|||||||||||||||||||||
| (a) | Includes net capital gain distributions, if applicable. |
Derivative Financial Instruments Outstanding as of Period End
Futures Contracts
| Description | Number of Contracts |
Expiration Date |
Notional Amount (000) |
Value/ Unrealized Appreciation (Depreciation) |
||||||||||||
| Short Contracts |
||||||||||||||||
| 10-Year U.S. Treasury Note |
100 | 06/19/20 | $ | 13,475 | $ | (168,887 | ) | |||||||||
| U.S. Long Treasury Bond |
175 | 06/19/20 | 29,794 | (588,446 | ) | |||||||||||
| 5-Year U.S. Treasury Note |
102 | 06/30/20 | 12,521 | (118,439 | ) | |||||||||||
|
|
|
|||||||||||||||
| $ | (875,772 | ) | ||||||||||||||
|
|
|
|||||||||||||||
| 48 | 2020 BLACKROCK SEMI-ANNUAL REPORT TO SHAREHOLDERS |
| Schedule of Investments (unaudited) (continued) February 29, 2020 |
BlackRock MuniHoldings Investment Quality Fund (MFL) |
Derivative Financial Instruments Categorized by Risk Exposure
As of period end, the fair values of derivative financial instruments located in the Statements of Assets and Liabilities were as follows:
| Commodity Contracts |
Credit Contracts |
Equity Contracts |
Foreign Currency Exchange Contracts |
Interest Rate Contracts |
Other Contracts |
Total | ||||||||||||||||||||||
| Liabilities — Derivative Financial Instruments |
||||||||||||||||||||||||||||
| Futures contracts |
||||||||||||||||||||||||||||
| Unrealized depreciation on futures contracts(a) |
$ | — | $ | — | $ | — | $ | — | $ | 875,772 | $ | — | $ | 875,772 | ||||||||||||||
|
|
|
|
|
|
|
|
|
|
|
|
|
|
|
|||||||||||||||
| (a) | Net cumulative unrealized appreciation (depreciation) on futures contracts and centrally cleared swaps, if any, are reported in the Schedule of Investments. In the Statements of Assets and Liabilities, only current day’s variation margin is reported in receivables or payables and the net cumulative unrealized appreciation (depreciation) is included in accumulated earnings (loss). |
For the six months ended February 29, 2020, the effect of derivative financial instruments in the Statements of Operations were as follows:
| Commodity Contracts |
Credit Contracts |
Equity Contracts |
Foreign Currency Exchange Contracts |
Interest Rate Contracts |
Other Contracts |
Total | ||||||||||||||||||||||
| Net Realized Gain (Loss) from: |
||||||||||||||||||||||||||||
| Futures contracts |
$ | — | $ | — | $ | — | $ | — | $ | (719,617 | ) | $ | — | $ | (719,617 | ) | ||||||||||||
|
|
|
|
|
|
|
|
|
|
|
|
|
|
|
|||||||||||||||
| Net Change in Unrealized Appreciation (Depreciation) on: | ||||||||||||||||||||||||||||
| Futures contracts |
$ | — | $ | — | $ | — | $ | — | $ | (766,356 | ) | $ | — | $ | (766,356 | ) | ||||||||||||
|
|
|
|
|
|
|
|
|
|
|
|
|
|
|
|||||||||||||||
Average Quarterly Balances of Outstanding Derivative Financial Instruments
| Futures contracts: |
||||
| Average notional value of contracts — long |
$ | — | (a) | |
| Average notional value of contracts — short |
52,946,945 |
| (a) | Derivative not held at any quarter-end. The risk exposure table serves as an indicator of activity during the period. |
For more information about the Trust’s investment risks regarding derivative financial instruments, refer to the Notes to Financial Statements.
Fair Value Hierarchy as of Period End
Various inputs are used in determining the fair value of investments and derivative financial instruments. For information about the Trust’s policy regarding valuation of investments and derivative financial instruments, refer to the Notes to Financial Statements
The following tables summarize the Trust’s investments and derivative financial instruments categorized in the disclosure hierarchy:
| Level 1 | Level 2 | Level 3 | Total | |||||||||||||
| Assets: |
| |||||||||||||||
| Investments: |
| |||||||||||||||
| Long-Term Investments(a) |
$ | — | $ | 949,531,934 | $ | — | $ | 949,531,934 | ||||||||
| Short-Term Securities |
425,013 | — | — | 425,013 | ||||||||||||
|
|
|
|
|
|
|
|
|
|||||||||
| $ | 425,013 | $ | 949,531,934 | $ | — | $ | 949,956,947 | |||||||||
|
|
|
|
|
|
|
|
|
|||||||||
| Derivative Financial Instruments(b) |
| |||||||||||||||
| Liabilities: |
| |||||||||||||||
| Interest rate contracts |
$ | (875,772 | ) | $ | — | $ | — | $ | (875,772 | ) | ||||||
|
|
|
|
|
|
|
|
|
|||||||||
| (a) | See above Schedule of Investments for values in each state or political subdivision. |
| (b) | Derivative financial instruments are futures contracts. Futures contracts are valued at the unrealized appreciation (depreciation) on the instrument. |
The Trust may hold assets and/or liabilities in which the fair value approximates the carrying amount for financial statement purposes. As of period end, such assets and/or liabilities are categorized within the disclosure hierarchy as follows:
| Level 1 | Level 2 | Level 3 | Total | |||||||||||||
| Liabilities: |
| |||||||||||||||
| TOB Trust Certificates |
$ | — | $ | (105,978,045 | ) | $ | — | $ | (105,978,045 | ) | ||||||
| VRDP Shares at Liquidation Value |
— | (274,600,000 | ) | — | (274,600,000 | ) | ||||||||||
|
|
|
|
|
|
|
|
|
|||||||||
| $ | — | $ | (380,578,045 | ) | $ | — | $ | (380,578,045 | ) | |||||||
|
|
|
|
|
|
|
|
|
|||||||||
See notes to financial statements.
| SCHEDULES OF INVESTMENTS | 49 |
| Schedule of Investments (unaudited) February 29, 2020 |
BlackRock MuniVest Fund, Inc. (MVF) (Percentages shown are based on Net Assets) |
| 50 | 2020 BLACKROCK SEMI-ANNUAL REPORT TO SHAREHOLDERS |
| Schedule of Investments (unaudited) (continued) February 29, 2020 |
BlackRock MuniVest Fund, Inc. (MVF) (Percentages shown are based on Net Assets) |
| SCHEDULES OF INVESTMENTS | 51 |
| Schedule of Investments (unaudited) (continued) February 29, 2020 |
BlackRock MuniVest Fund, Inc. (MVF) (Percentages shown are based on Net Assets) |
| 52 | 2020 BLACKROCK SEMI-ANNUAL REPORT TO SHAREHOLDERS |
| Schedule of Investments (unaudited) (continued) February 29, 2020 |
BlackRock MuniVest Fund, Inc. (MVF) (Percentages shown are based on Net Assets) |
| SCHEDULES OF INVESTMENTS | 53 |
| Schedule of Investments (unaudited) (continued) February 29, 2020 |
BlackRock MuniVest Fund, Inc. (MVF) (Percentages shown are based on Net Assets) |
| 54 | 2020 BLACKROCK SEMI-ANNUAL REPORT TO SHAREHOLDERS |
| Schedule of Investments (unaudited) (continued) February 29, 2020 |
BlackRock MuniVest Fund, Inc. (MVF) (Percentages shown are based on Net Assets) |
| (j) | During the six months ended February 29, 2020, investments in issuers considered to be an affiliate/affiliates of the Trust for purposes of Section 2(a)(3) of the Investment Company Act of 1940, as amended, were as follows: |
| Affiliate | Shares Held at 08/31/19 |
Net Activity |
Shares Held at 02/29/20 |
Value at 02/29/20 |
Income | Net Realized Gain (Loss) (a) |
Change in Unrealized Appreciation (Depreciation) |
|||||||||||||||||||||
| BlackRock Liquidity Funds, MuniCash, Institutional Class |
16,623,641 | (13,820,554 | ) | 2,803,087 | $ | 2,803,647 | $ | 33,830 | $ | (1,658 | ) | $ | 1,902 | |||||||||||||||
|
|
|
|
|
|
|
|
|
|||||||||||||||||||||
| (a) | Includes net capital gain distributions, if applicable. |
Derivative Financial Instruments Outstanding as of Period End
Futures Contracts
| Description | Number of Contracts |
Expiration Date |
Notional Amount (000) |
Value/ Unrealized Appreciation (Depreciation) |
||||||||||||
| Short Contracts |
||||||||||||||||
| 10-Year U.S. Treasury Note |
101 | 06/19/20 | $ | 13,610 | $ | (171,779 | ) | |||||||||
| U.S. Long Treasury Bond |
227 | 06/19/20 | 38,647 | (765,257 | ) | |||||||||||
| 5-Year U.S. Treasury Note |
56 | 06/30/20 | 6,874 | (65,410 | ) | |||||||||||
|
|
|
|||||||||||||||
| $ | (1,002,446 | ) | ||||||||||||||
|
|
|
|||||||||||||||
| SCHEDULES OF INVESTMENTS | 55 |
| Schedule of Investments (unaudited) (continued) February 29, 2020 |
BlackRock MuniVest Fund, Inc. (MVF) |
Derivative Financial Instruments Categorized by Risk Exposure
As of period end, the fair values of derivative financial instruments located in the Statements of Assets and Liabilities were as follows:
| Commodity Contracts |
Credit Contracts |
Equity Contracts |
Foreign Currency Exchange Contracts |
Interest Rate Contracts |
Other Contracts |
Total | ||||||||||||||||||||||
| Liabilities — Derivative Financial Instruments |
||||||||||||||||||||||||||||
| Futures contracts |
||||||||||||||||||||||||||||
| Unrealized depreciation on futures contracts(a) |
$ | — | $ | — | $ | — | $ | — | $ | 1,002,446 | $ | — | $ | 1,002,446 | ||||||||||||||
|
|
|
|
|
|
|
|
|
|
|
|
|
|
|
|||||||||||||||
| (a) | Net cumulative unrealized appreciation (depreciation) on futures contracts and centrally cleared swaps, if any, are reported in the Schedule of Investments. In the Statements of Assets and Liabilities, only current day’s variation margin is reported in receivables or payables and the net cumulative unrealized appreciation (depreciation) is included in accumulated earnings (loss). |
For the six months ended February 29, 2020, the effect of derivative financial instruments in the Statements of Operations was as follows:
| Commodity Contracts |
Credit Contracts |
Equity Contracts |
Foreign Currency Exchange Contracts |
Interest Rate Contracts |
Other Contracts |
Total | ||||||||||||||||||||||
| Net Realized Gain (Loss) from: |
||||||||||||||||||||||||||||
| Futures contracts |
$ | — | $ | — | $ | — | $ | — | $ | (1,426,618 | ) | $ | — | $ | (1,426,618 | ) | ||||||||||||
|
|
|
|
|
|
|
|
|
|
|
|
|
|
|
|||||||||||||||
| Net Change in Unrealized Appreciation (Depreciation) on: | ||||||||||||||||||||||||||||
| Futures contracts |
$ | — | $ | — | $ | — | $ | — | $ | (944,400 | ) | $ | — | $ | (944,400 | ) | ||||||||||||
|
|
|
|
|
|
|
|
|
|
|
|
|
|
|
|||||||||||||||
Average Quarterly Balances of Outstanding Derivative Financial Instruments
| Futures contracts: |
| |||
| Average notional value of contracts — long |
$ | — | (a) | |
| Average notional value of contracts — short |
51,699,570 | |||
| (a) | Derivative not held at any quarter-end. The risk exposure table serves as an indicator of activity during the period. |
For more information about the Trust’s investment risks regarding derivative financial instruments, refer to the Notes to Financial Statements.
Fair Value Hierarchy as of Period End
Various inputs are used in determining the fair value of investments and derivative financial instruments. For information about the Trust’s policy regarding valuation of investments and derivative financial instruments, refer to the Notes to Financial Statements.
The following tables summarize the Trust’s investments and derivative financial instruments categorized in the disclosure hierarchy:
| Level 1 | Level 2 | Level 3 | Total | |||||||||||||
| Assets: |
| |||||||||||||||
| Investments: |
| |||||||||||||||
| Long-Term Investments(a) |
$ | — | $ | 1,008,899,106 | $ | — | $ | 1,008,899,106 | ||||||||
| Short-Term Securities |
2,803,647 | — | — | 2,803,647 | ||||||||||||
|
|
|
|
|
|
|
|
|
|||||||||
| $ | 2,803,647 | $ | 1,008,899,106 | $ | — | $ | 1,011,702,753 | |||||||||
|
|
|
|
|
|
|
|
|
|||||||||
| Derivative Financial Instruments(b) |
| |||||||||||||||
| Liabilities: |
| |||||||||||||||
| Interest rate contracts |
$ | (1,002,446 | ) | $ | — | $ | — | $ | (1,002,446 | ) | ||||||
|
|
|
|
|
|
|
|
|
|||||||||
| (a) | See above Schedule of Investments for values in each state or political subdivision. |
| (b) | Derivative financial instruments are futures contracts. Future contracts are valued at the unrealized appreciation (depreciation) on the instrument. |
The Trust may hold assets and/or liabilities in which the fair value approximates the carrying amount for financial statement purposes. As of period end, such assets and/or liabilities are categorized within the disclosure hierarchy as follows:
| Level 1 | Level 2 | Level 3 | Total | |||||||||||||
| Liabilities: |
| |||||||||||||||
| TOB Trust Certificates |
$ | — | $ | (100,737,488 | ) | $ | — | $ | (100,737,488 | ) | ||||||
| VMTP Shares at Liquidation Value |
— | (243,800,000 | ) | — | (243,800,000 | ) | ||||||||||
|
|
|
|
|
|
|
|
|
|||||||||
| $ | — | $ | (344,537,488 | ) | $ | — | $ | (344,537,488 | ) | |||||||
|
|
|
|
|
|
|
|
|
|||||||||
See notes to financial statements.
| 56 | 2020 BLACKROCK SEMI-ANNUAL REPORT TO SHAREHOLDERS |
Statements of Assets and Liabilities (unaudited)
February 29, 2020
| BBK | BAF | BYM | BLE | |||||||||||||
| ASSETS |
| |||||||||||||||
| Investments at value — unaffiliated(a) |
$ | 293,205,140 | $ | 242,679,906 | $ | 686,877,262 | $ | 579,415,406 | ||||||||
| Investments at value — affiliated(b) |
1,777,266 | 1,094,204 | 5,260,407 | 10,936,129 | ||||||||||||
| Cash pledged for futures contracts |
223,050 | 168,800 | 506,050 | 337,800 | ||||||||||||
| Receivables: |
| |||||||||||||||
| Investments sold |
— | 514,617 | — | 484,811 | ||||||||||||
| Dividends — affiliated |
223 | 250 | 2,679 | 7,881 | ||||||||||||
| Interest — unaffiliated |
2,840,294 | 2,358,370 | 6,664,278 | 6,157,498 | ||||||||||||
| Prepaid expenses |
1,792 | 1,557 | 3,088 | 2,911 | ||||||||||||
|
|
|
|
|
|
|
|
|
|||||||||
| Total assets |
298,047,765 | 246,817,704 | 699,313,764 | 597,342,436 | ||||||||||||
|
|
|
|
|
|
|
|
|
|||||||||
| ACCRUED LIABILITIES |
| |||||||||||||||
| Payables: |
| |||||||||||||||
| Investments purchased |
2,192,350 | 7,230,717 | 6,256,791 | 8,381,785 | ||||||||||||
| Income dividend distributions — Common Shares |
573,501 | 450,595 | 1,267,501 | 1,365,562 | ||||||||||||
| Interest expense and fees |
66,186 | 143,782 | 386,736 | 188,329 | ||||||||||||
| Investment advisory fees |
273,609 | 211,287 | 612,310 | 518,412 | ||||||||||||
| Trustees’ and Officer’s fees |
30,122 | 22,167 | 69,640 | 63,015 | ||||||||||||
| Other accrued expenses |
75,514 | 69,525 | 102,445 | 93,860 | ||||||||||||
| Variation margin on futures contracts |
233,821 | 174,785 | 541,000 | 346,930 | ||||||||||||
|
|
|
|
|
|
|
|
|
|||||||||
| Total accrued liabilities |
3,445,103 | 8,302,858 | 9,236,423 | 10,957,893 | ||||||||||||
|
|
|
|
|
|
|
|
|
|||||||||
| OTHER LIABILITIES |
| |||||||||||||||
| TOB Trust Certificates |
33,442,766 | 56,448,869 | 127,922,497 | 69,294,759 | ||||||||||||
| VMTP Shares, at liquidation value of $100,000 per share(c)(d) |
79,900,000 | 42,200,000 | 137,200,000 | 151,300,000 | ||||||||||||
|
|
|
|
|
|
|
|
|
|||||||||
| Total other liabilities |
113,342,766 | 98,648,869 | 265,122,497 | 220,594,759 | ||||||||||||
|
|
|
|
|
|
|
|
|
|||||||||
| Total liabilities |
116,787,869 | 106,951,727 | 274,358,920 | 231,552,652 | ||||||||||||
|
|
|
|
|
|
|
|
|
|||||||||
| NET ASSETS APPLICABLE TO COMMON SHAREHOLDERS |
$ | 181,259,896 | $ | 139,865,977 | $ | 424,954,844 | $ | 365,789,784 | ||||||||
|
|
|
|
|
|
|
|
|
|||||||||
| NET ASSETS APPLICABLE TO COMMON SHAREHOLDERS CONSIST OF |
| |||||||||||||||
| Paid-in capital(e)(f)(g) |
$ | 149,545,188 | $ | 124,019,631 | $ | 362,795,037 | $ | 325,161,855 | ||||||||
| Accumulated earnings |
31,714,708 | 15,846,346 | 62,159,807 | 40,627,929 | ||||||||||||
|
|
|
|
|
|
|
|
|
|||||||||
| NET ASSETS APPLICABLE TO COMMON SHAREHOLDERS |
$ | 181,259,896 | $ | 139,865,977 | $ | 424,954,844 | $ | 365,789,784 | ||||||||
|
|
|
|
|
|
|
|
|
|||||||||
| Net asset value per Common share |
$ | 17.23 | $ | 15.99 | $ | 16.09 | $ | 15.54 | ||||||||
|
|
|
|
|
|
|
|
|
|||||||||
| (a) Investments at cost — unaffiliated |
$ | 259,866,788 | $ | 221,958,548 | $ | 613,061,910 | $ | 529,007,801 | ||||||||
| (b) Investments at cost — affiliated |
$ | 1,777,266 | $ | 1,094,204 | $ | 5,260,367 | $ | 10,935,559 | ||||||||
| (c) Preferred Shares outstanding, par value $0.001 per share |
799 | 422 | 1,372 | 1,513 | ||||||||||||
| (d) Preferred Shares authorized |
unlimited | unlimited | unlimited | unlimited | ||||||||||||
| (e) Par value per Common Shares |
$ | 0.001 | $ | 0.001 | $ | 0.001 | $ | 0.001 | ||||||||
| (f) Common Shares outstanding |
10,522,957 | 8,749,418 | 26,406,273 | 23,544,171 | ||||||||||||
| (g) Common Shares authorized |
unlimited | unlimited | unlimited | unlimited | ||||||||||||
See notes to financial statements.
| FINANCIAL STATEMENTS | 57 |
Statements of Assets and Liabilities (unaudited) (continued)
February 29, 2020
| MFL | MVF | |||||||
| ASSETS |
| |||||||
| Investments at value — unaffiliated(a) |
$ | 949,531,934 | $ | 1,008,899,106 | ||||
| Investments at value — affiliated(b) |
425,013 | 2,803,647 | ||||||
| Cash |
15,231 | — | ||||||
| Cash pledged for futures contracts |
684,150 | 799,500 | ||||||
| Receivables: |
| |||||||
| Investments sold |
36,209,432 | 4,456,899 | ||||||
| Dividends — affiliated |
2,998 | 3,283 | ||||||
| Interest — unaffiliated |
10,083,123 | 11,086,095 | ||||||
| Prepaid expenses |
2,734 | 2,202 | ||||||
|
|
|
|
|
|||||
| Total assets |
996,954,615 | 1,028,050,732 | ||||||
|
|
|
|
|
|||||
| ACCRUED LIABILITIES |
| |||||||
| Payables: |
| |||||||
| Investments purchased |
28,970,069 | 22,048,870 | ||||||
| Income dividend distributions — Common Shares |
1,724,277 | 2,172,018 | ||||||
| Interest expense and fees |
276,626 | 311,689 | ||||||
| Investment advisory fees |
789,105 | 805,836 | ||||||
| Trustees’ and Officer’s fees |
284,638 | 129,364 | ||||||
| Other accrued expenses |
151,964 | 150,117 | ||||||
| Variation margin on futures contracts |
726,114 | 828,328 | ||||||
|
|
|
|
|
|||||
| Total accrued liabilities |
32,922,793 | 26,446,222 | ||||||
|
|
|
|
|
|||||
| OTHER LIABILITIES |
| |||||||
| TOB Trust Certificates |
105,978,045 | 100,737,488 | ||||||
| VRDP Shares, at liquidation value of $100,000 per share, net of deferred offering costs(c)(d) |
274,238,531 | — | ||||||
| VMTP Shares, at liquidation value of $100,000 per share(c)(d) |
— | 243,800,000 | ||||||
|
|
|
|
|
|||||
| Total other liabilities |
380,216,576 | 344,537,488 | ||||||
|
|
|
|
|
|||||
| Total liabilities |
413,139,369 | 370,983,710 | ||||||
|
|
|
|
|
|||||
| NET ASSETS APPLICABLE TO COMMON SHAREHOLDERS |
$ | 583,815,246 | $ | 657,067,022 | ||||
|
|
|
|
|
|||||
| NET ASSETS APPLICABLE TO COMMON SHAREHOLDERS CONSIST OF |
| |||||||
| Paid-in capital(e)(f)(g) |
$ | 513,574,337 | $ | 577,197,773 | ||||
| Accumulated earnings |
70,240,909 | 79,869,249 | ||||||
|
|
|
|
|
|||||
| NET ASSETS APPLICABLE TO COMMON SHAREHOLDERS |
$ | 583,815,246 | $ | 657,067,022 | ||||
|
|
|
|
|
|||||
| Net asset value per Common Share |
$ | 15.41 | $ | 10.13 | ||||
|
|
|
|
|
|||||
| (a) Investments at cost — unaffiliated |
$ | 870,870,817 | $ | 911,351,810 | ||||
| (b) Investments at cost — affiliated |
$ | 425,013 | $ | 2,803,406 | ||||
| (c) Preferred Shares outstanding, par value $0.10 per share |
2,746 | 2,438 | ||||||
| (d) Preferred Shares authorized |
1,000,000 | 10,000,000 | ||||||
| (e) Par value per Common Shares |
$ | 0.10 | $ | 0.10 | ||||
| (f) Common Shares outstanding |
37,896,208 | 64,836,371 | ||||||
| (g) Common Shares authorized |
unlimited | 150,000,000 | ||||||
See notes to financial statements.
| 58 | 2020 BLACKROCK SEMI-ANNUAL REPORT TO SHAREHOLDERS |
Statements of Operations (unaudited)
Six Months Ended February 29, 2020
| BBK | BAF | BYM | BLE | |||||||||||||
| INVESTMENT INCOME |
| |||||||||||||||
| Dividends — affiliated |
$ | 4,852 | $ | 1,461 | $ | 17,051 | $ | 40,172 | ||||||||
| Interest — unaffiliated |
5,892,824 | 4,513,404 | 12,899,536 | 12,250,813 | ||||||||||||
|
|
|
|
|
|
|
|
|
|||||||||
| Total investment income |
5,897,676 | 4,514,865 | 12,916,587 | 12,290,985 | ||||||||||||
|
|
|
|
|
|
|
|
|
|||||||||
| EXPENSES |
| |||||||||||||||
| Investment advisory |
927,579 | 635,247 | 1,838,157 | 1,547,303 | ||||||||||||
| Accounting services |
27,655 | 24,677 | 35,245 | 35,245 | ||||||||||||
| Professional |
26,028 | 25,323 | 33,091 | 32,179 | ||||||||||||
| Rating agency |
22,046 | 22,045 | 22,047 | 22,047 | ||||||||||||
| Transfer agent |
12,252 | 10,496 | 20,457 | 18,042 | ||||||||||||
| Trustees and Officer |
5,384 | 4,398 | 11,648 | 9,996 | ||||||||||||
| Custodian |
4,973 | 7,711 | 7,419 | 3,604 | ||||||||||||
| Registration |
4,509 | 4,506 | 4,880 | 4,330 | ||||||||||||
| Printing |
4,212 | 3,954 | 5,099 | 4,852 | ||||||||||||
| Miscellaneous |
4,381 | 4,260 | 5,203 | 5,109 | ||||||||||||
|
|
|
|
|
|
|
|
|
|||||||||
| Total expenses excluding interest expense, fees and amortization of offering costs |
1,039,019 | 742,617 | 1,983,246 | 1,682,707 | ||||||||||||
| Interest expense, fees and amortization of offering costs(a) |
1,128,342 | 942,938 | 2,574,026 | 2,144,006 | ||||||||||||
|
|
|
|
|
|
|
|
|
|||||||||
| Total expenses |
2,167,361 | 1,685,555 | 4,557,272 | 3,826,713 | ||||||||||||
| Less fees waived and/or reimbursed by the Manager |
(107,477 | ) | (133 | ) | (1,586 | ) | (3,574 | ) | ||||||||
|
|
|
|
|
|
|
|
|
|||||||||
| Total expenses after fees waived and/or reimbursed |
2,059,884 | 1,685,422 | 4,555,686 | 3,823,139 | ||||||||||||
|
|
|
|
|
|
|
|
|
|||||||||
| Net investment income |
3,837,792 | 2,829,443 | 8,360,901 | 8,467,846 | ||||||||||||
|
|
|
|
|
|
|
|
|
|||||||||
| REALIZED AND UNREALIZED GAIN (LOSS) |
| |||||||||||||||
| Net realized gain (loss) from: |
| |||||||||||||||
| Futures contracts |
(466,370 | ) | (372,684 | ) | (1,042,481 | ) | (518,947 | ) | ||||||||
| Investments — affiliated |
(95 | ) | (79 | ) | (118 | ) | 471 | |||||||||
| Investments — unaffiliated |
181,448 | 363,346 | 802,006 | 646,748 | ||||||||||||
|
|
|
|
|
|
|
|
|
|||||||||
| (285,017 | ) | (9,417 | ) | (240,593 | ) | 128,272 | ||||||||||
|
|
|
|
|
|
|
|
|
|||||||||
| Net change in unrealized appreciation (depreciation) on: |
| |||||||||||||||
| Futures contracts |
(246,962 | ) | (187,429 | ) | (568,874 | ) | (370,030 | ) | ||||||||
| Investments — affiliated |
— | — | 40 | 1,104 | ||||||||||||
| Investments — unaffiliated |
4,365,316 | 2,711,438 | 9,880,900 | 8,928,986 | ||||||||||||
|
|
|
|
|
|
|
|
|
|||||||||
| 4,118,354 | 2,524,009 | 9,312,066 | 8,560,060 | |||||||||||||
|
|
|
|
|
|
|
|
|
|||||||||
| Net realized and unrealized gain |
3,833,337 | 2,514,592 | 9,071,473 | 8,688,332 | ||||||||||||
|
|
|
|
|
|
|
|
|
|||||||||
| NET INCREASE IN NET ASSETS APPLICABLE TO COMMON SHAREHOLDERS RESULTING FROM OPERATIONS |
$ | 7,671,129 | $ | 5,344,035 | $ | 17,432,374 | $ | 17,156,178 | ||||||||
|
|
|
|
|
|
|
|
|
|||||||||
| (a) | Related to TOB Trusts, VRDP Shares and/or VMTP Shares. |
See notes to financial statements.
| FINANCIAL STATEMENTS | 59 |
Statements of Operations (unaudited) (continued)
Six Months Ended February 29, 2020
| MFL | MVF | |||||||
| INVESTMENT INCOME |
| |||||||
| Dividends — affiliated |
$ | 19,229 | $ | 33,830 | ||||
| Interest — unaffiliated |
16,968,978 | 19,427,520 | ||||||
|
|
|
|
|
|||||
| Total investment income |
16,988,207 | 19,461,350 | ||||||
|
|
|
|
|
|||||
| EXPENSES |
| |||||||
| Investment advisory |
2,559,383 | 2,428,622 | ||||||
| Accounting services |
63,010 | 65,654 | ||||||
| Professional |
42,518 | 43,286 | ||||||
| Transfer agent |
24,167 | 27,547 | ||||||
| Rating agency |
22,050 | 22,049 | ||||||
| Liquidity fees |
13,940 | — | ||||||
| Remarketing fees on Preferred Shares |
13,687 | — | ||||||
| Registration |
7,002 | 11,405 | ||||||
| Trustees and Officer |
6,743 | 17,016 | ||||||
| Custodian |
4,756 | 4,187 | ||||||
| Printing |
5,484 | 5,931 | ||||||
| Miscellaneous |
5,808 | 7,073 | ||||||
|
|
|
|
|
|||||
| Total expenses excluding interest expense, fees and amortization of offering costs |
2,768,548 | 2,632,770 | ||||||
| Interest expense, fees and amortization of offering costs(a) |
3,695,480 | 3,524,612 | ||||||
|
|
|
|
|
|||||
| Total expenses |
6,464,028 | 6,157,382 | ||||||
| Less fees waived and/or reimbursed by the Manager |
(199,547 | ) | (3,055 | ) | ||||
|
|
|
|
|
|||||
| Total expenses after fees waived and/or reimbursed |
6,264,481 | 6,154,327 | ||||||
|
|
|
|
|
|||||
| Net investment income |
10,723,726 | 13,307,023 | ||||||
|
|
|
|
|
|||||
| REALIZED AND UNREALIZED GAIN (LOSS) |
| |||||||
| Net realized gain (loss) from: |
| |||||||
| Futures contracts |
(719,617 | ) | (1,426,618 | ) | ||||
| Investments — affiliated |
(438 | ) | (1,658 | ) | ||||
| Investments — unaffiliated |
3,978,381 | 888,506 | ||||||
|
|
|
|
|
|||||
| 3,258,326 | (539,770 | ) | ||||||
|
|
|
|
|
|||||
| Net change in unrealized appreciation (depreciation) on: |
| |||||||
| Futures contracts |
(766,356 | ) | (944,400 | ) | ||||
| Investments — affiliated |
5 | 1,902 | ||||||
| Investments — unaffiliated |
14,604,137 | 21,184,235 | ||||||
|
|
|
|
|
|||||
| 13,837,786 | 20,241,737 | |||||||
|
|
|
|
|
|||||
| Net realized and unrealized gain |
17,096,112 | 19,701,967 | ||||||
|
|
|
|
|
|||||
| NET INCREASE IN NET ASSETS APPLICABLE TO COMMON SHAREHOLDERS RESULTING FROM OPERATIONS |
$ | 27,819,838 | $ | 33,008,990 | ||||
|
|
|
|
|
|||||
| (a) | Related to TOB Trusts, VRDP Shares and/or VMTP Shares. |
See notes to financial statements.
| 60 | 2020 BLACKROCK SEMI-ANNUAL REPORT TO SHAREHOLDERS |
Statements of Changes in Net Assets
| BBK | BAF | |||||||||||||||||||
| Six Months Ended (unaudited) |
Year Ended 08/31/19 |
Six Months Ended (unaudited) |
Year Ended 08/31/19 |
|||||||||||||||||
| INCREASE (DECREASE) IN NET ASSETS APPLICABLE TO COMMON SHAREHOLDERS |
|
|||||||||||||||||||
| OPERATIONS |
|
|||||||||||||||||||
| Net investment income |
$ | 3,837,792 | $ | 6,872,366 | $ | 2,829,443 | $ | 5,709,453 | ||||||||||||
| Net realized loss |
(285,017 | ) | (1,811,757 | ) | (9,417 | ) | (922,047 | ) | ||||||||||||
| Net change in unrealized appreciation (depreciation) |
4,118,354 | 13,838,815 | 2,524,009 | 8,435,693 | ||||||||||||||||
|
|
|
|
|
|
|
|
|
|||||||||||||
| Net increase in net assets applicable to Common Shareholders resulting from operations |
7,671,129 | 18,899,424 | 5,344,035 | 13,223,099 | ||||||||||||||||
|
|
|
|
|
|
|
|
|
|||||||||||||
| DISTRIBUTIONS TO COMMON SHAREHOLDERS(a) |
|
|||||||||||||||||||
| Decrease in net assets resulting from distributions to Common Shareholders |
(3,441,007 | ) | (7,948,273 | ) | (2,703,570 | ) | (6,019,600 | ) | ||||||||||||
|
|
|
|
|
|
|
|
|
|||||||||||||
| NET ASSETS APPLICABLE TO COMMON SHAREHOLDERS |
|
|||||||||||||||||||
| Total increase in net assets applicable to Common Shareholders |
4,230,122 | 10,951,151 | 2,640,465 | 7,203,499 | ||||||||||||||||
| Beginning of period |
177,029,774 | 166,078,623 | 137,225,512 | 130,022,013 | ||||||||||||||||
|
|
|
|
|
|
|
|
|
|||||||||||||
| End of period |
$ | 181,259,896 | $ | 177,029,774 | $ | 139,865,977 | $ | 137,225,512 | ||||||||||||
|
|
|
|
|
|
|
|
|
|||||||||||||
| (a) | Distributions for annual periods determined in accordance with U.S. federal income tax regulations. |
See notes to financial statements.
| FINANCIAL STATEMENTS | 61 |
Statements of Changes in Net Assets (continued)
| BYM | BLE | |||||||||||||||||||
| Six Months Ended (unaudited) |
Year Ended 08/31/19 |
Six Months Ended (unaudited) |
Year Ended 08/31/19 |
|||||||||||||||||
| INCREASE (DECREASE) IN NET ASSETS APPLICABLE TO COMMON SHAREHOLDERS |
| |||||||||||||||||||
| OPERATIONS |
| |||||||||||||||||||
| Net investment income |
$ | 8,360,901 | $ | 16,163,564 | $ | 8,467,846 | $ | 16,652,798 | ||||||||||||
| Net realized gain (loss) |
(240,593 | ) | (4,197,389 | ) | 128,272 | (2,843,168 | ) | |||||||||||||
| Net change in unrealized appreciation (depreciation) |
9,312,066 | 31,612,385 | 8,560,060 | 16,739,939 | ||||||||||||||||
|
|
|
|
|
|
|
|
|
|||||||||||||
| Net increase in net assets applicable to Common Shareholders resulting from operations |
17,432,374 | 43,578,560 | 17,156,178 | 30,549,569 | ||||||||||||||||
|
|
|
|
|
|
|
|
|
|||||||||||||
| DISTRIBUTIONS TO COMMON SHAREHOLDERS(a) |
| |||||||||||||||||||
| Decrease in net assets resulting from distributions to Common Shareholders |
(7,605,007 | )(b) | (16,599,960 | ) | (8,191,654 | ) | (16,376,933 | ) | ||||||||||||
|
|
|
|
|
|
|
|
|
|||||||||||||
| CAPITAL SHARE TRANSACTIONS |
|
|||||||||||||||||||
| Reinvestment of common distributions |
— | — | 176,517 | 38,608 | ||||||||||||||||
|
|
|
|
|
|
|
|
|
|||||||||||||
| NET ASSETS APPLICABLE TO COMMON SHAREHOLDERS |
| |||||||||||||||||||
| Total increase in net assets applicable to Common Shareholders |
9,827,367 | 26,978,600 | 9,141,041 | 14,211,244 | ||||||||||||||||
| Beginning of period |
415,127,477 | 388,148,877 | 356,648,743 | 342,437,499 | ||||||||||||||||
|
|
|
|
|
|
|
|
|
|||||||||||||
| End of period |
$ | 424,954,844 | $ | 415,127,477 | $ | 365,789,784 | $ | 356,648,743 | ||||||||||||
|
|
|
|
|
|
|
|
|
|||||||||||||
| (a) | Distributions for annual periods determined in accordance with U.S. federal income tax regulations. |
| (b) | A portion of the distributions from net investment income may be deemed a return of capital or net realized gain at fiscal year end. |
See notes to financial statements.
| 62 | 2020 BLACKROCK SEMI-ANNUAL REPORT TO SHAREHOLDERS |
Statements of Changes in Net Assets (continued)
| MFL | MVF | |||||||||||||||||||
| Six Months Ended (unaudited) |
Year Ended 08/31/19 |
Six Months Ended 02/29/20 (unaudited) |
Year Ended 08/31/19 |
|||||||||||||||||
| INCREASE (DECREASE) IN NET ASSETS APPLICABLE TO COMMON SHAREHOLDERS |
|
|||||||||||||||||||
| OPERATIONS |
|
|||||||||||||||||||
| Net investment income |
$ | 10,723,726 | $ | 22,233,643 | $ | 13,307,023 | $ | 28,718,159 | ||||||||||||
| Net realized gain |
3,258,326 | 2,226,310 | (539,770 | ) | (4,769,186 | ) | ||||||||||||||
| Net change in unrealized appreciation (depreciation) |
13,837,786 | 32,059,502 | 20,241,737 | 37,783,965 | ||||||||||||||||
|
|
|
|
|
|
|
|
|
|||||||||||||
| Net increase in net assets applicable to Common Shareholders resulting from operations |
27,819,838 | 56,519,455 | 33,008,990 | 61,732,938 | ||||||||||||||||
|
|
|
|
|
|
|
|
|
|||||||||||||
| DISTRIBUTIONS TO COMMON SHAREHOLDERS(a) |
|
|||||||||||||||||||
| Decrease in net assets resulting from distributions to Common Shareholders |
(10,345,665 | ) | (24,253,573 | ) | (13,578,292 | )(b) | (30,068,516 | ) | ||||||||||||
|
|
|
|
|
|
|
|
|
|||||||||||||
| NET ASSETS APPLICABLE TO COMMON SHAREHOLDERS |
|
|||||||||||||||||||
| Total increase in net assets applicable to Common Shareholders |
17,474,173 | 32,265,882 | 19,430,698 | 31,664,422 | ||||||||||||||||
| Beginning of period |
566,341,073 | 534,075,191 | 637,636,324 | 605,971,902 | ||||||||||||||||
|
|
|
|
|
|
|
|
|
|||||||||||||
| End of period |
$ | 583,815,246 | $ | 566,341,073 | $ | 657,067,022 | $ | 637,636,324 | ||||||||||||
|
|
|
|
|
|
|
|
|
|||||||||||||
| (a) | Distributions for annual periods determined in accordance with U.S. federal income tax regulations. |
| (b) | A portion of the distributions from net investment income may be deemed a return of capital or net realized gain at fiscal year end. |
See notes to financial statements.
| FINANCIAL STATEMENTS | 63 |
Statements of Cash Flows (unaudited)
Six Months Ended February 29, 2020
| BBK | BAF | BYM | BLE | |||||||||||||
| CASH PROVIDED BY (USED FOR) OPERATING ACTIVITIES |
||||||||||||||||
| Net increase in net assets resulting from operations |
$ | 7,671,129 | $ | 5,344,035 | $ | 17,432,374 | $ | 17,156,178 | ||||||||
| Adjustments to reconcile net increase in net assets resulting from operations to net cash provided by (used for) operating activities: |
||||||||||||||||
| Proceeds from sales of long-term investments |
8,957,793 | 21,235,617 | 25,710,788 | 47,662,409 | ||||||||||||
| Purchases of long-term investments |
(11,502,178 | ) | (23,345,851 | ) | (30,979,192 | ) | (54,472,098 | ) | ||||||||
| Net proceeds from sales (purchases) of short-term securities |
(1,769,559 | ) | (627,268 | ) | (4,288,430 | ) | (3,822,905 | ) | ||||||||
| Amortization of premium and accretion of discount on investments and other fees |
2,935 | 571,324 | 419,999 | 543,066 | ||||||||||||
| Net realized gain (loss) on investments |
(181,353 | ) | (363,267 | ) | (801,888 | ) | (647,219 | ) | ||||||||
| Net unrealized appreciation (depreciation) on investments |
(4,365,316 | ) | (2,711,438 | ) | (9,880,940 | ) | (8,930,090 | ) | ||||||||
| (Increase) Decrease in Assets: |
||||||||||||||||
| Receivables: |
||||||||||||||||
| Dividends — affiliated |
87 | 435 | (1,395 | ) | 635 | |||||||||||
| Interest — unaffiliated |
38,356 | (30,449 | ) | 45,554 | 261,597 | |||||||||||
| Prepaid expenses |
25,549 | 25,643 | 25,310 | 24,938 | ||||||||||||
| Increase (Decrease) in Liabilities: |
||||||||||||||||
| Payables: |
||||||||||||||||
| Interest expense and fees |
(10,358 | ) | (36,026 | ) | (98,670 | ) | (70,190 | ) | ||||||||
| Investment advisory fees |
134,916 | 102,816 | 300,477 | 254,038 | ||||||||||||
| Trustees’ and Officer’s fees |
(1,338 | ) | (974 | ) | (3,092 | ) | (2,792 | ) | ||||||||
| Other accrued expenses |
(50,539 | ) | (42,179 | ) | (64,142 | ) | (60,094 | ) | ||||||||
| Variation margin on futures contracts |
229,883 | 172,441 | 529,469 | 342,055 | ||||||||||||
|
|
|
|
|
|
|
|
|
|||||||||
| Net cash provided by (used for) operating activities |
(819,993 | ) | 294,859 | (1,653,778 | ) | (1,760,472 | ) | |||||||||
|
|
|
|
|
|
|
|
|
|||||||||
| CASH PROVIDED BY (USED FOR) FINANCING ACTIVITIES |
||||||||||||||||
| Cash dividends paid to Common Shareholders |
(3,441,007 | ) | (2,703,570 | ) | (7,605,007 | ) | (8,014,457 | ) | ||||||||
| Repayments of TOB Trust Certificates |
— | (20,680 | ) | (719,542 | ) | (6,890,000 | ) | |||||||||
| Proceeds from TOB Trust Certificates |
4,248,500 | 2,440,000 | 9,916,498 | 16,665,890 | ||||||||||||
|
|
|
|
|
|
|
|
|
|||||||||
| Net cash (provided by) used for financing activities |
807,493 | (284,250 | ) | 1,591,949 | 1,761,433 | |||||||||||
|
|
|
|
|
|
|
|
|
|||||||||
| CASH |
||||||||||||||||
| Net increase (decrease) in restricted and unrestricted cash |
(12,500 | ) | 10,609 | (61,829 | ) | 961 | ||||||||||
| Restricted and unrestricted cash at beginning of period |
235,550 | 158,191 | 567,879 | 336,839 | ||||||||||||
|
|
|
|
|
|
|
|
|
|||||||||
| Restricted and unrestricted cash at end of period |
$ | 223,050 | $ | 168,800 | $ | 506,050 | $ | 337,800 | ||||||||
|
|
|
|
|
|
|
|
|
|||||||||
| SUPPLEMENTAL DISCLOSURE OF CASH FLOW INFORMATION |
||||||||||||||||
| Cash paid during the period for interest expense |
$ | 1,138,700 | $ | 978,964 | $ | 2,672,696 | $ | 2,214,196 | ||||||||
|
|
|
|
|
|
|
|
|
|||||||||
| NON-CASH FINANCING ACTIVITIES |
||||||||||||||||
| Capital shares issued in reinvestment of distributions paid to Common Shareholders |
$ | — | $ | — | $ | — | $ | 176,517 | ||||||||
|
|
|
|
|
|
|
|
|
|||||||||
| RECONCILIATION OF RESTRICTED AND UNRESTRICTED CASH AT THE END OF PERIOD TO THE STATEMENTS OF ASSETS AND LIABILITIES |
||||||||||||||||
| Cash |
$ | — | $ | — | $ | — | $ | — | ||||||||
| Cash pledged: |
||||||||||||||||
| Futures contracts |
223,050 | 168,800 | 506,050 | 337,800 | ||||||||||||
|
|
|
|
|
|
|
|
|
|||||||||
| $ | 223,050 | $ | 168,800 | $ | 506,050 | $ | 337,800 | |||||||||
|
|
|
|
|
|
|
|
|
|||||||||
| RECONCILIATION OF RESTRICTED AND UNRESTRICTED CASH AT THE BEGINNING OF PERIOD TO THE STATEMENTS OF ASSETS AND LIABILITIES |
||||||||||||||||
| Cash |
$ | 54,500 | $ | 36,391 | $ | 130,829 | $ | 78,039 | ||||||||
| Cash pledged: |
||||||||||||||||
| Futures contracts |
181,050 | 121,800 | 437,050 | 258,800 | ||||||||||||
|
|
|
|
|
|
|
|
|
|||||||||
| $ | 235,550 | $ | 158,191 | $ | 567,879 | $ | 336,839 | |||||||||
|
|
|
|
|
|
|
|
|
|||||||||
See notes to financial statements.
| 64 | 2020 BLACKROCK SEMI-ANNUAL REPORT TO SHAREHOLDERS |
Statements of Cash Flows (unaudited) (continued)
Six Months Ended February 29, 2020
| MFL | MVF | |||||||
| CASH PROVIDED BY (USED FOR) OPERATING ACTIVITIES |
||||||||
| Net increase in net assets resulting from operations |
$ | 27,819,838 | $ | 33,008,990 | ||||
| Adjustments to reconcile net increase in net assets resulting from operations to net cash provided by (used for) operating activities: |
||||||||
| Proceeds from sales of long-term investments |
146,117,728 | 64,499,270 | ||||||
| Purchases of long-term investments |
(162,149,834 | ) | (77,650,237 | ) | ||||
| Net proceeds from sales (purchases) of short-term securities |
2,830,647 | 13,821,901 | ||||||
| Amortization of premium and accretion of discount on investments and other fees |
3,293,430 | 1,888,390 | ||||||
| Net realized gain (loss) on investments |
(3,977,943 | ) | (886,848 | ) | ||||
| Net unrealized appreciation (depreciation) on investments |
(14,604,142 | ) | (21,186,137 | ) | ||||
| (Increase) Decrease in Assets: |
||||||||
| Receivables: |
||||||||
| Dividends — affiliated |
476 | 12,978 | ||||||
| Interest — unaffiliated |
22,803 | (691,551 | ) | |||||
| Prepaid expenses |
27,628 | 31,288 | ||||||
| Increase (Decrease) in Liabilities: |
||||||||
| Payables: |
|
|||||||
| Interest expense and fees |
(64,184 | ) | (111,576 | ) | ||||
| Investment advisory fees |
384,595 | 392,251 | ||||||
| Trustees’ and Officer’s fees |
(29,706 | ) | (19,326 | ) | ||||
| Other accrued expenses |
(103,562 | ) | (105,296 | ) | ||||
| Variation margin on futures contracts |
715,495 | 822,984 | ||||||
|
|
|
|
|
|||||
| Net cash provided by (used for) operating activities |
283,269 | 13,827,081 | ||||||
|
|
|
|
|
|||||
| CASH PROVIDED BY (USED FOR) FINANCING ACTIVITIES |
||||||||
| Cash dividends paid to Common Shareholders |
(10,345,665 | ) | (13,707,965 | ) | ||||
| Repayments of TOB Trust Certificates |
— | (6,399,835 | ) | |||||
| Proceeds from TOB Trust Certificates |
10,000,000 | 6,674,001 | ||||||
| Amortization of deferred offering costs |
8,446 | — | ||||||
|
|
|
|
|
|||||
| Net cash (provided by) used for financing activities |
(337,219 | ) | (13,433,799 | ) | ||||
|
|
|
|
|
|||||
| CASH |
||||||||
| Net increase (decrease) in restricted and unrestricted cash |
(53,950 | ) | 393,282 | |||||
| Restricted and unrestricted cash at beginning of period |
753,331 | 406,218 | ||||||
|
|
|
|
|
|||||
| Restricted and unrestricted cash at end of period |
$ | 699,381 | $ | 799,500 | ||||
|
|
|
|
|
|||||
| SUPPLEMENTAL DISCLOSURE OF CASH FLOW INFORMATION |
||||||||
| Cash paid during the period for interest expense |
$ | 3,751,218 | $ | 3,636,188 | ||||
|
|
|
|
|
|||||
| RECONCILIATION OF RESTRICTED AND UNRESTRICTED CASH AT THE END OF PERIOD TO THE STATEMENTS OF ASSETS AND LIABILITIES |
||||||||
| Cash |
$ | 15,231 | $ | — | ||||
| Cash pledged: |
||||||||
| Futures contracts |
684,150 | 799,500 | ||||||
|
|
|
|
|
|||||
| $ | 699,381 | $ | 799,500 | |||||
|
|
|
|
|
|||||
| RECONCILIATION OF RESTRICTED AND UNRESTRICTED CASH AT THE BEGINNING OF PERIOD TO THE STATEMENTS OF ASSETS AND LIABILITIES |
||||||||
| Cash |
$ | 174,181 | $ | 94,718 | ||||
| Cash pledged: |
||||||||
| Futures contracts |
579,150 | 311,500 | ||||||
|
|
|
|
|
|||||
| $ | 753,331 | $ | 406,218 | |||||
|
|
|
|
|
|||||
See notes to financial statements.
| FINANCIAL STATEMENTS | 65 |
(For a share outstanding throughout each period)
| BBK | ||||||||||||||||||||||||||||
| Six Months Ended 02/29/20 (unaudited) |
Year Ended August 31, | |||||||||||||||||||||||||||
| 2019 | 2018 | 2017 | 2016 | 2015 | ||||||||||||||||||||||||
| Net asset value, beginning of period |
$ | 16.82 | $ | 15.78 | $ | 16.32 | $ | 17.89 | $ | 16.49 | $ | 16.54 | ||||||||||||||||
|
|
|
|
|
|
|
|
|
|
|
|
|
|||||||||||||||||
| Net investment income(a) |
0.36 | 0.65 | 0.70 | 0.74 | 0.89 | 0.90 | ||||||||||||||||||||||
| Net realized and unrealized gain (loss) |
0.38 | 1.15 | (0.47 | ) | (1.09 | ) | 1.42 | 0.03 | ||||||||||||||||||||
|
|
|
|
|
|
|
|
|
|
|
|
|
|||||||||||||||||
| Net increase (decrease) from investment operations |
0.74 | 1.80 | 0.23 | (0.35 | ) | 2.31 | 0.93 | |||||||||||||||||||||
|
|
|
|
|
|
|
|
|
|
|
|
|
|||||||||||||||||
| Distributions to Common Shareholders(b) |
||||||||||||||||||||||||||||
| From net investment income |
(0.33 | ) | (0.70 | ) | (0.77 | ) | (0.83 | ) | (0.90 | ) | (0.98 | ) | ||||||||||||||||
| From net realized gain |
— | (0.06 | ) | — | (0.39 | ) | (0.01 | ) | — | |||||||||||||||||||
|
|
|
|
|
|
|
|
|
|
|
|
|
|||||||||||||||||
| Total distributions to Common Shareholders |
(0.33 | ) | (0.76 | ) | (0.77 | ) | (1.22 | ) | (0.91 | ) | (0.98 | ) | ||||||||||||||||
|
|
|
|
|
|
|
|
|
|
|
|
|
|||||||||||||||||
| Net asset value, end of period |
$ | 17.23 | $ | 16.82 | $ | 15.78 | $ | 16.32 | $ | 17.89 | $ | 16.49 | ||||||||||||||||
|
|
|
|
|
|
|
|
|
|
|
|
|
|||||||||||||||||
| Market price, end of period |
$ | 15.94 | $ | 15.95 | $ | 14.35 | $ | 15.99 | $ | 18.22 | $ | 15.23 | ||||||||||||||||
|
|
|
|
|
|
|
|
|
|
|
|
|
|||||||||||||||||
| Total Return Applicable to Common Shareholders(c) |
||||||||||||||||||||||||||||
| Based on net asset value |
4.58 | %(d) | 12.35 | % | 1.87 | % | (1.44 | )% | 14.53 | % | 5.96 | % | ||||||||||||||||
|
|
|
|
|
|
|
|
|
|
|
|
|
|||||||||||||||||
| Based on market price |
2.02 | %(d) | 17.16 | % | (5.45 | )% | (5.18 | )% | 26.29 | % | 3.83 | % | ||||||||||||||||
|
|
|
|
|
|
|
|
|
|
|
|
|
|||||||||||||||||
| Ratios to Average Net Assets Applicable to Common Shareholders |
||||||||||||||||||||||||||||
| Total expenses |
2.48 | %(e) | 2.79 | % | 2.49 | % | 2.31 | % | 1.78 | % | 1.73 | % | ||||||||||||||||
|
|
|
|
|
|
|
|
|
|
|
|
|
|||||||||||||||||
| Total expenses after fees waived and paid indirectly |
2.36 | %(e) | 2.77 | % | 2.49 | % | 2.31 | % | 1.77 | % | 1.73 | % | ||||||||||||||||
|
|
|
|
|
|
|
|
|
|
|
|
|
|||||||||||||||||
| Total expenses after fees waived and paid indirectly and excluding interest expense, fees, and amortization of offering costs(f) |
1.07 | %(e) | 1.18 | % | 1.18 | % | 1.19 | % | 1.16 | % | 1.16 | % | ||||||||||||||||
|
|
|
|
|
|
|
|
|
|
|
|
|
|||||||||||||||||
| Net investment income to Common Shareholders |
4.40 | %(e) | 4.13 | % | 4.39 | % | 4.55 | % | 5.18 | % | 5.41 | % | ||||||||||||||||
|
|
|
|
|
|
|
|
|
|
|
|
|
|||||||||||||||||
| Supplemental Data |
||||||||||||||||||||||||||||
| Net assets applicable to Common Shareholders, end of period (000) |
$ | 181,260 | $ | 177,030 | $ | 166,079 | $ | 171,705 | $ | 188,107 | $ | 173,363 | ||||||||||||||||
|
|
|
|
|
|
|
|
|
|
|
|
|
|||||||||||||||||
| VMTP Shares outstanding at $100,000 liquidation value, end of period (000) |
$ | 79,900 | $ | 79,900 | $ | 79,900 | $ | 79,900 | $ | 79,900 | $ | 79,900 | ||||||||||||||||
|
|
|
|
|
|
|
|
|
|
|
|
|
|||||||||||||||||
| Asset coverage per VMTP Shares at $100,000 liquidation value, end of period |
$ | 326,858 | $ | 321,564 | $ | 307,858 | $ | 314,899 | $ | 335,428 | $ | 316,975 | ||||||||||||||||
|
|
|
|
|
|
|
|
|
|
|
|
|
|||||||||||||||||
| Borrowings outstanding, end of period (000) |
$ | 33,443 | $ | 29,194 | $ | 23,232 | $ | 22,404 | $ | 25,054 | $ | 19,495 | ||||||||||||||||
|
|
|
|
|
|
|
|
|
|
|
|
|
|||||||||||||||||
| Portfolio turnover rate |
3 | % | 19 | % | 38 | % | 46 | % | 29 | % | 34 | % | ||||||||||||||||
|
|
|
|
|
|
|
|
|
|
|
|
|
|||||||||||||||||
| (a) | Based on average Common Shares outstanding. |
| (b) | Distributions for annual periods determined in accordance with U.S. federal income tax regulations. |
| (c) | Total returns based on market price, which can be significantly greater or less than the net asset value, may result in substantially different returns. Where applicable, excludes the effects of any sales charges and assumes the reinvestment of distributions at actual reinvestment prices. |
| (d) | Aggregate total return. |
| (e) | Annualized. |
| (f) | Interest expense, fees and amortization of offering costs related to TOB Trusts and/or VMTP Shares. See Note 4 and Note 10 of the Notes to Financial Statements for details. |
See notes to financial statements.
| 66 | 2020 BLACKROCK SEMI-ANNUAL REPORT TO SHAREHOLDERS |
Financial Highlights (continued)
(For a share outstanding throughout each period)
| BAF | ||||||||||||||||||||||||||||
| Six Months Ended 02/29/20 (unaudited) |
Year Ended August 31, | |||||||||||||||||||||||||||
| 2019 | 2018 | 2017 | 2016 | 2015 | ||||||||||||||||||||||||
| Net asset value, beginning of period |
$ | 15.68 | $ | 14.86 | $ | 15.69 | $ | 16.56 | $ | 15.80 | $ | 15.97 | ||||||||||||||||
|
|
|
|
|
|
|
|
|
|
|
|
|
|||||||||||||||||
| Net investment income(a) |
0.32 | 0.65 | 0.74 | 0.79 | 0.83 | 0.83 | ||||||||||||||||||||||
| Net realized and unrealized gain (loss) |
0.30 | 0.86 | (0.77 | ) | (0.84 | ) | 0.75 | (0.18 | ) | |||||||||||||||||||
|
|
|
|
|
|
|
|
|
|
|
|
|
|||||||||||||||||
| Net increase (decrease) from investment operations |
0.62 | 1.51 | (0.03 | ) | (0.05 | ) | 1.58 | 0.65 | ||||||||||||||||||||
|
|
|
|
|
|
|
|
|
|
|
|
|
|||||||||||||||||
| Distributions to Common Shareholders from net investment income(b) |
(0.31 | ) | (0.69 | ) | (0.80 | ) | (0.82 | ) | (0.82 | ) | (0.82 | ) | ||||||||||||||||
|
|
|
|
|
|
|
|
|
|
|
|
|
|||||||||||||||||
| Net asset value, end of period |
$ | 15.99 | $ | 15.68 | $ | 14.86 | $ | 15.69 | $ | 16.56 | $ | 15.80 | ||||||||||||||||
|
|
|
|
|
|
|
|
|
|
|
|
|
|||||||||||||||||
| Market price, end of period |
$ | 14.36 | $ | 14.53 | $ | 13.54 | $ | 15.11 | $ | 15.79 | $ | 13.89 | ||||||||||||||||
|
|
|
|
|
|
|
|
|
|
|
|
|
|||||||||||||||||
| Total Return Applicable to Common Shareholders(c) |
||||||||||||||||||||||||||||
| Based on net asset value |
4.17 | %(d) | 10.96 | % | 0.18 | % | 0.14 | % | 10.57 | % | 4.71 | % | ||||||||||||||||
|
|
|
|
|
|
|
|
|
|
|
|
|
|||||||||||||||||
| Based on market price |
0.95 | %(d) | 12.85 | % | (5.22 | )% | 1.15 | % | 19.92 | % | 3.68 | % | ||||||||||||||||
|
|
|
|
|
|
|
|
|
|
|
|
|
|||||||||||||||||
| Ratios to Average Net Assets Applicable to Common Shareholders |
||||||||||||||||||||||||||||
| Total expenses |
2.50 | %(e) | 2.82 | % | 2.47 | % | 2.06 | % | 1.61 | % | 1.50 | % | ||||||||||||||||
|
|
|
|
|
|
|
|
|
|
|
|
|
|||||||||||||||||
| Total expenses after fees waived and paid indirectly |
2.50 | %(e) | 2.82 | % | 2.47 | % | 2.06 | % | 1.61 | % | 1.50 | % | ||||||||||||||||
|
|
|
|
|
|
|
|
|
|
|
|
|
|||||||||||||||||
| Total expenses after fees waived and paid indirectly and excluding interest expense, fees, and amortization of offering costs(f) |
1.10 | %(e) | 1.11 | % | 1.08 | % | 1.06 | % | 1.01 | % | 1.00 | % | ||||||||||||||||
|
|
|
|
|
|
|
|
|
|
|
|
|
|||||||||||||||||
| Net investment income to Common Shareholders |
4.19 | %(e) | 4.38 | % | 4.84 | % | 5.06 | % | 5.09 | % | 5.16 | % | ||||||||||||||||
|
|
|
|
|
|
|
|
|
|
|
|
|
|||||||||||||||||
| Supplemental Data |
||||||||||||||||||||||||||||
| Net assets applicable to Common Shareholders, end of period (000) |
$ | 139,866 | $ | 137,226 | $ | 130,022 | $ | 137,264 | $ | 144,927 | $ | 138,203 | ||||||||||||||||
|
|
|
|
|
|
|
|
|
|
|
|
|
|||||||||||||||||
| VMTP Shares outstanding at $100,000 liquidation value, end of period (000) |
$ | 42,200 | $ | 42,200 | $ | 42,200 | $ | 42,200 | $ | 42,200 | $ | 42,200 | ||||||||||||||||
|
|
|
|
|
|
|
|
|
|
|
|
|
|||||||||||||||||
| Asset coverage per VMTP Shares at $100,000 liquidation value, end of period |
$ | 431,436 | $ | 425,179 | $ | 408,109 | $ | 425,270 | $ | 443,429 | $ | 427,495 | ||||||||||||||||
|
|
|
|
|
|
|
|
|
|
|
|
|
|||||||||||||||||
| Borrowings outstanding, end of period (000) |
$ | 56,449 | $ | 54,030 | $ | 49,192 | $ | 44,937 | $ | 42,089 | $ | 33,470 | ||||||||||||||||
|
|
|
|
|
|
|
|
|
|
|
|
|
|||||||||||||||||
| Portfolio turnover rate |
9 | % | 36 | % | 28 | % | 31 | % | 29 | % | 13 | % | ||||||||||||||||
|
|
|
|
|
|
|
|
|
|
|
|
|
|||||||||||||||||
| (a) | Based on average Common Shares outstanding. |
| (b) | Distributions for annual periods determined in accordance with U.S. federal income tax regulations. |
| (c) | Total returns based on market price, which can be significantly greater or less than the net asset value, may result in substantially different returns. Where applicable, excludes the effects of any sales charges and assumes the reinvestment of distributions at actual reinvestment prices. |
| (d) | Aggregate total return. |
| (e) | Annualized. |
| (f) | Interest expense, fees and amortization of offering costs related to TOBs Trusts and/or VMTP Shares. See Note 4 and Note 10 of the Notes to Financial Statements for details. |
See notes to financial statements.
| FINANCIAL HIGHLIGHTS | 67 |
Financial Highlights (continued)
(For a share outstanding throughout each period)
| BYM | ||||||||||||||||||||||||||||
| Six Months Ended 02/29/20 (unaudited) |
Year Ended August 31, | |||||||||||||||||||||||||||
| 2019 | 2018 | 2017 | 2016 | 2015 | ||||||||||||||||||||||||
| Net asset value, beginning of period |
$ | 15.72 | $ | 14.70 | $ | 15.32 | $ | 16.22 | $ | 15.21 | $ | 15.56 | ||||||||||||||||
|
|
|
|
|
|
|
|
|
|
|
|
|
|||||||||||||||||
| Net investment income(a) |
0.32 | 0.61 | 0.67 | 0.75 | 0.82 | 0.84 | ||||||||||||||||||||||
| Net realized and unrealized gain (loss) |
0.34 | 1.04 | (0.62 | ) | (0.87 | ) | 1.02 | (0.33 | ) | |||||||||||||||||||
|
|
|
|
|
|
|
|
|
|
|
|
|
|||||||||||||||||
| Net increase (decrease) from investment operations |
0.66 | 1.65 | 0.05 | (0.12 | ) | 1.84 | 0.51 | |||||||||||||||||||||
|
|
|
|
|
|
|
|
|
|
|
|
|
|||||||||||||||||
| Distributions to Common Shareholders from net investment income(b) |
(0.29 | )(c) | (0.63 | ) | (0.67 | ) | (0.78 | ) | (0.83 | ) | (0.86 | ) | ||||||||||||||||
|
|
|
|
|
|
|
|
|
|
|
|
|
|||||||||||||||||
| Net asset value, end of period |
$ | 16.09 | $ | 15.72 | $ | 14.70 | $ | 15.32 | $ | 16.22 | $ | 15.21 | ||||||||||||||||
|
|
|
|
|
|
|
|
|
|
|
|
|
|||||||||||||||||
| Market price, end of period |
$ | 14.39 | $ | 14.19 | $ | 13.09 | $ | 14.84 | $ | 15.55 | $ | 13.67 | ||||||||||||||||
|
|
|
|
|
|
|
|
|
|
|
|
|
|||||||||||||||||
| Total Return Applicable to Common Shareholders(d) |
||||||||||||||||||||||||||||
| Based on net asset value |
4.44 | %(e) | 12.12 | % | 0.80 | % | (0.30 | )% | 12.71 | % | 3.85 | % | ||||||||||||||||
|
|
|
|
|
|
|
|
|
|
|
|
|
|||||||||||||||||
| Based on market price |
3.48 | %(e) | 13.66 | % | (7.34 | )% | 0.74 | % | 20.23 | % | 4.03 | % | ||||||||||||||||
|
|
|
|
|
|
|
|
|
|
|
|
|
|||||||||||||||||
| Ratios to Average Net Assets Applicable to Common Shareholders |
||||||||||||||||||||||||||||
| Total expenses |
2.23 | %(f) | 2.53 | % | 2.23 | % | 1.93 | % | 1.56 | % | 1.47 | % | ||||||||||||||||
|
|
|
|
|
|
|
|
|
|
|
|
|
|||||||||||||||||
| Total expenses after fees waived and paid indirectly |
2.23 | %(f) | 2.53 | % | 2.23 | % | 1.93 | % | 1.56 | % | 1.47 | % | ||||||||||||||||
|
|
|
|
|
|
|
|
|
|
|
|
|
|||||||||||||||||
| Total expenses after fees waived and paid indirectly and excluding interest expense, fees, and amortization of offering costs(g) |
0.97 | %(f) | 0.98 | % | 0.97 | % | 0.97 | % | 0.95 | % | 0.96 | % | ||||||||||||||||
|
|
|
|
|
|
|
|
|
|
|
|
|
|||||||||||||||||
| Net investment income to Common Shareholders |
4.09 | %(f) | 4.13 | % | 4.50 | % | 4.95 | % | 5.19 | % | 5.42 | % | ||||||||||||||||
|
|
|
|
|
|
|
|
|
|
|
|
|
|||||||||||||||||
| Supplemental Data |
||||||||||||||||||||||||||||
| Net assets applicable to Common Shareholders, end of period (000) |
$ | 424,955 | $ | 415,127 | $ | 388,149 | $ | 404,474 | $ | 428,389 | $ | 401,536 | ||||||||||||||||
|
|
|
|
|
|
|
|
|
|
|
|
|
|||||||||||||||||
| VMTP Shares outstanding at $100,000 liquidation value, end of period (000) |
$ | 137,200 | $ | 137,200 | $ | 137,200 | $ | 137,200 | $ | 137,200 | $ | 137,200 | ||||||||||||||||
|
|
|
|
|
|
|
|
|
|
|
|
|
|||||||||||||||||
| Asset coverage per VMTP Shares at $100,000 liquidation value, end of period |
$ | 409,734 | $ | 402,571 | $ | 382,907 | $ | 394,806 | $ | 412,237 | $ | 392,665 | ||||||||||||||||
|
|
|
|
|
|
|
|
|
|
|
|
|
|||||||||||||||||
| Borrowings outstanding, end of period (000) |
$ | 127,922 | $ | 118,726 | $ | 111,781 | $ | 101,288 | $ | 100,250 | $ | 101,818 | ||||||||||||||||
|
|
|
|
|
|
|
|
|
|
|
|
|
|||||||||||||||||
| Portfolio turnover rate |
4 | % | 15 | % | 30 | % | 18 | % | 10 | % | 12 | % | ||||||||||||||||
|
|
|
|
|
|
|
|
|
|
|
|
|
|||||||||||||||||
| (a) | Based on average Common Shares outstanding. |
| (b) | Distributions for annual periods determined in accordance with U.S. federal income tax regulations. |
| (c) | A portion of the distributions from net investment income may be deemed a return of capital or net realized gain at fiscal year end. |
| (d) | Total returns based on market price, which can be significantly greater or less than the net asset value, may result in substantially different returns. Where applicable, excludes the effects of any sales charges and assumes the reinvestment of distributions at actual reinvestment prices. |
| (e) | Aggregate total return. |
| (f) | Annualized. |
| (g) | Interest expense, fees and amortization of offering costs related to TOB Trusts and/or VMTP Shares. See Note 4 and Note 10 of the Notes to Financial Statements for details. |
See notes to financial statements.
| 68 | 2020 BLACKROCK SEMI-ANNUAL REPORT TO SHAREHOLDERS |
Financial Highlights (continued)
(For a share outstanding throughout each period)
| BLE | ||||||||||||||||||||||||||||
| Six Months Ended 02/29/20 (unaudited) |
Year Ended August 31, | |||||||||||||||||||||||||||
| 2019 | 2018 | 2017 | 2016 | 2015 | ||||||||||||||||||||||||
| Net asset value, beginning of period |
$ | 15.16 | $ | 14.55 | $ | 15.17 | $ | 16.12 | $ | 15.25 | $ | 15.48 | ||||||||||||||||
|
|
|
|
|
|
|
|
|
|
|
|
|
|||||||||||||||||
| Net investment income(a) |
0.36 | 0.71 | 0.76 | 0.83 | 0.93 | 0.92 | ||||||||||||||||||||||
| Net realized and unrealized gain (loss) |
0.37 | 0.60 | (0.60 | ) | (0.89 | ) | 0.87 | (0.19 | ) | |||||||||||||||||||
|
|
|
|
|
|
|
|
|
|
|
|
|
|||||||||||||||||
| Net increase (decrease) from investment operations |
0.73 | 1.31 | 0.16 | (0.06 | ) | 1.80 | 0.73 | |||||||||||||||||||||
|
|
|
|
|
|
|
|
|
|
|
|
|
|||||||||||||||||
| Distributions to Common Shareholders from net investment income(b) |
(0.35 | ) | (0.70 | ) | (0.78 | ) | (0.89 | ) | (0.93 | ) | (0.96 | ) | ||||||||||||||||
|
|
|
|
|
|
|
|
|
|
|
|
|
|||||||||||||||||
| Net asset value, end of period |
$ | 15.54 | $ | 15.16 | $ | 14.55 | $ | 15.17 | $ | 16.12 | $ | 15.25 | ||||||||||||||||
|
|
|
|
|
|
|
|
|
|
|
|
|
|||||||||||||||||
| Market price, end of period |
$ | 14.78 | $ | 15.48 | $ | 13.77 | $ | 15.45 | $ | 16.34 | $ | 14.18 | ||||||||||||||||
|
|
|
|
|
|
|
|
|
|
|
|
|
|||||||||||||||||
| Total Return Applicable to Common Shareholders(c) |
||||||||||||||||||||||||||||
| Based on net asset value |
4.90 | %(d) | 9.52 | % | 1.35 | % | (0.18 | )% | 12.21 | % | 5.01 | % | ||||||||||||||||
|
|
|
|
|
|
|
|
|
|
|
|
|
|||||||||||||||||
| Based on market price |
(2.29 | )%(d) | 18.17 | % | (5.82 | )% | 0.29 | % | 22.33 | % | 2.83 | % | ||||||||||||||||
|
|
|
|
|
|
|
|
|
|
|
|
|
|||||||||||||||||
| Ratios to Average Net Assets Applicable to Common Shareholders |
||||||||||||||||||||||||||||
| Total expenses |
2.17 | %(e) | 2.55 | % | 2.32 | % | 2.02 | % | 1.62 | % | 1.55 | % | ||||||||||||||||
|
|
|
|
|
|
|
|
|
|
|
|
|
|||||||||||||||||
| Total expenses after fees waived and paid indirectly |
2.17 | %(e) | 2.55 | % | 2.31 | % | 2.02 | % | 1.62 | % | 1.55 | % | ||||||||||||||||
|
|
|
|
|
|
|
|
|
|
|
|
|
|||||||||||||||||
| Total expenses after fees waived and paid indirectly and excluding interest expense, fees, and amortization of offering costs(f) |
0.95 | %(e) | 0.98 | % | 0.98 | % | 0.99 | % | 0.98 | % | 0.98 | % | ||||||||||||||||
|
|
|
|
|
|
|
|
|
|
|
|
|
|||||||||||||||||
| Net investment income to Common Shareholders |
4.81 | %(e) | 4.86 | % | 5.12 | % | 5.47 | % | 5.90 | % | 5.94 | % | ||||||||||||||||
|
|
|
|
|
|
|
|
|
|
|
|
|
|||||||||||||||||
| Supplemental Data |
||||||||||||||||||||||||||||
| Net assets applicable to Common Shareholders, end of period (000) |
$ | 365,790 | $ | 356,649 | $ | 342,437 | $ | 356,901 | $ | 378,572 | $ | 357,868 | ||||||||||||||||
|
|
|
|
|
|
|
|
|
|
|
|
|
|||||||||||||||||
| VMTP Shares outstanding at $100,000 liquidation value, end of period (000) |
$ | 151,300 | $ | 151,300 | $ | 151,300 | $ | 151,300 | $ | 151,300 | $ | 151,300 | ||||||||||||||||
|
|
|
|
|
|
|
|
|
|
|
|
|
|||||||||||||||||
| Asset coverage per VMTP Shares at $100,000 liquidation value, end of period |
$ | 341,765 | $ | 335,723 | $ | 326,330 | $ | 335,890 | $ | 350,213 | $ | 336,529 | ||||||||||||||||
|
|
|
|
|
|
|
|
|
|
|
|
|
|||||||||||||||||
| Borrowings outstanding, end of period (000) |
$ | 69,295 | $ | 59,519 | $ | 67,497 | $ | 71,274 | $ | 77,130 | $ | 68,692 | ||||||||||||||||
|
|
|
|
|
|
|
|
|
|
|
|
|
|||||||||||||||||
| Portfolio turnover rate |
9 | % | 18 | % | 7 | % | 9 | % | 7 | % | 10 | % | ||||||||||||||||
|
|
|
|
|
|
|
|
|
|
|
|
|
|||||||||||||||||
| (a) | Based on average Common Shares outstanding. |
| (b) | Distributions for annual periods determined in accordance with U.S. federal income tax regulations. |
| (c) | Total returns based on market price, which can be significantly greater or less than the net asset value, may result in substantially different returns. Where applicable, excludes the effects of any sales charges and assumes the reinvestment of distributions at actual reinvestment prices. |
| (d) | Aggregate total return. |
| (e) | Annualized. |
| (f) | Interest expense, fees and amortization of offering costs related to TOB Trusts and/or VMTP Shares. See Note 4 and Note 10 of the Notes to Financial Statements for details. |
See notes to financial statements.
| FINANCIAL HIGHLIGHTS | 69 |
Financial Highlights (continued)
(For a share outstanding throughout each period)
| MFL | ||||||||||||||||||||||||||||
| Six Months Ended 02/29/20 (unaudited) |
Year Ended August 31, | |||||||||||||||||||||||||||
| 2019 | 2018 | 2017 | 2016 | 2015 | ||||||||||||||||||||||||
| Net asset value, beginning of period |
$ | 14.94 | $ | 14.09 | $ | 14.91 | $ | 15.86 | $ | 15.18 | $ | 15.46 | ||||||||||||||||
|
|
|
|
|
|
|
|
|
|
|
|
|
|||||||||||||||||
| Net investment income(a) |
0.28 | 0.59 | 0.71 | 0.78 | 0.86 | 0.89 | ||||||||||||||||||||||
| Net realized and unrealized gain (loss) |
0.46 | 0.90 | (0.76 | ) | (0.87 | ) | 0.68 | (0.31 | ) | |||||||||||||||||||
|
|
|
|
|
|
|
|
|
|
|
|
|
|||||||||||||||||
| Net increase (decrease) from investment operations |
0.74 | 1.49 | (0.05 | ) | (0.09 | ) | 1.54 | 0.58 | ||||||||||||||||||||
|
|
|
|
|
|
|
|
|
|
|
|
|
|||||||||||||||||
| Distributions to Common Shareholders from net investment income(b) |
(0.27 | ) | (0.64 | ) | (0.77 | ) | (0.86 | ) | (0.86 | ) | (0.86 | ) | ||||||||||||||||
|
|
|
|
|
|
|
|
|
|
|
|
|
|||||||||||||||||
| Net asset value, end of period |
$ | 15.41 | $ | 14.94 | $ | 14.09 | $ | 14.91 | $ | 15.86 | $ | 15.18 | ||||||||||||||||
|
|
|
|
|
|
|
|
|
|
|
|
|
|||||||||||||||||
| Market price, end of period |
$ | 13.75 | $ | 13.60 | $ | 12.73 | $ | 15.03 | $ | 15.86 | $ | 14.06 | ||||||||||||||||
|
|
|
|
|
|
|
|
|
|
|
|
|
|||||||||||||||||
| Total Return Applicable to Common Shareholders(c) |
||||||||||||||||||||||||||||
| Based on net asset value |
5.24 | %(d) | 11.42 | % | (0.05 | )% | (0.34 | )% | 10.56 | % | 4.29 | % | ||||||||||||||||
|
|
|
|
|
|
|
|
|
|
|
|
|
|||||||||||||||||
| Based on market price |
3.15 | %(d) | 12.27 | % | (10.42 | )% | 0.46 | % | 19.37 | % | 7.28 | % | ||||||||||||||||
|
|
|
|
|
|
|
|
|
|
|
|
|
|||||||||||||||||
| Ratios to Average Net Assets Applicable to Common Shareholders |
||||||||||||||||||||||||||||
| Total expenses |
2.32 | %(e) | 2.67 | % | 2.51 | % | 2.17 | % | 1.65 | % | 1.54 | % | ||||||||||||||||
|
|
|
|
|
|
|
|
|
|
|
|
|
|||||||||||||||||
| Total expenses after fees waived and paid indirectly |
2.24 | %(e) | 2.58 | % | 2.41 | % | 2.08 | % | 1.60 | % | 1.49 | % | ||||||||||||||||
|
|
|
|
|
|
|
|
|
|
|
|
|
|||||||||||||||||
| Total expenses after fees waived and paid indirectly and excluding interest expense, fees, and amortization of offering costs(f)(g) |
0.92 | %(e) | 0.94 | % | 0.94 | % | 0.95 | % | 0.94 | % | 0.95 | % | ||||||||||||||||
|
|
|
|
|
|
|
|
|
|
|
|
|
|||||||||||||||||
| Net investment income to Common Shareholders |
3.84 | %(e) | 4.15 | % | 4.91 | % | 5.22 | % | 5.54 | % | 5.73 | % | ||||||||||||||||
|
|
|
|
|
|
|
|
|
|
|
|
|
|||||||||||||||||
| Supplemental Data |
||||||||||||||||||||||||||||
| Net assets applicable to Common Shareholders, end of period (000) |
$ | 583,815 | $ | 566,341 | $ | 534,075 | $ | 564,383 | $ | 599,930 | $ | 573,885 | ||||||||||||||||
|
|
|
|
|
|
|
|
|
|
|
|
|
|||||||||||||||||
| VRDP Shares outstanding at $100,000 liquidation value, end of period (000) |
$ | 274,600 | $ | 274,600 | $ | 274,600 | $ | 274,600 | $ | 274,600 | $ | 274,600 | ||||||||||||||||
|
|
|
|
|
|
|
|
|
|
|
|
|
|||||||||||||||||
| Asset coverage per VRDP Shares at $100,000 liquidation value, end of period |
$ | 312,606 | $ | 306,242 | $ | 294,492 | $ | 305,529 | $ | 318,474 | $ | 308,990 | ||||||||||||||||
|
|
|
|
|
|
|
|
|
|
|
|
|
|||||||||||||||||
| Borrowings outstanding, end of period (000) |
$ | 105,978 | $ | 95,978 | $ | 114,546 | $ | 123,111 | $ | 131,279 | $ | 85,502 | ||||||||||||||||
|
|
|
|
|
|
|
|
|
|
|
|
|
|||||||||||||||||
| Portfolio turnover rate |
19 | % | 52 | % | 22 | % | 16 | % | 27 | % | 13 | % | ||||||||||||||||
|
|
|
|
|
|
|
|
|
|
|
|
|
|||||||||||||||||
| (a) | Based on average Common Shares outstanding. |
| (b) | Distributions for annual periods determined in accordance with U.S. federal income tax regulations. |
| (c) | Total returns based on market price, which can be significantly greater or less than the net asset value, may result in substantially different returns. Where applicable, excludes the effects of any sales charges and assumes the reinvestment of distributions at actual reinvestment prices. |
| (d) | Aggregate total return. |
| (e) | Annualized. |
| (f) | Interest expense, fees and amortization of offering costs related to TOBs and/or VRDP Shares. See Note 4 and Note 10 of the Notes to Financial Statements for details. |
| (g) | The total expense ratio after fees waived and/or reimbursed and paid indirectly and excluding interest expense, fees, amortization of offering costs, liquidity and remarketing fees were as follows: |
| Six Months Ended 02/29/20 (unaudited) |
Year Ended August 31, | |||||||||||||||||||||||||||
| 2019 | 2018 | 2017 | 2016 | 2015 | ||||||||||||||||||||||||
| Expense ratios |
0.91 | % | 0.93 | % | 0.93 | % | 0.94 | % | 0.93 | % | 0.94 | % | ||||||||||||||||
|
|
|
|
|
|
|
|
|
|
|
|
|
|||||||||||||||||
See notes to financial statements.
| 70 | 2020 BLACKROCK SEMI-ANNUAL REPORT TO SHAREHOLDERS |
Financial Highlights (continued)
(For a share outstanding throughout each period)
| MVF | ||||||||||||||||||||||||||||
| Six Months Ended 02/29/20 (unaudited) |
Year Ended August 31, | |||||||||||||||||||||||||||
| 2019 | 2018 | 2017 | 2016 | 2015 | ||||||||||||||||||||||||
| Net asset value, beginning of period |
$ | 9.83 | $ | 9.35 | $ | 9.75 | $ | 10.38 | $ | 10.04 | $ | 10.27 | ||||||||||||||||
|
|
|
|
|
|
|
|
|
|
|
|
|
|||||||||||||||||
| Net investment income(a) |
0.21 | 0.44 | 0.51 | 0.56 | 0.61 | 0.62 | ||||||||||||||||||||||
| Net realized and unrealized gain (loss) |
0.30 | 0.50 | (0.39 | ) | (0.62 | ) | 0.36 | (0.21 | ) | |||||||||||||||||||
|
|
|
|
|
|
|
|
|
|
|
|
|
|||||||||||||||||
| Net increase (decrease) from investment operations |
0.51 | 0.94 | 0.12 | (0.06 | ) | 0.97 | 0.41 | |||||||||||||||||||||
|
|
|
|
|
|
|
|
|
|
|
|
|
|||||||||||||||||
| Distributions to Common Shareholders from net investment income(b) |
(0.21 | )(c) | (0.46 | ) | (0.52 | ) | (0.57 | ) | (0.63 | ) | (0.64 | ) | ||||||||||||||||
|
|
|
|
|
|
|
|
|
|
|
|
|
|||||||||||||||||
| Net asset value, end of period |
$ | 10.13 | $ | 9.83 | $ | 9.35 | $ | 9.75 | $ | 10.38 | $ | 10.04 | ||||||||||||||||
|
|
|
|
|
|
|
|
|
|
|
|
|
|||||||||||||||||
| Market price, end of period |
$ | 9.24 | $ | 9.49 | $ | 8.81 | $ | 9.84 | $ | 10.77 | $ | 9.65 | ||||||||||||||||
|
|
|
|
|
|
|
|
|
|
|
|
|
|||||||||||||||||
| Total Return Applicable to Common Shareholders(d) |
||||||||||||||||||||||||||||
| Based on net asset value |
5.41 | %(e) | 10.76 | % | 1.52 | % | (0.38 | )% | 9.96 | % | 4.27 | % | ||||||||||||||||
|
|
|
|
|
|
|
|
|
|
|
|
|
|||||||||||||||||
| Based on market price |
(0.40 | )%(e) | 13.47 | % | (5.22 | )% | (3.10 | )% | 18.70 | % | 4.71 | % | ||||||||||||||||
|
|
|
|
|
|
|
|
|
|
|
|
|
|||||||||||||||||
| Ratios to Average Net Assets Applicable to Common Shareholders |
||||||||||||||||||||||||||||
| Total expenses |
1.96 | %(f) | 2.29 | % | 2.16 | % | 1.92 | % | 1.55 | % | 1.43 | % | ||||||||||||||||
|
|
|
|
|
|
|
|
|
|
|
|
|
|||||||||||||||||
| Total expenses after fees waived and paid indirectly |
1.96 | %(f) | 2.29 | % | 2.16 | % | 1.92 | % | 1.55 | % | 1.43 | % | ||||||||||||||||
|
|
|
|
|
|
|
|
|
|
|
|
|
|||||||||||||||||
| Total expenses after fees waived and paid indirectly and excluding interest expense, fees, and amortization of offering costs(g) |
0.84 | %(f) | 0.87 | % | 0.89 | % | 0.91 | % | 0.89 | % | 0.89 | % | ||||||||||||||||
|
|
|
|
|
|
|
|
|
|
|
|
|
|||||||||||||||||
| Net investment income to Common Shareholders |
4.24 | %(f) | 4.74 | % | 5.35 | % | 5.71 | % | 5.95 | % | 6.03 | % | ||||||||||||||||
|
|
|
|
|
|
|
|
|
|
|
|
|
|||||||||||||||||
| Supplemental Data |
||||||||||||||||||||||||||||
| Net assets applicable to Common Shareholders, end of period (000) |
$ | 657,067 | $ | 637,636 | $ | 605,972 | $ | 630,489 | $ | 667,589 | $ | 642,889 | ||||||||||||||||
|
|
|
|
|
|
|
|
|
|
|
|
|
|||||||||||||||||
| VMTP Shares outstanding at $100,000 liquidation value, end of period (000) |
$ | 243,800 | $ | 243,800 | $ | 243,800 | $ | 243,800 | $ | 243,800 | $ | 243,800 | ||||||||||||||||
|
|
|
|
|
|
|
|
|
|
|
|
|
|||||||||||||||||
| Asset coverage per VMTP Shares at $100,000 liquidation value, end of period |
$ | 369,511 | $ | 361,541 | $ | 348,553 | $ | 358,609 | $ | 373,827 | $ | 363,695 | ||||||||||||||||
|
|
|
|
|
|
|
|
|
|
|
|
|
|||||||||||||||||
| Borrowings outstanding, end of period (000) |
$ | 100,737 | $ | 100,463 | $ | 112,817 | $ | 139,989 | $ | 161,957 | $ | 148,867 | ||||||||||||||||
|
|
|
|
|
|
|
|
|
|
|
|
|
|||||||||||||||||
| Portfolio turnover rate |
7 | % | 31 | % | 21 | % | 26 | % | 13 | % | 18 | % | ||||||||||||||||
|
|
|
|
|
|
|
|
|
|
|
|
|
|||||||||||||||||
| (a) | Based on average Common Shares outstanding. |
| (b) | Distributions for annual periods determined in accordance with U.S. federal income tax regulations. |
| (c) | A portion of the distributions from net investment income may be deemed a return of capital or net realized gain at fiscal year end. |
| (d) | Total returns based on market price, which can be significantly greater or less than the net asset value, may result in substantially different returns. Where applicable, excludes the effects of any sales charges and assumes the reinvestment of distributions at actual reinvestment prices. |
| (e) | Aggregate total return. |
| (f) | Annualized. |
| (g) | Interest expense, fees and amortization of offering costs related to TOBs and/or VMTP Shares. See Note 4 and Note 10 of the Notes to Financial Statements for details. |
See notes to financial statements.
| FINANCIAL HIGHLIGHTS | 71 |
Notes to Financial Statements (unaudited)
| 1. | ORGANIZATION |
The following are registered under the Investment Company Act of 1940, as amended (the “1940 Act”), as closed-end management investment companies and are referred to herein collectively as the “Trusts”, or individually as a “Trust”:
| Trust Name | Herein Referred To As | Organized | Diversification Classification | |||
| BlackRock Municipal Bond Trust |
BBK | Delaware | Diversified | |||
| BlackRock Municipal Income Investment Quality Trust |
BAF | Delaware | Diversified | |||
| BlackRock Municipal Income Quality Trust |
BYM | Delaware | Diversified | |||
| BlackRock Municipal Income Trust II |
BLE | Delaware | Diversified | |||
| BlackRock MuniHoldings Investment Quality Fund |
MFL | Massachusetts | Diversified | |||
| BlackRock MuniVest Fund, Inc. |
MVF | Maryland | Diversified |
The Boards of Trustees and Boards of Directors of the Trusts are collectively referred to throughout this report as the “Board of Trustees” or the “Board,” and the trustees thereof are collectively referred to throughout this report as “Trustees”. The Trusts determine and make available for publication the net asset values (“NAVs”) of their Common Shares on a daily basis.
The Trusts, together with certain other registered investment companies advised by BlackRock Advisors, LLC (the “Manager”) or its affiliates, are included in a complex of non-index fixed-income mutual funds and all BlackRock-advised closed-end funds referred to as the BlackRock Fixed-Income Complex.
| 2. | SIGNIFICANT ACCOUNTING POLICIES |
The financial statements are prepared in conformity with accounting principles generally accepted in the United States of America (“U.S. GAAP”), which may require management to make estimates and assumptions that affect the reported amounts of assets and liabilities in the financial statements, disclosure of contingent assets and liabilities at the date of the financial statements and the reported amounts of increases and decreases in net assets from operations during the reporting period. Actual results could differ from those estimates. Each Trust is considered an investment company under U.S. GAAP and follows the accounting and reporting guidance applicable to investment companies. Below is a summary of significant accounting policies:
Investment Transactions and Income Recognition: For financial reporting purposes, investment transactions are recorded on the dates the transactions are executed. Realized gains and losses on investment transactions are determined on the identified cost basis. Dividend income is recorded on the ex-dividend date. Interest income, including amortization and accretion of premiums and discounts on debt securities, is recognized on an accrual basis.
Segregation and Collateralization: In cases where a Trust enters into certain investments (e.g., futures contracts) or certain borrowings (e.g., TOB Trust transactions) that would be treated as “senior securities” for 1940 Act purposes, a Trust may segregate or designate on its books and records cash or liquid assets having a market value at least equal to the amount of its future obligations under such investments or borrowings. Doing so allows the investment or borrowings to be excluded from treatment as a “senior security.” Furthermore, if required by an exchange or counterparty agreement, the Trusts may be required to deliver/deposit cash and/or securities to/with an exchange, or broker-dealer or custodian as collateral for certain investments or obligations.
Distributions: Distributions from net investment income are declared monthly and paid monthly. Distributions of capital gains are recorded on the ex-dividend date and made at least annually. The character and timing of distributions are determined in accordance with U.S. federal income tax regulations, which may differ from U.S. GAAP. Distributions to Preferred Shareholders are accrued and determined as described in Note 10.
Deferred Compensation Plan: Under the Deferred Compensation Plan (the “Plan”) approved by each Trust’s Board, the trustees who are not “interested persons” of the Trusts, as defined in the 1940 Act (“Independent Trustees”), may defer a portion of their annual complex-wide compensation. Deferred amounts earn an approximate return as though equivalent dollar amounts had been invested in common shares of certain funds in the BlackRock Fixed-Income Complex selected by the Independent Trustees. This has the same economic effect for the Independent Trustees as if the Independent Trustees had invested the deferred amounts directly in certain funds in the BlackRock Fixed-Income Complex.
The Plan is not funded and obligations thereunder represent general unsecured claims against the general assets of each Trust, as applicable. Deferred compensation liabilities are included in the Trustees’ and Officer’s fees payable in the Statements of Assets and Liabilities and will remain as a liability of the Trusts until such amounts are distributed in accordance with the Plan.
Recent Accounting Standards: The Trusts have adopted Financial Accounting Standards Board Accounting Standards Update 2017-08 to amend the amortization period for certain purchased callable debt securities held at a premium. Under the new standard, the Trusts have changed the amortization period for the premium on certain purchased callable debt securities with non-contingent call features to the earliest call date. In accordance with the transition provisions of the standard, the Trusts applied the amendments on a modified retrospective basis beginning with the fiscal period ended February 29, 2020. The adjusted cost basis of securities at August 31, 2019 are as follows:
| BBK |
$ | 254,959,342 | ||
| BAF |
213,803,733 | |||
| BYM |
600,981,763 | |||
| BLE |
521,309,639 | |||
| MFL |
871,235,972 | |||
| MVF |
895,745,721 |
| 72 | 2020 BLACKROCK SEMI-ANNUAL REPORT TO SHAREHOLDERS |
Notes to Financial Statements (unaudited) (continued)
This change in accounting policy has been made to comply with the newly issued accounting standard and had no impact on accumulated earnings (loss) or the net asset value of the Trusts.
Indemnifications: In the normal course of business, a Trust enters into contracts that contain a variety of representations that provide general indemnification. A Trust’s maximum exposure under these arrangements is unknown because it involves future potential claims against a Trust, which cannot be predicted with any certainty.
Other: Expenses directly related to a Trust are charged to that Trust. Other operating expenses shared by several funds, including other funds managed by the Manager, are prorated among those funds on the basis of relative net assets or other appropriate methods.
| 3. | INVESTMENT VALUATION AND FAIR VALUE MEASUREMENTS |
Investment Valuation Policies: The Trusts’ investments are valued at fair value (also referred to as “market value” within the financial statements) as of the close of trading on the New York Stock Exchange (“NYSE”) (generally 4:00 p.m., Eastern time) (or if the reporting date falls on a day the NYSE is closed, investments are valued at fair value as of the period end). U.S. GAAP defines fair value as the price the Trusts would receive to sell an asset or pay to transfer a liability in an orderly transaction between market participants at the measurement date. The Trusts determine the fair values of their financial instruments using various independent dealers or pricing services under policies approved by the Board. The BlackRock Global Valuation Methodologies Committee (the “Global Valuation Committee”) is the committee formed by management to develop global pricing policies and procedures and to oversee the pricing function for all financial instruments.
Fair Value Inputs and Methodologies: The following methods and inputs are used to establish the fair value of each Trust’s assets and liabilities:
| • | Municipal investments (including commitments to purchase such investments on a “when-issued” basis) are valued on the basis of prices provided by dealers or pricing services. In determining the value of a particular investment, pricing services may use certain information with respect to transactions in such investments, quotations from dealers, pricing matrixes, market transactions in comparable investments and information with respect to various relationships between investments. |
| • | Investments in open-end U.S. mutual funds are valued at NAV each business day. |
| • | Futures contracts traded on exchanges are valued at their last sale price. |
If events (e.g., a company announcement, market volatility or a natural disaster) occur that are expected to materially affect the value of such investments, or in the event that the application of these methods of valuation results in a price for an investment that is deemed not to be representative of the market value of such investment, or if a price is not available, the investment will be valued by the Global Valuation Committee, or its delegate, in accordance with a policy approved by the Board as reflecting fair value (“Fair Valued Investments”). The fair valuation approaches that may be used by the Global Valuation Committee will include market approach, income approach and cost approach. Valuation techniques such as discounted cash flow, use of market comparables and matrix pricing are types of valuation approaches and are typically used in determining fair value. When determining the price for Fair Valued Investments, the Global Valuation Committee, or its delegate, seeks to determine the price that each Trust might reasonably expect to receive or pay from the current sale or purchase of that asset or liability in an arm’s-length transaction. Fair value determinations shall be based upon all available factors that the Global Valuation Committee, or its delegate, deems relevant and consistent with the principles of fair value measurement. The pricing of all Fair Valued Investments is subsequently reported to the Board or a committee thereof on a quarterly basis.
Fair Value Hierarchy: Various inputs are used in determining the fair value of investments and derivative financial instruments. These inputs to valuation techniques are categorized into a fair value hierarchy consisting of three broad levels for financial statement purposes as follows:
| • | Level 1 — Unadjusted price quotations in active markets/exchanges for identical assets or liabilities that each Trust has the ability to access |
| • | Level 2 — Other observable inputs (including, but not limited to, quoted prices for similar assets or liabilities in markets that are active, quoted prices for identical or similar assets or liabilities in markets that are not active, inputs other than quoted prices that are observable for the assets or liabilities (such as interest rates, yield curves, volatilities, prepayment speeds, loss severities, credit risks and default rates) or other market–corroborated inputs) |
| • | Level 3 — Unobservable inputs based on the best information available in the circumstances, to the extent observable inputs are not available (including the BlackRock Global Valuation Committee’s assumptions used in determining the fair value of investments and derivative financial instruments) |
The hierarchy gives the highest priority to unadjusted quoted prices in active markets for identical assets or liabilities (Level 1 measurements) and the lowest priority to unobservable inputs (Level 3 measurements). Accordingly, the degree of judgment exercised in determining fair value is greatest for instruments categorized in Level 3. The inputs used to measure fair value may fall into different levels of the fair value hierarchy. In such cases, for disclosure purposes, the fair value hierarchy classification is determined based on the lowest level input that is significant to the fair value measurement in its entirety. Investments classified within Level 3 have significant unobservable inputs used by the Global Valuation Committee in determining the price for Fair Valued Investments. Level 3 investments include equity or debt issued by privately held companies or funds. There may not be a secondary market, and/or there are a limited number of investors. The categorization of a value determined for investments and derivative financial instruments is based on the pricing transparency of the investments and derivative financial instruments and is not necessarily an indication of the risks associated with investing in those securities.
| 4. | SECURITIES AND OTHER INVESTMENTS |
Zero-Coupon Bonds: Zero-coupon bonds are normally issued at a significant discount from face value and do not provide for periodic interest payments. These bonds may experience greater volatility in market value than other debt obligations of similar maturity which provide for regular interest payments.
| NOTES TO FINANCIAL STATEMENTS | 73 |
Notes to Financial Statements (unaudited) (continued)
Forward Commitments, When-Issued and Delayed Delivery Securities: Certain funds may purchase securities on a when-issued basis and may purchase or sell securities on a forward commitment basis. Settlement of such transactions normally occurs within a month or more after the purchase or sale commitment is made. A fund may purchase securities under such conditions with the intention of actually acquiring them, but may enter into a separate agreement to sell the securities before the settlement date. Since the value of securities purchased may fluctuate prior to settlement, a fund may be required to pay more at settlement than the security is worth. In addition, a fund is not entitled to any of the interest earned prior to settlement. When purchasing a security on a delayed delivery basis, a fund assumes the rights and risks of ownership of the security, including the risk of price and yield fluctuations. In the event of default by the counterparty, a fund’s maximum amount of loss is the unrealized appreciation of unsettled when-issued transactions.
Municipal Bonds Transferred to TOB Trusts: Certain funds leverage their assets through the use of “TOB Trust” transactions. The funds transfer municipal bonds into a special purpose trust (a “TOB Trust”). A TOB Trust issues two classes of beneficial interests: short-term floating rate interests (“TOB Trust Certificates”), which are sold to third party investors, and residual inverse floating rate interests (“TOB Residuals”), which are issued to the participating funds that contributed the municipal bonds to the TOB Trust. The TOB Trust Certificates have interest rates that reset weekly and their holders have the option to tender such certificates to the TOB Trust for redemption at par and any accrued interest at each reset date. The TOB Residuals held by a fund provide the fund with the right to cause the holders of a proportional share of the TOB Trust Certificates to tender their certificates to the TOB Trust at par plus accrued interest. The funds may withdraw a corresponding share of the municipal bonds from the TOB Trust. Other funds managed by the investment adviser may also contribute municipal bonds to a TOB Trust into which a fund has contributed bonds. If multiple BlackRock-advised funds participate in the same TOB Trust, the economic rights and obligations under the TOB Residuals will be shared among the funds ratably in proportion to their participation in the TOB Trust.
TOB Trusts are supported by a liquidity facility provided by a third party bank or other financial institution (the “Liquidity Provider”) that allows the holders of the TOB Trust Certificates to tender their certificates in exchange for payment of par plus accrued interest on any business day. The tendered TOB Trust Certificates are remarketed by a Remarketing Agent. In the event of a failed remarketing, the TOB Trust may draw upon a loan from the Liquidity Provider to purchase the tendered TOB Trust Certificates. Any loans made by the Liquidity Provider will be secured by the purchased TOB Trust Certificates held by the TOB Trust and will be subject to an increased interest rate based on number of days the loan is outstanding.
The TOB Trust may be collapsed without the consent of a fund, upon the occurrence of a termination event as defined in the TOB Trust agreement. Upon the occurrence of a termination event, a TOB Trust would be liquidated with the proceeds applied first to any accrued fees owed to the trustee of the TOB Trust, the Remarketing Agent and the Liquidity Provider. Upon certain termination events, TOB Trust Certificates holders will be paid before the TOB Residuals holders (i.e., the Trusts) whereas in other termination events, TOB Trust Certificates holders and TOB Residuals holders will be paid pro rata.
While a fund’s investment policies and restrictions expressly permit investments in inverse floating rate securities, such as TOB Residuals, they restrict the ability of a fund to borrow money for purposes of making investments. MVF’s management believes that the fund’s restrictions on borrowings do not apply to the funds’ TOB Trust transactions. Each fund’s transfer of the municipal bonds to a TOB Trust is considered a secured borrowing for financial reporting purposes. The cash received by the TOB Trust from the sale of the TOB Trust Certificates, less certain transaction expenses, is paid to a fund. A fund typically invests the cash received in additional municipal bonds.
Accounting for TOB Trusts: The municipal bonds deposited into a TOB Trust are presented in a fund’s Schedule of Investments and the TOB Trust Certificates are shown in Other Liabilities in the Statements of Assets and Liabilities. Any loans drawn by the TOB Trust pursuant to the liquidity facility to purchase tendered TOB Trust Certificates are shown as Loan for TOB Trust Certificates. The carrying amount of a fund’s payable to the holder of the TOB Trust Certificates, as reported in the Statements of Assets and Liabilities as TOB Trust Certificates, approximates its fair value.
Interest income, including amortization and accretion of premiums and discounts, from the underlying municipal bonds is recorded by a fund on an accrual basis. Interest expense incurred on the TOB Trust transaction and other expenses related to remarketing, administration, trustee, liquidity and other services to a TOB Trust are shown as interest expense, fees and amortization of offering costs in the Statements of Operations. Fees paid upon creation of the TOB Trust are recorded as debt issuance costs and are amortized to interest expense, fees and amortization of offering costs in the Statements of Operations to the expected maturity of the TOB Trust. In connection with the restructurings of the TOB Trusts to non-bank sponsored TOB Trusts, a Trust incurred non-recurring, legal and restructuring fees, which are recorded as interest expense, fees and amortization of deferred offering costs in the Statements of Operations. Amounts recorded within interest expense, fees and amortization of offering costs in the Statements of Operations are:
| Interest Expense | Liquidity Fees | Other Expenses | Total | |||||||||||||
| BBK |
$ | 190,432 | $ | 62,479 | $ | 24,725 | $ | 277,636 | ||||||||
| BAF |
336,955 | 112,891 | 43,783 | 493,629 | ||||||||||||
| BYM |
763,929 | 264,402 | 84,909 | 1,113,240 | ||||||||||||
| BLE |
367,336 | 122,686 | 43,073 | 533,095 | ||||||||||||
| MFL |
611,944 | 201,454 | 73,949 | 887,347 | ||||||||||||
| MVF |
626,260 | 213,565 | 75,611 | 915,436 | ||||||||||||
| 74 | 2020 BLACKROCK SEMI-ANNUAL REPORT TO SHAREHOLDERS |
Notes to Financial Statements (unaudited) (continued)
For the six months ended February 29, 2020, the following table is a summary of each fund’s TOB Trusts:
| Underlying Municipal Bonds Transferred to TOB Trusts (a) |
Liability for TOB Trust Certificates (b) |
Range of Interest Rates on TOB Trust Certificates at Period End |
Average TOB Trust Certificates Outstanding |
Daily Weighted Average Rate of Interest and Other Expenses on TOB Trusts |
||||||||||||||||
| BBK |
$ | 57,430,704 | $ | 33,442,766 | 1.17% — 1.23% | $ | 31,649,915 | 1.76 | % | |||||||||||
| BAF |
101,919,110 | 56,448,869 | 1.15% — 1.33% | 54,455,468 | 1.82 | |||||||||||||||
| BYM |
215,346,724 | 127,922,497 | 1.17% — 1.35% | 124,108,355 | 1.80 | |||||||||||||||
| BLE |
118,344,864 | 69,294,759 | 1.15% — 1.33% | 60,758,510 | 1.76 | |||||||||||||||
| MFL |
240,242,642 | 105,978,045 | 1.17% — 1.25% | 100,098,924 | 1.78 | |||||||||||||||
| MVF |
205,537,915 | 100,737,488 | 1.15% — 1.30% | 101,352,916 | 1.82 | |||||||||||||||
| (a) | The municipal bonds transferred to a TOB Trust are generally high grade municipal bonds. In certain cases, when municipal bonds transferred are lower grade municipal bonds, the TOB Trust transaction may include a credit enhancement feature that provides for the timely payment of principal and interest on the bonds to the TOB Trust by a credit enhancement provider in the event of default of the municipal bond. The TOB Trust would be responsible for the payment of the credit enhancement fee and the fund, as a TOB Residuals holders, would be responsible for reimbursement of any payments of principal and interest made by the credit enhancement provider. The maximum potential amounts owed by the fund, for such reimbursements, as applicable, are included in the maximum potential amounts disclosed for recourse TOB Trusts. |
| (b) | TOB Trusts may be structured on a non-recourse or recourse basis. When a Trust invests in TOB Trusts on a non-recourse basis, the Liquidity Provider may be required to make a payment under the liquidity facility to allow the TOB Trust to repurchase TOB Trust Certificates. The Liquidity Provider will be reimbursed from the liquidation of bonds held in the TOB Trust. If a fund invests in a TOB Trust on a recourse basis, the fund enters into a reimbursement agreement with the Liquidity Provider where the fund is required to reimburse the Liquidity Provider for any shortfall between the amount paid by the Liquidity Provider and proceeds received from liquidation of municipal bonds held in the TOB Trust (the “Liquidation Shortfall”). As a result, if a fund invests in a recourse TOB Trust, the fund will bear the risk of loss with respect to any Liquidation Shortfall. If multiple funds participate in any such TOB Trust, these losses will be shared ratably, including the maximum potential amounts owed by a fund at February 29, 2020, in proportion to their participation in the TOB Trust. The recourse TOB Trusts are identified in the Schedules of Investments including the maximum potential amounts owed by a fund at February 29, 2020. |
| 5. | DERIVATIVE FINANCIAL INSTRUMENTS |
The Trusts engage in various portfolio investment strategies using derivative contracts both to increase the returns of the Trusts and/or to manage their exposure to certain risks such as credit risk, equity risk, interest rate risk, foreign currency exchange rate risk, commodity price risk or other risks (e.g., inflation risk). Derivative financial instruments categorized by risk exposure are included in the Schedules of Investments. These contracts may be transacted on an exchange or over-the-counter.
Futures Contracts: Futures contracts are purchased or sold to gain exposure to, or manage exposure to, changes in interest rates (interest rate risk) and changes in the value of equity securities (equity risk) or foreign currencies (foreign currency exchange rate risk).
Futures contracts are agreements between the Trusts and a counterparty to buy or sell a specific quantity of an underlying instrument at a specified price and on a specified date. Depending on the terms of a contract, it is settled either through physical delivery of the underlying instrument on the settlement date or by payment of a cash amount on the settlement date. Upon entering into a futures contract, the Trusts are required to deposit initial margin with the broker in the form of cash or securities in an amount that varies depending on a contract’s size and risk profile. The initial margin deposit must then be maintained at an established level over the life of the contract. Amounts pledged, which are considered restricted, are included in cash pledged for futures contracts in the Statements of Assets and Liabilities.
Securities deposited as initial margin are designated in the Schedules of Investments and cash deposited, if any, are shown as cash pledged for futures contracts in the Statements of Assets and Liabilities. Pursuant to the contract, the Trusts agree to receive from or pay to the broker an amount of cash equal to the daily fluctuation in market value of the contract (“variation margin”). Variation margin is recorded as unrealized appreciation (depreciation) and, if any, shown as variation margin receivable (or payable) on futures contracts in the Statements of Assets and Liabilities. When the contract is closed, a realized gain or loss is recorded in the Statements of Operations equal to the difference between the notional amount of the contract at the time it was opened and the notional amount at the time it was closed. The use of futures contracts involves the risk of an imperfect correlation in the movements in the price of futures contracts and interest, foreign currency exchange rates or underlying assets.
| 6. | INVESTMENT ADVISORY AGREEMENT AND OTHER TRANSACTIONS WITH AFFILIATES |
Investment Advisory: Each Trust entered into an Investment Advisory Agreement with the Manager, the Trusts’ investment adviser and an indirect, wholly-owned subsidiary of BlackRock, Inc. (“BlackRock”), to provide investment advisory and administrative services. The Manager is responsible for the management of each Trust’s portfolio and provides the personnel, facilities, equipment and certain other services necessary to the operations of each Trust.
For such services, each Trust, except for MFL and MVF, pays the Manager a monthly fee at an annual rate equal to the following percentages of the average weekly value of each Trust’s managed assets.
| BBK | BAF | BYM | BLE | |||||||||||||
| Investment advisory fees |
0.65 | % | 0.55 | % | 0.55 | % | 0.55 | % | ||||||||
For purposes of calculating these fees, “managed assets” are determined as total assets of the Trusts (including any assets attributable to money borrowed for investment purposes) less the sum of its accrued liabilities (other than money borrowed for investment purposes).
| NOTES TO FINANCIAL STATEMENTS | 75 |
Notes to Financial Statements (unaudited) (continued)
For such services, MFL and MVF pays the Manager a monthly fee at an annual rate equal to 0.55% and 0.50%, respectively, of the average daily value of each Trust’s net assets.
For purposes of calculating these fees, “net assets” mean the total assets of each Trust minus the sum of its accrued liabilities (which does not include liabilities represented by TOB Trusts and the liquidation preference of any outstanding preferred shares). It is understood that the liquidation preference of any outstanding preferred stock (other than accumulated dividends) and TOB Trusts is not considered a liability in determining a Trust’s net asset value.
Expense Limitations, Waivers and Reimbursements: The Manager, for MFL, voluntarily agreed to waive its investment advisory fee on the proceeds of the Preferred Shares and TOB Trusts that exceed 35% of total assets minus the sum of its accrued liabilities (which does not include liabilities represented by TOB Trusts and the liquidation preference of any outstanding preferred shares). The voluntary waiver may be reduced or discontinued at any time without notice. This amount is included in fees waived and/or reimbursed by the Manager in the Statements of Operations. For the six months ended February 29, 2020, the investment advisory fees waived were $197,779.
The Manager voluntarily agreed to waive a portion of the investment advisory fees or other expenses on BBK as a percentage of its average weekly managed assets as follows:
| BBK |
0.075 | % |
This voluntary waiver may be reduced or discontinued at any time without notice. For the six months ended February 29, 2020, the investment advisory fees waived, which are included in fees waived and/or reimbursed by the Manager in the Statements of Operations, were $107,028.
With respect to each Trust, the Manager contractually agreed to waive its investment advisory fees by the amount of investment advisory fees each Trust pays to the Manager indirectly through its investment in affiliated money market funds (the “affiliated money market fund waiver”) through June 30, 2021. The contractual agreement may be terminated upon 90 days’ notice by a majority of the Independent Trustees, or by a vote of a majority of the outstanding voting securities of a Trust. Prior to December 1, 2019, this waiver was voluntary. These amounts are included in fees waived and/or reimbursed by the Manager in the Statements of Operations. For the six months ended February 29, 2020, the amounts waived were as follows:
| BBK | BAF | BYM | BLE | MFL | MVF | |||||||||||||||||||
| Amounts Waived |
$ | 449 | $ | 133 | $ | 1,586 | $ | 3,574 | $ | 1,768 | $ | 3,055 | ||||||||||||
The Manager contractually agreed to waive its investment advisory fee with respect to any portion of each Trust’s assets invested in affiliated equity and fixed-income mutual funds and affiliated exchange-traded funds that have a contractual management fee through June 30, 2021. The agreement can be renewed for annual periods thereafter, and may be terminated on 90 days’ notice, each subject to approval by a majority of a Trust’s Independent Trustees. For the six months ended February 29, 2020, there were no fees waived and/or reimbursed by the Manager pursuant to this agreement.
Trustees and Officers: Certain trustees and/or officers of the Trusts are directors and/or officers of BlackRock or its affiliates. The Trusts reimburse the Manager for a portion of the compensation paid to the Trusts’ Chief Compliance Officer, which is included in Trustees and Officer in the Statements of Operations.
| 7. | PURCHASES AND SALES |
For the six months ended February 29, 2020, purchases and sales of investments, excluding short-term securities were as follows:
| BBK | BAF | BYM | BLE | MFL | MVF | |||||||||||||||||||
| Purchases |
$ | 13,694,528 | $ | 30,576,568 | $ | 37,235,983 | $ | 62,853,883 | $ | 179,798,403 | $ | 99,699,107 | ||||||||||||
| Sales |
8,957,793 | 21,746,760 | 24,565,788 | 48,147,220 | 177,592,411 | 66,466,169 | ||||||||||||||||||
| 8. | INCOME TAX INFORMATION |
It is each Trust’s policy to comply with the requirements of the Internal Revenue Code of 1986, as amended, applicable to regulated investment companies, and to distribute substantially all of its taxable income to its shareholders. Therefore, no U.S. federal income tax provision is required.
Each Trust files U.S. federal and various state and local tax returns. No income tax returns are currently under examination. The statute of limitations on each Trust’s U.S. federal tax returns generally remains open for each of the four years ended August 31, 2019. The statutes of limitations on each Trust’s state and local tax returns may remain open for an additional year depending upon the jurisdiction.
Management has analyzed tax laws and regulations and their application to the Trusts as of February 29, 2020, inclusive of the open tax return years, and does not believe that there are any uncertain tax positions that require recognition of a tax liability in the Trusts’ financial statements.
As of August 31, 2019, the Trusts had non-expiring capital loss carryforwards available to offset future realized capital gains as follows:
| BBK | BAF | BYM | BLE | MFL | MVF | |||||||||||||||||||||||||||
| $ | — | $ | 4,746,829 | $ | 10,129,559 | $ | 10,698,442 | $ | 11,129,625 | $ | 13,962,143 | |||||||||||||||||||||
| 76 | 2020 BLACKROCK SEMI-ANNUAL REPORT TO SHAREHOLDERS |
Notes to Financial Statements (unaudited) (continued)
As of February 29, 2020, gross unrealized appreciation and depreciation for investments and derivatives based on cost for U.S. federal income tax purposes were as follows:
| BBK | BAF | BYM | BLE | MFL | MVF | |||||||||||||||||||
| Tax Cost |
$ | 228,178,259 | $ | 166,961,517 | $ | 490,928,828 | $ | 470,584,338 | $ | 765,391,491 | $ | 814,676,864 | ||||||||||||
|
|
|
|
|
|
|
|
|
|
|
|
|
|||||||||||||
| Gross unrealized appreciation |
$ | 33,904,557 | $ | 20,726,308 | $ | 73,816,465 | $ | 54,945,826 | $ | 78,707,700 | $ | 97,562,444 | ||||||||||||
| Gross unrealized depreciation |
(824,519 | ) | (573,699 | ) | (1,180,004 | ) | (4,893,509 | ) | (996,061 | ) | (2,276,489 | ) | ||||||||||||
|
|
|
|
|
|
|
|
|
|
|
|
|
|||||||||||||
| Net unrealized appreciation |
$ | 33,080,038 | $ | 20,152,609 | $ | 72,636,461 | $ | 50,052,317 | $ | 77,711,639 | $ | 95,285,955 | ||||||||||||
|
|
|
|
|
|
|
|
|
|
|
|
|
|||||||||||||
| 9. | PRINCIPAL RISKS |
Many municipalities insure repayment of their bonds, which may reduce the potential for loss due to credit risk. The market value of these bonds may fluctuate for other reasons, including market perception of the value of such insurance, and there is no guarantee that the insurer will meet its obligation.
Inventories of municipal bonds held by brokers and dealers may decrease, which would lessen their ability to make a market in these securities. Such a reduction in market making capacity could potentially decrease a Trust’s ability to buy or sell bonds. As a result, a Trust may sell a security at a lower price, sell other securities to raise cash, or give up an investment opportunity, any of which could have a negative impact on performance. If a Trust needed to sell large blocks of bonds, those sales could further reduce the bonds’ prices and impact performance.
In the normal course of business, certain Trusts invest in securities or other instruments and may enter into certain transactions, and such activities subject each Trust to various risks, including among others, fluctuations in the market (market risk) or failure of an issuer to meet all of its obligations. The value of securities or other instruments may also be affected by various factors, including, without limitation: (i) the general economy; (ii) the overall market as well as local, regional or global political and/or social instability; (iii) regulation, taxation or international tax treaties between various countries; or (iv) currency, interest rate and price fluctuations. Local, regional or global events such as war, acts of terrorism, the spread of infectious illness or other public health issues, recessions, or other events could have a significant impact on each Trust and its investments.
Each Trust may be exposed to prepayment risk, which is the risk that borrowers may exercise their option to prepay principal earlier than scheduled during periods of declining interest rates, which would force each Trust to reinvest in lower yielding securities. Each Trust may also be exposed to reinvestment risk, which is the risk that income from each Trust’s portfolio will decline if each Trust invests the proceeds from matured, traded or called fixed-income securities at market interest rates that are below each Trust portfolio’s current earnings rate.
The Trusts may hold a significant amount of bonds subject to calls by the issuers at defined dates and prices. When bonds are called by issuers and the Trusts reinvest the proceeds received, such investments may be in securities with lower yields than the bonds originally held, and correspondingly, could adversely impact the yield and total return performance of a Trust.
A Trust structures and “sponsors” the TOB Trusts in which it holds TOB Residuals and has certain duties and responsibilities, which may give rise to certain additional risks including, but not limited to, compliance, securities law and operational risks.
Should short-term interest rates rise, the Trusts’ investments in the TOB Trusts may adversely affect the Trusts’ net investment income and dividends to Common Shareholders. Also, fluctuations in the market value of municipal bonds deposited into the TOB Trust may adversely affect the Trusts’ NAVs per share.
The U.S. Securities and Exchange Commission (“SEC”) and various federal banking and housing agencies have adopted credit risk retention rules for securitizations (the “Risk Retention Rules”). The Risk Retention Rules would require the sponsor of a TOB Trust to retain at least 5% of the credit risk of the underlying assets supporting the TOB Trust’s municipal bonds. The Risk Retention Rules may adversely affect the Trusts’ ability to engage in TOB Trust transactions or increase the costs of such transactions in certain circumstances.
TOB Trusts constitute an important component of the municipal bond market. Any modifications or changes to rules governing TOB Trusts may adversely impact the municipal market and the Trusts, including through reduced demand for and liquidity of municipal bonds and increased financing costs for municipal issuers. The ultimate impact of any potential modifications on the TOB Trust market and the overall municipal market is not yet certain.
Each Trust may invest without limitation in illiquid or less liquid investments or investments in which no secondary market is readily available or which are otherwise illiquid, including private placement securities. A Trust may not be able to readily dispose of such investments at prices that approximate those at which the Trust could sell such investments if they were more widely traded and, as a result of such illiquidity, the Trust may have to sell other investments or engage in borrowing transactions if necessary to raise funds to meet its obligations. Limited liquidity can also affect the market price of investments, thereby adversely affecting the Trust’s net asset value and ability to make dividend distributions. Privately issued debt securities are often of below investment grade quality, frequently are unrated and present many of the same risks as investing in below investment grade public debt securities.
An outbreak of respiratory disease caused by a novel coronavirus has developed into a global pandemic and has resulted in closing borders, quarantines, disruptions to supply chains and customer activity, as well as general concern and uncertainty. The impact of this pandemic, and other global health crises that may arise in the future, could affect the economies of many nations, individual companies and the market in general in ways that cannot necessarily be foreseen at the present time. This pandemic may result in substantial market volatility and may adversely impact the prices and liquidity of a fund’s investments. The impact of the pandemic may be short term or may last for an extended period of time.
Counterparty Credit Risk: The Trusts may be exposed to counterparty credit risk, or the risk that an entity may fail to or be unable to perform on its commitments related to unsettled or open transactions. The Trusts manage counterparty credit risk by entering into transactions only with counterparties that the Manager believes have the
| NOTES TO FINANCIAL STATEMENTS | 77 |
Notes to Financial Statements (unaudited) (continued)
financial resources to honor their obligations and by monitoring the financial stability of those counterparties. Financial assets, which potentially expose the Trusts to market, issuer and counterparty credit risks, consist principally of financial instruments and receivables due from counterparties. The extent of the Trusts’ exposure to market, issuer and counterparty credit risks with respect to these financial assets is approximately their value recorded in the Statements of Assets and Liabilities, less any collateral held by the Trusts.
A derivative contract may suffer a mark-to-market loss if the value of the contract decreases due to an unfavorable change in the market rates or values of the underlying instrument. Losses can also occur if the counterparty does not perform under the contract.
With exchange-traded futures, there is less counterparty credit risk to the Trusts since the exchange or clearinghouse, as counterparty to such instruments, guarantees against a possible default. The clearinghouse stands between the buyer and the seller of the contract; therefore, credit risk is limited to failure of the clearinghouse. While offset rights may exist under applicable law, a Trust does not have a contractual right of offset against a clearing broker or clearinghouse in the event of a default (including the bankruptcy or insolvency). Additionally, credit risk exists in exchange-traded futures with respect to initial and variation margin that is held in a clearing broker’s customer accounts. While clearing brokers are required to segregate customer margin from their own assets, in the event that a clearing broker becomes insolvent or goes into bankruptcy and at that time there is a shortfall in the aggregate amount of margin held by the clearing broker for all its clients, typically the shortfall would be allocated on a pro rata basis across all the clearing broker’s customers, potentially resulting in losses to the Trusts.
Concentration Risk: As of period end, BAF, MFL and MVF invested a significant portion of their assets in securities in the transportation sector. Changes in economic conditions affecting such sectors would have a greater impact on the Trusts and could affect the value, income and/or liquidity of positions in such securities.
The Trusts invest a significant portion of their assets in fixed-income securities and/or use derivatives tied to the fixed-income markets. Changes in market interest rates or economic conditions may affect the value and/or liquidity of such investments. Interest rate risk is the risk that prices of bonds and other fixed-income securities will increase as interest rates fall and decrease as interest rates rise. The Trusts may be subject to a greater risk of rising interest rates due to the current period of historically low rates.
| 10. | CAPITAL SHARE TRANSACTIONS |
Each of BBK, BAF, BYM, and BLE is authorized to issue an unlimited number of shares, including Preferred Shares, par value $0.001 per share, all of which were initially classified as Common Shares. The Board is authorized, however, to reclassify any unissued Common Shares to Preferred Shares without the approval of Common Shareholders.
MFL is authorized to issue an unlimited number of shares, including 1 million Preferred Shares, par value $0.10 per share.
MVF is authorized to issue 160 million shares, 150 million of which were initially classified as Common Shares, par value $0.10 per share and 10 million of which were classified as Preferred Shares, par value $0.10 per share.
Common Shares
For the periods shown, shares issued and outstanding increased by the following amounts as a result of dividend reinvestment:
| BLE | ||||
| Six Months Ended February 29, 2020 |
11,725 | |||
| Year Ended August 31, 2019 |
2,585 | |||
For the six months ended February 29, 2020 and year ended August 31, 2019, shares issued and outstanding remained constant for BBK, BAF, BYM, MFL and MVF.
The Trusts participate in an open market share repurchase program (the “Repurchase Program”). From December 1, 2018 through November 30, 2019, each Trust may repurchase up to 5% of its outstanding common shares under the Repurchase Program, based on common shares outstanding as of the close of business on November 30, 2018, subject to certain conditions. From December 1, 2019 through November 30, 2020, each Trust may repurchase up to 5% of its outstanding common shares under the Repurchase Program, based on common shares outstanding as of the close of business on November 30, 2019, subject to certain conditions. There is no assurance that the Trusts will purchase shares in any particular amounts. For the six months ended February 29, 2020, the Trusts did not repurchase any shares.
Preferred Shares
A Trust’s Preferred Shares rank prior to its Common Shares as to the payment of dividends by the Trust and distribution of assets upon dissolution or liquidation of the Trust. The 1940 Act prohibits the declaration of any dividend on Common Shares or the repurchase of Common Shares if the Trust fails to maintain asset coverage of at least 200% of the liquidation preference of the Trust’s outstanding Preferred Shares. In addition, pursuant to the Preferred Shares’ governing instruments, a Trust is restricted from declaring and paying dividends on classes of shares ranking junior to or on parity with its Preferred Shares or repurchasing such shares if the Trust fails to declare and pay dividends on the Preferred Shares, redeem any Preferred Shares required to be redeemed under the Preferred Shares’ governing instruments or comply with the basic maintenance amount requirement of the ratings agencies rating the Preferred Shares.
Holders of Preferred Shares have voting rights equal to the voting rights of holders of Common Shares (one vote per share) and vote together with holders of Common Shares (one vote per share) as a single class on certain matters. Holders of Preferred Shares, voting as a separate class, are also entitled to (i) elect two members of the Board, (ii) elect the full Board if dividends on the Preferred Shares are not paid for a period of two years and (iii) a separate class vote to amend the Preferred Share governing documents. In addition, the 1940 Act requires the approval of the holders of a majority of any outstanding Preferred Shares, voting as a separate class, to
| 78 | 2020 BLACKROCK SEMI-ANNUAL REPORT TO SHAREHOLDERS |
Notes to Financial Statements (unaudited) (continued)
(a) adopt any plan of reorganization that would adversely affect the Preferred Shares, (b) change a Trust’s sub-classification as a closed-end investment company or change its fundamental investment restrictions or (c) change its business so as to cease to be an investment company.
VRDP Shares
MFL (for purposes of this section, a “VRDP Trust”), has issued Series W-7 VRDP Shares, $100,000 liquidation preference per share, in one or more privately negotiated offerings to qualified institutional buyers as defined pursuant to Rule 144A under the Securities Act of 1933, as amended (the “Securities Act”). The VRDP Shares include a liquidity feature and may be subject to a special rate period. As of period end, the VRDP Shares outstanding were as follows:
| Issue Date |
Shares Issued |
Aggregate Principal |
Maturity Date |
|||||||||||||
| MFL |
6/30/11 | 2,746 | $ | 274,600,000 | 7/01/41 | |||||||||||
Redemption Terms: A VRDP Trust is required to redeem its VRDP Shares on the maturity date, unless earlier redeemed or repurchased. Six months prior to the maturity date, a VRDP Trust is required to begin to segregate liquid assets with the Trust’s custodian to fund the redemption. In addition, a VRDP Trust is required to redeem certain of its outstanding VRDP Shares if it fails to comply with certain asset coverage, basic maintenance amount or leverage requirements.
Subject to certain conditions, the VRDP Shares may also be redeemed, in whole or in part, at any time at the option of a VRDP Trust. The redemption price per VRDP Share is equal to the liquidation preference per share plus any outstanding unpaid dividends.
Liquidity Feature: VRDP Shares are subject to a fee agreement between the VRDP Trust and the liquidity provider that requires a per annum liquidity fee and, in some cases, an upfront or initial commitment fee, payable to the liquidity provider. These fees, if applicable, are shown as liquidity fees in the Statements of Operations. As of period end, the fee agreement is set to expire, unless renewed or terminated in advance, on April 30, 2021.
The VRDP Shares are also subject to a purchase agreement in connection with the liquidity feature. In the event a purchase agreement is not renewed or is terminated in advance, and the VRDP Shares do not become subject to a purchase agreement with an alternate liquidity provider, the VRDP Shares will be subject to mandatory purchase by the liquidity provider prior to the termination of the purchase agreement. In the event of such mandatory purchase, a VRDP Trust is required to redeem the VRDP Shares six months after the purchase date. Immediately after such mandatory purchase, the VRDP Trust is required to begin to segregate liquid assets with its custodian to fund the redemption. There is no assurance that a VRDP Trust will replace such redeemed VRDP Shares with any other preferred shares or other form of leverage.
Remarketing: A VRDP Trust may incur remarketing fees on the aggregate principal amount of all its VRDP Shares, which, if any, are included in remarketing fees on Preferred Shares in the Statements of Operations. During any special rate period (as described below), a VRDP Trust may incur nominal or no remarketing fees.
Ratings: As of period end, the VRDP Shares were assigned the following ratings:
| Moody’s Long-term Rating |
Fitch Long-term Rating |
|||||||
| MFL |
Aa1 | AAA | ||||||
Any short-term ratings on VRDP Shares are directly related to the short-term ratings of the liquidity provider for such VRDP Shares. Changes in the credit quality of the liquidity provider could cause a change in the short-term credit ratings of the VRDP Shares as rated by Moody’s and Fitch. The liquidity provider may be terminated prior to the scheduled termination date if the liquidity provider fails to maintain short-term debt ratings in one of the two highest rating categories.
Special Rate Period: A VRDP Trust may commence a “special rate period” with respect to its VRDP Shares, during which the VRDP Shares will not be subject to any remarketing and the dividend rate will be based on a predetermined methodology. During a special rate period, short-term ratings on VRDP Shares are withdrawn. MFL’s special rate period has commenced on April 17, 2014 and has a current expiration date of April 15, 2021.
Prior to the expiration date, the VRDP Trust and the VRDP Shares holder may mutually agree to extend the special rate period. If a special rate period is not extended, the VRDP Shares will revert to remarketable securities upon the termination of the special rate period and will be remarketed and available for purchase by qualified institutional investors.
During the special rate period: (i) the liquidity and fee agreements remain in effect, (ii) VRDP Shares remain subject to mandatory redemption by the VRDP Trust on the maturity date, (iii) VRDP Shares will not be remarketed or subject to optional or mandatory tender events, (iv) the VRDP Trust is required to comply with the same asset coverage, basic maintenance amount and leverage requirements for the VRDP Shares as is required when the VRDP Shares are not in a special rate period, (v) the VRDP Trust will pay dividends monthly based on the sum of an agreed upon reference rate and a percentage per annum based on the long-term ratings assigned to the VRDP Shares and (vi) the VRDP Trust will pay nominal or no fees to the liquidity provider and remarketing agent.
Dividends: Except during the Special Rate Period as described above, dividends on the VRDP Shares are payable monthly at a variable rate set weekly by the remarketing agent. Such dividend rates are generally based upon a spread over a base rate and cannot exceed a maximum rate. A change in the short-term credit rating of the liquidity provider or the VRDP Shares may adversely affect the dividend rate paid on such shares, although the dividend rate paid on the VRDP Shares is not directly based upon either short-term rating. In the event of a failed remarketing, the dividend rate of the VRDP Shares will be reset to a maximum rate. The maximum rate is determined based on, among other things, the long-term preferred share rating assigned to the VRDP Shares and the length of time that the VRDP Shares fail to be remarketed.
| NOTES TO FINANCIAL STATEMENTS | 79 |
Notes to Financial Statements (unaudited) (continued)
For the six months ended February 29, 2020, the annualized dividend rates for the VRDP Shares was 2.04%
For the six months ended February 29, 2020, VRDP Shares issued and outstanding of the VRDP Trust remained constant.
VMTP Shares
BBK, BAF, BYM, BLE, and MVF (collectively, the “VMTP Trusts”) have each issued Series W-7 VMTP Shares, $100,000 liquidation preference per share, in one or more privately negotiated offerings to qualified institutional buyers as defined pursuant to Rule 144A under the Securities Act. The VMTP Shares are subject to certain restrictions on transfer, and a VMTP Trust may also be required to register its VMTP Shares for sale under the Securities Act under certain circumstances. As of period end, the VMTP Shares outstanding and assigned long-term ratings were as follows:
| Issue Date |
Shares Issued |
Aggregate Principal |
Term Redemption Date |
Moody’s Rating |
Fitch Rating |
|||||||||||||||||||
| BBK |
12/16/11 | 799 | $ | 79,900,000 | 07/02/21 | Aa1 | AAA | |||||||||||||||||
| BAF |
12/16/11 | 422 | 42,200,000 | 07/02/21 | Aa1 | AAA | ||||||||||||||||||
| BYM |
12/16/11 | 1,372 | 137,200,000 | 07/02/21 | Aa1 | AAA | ||||||||||||||||||
| BLE |
12/16/11 | 1,513 | 151,300,000 | 07/02/21 | Aa1 | AAA | ||||||||||||||||||
| MVF |
12/16/11 | 2,438 | 243,800,000 | 07/02/21 | Aa1 | AAA | ||||||||||||||||||
Redemption Terms: Each VMTP Trust is required to redeem its VMTP Shares on the term redemption date, unless earlier redeemed or repurchased or unless extended. There is no assurance that a term will be extended further or that any VMTP Shares will be replaced with any other preferred shares or other form of leverage upon the redemption or repurchase of the VMTP Shares. Six months prior to the term redemption date, a VMTP Trust is required to begin to segregate liquid assets with its custodian to fund the redemption. In addition, a VMTP Trust is required to redeem certain of its outstanding VMTP Shares if it fails to comply with certain asset coverage, basic maintenance amount or leverage requirements.
Subject to certain conditions, VMTP Shares may be redeemed, in whole or in part, at any time at the option of the VMTP Trust. The redemption price per VMTP Share is equal to the liquidation preference per share plus any outstanding unpaid dividends.
Dividends: Dividends on the VMTP Shares are declared daily and payable monthly at a variable rate set weekly at a fixed rate spread to the Securities Industry and Financial Markets Association Municipal Swap Index or to a percentage of the one-month LIBOR rate, as set forth in the VMTP Shares governing instrument. The fixed spread is determined based on the long-term preferred share rating assigned to the VMTP Shares by the ratings agencies then rating the VMTP Shares.
The dividend rate on VMTP Shares is subject to a step-up spread if the VMTP Trust fails to comply with certain provisions, including, among other things, the timely payment of dividends, redemptions or gross-up payments, and complying with certain asset coverage and leverage requirements.
For the six months ended February 29, 2020, the average annualized dividend rates for the VMTP Shares were as follows:
| BBK | BAF | BYM | BLE | MVF | ||||||||||||||||
| Rate |
2.13 | % | 2.13 | % | 2.13 | % | 2.13 | % | 2.14 | % | ||||||||||
Offering Costs: MFL and the VMTP Trusts incurred costs in connection with the issuance of VRDP and VMTP Shares, which were recorded as a direct deduction from the carrying value of the related debt liability and will be amortized over the life of the VRDP and VMTP Shares, with the exception of any upfront fees paid by MFL to the liquidity provider which, if any, were amortized over the life of the liquidity agreement. Amortization of these costs is included in interest expense, fees and amortization of offering costs in the Statements of Operations.
Financial Reporting: The VRDP and VMTP Shares are considered debt of the issuer; therefore, the liquidation preference, which approximates fair value of the VRDP and VMTP Shares, is recorded as a liability in the Statements of Assets and Liabilities net of deferred offering costs. Unpaid dividends are included in interest expense and fees payable in the Statements of Assets and Liabilities, and the dividends accrued and paid on the VRDP and VMTP Shares are included as a component of interest expense, fees and amortization of offering costs in the Statements of Operations. The VRDP and VMTP Shares are treated as equity for tax purposes. Dividends paid to holders of the VRDP and VMTP Shares are generally classified as tax-exempt income for tax-reporting purposes. Dividends and amortization of deferred offering costs on VRDP and VMTP Shares are included in interest expense, fees and amortization of offering costs in the Statements of Operations:
| Dividend Accrued | Deferred Offering Cost Amortization |
|||||||
| BBK |
$ | 850,706 | $ | — | ||||
| BAF |
449,309 | — | ||||||
| BYM |
1,460,786 | — | ||||||
| BLE |
1,610,911 | — | ||||||
| MFL |
2,799,688 | 8,446 | ||||||
| MVF |
2,609,176 | — | ||||||
| 80 | 2020 BLACKROCK SEMI-ANNUAL REPORT TO SHAREHOLDERS |
Notes to Financial Statements (unaudited) (continued)
| 11. | SUBSEQUENT EVENTS |
Management’s evaluation of the impact of all subsequent events on the Trusts’ financial statements was completed through the date the financial statements were issued and the following items were noted.
The Trusts declared and paid distributions to Common Shareholders and Preferred Shareholders as follows:
| Common Dividend Per Share |
Preferred Shares (c) | |||||||||||||||||||||||
| Paid (a) | Declare (b) | Shares | Series | Declared | ||||||||||||||||||||
| BBK |
$ | 0.056000 | $ | 0.056000 | VMTP | W-7 | $ | 105,431 | ||||||||||||||||
| BAF |
0.051500 | 0.051500 | VMTP | W-7 | 55,684 | |||||||||||||||||||
| BYM |
0.048000 | 0.048000 | VMTP | W-7 | 181,040 | |||||||||||||||||||
| BLE |
0.058000 | 0.058000 | VMTP | W-7 | 199,646 | |||||||||||||||||||
| MFL |
0.045500 | 0.045500 | VRDP | W-7 | 841,957 | |||||||||||||||||||
| MVF |
0.033500 | 0.033500 | VMTP | W-7 | 321,703 | |||||||||||||||||||
| (a) | Net investment income dividend paid on April 1, 2020 to Common Shareholders of record on March 16, 2020. |
| (b) | Net investment income dividend declared on April 1, 2020, payable to Common Shareholders of record on April 15, 2020. |
| (c) | Dividends declared for period March 1, 2020 to March 31, 2020. |
| NOTES TO FINANCIAL STATEMENTS | 81 |
Trustee and Officer Information
Richard E. Cavanagh, Co-Chair of the Board and Trustee
Karen P. Robards, Co-Chair of the Board and Trustee
Michael J. Castellano, Trustee
Cynthia L. Egan, Trustee
Frank J. Fabozzi, Trustee
R. Glenn Hubbard, Trustee
W. Carl Kester, Trustee
Catherine A. Lynch, Trustee
Robert Fairbairn, Trustee
John M. Perlowski, Trustee, President and Chief Executive Officer
Jonathan Diorio, Vice President
Neal J. Andrews, Chief Financial Officer
Jay M. Fife, Treasurer
Charles Park, Chief Compliance Officer
Janey Ahn, Secretary
Effective February 19, 2020, Henry Gabbay resigned as a Trustee of the Trusts.
| 82 | 2020 BLACKROCK SEMI-ANNUAL REPORT TO SHAREHOLDERS |
Section 19(a) Notices
The amounts and sources of distributions reported are estimates and are being provided pursuant to regulatory requirements and are not being provided for tax reporting purposes. The actual amounts and sources for tax reporting purposes will depend upon each Trust’s investment experience during the year and may be subject to changes based on tax regulations. Shareholders will receive a Form 1099-DIV each calendar year that will inform them how to report these distributions for federal income tax purposes.
|
|
Total Fiscal Year to Date Cumulative Distributions by Character |
Percentage of Fiscal Year to Date Cumulative Distributions by Character |
||||||||||||||||||||||||||||||||||||||
| Net Investment Income |
Net Realized Capital Gains Short Term |
Net Realized Capital Gains Long Term |
Return of Capital(a) |
Total Per Common Share |
Net Investment Income |
Net Realized Capital Gains Short Term |
Net Realized Capital Gains Long Term |
Return of Capital |
Total Per Common Share |
|||||||||||||||||||||||||||||||
| BYM |
$ | 0.2864663 | $ | — | $ | — | $ | 0.0015337 | $ | 0.2880000 | 99 | % | 0 | % | 0 | % | 1 | % | 100 | % | ||||||||||||||||||||
| MVF |
0.1978250 | — | — | 0.0115990 | 0.2094240 | 94 | 0 | 0 | 6 | 100 | ||||||||||||||||||||||||||||||
| (a) | The Trust estimates that it has distributed more than its net investment income and net realized capital gains; therefore, a portion of the distribution may be a return of capital. A return of capital may occur, for example, when some or all of the shareholder’s investment in the Trust is returned to the shareholder. A return of capital does not necessarily reflect the Trust’s investment performance and should not be confused with “yield” or “income.” When distributions exceed total return performance, the difference will reduce the Trust’s net asset value per share. |
Section 19(a) notices for the Trusts, as applicable, are available on the BlackRock website at blackrock.com.
Trust Certification
The Trusts are listed for trading on the NYSE and have filed with the NYSE their annual chief executive officer certification regarding compliance with the NYSE’s listing standards. The Trusts filed with the SEC the certification of its chief executive officer and chief financial officer required by section 302 of the Sarbanes-Oxley Act.
Dividend Policy
Each Trust’s dividend policy is to distribute all or a portion of its net investment income to its shareholders on a monthly basis. In order to provide shareholders with a more stable level of distributions, the Trusts may at times pay out less than the entire amount of net investment income earned in any particular month and may at times in any particular month pay out such accumulated but undistributed income in addition to net investment income earned in that month. As a result, the distributions paid by the Trusts for any particular month may be more or less than the amount of net investment income earned by the Trusts during such month. The Trusts’ current accumulated but undistributed net investment income, if any, is disclosed as accumulated earnings (loss) in the Statements of Assets and Liabilities, which comprises part of the financial information included in this report.
General Information
The Trusts do not make available copies of their Statements of Additional Information because the Trusts’ shares are not continuously offered, which means that the Statement of Additional Information of each Trust has not been updated after completion of the respective Trust’s offerings and the information contained in each Trust’s Statement of Additional Information may have become outdated.
During the period, there were no material changes in the Trusts’ investment objectives or policies or to the Trusts’ charters or by-laws that would delay or prevent a change of control of the Trusts that were not approved by the shareholders or in the principal risk factors associated with investment in the Trusts. There have been no changes in the persons who are primarily responsible for the day-to-day management of the Trusts’ portfolios.
Effective March 24, 2020, MFL may enter into reverse repurchase agreements. The use of reverse repurchase agreements may generate taxable income for MFL and may increase the amount of ordinary income distributions paid to shareholders.
In accordance with Section 23(c) of the Investment Company Act of 1940, each Trust may from time to time purchase shares of its common stock in the open market or in private transactions.
Quarterly performance, semi-annual and annual reports, current net asset value and other information regarding the Trusts may be found on BlackRock’s website, which can be accessed at blackrock.com. Any reference to BlackRock’s website in this report is intended to allow investors public access to information regarding the Trusts and does not, and is not intended to, incorporate BlackRock’s website in this report.
Electronic Delivery
Shareholders can sign up for e-mail notifications of quarterly statements, annual and semi-annual shareholder reports by enrolling in the electronic delivery program. Electronic copies of shareholder reports are available on BlackRock’s website.
To enroll in electronic delivery:
| ADDITIONAL INFORMATION | 83 |
Additional Information (continued)
Shareholders Who Hold Accounts with Investment Advisers, Banks or Brokerages:
Please contact your financial advisor. Please note that not all investment advisers, banks or brokerages may offer this service.
Householding
The Trusts will mail only one copy of shareholder documents, annual and semi-annual reports and proxy statements, to shareholders with multiple accounts at the same address. This practice is commonly called “householding” and is intended to reduce expenses and eliminate duplicate mailings of shareholder documents. Mailings of your shareholder documents may be householded indefinitely unless you instruct us otherwise. If you do not want the mailing of these documents to be combined with those for other members of your household, please call the Trusts at (800) 882-0052.
Availability of Quarterly Schedule of Investments
The Trusts file their complete schedule of portfolio holdings with the SEC for the first and third quarters of each fiscal year as an exhibit to its reports on Form N-PORT, and for reporting periods ended prior to March 31, 2019, filed such information on Form N-Q. The Trusts’ Forms N-PORT and N-Q are available on the SEC’s website at sec.gov. The Trusts’ Forms N-PORT and N-Q may also be obtained upon request and without charge by calling (800) 882-0052.
Availability of Proxy Voting Policies and Procedures
A description of the policies and procedures that the Trusts use to determine how to vote proxies relating to portfolio securities is available upon request and without charge (1) by calling (800) 882-0052; (2) at blackrock.com; and (3) on the SEC’s website at sec.gov.
Availability of Proxy Voting Record
Information about how the Trusts voted proxies relating to securities held in the Trusts’ portfolios during the most recent 12-month period ended June 30 is available upon request and without charge (1) at blackrock.com; or by calling (800) 882-0052; and (2) on the SEC’s website at sec.gov.
Availability of Trust Updates
BlackRock will update performance and certain other data for the Trusts on a monthly basis on its website in the “Closed-end Funds” section of blackrock.com as well as certain other material information as necessary from time to time. Investors and others are advised to check the website for updated performance information and the release of other material information about the Trusts. This reference to BlackRock’s website is intended to allow investors public access to information regarding the Trusts and does not, and is not intended to, incorporate BlackRock’s website in this report.
BlackRock Privacy Principles
BlackRock is committed to maintaining the privacy of its current and former fund investors and individual clients (collectively, “Clients”) and to safeguarding their non-public personal information. The following information is provided to help you understand what personal information BlackRock collects, how we protect that information and why in certain cases we share such information with select parties.
If you are located in a jurisdiction where specific laws, rules or regulations require BlackRock to provide you with additional or different privacy-related rights beyond what is set forth below, then BlackRock will comply with those specific laws, rules or regulations.
BlackRock obtains or verifies personal non-public information from and about you from different sources, including the following: (i) information we receive from you or, if applicable, your financial intermediary, on applications, forms or other documents; (ii) information about your transactions with us, our affiliates, or others; (iii) information we receive from a consumer reporting agency; and (iv) from visits to our websites.
BlackRock does not sell or disclose to non-affiliated third parties any non-public personal information about its Clients, except as permitted by law or as is necessary to respond to regulatory requests or to service Client accounts. These non-affiliated third parties are required to protect the confidentiality and security of this information and to use it only for its intended purpose.
We may share information with our affiliates to service your account or to provide you with information about other BlackRock products or services that may be of interest to you. In addition, BlackRock restricts access to non-public personal information about its Clients to those BlackRock employees with a legitimate business need for the information. BlackRock maintains physical, electronic and procedural safeguards that are designed to protect the non-public personal information of its Clients, including procedures relating to the proper storage and disposal of such information.
| 84 | 2020 BLACKROCK SEMI-ANNUAL REPORT TO SHAREHOLDERS |
Glossary of Terms Used in this Report
| GLOSSARY OF TERMS USED IN THIS REPORT | 85 |
Want to know more?
blackrock.com | 877-275-1255 (1-877-ASK-1BLK)
This report is intended for current holders. It is not a prospectus. Past performance results shown in this report should not be considered a representation of future performance. The Trusts have leveraged their Common Shares, which creates risks for Common Shareholders, including the likelihood of greater volatility of net asset value and market price of the Common Shares, and the risk that fluctuations in short-term interest rates may reduce the Common Shares’ yield. Statements and other information herein are as dated and are subject to change.
CEF-NTL-2/20-SAR
|
|

|
