Exhibit 99.2

Juniper Networks, Inc.
1133 Innovation Way
Sunnyvale, CA 94089
July 25, 2017
CFO Commentary on Second Quarter 2017 Preliminary Financial Results
Related Information
The following commentary is provided by management and should be referenced in conjunction with Juniper Networks’ second quarter 2017 preliminary financial results press release available on its Investor Relations website at http://investor.juniper.net. These remarks represent management’s current views of the Company’s financial and operational performance and outlook and are provided to give investors and analysts further insight into the Company’s performance in advance of the earnings call webcast.
Q2 2017 Preliminary Financial Results
GAAP
| (in millions, except per share amounts and percentages) | Q2’17 | Q1’17 | Q2’16 | Q/Q Change | Y/Y Change | |||||||||||||||
| Revenue |
$ | 1,308.9 | $ | 1,221.0 | $ | 1,221.3 | 7 | % | 7 | % | ||||||||||
| Product |
917.2 | 828.9 | 862.1 | 11 | % | 6 | % | |||||||||||||
| Service |
391.7 | 392.1 | 359.2 | — | % | 9 | % | |||||||||||||
| Gross margin % |
61.3 | % | 61.1 | % | 61.9 | % | 0.2pts | (0.6 | )pts | |||||||||||
| Research and development |
240.2 | 276.2 | 247.9 | (13 | )% | (3 | )% | |||||||||||||
| Sales and marketing |
239.9 | 244.2 | 243.7 | (2 | )% | (2 | )% | |||||||||||||
| General and administrative |
55.6 | 50.5 | 58.6 | 10 | % | (5 | )% | |||||||||||||
| Restructuring charges |
8.0 | 19.4 | 2.4 | (59 | )% | 233 | % | |||||||||||||
|
|
|
|
|
|
|
|||||||||||||||
| Total operating expenses |
$ | 543.7 | $ | 590.3 | $ | 552.6 | (8 | )% | (2 | )% | ||||||||||
|
|
|
|
|
|
|
|||||||||||||||
| Operating margin % |
19.7 | % | 12.8 | % | 16.7 | % | 6.9pts | 3.0pts | ||||||||||||
|
|
|
|
|
|
|
|||||||||||||||
| Net income |
$ | 179.8 | $ | 108.8 | $ | 140.0 | 65 | % | 28 | % | ||||||||||
|
|
|
|
|
|
|
|||||||||||||||
| Diluted EPS |
$ | 0.47 | $ | 0.28 | $ | 0.36 | 68 | % | 31 | % | ||||||||||
|
|
|
|
|
|
|
|||||||||||||||
Non-GAAP
| (in millions, except per share amounts and percentages) | Q3’17 Guidance | Q2’17 | Q1’17 | Q2’16 | Q/Q Change | Y/Y Change | ||||||||||||||||||
| Revenue(1) |
$ | 1,320 +/- $30 | $ | 1,308.9 | $ | 1,221.0 | $ | 1,221.3 | 7 | % | 7 | % | ||||||||||||
| Product(1) |
917.2 | 828.9 | 862.1 | 11 | % | 6 | % | |||||||||||||||||
| Service(1) |
391.7 | 392.1 | 359.2 | — | % | 9 | % | |||||||||||||||||
| Gross margin % |
62.0% +/- 0.5% | 62.0 | % | 62.5 | % | 63.0 | % | (0.5 | )pts | (1.0 | )pts | |||||||||||||
| Research and development |
225.6 | 239.6 | 218.0 | (6 | )% | 3 | % | |||||||||||||||||
| Sales and marketing |
222.2 | 226.5 | 228.3 | (2 | )% | (3 | )% | |||||||||||||||||
| General and administrative |
48.0 | 43.0 | 48.0 | 12 | % | — | % | |||||||||||||||||
|
|
|
|
|
|
|
|||||||||||||||||||
| Total operating expenses |
$ | 500 +/- $5 | $ | 495.8 | $ | 509.1 | $ | 494.3 | (3 | )% | — | % | ||||||||||||
|
|
|
|
|
|
|
|||||||||||||||||||
| Operating margin % |
|
~24.1% at the midpoint |
|
24.2 | % | 20.8 | % | 22.5 | % | 3.4pts | 1.7pts | |||||||||||||
|
|
|
|
|
|
|
|||||||||||||||||||
| Net income |
$ | 220.5 | $ | 178.0 | $ | 191.6 | 24 | % | 15 | % | ||||||||||||||
|
|
|
|
|
|
|
|||||||||||||||||||
| Diluted EPS |
$ | 0.58 +/- $0.03 | $ | 0.57 | $ | 0.46 | $ | 0.50 | 24 | % | 14 | % | ||||||||||||
|
|
|
|
|
|
|
|||||||||||||||||||
| (1) | Revenue numbers are GAAP. |
This CFO Commentary contains non-GAAP financial measures, and the reconciliation between GAAP and non-GAAP financial measures can be found at the end of this document. We are unable to provide a reconciliation of forward-looking non-GAAP guidance measures to corresponding GAAP measures without unreasonable effort due to the overall high variability and low visibility of most of the items that are excluded from our non-GAAP guidance measures. More information on these exclusions can be found under “Outlook” below.
Q2 2017 Overview
The results for the second quarter of 2017 reflect good sequential and year-over-year revenue growth, continued expansion of earnings and healthy cash flows.
The industry shift towards Cloud networking continued to play to our strengths. The Cloud vertical grew 32% year-over-year and from a product perspective, we had a record revenue quarter in Switching, led by the QFX product family. Our Services business remained solid, growing 9% year-over-year.
In reviewing our top 10 customers for the quarter, four were Cloud, five were Telecom / Cable, and one was a Strategic Enterprise. Of these customers, two were located outside of the U.S. One customer accounted for greater than 10% of revenue for the quarter.
Product deferred revenue was $297 million, up $7 million or 2% year-over-year and up $16 million or 6% sequentially.
In the quarter, we continued to generate healthy cash flows from operations of $299 million, down $61 million year-over-year and down $247 million sequentially. During the quarter, we repurchased $125 million shares and paid $38 million in dividends.
Revenue
Product & Service
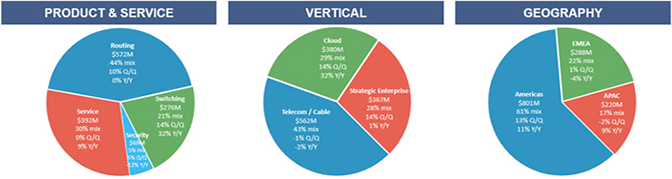
| • | Routing product revenue: $572 million, flat year-over-year and up 10% sequentially. Year-over-year, the Cloud vertical increased, offset by Telecom / Cable and Strategic Enterprise. The sequential increase was driven by Cloud and Strategic Enterprise, partially offset by Telecom / Cable. Within the routing products, the sequential results were driven by an increase from our MX and PTX products partially offset by declines from our legacy products. |
| • | Switching product revenue: $276 million, up 32% year-over-year and up 14% sequentially. All verticals increased year-over-year and sequentially. We saw continued data center strength with our QFX product family and our EX product family increased both year-over-year and sequentially. |
| • | Security product revenue: $69 million, down 12% year-over-year and up 5% sequentially. All verticals decreased year-over-year. The sequential increase was due to Telecom / Cable and Strategic Enterprise customers partially offset by a decrease in Cloud. |
| • | Service revenue: $392 million, up 9% year-over-year and flat sequentially. The year-over-year increase was driven by strong demand for professional services and strong renewal and attach rates of support contracts. As a reminder, in the first quarter of 2017 we recognized previously deferred revenue of approximately $15 million related to the completion of delivery to an APAC Telecom customer. |
Vertical
| • | Cloud: $380 million, up 32% year-over-year and up 14% sequentially. The year-over-year increase was driven by Switching and Routing deployments at several large customers. The sequential increase was primarily driven by Routing and to a lesser extent Switching, partially offset by a decrease in Security. |
| • | Telecom / Cable: $562 million, down 2% year-over-year and down 1% sequentially. The year-over-year decrease was primarily due to Routing, partially offset by increases in Services and Switching. Sequentially, the decrease was primarily due to Routing, partially offset by increases in Switching. Sequentially, U.S. Cable declined, partially offset by an increase in U.S. and EMEA Telecom. |
| • | Strategic Enterprise: $367 million, up 1% year-over-year and up 14% sequentially. The year-over-year increase was driven by higher Switching and Services, partially offset by decreases in Routing and Security. All technologies and Services increased sequentially. Sequentially, the increase was due to the broader Enterprise market, National Government and Financial Services. |
Geography
| • | Americas: $801 million, up 11% year-over-year and up 13% sequentially. The year-over-year increase was driven by Cloud. Sequentially, all verticals increased, primarily driven by Cloud. |
| • | EMEA: $288 million, down 4% year-over-year and up 1% sequentially. Year-over-year Telecom / Cable and Cloud declined, which was partially offset by an increase in Strategic Enterprise. The majority of the decline was in the U.K. and Germany. Sequentially, the increase was due to Telecom/ Cable, partially offset by a decrease in Cloud. The sequential increase was driven primarily by the Middle East partially offset by Europe. |
| • | APAC: $220 million, up 9% year-over-year and down 2% sequentially. The year-over-year increase was due to an increase across all verticals. The sequential decrease was due to Telecom / Cable, partially offset by Strategic Enterprise and Cloud. The year-over-year increase was driven primarily by Australia. The sequential decrease was primarily due to Southeast Asia partially offset by Australia. |
Gross Margin
| • | GAAP gross margin: 61.3%, compared to 61.9% from the prior year and 61.1% from last quarter. |
| • | Non-GAAP gross margin: 62.0%, compared to 63.0% from the prior year and 62.5% from last quarter. |
Non-GAAP gross margin was within our guided range for the quarter, reflecting the expected market dynamics. We remain focused on delivering innovation and continued improvements to our cost structure.
| • | GAAP product gross margin: 60.7%, down 1.2 points from the prior year and up 0.5 points from last quarter. |
Year-over-year, the decrease in product gross margin, on a GAAP basis was primarily due to customer mix as we continue to expand our footprint with certain strategic customers, particularly Cloud and Telecom / Cable in APAC, the product mix related to the strong performance of Switching, and higher costs of certain memory components. The decrease was partially offset by improvements in our cost structure and higher revenue.
The sequential increase, on a GAAP basis, was due to a charge related to supplier component remediation in the first quarter of 2017, improvements in our cost structure and higher revenue, partially offset by customer mix as we continue to expand our footprint with certain strategic customers, product mix and higher costs of certain memory components.
| • | Non-GAAP product gross margin: 61.2%, down 1.6 points from the prior year and down 0.3 points from last quarter. |
Year-over-year the decrease in product gross margin, on a non-GAAP basis was primarily due to customer mix as we continue to expand our footprint with certain strategic customers, particularly Cloud and Telecom / Cable customers in APAC. Additionally, the product mix primarily related to the strong performance of Switching and higher costs for certain memory components had an adverse impact. The decrease was partially offset by improvements in our cost structure and higher revenue.
Sequentially, the decrease in product gross margin, on a non-GAAP basis was primarily due to customer mix as we continue to expand our footprint with certain strategic customers, product mix and higher costs of certain memory components partially offset by improvements in our cost structure and higher revenue.
| • | GAAP service gross margin: 62.5%, up 0.5 points from the prior year and down 0.7 points from last quarter. |
| • | Non-GAAP service gross margin: 64.0%, up 0.7 points from the prior year and down 0.5 points from last quarter. |
Year-over-year, the increase in service gross margin, on a GAAP and non-GAAP basis, was due to higher service revenue and continued improvements in our customer support model.
The sequential decrease in service gross margin, on a GAAP and non-GAAP basis, was primarily due to the recognition of previously deferred revenue related to the completion of delivery to an APAC Telecom customer from the prior quarter
Operating Expenses
| • | GAAP operating expenses: $544 million, a decrease of $9 million, or 2% year-over-year, and a decrease of $47 million, or 8% sequentially. |
The year-over-year decrease in operating expense was primarily due to lower share-based compensation, lower variable compensation and cost discipline, partially offset by higher costs related to acquisitions completed in the second half of 2016. The sequential decrease was primarily due to lower share-based and variable compensation and restructuring charges.
GAAP operating expenses were 41.5% of revenue, down 3.7 points year-over-year and down 6.8 points quarter-over-quarter.
| • | Non-GAAP operating expenses: $496 million, an increase of $2 million, or flat year-over-year, and a decrease of $13 million or 3% sequentially. |
The flat year-over-year operating expense was primarily due to lower variable compensation and cost discipline offset by higher costs related to acquisitions completed in the second half of 2016. The sequential decrease was primarily the result of lower variable compensation and cost discipline.
Non-GAAP operating expenses were 37.9% of revenue, down 2.6 points year-over-year and down 3.8 points quarter-over-quarter.
Operating Margin
| • | GAAP operating margin: 19.7%, an increase of 3.0 points year-over-year and 6.9 points sequentially. |
| • | Non-GAAP operating margin: 24.2%, an increase of 1.7 points year-over-year and an increase of 3.4 points sequentially. |
Tax Rate
| • | GAAP tax rate: 26.7%, an increase of 4.1 points compared to 22.6% last quarter. |
| • | Non-GAAP tax rate: 27.3%, an increase of 2.1 points compared to 25.2% last quarter. |
The sequential change in the effective tax rate, on a GAAP and non-GAAP basis, was primarily due to the benefit of discrete items in the previous quarter.
Diluted Earnings Per Share
| • | GAAP diluted earnings per share: $0.47, an increase of $0.11 year-over-year and an increase of $0.19 sequentially. |
The year-over-year increase was driven by higher revenue and lower operating expenses, partially offset by lower gross margin. The sequential increase was primarily due to higher revenue and lower operating expenses, partially offset by a higher tax rate.
| • | Non-GAAP diluted earnings per share: $0.57, an increase of $0.07 year-over-year and an increase of $0.11 sequentially. |
The year-over-year increase was primarily driven by higher revenue partially offset by lower gross margin. The sequential increase was primarily due to higher revenue and lower operating expense, partially offset by higher tax rate and lower gross margin.
Balance Sheet, Cash Flow, Capital Return, and Other Financial Metrics
| (in millions, except days sales outstanding (“DSO”), and headcount) | Q2’17 | Q1’17 | Q4’16 | Q3’16 | Q2’16 | |||||||||||||||
| Cash(1, 2) |
$ | 4,214.6 | $ | 4,043.7 | $ | 3,657.3 | $ | 3,480.1 | $ | 3,491.1 | ||||||||||
| Debt |
2,135.0 | 2,134.4 | 2,133.7 | 2,133.1 | 2,132.5 | |||||||||||||||
| Net cash and investments(3) |
2,079.6 | 1,909.3 | 1,523.6 | 1,347.0 | 1,358.6 | |||||||||||||||
| Operating cash flow(4) |
298.7 | 545.3 | 334.7 | 245.6 | 360.0 | |||||||||||||||
| Capital expenditures |
32.2 | 32.1 | 51.8 | 46.0 | 67.6 | |||||||||||||||
| Depreciation and amortization |
54.8 | 54.2 | 53.9 | 52.2 | 49.2 | |||||||||||||||
| Share repurchases |
125.0 | 125.0 | — | 112.4 | 125.5 | |||||||||||||||
| Dividends |
$ | 37.8 | $ | 38.0 | $ | 38.1 | $ | 38.0 | $ | 38.1 | ||||||||||
| Diluted shares |
385.6 | 388.0 | 385.6 | 384.5 | 386.3 | |||||||||||||||
| DSO |
52 | 49 | 68 | 53 | 55 | |||||||||||||||
| Headcount(5) |
9,661 | 9,694 | 9,832 | 9,863 | 9,617 | |||||||||||||||
| (1) | Includes cash, cash equivalents, and investments. |
| (2) | 17% held onshore as of the end of Q2’17. |
| (3) | Net cash and investments includes, cash, cash equivalents, and investments, net of debt. |
| (4) | In Q1’17, we adopted the new accounting pronouncement on Improvements to Employee Share-Based Payment Accounting, requiring excess tax benefits to be presented as an operating activity in our consolidated statements of cash flows. We applied this provision on a retrospective basis, resulting in the reclassification of certain excess tax benefits from share-based compensation to operating activities from financing activities. |
| (5) | Q2’17 and Q1’17 excludes headcount impacted by restructuring activities. |
Cash Flow
| • | Cash flow from operations: $299 million, down $61 million year-over-year and $247 million sequentially. The year-over-year and sequential decrease was the result of timing differences in working capital, primarily related to fluctuations in accounts receivable. |
Days Sales Outstanding
| • | DSO: 52 days, compared to 49 days from the prior quarter, an increase of 3 days. The increase in DSO was driven by a return to normalized invoicing linearity. |
Capital Return
| • | In the quarter, we repurchased $125 million of shares and paid a dividend of $0.10 per share for a total of $38 million. |
| • | Diluted shares were approximately flat year-over-year. |
| • | In 2017, we intend to return approximately 50% of annual free cash flow to our shareholders, inclusive of share repurchases and dividends. Free cash flow is calculated as net cash provided by operating activities less capital expenditures. |
Demand metrics
| • | Total deferred revenue was $1,501 million, up $205 million year-over-year and up $8 million quarter-over-quarter. |
| • | Product deferred revenue was $297 million, an increase of $7 million year-over-year and an increase of $16 million quarter-over-quarter. |
Headcount
| • | Ending headcount was 9,661, excluding headcount impacted by restructuring activities, an increase of 44 employees year-over-year and a decrease of 33 employees sequentially. The year-over-year increase was primarily related to Services and acquisitions completed in the second half of 2016 partially offset by restructuring of headcount. The sequential decrease was primarily related to restructuring of headcount. |
Outlook
These metrics are provided on a non-GAAP basis, except for revenue and share count. Earnings per share is on a fully diluted basis. The outlook assumes that the exchange rate of the U.S. dollar to other currencies will remain relatively stable at current levels.
As a company, we remain committed to the financial principles we outlined at the beginning of the year, which, are: we expect revenue growth for the year; we are focused on earnings expansion with long-term consistency and we intend to maintain an optimized capital structure. In addition, we remain committed to delivering strong operating cash flow.
We continue to expect revenue growth for 2017 to be near the midpoint of our long-term model range of 3 to 6%. As we shared with you last quarter, some elements of our addressable markets are challenged and timing of customer deployments may vary. We are pleased with our product portfolio and expect to see continued strength from the Cloud vertical.
We expect similar gross margin dynamics to persist for the remainder of the year as seen in the first half of the year.
We are focused on driving earnings expansion for the full year, through revenue growth, operating expense discipline and strong execution. As we stated last quarter, we are driving to our long-term model of 39% of operating expense as a percent of revenue for the full year.
We intend to return approximately 50% of annual free cash flow to our shareholders, inclusive of share repurchases and dividends.
Our guidance for the quarter ending September 30, 2017, is as follows:
| • | Revenues will be approximately $1,320 million, plus or minus $30 million. |
| • | Non-GAAP gross margin will be approximately 62.0%, plus or minus 0.5%. |
| • | Non-GAAP operating expenses will be approximately $500 million, plus or minus $5 million. |
| • | Non-GAAP operating margin will be approximately 24.1% at the midpoint of revenue guidance. |
| • | Non-GAAP tax rate will be approximately 27.5%. |
| • | Non-GAAP net income per share will be approximately $0.58, plus or minus $0.03. This assumes a share count of approximately 385 million. |
Forward-Looking Statements
Statements in this CFO Commentary and related conference call concerning Juniper Networks’ business, economic and market outlook, including pricing pressure and product mix, factors that impact gross margin, long-term financial model, product portfolio and success of particular products and product families, success in obtaining revenue growth, future financial and operating results, including our financial guidance, focus on and ability to deliver on growth, operational expense discipline, and cash flows, improvements to our cost structure and expense reductions and management, strength of certain customer segments, capital structure, capital return program, and overall future prospects are forward looking statements within the meaning of the Private Securities Litigation Reform Act that involve a number of uncertainties and risks. Actual results or events could differ materially from those anticipated in those forward-looking statements as a result of several factors, including: general economic and political conditions globally or regionally; business and economic conditions in the networking industry; changes in overall technology spending by our customers; the network capacity requirements of our customers and, in particular, cloud and telecommunication service providers; contractual terms that may result in the deferral of revenue; increases in and the effect of competition; the timing of orders and their fulfillment; manufacturing and supply chain constraints, changes or disruptions; availability of key product components; ability to establish and maintain relationships with distributors, resellers and other partners; variations in the expected mix of products sold; changes in customer mix; changes in geography mix; customer and industry analyst perceptions of Juniper Networks and its technology, products and future prospects; delays in scheduled product availability; market acceptance of Juniper Networks products and services; rapid technological and market change; adoption of regulations or standards affecting Juniper Networks products, services or the networking industry; the ability to successfully acquire, integrate and manage businesses and technologies; product defects, returns or vulnerabilities; the ability to recruit and retain key personnel; significant effects of tax legislation and judicial or administrative interpretation of tax regulations; currency fluctuations; litigation settlements and resolutions; the potential impact of activities related to the execution of capital return, restructurings and product rationalization; and other factors listed in Juniper Networks’ most recent report on Form 10-K or 10-Q filed with the Securities and Exchange Commission (“SEC”). All statements contained in this CFO Commentary and related conference call are made only as of the date set forth at the beginning of this document. Juniper Networks undertakes no obligation to update the information contained in this document or the related conference call in the event facts or circumstances subsequently change after the date of this document.
Use of Non-GAAP Financial Measures
This CFO Commentary contains references to the following non-GAAP financial measures: gross margin; product gross margin; service gross margin; product gross margin as a percentage of product revenue; service gross margin as a percentage of service revenue; gross margin as a percentage of revenue; research and development expense; sales and marketing expense; general and administrative expense; operating expense; operating expense as a percentage of revenue; operating income; operating margin; provision for income tax; income tax rate; net income; and diluted earnings per share. For important commentary on why Juniper Networks considers non-GAAP information a useful view of the company’s financial results, please see the press release furnished with our Form 8-K filed today with the SEC. With respect to future financial guidance provided on a non-GAAP basis, we have excluded estimates for amortization of intangible assets, share-based compensation expenses, acquisition-related charges, restructuring charges, impairment charges, litigation settlement and resolution charges, gain or loss on equity investments, retroactive impact of certain tax settlements, non-recurring income tax adjustments, valuation allowance on deferred tax assets, and the income tax effect of non-GAAP exclusions, and do not include the impact of any future acquisitions, divestitures, or joint ventures that may occur in the quarter. These measures are not presented in accordance with, nor are they a substitute for U.S. generally accepted accounting principles or GAAP. In addition, these measures may be different from non-GAAP measures used by other companies, limiting their usefulness for comparison purposes. The non-GAAP financial measures used in this CFO Commentary should not be considered in isolation from measures of financial performance prepared in accordance with GAAP. Investors are cautioned that there are material limitations associated with the use of non-GAAP financial measures as an analytical tool. In particular, many of the adjustments to our GAAP financial measures reflect the exclusion of items that are recurring and will be reflected in our financial results for the foreseeable future.
A reconciliation of non-GAAP guidance measures to corresponding GAAP measures is not available on a forward-looking basis due to the high variability and low visibility with respect to the charges which are excluded from these non-GAAP measures. For example, share-based compensation expense is impacted by the Company’s future hiring needs, and restructuring actions, the type and volume of equity awards necessary for such future hiring, and the price at which the Company’s stock will trade in those future periods. Amortization of intangible assets is significantly impacted by the timing and size of any future acquisitions. The items that are being excluded are difficult to predict and a reconciliation could result in disclosure that would be imprecise or potentially misleading. Material changes to any one of these items could have a significant effect on our guidance and future GAAP results. Certain exclusions, such as amortization of intangible assets and share-based compensation expenses, are generally incurred each quarter, but the amounts have historically and may continue to vary significantly from quarter to quarter.
Juniper Networks, Inc.
Preliminary Supplemental Data
(in millions, except percentages)
(unaudited)
Deferred Revenue
| As of | ||||||||
| June 30, 2017 |
December 31, 2016 |
|||||||
| Deferred product revenue: |
||||||||
| Undelivered product commitments and other product deferrals |
$ | 265.5 | $ | 302.4 | ||||
| Distributor inventory and other sell-through items |
76.1 | 74.2 | ||||||
|
|
|
|
|
|||||
| Deferred gross product revenue |
341.6 | 376.6 | ||||||
| Deferred cost of product revenue |
(44.3 | ) | (53.7 | ) | ||||
|
|
|
|
|
|||||
| Deferred product revenue, net |
297.3 | 322.9 | ||||||
| Deferred service revenue |
1,203.7 | 1,158.2 | ||||||
|
|
|
|
|
|||||
| Total |
$ | 1,501.0 | $ | 1,481.1 | ||||
|
|
|
|
|
|||||
| Reported as: |
||||||||
| Current |
$ | 998.0 | $ | 1,032.0 | ||||
| Long-term |
503.0 | 449.1 | ||||||
|
|
|
|
|
|||||
| Total |
$ | 1,501.0 | $ | 1,481.1 | ||||
|
|
|
|
|
|||||
Vertical Reporting: Quarterly Revenue Trend
| FY 2015 | FY 2016 | Q2’16 | Q3’16 | Q4’16 | Q1’17 | Q2’17 | Q/Q Change | Y/Y Change | ||||||||||||||||||||||||||||||||||||
| Cloud |
$ | 1,021.2 | $ | 1,322.3 | $ | 287.3 | $ | 359.4 | $ | 410.8 | $ | 331.6 | $ | 379.6 | $ | 48.0 | 14% | $ | 92.3 | 32% | ||||||||||||||||||||||||
| Telecom / Cable |
2,417.1 | 2,324.7 | 571.0 | 599.4 | 636.2 | 568.5 | 562.4 | (6.1 | ) | (1)% | (8.6 | ) | (2)% | |||||||||||||||||||||||||||||||
| Strategic Enterprise |
1,419.5 | 1,343.1 | 363.0 | 326.5 | 338.6 | 320.9 | 366.9 | 46.0 | 14% | 3.9 | 1% | |||||||||||||||||||||||||||||||||
|
|
|
|
|
|
|
|
|
|
|
|
|
|
|
|
|
|
|
|
|
|
|
|||||||||||||||||||||||
| Total revenue |
$ | 4,857.8 | $ | 4,990.1 | $ | 1,221.3 | $ | 1,285.3 | $ | 1,385.6 | $ | 1,221.0 | $ | 1,308.9 | $ | 87.9 | 7% | $ | 87.6 | 7% | ||||||||||||||||||||||||
|
|
|
|
|
|
|
|
|
|
|
|
|
|
|
|
|
|
|
|
|
|
|
|||||||||||||||||||||||
Juniper Networks, Inc.
Preliminary Reconciliations between GAAP and non-GAAP Financial Measures
(in millions, except percentages and per share amounts)
(unaudited)
| Three Months Ended | ||||||||||||
| June 30, 2017 | March 31, 2017 | June 30, 2016 | ||||||||||
| GAAP gross margin - Product |
$ | 557.0 | $ | 498.7 | $ | 533.8 | ||||||
| GAAP product gross margin % of product revenue |
60.7 | % | 60.2 | % | 61.9 | % | ||||||
| Share-based compensation expense |
1.4 | 0.9 | 1.5 | |||||||||
| Share-based payroll tax expense |
— | 0.2 | — | |||||||||
| Amortization of purchased intangible assets |
3.1 | 3.1 | 3.6 | |||||||||
| Acquisition-related and other charges |
— | — | 2.8 | |||||||||
| Supplier component remediation charges |
— | 7.1 | — | |||||||||
|
|
|
|
|
|
|
|||||||
| Non-GAAP gross margin - Product |
$ | 561.5 | $ | 510.0 | $ | 541.7 | ||||||
|
|
|
|
|
|
|
|||||||
| Non-GAAP product gross margin % of product revenue |
61.2 | % | 61.5 | % | 62.8 | % | ||||||
| GAAP gross margin - Service |
$ | 244.9 | $ | 247.9 | $ | 222.6 | ||||||
| GAAP service gross margin % of service revenue |
62.5 | % | 63.2 | % | 62.0 | % | ||||||
| Share-based compensation expense |
5.3 | 4.3 | 4.3 | |||||||||
| Share-based payroll tax expense |
0.3 | 0.7 | 0.3 | |||||||||
|
|
|
|
|
|
|
|||||||
| Non-GAAP gross margin - Service |
$ | 250.5 | $ | 252.9 | $ | 227.2 | ||||||
|
|
|
|
|
|
|
|||||||
| Non-GAAP service gross margin % of service revenue |
64.0 | % | 64.5 | % | 63.3 | % | ||||||
| GAAP gross margin |
$ | 801.9 | $ | 746.6 | $ | 756.4 | ||||||
| GAAP gross margin % of revenue |
61.3 | % | 61.1 | % | 61.9 | % | ||||||
| Share-based compensation expense |
6.7 | 5.2 | 5.8 | |||||||||
| Share-based payroll tax expense |
0.3 | 0.9 | 0.3 | |||||||||
| Amortization of purchased intangible assets |
3.1 | 3.1 | 3.6 | |||||||||
| Acquisition-related and other charges |
— | — | 2.8 | |||||||||
| Supplier component remediation charges |
— | 7.1 | — | |||||||||
|
|
|
|
|
|
|
|||||||
| Non-GAAP gross margin |
$ | 812.0 | $ | 762.9 | $ | 768.9 | ||||||
|
|
|
|
|
|
|
|||||||
| Non-GAAP gross margin % of revenue |
62.0 | % | 62.5 | % | 63.0 | % | ||||||
| GAAP research and development expense |
$ | 240.2 | $ | 276.2 | $ | 247.9 | ||||||
| Share-based compensation expense |
(14.1 | ) | (34.8 | ) | (29.5 | ) | ||||||
| Share-based payroll tax expense |
(0.5 | ) | (1.8 | ) | (0.4 | ) | ||||||
|
|
|
|
|
|
|
|||||||
| Non-GAAP research and development expense |
$ | 225.6 | $ | 239.6 | $ | 218.0 | ||||||
|
|
|
|
|
|
|
|||||||
| GAAP sales and marketing expense |
$ | 239.9 | $ | 244.2 | $ | 243.7 | ||||||
| Share-based compensation expense |
(16.3 | ) | (15.3 | ) | (13.8 | ) | ||||||
| Share-based payroll tax expense |
(0.5 | ) | (1.4 | ) | (0.8 | ) | ||||||
| Amortization of purchased intangible assets |
(0.9 | ) | (1.0 | ) | (0.8 | ) | ||||||
|
|
|
|
|
|
|
|||||||
| Non-GAAP sales and marketing expense |
$ | 222.2 | $ | 226.5 | $ | 228.3 | ||||||
|
|
|
|
|
|
|
|||||||
| GAAP general and administrative expense |
$ | 55.6 | $ | 50.5 | $ | 58.6 | ||||||
| Share-based compensation expense |
(7.0 | ) | (6.7 | ) | (6.5 | ) | ||||||
| Share-based payroll tax expense |
(0.4 | ) | (0.3 | ) | (0.1 | ) | ||||||
| Amortization of purchased intangible assets |
(0.2 | ) | (0.2 | ) | (0.4 | ) | ||||||
| Acquisition-related and other charges |
— | (0.3 | ) | (3.6 | ) | |||||||
|
|
|
|
|
|
|
|||||||
| Non-GAAP general and administrative expense |
$ | 48.0 | $ | 43.0 | $ | 48.0 | ||||||
|
|
|
|
|
|
|
|||||||
Juniper Networks, Inc.
Preliminary Reconciliations between GAAP and non-GAAP Financial Measures
(in millions, except percentages and per share amounts)
(unaudited)
| Three Months Ended | ||||||||||||
| June 30, 2017 | March 31, 2017 | June 30, 2016 | ||||||||||
| GAAP operating expenses |
$ | 543.7 | $ | 590.3 | $ | 552.6 | ||||||
| GAAP operating expenses % of revenue |
41.5 | % | 48.3 | % | 45.2 | % | ||||||
| Share-based compensation expense |
(37.4 | ) | (56.8 | ) | (49.8 | ) | ||||||
| Share-based payroll tax expense |
(1.4 | ) | (3.5 | ) | (1.3 | ) | ||||||
| Amortization of purchased intangible assets |
(1.1 | ) | (1.2 | ) | (1.2 | ) | ||||||
| Restructuring charges |
(8.0 | ) | (19.4 | ) | (2.4 | ) | ||||||
| Acquisition-related and other charges |
— | (0.3 | ) | (3.6 | ) | |||||||
|
|
|
|
|
|
|
|||||||
| Non-GAAP operating expenses |
$ | 495.8 | $ | 509.1 | $ | 494.3 | ||||||
|
|
|
|
|
|
|
|||||||
| Non-GAAP operating expenses % of revenue |
37.9 | % | 41.7 | % | 40.5 | % | ||||||
| GAAP operating income |
$ | 258.2 | $ | 156.3 | $ | 203.8 | ||||||
| GAAP operating margin |
19.7 | % | 12.8 | % | 16.7 | % | ||||||
| Share-based compensation expense |
44.1 | 62.0 | 55.6 | |||||||||
| Share-based payroll tax expense |
1.7 | 4.4 | 1.6 | |||||||||
| Amortization of purchased intangible assets |
4.2 | 4.3 | 4.8 | |||||||||
| Restructuring charges |
8.0 | 19.4 | 2.4 | |||||||||
| Acquisition-related and other charges |
— | 0.3 | 6.4 | |||||||||
| Supplier component remediation charges |
— | 7.1 | — | |||||||||
|
|
|
|
|
|
|
|||||||
| Non-GAAP operating income |
$ | 316.2 | $ | 253.8 | $ | 274.6 | ||||||
|
|
|
|
|
|
|
|||||||
| Non-GAAP operating margin |
24.2 | % | 20.8 | % | 22.5 | % | ||||||
| GAAP income tax provision |
$ | 65.4 | $ | 31.8 | $ | 52.2 | ||||||
| GAAP income tax rate |
26.7 | % | 22.6 | % | 27.2 | % | ||||||
| Income tax effect of non-GAAP exclusions |
17.3 | 28.3 | 15.9 | |||||||||
|
|
|
|
|
|
|
|||||||
| Non-GAAP provision for income tax |
$ | 82.7 | $ | 60.1 | $ | 68.1 | ||||||
|
|
|
|
|
|
|
|||||||
| Non-GAAP income tax rate |
27.3 | % | 25.2 | % | 26.2 | % | ||||||
| GAAP net income |
$ | 179.8 | $ | 108.8 | $ | 140.0 | ||||||
| Share-based compensation expense |
44.1 | 62.0 | 55.6 | |||||||||
| Share-based payroll tax expense |
1.7 | 4.4 | 1.6 | |||||||||
| Amortization of purchased intangible assets |
4.2 | 4.3 | 4.8 | |||||||||
| Restructuring charges |
8.0 | 19.4 | 2.4 | |||||||||
| Acquisition-related and other charges |
— | 0.3 | 6.4 | |||||||||
| Supplier component remediation charges |
— | 7.1 | — | |||||||||
| Gain on equity investments |
— | — | (3.3 | ) | ||||||||
| Income tax effect of non-GAAP exclusions |
(17.3 | ) | (28.3 | ) | (15.9 | ) | ||||||
|
|
|
|
|
|
|
|||||||
| Non-GAAP net income |
$ | 220.5 | $ | 178.0 | $ | 191.6 | ||||||
|
|
|
|
|
|
|
|||||||
| GAAP diluted net income per share |
$ | 0.47 | $ | 0.28 | $ | 0.36 | ||||||
|
|
|
|
|
|
|
|||||||
| Non-GAAP diluted net income per share |
$ | 0.57 | $ | 0.46 | $ | 0.50 | ||||||
|
|
|
|
|
|
|
|||||||
| Shares used in computing diluted net income per share |
385.6 | 388.0 | 386.3 | |||||||||
|
|
|
|
|
|
|
|||||||