Table of Contents
UNITED STATES
SECURITIES AND EXCHANGE COMMISSION
Washington, D.C. 20549
FORM N-CSR
CERTIFIED SHAREHOLDER REPORT OF REGISTERED
MANAGEMENT INVESTMENT COMPANIES
Investment Company Act file number: 811-08257
STATE STREET INSTITUTIONAL FUNDS
(formerly known as GE Institutional Funds)
(Exact name of registrant as specified in charter)
1600 Summer Street
Stamford, Connecticut 06905
(Address of principal executive offices)(Zip code)
SSGA Funds Management, Inc.
1600 Summer Street
Stamford, Connecticut 06905
(Name and Address of Agent for Service)
Registrant’s telephone number, including area code: 800-242-0134
Date of fiscal year end: 09/30
Date of reporting period: 09/30/16
Table of Contents
Item 1. Reports to Stockholders
Table of Contents
Annual Report
September 30, 2016
GE Institutional Funds

Table of Contents
GE Institutional Funds
Annual Report
September 30, 2016
| Page | ||||
| Notes to Performance | 1 | |||
| Manager Reviews and Schedules of Investments | ||||
| 3 | ||||
| 11 | ||||
| 24 | ||||
| 31 | ||||
| 38 | ||||
| 50 | ||||
| 58 | ||||
| 84 | ||||
| Financial Statements | ||||
| 102 | ||||
| 112 | ||||
| 114 | ||||
| 116 | ||||
| 120 | ||||
| Report of Independent Registered Public Accounting Firm | 136 | |||
| Tax Information | 137 | |||
| Advisory and Administration Agreement Approval | 138 | |||
| Sub-Advisory Agreement Approval | 141 | |||
| Special Meeting of Shareholders — Voting Results | 143 | |||
| Additional Information | 151 | |||
| Investment Team | 155 | |||
This report has been prepared for shareholders and may be distributed to others only if accompanied with a current prospectus and/or summary prospectus.
Table of Contents
GE Institutional Funds
Notes to Performance — September 30, 2016 (Unaudited)
The information provided on the following performance pages relates to the GE Institutional Funds (the “Trust”) and each of its series portfolios (each, a Fund and collectively, the “Funds”).
Total returns take into account changes in share price and assume reinvestment of dividends and capital gains distributions, if any. Total returns shown are net of Fund expenses.
The performance data quoted represents past performance; past performance does not guarantee future results. Investment return and principal value will fluctuate. Accordingly, your shares, when redeemed, may be worth more or less than their original cost. Current performance may be higher or lower than the performance data quoted. Periods less than one year are not annualized. Please call toll-free (800) 242-0134 or visit the Funds’ website at http://www.geam.com for the most recent month-end performance data.
An investment in a Fund is not a deposit of any bank and is not insured or guaranteed by the Federal Deposit Insurance Corporation (“FDIC”) or any other government agency. An investment in a Fund is subject to risk, including possible loss of principal invested.
The S&P 500® Composite Price Index of stocks (“S&P 500 Index”) is an unmanaged market capitalization-weighted index of stocks of 500 large U.S. companies, which is widely used as a measure of large-cap U.S. stock market performance.
The Russell 1000® Growth Index measures the performance of the large-cap growth segment of the U.S. equity universe. It includes companies in the Russell 1000® Index with higher price-to-book ratios and higher forecasted growth values. It is a subset of the Russell 3000® Index and includes approximately 1,000 of the largest securities based on a combination of their market cap and current index membership.
The Russell 2000® Index is a market capitalization-weighted index consisting of 2,000 of the smallest U.S.-domiciled publicly traded common stocks that are included in the Russell 3000® Index. The Russell 3000® Index is comprised of the 3,000 largest U.S.-domiciled companies.
The Morgan Stanley Capital International Europe, Australasia, and Far East Index (“MSCI® EAFE® Index”) is a market capitalization-weighted index of equity securities of companies domiciled in various countries. The MSCI® EAFE® Index is designed to represent the performance of developed stock markets outside the U.S. and Canada and excludes certain market segments unavailable to U.S. based investors.
The Morgan Stanley Capital International All Country World Index Ex-U.S. (“MSCI® ACWI Ex-U.S. Index”) is a market capitalization-weighted index designed to provide a broad measure of stock performance throughout the world, with the exception of U.S.-based companies. The MSCI® ACWI Ex-U.S. Index includes both developed and emerging markets.
The Barclays U.S. Aggregate Bond Index is an unmanaged market value-weighted index of taxable investment grade debt issues, including government, corporate, asset-backed and mortgage-backed securities, with maturities of one year or more. The Barclays U.S. Aggregate Bond Index is designed to represent performance of the U.S. investment-grade fixed rate bond market.
The results shown for the foregoing indices assume the reinvestment of net dividends or interest and do not reflect fees, expenses, or taxes. As such, index returns do not reflect the actual cost of investing in the instruments that comprise an index.
The peer universe of the underlying open end funds used for the peer group average annual total return calculation is based on a blend of Morningstar peer categories, as shown. Morningstar is an independent mutual fund rating service. A Fund’s performance may be compared to or ranked within a universe of mutual funds with investment objectives and policies similar but not necessarily identical to that of the Fund.
©2016 Morningstar, Inc. All Rights Reserved. The Morningstar information contained herein: (1) is proprietary to Morningstar and/or its content providers; (2) may not be copied or distributed; and (3) is not warranted to be accurate, complete or timely. Neither Morningstar nor its content providers are responsible for any damage or losses relating from any use of this information. Past performance does not guarantee future results.
The S&P 500 Index Fund is not sponsored, endorsed, sold or promoted by S&P Global Ratings (“S&P”), and S&P makes no representation or warranty, express or implied, to the investors of the Fund or any member of the public regarding the advisability of investing in the securities generally or in this Fund particularly or the ability of the S&P 500 Index Fund to track general stock market performance.
Russell Investment Group owns the Russell Index data, including all applicable trademarks and copyrights, used by SSGA Funds Management, Inc. (“SSGA FM”) in these materials. Any unauthorized use or redistribution of such Russell Index data is strictly prohibited. Russell Investment Group is not responsible for the configuration of this material or for any inaccuracy in SSGA FM’s presentation thereof.
| Notes to Performance | 1 |
Table of Contents
GE Institutional Funds
Notes to Performance, continued — September 30, 2016 (Unaudited)
The views, expressed in this document, reflect our judgment as of the publication date and are subject to change at any time without notice.
State Street Global Markets, LLC, member of FINRA & SIPC is the principal underwriter and distributor of the GE Institutional Funds and a wholly owned subsidiary of State Street Corporation. References to State Street may include State Street Corporation and its affiliates. The Funds pay State Street Bank and Trust Company for its services as custodian and Fund Accounting agent, and pay SSGA Funds Management, Inc. for investment advisory and administrative services.
| 2 | Notes to Performance |
Table of Contents
Portfolio Management Discussion and Analysis — September 30, 2016 (Unaudited)
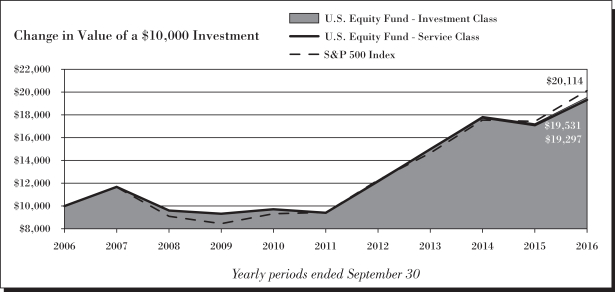
| Q. | How did the GE Institutional U.S. Equity Fund perform compared to its benchmark and Morningstar peer group for the twelve-month period ended September 30, 2016? |
| A. | For the twelve-month period ended September 30, 2016, the GE Institutional U.S. Equity Fund returned 13.29% for the Investment Class shares and 12.96% for the Service Class shares. The Fund’s benchmark, the S&P 500 Index returned 15.43% and the Fund’s Morningstar peer group of 1,576 US Large Blend funds returned an average of 11.76% over the same period. |
| Q. | What market conditions impacted the Fund’s performance? |
| A. | It was a volatile year for U.S. stocks. However, the market climbed a wall of worry and turned in solid double-digit gains in the last 12 months. Markets rebounded from serial concerns ranging from China’s currency devaluation at the beginning of the period, to global slowdown and recession fears in early 2016, to Britain’s astonishing referendum vote to leave the European Union in late June. Despite these uncertainties, U.S. stocks ended the year near all-time highs. |
| Plunging worldwide interest rates motivated equity investors to reach for yield, causing defensive telecomm, utilities and staples to outperform (and become richly valued, in our view). Commodity prices were stronger this year helping the materials and energy sectors to outperform. Also strong were the cyclical industrials and information technology sectors. Rallies in semiconductors, internet and software companies underpinned strength in technology stocks. |
| Only three sectors underperformed the S&P 500 broad market return: financials, consumer discretionary and health care. Careful stock selection was warranted in financials, as persistent low rates pressured interest-rate sensitive banks and insurance companies. Consumer discretionary — last year’s top-performing sector — took a breather as investors fretted growth. Health care stocks fell under pressure, caught in a stream of negative election year rhetoric around drug pricing. |
| Q. | What were the drivers behind Fund performance? |
| A. | The Fund outperformed the average Morningstar US Large Blend manager, yet failed to keep pace with the S&P 500 Index in a volatile and challenging investment environment. The Fund’s performance in the second half of the year was driven by a momentum reversal away from defensive yield sectors, favoring more cyclical sectors of the market. Given an outlook for continued slow economic growth, the Fund was underweight the defensive telecommunications, utilities and consumer staples sectors during the year — hurting annual relative performance but helping in recent months. In fact, portfolio positioning was the key negative performance driver in an environment that was largely macro-driven this year. |
| In the last 12 months, financials weighed on returns, due to underperformance in rate-sensitive insurance companies, banks and asset managers. We reduced financials exposure during the period to reflect the Federal Reserve’s pushed-out path to interest rate normalization. Underweighting the most defensive staples companies hurt, despite relative strength in one of our high-quality beverage company holdings. The Fund also failed to capture all of the upside in the commodity sectors, given an underweight in materials and underperformance among some of the Fund’s oil exploration and production holdings in energy. Finally, one of the Fund’s health care holdings was involved in a large M&A transaction that did not materialize, negatively impacting returns. We maintained conviction in this holding’s prospects as a standalone specialty pharma company. In general, we find health care’s growth rates and valuations attractive, and believe the uncertainty overhang should begin to resolve post November 2016’s presidential election. |
| On the other hand, strong stock selection in consumer discretionary and information technology (“IT”) sectors bolstered returns. Among consumer cyclicals, several of the Fund’s U.S. media holdings demonstrated strong results, seemingly immune to economic growth fears. In addition, a new position in a home furnishings company demonstrated accretion from a recent merger, and a Macao-based casino company rebounded along with the Chinese gaming market. In IT, our communications equipment, semiconductor and IT services holdings outperformed. Finally, the Fund benefited from strong stock selection in Real Estate Investment Trusts (“REITs”), a classic yield sector (our REIT holdings generally offer stable earnings growth and aren’t held solely for dividend income). |
| The Fund does not invest in derivatives securities as part of its strategy, but may hold futures contracts or ETFs to equitize cash flows in advance of investment. The effect of derivatives on performance was de minimis for the year. |
| U.S. Equity Fund | 3 |
Table of Contents
U.S. Equity Fund
Portfolio Management Discussion and Analysis, continued — September 30, 2016 (Unaudited)
| Q. | Were there any significant changes in the Fund during the period? |
| A. | There were no changes during the period in the portfolio management team or their approach to investing. Health care and financials remained key sector overweights, but we reduced our financials exposure somewhat as the Federal Reserve’s path of rate increases remained opaque. Modest positioning changes moderated the Fund’s cyclical tilt as we reach later innings of the business cycle. As such, the Fund also reduced its IT and materials exposures, and increased its consumer staples exposure, although still underweight at year-end. We are comfortable with our moderate pro-cyclical positioning as we think this business cycle may even reach extra innings due to the slow growth of this recovery. |
| 4 | U.S. Equity Fund |
Table of Contents
U.S. Equity Fund
Performance Summary — September 30, 2016 (Unaudited)

| U.S. Equity Fund | 5 |
Table of Contents
U.S. Equity Fund
Performance Summary, continued — September 30, 2016 (Unaudited)
| (a) | Fair Value basis is inclusive of short-term investment in State Street Institutional U.S. Government Money Market Fund Class G Shares. |
| (b) | The securities information regarding holdings, allocations and other characteristics is presented to illustrate examples of securities that the Fund has bought and the diversity of areas in which the Fund may invest as of a particular date. It may not be representative of the Fund’s current or future investments and should not be construed as a recommendation to purchase or sell a particular security. |
See Notes to Performance beginning on page 1 for further information, including an explanation of Morningstar peer categories.
Past performance does not predict future performance. The performance shown in the graphs and tables does not reflect the deduction of taxes that a shareholder would pay on Fund distributions or the redemption of Fund shares.
| 6 | U.S. Equity Fund |
Table of Contents
U.S. Equity Fund
Understanding Your Fund’s Expenses — September 30, 2016 (Unaudited)
| U.S. Equity Fund | 7 |
Table of Contents
U.S. Equity Fund
Schedule of Investments — September 30, 2016
See accompanying notes to financial statements.
| 8 | U.S. Equity Fund |
Table of Contents
U.S. Equity Fund
Schedule of Investments, continued — September 30, 2016
See accompanying notes to financial statements.
| U.S. Equity Fund | 9 |
Table of Contents
U.S. Equity Fund
Schedule of Investments, continued — September 30, 2016
Other Information:
The Fund had the following long futures contracts open at September 30, 2016:
| Description | Expiration date |
Number of Contracts |
Current Notional Value |
Unrealized Depreciation |
||||||||||||
| S&P 500 Emini Index Futures |
December 2016 | 115 | $ | 12,422,300 | $ | (904 | ) | |||||||||
|
|
|
|||||||||||||||
Affiliate Table
| Number of Shares Held at 9/30/15 |
Value At 9/30/15 |
Shares Purchased |
Shares Sold |
Number of Shares Held at 9/30/16 |
Value at 9/30/16 |
Dividend/ Interest Income |
Realized Gain (Loss) |
|||||||||||||||||||||||||
| Financial Select Sector SPDR Fund |
72,629 | $ | 1,645,773 | 7,141 | 79,770 | — | $ | — | $ | 21,277 | $ | 560,910 | ||||||||||||||||||||
| Industrial Select Sector SPDR Fund |
131,838 | 6,577,398 | 39,270 | 171,108 | — | — | 130,507 | 2,393,943 | ||||||||||||||||||||||||
| State Street Institutional U.S. Government Money Market Fund - Class G Shares |
17,993,117 | 17,993,117 | 137,929,254 | 147,563,953 | 8,358,418 | 8,358,418 | 35,779 | — | ||||||||||||||||||||||||
|
|
|
|
|
|
|
|||||||||||||||||||||||||||
| $ | 8,358,418 | $ | 187,563 | $ | 2,954,853 | |||||||||||||||||||||||||||
|
|
|
|
|
|
|
|||||||||||||||||||||||||||
See accompanying notes to financial statements.
| 10 | U.S. Equity Fund |
Table of Contents
Portfolio Management Discussion and Analysis — September 30, 2016 (Unaudited)
| Q. | How did the GE Institutional S&P 500 Index Fund perform compared to its benchmark and Morningstar peer group for the twelve-month period ended September 30, 2016? |
| A. | For the twelve-month period ended September 30, 2016, the GE Institutional S&P 500 Index Fund returned 15.21% for the Investment Class shares and 14.90% for the Service Class shares. The Fund’s benchmark, the S&P 500 Index returned 15.43% and the Fund’s Morningstar peer group of 1,576 U.S. Large Blend funds returned an average of 11.76% over the same period. |
| Q. | What market conditions impacted the Fund’s performance? |
| A. | Overcoming the uncertainty prevailing at the end of 2015 and beginning of 2016 markets gained momentum and finished a 12-month period strongly with double-digit positive return. In contrast to August of 2015, when global equity markets witnessed their most volatile month since 2011, fast forward one year later and markets demonstrated an air of complacency in August 2016. In fact, the S&P 500 Index did not experience a daily price move of greater than 1%, up or down, between July 8th and September 8th. Using 30 day realized volatility as a measure, it was chronicled by the Wall Street Journal on August 23rd that the 30 preceding trading days had been the least volatile for the S&P 500 in over two decades. It was perhaps no coincidence that the relative stability markets exhibited in August occurred during a month in which the central banking calendar was relatively light. Attention around the Federal Reserve (“Fed”) in August focused on whether or not U.S. monetary policy would be tightened at some point in 2016, and by the end of the month a tightening as soon as September seemed a real possibility. Strong economic data including a second month of better than expected payroll gains paired with ever more confident pronouncements from Fed officials that the time for tightening could be gradually high nudged expectations for more imminent Fed action higher through August. |
| Q. | What were the drivers behind Fund performance? |
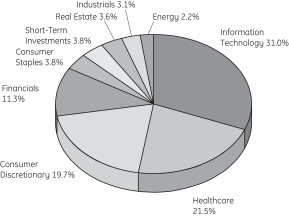
| A. | Information Technology, Industrials and Consumer Staples were the strongest contributing sectors to S&P 500 performance. Real Estate, Financials, and Utilities were to weakest contributors to the performance. Amazon, Microsoft and Facebook were the strongest contributors to the Fund’s performance. Wells Fargo, Gilead and Allergan were the weakest contributors to the performance. |
| S&P 500 Index Fund | 11 |
Table of Contents
S&P 500 Index Fund
Performance Summary — September 30, 2016 (Unaudited)
| 12 | S&P 500 Index Fund |
Table of Contents
S&P 500 Index Fund
Performance Summary, continued — September 30, 2016 (Unaudited)

| (a) | Fair Value basis is inclusive of short-term investment in State Street Institutional U.S. Government Money Market Fund Class G Shares. |
| (b) | The securities information regarding holdings, allocations and other characteristics is presented to illustrate examples of securities that the Fund has bought and the diversity of areas in which the Fund may invest as of a particular date. It may not be representative of the Fund’s current or future investments and should not be construed as a recommendation to purchase or sell a particular security. |
See Notes to Performance beginning on page 1 for further information, including an explanation of Morningstar peer categories.
Past performance does not predict future performance. The performance shown in the graphs and tables does not reflect the deduction of taxes that a shareholder would pay on Fund distributions or the redemption of Fund shares.
| S&P 500 Index Fund | 13 |
Table of Contents
S&P 500 Index Fund
Understanding Your Fund’s Expenses — September 30, 2016 (Unaudited)
| 14 | S&P 500 Index Fund |
Table of Contents
S&P 500 Index Fund
Schedule of Investments — September 30, 2016
See accompanying notes to financial statements.
| S&P 500 Index Fund | 15 |
Table of Contents
S&P 500 Index Fund
Schedule of Investments, continued — September 30, 2016
See accompanying notes to financial statements.
| 16 | S&P 500 Index Fund |
Table of Contents
S&P 500 Index Fund
Schedule of Investments, continued — September 30, 2016
See accompanying notes to financial statements.
| S&P 500 Index Fund | 17 |
Table of Contents
S&P 500 Index Fund
Schedule of Investments, continued — September 30, 2016
See accompanying notes to financial statements.
| 18 | S&P 500 Index Fund |
Table of Contents
S&P 500 Index Fund
Schedule of Investments, continued — September 30, 2016
See accompanying notes to financial statements.
| S&P 500 Index Fund | 19 |
Table of Contents
S&P 500 Index Fund
Schedule of Investments, continued — September 30, 2016
See accompanying notes to financial statements.
| 20 | S&P 500 Index Fund |
Table of Contents
S&P 500 Index Fund
Schedule of Investments, continued — September 30, 2016
See accompanying notes to financial statements.
| S&P 500 Index Fund | 21 |
Table of Contents
S&P 500 Index Fund
Schedule of Investments, continued — September 30, 2016
See accompanying notes to financial statements.
| 22 | S&P 500 Index Fund |
Table of Contents
S&P 500 Index Fund
Schedule of Investments, continued — September 30, 2016
Other Information:
The Fund had the following long futures contracts open at September 30, 2016:
| Description | Expiration date |
Number of Contracts |
Current Notional Value |
Unrealized Appreciation |
||||||||||||
| S&P 500 Emini Index Futures |
December 2016 | 7 | $ | 756,140 | $ | 4,441 | ||||||||||
|
|
|
|||||||||||||||
Affiliate Table
| Number of Shares Held at 9/30/15 |
Value At 9/30/15 |
Shares Purchased |
Shares Sold |
Number of Shares Held at 9/30/16 |
Value at 9/30/16 |
Dividend/ Interest Income |
Realized Gain (Loss) |
|||||||||||||||||||||||
| General Electric Co.* |
15,333 | $ | 386,698 | 1,497 | 9,438 | 7,392 | $ | 218,951 | $ | 8,882 | $ | 99,102 | ||||||||||||||||||
| State Street Corp. |
637 | 42,813 | 29 | 364 | 302 | 21,028 | 562 | 7,711 | ||||||||||||||||||||||
| State Street Institutional U.S. Government Money Market Fund - Class G Shares |
1,221,898 | 1,221,898 | 6,017,076 | 6,537,519 | 701,455 | 701,455 | 1,406 | — | ||||||||||||||||||||||
|
|
|
|
|
|
|
|||||||||||||||||||||||||
| $ | 941,434 | $ | 10,850 | $ | 106,813 | |||||||||||||||||||||||||
|
|
|
|
|
|
|
|||||||||||||||||||||||||
| * | Non-affiliated investment as of September 30, 2016. |
See accompanying notes to financial statements.
| S&P 500 Index Fund | 23 |
Table of Contents
U.S. Large-Cap Core Equity Fund
Portfolio Management Discussion and Analysis — September 30, 2016 (Unaudited)
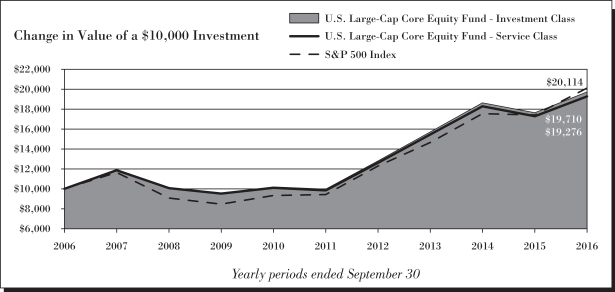
| Q. | How did the GE Institutional U.S. Large-Cap Core Equity Fund perform compared to its benchmark and Morningstar peer group for the twelve-month period ended September 30, 2016? |
| A. | For the twelve-month period ended September 30, 2016, the GE Institutional U.S. Large-Cap Core Equity Fund returned 11.67% for the Investment Class shares and 11.58% for the Service Class shares. The Fund’s benchmark, the S&P 500 Index returned 15.43% and the Fund’s Morningstar peer group of 1,576 U.S. Large Blend funds returned an average of 11.76% over the same period. |
| Q. | What market conditions impacted the Fund’s performance? |
| A. | It was a volatile year for U.S. stocks. However, the market climbed a wall of worry and turned in solid double-digit gains in the last 12 months. Markets rebounded from serial concerns ranging from China’s currency devaluation at the beginning of the period, to global slowdown and recession fears in early 2016, to Britain’s astonishing referendum vote to leave the European Union in late June. Despite these uncertainties, U.S. stocks ended the year near all-time highs. |
| Plunging worldwide interest rates motivated equity investors to reach for yield, causing defensive telecomm, utilities and staples to outperform (and become richly valued, in our view). Commodity prices were stronger this year helping the materials and energy sectors to outperform. Also strong were the cyclical industrials and information technology sectors. Rallies in semiconductors, internet and software companies underpinned strength in technology stocks. |
| Only three sectors underperformed the S&P 500 broad market return: financials, consumer discretionary and health care. Sector performance in financials was dampened by poor performance of rate-sensitive banks and life insurance companies. Consumer discretionary — last year’s top-performing sector — took a breather as investors fretted a slowdown in consumer spending and disruption of traditional media. Health care stocks were pressured by negative election year rhetoric around drug pricing. |
| Q. | What were the drivers behind Fund performance? |
| A. | The Fund performed approximately in-line with Morningstar’s average U.S. Large Blend manager in a challenging investment environment, underperforming the S&P 500 Index. Given our relative value approach, the portfolio was underweight defensive sectors that rallied (e.g., telecommunications, utilities and consumer staples). Financials weighed on returns, led by rate-sensitive insurance companies and banks, and asset managers that lagged. We reduced financials exposure during the period to reflect the Federal Reserve’s pushed-out path to interest rate normalization. Within consumer discretionary and information technology, not owning expensive growth-oriented Internet companies hurt relative performance. The Fund also failed to capture all of the upside in the commodity sectors, given an underweight in materials and underperformance among some of the Fund’s oil exploration and production holdings in energy. |
| Strong stock selection in health care offered a bright spot, helping performance. The Fund emphasized health care device companies that seemed to stay out of the cross hairs of negative drug pricing rhetoric. The Fund’s pharmaceutical holdings outperformed, not only in the reach for dividend yield but due to strong pipelines and fundamentals in many cases. Finally, the Fund benefited from strong stock selection in REITs, another yield sector. |
| The Fund does not invest in derivatives securities as part of its strategy, but may hold futures contracts or ETFs to equitize cash flows in advance of investment. The effect of derivatives on performance was de minimis for the year. |
| Q. | Were there any significant changes in the Fund during the period? |
| A. | There were no changes during the period in the portfolio management team or the team’s approach to investing. Health care has remained a key sector overweight. However, the Fund significantly reduced its industrials exposure during the year, taking profits as the global growth outlook faded on the margin. We initiated an overweight in utilities. The Fund also increased its exposure to energy and materials, reflecting our outlook for better fundamentals and commodity prices. Finally, the Fund increased its underweights in consumer staples and telecommunications, reflecting the lack of relative value in those sectors. |
| 24 | U.S. Large-Cap Core Equity Fund |
Table of Contents
U.S. Large-Cap Core Equity Fund
Performance Summary — September 30, 2016 (Unaudited)
| U.S. Large-Cap Core Equity Fund | 25 |
Table of Contents
U.S. Large-Cap Core Equity Fund
Performance Summary, continued — September 30, 2016 (Unaudited)
| (a) | Fair Value basis is inclusive of short-term investment in State Street Institutional U.S. Government Money Market Fund Class G Shares. |
| (b) | The securities information regarding holdings, allocations and other characteristics is presented to illustrate examples of securities that the Fund has bought and the diversity of areas in which the Fund may invest as of a particular date. It may not be representative of the Fund’s current or future investments and should not be construed as a recommendation to purchase or sell a particular security. |
See Notes to Performance beginning on page 1 for further information, including an explanation of Morningstar peer categories.
Past performance does not predict future performance. The performance shown in the graphs and tables does not reflect the deduction of taxes that a shareholder would pay on Fund distributions or the redemption of Fund shares.
| 26 | U.S. Large-Cap Core Equity Fund |
Table of Contents
U.S. Large-Cap Core Equity Fund
Understanding Your Fund’s Expenses — September 30, 2016 (Unaudited)
| U.S. Large-Cap Core Equity Fund | 27 |
Table of Contents
U.S. Large-Cap Core Equity Fund
Schedule of Investments — September 30, 2016
See accompanying notes to financial statements.
| 28 | U.S. Large-Cap Core Equity Fund |
Table of Contents
U.S. Large-Cap Core Equity Fund
Schedule of Investments, continued — September 30, 2016
Other Information:
The Fund had the following long futures contracts open at September 30, 2016:
| Description | Expiration date |
Number of Contracts |
Current Notional Value |
Unrealized Appreciation |
||||||||||||
| S&P 500 Emini Index Futures |
December 2016 | 2 | $ | 216,040 | $ | 854 | ||||||||||
|
|
|
|||||||||||||||
See accompanying notes to financial statements.
| U.S. Large-Cap Core Equity Fund | 29 |
Table of Contents
U.S. Large-Cap Core Equity Fund
Schedule of Investments, continued — September 30, 2016
Affiliate Table
| Number of Shares Held at 9/30/15 |
Value At 9/30/15 |
Shares Purchased |
Shares Sold |
Number of Shares Held at 9/30/16 |
Value at 9/30/16 |
Dividend/ Interest Income |
Realized Gain (Loss) |
|||||||||||||||||||||||||
| Financial Select Sector SPDR Fund |
7,859 | $ | 178,085 | 1,188 | 9,047 | — | $ | — | $ | 2,283 | $ | 82,314 | ||||||||||||||||||||
| Industrial Select Sector SPDR Fund |
14,295 | 713,178 | 5,057 | 19,352 | — | — | 13,753 | 253,911 | ||||||||||||||||||||||||
| State Street Institutional U.S. Government Money Market Fund - Class G Shares |
326,019 | 326,019 | 23,327,445 | 22,224,885 | 1,428,579 | 1,428,579 | 4,192 | — | ||||||||||||||||||||||||
|
|
|
|
|
|
|
|||||||||||||||||||||||||||
| $ | 1,428,579 | $ | 20,228 | $ | 336,225 | |||||||||||||||||||||||||||
|
|
|
|
|
|
|
|||||||||||||||||||||||||||
See accompanying notes to financial statements.
| 30 | U.S. Large-Cap Core Equity Fund |
Table of Contents
Portfolio Management Discussion and Analysis — September 30, 2016 (Unaudited)
| Q. | How did the GE Institutional Premier Growth Equity Fund perform compared to its benchmarks and Morningstar peer group for the twelve-month period ended September 30, 2016? |
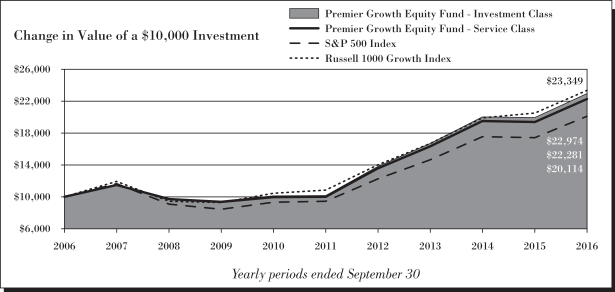
| A. | For the twelve-month period ended September 30, 2016, the GE Institutional Premier Growth Equity Fund returned 15.25% for the Investment Class shares and 14.99% for the Service Class shares. The Fund’s benchmarks, the S&P 500 Index and the Russell 1000 Growth Index returned 15.43% and 13.76%, respectively, and the Fund’s Morningstar peer group of 1,677 US Large Growth funds returned an average of 10.50% over the same period. |
| Q. | What market conditions impacted the Fund’s performance? |
| A. | It was a volatile year for U.S. stocks. However, the market climbed a wall of worry and turned in solid double-digit gains in the last 12 months. Markets rebounded from serial concerns ranging from China’s currency devaluation at the beginning of the period, to global slowdown and recession fears in early 2016, to Britain’s astonishing referendum vote to leave the European Union in late June. Despite these uncertainties, U.S. stocks ended the year near all-time highs. |
| Plunging worldwide interest rates motivated equity investors to reach for yield, causing defensive telecomm, utilities and staples to outperform (and become richly valued, in our view). Commodity prices were stronger this year helping the materials and energy sectors to outperform. Also strong were the cyclical industrials and information technology sectors. Rallies in semiconductors, internet and software companies underpinned strength in technology stocks. |
| Only three sectors underperformed the S&P 500 broad market return: financials, consumer discretionary and health care. Careful stock selection was warranted in financials, as persistent low rates pressured interest-rate sensitive banks and insurance companies. Consumer discretionary — last year’s top-performing sector — took a breather as investors fretted growth. Health care stocks fell under pressure, caught in a stream of negative election year rhetoric around drug pricing. As yield sectors led and commodity oriented sectors recovered, the large cap value style of investing outperformed large cap growth. |
| Q. | What were the drivers behind Fund performance? |
| A. | The Fund outperformed the Russell 1000 Growth Benchmark due to broad-based stock selection strength across the entire portfolio. Due to growth style headwinds, it slightly lagged the S&P 500 Index, net of fees. Consumer discretionary stock selection was a key positive performance driver, even as momentum reversed for the consumer cyclicals. The leading Internet retailer defied gravity as it took share from traditional retailers and asserted its leadership position in cloud computing services. In addition, a Macao-based casino company rebounded along with the Chinese gaming market and we eliminated the positon on strength. Several of the Fund’s U.S. media holdings demonstrated strong results, seemingly immune to economic growth fears. |
| Within financials, we avoided banks and insurance companies most leveraged to margin pressure from the low rate environment. Instead we held certain capital markets companies and diversified financials which discounted the potential for future rate increases early. On the other side of the financials barbell, the Fund’s sole Real Estate Investment Trust (“REIT”) holding also contributed to returns as the outlook for a Fed Funds rate increase got pushed out. In the information technology (“IT”) sector, the Fund benefited from strength among its communications equipment, internet and services holdings. |
| The Fund’s health care holdings trimmed relative performance as rhetoric around drug pricing intensified. One of our health care names was involved in a large M&A transaction that did not materialize, negatively impacting returns. We maintain conviction in this company’s ability to grow well on its own. We find health care’s superior growth rates and attractive valuations compelling, and believe the uncertainty overhang should begin to resolve post November 2016’s presidential election. |
| The Fund’s underweight positioning in defensive yield sectors modestly trimmed relative performance amid the year’s uncertainties. We do not see the combination of steady, visible double-digit earnings growth among the staples, telecomm and utilities sectors. Trading at rich multiples, these slower-growth areas of the market are unattractive at this point in the cycle. |
| The Fund does not invest in derivatives securities as part of its strategy, buy may hold futures contracts or ETFs to equitize cash flows in advance of investment. The effect of derivatives on performance was de minimis for the year. |
| Premier Growth Equity Fund | 31 |
Table of Contents
Premier Growth Equity Fund
Portfolio Management Discussion and Analysis, continued — September 30, 2016 (Unaudited)
| Q. | Were there any significant changes in the Fund during the period? |
| A. | There were no changes during the period in the portfolio management team or its approach to investing. Turnover remained relatively low in keeping with our long-term investment horizon, but did result in some changes in positioning. Among sectors, IT was the largest absolute weighting as the sector where we find many of the innovative, growth companies at reasonable valuations that we favor. We have modestly trimmed our exposure to IT in the past year. We also modestly reduced our financials exposure, and increased our overweight in health care. We eliminated our sole materials holding, increasing the Fund’s underweight in this commodity oriented sector. Consumer staples has been a consistent sector underweight, but that underweight was reduced somewhat over the last year due to outperformance in our sole holding, a beverage company. |
| 32 | Premier Growth Equity Fund |
Table of Contents
Premier Growth Equity Fund
Performance Summary — September 30, 2016 (Unaudited)
| Premier Growth Equity Fund | 33 |
Table of Contents
Premier Growth Equity Fund
Performance Summary, continued — September 30, 2016 (Unaudited)
| (a) | Fair Value basis is inclusive of short-term investment in State Street Institutional U.S. Government Money Market Fund Class G Shares. |
| (b) | The securities information regarding holdings, allocations and other characteristics is presented to illustrate examples of securities that the Fund has bought and the diversity of areas in which the Fund may invest as of a particular date. It may not be representative of the Fund’s current or future investments and should not be construed as a recommendation to purchase or sell a particular security. |
See Notes to Performance beginning on page 1 for further information, including an explanation of Morningstar peer categories.
Past performance does not predict future performance. The performance shown in the graphs and tables does not reflect the deduction of taxes that a shareholder would pay on Fund distributions or the redemption of Fund shares.
| 34 | Premier Growth Equity Fund |
Table of Contents
Premier Growth Equity Fund
Understanding Your Fund’s Expenses — September 30, 2016 (Unaudited)
| Premier Growth Equity Fund | 35 |
Table of Contents
Premier Growth Equity Fund
Schedule of Investments — September 30, 2016
See accompanying notes to financial statements.
| 36 | Premier Growth Equity Fund |
Table of Contents
Premier Growth Equity Fund
Schedule of Investments, continued — September 30, 2016
Other Information:
The Fund had the following long futures contracts open at September 30, 2016:
| Description | Expiration date |
Number of Contracts |
Current Notional Value |
Unrealized Appreciation |
||||||||||||
| S&P 500 Emini Index Futures |
December 2016 | 30 | $ | 3,240,600 | $ | 22,586 | ||||||||||
|
|
|
|||||||||||||||
Affiliate Table
| Number of Shares Held at 9/30/15 |
Value At 9/30/15 |
Shares Purchased |
Shares Sold |
Number of Shares Held at 9/30/16 |
Value at 9/30/16 |
Dividend/ Interest Income |
Realized Gain (Loss) |
|||||||||||||||||||||||||
| State Street Institutional U.S. Government Money Market Fund - Class G Shares |
4,317,388 | $ | 4,317,388 | 93,824,923 | 85,297,584 | 12,844,727 | $ | 12,844,727 | $ | 19,746 | $ | — | ||||||||||||||||||||
|
|
|
|
|
|
|
|||||||||||||||||||||||||||
| $ | 12,844,727 | $ | 19,746 | $ | — | |||||||||||||||||||||||||||
|
|
|
|
|
|
|
|||||||||||||||||||||||||||
See accompanying notes to financial statements.
| Premier Growth Equity Fund | 37 |
Table of Contents
Portfolio Management Discussion and Analysis — September 30, 2016 (Unaudited)
| Q. | How did the GE Institutional Small-Cap Equity Fund perform compared to its benchmark and Morningstar peer group for the twelve-month period ended September 30, 2016? |
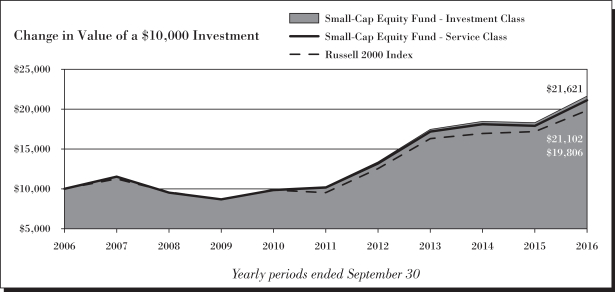
| A. | For the twelve-month period ended September 30, 2016, the GE Institutional Small-Cap Equity Fund returned 18.24% for the Investment Class shares and 17.96% for the Service Class shares. The Fund’s benchmark, the Russell 2000 Index returned 15.47% and the Fund’s Morningstar peer group of 857 US Small Blend funds returned an average of 13.08% over the same period. |
| Q. | What market conditions impacted the Fund’s performance? |
| A. | A strong rally in U.S. small cap equities helped propel the Fund throughout the 12 month period. Value and quality were rewarded earlier on in the year in a substantial way, which helped drive the returns of the Fund above the index especially in the industrials, healthcare, and technology sectors where the portfolio managers’ price discipline and preference for strong balance sheets led to excess returns. |
| Q. | What were the drivers behind Fund performance? |
| A. | Performance was driven largely by security selection. While each manager has their own unique style of investing, most of those were rewarded over the period. The Fund remained significantly underweight financials, which ended up being a mild additive as one of the more volatile components of the index (mortgage REITS) were not held in the portfolio. While approximately 1% of the Fund’s assets were invested in derivatives to equitize cash, they replicate the index performance and did not materially add or detract from performance. |
| Q. | Were there any significant changes in the Fund during the period? |
| A. | While, managers were rebalanced up and down towards the strategic weights in the fund, no significant changes were made to the overall Fund. |
| 38 | Small-Cap Equity Fund |
Table of Contents
Small-Cap Equity Fund
Performance Summary — September 30, 2016 (Unaudited)

| Small-Cap Equity Fund | 39 |
Table of Contents
Small-Cap Equity Fund
Performance Summary, continued — September 30, 2016 (Unaudited)
| (a) | Fair Value basis is inclusive of short-term investment in State Street Institutional U.S. Government Money Market Fund Class G Shares. |
| (b) | The securities information regarding holdings, allocations and other characteristics is presented to illustrate examples of securities that the Fund has bought and the diversity of areas in which the Fund may invest as of a particular date. It may not be representative of the Fund’s current or future investments and should not be construed as a recommendation to purchase or sell a particular security. |
See Notes to Performance beginning on page 1 for further information, including an explanation of Morningstar peer categories.
Past performance does not predict future performance. The performance shown in the graphs and tables does not reflect the deduction of taxes that a shareholder would pay on Fund distributions or the redemption of Fund shares.
| 40 | Small-Cap Equity Fund |
Table of Contents
Small-Cap Equity Fund
Understanding Your Fund’s Expenses — September 30, 2016 (Unaudited)
| Small-Cap Equity Fund | 41 |
Table of Contents
Small-Cap Equity Fund
Schedule of Investments — September 30, 2016
See accompanying notes to financial statements.
| 42 | Small-Cap Equity Fund |
Table of Contents
Small-Cap Equity Fund
Schedule of Investments, continued — September 30, 2016
See accompanying notes to financial statements.
| Small-Cap Equity Fund | 43 |
Table of Contents
Small-Cap Equity Fund
Schedule of Investments, continued — September 30, 2016
See accompanying notes to financial statements.
| 44 | Small-Cap Equity Fund |
Table of Contents
Small-Cap Equity Fund
Schedule of Investments, continued — September 30, 2016
See accompanying notes to financial statements.
| Small-Cap Equity Fund | 45 |
Table of Contents
Small-Cap Equity Fund
Schedule of Investments, continued — September 30, 2016
See accompanying notes to financial statements.
| 46 | Small-Cap Equity Fund |
Table of Contents
Small-Cap Equity Fund
Schedule of Investments, continued — September 30, 2016
See accompanying notes to financial statements.
| Small-Cap Equity Fund | 47 |
Table of Contents
Small-Cap Equity Fund
Schedule of Investments, continued — September 30, 2016
See accompanying notes to financial statements.
| 48 | Small-Cap Equity Fund |
Table of Contents
Small-Cap Equity Fund
Schedule of Investments, continued — September 30, 2016
Other Information:
The Fund had the following long futures contracts open at September 30, 2016:
| Description | Expiration date |
Number of Contracts |
Current Notional Value |
Unrealized Appreciation |
||||||||||||
| Russell 2000 Mini Index Futures |
December 2016 | 209 | $ | 26,089,470 | $ | 128,327 | ||||||||||
|
|
|
|||||||||||||||
Affiliate Table
| Number of Shares Held at 9/30/15 |
Value At 9/30/15 |
Shares Purchased |
Shares Sold |
Number of Shares Held at 9/30/16 |
Value at 9/30/16 |
Dividend/ Interest Income |
Realized Gain (Loss) |
|||||||||||||||||||||||||
| State Street Institutional U.S. Government Money Market Fund - Class G Shares |
68,607,689 | $ | 68,607,689 | 335,101,289 | 335,420,772 | 68,288,206 | $ | 68,288,206 | $ | 157,078 | $ | — | ||||||||||||||||||||
|
|
|
|
|
|
|
|||||||||||||||||||||||||||
| $ | 68,288,206 | $ | 157,078 | $ | — | |||||||||||||||||||||||||||
|
|
|
|
|
|
|
|||||||||||||||||||||||||||
See accompanying notes to financial statements.
| Small-Cap Equity Fund | 49 |
Table of Contents
Portfolio Management Discussion and Analysis — September 30, 2016 (Unaudited)
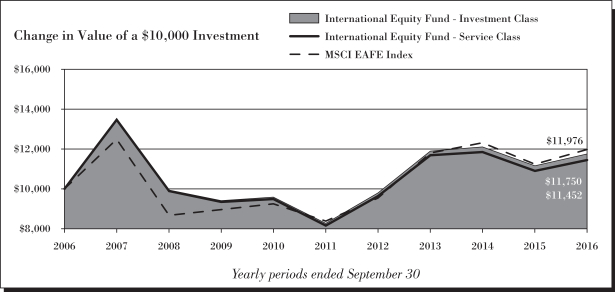
| Q. | How did the GE Institutional International Equity Fund perform compared to its benchmark and Morningstar peer group for the twelve-month period ended September 30, 2016? |
| A. | For the twelve-month period ended September 30, 2016, the GE Institutional International Equity Fund returned 5.32% for the Investment Class shares and 5.01% for the Service Class shares. The Fund’s benchmark, the MSCI® EAFE® Index returned 6.52% and the Fund’s Morningstar peer group of 879 Foreign Large Blend funds returned an average of 6.71% over the same period. |
| Q. | What market conditions impacted the Fund’s performance? |
| A. | The one-year period that ended September 30, 2016 began on a positive note with the market recovering from the late summer 2015 swoon that was brought about by fears of currency devaluation and an economic crash in China. As the situation stabilized and it appeared that China was not on the verge of collapse, the market surged last October. The good mood was not to last, however, and by late December, fear had returned to the market driven again by China worries as well as expectations of slower global growth. 2016 opened with one of the worst starts ever for equity markets. But in keeping with recent patterns, the weakness did not last. By the end of the quarter, the market had recovered most of what it had lost and was looking forward to its next source of turbulence: the U.K.’s coming referendum on European Union membership. By late June, when the Brexit vote took place, the market had enjoyed a few months of relative strength and most observers were expecting a close but nevertheless sensible vote to remain in the EU. The shock when the vote went the other way resulted in yet another swift market fall, followed, again, by a surprisingly quick recovery. By September of 2016, the MSCI® EAFE® Index was hitting its highs of the year, leading many to wonder if the market was being too complacent. |
| For the one-year period, the MSCI® EAFE® Index was up 6.5% in U.S. dollar terms. Earnings growth during this period was not strong causing the market P/E to rise from a slightly elevated 18.5 at the beginning of the year to an expensive 24.8 at the end. At this valuation, the question for investors is whether the market is being overly optimistic or is it correctly pricing in healthier future earnings growth. There are some signs of earnings improvement, with, for example, Europe recently seeing the first upgrades in over a year, but this trend will need to be sustained to justify current valuations. |
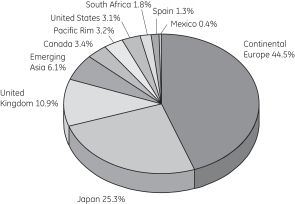
| Regionally, the Pacific Basin had the strongest return, up 20.0%, followed by Japan, +12.1%. Lagging on currency weakness was the U.K., up only 1.5% in U.S. dollars. |
| Commodity prices were stronger this year helping the materials and energy sectors to outperform. Also strong were the cyclical sectors of information technology (“IT”) and industrials. The weakest sectors were financials, where the profitability of banks came under increasing pressure due to persistent low interest rates, and healthcare. |
| Q. | What were the drivers behind Fund performance? |
| A. | The Fund underperformed its MSCI® EAFE® Index during the one-year period ended September 30, 2016. The biggest factor in this underperformance was the portfolio’s bank holdings. These included Japanese banks that were impacted by the Bank of Japan’s moves into negative interest rates, as well as European banks which were hit by economic weakness, low interest rates, and Brexit. As of September 30, 2016, we continued to hold most of these names based on their attractive valuations and potential upside from higher rates and improving economic growth. The Fund’s bank holdings as a group are relatively well-capitalized, have cut costs, have improving profitability, and are very cheap on a price to book basis. In the latest quarter, some of what we have been waiting for began to be seen as interest rates moved higher and economic growth expectations improved. This resulted in the banks industry generally and the Fund’s holdings even more so outperforming the market. |
| Another headwind experienced by the Fund during this period, was the outperformance of the defensive growth sector, consumer staples. Consumer staples names have surged this year with the popularity of low volatility and high yield factors. We consider many of these names to be overvalued relative to the growth that we expect them to deliver and have therefore mostly avoided them in the Fund. While this hurt the relative performance of the Fund over the past twelve months, we expect that over time the over-valuation in the sector is likely to correct. We saw some signs of this happening in the third quarter, when consumer staples was one of the worst performing sectors. |
| On the other side of the ledger, the Fund was helped by its holdings in and allocation to the information technology sector. IT is a place where we find many of the innovative, growing companies at reasonable valuations that we favor. Having an overweight to this sector helped relative performance, as IT in general outperformed the market, but it was the portfolio’s specific IT holdings that really added value, up more than 30% as a group. |
| 50 | International Equity Fund |
Table of Contents
International Equity Fund
Portfolio Management Discussion and Analysis, continued — September 30, 2016 (Unaudited)
| Derivatives did not have any material impact on Fund performance. |
| Q. | Were there any significant changes in the Fund during the period? |
| A. | There were no changes during the period in the portfolio management team or their approach to investing. Turnover remained relatively low in keeping with our long-term investment horizon, but did result in some changes in positioning. Regionally, the Fund’s weight in emerging market countries increased as a result of both outperformance and trading. The Fund’s overweight in Japan decreased somewhat but remained positive, a benefit to the Fund as that market is on pace for a fourth year in a row of outperformance versus the MSCI® EAFE® Index (measured in U.S. dollars). The Fund’s underweight in the Pacific region outside of Japan and in the U.K. both became larger over the past year. |
| Among sectors, IT was the largest overweight and that overweight has grown over the last year. Financials has gone from a small overweight to a moderate underweight, due in large part to recent reductions in Japanese banks. Consumer staples has been a consistent underweight, but that underweight was reduced somewhat over the last year. |
| International Equity Fund | 51 |
Table of Contents
International Equity Fund
Performance Summary — September 30, 2016 (Unaudited)
| 52 | International Equity Fund |
Table of Contents
International Equity Fund
Performance Summary, continued — September 30, 2016 (Unaudited)
| (a) | Fair Value basis is inclusive of short-term investment in State Street Institutional U.S. Government Money Market Fund Class G Shares. |
| (b) | The securities information regarding holdings, allocations and other characteristics is presented to illustrate examples of securities that the Fund has bought and the diversity of areas in which the Fund may invest as of a particular date. It may not be representative of the Fund’s current or future investments and should not be construed as a recommendation to purchase or sell a particular security. |
See Notes to Performance beginning on page 1 for further information, including an explanation of Morningstar peer categories.
Past performance does not predict future performance. The performance shown in the graphs and tables does not reflect the deduction of taxes that a shareholder would pay on Fund distributions or the redemption of Fund shares.
| International Equity Fund | 53 |
Table of Contents
International Equity Fund
Understanding Your Fund’s Expenses — September 30, 2016 (Unaudited)
| 54 | International Equity Fund |
Table of Contents
International Equity Fund
Schedule of Investments — September 30, 2016
See accompanying notes to financial statements.
| International Equity Fund | 55 |
Table of Contents
International Equity Fund
Schedule of Investments, continued — September 30, 2016
Other Information:
The Fund had the following long futures contracts open at September 30, 2016:
| Description | Expiration date |
Number of Contracts |
Current Notional Value |
Unrealized Appreciation |
||||||||||||
| MSCI EAFE Mini Index Futures |
December 2016 | 16 | $ | 1,365,360 | $ | 17,674 | ||||||||||
|
|
|
|||||||||||||||
The Fund was invested in the following sectors at September 30, 2016 (unaudited):
See accompanying notes to financial statements.
| 56 | International Equity Fund |
Table of Contents
International Equity Fund
Schedule of Investments, continued — September 30, 2016
| Affiliate Table
|
||||||||||||||||||||||||||||||||
| Number of Shares Held at 9/30/15 |
Value At 9/30/15 |
Shares Purchased |
Shares Sold |
Number of Shares Held at 9/30/16 |
Value at 9/30/16 |
Dividend/ Interest Income |
Realized Gain (Loss) |
|||||||||||||||||||||||||
| State Street Institutional U.S. Government Money Market Fund - Class G Shares |
37,712,664 | $ | 37,712,664 | 285,263,981 | 283,948,962 | 39,027,683 | $ | 39,027,683 | $ | 67,198 | $ | — | ||||||||||||||||||||
|
|
|
|
|
|
|
|||||||||||||||||||||||||||
| $ | 39,027,683 | $ | 67,198 | $ | — | |||||||||||||||||||||||||||
|
|
|
|
|
|
|
|||||||||||||||||||||||||||
See accompanying notes to financial statements.
| International Equity Fund | 57 |
Table of Contents
Portfolio Management Discussion and Analysis — September 30, 2016 (Unaudited)
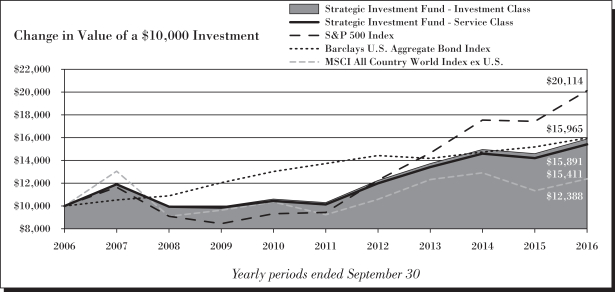
| Q. | How did the GE Institutional Strategic Investment Fund perform compared to its benchmarks and Morningstar peer group for the twelve-month period ended September 30, 2016? |
| A. | For the twelve-month period ended September 30, 2016, the GE Institutional Strategic Investment Fund returned 8.83% for the Investment Class shares and 8.53% for the Service Class shares. The Fund’s broad based benchmarks, the S&P 500 Index, the MSCI All Country World ex-US Index and the Barclays Capital U.S. Aggregate Bond Index returned 15.43%, 9.26% and 5.19%, respectively and the Fund’s Morningstar peer group of 951 U.S. Moderate Allocation funds returned an average of 9.02% over the same period. |
| Q. | What market conditions impacted the Fund’s performance? |
| A. | Over the last year, gains across markets have been strong. Continued economic expansion has supported risk appetite in equity and in credit fixed income markets. Meanwhile, accommodative monetary policy against a backdrop of modest growth and inflation have helped keep interest rates low and, therefore, returns in government bonds robust. |
| Q. | What were the drivers behind Fund performance |
| A. | In general an overweight allocation to equities was a positive contributor to performance as was a preference for U.S. equities relative to international equities. An underweight allocation to fixed income, offset by an overweight position in cash, acted as a drag on performance relative to our benchmark allocation given strong returns in bond markets. A small allocation to high yield bonds was beneficial to returns. |
| The Fund does employ the use of derivatives at times. In our fixed income portfolios, U.S. Treasury and Long Bond futures are used for access to government bond exposure and to manage duration within the portfolio. As such, changes in interest rates can impact the value of these securities. Moreover, for parts of the past year, we have used S&P 500 equity futures as a means of tactically managing our overall exposure to equity markets. Given the tactical nature of these holdings, we preferred this more nimble approach to changing our allocation to the underlying funds. As equity markets moved slightly higher during much of the third quarter, these vehicles acted as a modest detractor to performance in the aggregate, though they dampened volatility during the Brexit-related volatility sell-off in late-Q2 and the very early part of Q3. |
| Q. | Were there any significant changes in the Fund during the period? |
| A. | No, there were no significant changes to the Fund. |
| 58 | Strategic Investment Fund |
Table of Contents
Strategic Investment Fund
Performance Summary — September 30, 2016 (Unaudited)
| Strategic Investment Fund | 59 |
Table of Contents
Strategic Investment Fund
Performance Summary, continued — September 30, 2016 (Unaudited)
| (a) | Fair Value basis is inclusive of short-term investment in State Street Institutional U.S. Government Money Market Fund Class G Shares. |
| (b) | The securities information regarding holdings, allocations and other characteristics is presented to illustrate examples of securities that the Fund has bought and the diversity of areas in which the Fund may invest as of a particular date. It may not be representative of the Fund’s current or future investments and should not be construed as a recommendation to purchase or sell a particular security. |
See Notes to Performance beginning on page 1 for further information, including an explanation of Morningstar peer categories.
Past performance does not predict future performance. The performance shown in the graphs and tables does not reflect the deduction of taxes that a shareholder would pay on Fund distributions or the redemption of Fund shares.
| 60 | Strategic Investment Fund |
Table of Contents
Strategic Investment Fund
Understanding Your Fund’s Expenses — September 30, 2016 (Unaudited)
| Strategic Investment Fund | 61 |
Table of Contents
Strategic Investment Fund
Schedule of Investments — September 30, 2016
See accompanying notes to financial statements.
| 62 | Strategic Investment Fund |
Table of Contents
Strategic Investment Fund
Schedule of Investments, continued — September 30, 2016
See accompanying notes to financial statements.
| Strategic Investment Fund | 63 |
Table of Contents
Strategic Investment Fund
Schedule of Investments, continued — September 30, 2016
See accompanying notes to financial statements.
| 64 | Strategic Investment Fund |
Table of Contents
Strategic Investment Fund
Schedule of Investments, continued — September 30, 2016
See accompanying notes to financial statements.
| Strategic Investment Fund | 65 |
Table of Contents
Strategic Investment Fund
Schedule of Investments, continued — September 30, 2016
See accompanying notes to financial statements.
| 66 | Strategic Investment Fund |
Table of Contents
Strategic Investment Fund
Schedule of Investments, continued — September 30, 2016
See accompanying notes to financial statements.
| Strategic Investment Fund | 67 |
Table of Contents
Strategic Investment Fund
Schedule of Investments, continued — September 30, 2016
See accompanying notes to financial statements.
| 68 | Strategic Investment Fund |
Table of Contents
Strategic Investment Fund
Schedule of Investments, continued — September 30, 2016
See accompanying notes to financial statements.
| Strategic Investment Fund | 69 |
Table of Contents
Strategic Investment Fund
Schedule of Investments, continued — September 30, 2016
See accompanying notes to financial statements.
| 70 | Strategic Investment Fund |
Table of Contents
Strategic Investment Fund
Schedule of Investments, continued — September 30, 2016
See accompanying notes to financial statements.
| Strategic Investment Fund | 71 |
Table of Contents
Strategic Investment Fund
Schedule of Investments, continued — September 30, 2016
See accompanying notes to financial statements.
| 72 | Strategic Investment Fund |
Table of Contents
Strategic Investment Fund
Schedule of Investments, continued — September 30, 2016
See accompanying notes to financial statements.
| Strategic Investment Fund | 73 |
Table of Contents
Strategic Investment Fund
Schedule of Investments, continued — September 30, 2016
See accompanying notes to financial statements.
| 74 | Strategic Investment Fund |
Table of Contents
Strategic Investment Fund
Schedule of Investments, continued — September 30, 2016
See accompanying notes to financial statements.
| Strategic Investment Fund | 75 |
Table of Contents
Strategic Investment Fund
Schedule of Investments, continued — September 30, 2016
See accompanying notes to financial statements.
| 76 | Strategic Investment Fund |
Table of Contents
Strategic Investment Fund
Schedule of Investments, continued — September 30, 2016
See accompanying notes to financial statements.
| Strategic Investment Fund | 77 |
Table of Contents
Strategic Investment Fund
Schedule of Investments, continued — September 30, 2016
See accompanying notes to financial statements.
| 78 | Strategic Investment Fund |
Table of Contents
Strategic Investment Fund
Schedule of Investments, continued — September 30, 2016
Other Information:
Centrally Cleared Credit Default Swaps - Buy Protection
| Reference Entity | Counterparty | Notional Amount (000s omitted) |
Contract annual Fixed Rate |
Termination Date |
Market Value |
Unamortized Upfront Payments Received |
Unrealized Depreciation |
|||||||||||||||||||
| Markit CDX North America High Yield Index |
CME Group Inc. | $ | 11,900 | 5.00% | 12/20/20 | $ | (697,024 | ) | $ | (246,505 | ) | $ | (450,519 | ) | ||||||||||||
| Markit CDX North America Investment Grade Index |
CME Group Inc. | $ | 6,127 | 1.00% | 06/20/21 | $ | (88,770 | ) | $ | (74,464 | ) | $ | (14,306 | ) | ||||||||||||
|
|
|
|||||||||||||||||||||||||
| $ | (464,825 | ) | ||||||||||||||||||||||||
|
|
|
|||||||||||||||||||||||||
See accompanying notes to financial statements.
| Strategic Investment Fund | 79 |
Table of Contents
Strategic Investment Fund
Schedule of Investments, continued — September 30, 2016
The Fund had the following long futures contracts open at September 30, 2016:
| Description | Expiration date |
Number of Contracts |
Current Notional Value |
Unrealized Appreciation |
||||||||||||
| MSCI EAFE Mini Index Futures |
December 2016 | 27 | $ | 2,304,045 | $ | 37,972 | ||||||||||
| S&P 500 Emini Index Futures |
December 2016 | 38 | 4,104,760 | 17,092 | ||||||||||||
| S&P Mid 400 Emini Index Futures |
December 2016 | 104 | 16,115,840 | 71,017 | ||||||||||||
| 2 Yr. U.S. Treasury Notes Futures |
December 2016 | 71 | 15,511,281 | 3,597 | ||||||||||||
| 5 Yr. U.S. Treasury Notes Futures |
December 2016 | 17 | 2,065,766 | 3,687 | ||||||||||||
|
|
|
|||||||||||||||
| $ | 133,365 | |||||||||||||||
|
|
|
|||||||||||||||
The Fund had the following short futures contracts open at September 30, 2016:
| Description | Expiration date |
Number of Contracts |
Current Notional Value |
Unrealized Appreciation (Depreciation) |
||||||||||||
| S&P 500 Emini Index Futures |
December 2016 | 145 | $ | (15,662,900 | ) | $ | (61,935 | ) | ||||||||
| U.S. Long Bond Futures |
December 2016 | 15 | (2,522,344 | ) | 10,753 | |||||||||||
| 10 Yr. U.S. Treasury Notes Futures |
December 2016 | 104 | (13,637,000 | ) | 10,650 | |||||||||||
|
|
|
|||||||||||||||
| $ | (40,532 | ) | ||||||||||||||
|
|
|
|||||||||||||||
| $ | 92,833 | |||||||||||||||
|
|
|
|||||||||||||||
The Fund was invested in the following countries/territories at September 30, 2016 (unaudited):
See accompanying notes to financial statements.
| 80 | Strategic Investment Fund |
Table of Contents
Strategic Investment Fund
Schedule of Investments, continued — September 30, 2016
The Fund’s % share of investment in the various categories, based on Fair Value, is as follows at September 30, 2016 (unaudited):
| Industry | Domestic | Foreign | Total | |||||||||
| Exchange Traded Funds |
6.13% | 0.00% | 6.13% | |||||||||
| Diversified Banks |
2.11% | 2.04% | 4.15% | |||||||||
| Pharmaceuticals |
2.90% | 1.23% | 4.13% | |||||||||
| Healthcare Equipment |
0.82% | 1.39% | 2.21% | |||||||||
| Biotechnology |
1.71% | 0.43% | 2.14% | |||||||||
| Integrated Oil & Gas |
1.49% | 0.60% | 2.09% | |||||||||
| Cable & Satellite |
1.63% | 0.37% | 2.00% | |||||||||
| Internet Software & Services |
1.51% | 0.37% | 1.88% | |||||||||
| Technology Hardware, Storage & Peripherals |
1.53% | 0.29% | 1.82% | |||||||||
| Semiconductors |
0.90% | 0.87% | 1.77% | |||||||||
| Oil & Gas Exploration & Production |
0.94% | 0.32% | 1.26% | |||||||||
| Aerospace & Defense |
0.80% | 0.38% | 1.18% | |||||||||
| Communications Equipment |
0.73% | 0.30% | 1.03% | |||||||||
| Semiconductor Equipment |
0.58% | 0.41% | 0.99% | |||||||||
| Packaged Foods & Meats |
0.41% | 0.58% | 0.99% | |||||||||
| Movies & Entertainment |
0.76% | 0.20% | 0.96% | |||||||||
| Financial Exchanges & Data |
0.84% | 0.00% | 0.84% | |||||||||
| Industrial Machinery |
0.51% | 0.32% | 0.83% | |||||||||
| Data Processing & Outsourced Services |
0.72% | 0.01% | 0.73% | |||||||||
| Wireless Telecommunication Services |
0.00% | 0.72% | 0.72% | |||||||||
| Soft Drinks |
0.72% | 0.00% | 0.72% | |||||||||
| Systems Software |
0.71% | 0.00% | 0.71% | |||||||||
| Electrical Components & Equipment |
0.00% | 0.71% | 0.71% | |||||||||
| Internet & Direct Marketing Retail |
0.52% | 0.16% | 0.68% | |||||||||
| Electronic Equipment & Instruments |
0.00% | 0.66% | 0.66% | |||||||||
| Property & Casualty Insurance |
0.00% | 0.66% | 0.66% | |||||||||
| Auto Parts & Equipment |
0.00% | 0.65% | 0.65% | |||||||||
| Application Software |
0.35% | 0.30% | 0.65% | |||||||||
| Electric Utilities |
0.29% | 0.35% | 0.64% | |||||||||
| Specialized REITs |
0.62% | 0.00% | 0.62% | |||||||||
| Automobile Manufacturers |
0.10% | 0.50% | 0.60% | |||||||||
| Life & Health Insurance |
0.00% | 0.57% | 0.57% | |||||||||
| Multi-Line Insurance |
0.34% | 0.22% | 0.56% | |||||||||
| Asset Management & Custody Banks |
0.46% | 0.09% | 0.55% | |||||||||
| Diversified Real Estate Activities |
0.00% | 0.54% | 0.54% | |||||||||
| Multi-Utilities |
0.52% | 0.00% | 0.52% | |||||||||
| Consumer Finance |
0.52% | 0.00% | 0.52% | |||||||||
| Building Products |
0.00% | 0.50% | 0.50% | |||||||||
| Oil & Gas Equipment & Services |
0.34% | 0.14% | 0.48% | |||||||||
| Specialty Chemicals |
0.05% | 0.43% | 0.48% | |||||||||
| Housewares & Specialties |
0.44% | 0.00% | 0.44% | |||||||||
| Home Improvement Retail |
0.44% | 0.00% | 0.44% | |||||||||
| Personal Products |
0.00% | 0.43% | 0.43% | |||||||||
| Research & Consulting Services |
0.40% | 0.00% | 0.40% | |||||||||
| Trading Companies & Distributors |
0.39% | 0.00% | 0.39% | |||||||||
| Brewers |
0.00% | 0.39% | 0.39% | |||||||||
| Airlines |
0.38% | 0.00% | 0.38% | |||||||||
| Investment Banking & Brokerage |
0.37% | 0.00% | 0.37% | |||||||||
| Leisure Products |
0.00% | 0.31% | 0.31% | |||||||||
| Healthcare Services |
0.00% | 0.28% | 0.28% | |||||||||
| Security & Alarm Services |
0.00% | 0.27% | 0.27% | |||||||||
| Construction Materials |
0.00% | 0.26% | 0.26% | |||||||||
See accompanying notes to financial statements.
| Strategic Investment Fund | 81 |
Table of Contents
Strategic Investment Fund
Schedule of Investments, continued — September 30, 2016
| Industry | Domestic | Foreign | Total | |||||||||
| Apparel, Accessories & Luxury Goods |
0.24% | 0.01% | 0.25% | |||||||||
| Construction Machinery & Heavy Trucks |
0.00% | 0.24% | 0.24% | |||||||||
| Electronic Components |
0.00% | 0.23% | 0.23% | |||||||||
| Advertising |
0.00% | 0.23% | 0.23% | |||||||||
| Home Building |
0.00% | 0.22% | 0.22% | |||||||||
| Industrial Gases |
0.08% | 0.13% | 0.21% | |||||||||
| Healthcare Supplies |
0.20% | 0.00% | 0.20% | |||||||||
| Industrial Conglomerates |
0.18% | 0.00% | 0.18% | |||||||||
| Household Products |
0.06% | 0.12% | 0.18% | |||||||||
| Hypermarkets & Super Centers |
0.17% | 0.01% | 0.18% | |||||||||
| General Merchandise Stores |
0.16% | 0.00% | 0.16% | |||||||||
| Gold |
0.14% | 0.01% | 0.15% | |||||||||
| Automotive Retail |
0.14% | 0.00% | 0.14% | |||||||||
| Diversified Metals & Mining |
0.00% | 0.13% | 0.13% | |||||||||
| Railroads |
0.00% | 0.13% | 0.13% | |||||||||
| Independent Power Producers & Energy Traders |
0.13% | 0.00% | 0.13% | |||||||||
| Air Freight & Logistics |
0.12% | 0.00% | 0.12% | |||||||||
| Hotels, Resorts & Cruise Lines |
0.12% | 0.00% | 0.12% | |||||||||
| Agricultural Products |
0.11% | 0.00% | 0.11% | |||||||||
| Human Resource & Employment Services |
0.00% | 0.10% | 0.10% | |||||||||
| Diversified Support Services |
0.00% | 0.06% | 0.06% | |||||||||
| Paper Packaging |
0.06% | 0.00% | 0.06% | |||||||||
| Drug Retail |
0.05% | 0.00% | 0.05% | |||||||||
| Thrifts & Mortgage Finance |
0.00% | 0.05% | 0.05% | |||||||||
| Department Stores |
0.00% | 0.03% | 0.03% | |||||||||
| IT Consulting & Other Services |
0.00% | 0.03% | 0.03% | |||||||||
| Food Retail |
0.00% | 0.02% | 0.02% | |||||||||
| Other Diversified Financial Services |
0.00% | 0.02% | 0.02% | |||||||||
| Highways & Railtracks |
0.00% | 0.01% | 0.01% | |||||||||
| Diversified REITs |
0.00% | 0.01% | 0.01% | |||||||||
| Construction & Engineering |
0.00% | 0.01% | 0.01% | |||||||||
| Household Appliances |
0.00% | 0.01% | 0.01% | |||||||||
| Real Estate Development |
0.00% | 0.01% | 0.01% | |||||||||
| Footwear |
0.00% | 0.01% | 0.01% | |||||||||
| Broadcasting |
0.00% | 0.00% | 0.00% | |||||||||
| Residential REITs |
0.00% | 0.00% | 0.00% | |||||||||
| Steel |
0.00% | 0.00% | 0.00% | |||||||||
|
|
|
|||||||||||
| 58.02% | ||||||||||||
|
|
|
|||||||||||
See accompanying notes to financial statements.
| 82 | Strategic Investment Fund |
Table of Contents
Strategic Investment Fund
Schedule of Investments, continued — September 30, 2016
Affiliate Table
| Number of Shares Held at 9/30/15 |
Value At 9/30/15 |
Shares Purchased |
Shares Sold | Number of Shares Held at 9/30/16 |
Value at 9/30/16 |
Dividend/ Interest Income |
Realized Gain (Loss) |
|||||||||||||||||||||||||
| Financial Select Sector SPDR Fund |
28,982 | $ | 656,732 | 3,846 | 32,828 | — | $ | — | $ | 8,380 | $ | 190,504 | ||||||||||||||||||||
| Industrial Select Sector SPDR Fund |
52,114 | 2,599,967 | 20,040 | 72,154 | — | — | 53,600 | 955,895 | ||||||||||||||||||||||||
| SPDR Barclays High Yield Bond ETF |
— | — | 632,267 | — | 632,267 | 23,216,844 | 395,283 | — | ||||||||||||||||||||||||
| State Street Institutional U.S. Government Money Market Fund - Class G Shares |
102,285,749 | 102,285,749 | 242,863,794 | 259,244,286 | 85,905,257 | 85,905,257 | 179,709 | — | ||||||||||||||||||||||||
|
|
|
|
|
|
|
|||||||||||||||||||||||||||
| $ | 109,122,101 | $ | 636,972 | $ | 1,146,399 | |||||||||||||||||||||||||||
|
|
|
|
|
|
|
|||||||||||||||||||||||||||
See accompanying notes to financial statements.
| Strategic Investment Fund | 83 |
Table of Contents
Portfolio Management Discussion and Analysis — September 30, 2016 (Unaudited)
| Q. | How did the GE Institutional Income Fund perform compared to its benchmark and Morningstar peer group for the twelve-month period ended September 30, 2016? |
| A. | For the twelve-month period ended September 30, 2016, the GE Institutional Income Fund returned 6.18% for the Investment Class shares and 5.95% for the Service Class shares. The Fund’s benchmark, the Barclays Capital U.S. Aggregate Bond Index returned 5.19% and the Fund’s Morningstar peer group of 1,101 U.S. Intermediate-Term Bond funds returned an average of 5.29% over the same period. |
| Q. | What market conditions impacted the Fund’s performance? |
| A. | After 7 years of steady rate policy, the Federal Reserve raised its Fed Funds target 25 basis points (bps) to a lower bound of 0.25% and upper bound of 0.5% in December, 2015. Expectations for more hikes in 2016 waned as the Federal Open Market Committee sounded a more dovish tone due to slow global growth and moderate inflation. Real GDP in the US remained below 2% for the period. Globally, central banks remained accommodative with the European Central Bank and Bank of Japan upping their quantitative easing measures. In late June, the British electorate voted to leave the European Union, which increased financial market volatility in the short term. The U.S. treasury yield curve flattened over the 12 month period as the 2-year note yield rose 13 bps to 0.76% and 10 and 30-year yields falling -44 bps and -54 bps respectively. Global central bank policy, low global rates and demand for yield drove credit spreads tighter over the period. The option adjusted spread for the Barclays US Credit Index began the period at +160 bps, spiked early in 2016 to +200 bps after disappointing economic news from China and tensions in the Middle East, then steadily declined to +130 bps at September 30, 2016. High yield spreads followed the same path but over a wider range. Starting at +635 bps, the option-adjusted spreads (“OAS”) of the Barclays US High Yield Index peaked at +840 bps in early February then fell to +480 bps at the end of third quarter of 2016. |
| Q. | What were the drivers behind Fund performance? |
| A. | In beating its benchmark, the Fund benefited from duration positioning, sector allocation and security selection. The Fund’s long relative duration in the second quarter, mainly through the use of treasury futures, positively impacted return as interest rates fell. The overweight in investment grade credit, which outperformed the Barclays Aggregate Index by roughly 3%, and the exposure to BB and B-rated high yield securities (non-index), which gained almost 12% versus being underweight treasury securities, were the main driver of performance from sector allocation. A short position in a high yield credit default swap did offset some of the benefit from the position in cash securities. Positive security selection came mainly in investment grade credit due to an overweight in BBB-rated and financial securities. Holdings in commercial mortgage-backed securities (“MBS”) rated below AAA were a moderate drag on performance as the tightening in spreads lagged that in corporate bonds. |
| Q. | Were there any significant changes in the Fund during the period? |
| A. | The Fund’s duration positioning was tactically traded between -0.25 years to +0.75 years long relative to the benchmark during the period. The Fund’s duration was extended in March as our view for further rate hikes was below that of consensus. The sector overweights in investment grade credit, commercial MBS and non-index exposure to high yield were all reduced in 2016 as credit spreads tightened. No significant changes were made within the corporate bond or commercial MBS sectors, but the position in specified (small loan size) pools in the agency MBS space was replaced with interest only securities which provide higher carry should rates move higher. |
| 84 | Income Fund |
Table of Contents
Income Fund
Performance Summary — September 30, 2016 (Unaudited)
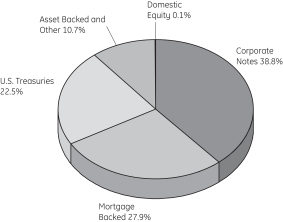
| Income Fund | 85 |
Table of Contents
Income Fund
Performance Summary, continued — September 30, 2016 (Unaudited)
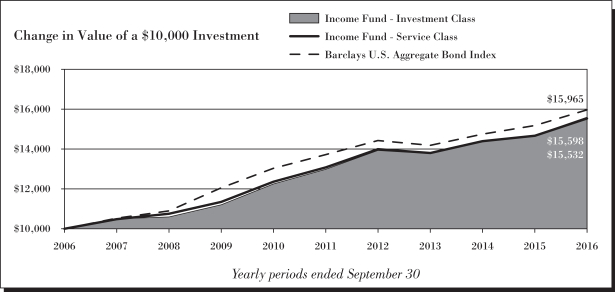
| (a) | Fair Value basis is inclusive of short-term investment in State Street Institutional U.S. Government Money Market Fund Class G Shares. |
| (b) | The securities information regarding holdings, allocations and other characteristics is presented to illustrate examples of securities that the Fund has bought and the diversity of areas in which the Fund may invest as of a particular date. It may not be representative of the Fund’s current or future investments and should not be construed as a recommendation to purchase or sell a particular security. |
| * | Moody’s Investors Services, Inc. (“Moody’s”) and S&P Global Ratings (“S&P”) are nationally recognized statistical rating organizations. The quality ratings represent the lower of Moody’s or S&P credit ratings. When a rating from only one of the rating agencies is available, that rating is used. Securities not rated by Moody’s or S&P are categorized as not rated. Credit quality measures a bond issuer’s ability to repay interest and principal in a timely manner. Credit quality ratings assigned by a rating agency are subject to change periodically and are not absolute standards of quality. In formulating investment decisions for the Fund, SSGA FM develops its own analysis of the credit quality and risks associated with individual debt instruments, rather than relying exclusively on rating agency ratings. |
See Notes to Performance beginning on page 1 for further information, including an explanation of Morningstar peer categories.
Past performance does not predict future performance. The performance shown in the graphs and tables does not reflect the deduction of taxes that a shareholder would pay on Fund distributions or the redemption of Fund shares.
| 86 | Income Fund |
Table of Contents
Income Fund
Understanding Your Fund’s Expenses — September 30, 2016 (Unaudited)
| Income Fund | 87 |
Table of Contents
Income Fund
Schedule of Investments — September 30, 2016
See accompanying notes to financial statements.
| 88 | Income Fund |
Table of Contents
Income Fund
Schedule of Investments, continued — September 30, 2016
See accompanying notes to financial statements.
| Income Fund | 89 |
Table of Contents
Income Fund
Schedule of Investments, continued — September 30, 2016
See accompanying notes to financial statements.
| 90 | Income Fund |
Table of Contents
Income Fund
Schedule of Investments, continued — September 30, 2016
See accompanying notes to financial statements.
| Income Fund | 91 |
Table of Contents
Income Fund
Schedule of Investments, continued — September 30, 2016
See accompanying notes to financial statements.
| 92 | Income Fund |
Table of Contents
Income Fund
Schedule of Investments, continued — September 30, 2016
See accompanying notes to financial statements.
| Income Fund | 93 |
Table of Contents
Income Fund
Schedule of Investments, continued — September 30, 2016
See accompanying notes to financial statements.
| 94 | Income Fund |
Table of Contents
Income Fund
Schedule of Investments, continued — September 30, 2016
See accompanying notes to financial statements.
| Income Fund | 95 |
Table of Contents
Income Fund
Schedule of Investments, continued — September 30, 2016
See accompanying notes to financial statements.
| 96 | Income Fund |
Table of Contents
Income Fund
Schedule of Investments, continued — September 30, 2016
See accompanying notes to financial statements.
| Income Fund | 97 |
Table of Contents
Income Fund
Schedule of Investments, continued — September 30, 2016
See accompanying notes to financial statements.
| 98 | Income Fund |
Table of Contents
Income Fund
Schedule of Investments, continued — September 30, 2016
See accompanying notes to financial statements.
| Income Fund | 99 |
Table of Contents
Income Fund
Schedule of Investments, continued — September 30, 2016
Other Information:
Centrally Cleared Credit Default Swaps - Buy Protection
| Reference Entity | Counterparty | Notional Amount (000s omitted) |
Contract annual Fixed Rate |
Termination Date |
Market Value |
Unamortized Upfront Payments Received |
Unrealized Depreciation |
|||||||||||||||||||||
| Markit CDX North America High Yield Index |
CME Group Inc. | $ | 14,477 | 5.00 | % | 12/20/20 | $ | (847,970 | ) | $ | (298,967 | ) | $ | (549,003 | ) | |||||||||||||
| Markit CDX North America Investment Grade Index |
CME Group Inc. | $ | 8,452 | 1.00 | % | 06/20/21 | $ | (122,457 | ) | $ | (102,720 | ) | $ | (19,737 | ) | |||||||||||||
|
|
|
|||||||||||||||||||||||||||
| $ | (568,740 | ) | ||||||||||||||||||||||||||
|
|
|
|||||||||||||||||||||||||||
The Fund had the following long futures contracts open at September 30, 2016:
| Description | Expiration date |
Number of Contracts |
Current Notional Value |
Unrealized Appreciation (Depreciation) |
||||||||||||
| Ultra Long-Term U.S. Treasury Bond Futures |
December 2016 | 31 | $ | 5,700,125 | $ | (39,770 | ) | |||||||||
| 2 Yr. U.S. Treasury Notes Futures |
December 2016 | 22 | 4,806,313 | 3,052 | ||||||||||||
| 5 Yr. U.S. Treasury Notes Futures |
December 2016 | 73 | 8,870,640 | 5,768 | ||||||||||||
|
|
|
|||||||||||||||
| $ | (30,950 | ) | ||||||||||||||
|
|
|
|||||||||||||||
The Fund had the following short futures contracts open at September 30, 2016:
| Description | Expiration date |
Number of Contracts |
Current Notional Value |
Unrealized Appreciation |
||||||||||||
| U.S. Long Bond Futures |
December 2016 | 21 | $ | (3,531,281 | ) | $ | 18,804 | |||||||||
| 10 Yr. U.S. Treasury Notes Futures |
December 2016 | 174 | (22,815,750 | ) | 19,630 | |||||||||||
|
|
|
|||||||||||||||
| $ | 38,434 | |||||||||||||||
|
|
|
|||||||||||||||
| $ | 7,484 | |||||||||||||||
|
|
|
|||||||||||||||
Affiliate Table
| Number of Shares Held at 9/30/15 |
Value At 9/30/15 |
Shares Purchased |
Shares Sold |
Number of Shares Held at 9/30/16 |
Value at 9/30/16 |
Dividend/ Interest Income |
Realized Gain (Loss) |
|||||||||||||||||||||||||
| State Street Institutional U.S. Government Money Market Fund - Class G Shares |
18,496,948 | $ | 18,496,948 | 153,480,854 | 142,298,937 | 29,678,865 | $ | 29,678,865 | $ | 26,757 | $ | — | ||||||||||||||||||||
|
|
|
|
|
|
|
|||||||||||||||||||||||||||
| $ | 29,678,865 | $ | 26,757 | $ | — | |||||||||||||||||||||||||||
|
|
|
|
|
|
|
|||||||||||||||||||||||||||
See accompanying notes to financial statements.
| 100 | Income Fund |
Table of Contents
GE Institutional Funds
Notes to Schedules of Investments — September 30, 2016
| Notes to Schedules of Investments | 101 |
Table of Contents
U.S. Equity Fund
Selected data based on a share outstanding throughout the fiscal years indicated
| Investment Class | ||||||||||||||||||||
| 9/30/16 | 9/30/15** | 9/30/14** | 9/30/13** | 9/30/12** | ||||||||||||||||
| Inception date | 11/25/97 | |||||||||||||||||||
| Net asset value, beginning of period |
$ | 14.46 | $ | 17.32 | $ | 15.59 | $ | 12.90 | $ | 10.07 | ||||||||||
|
|
|
|
|
|
|
|
|
|
|
|||||||||||
| Income/(loss) from investment operations: |
|
|||||||||||||||||||
| Net investment income |
0.21 | * | 0.21 | * | 0.22 | * | 0.22 | * | 0.16 | * | ||||||||||
| Net realized and unrealized gains/(losses) on investments |
1.52 | * | (0.65 | )* | 2.60 | * | 2.67 | * | 2.80 | * | ||||||||||
|
|
|
|
|
|
|
|
|
|
|
|||||||||||
| Total income/(loss) from investment operations |
1.73 | (0.44 | ) | 2.82 | 2.89 | 2.96 | ||||||||||||||
|
|
|
|
|
|
|
|
|
|
|
|||||||||||
| Less distributions from: |
||||||||||||||||||||
| Net investment income |
0.24 | 0.25 | 0.22 | 0.20 | 0.13 | |||||||||||||||
| Net realized gains |
2.45 | 2.17 | 0.87 | — | — | |||||||||||||||
|
|
|
|
|
|
|
|
|
|
|
|||||||||||
| Total distributions |
2.69 | 2.42 | 1.09 | 0.20 | 0.13 | |||||||||||||||
|
|
|
|
|
|
|
|
|
|
|
|||||||||||
| Net asset value, end of period |
$ | 13.50 | $ | 14.46 | $ | 17.32 | $ | 15.59 | $ | 12.90 | ||||||||||
|
|
|
|
|
|
|
|
|
|
|
|||||||||||
| Total return(a) |
13.29 | % | (3.57 | )% | 18.88 | % | 22.76 | % | 29.68 | % | ||||||||||
| Ratios/Supplemental Data: |
||||||||||||||||||||
| Net assets, end of period (in thousands) |
$ | 603,060 | $ | 615,024 | $ | 836,752 | $ | 767,603 | $ | 658,065 | ||||||||||
| Ratios to average net assets: |
||||||||||||||||||||
| Net expenses |
0.37 | % | 0.37 | % | 0.36 | %(b) | 0.36 | %(b) | 0.36 | %(b) | ||||||||||
| Gross expenses |
0.37 | % | 0.37 | % | 0.36 | % | 0.36 | % | 0.37 | % | ||||||||||
| Net investment income |
1.61 | % | 1.32 | % | 1.36 | % | 1.60 | % | 1.39 | % | ||||||||||
| Portfolio turnover rate |
43 | % | 41 | % | 38 | % | 37 | % | 71 | % | ||||||||||
| Service Class | ||||||||||||||||||||
| 9/30/16 | 9/30/15** | 9/30/14** | 9/30/13** | 9/30/12** | ||||||||||||||||
| Inception date | 1/3/01 | |||||||||||||||||||
| Net asset value, beginning of period |
$ | 15.06 | $ | 17.95 | $ | 15.96 | $ | 13.12 | $ | 10.24 | ||||||||||
|
|
|
|
|
|
|
|
|
|
|
|||||||||||
| Income/(loss) from investment operations: |
|
|||||||||||||||||||
| Net investment income |
0.19 | * | 0.18 | * | 0.19 | * | 0.18 | * | 0.14 | * | ||||||||||
| Net realized and unrealized gains/(losses) on investments |
1.58 | * | (0.69 | )* | 2.67 | * | 2.83 | * | 2.84 | * | ||||||||||
|
|
|
|
|
|
|
|
|
|
|
|||||||||||
| Total income/(loss) from investment operations |
1.77 | (0.51 | ) | 2.86 | 3.01 | 2.98 | ||||||||||||||
|
|
|
|
|
|
|
|
|
|
|
|||||||||||
| Less distributions from: |
||||||||||||||||||||
| Net investment income |
0.20 | 0.21 | — | 0.17 | 0.10 | |||||||||||||||
| Net realized gains |
2.45 | 2.17 | 0.87 | — | — | |||||||||||||||
|
|
|
|
|
|
|
|
|
|
|
|||||||||||
| Total distributions |
2.65 | 2.38 | 0.87 | 0.17 | 0.10 | |||||||||||||||
|
|
|
|
|
|
|
|
|
|
|
|||||||||||
| Net asset value, end of period |
$ | 14.18 | $ | 15.06 | $ | 17.95 | $ | 15.96 | $ | 13.12 | ||||||||||
|
|
|
|
|
|
|
|
|
|
|
|||||||||||
| Total return(a) |
12.96 | % | (3.83 | )% | 18.55 | % | 23.23 | % | 29.33 | % | ||||||||||
| Ratios/Supplemental Data: |
||||||||||||||||||||
| Net assets, end of period (in thousands) |
$ | 95 | $ | 104 | $ | 117 | $ | 84 | $ | 3,133 | ||||||||||
| Ratios to average net assets: |
||||||||||||||||||||
| Net expenses |
0.62 | % | 0.62 | % | 0.61 | %(b) | 0.61 | %(b) | 0.61 | %(b) | ||||||||||
| Gross expenses |
0.62 | % | 0.62 | % | 0.61 | % | 0.61 | % | 0.62 | % | ||||||||||
| Net investment income |
1.35 | % | 1.07 | % | 1.11 | % | 1.33 | % | 1.14 | % | ||||||||||
| Portfolio turnover rate |
43 | % | 41 | % | 38 | % | 37 | % | 71 | % | ||||||||||
See accompanying notes to financial statements.
| 102 | Financial Highlights |
Table of Contents
S&P 500 Index Fund
Financial Highlights
Selected data based on a share outstanding throughout the fiscal years indicated
| Investment Class | ||||||||||||||||||||
| 9/30/16 | 9/30/15** | 9/30/14** | 9/30/13** | 9/30/12** | ||||||||||||||||
| Inception date | 11/25/97 | |||||||||||||||||||
| Net asset value, beginning of period |
$ | 18.34 | $ | 18.84 | $ | 16.01 | $ | 13.71 | $ | 10.91 | ||||||||||
|
|
|
|
|
|
|
|
|
|
|
|||||||||||
| Income/(loss) from investment operations: |
||||||||||||||||||||
| Net investment income |
0.39 | * | 0.37 | * | 0.32 | * | 0.30 | * | 0.26 | * | ||||||||||
| Net realized and unrealized gains/(losses) on investments |
2.37 | * | (0.48 | )* | 2.76 | * | 2.27 | * | 2.95 | * | ||||||||||
|
|
|
|
|
|
|
|
|
|
|
|||||||||||
| Total income/(loss) from investment operations |
2.76 | (0.11 | ) | 3.08 | 2.57 | 3.21 | ||||||||||||||
|
|
|
|
|
|
|
|
|
|
|
|||||||||||
| Less distributions from: |
||||||||||||||||||||
| Net investment income |
0.41 | 0.39 | 0.25 | 0.27 | 0.41 | |||||||||||||||
|
|
|
|
|
|
|
|
|
|
|
|||||||||||
| Total distributions |
0.41 | 0.39 | 0.25 | 0.27 | 0.41 | |||||||||||||||
|
|
|
|
|
|
|
|
|
|
|
|||||||||||
| Net asset value, end of period |
$ | 20.69 | $ | 18.34 | $ | 18.84 | $ | 16.01 | $ | 13.71 | ||||||||||
|
|
|
|
|
|
|
|
|
|
|
|||||||||||
| Total return(a) |
15.21 | % | (0.68 | )% | 19.54 | % | 19.11 | % | 30.07 | % | ||||||||||
| Ratios/Supplemental Data: |
||||||||||||||||||||
| Net assets, end of period (in thousands) |
$ | 8,875 | $ | 20,017 | $ | 32,326 | $ | 42,753 | $ | 31,997 | ||||||||||
| Ratios to average net assets: |
||||||||||||||||||||
| Net expenses |
0.16 | % | 0.16 | % | 0.19 | %(b) | 0.15 | %(b) | 0.15 | %(b) | ||||||||||
| Gross expenses |
0.16 | % | 0.16 | % | 0.19 | % | 0.15 | % | 0.16 | % | ||||||||||
| Net investment income |
2.02 | % | 1.91 | % | 1.79 | % | 2.05 | % | 2.03 | % | ||||||||||
| Portfolio turnover rate |
12 | % | 7 | % | 16 | % | 2 | % | 11 | % | ||||||||||
| Service Class | ||||||||||||||||||||
| 9/30/16 | 9/30/15** | 9/30/14** | 9/30/13** | 9/30/12** | ||||||||||||||||
| Inception date | 9/30/05 | |||||||||||||||||||
| Net asset value, beginning of period |
$ | 18.69 | $ | 19.20 | $ | 16.31 | $ | 13.97 | $ | 10.86 | ||||||||||
|
|
|
|
|
|
|
|
|
|
|
|||||||||||
| Income/(loss) from investment operations: |
||||||||||||||||||||
| Net investment income |
0.36 | * | 0.33 | * | 0.28 | * | 0.27 | * | 0.22 | * | ||||||||||
| Net realized and unrealized gains/(losses) on investments |
2.40 | * | (0.49 | )* | 2.83 | * | 2.31 | * | 2.98 | * | ||||||||||
|
|
|
|
|
|
|
|
|
|
|
|||||||||||
| Total income/(loss) from investment operations |
2.76 | (0.16 | ) | 3.11 | 2.58 | 3.20 | ||||||||||||||
|
|
|
|
|
|
|
|
|
|
|
|||||||||||
| Less distributions from: |
||||||||||||||||||||
| Net investment income |
0.36 | 0.35 | 0.22 | 0.24 | 0.09 | |||||||||||||||
|
|
|
|
|
|
|
|
|
|
|
|||||||||||
| Total distributions |
0.36 | 0.35 | 0.22 | 0.24 | 0.09 | |||||||||||||||
|
|
|
|
|
|
|
|
|
|
|
|||||||||||
| Net asset value, end of period |
$ | 21.09 | $ | 18.69 | $ | 19.20 | $ | 16.31 | $ | 13.97 | ||||||||||
|
|
|
|
|
|
|
|
|
|
|
|||||||||||
| Total return(a) |
14.90 | % | (0.95 | )% | 19.28 | % | 18.81 | % | 29.65 | % | ||||||||||
| Ratios/Supplemental Data: |
||||||||||||||||||||
| Net assets, end of period (in thousands) |
$ | 7,360 | $ | 6,960 | $ | 7,150 | $ | 5,922 | $ | 4,496 | ||||||||||
| Ratios to average net assets: |
||||||||||||||||||||
| Net expenses |
0.41 | % | 0.41 | % | 0.44 | %(b) | 0.40 | %(b) | 0.40 | %(b) | ||||||||||
| Gross expenses |
0.41 | % | 0.41 | % | 0.44 | % | 0.40 | % | 0.41 | % | ||||||||||
| Net investment income |
1.80 | % | 1.65 | % | 1.52 | % | 1.80 | % | 1.76 | % | ||||||||||
| Portfolio turnover rate |
12 | % | 7 | % | 16 | % | 2 | % | 11 | % | ||||||||||
See accompanying notes to financial statements.
| Financial Highlights | 103 |
Table of Contents
U.S. Large-Cap Core Equity Fund
Financial Highlights
Selected data based on a share outstanding throughout the fiscal years indicated
| Investment Class | ||||||||||||||||||||
| 9/30/16 | 9/30/15** | 9/30/14** | 9/30/13** | 9/30/12** | ||||||||||||||||
| Inception date | 2/2/00 | |||||||||||||||||||
| Net asset value, beginning of period |
$ | 8.85 | $ | 11.15 | $ | 11.64 | $ | 10.94 | $ | 8.76 | ||||||||||
|
|
|
|
|
|
|
|
|
|
|
|||||||||||
| Income/(loss) from investment operations: |
||||||||||||||||||||
| Net investment income |
0.13 | * | 0.18 | 0.17 | 0.21 | 0.18 | ||||||||||||||
| Net realized and unrealized gains/(losses) on investments |
0.75 | * | (0.62 | ) | 1.73 | 1.94 | 2.25 | |||||||||||||
|
|
|
|
|
|
|
|
|
|
|
|||||||||||
| Total income/(loss) from investment operations |
0.88 | (0.44 | ) | 1.90 | 2.15 | 2.43 | ||||||||||||||
|
|
|
|
|
|
|
|
|
|
|
|||||||||||
| Less distributions from: |
||||||||||||||||||||
| Net investment income |
0.18 | 0.16 | 0.15 | 0.25 | 0.14 | |||||||||||||||
| Net realized gains |
1.77 | 1.70 | 2.24 | 1.20 | 0.11 | |||||||||||||||
|
|
|
|
|
|
|
|
|
|
|
|||||||||||
| Total distributions |
1.95 | 1.86 | 2.39 | 1.45 | 0.25 | |||||||||||||||
|
|
|
|
|
|
|
|
|
|
|
|||||||||||
| Net asset value, end of period |
$ | 7.78 | $ | 8.85 | $ | 11.15 | $ | 11.64 | $ | 10.94 | ||||||||||
|
|
|
|
|
|
|
|
|
|
|
|||||||||||
| Total return(a) |
11.67 | % | (5.31 | )% | 18.60 | % | 22.84 | % | 28.27 | % | ||||||||||
| Ratios/Supplemental Data: |
||||||||||||||||||||
| Net assets, end of period (in thousands) |
$ | 52,332 | $ | 59,483 | $ | 95,740 | $ | 90,668 | $ | 185,990 | ||||||||||
| Ratios to average net assets: |
||||||||||||||||||||
| Net expenses |
0.49 | % | 0.43 | % | 0.43 | %(b) | 0.43 | %(b) | 0.39 | %(b) | ||||||||||
| Gross expenses |
0.49 | % | 0.43 | % | 0.43 | % | 0.43 | % | 0.39 | % | ||||||||||
| Net investment income |
1.67 | % | 1.44 | % | 1.46 | % | 1.78 | % | 1.80 | % | ||||||||||
| Portfolio turnover rate |
54 | % | 48 | % | 45 | % | 44 | % | 83 | % | ||||||||||
| Service Class | ||||||||||||||||||||
| 9/30/16 | 9/30/15** | 9/30/14** | 9/30/13** | 9/30/12** | ||||||||||||||||
| Inception date | 9/30/05 | |||||||||||||||||||
| Net asset value, beginning of period |
$ | 8.77 | $ | 11.06 | $ | 11.56 | $ | 10.87 | $ | 8.71 | ||||||||||
|
|
|
|
|
|
|
|
|
|
|
|||||||||||
| Income/(loss) from investment operations: |
||||||||||||||||||||
| Net investment income |
0.11 | * | 0.11 | 0.13 | 0.17 | 0.17 | ||||||||||||||
| Net realized and unrealized gains/(losses) on investments |
0.76 | * | (0.57 | ) | 1.73 | 1.94 | 2.22 | |||||||||||||
|
|
|
|
|
|
|
|
|
|
|
|||||||||||
| Total income/(loss) from investment operations |
0.87 | (0.46 | ) | 1.86 | 2.11 | 2.39 | ||||||||||||||
|
|
|
|
|
|
|
|
|
|
|
|||||||||||
| Less distributions from: |
||||||||||||||||||||
| Net investment income |
0.16 | 0.13 | 0.12 | 0.22 | 0.12 | |||||||||||||||
| Net realized gains |
1.77 | 1.70 | 2.24 | 1.20 | 0.11 | |||||||||||||||
|
|
|
|
|
|
|
|
|
|
|
|||||||||||
| Total distributions |
1.93 | 1.83 | 2.36 | 1.42 | 0.23 | |||||||||||||||
|
|
|
|
|
|
|
|
|
|
|
|||||||||||
| Net asset value, end of period |
$ | 7.71 | $ | 8.77 | $ | 11.06 | $ | 11.56 | $ | 10.87 | ||||||||||
|
|
|
|
|
|
|
|
|
|
|
|||||||||||
| Total return(a) |
11.58 | % | (5.51 | )% | 18.32 | % | 22.56 | % | 27.88 | % | ||||||||||
| Ratios/Supplemental Data: |
||||||||||||||||||||
| Net assets, end of period (in thousands) |
$ | 870 | $ | 4,117 | $ | 4,391 | $ | 3,583 | $ | 3,191 | ||||||||||
| Ratios to average net assets: |
||||||||||||||||||||
| Net expenses |
0.74 | % | 0.68 | % | 0.68 | %(b) | 0.68 | %(b) | 0.64 | %(b) | ||||||||||
| Gross expenses |
0.74 | % | 0.68 | % | 0.68 | % | 0.68 | % | 0.64 | % | ||||||||||
| Net investment income |
1.49 | % | 1.20 | % | 1.21 | % | 1.44 | % | 1.55 | % | ||||||||||
| Portfolio turnover rate |
54 | % | 48 | % | 45 | % | 44 | % | 83 | % | ||||||||||
See accompanying notes to financial statements.
| 104 | Financial Highlights |
Table of Contents
Premier Growth Equity Fund
Financial Highlights
Selected data based on a share outstanding throughout the fiscal years indicated
| Investment Class | ||||||||||||||||||||
| 9/30/16 | 9/30/15** | 9/30/14** | 9/30/13** | 9/30/12** | ||||||||||||||||
| Inception date | 10/29/99 | |||||||||||||||||||
| Net asset value, beginning of period |
$ | 13.61 | $ | 14.96 | $ | 12.92 | $ | 10.83 | $ | 8.05 | ||||||||||
|
|
|
|
|
|
|
|
|
|
|
|||||||||||
| Income/(loss) from investment operations: |
|
|||||||||||||||||||
| Net investment income |
0.13 | * | 0.13 | * | 0.13 | * | 0.14 | * | 0.10 | * | ||||||||||
| Net realized and unrealized gains/(losses) on investments |
1.88 | * | (0.11 | )* | 2.38 | * | 2.09 | * | 2.77 | * | ||||||||||
|
|
|
|
|
|
|
|
|
|
|
|||||||||||
| Total income from investment operations |
2.01 | 0.02 | 2.51 | 2.23 | 2.87 | |||||||||||||||
|
|
|
|
|
|
|
|
|
|
|
|||||||||||
| Less distributions from: |
||||||||||||||||||||
| Net investment income |
0.14 | 0.13 | 0.11 | 0.14 | 0.09 | |||||||||||||||
| Net realized gains |
1.25 | 1.24 | 0.36 | — | — | |||||||||||||||
|
|
|
|
|
|
|
|
|
|
|
|||||||||||
| Total distributions |
1.39 | 1.37 | 0.47 | 0.14 | 0.09 | |||||||||||||||
|
|
|
|
|
|
|
|
|
|
|
|||||||||||
| Net asset value, end of period |
$ | 14.23 | $ | 13.61 | $ | 14.96 | $ | 12.92 | $ | 10.83 | ||||||||||
|
|
|
|
|
|
|
|
|
|
|
|||||||||||
| Total return(a) |
15.25 | % | (0.47 | )% | 19.80 | % | 20.85 | % | 35.95 | % | ||||||||||
| Ratios/Supplemental Data: |
||||||||||||||||||||
| Net assets, end of period (in thousands) |
$ | 325,700 | $ | 334,227 | $ | 428,536 | $ | 369,286 | $ | 257,923 | ||||||||||
| Ratios to average net assets: |
||||||||||||||||||||
| Net expenses |
0.38 | % | 0.38 | % | 0.37 | %(b) | 0.38 | %(b) | 0.38 | %(b) | ||||||||||
| Gross expenses |
0.38 | % | 0.38 | % | 0.37 | % | 0.38 | % | 0.38 | % | ||||||||||
| Net investment income |
0.95 | % | 0.89 | % | 0.94 | % | 1.20 | % | 0.98 | % | ||||||||||
| Portfolio turnover rate |
21 | % | 21 | % | 21 | % | 25 | % | 15 | % | ||||||||||
| Service Class | ||||||||||||||||||||
| 9/30/16 | 9/30/15** | 9/30/14** | 9/30/13** | 9/30/12** | ||||||||||||||||
| Inception date | 1/3/01 | |||||||||||||||||||
| Net asset value, beginning of period |
$ | 13.46 | $ | 14.82 | $ | 12.80 | $ | 10.74 | $ | 7.98 | ||||||||||
|
|
|
|
|
|
|
|
|
|
|
|||||||||||
| Income/(loss) from investment operations: |
|
|||||||||||||||||||
| Net investment income |
0.09 | * | 0.09 | * | 0.10 | * | 0.11 | * | 0.07 | * | ||||||||||
| Net realized and unrealized gains/(losses) on investments |
1.87 | * | (0.12 | )* | 2.36 | * | 2.07 | * | 2.76 | * | ||||||||||
|
|
|
|
|
|
|
|
|
|
|
|||||||||||
| Total income/(loss) from investment operations |
1.96 | (0.03 | ) | 2.46 | 2.18 | 2.83 | ||||||||||||||
|
|
|
|
|
|
|
|
|
|
|
|||||||||||
| Less distributions from: |
||||||||||||||||||||
| Net investment income |
0.11 | 0.09 | 0.08 | 0.12 | 0.07 | |||||||||||||||
| Net realized gains |
1.25 | 1.24 | 0.36 | — | — | |||||||||||||||
|
|
|
|
|
|
|
|
|
|
|
|||||||||||
| Total distributions |
1.36 | 1.33 | 0.44 | 0.12 | 0.07 | |||||||||||||||
|
|
|
|
|
|
|
|
|
|
|
|||||||||||
| Net asset value, end of period |
$ | 14.06 | $ | 13.46 | $ | 14.82 | $ | 12.80 | $ | 10.74 | ||||||||||
|
|
|
|
|
|
|
|
|
|
|
|||||||||||
| Total return(a) |
14.99 | % | (0.77 | )% | 19.56 | % | 20.49 | % | 35.65 | % | ||||||||||
| Ratios/Supplemental Data: |
||||||||||||||||||||
| Net assets, end of period (in thousands) |
$ | 11,547 | $ | 5,820 | $ | 3,836 | $ | 3,216 | $ | 2,148 | ||||||||||
| Ratios to average net assets: |
||||||||||||||||||||
| Net expenses |
0.63 | % | 0.63 | % | 0.62 | %(b) | 0.63 | %(b) | 0.63 | %(b) | ||||||||||
| Gross expenses |
0.63 | % | 0.63 | % | 0.62 | % | 0.63 | % | 0.63 | % | ||||||||||
| Net investment income |
0.67 | % | 0.61 | % | 0.69 | % | 0.93 | % | 0.73 | % | ||||||||||
| Portfolio turnover rate |
21 | % | 21 | % | 21 | % | 25 | % | 15 | % | ||||||||||
See accompanying notes to financial statements.
| Financial Highlights | 105 |
Table of Contents
Small-Cap Equity Fund
Financial Highlights
Selected data based on a share outstanding throughout the fiscal years indicated
| Investment Class | ||||||||||||||||||||
| 9/30/16 | 9/30/15** | 9/30/14** | 9/30/13** | 9/30/12** | ||||||||||||||||
| Inception date | 8/3/98 | |||||||||||||||||||
| Net asset value, beginning of period |
$ | 17.18 | $ | 19.32 | $ | 20.19 | $ | 16.80 | $ | 13.05 | ||||||||||
|
|
|
|
|
|
|
|
|
|
|
|||||||||||
| Income/(loss) from investment operations: |
||||||||||||||||||||
| Net investment income |
0.04 | * | 0.03 | * | 0.01 | * | 0.07 | * | 0.04 | |||||||||||
| Net realized and unrealized gains/(losses) on investments |
2.79 | * | (0.08 | )* | 1.12 | * | 4.69 | * | 3.86 | |||||||||||
|
|
|
|
|
|
|
|
|
|
|
|||||||||||
| Total income/(loss) from investment operations |
2.83 | (0.05 | ) | 1.13 | 4.76 | 3.90 | ||||||||||||||
|
|
|
|
|
|
|
|
|
|
|
|||||||||||
| Less distributions from: |
||||||||||||||||||||
| Net investment income |
0.03 | 0.02 | 0.02 | 0.07 | 0.06 | |||||||||||||||
| Net realized gains |
2.02 | 2.07 | 1.98 | 1.30 | 0.09 | |||||||||||||||
|
|
|
|
|
|
|
|
|
|
|
|||||||||||
| Total distributions |
2.05 | 2.09 | 2.00 | 1.37 | 0.15 | |||||||||||||||
|
|
|
|
|
|
|
|
|
|
|
|||||||||||
| Net asset value, end of period |
$ | 17.96 | $ | 17.18 | $ | 19.32 | $ | 20.19 | $ | 16.80 | ||||||||||
|
|
|
|
|
|
|
|
|
|
|
|||||||||||
| Total return(a) |
18.24 | % | (0.90 | )% | 5.61 | % | 30.57 | % | 30.03 | % | ||||||||||
| Ratios/Supplemental Data: |
||||||||||||||||||||
| Net assets, end of period (in thousands) |
$ | 1,298,789 | $ | 1,171,984 | $ | 1,264,304 | $ | 1,249,146 | $ | 966,702 | ||||||||||
| Ratios to average net assets: |
||||||||||||||||||||
| Net expenses |
0.89 | % | 0.89 | % | 0.88 | %(b) | 0.88 | %(b) | 0.89 | %(b) | ||||||||||
| Gross expenses |
0.89 | % | 0.89 | % | 0.88 | % | 0.89 | % | 0.90 | % | ||||||||||
| Net investment income |
0.25 | % | 0.17 | % | 0.07 | % | 0.37 | % | 0.27 | % | ||||||||||
| Portfolio turnover rate |
33 | % | 40 | % | 37 | % | 37 | % | 36 | % | ||||||||||
| Service Class | ||||||||||||||||||||
| 9/30/16 | 9/30/15** | 9/30/14** | 9/30/13** | 9/30/12** | ||||||||||||||||
| Inception date | 9/30/05 | |||||||||||||||||||
| Net asset value, beginning of period |
$ | 17.21 | $ | 19.37 | $ | 20.27 | $ | 16.87 | $ | 13.11 | ||||||||||
|
|
|
|
|
|
|
|
|
|
|
|||||||||||
| Income/(loss) from investment operations: |
||||||||||||||||||||
| Net investment income (loss) |
(0.00 | )*(c) | (0.01 | )* | (0.04 | )* | 0.02 | * | 0.00 | (c) | ||||||||||
| Net realized and unrealized gains/(losses) on investments |
2.80 | * | (0.08 | )* | 1.12 | * | 4.72 | * | 3.87 | |||||||||||
|
|
|
|
|
|
|
|
|
|
|
|||||||||||
| Total income/(loss) from investment operations |
2.80 | (0.09 | ) | 1.08 | 4.74 | 3.87 | ||||||||||||||
|
|
|
|
|
|
|
|
|
|
|
|||||||||||
| Less distributions from: |
||||||||||||||||||||
| Net investment income |
0.01 | — | — | 0.04 | 0.02 | |||||||||||||||
| Net realized gains |
2.02 | 2.07 | 1.98 | 1.30 | 0.09 | |||||||||||||||
|
|
|
|
|
|
|
|
|
|
|
|||||||||||
| Total distributions |
2.03 | 2.07 | 1.98 | 1.34 | 0.11 | |||||||||||||||
|
|
|
|
|
|
|
|
|
|
|
|||||||||||
| Net asset value, end of period |
$ | 17.98 | $ | 17.21 | $ | 19.37 | $ | 20.27 | $ | 16.87 | ||||||||||
|
|
|
|
|
|
|
|
|
|
|
|||||||||||
| Total return(a) |
17.96 | % | (1.12 | )% | 5.32 | % | 30.26 | % | 29.63 | % | ||||||||||
| Ratios/Supplemental Data: |
||||||||||||||||||||
| Net assets, end of period (in thousands) |
$ | 2,579 | $ | 1,741 | $ | 71 | $ | 87 | $ | 44 | ||||||||||
| Ratios to average net assets: |
||||||||||||||||||||
| Net expenses |
1.14 | % | 1.14 | % | 1.13 | %(b) | 1.13 | %(b) | 1.14 | %(b) | ||||||||||
| Gross expenses |
1.14 | % | 1.14 | % | 1.13 | % | 1.14 | % | 1.15 | % | ||||||||||
| Net investment income (loss) |
(0.00 | )%(d) | (0.07 | )% | (0.19 | )% | 0.09 | % | 0.04 | % | ||||||||||
| Portfolio turnover rate |
33 | % | 40 | % | 37 | % | 37 | % | 36 | % | ||||||||||
See accompanying notes to financial statements.
| 106 | Financial Highlights |
Table of Contents
International Equity Fund
Financial Highlights
Selected data based on a share outstanding throughout the fiscal years indicated
| Investment Class | ||||||||||||||||||||
| 9/30/16 | 9/30/15** | 9/30/14** | 9/30/13** | 9/30/12** | ||||||||||||||||
| Inception date | 11/25/97 | |||||||||||||||||||
| Net asset value, beginning of period |
$ | 11.41 | $ | 12.72 | $ | 12.71 | $ | 10.68 | $ | 9.25 | ||||||||||
|
|
|
|
|
|
|
|
|
|
|
|||||||||||
| Income/(loss) from investment operations: |
||||||||||||||||||||
| Net investment income |
0.20 | * | 0.18 | * | 0.30 | * | 0.18 | * | 0.20 | * | ||||||||||
| Net realized and unrealized gains/(losses) on investments |
0.40 | * | (1.15 | )* | (0.08 | )* | 2.09 | * | 1.47 | * | ||||||||||
|
|
|
|
|
|
|
|
|
|
|
|||||||||||
| Total income/(loss) from investment operations |
0.60 | (0.97 | ) | 0.22 | 2.27 | 1.67 | ||||||||||||||
|
|
|
|
|
|
|
|
|
|
|
|||||||||||
| Less distributions from: |
||||||||||||||||||||
| Net investment income |
0.18 | 0.34 | 0.21 | 0.24 | 0.24 | |||||||||||||||
|
|
|
|
|
|
|
|
|
|
|
|||||||||||
| Total distributions |
0.18 | 0.34 | 0.21 | 0.24 | 0.24 | |||||||||||||||
|
|
|
|
|
|
|
|
|
|
|
|||||||||||
| Net asset value, end of period |
$ | 11.83 | $ | 11.41 | $ | 12.72 | $ | 12.71 | $ | 10.68 | ||||||||||
|
|
|
|
|
|
|
|
|
|
|
|||||||||||
| Total return(a) |
5.32 | % | (7.80 | )% | 1.69 | % | 21.57 | % | 18.43 | % | ||||||||||
| Ratios/Supplemental Data: |
||||||||||||||||||||
| Net assets, end of period (in thousands) |
$ | 1,238,011 | $ | 1,284,412 | $ | 1,724,647 | $ | 1,836,243 | $ | 1,984,087 | ||||||||||
| Ratios to average net assets: |
||||||||||||||||||||
| Net expenses |
0.57 | % | 0.56 | % | 0.56 | %(b) | 0.56 | %(b) | 0.56 | %(b) | ||||||||||
| Gross expenses |
0.57 | % | 0.56 | % | 0.56 | % | 0.56 | % | 0.56 | % | ||||||||||
| Net investment income |
1.73 | % | 1.38 | % | 2.29 | % | 1.57 | % | 2.03 | % | ||||||||||
| Portfolio turnover rate |
33 | % | 26 | % | 39 | % | 47 | % | 50 | % | ||||||||||
| Service Class | ||||||||||||||||||||
| 9/30/16 | 9/30/15** | 9/30/14** | 9/30/13** | 9/30/12** | ||||||||||||||||
| Inception date | 1/3/01 | |||||||||||||||||||
| Net asset value, beginning of period |
$ | 11.33 | $ | 12.62 | $ | 12.61 | $ | 10.59 | $ | 9.17 | ||||||||||
|
|
|
|
|
|
|
|
|
|
|
|||||||||||
| Income/(loss) from investment operations: |
||||||||||||||||||||
| Net investment income |
0.17 | * | 0.08 | * | 0.26 | * | 0.15 | * | 0.14 | * | ||||||||||
| Net realized and unrealized gains/(losses) on investments |
0.40 | * | (1.06 | )* | (0.08 | )* | 2.07 | * | 1.49 | * | ||||||||||
|
|
|
|
|
|
|
|
|
|
|
|||||||||||
| Total income/(loss) from investment operations |
0.57 | (0.98 | ) | 0.18 | 2.22 | 1.63 | ||||||||||||||
|
|
|
|
|
|
|
|
|
|
|
|||||||||||
| Less distributions from: |
||||||||||||||||||||
| Net investment income |
0.14 | 0.31 | 0.17 | 0.20 | 0.21 | |||||||||||||||
|
|
|
|
|
|
|
|
|
|
|
|||||||||||
| Total distributions |
0.14 | 0.31 | 0.17 | 0.20 | 0.21 | |||||||||||||||
|
|
|
|
|
|
|
|
|
|
|
|||||||||||
| Net asset value, end of period |
$ | 11.76 | $ | 11.33 | $ | 12.62 | $ | 12.61 | $ | 10.59 | ||||||||||
|
|
|
|
|
|
|
|
|
|
|
|||||||||||
| Total return(a) |
5.01 | % | (7.95 | )% | 1.42 | % | 21.19 | % | 18.11 | % | ||||||||||
| Ratios/Supplemental Data: |
||||||||||||||||||||
| Net assets, end of period (in thousands) |
$ | 17,796 | $ | 19,562 | $ | 92,749 | $ | 101,204 | $ | 119,576 | ||||||||||
| Ratios to average net assets: |
||||||||||||||||||||
| Net expenses |
0.82 | % | 0.81 | % | 0.81 | %(b) | 0.81 | %(b) | 0.81 | %(b) | ||||||||||
| Gross expenses |
0.82 | % | 0.81 | % | 0.81 | % | 0.81 | % | 0.81 | % | ||||||||||
| Net investment income |
1.45 | % | 0.63 | % | 2.03 | % | 1.31 | % | 1.39 | % | ||||||||||
| Portfolio turnover rate |
33 | % | 26 | % | 39 | % | 47 | % | 50 | % | ||||||||||
See accompanying notes to financial statements.
| Financial Highlights | 107 |
Table of Contents
Strategic Investment Fund
Financial Highlights
Selected data based on a share outstanding throughout the fiscal years indicated
| Investment Class | ||||||||||||||||||||
| 9/30/16 | 9/30/15** | 9/30/14** | 9/30/13** | 9/30/12** | ||||||||||||||||
| Inception date | 10/29/99 | |||||||||||||||||||
| Net asset value, beginning of period |
$ | 11.91 | $ | 13.54 | $ | 13.09 | $ | 11.88 | $ | 10.23 | ||||||||||
|
|
|
|
|
|
|
|
|
|
|
|||||||||||
| Income/(loss) from investment operations: |
||||||||||||||||||||
| Net investment income |
0.23 | * | 0.21 | * | 0.25 | * | 0.22 | * | 0.22 | * | ||||||||||
| Net realized and unrealized gains/(losses) on investments |
0.77 | * | (0.49 | )* | 0.90 | * | 1.22 | * | 1.66 | * | ||||||||||
|
|
|
|
|
|
|
|
|
|
|
|||||||||||
| Total income/(loss) from investment operations |
1.00 | (0.28 | ) | 1.15 | 1.44 | 1.88 | ||||||||||||||
|
|
|
|
|
|
|
|
|
|
|
|||||||||||
| Less distributions from: |
||||||||||||||||||||
| Net investment income |
0.20 | 0.25 | 0.22 | 0.23 | 0.23 | |||||||||||||||
| Net realized gains |
0.60 | 1.10 | 0.48 | — | — | |||||||||||||||
|
|
|
|
|
|
|
|
|
|
|
|||||||||||
| Total distributions |
0.80 | 1.35 | 0.70 | 0.23 | 0.23 | |||||||||||||||
|
|
|
|
|
|
|
|
|
|
|
|||||||||||
| Net asset value, end of period |
$ | 12.11 | $ | 11.91 | $ | 13.54 | $ | 13.09 | $ | 11.88 | ||||||||||
|
|
|
|
|
|
|
|
|
|
|
|||||||||||
| Total return(a) |
8.83 | % | (2.46 | )% | 8.98 | % | 12.34 | % | 18.67 | % | ||||||||||
| Ratios/Supplemental Data: |
||||||||||||||||||||
| Net assets, end of period (in thousands) |
$ | 757,680 | $ | 754,367 | $ | 835,338 | $ | 827,998 | $ | 742,918 | ||||||||||
| Ratios to average net assets: |
||||||||||||||||||||
| Net expenses |
0.36 | % | 0.36 | % | 0.35 | %(b) | 0.34 | %(b) | 0.34 | %(b) | ||||||||||
| Gross expenses |
0.36 | % | 0.36 | % | 0.35 | % | 0.36 | % | 0.36 | % | ||||||||||
| Net investment income |
1.94 | % | 1.61 | % | 1.84 | % | 1.74 | % | 1.93 | % | ||||||||||
| Portfolio turnover rate |
109 | % | 144 | % | 185 | % | 153 | % | 188 | % | ||||||||||
| Service Class | ||||||||||||||||||||
| 9/30/16 | 9/30/15** | 9/30/14** | 9/30/13** | 9/30/12** | ||||||||||||||||
| Inception date | 9/30/05 | |||||||||||||||||||
| Net asset value, beginning of period |
$ | 11.81 | $ | 13.44 | $ | 12.99 | $ | 11.80 | $ | 10.17 | ||||||||||
|
|
|
|
|
|
|
|
|
|
|
|||||||||||
| Income/(loss) from investment operations: |
||||||||||||||||||||
| Net investment income |
0.20 | * | 0.17 | * | 0.21 | * | 0.18 | * | 0.18 | * | ||||||||||
| Net realized and unrealized gains/(losses) on investments |
0.76 | * | (0.48 | )* | 0.90 | * | 1.21 | * | 1.66 | * | ||||||||||
|
|
|
|
|
|
|
|
|
|
|
|||||||||||
| Total income/(loss) from investment operations |
0.96 | (0.31 | ) | 1.11 | 1.39 | 1.84 | ||||||||||||||
|
|
|
|
|
|
|
|
|
|
|
|||||||||||
| Less distributions from: |
||||||||||||||||||||
| Net investment income |
0.17 | 0.22 | 0.18 | 0.20 | 0.21 | |||||||||||||||
| Net realized gains |
0.60 | 1.10 | 0.48 | — | — | |||||||||||||||
|
|
|
|
|
|
|
|
|
|
|
|||||||||||
| Total distributions |
0.77 | 1.32 | 0.66 | 0.20 | 0.21 | |||||||||||||||
|
|
|
|
|
|
|
|
|
|
|
|||||||||||
| Net asset value, end of period |
$ | 12.00 | $ | 11.81 | $ | 13.44 | $ | 12.99 | $ | 11.80 | ||||||||||
|
|
|
|
|
|
|
|
|
|
|
|||||||||||
| Total return(a) |
8.53 | % | (2.72 | )% | 8.79 | % | 11.98 | % | 18.39 | % | ||||||||||
| Ratios/Supplemental Data: |
||||||||||||||||||||
| Net assets, end of period (in thousands) |
$ | 55 | $ | 60 | $ | 62 | $ | 57 | $ | 61 | ||||||||||
| Ratios to average net assets: |
||||||||||||||||||||
| Net expenses |
0.61 | % | 0.61 | % | 0.60 | %(b) | 0.59 | %(b) | 0.59 | %(b) | ||||||||||
| Gross expenses |
0.61 | % | 0.61 | % | 0.60 | % | 0.61 | % | 0.61 | % | ||||||||||
| Net investment income |
1.70 | % | 1.36 | % | 1.60 | % | 1.48 | % | 1.69 | % | ||||||||||
| Portfolio turnover rate |
109 | % | 144 | % | 185 | % | 153 | % | 188 | % | ||||||||||
See accompanying notes to financial statements.
| 108 | Financial Highlights |
Table of Contents
Income Fund
Financial Highlights
Selected data based on a share outstanding throughout the fiscal years indicated
| Investment Class | ||||||||||||||||||||
| 9/30/16 | 9/30/15** | 9/30/14** | 9/30/13** | 9/30/12** | ||||||||||||||||
| Inception date | 11/21/97 | |||||||||||||||||||
| Net asset value, beginning of period |
$ | 9.45 | $ | 9.51 | $ | 9.34 | $ | 10.01 | $ | 9.73 | ||||||||||
|
|
|
|
|
|
|
|
|
|
|
|||||||||||
| Income/(loss) from investment operations: |
|
|||||||||||||||||||
| Net investment income |
0.26 | * | 0.25 | 0.26 | 0.21 | 0.25 | ||||||||||||||
| Net realized and unrealized gains/(losses) on investments |
0.31 | * | (0.05 | ) | 0.17 | (0.32 | ) | 0.44 | ||||||||||||
|
|
|
|
|
|
|
|
|
|
|
|||||||||||
| Total income/(loss) from investment operations |
0.57 | 0.20 | 0.43 | (0.11 | ) | 0.69 | ||||||||||||||
|
|
|
|
|
|
|
|
|
|
|
|||||||||||
| Less distributions from: |
||||||||||||||||||||
| Net investment income |
0.26 | 0.26 | 0.26 | 0.21 | 0.26 | |||||||||||||||
| Net realized gains |
0.09 | — | — | 0.35 | 0.15 | |||||||||||||||
|
|
|
|
|
|
|
|
|
|
|
|||||||||||
| Total distributions |
0.35 | 0.26 | 0.26 | 0.56 | 0.41 | |||||||||||||||
|
|
|
|
|
|
|
|
|
|
|
|||||||||||
| Net asset value, end of period |
$ | 9.67 | $ | 9.45 | $ | 9.51 | $ | 9.34 | $ | 10.01 | ||||||||||
|
|
|
|
|
|
|
|
|
|
|
|||||||||||
| Total return(a) |
6.18 | % | 2.05 | % | 4.61 | % | (1.13 | )% | 7.28 | % | ||||||||||
| Ratios/Supplemental Data: |
||||||||||||||||||||
| Net assets, end of period (in thousands) |
$ | 298,908 | $ | 291,252 | $ | 322,946 | $ | 341,603 | $ | 372,643 | ||||||||||
| Ratios to average net assets: |
||||||||||||||||||||
| Net expenses |
0.24 | % | 0.23 | % | 0.23 | %(b) | 0.21 | %(b) | 0.21 | %(b) | ||||||||||
| Gross expenses |
0.24 | % | 0.23 | % | 0.23 | % | 0.23 | % | 0.23 | % | ||||||||||
| Net investment income |
2.79 | % | 2.65 | % | 2.73 | % | 2.21 | % | 2.58 | % | ||||||||||
| Portfolio turnover rate |
219 | % | 297 | % | 308 | % | 348 | % | 403 | % | ||||||||||
| Service Class | ||||||||||||||||||||
| 9/30/16 | 9/30/15** | 9/30/14** | 9/30/13** | 9/30/12** | ||||||||||||||||
| Inception date | 9/30/05 | |||||||||||||||||||
| Net asset value, beginning of period |
$ | 9.66 | $ | 9.72 | $ | 9.55 | $ | 10.23 | $ | 9.94 | ||||||||||
|
|
|
|
|
|
|
|
|
|
|
|||||||||||
| Income/(loss) from investment operations: |
|
|||||||||||||||||||
| Net investment income |
0.25 | * | 0.23 | 0.24 | 0.19 | 0.24 | ||||||||||||||
| Net realized and unrealized gains/(losses) on investments |
0.31 | * | (0.05 | ) | 0.17 | (0.33 | ) | 0.44 | ||||||||||||
|
|
|
|
|
|
|
|
|
|
|
|||||||||||
| Total income/(loss) from investment operations |
0.56 | 0.18 | 0.41 | (0.14 | ) | 0.68 | ||||||||||||||
|
|
|
|
|
|
|
|
|
|
|
|||||||||||
| Less distributions from: |
||||||||||||||||||||
| Net investment income |
0.24 | 0.24 | 0.24 | 0.19 | 0.24 | |||||||||||||||
| Net realized gains |
0.09 | — | — | 0.35 | 0.15 | |||||||||||||||
|
|
|
|
|
|
|
|
|
|
|
|||||||||||
| Total distributions |
0.33 | 0.24 | 0.24 | 0.54 | 0.39 | |||||||||||||||
|
|
|
|
|
|
|
|
|
|
|
|||||||||||
| Net asset value, end of period |
$ | 9.89 | $ | 9.66 | $ | 9.72 | $ | 9.55 | $ | 10.23 | ||||||||||
|
|
|
|
|
|
|
|
|
|
|
|||||||||||
| Total return(a) |
5.95 | % | 1.81 | % | 4.32 | % | (1.40 | )% | 7.02 | % | ||||||||||
| Ratios/Supplemental Data: |
||||||||||||||||||||
| Net assets, end of period (in thousands) |
$ | 181 | $ | 248 | $ | 327 | $ | 316 | $ | 320 | ||||||||||
| Ratios to average net assets: |
||||||||||||||||||||
| Net expenses |
0.49 | % | 0.48 | % | 0.48 | %(b) | 0.46 | %(b) | 0.46 | %(b) | ||||||||||
| Gross expenses |
0.49 | % | 0.48 | % | 0.48 | % | 0.48 | % | 0.48 | % | ||||||||||
| Net investment income |
2.58 | % | 2.40 | % | 2.47 | % | 2.00 | % | 2.33 | % | ||||||||||
| Portfolio turnover rate |
219 | % | 297 | % | 308 | % | 348 | % | 403 | % | ||||||||||
See accompanying notes to financial statements.
| Financial Highlights | 109 |
Table of Contents
GE Institutional Funds
Notes to Financial Highlights
| (a) | Total returns are historical and assume changes in share price and reinvestment of dividends and capital gains distributions. |
| (b) | Includes contractual management fee waiver related to the Fund’s investments in the GE Institutional Money Market Fund (the “Money Market Fund”). The fee waiver agreement was terminated effective June 30, 2014 with the closure of the Money Market Fund. |
| (c) | Less than $0.005. |
| (d) | Less than 0.005%. |
| * | Per share values have been calculated using the average share method. |
| ** | Beginning with the fiscal year ended September 30, 2016, the Funds were audited by Ernst & Young LLP. The previous years were audited by another independent registered public accounting firm. |
See accompanying notes to financial statements.
| Notes to Financial Highlights | 110 |
Table of Contents
This page has been intentionally left blank.
Table of Contents
GE Institutional Funds
Statements of Assets and Liabilities — September 30, 2016
| U.S. Equity Fund |
S&P 500 Index Fund |
U.S. Large-Cap Core Equity Fund |
||||||||||
| Assets |
||||||||||||
| Investments in securities, at fair value (cost $491,699,328; $12,754,434; $45,920,605; $256,114,297; $976,277,205; $1,164,346,724; $618,047,483 and $287,011,856, respectively) |
$ | 578,157,789 | $ | 15,218,405 | $ | 52,076,598 | ||||||
| Investments in affiliated securities, at fair value (cost $0; $210,686; $0; $0; $0; $0; $22,506,031 and $0, respectively) |
— | 239,979 | — | |||||||||
| Short-term affiliated investments, at fair value |
8,358,418 | 701,455 | 1,428,579 | |||||||||
| Cash |
— | 140 | — | |||||||||
| Restricted cash(1) |
— | 31,500 | — | |||||||||
| Foreign currency (cost $0; $0; $0; $0; $0; $440,283; $71,325 and $0, respectively) |
— | — | — | |||||||||
| Receivable for investments sold |
42,901,700 | 299 | 369,631 | |||||||||
| Income receivables (including receivables from affiliated investments of $2,845, $2,042, $544, $1,168, $20,405, $8,753, $20,802 and $4,947, respectively) |
618,257 | 17,611 | 55,052 | |||||||||
| Receivable for fund shares sold |
33,005 | 27,118 | 1,773 | |||||||||
| Receivable for variation margin on open futures contracts |
— | 2,117 | 1,190 | |||||||||
|
|
|
|
|
|
|
|||||||
| Total assets |
630,069,169 | 16,238,624 | 53,932,823 | |||||||||
|
|
|
|
|
|
|
|||||||
| Liabilities |
||||||||||||
| Distribution payable to shareholders |
— | — | — | |||||||||
| Payable for investments purchased |
6,360,863 | — | 696,431 | |||||||||
| Payable for fund shares redeemed |
20,317,957 | — | 11,844 | |||||||||
| Payable for variation margin on open centrally cleared swap contracts |
— | — | — | |||||||||
| Payable for variation margin on open futures contracts |
40,638 | — | — | |||||||||
| Payable to the Adviser (Note 6) |
184,515 | 1,987 | 21,550 | |||||||||
| Accrued other expenses |
10,219 | 314 | 968 | |||||||||
| Distribution and service fees (Note 6) |
19 | 1,510 | 177 | |||||||||
| Accrued foreign capital gains tax |
— | — | — | |||||||||
|
|
|
|
|
|
|
|||||||
| Total liabilities |
26,914,211 | 3,811 | 730,970 | |||||||||
|
|
|
|
|
|
|
|||||||
| Net Assets |
$ | 603,154,958 | $ | 16,234,813 | $ | 53,201,853 | ||||||
|
|
|
|
|
|
|
|||||||
| Net Assets Consist of: |
||||||||||||
| Capital paid in |
$ | 489,701,479 | $ | 22,295,620 | $ | 45,803,443 | ||||||
| Undistributed (distributions in excess of) net investment income |
6,822,971 | 232,106 | 715,789 | |||||||||
| Accumulated net realized gain (loss) |
20,172,951 | (8,790,618 | ) | 525,774 | ||||||||
| Net unrealized appreciation (depreciation) on: |
||||||||||||
| Investments |
86,458,461 | 2,493,264 | 6,155,993 | |||||||||
| Futures |
(904 | ) | 4,441 | 854 | ||||||||
| Swap contracts |
— | — | — | |||||||||
| Foreign currency related transactions |
— | — | — | |||||||||
|
|
|
|
|
|
|
|||||||
| Net Assets |
$ | 603,154,958 | $ | 16,234,813 | $ | 53,201,853 | ||||||
|
|
|
|
|
|
|
|||||||
| Investment Class: |
||||||||||||
| Net Assets |
$ | 603,059,530 | $ | 8,874,743 | $ | 52,332,009 | ||||||
| Shares outstanding ($0.001 par value, unlimited shares authorized) |
44,679,613 | 429,008 | 6,730,785 | |||||||||
| Net asset value, offering and redemption price per share |
$ | 13.50 | $ | 20.69 | $ | 7.78 | ||||||
| Service Class: |
||||||||||||
| Net Assets |
$ | 95,428 | $ | 7,360,070 | $ | 869,844 | ||||||
| Shares outstanding ($0.001 par value, unlimited shares authorized) |
6,728 | 348,902 | 112,859 | |||||||||
| Net asset value, offering and redemption price per share |
$ | 14.18 | $ | 21.09 | $ | 7.71 | ||||||
| (1) Deposits at broker for futures contracts. |
||||||||||||
See accompanying notes to financial statements.
| 112 | Statements of Assets and Liabilities |
Table of Contents
| Premier Growth Equity Fund |
Small-Cap Equity Fund |
International Equity Fund |
Strategic Investment Fund |
Income Fund |
||||||||||||||
| $ |
323,252,989 |
|
$ | 1,214,471,072 | $ | 1,217,001,600 | $ | 668,989,404 | $ | 293,843,832 | ||||||||
|
|
— |
|
— | — | 23,216,844 | — | ||||||||||||
| 12,844,727 | 68,288,206 | 39,027,683 | 85,905,257 | 29,678,865 | ||||||||||||||
| — | — | 20,072 | — | — | ||||||||||||||
| — | 704,000 | 324,000 | 940,000 | — | ||||||||||||||
| — | — | 442,634 | 71,422 | — | ||||||||||||||
| 2,318,094 | 2,503,053 | — | 8,721,417 | 6,619,942 | ||||||||||||||
|
|
174,970 |
|
1,049,686 | 4,205,175 | 2,135,156 | 1,711,917 | ||||||||||||
| 39,732 | 16,211,011 | 355,166 | 238,825 | 34,097 | ||||||||||||||
| 17,472 | 99,466 | 13,113 | 156,267 | 23,506 | ||||||||||||||
|
|
|
|
|
|
|
|
|
|
|
|||||||||
| 338,647,984 | 1,303,326,494 | 1,261,389,443 | 790,374,592 | 331,912,159 | ||||||||||||||
|
|
|
|
|
|
|
|
|
|
|
|||||||||
| — | — | — | — | 237 | ||||||||||||||
| 1,208,216 | 1,013,599 | 4,615,401 | 32,219,729 | 32,676,380 | ||||||||||||||
| 81,879 | — | 22,044 | 90,364 | 19,584 | ||||||||||||||
| — | — | — | 55,655 | 69,230 | ||||||||||||||
| — | — | — | — | — | ||||||||||||||
| 102,697 | 924,844 | 574,860 | 220,359 | 56,199 | ||||||||||||||
| 5,754 | 19,514 | 20,687 | 11,911 | 924 | ||||||||||||||
| 2,344 | 522 | 3,655 | 11 | 37 | ||||||||||||||
| — | — | 345,900 | 41,467 | — | ||||||||||||||
|
|
|
|
|
|
|
|
|
|
|
|||||||||
| 1,400,890 | 1,958,479 | 5,582,547 | 32,639,496 | 32,822,591 | ||||||||||||||
|
|
|
|
|
|
|
|
|
|
|
|||||||||
| $ | 337,247,094 | $ | 1,301,368,015 | $ | 1,255,806,896 | $ | 757,735,096 | $ | 299,089,568 | |||||||||
|
|
|
|
|
|
|
|
|
|
|
|||||||||
| $ | 242,597,460 | $ | 1,029,924,854 | $ | 1,425,089,817 | $ | 693,460,851 | $ | 292,468,028 | |||||||||
| 1,728,714 | 1,346,261 | 21,640,409 | 11,785,501 | 211,089 | ||||||||||||||
| 25,759,642 | 31,774,706 | (243,187,730 | ) | 1,255,807 | 139,731 | |||||||||||||
| 67,138,692 | 238,193,867 | 52,308,976 | 51,611,267 | 6,831,976 | ||||||||||||||
| 22,586 | 128,327 | 17,674 | 92,833 | 7,484 | ||||||||||||||
| — | — | — | (464,825 | ) | (568,740 | ) | ||||||||||||
| — | — | (62,250 | ) | (6,338 | ) | — | ||||||||||||
|
|
|
|
|
|
|
|
|
|
|
|||||||||
| $ | 337,247,094 | $ | 1,301,368,015 | $ | 1,255,806,896 | $ | 757,735,096 | $ | 299,089,568 | |||||||||
|
|
|
|
|
|
|
|
|
|
|
|||||||||
| $ | 325,700,362 | $ | 1,298,788,567 | $ | 1,238,010,949 | $ | 757,680,349 | $ | 298,908,487 | |||||||||
| 22,884,452 | 72,302,956 | 104,670,736 | 62,590,275 | 30,908,155 | ||||||||||||||
| $ | 14.23 | $ | 17.96 | $ | 11.83 | $ | 12.11 | $ | 9.67 | |||||||||
| $ | 11,546,732 | $ | 2,579,448 | $ | 17,795,947 | $ | 54,747 | $ | 181,081 | |||||||||
| 821,403 | 143,470 | 1,512,860 | 4,562 | 18,303 | ||||||||||||||
| $ | 14.06 | $ | 17.98 | $ | 11.76 | $ | 12.00 | $ | 9.89 | |||||||||
See accompanying notes to financial statements.
| Statements of Assets and Liabilities | 113 |
Table of Contents
GE Institutional Funds
Statements of Operations — For the year ended September 30, 2016
| U.S. Equity Fund |
S&P 500 Index Fund |
U.S. Large-Cap Core Equity Fund |
||||||||||
| Investment Income |
||||||||||||
| Income |
||||||||||||
| Dividend (including dividend from affiliated investments of $151,784, $9,444, $16,036, $0, $0, $0, $457,263 and $0, respectively) |
$ | 12,039,670 | $ | 434,345 | $ | 1,265,940 | ||||||
| Interest (including interest from affiliated investments of $35,779, $1,406, $4,192, $19,746, $157,078, $67,198, $179,709 and $26,757, respectively) |
35,779 | 1,409 | 4,192 | |||||||||
| Less: Foreign taxes withheld |
(4,570 | ) | (17 | ) | (404 | ) | ||||||
|
|
|
|
|
|
|
|||||||
| Total income |
12,070,879 | 435,737 | 1,269,728 | |||||||||
|
|
|
|
|
|
|
|||||||
| Expenses |
||||||||||||
| Advisory and administration fees (Note 6) |
2,214,294 | 29,826 | 279,860 | |||||||||
| Distribution and service (Note 6): |
||||||||||||
| Service Class |
278 | 18,712 | 7,922 | |||||||||
| Trustees’ fees |
36,564 | 1,382 | 7,683 | |||||||||
| Other expenses |
290 | 112 | 39 | |||||||||
|
|
|
|
|
|
|
|||||||
| Total expenses |
2,251,426 | 50,032 | 295,504 | |||||||||
|
|
|
|
|
|
|
|||||||
| Net investment income |
$ | 9,819,453 | $ | 385,705 | $ | 974,224 | ||||||
|
|
|
|
|
|
|
|||||||
| Net Realized and Unrealized Gain (Loss) on Investments |
||||||||||||
| Realized gain (loss) on: |
||||||||||||
| Investments (including realized gain (loss) from affiliated investments of $2,954,853, $106,813, $336,225, $0, $0, $0, $1,146,399 and $0, respectively) |
$ | 32,265,359 | $ | 5,196,398 | $ | 1,284,696 | ||||||
| Futures |
(557,747 | ) | 82,126 | 123,949 | ||||||||
| Swap contracts |
— | — | — | |||||||||
| Foreign currency transactions |
39 | — | 3 | |||||||||
| Increase (decrease) in unrealized appreciation/depreciation on: |
||||||||||||
| Investments |
35,532,155 | (2,566,472 | ) | 4,075,319 | ||||||||
| Futures |
200,347 | 50,884 | (4,592 | ) | ||||||||
| Swap contracts |
— | — | — | |||||||||
| Foreign currency translations |
205 | — | 18 | |||||||||
|
|
|
|
|
|
|
|||||||
| Net realized and unrealized gain (loss) on investments |
67,440,358 | 2,762,936 | 5,479,393 | |||||||||
|
|
|
|
|
|
|
|||||||
| Net increase in Net Assets Resulting from Operations |
$ | 77,259,811 | $ | 3,148,641 | $ | 6,453,617 | ||||||
|
|
|
|
|
|
|
|||||||
| * | Includes change in accrued foreign capital gains tax of $(345,900), and $(41,467) for the International Equity Fund and Strategic Investment Fund, respectively. |
See accompanying notes to financial statements.
| 114 | Statements of Operations |
Table of Contents
| Premier Growth Equity Fund |
Small-Cap Equity Fund |
International Equity Fund |
Strategic Investment Fund |
Income Fund |
||||||||||||||
| $ |
4,471,207 |
|
$ | 13,504,809 | $ | 32,786,943 | $ | 10,300,590 | $ | 57,276 | ||||||||
|
|
19,746 |
|
157,078 | 64,531 | 7,497,278 | 8,867,372 | ||||||||||||
| — | (46,933 | ) | (3,629,347 | ) | (440,879 | ) | — | |||||||||||
|
|
|
|
|
|
|
|
|
|
|
|||||||||
| 4,490,953 | 13,614,954 | 29,222,127 | 17,356,989 | 8,924,648 | ||||||||||||||
|
|
|
|
|
|
|
|
|
|
|
|||||||||
| 1,258,565 | 10,562,654 | 7,110,433 | 2,672,281 | 676,555 | ||||||||||||||
|
|
24,547 |
|
4,916 | 45,726 | 149 | 552 | ||||||||||||
| 18,375 | 68,467 | 97,105 | 46,285 | 16,639 | ||||||||||||||
| 2,538 | 1,985 | 3,865 | 3,404 | 372 | ||||||||||||||
|
|
|
|
|
|
|
|
|
|
|
|||||||||
| 1,304,025 | 10,638,022 | 7,257,129 | 2,722,119 | 694,118 | ||||||||||||||
|
|
|
|
|
|
|
|
|
|
|
|||||||||
| $ | 3,186,928 | $ | 2,976,932 | $ | 21,964,998 | $ | 14,634,870 | $ | 8,230,530 | |||||||||
|
|
|
|
|
|
|
|
|
|
|
|||||||||
| $ |
30,282,914 |
|
$ | 48,141,411 | $ | (51,356,389 | ) | $ | 6,195,666 | $ | 2,484,044 | |||||||
| 1,013,067 | 2,094,826 | 6,389,767 | 1,207,220 | (456,598 | ) | |||||||||||||
| — | — | — | (171,228 | ) | (218,652 | ) | ||||||||||||
| — | — | (427,605 | ) | (22,139 | ) | — | ||||||||||||
| 13,902,563 | 149,778,881 | 87,827,039 | * | 41,521,558 | * | 7,665,754 | ||||||||||||
| (41,804 | ) | 958,595 | 327,733 | 499,488 | 362,641 | |||||||||||||
| — | — | — | (264,050 | ) | (331,496 | ) | ||||||||||||
| — | — | 40,738 | 2,070 | — | ||||||||||||||
|
|
|
|
|
|
|
|
|
|
|
|||||||||
| 45,156,740 | 200,973,713 | 42,801,283 | 48,968,585 | 9,505,693 | ||||||||||||||
|
|
|
|
|
|
|
|
|
|
|
|||||||||
| $ | 48,343,668 | $ | 203,950,645 | $ | 64,766,281 | $ | 63,603,455 | $ | 17,736,223 | |||||||||
|
|
|
|
|
|
|
|
|
|
|
|||||||||
See accompanying notes to financial statements.
| Statements of Operations | 115 |
Table of Contents
GE Institutional Funds
Statements of Changes in Net Assets
| U.S. Equity Fund | S&P 500 Index Fund | |||||||||||||||
| Year Ended September 30, 2016 |
Year Ended September 30, 2015** |
Year Ended September 30, 2016 |
Year Ended September 30, 2015** |
|||||||||||||
| Increase (Decrease) in Net Assets |
|
|||||||||||||||
| Operations: |
||||||||||||||||
| Net investment income |
$ | 9,819,453 | $ | 9,710,584 | $ | 385,705 | $ | 594,729 | ||||||||
| Net realized gain (loss) on investments, futures and foreign currency transactions |
31,707,651 | 114,888,316 | 5,278,524 | 6,306,220 | ||||||||||||
| Net increase (decrease) in unrealized appreciation/depreciation on investments, futures and foreign currency translations |
35,732,707 | (140,741,014 | ) | (2,515,588 | ) | (6,272,597 | ) | |||||||||
|
|
|
|
|
|
|
|
|
|||||||||
| Net increase (decrease) from operations |
77,259,811 | (16,142,114 | ) | 3,148,641 | 628,352 | |||||||||||
|
|
|
|
|
|
|
|
|
|||||||||
| Distributions to shareholders from: |
|
|||||||||||||||
| Net investment income |
||||||||||||||||
| Investment Class |
(9,776,530 | ) | (10,530,007 | ) | (419,862 | ) | (530,385 | ) | ||||||||
| Service Class |
(1,625 | ) | (1,455 | ) | (134,350 | ) | (129,629 | ) | ||||||||
| Net realized gains |
||||||||||||||||
| Investment Class |
(101,216,102 | ) | (92,508,676 | ) | — | — | ||||||||||
| Service Class |
(20,100 | ) | (15,079 | ) | — | — | ||||||||||
|
|
|
|
|
|
|
|
|
|||||||||
| Total distributions |
(111,014,357 | ) | (103,055,217 | ) | (554,212 | ) | (660,014 | ) | ||||||||
|
|
|
|
|
|
|
|
|
|||||||||
| Increase (decrease) in assets from operations and distributions |
(33,754,546 | ) | (119,197,331 | ) | 2,594,429 | (31,662 | ) | |||||||||
|
|
|
|
|
|
|
|
|
|||||||||
| Share transactions: |
||||||||||||||||
| Proceeds from sale of shares |
||||||||||||||||
| Investment Class |
21,123,025 | 34,686,103 | 3,544,265 | 6,032,321 | ||||||||||||
| Service Class |
20,465 | 49,265 | 896,383 | 752,048 | ||||||||||||
| Value of distributions reinvested |
||||||||||||||||
| Investment Class |
110,532,200 | 103,038,406 | 419,839 | 430,561 | ||||||||||||
| Service Class |
21,641 | 16,458 | 133,812 | 129,109 | ||||||||||||
| Cost of shares redeemed |
||||||||||||||||
| Investment Class |
(109,875,352 | ) | (240,277,040 | ) | (16,828,064 | ) | (18,914,519 | ) | ||||||||
| Service Class |
(40,174 | ) | (56,454 | ) | (1,503,268 | ) | (896,204 | ) | ||||||||
|
|
|
|
|
|
|
|
|
|||||||||
| Net increase (decrease) from share transactions |
21,781,805 | (102,543,262 | ) | (13,337,033 | ) | (12,466,684 | ) | |||||||||
|
|
|
|
|
|
|
|
|
|||||||||
| Total increase (decrease) in net assets |
(11,972,741 | ) | (221,740,593 | ) | (10,742,604 | ) | (12,498,346 | ) | ||||||||
| Net Assets |
||||||||||||||||
| Beginning of year |
615,127,699 | 836,868,292 | 26,977,417 | 39,475,763 | ||||||||||||
|
|
|
|
|
|
|
|
|
|||||||||
| End of year |
$ | 603,154,958 | $ | 615,127,699 | $ | 16,234,813 | $ | 26,977,417 | ||||||||
|
|
|
|
|
|
|
|
|
|||||||||
| Undistributed (distributions in excess of) net investment income, end of year |
$ | 6,822,971 | $ | 7,099,401 | $ | 232,106 | $ | 413,632 | ||||||||
| Changes in Fund Shares |
|
|||||||||||||||
| Investment Class |
||||||||||||||||
| Shares sold |
1,635,190 | 2,154,666 | 186,211 | 310,559 | ||||||||||||
| Issued for distributions reinvested |
8,793,333 | 6,600,795 | 21,889 | 22,240 | ||||||||||||
| Shares redeemed |
(8,296,312 | ) | (14,517,431 | ) | (870,643 | ) | (957,242 | ) | ||||||||
|
|
|
|
|
|
|
|
|
|||||||||
| Net increase (decrease) in fund shares |
2,132,211 | (5,761,970 | ) | (662,543 | ) | (624,443 | ) | |||||||||
|
|
|
|
|
|
|
|
|
|||||||||
| Service Class |
||||||||||||||||
| Shares sold |
1,339 | 2,959 | 45,325 | 37,912 | ||||||||||||
| Issued for distributions reinvested |
1,635 | 1,010 | 6,827 | 6,527 | ||||||||||||
| Shares redeemed |
(3,157 | ) | (3,563 | ) | (75,576 | ) | (44,479 | ) | ||||||||
|
|
|
|
|
|
|
|
|
|||||||||
| Net increase (decrease) in fund shares |
(183 | ) | 406 | (23,424 | ) | (40 | ) | |||||||||
|
|
|
|
|
|
|
|
|
|||||||||
| * | Includes $53,149,863 of net realized gains from redemptions in-kind. |
| ** | Beginning with the fiscal year ended September 30, 2016, the Funds were audited by Ernst & Young LLP. The previous years were audited by another independent registered public accounting firm. |
See accompanying notes to financial statements.
| 116 | Statements of Changes in Net Assets |
Table of Contents
| U.S. Large-Cap Core Equity Fund | Premier Growth Equity Fund | Small-Cap Equity Fund | ||||||||||||||||||||
| Year Ended September 30, 2016 |
Year Ended September 30, 2015** |
Year Ended September 30, 2016 |
Year Ended September 30, 2015** |
Year Ended September 30, 2016 |
Year Ended September 30, 2015** |
|||||||||||||||||
| $ | 974,224 | $ | 1,317,080 | $ | 3,186,928 | $ | 3,476,376 | $ | 2,976,932 | $ | 2,176,128 | |||||||||||
| |
1,408,648 |
|
12,395,598 | 31,295,981 | 81,687,620 | * | 50,236,237 | 131,806,056 | ||||||||||||||
| |
4,070,745 |
|
(15,671,708 | ) | 13,860,759 | (82,804,737 | ) | 150,737,476 | (140,276,190 | ) | ||||||||||||
|
|
|
|
|
|
|
|
|
|
|
|
|
|||||||||||
| 6,453,617 | (1,959,030 | ) | 48,343,668 | 2,359,259 | 203,950,645 | (6,294,006 | ) | |||||||||||||||
|
|
|
|
|
|
|
|
|
|
|
|
|
|||||||||||
| (1,156,540 | ) | (1,342,057 | ) | (3,274,744 | ) | (3,720,776 | ) | (2,263,681 | ) | (1,374,532 | ) | |||||||||||
| (76,196 | ) | (52,746 | ) | (49,836 | ) | (26,469 | ) | (981 | ) | — | ||||||||||||
| (11,092,379 | ) | (14,455,771 | ) | (29,010,695 | ) | (35,918,312 | ) | (135,317,625 | ) | (132,249,163 | ) | |||||||||||
| (837,244 | ) | (683,259 | ) | (575,259 | ) | (346,446 | ) | (207,202 | ) | (7,659 | ) | |||||||||||
|
|
|
|
|
|
|
|
|
|
|
|
|
|||||||||||
| (13,162,359 | ) | (16,533,833 | ) | (32,910,534 | ) | (40,012,003 | ) | (137,789,489 | ) | (133,631,354 | ) | |||||||||||
|
|
|
|
|
|
|
|
|
|
|
|
|
|||||||||||
| |
(6,708,742 |
) |
(18,492,863 | ) | 15,433,134 | (37,652,744 | ) | 66,161,156 | (139,925,360 | ) | ||||||||||||
|
|
|
|
|
|
|
|
|
|
|
|
|
|||||||||||
| 3,310,059 | 10,054,919 | 55,895,930 | 106,044,404 | 59,925,029 | 84,339,060 | |||||||||||||||||
| 224,319 | 516,762 | 6,508,525 | 3,538,979 | 730,980 | 1,899,623 | |||||||||||||||||
| 12,245,160 | 15,793,694 | 32,115,120 | 38,382,651 | 137,581,306 | 133,620,989 | |||||||||||||||||
| 913,420 | 735,986 | 624,951 | 372,773 | 208,183 | 7,659 | |||||||||||||||||
| (16,619,783 | ) | (44,589,061 | ) | (111,333,277 | ) | (201,640,905 | ) | (136,736,850 | ) | (170,538,400 | ) | |||||||||||
| (3,762,143 | ) | (551,232 | ) | (2,044,128 | ) | (1,370,477 | ) | (227,265 | ) | (53,119 | ) | |||||||||||
|
|
|
|
|
|
|
|
|
|
|
|
|
|||||||||||
| (3,688,968 | ) | (18,038,932 | ) | (18,232,879 | ) | (54,672,575 | ) | 61,481,383 | 49,275,812 | |||||||||||||
|
|
|
|
|
|
|
|
|
|
|
|
|
|||||||||||
| |
(10,397,710 |
) |
(36,531,795 | ) | (2,799,745 | ) | (92,325,319 | ) | 127,642,539 | (90,649,548 | ) | |||||||||||
| 63,599,563 | 100,131,358 | 340,046,839 | 432,372,158 | 1,173,725,476 | 1,264,375,024 | |||||||||||||||||
|
|
|
|
|
|
|
|
|
|
|
|
|
|||||||||||
| $ | 53,201,853 | $ | 63,599,563 | $ | 337,247,094 | $ | 340,046,839 | $ | 1,301,368,015 | $ | 1,173,725,476 | |||||||||||
|
|
|
|
|
|
|
|
|
|
|
|
|
|||||||||||
| $ |
715,789 |
|
$ | 986,347 | $ | 1,728,714 | $ | 2,189,133 | $ | 1,346,261 | $ | 859,333 | ||||||||||
| 432,443 | 1,007,527 | 4,156,779 | 7,079,612 | 3,564,517 | 4,486,265 | |||||||||||||||||
| 1,688,988 | 1,641,756 | 2,368,372 | 2,645,255 | 8,779,917 | 7,301,693 | |||||||||||||||||
| (2,113,052 | ) | (4,511,311 | ) | (8,206,857 | ) | (13,797,090 | ) | (8,267,615 | ) | (9,002,090 | ) | |||||||||||
|
|
|
|
|
|
|
|
|
|
|
|
|
|||||||||||
| 8,379 | (1,862,028 | ) | (1,681,706 | ) | (4,072,223 | ) | 4,076,819 | 2,785,868 | ||||||||||||||
|
|
|
|
|
|
|
|
|
|
|
|
|
|||||||||||
| 29,485 | 53,845 | 494,832 | 237,641 | 43,619 | 99,952 | |||||||||||||||||
| 127,040 | 77,067 | 46,569 | 25,923 | 13,243 | 417 | |||||||||||||||||
| (513,329 | ) | (58,177 | ) | (152,431 | ) | (90,000 | ) | (14,595 | ) | (2,852 | ) | |||||||||||
|
|
|
|
|
|
|
|
|
|
|
|
|
|||||||||||
| (356,804 | ) | 72,735 | 388,970 | 173,564 | 42,267 | 97,517 | ||||||||||||||||
|
|
|
|
|
|
|
|
|
|
|
|
|
|||||||||||
See accompanying notes to financial statements.
| Statements of Changes in Net Assets | 117 |
Table of Contents
GE Institutional Funds
Statements of Changes in Net Assets
| International Equity Fund | ||||||||
| Year Ended September 30, 2016 |
Year Ended September 30, 2015** |
|||||||
| Increase (Decrease) in Net Assets |
||||||||
| Operations: |
||||||||
| Net investment income |
$ | 21,964,998 | $ | 21,421,320 | ||||
| Net realized gain (loss) on investments, futures, swap contracts and foreign currency transactions |
(45,394,227 | ) | 110,110,756 | |||||
| Net increase (decrease) in unrealized appreciation/depreciation on investments, futures, swap contracts and foreign currency translations |
88,195,510 | (233,019,206 | ) | |||||
|
|
|
|
|
|||||
| Net increase (decrease) from operations |
64,766,281 | (101,487,130 | ) | |||||
|
|
|
|
|
|||||
| Distributions to shareholders from: |
||||||||
| Net investment income |
||||||||
| Investment Class |
(20,487,258 | ) | (40,074,208 | ) | ||||
| Service Class |
(228,586 | ) | (2,200,814 | ) | ||||
| Net realized gains |
||||||||
| Investment Class |
— | — | ||||||
| Service Class |
— | — | ||||||
|
|
|
|
|
|||||
| Total distributions |
(20,715,844 | ) | (42,275,022 | ) | ||||
|
|
|
|
|
|||||
| Increase (decrease) in assets from operations and distributions |
44,050,437 | (143,762,152 | ) | |||||
|
|
|
|
|
|||||
| Share transactions: |
||||||||
| Proceeds from sale of shares |
||||||||
| Investment Class |
47,289,789 | 88,160,235 | ||||||
| Service Class |
110,591 | 423,186 | ||||||
| Value of distributions reinvested |
||||||||
| Investment Class |
20,486,760 | 39,960,532 | ||||||
| Service Class |
228,334 | 2,200,320 | ||||||
| Cost of shares redeemed |
||||||||
| Investment Class |
(157,598,526 | ) | (425,151,525 | ) | ||||
| Service Class |
(2,735,116 | ) | (75,251,629 | ) | ||||
|
|
|
|
|
|||||
| Net increase (decrease) from share transactions |
(92,218,168 | ) | (369,658,881 | ) | ||||
|
|
|
|
|
|||||
| Total increase (decrease) in net assets |
(48,167,731 | ) | (513,421,033 | ) | ||||
| Net Assets |
||||||||
| Beginning of year |
1,303,974,627 | 1,817,395,660 | ||||||
|
|
|
|
|
|||||
| End of year |
$ | 1,255,806,896 | $ | 1,303,974,627 | ||||
|
|
|
|
|
|||||
| Undistributed (distributions in excess of) net investment income, end of year |
$ | 21,640,409 | $ | 19,466,797 | ||||
| Changes in Fund Shares |
||||||||
| Investment Class |
||||||||
| Shares sold |
4,137,415 | 6,898,008 | ||||||
| Issued for distributions reinvested |
1,754,003 | 3,288,933 | ||||||
| Shares redeemed |
(13,763,388 | ) | (33,274,173 | ) | ||||
|
|
|
|
|
|||||
| Net increase (decrease) in fund shares |
(7,871,970 | ) | (23,087,232 | ) | ||||
|
|
|
|
|
|||||
| Service Class |
||||||||
| Shares sold |
9,772 | 32,902 | ||||||
| Issued for distributions reinvested |
19,616 | 181,995 | ||||||
| Shares redeemed |
(242,704 | ) | (5,835,339 | ) | ||||
|
|
|
|
|
|||||
| Net increase (decrease) in fund shares |
(213,316 | ) | (5,620,442 | ) | ||||
|
|
|
|
|
|||||
| * | Includes $53,149,863 of net realized gains from redemptions in-kind. |
| ** | Beginning with the fiscal year ended September 30, 2016, the Funds were audited by Ernst & Young LLP. The previous years were audited by another independent registered public accounting firm. |
See accompanying notes to financial statements.
| 118 | Statements of Changes in Net Assets |
Table of Contents
| Strategic Investment Fund | Income Fund | |||||||||||||
| Year Ended September 30, 2016 |
Year Ended September 30, 2015** |
Year Ended September 30, 2016 |
Year Ended September 30, 2015** |
|||||||||||
| $ | 14,634,870 | $ | 13,136,228 | $ | 8,230,530 | $ | 8,213,587 | |||||||
| 7,209,519 | 38,111,815 | 1,808,794 | 2,673,620 | |||||||||||
|
|
41,759,066 |
|
(68,993,007 | ) | 7,696,899 | (3,747,989 | ) | |||||||
|
|
|
|
|
|
|
|
|
|||||||
| 63,603,455 | (17,744,964 | ) | 17,736,223 | 7,139,218 | ||||||||||
|
|
|
|
|
|
|
|
|
|||||||
| (12,422,840 | ) | (15,273,876 | ) | (7,971,456 | ) | (8,238,729 | ) | |||||||
| (853 | ) | (1,030 | ) | (5,539 | ) | (7,616 | ) | |||||||
| (37,733,122 | ) | (66,200,278 | ) | (2,849,874 | ) | — | ||||||||
| (3,016 | ) | (5,115 | ) | (2,372 | ) | — | ||||||||
|
|
|
|
|
|
|
|
|
|||||||
| (50,159,831 | ) | (81,480,299 | ) | (10,829,241 | ) | (8,246,345 | ) | |||||||
|
|
|
|
|
|
|
|
|
|||||||
| 13,443,624 | (99,225,263 | ) | 6,906,982 | (1,107,127 | ) | |||||||||
|
|
|
|
|
|
|
|
|
|||||||
| 32,104,281 | 60,984,889 | 57,547,356 | 78,967,884 | |||||||||||
| 1,911 | 250 | 34,392 | 4,700 | |||||||||||
| 50,155,750 | 81,473,065 | 10,809,076 | 8,186,024 | |||||||||||
| 3,427 | 5,390 | 7,912 | 7,616 | |||||||||||
| (92,389,632 | ) | (124,210,613 | ) | (67,602,733 | ) | (117,742,658 | ) | |||||||
| (11,933 | ) | (25 | ) | (112,921 | ) | (89,998 | ) | |||||||
|
|
|
|
|
|
|
|
|
|||||||
| (10,136,196 | ) | 18,252,956 | 683,082 | (30,666,432 | ) | |||||||||
|
|
|
|
|
|
|
|
|
|||||||
| 3,307,428 | (80,972,307 | ) | 7,590,064 | (31,773,559 | ) | |||||||||
| 754,427,668 | 835,399,975 | 291,499,504 | 323,273,063 | |||||||||||
|
|
|
|
|
|
|
|
|
|||||||
| $ | 757,735,096 | $ | 754,427,668 | $ | 299,089,568 | $ | 291,499,504 | |||||||
|
|
|
|
|
|
|
|
|
|||||||
| $ | 11,785,501 | $ | 10,031,155 | $ | 211,089 | $ | 322,669 | |||||||
| 2,746,867 | 4,767,694 | 6,075,536 | 8,248,670 | |||||||||||
| 4,399,627 | 6,575,711 | 1,147,253 | 853,674 | |||||||||||
| (7,913,209 | ) | (9,660,957 | ) | (7,141,399 | ) | (12,247,001 | ) | |||||||
|
|
|
|
|
|
|
|
|
|||||||
| (766,715 | ) | 1,682,448 | 81,390 | (3,144,657 | ) | |||||||||
|
|
|
|
|
|
|
|
|
|||||||
| 169 | 19 | 3,496 | 482 | |||||||||||
| 302 | 438 | 823 | 777 | |||||||||||
| (1,009 | ) | (2 | ) | (11,670 | ) | (9,284 | ) | |||||||
|
|
|
|
|
|
|
|
|
|||||||
| (538 | ) | 455 | (7,351 | ) | (8,025 | ) | ||||||||
|
|
|
|
|
|
|
|
|
|||||||
See accompanying notes to financial statements.
| Statements of Changes in Net Assets | 119 |
Table of Contents
GE Institutional Funds
Notes to Financial Statements — September 30, 2016
| 1. | Organization of the Funds |
GE Institutional Funds (the “Trust”) is registered under the Investment Company Act of 1940, as amended (the “1940 Act”), as an open-end management investment company. The Trust was organized as a Delaware business trust on May 23, 1997, and is authorized to issue an unlimited number of shares. It is currently comprised of the following eight investment funds (each, a “Fund” and collectively, the “Funds”): U.S. Equity Fund, S&P 500 Index Fund, U.S. Large-Cap Core Equity Fund, Premier Growth Equity Fund, Small-Cap Equity Fund, International Equity Fund, Strategic Investment Fund and Income Fund. The Funds presently offer two classes of shares — the Investment Class and the Service Class. The Trust expects that most of the time, each Fund will have relatively few shareholders (as compared with most mutual funds), but that these shareholders will invest substantial amounts in a Fund (minimum initial investment requirements are described in the current summary prospectus for each Fund and in the Funds’ statutory prospectus). Each Fund is an investment company and accordingly follows the investment company accounting and reporting guidance of the Financial Accounting Standards Board (“FASB”) Accounting Standard Codification (“ASC”) Topic 946 Financial Services — Investment Companies. Each Fund is a diversified investment company within the meaning of the 1940 Act.
SSGA Funds Management, Inc. (“SSGA FM”) is the investment adviser and administrator of each of the Funds effective July 1, 2016. Prior to July 1, 2016, GE Asset Management Incorporated (“GEAM”) served as the investment adviser and administrator to each Fund.
| 2. | Summary of Significant Accounting Policies |
The preparation of financial statements in conformity with U.S. generally accepted accounting principles (“GAAP”) requires management to make estimates and assumptions that affect the reported amounts of assets and liabilities and disclosure of contingent assets and liabilities at the date of the financial statements and the reported amounts of increases and decreases in net assets from operations during the reporting period. Actual results may differ from those estimates.
Subsequent events after the balance sheet date through the date the financial statements were issued have been evaluated in the preparation of the financial statements. See Footnote 11 for subsequent events identified.
The following summarizes the significant accounting policies of the Trust.
Securities Valuation and Transactions All investments in securities are recorded at their estimated fair value, as described in Note 3.
Securities transactions are accounted for as of the trade date. Realized gains and losses on investments sold are recorded on the basis of identified cost for both financial statement and federal tax purposes.
Each Fund’s income, expenses (other than distribution and service fees) and realized and unrealized gains and losses are allocated proportionally each day among the share classes based upon the relative net assets of each class.
Foreign Currency Accounting records of the Funds are maintained in U.S. dollars. Investment securities and other assets and liabilities denominated in a foreign currency are translated to U.S. dollars at the prevailing rates of exchange at period end. Purchases and sales of securities, income receipts and expense payments denominated in foreign currencies are translated into U.S. dollars at the prevailing exchange rate on the respective dates of such transactions.
All assets and liabilities of the Funds initially expressed in foreign currency values will be converted into U.S. dollars at the WM/Reuters exchange rate computed at 11:00 a.m. Eastern time.
The Funds do not isolate the portion of the results of operations resulting from changes in foreign exchange rates from the fluctuations arising from changes in the market prices of securities during the year. Such fluctuations are included in the net realized or unrealized gain or loss from investments. Net realized gains or losses on foreign currency transactions represent net gains or losses on sales and maturities of foreign currency contracts, disposition of foreign currencies, the difference between the amount of net investment income and withholding taxes accrued and the U.S. dollar amount actually received or paid, and gains or losses between the trade and settlement date on purchases and sales of foreign securities. Net unrealized foreign exchange gains and losses arising from changes in the value of other assets and liabilities (including foreign currencies and open foreign currency contracts) as a result of changes in foreign exchange rates are included as increases or decreases in unrealized appreciation/depreciation on foreign currency related transactions.
| 120 | Notes to Financial Statements |
Table of Contents
GE Institutional Funds
Notes to Financial Statements, continued — September 30, 2016
Derivatives The Funds are subject to equity price risk, interest rate risk, credit risk and foreign currency exchange rate risk in the normal course of pursuing their investment objectives. Certain Funds may enter into various types of derivatives transactions (such as options, futures, options on futures, interest rate futures, interest-only swaps, interest rate swaps, index swaps and credit default swaps) to gain or hedge exposure to certain types of securities as an alternative to investing directly in or selling such securities, or to manage: yield, interest rate exposure (also known as duration), exposure to credit quality, and to gain exposure to certain market segments.
Futures Contracts A futures contract is an agreement to buy or sell a specific amount of a commodity, financial instrument, currency or index at a particular price and future date. Certain Funds may invest in interest rate, financial and stock or bond index futures contracts subject to certain limitations. During the fiscal year ended September 30, 2016, the U.S. Equity Fund, S&P 500 Index Fund, U.S. Large-Cap Core Equity Fund, Premier Growth Equity Fund, Small-Cap Equity Fund and International Equity Fund invested in stock index future contracts to gain equity exposure for accumulating and residual cash positions. The Strategic Investment Fund invested in futures contracts on various stock indices, bonds and notes to gain equity exposure and to manage duration of fixed income securities. The Income Fund invested in futures contracts on bonds and notes to manage duration of fixed income securities. Buying futures tends to increase a Fund’s exposure to the underlying instrument while selling futures tends to decrease a Fund’s exposure to the underlying instrument, or hedge other Fund investments. With futures contracts, there is minimal counterparty credit risk to a Fund since futures contracts are exchange traded and the exchange’s clearinghouse, as counterparty to all traded futures, guarantees the futures against default. A Fund’s risks in using these contracts include changes in the value of the underlying instruments, non-performance of the counterparties under the contracts’ terms and changes in the liquidity of the secondary market for the contracts. Futures contracts are valued at the settlement price established each day by the board of trade or exchange on which they principally trade.
Upon entering into a financial futures contract, a Fund is required to pledge to the broker an amount of cash and/or other assets equal to a certain percentage of the contract amount, known as initial margin deposit. Subsequent payments, known as variation margin, are made or received by a Fund each day, depending on the daily fluctuation in the fair value of the underlying security. A Fund records an unrealized gain or loss equal to the daily variation margin. Should market conditions move unexpectedly, a Fund may not achieve the anticipated benefits of the futures contracts and may incur a loss. A Fund recognizes a realized gain or loss on the expiration or closing of a futures contract.
Credit Default Swaps During the fiscal year ended September 30, 2016, the Strategic Investment Fund and Income Fund engaged in credit default swaps to manage credit risk. When a Fund is the buyer in a credit default swap contract, a Fund is entitled to receive the par (or other agreed upon) value (full notional value) of a referenced debt obligation (or basket of debt obligations) from the counterparty (or central clearing party (“CCP”) in the case of a centrally cleared swap) to the contract if a credit event by a third party, such as a U.S. or foreign corporate issuer or sovereign issuer, on the debt obligation occurs. In return, a Fund pays the counterparty a periodic stream of payments over the term of the contract provided that no credit event has occurred. If no credit event occurs, a Fund loses its investment and recovers nothing. However, if a credit event occurs, a Fund receives full notional value for a referenced debt obligation that may have little or no value. When a Fund is the seller of a credit default swap, it receives a fixed rate of income throughout the term of the contract, provided there is no credit event. If a credit event occurs, a Fund is obligated to pay the notional amount of the swap and in certain instances take delivery of securities of the reference entity upon the occurrence of a credit event, as defined under the terms of that particular swap agreement. Credit events are contract specific but may include bankruptcy, failure to pay, restructuring, obligation acceleration and repudiation/moratorium. If a Fund is a seller of protection and a credit event occurs, the maximum potential amount of future payments that a Fund could be required to make would be an amount equal to the notional amount of the agreement. This potential amount would be partially offset by any recovery value of the respective referenced obligation, or net amount received from the settlement of a buy protection credit default swap agreement entered into by a Fund for the same referenced obligation. As the seller, a Fund may create economic leverage to its portfolio because, in addition to its total net assets, a Fund is subject to investment exposure on the notional amount of the swap. The interest fee paid or received on the swap, which is based on a specified interest rate on a fixed notional amount, is accrued daily as a component of unrealized appreciation (depreciation) and is recorded as realized gain upon receipt or realized loss upon payment. A Fund also records an increase or decrease to unrealized appreciation (depreciation) in an amount equal to the daily valuation. For centrally cleared swaps, the daily change in valuation is recorded as a receivable or payable for variation margin and settled in cash with the CCP daily. All upfront payments, if any, are amortized over the life of the swap as realized gains or losses. Those upfront payments that are paid or received, typically for non-centrally cleared swaps, are recorded as other assets or other
| Notes to Financial Statements | 121 |
Table of Contents
GE Institutional Funds
Notes to Financial Statements, continued — September 30, 2016
liabilities, respectively, net of amortization. For financial reporting purposes, unamortized upfront payments, if any, are netted with unrealized appreciation or depreciation on swaps to determine the market value of swaps. A Fund segregates assets in the form of cash or liquid securities in an amount equal to the notional amount of the credit default swaps of which it is the seller. A Fund segregates assets in the form of cash or liquid securities in an amount equal to any unrealized depreciation of the credit default swaps of which it is the buyer, marked to market on a daily basis. Credit default swaps involve greater risks than if a Fund had invested in the referenced debt obligation directly. If a Fund is a buyer of a credit default swap and no credit event occurs, a Fund will not earn any return on its investment. If a Fund is a seller of a credit default swap, a Fund’s risk of loss may be the entire notional amount of the swap. Swaps may also subject a Fund to the risk that the counterparty to the transaction may not fulfill its obligation. In the case of centrally cleared swaps, counterparty risk is minimal due to protections provided by the CCP.
When-Issued Securities and Forward Commitments The Strategic Investment Fund and Income Fund may purchase or sell securities on a when-issued or forward commitment basis. These transactions are arrangements in which a Fund purchases and sells securities with payment and delivery scheduled a month or more after entering into the transaction. The price of the underlying securities and the date when these securities will be delivered and paid for are fixed at the time the transaction is negotiated. Losses may arise due to changes in the market value of the underlying securities or if the counterparty does not perform under the commitments. In connection with such purchases, a Fund maintains cash or liquid assets in an amount equal to the purchase commitments for such underlying securities until settlement date and for sales commitments a Fund maintains equivalent deliverable securities as “cover” for the transaction. Unsettled commitments are valued at the current market value of the underlying security. Daily fluctuations in the value of such commitments are recorded as unrealized gains or losses. The Funds will not enter into such commitments for the purpose of investment leverage.
Forward Foreign Currency Exchange Contracts Certain Funds may enter into forward foreign currency exchange contracts to facilitate transactions in foreign denominated securities and to manage currency exposure. Forward foreign currency exchange contracts are valued at the mean between the bid and the offered forward rates as last quoted by a recognized dealer. The aggregate principal amounts of the contracts are not recorded in a Fund’s financial statements. Such amounts appear under the caption Forward Foreign Currency Contracts in the Schedules of Investments. Fluctuations in the value of the contracts are recorded in the Statements of Assets and Liabilities as an asset (or liability) and in the Statements of Operations as unrealized appreciation (depreciation) until the contracts are closed, when they are recorded as realized gains or losses on foreign currency related transactions. A Fund’s risks in using these contracts include changes in the value of foreign currency or the possibility that the counterparties do not perform under the contracts’ terms. When a Fund enters into a forward foreign currency exchange contract, it is required to segregate cash or liquid securities with its custodian in an amount equal to the value of a Fund’s total assets committed to the consummation of the forward contract. If the value of the segregated securities declines, additional cash or securities are segregated so that the value of the account will equal the amount of a Fund’s commitment with respect to the contract.
Investments in Foreign Markets Investments in foreign markets involve special risks and considerations not typically associated with investing in the United States. These risks include revaluation of currencies, high rates of inflation, restrictions on repatriation of income and capital, and adverse political and economic developments. Moreover, securities issued in these markets may be less liquid, subject to government ownership controls, tariffs and taxes, subject to delays in settlements, and their prices may be more volatile.
A Fund may be subject to capital gains and repatriation taxes imposed by certain countries in which it invests. Such taxes are generally based upon income and/or capital gains earned or repatriated. Taxes are accrued based on net investment income, net realized gains and net unrealized appreciation as income and/or capital gains are earned. These foreign taxes, if any, are paid by the Funds and are reflected in the Statements of Operations, if applicable. Foreign taxes payable or deferred as of September 30, 2016, if any, are disclosed in the Funds’ Statements of Assets and Liabilities.
Investment Income Corporate actions (including cash dividends) are recorded on the ex-dividend date, net of applicable withholding taxes, except for certain foreign corporate actions which are recorded as soon after the ex-dividend date as such information becomes available. Withholding taxes on foreign dividends, if any, have been provided for in accordance with a Fund’s understanding of the applicable country’s tax rules and rates. Interest income is recorded on the accrual basis. Accretion of discounts and amortization of premiums on taxable bonds are to the call or maturity date, whichever is shorter, using the effective yield method.
| 122 | Notes to Financial Statements |
Table of Contents
GE Institutional Funds
Notes to Financial Statements, continued — September 30, 2016
Expenses Each Fund pays a “unitary fee” to SSGA FM equivalent to the Fund’s advisory and administration fee. This fee includes any normal operating expenses payable by a Fund, except for fees paid to the Trust’s independent Trustees, distribution and shareholder servicing fees, brokerage fees and commissions and expenses that are not normal operating expenses of the Funds (such as extraordinary expenses, interest and taxes). Prior to July 1, 2016, each Fund paid this “unitary fee” to GEAM.
Federal Income Taxes The Funds intend to comply with all sections of the Internal Revenue Code of 1986, as amended (the “Internal Revenue Code”), applicable to regulated investment companies including the distribution of substantially all of their taxable net investment income, tax-exempt income and net realized capital gains to their shareholders. Therefore, no provision for federal income tax has been made. Each Fund is treated as a separate taxpayer for federal income tax purposes.
| 3. | Security Valuation and Transactions |
The Funds utilize various methods to measure the fair value of their investments on a recurring basis. GAAP establishes a framework for measuring fair value and providing related disclosures. Broadly, the framework requires fair value to be determined based on the exchange price that would be received for an asset or paid to transfer a liability (an exit price) in the principal or most advantageous market for the asset or liability in an orderly transaction between market participants at the measurement date. In the absence of active markets for the identical assets or liabilities, such measurements involve developing assumptions based on market observable data and, in the absence of such data, internal information that is consistent with what market participants would use in a hypothetical transaction that occurs at the measurement date. It also establishes a three-level valuation hierarchy based upon observable and non-observable inputs.
Observable inputs reflect market data obtained from independent sources, while unobservable inputs reflect our market assumptions. Preference is given to observable inputs. These two types of inputs create the following fair value hierarchy:
| • | Level 1 — Quoted prices for identical investments in active markets. |
| • | Level 2 — Quoted prices for similar investments in active markets; quoted prices for identical or similar investments in markets that are not active; and model-derived valuations whose inputs are observable or whose significant value drivers are observable. |
| • | Level 3 — Significant inputs to the valuation model are unobservable. |
Policies and procedures are maintained to value investments using the best and most relevant data available. In addition, pricing vendors are utilized to assist in valuing investments. The investment adviser performs periodic reviews of the methodologies used by independent pricing services including price validation of individual securities.
Fair Value Measurement The following section describes the valuation methodologies the Funds use to measure different financial investments at fair value.
A Fund’s portfolio securities are valued generally on the basis of market quotations. Equity securities generally are valued at the last reported sale price on the primary market in which they are traded. Portfolio securities listed on NASDAQ are valued using the NASDAQ Official Closing Price. Level 1 securities primarily include publicly-traded equity securities, which may not necessarily represent the last sales price. If no sales occurred on the exchange or NASDAQ that day, the portfolio security generally is valued using the last reported bid price. In those circumstances, the Fund typically classifies the investment securities in Level 2.
Debt securities (other than short-term securities described below) generally are valued at an evaluated bid price as reported by independent pricing services. The pricing services use various pricing models for each asset class. The inputs and assumptions to the model of the pricing services are derived from market observable sources, which may include: benchmark yields, reported trades, broker/dealer quotes, issuer spreads, benchmark securities, bids, offers and other market related data. Since many fixed income securities do not trade on a daily basis, the methodology of the pricing service may also use other available information such as benchmark curves, benchmarking of similar securities, sector groupings and matrix pricing, as applicable. Thus, certain securities may not be priced using market quotations, but rather determined from market observable information. These investments are included in Level 2 and are primarily comprised of corporate fixed income, government, mortgage and asset-backed securities. In the absence of a reliable bid price from such a pricing service, debt securities may be valued based
| Notes to Financial Statements | 123 |
Table of Contents
GE Institutional Funds
Notes to Financial Statements, continued — September 30, 2016
on broker or dealer supplied valuations or quotations. In these infrequent circumstances, pricing services may provide the Funds with valuations that are based on significant unobservable inputs, and in those circumstances the investment securities are classified as Level 3.
A Fund may use non-binding broker or dealer quotes for valuation when there is limited or no relevant market activity for a specific investment or for other investments that share similar characteristics and a price is not provided by a pricing service or is deemed not to be reliable. The Funds have not adjusted the prices obtained. Investment securities priced using non-binding broker or dealer quotes are included in Level 3.
Investments in registered investment companies are valued at the published daily net asset value (“NAV”) and classified in Level 1.
Short-term securities of sufficient credit quality with remaining maturities of sixty days or less at the time of purchase are typically valued on the basis of amortized cost which approximates fair value and these are included in Level 2. If it is determined that amortized cost does not approximate fair value, securities may be valued based on dealer supplied valuations or quotations. In these infrequent circumstances, pricing services may provide the Funds with valuations that are based on significant unobservable inputs, and in those circumstances the investment securities are classified in Level 3.
If prices are not readily available for a portfolio security, or if it is believed that a price for a portfolio security does not represent its fair value, the security may be valued using procedures approved by the Trust’s Board of Trustees (the Board) that are designed to establish its “fair” value. These securities are typically classified in Level 3. Those procedures require that the fair value of a security be established by a valuation committee of the investment adviser. The valuation committee follows different protocols for different types of investments and circumstances. The fair value procedures may be used to value any investment of any Fund in the appropriate circumstances.
Foreign securities may be valued with the assistance of an independent fair value pricing service in circumstances where it is believed that they have been or would be materially affected by events occurring after the close of the portfolio security’s primary market and before the close of regular trading on the New York Stock Exchange. In these circumstances, the Funds classify the investment securities in Level 2. This independent fair value pricing service uses a proprietary model to identify affected securities, taking into consideration various factors, and the fair value of such securities may be something other than the last available quotation or other market price.
All assets and liabilities of the Funds initially expressed in foreign currency values will be converted into U.S. dollars at the WM/Reuters exchange rate computed at 11:00 a.m. Eastern time.
Fair value determinations generally are used for securities whose value is affected by a significant event that will materially affect the value of a security and which occurs subsequent to the time of the close of the principal market on which such security trades but prior to the calculation of a Fund’s NAV.
The value established for such a portfolio security valued other than by use of a market quotation (as described above) may be different than what would be produced through the use of market quotations or another methodology. Portfolio securities that are valued using techniques other than market quotations, including “fair valued” securities, may be subject to greater fluctuation in their value from one day to the next than would be the case if market quotations were used. In addition, there is no assurance that a Fund could sell a portfolio security for the value established for it at any time and it is possible that a Fund would incur a loss because a portfolio security is sold at a discount to its established value.
Other financial investments are derivative instruments that are not reflected in total investments, such as futures, forwards, swaps and written options contracts, which are valued based on fair value as discussed above.
The Funds use closing prices for derivatives included in Level 1, which are traded either on exchanges or liquid over-the-counter markets. Derivative assets and liabilities included in Level 2 primarily represent interest rate swaps, cross-currency swaps, credit default swaps and foreign currency and commodity forward and option contracts. Derivative assets and liabilities included in Level 3 primarily represent interest rate products that contain embedded optionality or prepayment features.
The inputs or methodology used for valuing securities are not an indication of the risk associated with investing in those securities.
| 124 | Notes to Financial Statements |
Table of Contents
GE Institutional Funds
Notes to Financial Statements, continued — September 30, 2016
The following tables present each Fund’s investments measured at fair value on a recurring basis at September 30, 2016:
| Fund | Investments | Level 1 | Level 2 | Level 3 | Total | |||||||||||||
| U.S. Equity Fund | Investments in Securities† |
|||||||||||||||||
| Common Stock |
$ | 578,157,789 | $ | — | $ | — | $ | 578,157,789 | ||||||||||
| Short-Term Investments |
8,358,418 | — | — | 8,358,418 | ||||||||||||||
|
|
|
|
|
|
|
|
|
|||||||||||
| Total Investments in Securities |
$ | 586,516,207 | $ | — | $ | — | $ | 586,516,207 | ||||||||||
|
|
|
|
|
|
|
|
|
|||||||||||
| Other Financial Instruments* |
||||||||||||||||||
| Long Futures Contracts — Unrealized Depreciation |
$ | (904 | ) | $ | — | $ | — | $ | (904 | ) | ||||||||
|
|
|
|
|
|
|
|
|
|||||||||||
| Fund | Investments | Level 1 | Level 2 | Level 3 | Total | |||||||||||||
| S&P 500 Index Fund | Investments in Securities† |
|||||||||||||||||
| Common Stock |
$ | 15,458,384 | $ | — | $ | — | $ | 15,458,384 | ||||||||||
| Short-Term Investments |
701,455 | — | — | 701,455 | ||||||||||||||
|
|
|
|
|
|
|
|
|
|||||||||||
| Total Investments in Securities |
$ | 16,159,839 | $ | — | $ | — | $ | 16,159,839 | ||||||||||
|
|
|
|
|
|
|
|
|
|||||||||||
| Other Financial Instruments* |
||||||||||||||||||
| Long Futures Contracts — Unrealized Appreciation |
$ | 4,441 | $ | — | $ | — | $ | 4,441 | ||||||||||
|
|
|
|
|
|
|
|
|
|||||||||||
| Fund | Investments | Level 1 | Level 2 | Level 3 | Total | |||||||||||||
| U.S. Large-Cap Core Equity Fund | Investments in Securities† |
|||||||||||||||||
| Common Stock |
$ | 52,076,598 | $ | — | $ | — | $ | 52,076,598 | ||||||||||
| Short-Term Investments |
1,428,579 | — | — | 1,428,579 | ||||||||||||||
|
|
|
|
|
|
|
|
|
|||||||||||
| Total Investments in Securities |
$ | 53,505,177 | $ | — | $ | — | $ | 53,505,177 | ||||||||||
|
|
|
|
|
|
|
|
|
|||||||||||
| Other Financial Instruments* |
||||||||||||||||||
| Long Futures Contracts — Unrealized Appreciation |
$ | 854 | $ | — | $ | — | $ | 854 | ||||||||||
|
|
|
|
|
|
|
|
|
|||||||||||
| Fund | Investments | Level 1 | Level 2 | Level 3 | Total | |||||||||||||
| Premier Growth Equity Fund | Investments in Securities† |
|||||||||||||||||
| Common Stock |
$ | 323,252,989 | $ | — | $ | — | $ | 323,252,989 | ||||||||||
| Short-Term Investments |
12,844,727 | — | — | 12,844,727 | ||||||||||||||
|
|
|
|
|
|
|
|
|
|||||||||||
| Total Investments in Securities |
$ | 336,097,716 | $ | — | $ | — | $ | 336,097,716 | ||||||||||
|
|
|
|
|
|
|
|
|
|||||||||||
| Other Financial Instruments* |
||||||||||||||||||
| Long Futures Contracts — Unrealized Appreciation |
$ | 22,586 | $ | — | $ | — | $ | 22,586 | ||||||||||
|
|
|
|
|
|
|
|
|
|||||||||||
| Notes to Financial Statements | 125 |
Table of Contents
GE Institutional Funds
Notes to Financial Statements, continued — September 30, 2016
| Fund | Investments | Level 1 | Level 2 | Level 3 | Total | |||||||||||||
| Small-Cap Equity Fund | Investments in Securities† |
|||||||||||||||||
| Common Stock |
$ | 1,214,471,072 | $ | — | $ | — | $ | 1,214,471,072 | ||||||||||
| Short-Term Investments |
68,288,206 | — | — | 68,288,206 | ||||||||||||||
|
|
|
|
|
|
|
|
|
|||||||||||
| Total Investments in Securities |
$ | 1,282,759,278 | $ | — | $ | — | $ | 1,282,759,278 | ||||||||||
|
|
|
|
|
|
|
|
|
|||||||||||
| Other Financial Instruments* |
||||||||||||||||||
| Long Futures Contracts — Unrealized Appreciation |
$ | 128,327 | $ | — | $ | — | $ | 128,327 | ||||||||||
|
|
|
|
|
|
|
|
|
|||||||||||
| Fund | Investments | Level 1 | Level 2 | Level 3 | Total | |||||||||||||
| International Equity Fund | Investments in Securities† |
|||||||||||||||||
| Common Stock |
$ | 1,217,001,600 | $ | — | $ | — | $ | 1,217,001,600 | ||||||||||
| Short-Term Investments |
39,027,683 | — | — | 39,027,683 | ||||||||||||||
|
|
|
|
|
|
|
|
|
|||||||||||
| Total Investments in Securities |
$ | 1,256,029,283 | $ | — | $ | — | $ | 1,256,029,283 | ||||||||||
|
|
|
|
|
|
|
|
|
|||||||||||
| Other Financial Instruments* |
||||||||||||||||||
| Long Futures Contracts — Unrealized Appreciation |
$ | 17,674 | $ | — | $ | — | $ | 17,674 | ||||||||||
|
|
|
|
|
|
|
|
|
|||||||||||
| Fund | Investments | Level 1 | Level 2 | Level 3 | Total | |||||||||||||
| Strategic Investment Fund | Investments in Securities† |
|||||||||||||||||
| Domestic Equity |
$ | 239,686,993 | $ | — | $ | — | $ | 239,686,993 | ||||||||||
| Foreign Equity |
164,130,503 | — | — | 164,130,503 | ||||||||||||||
| U.S. Treasuries |
— | 61,074,365 | — | 61,074,365 | ||||||||||||||
| Agency Mortgage Backed |
— | 54,075,963 | — | 54,075,963 | ||||||||||||||
| Agency Collateralized Mortgage Obligations |
— | 3,158,773 | — | 3,158,773 | ||||||||||||||
| Corporate Notes |
— | 104,116,681 | — | 104,116,681 | ||||||||||||||
| Non-Agency Collateralized Mortgage Obligations |
— | 14,681,924 | — | 14,681,924 | ||||||||||||||
| Sovereign Bonds |
— | 2,307,159 | — | 2,307,159 | ||||||||||||||
| Municipal Bonds and Notes |
— | 1,304,153 | — | 1,304,153 | ||||||||||||||
| FNMA (TBA) |
— | — | 1,933 | 1,933 | ||||||||||||||
| Exchange Traded Funds |
47,667,802 | — | — | 47,667,802 | ||||||||||||||
| Short-Term Investments |
85,905,257 | — | — | 85,905,257 | ||||||||||||||
|
|
|
|
|
|
|
|
|
|||||||||||
| Total Investments in Securities |
$ | 537,390,555 | $ | 240,719,018 | $ | 1,933 | $ | 778,111,506 | ||||||||||
|
|
|
|
|
|
|
|
|
|||||||||||
| Other Financial Instruments* |
||||||||||||||||||
| Credit Default Swap Contracts — Unrealized Depreciation |
$ | — | $ | (464,825 | ) | $ | — | $ | (464,825 | ) | ||||||||
| Long Futures Contracts — Unrealized Appreciation |
133,365 | — | — | 133,365 | ||||||||||||||
| Short Futures Contracts — Unrealized Appreciation |
21,403 | — | — | 21,403 | ||||||||||||||
| Short Futures Contracts — Unrealized Depreciation |
(61,935 | ) | — | — | (61,935 | ) | ||||||||||||
|
|
|
|
|
|
|
|
|
|||||||||||
| Total Other Financial Instruments |
$ | 92,833 | $ | (464,825 | ) | $ | — | $ | (371,992 | ) | ||||||||
|
|
|
|
|
|
|
|
|
|||||||||||
| 126 | Notes to Financial Statements |
Table of Contents
GE Institutional Funds
Notes to Financial Statements, continued — September 30, 2016
| Fund | Investments | Level 1 | Level 2 | Level 3 | Total | |||||||||||||
| Income Fund | Investments in Securities† |
|||||||||||||||||
| U.S. Treasuries |
$ | — | $ | 72,710,505 | $ | — | $ | 72,710,505 | ||||||||||
| Agency Mortgage Backed |
— | 67,137,006 | — | 67,137,006 | ||||||||||||||
| Agency Collateralized Mortgage Obligations |
— | 3,831,080 | — | 3,831,080 | ||||||||||||||
| Asset Backed |
— | 249,757 | — | 249,757 | ||||||||||||||
| Corporate Notes |
— | 125,623,918 | — | 125,623,918 | ||||||||||||||
| Non-Agency Collateralized Mortgage Obligations |
— | 19,203,334 | — | 19,203,334 | ||||||||||||||
| Sovereign Bonds |
— | 2,773,846 | — | 2,773,846 | ||||||||||||||
| Municipal Bonds and Notes |
— | 1,958,930 | — | 1,958,930 | ||||||||||||||
| FNMA (TBA) |
— | — | 6,529 | 6,529 | ||||||||||||||
| Preferred Stock |
348,927 | — | — | 348,927 | ||||||||||||||
| Short-Term Investments |
29,678,865 | — | — | 29,678,865 | ||||||||||||||
|
|
|
|
|
|
|
|
|
|||||||||||
| Total Investments in Securities |
$ | 30,027,792 | $ | 293,488,376 | $ | 6,529 | $ | 323,522,697 | ||||||||||
|
|
|
|
|
|
|
|
|
|||||||||||
| Other Financial Instruments* |
||||||||||||||||||
| Credit Default Swap Contracts — Unrealized Depreciation |
$ | — | $ | (568,740 | ) | $ | — | $ | (568,740 | ) | ||||||||
| Long Futures Contracts — Unrealized Appreciation |
8,820 | — | — | 8,820 | ||||||||||||||
| Long Futures Contracts — Unrealized Depreciation |
(39,770 | ) | — | — | (39,770 | ) | ||||||||||||
| Short Futures Contracts — Unrealized Appreciation |
38,434 | — | — | 38,434 | ||||||||||||||
|
|
|
|
|
|
|
|
|
|||||||||||
| Total Other Financial Instruments |
$ | 7,484 | $ | (568,740 | ) | $ | — | $ | (561,256 | ) | ||||||||
|
|
|
|
|
|
|
|
|
|||||||||||
| † | See Schedules of Investments for Industry Classification. |
| * | Other financial instruments include derivative instruments such as futures contracts and credit default swaps. Amounts shown represent unrealized appreciation (depreciation), at period end. |
There were no significant transfers between fair value levels during the period. Transfers between fair value levels are recognized at the beginning of the period.
Level 3 investments at the beginning and/or end of the period in relation to net assets were not significant and, accordingly, a reconciliation of Level 3 assets for the fiscal year ended September 30, 2016 is not presented.
| 4. | Derivatives Disclosure |
Shown below are the derivative contracts entered into by each Fund, summarized by primary risk exposure as they appear on the Statements of Assets and Liabilities, none of which are accounted for as hedging instruments under FASB ASC No. 815 Derivatives and Hedging (“ASC 815”) as of September 30, 2016.
| Asset Derivatives September 30, 2016 |
Liability Derivatives September 30, 2016 |
|||||||||||
| Derivatives not accounted for as hedging instruments under ASC 815 |
Location in the Statements of Assets and Liabilities |
Fair Value ($) |
Location in the Statements of Assets and Liabilities |
Fair Value ($) |
||||||||
| U.S. Equity Fund | ||||||||||||
| Equity Contracts | Assets, Net Assets — Net Unrealized Appreciation/ (Depreciation) on Futures | — | Liabilities, Net Assets — Net Unrealized Appreciation/ (Depreciation) on Futures | (904 | )* | |||||||
| S&P 500 Index Fund | ||||||||||||
| Equity Contracts | Assets, Net Assets — Net Unrealized Appreciation/ (Depreciation) on Futures | 4,441 | * | Liabilities, Net Assets — Net Unrealized Appreciation/ (Depreciation) on Futures | — | |||||||
| Notes to Financial Statements | 127 |
Table of Contents
GE Institutional Funds
Notes to Financial Statements, continued — September 30, 2016
| Asset Derivatives September 30, 2016 |
Liability Derivatives September 30, 2016 |
|||||||||||
| Derivatives not accounted for as hedging instruments under ASC 815 |
Location in the Statements of Assets and Liabilities |
Fair Value ($) |
Location in the Statements of Assets and Liabilities |
Fair Value ($) |
||||||||
| U.S. Large-Cap Core Equity Fund | ||||||||||||
| Equity Contracts | Assets, Net Assets — Net Unrealized Appreciation/ (Depreciation) on Futures | 854 | * | Liabilities, Net Assets — Net Unrealized Appreciation/ (Depreciation) on Futures | — | |||||||
| Premier Growth Equity Fund | ||||||||||||
| Equity Contracts | Assets, Net Assets — Net Unrealized Appreciation/ (Depreciation) on Futures | 22,586 | * | Liabilities, Net Assets — Net Unrealized Appreciation/ (Depreciation) on Futures | — | |||||||
| Small-Cap Equity Fund | ||||||||||||
| Equity Contracts | Assets, Net Assets — Net Unrealized Appreciation/ (Depreciation) on Futures | 128,327 | * | Liabilities, Net Assets — Net Unrealized Appreciation/ (Depreciation) on Futures | — | |||||||
| International Equity Fund | ||||||||||||
| Equity Contracts | Assets, Net Assets — Net Unrealized Appreciation/ (Depreciation) on Futures | 17,674 | * | Liabilities, Net Assets — Net Unrealized Appreciation/ (Depreciation) on Futures | — | |||||||
| Strategic Investment Fund | ||||||||||||
| Equity Contracts | Assets, Net Assets — Net Unrealized Appreciation/ (Depreciation) on Futures | 126,081 | * | Liabilities, Net Assets — Net Unrealized Appreciation/ (Depreciation) on Futures | (61,935 | )* | ||||||
| Interest Rate Contracts | Assets, Net Assets — Net Unrealized Appreciation/ (Depreciation) on Futures | 28,687 | * | Liabilities, Net Assets — Net Unrealized Appreciation/ (Depreciation) on Futures | — | |||||||
| Credit Risk Contracts | Assets, Net Assets — Net Unrealized Appreciation/ (Depreciation) on Swap Contracts | — | Liabilities, Net Assets — Net Unrealized Appreciation/ (Depreciation) on Swap Contracts | (464,825 | )* | |||||||
| Income Fund | ||||||||||||
| Interest Rate Contracts | Assets, Net Assets — Net Unrealized Appreciation/ (Depreciation) on Futures | 47,254 | * | Liabilities, Net Assets — Net Unrealized Appreciation/ (Depreciation) on Futures | (39,770 | )* | ||||||
| Credit Risk Contracts | Assets, Net Assets — Net Unrealized Appreciation/ (Depreciation) on Swap Contracts | — | Liabilities, Net Assets — Net Unrealized Appreciation/ (Depreciation) on Swap Contracts | (568,740 | )* | |||||||
| * | Includes cumulative unrealized appreciation/(depreciation) of futures and credit default swap contracts as reported in the Schedules of Investments and within the components of the net assets section of the Statement of Assets and Liabilities. Only the current day’s variation margin is reported within the Assets and/or Liabilities section on the Statement of Assets and Liabilities. |
| 128 | Notes to Financial Statements |
Table of Contents
GE Institutional Funds
Notes to Financial Statements, continued — September 30, 2016
Shown below are the effects of derivative instruments on each Fund’s Statement of Operations, summarized by primary risk exposure, none of which are accounted for as hedging instruments under ASC 815.
| Derivatives not accounted for as hedging instruments under ASC 815 |
Location in the Statements of Operations | Total Notional Amount of Futures Contracts Purchased/(Sold) ($) |
Realized Gain (Loss) on Derivatives Recognized in Income ($) |
Change in Unrealized Appreciation (Depreciation) on Derivatives Recognized in Income ($) |
||||||||||
| Realized Gain/(Loss) |
Unrealized Gain/(Loss) |
|||||||||||||
| U.S. Equity Fund | ||||||||||||||
| Equity Contracts | Realized gain (loss) on Futures, Increase (decrease) in unrealized appreciation/ (depreciation) on Futures |
|
100,780,327/ (98,383,121) |
|
(557,747 | ) | 200,347 | |||||||
| S&P 500 Index Fund | ||||||||||||||
| Equity Contracts | Realized gain (loss) on Futures, Increase (decrease) in unrealized appreciation/ (depreciation) on Futures |
|
5,881,633/ (6,690,181) |
|
82,126 | 50,884 | ||||||||
| U.S. Large-Cap Core Equity Fund | ||||||||||||||
| Equity Contracts | Realized gain (loss) on Futures, Increase (decrease) in unrealized appreciation/ (depreciation) on Futures |
|
15,500,346/ (16,697,076) |
|
123,949 | (4,592 | ) | |||||||
| Premier Growth Equity Fund | ||||||||||||||
| Equity Contracts | Realized gain (loss) on Futures, Increase (decrease) in unrealized appreciation/ (depreciation) on Futures |
|
80,119,948/ (74,873,165) |
|
1,013,067 | (41,804 | ) | |||||||
| Small-Cap Equity Fund | ||||||||||||||
| Equity Contracts | Realized gain (loss) on Futures, Increase (decrease) in unrealized appreciation/ (depreciation) on Futures |
|
245,944,691/ (242,090,286) |
|
2,094,826 | 958,595 | ||||||||
| International Equity Fund | ||||||||||||||
| Equity Contracts | Realized gain (loss) on Futures, Increase (decrease) in unrealized appreciation/ (depreciation) on Futures |
|
194,473,556/ (191,627,814) |
|
6,389,767 | 327,733 | ||||||||
| Strategic Investment Fund | ||||||||||||||
| Equity Contracts | Realized gain (loss) on Futures, Increase (decrease) in unrealized appreciation/ (depreciation) on Futures |
|
273,736,522/ (280,428,320) |
|
1,940,704 | 248,019 | ||||||||
| Interest Rate Contracts | Realized gain/(loss) on futures, Increase/(decrease) in unrealized appreciation/ (depreciation) on Futures |
|
770,323,355/ (756,129,941) |
|
(733,484 | ) | 251,469 | |||||||
| Credit Risk Contracts | Realized gain/(loss) on credit default swaps Increase/ (decrease) in unrealized appreciation/(depreciation) on swap contracts | —/— | (171,228 | ) | (264,050 | ) | ||||||||
| Income Fund | ||||||||||||||
| Interest Rate Contracts | Realized gain/(loss) on futures, Increase/(decrease) in unrealized appreciation/ (depreciation) on Futures |
|
1,000,428,174/ 990,482,039 |
|
(456,598 | ) | 362,641 | |||||||
| Credit Risk Contracts | Realized gain/(loss) on credit default swaps Increase/ (decrease) in unrealized appreciation/(depreciation) on swap contracts | —/— | (218,652 | ) | (331,496 | ) | ||||||||
| Notes to Financial Statements | 129 |
Table of Contents
GE Institutional Funds
Notes to Financial Statements, continued — September 30, 2016
During the fiscal year ended September 30, 2016, the Funds had an average notional value of long and short futures contracts as shown below. The Strategic Investment Fund and Income Fund had average notional values of $10,546,535 and $13,443,658 on credit default swaps, respectively. Please refer to the table following the Portfolio of Investments for open credit default swaps and futures contracts at September 30, 2016.
| Fund | Long Contracts | Short Contracts | ||||||
| U.S. Equity Fund |
6,429,764 | 442,096 | ||||||
| S&P 500 Index Fund |
847,828 | — | ||||||
| U.S. Large-Cap Core Equity Fund |
1,110,852 | — | ||||||
| Premier Growth Equity Fund |
1,973,209 | 830,739 | ||||||
| Small-Cap Equity Fund |
19,515,046 | — | ||||||
| International Equity Fund |
8,065,308 | 2,879,776 | ||||||
| Strategic Investment Fund |
44,342,407 | 36,165,124 | ||||||
| Income Fund |
28,338,213 | 33,381,974 | ||||||
| 5. | Line of Credit |
Prior to July 1, 2016, the Trust (excluding the S&P 500 Index Fund) shared a revolving credit facility of up to $150 million with a number of its affiliates. The credit facility was with the Trust’s custodian bank, State Street Bank and Trust Company (“State Street”). The revolving credit facility required the payment of a commitment fee equal to 0.20% per annum on the daily unused portion of the credit facility, payable quarterly. The portion borne by each Fund generally was borne proportionally based upon net assets. Generally, borrowings under the credit facility would accrue interest at the higher of the 1-Month LIBOR plus 1.25% and the Overnight Federal Funds Rate plus 1.25% and would be borne by the borrowing Fund. The maximum amount allowed to be borrowed by any one Fund was the lesser of (i) 33.33% of its total assets or (ii) 20% of its net assets. The revolving credit facility with State Street was terminated effective June 30, 2016.
Effective July 1, 2016, the Trust and other affiliated funds (each, a “Participant” and collectively, the “Participants”) share in a $360 million revolving credit facility provided by a syndication of banks. The current agreement expires in October 2017 unless extended or renewed. Participants may borrow up to $360 million at any time outstanding, subject to asset coverage and other limitations as specified under separate agreements. The Participants were charged an annual commitment fee of 0.12% (0.15% commencing October 13, 2016) per annum, which is calculated based on the daily unused portion of the shared credit line. Commitment fees are allocated among each of the Participants based on relative net assets. Commitment fees are paid by the Adviser and included in the “unitary fee” paid by the Funds. A Participant incurs and pays the interest expense related to its borrowing. Prior to October 13, 2016, interest was calculated at a rate per annum equal to the sum of the New York Fed Bank Rate plus 1%. Effective October 13, 2016, interest is calculated at a rate per annum equal to the higher of the New York Fed Bank Rate or LIBOR plus 1%. Neither credit facility was utilized by the Trust during the fiscal year ended September 30, 2016. The maximum amount allowed to be borrowed by any one Fund is the lesser of (i) 33.33% of its total assets or (ii) 20% of its net assets.
| 6. | Fees and Compensation Paid to Affiliates |
SSGA FM, a registered investment adviser, was retained by the Trust’s Board effective July 1, 2016 to act as investment adviser and administrator of each Fund. SSGA FM’s compensation for investment advisory and administrative services (“Management Fee”) is paid monthly based on the average daily net assets of each Fund. The Management Fee is stated in the following schedule:
| Fund | Average Daily Net Assets of Fund |
Management Fee | ||||
| U.S. Equity Fund |
First $25 million | 0.55 | % | |||
| U.S. Large-Cap Core Equity Fund |
Next $25 million | 0.45 | % | |||
| Premier Growth Equity Fund |
Over $50 million | 0.35 | % | |||
| S&P 500 Index Fund |
All assets | 0.15 | % | |||
| 130 | Notes to Financial Statements |
Table of Contents
GE Institutional Funds
Notes to Financial Statements, continued — September 30, 2016
| Fund | Average Daily Net Assets of Fund |
Management Fee | ||||
| Small-Cap Equity Fund |
First $250 million | 0.95 | % | |||
| Next $250 million | 0.90 | % | ||||
| Over $500 million | 0.85 | % | ||||
| International Equity Fund |
First $25 million | 0.75 | % | |||
| Next $50 million | 0.65 | % | ||||
| Over $75 million | 0.55 | % | ||||
| Strategic Investment Fund |
First $25 million | 0.45 | % | |||
| Next $25 million | 0.40 | % | ||||
| Over $50 million | 0.35 | % | ||||
| Income Fund |
First $25 million | 0.35 | % | |||
| Next $25 million | 0.30 | % | ||||
| Next $50 million | 0.25 | % | ||||
| Over $100 million | 0.20 | % | ||||
Prior to July 1, 2016, GEAM served as each Fund’s investment adviser and administrator and each Fund paid GEAM a Management Fee as stated in the following schedule:
| Fund | Average Daily Net Assets of Fund |
Management Fee | ||||
| U.S. Equity Fund |
First $25 million | 0.55 | % | |||
| U.S. Large-Cap Core Equity Fund |
Next $25 million | 0.45 | % | |||
| Premier Growth Equity Fund |
Over $50 million | 0.35 | % | |||
| S&P 500 Index Fund |
All assets | 0.15 | % | |||
| Small-Cap Equity Fund |
First $250 million | 0.95 | % | |||
| Next $250 million | 0.90 | % | ||||
| Over $500 million | 0.85 | % | ||||
| International Equity Fund |
First $25 million | 0.75 | % | |||
| Next $50 million | 0.65 | % | ||||
| Over $75 million | 0.55 | % | ||||
| Strategic Investment Fund |
First $25 million | 0.45 | % | |||
| Next $25 million | 0.40 | % | ||||
| Over $50 million | 0.35 | % | ||||
| Income Fund |
First $25 million | 0.35 | % | |||
| Next $25 million | 0.30 | % | ||||
| Next $50 million | 0.25 | % | ||||
| Over $100 million | 0.20 | % | ||||
Distribution and Shareholder Servicing Fees The Funds have adopted a Shareholder Servicing and Distribution Plan (the “Plan”) pursuant to Rule 12b-1 under the 1940 Act with respect to the Service Class shares of each Fund. Each Fund pays State Street Global Markets, LLC, the Funds’ principal underwriter effective July 1, 2016, a monthly fee for distribution and/or shareholder services provided, at an annual rate of 0.25% of the average daily net assets of such Fund attributable to the Service Class shares. Prior to July 1, 2016, GE Investment Distributors, Inc. (“GEID”), a wholly-owned subsidiary of GEAM, served as the Funds’ principal underwriter and the Funds paid GEID a monthly fee for distribution and/or shareholder
| Notes to Financial Statements | 131 |
Table of Contents
GE Institutional Funds
Notes to Financial Statements, continued — September 30, 2016
services provided, at an annual rate of 0.25% of the average daily net assets of such Fund attributable to the Service Class shares. Currently, Investment Class shares are not subject to a 12b-1 fee.
Trustee Compensation The Funds pay no compensation to their Trustees who are officers or employees of SSGA FM or its affiliates. Trustees who are not such officers or employees also serve in a similar capacity for other funds advised by SSGA FM. Compensation paid to independent Trustees is reflected on the Statements of Operations. These fees are allocated pro rata across funds and share classes served by the Trustees and are based upon the relative net assets of each fund. Prior to July 1, 2016, the Trustees who were officers or employees of GEAM received no compensation from the Funds. (For additional information about Trustees’ compensation please refer to the Funds’ Statement of Additional Information).
| 7. | Sub-Advisory Fees |
For certain Funds that have retained sub-advisers to manage all or a portion of the respective Fund’s assets, SSGA FM pays each sub-adviser an investment sub-advisory fee out of the Management Fee that it receives from the respective Fund. The investment sub-advisory fee is paid by SSGA FM monthly and is based upon the average daily net assets of the respective Fund’s assets that are allocated to and managed by the sub-adviser. Each such sub-adviser is responsible for the day-to-day management of those assets of the Fund that are allocated to the sub-adviser, including the responsibility for making decisions to buy, sell or hold a particular security with respect to those assets. For their services as sub-advisers to the Small-Cap Equity Fund, SSGA FM pays an investment sub-advisory fee to each of Palisade Capital Management, L.L.C., Champlain Investment Partners, LLC, GlobeFlex Capital, L.P., SouthernSun Asset Management, LLC and Kennedy Capital Management, Inc. Prior to July 1, 2016, SSGA FM served as the sub-adviser to the S&P 500 Index Fund and was paid a monthly investment sub-advisory fee by the investment adviser based upon the average daily net assets of the S&P 500 Index Fund.
| 8. | Investment Transactions |
Purchases and Sales of Securities The cost of purchases and the proceeds from sales of investments, other than short-term securities, for the fiscal year ended September 30, 2016, were as follows:
| U.S. Government Securities | Other Securities | |||||||||||||||
| Fund | Purchases | Sales | Purchases | Sales | ||||||||||||
| U.S. Equity Fund |
$ | — | $ | — | $ | 256,180,825 | $ | 342,077,758 | ||||||||
| S&P 500 Index Fund |
— | — | 2,313,575 | 15,034,894 | ||||||||||||
| U.S. Large-Cap Core Equity Fund |
— | — | 30,595,481 | 45,517,218 | ||||||||||||
| Premier Growth Equity Fund |
— | — | 69,527,204 | 127,133,195 | ||||||||||||
| Small-Cap Equity Fund |
— | — | 378,107,555 | 467,716,504 | ||||||||||||
| International Equity Fund |
— | — | 413,726,339 | 494,835,536 | ||||||||||||
| Strategic Investment Fund |
473,407,570 | 468,749,305 | 267,390,731 | 296,257,591 | ||||||||||||
| Income Fund |
527,677,465 | 512,921,659 | 100,660,638 | 116,186,868 | ||||||||||||
Affiliated Investments The Funds may invest in affiliated funds, or entities deemed to be affiliates as a result of the Funds owning more than five percent of the entity’s voting securities or outstanding shares. Amounts relating to these transactions during the fiscal year ended September 30, 2016 are disclosed in the Schedules of Investments.
| 9. | Income Taxes |
The Funds are subject to ASC 740, Income Taxes (“ASC 740”). ASC 740 provides guidance for financial accounting and reporting for the effects of income taxes that result from an entity’s activities during the year. ASC 740 also provides guidance regarding how uncertain tax positions should be recognized, measured, presented and disclosed in the financial statements. ASC 740 requires evaluation of tax positions taken or expected to be taken in the course of preparing each Fund’s tax returns to determine whether the tax positions are “more likely than not” of being sustained by the applicable tax authority. There are no adjustments to any Fund’s net assets required under ASC 740. Each Fund’s 2012, 2013, 2014 and 2015 fiscal year tax returns are still open to examination by the Federal and applicable state tax authorities.
| 132 | Notes to Financial Statements |
Table of Contents
GE Institutional Funds
Notes to Financial Statements, continued — September 30, 2016
At September 30, 2016, information on the tax cost of investments and distributable earnings on a tax basis was as follows:
| Fund |
Cost of Investments for Tax Purposes |
Gross Tax | Net Tax Appreciation/ (Depreciation) |
Undistributed |
Undistributed Accumulated Capital Gain/(Loss) |
Late-Year |
||||||||||||||||||||||||||
| Appreciation | Depreciation | Investments | Derivatives/ Currency |
|||||||||||||||||||||||||||||
| U.S. Equity Fund |
$ | 505,597,080 | $ | 89,627,776 | $ | (8,708,649 | ) | $ | 80,919,127 | $ | (904 | ) | $ | 6,822,971 | $ | 25,711,381 | $ | — | ||||||||||||||
| S&P 500 Index Fund |
13,717,144 | 2,899,329 | (456,634 | ) | 2,442,695 | 4,441 | 232,106 | (8,735,610 | ) | — | ||||||||||||||||||||||
| U.S. Large-Cap Core Equity Fund |
47,754,332 | 6,825,784 | (1,074,939 | ) | 5,750,845 | 854 | 715,789 | 931,775 | — | |||||||||||||||||||||||
| Premier Growth Equity Fund |
269,408,513 | 70,898,987 | (4,209,784 | ) | 66,689,203 | 22,586 | 1,728,714 | 26,800,868 | (569,152 | ) | ||||||||||||||||||||||
| Small-Cap Equity Fund |
1,050,233,517 | 281,622,873 | (49,097,112 | ) | 232,525,761 | 128,327 | 1,346,261 | 37,571,138 | — | |||||||||||||||||||||||
| International Equity Fund |
1,225,878,471 | 126,120,915 | (95,970,103 | ) | 30,150,812 | (44,576 | ) | 21,620,563 | (220,665,993 | ) | — | |||||||||||||||||||||
| Strategic Investment Fund |
732,352,618 | 62,788,142 | (17,029,254 | ) | 45,758,888 | (378,330 | ) | 13,255,737 | 5,889,673 | — | ||||||||||||||||||||||
| Income Fund |
316,834,660 | 8,178,952 | (1,490,915 | ) | 6,688,037 | (561,256 | ) | 607,723 | — | — | ||||||||||||||||||||||
As of September 30, 2016, the following Funds have capital loss carryovers as indicated below. The capital loss carryover is available to offset future realized capital gains to the extent provided in the Internal Revenue Code and regulations thereunder. To the extent that these carryover losses are used to offset future capital gains, it is probable that the gains offset will not be distributed to shareholders.
| Fund | Short Term | Long Term | Expires | |||||||||
| S&P 500 Index Fund |
$ | 7,532,863 | $ | — | 9/30/2018 | |||||||
| 1,202,747 | — | 9/30/2019 | ||||||||||
| International Equity Fund |
$ | 34,429,113 | — | 9/30/2018 | ||||||||
| 140,255,693 | — | 9/30/2019 | ||||||||||
| 8,854,818 | 37,126,369 | Unlimited | ||||||||||
These amounts will be available to offset future taxable capital gains. Under the Regulated Investment Company Modernization Act of 2010, a Fund is permitted to carry forward capital losses incurred in taxable years beginning after December 22, 2010 for an unlimited period. However, any losses incurred during those future years will be required to be utilized prior to the losses incurred in pre-enactment tax years. As a result of this ordering rule, pre-enactment capital loss carryforwards may be more likely to expire unused. Additionally, post-enactment capital losses that are carried forward will retain their character as either short-term or long-term capital losses rather than being considered all short-term as under previous law.
Fund capital loss carryovers were utilized as follows:
| Fund | Amount | |||
| S&P 500 Index Fund |
$ | 5,223,240 | ||
Any qualified late-year loss is deemed to arise on the first day of a Fund’s next tax year (if the Fund elects to defer such loss). Under this regime, generally, a Fund can elect to defer any post-October capital loss and/or any late-year ordinary loss as defined by the Internal Revenue Code.
The following Funds elected to defer qualified late-year losses for the fiscal year ended September 30, 2016 as follows:
| Fund | Capital | Ordinary | ||||||
| Premier Growth Equity Fund |
$ | (569,152 | ) | — | ||||
Distributions to Shareholders The Income Fund declares net investment income dividends daily and pays them monthly. All other Funds declare and pay dividends from net investment income, if any, annually. All Funds declare and pay distributions annually from net realized capital gains in excess of capital loss carryforwards, if any. The character of income and gains to be distributed is determined in accordance with income tax regulations which may differ from GAAP. These differences include (but are not limited to) gains and losses on foreign currency, foreign taxes payable, investments in futures, investments in swap contracts, investments in passive foreign investment companies, losses deferred to offsetting positions, losses deferred due to wash sale transactions, investments in underlying securities and redemptions in kind.
| Notes to Financial Statements | 133 |
Table of Contents
GE Institutional Funds
Notes to Financial Statements, continued — September 30, 2016
The tax character of distributions paid during the fiscal years ended September 30, 2016 and September 30, 2015 were as follows:
| September 30, 2016 | September 30, 2015 | |||||||||||||||
| Fund | Ordinary Income |
Long Term Capital Gains |
Ordinary Income |
Long Term Capital Gains |
||||||||||||
| U.S. Equity Fund |
$ | 9,778,155 | $ | 101,236,202 | $ | 14,371,167 | $ | 88,684,050 | ||||||||
| S&P 500 Index Fund |
554,212 | — | 660,014 | — | ||||||||||||
| U.S. Large-Cap Core Equity Fund |
1,330,366 | 11,831,993 | 2,468,416 | 14,065,417 | ||||||||||||
| Premier Growth Equity Fund |
3,953,664 | 28,956,870 | 4,234,095 | 35,777,908 | ||||||||||||
| Small-Cap Equity Fund |
2,264,662 | 135,524,827 | 11,492,443 | 122,138,911 | ||||||||||||
| International Equity Fund |
20,715,844 | — | 42,275,022 | — | ||||||||||||
| Strategic Investment Fund |
14,267,379 | 35,892,452 | 22,748,238 | 58,732,061 | ||||||||||||
| Income Fund |
10,829,241 | — | 8,246,345 | — | ||||||||||||
Reclassifications are made to a Fund’s capital accounts to reflect income and gains available for distribution (or available capital loss carryovers) under income tax regulations. These reclassifications have no impact on net investment income, realized gains or losses, or the NAV of any of the Funds. The calculation of net investment income per share in the Financial Highlights table excludes these adjustments.
The reclassifications for the fiscal year ended September 30, 2016 were as follows:
| Fund | Undistributed Net Investment Income |
Accumulated Net Realized Gain (Loss) |
Unrealized Loss |
Paid In Capital |
||||||||||||
| U.S. Equity Fund |
$ | (317,728 | ) | $ | 317,728 | $ | — | $ | — | |||||||
| S&P 500 Index Fund |
(13,019 | ) | 13,019 | — | — | |||||||||||
| U.S. Large-Cap Core Equity Fund |
(12,046 | ) | 12,046 | — | — | |||||||||||
| Premier Growth Equity Fund |
(322,767 | ) | 322,767 | — | — | |||||||||||
| Small-Cap Equity Fund |
(225,342 | ) | 225,342 | — | — | |||||||||||
| International Equity Fund |
924,458 | (924,458 | ) | — | — | |||||||||||
| Strategic Investment Fund |
(456,831 | ) | 456,831 | — | — | |||||||||||
| Income Fund |
(365,115 | ) | 365,115 | — | — | |||||||||||
| 10. | Change in Audit Firm |
KPMG LLP (“KPMG”) served as the independent registered certified public accounting firm of the Trust through its resignation as of June 30, 2016. On September 9, 2016, upon recommendation by the Audit Committee of the Trust, the Trust’s Board selected Ernst & Young LLP (“EY”) to replace KPMG as the independent public accountant for the fiscal year ended September 30, 2016.
The reports of KPMG on the financial statements for the fiscal years ended September 30, 2014 and September 30, 2015 contained no adverse opinion or disclaimer of opinion and were not qualified or modified as to uncertainty, audit scope or accounting principles.
During the Trust’s fiscal years ended September 30, 2014 and September 30, 2015 and through the period ended June 30, 2016, there were no disagreements with KPMG on any matter of accounting principles or practices, financial statement disclosure, or auditing scope or procedure, which disagreements if not resolved to the satisfaction of KPMG would have caused them to make reference thereto in their reports on the financial statements for such years or periods.
During the Trust’s fiscal years ended September 30, 2014 and September 30, 2015 and through the period ended June 30, 2016, there were no reportable events (as defined in Item 304(a)(1)(v) of Regulation S-K). The Funds requested and KPMG furnished a letter addressed to the Securities and Exchange Commission stating whether or not it agreed with the above statements. A copy of such letter was filed as Exhibit 77 to Form N-SAR for the period ended September 30, 2016.
During the Trust’s fiscal years ended September 30, 2014 and September 30, 2015 and through September 9, 2016, neither the Trust nor anyone on its behalf has consulted EY on items which: (i) concerned the application of accounting principles to a specified transaction, either completed or proposed, or the type of audit opinion that might be rendered on the Trust’s financial
| 134 | Notes to Financial Statements |
Table of Contents
GE Institutional Funds
Notes to Financial Statements, continued — September 30, 2016
statements or (ii) concerned the subject of a disagreement (as defined in paragraph (a)(1)(iv) of Item 304 of Regulations S-K) or reportable events (as described in paragraph (a)(1)(v) of said Item 304).
| 11. | Subsequent Event |
At a Board meeting held on June 9, 2016, the Board approved the rebranding of the Trust and each of its series portfolios in connection with the appointment of SSGA FM as investment adviser to the Funds. Effective on or about November 30, 2016, the Trust will be rebranded the “State Street Institutional Funds” and each individual Fund will change its respective name as follows:
| Old Name | New Name | |
| GE Institutional Income Fund |
State Street Institutional Income Fund | |
| GE Institutional International Equity Fund |
State Street Institutional International Equity Fund | |
| GE Institutional U.S. Large-Cap Core Equity Fund |
State Street Institutional U.S. Large-Cap Core Equity Fund | |
| GE Institutional Premier Growth Equity Fund |
State Street Institutional Premier Growth Equity Fund | |
| GE Institutional S&P 500 Index Fund |
State Street Institutional S&P 500 Index Fund | |
| GE Institutional Small-Cap Equity Fund |
State Street Institutional Small-Cap Equity Fund | |
| GE Institutional Strategic Investment Fund |
State Street Institutional Strategic Investment Fund | |
| GE Institutional U.S. Equity Fund |
State Street Institutional U.S. Equity Fund |
| Notes to Financial Statements | 135 |
Table of Contents
GE Institutional Funds
Report of Independent Registered Public Accounting Firm
To the Shareholders and Board of Trustees of GE Institutional Funds:
We have audited the accompanying statements of assets and liabilities, including the schedules of investments, of GE Institutional Funds (comprising, respectively, U.S. Equity Fund, S&P 500 Index Fund, U.S. Large-Cap Core Equity Fund, Premier Growth Equity Fund, Small-Cap Equity Fund, International Equity Fund, Strategic Investment Fund and Income Fund) (collectively, the “Funds”) as of September 30, 2016, and the related statements of operations, statements of changes in net assets, and the financial highlights for the year then ended. These financial statements and financial highlights are the responsibility of the Funds’ management. Our responsibility is to express an opinion on these financial statements and financial highlights based on our audits. The statements of changes in net assets for the year ended September 30, 2015 and the financial highlights for periods ended prior to October 1, 2015 were audited by another independent registered public accounting firm whose report, dated November 20, 2015, expressed an unqualified opinion on those statements of changes in net assets and those financial highlights.
We conducted our audits in accordance with the standards of the Public Company Accounting Oversight Board (United States). Those standards require that we plan and perform the audit to obtain reasonable assurance about whether the financial statements and financial highlights are free of material misstatement. We were not engaged to perform an audit of the Funds’ internal control over financial reporting. Our audits included consideration of internal control over financial reporting as a basis for designing audit procedures that are appropriate in the circumstances, but not for the purpose of expressing an opinion on the effectiveness of the Funds’ internal control over financial reporting. Accordingly, we express no such opinion. An audit also includes examining, on a test basis, evidence supporting the amounts and disclosures in the financial statements and financial highlights, assessing the accounting principles used and significant estimates made by management, and evaluating the overall financial statement presentation. Our procedures included confirmation of securities owned as of September 30, 2016, by correspondence with the custodian, brokers and others or by other appropriate auditing procedures where replies from brokers and others were not received. We believe that our audits provide a reasonable basis for our opinion.
In our opinion, the financial statements and financial highlights referred to above present fairly, in all material respects, the financial position of each of the aforementioned funds comprising GE Institutional Funds at September 30, 2016, and the results of their operations, the changes in their net assets, and the financial highlights for the year then ended, in conformity with U.S. generally accepted accounting principles.

Boston, Massachusetts
November 21, 2016
| 136 | Report of Independent Registered Public Accounting Firm |
Table of Contents
GE Institutional Funds
Tax Information — September 30, 2016 (Unaudited)
The following Fund intends to make an election under Internal Revenue Code Section 853. The election will allow shareholders to treat their attributable share of foreign taxes paid by the Fund to be paid by them directly. For the fiscal year ended September 30, 2016, the total amount of income received by the Fund from sources within foreign countries and possessions of the United States and the total amount of taxes paid by the Fund follows:
| Fund | Total Foreign Source Income |
Total Foreign Taxes Paid |
||||||
| International Equity Fund |
$ | 34,203,537 | $ | 3,249,011 | ||||
For the fiscal year ended September 30, 2016, certain dividends paid by the Funds may be subject to a maximum income tax rate of 15% as provided for by the Jobs and Growth Tax Relief Reconciliation Act of 2003. The following represent the amounts that may be considered qualified dividend income:
| Fund | QDI | |||
| U.S. Equity Fund |
$ | 11,523,917 | ||
| S&P 500 Index Fund |
400,284 | |||
| U.S. Large-Cap Core Equity Fund |
1,198,582 | |||
| Premier Growth Equity Fund |
4,145,198 | |||
| Small-Cap Equity Fund |
12,545,165 | |||
| International Equity Fund |
33,021,221 | |||
| Strategic Investment Fund |
8,869,323 | |||
| Income Fund |
19,077 | |||
For corporate shareholders the following represent the percentages of respective fund distributions that may be eligible for the dividends received deduction:
| Fund | DRD | |||
| U.S. Equity Fund |
100.00% | |||
| S&P 500 Index Fund |
98.11% | |||
| U.S. Large-Cap Core Equity Fund |
100.00% | |||
| Premier Growth Equity Fund |
100.00% | |||
| Small-Cap Equity Fund |
100.00% | |||
| Strategic Investment Fund |
28.33% | |||
| Income Fund |
0.21% | |||
For the year ended September 30, 2016, the following Funds hereby designate as capital gain dividends the amounts set forth, or the amount ultimately treated as capital gain net income:
| Fund | Gross Amount | |||
| U.S. Equity Fund |
$ | 101,236,202 | ||
| U.S. Large-Cap Core Equity Fund |
11,831,993 | |||
| Premier Growth Equity Fund |
28,956,870 | |||
| Small-Cap Equity Fund |
135,524,827 | |||
| Strategic Investment Fund |
35,892,452 | |||
The amounts presented herein may differ from amounts presented elsewhere in the financial statements due to differences between tax and financial accounting principles. Please consult a tax advisor if you have any questions about Federal or State income tax laws or on how to prepare your tax returns. If you have specific questions about your Fund account, please consult your investment representative.
| Tax Information | 137 |
Table of Contents
GE Institutional Funds
Advisory and Administration Agreement Approval (Unaudited)
Disclosure for the Board of Trustees’ Consideration of the Approval of the New Investment Advisory and Administration Agreements with SSGA Funds Management, Inc.
At a meeting of the Board of Trustees held on April 19-20, 2016 (the “Board Meeting”), the Trustees, including a majority of the Independent Trustees, who were present at the Board Meeting considered and unanimously approved an investment advisory and administration agreement (the “New Investment Advisory and Administration Agreement”) with SSGA Funds Management, Inc. (“SSGA FM” or the “Adviser”) on behalf of each Fund. In considering whether to approve the New Investment Advisory and Administration Agreement, the Trustees considered and discussed a substantial amount of information and analysis provided, at the Board’s request, by the Adviser and GE Asset Management Incorporated (“GEAM”).
Before approving the New Investment Advisory and Administration Agreement on behalf of each Fund, the Board reviewed the information provided with management of the Adviser and GEAM. The Board also reviewed a memorandum prepared by independent legal counsel discussing the legal standards for the consideration of the proposed New Investment Advisory and Administration Agreement, as well as other memoranda and information relevant to the legal standards and related considerations for a transaction such as the one between the Adviser and GEAM. The Independent Trustees discussed the New Investment Advisory and Administration Agreement in detail during private sessions in advance of, and at, the Board Meeting with their independent legal counsel at which no representatives of the Adviser or GEAM were present. The Independent Trustees and their independent legal counsel requested, and received and considered, additional information from the Adviser and GEAM prior to the Board Meeting.
Prior to and at the Board Meeting, representatives of GEAM and the Adviser explained and discussed with the Board the specific terms of the asset purchase agreement entered into on March 29, 2016 by General Electric Company (“GE”) with State Street Corporation (“SSC”) for the sale of the asset management and advisory services business conducted by GEAM, a wholly owned subsidiary of GE and the Funds’ investment adviser, and certain of its subsidiaries (the “Transaction”) and responded to questions raised by the Board. The Trustees posed questions to these representatives and engaged in significant discussions. In addition, in response to their detailed requests, the Board received from the Adviser written responses to its inquiries, which included substantial exhibits and other materials related to the Adviser’s business and the services it proposes to provide to each Fund. The Trustees took into account their multi-year experience as Trustees and particularly their consideration of the current investment advisory and administration agreements under which GEAM provides investment advisory services to the Funds (the “Existing GEAM Agreements”) in recent years.
The Board also received materials relating to the organizational structure and business of the Adviser, including materials describing changes expected as a result of the Transaction. Various information relating to the terms of the Transaction, including the goals, interests and timetable of the Adviser, was discussed as well. The Adviser also advised that no change in investment processes is anticipated as a result of the Transaction as all of the personnel of GEAM responsible for the daily management and operations of the Funds, including current officers of the Funds, were expected to become employees of SSGA FM or its affiliates and continue to serve in the same capacities upon the closing of the Transaction.
In approving the New Investment Advisory and Administration Agreement with the Adviser, the Trustees considered those factors it deemed relevant, including the factors discussed below. In its deliberations, the Board did not identify any single factor that was dispositive and each Trustee may have attributed different weights to the various factors. The Trustees evaluated the information provided to them by GEAM and the Adviser, as well as the presentations and discussions that occurred at the Board Meeting, for each Fund on a Fund-by-Fund basis, and their determinations were made separately in respect of each Fund.
The material factors and conclusions that formed the basis for the Board’s determinations to approve the New Investment Advisory and Administration Agreement with the Adviser on behalf of each Fund are as discussed below.
The Nature, Extent and Quality of Services Expected to be Provided.
The Trustees reviewed the services expected to be provided to the Funds by the Adviser. The Board considered the Adviser’s favorable attributes, including its substantial experience managing mutual funds, investment philosophy and discipline, experienced investment and trading personnel, systems and other resources, and favorable history and reputation. The Board also reviewed the extensive information provided by the Adviser related to its business, legal and regulatory affairs. This review considered the resources available to the Adviser to provide the services specified under the New Investment Advisory and
| 138 | Advisory and Administration Agreement Approval |
Table of Contents
GE Institutional Funds
Advisory and Administration Agreement Approval (Unaudited), continued
Administration Agreement, including the supervision of the existing sub-advisers to the Small-Cap Equity Fund. Additionally, the Board considered that it is anticipated that substantially all of the portfolio managers currently managing the Funds will be joining the Adviser as part of the Transaction.
In light of the foregoing, the Board, including the Independent Trustees, concluded that the services expected to be provided by the Adviser would be satisfactory, particularly given that the same individuals who currently provide portfolio management services to the Funds as employees of GEAM are expected to continue providing such services as employees of the Adviser, benefiting the Funds by providing continuity of service following the Transaction.
Investment Performance of GEAM and the Adviser.
The Trustees considered the investment performance of GEAM and the Adviser for various periods focusing on GEAM’s and the Adviser’s investment performance with respect to registered investment companies and other accounts that have investment objectives and strategies similar to that of the Funds. The Board also engaged in detailed discussions with GEAM and the Adviser about their investment processes, focusing on the number and experience of portfolio management and supporting research personnel and GEAM’s and the Adviser’s investment style and approach employed. The Board noted that the Funds’ historical performance under the Existing GEAM Agreements was relevant as the personnel providing portfolio management services would continue to provide those services under the New Investment Advisory and Administration Agreement.
Taking these factors into consideration, the Board, including the Independent Trustees, concluded that each Fund’s performance was acceptable.
Cost of the Services to be Provided And Profits to be Realized From The Relationship with the Funds.
The Trustees considered the proposed Management Fees that would be paid to the Adviser by the Funds, as well as the fees proposed to be paid to each of the sub-advisers by the Adviser, which will reduce the net Management Fees retained by the Adviser. Representatives of the Adviser stated that the Adviser was not able to estimate profitability in a meaningful way but expected to discuss any changes in the level of profitability with the Board during the contract renewal process. The Trustees considered the renewal requirements for advisory agreements and their ability to review the Management Fees annually after the initial term of the New Investment Advisory and Administration Agreement.
Information also was presented regarding the financial condition of the Adviser for various past periods. The Trustees also considered the Adviser’s statements concerning its significant investment in supporting registered investment companies.
The Extent to Which Economies of Scale Would Be Realized as the Funds Grow and Whether Fee Levels Would Reflect Such Economies of Scale.
The Trustees considered the extent to which economies of scale would be realized as the Funds grow, and whether the proposed fee levels reflect these economies of scale for the benefit of Fund investors. The Trustees noted that the Adviser expects its distribution plans and capabilities to provide an opportunity for the Funds to experience additional growth. The Board considered that there might be some opportunities for reductions in certain fixed operating expenses that might be enjoyed by the Funds depending on the extent to which their assets increase and determined that, to the extent in the future it were determined that material economies of scale had not been shared with the Funds, the Board would seek to have those economies of scale shared with the Funds.
Comparison of Services to be Rendered and Fees to be Paid.
The Board discussed the services expected to be provided to the Funds by the Adviser, and the proposed Management Fees to be charged to the Funds for those services. The Trustees reviewed information regarding the fee and expense ratio for each Fund and comparative information with respect to similar products. They discussed that most of the Funds’ fees and expenses generally should remain within applicable peer group ranges and, therefore, the Funds generally would be charged a competitive rate in comparison to their peers. The Trustees also considered Funds’ comparatively lower historical fee structure overall relative to advisers of other comparable industry peer group funds and noted that the Funds have generally benefitted from not having a high management fee rate for most of the Funds since their inception, and that the Management Fee is not proposed to change.
In light of the foregoing, the Board, including the Independent Trustees, determined that the proposed Management Fees, considered in relation to the services to be provided to the Funds, supported the Board’s approval of the New Investment Advisory and Administration Agreement.
| Advisory and Administration Agreement Approval | 139 |
Table of Contents
GE Institutional Funds
Advisory and Administration Agreement Approval (Unaudited), continued
Fall-Out Benefits.
The Board considered actual and potential financial benefits that the Adviser could derive from its relationship with the Funds, including the custody, fund accounting and sub-administration services being provided to the Funds by affiliates of the Adviser. The Board noted, however, that the affiliates of the Adviser had already been providing such services to the Funds pursuant to various services agreements that had been negotiated at arm’s-length prior to the Transaction, and that the Adviser would not derive any additional benefits from such services following the close of the Transaction.
Conclusion.
No single factor was determinative to the Board’s decision. Based on their discussion and such other matters as were deemed relevant, the Trustees, including the Independent Trustees, concluded that the approval of the New Investment Advisory and Administration Agreement with the Adviser was in the best interests of the Funds.
| 140 | Advisory and Administration Agreement Approval |
Table of Contents
GE Institutional Funds
Sub-Advisory Agreement Approval (Unaudited), continued
Disclosure for the Board of Trustees’ Consideration of the Approval of New Sub-Advisory Agreements with each of Palisade Capital Management, LLC, Champlain Investment Partners, LLC, GlobeFlex Capital, L.P., Kennedy Capital Management, Inc. and SouthernSun Asset Management, LLC
At the Board Meeting, the Trustees, including a majority of the Independent Trustees, who were present at the Board Meeting considered and unanimously approved the new sub-advisory agreements (each, a “New Sub-Advisory Agreement”) between SSGA FM and each of Palisade Capital Management, LLC, Champlain Investment Partners, LLC, GlobeFlex Capital, L.P., Kennedy Capital Management, Inc. and SouthernSun Asset Management, LLC (collectively, the “Small-Cap Equity Fund Sub-Advisers”). The Trustees noted that they had previously considered and approved the current sub-advisory agreements between GEAM and each Small-Cap Equity Fund Sub-Adviser (each, an “Existing Sub-Advisory Agreement”) at meetings held on December 16 and 18, 2015. For that reason, the Trustees focused on information with respect to those Small-Cap Equity Fund Sub-Advisers that had changed since that prior approval, but otherwise relied in part on their prior determinations, consideration and analysis.
In advance of the Board Meeting, the Board received materials from GEAM, the Adviser and each of the Small-Cap Equity Fund Sub-Advisers, and had the opportunity to ask questions and request additional information in connection with its consideration. The materials detailed, among other things, information about each of the Small-Cap Equity Fund Sub-Advisers and its professional staff, the Small-Cap Equity Fund Sub-Advisers’ experience, expertise and historical performance in managing similar funds and in servicing institutional clients.
In approving the New Sub-Advisory Agreements with each of the Small-Cap Equity Fund Sub-Advisers, the Trustees considered those factors they deemed relevant, including the nature, quality and extent of services expected to be provided by Small-Cap Equity Fund Sub-Advisers. In its deliberations, the Board did not identify any single factor that was dispositive and each Trustee may have attributed different weights to the various factors. The Trustees evaluated this information and all other information made available to them by GEAM, the Adviser and the Small-Cap Equity Fund Sub-Advisers, as well as the presentations and discussions that occurred at the Board Meeting.
The material factors and conclusions that formed the basis for the Board’s determinations to approve the Small-Cap Equity Fund’s New Sub-Advisory Agreements with the Small-Cap Equity Fund Sub-Advisers are as discussed below.
The Nature, Extent and Quality of Services Expected to be Provided.
The Trustees reviewed the services expected to be provided to the Small-Cap Equity Fund by the Small-Cap Equity Fund Sub-Advisers under the New Sub-Advisory Agreements. The Board noted that as a result of the Transaction, there was not expected to be any material changes in the nature, extent or quality of the sub-advisory services currently provided by the Small-Cap Equity Fund Sub-Advisers, or in the portfolio management of the Small-Cap Equity Fund. The Board focused on its experiences with each Small-Cap Equity Fund Sub-Adviser in connection with its prior and current service as sub-adviser to the Small-Cap Equity Fund. The Board considered each Small-Cap Equity Fund Sub-Adviser’s attributes relating to its investment philosophy oriented toward long-term performance, its process for selecting investments, and its experienced professionals, including research analysts and portfolio managers with experience involving small-cap equity securities, access to significant technological resources and a favorable history and reputation. The Board also considered the review process undertaken by the Adviser and the Adviser’s favorable assessment of the nature and quality of the investment sub-advisory services provided and expected to be provided to the Small-Cap Equity Fund by the Small-Cap Equity Fund Sub-Advisers after consummation of the Transaction.
In light of the foregoing, the Board, including the Independent Trustees, concluded that the breadth and quality of services provided by each of the Small-Cap Equity Fund Sub-Advisers was expected to continue to be satisfactory.
Investment Performance of the Small-Cap Equity Fund Sub-Advisers.
The Trustees considered the investment performance of the Small-Cap Equity Fund for various periods. The Trustees reviewed detailed information provided by the Small-Cap Equity Fund Sub-Advisers comparing their performance to that of relevant securities indices and peer groupings over these periods, at the Meeting as well as the annual contract renewal meetings held on December 16 and 18, 2015. On this basis, the Board, including the Independent Trustees, concluded that each Small-Cap Equity Fund Sub-Adviser’s historical performance record in managing its allocated portion of the Small-Cap Equity Fund’s investment portfolio, when viewed together with the other factors considered by the Board, supported a decision to approve New Sub-Advisory Agreements.
| Sub-Advisory Agreement Approval | 141 |
Table of Contents
GE Institutional Funds
Sub-Advisory Agreement Approval (Unaudited), continued
Cost of the Services to be Provided to the Small-Cap Equity Fund.
The Board considered the proposed fees payable under the New Sub-Advisory Agreements, noting that the fees would be paid by the Adviser, and not the Small-Cap Equity Fund. The Board considered that the proposed fee rates to be paid to the Small-Cap Equity Fund Sub-Advisers by the Adviser under the New Sub-Advisory Agreements were the same as the fee rates paid under the Existing Sub-Advisory Agreements with the Small-Cap Equity Fund Sub-Advisers and have been negotiated at arm’s-length. The Board concluded that the fees payable to each of the Small-Cap Equity Fund Sub-Advisers by the Adviser under the New Sub-Advisory Agreements, with respect to the assets to be allocated to each Small-Cap Equity Fund Sub-Adviser, were reasonable and appropriate.
In addition, the Board recognized that, because the fee rates payable to the Small-Cap Equity Fund Sub-Advisers were the same as the fee rates paid under the Existing Sub-Advisory Agreements and would be paid by the Adviser, an analysis of profitability was more appropriate in the context of the Board’s consideration of the Small-Cap Equity Fund’s New Investment Advisory and Administration Agreement with the Adviser. Accordingly, considerations of profitability with respect to approval of the New Sub-Advisory Agreements with the Small-Cap Equity Fund Sub-Advisers were not relevant to the Board’s determination to approve such agreements.
The Extent to Which Economies of Scale Would be Realized as the Fund Grows and Whether Fee Levels Would Reflect Such Economies of Scale.
The Trustees considered the extent to which economies of scale would be realized as the Small-Cap Equity Fund grows, and whether fee levels reflect these economies of scale for the benefit of Small-Cap Equity Fund investors. The Board recognized that this consideration is less relevant with respect to the proposed sub-advisory fees, because the Adviser will pay Small-Cap Equity Fund Sub-Advisers out of its advisory fees received from the Small-Cap Equity Fund, and noted that the Board considered economies of scale for the Small-Cap Equity Fund in connection with the Small-Cap Equity Fund’s New Investment Advisory and Administration Agreement with the Adviser. The Board also recognized the benefits to the Small-Cap Equity Fund of being able to leverage a favorable cost structure achieved with respect to the Small-Cap Equity Fund’s other operating expenses as a result of the Adviser’s large overall base of assets under management.
Comparison of Services to be Rendered and Fees to be Paid.
The Board reviewed and discussed the services expected to be provided to the Small-Cap Equity Fund by each of the Small-Cap Equity Fund Sub-Advisers, and the proposed fee rates to be charged to the Adviser for those services. The Trustees noted that they had reviewed the comparative fee information provided by each of the Small-Cap Equity Fund Sub-Advisers at the December 16 and 18, 2015 board meetings with respect to comparable mutual fund or other client accounts managed by each of the Small-Cap Equity Fund Sub-Advisers.
The Board, including the Independent Trustees, concluded that, based on this information, the proposed sub-advisory fees were reasonable in relation to the services expected to be provided to the Small-Cap Equity Fund.
Fall-Out Benefits.
The Board considered that there may be financial benefits that Small-Cap Equity Fund Sub-Advisers may derive from their relationships with the Adviser and the Small-Cap Equity Fund, including soft dollar commission benefits generated through the Small-Cap Equity Fund portfolio transactions. The Board noted, however, that the Small-Cap Equity Fund should benefit from the resources expected to be made available through the Small-Cap Equity Fund Sub-Advisers and that the Fund represents only a small portion of the assets managed by the Small-Cap Equity Fund Sub-Advisers.
The Board did not view this consideration as having a material effect on its overall view of the reasonableness of the proposed fees under the New Sub-Advisory Agreements.
Conclusion.
No single factor was determinative to the Board’s decision. Based on the Trustees’ discussion and such other matters as were deemed relevant, the Board, including the Independent Trustees, concluded that the New Sub-Advisory Agreements were in the best interest of the Small-Cap Equity Fund.
| 142 | Sub-Advisory Agreement Approval |
Table of Contents
GE Institutional Funds
Special Meeting of Shareholders — Voting Results (Unaudited)
On June 22, 2016, the GE Institutional Funds (the “Trust”) held a special meeting of shareholders of the U.S. Equity Fund, U.S. Large-Cap Core Equity Fund, Premier Growth Equity Fund, Small-Cap Equity Fund, S&P 500 Index Fund, International Equity Fund, Income Fund and Strategic Investment Fund (each, a “Fund” and collectively, the “Funds”). Shareholders of record on April 22, 2016 were entitled to vote on the proposals. For each proposal, except Proposal 2, shareholders voted on a fund-by-fund basis. For Proposal 2, shareholders of all Funds voted together and not by Fund or share class. At the meeting, all proposals were approved by the respective shareholders of each Fund, and the following votes were recorded:
Proposal 1:
Approval of a new investment advisory and administration agreement with SSGA Funds Management, Inc. (“SSGA FM”), pursuant to which SSGA FM will replace GE Asset Management Incorporated (“GEAM”) as investment adviser and administrator to the Funds upon consummation of the sale of the asset management and advisory services business conducted by GEAM and certain of its subsidiaries (the “Transaction”).
| U.S. Equity Fund |
||||||||||||
| No. of Shares | % of Outstanding Shares | % of Shares Present | ||||||||||
| Affirmative |
30,443,986.000 | 63.793 | % | 99.969 | % | |||||||
| Against |
0.000 | 0.000 | % | 0.000 | % | |||||||
| Abstain |
0.000 | 0.000 | % | 0.000 | % | |||||||
| Broker Non-Vote |
9,572.000 | 0.020 | % | 0.031 | % | |||||||
|
Total |
30,453,558.000 | 63.813 | % | 100.000 | % | |||||||
| U.S. Large-Cap Core Equity Fund |
||||||||||||
| No. of Shares | % of Outstanding Shares | % of Shares Present | ||||||||||
| Affirmative |
4,187,429.776 | 53.087 | % | 88.404 | % | |||||||
| Against |
203.000 | 0.002 | % | 0.005 | % | |||||||
| Abstain |
0.000 | 0.000 | % | 0.000 | % | |||||||
| Broker Non-Vote |
549,041.000 | 6.961 | % | 11.591 | % | |||||||
|
Total |
4,736,673.776 | 60.050 | % | 100.000 | % | |||||||
| Premier Growth Equity Fund |
||||||||||||
| No. of Shares | % of Outstanding Shares | % of Shares Present | ||||||||||
| Affirmative |
19,047,614.204 | 76.501 | % | 87.945 | % | |||||||
| Against |
2,329,127.026 | 9.354 | % | 10.754 | % | |||||||
| Abstain |
19,839.987 | 0.080 | % | 0.091 | % | |||||||
| Broker Non-Vote |
261,961.000 | 1.052 | % | 1.210 | % | |||||||
|
Total |
21,658,542.217 | 86.987 | % | 100.000 | % | |||||||
| Small-Cap Equity Fund |
||||||||||||
| No. of Shares | % of Outstanding Shares | % of Shares Present | ||||||||||
| Affirmative |
70,394,249.319 | 95.376 | % | 99.926 | % | |||||||
| Against |
0.000 | 0.000 | % | 0.000 | % | |||||||
| Abstain |
0.000 | 0.000 | % | 0.000 | % | |||||||
| Broker Non-Vote |
51,971.000 | 0.070 | % | 0.074 | % | |||||||
|
Total |
70,446,220.319 | 95.446 | % | 100.000 | % | |||||||
| S&P 500 Index Fund |
||||||||||||
| No. of Shares | % of Outstanding Shares | % of Shares Present | ||||||||||
| Affirmative |
553,626.000 | 62.757 | % | 69.309 | % | |||||||
| Against |
0.000 | 0.000 | % | 0.000 | % | |||||||
| Abstain |
1.000 | 0.000 | % | 0.001 | % | |||||||
| Broker Non-Vote |
245,147.000 | 27.789 | % | 30.690 | % | |||||||
|
Total |
798,774.000 | 90.546 | % | 100.000 | % | |||||||
| Special Meeting of Shareholders — Voting Results | 143 |
Table of Contents
GE Institutional Funds
Special Meeting of Shareholders — Voting Results (Unaudited), continued
| International Equity Fund |
||||||||||||
| No. of Shares | % of Outstanding Shares | % of Shares Present | ||||||||||
| Affirmative |
110,562,472.383 | 99.074 | % | 99.196 | % | |||||||
| Against |
4,514.000 | 0.004 | % | 0.004 | % | |||||||
| Abstain |
5,842.000 | 0.005 | % | 0.005 | % | |||||||
| Broker Non-Vote |
885,738.000 | 0.794 | % | 0.795 | % | |||||||
|
Total |
111,458,566.383 | 99.877 | % | 100.000 | % | |||||||
| Income Fund |
||||||||||||
| No. of Shares | % of Outstanding Shares | % of Shares Present | ||||||||||
| Affirmative |
30,427,563.000 | 97.800 | % | 99.709 | % | |||||||
| Against |
0.000 | 0.000 | % | 0.000 | % | |||||||
| Abstain |
0.000 | 0.000 | % | 0.000 | % | |||||||
| Broker Non-Vote |
88,951.000 | 0.286 | % | 0.291 | % | |||||||
|
Total |
30,516,514.000 | 98.086 | % | 100.000 | % | |||||||
| Strategic Investment Fund |
||||||||||||
| No. of Shares | % of Outstanding Shares | % of Shares Present | ||||||||||
| Affirmative |
64,383,806.000 | 98.926 | % | 99.996 | % | |||||||
| Against |
0.000 | 0.000 | % | 0.000 | % | |||||||
| Abstain |
0.000 | 0.000 | % | 0.000 | % | |||||||
| Broker Non-Vote |
2,667.000 | 0.004 | % | 0.004 | % | |||||||
|
Total |
64,386,473.000 | 98.930 | % | 100.000 | % | |||||||
Proposal 2:
Approval of the election of John R. Costantino, Jeanne M. La Porta, R. Sheldon Johnson and Donna M. Rapaccioli to the Board of Trustees of the Trust (the “Board”).
Trust votes:
| No. of Shares | % of Outstanding Shares | % of Shares Present | ||||||||||
| Mr. John R. Costantino | ||||||||||||
| Affirmative |
334,384,210.807 | 92.119 | % | 99.979 | % | |||||||
|
Withhold |
71,110.888 | 0.020 | % | 0.021 | % | |||||||
|
Total |
334,455,321.695 | 92.139 | % | 100.000 | % | |||||||
| Ms. Jeanne M. La Porta | ||||||||||||
| Affirmative |
334,385,664.807 | 92.120 | % | 99.979 | % | |||||||
|
Withhold |
69,656.888 | 0.019 | % | 0.021 | % | |||||||
|
Total |
334,455,321.695 | 92.139 | % | 100.000 | % | |||||||
| Mr. R. Sheldon Johnson | ||||||||||||
| Affirmative |
334,384,210.807 | 92.119 | % | 99.979 | % | |||||||
|
Withhold |
71,110.888 | 0.020 | % | 0.021 | % | |||||||
|
Total |
334,455,321.695 | 92.139 | % | 100.000 | % | |||||||
| Ms. Donna M. Rapaccioli | ||||||||||||
| Affirmative |
334,385,664.807 | 92.120 | % | 99.979 | % | |||||||
|
Withhold |
69,656.888 | 0.019 | % | 0.021 | % | |||||||
|
Total |
334,455,321.695 | 92.139 | % | 100.000 | % | |||||||
| 144 | Special Meeting of Shareholders — Voting Results |
Table of Contents
GE Institutional Funds
Special Meeting of Shareholders — Voting Results (Unaudited), continued
Fund votes:
| U.S. Equity Fund |
||||||||||||
| No. of Shares | % of Outstanding Shares | % of Shares Present | ||||||||||
| Mr. John R. Costantino | ||||||||||||
| Affirmative |
30,453,558.000 | 63.813 | % | 100.000 | % | |||||||
|
Withhold |
0.000 | 0.000 | % | 0.000 | % | |||||||
|
Total |
30,453,558.000 | 63.813 | % | 100.000 | % | |||||||
| Ms. Jeanne M. La Porta | ||||||||||||
| Affirmative |
30,453,558.000 | 63.813 | % | 100.000 | % | |||||||
|
Withhold |
0.000 | 0.000 | % | 0.000 | % | |||||||
|
Total |
30,453,558.000 | 63.813 | % | 100.000 | % | |||||||
| Mr. R. Sheldon Johnson | ||||||||||||
| Affirmative |
30,453,558.000 | 63.813 | % | 100.000 | % | |||||||
|
Withhold |
0.000 | 0.000 | % | 0.000 | % | |||||||
|
Total |
30,453,558.000 | 63.813 | % | 100.000 | % | |||||||
| Ms. Donna M. Rapaccioli | ||||||||||||
| Affirmative |
30,453,558.000 | 63.813 | % | 100.000 | % | |||||||
|
Withhold |
0.000 | 0.000 | % | 0.000 | % | |||||||
|
Total |
30,453,558.000 | 63.813 | % | 100.000 | % | |||||||
| U.S. Large-Cap Core Equity Fund |
||||||||||||
| No. of Shares | % of Outstanding Shares | % of Shares Present | ||||||||||
| Mr. John R. Costantino | ||||||||||||
| Affirmative |
4,736,673.776 | 60.050 | % | 100.000 | % | |||||||
|
Withhold |
0.000 | 0.000 | % | 0.000 | % | |||||||
|
Total |
4,736,673.776 | 60.050 | % | 100.000 | % | |||||||
| Ms. Jeanne M. La Porta | ||||||||||||
| Affirmative |
4,736,673.776 | 60.050 | % | 100.000 | % | |||||||
|
Withhold |
0.000 | 0.000 | % | 0.000 | % | |||||||
|
Total |
4,736,673.776 | 60.050 | % | 100.000 | % | |||||||
| Mr. R. Sheldon Johnson | ||||||||||||
| Affirmative |
4,736,673.776 | 60.050 | % | 100.000 | % | |||||||
|
Withhold |
0.000 | 0.000 | % | 0.000 | % | |||||||
|
Total |
4,736,673.776 | 60.050 | % | 100.000 | % | |||||||
| Ms. Donna M. Rapaccioli | ||||||||||||
| Affirmative |
4,736,673.776 | 60.050 | % | 100.000 | % | |||||||
|
Withhold |
0.000 | 0.000 | % | 0.000 | % | |||||||
|
Total |
4,736,673.776 | 60.050 | % | 100.000 | % | |||||||
| Premier Growth Equity Fund |
||||||||||||
| No. of Shares | % of Outstanding Shares | % of Shares Present | ||||||||||
| Mr. John R. Costantino | ||||||||||||
| Affirmative |
21,612,044.329 | 86.800 | % | 99.785 | % | |||||||
|
Withhold |
46,497.888 | 0.187 | % | 0.215 | % | |||||||
|
Total |
21,658,542.217 | 86.987 | % | 100.000 | % | |||||||
| Special Meeting of Shareholders — Voting Results | 145 |
Table of Contents
GE Institutional Funds
Special Meeting of Shareholders — Voting Results (Unaudited), continued
| No. of Shares | % of Outstanding Shares | % of Shares Present | ||||||||||
| Ms. Jeanne M. La Porta | ||||||||||||
| Affirmative |
21,612,044.329 | 86.800 | % | 99.785 | % | |||||||
|
Withhold |
46,497.888 | 0.187 | % | 0.215 | % | |||||||
|
Total |
21,658,542.217 | 86.987 | % | 100.000 | % | |||||||
| Mr. R. Sheldon Johnson | ||||||||||||
| Affirmative |
21,612,044.329 | 86.800 | % | 99.785 | % | |||||||
|
Withhold |
46,497.888 | 0.187 | % | 0.215 | % | |||||||
|
Total |
21,658,542.217 | 86.987 | % | 100.000 | % | |||||||
| Ms. Donna M. Rapaccioli | ||||||||||||
| Affirmative |
21,612,044.329 | 86.800 | % | 99.785 | % | |||||||
|
Withhold |
46,497.888 | 0.187 | % | 0.215 | % | |||||||
|
Total |
21,658,542.217 | 86.987 | % | 100.000 | % | |||||||
| Small-Cap Equity Fund |
||||||||||||
| No. of Shares | % of Outstanding Shares | % of Shares Present | ||||||||||
| Mr. John R. Costantino | ||||||||||||
| Affirmative |
70,446,220.319 | 95.446 | % | 100.000 | % | |||||||
|
Withhold |
0.000 | 0.000 | % | 0.000 | % | |||||||
|
Total |
70,446,220.319 | 95.446 | % | 100.000 | % | |||||||
| Ms. Jeanne M. La Porta | ||||||||||||
| Affirmative |
70,446,220.319 | 95.446 | % | 100.000 | % | |||||||
|
Withhold |
0.000 | 0.000 | % | 0.000 | % | |||||||
|
Total |
70,446,220.319 | 95.446 | % | 100.000 | % | |||||||
| Mr. R. Sheldon Johnson | ||||||||||||
| Affirmative |
70,446,220.319 | 95.446 | % | 100.000 | % | |||||||
|
Withhold |
0.000 | 0.000 | % | 0.000 | % | |||||||
|
Total |
70,446,220.319 | 95.446 | % | 100.000 | % | |||||||
| Ms. Donna M. Rapaccioli | ||||||||||||
| Affirmative |
70,446,220.319 | 95.446 | % | 100.000 | % | |||||||
|
Withhold |
0.000 | 0.000 | % | 0.000 | % | |||||||
|
Total |
70,446,220.319 | 95.446 | % | 100.000 | % | |||||||
| S&P 500 Index Fund |
||||||||||||
| No. of Shares | % of Outstanding Shares | % of Shares Present | ||||||||||
| Mr. John R. Costantino | ||||||||||||
| Affirmative |
798,774.000 | 90.546 | % | 100.000 | % | |||||||
|
Withhold |
0.000 | 0.000 | % | 0.000 | % | |||||||
|
Total |
798,774.000 | 90.546 | % | 100.000 | % | |||||||
| Ms. Jeanne M. La Porta | ||||||||||||
| Affirmative |
798,774.000 | 90.546 | % | 100.000 | % | |||||||
|
Withhold |
0.000 | 0.000 | % | 0.000 | % | |||||||
|
Total |
798,774.000 | 90.546 | % | 100.000 | % | |||||||
| Mr. R. Sheldon Johnson | ||||||||||||
| Affirmative |
798,774.000 | 90.546 | % | 100.000 | % | |||||||
|
Withhold |
0.000 | 0.000 | % | 0.000 | % | |||||||
|
Total |
798,774.000 | 90.546 | % | 100.000 | % | |||||||
| 146 | Special Meeting of Shareholders — Voting Results |
Table of Contents
GE Institutional Funds
Special Meeting of Shareholders — Voting Results (Unaudited), continued
| No. of Shares | % of Outstanding Shares | % of Shares Present | ||||||||||
| Ms. Donna M. Rapaccioli | ||||||||||||
| Affirmative |
798,774.000 | 90.546 | % | 100.000 | % | |||||||
|
Withhold |
0.000 | 0.000 | % | 0.000 | % | |||||||
|
Total |
798,774.000 | 90.546 | % | 100.000 | % | |||||||
| International Equity Fund |
||||||||||||
| No. of Shares | % of Outstanding Shares | % of Shares Present | ||||||||||
| Mr. John R. Costantino | ||||||||||||
| Affirmative |
111,433,953.383 | 99.855 | % | 99.978 | % | |||||||
|
Withhold |
24,613.000 | 0.022 | % | 0.022 | % | |||||||
|
Total |
111,458,566.383 | 99.877 | % | 100.000 | % | |||||||
| Ms. Jeanne M. La Porta | ||||||||||||
| Affirmative |
111,435,407.383 | 99.856 | % | 99.979 | % | |||||||
|
Withhold |
23,159.000 | 0.021 | % | 0.021 | % | |||||||
|
Total |
111,458,566.383 | 99.877 | % | 100.000 | % | |||||||
| Mr. R. Sheldon Johnson | ||||||||||||
| Affirmative |
111,433,953.383 | 99.855 | % | 99.978 | % | |||||||
|
Withhold |
24,613.000 | 0.022 | % | 0.022 | % | |||||||
|
Total |
111,458,566.383 | 99.877 | % | 100.000 | % | |||||||
| Ms. Donna M. Rapaccioli | ||||||||||||
| Affirmative |
111,435,407.383 | 99.856 | % | 99.979 | % | |||||||
|
Withhold |
23,159.000 | 0.021 | % | 0.021 | % | |||||||
|
Total |
111,458,566.383 | 99.877 | % | 100.000 | % | |||||||
| Income Fund |
||||||||||||
| No. of Shares | % of Outstanding Shares | % of Shares Present | ||||||||||
| Mr. John R. Costantino | ||||||||||||
| Affirmative |
30,516,514.000 | 98.086 | % | 100.000 | % | |||||||
|
Withhold |
0.000 | 0.000 | % | 0.000 | % | |||||||
|
Total |
30,516,514.000 | 98.086 | % | 100.000 | % | |||||||
| Ms. Jeanne M. La Porta | ||||||||||||
| Affirmative |
30,516,514.000 | 98.086 | % | 100.000 | % | |||||||
|
Withhold |
0.000 | 0.000 | % | 0.000 | % | |||||||
|
Total |
30,516,514.000 | 98.086 | % | 100.000 | % | |||||||
| Mr. R. Sheldon Johnson | ||||||||||||
| Affirmative |
30,516,514.000 | 98.086 | % | 100.000 | % | |||||||
|
Withhold |
0.000 | 0.000 | % | 0.000 | % | |||||||
|
Total |
30,516,514.000 | 98.086 | % | 100.000 | % | |||||||
| Ms. Donna M. Rapaccioli | ||||||||||||
| Affirmative |
30,516,514.000 | 98.086 | % | 100.000 | % | |||||||
|
Withhold |
0.000 | 0.000 | % | 0.000 | % | |||||||
|
Total |
30,516,514.000 | 98.086 | % | 100.000 | % | |||||||
| Strategic Investment Fund |
||||||||||||
| No. of Shares | % of Outstanding Shares | % of Shares Present | ||||||||||
| Mr. John R. Costantino | ||||||||||||
| Affirmative |
64,386,473.000 | 98.930 | % | 100.000 | % | |||||||
|
Withhold |
0.000 | 0.000 | % | 0.000 | % | |||||||
|
Total |
64,386,473.000 | 98.930 | % | 100.000 | % | |||||||
| Special Meeting of Shareholders — Voting Results | 147 |
Table of Contents
GE Institutional Funds
Special Meeting of Shareholders — Voting Results (Unaudited), continued
| No. of Shares | % of Outstanding Shares | % of Shares Present | ||||||||||
| Ms. Jeanne M. La Porta | ||||||||||||
| Affirmative |
64,386,473.000 | 98.930 | % | 100.000 | % | |||||||
|
Withhold |
0.000 | 0.000 | % | 0.000 | % | |||||||
|
Total |
64,386,473.000 | 98.930 | % | 100.000 | % | |||||||
| Mr. R. Sheldon Johnson | ||||||||||||
| Affirmative |
64,386,473.000 | 98.930 | % | 100.000 | % | |||||||
|
Withhold |
0.000 | 0.000 | % | 0.000 | % | |||||||
|
Total |
64,386,473.000 | 98.930 | % | 100.000 | % | |||||||
| Ms. Donna M. Rapaccioli | ||||||||||||
| Affirmative |
64,386,473.000 | 98.930 | % | 100.000 | % | |||||||
|
Withhold |
0.000 | 0.000 | % | 0.000 | % | |||||||
|
Total |
64,386,473.000 | 98.930 | % | 100.000 | % | |||||||
Proposal 3:
A. Approval of manager-of-managers authority for SSGA FM, whereby SSGA FM may, subject to approval of the Board, enter into and materially amend investment sub-advisory agreements with unaffiliated sub-advisers for a Fund without obtaining shareholder approval in each case.
| U.S. Equity Fund |
||||||||||||
| No. of Shares | % of Outstanding Shares | % of Shares Present | ||||||||||
| Affirmative |
30,443,986.000 | 63.793 | % | 99.969 | % | |||||||
| Against |
0.000 | 0.000 | % | 0.000 | % | |||||||
| Abstain |
0.000 | 0.000 | % | 0.000 | % | |||||||
| Broker Non-Vote |
9,572.000 | 0.020 | % | 0.031 | % | |||||||
|
Total |
30,453,558.000 | 63.813 | % | 100.000 | % | |||||||
| U.S. Large-Cap Core Equity Fund |
||||||||||||
| No. of Shares | % of Outstanding Shares | % of Shares Present | ||||||||||
| Affirmative |
4,187,429.776 | 53.087 | % | 88.404 | % | |||||||
| Against |
203.000 | 0.002 | % | 0.005 | % | |||||||
| Abstain |
0.000 | 0.000 | % | 0.000 | % | |||||||
| Broker Non-Vote |
549,041.000 | 6.961 | % | 11.591 | % | |||||||
|
Total |
4,736,673.776 | 60.050 | % | 100.000 | % | |||||||
| Premier Growth Equity Fund |
||||||||||||
| No. of Shares | % of Outstanding Shares | % of Shares Present | ||||||||||
| Affirmative |
18,058,732.204 | 72.529 | % | 83.379 | % | |||||||
| Against |
3,318,009.026 | 13.326 | % | 15.320 | % | |||||||
| Abstain |
19,839.987 | 0.080 | % | 0.091 | % | |||||||
| Broker Non-Vote |
261,961.000 | 1.052 | % | 1.210 | % | |||||||
|
Total |
21,658,542.217 | 86.987 | % | 100.000 | % | |||||||
| Small-Cap Equity Fund |
||||||||||||
| No. of Shares | % of Outstanding Shares | % of Shares Present | ||||||||||
| Affirmative |
70,394,249.319 | 95.376 | % | 99.926 | % | |||||||
| Against |
0.000 | 0.000 | % | 0.000 | % | |||||||
| Abstain |
0.000 | 0.000 | % | 0.000 | % | |||||||
| Broker Non-Vote |
51,971.000 | 0.070 | % | 0.074 | % | |||||||
|
Total |
70,446,220.319 | 95.446 | % | 100.000 | % | |||||||
| 148 | Special Meeting of Shareholders — Voting Results |
Table of Contents
GE Institutional Funds
Special Meeting of Shareholders — Voting Results (Unaudited), continued
| S&P 500 Index Fund |
||||||||||||
| No. of Shares | % of Outstanding Shares | % of Shares Present | ||||||||||
| Affirmative |
553,626.000 | 62.757 | % | 69.309 | % | |||||||
| Against |
0.000 | 0.000 | % | 0.000 | % | |||||||
| Abstain |
1.000 | 0.000 | % | 0.001 | % | |||||||
| Broker Non-Vote |
245,147.000 | 27.789 | % | 30.690 | % | |||||||
|
Total |
798,774.000 | 90.546 | % | 100.000 | % | |||||||
| International Equity Fund |
||||||||||||
| No. of Shares | % of Outstanding Shares | % of Shares Present | ||||||||||
| Affirmative |
110,561,535.383 | 99.073 | % | 99.195 | % | |||||||
| Against |
5,260.000 | 0.005 | % | 0.005 | % | |||||||
| Abstain |
6,033.000 | 0.005 | % | 0.005 | % | |||||||
| Broker Non-Vote |
885,738.000 | 0.794 | % | 0.795 | % | |||||||
|
Total |
111,458,566.383 | 99.877 | % | 100.000 | % | |||||||
| Income Fund |
||||||||||||
| No. of Shares | % of Outstanding Shares | % of Shares Present | ||||||||||
| Affirmative |
30,427,563.000 | 97.800 | % | 99.709 | % | |||||||
| Against |
0.000 | 0.000 | % | 0.000 | % | |||||||
| Abstain |
0.000 | 0.000 | % | 0.000 | % | |||||||
| Broker Non-Vote |
88,951.000 | 0.286 | % | 0.291 | % | |||||||
|
Total |
30,516,514.000 | 98.086 | % | 100.000 | % | |||||||
| Strategic Investment Fund |
||||||||||||
| No. of Shares | % of Outstanding Shares | % of Shares Present | ||||||||||
| Affirmative |
64,383,806.000 | 98.926 | % | 99.996 | % | |||||||
| Against |
0.000 | 0.000 | % | 0.000 | % | |||||||
| Abstain |
0.000 | 0.000 | % | 0.000 | % | |||||||
| Broker Non-Vote |
2,667.000 | 0.004 | % | 0.004 | % | |||||||
|
Total |
64,386,473.000 | 98.930 | % | 100.000 | % | |||||||
(Small-Cap Equity Fund Only):
B. Approval of an investment sub-advisory agreement for the Small-Cap Equity Fund between SSGA FM and Palisade Capital Management, LLC. (“Palisade”), pursuant to which the sub-advisory arrangement with Palisade will continue subsequent to the termination of Palisade’s current sub-advisory agreement with respect to the Small-Cap Equity Fund as a result of the Transaction.
| No. of Shares | % of Outstanding Shares | % of Shares Present | ||||||||||
| Affirmative |
70,394,249.319 | 95.376 | % | 99.926 | % | |||||||
| Against |
0.000 | 0.000 | % | 0.000 | % | |||||||
| Abstain |
0.000 | 0.000 | % | 0.000 | % | |||||||
| Broker Non-Vote |
51,971.000 | 0.070 | % | 0.074 | % | |||||||
|
Total |
70,446,220.319 | 95.446 | % | 100.000 | % | |||||||
C. Approval of an investment sub-advisory agreement for the Small-Cap Equity Fund between SSGA FM and Champlain Investment Partners, LLC. (“Champlain”), pursuant to which the sub-advisory arrangement with Champlain will continue subsequent to the termination of Champlain’s current sub-advisory agreement with respect to the Small-Cap Equity Fund as a result of the Transaction.
| Special Meeting of Shareholders — Voting Results | 149 |
Table of Contents
GE Institutional Funds
Special Meeting of Shareholders — Voting Results (Unaudited), continued
| No. of Shares | % of Outstanding Shares | % of Shares Present | ||||||||||
| Affirmative |
70,394,249.319 | 95.376 | % | 99.926 | % | |||||||
| Against |
0.000 | 0.000 | % | 0.000 | % | |||||||
| Abstain |
0.000 | 0.000 | % | 0.000 | % | |||||||
| Broker Non-Vote |
51,971.000 | 0.070 | % | 0.074 | % | |||||||
|
Total |
70,446,220.319 | 95.446 | % | 100.000 | % | |||||||
D. Approval of an investment sub-advisory agreement for the Small-Cap Equity Fund between SSGA FM and GlobeFlex Capital, L.P. (“GlobeFlex”), pursuant to which the sub-advisory arrangement with GlobeFlex will continue subsequent to the termination of GlobeFlex’s current sub-advisory agreement with respect to the Small-Cap Equity Fund as a result of the Transaction.
| No. of Shares | % of Outstanding Shares | % of Shares Present | ||||||||||
| Affirmative |
70,394,249.319 | 95.376 | % | 99.926 | % | |||||||
| Against |
0.000 | 0.000 | % | 0.000 | % | |||||||
| Abstain |
0.000 | 0.000 | % | 0.000 | % | |||||||
| Broker Non-Vote |
51,971.000 | 0.070 | % | 0.074 | % | |||||||
|
Total |
70,446,220.319 | 95.446 | % | 100.000 | % | |||||||
E. Approval of an investment sub-advisory agreement for the Small-Cap Equity Fund between SSGA FM and Kennedy Capital Management, Inc. (“Kennedy”), pursuant to which the sub-advisory arrangement with Kennedy will continue subsequent to the termination of Kennedy’s current sub-advisory agreement with respect to the Small-Cap Equity Fund as a result of the Transaction.
| No. of Shares | % of Outstanding Shares | % of Shares Present | ||||||||||
| Affirmative |
70,394,249.319 | 95.376 | % | 99.926 | % | |||||||
| Against |
0.000 | 0.000 | % | 0.000 | % | |||||||
| Abstain |
0.000 | 0.000 | % | 0.000 | % | |||||||
| Broker Non-Vote |
51,971.000 | 0.070 | % | 0.074 | % | |||||||
|
Total |
70,446,220.319 | 95.446 | % | 100.000 | % | |||||||
F. Approval of an investment sub-advisory agreement for the Small-Cap Equity Fund between SSGA FM and SouthernSun Asset Management LLC. (“SouthernSun”), pursuant to which the sub-advisory arrangement with SouthernSun will continue subsequent to the termination of SouthernSun’s current sub-advisory agreement with respect to the Small-Cap Equity Fund as a result of the Transaction.
| No. of Shares | % of Outstanding Shares | % of Shares Present | ||||||||||
| Affirmative |
70,394,249.319 | 95.376 | % | 99.926 | % | |||||||
| Against |
0.000 | 0.000 | % | 0.000 | % | |||||||
| Abstain |
0.000 | 0.000 | % | 0.000 | % | |||||||
| Broker Non-Vote |
51,971.000 | 0.070 | % | 0.074 | % | |||||||
|
Total |
70,446,220.319 | 95.446 | % | 100.000 | % | |||||||
| 150 | Special Meeting of Shareholders — Voting Results |
Table of Contents
GE Institutional Funds
Additional Information — September 30, 2016 (Unaudited)
Information about Directors and Executive Officers:
The business and affairs of the Funds are managed under the direction of the Funds’ Board of Trustees. Information pertaining to the Trustees and Officers of the Funds is set forth below. Matthew J. Simpson resigned as a Trustee of the Funds effective June 30, 2016.
| Name, Address, and Age |
Position(s) Held with Fund |
Term of Office and Length of Time Served |
Principal Occupation(s) During Past 5 Years |
Number of Portfolios in Fund Complex Overseen by Trustee |
Other Directorships Held by Trustee | |||||||
|
INTERESTED TRUSTEES AND EXECUTIVE OFFICERS | ||||||||||||
|
Jeanne M. La Porta c/o SSGA FM 1600 Summer St. Stamford, CT 06905
Age 51 |
Trustee and President | Until successor is elected and qualified – 2 years | Senior Managing Director at State Street Global Advisors since July 2016; President of GE Retirement Savings Plan Funds since July 2016; Senior Vice President and Commercial Operations Leader at GEAM from March 2014 to July 2016; President of GE Institutional Funds and GE Investments Funds, Inc. since April 2014; President and Trustee of GEAM’s UCITs Funds from March 2014 to November 2014; Senior Vice President and Commercial Administrative Officer at GEAM from April 2010 to March 2014; Vice President of GE Institutional Funds since July 2003; Vice President of Elfun Funds since October 2003; Vice President of GE Retirement Savings Plan Funds from October 2003 to July 2016; Secretary of GE Funds from July 2007 to September 2010 and Vice President from July 2007 to February 2011; Senior Vice President and Deputy General Counsel of GEAM from October 2007 to April 2010; Vice President and Assistant Secretary of Elfun Funds and GE Retirement Savings Plan Funds from July 2003 to June 2010; and Vice President and Associate General Counsel – Marketing and Client Services (formerly Asset Management Services) at GEAM from May 1997 to October 2007. |
22 | Director and President of GE Investments Funds, Inc. since 2014; Trustee of Elfun Funds since 2014. | |||||||
| Additional Information | 151 |
Table of Contents
GE Institutional Funds
Additional Information, continued — September 30, 2016 (Unaudited)
| Name, Address, and Age |
Position(s) Held with Fund |
Term of Office and Length of Time Served |
Principal Occupation(s) During Past 5 Years |
Number of Portfolios in Fund Complex Overseen by Trustee |
Other Directorships Held by Trustee | |||||||
|
INTERESTED TRUSTEES AND EXECUTIVE OFFICERS (continued) | ||||||||||||
|
JoonWon Choe c/o SSGA FM 1600 Summer St. Stamford, CT 06905
Age 47 |
Vice President & Secretary | Until successor is elected and qualified – 6 years | Managing Director and Managing Counsel at State Street Global Advisors since July 2016; Senior Vice President and Deputy General Counsel at GEAM from March 2011 to July 2016; Vice President and Secretary of GE Institutional Funds since September 2010; Vice President and Assistant Secretary of GE Retirement Savings Plan Funds since September 2010; Vice President and Assistant Secretary of Elfun Funds from September 2010 to July 2016; Senior Vice President and Associate General Counsel at GEAM from June 2010 to March 2011; Vice President and Associate General Counsel of GEAM from November 2005 to June 2010; and Vice President and Secretary of GE Funds from September 2010 to February 2011. |
N/A | N/A | |||||||
|
Robert Herlihy c/o SSGA FM 1600 Summer St. Stamford, CT 06905
Age 49 |
Chief Compliance Officer | Until successor is elected and qualified – 11 years | Managing Director at State Street Global Advisors since July 2016; Deputy Chief Compliance Officer of Elfun Funds since July 2016; Chief Compliance Officer of GE Institutional Funds and GE Retirement Savings Plan Funds since July 2005; Chief Compliance Officer of GEAM and Elfun Funds from July 2005 to July 2016; Chief Compliance Officer of GE Funds from July 2005 to February 2011; and Manager of Fund Administration at GEAM from 2002-2005. |
N/A | N/A | |||||||
|
Arthur A. Jensen c/o SSGA
FM 1600 Summer St. Stamford, CT 06905
Age 50 |
Treasurer | Until successor is elected and qualified – 5 years | Vice President at State Street Global Advisors since July 2016; Deputy Treasurer of Elfun Funds since July 2016; Treasurer of GE Institutional Funds and GE Retirement Savings Plan Funds since June 2011; Treasurer of Elfun Funds from June 2011 to July 2016; Mutual Funds Controller of GEAM from April 2011 to July 2016; Senior Vice President at Citigroup from 2008 to 2010; and Vice President at JPMorgan from 2005 to 2008. |
N/A | N/A | |||||||
| 152 | Additional Information |
Table of Contents
GE Institutional Funds
Additional Information, continued — September 30, 2016 (Unaudited)
| Name, Address, and Age |
Position(s) Held with Fund |
Term of Office and Length of Time Served |
Principal Occupation(s) During Past 5 Years |
Number of Portfolios in Fund Complex Overseen by Trustee |
Other Directorships Held by Trustee | |||||||
|
INTERESTED TRUSTEES AND EXECUTIVE OFFICERS (continued) | ||||||||||||
|
Brian Harris SSGA FM State Street Financial Center One Lincoln Street Boston, MA 02111-2900
Age 43 |
Deputy Chief Compliance Officer | Until successor is elected and qualified – less than 1 year | Managing Director, State Street Global Advisors and SSGA Funds Management, Inc. (June 2013 – present)*; Senior Vice President and Global Head of Investment Compliance, BofA Global Capital Management (2010-2013); Director of Compliance, AARP Financial Inc. (2008-2010). | N/A | N/A | |||||||
|
Bruce S. Rosenberg SSGA FM State Street Financial Center One Lincoln Street Boston, MA 02111-2900
Age 55 |
Assistant Treasurer | Until successor is elected and qualified – less than 1 year | Managing Director, State Street Global Advisors and SSGA Funds Management, Inc. (July 2015 – present); Director, Credit Suisse (April 2008 – July 2015). | N/A | N/A | |||||||
| Ann M. Carpenter SSGA FM State Street Financial Center One Lincoln Street Boston, MA 02111-2900
Age 50 |
Assistant Treasurer | Until successor is elected and qualified – less than 1 year | Chief Operating Officer, SSGA Funds Management, Inc. (April 2014 – present); Managing Director, State Street Global Advisors and SSGA Funds Management, Inc. (2005 – present).* | N/A | N/A | |||||||
|
Chad C. Hallett SSGA FM State Street Financial Center One Lincoln Street Boston, MA 02111-2900
Age 47 |
Assistant Treasurer | Until successor is elected and qualified – less than 1 year | Vice President, State Street Global Advisors and SSGA Funds Management, Inc. (November 2014 – present); Vice President, State Street Bank and Trust Company (2001 – November 2014). | N/A | N/A | |||||||
| NON-INTERESTED TRUSTEES | ||||||||||||
|
John R. Costantino c/o SSGA FM 1600 Summer St. Stamford, CT 06905
Age 70 |
Chairman of the Board | Until successor is elected and qualified – 19 years | General Partner, NGN Capital LLC since 2006; and Managing Director, Vice President of Walden Capital Management since 1996. | 16 | Director of GE Investments Funds, Inc. since 1997; Trustee of Fordham University from 1989 to 1995 and from 2001 to 2007 and Trustee Emeritus since 2007; Trustee of NeuroScience Research Institute since 1986; Trustee of GE Funds from 1993 to February 2011; Director of Artes Medical from 2006 to 2008 and Trustee of Gregorian University Foundation from 1992 to 2007. | |||||||
| * | Served in various capacities and/or with various affiliated entities during noted time period. |
| Additional Information | 153 |
Table of Contents
GE Institutional Funds
Additional Information, continued — September 30, 2016 (Unaudited)
| Name, Address, and Age |
Position(s) Held with Fund |
Term of Office and Length of Time Served |
Principal Occupation(s) During Past 5 Years |
Number of Portfolios in Fund Complex Overseen by Trustee |
Other Directorships Held by Trustee | |||||||
| NON-INTERESTED TRUSTEES (continued) | ||||||||||||
| R. Sheldon Johnson c/o SSGA FM 1600 Summer St. Stamford, CT 06905
Age 70 |
Trustee | Until successor is elected and qualified – 5 years | Retired, 2006 to present; Head of Global Institutional Equity Sales and Marketing at Morgan Stanley & Co., Inc. from 2002 to 2006 and Managing Director at Morgan Stanley & Co., Inc. from 1988 to 2006. | 16 | Director of GE Investments Funds, Inc. since April 2011 and Trustee of St. Lawrence University since 2003. | |||||||
|
Donna M. Rapaccioli c/o SSGA FM 1600 Summer St. Stamford, CT 06905
Age 53 |
Trustee | Until successor is elected and qualified – 4 years | Dean of the Gabelli School of Business since 2007 and Accounting Professor since 1987 at Fordham University. | 16 | Director of GE Investments Funds, Inc. since January 2012 and Trustee of Emmanuel College since 2010. | |||||||
The Statement of Additional Information for the Funds includes additional information about the Trustees and Officers and is available, without charge, upon request by calling 1-800-242-0134.
| 154 | Additional Information |
Table of Contents
GE Institutional Funds
| Investment Team | 155 |
Table of Contents
The Funds file their complete schedules of portfolio holdings with the Securities and Exchange Commission for the first, second and third quarters of each fiscal year on Form N-Q. The Funds’ Forms N-Q, as well as a description of the policies and procedures that the Funds use to determine how to vote proxies (if any) relating to portfolio securities is available without charge (i) upon request, by calling 1-800-242-0134; (ii) on the Funds’ website at http://www.geam.com; and (iii) on the Commission’s website at http://www.sec.gov. The Funds’ Forms N-Q may be reviewed and copied at the Commission’s Public Reference Room in Washington, DC — information on the operation of the Public Reference Room may be obtained by calling 1-800-SEC-0330.
Information (if any) regarding how the Funds voted proxies relating to portfolio securities during the most recently disclosed 12-months period ended June 30 is available without charge (i) through the Funds’ website at http://www.geam.com; and (ii) on the Commission’s website at http://www.sec.gov.
| GE Institutional Funds State Street Bank and Trust Company P.O. Box 5049 Boston, MA 02206 |
IBG-21923 |
Table of Contents
| Item 2. | Code of Ethics. |
During the period covered by this report, and related to the approval of a new investment adviser, State Street Institutional Funds (formerly known as GE Institutional Funds) (the “Registrant” or the “Funds,” as applicable) has adopted a new code of ethics, as defined in Item 2 of Form N-CSR, applicable to its principal executive officer, principal financial officer, principal accounting officer or controller, or persons performing similar functions, which replaces the prior code of ethics. A copy of this code of ethics is filed as an exhibit to this Form N-CSR.
There have not been any waivers granted from a provision that relates to any element of the code of ethics definition set forth in paragraph (b) of Item 2 of Form N-CSR during the period covered by this report.
| Item 3. | Audit Committee Financial Expert. |
The Board of Trustees of the Registrant has determined that John R. Costantino and Donna M. Rapaccioli are designated as the audit committee financial experts for the Registrant; and further that it is the finding of the Board of Trustees that Mr. Costantino and Ms. Rapaccioli, the audit committee financial experts, qualify as being “independent” pursuant to paragraph (a)(2) of Item 3 to Form N-CSR.
| Item 4. | Principal Accountant Fees and Services. |
(a) AUDIT FEES. For the fiscal year ended September 30, 2016, the aggregate audit fees billed for professional services rendered by Ernst & Young LLP (“EY”), the Registrant’s principal accountant, for the audit of the Registrant’s annual financial statements, or services that are normally provided by EY in connection with the Registrant’s statutory and regulatory filings and engagements were $200,800. For the fiscal year ended September 30, 2015, the aggregate audit fees billed for professional services rendered by KPMG LLP (“KPMG”), the Registrant’s prior principal accountant, for the audit of the Registrant’s annual financial statements, or services that are normally provided in connection with the Registrant’s statutory and regulatory filings and engagements were $156,700.
(b) AUDIT RELATED FEES. There were no fees billed either by EY for the fiscal year ended September 30, 2016 or KPMG for the fiscal year ended September 30, 2015, for assurance and related services that were reasonably related to the performance of the audit of the Registrant.
(c) TAX FEES. The aggregate tax fees billed for professional services rendered by EY for tax compliance, tax advice and tax planning for the Registrant in the form of preparation of excise filings and income tax returns for the fiscal year ended September 30, 2016 were $61,467. There were no fees billed for professional services rendered by KPMG for tax compliance, tax advice or tax planning for the Registrant for the fiscal year ended September 30, 2015.
Table of Contents
(d) ALL OTHER FEES. For the fiscal year ended September 30, 2016, there were no fees billed for professional services rendered by EY for products and services provided by EY to the Registrant, other than the services reported in paragraphs (a) through (c) of this Item. For the fiscal year ended September 30, 2016, the aggregate fees for professional services rendered by EY for products and services provided by EY to the Registrant’s investment adviser and any entity controlling, controlled by, or under common control with the Registrant’s investment adviser that provides ongoing services to the Registrant that (i) relate directly to the operations and financial reporting of the Registrant and (ii) were pre-approved by the Registrant’s audit committee were approximately $7,777,372. There were no fees billed for products and services provided by KPMG during the fiscal year ended September 30, 2015, for the Registrant, other than the services reported in paragraphs (a) through (c) of this Item.
(e)(1) AUDIT COMMITTEE PRE-APPROVAL POLICIES AND PROCEDURES. The Audit Committee of the Funds Board of Trustees is responsible for, among other things, the appointment, compensation and oversight of the work of the Funds’ Auditor. As part of this responsibility and to ensure that the Auditor’s independence is not impaired, the Audit Committee (1) pre-approves the audit and non-audit services provided to the Funds by the Auditor, and (2) all non-audit services provided to the Funds’ investment adviser and Covered Affiliates (as defined in the Audit Committee Charter) that provide ongoing services to the Funds if the services directly impact the Funds’ operations or financial reporting, in accordance with the Audit Committee Charter. The following excerpt from the Audit Committee Charter sets forth the pre-approval policies and procedures:
Pre-Approval of Audit Related Services and Permissible Non-Audit Services. The Audit Committee shall pre-approve both audit (including audit, review, and attest) services and permissible non-audit services provided to the Fund and, if the nature of the engagement relates directly to the operations and financial reporting of the Fund, permissible non-audit services provided to any Covered Affiliate.
The Audit Committee may determine to delegate the authority to grant pre-approvals to one or more Audit Committee members, each acting on behalf of the Audit Committee. In this event, the member of the Audit Committee so delegated shall report each delegated pre-approval to the Audit Committee at its next regularly scheduled meeting. The Audit Committee may also adopt and follow, in lieu of explicit pre-approval described above, written policies and procedures detailed as to the particular service, designed to safeguard the continued independence of the Auditor, consistent with the requirements of the Investment Company Act of 1940, as amended, and SEC regulations there under.
Notwithstanding the foregoing, the pre-approval requirement concerning permissible non-audit services provided to the Fund or any Covered Affiliate is waived if: (1) the aggregate amount of all such non-audit services provided constitutes no more than five percent (5%) of the total amount of revenues paid to the Auditor by the Fund and the Covered Affiliates during the fiscal year in which the services are provided that would have to be pre-approved by the Audit Committee, (2) the non-audit services were not recognized as non-audit services at the time of the engagement, and (3) such non-audit services are promptly brought to the attention of the Audit Committee and approved by the Audit Committee or one or more designated members of the Audit Committee prior to the completion of the audit.
Table of Contents
(2) PERCENTAGE OF SERVICES DESCRIBED IN PARAGRAPHS (b) THROUGH (d) APPROVED BY AUDIT COMMITTEE. The percentage of services described in each of paragraphs (b) through (d) of this Item rendered by EY for the fiscal year ended September 30, 2016 that were approved by the audit committee pursuant to paragraph (c)(7)(i)(C) of Rule 2-01 of Regulation S-X is as follows:
| Audit Fees |
100 | % | ||
| Audit-Related Fees |
100 | % | ||
| Tax Fees |
100 | % | ||
| All Other Fees |
100 | % |
There were no fees billed by KPMG for the fiscal year ended September 30, 2015 for audit related, tax or other services as indicated in paragraphs (b) through (d) of this Item.
(f) Not applicable.
(g) NON-AUDIT FEES. The aggregate non-audit fees billed by EY for services rendered to the Registrant, and rendered to the Registrant’s investment adviser and any entity controlling, controlled by, or under common control with the Registrant’s adviser (“Service Affiliates”), for the fiscal year ended September 30, 2016 were $25,696,758. The aggregate non-audit fees billed by KPMG for services rendered to the Registrant and rendered to any Service Affiliates for the fiscal year ended September 30, 2015 were $0.
(h) AUDITOR INDEPENDENCE. On July 1, 2016, State Street Corporation acquired the asset management and advisory services business conducted by GE Asset Management Incorporated (“GEAM”), a wholly owned subsidiary of General Electric Company, and certain of its subsidiaries (the “Transaction”). In connection with the Transaction, Shareholders of the Funds voted to approve SSGA Funds Management, Inc. (“SSGA FM”) as investment adviser of the Funds, replacing GEAM.
In connection with the appointment of EY, a member firm of Ernst & Young Global Limited, as the independent auditor of the Funds for their fiscal year ended September 30, 2016, EY evaluated its independence and identified the following matters that are inconsistent with the auditor independence rules of the Securities and Exchange Commission (“SEC”). All of the lobbying services and project management services described below occurred prior to the consummation of the Transaction.
Lobbying services
During the audit period, EY was a registered lobbyist for the parent company of the former investment adviser to the Funds (the “parent company”) under the Lobbying Disclosure Act of 1995 and provided lobbying services on behalf of the parent company. The services primarily included lobbying efforts, on behalf of the parent company, relating to tax reform and to changes to the tax code or regulations affecting the parent company and its affiliates. The services did not relate to the asset management business of the Funds.
Table of Contents
Project management services
During the audit period, EY was engaged to provide project management support to the parent company and one of its affiliates in relation to certain information technology programs. The services did not relate to the asset management business of the Funds.
Loan Rule
EY has identified one record holder (the “record holder”) of greater than 10% of the shares of State Street Institutional Income Fund (formerly known as GE Institutional Income Fund) and State Street Institutional Premier Growth Equity Fund (formerly known as GE Institutional Premier Growth Equity Fund) (each a series of State Street Institutional Funds (formerly known as GE Institutional Funds)) (collectively, the “Two Funds”), with which EY and covered person professionals maintain lending relationships. These investments in the Two Funds are each held at an omnibus level by the record holder on behalf of its customers, who own the economic interest in the shares. There was one meeting of shareholders of the Two Funds during the audit period. At that meeting, shareholders voted on matters relating to the acquisition by State Street Corporation and its affiliates of substantially all of the asset management and advisory services business conducted by the former investment adviser to the Two Funds, including votes to (i) approve a new investment advisory and administration agreement with SSGA FM, (ii) elect the Trustees to the Board of Trustees, and (iii) approve manager-of-managers authority for SSGA FM with respect to the Two Funds. EY and SSGA FM, through discussion with the record holder, have determined that the record holder did not exercise discretionary authority over the shares it held in respect of any of those votes. EY believes that, while a lending arrangement with a record owner of greater than 10% of the shares is inconsistent with Rule 2-01(c)(1)(ii)(A) of Regulation S-X, the circumstances fall within the situations described in the relevant No Action Letter issued by the SEC Staff on June 20, 2016.
EY has reviewed the independence matters described above and the applicable guidance and has concluded that the services and relationship described above did not impair EY’s ability to exercise objective and impartial judgment in connection with the audits of the financial statements of the Funds under the SEC and Public Company Accounting Oversight Board standards for the fiscal year ended September 30, 2016. In light of the representations and determinations by EY, SSGA FM has determined that it shares that same belief.
The Audit Committee of the Board of the Funds has considered these independence matters and discussed these matters with EY and members of SSGA FM, and based on these discussions and the statements of SSGA FM and EY, the Audit Committee believes it was reasonable for it to accept the view of EY that EY was capable of exercising objective and impartial judgment in connection with the audits of the financial statements of the Funds in the specific circumstances described above.
Item 5. Audit Committee of Listed Registrants.
Applicable only to Closed-End Management Investment Companies.
Table of Contents
Item 6. Schedule of Investments.
(a) Schedule of Investments is included as part of the Report to Shareholders filed under Item 1 of this Form N-CSR.
(b) Not applicable.
Item 7. Disclosure of Proxy Voting Policies and Procedures for Closed-End Management Investment Companies.
Applicable only to Closed-End Management Investment Companies.
Item 8. Portfolio Managers of Closed-End Management Investment Companies.
Applicable only to Closed-End Management Investment Companies.
Item 9. Purchases of Equity Securities by Closed-End Management Investment Company and Affiliated Purchasers.
Applicable only to Closed-End Management Investment Companies.
Item 10. Submission of Matters to a Vote of Security Holders.
During the reporting period, there have been no material changes to the procedures by which the shareholders may recommend nominees to the Registrant’s Board of Trustees.
Item 11. Controls and Procedures.
(a) The Registrant’s principal executive officer and principal financial officer have concluded that the Registrant’s disclosure controls and procedures (as defined in Rule 30a-3(c) under the Investment Company Act of 1940, as amended (the “1940 Act”)), are effective as of a date within 90 days of the filing date of the report included in Item 1 of this Form N-CSR, based on the evaluation of these controls and procedures required by Rule 30a-3(b) under the 1940 Act and Rules 13a-15(b) or 15d-15(b) under the Securities Exchange Act of 1934, as amended.
(b) There were no changes in the Registrant’s internal control over financial reporting (as defined in Rule 30a-3(d) under the 1940 Act) that occurred during the Registrant’s second fiscal quarter of the period covered by this Form N-CSR that have materially affected, or are reasonably likely to materially affect, the Registrant’s internal control over financial reporting.
Table of Contents
Item 12. Exhibits.
(a)(1) The Code of Ethics that applies to the Registrant’s principal executive officer and principal financial officer is attached hereto.
(a)(2) The certifications required by Rule 30a-2(a) under the 1940 Act and Section 302 of the Sarbanes-Oxley Act of 2002 are attached hereto.
(a)(3) Not applicable.
(b) The certifications by the Registrant’s principal executive officer and principal financial officer, as required by Rule 30a-2(b) under the 1940 Act and Section 906 of the Sarbanes-Oxley Act of 2002, are attached hereto.
Table of Contents
SIGNATURES
Pursuant to the requirements of the Securities Exchange Act of 1934 and the Investment Company Act of 1940, the Registrant has duly caused this report to be signed on its behalf by the undersigned, thereunto duly authorized.
| GE Institutional Funds | ||
| By: | /s/ Jeanne M. La Porta | |
| Jeanne M. La Porta | ||
| President, GE Institutional Funds | ||
Date: November 21, 2016
Pursuant to the requirements of the Securities Exchange Act of 1934 and the Investment Company Act of 1940, this report has been signed below by the following persons on behalf of the Registrant and in the capacities and on the dates indicated.
| By: | /s/ Jeanne M. La Porta | |
| Jeanne M. La Porta | ||
| President, GE Institutional Funds |
Date: November 21, 2016
| By: | /s/ Arthur A. Jensen | |
| Arthur A. Jensen | ||
| Treasurer, GE Institutional Funds |
Date: November 21, 2016