Exhibit 13

Financial Information
Selected Consolidated Financial Data
| Year Ended December 31, | ||||||||||||||||||||
| 2010 | 2009 | 2008 | 2007 | 2006 | ||||||||||||||||
| (Dollars in thousands, except per share amounts) | ||||||||||||||||||||
| Income statement data: |
||||||||||||||||||||
| Interest income |
$ | 157,972 | $ | 165,908 | $ | 183,003 | $ | 176,970 | $ | 155,198 | ||||||||||
| Interest expense |
34,337 | 47,585 | 84,302 | 99,352 | 84,478 | |||||||||||||||
| Net interest income |
123,635 | 118,323 | 98,701 | 77,618 | 70,720 | |||||||||||||||
| Provision for loan and lease losses |
16,000 | 44,800 | 19,025 | 6,150 | 2,450 | |||||||||||||||
| Non-interest income |
70,322 | 51,051 | 19,349 | 22,975 | 23,231 | |||||||||||||||
| Non-interest expense |
87,419 | 68,632 | 54,398 | 48,252 | 46,390 | |||||||||||||||
| Preferred stock dividends |
— | 6,276 | 227 | — | — | |||||||||||||||
| Net income available to common stockholders |
64,001 | 36,826 | 34,474 | 31,746 | 31,693 | |||||||||||||||
| Common share and per common share data: |
||||||||||||||||||||
| Earnings - diluted |
$ | 3.75 | $ | 2.18 | $ | 2.04 | $ | 1.89 | $ | 1.89 | ||||||||||
| Book value |
18.79 | 15.91 | 14.96 | 11.35 | 10.43 | |||||||||||||||
| Dividends |
0.60 | 0.52 | 0.50 | 0.43 | 0.40 | |||||||||||||||
| Weighted-average diluted shares outstanding (thousands) |
17,045 | 16,900 | 16,874 | 16,834 | 16,803 | |||||||||||||||
| End of period shares outstanding (thousands) |
17,054 | 16,905 | 16,864 | 16,818 | 16,747 | |||||||||||||||
| Balance sheet data at period end: |
||||||||||||||||||||
| Total assets |
$ | 3,273,659 | $ | 2,770,811 | $ | 3,233,303 | $ | 2,710,875 | $ | 2,529,400 | ||||||||||
| Total loans and leases not covered by loss share |
1,856,429 | 1,904,104 | 2,021,199 | 1,871,135 | 1,677,389 | |||||||||||||||
| Allowance for loan and lease losses |
40,230 | 39,619 | 29,512 | 19,557 | 17,699 | |||||||||||||||
| Loans covered by loss share |
497,545 | — | — | — | — | |||||||||||||||
| ORE covered by loss share |
31,145 | — | — | — | — | |||||||||||||||
| FDIC loss share receivable |
153,111 | — | — | — | — | |||||||||||||||
| Total investment securities |
398,698 | 506,678 | 944,783 | 578,348 | 620,132 | |||||||||||||||
| Total deposits |
2,540,753 | 2,028,994 | 2,341,414 | 2,057,061 | 2,045,092 | |||||||||||||||
| Repurchase agreements with customers |
43,324 | 44,269 | 46,864 | 46,086 | 41,001 | |||||||||||||||
| Other borrowings |
282,139 | 342,553 | 424,947 | 336,533 | 194,661 | |||||||||||||||
| Subordinated debentures |
64,950 | 64,950 | 64,950 | 64,950 | 64,950 | |||||||||||||||
| Preferred stock, net of unamortized discount |
— | — | 71,880 | — | — | |||||||||||||||
| Total common stockholders’ equity |
320,355 | 269,028 | 252,302 | 190,829 | 174,633 | |||||||||||||||
| Loan and lease including covered loans to deposit ratio |
92.65 | % | 93.84 | % | 86.32 | % | 90.96 | % | 82.02 | % | ||||||||||
| Average balance sheet data: |
||||||||||||||||||||
| Total average assets |
$ | 2,998,850 | $ | 3,002,121 | $ | 3,017,707 | $ | 2,601,299 | $ | 2,365,316 | ||||||||||
| Total average common stockholders’ equity |
296,035 | 267,768 | 213,271 | 184,819 | 158,194 | |||||||||||||||
| Average common equity to average assets |
9.87 | % | 8.92 | % | 7.07 | % | 7.10 | % | 6.69 | % | ||||||||||
| Performance ratios: |
||||||||||||||||||||
| Return on average assets |
2.13 | % | 1.23 | % | 1.14 | % | 1.22 | % | 1.34 | % | ||||||||||
| Return on average common stockholders’ equity |
21.62 | 13.75 | 16.16 | 17.18 | 20.03 | |||||||||||||||
| Net interest margin - FTE |
5.18 | 4.80 | 3.96 | 3.44 | 3.49 | |||||||||||||||
| Efficiency ratio |
42.86 | 37.84 | 42.32 | 46.33 | 47.07 | |||||||||||||||
| Common stock dividend payout ratio |
15.89 | 23.84 | 24.42 | 22.75 | 21.16 | |||||||||||||||
| Asset quality ratios: |
||||||||||||||||||||
| Net charge-offs to average loans and leases(1) |
0.81 | % | 1.75 | % | 0.45 | % | 0.24 | % | 0.12 | % | ||||||||||
| Nonperforming loans and leases to total loans and leases(1) |
0.75 | 1.24 | 0.76 | 0.35 | 0.34 | |||||||||||||||
| Nonperforming assets to total assets(1) |
1.72 | 3.06 | 0.81 | 0.36 | 0.24 | |||||||||||||||
| Allowance for loan and lease losses as a percentage of: |
||||||||||||||||||||
| Total loans and leases(1) |
2.17 | % | 2.08 | % | 1.46 | % | 1.05 | % | 1.06 | % | ||||||||||
| Nonperforming loans and leases |
288 | % | 168 | % | 192 | % | 295 | % | 310 | % | ||||||||||
| Capital ratios at period end: |
||||||||||||||||||||
| Tier 1 leverage |
11.88 | % | 11.39 | % | 11.64 | % | 9.80 | % | 9.39 | % | ||||||||||
| Tier 1 risk-based capital |
16.13 | 13.78 | 14.21 | 11.79 | 11.71 | |||||||||||||||
| Total risk-based capital |
17.39 | 15.03 | 15.36 | 12.67 | 12.76 | |||||||||||||||
| (1) | Excludes loans and/or ORE covered by FDIC loss share agreements, except for their inclusion in total assets. |
9
MANAGEMENT’S DISCUSSION AND ANALYSIS OF FINANCIAL CONDITION
AND RESULTS OF OPERATIONS
General
Net income available to common stockholders of Bank of the Ozarks, Inc. (the “Company”) was $64.0 million for the year ended December 31, 2010, a 73.8% increase from $36.8 million in 2009. Net income available to common stockholders in 2008 was $34.5 million. Diluted earnings per common share were $3.75 for 2010, a 72.0% increase from $2.18 in 2009. Diluted earnings per common share were $2.04 in 2008.
The table below shows total assets, investment securities, loans and leases not covered by Federal Deposit Insurance Corporation (“FDIC”) loss share agreements, assets covered by loss share agreements (“covered assets”), deposits, common stockholders’ equity, net income available to common stockholders, diluted earnings per common share and book value per common share at December 31, 2010, 2009 and 2008 and the percentage of change year over year.
| % Change | ||||||||||||||||||||
| December 31, | 2010 | 2009 | ||||||||||||||||||
| 2010 | 2009 | 2008 | from 2009 | from 2008 | ||||||||||||||||
| (Dollars in thousands, except per share amounts) | ||||||||||||||||||||
| Total assets |
$ | 3,273,659 | $ | 2,770,811 | $ | 3,233,303 | 18.1 | % | (14.3 | )% | ||||||||||
| Investment securities |
398,698 | 506,678 | 944,783 | (21.3 | ) | (46.4 | ) | |||||||||||||
| Loans and leases not covered by FDIC loss share agreements |
1,856,429 | 1,904,104 | 2,021,199 | (2.5 | ) | (5.8 | ) | |||||||||||||
| Covered assets: |
||||||||||||||||||||
| Loans |
497,545 | — | — | — | — | |||||||||||||||
| Other real estate |
31,145 | — | — | — | — | |||||||||||||||
| FDIC loss share receivable |
153,111 | — | — | — | — | |||||||||||||||
| Deposits |
2,540,753 | 2,028,994 | 2,341,414 | 25.2 | (13.3 | ) | ||||||||||||||
| Common stockholders’ equity |
320,355 | 269,028 | 252,302 | 19.1 | 6.6 | |||||||||||||||
| Net income available to common stockholders |
64,001 | 36,826 | 34,474 | 73.8 | 6.8 | |||||||||||||||
| Diluted earnings per common share |
3.75 | 2.18 | 2.04 | 72.0 | 6.9 | |||||||||||||||
| Book value per common share |
18.79 | 15.91 | 14.96 | 18.1 | 6.4 | |||||||||||||||
Two measures used to assess performance by banking institutions are return on average assets (“ROA”) and return on average common stockholders’ equity (“ROE”). ROA measures net income available to common stockholders in relation to average total assets. It is calculated by dividing annual net income available to common stockholders by average total assets and indicates a company’s ability to employ its resources profitably. For the year ended December 31, 2010, the Company’s ROA was 2.13% compared with 1.23% in 2009 and 1.14% in 2008. ROE measures net income available to common stockholders in relation to average common stockholders’ equity. It is calculated by dividing annual net income available to common stockholders by average common stockholders’ equity and indicates how effectively a company can generate net income on the capital invested by its common stockholders. For the year ended December 31, 2010, the Company’s ROE was 21.62% compared with 13.75% in 2009 and 16.16% in 2008.
Analysis of Results of Operations
The Company is a bank holding company whose primary business is commercial banking conducted through its wholly-owned state chartered bank subsidiary – Bank of the Ozarks (the “Bank”). The Company’s results of operations depend primarily on net interest income, which is the difference between the interest income from earning assets, such as loans, leases, loans covered by FDIC loss share agreements (“covered loans”) and investments, and the interest expense incurred on interest bearing liabilities, such as deposits, borrowings and subordinated debentures. The Company also generates non-interest income, including service charges on deposit accounts, mortgage lending income, trust income, bank owned life insurance (“BOLI”) income, other charges and fees, gains and losses on investment securities and from sales of other assets, and, during 2010, gains on FDIC-assisted transactions and accretion of FDIC loss share receivable.
The Company’s non-interest expense consists primarily of employee compensation and benefits, net occupancy and equipment expense and other operating expenses. The Company’s results of operations are significantly affected by its provision for loan and lease losses and its provision for income taxes. The following discussion provides a summary of the Company’s operations for the past three years and should be read in conjunction with the consolidated financial statements and related notes presented elsewhere in this report.
Net Interest Income
Net interest income and net interest margin are analyzed in this discussion on a fully taxable equivalent (“FTE”) basis. The adjustment to convert net interest income to a FTE basis consists of dividing tax-exempt
10
income by one minus the statutory federal income tax rate of 35%. The FTE adjustments to net interest income were $10.0 million in 2010, $12.0 million in 2009 and $10.5 million in 2008. No adjustments have been made in this analysis for income exempt from state income taxes or for interest expense deductions disallowed under the provisions of the Internal Revenue Code as a result of investments in certain tax-exempt securities.
2010 compared to 2009
Net interest income for 2010 increased 2.5% to $133.6 million compared to $130.3 million for 2009. Net interest margin was 5.18% in 2010 compared to 4.80% in 2009. The growth in net interest income was a result of the improvement in the Company’s net interest margin, which increased 38 basis points (“bps”) from 2009 to 2010, offset in part by a reduction in the Company’s average earning assets, which decreased 5.0% from 2009 to 2010.
The Company’s improvement in its net interest margin in 2010 resulted from a combination of factors including (i) improvement in the Company’s spread between yields on loans and leases not covered by FDIC loss share agreements and rates paid on deposits and (ii) the addition of higher yielding covered loans that were acquired as a result of the Company’s four FDIC-assisted acquisitions in 2010.
Yields on average earning assets decreased 4 bps in 2010 compared to 2009. This decrease was due primarily to a 7 bps decrease in loan and lease yields in 2010, and a 21 bps decrease in the average yield on the Company’s investment securities portfolio, mostly offset by the addition of higher yielding covered loans in 2010.
The 7 bps decrease in loan and lease yields was due primarily to the repricing of the Company’s loan and lease portfolio at lower interest rates during 2010. The 21 bps decrease in the Company’s average yield on its investment securities in 2010 was the result of an 85 bps decrease in yield on taxable investment securities, an 89 bps decrease in yield on tax-exempt investment securities, and a shift in the composition of the portfolio to include a higher proportion of tax-exempt investment securities with generally higher FTE yields than the Company’s taxable investment securities. During 2010 tax-exempt investment securities comprised 81.8% of the average balance of the Company’s investment securities portfolio compared to 56.1% in 2009. In 2009 and 2010, the Company reduced its investment securities portfolio as a result of its ongoing evaluations of interest rate risk and to free up capital for FDIC-assisted acquisitions.
During 2010 the Company, through the Bank, made four FDIC-assisted acquisitions. Most loans acquired in these acquisitions are covered loans and are higher yielding than the Company’s non-covered loans and leases. The yield on covered loans in 2010 was 7.85%, or 160 bps higher than the Company’s 2010 yield of 6.25% on non-covered loans and leases.
The 4 bps decrease in average earning asset yields in 2010 was more than offset by a 53 bps decrease in the average rate on interest bearing liabilities, resulting in the overall 38 bps increase in net interest margin in 2010 compared to 2009. The decrease in the average rate on interest bearing liabilities was primarily attributable to a 56 bps decrease in the average rate on interest bearing deposits, the largest component of the Company’s interest bearing liabilities. This decrease in the average rate on interest bearing deposits was principally due to (i) effectively managing the repricing of time deposits which resulted in lower rates paid on these deposits as they were renewed or repriced and (ii) a favorable shift in the mix of the Company’s deposits, resulting in the Company’s average balance of time deposits, which generally pay higher rates than other interest bearing deposits, decreasing to 43.7% of average interest bearing deposits in 2010 from 57.1% of average interest bearing deposits in 2009.
The Company’s other borrowing sources include (i) repurchase agreements with customers (“repos”), (ii) other borrowings comprised primarily of Federal Home Loan Bank of Dallas (“FHLB”) advances, and, to a lesser extent, Federal Reserve Bank (“FRB”) borrowings and federal funds purchased, and (iii) subordinated debentures. The rates paid on repos decreased 37 bps for 2010 compared to 2009 primarily as a result of the Company’s efforts to effectively manage the rates on its interest bearing liabilities, including repos. The rates paid on the Company’s other borrowings increased 8 bps in 2010 compared to 2009. Other borrowings consist primarily of fixed rate, callable FHLB advances. The increase in rates for other borrowings in 2010 compared to 2009 was due primarily to lower utilization of lower rate short-term federal funds purchased and short-term FHLB borrowings, partially offset by the repayment of $60.0 million of fixed rate, callable FHLB advances with a weighted-average interest rate of 6.25% that were repaid on their maturity dates in May 2010. The rates paid on the Company’s subordinated debentures, which are tied to a spread over the 90-day London Interbank Offered Rate (“LIBOR”) and reset periodically, decreased 57 bps in 2010 compared to 2009 as a result of the decrease in 90-day LIBOR on the applicable reset dates during 2010.
The 5.0% reduction in average earning assets in 2010 was due primarily to a decrease of $265 million in the Company’s average investment securities portfolio. During both 2009 and 2010 the Company was a net seller of investment securities, reducing its year-end portfolio by $438 million from December 31, 2008 to December 31, 2009, and by $108 million from December 31, 2009 to December 31, 2010. The average
11
balance of investment securities was $469 million for 2010 compared to $734 million for 2009. The addition of covered loans during 2010 partially offset the decrease in average earnings assets caused by the reduction of the investment securities portfolio. During 2010, the Company’s covered loan portfolio increased from none at December 31, 2009 to $498 million at December 31, 2010, and the average balance of covered loans was $218 million for 2010 compared to none for 2009.
2009 compared to 2008
Net interest income for 2009 increased 19.4% to $130.3 million compared to $109.2 million for 2008. Net interest margin was 4.80% in 2009 compared to 3.96% in 2008. The growth in net interest income was a result of the improvement in the Company’s net interest margin, which increased 84 bps from 2008 to 2009, offset in part by a reduction in the Company’s average earning assets, which decreased 1.5% from 2008 to 2009.
The Company’s improvement in its net interest margin resulted from a combination of factors including (i) improvement in the Company’s spread between yields on loans and leases and rates paid on deposits, (ii) favorable yields achieved on the Company’s investment securities portfolio and (iii) a decrease in the average interest rate paid on the Company’s other interest bearing liabilities.
Yields on average earning assets decreased 47 bps in 2009 compared to 2008. This decrease was due primarily to a 78 bps decline in loan and lease yields in 2009, which was partially offset by a 37 bps increase in the average yield on the Company’s investment securities portfolio.
The 78 bps decrease in loan and lease yields was due primarily to the repricing of the Company’s loan and lease portfolio at lower interest rates during 2009. Beginning in September 2007 and continuing through December 2008, the Federal Open Market Committee (“FOMC”) decreased its federal funds target rate a total of 500 bps, resulting in many of the Company’s variable rate loans repricing to lower rates beginning in the third quarter of 2007 and continuing throughout 2008 and, to a lesser extent, in 2009. Additionally, the Company’s newly originated and renewed loans and leases generally priced at lower rates beginning in the third quarter of 2007 and continuing throughout 2008 and 2009 as a result of these FOMC interest rate decreases.
At December 31, 2009, approximately 53% of the Company’s variable rate loans were at their “floor” rate. In recent years, the Company has included “floor” interest rates in many of its variable rate loan contracts. The inclusion of these floor rates has helped to lessen the impact that falling interest rates have had on the Company’s loan and lease yields.
The 37 bps increase in the Company’s average yield on its investment securities in 2009 compared to 2008 was the result of a 15 bps increase in yield on taxable investment securities, a 16 bps increase in yield on tax-exempt investment securities and a shift in the composition of the portfolio to include a higher proportion of tax-exempt investment securities with generally higher FTE yields than the Company’s taxable investment securities. During 2009 tax-exempt investment securities comprised 56.1% of the average balance of the Company’s investment securities portfolio compared to 48.0% in 2008.
The 78 bps decrease in average earning asset yields in 2009 compared to 2008 was more than offset by a 129 bps decrease in the average rate on interest bearing liabilities, resulting in the overall 84 bps increase in net interest margin in 2009 compared to 2008. The decrease in the average rate on interest bearing liabilities was primarily attributable to a 156 bps decrease in the average rate on interest bearing deposits. This decrease in the average rate on interest bearing deposits was principally due to (i) the FOMC interest rate decreases which resulted in lower rates paid on deposits as they were renewed or repriced and (ii) a favorable shift in the mix of the Company’s interest bearing deposits, resulting in the Company’s average balance of time deposits, which generally pay higher rates than other interest bearing deposits, decreasing to 57.1% of average interest bearing deposits in 2009 from 69.4% in 2008.
The Company’s other borrowing sources include (i) repos, (ii) other borrowings, and (iii) subordinated debentures. The rates paid on repos decreased 68 bps for 2009 compared to 2008 primarily as a result of decreases in FOMC federal funds target rate and other rate indices. The rates paid on the Company’s other borrowings increased 21 bps in 2009 compared to 2008 primarily due to lower average balances of short-term FHLB advances utilized in 2009 compared to 2008. The rates paid on the Company’s subordinated debentures declined 250 bps in 2009 compared to 2008 as a result of the decrease in 90-day LIBOR during 2009.
The reduction in average earning assets in 2009 was due principally to a decrease in the Company’s investment securities portfolio. During 2009 the Company was a net seller of investment securities, reducing its portfolio by $438 million from December 31, 2008 to December 31, 2009 and its average portfolio balance by $27 million in 2009 compared to 2008. This reduction in the investment securities portfolio was a result of the Company’s ongoing evaluations of interest rate risk, including consideration of potential effects of recent United States government monetary and fiscal policy actions.
12
The following table sets forth certain information relating to the Company’s net interest income for the years ended December 31, 2010, 2009 and 2008. The yields and rates are derived by dividing interest income or interest expense by the average balance of the related assets or liabilities, respectively, for the periods shown except where otherwise noted. Average balances are derived from daily average balances for such assets and liabilities. The average balance of loans and leases not covered by loss share includes loans and leases on which the Company has discontinued accruing interest. The average balances of investment securities are computed based on amortized cost adjusted for unrealized gains and losses on investment securities available for sale (“AFS”) and other-than-temporary impairment writedowns. The yields on loans and leases not covered by loss share include late fees and amortization of certain deferred fees and origination costs, which are considered adjustments to yields. The yields on investment securities include amortization of premiums and accretion of discounts. The yields on covered loans consist of accretion of the net present value of expected future cash flows using the effective yield method over the term of the loans. Interest expense and rates on other borrowings are presented net of interest capitalized on construction projects.
Average Consolidated Balance Sheets and Net Interest Analysis
| Year Ended December 31, | ||||||||||||||||||||||||||||||||||||
| 2010 | 2009 | 2008 | ||||||||||||||||||||||||||||||||||
| Average Balance |
Income/ Expense |
Yield/ Rate |
Average Balance |
Income/ Expense |
Yield/ Rate |
Average Balance |
Income/ Expense |
Yield/ Rate |
||||||||||||||||||||||||||||
| (Dollars in thousands) | ||||||||||||||||||||||||||||||||||||
| ASSETS |
||||||||||||||||||||||||||||||||||||
| Earning assets: |
||||||||||||||||||||||||||||||||||||
| Interest earning deposits and federal funds sold |
$ | 1,230 | $ | 18 | 1.50 | % | $ | 552 | $ | 10 | 1.88 | % | $ | 470 | $ | 13 | 2.77 | % | ||||||||||||||||||
| Investment securities: |
||||||||||||||||||||||||||||||||||||
| Taxable |
85,554 | 4,130 | 4.83 | 322,215 | 18,314 | 5.68 | 395,484 | 21,858 | 5.53 | |||||||||||||||||||||||||||
| Tax-exempt - FTE |
383,433 | 28,512 | 7.44 | 411,710 | 34,282 | 8.33 | 365,413 | 29,856 | 8.17 | |||||||||||||||||||||||||||
| Loans and leases - FTE |
1,890,357 | 118,162 | 6.25 | 1,981,454 | 125,317 | 6.32 | 1,995,231 | 141,759 | 7.10 | |||||||||||||||||||||||||||
| Covered loans (1) |
218,274 | 17,141 | 7.85 | — | — | — | — | — | — | |||||||||||||||||||||||||||
| Total earning assets - FTE |
2,578,848 | 167,963 | 6.51 | 2,715,931 | 177,923 | 6.55 | 2,756,598 | 193,486 | 7.02 | |||||||||||||||||||||||||||
| Non-interest earning assets |
420,002 | 286,190 | 261,109 | |||||||||||||||||||||||||||||||||
| Total assets |
$ | 2,998,850 | $ | 3,002,121 | $ | 3,017,707 | ||||||||||||||||||||||||||||||
| LIABILITIES AND STOCKHOLDERS’ EQUITY |
|
|||||||||||||||||||||||||||||||||||
| Interest bearing liabilities: |
||||||||||||||||||||||||||||||||||||
| Deposits: |
||||||||||||||||||||||||||||||||||||
| Savings and interest bearing transaction |
$ | 1,121,528 | $ | 8,735 | 0.78 | % | $ | 832,808 | $ | 7,128 | 0.86 | % | $ | 628,183 | $ | 9,282 | 1.48 | % | ||||||||||||||||||
| Time deposits of $100,000 or more |
476,748 | 5,829 | 1.22 | 699,281 | 13,504 | 1.93 | 906,306 | 35,464 | 3.91 | |||||||||||||||||||||||||||
| Other time deposits |
392,671 | 5,483 | 1.40 | 409,969 | 9,848 | 2.40 | 516,655 | 19,425 | 3.76 | |||||||||||||||||||||||||||
| Total interest bearing deposits |
1,990,947 | 20,047 | 1.01 | 1,942,058 | 30,480 | 1.57 | 2,051,144 | 64,171 | 3.13 | |||||||||||||||||||||||||||
| Repurchase agreements with customers |
49,835 | 380 | 0.76 | 52,549 | 592 | 1.13 | 43,916 | 796 | 1.81 | |||||||||||||||||||||||||||
| Other borrowings |
317,796 | 12,146 | 3.82 | (2) | 384,854 | 14,375 | 3.74 | (2) | 441,288 | 15,574 | 3.53 | (2) | ||||||||||||||||||||||||
| Subordinated debentures |
64,950 | 1,764 | 2.72 | 64,950 | 2,138 | 3.29 | 64,950 | 3,761 | 5.79 | |||||||||||||||||||||||||||
| Total interest bearing liabilities |
2,423,528 | 34,337 | 1.42 | 2,444,411 | 47,585 | 1.95 | 2,601,298 | 84,302 | 3.24 | |||||||||||||||||||||||||||
| Non-interest bearing liabilities: |
||||||||||||||||||||||||||||||||||||
| Non-interest bearing deposits |
256,910 | 207,782 | 184,563 | |||||||||||||||||||||||||||||||||
| Other non-interest bearing liabilities |
18,940 | 18,010 | 11,061 | |||||||||||||||||||||||||||||||||
| Total liabilities |
2,699,378 | 2,670,203 | 2,796,922 | |||||||||||||||||||||||||||||||||
| Preferred stock, net of unamortized discount |
— | 60,708 | 4,098 | |||||||||||||||||||||||||||||||||
| Common stockholders’ equity |
296,035 | 267,768 | 213,271 | |||||||||||||||||||||||||||||||||
| Noncontrolling interest |
3,437 | 3,442 | 3,416 | |||||||||||||||||||||||||||||||||
| Total liabilities and stockholders’ equity |
$ | 2,998,850 | $ | 3,002,121 | $ | 3,017,707 | ||||||||||||||||||||||||||||||
| Net interest income - FTE |
$ | 133,626 | $ | 130,338 | $ | 109,184 | ||||||||||||||||||||||||||||||
| Net interest margin - FTE |
5.18 | % | 4.80 | % | 3.96 | % | ||||||||||||||||||||||||||||||
| (1) | Covered loans are loans covered by FDIC loss share agreements. |
| (2) | The interest expense and rates for other borrowings were impacted by interest capitalized on construction projects in the amount of $0.1 million, $0.4 million and $1.1 million, respectively, for the years ended December 31, 2010, 2009 and 2008. In the absence of this capitalization, these rates would have been 3.87%, 3.84% and 3.78%, respectively, for the years ended December 31, 2010, 2009 and 2008. |
13
The following table reflects how changes in the volume of interest earning assets and interest bearing liabilities and changes in interest rates have affected the Company’s interest income, interest expense and net interest income for the periods indicated. Information is provided in each category with respect to changes attributable to (1) changes in volume (changes in volume multiplied by prior yield/rate); (2) changes in yield/rate (changes in yield/rate multiplied by prior volume); and (3) changes in both yield/rate and volume (changes in yield/rate multiplied by changes in volume). The changes attributable to the combined impact of volume and yield/rate have all been allocated to the changes due to volume.
Analysis of Changes in Net Interest Income - FTE
| 2010 over 2009 | 2009 over 2008 | |||||||||||||||||||||||
| Yield/ | Net | Yield/ | Net | |||||||||||||||||||||
| Volume | Rate | Change | Volume | Rate | Change | |||||||||||||||||||
| (Dollars in thousands) | ||||||||||||||||||||||||
| Increase (decrease) in: |
||||||||||||||||||||||||
| Interest income - FTE: |
||||||||||||||||||||||||
| Interest earning deposits and federal funds sold |
$ | 10 | $ | (2 | ) | $ | 8 | $ | 1 | $ | (4 | ) | $ | (3 | ) | |||||||||
| Investment securities: |
||||||||||||||||||||||||
| Taxable |
(11,445 | ) | (2,739 | ) | (14,184 | ) | (4,137 | ) | 593 | (3,544 | ) | |||||||||||||
| Tax-exempt - FTE |
(2,106 | ) | (3,664 | ) | (5,770 | ) | 3,841 | 585 | 4,426 | |||||||||||||||
| Loans and leases - FTE |
(5,768 | ) | (1,387 | ) | (7,155 | ) | (879 | ) | (15,563 | ) | (16,442 | ) | ||||||||||||
| Covered loans |
17,141 | — | 17,141 | — | — | — | ||||||||||||||||||
| Total interest income - FTE |
(2,168 | ) | (7,792 | ) | (9,960 | ) | (1,174 | ) | (14,389 | ) | (15,563 | ) | ||||||||||||
| Interest expense: |
||||||||||||||||||||||||
| Savings and interest bearing transaction |
2,273 | (666 | ) | 1,607 | 1,741 | (3,895 | ) | (2,154 | ) | |||||||||||||||
| Time deposits of $100,000 or more |
(2,710 | ) | (4,965 | ) | (7,675 | ) | (4,015 | ) | (17,945 | ) | (21,960 | ) | ||||||||||||
| Other time deposits |
(265 | ) | (4,100 | ) | (4,365 | ) | (2,550 | ) | (7,027 | ) | (9,577 | ) | ||||||||||||
| Repurchase agreements with customers |
(18 | ) | (194 | ) | (212 | ) | 95 | (299 | ) | (204 | ) | |||||||||||||
| Other borrowings |
(2,537 | ) | 308 | (2,229 | ) | (2,126 | ) | 927 | (1,199 | ) | ||||||||||||||
| Subordinated debentures |
— | (374 | ) | (374 | ) | — | (1,623 | ) | (1,623 | ) | ||||||||||||||
| Total interest expense |
(3,257 | ) | (9,991 | ) | (13,248 | ) | (6,855 | ) | (29,862 | ) | (36,717 | ) | ||||||||||||
| Increase in net interest income - FTE |
$ | 1,089 | $ | 2,199 | $ | 3,288 | $ | 5,681 | $ | 15,473 | $ | 21,154 | ||||||||||||
Non-Interest Income
The Company’s non-interest income consists primarily of service charges on deposit accounts, mortgage lending income, trust income, BOLI income, appraisal fees, credit life commissions and other credit related fees, safe deposit box rental, operating lease income, brokerage fees and other miscellaneous fees, gains and losses on investment securities and on sales of other assets, and, during 2010, gains on FDIC-assisted transactions and accretion of FDIC loss share receivable.
2010 compared to 2009
Non-interest income for 2010 increased 37.7% to $70.3 million compared to $51.1 million in 2009. The increase in non-interest income for 2010 compared to 2009 is due primarily to $35.0 million of bargain purchase gains recorded on four FDIC-assisted transactions during 2010, partially offset by a $22.4 million reduction in gains on investments securities.
Service charges on deposit accounts increased 22.0% to $15.2 million in 2010 compared to $12.4 million in 2009. This increase was due to a number of factors including growth in the number of transaction accounts, increased customer utilization of fee-based services, and the addition of deposit customers from the Company’s four FDIC-assisted acquisitions during 2010. The Company’s non-CD account deposits grew $446 million during 2010 and increased from 56.8% of total deposits at December 31, 2009 to 62.9% of total deposits at December 31, 2010.
Mortgage lending income increased 16.6% to $3.9 million in 2010 compared to $3.3 million in 2009. This increase was due to improved profit margins and, to a lesser extent, increased volume. Originations of mortgage loans for sale, including both originations for home purchases and refinancings of existing mortgages, increased 2.4% to $188.1 million in 2010 compared to $183.6 million in 2009. Mortgage originations for home purchases were 38% of 2010 origination volume compared to 39% in 2009. Refinancing of existing mortgages accounted for 62% of the Company’s 2010 origination volume compared to 61% in 2009.
14
Trust income increased 10.7% to $3.4 million in 2010 compared to $3.1 million in 2009. This increase was primarily the result of continued growth in personal trust business during 2010.
BOLI income decreased 32.5% to $2.2 million in 2010 compared to $3.2 million in 2009. BOLI income was comprised of (i) increases in cash surrender value of $2.2 million in 2010 compared to $1.9 million in 2009 and (ii) no income from BOLI death benefits in 2010 compared to $1.3 million in 2009.
Net gains on investment securities were $4.5 million in 2010 compared to net gains of $27.0 million in 2009. The Company sold approximately $251 million of its investment securities in 2010 and approximately $529 million of its investment securities in 2009.
Net gains on sales of other assets were $0.8 million in 2010 compared to net losses of $0.2 million in 2009.
On March 26, 2010 the Company, through the Bank, entered into a purchase and assumption agreement with loss share agreements with the FDIC pursuant to which it acquired substantially all of the assets and assumed substantially all of the deposits and certain other liabilities of the former Unity National Bank (“Unity”). This FDIC-assisted transaction resulted in the Company recognizing a pre-tax bargain purchase gain of $10.0 million in the first quarter of 2010.
On July 16, 2010 the Company, through the Bank, entered into a purchase and assumption agreement with loss share agreements with the FDIC pursuant to which it acquired substantially all of the assets and assumed substantially all of the deposits and certain other liabilities of the former Woodlands Bank (“Woodlands”). This FDIC-assisted transaction resulted in the Company recognizing a pre-tax bargain purchase gain of $14.4 million in the third quarter of 2010.
On September 10, 2010 the Company, through the Bank, entered into a purchase and assumption agreement with loss share agreements with the FDIC pursuant to which it acquired substantially all of the assets and assumed substantially all of the deposits and certain other liabilities of the former Horizon Bank (“Horizon”). This FDIC-assisted transaction resulted in the Company recognizing a pre-tax bargain purchase gain of $1.8 million in the third quarter of 2010.
On December 17, 2010 the Company, through the Bank, entered into a purchase and assumption agreement with loss share agreements with the FDIC pursuant to which it acquired substantially all of the assets and assumed substantially all of the deposits and certain other liabilities of the former Chestatee State Bank (“Chestatee”). This FDIC-assisted transaction resulted in the Company recognizing a pre-tax bargain purchase gain of $8.9 million in the fourth quarter of 2010.
Non-interest income from all other sources was $5.4 million in 2010 compared to $2.2 million in 2009. The increase in non-interest income from other sources was due primarily to the accretion of the FDIC loss share receivable, net of the amortization of the FDIC clawback payable, of $2.4 million during 2010. The FDIC loss share receivable reflects the indemnification provided by the FDIC in FDIC-assisted transactions, and the FDIC clawback payable represents the obligation of the Company to reimburse the FDIC should actual losses be less than certain thresholds established in each loss share agreement.
2009 compared to 2008
Non-interest income for 2009 increased 163.8% to $51.1 million compared to $19.3 million in 2008. The large increase in non-interest income for 2009 was primarily attributable to significant gains on investment securities.
Service charges on deposit accounts increased 3.4% to $12.4 million in 2009 compared to $12.0 million in 2008. This increase was due, in part, to the Company’s growth in transaction account deposits, which grew $113 million and increased from 44.3% to 56.8% of total deposits from December 31, 2008 to December 31, 2009.
Mortgage lending income increased 49.5% to $3.3 million in 2009 compared to $2.2 million in 2008. Originations of mortgage loans for sale, including both originations for home purchases and refinancings of existing mortgages, increased 43.7% to $183.6 million in 2009 compared to $128.0 million in 2008. Mortgage originations for home purchases were 39% of 2009 origination volume compared to 52% in 2008. Refinancing of existing mortgages accounted for 61% of the Company’s 2009 origination volume compared to 48% in 2008.
15
Trust income increased 18.6% to $3.1 million in 2009 compared to $2.6 million in 2008. This increase was primarily the result of continued growth in both personal and corporate trust business through adding new accounts and growing existing relationships during 2009.
BOLI income decreased 22.9% to $3.2 million in 2009 compared to $4.1 million in 2008. BOLI income was comprised of (i) increases in cash surrender value of $1.9 million in 2009 compared to $2.0 million in 2008 and (ii) $1.3 million of income from BOLI death benefits in 2009 compared to $2.1 million in 2008.
Net gains on investment securities, including the impairment charge discussed below, were $27.0 million in 2009 compared to net losses of $3.4 million in 2008. The Company sold approximately $529 million of its investment securities in 2009 and approximately $14 million of its investment securities in 2008. During 2009, the Company’s investment securities portfolio included one security categorized as a collateralized debt obligation (“CDO”). This CDO had performed in accordance with its terms and was not in default, but, because of its credit rating being downgraded to below investment grade and other factors, the Company determined during 2009 that it no longer expected to hold this security until maturity or until such time as fair value recovers to or above cost. As a result, the Company recorded a $0.9 million charge during 2009 to reduce the carrying value of this security to $0.1 million. During 2010 the Company sold this security.
Net losses on sales of other assets were $0.2 million in 2009 compared to net losses of $0.5 million in 2008. Non-interest income from all other sources was $2.2 million in 2009 compared to $2.4 million in 2008.
The following table presents non-interest income for the years ended December 31, 2010, 2009 and 2008.
Non-Interest Income
| Year Ended December 31, | ||||||||||||
| 2010 | 2009 | 2008 | ||||||||||
| (Dollars in thousands) | ||||||||||||
| Service charges on deposit accounts |
$ | 15,156 | $ | 12,421 | $ | 12,007 | ||||||
| Mortgage lending income |
3,863 | 3,312 | 2,215 | |||||||||
| Trust income |
3,406 | 3,078 | 2,595 | |||||||||
| Bank owned life insurance income |
2,151 | 3,186 | 4,131 | |||||||||
| Appraisal, credit life commissions and other credit related fees |
261 | 491 | 456 | |||||||||
| Safe deposit box rental, operating lease income, brokerage fees and other miscellaneous fees |
1,502 | 1,231 | 1,218 | |||||||||
| Gains (losses) on investment securities |
4,544 | 26,982 | (3,433 | ) | ||||||||
| Gains (losses) on sales of other assets |
802 | (177 | ) | (544 | ) | |||||||
| Gains on FDIC-assisted transactions |
35,019 | — | — | |||||||||
| Accretion of FDIC loss share receivable, net of amortization of FDIC clawback payable |
2,429 | — | — | |||||||||
| Other loss share income, net |
599 | — | — | |||||||||
| Other |
590 | 527 | 704 | |||||||||
| Total non-interest income |
$ | 70,322 | $ | 51,051 | $ | 19,349 | ||||||
Non-Interest Expense
Non-interest expense consists of salaries and employee benefits, net occupancy and equipment expense and other operating expenses.
2010 compared to 2009
Non-interest expense for 2010 increased 27.4% to $87.4 million compared to $68.6 million in 2009. The Company’s efficiency ratio (non-interest expense divided by the sum of FTE net interest income and non-interest income) for 2010 was 42.9% compared to 37.8% in 2009. The increase in the efficiency ratio in 2010 resulted from the Company’s total revenue (the sum of FTE net interest income and non-interest income) increasing at a slower rate than its non-interest expense.
Salaries and employee benefits, the Company’s largest component of non-interest expense, increased 26.1% to $40.2 million in 2010 from $31.8 million in 2009. The Company had 881 full-time equivalent employees at December 31, 2010, an increase of 22.0% from 722 full-time equivalent employees at December 31, 2009. This increase in full-time equivalent employees was due primarily to the Company’s four FDIC-assisted acquisitions during 2010.
16
Net occupancy and equipment expense for 2010 increased 9.0% to $10.6 million compared to $9.7 million in 2009. During 2010 the Company added five new northwest Georgia banking offices from its Unity acquisition, four new banking offices (one office each in North Carolina, South Carolina, Georgia and Alabama) from its Woodlands acquisition, three new banking offices in Florida from its Horizon acquisition, and four new north central Georgia banking offices from its Chestatee acquisition. The Company also opened a new de novo banking office in Benton, Arkansas during 2010. At December 31, 2010, the Company had 90 offices, including 66 in Arkansas, 10 in Georgia, seven in Texas, three in Florida, two in North Carolina, and one each in South Carolina and Alabama. At December 31, 2009, the Company had 73 offices, including 65 in Arkansas, seven in Texas and one in North Carolina.
Other operating expenses for 2010 increased 35.5% to $36.6 million compared to $27.0 million in 2009, primarily as a result of the items described in the following paragraph.
The increase in non-interest expense for 2010 was primarily attributable to (i) $9.0 million of write downs of other real estate owned during 2010 compared to $4.0 million of such write downs during 2009, (ii) $3.8 million of expenses related to the four FDIC-assisted acquisitions in 2010 and costs incurred for completing and preparing for various systems conversions related to those acquisitions, (iii) costs of ongoing due diligence efforts, and (iv) $1.0 million of general cash bonuses paid in 2010.
2009 compared to 2008
Non-interest expense for 2009 increased 26.2% to $68.6 million compared to $54.4 million in 2008. The Company’s efficiency ratio for 2009 was 37.8% compared to 42.3% in 2008. This decrease in the effeciency ratio in 2009 resulted from the Company’s total revenue (the sum of FTE net interest income and non-interest income) increasing at a faster rate than its non-interest expense.
Salaries and employee benefits, the Company’s largest component of non-interest expense, increased 5.7% to $31.8 million in 2009 from $30.1 million in 2008. The Company had 722 full-time equivalent employees at December 31, 2009, an increase of 2.4% from 705 full-time equivalent employees at December 31, 2008.
Net occupancy and equipment expense for 2009 increased 9.7% to $9.7 million compared to $8.9 million in 2008. During 2009 the Company added new banking offices in downtown Little Rock, Arkansas and Allen, Texas and closed a small office in North Little Rock, Arkansas where the leased space became unavailable. At December 31, 2009, the Company had 73 offices, including 65 banking offices in Arkansas, seven Texas banking offices and one loan production office in Charlotte, North Carolina. At December 31, 2008, the Company had 72 offices.
Other operating expenses for 2009 increased 75.8% to $27.0 million compared to $15.4 million in 2008. The significant increase in other operating expenses was primarily attributable to increases in (i) FDIC insurance expense, (ii) loan collection and repossession expense, (iii) write downs on other real estate owned, and (iv) other expenses.
The Company’s FDIC insurance expense increased 279.4% to $4.3 million in 2009 compared to $1.1 million in 2008. This large increase was due to (i) a special assessment levied by the FDIC on all insured institutions during the second quarter of 2009, relating to the rebuilding of the FDIC’s Deposit Insurance Fund, which resulted in the Company incurring $1.3 million of expense and (ii) higher FDIC base insurance premium assessments for 2009 applicable to all FDIC insured institutions which resulted in increased expense of $1.9 million.
The Company’s loan collection and repossession expense increased 300.3% to $4.0 million in 2009 compared to $1.0 million in 2008. This increase was primarily attributable to the increased volume of foreclosure and repossession activity in 2009 compared to 2008.
During 2009 the Company recorded write downs on other real estate owned of $4.0 million compared to $1.0 million in 2008. The increase in write downs of other real estate owned in 2009 was primarily attributable to the higher volume of other real estate owned in 2009 and declines in the value of assets held in other real estate owned in 2009 as a result of economic and real estate market conditions and other factors.
17
The increase in other expenses in 2009 included (i) a $0.6 million write off of capitalized branch costs and (ii) a $1.0 million impairment charge on an equity investment in a real estate development project. The $0.6 million write off of capitalized branch costs resulted from the Company’s decision to indefinitely delay construction of five Arkansas branches for which it had previously incurred architectural, engineering and other capitalized pre-construction costs. It is presently uncertain as to when or if the Company will proceed with construction. The $1.0 million impairment charge resulted from the Company’s only equity investment in a real estate development project. Because the project is selling at a slower than expected pace, the Company recognized the impairment charge which reduced the Company’s investment to $2.55 million, equaling the net present value of the proceeds expected to be realized using a 15% compounded annual discount rate.
The following table presents non-interest expense for the years ended December 31, 2010, 2009 and 2008.
Non-Interest Expense
| Year Ended December 31, | ||||||||||||
| 2010 | 2009 | 2008 | ||||||||||
| (Dollars in thousands) | ||||||||||||
| Salaries and employee benefits |
$ | 40,161 | $ | 31,847 | $ | 30,132 | ||||||
| Net occupancy and equipment expense |
10,618 | 9,740 | 8,882 | |||||||||
| Other operating expenses: |
||||||||||||
| Postage and supplies |
1,981 | 1,530 | 1,633 | |||||||||
| Telephone and data lines |
2,110 | 1,806 | 1,630 | |||||||||
| Advertising and public relations |
2,076 | 1,083 | 1,204 | |||||||||
| Professional and outside services |
3,024 | 1,793 | 1,537 | |||||||||
| Software expense |
2,657 | 1,524 | 1,261 | |||||||||
| FDIC and state assessments |
678 | 673 | 664 | |||||||||
| FDIC insurance |
3,238 | 4,291 | 1,131 | |||||||||
| ATM expense |
881 | 745 | 633 | |||||||||
| Loan collection and repossession expense |
4,001 | 3,999 | 999 | |||||||||
| Write downs of other real estate owned |
8,960 | 4,009 | 1,042 | |||||||||
| Amortization of intangibles |
431 | 110 | 214 | |||||||||
| Other |
6,603 | 5,482 | 3,447 | |||||||||
| Total non-interest expense |
$ | 87,419 | $ | 68,632 | $ | 54,409 | ||||||
Income Taxes
The Company’s provision for income taxes was $26.6 million for the year ended December 31, 2010 compared to $12.9 million in 2009 and $9.9 million in 2008. Its effective income tax rates were 29.40%, 22.98% and 22.24%, respectively, for 2010, 2009 and 2008. The effective tax rate increased 642 bps in 2010 compared to 2009. The effective tax rate increased 74 bps in 2009 compared to 2008. The increase in the Company’s effective tax rate for 2010 compared to 2009 was due primarily to the increase in taxable income and the decline, both in volume and as a percentage of taxable income, of income exempt from federal and/or state income taxes. The effective tax rates for all periods were also affected by various other factors including other non-taxable income and non-deductible expenses.
18
Analysis of Financial Condition
Loan and Lease Portfolio
At December 31, 2010, the Company’s loan and lease portfolio, excluding loans covered by FDIC loss share agreements, was $1.86 billion, a decrease of 2.5% from $1.90 billion at December 31, 2009. Economic conditions in 2010 and 2009 diminished both the demand for loans and leases and the quality of many credit applications, resulting in the volume of new loan and lease originations in both 2010 and 2009 being more than offset by loan and lease paydowns.
As of December 31, 2010, the Company’s loan and lease portfolio, excluding loans covered by FDIC loss share agreements, consisted of 87.6% real estate loans, 6.5% commercial and industrial loans, 2.9% consumer loans, 2.3% direct financing leases and 0.5% agricultural loans (non-real estate). Real estate loans, the Company’s largest category of loans, include all loans made to finance the development of real property construction projects, provided such loans are secured by real estate, and all other loans secured by real estate as evidenced by mortgages or other liens.
The amount and type of loans and leases outstanding, excluding loans covered by FDIC loss share agreements, are reflected in the following table.
Loan and Lease Portfolio
| December 31, | ||||||||||||||||||||
| 2010 | 2009 | 2008 | 2007 | 2006 | ||||||||||||||||
| (Dollars in thousands) | ||||||||||||||||||||
| Real estate: |
||||||||||||||||||||
| Residential 1-4 family |
$ | 266,014 | $ | 282,733 | $ | 275,281 | $ | 279,375 | $ | 281,400 | ||||||||||
| Non-farm/non-residential |
678,465 | 606,880 | 551,821 | 445,303 | 433,998 | |||||||||||||||
| Construction/land development |
496,737 | 600,342 | 694,527 | 684,775 | 514,899 | |||||||||||||||
| Agricultural |
81,736 | 86,237 | 84,432 | 91,810 | 88,021 | |||||||||||||||
| Multifamily residential |
103,875 | 55,860 | 61,668 | 31,414 | 50,202 | |||||||||||||||
| Total real estate |
1,626,827 | 1,632,052 | 1,667,729 | 1,532,677 | 1,368,520 | |||||||||||||||
| Commercial and industrial |
120,038 | 150,208 | 206,058 | 173,128 | 148,853 | |||||||||||||||
| Consumer |
54,401 | 63,561 | 75,015 | 87,867 | 86,048 | |||||||||||||||
| Direct financing leases |
42,754 | 40,353 | 50,250 | 53,446 | 49,705 | |||||||||||||||
| Agricultural (non-real estate) |
9,962 | 15,509 | 19,460 | 22,439 | 22,298 | |||||||||||||||
| Other |
2,447 | 2,421 | 2,687 | 1,578 | 1,965 | |||||||||||||||
| Total loans and leases |
$ | 1,856,429 | $ | 1,904,104 | $ | 2,021,199 | $ | 1,871,135 | $ | 1,677,389 | ||||||||||
The amount and percentage of the Company’s loan and lease portfolio, excluding loans covered by FDIC loss share agreements, by state of originating office are reflected in the following table.
Loan and Lease Portfolio by State of Originating Office
| December 31, | ||||||||||||||||||||||||
| 2010 | 2009 | 2008 | ||||||||||||||||||||||
| Loans and Leases Attributable to Offices In |
Amount | % | Amount | % | Amount | % | ||||||||||||||||||
| (Dollars in thousands) | ||||||||||||||||||||||||
| Arkansas |
$ | 1,064,558 | 57.3 | % | $ | 1,148,053 | 60.3 | % | $ | 1,333,420 | 66.0 | % | ||||||||||||
| Texas |
685,317 | 36.9 | 643,575 | 33.8 | 588,875 | 29.1 | ||||||||||||||||||
| North Carolina |
101,165 | 5.5 | 112,476 | 5.9 | 98,904 | 4.9 | ||||||||||||||||||
| Georgia |
3,944 | 0.2 | — | — | — | — | ||||||||||||||||||
| Florida |
890 | 0.1 | — | — | — | — | ||||||||||||||||||
| Alabama |
513 | — | — | — | — | — | ||||||||||||||||||
| South Carolina |
42 | — | — | — | — | — | ||||||||||||||||||
| Total |
$ | 1,856,429 | 100.0 | % | $ | 1,904,104 | 100.0 | % | $ | 2,021,199 | 100.0 | % | ||||||||||||
19
The amount and type of the Company’s real estate loans, excluding loans covered by FDIC loss share agreements, at December 31, 2010 based on the metropolitan statistical area (“MSA”) and other geographic areas in which the principal collateral is located are reflected in the following table. Data for individual states is separately presented when aggregate real estate loans in that state exceed $10 million.
Geographic Distribution of Real Estate Loans
| Residential 1-4 Family |
Non-Farm/ Non- Residential |
Construction/ Land Development |
Agricultural | Multifamily Residential |
Total | |||||||||||||||||||
| (Dollars in thousands) | ||||||||||||||||||||||||
| Arkansas: |
||||||||||||||||||||||||
| Little Rock - North Little Rock, AR MSA |
$ | 72,458 | $ | 189,771 | $ | 75,029 | $ | 6,523 | $ | 8,022 | $ | 351,803 | ||||||||||||
| Fort Smith, AR/OK MSA |
37,763 | 47,882 | 7,073 | 4,785 | 2,508 | 100,011 | ||||||||||||||||||
| Fayetteville - Springdale - Rogers, AR MSA |
8,951 | 17,680 | 21,772 | 6,288 | 1,039 | 55,730 | ||||||||||||||||||
| Hot Springs, AR MSA |
9,034 | 9,048 | 6,943 | — | 1,473 | 26,498 | ||||||||||||||||||
| Western Arkansas(1) |
27,133 | 38,659 | 7,760 | 11,238 | 1,537 | 86,327 | ||||||||||||||||||
| Northern Arkansas(2) |
78,020 | 31,206 | 14,803 | 37,636 | 587 | 162,252 | ||||||||||||||||||
| All other Arkansas(3) |
5,864 | 10,486 | 2,332 | 2,430 | — | 21,112 | ||||||||||||||||||
| Total Arkansas |
239,223 | 344,732 | 135,712 | 68,900 | 15,166 | 803,733 | ||||||||||||||||||
| Texas: |
||||||||||||||||||||||||
| Dallas - Fort Worth - Arlington, TX MSA |
4,449 | 157,534 | 160,726 | — | 36,141 | 358,850 | ||||||||||||||||||
| Houston - Baytown - Sugar Land, TX MSA |
— | 11,526 | 44,012 | — | — | 55,538 | ||||||||||||||||||
| San Antonio, TX MSA |
— | 9,561 | 11,647 | — | — | 21,208 | ||||||||||||||||||
| Austin - Round Rock, TX MSA |
— | — | 1,741 | — | 17,775 | 19,516 | ||||||||||||||||||
| Texarkana, TX - Texarkana, AR MSA |
11,867 | 10,565 | 5,122 | 504 | 1,149 | 29,207 | ||||||||||||||||||
| All other Texas(3) |
1,053 | 15,693 | 990 | — | 17,372 | 35,108 | ||||||||||||||||||
| Total Texas |
17,369 | 204,879 | 224,238 | 504 | 72,437 | 519,427 | ||||||||||||||||||
| North Carolina/South Carolina: |
||||||||||||||||||||||||
| Charlotte - Gastonia - Concord, NC/SC MSA |
1,476 | 28,217 | 38,861 | — | 5,541 | 74,095 | ||||||||||||||||||
| All other North Carolina(3) |
— | 28,254 | 36,420 | — | — | 64,674 | ||||||||||||||||||
| All other South Carolina(3) |
5,318 | 7,194 | 5,300 | — | 6,576 | 24,388 | ||||||||||||||||||
| Total North Carolina/ South Carolina |
6,794 | 63,665 | 80,581 | — | 12,117 | 163,157 | ||||||||||||||||||
| California |
— | 2,589 | 27,903 | — | — | 30,492 | ||||||||||||||||||
| Virginia |
— | — | 19,006 | — | — | 19,006 | ||||||||||||||||||
| Oklahoma(4) |
361 | 14,049 | 788 | — | — | 15,198 | ||||||||||||||||||
| Louisiana |
— | 999 | 635 | 11,514 | — | 13,148 | ||||||||||||||||||
| All other states(3)(5) |
2,267 | 47,552 | 7,874 | 818 | 4,155 | 62,666 | ||||||||||||||||||
| Total real estate loans |
$ | 266,014 | $ | 678,465 | $ | 496,737 | $ | 81,736 | $ | 103,875 | $ | 1,626,827 | ||||||||||||
| (1) | This geographic area includes the following counties in Western Arkansas: Johnson, Logan, Pope and Yell counties. |
| (2) | This geographic area includes the following counties in Northern Arkansas: Baxter, Boone, Marion, Newton, Searcy and Van Buren counties. |
| (3) | These geographic areas include all MSA and non-MSA areas that are not separately reported. |
| (4) | This geographic area includes all real estate loans in Oklahoma except loans in Le Flore and Sequoyah counties which are included in the Fort Smith, AR/OK MSA above. |
| (5) | Includes all states not separately presented above. |
20
The amount and type of non-farm/non-residential loans, excluding loans covered by FDIC loss share agreements, at December 31, 2010 and 2009, and their respective percentage of the total non-farm/non-residential loan portfolio are reflected in the following table.
Non-Farm/Non-Residential Loans
| December 31, | ||||||||||||||||
| 2010 | 2009 | |||||||||||||||
| Amount | % | Amount | % | |||||||||||||
| (Dollars in thousands) | ||||||||||||||||
| Retail, including shopping centers and strip centers |
$ | 225,701 | 33.3 | % | $ | 182,343 | 30.0 | % | ||||||||
| Churches and schools |
56,670 | 8.3 | 58,601 | 9.6 | ||||||||||||
| Office, including medical offices |
90,924 | 13.4 | 53,797 | 8.9 | ||||||||||||
| Office warehouse, warehouse and mini-storage |
64,137 | 9.5 | 64,608 | 10.6 | ||||||||||||
| Gasoline stations and convenience stores |
14,452 | 2.1 | 17,942 | 3.0 | ||||||||||||
| Hotels and motels |
45,078 | 6.6 | 39,206 | 6.5 | ||||||||||||
| Restaurants and bars |
39,069 | 5.8 | 45,597 | 7.5 | ||||||||||||
| Manufacturing and industrial facilities |
10,215 | 1.5 | 34,859 | 5.7 | ||||||||||||
| Nursing homes and assisted living centers |
29,711 | 4.4 | 30,171 | 5.0 | ||||||||||||
| Hospitals, surgery centers and other medical |
63,157 | 9.3 | 38,662 | 6.4 | ||||||||||||
| Golf courses, entertainment and recreational facilities |
13,457 | 2.0 | 15,162 | 2.5 | ||||||||||||
| Other non-farm/non-residential |
25,894 | 3.8 | 25,932 | 4.3 | ||||||||||||
| Total |
$ | 678,465 | 100.0 | % | $ | 606,880 | 100.0 | % | ||||||||
The amount and type of construction/land development loans, excluding loans covered by FDIC loss share agreements, at December 31, 2010 and 2009, and their respective percentage of the total construction/land development loan portfolio are reflected in the following table.
Construction/Land Development Loans
| December 31, | ||||||||||||||||
| 2010 | 2009 | |||||||||||||||
| Amount | % | Amount | % | |||||||||||||
| (Dollars in thousands) | ||||||||||||||||
| Unimproved land |
$ | 99,084 | 20.0 | % | $ | 98,386 | 16.4 | % | ||||||||
| Land development and lots: |
||||||||||||||||
| 1-4 family residential and multifamily |
168,080 | 33.8 | 189,691 | 31.6 | ||||||||||||
| Non-residential |
74,745 | 15.1 | 74,744 | 12.5 | ||||||||||||
| Construction: |
||||||||||||||||
| 1-4 family residential: |
||||||||||||||||
| Owner occupied |
13,505 | 2.7 | 12,878 | 2.1 | ||||||||||||
| Non-owner occupied: |
||||||||||||||||
| Pre-sold |
4,153 | 0.8 | 6,626 | 1.1 | ||||||||||||
| Speculative |
43,899 | 8.8 | 54,719 | 9.1 | ||||||||||||
| Multifamily |
60,536 | 12.2 | 78,540 | 13.1 | ||||||||||||
| Industrial, commercial and other |
32,735 | 6.6 | 84,758 | 14.1 | ||||||||||||
| Total |
$ | 496,737 | 100.0 | % | $ | 600,342 | 100.0 | % | ||||||||
21
The establishment of interest reserves for construction and development loans is established banking practice, but the handling of such interest reserves varies widely within the industry. Many of the Company’s construction and development loans provide for the use of interest reserves. When the Company underwrites construction and development loans, it considers the expected total project costs, including hard costs such as land, site work and construction costs and soft costs such as architectural and engineering fees, closing costs, leasing commissions and construction period interest. Based on the total project costs and other factors, the Company determines the required borrower cash equity contribution and the maximum amount the Company is willing to loan. In the vast majority of cases, the Company requires that all of the borrower’s cash equity contribution be contributed prior to any significant loan advances. This ensures that the borrower’s cash equity required to complete the project will in fact be available for such purposes. As a result of this practice, the borrower’s cash equity typically goes toward the purchase of the land and early stage hard costs and soft costs. This results in the Company funding the loan later as the project progresses, and accordingly, the Company typically funds the majority of the construction period interest through loan advances. However, when the Company initially determines the borrower’s cash equity requirement, the Company typically requires the borrower’s cash equity to cover a majority, or all, of the soft costs, including an amount equal to construction period interest, and an appropriate portion of the hard costs. During 2010, the Company advanced construction period interest totaling approximately $6.3 million on construction and development loans. While the Company advanced these sums as part of the funding process, the Company believes that the borrowers in effect had in most cases already provided for these sums as part of their initial equity contribution. Specifically, the maximum committed balance of all construction and development loans which provide for the use of interest reserves at December 31, 2010 was $361.7 million, of which $296.9 million was outstanding at December 31, 2010 and $64.8 million remained to be advanced. The weighted average loan to cost on such loans, assuming such loans are ultimately fully advanced, will be approximately 62%, which means that the weighted average cash equity contributed on such loans, assuming such loans are ultimately fully advanced, will be approximately 38%. The weighted average final loan to value ratio on such loans, based on the most recent appraisals and assuming such loans are ultimately fully advanced, is expected to be approximately 55%.
Loan and Lease Maturities
The following table reflects loans and leases, excluding loans covered by FDIC loss share agreements, grouped by remaining maturities at December 31, 2010 by type and by fixed or floating interest rates. This table is based on actual maturities and does not reflect amortizations, projected paydowns or the earliest repricing for floating rate loans. Many loans have principal paydowns scheduled in periods prior to the period in which they mature. In addition many variable rate loans are subject to repricing in periods prior to the period in which they mature.
Loan and Lease Maturities
| 1 Year or Less |
Over
1 Through 5 Years |
Over 5 Years |
Total | |||||||||||||
| (Dollars in thousands) | ||||||||||||||||
| Real estate |
$ | 777,299 | $ | 731,394 | $ | 118,134 | $ | 1,626,827 | ||||||||
| Commercial, industrial and agricultural |
70,883 | 57,871 | 1,246 | 130,000 | ||||||||||||
| Consumer |
14,267 | 38,543 | 1,591 | 54,401 | ||||||||||||
| Direct financing leases |
3,094 | 39,660 | — | 42,754 | ||||||||||||
| Other |
833 | 1,614 | — | 2,447 | ||||||||||||
| Total |
$ | 866,376 | $ | 869,082 | $ | 120,971 | $ | 1,856,429 | ||||||||
| Fixed rate |
$ | 251,368 | $ | 505,101 | $ | 84,636 | $ | 841,105 | ||||||||
| Floating rate (not at a floor or ceiling rate) |
33,392 | 11,299 | 10,190 | 54,881 | ||||||||||||
| Floating rate (at floor rate) |
581,616 | 352,682 | 26,145 | 960,443 | ||||||||||||
| Floating rate (at ceiling rate) |
— | — | — | — | ||||||||||||
| Total |
$ | 866,376 | $ | 869,082 | $ | 120,971 | $ | 1,856,429 | ||||||||
22
The following table reflects loans and leases, excluding loans covered by FDIC loss share agreements, as of December 31, 2010 grouped by expected amortizations, expected paydowns or the earliest repricing opportunity for floating rate loans. This cash flow or repricing schedule approximates the Company’s ability to reprice the outstanding principal of loans and leases either by adjusting rates on existing loans and leases or reinvesting principal cash flow in new loans and leases.
Loan and Lease Cash Flows or Repricing
| 1 Year or Less |
Over
1 Through 2 Years |
Over
2 Through 3 Years |
Over
3 Through 5 Years |
Over 5 Years |
Total | |||||||||||||||||||
| (Dollars in thousands) | ||||||||||||||||||||||||
| Fixed rate |
$ | 308,596 | $ | 224,465 | $ | 160,936 | $ | 84,928 | $ | 62,180 | $ | 841,105 | ||||||||||||
| Floating rate (not at a floor or ceiling rate) |
50,403 | 3,088 | 341 | 803 | 246 | 54,881 | ||||||||||||||||||
| Floating rate (at floor rate)(1) |
959,184 | 160 | — | 1,099 | — | 960,443 | ||||||||||||||||||
| Floating rate (at ceiling rate) |
— | — | — | — | — | — | ||||||||||||||||||
| Total |
$ | 1,318,183 | $ | 227,713 | $ | 161,277 | $ | 86,830 | $ | 62,426 | $ | 1,856,429 | ||||||||||||
| Percentage of total |
71.0 | % | 12.3 | % | 8.7 | % | 4.6 | % | 3.4 | % | 100.0 | % | ||||||||||||
| Cumulative percentage of total |
71.0 | 83.3 | 92.0 | 96.6 | 100.0 | |||||||||||||||||||
| (1) | The inclusion of a floor rate in many of the Company’s loans and leases has lessened the impact of falling interest rates on the Company’s loan and lease yields. Conversely, many loans and leases with floor rates will not immediately reprice in a rising rate environment if the interest rate index and margin on such loans and leases continue to result in a computed interest rate less than the applicable floor rate. The earnings simulation model results included in the interest rate risk section of this Management’s Discussion and Analysis include consideration of the impact of all interest rate floors and ceilings in loans and leases. |
Covered Assets
On March 26, 2010, the Company, through the Bank, acquired substantially all of the assets and assumed substantially all of the deposits and certain other liabilities of Unity in a FDIC-assisted transaction. Loans comprise the majority of the assets acquired and are subject to loss share agreements with the FDIC whereby the Bank is indemnified against losses on covered loans and covered other real estate owned (“covered ORE”). The loans acquired from Unity, as well as the covered ORE and the related loss share receivable from the FDIC, are presented as covered assets in the accompanying consolidated financial statements.
On July 16, 2010, the Company, through the Bank, acquired substantially all of the assets and assumed substantially all of the deposits and certain other liabilities of Woodlands in a FDIC-assisted transaction. Loans comprise the majority of the assets acquired and all but $1.1 million of consumer loans are subject to loss share agreements with the FDIC whereby the Bank is indemnified against losses on covered loans and covered ORE. The loans acquired from Woodlands that are covered by loss share agreements, as well as the covered ORE and the related loss share receivable from the FDIC, are presented as covered assets in the accompanying consolidated financial statements.
On September 10, 2010, the Company, through the Bank, acquired substantially all of the assets and assumed substantially all of the deposits and certain other liabilities of Horizon in a FDIC-assisted transaction. Loans comprise the majority of the assets acquired and all but $0.9 million of consumer loans are subject to loss share agreements with the FDIC whereby the Bank is indemnified against losses on covered loans and covered ORE. The loans acquired from Horizon that are covered by loss share agreements, as well as the covered ORE and the related loss share receivable from the FDIC, are presented as covered assets in the accompanying consolidated financial statements.
On December 17, 2010, the Company, through the Bank, acquired substantially all of the assets and assumed substantially all of the deposits and certain other liabilities of Chestatee in a FDIC-assisted transaction. Loans comprise the majority of the assets acquired and all but $3.6 million of consumer loans are subject to loss share agreements with the FDIC whereby the Bank is indemnified against losses on covered loans and covered ORE. The loans acquired from Chestatee that are covered by loss share agreements, as well as the covered ORE and the related loss share receivable from the FDIC, are presented as covered assets in the accompanying consolidated financial statements.
In conjunction with each of these acquisitions, the Bank entered into loss share agreements with the FDIC such that the Bank and the FDIC will share in the losses on assets covered under the loss share agreements. Pursuant to the terms of the loss share agreements for the Unity acquisition, on losses up to $65 million, the
23
FDIC will reimburse the Bank for 80% of losses. On losses exceeding $65 million, the FDIC will reimburse the Bank for 95% of losses. Pursuant to the terms of the loss share agreements for the Woodlands acquisition, the FDIC will reimburse the Bank for 80% of losses. Pursuant to the terms of the loss share agreements for the Horizon acquisition, the FDIC will reimburse the Bank on single family residential loans and related foreclosed real estate for (i) 80% of losses up to $11.8 million, (ii) 30% of losses between $11.8 million and $17.9 million and (iii) 80% of losses in excess of $17.9 million. For non-single family residential loans and related foreclosed real estate, the FDIC will reimburse the Bank for (i) 80% of losses up to $32.3 million, (ii) 0% of losses between $32.3 million and $42.8 million and (iii) 80% of losses in excess of $42.8 million. Pursuant to the terms of the loss share agreements for the Chestatee acquisition, the FDIC will reimburse the Bank for 80% of losses.
The loss share agreements applicable to single family residential mortgage loans and related foreclosed real estate provide for FDIC loss sharing and the Bank’s reimbursement to the FDIC for recoveries of covered losses for ten years from the date on which each applicable loss share agreement was entered. The loss share agreements applicable to commercial loans and related foreclosed real estate provide for FDIC loss sharing for five years from the date on which each applicable loss share agreement was entered and the Bank’s reimbursement to the FDIC for recoveries of covered losses for an additional three years thereafter.
To the extent that actual losses incurred by the Bank are less than (i) $65 million on the Unity assets covered under the loss share agreements, (ii) $107 million on the Woodlands assets covered under the loss share agreements, (iii) $60 million on the Horizon assets covered under the loss share agreements and (iv) $66 million on the Chestatee assets covered under the loss share agreements, the Bank may be required to reimburse the FDIC under the clawback provisions of the loss share agreements. At December 31, 2010 the covered loans and covered ORE and the related FDIC loss share receivable (collectively, the “covered assets”) and the FDIC clawback payable were reported at the net present value of expected future amounts to be paid or received.
A summary of the covered assets and the FDIC clawback payable is as follows:
Covered Assets and FDIC Clawback Payable
| December 31, 2010 | ||||
| (Dollars in thousands) | ||||
| Covered loans |
$ | 497,545 | ||
| Covered ORE |
31,145 | |||
| FDIC loss share receivable |
153,111 | |||
| Total covered assets |
$ | 681,801 | ||
| FDIC clawback payable |
$ | 7,286 | ||
Purchased loans acquired in a business combination, including covered loans, are recorded at estimated fair value on their purchase date with no carryover of the related allowance for loan and lease losses. In determining the estimated fair value of purchased loans, management considers a number of factors including, among other things, the remaining life of the acquired loans, estimated prepayments, estimated loss ratios, estimated value of the underlying collateral, estimated holding periods, and net present value of cash flows expected to be received. Purchased loans are accounted for in accordance with guidance for certain loans or debt securities acquired in a transfer when the loans have evidence of credit deterioration since origination and it is probable at the date of acquisition that the acquirer will not collect all contractually required principal and interest payments. In determining the acquisition date fair values of purchased loans, management calculates a non-accretable difference (the credit component of the purchased loans) and an accretable difference (the yield component of the purchased loans).
The difference between contractually required payments and the cash flows expected to be collected at acquisition is referred to as the non-accretable difference. Subsequent decreases to the expected cash flows will generally result in a provision for loan and lease losses. Subsequent increases in cash flows will result in a reversal of the provision for loan and lease losses to the extent of prior charges and then an adjustment to accretable yield, which would have a positive impact on interest income.
The accretable difference on purchased loans is the difference between the expected cash flows and the net present value of expected cash flows. Such difference is accreted into earnings using the effective yield method over the term of the loans. In determining the net present value of expected cash flows, the Company used discount rates ranging from 6.0% to 9.5% depending on the risk characteristics of each individual loan or loan pool.
24
The following table presents a summary, by acquisition, of covered loans acquired during 2010 as of the dates of acquisition and changes in such balances during 2010.
Covered Loans
| Unity | Woodlands | Horizon | Chestatee | Total | ||||||||||||||||
| (Dollars in thousands) | ||||||||||||||||||||
| At acquisition date: |
||||||||||||||||||||
| Contractually required principal and interest |
$ | 208,410 | $ | 315,103 | $ | 179,441 | $ | 181,523 | $ | 884,477 | ||||||||||
| Nonaccretable differences |
(53,793 | ) | (82,375 | ) | (52,388 | ) | (42,665 | ) | (231,221 | ) | ||||||||||
| Cash flows expected to be collected |
154,617 | 232,728 | 127,053 | 138,858 | 653,256 | |||||||||||||||
| Accretable difference |
(20,165 | ) | (44,795 | ) | (34,050 | ) | (22,050 | ) | (121,060 | ) | ||||||||||
| Fair value |
134,452 | 187,933 | 93,003 | 116,808 | 532,196 | |||||||||||||||
| Activity in 2010: |
||||||||||||||||||||
| Accretion |
7,436 | 7,144 | 2,222 | 339 | 17,141 | |||||||||||||||
| Transfers to covered ORE |
(2,755 | ) | (2,599 | ) | — | — | (5,354 | ) | ||||||||||||
| Payments received |
(23,786 | ) | (15,356 | ) | (6,339 | ) | (669 | ) | (46,150 | ) | ||||||||||
| Other activity, net |
(364 | ) | 53 | 23 | — | (288 | ) | |||||||||||||
| Total carrying value of covered loans at December 31, 2010 |
$ | 114,983 | $ | 177,175 | $ | 88,909 | $ | 116,478 | $ | 497,545 | ||||||||||
The following table presents a summary, by acquisition, of the carrying value and type of covered loans at December 31, 2010.
Covered Loan Portfolio
| Unity | Woodlands | Horizon | Chestatee | Total | ||||||||||||||||
| (Dollars in thousands) | ||||||||||||||||||||
| Real estate: |
||||||||||||||||||||
| Residential 1-4 family |
$ | 32,699 | $ | 50,411 | $ | 32,351 | $ | 17,772 | $ | 133,233 | ||||||||||
| Non-farm/non-residential |
53,119 | 61,848 | 39,378 | 60,173 | 214,518 | |||||||||||||||
| Construction/land development |
12,435 | 56,734 | 9,476 | 30,509 | 109,154 | |||||||||||||||
| Agricultural |
7,980 | 69 | 999 | 649 | 9,697 | |||||||||||||||
| Multifamily residential |
3,970 | 4,298 | 2,194 | 307 | 10,769 | |||||||||||||||
| Total real estate |
110,203 | 173,360 | 84,398 | 109,410 | 477,371 | |||||||||||||||
| Commercial and industrial |
3,479 | 3,812 | 3,360 | 6,995 | 17,646 | |||||||||||||||
| Consumer |
1,301 | — | — | — | 1,301 | |||||||||||||||
| Agricultural (non-real estate) |
— | — | — | 73 | 73 | |||||||||||||||
| Other |
— | 3 | 1,151 | — | 1,154 | |||||||||||||||
| Total covered loans |
$ | 114,983 | $ | 177,175 | $ | 88,909 | $ | 116,478 | $ | 497,545 | ||||||||||
The following table presents a summary, by acquisition, of changes in the accretable yield on covered loans during 2010.
Accretable Yield on Covered Loans
| Unity | Woodlands | Horizon | Chestatee | Total | ||||||||||||||||
| (Dollars in thousands) | ||||||||||||||||||||
| Accretable yield at date of acquisition |
$ | 20,165 | $ | 44,795 | $ | 34,050 | $ | 22,050 | $ | 121,060 | ||||||||||
| Accretion |
(7,436 | ) | (7,144 | ) | (2,222 | ) | (339 | ) | (17,141 | ) | ||||||||||
| Other activity, net |
(1,593 | ) | (366 | ) | (858 | ) | — | (2,817 | ) | |||||||||||
| Balance at December 31, 2010 |
$ | 11,136 | $ | 37,285 | $ | 30,970 | $ | 21,711 | $ | 101,102 | ||||||||||
The covered ORE is recorded at estimated fair value on the date of acquisition. In estimating the fair value of covered ORE, management considers a number of factors including, among others, appraised value, estimated holding periods, net present value of cash flows expected to be received and estimated selling costs. A discount rate ranging from 8.0% to 9.5% was used to determine the net present value of covered ORE.
25
The following table presents a summary, by acquisition, of covered ORE and activity within covered ORE during 2010.
Covered ORE Activity
| Unity | Woodlands | Horizon | Chestatee | Total | ||||||||||||||||
| (Dollars in thousands) | ||||||||||||||||||||
| At acquisition date: |
||||||||||||||||||||
| Balance on acquired bank’s books |
$ | 20,258 | $ | 12,258 | $ | 8,391 | $ | 31,647 | $ | 72,554 | ||||||||||
| Total expected losses |
(9,265 | ) | (5,897 | ) | (3,678 | ) | (15,960 | ) | (34,800 | ) | ||||||||||
| Discount for net present value of expected cash flows |
(2,134 | ) | (1,332 | ) | (1,030 | ) | (2,281 | ) | (6,777 | ) | ||||||||||
| Fair value |
8,859 | 5,029 | 3,683 | 13,406 | 30,977 | |||||||||||||||
| Activity in 2010: |
||||||||||||||||||||
| Loans transferred to covered ORE |
2,755 | 2,599 | — | — | 5,354 | |||||||||||||||
| Sales of covered ORE |
(3,554 | ) | (1,632 | ) | — | — | (5,186 | ) | ||||||||||||
| Covered ORE at December 31, 2010 |
$ | 8,060 | $ | 5,996 | $ | 3,683 | $ | 13,406 | $ | 31,145 | ||||||||||
The following table presents a summary, by acquisition, of the carrying value and type of covered ORE at December 31, 2010.
Covered ORE
| Unity | Woodlands | Horizon | Chestatee | Total | ||||||||||||||||
| (Dollars in thousands) | ||||||||||||||||||||
| Real estate: |
||||||||||||||||||||
| Residential 1-4 family |
$ | 1,558 | $ | 1,620 | $ | 1,742 | $ | 5,704 | $ | 10,624 | ||||||||||
| Non-farm/non-residential |
1,010 | 274 | 1,516 | 955 | 3,755 | |||||||||||||||
| Construction/land development |
5,092 | 4,102 | 425 | 6,747 | 16,366 | |||||||||||||||
| Total real estate |
7,660 | 5,996 | 3,683 | 13,406 | 30,745 | |||||||||||||||
| Commercial and industrial |
400 | — | — | — | 400 | |||||||||||||||
| Total covered ORE |
$ | 8,060 | $ | 5,996 | $ | 3,683 | $ | 13,406 | $ | 31,145 | ||||||||||
In connection with the Company’s FDIC-assisted acquisitions, the Company has recorded an FDIC loss share receivable to reflect the indemnification provided by the FDIC. Since the indemnified items are covered loans and covered ORE, which are measured at fair value at the date of acquisition, the FDIC loss share receivable is also measured at fair value at the date of acquisition, and is calculated by discounting the cash flows expected to be received from the FDIC. A discount rate of 5.0% was used to determine the net present value of the FDIC loss share receivable. These cash flows are estimated by multiplying estimated losses by the reimbursement rates as set forth in the loss share agreements. The balance of the FDIC loss share receivable is adjusted periodically to reflect changes in expectations of discounted cash flows, expense reimbursements under the loss share agreements and other factors.
26
The following table presents a summary, by acquisition, of the FDIC loss share receivable and the changes in receivable balance during 2010.
FDIC Loss Share Receivable
| Unity | Woodlands | Horizon | Chestatee | Total | ||||||||||||||||
| (Dollars in thousands) | ||||||||||||||||||||
| At acquisition date: |
||||||||||||||||||||
| Expected principal loss on covered assets: |
||||||||||||||||||||
| Covered loans |
$ | 51,590 | $ | 71,765 | $ | 40,537 | $ | 41,996 | $ | 205,888 | ||||||||||
| Covered ORE |
9,265 | 5,897 | 3,678 | 15,960 | 34,800 | |||||||||||||||
| Total expected principal losses |
60,855 | 77,662 | 44,215 | 57,956 | 240,688 | |||||||||||||||
| Estimated loss sharing percentage |
80 | % | 80 | % | 80 | % | 80 | % | 80 | % | ||||||||||
| Estimated recovery from FDIC loss share agreements |
48,684 | 62,130 | 35,372 | 46,365 | 192,551 | |||||||||||||||
| Discount for net present value on FDIC loss share receivable |
(4,537 | ) | (7,303 | ) | (6,283 | ) | (4,293 | ) | (22,416 | ) | ||||||||||
| Net present value of FDIC loss share receivable |
44,147 | 54,827 | 29,089 | 42,072 | 170,135 | |||||||||||||||
| Activity in 2010: |
||||||||||||||||||||
| Accretion income |
1,229 | 1,007 | 331 | — | 2,567 | |||||||||||||||
| Cash received from FDIC |
(15,308 | ) | (4,802 | ) | — | — | (20,110 | ) | ||||||||||||
| Other activity, net |
1,052 | (295 | ) | (238 | ) | — | 519 | |||||||||||||
| FDIC loss share receivable, at estimated net present value, at December 31, 2010 |
$ | 31,120 | $ | 50,737 | $ | 29,182 | $ | 42,072 | $ | 153,111 | ||||||||||
Pursuant to the clawback provisions of the loss share agreements for the FDIC-assisted acquisitions, the Company may be required to reimburse the FDIC should actual losses be less than certain thresholds established in each loss share agreement. The amount of the clawback provision for each acquisition is measured at fair value at the date of acquisition and is calculated as the difference between management’s estimated losses on covered loans and covered ORE and the loss threshold contained in each loss share agreement, multiplied by the applicable clawback provisions contained in each loss share agreement. This clawback amount which is payable to the FDIC upon termination of the applicable loss share agreement is discounted back to net present value using a discount rate of 5.0%. To the extent that actual losses on covered loans and covered ORE are less than estimated losses, the applicable clawback payable to the FDIC upon termination of the loss share agreements will increase. To the extent that actual losses on covered loans and covered ORE are more than estimated losses, the applicable clawback payable to the FDIC upon termination of the loss share agreements will decrease.
The following table presents a summary, by acquisition, of the FDIC clawback payable and changes in the payable during 2010.
FDIC Clawback Payable
| Unity | Woodlands | Horizon | Chestatee | Total | ||||||||||||||||
| (Dollars in thousands) | ||||||||||||||||||||
| At acquisition date: |
||||||||||||||||||||
| Estimated FDIC clawback payable |
$ | 2,612 | $ | 4,935 | $ | 2,380 | $ | 1,778 | $ | 11,705 | ||||||||||
| Discount for net present value on FDIC clawback payable |
(1,046 | ) | (1,905 | ) | (919 | ) | (687 | ) | (4,557 | ) | ||||||||||
| Net present value of FDIC clawback payable |
1,566 | 3,030 | 1,461 | 1,091 | 7,148 | |||||||||||||||
| Activity in 2010: |
||||||||||||||||||||
| Accretion expense |
63 | 63 | 12 | — | 138 | |||||||||||||||
| FDIC clawback payable, at estimated net present value, at December 31, 2010 |
$ | 1,629 | $ | 3,093 | $ | 1,473 | $ | 1,091 | $ | 7,286 | ||||||||||
27
Nonperforming Assets
Nonperforming assets, excluding assets covered by FDIC loss share agreements, consist of (1) nonaccrual loans and leases, (2) accruing loans and leases 90 days or more past due, (3) certain troubled and restructured loans and leases providing for a reduction or deferral of interest or principal because of a deterioration in the financial position of the borrower or lessee and (4) real estate or other assets that have been acquired in partial or full satisfaction of loan or lease obligations or upon foreclosure.
The Company generally places a loan or lease on nonaccrual status when payments are contractually past due 90 days, or earlier when doubt exists as to the ultimate collection of payments. The Company may continue to accrue interest on certain loans or leases contractually past due 90 days or more if such loans or leases are both well secured and in the process of collection. At the time a loan or lease is placed on nonaccrual status, interest previously accrued but uncollected is generally reversed and charged against interest income. Nonaccrual loans and leases are generally returned to accrual status when payments are less than 90 days past due and the Company reasonably expects to collect all payments. If a loan or lease is determined to be uncollectible, the portion of the principal determined to be uncollectible will be charged against the allowance for loan and lease losses. Income on nonaccrual loans or leases is recognized on a cash basis when and if actually collected.
The following table presents information concerning nonperforming assets including nonaccrual and certain restructured loans and leases, foreclosed and repossessed assets held for sale, excluding assets covered by FDIC loss share agreements, for the periods indicated.
Nonperforming Assets
| December 31, | ||||||||||||||||||||
| 2010 | 2009 | 2008 | 2007 | 2006 | ||||||||||||||||
| (Dollars in thousands) | ||||||||||||||||||||
| Nonaccrual loans and leases |
$ | 13,944 | $ | 23,604 | $ | 15,382 | $ | 6,610 | $ | 5,713 | ||||||||||
| Accruing loans and leases 90 days or more past due |
— | — | — | 26 | — | |||||||||||||||
| Troubled and restructured loans and leases(1) |
— | — | — | — | — | |||||||||||||||
| Total nonperforming loans and leases |
13,944 | 23,604 | 15,382 | 6,636 | 5,713 | |||||||||||||||
| Foreclosed and repossessed assets held for sale (2) |
42,216 | 61,148 | 10,758 | 3,112 | 407 | |||||||||||||||
| Total nonperforming assets |
$ | 56,160 | $ | 84,752 | $ | 26,140 | $ | 9,748 | $ | 6,120 | ||||||||||
| Nonperforming loans and leases to total loans and leases(3) |
0.75 | % | 1.24 | % | 0.76 | % | 0.35 | % | 0.34 | % | ||||||||||
| Nonperforming assets to total assets(3) |
1.72 | 3.06 | 0.81 | 0.36 | 0.24 | |||||||||||||||
| (1) | All troubled and restructured loans and leases as of the dates shown were on nonaccrual status and are included as nonaccrual loans and leases in this table. |
| (2) | Foreclosed and repossessed assets held for sale are written down to estimated market value net of estimated selling costs at the time of transfer from the loan and lease portfolio. The values of such assets are reviewed from time to time throughout the holding period with the value adjusted through non-interest expense to the then estimated market value net of estimated selling costs, if lower, until disposition. |
| (3) | Excludes assets covered by FDIC loss share agreements, except for their inclusion in total assets. |
While most of the Company’s markets appear to have been less significantly impacted by weaker economic conditions than many markets nationally, the Company has not been immune to the effects of the slower economic conditions and the slow down in housing and other real estate activity.
At December 31, 2010, the Company has reduced the carrying value of its impaired loans and leases (all of which were included in nonaccrual loans and leases) by $8.9 million to the estimated fair value of such loans and leases of $9.8 million. The adjustment to reduce the carrying value of impaired loans and leases to estimated fair value consisted of $6.9 million of partial charge-offs and $2.0 million of specific loan and lease loss allocations.
28
The following table presents information concerning the geographic location of nonperforming assets, excluding assets covered by FDIC loss share agreements, at December 31, 2010. Nonaccrual loans and leases are reported in the physical location of the principal collateral. Foreclosed assets are reported in the physical location of the asset. Repossessions are reported at the physical location where the borrower resided or had its principal place of business at the time of repossession.
Geographic Distribution of Nonperforming Assets
| Nonaccrual Loans and Leases |
Foreclosed and Repossessed Assets Held for Sale |
Total Nonperforming Assets |
||||||||||
| (Dollars in thousands) | ||||||||||||
| Arkansas |
$ | 8,657 | $ | 23,240 | $ | 31,897 | ||||||
| Texas |
1,829 | 18,289 | 20,118 | |||||||||
| North Carolina |
1,717 | — | 1,717 | |||||||||
| South Carolina |
1,633 | — | 1,633 | |||||||||
| All other |
108 | 687 | 795 | |||||||||
| Total |
$ | 13,944 | $ | 42,216 | $ | 56,160 | ||||||
Allowance and Provision for Loan and Lease Losses
The Company’s allowance for loan and lease losses was $40.2 million at December 31, 2010, or 2.17% of total loans and leases, compared with $39.6 million, or 2.08% of total loans and leases, at December 31, 2009, and $29.5 million, or 1.46% of loans and leases, at December 31, 2008. The Company’s allowance for loan and lease losses was equal to 288% of its total nonperforming loans and leases at December 31, 2010 compared to 168% at December 31, 2009 and 192% at December 31, 2008. While the Company believes the current allowance is appropriate, changing economic and other conditions may require future adjustments to the allowance for loan and lease losses.
The amount of provision to the allowance for loan and lease losses is based on the Company’s analysis of the adequacy of the allowance for loan and lease losses utilizing the criteria discussed below. The provision for loan and lease losses for 2010 was $16.0 million compared to $44.8 million in 2009 and $19.0 million in 2008. The Company’s decrease in its provision for loan and lease losses for 2010 compared to 2009 was primarily due to the reduction of net charge-offs in 2010 compared to 2009. The Company’s provision for loan and lease losses and its net charge-offs for 2009 were significantly impacted by the weak economic conditions that existed during 2009.
29
An analysis of the allowance for loan and lease losses for the periods indicated is shown in the following table.
Analysis of the Allowance for Loan and Lease Losses
| Year Ended December 31, | ||||||||||||||||||||
| 2010 | 2009 | 2008 | 2007 | 2006 | ||||||||||||||||
| (Dollars in thousands) | ||||||||||||||||||||
| Balance, beginning of period |
$ | 39,619 | $ | 29,512 | $ | 19,557 | $ | 17,699 | $ | 17,007 | ||||||||||
| Loans and leases charged off: |
||||||||||||||||||||
| Real estate: |
||||||||||||||||||||
| Residential 1-4 family |
872 | 1,619 | 1,079 | 215 | 124 | |||||||||||||||
| Non-farm/non-residential |
1,702 | 3,182 | 552 | 182 | 132 | |||||||||||||||
| Construction/land development |
4,037 | 20,188 | 3,059 | 796 | 58 | |||||||||||||||
| Agricultural |
301 | 844 | 645 | 37 | — | |||||||||||||||
| Multifamily/residential |
133 | 4,355 | 250 | — | — | |||||||||||||||
| Total real estate |
7,045 | 30,188 | 5,585 | 1,230 | 314 | |||||||||||||||
| Commercial and industrial |
6,937 | 3,347 | 1,259 | 1,798 | 872 | |||||||||||||||
| Consumer |
1,196 | 1,303 | 1,783 | 1,046 | 709 | |||||||||||||||
| Direct financing leases |
478 | 648 | 734 | 367 | 63 | |||||||||||||||
| Agricultural (non-real estate) |
1,108 | 399 | 270 | 203 | 107 | |||||||||||||||
| Total loans and leases charged off |
16,764 | 35,885 | 9,631 | 4,644 | 2,065 | |||||||||||||||
| Recoveries of loans and leases previously charged off: |
||||||||||||||||||||
| Real estate: |
||||||||||||||||||||
| Residential 1-4 family |
99 | 99 | 55 | 25 | 5 | |||||||||||||||
| Non-farm/non-residential |
87 | 147 | 76 | 3 | 4 | |||||||||||||||
| Construction/land development |
253 | 82 | 29 | — | 4 | |||||||||||||||
| Agricultural |
45 | — | — | 19 | — | |||||||||||||||
| Multifamily residential |
1 | 1 | — | — | — | |||||||||||||||
| Total real estate |
485 | 329 | 160 | 47 | 13 | |||||||||||||||
| Commercial and industrial |
656 | 566 | 51 | 62 | 47 | |||||||||||||||
| Consumer |
212 | 183 | 317 | 209 | 234 | |||||||||||||||
| Direct financing leases |
20 | 67 | 21 | 27 | 13 | |||||||||||||||
| Agricultural (non-real estate) |
2 | 47 | 12 | 7 | — | |||||||||||||||
| Total recoveries |
1,375 | 1,192 | 561 | 352 | 307 | |||||||||||||||
| Net loans and leases charged off |
15,389 | 34,693 | 9,070 | 4,292 | 1,758 | |||||||||||||||
| Provision charged to operating expense |
16,000 | 44,800 | 19,025 | 6,150 | 2,450 | |||||||||||||||
| Balance, end of period |
$ | 40,230 | $ | 39,619 | $ | 29,512 | $ | 19,557 | $ | 17,699 | ||||||||||
| Net charge-offs to average loans and leases (1) |
0.81 | % | 1.75 | % | 0.45 | % | 0.24 | % | 0.12 | % | ||||||||||
| Allowance for loan and lease losses to total loans and leases (1) |
2.17 | % | 2.08 | % | 1.46 | % | 1.05 | % | 1.06 | % | ||||||||||
| Allowance for loan and lease losses to nonperforming loans and leases (1) |
288 | % | 168 | % | 192 | % | 295 | % | 310 | % | ||||||||||
| (1) | Excludes assets covered by FDIC loss share agreements. |
Provisions to and the adequacy of the allowance for loan and lease losses are based on the Company’s judgment and evaluation of the loan and lease portfolio utilizing objective and subjective criteria. The objective criteria utilized by the Company to assess the adequacy of its allowance for loan and lease losses and required additions to such allowance consists primarily of an internal grading system and specific allowances. The Company also utilizes a peer group analysis and an historical analysis to validate the overall adequacy of its allowance for loan and lease losses. In addition to these objective criteria, the Company subjectively assesses the adequacy of the allowance for loan and lease losses and the need for additions thereto, with consideration given to the nature, mix and volume of the portfolio, overall portfolio quality, review of specific problem loans and leases, national, regional and local business and economic conditions that may affect borrowers’ or lessees’ ability to pay, the value of collateral securing the loans and leases, and other relevant factors.
30
The Company’s internal grading system analysis assigns grades to all loans and leases except residential 1-4 family loans and consumer loans. Graded loans and leases are assigned to one of seven risk grades, with each grade being assigned a specific allowance allocation percentage. The grade for each individual loan or lease is determined by the account officer and other approving officers at the time the loan or lease is made and changed from time to time to reflect an ongoing assessment of loan or lease risk. Grades are reviewed on specific loans and leases from time to time by senior management and as part of the Company’s internal loan review process. Residential 1-4 family and consumer loans are assigned an allowance allocation percentage based on past due status. Allowance allocation percentages for the various risk grades and past due categories are determined by management and are adjusted periodically. In determining these allowance allocation percentages, management considers, among other factors, historical loss percentages for risk-rated loans and leases, residential 1-4 family loans and consumer loans. Additionally, management considers a variety of subjective criteria in determining the allowance allocation percentages.
All loans and leases deemed to be impaired are evaluated individually. The Company considers a loan or lease to be impaired when based on current information and events, it is probable that the Company will be unable to collect all amounts due according to the contractual terms thereof. Most of the Company’s nonaccrual loans and leases and all troubled loans and leases, excluding loans covered by FDIC loss share agreements, that have been restructured from their original contractual terms are considered impaired. The majority of the Company’s impaired loans and leases are dependent upon collateral for repayment. For such loans and leases, impairment is measured by comparing collateral value, net of holding and selling costs, to the current investment in the loan or lease. For all other impaired loans and leases, the Company compares estimated discounted cash flows to the current investment in the loan or lease. To the extent that the Company’s current investment in a particular loan or lease exceeds its estimated net collateral value or its estimated discounted cash flows, the impaired amount is (i) specifically considered in the determination of the allowance for loan and lease losses or (ii) immediately charged off as a reduction of the allowance for loan and lease losses.
The Company also maintains reserves for certain loans and leases not considered impaired where (i) the customer is continuing to make regular payments, although payments may be past due, (ii) there is a reasonable basis to believe the customer may continue to make regular payments, although there is also an elevated risk that the customer may default, and (iii) the collateral or other repayment sources are likely to be insufficient to recover the current investment in the loan or lease if a default occurs. The Company evaluates such loans and leases to determine if a reserve is needed for these loans and leases. For the purpose of calculating the amount of such reserve, management assumes that (i) no further regular payments occur and (ii) all sums recovered will come from liquidation of collateral and collection efforts from other payment sources. To the extent that the Company’s current investment in a particular loan or lease evaluated for the need for such reserve exceeds its net collateral value or its estimated discounted cash flows, such excess is considered allocated reserve for purposes of the determination of the allowance for loan and lease losses.
The Company also includes further allowance allocation for risk-rated and certain other loans, including commercial real estate loans and excluding loans covered by FDIC loss share agreements, that are in markets determined by management to be “stressed”. Stressed markets may include any specific geography experiencing (i) high unemployment substantially above the U.S. average, (ii) significant over-development in one or more commercial real estate categories, (iii) recent or announced loss of a major employer or significant workforce reductions, (iv) significant declines in real estate values, and (v) various other factors. The additional allowance for such stressed markets compensates for the expectation that a higher risk of loss is anticipated for the “work-out” or liquidation of a real estate loan in a stressed market versus a market that is not experiencing any significant levels of stress. The required allocation percentage applicable to real estate loans in stressed markets may be applied to the total market or it may be determined at the individual loan level based on collateral value, loan-to-value ratios, strength of the borrower and/or guarantor, viability of the underlying project and other factors.
The sum of all allowance amounts derived as described above, combined with a reasonable unallocated allowance determined by management that reflects inherent but undetected losses in the portfolio and imprecision in the allowance methodology, is utilized as the primary indicator of the appropriate level of allowance for loan and lease losses. The portion of the allowance that is not derived by the allowance allocation percentages compensates for the uncertainty and complexity in estimating loan and lease losses, including factors and conditions that may not be fully reflected in the determination and application of the allowance allocation percentages. The factors and conditions evaluated in determining the unallocated
31
portion of the allowance may include the following: (1) general economic and business conditions affecting key lending areas, (2) credit quality trends (including trends in nonperforming loans and leases expected to result from existing conditions), (3) trends that could affect collateral values, (4) seasoning of the loan and lease portfolio, (5) specific industry conditions affecting portfolio segments, (6) recent loss experience in particular segments of the portfolio, (7) concentrations of credit to single borrowers or related borrowers or to specific industries, or in specific collateral types in the loan and lease portfolio, including concentrations of credit in commercial real estate loans, (8) the Company’s expansion into new markets, (9) the offering of new loan and lease products, (10) expectations regarding the current business cycle, (11) bank regulatory examination results and (12) findings of the internal loan review department. At December 31, 2010 management believed it was appropriate to maintain an unallocated portion of the allowance not derived by the allowance allocation percentages that range from 15% to 25% of the total allowance for loan and lease losses.
In addition to the allowance for loan and lease losses methodology described above, the Company compares the allowance for loan and lease losses (as a percentage of total loans and leases) maintained by the Bank to the peer group average percentages as shown on the most recently available FDIC’s Uniform Bank Performance Report and FRB’s Bank Holding Company Performance Report. This comparison is used to validate the overall adequacy of the allowance for loan and lease losses.
Although the Company does not determine the overall allowance based upon the amount of loans or leases in a particular type or category (except in the case of residential 1-4 family and consumer loans), risk elements attributable to particular loan or lease types or categories are considered in assigning loan and lease grades to individual loans and leases. These risk elements include the following: (1) for non-farm/non-residential, multifamily residential, and agricultural real estate loans, the debt service coverage ratio (income from the property in excess of operating expenses compared to loan repayment requirements), operating results of the owner in the case of owner-occupied properties, the loan-to-value ratio, the age, condition, value, nature and marketability of the collateral and the specific risks and volatility of income, property value and operating results typical of properties of that type; (2) for construction and land development loans, the perceived feasibility of the project including the ability to sell developed lots or improvements constructed for resale or ability to lease property constructed for lease, the quality and nature of contracts for presale or preleasing, if any, experience and ability of the developer and loan-to-value ratios; (3) for commercial and industrial loans and leases, the operating results of the commercial, industrial or professional enterprise, the borrower’s or lessee’s business, professional and financial ability and expertise, the specific risks and volatility of income and operating results typical for businesses in the applicable industry and the age, condition, value, nature and marketability of collateral; and (4) for non-real estate agricultural loans and leases, the operating results, experience and ability of the borrower or lessee, historical and expected market conditions and the age, condition, value, nature and marketability of collateral. In addition, for each category the Company considers secondary sources of income and the financial strength of the borrower or lessee and any guarantors.
The board of directors reviews the analysis of the adequacy of the allowance for loan and lease losses on a quarterly basis, or more frequently as needed, to determine whether the amount of monthly provisions are adequate or whether additional provisions should be made to the allowance. While the allowance is determined by (i) management’s assessment and grading of individual loans and leases in the case of loans and leases other than residential 1-4 family loans and consumer loans, (ii) the past due status of residential 1-4 family loans and consumer loans, (iii) allowances made for specific loans and leases and (iv) “stressed” market allocations, the total allowance amount is available to absorb losses across the Company’s entire loan and lease portfolio.
32
The following table sets forth the sum of the amounts of the allowance for loan and lease losses attributable to individual loans and leases, excluding loans covered by FDIC loss share agreements, within each category, or loan and lease categories in general, and the unallocated allowance. The table also reflects the percentage of loans and leases, excluding loans covered by FDIC loss share agreements, in each category to the total portfolio of loans and leases, excluding loans covered by FDIC loss share agreements, for each of the periods indicated. These allowance amounts have been computed using the Company’s internal grading system, specific impairment analyses, specific special reserve analyses and “stressed” markets allocations. The amounts shown are not necessarily indicative of the actual future losses that may occur within particular categories.
Allocation of the Allowance for Loan and Lease Losses
| December 31, | ||||||||||||||||||||||||||||||||||||||||
| 2010 | 2009 | 2008 | 2007 | 2006 | ||||||||||||||||||||||||||||||||||||
| Allowance | % of Loans and Leases |
Allowance | % of Loans and Leases |
Allowance | % of Loans and Leases |
Allowance | % of Loans and Leases |
Allowance | % of Loans and Leases |
|||||||||||||||||||||||||||||||
| (Dollars in thousands) | ||||||||||||||||||||||||||||||||||||||||
| Real estate: |
||||||||||||||||||||||||||||||||||||||||
| Residential 1-4 family |
$ | 2,999 | 14.3 | % | $ | 3,600 | 14.9 | % | $ | 2,170 | 13.6 | % | $ | 2,217 | 14.9 | % | $ | 3,052 | 16.8 | % | ||||||||||||||||||||
| Non-farm/non-residential |
8,313 | 36.5 | 6,574 | 31.9 | 4,396 | 27.3 | 3,470 | 23.8 | 3,085 | 25.9 | ||||||||||||||||||||||||||||||
| Construction/land development |
10,565 | 26.8 | 11,585 | 31.5 | 8,560 | 34.4 | 5,192 | 36.6 | 3,381 | 30.7 | ||||||||||||||||||||||||||||||
| Agricultural |
2,569 | 4.4 | 750 | 4.5 | 745 | 4.2 | 791 | 4.9 | 765 | 5.2 | ||||||||||||||||||||||||||||||
| Multifamily residential |
1,320 | 5.6 | 710 | 2.9 | 1,658 | 3.0 | 198 | 1.7 | 272 | 3.0 | ||||||||||||||||||||||||||||||
| Commercial and industrial |
4,142 | 6.5 | 3,587 | 7.9 | 2,421 | 10.2 | 1,439 | 9.3 | 1,373 | 8.9 | ||||||||||||||||||||||||||||||
| Consumer |
2,051 | 2.9 | 2,599 | 3.4 | 1,894 | 3.7 | 2,280 | 4.7 | 2,179 | 5.1 | ||||||||||||||||||||||||||||||
| Direct financing leases |
1,726 | 2.3 | 1,560 | 2.1 | 808 | 2.5 | 335 | 2.8 | 305 | 3.0 | ||||||||||||||||||||||||||||||
| Agricultural (non-real estate) |
135 | 0.6 | 222 | 0.8 | 137 | 1.0 | 142 | 1.2 | 150 | 1.3 | ||||||||||||||||||||||||||||||
| Other |
66 | 0.1 | 67 | 0.1 | 72 | 0.1 | 65 | 0.1 | 77 | 0.1 | ||||||||||||||||||||||||||||||
| Unallocated allowance |
6,344 | 8,365 | 6,651 | 3,428 | 3,060 | |||||||||||||||||||||||||||||||||||
| Total |
$ | 40,230 | $ | 39,619 | $ | 29,512 | $ | 19,557 | $ | 17,699 | ||||||||||||||||||||||||||||||
The Company maintains an internally classified loan and lease list that, along with the list of nonaccrual loans and leases, the list of impaired loans and leases, the list of loans and leases with specific reserves, and the “stressed” market allocations, helps management assess the overall quality of the loan and lease portfolio and the adequacy of the allowance. Loans and leases classified as “substandard” have clear and defined weaknesses such as highly leveraged positions, unfavorable financial ratios, uncertain repayment sources or poor financial condition which may jeopardize collectability of the loan or lease. Loans and leases classified as “doubtful” have characteristics similar to substandard loans and leases, but also have an increased risk that a loss may occur or at least a portion of the loan or lease may require a charge-off if liquidated. Although loans and leases classified as substandard do not duplicate loans and leases classified as doubtful, both substandard and doubtful loans and leases may include some that are past due at least 90 days, are on nonaccrual status or have been restructured. Loans and leases classified as “loss” are charged off. At December 31, 2010 substandard loans and leases, excluding loans covered by FDIC loss share agreements, not designated as nonaccrual or 90 days past due totaled $35.8 million, compared to $26.1 million at December 31, 2009 and $41.6 million at December 31, 2008. No loans or leases were designated as doubtful or loss at December 31, 2010, 2009 or 2008.
Administration of the Bank’s lending function is the responsibility of the Chief Executive Officer and certain senior lenders. Such officers perform their lending duties subject to the oversight and policy direction of the board of directors and the loan committee. Loan or lease authority is granted to the Chief Executive Officer and certain other senior officers as determined by the board of directors. Loan or lease authorities of other lending officers are assigned by the Chief Executive Officer.
33
Loans or leases and aggregate loan and lease relationships exceeding $3.0 million up to the lending limits established by the Company’s board of directors are authorized by the loan committee. Such limits established by the board of directors stipulate that (i) any loan or lease secured by the same project or collateral shall not exceed $35 million, (ii) all direct and indirect loans and leases to a borrower shall not exceed $45 million, and (iii) all direct, indirect and related debt to any borrower and related interests shall not exceed $50 million. During 2010 the loan committee consisted of five or more directors and two of the Bank’s senior lending officers. The Company’s loan committee reviews various reports of loan and lease concentrations, loan and lease originations and commitments over $100,000, internally classified and watch list loans and leases and various other loan and lease reports. At least quarterly the board of directors reviews summary reports of past due loans and leases and activity in the Company’s allowance for loan and lease losses and various other loan and lease reports.
The Company’s compliance and loan review officers are responsible for the Bank’s compliance and loan review areas. Periodic reviews are scheduled for the purpose of evaluating asset quality and effectiveness of loan and lease administration. The compliance and loan review officers prepare reports which identify deficiencies, establish recommendations for improvement and outline management’s proposed action plan for curing the identified deficiencies. These reports are provided to and reviewed by the Company’s audit committee. Additionally, the reports issued by the Company’s loan review function are provided to and reviewed by the Company’s loan committee.
Investment Securities
At December 31, 2010, 2009 and 2008, the Company classified all of its investment securities portfolio as available for sale. Accordingly, its investment securities are stated at estimated fair value in the consolidated financial statements with the unrealized gains and losses, net of tax, reported as a separate component of stockholders’ equity and included in other comprehensive income (loss).
The Company’s holdings of “other equity securities” include Federal Home Loan Bank of Dallas (“FHLB-Dallas”), Federal Home Loan Bank of Atlanta (“FHLB-Atlanta”) and First National Banker’s Bankshares, Inc. (“FNBB”) shares which do not have readily determinable fair values and are carried at cost.
The following table presents the amortized cost and the fair value of investment securities as of the dates indicated.
Investment Securities
| December 31, | ||||||||||||||||||||||||
| 2010 | 2009 | 2008 | ||||||||||||||||||||||
| Amortized Cost |
Fair Value(1) |
Amortized Cost |
Fair Value(1) |
Amortized Cost |
Fair Value(1) |
|||||||||||||||||||
| (Dollars in thousands) | ||||||||||||||||||||||||
| Obligations of states and political subdivisions |
$ | 378,822 | $ | 378,547 | $ | 385,581 | $ | 393,887 | $ | 517,166 | $ | 542,740 | ||||||||||||
| U.S. Government agency residential mortgage-backed securities |
1,269 | 1,269 | 93,159 | 94,510 | 371,110 | 371,561 | ||||||||||||||||||
| Corporate obligations |
— | — | 1,596 | 1,865 | 6,953 | 6,953 | ||||||||||||||||||
| Collateralized debt obligation |
— | — | 100 | 100 | 1,000 | 683 | ||||||||||||||||||
| Other equity securities |
18,882 | 18,882 | 16,316 | 16,316 | 22,846 | 22,846 | ||||||||||||||||||
| Total |
$ | 398,973 | $ | 398,698 | $ | 496,752 | $ | 506,678 | $ | 919,075 | $ | 944,783 | ||||||||||||
| (1) | The Company utilizes independent third parties as its principal sources for determining fair value of investment securities which are measured on a recurring basis. For investment securities traded in an active market, the fair values are obtained from independent pricing services and are based on quoted market prices if available. If quoted market prices are not available, fair values are based on market prices for comparable securities, broker quotes or comprehensive interest rate tables, pricing matrices or a combination thereof. For investment securities traded in a market that is not active, fair value is determined using unobservable inputs. |
34
The Company’s investment securities portfolio is reported at amortized cost adjusted for unrealized gains and losses and for any impairment charges. At December 31, 2010, unrealized net losses totaled $0.3 million. At December 31, 2009 and 2008, unrealized net gains totaled $9.9 million and $25.7 million, respectively. Management believes that all of its unrealized losses on individual investment securities at December 31, 2010 are the result of fluctuations in interest rates and do not reflect deterioration in the credit quality of its investments. Accordingly management considers these unrealized losses to be temporary in nature. The Company does not have the intent to sell these investment securities and more likely than not would not be required to sell these investment securities before fair value recovers to amortized cost.
At December 31, 2009, the Company’s investment securities portfolio included one security categorized as a CDO. During 2009, the Company determined that it no longer expected to hold this security until maturity or until such time as fair value recovered to or above cost. Accordingly, the Company recorded a $0.9 million charge during 2009 to reduce the carrying value of this security to $0.1 million. This CDO was sold during 2010.
The Company had net gains of $4.5 million from the sale of $251 million of investment securities in 2010 compared to net gains of $27.9 million from the sale of $529 million of investment securities in 2009 and net losses of $0.4 million from the sale of $14 million of investment securities in 2008. The Company also recorded other-than-temporary impairment charges of $0.9 million in 2009 and $3.0 million in 2008 (none in 2010). During 2010, 2009 and 2008, respectively, investment securities totaling $60 million, $247 million and $1.64 billion matured or were called by the issuer. The Company purchased $121 million, $322 million and $1.96 billion, respectively, of investment securities during 2010, 2009 and 2008.
From February through December of 2008, the Company purchased a large volume of tax-exempt investment securities which the Company expected to be relatively temporary investments. The opportunity to acquire these securities at unusually favorable yields was due to unusual market conditions. The interest rates on the majority of these securities reset weekly, resulting in the securities being repurchased or called on a weekly basis. The Company’s volume of these investments had declined to $85 million at December 31, 2008. The remainder of these securities were called or otherwise paid off in the first and second quarters of 2009.
In addition, during the fourth quarter of 2008 and the first quarter of 2009, the Company purchased other investment securities which offered relatively good value at the time of purchase and consisted of tax-exempt mortgage-backed securities issued by housing authorities of states and political subdivisions (“Municipal Housing Authority Bonds”). These Municipal Housing Authority Bonds are primarily backed by single family or multi-family residential mortgages, the repayment of which is guaranteed by the Government National Mortgage Association, Federal National Mortgage Association, Federal Home Loan Mortgage Corporation, U.S. Department of Veterans’ Affairs, Federal Housing Agency or U.S. Department of Agriculture Rural Development.
During 2009, the Company sold most of the Municipal Housing Authority Bonds and, during 2009 and 2010, the Company sold most of its U.S. Government agency residential mortgage-backed securities. This reduction of the Company’s investment securities portfolio was a result of management’s ongoing evaluations of interest rate risk and to free up capital for additional FDIC-assisted acquisitions.
The Company invests in securities it believes offer good relative value at the time of purchase, and it will, from time to time reposition its investment securities portfolio. In making its decisions to sell or purchase securities, the Company considers credit ratings, call features, maturity dates, relative yields, current market factors, interest rate risk and other relevant factors.
35
The following table presents the types and estimated fair values of the Company’s investment securities at December 31, 2010 based on credit ratings by one or more nationally-recognized credit rating agencies.
Credit Ratings of Investment Securities
| AAA(1) | AA(2) | A(3) | BBB(4) | Non-Rated(5) | Total | |||||||||||||||||||
| (Dollars in thousands) |
||||||||||||||||||||||||
| Obligations of states and political subdivisions: |
||||||||||||||||||||||||
| Arkansas |
$ | — | $ | 108,579 | $ | 8,678 | $ | 7,924 | $ | 164,164 | $ | 289,345 | ||||||||||||
| Texas |
1,319 | 26,996 | 16,971 | 9,897 | 11,734 | 66,917 | ||||||||||||||||||
| Pennsylvania |
— | — | — | — | 5,944 | 5,944 | ||||||||||||||||||
| Louisiana |
— | 3,995 | — | — | — | 3,995 | ||||||||||||||||||
| South Carolina |
— | — | — | — | 3,357 | 3,357 | ||||||||||||||||||
| Connecticut |
— | — | 2,619 | — | — | 2,619 | ||||||||||||||||||
| Iowa |
— | — | 2,339 | — | — | 2,339 | ||||||||||||||||||
| Massachusetts |
— | — | — | — | 2,024 | 2,024 | ||||||||||||||||||
| Georgia |
— | 812 | 286 | 598 | — | 1,696 | ||||||||||||||||||
| Alabama |
— | — | — | 256 | — | 256 | ||||||||||||||||||
| Oklahoma |
— | — | — | — | 55 | 55 | ||||||||||||||||||
| U.S. Government agency residential mortgage-backed securities |
1,269 | — | — | — | — | 1,269 | ||||||||||||||||||
| Other equity securities |
— | — | — | — | 18,882 | 18,882 | ||||||||||||||||||
| Total |
$ | 2,588 | $ | 140,382 | $ | 30,893 | $ | 18,675 | $ | 206,160 | $ | 398,698 | ||||||||||||
| Percentage of total |
0.7 | % | 35.2 | % | 7.7 | % | 4.7 | % | 51.7 | % | 100.0 | % | ||||||||||||
| Cumulative percentage of total |
0.7 | % | 35.9 | % | 43.6 | % | 48.3 | % | 100.0 | % | ||||||||||||||
| (1) | Includes securities rated Aaa by Moody’s, AAA by Standard & Poor’s (“S&P”) or a comparable rating by other nationally-recognized credit rating agencies. |
| (2) | Includes securities rated Aa1 to Aa3 by Moody’s, AA+ to AA- by S&P or a comparable rating by other nationally-recognized credit rating agencies. |
| (3) | Includes securities rated A1 to A3 by Moody’s, A+ to A- by S&P or a comparable rating by other nationally-recognized credit rating agencies. |
| (4) | Includes securities rated Baa1 to Baa3 by Moody’s, BBB+ to BBB- by S&P or a comparable rating by other nationally-recognized credit rating agencies. |
| (5) | Includes all securities that are not rated or securities that are not rated but that have a rated credit enhancement where the Company has ignored such credit enhancement. For these securities, the Company has performed its own evaluation of the security and/or the underlying issuer and believes that such security or its issuer would warrant a credit rating of investment grade (i.e., Baa3 or better by Moody’s or BBB- or better by S&P or a comparable rating by another nationally-recognized credit rating agency). |
The following table presents the unaccreted discount and unamortized premium of the Company’s investment securities for the dates indicated.
Unaccreted Discount and Unamortized Premium
| Amortized Cost |
Unaccreted Discount |
Unamortized Premium |
Par Value |
|||||||||||||
| (Dollars in thousands) |
||||||||||||||||
| December 31, 2010: |
||||||||||||||||
| Obligations of states and political subdivisions |
$ | 378,822 | $ | 5,307 | $ | (193 | ) | $ | 383,936 | |||||||
| U.S. Government agency residential mortgage-backed securities |
1,269 | — | (22 | ) | 1,247 | |||||||||||
| Other equity securities |
18,882 | — | — | 18,882 | ||||||||||||
| Total |
$ | 398,973 | $ | 5,307 | $ | (215 | ) | $ | 404,065 | |||||||
| December 31, 2009: |
||||||||||||||||
| Obligations of states and political subdivisions |
$ | 385,581 | $ | 8,796 | $ | (22 | ) | $ | 394,355 | |||||||
| U.S. Government agency residential mortgage-backed securities |
93,159 | 445 | (25 | ) | 93,579 | |||||||||||
| Corporate obligations |
1,596 | 274 | — | 1,870 | ||||||||||||
| Collateralized debt obligation |
100 | 900 | — | 1,000 | ||||||||||||
| Other equity securities |
16,316 | — | — | 16,316 | ||||||||||||
| Total |
$ | 496,752 | $ | 10,415 | $ | (47 | ) | $ | 507,120 | |||||||
36
During 2010, 2009 and 2008, the Company recognized discount accretion, net of premium amortization, of $0.1 million, $4.5 million and $1.0 million, respectively, which is considered an adjustment to the yield of its investment securities.
The following table reflects the expected maturity distribution of the Company’s investment securities, at fair value, as of December 31, 2010 and weighted-average yields (for tax-exempt obligations on a FTE basis) of such securities. The maturity for all investment securities is shown based on each security’s contractual maturity date, except (1) equity securities with no contractual maturity date which are shown in the longest maturity category, (2) U.S. Government agency residential mortgage-backed securities are allocated among various maturities based on an estimated repayment schedule utilizing Bloomberg median prepayment speeds based on interest rate levels at December 31, 2010, and (3) callable investment securities when the Company has received notification of call are included in the maturity category in which the call occurs or is expected to occur. Actual maturities will differ from contractual maturities because issuers may have the right to call or prepay obligations with or without call or prepayment penalties. The weighted-average yields - FTE are calculated based on the coupon rate and amortized cost for such securities and do not include any projected discount accretion or premium amortization.
Expected Maturity Distribution of Investment Securities
| 1 Year or Less |
Over 1 Through 5 Years |
Over 5 Through 10 Years |
Over 10 Years |
Total | ||||||||||||||||
| (Dollars in thousands) |
||||||||||||||||||||
| Obligations of states and political subdivisions |
$ | 3,544 | $ | 17,888 | $ | 21,592 | $ | 335,523 | $ | 378,547 | ||||||||||
| U.S. Government agency residential mortgage-backed securities |
1,264 | 5 | — | — | 1,269 | |||||||||||||||
| Other equity securities(1) |
— | — | — | 18,882 | 18,882 | |||||||||||||||
| Total |
$ | 4,808 | $ | 17,893 | $ | 21,592 | $ | 354,405 | $ | 398,698 | ||||||||||
| Percentage of total |
1.2 | % | 4.5 | % | 5.4 | % | 88.9 | % | 100.0 | % | ||||||||||
| Cumulative percentage of total |
1.2 | % | 5.7 | % | 11.1 | % | 100.0 | % | ||||||||||||
| Weighted-average yield - FTE(2) |
4.80 | % | 6.55 | % | 7.42 | % | 7.31 | % | 7.25 | % | ||||||||||
| (1) | Includes approximately $18.5 million of FHLB-Dallas and FHLB-Atlanta stock which has historically paid quarterly dividends at a variable rate approximating the federal funds rate. |
| (2) | The weighted-average yields - FTE are calculated based on the coupon rate and amortized cost for such securities and do not include any projected discount accretion or premium amortization. |
Deposits
The Company’s lending and investing activities are funded primarily by deposits. The Company’s total deposits increased 25.2% to $2.54 billion at December 31, 2010, compared to $2.03 billion at December 31, 2009. This increase was primarily due to the Company’s four FDIC-assisted acquisitions during 2010.
Over the past two years, the Company has experienced a favorable change in its deposit mix. The Company’s non-CD deposits have grown and comprised 62.9% of total deposits at December 31, 2010, compared to 56.8% at December 31, 2009 and 44.3% at December 31, 2008. Non-CD deposits totaled $1.60 billion at December 31, 2010, compared to $1.15 billion at December 31, 2009 and $1.04 billion at December 31, 2008.
At December 31, 2010, the Company had outstanding brokered deposits of $58 million compared to $57 million at December 31, 2009 and $385 million at December 31, 2008.
37
The following table reflects the average balance and average rate paid for each deposit category shown for the years ended December 31, 2010, 2009 and 2008.
Average Deposit Balances and Rates
| Year Ended December 31, | ||||||||||||||||||||||||
| 2010 | 2009 | 2008 | ||||||||||||||||||||||
| Average Balance |
Average Rate Paid |
Average Balance |
Average Rate Paid |
Average Balance |
Average Rate Paid |
|||||||||||||||||||
| (Dollars in thousands) | ||||||||||||||||||||||||
| Non-interest bearing accounts |
$ | 256,910 | — | $ | 207,782 | — | $ | 184,563 | — | |||||||||||||||
| Interest bearing accounts: |
||||||||||||||||||||||||
| Transaction (NOW) |
574,432 | 0.49 | % | 431,587 | 0.58 | % | 400,145 | 1.18 | % | |||||||||||||||
| Savings and money market |
547,096 | 1.09 | 401,221 | 1.15 | 228,038 | 2.00 | ||||||||||||||||||
| Time deposits less than $100,000 |
392,671 | 1.40 | 409,969 | 2.40 | 516,655 | 3.76 | ||||||||||||||||||
| Time deposits $100,000 or more |
476,748 | 1.22 | 699,281 | 1.93 | 906,306 | 3.91 | ||||||||||||||||||
| Total deposits |
$ | 2,247,857 | $ | 2,149,840 | $ | 2,235,707 | ||||||||||||||||||
The following table sets forth, by time remaining to maturity, time deposits in amounts of $100,000 and over at December 31, 2010.
Maturity Distribution of Time Deposits of $100,000 and Over
| December 31, 2010 | ||||
| (Dollars in thousands) | ||||
| 3 months or less |
$ | 165,006 | ||
| Over 3 to 6 months |
157,336 | |||
| Over 6 to 12 months |
126,440 | |||
| Over 12 months |
35,142 | |||
| Total |
$ | 483,924 | ||
The amount and percentage of the Company’s deposits by state of originating office are reflected in the following table.
Deposits by State of Originating Office
| December 31, | ||||||||||||||||||||||||
| Deposits Attributable to Offices In |
2010 | 2009 | 2008 | |||||||||||||||||||||
| Amount | % | Amount | % | Amount | % | |||||||||||||||||||
| (Dollars in thousands) | ||||||||||||||||||||||||
| Arkansas |
$ | 1,752,977 | 69.0 | % | $ | 1,734,870 | 85.5 | % | $ | 2,032,335 | 86.8 | % | ||||||||||||
| Texas |
455,089 | 17.9 | 294,124 | 14.5 | 309,079 | 13.2 | ||||||||||||||||||
| Georgia |
152,333 | 6.0 | — | — | — | — | ||||||||||||||||||
| Florida |
110,556 | 4.3 | — | — | — | — | ||||||||||||||||||
| South Carolina |
32,861 | 1.3 | — | — | — | — | ||||||||||||||||||
| North Carolina |
19,615 | 0.8 | — | — | — | — | ||||||||||||||||||
| Alabama |
17,322 | 0.7 | — | — | — | — | ||||||||||||||||||
| Total |
$ | 2,540,753 | 100.0 | % | $ | 2,028,994 | 100.0 | % | $ | 2,341,414 | 100.0 | % | ||||||||||||
Other Interest Bearing Liabilities
The Company also relies on other interest bearing liabilities to fund its lending and investing activities. Such liabilities consist of repurchase agreements with customers, other borrowings (primarily FHLB advances and, to a lesser extent, FRB borrowings and federal funds purchased) and subordinated debentures.
Total other interest bearing liabilities were $390 million at December 31, 2010, a decrease of $62 million from $452 million at December 31, 2009. Repurchase agreements with customers decreased 2.1% to $43 million at December 31, 2010 from $44 million at December 31, 2009. Other borrowings, including FHLB advances, FRB borrowings and federal funds purchased, decreased 17.6% to $282 million at December 31, 2010 from $343 million at December 31, 2009. The decrease in total other borrowings was primarily due to the Company’s repayment of $60 million of fixed-rate callable FHLB advances on their maturity dates in May 2010.
38
The following table reflects the average balance and average rate paid for each category of other interest bearing liabilities for the years ended December 31, 2010, 2009 and 2008.
Average Balances and Rates of Other Interest Bearing Liabilities
| Year Ended December 31, | ||||||||||||||||||||||||
| 2010 | 2009 | 2008 | ||||||||||||||||||||||
| Average Balance |
Average Rate Paid |
Average Balance |
Average Rate Paid |
Average Balance |
Average Rate Paid |
|||||||||||||||||||
| (Dollars in thousands) |
||||||||||||||||||||||||
| Repurchase agreements with customers |
$ | 49,835 | 0.76 | % | $ | 52,549 | 1.13 | % | $ | 43,916 | 1.81 | % | ||||||||||||
| Other borrowings(1) |
317,796 | 3.82 | 384,854 | 3.74 | 441,228 | 3.53 | ||||||||||||||||||
| Subordinated debentures |
64,950 | 2.72 | 64,950 | 3.29 | 64,950 | 5.79 | ||||||||||||||||||
| Total other interest bearing liabilities |
$ | 432,581 | 3.30 | % | $ | 502,353 | 3.40 | % | $ | 550,094 | 3.66 | % | ||||||||||||
| (1) | Included in other borrowings at December 31, 2010 are FHLB advances that contain quarterly call features and mature as follows: 2017, $260.0 million at 3.90% weighted-average rate; and 2018, $20.0 million at 2.53% weighted-average rate. |
Capital Resources and Liquidity
Capital Resources
Subordinated Debentures. At December 31, 2010, the Company had an aggregate of $64.9 million of subordinated debentures and related trust preferred securities outstanding consisting of $20.6 million of subordinated debentures and securities issued in 2006 that bear interest, adjustable quarterly, at LIBOR plus 1.60%; $15.4 million of subordinated debentures and securities issued in 2004 that bear interest, adjustable quarterly, at LIBOR plus 2.22%; and $28.9 million of subordinated debentures and securities issued in 2003 that bear interest, adjustable quarterly, at a weighted-average rate of LIBOR plus 2.925%. These subordinated debentures and securities generally mature 30 years after issuance and may be prepaid at par, subject to regulatory approval, on or after approximately five years from the date of issuance, or at an earlier date upon certain changes in tax laws, investment company laws or regulatory capital requirements. These subordinated debentures and the related trust preferred securities provide the Company additional regulatory capital to support its expected future growth and expansion.
Preferred Stock and Common Stock Warrant. On December 12, 2008, as part of the United States Department of the Treasury’s (the “Treasury”) Capital Purchase Program made available to certain financial institutions in the U.S. pursuant to the Emergency Economic Stabilization Act of 2008 (“EESA”), the Company and the Treasury entered into a Letter Agreement including the Securities Purchase Agreement –Standard Terms incorporated therein pursuant to which the Company issued to the Treasury, in exchange for aggregate consideration of $75.0 million, (i) 75,000 shares of the Company’s Fixed Rate Cumulative Perpetual Preferred Stock, Series A, par value $0.01 and liquidation preference $1,000 per share (the “Series A Preferred Stock”), and (ii) a warrant (the “Warrant”) to purchase up to 379,811 shares of the Company’s common stock, par value $0.01 per share, at an exercise price of $29.62 per share. On November 4, 2009, the Company redeemed all of the Series A Preferred Stock for $75.0 million plus accrued and unpaid dividends, with the approval of the Company’s primary regulator in consultation with the Treasury. On November 24, 2009, the Company repurchased the Warrant from the Treasury for $2.65 million, which was charged against the Company’s additional paid-in capital.
Preferred Stock Dividend. The Series A Preferred Stock qualified as Tier 1 capital and paid cumulative cash dividends quarterly at a rate of 5% per annum while it was outstanding. These cash dividends and the amortization of the discount on issuance of the Series A Preferred Stock resulted in total dividends of $0.2 million in 2008 and $3.6 million in 2009 (none during 2010).
Tangible Common Equity. The Company uses its tangible common equity ratio as the principal measure of the strength of its capital. The tangible common equity ratio is calculated by dividing total common equity less intangible assets by total assets less intangible assets. The Company’s tangible common equity ratio was 9.57% at December 31, 2010 compared to 9.53% at December 31, 2009 and 7.64% at December 31, 2008.
Common Stock Dividend Policy. In 2010 the Company paid dividends of $0.60 per share. In 2009 and 2008 the Company paid dividends of $0.52 per share and $0.50 per share, respectively. In 2008, the per share dividend was $0.12 per quarter in the first and second quarters and $0.13 per quarter in the third and fourth quarters. In 2009 the per share dividend was $0.13 in each quarter. In 2010, the per share dividend was $0.14 in the first quarter, $0.15 per quarter in the second and third quarters, and $0.16 in the fourth
39
quarter. On January 3, 2011, the Company’s board of directors approved a dividend of $0.17 per common share that was paid on January 21, 2011. The determination of future dividends on the Company’s common stock will depend on conditions existing at that time.
Capital Compliance
Bank regulatory authorities in the United States impose certain capital standards on all bank holding companies and banks. These capital standards require compliance with certain minimum “risk-based capital ratios” and a minimum “leverage ratio.” The risk-based capital ratios consist of (1) Tier 1 capital (common stockholders’ equity excluding goodwill, certain intangibles and net unrealized gains and losses on available-for-sale investment securities, but including, subject to limitations, trust preferred securities, certain types of preferred stock and other qualifying items) to risk-weighted assets and (2) total capital (Tier 1 capital plus Tier 2 capital which includes the qualifying portion of the allowance for loan and lease losses and the portion of trust preferred securities not counted as Tier 1 capital) to risk-weighted assets. The Tier 1 leverage ratio is measured as Tier 1 capital to adjusted quarterly average assets.
The Company’s consolidated risk-based capital and leverage ratios exceeded these minimum requirements at December 31, 2010 and 2009 and are presented in the following table, followed by the capital ratios of the Bank at December 31, 2010 and 2009.
Consolidated Capital Ratios
| December 31, | ||||||||
| 2010 | 2009 | |||||||
| (Dollars in thousands) | ||||||||
| Tier 1 capital: |
||||||||
| Common stockholders’ equity |
$ | 320,355 | $ | 269,028 | ||||
| Allowed amount of trust preferred securities |
63,000 | 63,000 | ||||||
| Net unrealized losses (gains) on investment securities AFS |
167 | (6,032 | ) | |||||
| Less goodwill and certain intangible assets |
(7,925 | ) | (5,554 | ) | ||||
| Total Tier 1 capital |
375,597 | 320,442 | ||||||
| Tier 2 capital: |
||||||||
| Qualifying allowance for loan and lease losses |
29,241 | 29,207 | ||||||
| Total risk-based capital |
$ | 404,838 | $ | 349,649 | ||||
| Risk-weighted assets |
$ | 2,328,251 | $ | 2,326,185 | ||||
| Adjusted quarterly average assets - fourth quarter |
$ | 3,160,452 | $ | 2,813,053 | ||||
| Ratios at end of period: |
||||||||
| Tier 1 leverage |
11.88 | % | 11.39 | % | ||||
| Tier 1 risk-based capital |
16.13 | 13.78 | ||||||
| Total risk-based capital |
17.39 | 15.03 | ||||||
| Minimum ratio guidelines: |
||||||||
| Tier 1 leverage(1) |
3.00 | % | 3.00 | % | ||||
| Tier 1 risk-based capital |
4.00 | 4.00 | ||||||
| Total risk-based capital |
8.00 | 8.00 | ||||||
| Minimum ratio guidelines to be “well capitalized”: |
||||||||
| Tier 1 leverage |
5.00 | % | 5.00 | % | ||||
| Tier 1 risk-based capital |
6.00 | 6.00 | ||||||
| Total risk-based capital |
10.00 | 10.00 | ||||||
| (1) | Regulatory authorities require institutions to operate at varying levels (ranging from 100-200 bps) above a minimum Tier 1 leverage ratio of 3% depending upon capitalization classification. |
Bank Capital Ratios
| December 31, | ||||||||
| 2010 | 2009 | |||||||
| (Dollars in thousands) | ||||||||
| Stockholders’ equity - Tier 1 capital |
$ | 358,852 | $ | 299,683 | ||||
| Tier 1 leverage ratio |
11.40 | % | 10.72 | % | ||||
| Tier 1 risk-based capital ratio |
15.49 | 12.96 | ||||||
| Total risk-based capital ratio |
16.75 | 14.22 | ||||||
40
Liquidity
Liquidity represents an institution’s ability to provide funds to satisfy demands from depositors, borrowers and other creditors by either converting assets into cash or accessing new or existing sources of incremental funds. Liquidity risk arises from the possibility the Company may be unable to satisfy current or future funding requirements and needs. The ALCO and Investments Committee (“ALCO”), which reports to the board of directors, has primary responsibility for oversight of the Company’s liquidity, funds management, asset/liability (interest rate risk) position and investment portfolio functions.
The objective of managing liquidity risk is to ensure the cash flow requirements resulting from depositor, borrower and other creditor demands are met, as well as operating cash needs of the Company, and the cost of funding such requirements and needs is reasonable. The Company maintains a liquidity risk management policy and a contingency funding plan that include policies and procedures for managing liquidity risk. Generally the Company relies on deposits, loan and lease and covered loan repayments, and repayments of its investment securities as its primary sources of funds. The principal deposit sources utilized by the Company include consumer, commercial and public funds customers in the Company’s markets. The Company has used these funds, together with wholesale deposit sources such as brokered deposits, along with FHLB advances, FRB borrowings, federal funds purchased and other sources of short-term borrowings, to make loans and leases, acquire investment securities and other assets and to fund continuing operations.
Deposit levels may be affected by a number of factors, including rates paid by competitors, general interest rate levels, returns available to customers on alternative investments, general economic and market conditions and other factors. Loan and lease repayments are a relatively stable source of funds but are subject to the borrowers’ and lessees’ ability to repay the loans and leases, which can be adversely affected by a number of factors including changes in general economic conditions, adverse trends or events affecting business industry groups or specific businesses, declines in real estate values or markets, business closings or lay-offs, inclement weather, natural disasters and other factors. Furthermore, loans and leases generally are not readily convertible to cash. Accordingly, the Company may be required from time to time to rely on secondary sources of liquidity to meet loan, lease and deposit withdrawal demands or otherwise fund operations. Such secondary sources include FHLB advances, secured and unsecured federal funds lines of credit from correspondent banks and FRB borrowings.
At December 31, 2010 the Company had substantial unused borrowing availability. This availability was primarily comprised of the following four options: (1) $610 million of available blanket borrowing capacity with the FHLB, (2) $32 million of investment securities available to pledge for federal funds or other borrowings, (3) $92 million of available unsecured federal funds borrowing lines and (4) up to $88 million of available borrowing capacity from borrowing programs of the FRB.
The Company anticipates it will continue to rely primarily on deposits, loan and lease and covered loan repayments, and repayments of its investment securities to provide liquidity. Additionally, where necessary, the sources of borrowed funds described above will be used to augment the Company’s primary funding sources.
Emergency Economic Stabilization Act of 2008 and FDIC Temporary Liquidity Guaranty Program. On October 3, 2008, Congress passed, and the President signed into law, the EESA. The EESA, among other things, included a provision for an increase in the amount of deposits insured by the FDIC from $100,000 to $250,000 through December 31, 2013.
On October 14, 2008, the FDIC announced the Temporary Liquidity Guaranty Program (“TLGP”) that, among other things, provides unlimited deposit insurance on certain transaction accounts. The unlimited deposit insurance covers funds to the extent such funds are not otherwise covered by the existing deposit insurance limit of $250,000 in (i) non-interest bearing transaction deposit accounts and (ii) certain interest bearing transaction deposit accounts where the participating institution agrees to pay interest on such deposits at a rate not to exceed 25 bps. Such covered transaction accounts were initially insured through December 31, 2009 at a fee of 10 bps per annum paid by the Company’s bank subsidiary to the FDIC on deposit amounts in excess of $250,000. In August 2009, the FDIC extended the unlimited deposit insurance through June 30, 2010, and on April 13, 2010, the FDIC extended the deposit insurance through December 31, 2010. The fee payable by the Company to the FDIC to continue participation in this insurance program increased effective January 1, 2010 to 15 bps per annum on deposits in excess of $250,000.
On July 21, 2010, the Dodd-Frank Wall Street Reform and Consumer Protection Act of 2010 (“Dodd-Frank Act”) was signed into law. Among other things, the Dodd-Frank Act provides full deposit insurance with no maximum coverage amount for non-interest bearing transaction accounts for two years beginning
41
December 31, 2010. Participation in this deposit insurance coverage of the Dodd-Frank Act is mandatory for all financial institutions and requires no separate fee assessment to the Bank. Additionally, the Dodd-Frank Act permanently increases the maximum deposit insurance coverage for all other deposit categories to $250,000 retroactive to January 1, 2008.
Sources and Uses of Funds. Net cash provided by operating activities totaled $40 million, $48 million and $46 million, respectively, for 2010, 2009 and 2008. Net cash provided by operating activities is comprised primarily of net income, adjusted for certain non-cash items and for changes in various operating assets and liabilities.
Investing activities provided $493 million in 2010, $476 million in 2009 and used $493 million in 2008. The Company’s primary sources and uses of cash for investing activities include net loan and lease fundings, which provided $38 million in 2010 and $12 million in 2009 and used $174 million in 2008, purchases of premises and equipment which used $17 million, $9 million, and $28 million, respectively, in 2010, 2009 and 2008, and net activity in its investment securities portfolio, which provided $194 million in 2010 and $454 million in 2009, and used $303 million in 2008. The Company received $201 million of cash in connection with its four FDIC-assisted acquisitions in 2010 (none in 2009 and 2008) and received net cash of $73 million from liquidation of covered assets in 2010 (none in 2009 and 2008). During 2010, the Company purchased $10 million of BOLI and invested $5 million in unconsolidated subsidiaries. Proceeds from dispositions of premises and equipment and other assets provided $17 million in 2010, $17 million in 2009 and $8 million in 2008, and proceeds from BOLI death benefits provided $2 million in 2009 and $4 million in 2008 (none in 2010).
Financing activities used $562 million in 2010 and $487 million in 2009 and provided $441 million in 2008. The Company’s primary financing activities include net changes in deposit accounts, which used $441 million in 2010 and $312 million in 2009 and provided $284 million in 2008, and net proceeds from or repayments of other borrowings and repurchase agreements with customers, which used $115 million in 2010 and $85 million in 2009, and provided $89 million in 2008. In addition the Company paid common stock cash dividends of $10 million, $9 million and $8 million, respectively, in 2010, 2009 and 2008, and the Company paid preferred stock cash dividends of $3.4 million 2009 (none in 2008 or 2010). The Company’s financing activities were impacted by $75 million of proceeds received in 2008 from the issuance of Series A Preferred Stock and the Warrant in connection with the Company’s participation in the Treasury’s Capital Purchase Program and the redemption of the Series A Preferred Stock for $75 million in 2009, as well as the repurchase of the Warrant for $2.65 million in 2009.
Contractual Obligations. The following table presents, as of December 31, 2010, significant fixed and determinable contractual obligations to third parties by contractual date with no consideration given to earlier call or prepayment features. Other obligations consist primarily of contractual obligations for capital expenditures, software contracts and various other contractual obligations.
Contractual Obligations
| 1 Year or Less |
Over 1 Through 3 Years |
Over 3 Through 5 Years |
Over 5 Years |
Total | ||||||||||||||||
| (Dollars in thousands) |
||||||||||||||||||||
| Time deposits(1) |
$ | 873,347 | $ | 68,038 | $ | 7,965 | $ | 78 | $ | 949,428 | ||||||||||
| Deposits without a stated maturity(2) |
1,597,827 | — | — | — | 1,597,827 | |||||||||||||||
| Repurchase agreements with customers(1) |
43,324 | — | — | — | 43,324 | |||||||||||||||
| Other borrowings(1) |
13,075 | 21,719 | 21,686 | 299,164 | 355,644 | |||||||||||||||
| Subordinated debentures(1) |
1,906 | 3,471 | 3,466 | 97,408 | 106,251 | |||||||||||||||
| Lease obligations |
978 | 1,903 | 1,310 | 1,795 | 5,986 | |||||||||||||||
| Other obligations |
13,624 | 2,140 | 804 | 15,824 | 32,392 | |||||||||||||||
| Total contractual obligations |
$ | 2,544,081 | $ | 97,271 | $ | 35,231 | $ | 414,269 | $ | 3,090,852 | ||||||||||
| (1) | Includes unpaid interest through the contractual maturity on both fixed and variable rate obligations. The interest included on variable rate obligations is based upon interest rates in effect at December 31, 2010. The contractual amounts to be paid on variable rate obligations are affected by changes in interest rates. Future changes in interest rates could materially affect the contractual amounts to be paid. |
| (2) | Includes interest accrued and unpaid through December 31, 2010. |
42
Off-Balance Sheet Commitments. The following table details the amounts and expected maturities of significant off-balance sheet commitments as of December 31, 2010. Commitments to extend credit do not necessarily represent future cash requirements as these commitments may expire without being drawn.
Off-Balance Sheet Commitments
| 1 Year or Less |
Over 1 Through 3 Years |
Over 3 Through 5 Years |
Over 5 Years |
Total | ||||||||||||||||
| (Dollars in thousands) |
||||||||||||||||||||
| Commitments to extend credit(1) |
$ | 112,370 | $ | 50,885 | $ | 6,718 | $ | 2,131 | $ | 172,104 | ||||||||||
| Standby letters of credit |
4,934 | 775 | 135 | — | 5,844 | |||||||||||||||
| Total commitments |
$ | 117,304 | $ | 51,660 | $ | 6,853 | $ | 2,131 | $ | 177,948 | ||||||||||
| (1) | Includes commitments to extend credit under mortgage interest rate locks of $6.4 million that expire in one year or less. |
Interest Rate Risk
Interest rate risk results from timing differences in the repricing of assets and liabilities or from changes in relationships between interest rate indexes. The Company’s interest rate risk management is the responsibility of the ALCO.
The Company regularly reviews its exposure to changes in interest rates. Among the factors considered are changes in the mix of interest earning assets and interest bearing liabilities, interest rate spreads and repricing periods. Typically, the ALCO reviews on at least a quarterly basis the Company’s relative ratio of rate sensitive assets (“RSA”) to rate sensitive liabilities (“RSL”) and the related cumulative gap for different time periods. However, the primary tool used by ALCO to analyze the Company’s interest rate risk and interest rate sensitivity is an earnings simulation model.
This earnings simulation modeling process projects a baseline net interest income (assuming no changes in interest rate levels) and estimates changes to that baseline net interest income resulting from changes in interest rate levels. The Company relies primarily on the results of this model in evaluating its interest rate risk. This model incorporates a number of factors including: (1) the expected exercise of call features on various assets and liabilities, (2) the expected rates at which various RSA and RSL will reprice, (3) the expected growth in various interest earning assets and interest bearing liabilities and the expected interest rates on such new assets and liabilities, (4) the expected relative movements in different interest rate indexes which are used as the basis for pricing or repricing various assets and liabilities, (5) existing and expected contractual cap and floor rates on various assets and liabilities, (6) expected changes in administered rates on interest bearing transaction, savings, money market and time deposit accounts and the expected impact of competition on the pricing or repricing of such accounts and (7) other relevant factors. Inclusion of these factors in the model is intended to more accurately project the Company’s expected changes in net interest income resulting from interest rate changes. The Company models its change in net interest income assuming interest rates go up 100 bps, up 200 bps, up 300 bps, up 400 bps, down 100 bps and down 200 bps. Based on current conditions, the Company believes that modeling its change in net interest income assuming rates go down 100 bps and down 200 bps is not meaningful. For purposes of this model, the Company has assumed that the change in interest rates phases in over a 12-month period. While the Company believes this model provides a reasonably accurate projection of its interest rate risk, the model includes a number of assumptions and predictions which may or may not be correct and may impact the model results. These assumptions and predictions include inputs to compute baseline net interest income, growth rates, expected changes in administered rates on interest bearing deposit accounts, competition and a variety of other factors that are difficult to accurately predict. Accordingly, there can be no assurance the earnings simulation model will accurately reflect future results.
43
The following table presents the earnings simulation model’s projected impact of a change in interest rates on the projected baseline net interest income for the 12-month period commencing January 1, 2011. This change in interest rates assumes parallel shifts in the yield curve and does not take into account changes in the slope of the yield curve.
Earnings Simulation Model Results
| Change in |
% Change in Projected Baseline Net Interest Income |
|||
| +400 |
(1.1 | )% | ||
| +300 |
(1.5 | ) | ||
| +200 |
(1.5 | ) | ||
| +100 |
(0.8 | ) | ||
| -100 |
Not meaningful | |||
| -200 |
Not meaningful | |||
In the event of a shift in interest rates, the Company may take certain actions intended to mitigate the negative impact to net interest income or to maximize the positive impact to net interest income. These actions may include, but are not limited to, restructuring of interest earning assets and interest bearing liabilities, seeking alternative funding sources or investment opportunities and modifying the pricing or terms of loans and leases and deposits.
Impact of Inflation and Changing Prices
The consolidated financial statements and related notes presented elsewhere in this report have been prepared in accordance with accounting principles generally accepted in the United States. This requires the measurement of financial position and operating results in terms of historical dollars without considering the changes in the relative purchasing power of money over time due to inflation. Unlike most industrial companies, the vast majority of the assets and liabilities of the Company are monetary in nature. As a result, interest rates have a greater impact on the Company’s performance than do the effects of general levels of inflation. Interest rates do not necessarily move in the same direction or to the same extent as the prices of goods and services.
Growth and Expansion
On March 26, 2010 the Company, through the Bank, entered into a purchase and assumption agreement with loss share agreements with the FDIC pursuant to which it acquired substantially all of the assets and assumed substantially all of the deposits and certain other liabilities of Unity with five offices in Georgia, including Cartersville (2), Rome, Adairsville and Calhoun.
On July 16, 2010 the Company, through the Bank, entered into a purchase and assumption agreement with loss share agreements with the FDIC pursuant to which it acquired substantially all of the assets and assumed substantially all of the deposits and certain other liabilities of Woodlands with eight offices, including two in South Carolina, two in North Carolina, one in Georgia, and three in Alabama. Subsequently the Company renegotiated the leases on two offices to eliminate unneeded space. On October 26, 2010 the Company closed four of the former Woodlands’ offices and in December 2010 it relocated two offices. At December 31, 2010, the Company operated one office each in Bluffton, South Carolina; Wilmington, North Carolina; Savannah, Georgia; and Mobile, Alabama.
On September 10, 2010 the Company, through the Bank, entered into a purchase and assumption agreement with loss share agreements with the FDIC pursuant to which it acquired substantially all of the assets and assumed substantially all of the deposits and certain other liabilities of Horizon. On December 23, 2010 the Company closed one of the former Horizon offices such that at December 31, 2010, the Company operated offices in Bradenton (2) and Palmetto, Florida.
On December 17, 2010 the Company, through the Bank, entered into a purchase and assumption agreement with loss share agreements with the FDIC pursuant to which it acquired substantially all of the assets and assumed substantially all of the deposits and certain other liabilities of Chestatee with four offices in Georgia, including Dawsonville (2), Marble Hill and Cumming.
44
The Company expects to continue its growth and de novo branching strategy, although it has slowed the pace of new office openings in recent years. In addition to the 16 offices added in 2010 as a result of the Company’s four FDIC-assisted acquisitions, the Company opened one office in the fourth quarter of 2010 in Benton, Arkansas. At December 31, 2010, the Company conducted operations through 90 offices, including banking offices in Arkansas (66), Georgia (10), Texas (7), Florida (3), North Carolina (1), South Carolina (1), and Alabama (1) and a loan production office in Charlotte, North Carolina.
On January 14, 2011 the Company, through the Bank, entered into a purchase and assumption agreement with loss share agreements with the FDIC pursuant to which it acquired substantially all of the assets and assumed substantially all of the deposits and certain other liabilities of the former Oglethorpe Bank with two offices in Georgia, including Brunswick and St. Simons Island.
The Company expects to open three metro-Dallas offices in the first half of 2011. Opening new offices is subject to availability of suitable sites, hiring qualified personnel, obtaining regulatory and other approvals and many other conditions and contingencies that the Company cannot predict with certainty. The Company may increase or decrease its expected number of new offices as a result of a variety of factors including the Company’s financial results, changes in economic or competitive conditions, strategic opportunities or other factors.
During 2010 the Company spent $17 million on capital expenditures for premises and equipment, including premises and equipment acquired in FDIC-assisted acquisitions. The Company’s capital expenditures for 2011 are expected to be in the range of $13 to $25 million, including progress payments on construction projects expected to be completed in 2011 or 2012, furniture and equipment costs, acquisition of sites for future development and premises and equipment acquired in FDIC-assisted acquisitions. Actual expenditures may vary significantly from those expected, depending on the number and cost of additional branch offices acquired or constructed and sites acquired for future development, progress or delays encountered on ongoing and new construction projects, delays in or inability to obtain required approvals, potential premises and equipment expenditures associated with FDIC-assisted acquisitions, if any, and other factors.
Critical Accounting Policies
The preparation of financial statements in conformity with accounting principles generally accepted in the United States requires management to make estimates, assumptions and judgments that affect the amounts reported in the consolidated financial statements. The Company’s determination of (i) the provisions to and the adequacy of the allowance for loan and lease losses, (ii) the fair value of its investment securities portfolio, (iii) the fair value of foreclosed and repossessed assets held for sale and (iv) the fair value of the assets acquired and liabilities assumed pursuant to business combination transactions, including the Company’s FDIC-assisted acquisitions, all involve a higher degree of judgment and complexity than its other significant accounting policies. Accordingly, the Company considers the determination of (i) the adequacy of the allowance for loan and lease losses, (ii) the fair value of its investment securities portfolio, (iii) the fair value of foreclosed and repossessed assets held for sale and (iv) the fair value of the assets acquired and liabilities assumed pursuant to business combination transactions to be critical accounting policies.
Provisions to and adequacy of the allowance for loan and lease losses. Provisions to and the adequacy of the allowance for loan and lease losses are based on the Company’s evaluation of the loan and lease portfolio utilizing objective and subjective criteria as described in this report. See the “Analysis of Financial Condition” section of this Management’s Discussion and Analysis for a detailed discussion of the Company’s allowance for loan and lease losses. Changes in the criteria used in this evaluation or the availability of new information could cause the allowance to be increased or decreased in future periods. In addition bank regulatory agencies, as part of their examination process, may require adjustments to the allowance for loan and lease losses based on their judgments and estimates.
Fair value of the investment securities portfolio. The Company has classified all of its investment securities as AFS. Accordingly, its investment securities are stated at estimated fair value in the consolidated financial statements with unrealized gains and losses, net of related income taxes, reported as a separate component of stockholders’ equity and any related changes are included in accumulated other comprehensive income (loss).
The Company utilizes independent third parties as its principal sources for determining fair value of its investment securities that are measured on a recurring basis. For investment securities traded in an active market, the fair values are based on quoted market prices if available. If quoted market prices are not available, fair values are based on market prices for comparable securities, broker quotes or comprehensive interest rate tables, pricing matrices or a combination thereof. For investment securities traded in a market that is not active, fair value is determined using unobservable inputs.
45
The fair values of the Company’s investment securities traded in both active and inactive markets can be volatile and may be influenced by a number of factors including market interest rates, prepayment speeds, discount rates, credit quality of the issuer, general market conditions including market liquidity conditions and other factors. Factors and conditions are constantly changing and fair values could be subject to material variations that may significantly impact the Company’s financial condition, results of operations and liquidity.
Fair value of foreclosed and repossessed assets held for sale. Repossessed personal properties and real estate acquired through or in lieu of foreclosure are measured on a non-recurring basis and are initially recorded at the lesser of current principal investment or fair value less estimated cost to sell at the date of repossession or foreclosure. Valuations of these assets are periodically reviewed by management with the carrying value of such assets adjusted through non-interest expense to the then estimated fair value net of estimated selling costs, if lower, until disposition. Fair values of foreclosed and repossessed assets held for sale are generally based on third party appraisals, broker price opinions or other valuations of the property.
Fair value of assets acquired and liabilities assumed pursuant to business combination transactions. Assets acquired and liabilities assumed in business combinations are recorded at estimated fair value on their purchase date. Purchased loans acquired in a business combination, including covered loans, are recorded at estimated fair value with no carryover of the related allowance for loan and lease losses. In determining the estimated fair value of purchased loans, management considers a number of factors including, among other things, the remaining life of the acquired loans, estimated prepayments, estimated loss ratios, estimated value of the underlying collateral, estimated holding periods, and net present value of cash flows expected to be received. Purchased loans are accounted for in accordance with guidance for certain loans or debt securities acquired in a transfer when the loans have evidence of credit deterioration since origination and it is probable at the date of acquisition that the acquirer will not collect all contractually acquired principal and interest payments. In determining the acquisition date fair values of purchased loans, management calculates a non-accretable difference (the credit component of the purchased loans) and an accretable difference (the yield component of the purchased loans).
The difference between contractually acquired payments and the cash flows expected to be collected at acquisition is referred to as the non-accretable difference. Subsequent decreases to the expected cash flows will generally result in a provision for loan and lease losses. Subsequent increases in cash flows will result in a reversal of the provision for loan and lease losses to the extent of prior charges and then an adjustment to accretable yield, which would have a positive impact on interest income.
The accretable difference on purchased loans is the difference between the expected cash flows and the net present value of expected cash flows. Such difference is accreted into earnings using the effective yield method over the term of the loans. In determining the net present value of expected cash flows, the Company uses discount rates ranging from 6.0% to 9.5% depending on the risk characteristics of each loan or loan pool.
The estimated fair value of covered ORE and the FDIC loss share receivable are based on the net present value of expected future cash proceeds. The discount rates used are derived from current market rates and reflect the level of inherent risk in the assets. The expected cash flows are determined based on contractual terms, expected performance, default timing assumptions, property appraisals and other factors.
The fair values of investment securities acquired in business combinations are generally based on quoted market prices, broker quotes, comprehensive interest rate tables or pricing matrices or a combination thereof. The fair value of assumed liabilities in business combinations on their date of purchase is generally the amount payable by the Company necessary to completely satisfy the assumed obligation.
Recently Issued Accounting Standards
See Note 1 to the Consolidated Financial Statements for a discussion of certain recently issued accounting pronouncements.
46
Forward-Looking Information
This Management’s Discussion and Analysis of Financial Condition and Results of Operations, other filings made by the Company with the Securities and Exchange Commission and other oral and written statements or reports by the Company and its management include certain forward-looking statements including, without limitation, statements about economic, real estate market, competitive, employment, credit market and interest rate conditions; plans, goals, beliefs, expectations, thoughts, estimates and outlook for the future; revenue growth; net income and earnings per common share; net interest margin; net interest income; non-interest income, including service charges on deposit accounts, mortgage lending and trust income, gains (losses) on investment securities and sales of other assets; gains on FDIC-assisted transactions; non-interest expense; efficiency ratio; anticipated future operating results and financial performance; asset quality, including the effects of current economic and real estate market conditions; nonperforming loans and leases; nonperforming assets; net charge-offs; net charge-off ratio; provision for loan and lease losses; past due loans and leases; litigation; interest rate sensitivity, including the effects of possible interest rate changes; future growth and expansion opportunities including plans for making additional FDIC-assisted acquisitions and plans for opening new offices; opportunities and goals for future market share growth; expected capital expenditures; loan, lease and deposit growth; changes in covered assets; changes in the volume, yield and value of the Company’s investment securities portfolio; availability of unused borrowings and other similar forecasts and statements of expectation. Words such as “anticipate,” “believe,” “estimate,” “expect,” “intend,” “plan,” “look,” “seek,” “may,” “will,” “could,” “trend,” “target,” “goal,” and similar expressions, as they relate to the Company or its management, identify forward-looking statements. Forward-looking statements made by the Company and its management are based on estimates, projections, beliefs, plans and assumptions of management at the time of such statements and are not guarantees of future performance. The Company disclaims any obligation to update or revise any forward-looking statement based on the occurrence of future events, the receipt of new information or otherwise.
Actual future performance, outcomes and results may differ materially from those expressed in forward-looking statements made by the Company and its management due to certain risks, uncertainties and assumptions. Certain factors that may affect operating results of the Company include, but are not limited to, potential delays or other problems in implementing the Company’s growth and expansion strategy including delays in identifying satisfactory sites, hiring qualified personnel, obtaining regulatory or other approvals, obtaining permits and designing, constructing and opening new offices; the ability to enter into additional FDIC-assisted transactions; the ability to attract new deposits, loans and leases; the ability to generate future revenue growth or to control future growth in non-interest expense; interest rate fluctuations, including changes in the yield curve between short-term and long-term interest rates; competitive factors and pricing pressures, including their effect on the Company’s net interest margin; general economic, unemployment, credit market and real estate market conditions, including their effect on the creditworthiness of borrowers and lessees, collateral values, the value of investment securities and asset recovery values, including the value of the FDIC loss share receivable and related covered assets; changes in legal and regulatory requirements; changes in regular or special assessments by the FDIC for deposit insurance; recently enacted and potential legislation and regulatory actions, including legislation intended to stabilize economic conditions and credit markets, increase regulation of the financial services industry and protect homeowners or consumers; changes in U.S. government monetary and fiscal policy; adoption of new accounting standards or changes in existing standards; and adverse results in future litigation as well as other factors described in this and other Company reports and statements. Should one or more of the foregoing risks materialize, or should underlying assumptions prove incorrect, actual results or outcomes may vary materially from those described in the forward-looking statements.
47
Summary of Quarterly Results of
Operations, Market Prices of Common Stock and Dividends
Unaudited
| 2010 - Three Months Ended | ||||||||||||||||
| Mar. 31 | June 30 | Sept. 30 | Dec. 31 | |||||||||||||
| (Dollars in thousands, except per share amounts) | ||||||||||||||||
| Total interest income |
$ | 36,213 | $ | 38,580 | $ | 41,092 | $ | 42,087 | ||||||||
| Total interest expense |
(9,020 | ) | (8,851 | ) | (8,324 | ) | (8,142 | ) | ||||||||
| Net interest income |
27,193 | 29,729 | 32,768 | 33,945 | ||||||||||||
| Provision for loan and lease losses |
(4,200 | ) | (3,400 | ) | (4,300 | ) | (4,100 | ) | ||||||||
| Non-interest income |
17,365 | 9,127 | 25,183 | 18,646 | ||||||||||||
| Non-interest expense |
(17,471 | ) | (21,110 | ) | (23,565 | ) | (25,274 | ) | ||||||||
| Income taxes |
(6,944 | ) | (3,488 | ) | (9,878 | ) | (6,303 | ) | ||||||||
| Noncontrolling interest |
11 | 32 | 17 | 17 | ||||||||||||
| Net income available to common stockholders |
$ | 15,954 | $ | 10,890 | $ | 20,225 | $ | 16,931 | ||||||||
| Per common share: |
||||||||||||||||
| Earnings - diluted |
$ | 0.94 | $ | 0.64 | $ | 1.19 | $ | 0.99 | ||||||||
| Cash dividends |
0.14 | 0.15 | 0.15 | 0.16 | ||||||||||||
| Bid price per common share: |
||||||||||||||||
| Low |
$ | 28.66 | $ | 33.64 | $ | 34.40 | $ | 37.02 | ||||||||
| High |
35.53 | 39.46 | 39.27 | 44.50 | ||||||||||||
| 2009 - Three Months Ended | ||||||||||||||||
| Mar. 31 | June 30 | Sept. 30 | Dec. 31 | |||||||||||||
| (Dollars in thousands, except per share amounts) | ||||||||||||||||
| Total interest income |
$ | 45,262 | $ | 42,586 | $ | 39,904 | $ | 38,157 | ||||||||
| Total interest expense |
(14,928 | ) | (12,324 | ) | (10,672 | ) | (9,662 | ) | ||||||||
| Net interest income |
30,334 | 30,262 | 29,232 | 28,495 | ||||||||||||
| Provision for loan and lease losses |
(10,600 | ) | (21,100 | ) | (7,500 | ) | (5,600 | ) | ||||||||
| Non-interest income |
9,373 | 22,610 | 5,810 | 13,257 | ||||||||||||
| Non-interest expense |
(16,187 | ) | (17,945 | ) | (15,499 | ) | (19,001 | ) | ||||||||
| Income taxes |
(2,537 | ) | (3,250 | ) | (2,599 | ) | (4,472 | ) | ||||||||
| Noncontrolling interest |
(23 | ) | — | 25 | 17 | |||||||||||
| Preferred stock dividends and amortization of preferred stock discount |
(1,074 | ) | (1,076 | ) | (1,078 | ) | (3,048 | ) | ||||||||
| Net income available to common stockholders |
$ | 9,286 | $ | 9,501 | $ | 8,391 | $ | 9,648 | ||||||||
| Per common share: |
||||||||||||||||
| Earnings - diluted |
$ | 0.55 | $ | 0.56 | $ | 0.50 | $ | 0.57 | ||||||||
| Cash dividends |
0.13 | 0.13 | 0.13 | 0.13 | ||||||||||||
| Bid price per common share: |
||||||||||||||||
| Low |
$ | 17.05 | $ | 19.88 | $ | 21.20 | $ | 22.27 | ||||||||
| High |
29.43 | 26.25 | 26.76 | 29.78 | ||||||||||||
See Note 18 to Consolidated Financial Statements for discussion of dividend restrictions.
48
Company Performance
The graph below shows a comparison for the period commencing December 31, 2005 through December 31, 2010 of the cumulative total stockholder returns (assuming reinvestment of dividends) for the common stock of the Company, the S&P Smallcap Index and the NASDAQ Financial Index, assuming a $100 investment on December 31, 2005.
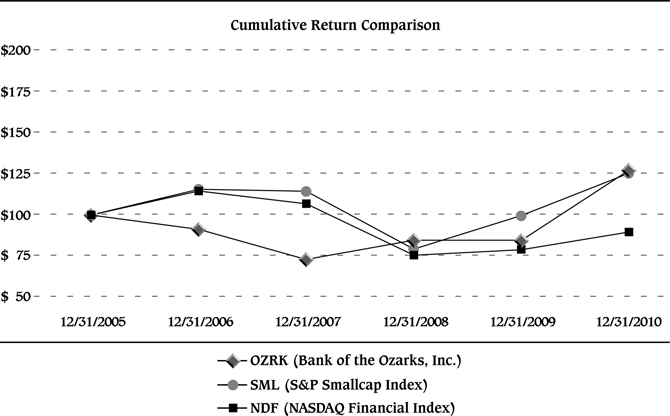
| 12/31/2005 | 12/31/2006 | 12/31/2007 | 12/31/2008 | 12/31/2009 | 12/31/2010 | |||||||||||||||||||
| OZRK (Bank of the Ozarks, Inc.) |
$ | 100 | $ | 91 | $ | 73 | $ | 84 | $ | 84 | $ | 126 | ||||||||||||
| SML (S&P Smallcap Index) |
$ | 100 | $ | 115 | $ | 114 | $ | 79 | $ | 99 | $ | 125 | ||||||||||||
| NDF (NASDAQ Financial Index) |
$ | 100 | $ | 114 | $ | 106 | $ | 75 | $ | 78 | $ | 89 | ||||||||||||
49
Report of Management on the Company’s
Internal Control Over Financial Reporting
March 10, 2010
Management of Bank of the Ozarks, Inc. is responsible for establishing and maintaining adequate internal control over financial reporting. Internal control over financial reporting is a process designed to provide reasonable assurance regarding the reliability of financial reporting and the preparation of financial statements for external purposes in accordance with accounting principles generally accepted in the United States. Internal control over financial reporting includes those policies and procedures that (1) pertain to the maintenance of records that, in reasonable detail, accurately and fairly reflect the transactions and dispositions of assets; (2) provide reasonable assurance that transactions are recorded as necessary to permit preparation of financial statements in accordance with accounting principles generally accepted in the United States, and that receipts and expenditures are made only in accordance with authorizations of management and directors; and (3) provide reasonable assurance regarding prevention or timely detection of unauthorized acquisition, use, or disposition of assets that could have a material effect on the financial statements.
Because of its inherent limitations, internal control over financial reporting may not prevent or detect misstatements. A control system, no matter how well conceived and operated, can provide only reasonable, not absolute, assurance that the objectives of the control system are met. Because of the inherent limitations in all control systems, no evaluation of controls can provide absolute assurance that all control issues and instances of fraud, if any, have been detected. Also, projections of any evaluation of effectiveness to future periods are subject to the risk that controls may become inadequate because of changes in conditions, or that the degree of compliance with the policies and procedures may deteriorate.
Management of Bank of the Ozarks, Inc., including the Chief Executive Officer and the Chief Financial Officer and Chief Accounting Officer, has assessed the Company’s internal control over financial reporting as of December 31, 2010, based on criteria for effective internal control over financial reporting described in “Internal Control – Integrated Framework” issued by the Committee of Sponsoring Organizations of the Treadway Commission. As permitted by SEC guidance, management excluded from its assessment the FDIC-assisted acquisitions described in Notes 2 and 3 to the Consolidated Financial Statements. The assets acquired in these acquisitions consist primarily of “covered assets” which comprised approximately 21% of total consolidated assets at December 31, 2010. Based on this assessment, management has concluded that the Company’s internal control over financial reporting was effective as of December 31, 2010, based on the specified criteria.
The effectiveness of Bank of the Ozarks, Inc.’s internal control over financial reporting has been audited by Crowe Horwath LLP, an independent registered public accounting firm, as stated in their report which is included herein.
|
|
| |
| George Gleason | Greg McKinney | |
| Chairman and Chief Executive Officer | Chief Financial Officer and Chief Accounting Officer |


50
Report of Independent Registered Public Accounting Firm
Board of Directors and Shareholders
Bank of the Ozarks, Inc.
We have audited Bank of the Ozarks, Inc.’s internal control over financial reporting as of December 31, 2010, based on criteria established in Internal Control-Integrated Framework issued by the Committee of Sponsoring Organizations of the Treadway Commission (the COSO criteria). Bank of the Ozarks, Inc.’s management is responsible for maintaining effective internal control over financial reporting, and for its assessment of the effectiveness of internal control over financial reporting, included in the accompanying Report of Management on the Company’s Internal Control Over Financial Reporting. Our responsibility is to express an opinion on the Company’s internal control over financial reporting based on our audit.
We conducted our audit in accordance with the standards of the Public Company Accounting Oversight Board (United States). Those standards require that we plan and perform the audit to obtain reasonable assurance about whether effective internal control over financial reporting was maintained in all material respects. Our audit included obtaining an understanding of internal control over financial reporting, assessing the risk that a material weakness exists, testing and evaluating the design and operating effectiveness of internal control based on the assessed risk, and performing such other procedures as we considered necessary in the circumstances. We believe that our audit provides a reasonable basis for our opinion.
A company’s internal control over financial reporting is a process designed to provide reasonable assurance regarding the reliability of financial reporting and the preparation of financial statements for external purposes in accordance with generally accepted accounting principles. A company’s internal control over financial reporting includes those policies and procedures that (1) pertain to the maintenance of records that, in reasonable detail, accurately and fairly reflect the transactions and dispositions of the assets of the company; (2) provide reasonable assurance that transactions are recorded as necessary to permit preparation of financial statements in accordance with generally accepted accounting principles and that receipts and expenditures of the company are being made only in accordance with authorizations of management and directors of the company; and (3) provide reasonable assurance regarding prevention or timely detection of unauthorized acquisition, use, or disposition of the company’s assets that could have a material effect on the financial statements.
Because of its inherent limitations, internal control over financial reporting may not prevent or detect misstatements. Also, projections of any evaluation of effectiveness to future periods are subject to the risk that controls may become inadequate because of changes in conditions, or that the degree of compliance with the policies or procedures may deteriorate.
As permitted, the Company excluded the operations of the four financial institutions aquired during 2010, which are described in Note 2 of the consolidated financial statements, from the scope of management’s report on internal control over financial reporting. As such, they have also been excluded from the scope of our audit of internal control over financial reporting.
In our opinion, Bank of the Ozarks, Inc. maintained, in all material respects, effective internal control over financial reporting as of December 31, 2010, based on the COSO criteria.
We also have audited, in accordance with the standards of the Public Company Accounting Oversight Board (United States), the consolidated balance sheet of Bank of the Ozarks, Inc. as of December 31, 2010, and the related consolidated statements of income, stockholders’ equity and cash flows for the year ended December 31, 2010, and our report dated March 10, 2011, expressed an unqualified opinion thereon.

Brentwood, Tennessee
March 10, 2011
51
Report of Independent Registered Public Accounting Firm
Board of Directors and Shareholders
Bank of the Ozarks, Inc.
We have audited the accompanying consolidated balance sheets of Bank of the Ozarks, Inc. (the “Company”) as of December 31, 2010 and 2009 and the related consolidated statements of income, stockholders’ equity, and cash flows for each of the three years in the period ended December 31, 2010. These financial statements are the responsibility of the Company’s management. Our responsibility is to express an opinion on these financial statements based on our audits.
We conducted our audits in accordance with the standards of the Public Company Accounting Oversight Board (United States). Those standards require that we plan and perform the audit to obtain reasonable assurance about whether the financial statements are free of material misstatement. An audit includes examining, on a test basis, evidence supporting the amounts and disclosures in the financial statements. An audit also includes assessing the accounting principles used and significant estimates made by management, as well as evaluating the overall financial statement presentation. We believe that our audits provide a reasonable basis for our opinion.
In our opinion, the consolidated financial statements referred to above present fairly, in all material respects, the financial position of Bank of the Ozarks, Inc. at December 31, 2010 and 2009 and the results of its operations and its cash flows for each of the three years in the period ended December 31, 2010, in conformity with accounting principles generally accepted in the United States.
We also have audited, in accordance with the standards of the Public Company Accounting Oversight Board (United States), Bank of the Ozarks, Inc.’s internal control over financial reporting as of December 31, 2010, based on criteria established in Internal Control-Integrated Framework issued by the Committee of Sponsoring Organizations of the Treadway Commission and our report dated March 10, 2011, expressed an unqualified opinion thereon.

Brentwood, Tennessee
March 10, 2011
52
Bank of the Ozarks, Inc.
CONSOLIDATED BALANCE SHEETS
| December 31, | ||||||||
| 2010 | 2009 | |||||||
| (Dollars in thousands, except per share amounts) | ||||||||
| ASSETS |
||||||||
| Cash and due from banks |
$ | 48,024 | $ | 77,678 | ||||
| Interest earning deposits |
1,005 | 616 | ||||||
| Cash and cash equivalents |
49,029 | 78,294 | ||||||
| Investment securities - available for sale (“AFS”) |
398,698 | 506,678 | ||||||
| Loans and leases, excluding covered loans |
1,856,429 | 1,904,104 | ||||||
| Allowance for loan and lease losses |
(40,230 | ) | (39,619 | ) | ||||
| Net loans and leases |
1,816,199 | 1,864,485 | ||||||
| Covered assets: |
||||||||
| Loans |
497,545 | — | ||||||
| Other real estate owned |
31,145 | — | ||||||
| Federal Deposit Insurance Corporation (“FDIC”) loss share receivable |
153,111 | — | ||||||
| Premises and equipment, net |
170,497 | 156,204 | ||||||
| Foreclosed and repossessed assets held for sale, net |
42,216 | 61,148 | ||||||
| Accrued interest receivable |
13,899 | 14,760 | ||||||
| Bank owned life insurance |
59,771 | 47,421 | ||||||
| Intangible assets, net |
7,925 | 5,554 | ||||||
| Other, net |
33,624 | 36,267 | ||||||
| Total assets |
$ | 3,273,659 | $ | 2,770,811 | ||||
| LIABILITIES AND STOCKHOLDERS’ EQUITY |
||||||||
| Deposits: |
||||||||
| Demand non-interest bearing |
$ | 298,585 | $ | 223,741 | ||||
| Savings and interest bearing transaction |
1,299,058 | 927,977 | ||||||
| Time |
943,110 | 877,276 | ||||||
| Total deposits |
2,540,753 | 2,028,994 | ||||||
| Repurchase agreements with customers |
43,324 | 44,269 | ||||||
| Other borrowings |
282,139 | 342,553 | ||||||
| Subordinated debentures |
64,950 | 64,950 | ||||||
| Accrued interest payable and other liabilities |
18,723 | 17,575 | ||||||
| Total liabilities |
2,949,990 | 2,498,341 | ||||||
| Commitments and contingencies |
||||||||
| Stockholders’ equity: |
||||||||
| Preferred stock; $0.01 par value; 1,000,000 shares authorized: no shares outstanding at December 31, 2010 and 2009 |
— | — | ||||||
| Common stock; $0.01 par value; 50,000,000 shares authorized; 17,053,640 and 16,904,540 shares issued and outstanding at December 31, 2010 and 2009, respectively |
170 | 169 | ||||||
| Additional paid-in capital |
45,278 | 41,584 | ||||||
| Retained earnings |
275,074 | 221,243 | ||||||
| Accumulated other comprehensive income (loss) |
(167 | ) | 6,032 | |||||
| Total stockholders’ equity before noncontrolling interest |
320,355 | 269,028 | ||||||
| Noncontrolling interest |
3,415 | 3,442 | ||||||
| Total stockholders’ equity |
323,770 | 272,470 | ||||||
| Total liabilities and stockholders’ equity |
$ | 3,273,659 | $ | 2,770,811 | ||||
See accompanying notes to the consolidated financial statements.
53
Bank of the Ozarks, Inc.
CONSOLIDATED STATEMENTS OF INCOME
| Year Ended December 31, | ||||||||||||
| 2010 | 2009 | 2008 | ||||||||||
| (Dollars in thousands, except per share amounts) | ||||||||||||
| Interest income: |
||||||||||||
| Loans and leases |
$ | 118,150 | $ | 125,301 | $ | 141,726 | ||||||
| Covered loans |
17,141 | — | — | |||||||||
| Investment securities: |
||||||||||||
| Taxable |
4,130 | 18,314 | 21,858 | |||||||||
| Tax-exempt |
18,533 | 22,283 | 19,406 | |||||||||
| Deposits with banks and federal funds sold |
18 | 10 | 13 | |||||||||
| Total interest income |
157,972 | 165,908 | 183,003 | |||||||||
| Interest expense: |
||||||||||||
| Deposits |
20,047 | 30,480 | 64,171 | |||||||||
| Repurchase agreements with customers |
380 | 592 | 796 | |||||||||
| Other borrowings |
12,146 | 14,375 | 15,574 | |||||||||
| Subordinated debentures |
1,764 | 2,138 | 3,761 | |||||||||
| Total interest expense |
34,337 | 47,585 | 84,302 | |||||||||
| Net interest income |
123,635 | 118,323 | 98,701 | |||||||||
| Provision for loan and lease losses |
16,000 | 44,800 | 19,025 | |||||||||
| Net interest income after provision for loan and lease losses |
107,635 | 73,523 | 79,676 | |||||||||
| Non-interest income: |
||||||||||||
| Service charges on deposit accounts |
15,156 | 12,421 | 12,007 | |||||||||
| Mortgage lending income |
3,863 | 3,312 | 2,215 | |||||||||
| Trust income |
3,406 | 3,078 | 2,595 | |||||||||
| Bank owned life insurance income |
2,151 | 3,186 | 4,131 | |||||||||
| Gains (losses) on investment securities |
4,544 | 26,982 | (3,433 | ) | ||||||||
| Gains (losses) on sales of other assets |
802 | (177 | ) | (544 | ) | |||||||
| Gains on FDIC-assisted transactions |
35,019 | — | — | |||||||||
| Accretion of FDIC loss share receivable, net of amortization of FDIC clawback payable |
2,429 | — | — | |||||||||
| Other |
2,952 | 2,249 | 2,378 | |||||||||
| Total non-interest income |
70,322 | 51,051 | 19,349 | |||||||||
| Non-interest expense: |
||||||||||||
| Salaries and employee benefits |
40,161 | 31,847 | 30,132 | |||||||||
| Net occupancy and equipment |
10,618 | 9,740 | 8,882 | |||||||||
| Other operating expenses |
36,640 | 27,045 | 15,395 | |||||||||
| Total non-interest expense |
87,419 | 68,632 | 54,409 | |||||||||
| Income before taxes |
90,538 | 55,942 | 44,616 | |||||||||
| Provision for income taxes |
26,614 | 12,859 | 9,926 | |||||||||
| Net income |
63,924 | 43,083 | 34,690 | |||||||||
| Net loss attributable to noncontrolling interest |
77 | 19 | 11 | |||||||||
| Preferred stock dividends and amortization of preferred stock discount |
— | (6,276 | ) | (227 | ) | |||||||
| Net income available to common stockholders |
$ | 64,001 | $ | 36,826 | $ | 34,474 | ||||||
| Basic earnings per common share |
$ | 3.77 | $ | 2.18 | $ | 2.05 | ||||||
| Diluted earnings per common share |
$ | 3.75 | $ | 2.18 | $ | 2.04 | ||||||
See accompanying notes to the consolidated financial statements.
54
Bank of the Ozarks, Inc.
CONSOLIDATED STATEMENTS OF STOCKHOLDERS’ EQUITY
| Preferred Stock— Series A |
Common Stock |
Additional Paid-In Capital |
Retained Earnings |
Accumulated Other Comprehensive Income (Loss) |
Non- Controlling Interest |
Total | ||||||||||||||||||||||
| (Dollars in thousands, except per share amounts) | ||||||||||||||||||||||||||||
| Balances - January 1, 2008 |
$ | — | $ | 168 | $ | 38,613 | $ | 167,139 | $ | (15,091 | ) | $ | 3,432 | $ | 194,261 | |||||||||||||
| Comprehensive income: |
||||||||||||||||||||||||||||
| Net income |
— | — | — | 34,690 | — | — | 34,690 | |||||||||||||||||||||
| Net loss attributable to noncontrolling interest |
— | — | — | 11 | — | (11 | ) | — | ||||||||||||||||||||
| Other comprehensive income (loss): |
||||||||||||||||||||||||||||
| Unrealized gains/losses on investment securities AFS, net of $18,478 tax effect |
— | — | — | — | 28,628 | — | 28,628 | |||||||||||||||||||||
| Reclassification of gains/losses included in net income, net of $1,346 tax effect |
— | — | — | — | 2,087 | — | 2,087 | |||||||||||||||||||||
| Total comprehensive income |
65,405 | |||||||||||||||||||||||||||
| Common stock dividends paid, $0.50 per share |
— | — | — | (8,418 | ) | — | — | (8,418 | ) | |||||||||||||||||||
| Issuance of 75,000 shares of preferred stock and a warrant for 379,811 shares of common stock |
71,851 | — | 3,149 | — | — | — | 75,000 | |||||||||||||||||||||
| Preferred stock dividends |
— | — | — | (198 | ) | — | — | (198 | ) | |||||||||||||||||||
| Amortization of preferred stock discount |
29 | — | — | (29 | ) | — | — | — | ||||||||||||||||||||
| Issuance of 45,900 shares of common stock for exercise of stock options |
— | 1 | 407 | — | — | — | 408 | |||||||||||||||||||||
| Tax (expense) benefit on exercise and forfeiture of stock options |
— | — | 283 | — | — | — | 283 | |||||||||||||||||||||
| Stock-based compensation expense |
— | — | 862 | — | — | — | 862 | |||||||||||||||||||||
| Balances - December 31, 2008 |
71,880 | 169 | 43,314 | 193,195 | 15,624 | 3,421 | 327,603 | |||||||||||||||||||||
| Comprehensive income: |
||||||||||||||||||||||||||||
| Net income |
— | — | — | 43,083 | — | — | 43,083 | |||||||||||||||||||||
| Net loss attributable to noncontrolling interest |
— | — | — | 19 | — | (19 | ) | — | ||||||||||||||||||||
| Other comprehensive income (loss): |
||||||||||||||||||||||||||||
| Unrealized gains/losses on investment securities AFS, net of $4,393 tax effect |
— | — | — | — | 6,806 | — | 6,806 | |||||||||||||||||||||
| Reclassification of gains/losses included in net income, net of $10,584 tax effect |
— | — | — | — | (16,398 | ) | — | (16,398 | ) | |||||||||||||||||||
| Total comprehensive income |
33,491 | |||||||||||||||||||||||||||
| Common stock dividends paid, $0.52 per share |
— | — | — | (8,778 | ) | — | — | (8,778 | ) | |||||||||||||||||||
| Preferred stock dividends |
— | — | — | (3,156 | ) | — | — | (3,156 | ) | |||||||||||||||||||
| Amortization of preferred stock discount |
463 | — | — | (463 | ) | — | — | — | ||||||||||||||||||||
| Redemption of 75,000 shares of preferred stock |
(72,343 | ) | — | — | (2,657 | ) | — | — | (75,000 | ) | ||||||||||||||||||
| Repurchase of a warrant for 379,811 shares of common stock |
— | — | (2,650 | ) | — | — | — | (2,650 | ) | |||||||||||||||||||
| Issuance of 21,800 shares of common stock for exercise of stock options |
— | — | 258 | — | — | — | 258 | |||||||||||||||||||||
| Tax (expense) benefit on exercise and forfeiture of stock options |
— | — | (50 | ) | — | — | — | (50 | ) | |||||||||||||||||||
| Stock-based compensation expense |
— | — | 712 | — | — | — | 712 | |||||||||||||||||||||
| Noncontrolling interest cash contribution |
— | — | — | — | — | 40 | 40 | |||||||||||||||||||||
| Issuance of 18,600 shares of unvested common stock under restricted stock plan |
— | — | — | — | — | — | — | |||||||||||||||||||||
| Balances - December 31, 2009 |
— | 169 | 41,584 | 221,243 | 6,032 | 3,442 | 272,470 | |||||||||||||||||||||
55
Bank of the Ozarks, Inc.
CONSOLIDATED STATEMENTS OF STOCKHOLDERS’ EQUITY (continued)
| Preferred Stock— Series A |
Common Stock |
Additional Paid-In Capital |
Retained Earnings |
Accumulated Other Comprehensive Income (Loss) |
Non- Controlling Interest |
Total | ||||||||||||||||||||||
| (Dollars in thousands, except per share amounts) | ||||||||||||||||||||||||||||
| Balances - December 31, 2009 |
$ | — | $ | 169 | $ | 41,584 | $ | 221,243 | $ | 6,032 | $ | 3,442 | $ | 272,470 | ||||||||||||||
| Comprehensive income: |
||||||||||||||||||||||||||||
| Net income |
— | — | — | 63,924 | — | — | 63,924 | |||||||||||||||||||||
| Net loss attributable to noncontrolling interest |
— | — | — | 77 | — | (77 | ) | — | ||||||||||||||||||||
| Other comprehensive income (loss): |
||||||||||||||||||||||||||||
| Unrealized gains/losses on investment securities AFS, net of $2,218 tax effect |
— | — | — | — | (3,437 | ) | — | (3,437 | ) | |||||||||||||||||||
| Reclassification of gains/losses included in net income, net of $1,783 tax effect |
— | — | — | — | (2,762 | ) | — | (2,762 | ) | |||||||||||||||||||
| Total comprehensive income |
57,725 | |||||||||||||||||||||||||||
| Common stock dividends paid, $0.60 per share |
— | — | — | (10,170 | ) | — | — | (10,170 | ) | |||||||||||||||||||
| Issuance of 113,800 shares of common stock for exercise of stock options |
— | 1 | 2,824 | — | — | — | 2,825 | |||||||||||||||||||||
| Tax (expense) benefit on exercise and forfeiture of stock options |
— | — | 37 | — | — | — | 37 | |||||||||||||||||||||
| Stock-based compensation expense |
— | — | 833 | — | — | — | 833 | |||||||||||||||||||||
| Noncontrolling interest cash contribution |
— | — | — | — | — | 50 | 50 | |||||||||||||||||||||
| Issuance of 37,300 shares of unvested common stock under restricted stock plan |
— | — | — | — | — | — | — | |||||||||||||||||||||
| Forfeiture of 2,000 shares of unvested common stock under restricted stock plan |
— | — | — | — | — | — | — | |||||||||||||||||||||
| Balances - December 31, 2010 |
$ | — | $ | 170 | $ | 45,278 | $ | 275,074 | $ | (167 | ) | $ | 3,415 | $ | 323,770 | |||||||||||||
See accompanying notes to the consolidated financial statements.
56
Bank of the Ozarks, Inc.
CONSOLIDATED STATEMENTS OF CASH FLOWS
| Year Ended December 31, | ||||||||||||
| 2010 | 2009 | 2008 | ||||||||||
| (Dollars in thousands) | ||||||||||||
| Cash flows from operating activities: |
||||||||||||
| Net income |
$ | 63,924 | $ | 43,083 | $ | 34,690 | ||||||
| Adjustments to reconcile net income to net cash provided by operating activities: |
||||||||||||
| Depreciation |
4,471 | 4,172 | 3,552 | |||||||||
| Amortization |
431 | 110 | 214 | |||||||||
| Net loss attributable to noncontrolling interest |
77 | 19 | 11 | |||||||||
| Provision for loan and lease losses |
16,000 | 44,800 | 19,025 | |||||||||
| Provision for losses on foreclosed assets |
8,960 | 4,009 | 1,042 | |||||||||
| Write down of other assets |
— | 1,639 | 520 | |||||||||
| Net accretion of investment securities AFS |
(585 | ) | (4,466 | ) | (1,008 | ) | ||||||
| Net (gains) losses on investment securities AFS |
(4,544 | ) | (26,982 | ) | 3,433 | |||||||
| Originations and purchases of mortgage loans held for sale |
(188,120 | ) | (185,075 | ) | (127,822 | ) | ||||||
| Proceeds from sales of mortgage loans held for sale |
180,371 | 184,195 | 127,873 | |||||||||
| Net accretion of covered loans |
(17,141 | ) | — | — | ||||||||
| Accretion of FDIC loss share receivable, net of FDIC clawback payable |
(2,429 | ) | — | — | ||||||||
| (Gains) losses on dispositions of premises and equipment, foreclosed and repossessed assets and other assets |
(802 | ) | 177 | 544 | ||||||||
| Gains on FDIC-assisted transactions |
(35,019 | ) | — | — | ||||||||
| Deferred income tax expense (benefit) |
8,195 | (1,706 | ) | (6,146 | ) | |||||||
| Increase in cash surrender value of bank owned life insurance (“BOLI”) |
(2,151 | ) | (1,932 | ) | (1,984 | ) | ||||||
| Current tax benefit on exercise of stock options |
(535 | ) | (111 | ) | (283 | ) | ||||||
| Stock-based compensation expense |
833 | 712 | 862 | |||||||||
| BOLI death benefits in excess of cash surrender value |
— | (1,254 | ) | (2,147 | ) | |||||||
| Changes in assets and liabilities: |
||||||||||||
| Accrued interest receivable |
1,430 | 4,117 | (1,392 | ) | ||||||||
| Other assets, net |
6,103 | (12,598 | ) | (3,993 | ) | |||||||
| Accrued interest payable and other liabilities |
1,015 | (4,946 | ) | (909 | ) | |||||||
| Net cash provided by operating activities |
40,484 | 47,963 | 46,082 | |||||||||
| Cash flows from investing activities: |
||||||||||||
| Proceeds from sales of investment securities AFS |
255,232 | 528,542 | 13,588 | |||||||||
| Proceeds from maturities/calls/paydowns of investment securities AFS |
59,887 | 246,888 | 1,642,437 | |||||||||
| Purchases of investment securities AFS |
(121,086 | ) | (321,925 | ) | (1,959,464 | ) | ||||||
| Net paydowns (fundings) of portfolio loans and leases |
38,195 | 12,293 | (173,987 | ) | ||||||||
| Net cash flow from covered assets |
73,161 | — | — | |||||||||
| Net cash proceeds received in FDIC-assisted acquisitions |
201,473 | — | — | |||||||||
| Purchases of premises and equipment |
(16,881 | ) | (9,199 | ) | (27,901 | ) | ||||||
| Proceeds from disposition of premises and equipment, foreclosed and repossessed assets and other assets |
17,310 | 17,438 | 8,186 | |||||||||
| Proceeds from BOLI death benefits |
— | 2,149 | 3,894 | |||||||||
| Purchase of BOLI |
(10,200 | ) | — | — | ||||||||
| Net investment in unconsolidated investments and noncontrolling interest |
(4,575 | ) | (15 | ) | (192 | ) | ||||||
| Net cash provided (used) by investing activities |
492,516 | 476,171 | (493,439 | ) | ||||||||
| Cash flows from financing activities: |
||||||||||||
| Net (decrease) increase in deposits |
(440,624 | ) | (312,420 | ) | 284,353 | |||||||
| Net (repayments of) proceeds from other borrowings |
(113,948 | ) | (82,394 | ) | 88,414 | |||||||
| Net (decrease) increase in repurchase agreements with customers |
(833 | ) | (2,595 | ) | 778 | |||||||
| Proceeds from exercise of stock options |
2,825 | 258 | 408 | |||||||||
| Proceeds from issuance of preferred stock and common stock warrant |
— | — | 75,000 | |||||||||
| Redemption of preferred stock |
— | (75,000 | ) | — | ||||||||
| Repurchase of common stock warrant |
— | (2,650 | ) | — | ||||||||
| Current tax benefits on exercise of stock options |
535 | 111 | 283 | |||||||||
| Cash dividends paid on common stock |
(10,170 | ) | (8,778 | ) | (8,418 | ) | ||||||
| Cash dividends paid on preferred stock |
— | (3,354 | ) | — | ||||||||
| Net cash (used) provided by financing activities |
(562,265 | ) | (486,822 | ) | 440,818 | |||||||
| Net (decrease) increase in cash and cash equivalents |
(29,265 | ) | 37,312 | (6,539 | ) | |||||||
| Cash and cash equivalents - beginning of year |
78,294 | 40,982 | 47,521 | |||||||||
| Cash and cash equivalents - end of year |
$ | 49,029 | $ | 78,294 | $ | 40,982 | ||||||
See accompanying notes to the consolidated financial statements.
57
Bank of the Ozarks, Inc.
Notes to Consolidated Financial Statements
December 31, 2010, 2009 and 2008
1. Summary of Significant Accounting Policies
Organization — Bank of the Ozarks, Inc. (the “Company”) is a bank holding company headquartered in Little Rock, Arkansas, which operates under the rules and regulations of the Board of Governors of the Federal Reserve System. The Company owns a wholly-owned state chartered bank subsidiary — Bank of the Ozarks (the “Bank”), four 100%-owned finance subsidary business trusts — Ozark Capital Statutory Trust II (“Ozark II”), Ozark Capital Statutory Trust III (“Ozark III”), Ozark Capital Statutory Trust IV (“Ozark IV”) and Ozark Capital Statutory Trust V (“Ozark V”) (collectively, the “Trusts”) and, indirectly through the Bank, a subsidary engaged in the development of real estate. The Bank is subject to the regulation of certain federal and state agencies and undergoes periodic examinations by those regulatory authorities. At December 31, 2010, the Company had 90 offices, including 66 in Arkansas, 10 in Georgia, seven in Texas, three in Florida, two in North Carolina and one each in South Carolina and Alabama.
Basis of presentation, use of estimates and principles of consolidation — The preparation of financial statements in conformity with accounting principles generally accepted in the United States (“GAAP”) requires management to make estimates, assumptions and judgments that affect the amounts reported in the consolidated financial statements and accompanying notes. Actual results could differ from those estimates. The consolidated financial statements include the accounts of the Company, the Bank and the real estate investment subsidiary. Significant intercompany transactions and amounts have been eliminated.
Subsidiaries in which the Company has majority voting interest (principally defined as owning a voting or economic interest greater than 50%) or where the Company exercises control over the operating and financial policies of the subsidiary through an operating agreement or other means are consolidated. Investments in companies in which the Company has significant influence over voting and financing decisions (principally defined as owning a voting or economic interest of 20% to 50%) and investments in limited partnerships and limited liability companies where the Company does not exercise control over the operating and financial policies are generally accounted for by the equity method of accounting. Investments in limited partnerships and limited liability companies in which the Company’s interest is so minor such that it has virtually no influence over operating and financial policies are generally accounted for by the cost method of accounting.
The voting interest approach is not applicable for entities that are not controlled through voting interests or in which the equity investors do not bear the residual economic risk. In such instances, management makes a determination, based on its review of applicable GAAP, on when the assets, liabilities and activities of a variable interest entity (“VIE”) should be included in the Company’s consolidated financial statements. GAAP requires a VIE to be consolidated by a company if that company is considered the primary beneficiary of the VIE’s activities. The Company has determined that the 100%-owned finance subsidiary Trusts are VIEs, but that the Company is not the primary beneficiary of the Trusts. Accordingly, the Company does not consolidate the activities of the Trusts into its financial statements, but instead reports its ownership interests in the Trusts as other assets and reports the subordinated debentures issued to the Trusts as a liability in the consolidated balance sheets. The distributions on the subordinated debentures are reported as interest expense in the accompanying consolidated statements of income.
Cash and cash equivalents — For cash flow purposes, cash and cash equivalents include cash on hand, amounts due from banks and interest bearing deposits with banks.
Investment securities — Management determines the appropriate classification of investment securities at the time of purchase and reevaluates such designation as of each balance sheet date. At December 31, 2010 and 2009, the Company has classified all of its investment securities as available for sale (“AFS”).
AFS investment securities are stated at estimated fair value, with the unrealized gains and losses determined on a specific identification basis. Such unrealized gains and losses, net of tax, are reported as a separate component of stockholders’ equity and included in other comprehensive income (loss). The Company utilizes independent third parties as its principal pricing sources for determining fair value of investment securities which are measured on a recurring basis. For investment securities traded in an active market, fair values are obtained from an independent pricing service and based on quoted market prices if available. If quoted market prices are not available, fair values are based on quoted market prices of comparable securities, broker quotes or comprehensive interest rate tables, pricing matrices or a combination thereof. For investment securities traded in a market that is not active, fair value is determined using unobservable inputs.
58
At December 31, 2010 and 2009, the Company owned stock in the Federal Home Loan Bank of Dallas (“FHLB-Dallas”), Federal Home Loan Bank of Atlanta (“FHLB-Atlanta”) and First National Banker’s Bankshares, Inc. (“FNBB”). The FHLB-Dallas, FHLB-Atlanta and FNBB shares do not have readily determinable fair values and are carried at cost.
Declines in the fair value of investment securities below their amortized cost are reviewed at least quarterly by the Company for other-than-temporary impairment. Factors considered during such review include, among other things, the length of time and extent that fair value has been less than cost and the financial condition and near term prospects of the issuer. The Company also assesses whether it has the intent to sell the investment security or more likely than not would be required to sell the investment security before any anticipated recovery in fair value. If either of the criteria regarding intent or requirement to sell is met, the entire difference between amortized cost and fair value is recognized as impairment through the income statement. For securities that do not meet the aforementioned criteria, the amount of impairment is split into (i) other-than-temporary impairment related to credit loss, which must be recognized in the income statement, and (ii) other-than-temporary impairment related to other factors, which is recognized in other comprehensive income. The credit loss is defined as the difference between the present value of the cash flows expected to be collected and the amortized cost basis.
Interest and dividends on investment securities, including the amortization of premiums and accretion of discounts through maturity, or in the case of mortgage-backed securities, over the estimated life of the security, are included in interest income. Realized gains or losses on the sale of investment securities are recognized on the specific identification method at the time of sale and are included in non-interest income. Purchases and sales of investment securities are recognized on a trade-date basis.
Loans and leases — Loans, excluding loans covered by Federal Deposit Insurance Corporation (“FDIC”) loss share agreements, that management has the intent and ability to hold for the foreseeable future or until maturity or payoff are reported at their outstanding principal balance adjusted for any charge-offs, deferred fees or costs on originated loans, and unamortized premiums or discounts on purchased loans. Interest on loans is recognized on an accrual basis and is calculated using the simple interest method on daily balances of the principal amount outstanding. Loan origination fees and costs are generally deferred and recognized over the life of the loan as an adjustment to yield on the related loan.
Leases are classified as either direct financing leases or operating leases, based on the terms of the agreement. Direct financing leases are reported as the sum of (i) total future lease payments to be received, net of unearned income, and (ii) estimated residual value of the leased property. Operating leases are recorded at the cost of the leased property, net of accumulated depreciation. Income on direct financing leases is included in interest income and is recognized on a basis that achieves a constant periodic rate of return on the outstanding investment. Income on operating leases is recognized as non-interest income on a straight-line basis over the lease term.
In the ordinary course of business, the Company has entered into off-balance sheet financial instruments consisting of commitments to extend credit and letters of credit. Such financial instruments are recorded in the financial statements when they are funded. Related fees are generally recognized when collected.
Mortgage loans held for sale are included in the Company’s loans and leases and totaled $14.3 million and $6.6 million, respectively, at December 31, 2010 and 2009. Mortgage loans held for sale are carried at the lower of cost or fair value. Gains and losses from the sales of mortgage loans are the difference between the selling price of the loan and its carrying value, net of discounts and points, and are recognized as mortgage lending income when the loan is sold to investors and servicing rights are released.
As part of its standard mortgage lending practice, the Company issues a written put option, in the form of an interest rate lock commitment (“IRLC”), such that the interest rate on the mortgage loan is established prior to funding. In addition to the IRLC, the Company enters into a forward sale commitment (“FSC”) for the sale of its mortgage loan originations to reduce its market risk on such originations in process. The IRLC on mortgage loans held for sale and the FSC have been determined to be derivatives as defined by GAAP. Accordingly, the fair values of derivative assets and liabilities for the Company’s IRLC and FSC are based primarily on the fluctuation of interest rates between the date on which the particular IRLC and FSC were entered into and year-end. At December 31, 2010 and 2009, respectively, the Company had recorded IRLC and FSC derivative assets of $0.1 million and $0.2 million and had recorded corresponding derivative liabilities of $0.1 million and $0.2 million. The notional amounts of loan commitments under both the IRLC and FSC were $6.4 million and $8.9 million at December 31, 2010 and 2009, respectively.
Covered loans — Loans comprise the majority of the assets acquired in the Company’s four FDIC-assisted acquisitions during 2010. All such acquired loans, excluding $5.6 million of acquired consumer loans, are subject to loss share agreements with the FDIC whereby the Bank is indemnified against a portion of the losses on those loans (“covered loans”).
59
Purchased loans acquired in a business combination, including covered loans, are recorded at estimated fair value on their purchase date with no carryover of the related allowance for loan and lease losses. In determining the estimated fair value of purchased loans, management considers a number of factors including, among other things, the remaining life of the acquired loans, estimated prepayments, estimated loss ratios, estimated value of the underlying collateral, estimated holding periods and net present value of cash flows expected to be received. Purchased loans are accounted for in accordance with guidance for certain loans or debt securities acquired in a transfer when the loans have evidence of credit deterioration since origination and it is probable at the date of acquisition that the acquirer will not collect all contractually required principal and interest payments. In determining the acquisition date fair values of purchased loans, the Company calculates a non-accretable difference (the credit component of the purchased loans fair value adjustment) and an accretable difference (the yield component of the purchased loans fair value adjustment).
The difference between contractually required payments and the cash flows expected to be collected at acquisition is referred to as the non-accretable difference. Subsequent decreases to the expected cash flows will generally result in a provision for loan and lease losses. Subsequent increases in cash flows will result in a reversal of the provision for loan and lease losses to the extent of prior charges and then an adjustment to accretable yield, which would have a positive impact on interest income.
The accretable difference on purchased loans is the difference between the expected cash flows and the net present value of expected cash flows. Such difference is accreted into earnings using the effective yield method over the term of the loans. In determining the net present value of expected cash flows, the Company used discount rates ranging from 6.0% to 9.5% depending on the risk characteristics of each individual loan or loan pool.
Covered other real estate owned (“covered ORE”) — Foreclosed assets covered by FDIC loss share agreements, or covered ORE, are recorded at estimated fair value on the date of acquisition. In estimating the fair value of covered ORE, management considers a number of factors including, among others, appraised value, estimated holding periods, net present value of cash flows expected to be received, and estimated selling costs. A discount rate ranging from 8.0% to 9.5% was used to determine the net present value of covered ORE.
FDIC loss share receivable — In connection with the Company’s FDIC-assisted acquisitions, the Company has recorded an FDIC loss share receivable to reflect the indemnification provided by the FDIC. Since the indemnified items are covered loans and covered ORE, which are measured at fair value at the date of acquisition, the FDIC loss share receivable is also measured at fair value at the date of acquisition, and is calculated by discounting the cash flows expected to be received from the FDIC. A discount rate of 5.0% was used to determine the net present value of the FDIC loss share receivable. These cash flows are estimated by multiplying estimated losses by the reimbursement rates as set forth in the loss share agreements. The balance of the FDIC loss share receivable is adjusted periodically to reflect changes in expectations of discounted cash flows, expense reimbursements under the loss share agreements and other factors.
FDIC clawback payable — Pursuant to the clawback provisions of the loss share agreements for the Company’s FDIC-assisted acquisitions, the Company may be required to reimburse the FDIC should actual losses be less than certain thresholds established in each loss share agreement. The amount of the clawback provision for each acquisition is included in “accrued interest payable and other liabilities” in the accompanying consolidated balance sheet and is measured at fair value at the date of acquisition. It is calculated as the difference between management’s estimated losses on covered loans and covered ORE and the loss threshold contained in each loss share agreement, multiplied by the applicable clawback provisions contained in each loss share agreement. This clawback amount which is payable to the FDIC upon termination of the applicable loss share agreement is discounted back to net present value using a discount rate of 5.0%. To the extent that actual losses on covered loans and covered ORE are less than estimated losses, the applicable clawback payable to the FDIC upon termination of the loss share agreements will increase. To the extent that actual losses on covered loans and covered ORE are more than estimated losses, the applicable clawback payable to the FDIC upon termination of the loss share agreements will decrease.
Allowance for loan and lease losses (“ALLL”) — The ALLL is established through a provision for such losses charged against income. All or portions of loans or leases, excluding purchased loans and loans covered by FDIC loss share agreements, deemed to be uncollectible are charged against the ALLL when management believes that collectibility of all or some portion of outstanding principal is unlikely. Subsequent recoveries, if any, of loans or leases previously charged off are credited to the ALLL. For purchased loans and covered loans, decreases or increases in cash flows will result in a provision for loan and lease losses or a reversal of a previous provision for loan and lease losses to the extent of prior charges and then an adjustment to accretable yield.
60
The ALLL is maintained at a level management believes will be adequate to absorb probable incurred losses in the loan and lease portfolio, excluding purchased loans and loans covered by FDIC loss share agreements. Provision to and the adequacy of the ALLL are based on evaluations of the loan and lease portfolio utilizing objective and subjective criteria. The objective criteria primarily include an internal grading system, specific allowances and “stressed” markets allocations. The Company also utilizes a peer group analysis and an historical analysis to validate the overall adequacy of its ALLL. The subjective criteria take into consideration such factors as the nature, mix and volume of the portfolio, overall portfolio quality, review of specific problem loans and leases, national, regional and local business and economic conditions that may affect the borrowers’ or lessees’ ability to pay, the value of collateral securing the loans and leases and other relevant factors. Changes in any of these criteria or the availability of new information could require adjustment of the ALLL in future periods. While a specific allowance has been calculated for impaired loans and leases and for loans and leases where the Company has otherwise determined a specific reserve is appropriate, no portion of the Company’s ALLL is restricted to any individual loan or lease or group of loans or leases, and the entire ALLL is available to absorb losses from any and all loans and leases.
The Company’s policy generally is to place a loan or lease, excluding loans covered by FDIC loss share agreements, on nonaccrual status when payment of principal or interest is contractually past due 90 days, or earlier when concern exists as to the ultimate collection of principal and interest. Nonaccrual loans or leases are generally returned to accrual status when principal and interest payments are less than 90 days past due and the Company reasonably expects to collect all principal and interest. The Company may continue to accrue interest on certain loans and leases contractually past due 90 days if such loans or leases are both well secured and in the process of collection. Loans and leases for which the terms have been modified and for which the borrower or lessee is experiencing financial difficulties are considered troubled debt restructurings and are included in impaired loans and leases.
All loans and leases deemed to be impaired are evaluated individually. The Company considers a loan or lease, excluding loans covered by FDIC loss share agreements, to be impaired when, based on current information and events, it is probable that the Company will be unable to collect all amounts due according to the contractual terms thereof. Many of the Company’s nonaccrual loans or leases and all troubled loans or leases, excluding loans covered by FDIC loss share agreements, that have been restructured from their original contractual terms are considered impaired. The majority of the Company’s impaired loans and leases are dependent upon collateral for repayment. Accordingly, impairment is generally measured by comparing collateral value, net of holding and selling costs, to the current investment in the loan or lease. For all other impaired loans and leases, the Company compares estimated discounted cash flows to the current investment in the loan or lease. To the extent that the Company’s current investment in a particular loan or lease exceeds its estimated net collateral value or its estimated discounted cash flows, the impaired amount is specifically considered in the determination of the allowance for loan and lease losses, or is immediately charged off as a reduction of the allowance for loan and lease losses.
For certain loans and leases, excluding loans covered by FDIC loss share agreements, not considered impaired where (i) the customer is continuing to make regular payments, although payments may be past due, (ii) there is a reasonable basis to believe the customer may continue to make regular payments, although there is also an elevated risk that the customer may default, and (iii) the collateral or other repayment sources are likely to be insufficient to recover the current investment in the loan if a default occurs, the Company evaluates such loans and leases to determine if a reserve is needed for these loans and leases. For the purpose of calculating the amount of such reserve, management assumes that (i) no further regular payments occur and (ii) all sums recovered will come from liquidation of collateral and collection efforts from other payment sources. To the extent that the Company’s current investment in a particular loan or lease evaluated for the need for such reserve exceeds its net collateral value or its estimated discounted cash flows, such excess is considered allocated reserve for purposes of the determination of the allowance for loan and lease losses.
The Company also includes further allowance allocation for risk-rated and certain other loans, including commercial real estate loans and excluding loans covered by FDIC loss share agreements, that are in markets determined by management to be “stressed”. Stressed markets may include any specific geography experiencing (i) high unemployment substantially above the U.S. average, (ii) significant over-development in one or more commercial real estate categories, (iii) recent or announced loss of a major employer or significant workforce reductions, (iv) significant declines in real estate values, and (v) various other factors. The additional allowance for such stressed markets compensates for the expectation that a higher risk of loss is anticipated for the “work-out” or liquidation of a real estate loan in a stressed market versus a market that is not experiencing any significant levels of stress. The required allocation percentage applicable to real estate loans in stressed markets may be applied to the total market or it may be determined at the individual loan level based on collateral value, loan-to-value ratios, strength of the borrower and/or guarantor, viability of the underlying project and other factors.
61
The accrual of interest on loans and leases, excluding loans covered by FDIC loss share agreements, is discontinued when, in management’s opinion, the borrower or lessee may be unable to meet payments as they become due. When interest accrual is discontinued, all unpaid accrued interest is reversed. Interest income is subsequently recognized only to the extent cash payments are received.
Premises and equipment — Premises and equipment are reported at cost less accumulated depreciation and amortization. Depreciation and amortization are computed on a straight-line basis over the estimated useful lives of the related assets. Depreciable lives for the major classes of assets are generally 45 years for buildings and 3 to 25 years for furniture, fixtures, equipment and certain building improvements. Leasehold improvements are amortized over the shorter of the asset’s estimated useful life or the term of the lease. Accelerated depreciation methods are used for income tax purposes. Maintenance and repair charges are expensed as incurred.
Foreclosed and repossessed assets held for sale — Repossessed personal properties and real estate acquired through or in lieu of foreclosure, excluding covered ORE, are initially recorded at the lesser of current principal investment or fair value less estimated cost to sell at the date of repossession or foreclosure. Valuations of these assets are periodically reviewed by management with the carrying value of such assets adjusted through non-interest expense to the then estimated fair value net of estimated selling costs, if lower, until disposition. Gains and losses from the sale of repossessions, foreclosed assets and other real estate are recorded in non-interest income, and expenses to maintain the properties are included in non-interest expense.
Income taxes — The Company utilizes the asset and liability method in accounting for income taxes. Under this method, deferred tax assets and liabilities are determined based upon the difference between the values of the assets and liabilities as reflected in the financial statements and their related tax basis using enacted tax rates in effect for the year or years in which the differences are expected to be recovered or settled. As changes in tax laws or rates are enacted, deferred tax assets and liabilities are adjusted through the provision for income taxes.
The Company recognizes a tax position as a benefit only if it is “more likely than not” that the tax position would be sustained in a tax examination, with a tax examination being presumed to occur. The amount recognized is the largest amount of tax benefit that has a greater than 50% likelihood of being realized on examination. For tax positions not meeting the “more likely than not” test, no tax benefit is recorded.
The Company files consolidated tax returns. The Bank and the other consolidated entities provide for income taxes on a separate return basis and remit to the Company amounts determined to be currently payable. The Company recognizes interest related to income tax matters as interest income or expense, and penalties related to income tax matters are recognized as non-interest expense. The Company is no longer subject to income tax examinations by U.S. federal tax authorities for years prior to 2007.
Bank owned life insurance (“BOLI”) — BOLI consists of life insurance purchased by the Company on (i) a qualifying group of officers with the Company designated as owner and beneficiary of the policies and (ii) one of the Company’s executive officers with the Company designated as owner and both the Company and the executive officer designated as beneficiaries of the policies. The earnings on BOLI policies are used to offset a portion of employee benefit costs. BOLI is carried at the policies’ realizable cash surrender values with changes in cash surrender values and death benefits received in excess of cash surrender values reported in non-interest income.
Intangible assets — Intangible assets consist of goodwill, bank charter costs and core deposit intangibles. Goodwill represents the excess purchase price over the fair value of net assets acquired in business acquisitions. The Company had goodwill of $5.2 million at both December 31, 2010 and 2009. The Company performed its annual impairment test of goodwill as of September 30, 2010. This test indicated no impairment of the Company’s goodwill.
Bank charter costs represent costs paid to acquire a Texas bank charter and are being amortized over 20 years. Bank charter costs totaled $239,000 at both December 31, 2010 and 2009, less accumulated amortization of $82,000 and $70,000 at December 31, 2010 and 2009, respectively.
Core deposit intangibles represent premiums paid for deposits acquired via acquisition and are being amortized over 3 to 8 years. Core deposit intangibles totaled $5.1 million and $2.3 million at December 31, 2010 and 2009, respectively, less accumulated amortization of $2.6 million and $2.2 million at December 31, 2010 and 2009, respectively.
62
The aggregate amount of amortization expense for the Company’s core deposit and bank charter intangibles is expected to be $0.8 million in 2011; $0.7 million per year in 2012 and 2013; $0.3 million in 2014; and $0.1 million in 2015.
Earnings per common share — Earnings per common share are computed using the two-class method as the Company has determined that its outstanding non-vested stock awards granted under its restricted stock plan are participating securities. Under this method, basic earnings per share are computed by dividing net earnings allocated to common stock by the weighted-average number of common shares outstanding during the applicable period. Diluted earnings per common share are computed by dividing reported earnings allocated to common stockholders by the weighted-average number of common shares outstanding after consideration of the dilutive effect, if any, of the Company’s common stock options and common stock warrant using the treasury stock method. On November 24, 2009 the Company repurchased its common stock warrant.
Stock-based compensation — The Company has an employee stock option plan, a non-employee director stock option plan and an employee restricted stock plan, which are described more fully in Note 15. The Company measures the cost of employee services received in exchange for an award of equity instruments based on the grant-date fair value of the award. Such cost is to be recognized over the vesting period of the award. For the years ended December 31, 2010, 2009 and 2008, the Company recognized $0.8 million, $0.7 million and $0.9 million, respectively, of non-interest expense for its stock-based compensation plans.
Segment disclosures — The Company operates in only one segment – community banking. Accordingly, there is no requirement to report segment information in the Company’s consolidated financial statements. No revenues are derived from foreign countries and no single external customer comprises more than 10% of the Company’s revenues.
Recent accounting pronouncements — In January 2010, the Financial Accounting Standards Board (“FASB”) issued Accounting Standards Update (“ASU”) 2010-06, “Fair Value Measurements and Disclosures (Topic 820): Improving Disclosures about Fair Value Measurements.” ASU 2010-06 requires more robust disclosures about (i) the different classes of assets and liabilities measured at fair value, (ii) the valuation techniques and inputs used, (iii) the activity in Level 3 fair value measurements, and (iv) the transfers between Levels 1, 2, and 3. Among other things, ASU 2010-06 requires separate disclosures about purchases, sales, issuances and settlements in the roll forward of activity in Level 3 fair value measurements as opposed to presenting such activity on a net basis. The new disclosures required by ASU 2010-06 are effective for interim and annual reporting periods beginning after December 15, 2009, except for the disclosures about the roll forward of activity in Level 3 fair value measurements which are effective for interim and annual periods beginning after December 15, 2010. The provisions of ASU 2010-06, did not have a material impact on the Company’s financial position, results of operations or liquidity, but did require expansion of the Company’s disclosures about fair value measurements.
In July 2010, the FASB issued ASU 2010-20, “Disclosures about the Credit Quality of Financing Receivables and the Allowance for Credit Losses.” ASU 2010-20 requires disclosure of additional information to assist financial statement users in assessing an entity’s credit risk exposures and evaluating the adequacy of the allowance for credit losses. Specifically, ASU 2010-20 requires entities to provide disclosures on a disaggregated basis, consisting of portfolio segment and class of financing receivable. A portfolio segment is defined by ASU 2010-20 as the level at which an entity develops and documents a systematic method for determining its allowance for credit losses. Classes of financing receivables generally are a disaggregation of portfolio segments. ASU 2010-20 amends existing disclosures to require an entity to provide, on a disaggregated basis, (i) a rollforward schedule of the allowance for credit losses from the beginning to the end of the reporting period, with the ending balance further disaggregated on the basis of impairment method, (ii) the recorded investment in financing receivables for each disaggregated ending balance, (iii) the nonaccrual status of financing receivables by class, and (iv) impaired financing receivables by class. Additionally, ASU 2010-20 required additional disclosures, including (i) credit quality indicators of financing receivables by class, (ii) aging of past due financing receivables by class, (iii) nature and extent of troubled debt restructurings (“TDRs”) by class and their effect on the allowance for credit losses, (iv) nature and extent of financing receivables by class modified as TDRs within the previous 12 months that defaulted during the reporting period and their effect on the allowance, and (v) significant purchases and sales of financing receivables during the reporting period disaggregated by portfolio segment. Disclosure pertaining to end of period balances are required for interim and annual reporting periods ending after December 15, 2010 (i.e. beginning December 31, 2010 for calendar year companies). Disclosures pertaining to activity that occurs during the reporting period are required for interim and annual reporting periods beginning
63
on or after December 15, 2010. On January 4, 2011, the FASB deferred the provisions of ASU 2010-20 regarding TDRs pending further guidance. ASU 2010-20 did not have a material impact on the Company’s financial position, results of operations or liquidity, but did require expansion of its disclosures about credit quality and the allowance for loan and lease losses.
Reclassifications — Certain reclassifications of 2009 and 2008 amounts have been made to conform with the 2010 financial statements presentation. These reclassifications had no impact on prior years’ net income, as previously reported.
2. Acquisitions
On March 26, 2010 the Company, through the Bank, entered into a purchase and assumption agreement with loss share agreements with the FDIC pursuant to which it acquired substantially all of the assets and assumed substantially all of the deposits and certain other liabilities of the former Unity National Bank (“Unity”) with five offices in Georgia, including two in Cartersville and one each in Rome, Adairsville and Calhoun.
On July 16, 2010 the Company, through the Bank, entered into a purchase and assumption agreement with loss share agreements with the FDIC pursuant to which it acquired substantially all of the assets and assumed substantially all of the deposits and certain other liabilities of the former Woodlands Bank (“Woodlands”) with eight offices, including two in South Carolina, two in North Carolina, one in Georgia and three in Alabama. On October 26, 2010, the Company closed four of the Woodlands offices, and in December 2010 the Company relocated two offices. The Company also renegotiated the leases on the remaining two offices. As a result at December 31, 2010, the Company operated one office each in Bluffton, South Carolina; Wilmington, North Carolina; Savannah, Georgia; and Mobile, Alabama.
On September 10, 2010 the Company, through the Bank, entered into a purchase and assumption agreement with loss share agreements with the FDIC pursuant to which it acquired substantially all of the assets and assumed substantially all of the deposits and certain other liabilities of the former Horizon Bank (“Horizon”) with four offices in Florida, including two in Bradenton and one each in Palmetto and Brandon. On December 23, 2010, the Company closed the office in Brandon, Florida.
On December 17, 2010 the Company, through the Bank, entered into a purchase and assumption agreement with loss share agreements with the FDIC pursuant to which it acquired substantially all of the assets and assumed substantially all of the deposits and certain other liabilities of the former Chestatee State Bank (“Chestatee”) with four offices in Georgia, including two in Dawsonville and one each in Cumming and Marble Hill.
A summary, at fair value, of the assets acquired and liabilities assumed in the Unity, Woodlands, Horizon and Chestatee transactions, as of the acquisition dates, is as follows:
| Unity | Woodlands | Horizon | Chestatee | |||||||||||||
| (Dollars in thousands) | ||||||||||||||||
| Assets acquired: |
||||||||||||||||
| Cash and cash equivalents |
$ | 45,401 | $ | 13,447 | $ | 11,775 | $ | 21,964 | ||||||||
| Investment securities AFS |
5,580 | 84,492 | 5,105 | 7,157 | ||||||||||||
| Loans not covered by loss share agreements |
— | 1,113 | 892 | 3,576 | ||||||||||||
| Covered assets: |
||||||||||||||||
| Loans |
134,452 | 187,933 | 93,003 | 116,808 | ||||||||||||
| Other real estate owned |
8,859 | 5,029 | 3,683 | 13,406 | ||||||||||||
| FDIC loss share receivable |
44,147 | 54,827 | 29,089 | 42,072 | ||||||||||||
| Core deposit intangible |
1,657 | 200 | 396 | 550 | ||||||||||||
| Other assets |
183 | 1,145 | 1,981 | 1,101 | ||||||||||||
| Total assets acquired |
240,279 | 348,186 | 145,924 | 206,634 | ||||||||||||
| Liabilities assumed: |
||||||||||||||||
| Deposits |
220,806 | 344,723 | 152,387 | 234,468 | ||||||||||||
| FHLB-Atlanta advances |
24,078 | 10,142 | 19,251 | — | ||||||||||||
| FDIC clawback payable |
1,566 | 3,030 | 1,461 | 1,091 | ||||||||||||
| Other liabilities |
492 | 193 | 562 | 640 | ||||||||||||
| Total liabilities assumed |
246,942 | 358,088 | 173,661 | 236,199 | ||||||||||||
| Net assets acquired at fair value |
(6,663 | ) | (9,902 | ) | (27,737 | ) | (29,565 | ) | ||||||||
| Cash reveived from FDIC |
16,700 | 24,260 | 29,502 | 38,424 | ||||||||||||
| Pre-tax gains on FDIC-assisted transactions |
$ | 10,037 | $ | 14,358 | $ | 1,765 | $ | 8,859 | ||||||||
64
The acquisition date fair values of acquired assets and assumed liabilities for each of the Company’s FDIC-assisted transactions may be revised for up to 12 months following the date of acquisition.
The Company’s results of operations for 2010 include the operating results of the acquired assets and assumed liabilities from the dates of acquisition through December 31, 2010. Due to the significant fair value adjustments and the nature of the loss share agreements with the FDIC, the Company believes pro forma information that would include historical results of each of these acquisitions is not relevant. Accordingly, no pro forma financial information is included in these consolidated financial statements.
In conjunction with each of these acquisitions, the Bank entered into loss share agreements with the FDIC such that the Bank and the FDIC will share in the losses on assets covered under the loss share agreements. Pursuant to the terms of the loss share agreements for the Unity acquisition, on losses up to $65.0 million, the FDIC will reimburse the Bank for 80% of losses. On losses exceeding $65.0 million, the FDIC will reimburse the Bank for 95% of losses. Under the terms of the loss share agreements for the Woodlands acquisition, the FDIC will reimburse the Bank for 80% of losses. Pursuant to the terms of the loss share agreements for the Horizon acquisition, the FDIC will reimburse the Bank on single family residential loans and related foreclosed real estate for (i) 80% of losses up to $11.8 million, (ii) 30% of losses between $11.8 million and $17.9 million and (iii) 80% of losses in excess of $17.9 million. For non-single family residential loans and related foreclosed real estate, the FDIC will reimburse the Bank for (i) 80% of losses up to $32.3 million, (ii) 0% of losses between $32.3 million and $42.8 million and (iii) 80% of losses in excess of $42.8 million. Under the terms of the loss share agreements for the Chestatee acquisition, the FDIC will reimburse the Bank for 80% of losses.
The loss share agreements applicable to single family residential mortgage loans and related foreclosed real estate provide for FDIC loss sharing and the Bank’s reimbursement to the FDIC for recoveries of covered losses for ten years from the date on which each applicable loss share agreement was entered. The loss share agreements applicable to commercial loans and related foreclosed real estate provide for FDIC loss sharing for five years from the date on which each applicable loss share agreement was entered and the Bank’s reimbursement to the FDIC for recoveries of covered losses for an additional three years thereafter.
To the extent that actual losses incurred by the Bank are less than (i) $65 million on the Unity assets covered under the loss share agreements, (ii) $107 million on the Woodlands assets covered under the loss share agreements, (iii) $60 million on the Horizon assets covered under the loss share agreements and (iv) $66 million on the Chestatee assets covered under the loss share agreements, the Bank may be required to reimburse the FDIC under the clawback provisions of the loss share agreements.
The terms of the purchase and assumption agreements for the Unity, Woodlands, Horizon and Chestatee acquisitions provide for the FDIC to indemnify the Bank against certain claims, including claims with respect to assets, liabilities or any affiliate not acquired or otherwise assumed by the Bank and with respect to claims based on any action by Unity’s, Woodland’s, Horizon’s or Chestatee’s directors, officers or employees.
3. Covered Assets and FDIC Clawback Payable
The covered loans and covered ORE from the Company’s four FDIC-assisted acquisitions, along with the related FDIC loss share receivable, are reported as “covered assets” in the accompanying consolidated financial statements. A summary of the covered assets and the FDIC clawback payable is as follows:
| December 31, 2010 | ||||
| (Dollars in thousands) | ||||
| Covered loans |
$ | 497,545 | ||
| Covered ORE |
31,145 | |||
| FDIC loss share receivable |
153,111 | |||
| Total covered assets |
$ | 681,801 | ||
| FDIC clawback payable |
$ | 7,286 | ||
65
The following table presents a summary, by acquisition, of covered loans acquired during 2010 as of the dates of acquisition and changes in such balances during 2010.
| Unity | Woodlands | Horizon | Chestatee | Total | ||||||||||||||||
| (Dollars in thousands) | ||||||||||||||||||||
| At acquisition date: |
||||||||||||||||||||
| Contractually required principal and interest |
$ | 208,410 | $ | 315,103 | $ | 179,441 | $ | 181,523 | $ | 884,477 | ||||||||||
| Nonaccretable differences |
(53,793 | ) | (82,375 | ) | (52,388 | ) | (42,665 | ) | (231,221 | ) | ||||||||||
| Cash flows expected to be collected |
154,617 | 232,728 | 127,053 | 138,858 | 653,256 | |||||||||||||||
| Accretable difference |
(20,165 | ) | (44,795 | ) | (34,050 | ) | (22,050 | ) | (121,060 | ) | ||||||||||
| Fair value |
134,452 | 187,933 | 93,003 | 116,808 | 532,196 | |||||||||||||||
| Activity in 2010: |
||||||||||||||||||||
| Accretion |
7,436 | 7,144 | 2,222 | 339 | 17,141 | |||||||||||||||
| Transfers to covered ORE |
(2,755 | ) | (2,599 | ) | — | — | (5,354 | ) | ||||||||||||
| Payments received |
(23,786 | ) | (15,356 | ) | (6,339 | ) | (669 | ) | (46,150 | ) | ||||||||||
| Other activity, net |
(364 | ) | 53 | 23 | — | (288 | ) | |||||||||||||
| Total carrying value of covered loans at December 31, 2010 |
$ | 114,983 | $ | 177,175 | $ | 88,909 | $ | 116,478 | $ | 497,545 | ||||||||||
The following table presents a summary, by acquisition, of the carrying value and type of covered loans at December 31, 2010.
| Unity | Woodlands | Horizon | Chestatee | Total | ||||||||||||||||
| (Dollars in thousands) | ||||||||||||||||||||
| Real estate: |
||||||||||||||||||||
| Residential 1-4 family |
$ | 32,699 | $ | 50,411 | $ | 32,351 | $ | 17,772 | $ | 133,233 | ||||||||||
| Non-farm/non-residential |
53,119 | 61,848 | 39,378 | 60,173 | 214,518 | |||||||||||||||
| Construction/land development |
12,435 | 56,734 | 9,476 | 30,509 | 109,154 | |||||||||||||||
| Agricultural |
7,980 | 69 | 999 | 649 | 9,697 | |||||||||||||||
| Multifamily residential |
3,970 | 4,298 | 2,194 | 307 | 10,769 | |||||||||||||||
| Total real estate |
110,203 | 173,360 | 84,398 | 109,410 | 477,371 | |||||||||||||||
| Commercial and industrial |
3,479 | 3,812 | 3,360 | 6,995 | 17,646 | |||||||||||||||
| Consumer |
1,301 | — | — | — | 1,301 | |||||||||||||||
| Agricultural (non-real estate) |
— | — | — | 73 | 73 | |||||||||||||||
| Other |
— | 3 | 1,151 | — | 1,154 | |||||||||||||||
| Total covered loans |
$ | 114,983 | $ | 177,175 | $ | 88,909 | $ | 116,478 | $ | 497,545 | ||||||||||
The following table presents a summary, by acquisition, of changes in the accretable yield on covered loans during 2010.
| Unity | Woodlands | Horizon | Chestatee | Total | ||||||||||||||||
| (Dollars in thousands) | ||||||||||||||||||||
| Accretable yield at date of acquisition |
$ | 20,165 | $ | 44,795 | $ | 34,050 | $ | 22,050 | $ | 121,060 | ||||||||||
| Accretion |
(7,436 | ) | (7,144 | ) | (2,222 | ) | (339 | ) | (17,141 | ) | ||||||||||
| Other activity, net |
(1,593 | ) | (366 | ) | (858 | ) | — | (2,817 | ) | |||||||||||
| Balance at December 31, 2010 |
$ | 11,136 | $ | 37,285 | $ | 30,970 | $ | 21,711 | $ | 101,102 | ||||||||||
66
The following table presents a summary, by acquisition, of covered ORE and activity within covered ORE during 2010.
| Unity | Woodlands | Horizon | Chestatee | Total | ||||||||||||||||
| (Dollars in thousands) | ||||||||||||||||||||
| At acquisition date: |
||||||||||||||||||||
| Balance on acquired bank’s books |
$ | 20,258 | $ | 12,258 | $ | 8,391 | $ | 31,647 | $ | 72,554 | ||||||||||
| Total expected losses |
(9,265 | ) | (5,897 | ) | (3,678 | ) | (15,960 | ) | (34,800 | ) | ||||||||||
| Discount for net present value of expected cash flows |
(2,134 | ) | (1,332 | ) | (1,030 | ) | (2,281 | ) | (6,777 | ) | ||||||||||
| Fair value |
8,859 | 5,029 | 3,683 | 13,406 | 30,977 | |||||||||||||||
| Activity in 2010: |
||||||||||||||||||||
| Loans transferred to covered ORE |
2,755 | 2,599 | — | — | 5,354 | |||||||||||||||
| Sales of covered ORE |
(3,554 | ) | (1,632 | ) | — | — | (5,186 | ) | ||||||||||||
| Covered ORE at December 31, 2010 |
$ | 8,060 | $ | 5,996 | $ | 3,683 | $ | 13,406 | $ | 31,145 | ||||||||||
The following table presents a summary, by acquisition, of the carrying value and type of covered ORE at December 31, 2010.
| Unity | Woodlands | Horizon | Chestatee | Total | ||||||||||||||||
| (Dollars in thousands) | ||||||||||||||||||||
| Real estate: |
||||||||||||||||||||
| Residential 1-4 family |
$ | 1,558 | $ | 1,620 | $ | 1,742 | $ | 5,704 | $ | 10,624 | ||||||||||
| Non-farm/non-residential |
1,010 | 274 | 1,516 | 955 | 3,755 | |||||||||||||||
| Construction/land development |
5,092 | 4,102 | 425 | 6,747 | 16,366 | |||||||||||||||
| Total real estate |
7,660 | 5,996 | 3,683 | 13,406 | 30,745 | |||||||||||||||
| Commercial and industrial |
400 | — | — | — | 400 | |||||||||||||||
| Total covered ORE |
$ | 8,060 | $ | 5,996 | $ | 3,683 | $ | 13,406 | $ | 31,145 | ||||||||||
The following table presents a summary, by acquisition, of the FDIC loss share receivable and the changes in receivable balance during 2010.
| Unity | Woodlands | Horizon | Chestatee | Total | ||||||||||||||||
| (Dollars in thousands) | ||||||||||||||||||||
| At acquisition date: |
||||||||||||||||||||
| Expected principal loss on covered assets: |
||||||||||||||||||||
| Covered loans |
$ | 51,590 | $ | 71,765 | $ | 40,537 | $ | 41,996 | $ | 205,888 | ||||||||||
| Covered ORE |
9,265 | 5,897 | 3,678 | 15,960 | 34,800 | |||||||||||||||
| Total expected principal losses |
60,855 | 77,662 | 44,215 | 57,956 | 240,688 | |||||||||||||||
| Estimated loss sharing percentage |
80 | % | 80 | % | 80 | % | 80 | % | 80 | % | ||||||||||
| Estimated recovery from FDIC loss share agreements |
48,684 | 62,130 | 35,372 | 46,365 | 192,551 | |||||||||||||||
| Discount for net present value on FDIC loss share receivable |
(4,537 | ) | (7,303 | ) | (6,283 | ) | (4,293 | ) | (22,416 | ) | ||||||||||
| Net present value of FDIC loss share receivable |
44,147 | 54,827 | 29,089 | 42,072 | 170,135 | |||||||||||||||
| Activity in 2010: |
||||||||||||||||||||
| Accretion income |
1,229 | 1,007 | 331 | — | 2,567 | |||||||||||||||
| Cash received from FDIC |
(15,308 | ) | (4,802 | ) | — | — | (20,110 | ) | ||||||||||||
| Other activity, net |
1,052 | (295 | ) | (238 | ) | — | 519 | |||||||||||||
| FDIC loss share receivable, at estimated net present value, at December 31, 2010 |
$ | 31,120 | $ | 50,737 | $ | 29,182 | $ | 42,072 | $ | 153,111 | ||||||||||
67
The following table presents a summary, by acquisition, of the FDIC clawback payable and changes in the payable during 2010.
| Unity | Woodlands | Horizon | Chestatee | Total | ||||||||||||||||
| (Dollars in thousands) | ||||||||||||||||||||
| At acquisition date: |
||||||||||||||||||||
| Estimated FDIC clawback payable |
$ | 2,612 | $ | 4,935 | $ | 2,380 | $ | 1,778 | $ | 11,705 | ||||||||||
| Discount for net present value on FDIC clawback payable |
(1,046 | ) | (1,905 | ) | (919 | ) | (687 | ) | (4,557 | ) | ||||||||||
| Net present value of FDIC clawback payable |
1,566 | 3,030 | 1,461 | 1,091 | 7,148 | |||||||||||||||
| Activity in 2010: |
||||||||||||||||||||
| Accretion expense |
63 | 63 | 12 | — | 138 | |||||||||||||||
| FDIC clawback payable, at estimated net present value, at December 31, 2010 |
$ | 1,629 | $ | 3,093 | $ | 1,473 | $ | 1,091 | $ | 7,286 | ||||||||||
4. Investment Securities
The following table is a summary of the amortized cost and estimated fair values of investment securities, all of which are classified as AFS. The Company’s holdings of “other equity securities” include FHLB-Dallas, FHLB-Atlanta and FNBB shares which do not have readily available fair values and are carried at cost.
| Amortized Cost |
Gross Unrealized Gains |
Gross Unrealized Losses |
Estimated Fair Value |
|||||||||||||
| (Dollars in thousands) | ||||||||||||||||
| December 31, 2010: |
||||||||||||||||
| Obligations of states and political subdivisions |
$ | 378,822 | $ | 6,431 | $ | (6,706 | ) | $ | 378,547 | |||||||
| U.S. Government agency residential mortgage-backed securities |
1,269 | — | — | 1,269 | ||||||||||||
| Other equity securities |
18,882 | — | — | 18,882 | ||||||||||||
| Total investment securities AFS |
$ | 398,973 | $ | 6,431 | $ | (6,706 | ) | $ | 398,698 | |||||||
| December 31, 2009: |
||||||||||||||||
| Obligations of states and political subdivisions |
$ | 385,581 | $ | 10,517 | $ | (2,211 | ) | $ | 393,887 | |||||||
| U.S. Government agency residential mortgage-backed securities |
93,159 | 1,351 | — | 94,510 | ||||||||||||
| Corporate obligations |
1,596 | 269 | — | 1,865 | ||||||||||||
| Collateralized debt obligation |
100 | — | — | 100 | ||||||||||||
| Other equity securities |
16,316 | — | — | 16,316 | ||||||||||||
| Total investment securities AFS |
$ | 496,752 | $ | 12,137 | $ | (2,211 | ) | $ | 506,678 | |||||||
The following table shows gross unrealized losses and estimated fair value of investment securities AFS, aggregated by investment category and length of time that individual investment securities have been in a continuous unrealized loss position.
| Less than 12 Months | 12 Months or More | Total | ||||||||||||||||||||||
| Estimated Fair Value |
Unrealized Losses |
Estimated Fair Value |
Unrealized Losses |
Estimated Fair Value |
Unrealized Losses |
|||||||||||||||||||
| (Dollars in thousands) | ||||||||||||||||||||||||
| December 31, 2010: |
||||||||||||||||||||||||
| Obligations of states and political subdivisions |
$ | 174,356 | $ | 6,153 | $ | 5,387 | $ | 553 | $ | 179,743 | $ | 6,706 | ||||||||||||
| Total temporarily impaired investment securities |
$ | 174,356 | $ | 6,153 | $ | 5,387 | $ | 553 | $ | 179,743 | $ | 6,706 | ||||||||||||
| December 31, 2009: |
||||||||||||||||||||||||
| Obligations of states and political subdivisions |
$ | 90,010 | $ | 1,453 | $ | 32,967 | $ | 758 | $ | 122,977 | $ | 2,211 | ||||||||||||
| Total temporarily impaired investment securities |
$ | 90,010 | $ | 1,453 | $ | 32,967 | $ | 758 | $ | 122,977 | $ | 2,211 | ||||||||||||
68
At December 31, 2009, the Company’s investment securities portfolio included one security categorized as a collateralized debt obligation (“CDO”). During 2009 the Company no longer expected to hold this security until maturity or until such time as fair value recovered to or above cost. As a result, the Company recorded a $0.9 million charge during 2009 to reduce the carrying value of this security to $0.1 million. This CDO was sold during 2010.
In evaluating the Company’s unrealized loss positions for other-than-temporary impairment for the investment securities portfolio, management considers the credit quality of the issuer, the nature and cause of the unrealized loss, the severity and duration of the impairments and other factors. At December 31, 2010 and 2009, management determined the unrealized losses were the result of fluctuations in interest rates and did not reflect deteriorations of the credit quality of the investments. Accordingly, management believes that all of its unrealized losses on investment securities are temporary in nature. The Company does not have the intent to sell these investment securities and more likely than not would not be required to sell these investment securities before fair value recovers to amortized cost.
A maturity distribution of investment securities AFS reported at amortized cost and estimated fair value as of December 31, 2010 is as follows:
| Amortized Cost |
Estimated Fair Value |
|||||||
| (Dollars in thousands) | ||||||||
| Due in one year or less |
$ | 4,773 | $ | 4,808 | ||||
| Due after one year to five years |
17,635 | 17,893 | ||||||
| Due after five years to ten years |
21,134 | 21,592 | ||||||
| Due after ten years |
355,431 | 354,405 | ||||||
| Total |
$ | 398,973 | $ | 398,698 | ||||
For purposes of this maturity distribution, all investment securities are shown based on their contractual maturity date, except (i) FHLB-Dallas, FHLB-Atlanta and FNBB stock with no contractual maturity date are shown in the longest maturity category and (ii) U.S. Government agency residential mortgage-backed securities are allocated among various maturities based on an estimated repayment schedule utilizing Bloomberg median prepayment speeds and interest rate levels at December 31, 2010. Expected maturities will differ from contractual maturities because issuers may have the right to call or prepay obligations with or without call or prepayment penalties.
Sales activities and other-than-temporary impairment charges of the Company’s investment securities AFS are summarized as follows:
| Year Ended December 31, | ||||||||||||
| 2010 | 2009 | 2008 | ||||||||||
| (Dollars in thousands) | ||||||||||||
| Sales proceeds |
$ | 255,232 | $ | 528,542 | $ | 13,588 | ||||||
| Gross realized gains |
$ | 5,030 | $ | 30,802 | $ | 360 | ||||||
| Gross realized losses |
(486 | ) | (2,920 | ) | (777 | ) | ||||||
| Other-than-temporary impairment charges |
— | (900 | ) | (3,016 | ) | |||||||
| Net gains (losses) on investment securities |
$ | 4,544 | $ | 26,982 | $ | (3,433 | ) | |||||
Investment securities with carrying values of $345.3 million and $344.6 million at December 31, 2010 and 2009, respectively, were pledged to secure public funds and trust deposits and for other purposes required or permitted by law.
At December 31, 2010, there were no holdings of investment securities of any one issuer in an amount greater than 10% of stockholders’ equity.
69
5. Loans and Leases
The following table is a summary of the loan and lease portfolio, excluding loans covered by FDIC loss share agreements, by principal category.
| December 31, | ||||||||
| 2010 | 2009 | |||||||
| (Dollars in thousands) | ||||||||
| Real estate: |
||||||||
| Residential 1-4 family |
$ | 266,014 | $ | 282,733 | ||||
| Non-farm/non-residential |
678,465 | 606,880 | ||||||
| Construction/land development |
496,737 | 600,342 | ||||||
| Agricultural |
81,736 | 86,237 | ||||||
| Multifamily residential |
103,875 | 55,860 | ||||||
| Commercial and industrial |
120,038 | 150,208 | ||||||
| Consumer |
54,401 | 63,561 | ||||||
| Direct financing leases |
42,754 | 40,353 | ||||||
| Agricultural (non-real estate) |
9,962 | 15,509 | ||||||
| Other |
2,447 | 2,421 | ||||||
| Total loans and leases |
$ | 1,856,429 | $ | 1,904,104 | ||||
The above table includes deferred costs, net of deferred fees, that totaled $1.6 million at both December 31, 2010 and 2009, respectively.
Loans and leases on which the accrual of interest has been discontinued aggregated $13.9 million and $23.6 million at December 31, 2010 and 2009, respectively. Interest income recorded during 2010, 2009 and 2008 for nonaccrual loans and leases at December 31, 2010, 2009 and 2008 was $0.1 million, $1.3 million and $0.6 million, respectively. Under the original terms, these loans and leases would have reported $1.1 million, $2.5 million and $1.1 million of interest income during 2010, 2009 and 2008, respectively.
The Company’s direct financing leases include estimated residual values of $0.5 million at December 31, 2010 and $0.8 million at December 31, 2009, and are presented net of unearned income totaling $5.9 million and $5.3 million at December 31, 2010 and 2009, respectively.
6. Allowance for Loan and Lease Losses (“ALLL”)
The following table is a summary of activity within the ALLL.
| Year Ended December 31, | ||||||||||||
| 2010 | 2009 | 2008 | ||||||||||
| (Dollars in thousands) | ||||||||||||
| Balance - beginning of year |
$ | 39,619 | $ | 29,512 | $ | 19,557 | ||||||
| Loans and leases charged off |
(16,764 | ) | (35,885 | ) | (9,631 | ) | ||||||
| Recoveries of loans and leases previously charged off |
1,375 | 1,192 | 561 | |||||||||
| Net loans and leases charged off |
(15,389 | ) | (34,693 | ) | (9,070 | ) | ||||||
| Provision charged to operating expense |
16,000 | 44,800 | 19,025 | |||||||||
| Balance - end of year |
$ | 40,230 | $ | 39,619 | $ | 29,512 | ||||||
70
The following table is a summary of the Company’s ALLL and recorded investment in loans and leases, excluding loans covered by FDIC loss share agreements, for the year ended December 31, 2010. At December 31, 2010, the Company had no ALLL allocated to covered loans.
| Real Estate | ||||||||||||||||||||||||||||||||||||||||||||
| Residential 1-4 Family |
Non-farm/ Non-residential |
Construction/ land development |
Agricultural | Multi- family Residential |
Commercial and Industrial |
Consumer | Direct Financing Leases |
Other | Unallocated | Total | ||||||||||||||||||||||||||||||||||
| (Dollars in thousands) | ||||||||||||||||||||||||||||||||||||||||||||
| Allowance for loan and lease losses: |
||||||||||||||||||||||||||||||||||||||||||||
| Beginning balance |
$ | 3,600 | $ | 6,574 | $ | 11,585 | $ | 750 | $ | 710 | $ | 3,587 | $ | 2,599 | $ | 1,560 | $ | 289 | $ | 8,365 | $ | 39,619 | ||||||||||||||||||||||
| Charge-offs |
(872 | ) | (1,702 | ) | (4,037 | ) | (301 | ) | (133 | ) | (6,937 | ) | (1,196 | ) | (478 | ) | (1,108 | ) | — | (16,764 | ) | |||||||||||||||||||||||
| Recoveries |
99 | 87 | 253 | 45 | 1 | 656 | 212 | 20 | 2 | — | 1,375 | |||||||||||||||||||||||||||||||||
| Provisions |
172 | 3,354 | 2,764 | 2,075 | 742 | 6,836 | 436 | 624 | 1,085 | (2,021 | ) | 16,000 | ||||||||||||||||||||||||||||||||
| Ending balance |
$ | 2,999 | $ | 8,313 | $ | 10,565 | $ | 2,569 | $ | 1,320 | $ | 4,142 | $ | 2,051 | $ | 1,726 | $ | 201 | $ | 6,344 | $ | 40,230 | ||||||||||||||||||||||
| Ending balance: |
||||||||||||||||||||||||||||||||||||||||||||
| ALLL for individually evaluated impaired loans and leases |
$ | 33 | $ | 71 | $ | 508 | $ | 403 | $ | — | $ | 928 | $ | 33 | $ | — | $ | 44 | $ | — | $ | 2,020 | ||||||||||||||||||||||
| Ending balance: |
||||||||||||||||||||||||||||||||||||||||||||
| ALLL for all other loans and leases |
2,966 | 8,242 | 10,057 | 2,166 | 1,320 | 3,214 | 2,108 | 1,726 | 157 | 6,344 | 38,210 | |||||||||||||||||||||||||||||||||
| Ending balance |
$ | 2,999 | $ | 8,313 | $ | 10,565 | $ | 2,569 | $ | 1,320 | $ | 4,142 | $ | 2,051 | $ | 1,726 | $ | 201 | $ | 6,344 | $ | 40,230 | ||||||||||||||||||||||
| Loans and leases: |
||||||||||||||||||||||||||||||||||||||||||||
| Ending balance: |
||||||||||||||||||||||||||||||||||||||||||||
| individually evaluated |
$ | 945 | $ | 3,096 | $ | 4,086 | $ | 2,456 | $ | — | $ | 947 | $ | 182 | $ | — | $ | 115 | $ | — | $ | 11,827 | ||||||||||||||||||||||
| Ending balance: |
||||||||||||||||||||||||||||||||||||||||||||
| all other loans |
265,069 | 675,369 | 492,651 | 79,280 | 103,055 | 119,091 | 54,219 | 42,754 | 12,294 | — |
|
1,844,602 |
| |||||||||||||||||||||||||||||||
| Ending balance |
$ | 266,014 | $ | 678,465 | $ | 496,737 | $ | 81,736 | $ | 103,875 | $ | 120,038 | $ | 54,401 | $ | 42,754 | $ | 12,409 | $ | — | $ | 1,856,429 | ||||||||||||||||||||||
The following table is a summary of credit quality indicators for the Company’s loans and leases, excluding loans covered by FDIC loss share agreements, as of December 31, 2010.
| Real Estate | ||||||||||||||||||||||||||||||||||||||||
| Residential 1-4 Family |
Non-farm/ Non-residential |
Construction/ land development |
Agricultural | Multi- family Residential |
Commercial and Industrial |
Consumer | Direct Financing Leases |
Other | Total | |||||||||||||||||||||||||||||||
| (Dollars in thousands) | ||||||||||||||||||||||||||||||||||||||||
| Satisfactory |
$ | — | $ | 504,923 | $ | 258,933 | $ | 58,873 | $ | 90,700 | $ | 79,926 | $ | — | $ | 38,666 | $ | 9,484 | $ | 1,041,511 | ||||||||||||||||||||
| Fair |
— | 122,883 | 201,038 | 10,489 | 8,579 | 34,274 | — | 3,328 | 1,836 | 382,427 | ||||||||||||||||||||||||||||||
| Watch |
|
— |
|
32,476 | 21,135 | 3,609 | 3,699 | 1,659 | — | 676 | 157 | 63,411 | ||||||||||||||||||||||||||||
| Substandard |
— |
|
18,183 |
|
15,631 | 8,759 | 897 | 4,179 | — | 84 | 242 | 47,975 | ||||||||||||||||||||||||||||
| Total risk-rated loans and leases |
|
— |
|
|
678,465 |
|
496,737 | 81,736 | 103,875 | 120,038 | — | 42,754 | 11,719 | 1,535,324 | ||||||||||||||||||||||||||
| Loans and leases not risk rated |
266,014 | — | — | — | — | — | 54,401 | — | 690 | 321,105 | ||||||||||||||||||||||||||||||
| Total loans and leases |
$ | 266,014 | $ | 678,465 | $ | 496,737 | $ | 81,736 | $ | 103,875 | $ | 120,038 | $ | 54,401 | $ | 42,754 | $ | 12,409 | $ | 1,856,429 | ||||||||||||||||||||
71
The following categories of credit quality indicators are used by the Company.
Satisfactory — Loans and leases in this category are considered to be a satisfactory credit risk and are generally considered to be collectable in full.
Fair — Loans and leases in this category are considered to be a marginally satisfactory credit risk and are generally considered to be collectable in full.
Watch — Loans and leases in this category are presently protected from apparent loss, however weaknesses exist which could cause future impairment of repayment of principal or interest.
Substandard — Loans and leases in this category are characterized by deterioration in quality exhibited by a number of weaknesses requiring corrective action and posing risk of some loss.
The following table is a summary of impaired loans and leases, excluding loans covered by FDIC loss share agreements, as of and for the year ended December 31, 2010.
| Recorded Investment |
Unpaid Principal Balance |
Related Allowance |
Average Recorded Investment |
|||||||||||||
| (Dollars in thousands) | ||||||||||||||||
| Real estate: |
||||||||||||||||
| Residential 1-4 family |
$ | 945 | $ | 1,156 | $ | 33 | $ | 1,790 | ||||||||
| Non-farm/non-residential |
3,096 | 4,135 | 71 | 4,788 | ||||||||||||
| Construction/land development |
4,086 | 7,974 | 508 | 4,457 | ||||||||||||
| Agricultural |
2,456 | 2,728 | 403 | 2,141 | ||||||||||||
| Multifamily residential |
— | 133 | — | — | ||||||||||||
| Commercial and industrial |
947 | 2,254 | 928 | 1,871 | ||||||||||||
| Consumer |
182 | 268 | 33 | 248 | ||||||||||||
| Other |
115 | 410 | 44 | 157 | ||||||||||||
| Total |
$ | 11,827 | $ | 19,058 | $ | 2,020 | $ | 15,452 | ||||||||
The following table is an aging analysis of past due loans and leases, excluding loans covered by FDIC loss share agreements, at December 31, 2010.
| 30-89 Days Past Due(1) |
Greater than 90 Days(2) |
Total Past Due |
Current(3) | Total Loans and Leases |
||||||||||||||||
| (Dollars in thousands) | ||||||||||||||||||||
| Real estate: |
||||||||||||||||||||
| Residential 1-4 family |
$ | 3,809 | $ | 726 | $ | 4,535 | $ | 261,479 | $ | 266,014 | ||||||||||
| Non-farm/non-residential |
6,261 | 3,337 | 9,598 | 668,867 | 678,465 | |||||||||||||||
| Construction/land development |
11,104 | 4,249 | 15,353 | 481,384 | 496,737 | |||||||||||||||
| Agricultural |
956 | 2,108 | 3,064 | 78,672 | 81,736 | |||||||||||||||
| Multifamily residential |
881 | — | 881 | 102,994 | 103,875 | |||||||||||||||
| Commercial and industrial |
1,639 | 881 | 2,520 | 117,518 | 120,038 | |||||||||||||||
| Consumer |
1,187 | 146 | 1,333 | 53,068 | 54,401 | |||||||||||||||
| Direct financing leases |
— | 84 | 84 | 42,670 | 42,754 | |||||||||||||||
| Other |
201 | — | 201 | 12,208 | 12,409 | |||||||||||||||
| Total |
$ | 26,038 | $ | 11,531 | $ | 37,569 | $ | 1,818,860 | $ | 1,856,429 | ||||||||||
| (1) | Includes $1.2 million of loans and leases, excluding loans covered by FDIC loss share agreements, on nonaccrual status at December 31, 2010. |
| (2) | All loans and leases greater than 90 days past due, excluding loans covered by FDIC loss share agreements, were on nonaccrual status at December 31, 2010. |
| (3) | Includes $1.3 million of loans and leases, excluding loans covered by FDIC loss share agreements, on nonaccrual status at December 31, 2010. |
72
7. Foreclosed and Repossessed Assets Held For Sale
The following table is a summary of activity within foreclosed and repossessed assets held for sale, excluding assets covered by FDIC loss share agreements, for the periods indicated.
| Year Ended December 31, | ||||||||||||
| 2010 | 2009 | 2008 | ||||||||||
| (Dollars in thousands) | ||||||||||||
| Balance - beginning of year |
$ | 61,148 | $ | 10,758 | $ | 3,112 | ||||||
| Loans transferred into foreclosed and repossessed assets held for sale |
17,095 | 74,122 | 17,259 | |||||||||
| Sales of foreclosed and repossessed assets |
(27,152 | ) | (19,723 | ) | (8,571 | ) | ||||||
| Write downs of foreclosed and repossessed assets held for sale |
(8,960 | ) | (4,009 | ) | (1,042 | ) | ||||||
| Foreclosed and repossessed assets acquired in acquisitions - not covered by loss share agreements |
85 | — | — | |||||||||
| Balance - end of year |
$ | 42,216 | $ | 61,148 | $ | 10,758 | ||||||
The amount and type of foreclosed and repossessed assets held for sale, excluding assets covered by loss share agreements, are as follows:
| December 31, | ||||||||
| 2010 | 2009 | |||||||
| (Dollars in thousands) | ||||||||
| Real estate: |
||||||||
| Residential 1-4 family |
$ | 4,018 | $ | 4,374 | ||||
| Non-farm/non-residential |
3,866 | 4,544 | ||||||
| Construction/land development |
33,701 | 41,490 | ||||||
| Agricultural |
459 | — | ||||||
| Multifamily residential |
— | 10,470 | ||||||
| Total real estate |
42,044 | 60,888 | ||||||
| Commercial and industrial |
87 | 220 | ||||||
| Consumer |
85 | 40 | ||||||
| Total foreclosed and repossessed assets held for sale |
$ | 42,216 | $ | 61,148 | ||||
8. Premises and Equipment
The following table is a summary of premises and equipment.
| December 31, | ||||||||
| 2010 | 2009 | |||||||
| (Dollars in thousands) | ||||||||
| Land |
$ | 60,148 | $ | 54,760 | ||||
| Construction in progress |
3,069 | 5,827 | ||||||
| Buildings and improvements |
105,741 | 92,278 | ||||||
| Leasehold improvements |
5,080 | 5,004 | ||||||
| Equipment |
26,114 | 23,752 | ||||||
| Gross premises and equipment |
200,152 | 181,621 | ||||||
| Accumulated depreciation |
(29,655 | ) | (25,417 | ) | ||||
| Premises and equipment, net |
$ | 170,497 | $ | 156,204 | ||||
The Company capitalized $0.1 million, $0.4 million and $1.1 million of interest on construction projects during the years ended December 31, 2010, 2009 and 2008, respectively.
Included in occupancy expense is rent of $1.1 million, $0.5 million and $0.6 million incurred under noncancelable operating leases in 2010, 2009 and 2008, respectively, for leases of real estate, buildings and premises. These leases contain certain renewal and purchase options according to the terms of the agreements. Future amounts due under noncancelable operating leases at December 31, 2010 are as follows: $1.0 million in 2011, $1.0 million in 2012, $0.9 million in 2013, $0.7 million in 2014, $0.6 million in 2015 and $1.8 million thereafter. Rental income recognized during 2010, 2009 and 2008 for leases of buildings and premises and for equipment leased under operating leases was $1.1 million, $0.5 million and $0.6 million, respectively.
73
9. Deposits
The following table is a summary of the scheduled maturities of all time deposits.
| December 31, | ||||||||
| 2010 | 2009 | |||||||
| (Dollars in thousands) | ||||||||
| Up to one year |
$ | 905,818 | $ | 832,905 | ||||
| Over one to two years |
29,352 | 41,328 | ||||||
| Over two to three years |
3,819 | 2,521 | ||||||
| Over three to four years |
3,159 | 338 | ||||||
| Over four to five years |
880 | 111 | ||||||
| Thereafter |
82 | 73 | ||||||
| Total time deposits |
$ | 943,110 | $ | 877,276 | ||||
The aggregate amount of time deposits with a minimum denomination of $100,000 was $483.9 million and $540.2 million at December 31, 2010 and 2009, respectively.
10. Borrowings
Short-term borrowings with original maturities less than one year include FHLB-Dallas advances, Federal Reserve Bank (“FRB”) borrowings, treasury, tax and loan note accounts and federal funds purchased. The following table is a summary of information relating to these short-term borrowings.
| December 31, | ||||||||
| 2010 | 2009 | |||||||
| (Dollars in thousands) | ||||||||
| Average annual balance |
$ | 14,465 | $ | 44,028 | ||||
| December 31 balance |
1,299 | 1,742 | ||||||
| Maximum month-end balance during year |
36,353 | 108,690 | ||||||
| Interest rate: |
||||||||
| Weighted-average - year |
0.37 | % | 0.37 | % | ||||
| Weighted-average - December 31 |
0.00 | 0.00 | ||||||
At December 31, 2010 and 2009, respectively, the Company had fixed rate FHLB-Dallas advances with original maturities exceeding one year of $280.8 million and $340.8 million. These fixed rate advances bear interest at rates ranging from 1.34% to 5.12% at December 31, 2010, are collateralized by a blanket lien on a substantial portion of the Company’s real estate loans and are subject to prepayment penalties if repaid prior to maturity date. At December 31, 2010, the Bank had $610 million of unused FHLB-Dallas borrowing availability.
At December 31, 2010, aggregate annual maturities and weighted-average rates of FHLB-Dallas advances with an original maturity of over one year were as follows:
| Maturity |
Amount | Weighted-Average Interest Rate |
||||||
| (Dollars in thousands) | ||||||||
| 2011 |
$ | 44 | 3.81 | % | ||||
| 2012 |
33 | 3.40 | ||||||
| 2013 |
31 | 3.22 | ||||||
| 2014 |
32 | 3.24 | ||||||
| 2015 |
33 | 3.27 | ||||||
| Thereafter |
280,667 | 3.80 | ||||||
| Total |
$ | 280,840 | 3.80 | |||||
Included in the above table are $280.0 million of FHLB-Dallas advances that contain quarterly call features and are callable as follows:
| Amount | Weighted-Average Interest Rate |
Maturity | ||||||||||
| (Dollars in thousands) | ||||||||||||
| Callable quarterly |
$ | 260,000 | 3.90 | % | 2017 | |||||||
| Callable quarterly |
20,000 | 2.53 | 2018 | |||||||||
| Total |
$ | 280,000 | 3.80 | |||||||||
74
11. Subordinated Debentures
At December 31, 2010 the Company had the following issues of trust preferred securities outstanding and subordinated debentures owed to the Trusts.
| Subordinated Debentures Owed to Trust |
Trust Preferred Securities of the Trust |
Interest Rate at December 31, 2010 |
Final Maturity Date | |||||||||||||
| (Dollars in thousands) | ||||||||||||||||
| Ozark III |
$ | 14,434 | $ | 14,000 | 3.24 | % | September 25, 2033 | |||||||||
| Ozark II |
14,433 | 14,000 | 3.20 | September 29, 2033 | ||||||||||||
| Ozark IV |
15,464 | 15,000 | 2.50 | September 28, 2034 | ||||||||||||
| Ozark V |
20,619 | 20,000 | 1.90 | December 15, 2036 | ||||||||||||
| Total |
$ | 64,950 | $ | 63,000 | ||||||||||||
On September 25, 2003, Ozark III sold to investors in a private placement offering $14 million of adjustable rate trust preferred securities, and on September 29, 2003, Ozark II sold to investors in a private placement offering $14 million of adjustable rate trust preferred securities (collectively, “2003 Securities”). The 2003 Securities bear interest, adjustable quarterly, at 90-day London Interbank Offered Rate (“LIBOR”) plus 2.95% for Ozark III and 90-day LIBOR plus 2.90% for Ozark II. The aggregate proceeds of $28 million from the 2003 Securities were used to purchase an equal principal amount of adjustable rate subordinated debentures of the Company that bear interest, adjustable quarterly, at 90-day LIBOR plus 2.95% for Ozark III and 90-day LIBOR plus 2.90% for Ozark II (collectively,“2003 Debentures”).
On September 28, 2004, Ozark IV sold to investors in a private placement offering $15 million of adjustable rate trust preferred securities (“2004 Securities”). The 2004 Securities bear interest, adjustable quarterly, at 90-day LIBOR plus 2.22%. The $15 million proceeds from the 2004 Securities were used to purchase an equal principal amount of adjustable rate subordinated debentures of the Company that bear interest, adjustable quarterly, at 90-day LIBOR plus 2.22% (“2004 Debentures”).
On September 29, 2006 Ozark V sold to investors in a private placement offering $20 million of adjustable rate trust preferred securities (“2006 Securities”). The Securities bear interest, adjustable quarterly, at 90-day LIBOR plus 1.60%. The $20 million proceeds from the 2006 Securities were used to purchase an equal principal amount of adjustable rate subordinated debentures of the Company that bear interest, adjustable quarterly, at 90-day LIBOR plus 1.60% (“2006 Debentures”).
In addition to the issuance of these adjustable rate securities, Ozark II and Ozark III collectively sold $0.9 million, Ozark IV sold $0.4 million and Ozark V sold $0.6 million of trust common equity to the Company. The proceeds from the sales of the trust common equity were used, respectively, to purchase $0.9 million of 2003 Debentures, $0.4 million of 2004 Debentures and $0.6 million of 2006 Debentures issued by the Company.
At both December 31, 2010 and 2009, the Company had an aggregate of $64.9 million of subordinated debentures outstanding and had an asset of $1.9 million representing its investment in the common equity issued by the Trusts. At both December 31, 2010 and 2009, the sole assets of the Trusts are the respective adjustable rate debentures and the liabilities of the respective Trusts are the 2003 Securities, the 2004 Securities and the 2006 Securities. The Trusts had aggregate common equity of $1.9 million and did not have any restricted net assets at both December 31, 2010 and 2009. The Company has, through various contractual arrangements, fully and unconditionally guaranteed all obligations of the Trusts with respect to the 2003 Securities, the 2004 Securities and the 2006 Securities. Additionally, there are no restrictions on the ability of the Trusts to transfer funds to the Company in the form of cash dividends, loans or advances. The Company has the option to defer interest payments on the subordinated debentures from time to time for a period not to exceed five consecutive years.
These securities generally mature at or near the 30th anniversary date of each issuance. However, these securities and debentures may be prepaid at par, subject to regulatory approval, prior to maturity at any time on or after September 25 and 29, 2008 for the two issues of 2003 Securities and 2003 Debentures; on or after September 28, 2009 for the 2004 Securities and 2004 Debentures; and on or after December 15, 2011 for the 2006 Securities and 2006 Debentures, or at an earlier date upon certain changes in tax laws, investment company laws or regulatory capital requirements.
75
12. Income Taxes
The following table is a summary of the components of the provision (benefit) for income taxes.
| Year Ended December 31, | ||||||||||||
| 2010 | 2009 | 2008 | ||||||||||
| (Dollars in thousands) | ||||||||||||
| Current: |
||||||||||||
| Federal |
$ | 15,696 | $ | 12,151 | $ | 13,400 | ||||||
| State |
2,723 | 2,414 | 2,672 | |||||||||
| Total current |
18,419 | 14,565 | 16,072 | |||||||||
| Deferred: |
||||||||||||
| Federal |
6,895 | (1,308 | ) | (5,161 | ) | |||||||
| State |
1,300 | (398 | ) | (985 | ) | |||||||
| Total deferred |
8,195 | (1,706 | ) | (6,146 | ) | |||||||
| Provision for income taxes |
$ | 26,614 | $ | 12,859 | $ | 9,926 | ||||||
The reconciliation between the statutory federal income tax rate and effective income tax rate is as follows:
| Year Ended December 31, | ||||||||||||
| 2010 | 2009 | 2008 | ||||||||||
| Statutory federal income tax rate |
35.0 | % | 35.0 | % | 35.0 | % | ||||||
| Increase (decrease) in taxes resulting from: |
||||||||||||
| State income taxes, net of federal benefit |
2.9 | 2.3 | 2.5 | |||||||||
| Effect of non-taxable interest income |
(7.2 | ) | (12.0 | ) | (10.8 | ) | ||||||
| Effect of BOLI and other non-taxable income |
(0.8 | ) | (2.0 | ) | (3.4 | ) | ||||||
| Other, net |
(0.5 | ) | (0.3 | ) | (1.1 | ) | ||||||
| Effective income tax rate |
29.4 | % | 23.0 | % | 22.2 | % | ||||||
Income tax benefits from the exercise of stock options in the amount of $0.5 million, $0.1 million and $0.3 million in 2010, 2009 and 2008, respectively, were recorded as an increase to additional paid-in capital.
At December 31, 2010 and 2009, income taxes refundable of $0.7 million and $2.9 million, respectively, were included in other assets.
The types of temporary differences between the tax basis of assets and liabilities and their financial reporting amounts that give rise to deferred income tax assets and liabilities and their approximate tax effects are as follows:
| December 31, | ||||||||
| 2010 | 2009 | |||||||
| (Dollars in thousands) | ||||||||
| Deferred tax assets: |
||||||||
| Allowance for loan and lease losses |
$ | 14,734 | $ | 14,756 | ||||
| Stock-based compensation |
1,224 | 1,395 | ||||||
| Deferred compensation |
1,256 | 704 | ||||||
| Other real estate owned |
3,171 | 980 | ||||||
| Investment securities AFS |
108 | — | ||||||
| Gross deferred tax assets |
20,493 | 17,835 | ||||||
| Deferred tax liabilities: |
||||||||
| Accelerated depreciation on premises and equipment |
7,894 | 7,577 | ||||||
| Investment securities AFS |
— | 3,612 | ||||||
| FHLB stock dividends |
281 | 363 | ||||||
| Deferred gains on FDIC-assisted acquisitions |
9,546 | — | ||||||
| Other, net |
1,127 | 548 | ||||||
| Gross deferred tax liabilities |
18,848 | 12,100 | ||||||
| Net deferred tax assets |
$ | 1,645 | $ | 5,735 | ||||
13. Preferred Stock
On December 12, 2008, as part of the United States Department of the Treasury’s (the “Treasury”) Capital Purchase Program made available to certain financial institutions in the U.S. pursuant to the Emergency Economic Stabilization Act of 2008 (“EESA”), the Company and the Treasury entered into a Letter Agreement including the Securities Purchase Agreement – Standard Terms incorporated therein (the “Purchase Agreement”) pursuant to which the Company issued to the Treasury, in exchange for aggregate consideration of $75.0
76
million, (i) 75,000 shares of the Company’s Fixed Rate Cumulative Perpetual Preferred Stock, Series A, par value $0.01 and liquidation preference $1,000 per share (the “Series A Preferred Stock”), and (ii) a warrant (the “Warrant”) to purchase up to 379,811 shares (the “Warrant Common Stock”) of the Company’s common stock, par value $0.01 per share, at an exercise price of $29.62 per share.
On November 4, 2009, the Company redeemed all of the Series A Preferred Stock for $75.0 million, plus accrued and unpaid dividends, with the approval of the Company’s primary regulator in consultation with the Treasury. On November 24, 2009, the Company repurchased the Warrant from the Treasury for $2.65 million, which was charged against the Company’s additional paid-in capital.
The Series A Preferred Stock qualified as Tier 1 capital and paid cumulative cash dividends quarterly at a rate of 5% per annum while outstanding. The Series A Preferred Stock was non-voting, other than class voting rights on certain matters that could adversely affect the Series A Preferred Stock. While the Series A Preferred Stock was outstanding, the Company could not, without Treasury’s consent, increase its dividend rate per share of common stock or repurchase its common stock.
Prior to its repurchase by the Company, the Warrant was immediately exercisable and had a 10-year term. The Treasury could not exercise voting power with respect to any shares of Warrant Common Stock until the Warrant had been exercised.
In addition, the Purchase Agreement (i) granted the holders of the Series A Preferred Stock, the Warrant and the Warrant Common Stock certain registration rights, (ii) subjected the Company to certain of the executive compensation limitations included in the EESA and (iii) allowed the Treasury to unilaterally amend any of the terms of the Purchase Agreement to the extent required to comply with any changes after December 12, 2008 in applicable federal statutes.
Upon receipt of the aggregate consideration from the Treasury on December 12, 2008, the Company allocated the $75.0 million proceeds on a pro rata basis to the Series A Preferred Stock and the Warrant based on relative fair values. In estimating the fair value of the Warrant, the Company utilized the Black-Scholes model which includes assumptions regarding the Company’s common stock prices, stock price volatility, dividend yield, the risk free interest rate and the estimated life of the Warrant. The fair value of the Series A Preferred Stock was determined using a discounted cash flow methodology and a discount rate of 12%. As a result, the Company assigned $3.1 million of the aggregate proceeds to the Warrant and $71.9 million to the Series A Preferred Stock. The discount assigned to the Series A Preferred Stock was expected to be amortized over a five-year period, which was the expected life of the Series A Preferred Stock at the time it was issued, up to the $75.0 million liquidation value of such preferred stock, with the cost of such amortization being reported as additional preferred stock dividends. This resulted in a total dividend with a consistent annual effective yield of 5.98% prior to the Company’s redemption of the Series A Preferred Stock. As a result of the redemption, the remaining unamortized discount of $2.7 million was recognized as an additional preferred stock dividend in the fourth quarter of 2009.
14. Employee Benefit Plans
The Company maintains a qualified retirement plan (the “401(k) Plan”) with a salary deferral feature designed to qualify under Section 401 of the Internal Revenue Code (the “Code”). The 401(k) Plan permits employees of the Company to defer a portion of their compensation in accordance with the provisions of Section 401(k) of the Code. Matching contributions may be made in amounts and at times determined by the Company. Certain other statutory limitations with respect to the Company’s contribution under the 401(k) Plan also apply. Amounts contributed by the Company for a participant vest over six years and are held in trust until distributed pursuant to the terms of the 401(k) Plan.
Contributions to the 401(k) Plan are invested in accordance with participant elections among certain investment options. Distributions from participant accounts are not permitted before age 65, except in the event of death, permanent disability, certain financial hardships or termination of employment. The Company made matching cash contributions to the 401(k) Plan during 2010, 2009 and 2008 of $0.6 million, $0.5 million and $0.4 million, respectively.
Prior to January 1, 2005, all full-time employees of the Company were eligible to participate in the 401(k) Plan. Beginning January 1, 2005, certain key employees of the Company have been excluded from further salary deferrals to the 401(k) Plan, but may make salary deferrals through participation in the Bank of the Ozarks, Inc. Deferred Compensation Plan (the “Plan”). The Plan, an unfunded deferred compensation arrangement for the group of employees designated as key employees, including certain of the Company’s executive officers, was adopted by the Company’s board of directors on December 14, 2004 and became
77
effective January 1, 2005. Under the terms of the Plan, eligible participants may elect to defer a portion of their compensation. Such deferred compensation will be distributable in lump sum or specified installments upon separation from service with the Company or upon other specified events as defined in the Plan. The Company has the ability to make a contribution to each participant’s account, limited to one half of the first 6% of compensation deferred by the participant and subject to certain other limitations. Amounts deferred under the Plan are to be invested in certain approved investments (excluding securities of the Company or its affiliates). Company contributions to the Plan in 2010, 2009 and 2008 totaled $117,000, $117,000 and $104,000, respectively. At December 31, 2010 and 2009, the Company had Plan assets, along with an equal amount of liabilities, totaling $3.1 million and $2.4 million, respectively, recorded on the accompanying consolidated balance sheet.
Effective May 4, 2010, the Company established a Supplemental Executive Retirement Plan (“SERP”) and certain other benefit arrangements for its Chairman and Chief Executive Officer. Pursuant to the SERP, this officer is entitled to receive 180 equal monthly payments of $32,197, or $386,360 annually, commencing at the later of obtaining age 70 or separation from service. If separation from service occurs prior to age 70, such benefit will be at a reduced amount. The costs of such benefits, assuming a retirement date at age 70, will be fully accrued by the Company over the next 14 years. During 2010 the Company accrued $89,000 (none in 2009 and 2008) for future benefits payable under the SERP. The SERP is an unfunded plan and is considered a general contractual obligation of the Company.
15. Stock-Based Compensation
The Company has a nonqualified stock option plan for certain key employees and officers of the Company. This plan provides for the granting of nonqualified options to purchase shares of common stock in the Company. No option may be granted under this plan for less than the fair market value of the common stock, defined by the plan as the average of the highest reported asked price and the lowest reported bid price, on the date of the grant. While the vesting period and the termination date for the employee plan options are determined when options are granted, all such employee options outstanding at December 31, 2010 were issued with a vesting period of three years and expire seven years after issuance. At December 31, 2010 there were 504,200 shares available for future grants under this plan.
The Company also has a nonqualified stock option plan for non-employee directors. The non-employee director plan calls for options to purchase 1,000 shares of common stock to be granted to each non-employee director the day after the annual stockholders’ meeting. Additionally, a non-employee director elected or appointed for the first time as a director on a date other than an annual meeting shall be granted an option to purchase 1,000 shares of common stock. These options are exercisable immediately and expire ten years after issuance.
All shares issued in connection with options exercised under both the employee and non-employee director stock option plans are in the form of newly-issued shares.
The following table summarizes stock option activity for the year ended December 31, 2010.
| Options | Weighted-Average Exercise Price/Share |
Weighted-Average Remaining Contractual Life (in years) |
Aggregate Intrinsic Value (in thousands) |
|||||||||||||
| Outstanding - January 1, 2010 |
562,750 | $ | 28.34 | |||||||||||||
| Granted |
110,900 | 37.70 | ||||||||||||||
| Exercised |
(113,800 | ) | 24.82 | |||||||||||||
| Forfeited |
(33,050 | ) | 29.58 | |||||||||||||
| Outstanding - December 31, 2010 |
526,800 | $ | 31.05 | 4.4 | $ | 6,480 | (1) | |||||||||
| Fully vested and exercisable at December 31, 2010 |
282,250 | $ | 31.37 | 3.2 | $ | 3,382 | (1) | |||||||||
| Expected to vest in future periods |
212,198 | |||||||||||||||
| Fully vested and expected to vest - December 31, 2010(2) |
494,448 | $ | 31.04 | 4.3 | $ | 6,086 | (1) | |||||||||
| (1) | Based on closing price of $43.35 per share on December 31, 2010. |
| (2) | At December 31, 2010 the Company estimates that options to purchase 32,352 shares of the Company’s common stock will not vest and will be forfeited prior to their vesting date. |
78
Intrinsic value for stock options is defined as the difference between the current market value and the exercise price. The total intrinsic value of options exercised during 2010, 2009 and 2008 was $1.4 million, $0.3 million and $1.0 million, respectively.
Options to purchase 110,900 shares, 77,600 shares and 117,950 shares, respectively, were granted during 2010, 2009 and 2008 with a weighted-average grant date fair value of $11.38, $7.09 and $7.33, respectively. The fair value for each option grant is estimated on the date of grant using the Black-Scholes option pricing model that uses the following assumptions. The Company uses the U.S. Treasury yield curve in effect at the time of the grant to determine the risk-free interest rate. The expected dividend yield is estimated using the current annual dividend level and recent stock price of the Company’s common stock at the date of grant. Expected stock volatility is based on historical volatilities of the Company’s common stock. The expected life of the options is calculated based on the “simplified” method as provided for under Staff Accounting Bulletin No. 110.
The weighted-average assumptions used in the Black-Scholes option pricing model for the years indicated were as follows:
| 2010 | 2009 | 2008 | ||||||||||
| Risk-free interest rate |
1.22 | % | 2.32 | % | 2.61 | % | ||||||
| Expected dividend yield |
1.69 | % | 2.13 | % | 1.88 | % | ||||||
| Expected stock volatility |
39.0 | % | 37.0 | % | 32.8 | % | ||||||
| Expected life (years) |
5.0 | 5.0 | 5.0 | |||||||||
The total fair value of options to purchase shares of the Company’s common stock that vested during 2010, 2009 and 2008 was $0.7 million, $0.9 million and $1.1 million, respectively. Total unrecognized compensation cost related to nonvested stock-based compensation was $1.2 million at December 31, 2010 and is expected to be recognized over a weighted-average period of 2.5 years.
Effective April 21, 2009, the Company’s stockholders voted to approve the Company’s restricted stock plan permitting issuance of up to 200,000 shares of restricted stock or restricted stock units. All officers and employees of the Company are eligible to receive awards under the restricted stock plan. The benefits or amounts that may be received by or allocated to any particular officer or employee of the Company under the restricted stock plan will be determined in the sole discretion of the Company’s board of directors or its personnel and compensation committee. Shares of common stock issued under the restricted stock plan may be shares of original issuance, shares held in treasury or shares that have been reacquired by the Company. At December 31, 2010 there were 146,100 shares available for future grants under this plan.
The following table summarizes non-vested restricted stock activity for the years ended December 31, 2010 and 2009.
| Year Ended December 31, | ||||||||
| 2010 | 2009 | |||||||
| Balance - beginning of year |
18,600 | — | ||||||
| Granted |
37,300 | 18,600 | ||||||
| Forfeited |
(2,000 | ) | — | |||||
| Earned and issued |
— | — | ||||||
| Balance - end of year |
53,900 | 18,600 | ||||||
The fair value of the restricted stock awards is amortized to compensation expense over the vesting period (generally three years) and is based on the market price of the Company’s common stock at the date of grant multiplied by the number of shares granted that are expected to vest. The weighted-average grant date fair value of restricted stock granted during 2010 and 2009 was $1.4 million, or $37.67 per share, and $0.5 million, or $24.44 per share, respectively. Stock-based compensation expense for restricted stock included in non-interest expense was $0.2 million and $24,000 for 2010 and 2009, respectively. Unrecognized compensation expense for nonvested restricted stock awards was $1.5 million at December 31, 2010 and is expected to be recognized over 2.7 years.
16. Commitments and Contingencies
The Company is a party to financial instruments with off-balance sheet risk in the normal course of business to meet the financing needs of its customers. These financial instruments include commitments to extend credit and standby letters of credit.
79
The Company’s exposure to credit loss in the event of nonperformance by the other party to the financial instrument for commitments to extend credit is represented by the contractual amount of those instruments. The Company has the same credit policies in making commitments and conditional obligations as it does for on-balance sheet instruments.
Commitments to extend credit are agreements to lend to a customer as long as there is no violation of any condition established in the contract. Commitments generally have fixed expiration dates or other termination clauses and may require payment of a fee. Since these commitments may expire without being drawn upon, the total commitment amounts do not necessarily represent future cash requirements. The Company evaluates each customer’s creditworthiness on a case-by-case basis. The amount of collateral obtained, if deemed necessary by the Company upon extension of credit, is based on management’s credit evaluation of the counterparty. The type of collateral held varies but may include accounts receivable, inventory, property, plant and equipment, and other real or personal property.
The Company had outstanding commitments to extend credit, excluding mortgage IRLCs, of $165.7 million and $191.0 million at December 31, 2010 and 2009, respectively. The commitments extend over varying periods of time with the majority to be disbursed or to expire within a one-year period.
Outstanding standby letters of credit are contingent commitments issued by the Company generally to guarantee the performance of a customer in third party borrowing arrangements. The terms of the letters of credit are generally for a period of one year. The maximum amount of future payments the Company could be required to make under these letters of credit at December 31, 2010 and 2009 is $6.0 million and $9.5 million, respectively. The Company holds collateral to support letters of credit when deemed necessary. The total of collateralized commitments at December 31, 2010 and 2009 was $5.5 million and $8.0 million, respectively.
17. Related Party Transactions
The Company has had, in the ordinary course of business, lending transactions with certain of its officers, directors, director nominees and their related and affiliated parties (related parties). The following table is a summary of activity of loans to related parties for the periods indicated.
| Year Ended December 31, | ||||||||||||
| 2010 | 2009 | 2008 | ||||||||||
| (Dollars in thousands) | ||||||||||||
| Balance - beginning of year |
$ | 8,174 | $ | 4,434 | $ | 17,785 | ||||||
| New loans and advances |
9,258 | 5,546 | 955 | |||||||||
| Repayments |
(13,648 | ) | (1,793 | ) | (5,391 | ) | ||||||
| Change in composition of related parties |
(410 | ) | (13 | ) | (8,915 | ) | ||||||
| Balance - end of year |
$ | 3,374 | $ | 8,174 | $ | 4,434 | ||||||
Wiring and cabling installation for certain of the Company’s facilities were performed by an entity whose ownership includes a member of the Company’s board of directors. Total payments to this entity were $68,000 in 2010, $119,000 in 2009, $224,000 in 2008 for such installation contract work. This entity was awarded each of these contracts as a result of it being the low bidder in a competitive bid process.
18. Regulatory Matters
The Company is subject to various regulatory capital requirements administered by federal and state banking agencies. Failure to meet minimum capital requirements can initiate certain mandatory and discretionary actions by regulators that, if undertaken, could have a direct material effect on the Company’s financial condition and results of operations. Under capital adequacy guidelines and the regulatory framework for prompt corrective action, the Company must meet specific capital guidelines that involve quantitative measures of the Company’s assets, liabilities and certain off-balance sheet items as calculated under regulatory accounting practices. The Company’s capital amounts and classification are also subject to qualitative judgments by the regulators about component risk weightings and other factors.
Federal and state regulatory agencies generally require the Company and the Bank to maintain minimum Tier 1 and total capital to risk-weighted assets of 4.0% and 8.0%, respectively, and Tier 1 capital to average quarterly assets (Tier 1 leverage ratio) of at least 3.0%. Tier 1 capital generally consists of common equity, retained earnings, certain types of preferred stock, qualifying minority interest and trust preferred securities, subject to limitations, and excludes goodwill and various intangible assets. Total capital includes Tier 1 capital, any amounts of trust preferred securities excluded from Tier 1 capital, and the lesser of the ALLL or 1.25% of risk-weighted assets. At December 31, 2010 and 2009 the Company’s and the Bank’s Tier 1 and total capital ratios and their Tier 1 leverage ratios exceeded minimum requirements.
80
The actual and required regulatory capital amounts and ratios of the Company and the Bank at December 31, 2010 and 2009 are as follows:
| Required | ||||||||||||||||||||||||
| Actual | For Capital Adequacy Purposes |
To Be Well Capitalized Under Prompt Corrective Action Provisions |
||||||||||||||||||||||
| Amount | Ratio | Amount | Ratio | Amount | Ratio | |||||||||||||||||||
| (Dollars in thousands) | ||||||||||||||||||||||||
| December 31, 2010: |
||||||||||||||||||||||||
| Total capital (to risk-weighted assets): |
||||||||||||||||||||||||
| Company |
$ | 404,838 | 17.39 | % | $ | 186,260 | 8.00 | % | $ | 232,825 | 10.00 | % | ||||||||||||
| Bank |
387,949 | 16.75 | 185,334 | 8.00 | 231,668 | 10.00 | ||||||||||||||||||
| Tier 1 capital (to risk-weighted assets): |
||||||||||||||||||||||||
| Company |
375,597 | 16.13 | 93,131 | 4.00 | 139,695 | 6.00 | ||||||||||||||||||
| Bank |
358,852 | 15.49 | 92,667 | 4.00 | 139,001 | 6.00 | ||||||||||||||||||
| Tier 1 leverage (to average assets): |
||||||||||||||||||||||||
| Company |
375,597 | 11.88 | 94,814 | 3.00 | 158,023 | 5.00 | ||||||||||||||||||
| Bank |
358,852 | 11.40 | 94,437 | 3.00 | 157,395 | 5.00 | ||||||||||||||||||
| December 31, 2009: |
||||||||||||||||||||||||
| Total capital (to risk-weighted assets): |
||||||||||||||||||||||||
| Company |
$ | 349,649 | 15.03 | % | $ | 186,095 | 8.00 | % | $ | 232,619 | 10.00 | % | ||||||||||||
| Bank |
328,714 | 14.22 | 184,952 | 8.00 | 231,191 | 10.00 | ||||||||||||||||||
| Tier 1 capital (to risk-weighted assets): |
||||||||||||||||||||||||
| Company |
320,442 | 13.78 | 93,047 | 4.00 | 139,571 | 6.00 | ||||||||||||||||||
| Bank |
299,683 | 12.96 | 92,476 | 4.00 | 138,714 | 6.00 | ||||||||||||||||||
| Tier 1 leverage (to average assets): |
||||||||||||||||||||||||
| Company |
320,442 | 11.39 | 84,392 | 3.00 | 140,653 | 5.00 | ||||||||||||||||||
| Bank |
299,683 | 10.72 | 83,904 | 3.00 | 139,841 | 5.00 | ||||||||||||||||||
As of December 31, 2010 and 2009, the most recent notification from the regulators categorized the Company and the Bank as well capitalized under the regulatory framework for prompt corrective action. There are no conditions or events since that notification that management believes have changed the Company’s or the Bank’s category.
The state bank commissioner’s approval is required before the Bank can declare and pay any dividend of 75% or more of the net profits of the Bank after all taxes for the current year plus 75% of the retained net profits for the immediately preceding year. At December 31, 2010, $26.3 million was available for payment of dividends by the Bank without the approval of regulatory authorities. At December 31, 2009, the Bank could not pay dividends without the approval of regulatory authorities as a result of the $75 million dividend paid by the Bank to the Company for the redemption of the Series A Preferred Stock.
Under FRB regulation, the Bank is also limited as to the amount it may loan to its affiliates, including the Company, and such loans must be collateralized by specific types of collateral. The maximum amount available for loan from the Bank to the Company is limited to 10% of the Bank’s capital and surplus or approximately $36 million and $31 million, respectively, at December 31, 2010 and 2009.
The Bank is required by bank regulatory agencies to maintain certain minimum balances of cash or deposits primarily with the FRB. At December 31, 2010 and 2009, these required balances aggregated $14.7 million and $6.2 million, respectively.
81
19. Fair Value Measurements
The Company measures certain of its assets and liabilities on a fair value basis using various valuation techniques and assumptions, depending on the nature of the asset or liability. Fair value is defined as the price that would be received to sell an asset or paid to transfer a liability in an orderly transaction between market participants at the measurement date. Additionally, fair value is used either annually or on a non-recurring basis to evaluate certain assets and liabilities for impairment or for disclosure purposes.
The Company applied the following fair value hierarchy:
Level 1 - Quoted prices for identical instruments in active markets.
Level 2 - Quoted prices for similar instruments in active markets; quoted prices for identical or similar instruments in markets that are not active; and model-derived valuations whose inputs are observable.
Level 3 - Instruments whose inputs are unobservable.
The following table sets forth the Company’s assets and liabilities at December 31, 2010 and 2009 that are accounted for at fair value.
| Level 1 | Level 2 | Level 3 | Total | |||||||||||||
| (Dollars in thousands) | ||||||||||||||||
| December 31, 2010: |
||||||||||||||||
| Assets: |
||||||||||||||||
| Investment securities AFS(1): |
||||||||||||||||
| Obligations of state and political subdivisons |
$ | — | $ | 358,511 | $ | 20,036 | $ | 378,547 | ||||||||
| U.S. Government agency residential mortgage-backed securities |
— | 1,269 | — | 1,269 | ||||||||||||
| Total investment securities AFS |
— | 359,780 | 20,036 | 379,816 | ||||||||||||
| Impaired loans and leases |
— | — | 10,101 | 10,101 | ||||||||||||
| Foreclosed and repossessed assets held for sale, net |
— | — | 42,216 | 42,216 | ||||||||||||
| Derivative assets - IRLC and FSC |
— | — | 55 | 55 | ||||||||||||
| Total assets at fair value |
$ | — | $ | 359,780 | $ | 72,408 | $ | 432,188 | ||||||||
| Liabilities: |
||||||||||||||||
| Derivative liabilities - IRLC and FSC |
$ | — | $ | — | $ | 55 | $ | 55 | ||||||||
| Total liabilities at fair value |
$ | — | $ | — | $ | 55 | $ | 55 | ||||||||
| December 31, 2009: |
||||||||||||||||
| Assets: |
||||||||||||||||
| Investment securities AFS(1) |
||||||||||||||||
| Obligations of state and political subdivisons |
$ | — | $ | 377,297 | $ | 16,590 | $ | 393,887 | ||||||||
| U.S. Government agency residential mortgage-backed securities |
— | 94,510 | — | 94,510 | ||||||||||||
| Corporate obligations |
— | 1,865 | — | 1,865 | ||||||||||||
| Collateralized debt obligation |
— | — | 100 | 100 | ||||||||||||
| Total investment securities AFS |
— | 473,672 | 16,690 | 490,362 | ||||||||||||
| Impaired loans and leases |
— | — | 19,204 | 19,204 | ||||||||||||
| Foreclosed and repossessed assets held for sale, net |
— | — | 61,148 | 61,148 | ||||||||||||
| Derivative assets - IRLC and FSC |
— | — | 210 | 210 | ||||||||||||
| Total assets at fair value |
$ | — | $ | 473,672 | $ | 97,252 | $ | 570,924 | ||||||||
| Liabilities: |
||||||||||||||||
| Derivative liabilities - IRLC and FSC |
$ | — | $ | — | $ | 210 | $ | 210 | ||||||||
| Total liabilities at fair value |
$ | — | $ | — | $ | 210 | $ | 210 | ||||||||
| (1) | Does not include $18.9 million at December 31, 2010 of shares of FHLB-Dallas, FHLB-Atlanta and FNBB stock and $16.3 million at December 31, 2009 of shares of FHLB-Dallas and FNBB stock that do not have readily determinable fair values and are carried at cost. |
82
The following methods and assumptions are used to estimate the fair value of the Company’s assets and liabilities that are accounted for at fair value.
Investment securities — The Company utilizes independent third parties as its principal pricing sources for determining fair value of investment securities which are measured on a recurring basis. For investment securities traded in an active market, fair values are based on quoted market prices if available. If quoted market prices are not available, fair values are based on quoted market prices of comparable securities, broker quotes or comprehensive interest rate tables, pricing matrices or a combination thereof. For investment securities traded in a market that is not active, fair value is determined using unobservable inputs.
The Company has determined that certain of its investment securities had a limited to non-existent trading market at December 31, 2010 and 2009. As a result, the Company considers these investments as Level 3 in the fair value hierarchy. The following is a description of those investment securities and the fair value methodology used for such securities.
Obligations of state and political subdivisions — The fair values of certain obligations of state and political subdivisions consisting of certain unrated private placement bonds (the “private placement bonds”) in the amount of $20.0 million and $16.6 million at December 31, 2010 and 2009, respectively, were calculated using Level 3 hierarchy inputs and assumptions as the trading market for such securities was determined to be “not active”. This determination was based on the limited number of trades or, in certain cases, the existence of no reported trades for the private placement bonds. The private placement bonds are generally prepayable at par value at the option of the issuer. As a result, management believes the private placement bonds should be valued at the lower of (i) the matrix pricing provided by the Company’s third party pricing services for comparable unrated municipal securities or (ii) par value. At December 31, 2010 and 2009, the third party pricing matrices valued the Company’s total portfolio of private placement bonds at $21.0 million and $17.4 million, respectively, which exceeded the aggregate of the lower of the matrix pricing or par value of the private placement bonds by $1.0 million and $0.8 million at December 31, 2010 and 2009, respectively. Accordingly, at December 31, 2010 and 2009 the Company reported the private placement bonds at the lower of the matrix pricing or par value of $20.0 million and $16.6 million, respectively.
Collateralized debt obligation — At December 31, 2009, the Company’s investment securities portfolio included one security categorized as a CDO. At December 31, 2009, the Company considered this security as a Level 3 in the fair value hierarchy based on a trading market that was determined to be “not active” based on the limited number of trades, small block sizes, and the significant spreads between the bid and ask price. This CDO continued to perform in accordance with its terms and was not in default, but, because its credit rating was downgraded to below investment grade and other factors, the Company recorded a $0.9 million charge during 2009 to reduce the carrying value of this security to $0.1 million at December 31, 2019. The Company sold this CDO in 2010.
Impaired loans and leases — Fair values are measured on a nonrecurring basis and are based on the underlying collateral value of the impaired loan or lease, net of holding and selling costs, or the estimated discounted cash flows for such loan or lease. The Company has reduced the carrying value of its impaired loans and leases (all of which are included in nonaccrual loans and leases) by $8.9 million and $9.7 million, respectively, to the estimated fair value of $9.8 million and $19.2 million, respectively, for such loans and leases at December 31, 2010 and 2009. These adjustments to reduce the carrying value of impaired loans and leases to estimated fair value during 2010 and 2009 consisted of $6.9 million and $8.1 million, respectively, of partial charge-offs and $2.0 million and $1.7 million, respectively, of specific loan and lease loss allocations.
Foreclosed and repossessed assets held for sale, net — Repossessed personal properties and real estate acquired through or in lieu of foreclosure, excluding covered ORE, are measured on a non-recurring basis and are initially recorded at the lesser of current principal investment or fair value less estimated cost to sell at the date of repossession or foreclosure. Valuations of these assets are periodically reviewed by management with the carrying value of such assets adjusted through non-interest expense to the then estimated fair value net of estimated selling costs, if lower, until disposition. Fair values of foreclosed and repossessed assets held for sale are generally based on third party appraisals, broker price opinions or other valuations of the property, resulting in a Level 3 classification.
Derivative assets and liabilities — The fair values of IRLC and FSC derivative assets and liabilities are measured on a recurring basis and are based primarily on the fluctuation of interest rates between the date on which the IRLC and FSC were entered and year end.
83
The following table presents additional information about assets and liabilities measured at fair value on a recurring basis and for which the Company has utilized Level 3 inputs to determine fair value.
| Investment Securities AFS |
Derivative Assets-IRLC and FSC |
Derivative Liabilities- IRLC and FSC |
||||||||||
| (Dollars in thousands) | ||||||||||||
| Balances - January 1, 2009 |
$ | 30,020 | $ | 477 | $ | (477 | ) | |||||
| Total realized gains/(losses) included in earnings |
(3,753 | ) | (267 | ) | 267 | |||||||
| Total unrealized gains/(losses) included in other comprehensive income |
317 | — | — | |||||||||
| Purchases, sales, issuances and settlements, net |
(6,524 | ) | — | — | ||||||||
| Transfers in and/or out of Level 3 |
(3,370 | ) | — | — | ||||||||
| Balances - December 31, 2009 |
16,690 | 210 | (210 | ) | ||||||||
| Total realized gains/(losses) included in earnings |
20 | (155 | ) | 155 | ||||||||
| Total unrealized gains/(losses) included in other comprehensive income |
(850 | ) | — | — | ||||||||
| Purchases, sales, issuances and settlements, net |
192 | — | — | |||||||||
| Transfers in and/or out of Level 3 |
3,984 | — | — | |||||||||
| Balances - December 31, 2010 |
$ | 20,036 | $ | 55 | $ | (55 | ) | |||||
During 2010 and 2009, there were no transfers of assets or liabilities measured at fair value between Level 1 and Level 2 fair value hierarchy.
20. Fair Value of Financial Instruments
The following methods and assumptions were used to estimate the fair value of financial instruments.
Cash and due from banks — For these short-term instruments, the carrying amount is a reasonable estimate of fair value.
Investment securities — The Company utilizes independent third parties as its principal pricing sources for determining fair value of investment securities that are measured on a recurring basis. For investment securities traded in an active market, fair values are based on quoted market prices if available. If quoted market prices are not available, fair values are based on quoted market prices of comparable securities, broker quotes or comprehensive interest rate tables, pricing matrices or a combination thereof. For investment securities traded in a market that is not active, fair value is determined using unobservable inputs. The Company’s investments in the common stock of the FHLB-Dallas, FHLB-Atlanta and FNBB of $18.9 million at December 31, 2010 and $16.3 million at December 31, 2009 do not have readily determinable fair values and are carried at cost.
Loans and leases — The fair value of loans and leases is estimated by discounting the future cash flows using the current rate at which similar loans or leases would be made to borrowers or lessees with similar credit ratings and for the same remaining maturities.
Covered loans — The fair value of covered loans is based on the net present value of future cash proceeds expected to be received using discount rates that are derived from current market rates and reflect the level of inherent risk in the covered loans.
FDIC loss share receivable — The fair value of the FDIC loss share receivable is based on the net present value of future cash proceeds expected to be received from the FDIC under the provisions of the loss share agreements using a discount rate that is based on current market rates.
Deposit liabilities — The fair value of demand deposits, savings accounts, money market deposits and other transaction accounts is the amount payable on demand at the reporting date. The fair value of fixed maturity time deposits is estimated using the rate currently available for deposits of similar remaining maturities.
Repurchase Agreements — For these short-term instruments, the carrying amount is a reasonable estimate of fair value.
Other borrowed funds — For these short-term instruments, the carrying amount is a reasonable estimate of fair value. The fair value of long-term instruments is estimated based on the current rates available to the Company for borrowings with similar terms and remaining maturities.
Subordinated debentures — The fair values of these instruments are based primarily upon discounted cash flows using rates for securities with similar terms and remaining maturities.
84
Derivative assets and liabilities — The fair values of IRLC and FSC derivative assets and liabilities are based primarily on the fluctuation of interest rates between the date on which the IRLC and FSC were entered and year-end.
Off-balance sheet instruments — The fair values of commercial loan commitments and letters of credit are based on fees currently charged to enter into similar agreements, taking into account the remaining terms of the agreements and were not material at December 31, 2010 and 2009.
The fair values of certain of these instruments were calculated by discounting expected cash flows, which contain numerous uncertainties and involve significant judgments by management. Fair value is the estimated amount at which financial assets or liabilities could be exchanged in a current transaction between willing parties other than in a forced or liquidation sale. Because no market exists for certain of these financial instruments and because management does not intend to sell these financial instruments, the Company does not know whether the fair values shown below represent values at which the respective financial instruments could be sold individually or in the aggregate.
The following table presents the estimated fair values of the Company’s financial instruments.
| 2010 | 2009 | |||||||||||||||
| Carrying Amount |
Estimated Fair Value |
Carrying Amount |
Estimated Fair Value |
|||||||||||||
| (Dollars in thousands) | ||||||||||||||||
| Financial assets: |
||||||||||||||||
| Cash and cash equivalents |
$ | 49,029 | $ | 49,029 | $ | 78,294 | $ | 78,294 | ||||||||
| Investment securities AFS |
398,698 | 398,698 | 506,678 | 506,678 | ||||||||||||
| Loans and leases, net of ALLL |
1,816,199 | 1,798,544 | 1,864,485 | 1,841,953 | ||||||||||||
| Covered loans |
497,545 | 497,445 | — | — | ||||||||||||
| FDIC loss share receivable |
153,111 | 153,383 | — | — | ||||||||||||
| Derivative assets - IRLC and FSC |
55 | 55 | 210 | 210 | ||||||||||||
| Financial liabilities: |
||||||||||||||||
| Demand, NOW, savings and money market account deposits |
$ | 1,597,643 | $ | 1,597,643 | $ | 1,151,718 | $ | 1,151,718 | ||||||||
| Time deposits |
943,110 | 947,447 | 877,276 | 881,463 | ||||||||||||
| Repurchase agreements with customers |
43,324 | 43,324 | 44,269 | 44,269 | ||||||||||||
| Other borrowings |
282,139 | 349,964 | 342,553 | 423,404 | ||||||||||||
| Subordinated debentures |
64,950 | 29,377 | 64,950 | 27,650 | ||||||||||||
| Derivative liabilities - IRLC and FSC |
55 | 55 | 210 | 210 | ||||||||||||
21. Supplemental Cash Flow Information
Supplemental cash flow information is as follows:
| Year Ended December 31, | ||||||||||||
| 2010 | 2009 | 2008 | ||||||||||
| (Dollars in thousands) | ||||||||||||
| Cash paid during the period for: |
||||||||||||
| Interest |
$ | 35,476 | $ | 49,692 | $ | 86,591 | ||||||
| Taxes |
13,879 | 14,504 | 15,045 | |||||||||
| Supplemental schedule of non-cash investing and financing activities: |
||||||||||||
| Loans transfered to foreclosed and repossessed assets held for sale |
17,095 | 74,122 | 17,259 | |||||||||
| Loans advanced for sales of foreclosed and repossessed assets held for sale |
9,755 | 3,132 | 2,457 | |||||||||
| Net change in unrealized gains and losses on investment securities AFS |
(10,201 | ) | (15,783 | ) | 50,539 | |||||||
| Unsettled AFS investment security trades: |
||||||||||||
| Purchases |
— | 8,372 | 14,038 | |||||||||
| Sales/calls |
— | — | 2,525 | |||||||||
| Securities received on dissolution of unconsolidated investments |
— | — | 3,370 | |||||||||
85
22. Other Operating Expenses
The following table is a summary of other operating expenses.
| Year Ended December 31, | ||||||||||||
| 2010 | 2009 | 2008 | ||||||||||
| (Dollars in thousands) | ||||||||||||
| Postage and supplies |
$ | 1,981 | $ | 1,530 | $ | 1,633 | ||||||
| Telephone and data lines |
2,110 | 1,806 | 1,630 | |||||||||
| Advertising and public relations |
2,076 | 1,083 | 1,204 | |||||||||
| Professional and outside services |
3,024 | 1,793 | 1,537 | |||||||||
| ATM expense |
881 | 745 | 633 | |||||||||
| Software |
2,657 | 1,524 | 1,261 | |||||||||
| FDIC Insurance |
3,238 | 4,291 | 1,131 | |||||||||
| FDIC and state assessments |
678 | 673 | 664 | |||||||||
| Loan collection and repossession expense |
4,001 | 3,999 | 999 | |||||||||
| Write downs of other real estate owned |
8,960 | 4,009 | 1,042 | |||||||||
| Amortization of intangible assets |
431 | 110 | 213 | |||||||||
| Other |
6,603 | 5,482 | 3,448 | |||||||||
| Total other operating expenses |
$ | 36,640 | $ | 27,045 | $ | 15,395 | ||||||
23. Earnings Per Common Share (“EPS”)
The following table sets forth the computation of basic and diluted EPS.
| Year Ended December 31, | ||||||||||||
| 2010 | 2009 | 2008 | ||||||||||
| (In thousands, except per share amounts) | ||||||||||||
| Numerator: |
||||||||||||
| Distributed earnings allocated to common stock |
$ | 10,170 | $ | 8,778 | $ | 8,418 | ||||||
| Undistributed earnings allocated to common stock |
53,831 | 28,048 | 26,056 | |||||||||
| Net earnings allocated to common stock |
$ | 64,001 | $ | 36,826 | $ | 34,474 | ||||||
| Denominator: |
||||||||||||
| Denominator for basic EPS—weighted-average common shares |
16,969 | 16,880 | 16,849 | |||||||||
| Effect of dilutive securities—stock options |
76 | 20 | 25 | |||||||||
| Denominator for diluted EPS—weighted-average common shares and assumed conversions |
17,045 | 16,900 | 16,874 | |||||||||
| Basic EPS |
$ | 3.77 | $ | 2.18 | $ | 2.05 | ||||||
| Diluted EPS |
$ | 3.75 | $ | 2.18 | $ | 2.04 | ||||||
Options to purchase 98,150 shares, 487,350 shares and 464,200 shares, respectively, of the Company’s common stock at a weighted-average exercise price of $37.67 per share, $30.02 per share and $30.86 per share, respectively, were outstanding during 2010, 2009 and 2008, but were not included in the computation of diluted EPS because the options’ exercise price was greater than the average market price of the common shares and inclusion would have been antidilutive. Additionally, a warrant for the purchase of 379,811 shares of the Company’s common stock at an exercise price of $29.62 was outstanding at December 31, 2008 (none at December 31, 2010 and 2009) but was not included in the diluted EPS computation as inclusion would have been antidilutive.
24. Subsequent Event
On January 14, 2011, the Company, through the Bank, entered into a purchase and assumption agreement with loss share agreements with the FDIC, pursuant to which the Bank acquired substantially all of the assets and assumed substantially all of the deposits and certain other liabilities of the former Oglethorpe Bank (“Oglethorpe Bank”), headquartered in Brunswick, Georgia.
86
Under the terms of the purchase and assumption agreement, the Bank acquired approximately $193 million of Oglethorpe Bank assets which excluded approximately $25 million of assets and approximately $4 million of allowance for loan losses retained by the FDIC. Assets acquired include approximately $162 million of loans, approximately $15 million of other real estate owned by Oglethorpe Bank and approximately $16 million of other assets. The assets were purchased from the FDIC at a discount of $38.0 million with no stated deposit premium. The Bank also assumed approximately $195 million of deposits and other liabilities. In connection with the acquisition, the FDIC paid the Bank $40.5 million.
During the first quarter of 2011, the Company expects to complete its analysis of the acquired loans and other assets and assumed liabilities in this transaction. The estimated fair values of acquired assets and assumed liabilities are expected to differ materially from the amounts presented above.
Pursuant to the terms of the loss share agreements, the FDIC will reimburse the Bank for 80% of the losses on the disposition of loans and foreclosed other real estate. The Bank will reimburse the FDIC for 80% of recoveries with respect to losses for which the FDIC paid the Bank 80% reimbursement under the loss sharing agreements. The loss share agreement applicable to single family residential mortgage loans and related foreclosed real estate provides for FDIC loss sharing and the Bank’s reimbursement to the FDIC for ten years. The loss sharing agreement applicable to commercial loans and related foreclosed real estate provides for FDIC loss sharing for five years and the Bank reimbursement to the FDIC for eight years.
The terms of the purchase and assumption agreement provide for the FDIC to indemnify the Bank against certain claims, including claims with respect to liabilities and assets of Oglethorpe Bank or any of its affiliates not assumed or otherwise purchased by the Bank and with respect to claims based on any action by Oglethorpe Bank’s directors, officers and other employees.
25. Parent Company Financial Information
The following condensed balance sheets, income statements and statements of cash flows reflect the financial position, results of operations and cash flows for the parent company.
Condensed Balance Sheets
| December 31, | ||||||||
| 2010 | 2009 | |||||||
| (Dollars in thousands) | ||||||||
| Assets |
||||||||
| Cash |
$ | 6,570 | $ | 8,437 | ||||
| Investment in consolidated bank subsidiary |
365,518 | 310,161 | ||||||
| Investment in unconsolidated Trusts |
1,950 | 1,950 | ||||||
| Investments securities AFS |
— | 485 | ||||||
| Loans |
8,236 | 8,768 | ||||||
| Land for future branch site |
— | 1,875 | ||||||
| Excess cost over fair value of net assets acquired |
1,092 | 1,092 | ||||||
| Income taxes receivable |
893 | — | ||||||
| Other, net |
1,382 | 1,554 | ||||||
| Total assets |
$ | 385,641 | $ | 334,322 | ||||
| Liabilities and Stockholders’ Equity |
||||||||
| Accounts payable and other liabilities |
$ | 163 | $ | 46 | ||||
| Accrued interest payable |
173 | 171 | ||||||
| Income taxes payable |
— | 127 | ||||||
| Subordinated debentures |
64,950 | 64,950 | ||||||
| Total liabilities |
65,286 | 65,294 | ||||||
| Stockholders’ equity: |
||||||||
| Common stock |
170 | 169 | ||||||
| Additional paid-in capital |
45,278 | 41,584 | ||||||
| Retained earnings |
275,074 | 221,243 | ||||||
| Accumulated other comprehensive income (loss) |
(167 | ) | 6,032 | |||||
| Total stockholders’ equity |
320,355 | 269,028 | ||||||
| Total liabilities and stockholders’ equity |
$ | 385,641 | $ | 334,322 | ||||
87
Condensed Statements of Income
| Year Ended December 31, | ||||||||||||
| 2010 | 2009 | 2008 | ||||||||||
| (Dollars in thousands) | ||||||||||||
| Income: |
||||||||||||
| Dividends from Bank |
$ | 13,200 | $ | 92,200 | $ | 14,400 | ||||||
| Dividends from Trusts |
53 | 64 | 113 | |||||||||
| Interest |
1,152 | 984 | 183 | |||||||||
| Other |
— | 138 | 137 | |||||||||
| Total income |
14,405 | 93,386 | 14,833 | |||||||||
| Expenses: |
||||||||||||
| Interest |
1,764 | 2,138 | 3,760 | |||||||||
| Other operating expenses |
2,853 | 2,258 | 2,411 | |||||||||
| Total expenses |
4,617 | 4,396 | 6,171 | |||||||||
| Net income before income tax benefit and equity in undistributed earnings of Bank |
9,788 | 88,990 | 8,662 | |||||||||
| Income tax benefit |
1,527 | 1,482 | 2,432 | |||||||||
| Equity in undistributed earnings of Bank |
52,686 | (47,370 | ) | 23,607 | ||||||||
| Net income |
64,001 | 43,102 | 34,701 | |||||||||
| Preferred stock dividends and amortization of preferred stock discount |
— | (6,276 | ) | (227 | ) | |||||||
| Net income available to common stockholders |
$ | 64,001 | $ | 36,826 | $ | 34,474 | ||||||
Condensed Statements of Cash Flows
| Year Ended December 31, | ||||||||||||
| 2010 | 2009 | 2008 | ||||||||||
| (Dollars in thousands) | ||||||||||||
| Cash flows from operating activities: |
||||||||||||
| Net income |
$ | 64,001 | $ | 43,102 | $ | 34,701 | ||||||
| Adjustments to reconcile net income to net cash provided by operating activities: |
||||||||||||
| Equity in undistributed earnings of Bank |
(52,686 | ) | 47,370 | (23,607 | ) | |||||||
| Loss (gain) on sale of investment securities AFS |
130 | (162 | ) | — | ||||||||
| Deferred income tax expense (benefit) |
169 | (63 | ) | (330 | ) | |||||||
| Stock-based compensation expense |
834 | 712 | 862 | |||||||||
| Tax benefits on exercise of stock options |
(535 | ) | (111 | ) | (283 | ) | ||||||
| Changes in other assets and other liabilities |
(831 | ) | (802 | ) | 999 | |||||||
| Net cash provided by operating activities |
11,082 | 90,046 | 12,342 | |||||||||
| Cash flows from investing activities: |
||||||||||||
| Net paydowns (fundings) of portfolio loans and leases |
531 | (3,880 | ) | (2,449 | ) | |||||||
| Proceeds from sales of investment securities AFS |
330 | 1,437 | — | |||||||||
| Equity contributed to Bank |
(7,000 | ) | — | (87,000 | ) | |||||||
| Net cash used by investing activities |
(6,139 | ) | (2,443 | ) | (89,449 | ) | ||||||
| Cash flows from financing activities: |
||||||||||||
| Proceeds from exercise of stock options |
2,825 | 258 | 408 | |||||||||
| Tax benefits on exercise of stock options |
535 | 111 | 283 | |||||||||
| Proceeds from issuance of preferred stock and common stock warrant |
— | — | 75,000 | |||||||||
| Redemption of preferred stock |
— | (75,000 | ) | — | ||||||||
| Repurchase of common stock warrant |
— | (2,650 | ) | — | ||||||||
| Cash dividends paid on preferred stock |
— | (3,354 | ) | — | ||||||||
| Cash dividends paid on common stock |
(10,170 | ) | (8,778 | ) | (8,418 | ) | ||||||
| Net cash (used) provided by financing activities |
(6,810 | ) | (89,413 | ) | 67,273 | |||||||
| Net decrease in cash |
(1,867 | ) | (1,810 | ) | (9,834 | ) | ||||||
| Cash - beginning of year |
8,437 | 10,247 | 20,081 | |||||||||
| Cash - end of year |
$ | 6,570 | $ | 8,437 | $ | 10,247 | ||||||
88