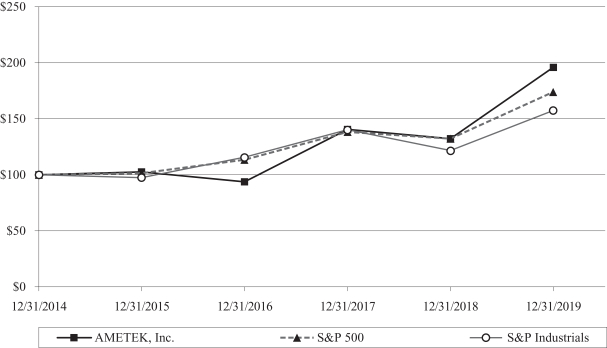
ANNUAL REPORT PURSUANT TO SECTION 13 OR 15(d) OF THE SECURITIES EXCHANGE ACT OF 1934 |
TRANSITION REPORT PURSUANT TO SECTION 13 OR 15(d) OF THE SECURITIES EXCHANGE ACT OF 1934 |
|
| |
(State or other jurisdiction of incorporation or organization) |
(I.R.S. Employer Identification No.) | |
|
| |
(Address of principal executive offices) |
(Zip Code) |
Title of each class |
Trading symbol(s) |
Name of each exchange on which registered | ||
|
|
|
|
☒ |
Accelerated filer |
☐ | |||
Non-accelerated filer |
☐ |
Smaller reporting company |
| |||
Emerging growth company |
|
Page |
||||||
PART I |
||||||
Item 1. |
2 |
|||||
Item 1A. |
11 |
|||||
Item 1B. |
17 |
|||||
Item 2. |
18 |
|||||
Item 3. |
18 |
|||||
Item 4. |
18 |
|||||
PART II |
||||||
Item 5. |
19 |
|||||
Item 6. |
22 |
|||||
Item 7. |
24 |
|||||
Item 7A. |
34 |
|||||
Item 8. |
35 |
|||||
Item 9. |
86 |
|||||
Item 9A. |
86 |
|||||
Item 9B. |
86 |
|||||
PART III |
||||||
Item 10. |
86 |
|||||
Item 11. |
87 |
|||||
Item 12. |
87 |
|||||
Item 13. |
87 |
|||||
Item 14. |
87 |
|||||
PART IV |
||||||
Item 15. |
88 |
|||||
Item 16. |
90 |
|||||
91 |
Item 1. |
Business |
• | AMETEK Programmable Power launched the RX0424, a rugged accelerometer instrument for measuring acceleration forces in extreme environmental conditions |
• | AMETEK SMP added two new titanium strip grades to expand their product portfolio for medical application that will ultimately help in the treatment of Parkinson’s disease, sleep apnea and chronic pain without the use of opioids |
• | Barben Analytical introduced the second generation OXYvisor ® , a trace to percent level, optical process oxygen analyzer to help prevent the corrosion of capital equipment and ensure product quality |
• | The SPECTROGREEN is the latest inductively coupled plasma optical emission spectrometer from SPECTRO Analytical Instruments that features revolutionary Dual Side-On Interface plasma viewing technology |
• | Vision Research launched several new cameras, including the Phantom ® S640 and VEO 440 high-speed cameras as well as the Phantom Miro C320J and C320 for automotive crash testing |
• | AMETEK Land launched two new continuous emission monitoring systems, the 4650-PM and 4750-PM, to accurately and reliably measure particulate matter from the industrial combustion processes |
• | Creaform launched two new handheld scanners, the HandySCAN BLACK and the Go!SCAN SPARK, both of which are third-generation versions of the company’s patented 3D scanning technology |
• | To better detect leaks in Modified Atmosphere Packaging, AMETEK MOCON developed the Dansensor LeakPointer 3 and LeakPointer 3+ for the food industry, where micro leaks in packaging can drastically affect product integrity |
• | Adding to their legacy of innovation, Haydon Kerk Pittman launched the EC042B IDEA Motor Series, a brushless motor with integrated drive optimized for specialized motion applications |
• | AMETEK Grabner Instruments launched the MINIFLASH FP Vision, which determines the flashpoint of flammable liquid mixtures with faster cooling cycles and sample turnaround times thanks to advanced Peltier technology |
• | The EIKOS-UV, a new atom probe microscope from AMETEK CAMECA, delivers nanoscale structural information to help develop products across industrial applications |
• | AMETEK EDAX, a leader in X-ray microanalysis and electron diffraction instrumentation, launched the OIM Matrix™ software package, Elite T Ultra EDS System and the Velocity™ Super EBSD Camera, which was developed in partnership with the Vision Research team. |
2019 |
2018 |
2017 |
||||||||||
(In millions) |
||||||||||||
Electronic Instruments |
$ |
842.5 |
$ | 765.5 |
$ | 718.1 |
||||||
Electromechanical |
875.4 |
836.6 |
678.0 |
|||||||||
Total |
$ |
1,717.9 |
$ | 1,602.1 |
$ | 1,396.1 |
||||||
• | Our ability to identify acceptable acquisition candidates; |
• | The impact of increased competition for acquisitions, which may increase acquisition costs, affect our ability to consummate acquisitions on favorable terms, and result in us assuming a greater portion of the seller’s liabilities; |
• | Successfully integrating acquired businesses, including integrating the management, technological and operational processes, procedures and controls of the acquired businesses with those of our existing operations; |
• | Adequate financing for acquisitions being available on terms acceptable to us; |
• | Unexpected losses of key employees, customers and suppliers of acquired businesses; |
• | Mitigating assumed, contingent and unknown liabilities; and |
• | Challenges in managing the increased scope, geographic diversity and complexity of our operations. |
• | Imposition of trade or foreign exchange restrictions, including in the United States; |
• | Overlap of different tax structures; |
• | Unexpected changes in regulatory requirements, including in the United States; |
• | Trade protection measures, such as the imposition of or increase in tariffs and other trade barriers, including in the United States; |
• | The difficulty and/or costs of designing and implementing an effective control environment across diverse regions and employee bases; |
• | Restrictions on currency repatriation; |
• | General economic conditions; |
• | Unstable political situations; |
• | Nationalization of assets; and |
• | Compliance with a wide variety of international and U.S. laws and regulatory requirements. |
Item 2. |
Properties |
Item 3. |
Legal Proceedings |
Item 4. |
Mine Safety Disclosures |
Item 5. |
Market for Registrant’s Common Equity, Related Stockholder Matters and Issuer Purchases of Equity Securities |
Period |
Total Number of Shares Purchased (1)(2) |
Average Price Paid per Share |
Total Number of Shares Purchased as Part of Publicly Announced Plan (2) |
Approximate Dollar Value of Shares that May Yet Be Purchased Under the Plan |
||||||||||||
October 1, 2019 to October 31, 2019 |
— |
$ | — |
— |
$ | 494,436,704 |
||||||||||
November 1, 2019 to November 30, 2019 |
55,211 |
96.20 |
55,211 |
489,125,278 |
||||||||||||
December 1, 2019 to December 31, 2019 |
— |
— |
— |
489,125,278 |
||||||||||||
Total |
55,211 |
96.20 |
55,211 |
|||||||||||||
(1) | Represents shares surrendered to the Company to satisfy tax withholding obligations in connection with employees’ share-based compensation awards. |
(2) | Consists of the number of shares purchased pursuant to the Company’s Board of Directors $500 million authorization for the repurchase of its common stock announced in February 2019. Such purchases may be effected from time to time in the open market or in private transactions, subject to market conditions and at management’s discretion. |
Plan category |
Number of securities to be issued upon exercise of outstanding options, warrants and rights (a) |
Weighted average exercise price of outstanding options, warrants and rights (b) |
Number of securities remaining available for future issuance under equity compensation plans (excluding securities reflected in column (a)) (c) |
|||||||||
Equity compensation plans approved by security holders |
4,302,540 |
$ | 62.50 |
4,579,533 |
||||||||
Equity compensation plans not approved by security holders |
— |
— |
— |
|||||||||
Total |
4,302,540 |
62.50 |
4,579,533 |
|||||||||
December 31, |
||||||||||||||||||||||||
2014 |
2015 |
2016 |
2017 |
2018 |
2019 |
|||||||||||||||||||
AMETEK, Inc. |
$ | 100.00 |
$ | 102.51 |
$ | 93.66 |
$ | 140.48 |
$ | 132.20 |
$ | 196.00 |
||||||||||||
S&P 500 Index |
100.00 |
101.38 |
113.51 |
138.29 |
132.23 |
173.86 |
||||||||||||||||||
S&P Industrials |
100.00 |
97.47 |
115.85 |
140.22 |
121.58 |
157.29 |
Item 6. |
Selected Financial Data |
2019 |
2018 |
2017 |
2016 |
2015 |
||||||||||||||||
(In millions, except per share amounts) |
||||||||||||||||||||
Consolidated Operating Results (Year Ended December 31): |
||||||||||||||||||||
Net sales |
$ |
5,158.6 |
$ | 4,845.9 |
$ | 4,300.2 |
$ | 3,840.1 |
$ | 3,974.3 |
||||||||||
Operating income (1) |
$ |
1,177.4 |
$ | 1,075.5 |
$ | 903.6 |
$ | 791.0 |
$ | 907.7 |
||||||||||
Interest expense |
$ |
88.5 |
$ | 82.2 |
$ | 98.0 |
$ | 94.3 |
$ | 91.8 |
||||||||||
Net income |
$ |
861.3 |
$ | 777.9 |
$ | 681.5 |
$ | 512.2 |
$ | 590.9 |
||||||||||
Earnings per share: |
||||||||||||||||||||
Basic |
$ |
3.78 |
$ | 3.37 |
$ | 2.96 |
$ | 2.20 |
$ | 2.46 |
||||||||||
Diluted |
$ |
3.75 |
$ | 3.34 |
$ | 2.94 |
$ | 2.19 |
$ | 2.45 |
||||||||||
Dividends declared and paid per share |
$ |
0.56 |
$ | 0.56 |
$ | 0.36 |
$ | 0.36 |
$ | 0.36 |
||||||||||
Weighted average common shares outstanding: |
||||||||||||||||||||
Basic |
227.8 |
230.8 |
230.2 |
232.6 |
239.9 |
|||||||||||||||
Diluted |
229.4 |
232.7 |
231.8 |
233.7 |
241.6 |
|||||||||||||||
Performance Measures and Other Data: |
||||||||||||||||||||
Operating income — Return on net sales (1) |
22.8 |
% |
22.2 |
% | 21.0 |
% | 20.6 |
% | 22.8 |
% | ||||||||||
— Return on average total assets (1) |
12.7 |
% |
13.1 |
% | 12.1 |
% | 11.5 |
% | 13.9 |
% | ||||||||||
Net income — Return on average total capital |
11.7 |
% |
11.9 |
% | 11.6 |
% | 9.5 |
% | 11.6 |
% | ||||||||||
— Return on average stockholders’ equity |
18.4 |
% |
18.8 |
% | 18.7 |
% | 15.7 |
% | 18.2 |
% | ||||||||||
EBITDA (2) |
$ |
1,388.3 |
$ | 1,267.7 |
$ | 1,076.0 |
$ | 966.0 |
$ | 1,046.9 |
||||||||||
Ratio of EBITDA to interest expense (2) |
15.7x |
15.4x |
11.0x |
10.2x |
11.4x |
|||||||||||||||
Depreciation and amortization |
$ |
234.0 |
$ | 199.5 |
$ | 183.2 |
$ | 179.7 |
$ | 149.5 |
||||||||||
Capital expenditures |
$ |
102.3 |
$ | 82.1 |
$ | 75.1 |
$ | 63.3 |
$ | 69.1 |
||||||||||
Cash provided by operating activities |
$ |
1,114.4 |
$ | 925.5 |
$ | 833.3 |
$ | 756.8 |
$ | 672.5 |
||||||||||
Free cash flow (3) |
$ |
1,012.1 |
$ | 843.4 |
$ | 758.2 |
$ | 693.5 |
$ | 603.4 |
||||||||||
Consolidated Financial Position (At December 31): |
||||||||||||||||||||
Current assets |
$ |
2,025.8 |
$ | 1,836.1 |
$ | 1,934.7 |
$ | 1,928.2 |
$ | 1,618.8 |
||||||||||
Current liabilities |
$ |
1,425.9 |
$ | 1,258.7 |
$ | 1,138.7 |
$ | 924.4 |
$ | 1,024.0 |
||||||||||
Property, plant and equipment, net |
$ |
548.9 |
$ | 554.1 |
$ | 493.3 |
$ | 473.2 |
$ | 484.5 |
||||||||||
Total assets |
$ |
9,844.6 |
$ | 8,662.3 |
$ | 7,796.1 |
$ | 7,100.7 |
$ | 6,660.5 |
||||||||||
Long-term debt, net |
$ |
2,271.3 |
$ | 2,273.8 |
$ | 1,866.2 |
$ | 2,062.6 |
$ | 1,553.1 |
||||||||||
Total debt, net |
$ |
2,768.7 |
$ | 2,632.7 |
$ | 2,174.3 |
$ | 2,341.6 |
$ | 1,938.0 |
||||||||||
Stockholders’ equity |
$ |
5,115.5 |
$ | 4,241.9 |
$ | 4,027.6 |
$ | 3,256.5 |
$ | 3,254.6 |
||||||||||
Stockholders’ equity per share |
$ |
22.33 |
$ | 18.68 |
$ | 17.42 |
$ | 14.20 |
$ | 13.82 |
||||||||||
Total debt as a percentage of capitalization |
35.1 |
% |
38.3 |
% | 35.1 |
% | 41.8 |
% | 37.3 |
% | ||||||||||
Net debt as a percentage of capitalization (4) |
31.7 |
% |
34.9 |
% | 27.5 |
% | 33.3 |
% | 32.4 |
% |
(1) | Amounts prior to 2016 do not reflect the adoption of ASU No. 2017-07, Improving the Presentation of Net Periodic Pension Cost and Net Periodic Postretirement Benefit Cost 2017-07”). |
(2) | EBITDA represents earnings before interest, income taxes, depreciation and amortization. EBITDA is presented because the Company is aware that it is used by rating agencies, securities analysts, investors and other parties in evaluating the Company. It should not be considered, however, as an alternative to operating income as an indicator of the Company’s operating performance or as an alternative to cash flows as a measure of the Company’s overall liquidity as presented in the Company’s consolidated financial statements. Furthermore, EBITDA measures shown for the Company may not be comparable to similarly titled measures used by other companies. The following table presents the reconciliation of net income reported in accordance with U.S. generally accepted accounting principles (“GAAP”) to EBITDA: |
Year Ended December 31, |
||||||||||||||||||||
2019 |
2018 |
2017 |
2016 |
2015 |
||||||||||||||||
(In millions) |
||||||||||||||||||||
Net income |
$ |
861.3 |
$ | 777.9 |
$ | 681.5 |
$ | 512.2 |
$ | 590.9 |
||||||||||
Add (deduct): |
||||||||||||||||||||
Interest expense |
88.5 |
82.2 |
98.0 |
94.3 |
91.8 |
|||||||||||||||
Interest income |
(4.0 |
) |
(1.7 |
) | (2.0 |
) | (1.1 |
) | (0.8 |
) | ||||||||||
Income taxes |
208.5 |
209.8 |
115.3 |
180.9 |
215.5 |
|||||||||||||||
Depreciation |
101.4 |
85.4 |
82.0 |
74.8 |
68.7 |
|||||||||||||||
Amortization |
132.6 |
114.1 |
101.2 |
104.9 |
80.8 |
|||||||||||||||
Total adjustments |
527.0 |
489.8 |
394.5 |
453.8 |
456.0 |
|||||||||||||||
EBITDA |
$ |
1,388.3 |
$ | 1,267.7 |
$ | 1,076.0 |
$ | 966.0 |
$ | 1,046.9 |
||||||||||
(3) | Free cash flow represents cash flow from operating activities less capital expenditures. Free cash flow is presented because the Company is aware that it is used by rating agencies, securities analysts, investors and other parties in evaluating the Company. The following table presents the reconciliation of cash flow from operating activities reported in accordance with U.S. GAAP to free cash flow: |
Year Ended December 31, |
||||||||||||||||||||
2019 |
2018 |
2017 |
2016 |
2015 |
||||||||||||||||
(In millions) |
||||||||||||||||||||
Cash provided by operating activities |
$ |
1,114.4 |
$ | 925.5 |
$ | 833.3 |
$ | 756.8 |
$ | 672.5 |
||||||||||
Deduct: Capital expenditures |
(102.3 |
) |
(82.1 |
) | (75.1 |
) | (63.3 |
) | (69.1 |
) | ||||||||||
Free cash flow |
$ |
1,012.1 |
$ | 843.4 |
$ | 758.2 |
$ | 693.5 |
$ | 603.4 |
||||||||||
(4) | Net debt represents total debt, net minus cash and cash equivalents. Net debt is presented because the Company is aware that it is used by rating agencies, securities analysts, investors and other parties in evaluating the Company. The following table presents the reconciliation of total debt, net reported in accordance with U.S. GAAP to net debt: |
December 31, |
||||||||||||||||||||
2019 |
2018 |
2017 |
2016 |
2015 |
||||||||||||||||
(In millions) |
||||||||||||||||||||
Total debt, net |
$ |
2,768.7 |
$ | 2,632.7 |
$ | 2,174.3 |
$ | 2,341.6 |
$ | 1,938.0 |
||||||||||
Less: Cash and cash equivalents |
(393.0 |
) |
(354.0 |
) | (646.3 |
) | (717.3 |
) | (381.0 |
) | ||||||||||
Net debt |
2,375.7 |
2,278.7 |
1,528.0 |
1,624.3 |
1,557.0 |
|||||||||||||||
Stockholders’ equity |
5,115.5 |
4,241.9 |
4,027.6 |
3,256.5 |
3,254.6 |
|||||||||||||||
Capitalization (net debt plus stockholders’ equity) |
$ |
7,491.2 |
$ | 6,520.6 |
$ | 5,555.6 |
$ | 4,880.8 |
$ | 4,811.6 |
||||||||||
Net debt as a percentage of capitalization |
31.7 |
% |
34.9 |
% | 27.5 |
% | 33.3 |
% | 32.4 |
% | ||||||||||
Item 7. |
Management’s Discussion and Analysis of Financial Condition and Results of Operations |
• | Orders for 2019 were $5,274.3 million, an increase of $222.5 million or 4.4%, compared with $5,051.8 million in 2018. As a result, the Company’s backlog of unfilled orders at December 31, 2019 was $1,717.9 million. |
• | Net sales for 2019 were $5,158.6 million, an increase of $312.7 million or 6.5%, compared with $4,845.9 million in 2018. The increase in net sales for 2019 was due to 2% organic sales growth, a 5% increase from the 2019 and 2018 acquisitions, partially offset by unfavorable foreign currency translation. |
• | Net income for 2019 was $861.3 million, an increase of $83.4 million or 10.7%, compared with $777.9 million in 2018. |
• | Diluted earnings per share for 2019 were $3.75, an increase of $0.41 or 12.3%, compared with $3.34 per diluted share in 2018. |
• | Cash flow provided by operating activities for 2019 was $1,114.4 million, an increase of $188.9 million or 20.4%, compared with $925.5 million in 2018. |
• | During 2019, the Company spent $1,061.9 million in cash, net of cash acquired, to acquire two businesses: |
• | In September 2019, AMETEK acquired Pacific Design Technologies, Inc. (“PDT”), a provider of advanced, mission-critical thermal management solutions; and |
• | In October 2019, AMETEK acquired Gatan, a provider of instrumentation and software used to enhance and extend the operation and performance of electron telescopes. |
• | In the fourth quarter of 2019, the Company paid in full, at maturity, $100 million in aggregate principal amount of 6.30% private placement senior notes. |
• | A $100 million second funding of the December 2018 Private Placement occurred in January 2019. |
• | In 2019, the Company repurchased approximately 133,000 shares of its common stock for $11.9 million. |
• | The Company continued its emphasis on investment in research, development and engineering, spending $260.3 million in 2019 before customer reimbursement of $3.2 million. |
Year Ended December 31, |
||||||||||||
2019 |
2018 |
2017 |
||||||||||
(In thousands) |
||||||||||||
Net sales: |
||||||||||||
Electronic Instruments |
$ |
3,322,881 |
$ | 3,028,959 |
$ | 2,690,554 |
||||||
Electromechanical |
1,835,676 |
1,816,913 |
1,609,616 |
|||||||||
Consolidated net sales |
$ |
5,158,557 |
$ | 4,845,872 |
$ | 4,300,170 |
||||||
Operating income and income before income taxes: |
||||||||||||
Segment operating income: |
||||||||||||
Electronic Instruments |
$ |
865,307 |
$ | 782,144 |
$ | 671,646 |
||||||
Electromechanical |
387,931 |
363,765 |
306,779 |
|||||||||
Total segment operating income |
1,253,238 |
1,145,909 |
978,425 |
|||||||||
Corporate administrative expenses |
(75,858 |
) |
(70,369 |
) | (74,805 |
) | ||||||
Consolidated operating income |
1,177,380 |
1,075,540 |
903,620 |
|||||||||
Interest expense |
(88,481 |
) |
(82,180 |
) | (98,029 |
) | ||||||
Other expense, net |
(19,151 |
) |
(5,615 |
) | (8,862 |
) | ||||||
Consolidated income before income taxes |
$ |
1,069,748 |
$ | 987,745 |
$ | 796,729 |
||||||
Payments Due |
||||||||||||||||||||
Contractual Obligations (1) |
Total |
Less Than One Year |
One to Three Years |
Four to Five Years |
After Five Years |
|||||||||||||||
(In millions) |
||||||||||||||||||||
Long-term debt borrowings (2) |
$ | 2,382.1 |
$ | 106.1 |
$ | 56.8 |
$ | 725.0 |
$ | 1,494.2 |
||||||||||
Revolving credit loans (3) |
384.8 |
384.8 |
— |
— |
— |
|||||||||||||||
Other indebtedness |
9.2 |
9.2 |
— |
— |
— |
|||||||||||||||
Total debt (4) |
2,776.1 |
500.1 |
56.8 |
725.0 |
1,494.2 |
|||||||||||||||
Interest on long-term fixed-rate debt |
516.2 |
73.6 |
139.0 |
134.9 |
168.7 |
|||||||||||||||
Noncancellable operating leases (5) |
208.0 |
49.4 |
76.2 |
43.4 |
39.0 |
|||||||||||||||
Purchase obligations (6) |
505.2 |
478.5 |
23.0 |
2.8 |
0.9 |
|||||||||||||||
Restructuring and other |
23.8 |
23.8 |
— |
— |
— |
|||||||||||||||
Total |
$ | 4,029.3 |
$ | 1,125.4 |
$ | 295.0 |
$ | 906.1 |
$ | 1,702.8 |
||||||||||
(1) | The liability for uncertain tax positions was not included in the table of contractual obligations as of December 31, 2019 because the timing of the settlements of these uncertain tax positions cannot be reasonably estimated at this time. See Note 9 to the Consolidated Financial Statements included in Part II, Item 8 of this Annual Report on Form 10-K for further details. |
(2) | See Note 10 to the Consolidated Financial Statements included in Part II, Item 8 of this Annual Report on Form 10-K for further details. |
(3) | Although not contractually obligated, the Company expects to have the capability to repay the revolving credit loan within one year as permitted in the Credit Agreement. Accordingly, $384.8 million was classified as short-term debt at December 31, 2019. |
(4) | Excludes debt issuance costs of $7.4 million, of which $2.7 million is classified as current and $4.7 million is classified as long-term. See Note 10 to the Consolidated Financial Statements included in Part II, Item 8 of this Annual Report on Form 10-K for further details. |
(5) | The leases expire over a range of years from 2020 to 2034, except for a single land lease with 64 years remaining. Most of the leases contain renewal or purchase options, subject to various terms and conditions. |
(6) | Purchase obligations primarily consist of contractual commitments to purchase certain inventories at fixed prices. |
• | Business Combinations |
• | Goodwill and Other Intangible Assets. |
• | Pensions. |
• | Income Taxes. |
Item 7A. |
Quantitative and Qualitative Disclosures About Market Risk |
Item 8. |
Financial Statements and Supplementary Data |
Page |
||||
Index to Financial Statements (Item 15(a)(1)) |
||||
36 |
||||
37 |
||||
41 |
||||
42 |
||||
43 |
||||
44 |
||||
45 |
||||
46 |
/s/ David A. Zapico |
/s/ William J. Burke | |
Chairman of the Board and Chief Executive Officer |
Executive Vice President – Chief Financial Officer |
Accounting for Acquisitions | ||
Description of the Matter |
As described in Note 6 to the consolidated financial statements, the Company completed the acquisition of Gatan in October 2019 for consideration of $938.5 million, net of cash acquired. This acquisition has been accounted for as a business combination. The Company also completed the acquisition of Telular Corporation in October 2018 for consideration of $525 million, net of cash acquired. This acquisition has been accounted for as a business combination and the finalization of the acquisition accounting was completed during the measurement period in 2019. Auditing the Company’s accounting for the acquisitions of Telular and Gatan were complex and highly judgmental due to subjectivity of the significant assumptions used by management in the valuation of acquired identifiable intangible assets. In particular, the inputs to the valuation models used to estimate the fair value of acquired identifiable intangible assets were inherently uncertain and generally unobservable, and the resulting valuations were sensitive to changes in the underlying significant assumptions. The significant assumptions used included discount rates, royalty rates and certain assumptions that form the basis of the forecasted future cash flows, including revenue growth rates, earnings before interest, taxes, depreciation and amortization (EBITDA) margins and estimated economic lives. These significant assumptions are forward looking and could be affected by future economic or market conditions. | |
How We Addressed the Matter in Our Audit |
We obtained an understanding, evaluated the design and tested the operating effectiveness of controls over the Company’s accounting for business combinations process. For example, we tested controls over the valuation of acquired identifiable intangible assets including controls over management’s review of the valuation models and the significant assumptions described above. To test the estimated fair value of the identifiable intangible assets, we performed audit procedures that included, among others, assessing the fair value methodologies utilized by management and the significant assumptions discussed above, including the underlying data used in the analyses. For example, when evaluating the significant assumptions, we compared them to current financial and operating plans, market and industry studies, historical trends, and assumptions used in prior periods. We also performed sensitivity analyses of significant assumptions to evaluate the changes in the fair value estimates of the acquired identifiable intangible assets that would result from changes in the assumptions. We involved our valuation specialists to assist in evaluating certain significant assumptions and valuation methodologies used by the Company. | |
Impairment Assessment of Indefinite Lived Intangible Assets (other than Goodwill) | ||
Description of the Matter |
At December 31, 2019, the Company’s indefinite lived intangible assets (other than goodwill) totaled $741.9 million, consisting of trademarks and trade names. As described in Note 1 to the consolidated financial statements, indefinite lived intangible assets are not amortized but are tested for impairment at least annually in the Company’s fourth quarter. Auditing management’s indefinite lived intangible asset impairment tests was complex and highly judgmental due to the significant measurement uncertainty in estimating the fair value of the trademarks and trade names. In particular, the fair value estimates were sensitive to significant assumptions such as discount rate, forecasted revenues and royalty rates, which are affected by expectations about future market or economic conditions. |
How We Addressed the Matter in Our Audit |
We obtained an understanding, evaluated the design and tested the operating effectiveness of controls over the Company’s indefinite lived intangible asset impairment process. For example, we tested controls over management’s review of the valuation models and significant assumptions, including forecasted financial information, as well as management’s controls to validate that the data used in the valuations was complete and accurate. To test the estimated fair value of the Company’s indefinite lived intangible assets, we performed audit procedures that included, among others, assessing the fair value methodologies utilized by management and the significant assumptions discussed above, including the underlying data used in the analyses. For example, when evaluating the significant assumptions, we compared them to current financial and operating plans, market and industry studies, historical trends, and other assumptions used in prior periods. We also assessed the historical accuracy of management’s forecasts and performed sensitivity analyses of significant assumptions to evaluate the changes in the fair value estimates of the trademarks and trade names that would result from changes in the assumptions. We involved our valuation specialists to assist in evaluating the discount rate, royalty rate and valuation methodologies used by the Company. |
Year Ended December 31, |
||||||||||||
2019 |
2018 |
2017 |
||||||||||
Net sales |
$ |
|
$ | |
$ | |
||||||
Cost of sales |
|
|
|
|||||||||
Selling, general and administrative |
|
|
|
|||||||||
Total operating expenses |
|
|
|
|||||||||
Operating income |
|
|
|
|||||||||
Interest expense |
( |
) |
( |
) | ( |
) | ||||||
Other expense, net |
( |
) |
( |
) | ( |
) | ||||||
Income before income taxes |
|
|
|
|||||||||
Provision for income taxes |
|
|
|
|||||||||
Net income |
$ |
|
$ | |
$ | |
||||||
Basic earnings per share |
$ |
|
$ | |
$ | |
||||||
Diluted earnings per share |
$ |
|
$ | |
$ | |
||||||
Weighted average common shares outstanding: |
||||||||||||
Basic shares |
|
|
|
|||||||||
Diluted shares |
|
|
|
|||||||||
Year Ended December 31, |
||||||||||||
2019 |
2018 |
2017 |
||||||||||
Net income |
$ |
$ | $ | |||||||||
Other comprehensive (loss) income: |
||||||||||||
Amounts arising during the period – gains (losses), net of tax (expense) benefit: |
||||||||||||
Foreign currency translation: |
||||||||||||
Translation adjustments |
( |
) | ||||||||||
Change in long-term intercompany notes |
( |
) |
( |
) | ||||||||
Net investment hedge instruments gain (loss), net of tax of $ |
( |
) |
( |
) | ||||||||
Defined benefit pension plans: |
||||||||||||
Net actuarial (loss) gain, net of tax of $ ( $ |
( |
) |
( |
) | ||||||||
Amortization of net actuarial loss, net of tax of ($ |
||||||||||||
Amortization of prior service costs, net of tax of ($ |
( |
) | ( |
) | ||||||||
Unrealized holding gain (loss) on available-for-sale securities: |
||||||||||||
Unrealized gain (loss), net of tax of $ |
— |
( |
) | |||||||||
Other comprehensive income (loss) |
( |
) | ||||||||||
Total comprehensive income |
$ |
$ | $ | |||||||||
December 31, |
||||||||
2019 |
2018 |
|||||||
ASSETS |
||||||||
Current assets: |
||||||||
Cash and cash equivalents |
$ |
|
$ | |
||||
Receivables |
|
|
||||||
Inventories, net |
|
|
||||||
Other current assets |
|
|
||||||
Total current assets |
|
|
||||||
Property, plant and equipment, net |
|
|
||||||
Right of use assets, net |
|
— |
||||||
Goodwill |
|
|
||||||
Other intangibles, net |
|
|
||||||
Investments and other assets |
|
|
||||||
Total assets |
$ |
|
$ | |
||||
LIABILITIES AND STOCKHOLDERS’ EQUITY |
||||||||
Current liabilities: |
||||||||
Short-term borrowings and current portion of long-term debt, net |
$ |
|
$ | |
||||
Accounts payable |
|
|
||||||
Customer advanced payments |
|
|
||||||
Income taxes payable |
|
|
||||||
Accrued liabilities and other |
|
|
||||||
Total current liabilities |
|
|
||||||
Long-term debt, net |
|
|
||||||
Deferred income taxes |
|
|
||||||
Other long-term liabilities |
|
|
||||||
Total liabilities |
|
|
||||||
Stockholders’ equity: |
||||||||
Preferred stock, $ |
|
|
||||||
Common stock, $ |
|
|
||||||
Capital in excess of par value |
|
|
||||||
Retained earnings |
|
|
||||||
Accumulated other comprehensive loss |
( |
) |
( |
) | ||||
Treasury stock: 2019 – |
( |
) |
( |
) | ||||
Total stockholders’ equity |
|
|
||||||
Total liabilities and stockholders’ equity |
$ |
|
$ | |
||||
Year Ended December 31, |
||||||||||||
2019 |
2018 |
2017 |
||||||||||
Capital stock |
||||||||||||
Preferred stock, $ |
$ | — |
$ | — |
$ | — |
||||||
Common stock, $ |
||||||||||||
Balance at the beginning of the year |
||||||||||||
Shares issued |
||||||||||||
Balance at the end of the year |
||||||||||||
Capital in excess of par value |
||||||||||||
Balance at the beginning of the year |
||||||||||||
Issuance of common stock under employee stock plans |
||||||||||||
Share-based compensation costs |
||||||||||||
Balance at the end of the year |
||||||||||||
Retained earnings |
||||||||||||
Balance at the beginning of the year |
||||||||||||
Net income |
||||||||||||
Cash dividends paid |
( |
) |
( |
) | ( |
) | ||||||
Other |
— |
|||||||||||
Balance at the end of the year |
||||||||||||
Accumulated other comprehensive (loss) income |
||||||||||||
Foreign currency translation: |
||||||||||||
Balance at the beginning of the year |
( |
) | ( |
) | ( |
) | ||||||
Translation adjustments |
( |
) | ||||||||||
Change in long-term intercompany notes |
( |
) |
( |
) | ||||||||
Net investment hedge instruments (loss) gain, net of tax of $ |
( |
) |
( |
) | ||||||||
Balance at the end of the year |
( |
) |
( |
) | ( |
) | ||||||
Defined benefit pension plans: |
||||||||||||
Balance at the beginning of the year |
( |
) | ( |
) | ( |
) | ||||||
Net actuarial (loss) gain, net of tax of $ |
( |
) |
( |
) | ||||||||
Amortization of net actuarial loss, net of tax of ($ |
||||||||||||
Amortization of prior service costs, net of tax of ($ |
( |
) | ( |
) | ||||||||
Balance at the end of the year |
( |
) |
( |
) | ( |
) | ||||||
Unrealized holding gain (loss) on available-for-sale securities: |
||||||||||||
Balance at the beginning of the year |
— |
( |
) | |||||||||
Increase (decrease) during the year, net of tax |
— |
( |
) |
|||||||||
Balance at the end of the year |
— |
— |
||||||||||
Accumulated other comprehensive loss at the end of the year |
( |
) |
( |
) | ( |
) | ||||||
Treasury stock |
||||||||||||
Balance at the beginning of the year |
( |
) | ( |
) | ( |
) | ||||||
Issuance of common stock under employee stock plans |
||||||||||||
Purchase of treasury stock |
( |
) |
( |
) | ( |
) | ||||||
Balance at the end of the year |
( |
) |
( |
) | ( |
) | ||||||
Total stockholders’ equity |
$ |
$ | $ | |||||||||
Year Ended December 31, |
||||||||||||
2019 |
2018 |
2017 |
||||||||||
Cash provided by (used for): |
||||||||||||
Operating activities: |
||||||||||||
Net income |
$ |
$ | $ | |||||||||
Adjustments to reconcile net income to total operating activities: |
||||||||||||
Depreciation and amortization |
||||||||||||
Deferred income taxes |
( |
) | ( |
) | ||||||||
Share-based compensation expense |
||||||||||||
(Gain) loss on sale of facilities |
( |
) |
( |
) | ||||||||
Changes in assets and liabilities, net of acquisitions: |
||||||||||||
Decrease (increase) in receivables |
( |
) | ( |
) | ||||||||
Decrease (increase) in inventories and other current assets |
( |
) | ( |
) | ||||||||
(Decrease) increase in payables, accruals and income taxes |
( |
) |
||||||||||
(Decrease) increase in other long-term liabilities |
( |
) |
||||||||||
Pension contributions |
( |
) |
( |
) | ( |
) | ||||||
Other, net |
( |
) | ( |
) | ||||||||
Total operating activities |
||||||||||||
Investing activities: |
||||||||||||
Additions to property, plant and equipment |
( |
) |
( |
) | ( |
) | ||||||
Purchases of businesses, net of cash acquired |
( |
) |
( |
) | ( |
) | ||||||
Proceeds from sale of facilities |
||||||||||||
Other, net |
( |
) | ( |
) | ||||||||
Total investing activities |
( |
) |
( |
) | ( |
) | ||||||
Financing activities: |
||||||||||||
Net change in short-term borrowings |
( |
) | ||||||||||
Proceeds from long-term borrowings |
— |
|||||||||||
Repayments of long-term borrowings |
( |
) |
( |
) | ( |
) | ||||||
Repurchases of common stock |
( |
) |
( |
) | ( |
) | ||||||
Cash dividends paid |
( |
) |
( |
) | ( |
) | ||||||
Acquisition contingent consideration |
( |
) |
( |
) | — |
|||||||
Proceeds from stock option exercises |
||||||||||||
Other, net |
( |
) |
( |
) | — |
|||||||
Total financing activities |
( |
) | ||||||||||
Effect of exchange rate changes on cash and cash equivalents |
( |
) | ||||||||||
Increase (decrease) in cash and cash equivalents |
( |
) | ( |
) | ||||||||
Cash and cash equivalents: |
||||||||||||
Beginning of year |
||||||||||||
End of year |
$ |
$ | $ | |||||||||
2019 |
2018 |
2017 |
||||||||||
(In thousands) |
||||||||||||
Weighted average shares: |
||||||||||||
Basic shares |
||||||||||||
Equity-based compensation plans |
||||||||||||
Diluted shares |
||||||||||||
2019 |
2018 |
|||||||
(In thousands) |
||||||||
Contract assets – January 1 |
$ | $ | ||||||
Contract assets – December 31 |
||||||||
Change in contract assets – increase |
||||||||
Contract liabilities – January 1 |
||||||||
Contract liabilities – December 31 |
||||||||
Change in contract liabilities – increase |
( |
) |
( |
) | ||||
Net change |
$ |
( |
) |
$ | ( |
) | ||
2019 |
||||||||||||
EIG |
EMG |
Total |
||||||||||
(In thousands) |
||||||||||||
United States |
$ |
|
$ |
|
$ |
|
||||||
International (1) : |
||||||||||||
United Kingdom |
|
|
|
|||||||||
European Union countries |
|
|
|
|||||||||
Asia |
|
|
|
|||||||||
Other foreign countries |
|
|
|
|||||||||
Total international |
|
|
|
|||||||||
Consolidated net sales |
$ |
|
$ |
|
$ |
|
||||||
(1) | Includes U.S. export sales of $ |
2018 |
||||||||||||
EIG |
EMG |
Total |
||||||||||
(In thousands) |
||||||||||||
United States |
$ | |
$ | |
$ | |
||||||
International (1) : |
||||||||||||
United Kingdom |
|
|
|
|||||||||
European Union countries |
|
|
|
|||||||||
Asia |
|
|
|
|||||||||
Other foreign countries |
|
|
|
|||||||||
Total international |
|
|
|
|||||||||
Consolidated net sales |
$ | |
$ | |
$ | |
||||||
(1) | Includes U.S. export sales of $ |
2017 |
||||||||||||
EIG |
EMG |
Total |
||||||||||
(In thousands) |
||||||||||||
United States |
$ | |
$ | |
$ | |
||||||
International (1) : |
||||||||||||
United Kingdom |
|
|
|
|||||||||
European Union countries |
|
|
|
|||||||||
Asia |
|
|
|
|||||||||
Other foreign countries |
|
|
|
|||||||||
Total international |
|
|
|
|||||||||
Consolidated net sales |
$ | |
$ | |
$ | |
||||||
(1) |
Includes U.S. export sales of $ |
2019 |
||||||||||||
EIG |
EMG |
Total |
||||||||||
(In thousands) |
||||||||||||
Process and analytical instrumentation |
$ |
|
$ |
— |
$ |
|
||||||
Aerospace and power |
|
|
|
|||||||||
Automation and engineered solutions |
— |
|
|
|||||||||
Consolidated net sales |
$ |
|
$ |
|
$ |
|
||||||
2018 |
||||||||||||
EIG |
EMG |
Total |
||||||||||
(In thousands) |
||||||||||||
Process and analytical instrumentation |
$ | |
$ | — |
$ | |
||||||
Aerospace and power |
|
|
|
|||||||||
Automation and engineered solutions |
— |
|
|
|||||||||
Consolidated net sales |
$ | |
$ | |
$ | |
||||||
2019 |
||||||||||||
EIG |
EMG |
Total |
||||||||||
(In thousands) |
||||||||||||
Products transferred at a point in time |
$ |
$ |
$ |
|||||||||
Products and services transferred over time |
||||||||||||
Consolidated net sales |
$ |
$ |
$ |
|||||||||
2018 |
||||||||||||
EIG |
EMG |
Total |
||||||||||
(In thousands) |
||||||||||||
Products transferred at a point in time |
$ | $ | $ | |||||||||
Products and services transferred over time |
||||||||||||
Consolidated net sales |
$ | $ | $ | |||||||||
2019 |
2018 |
2017 |
||||||||||
(In thousands) |
||||||||||||
Balance at the beginning of the year |
$ | $ | $ | |||||||||
Accruals for warranties issued during the year |
||||||||||||
Settlements made during the year |
( |
) |
( |
) | ( |
) | ||||||
Warranty accruals related to acquired businesses and other during the year |
||||||||||||
Balance at the end of the year |
$ |
$ | $ | |||||||||
2019 |
2018 |
|||||||
Fair Value |
Fair Value |
|||||||
(In thousands) |
||||||||
Mutual fund investments |
$ |
$ |
2019 |
2018 |
|||||||||||||||
Recorded Amount |
Fair Value |
Recorded Amount |
Fair Value |
|||||||||||||
(In thousands) |
||||||||||||||||
Long-term debt, net (including current portion) |
$ |
( |
) |
$ |
( |
) |
$ | ( |
) | $ | ( |
) |
PDT |
Gatan |
Total |
||||||||||
Property, plant and equipment |
$ |
$ |
$ |
|||||||||
Goodwill |
||||||||||||
Other intangible assets |
||||||||||||
Long-term assets |
||||||||||||
Long-term liabilities |
( |
) |
( |
) |
( |
) | ||||||
Net working capital and other (1) |
||||||||||||
Total cash paid |
$ |
$ |
$ |
|||||||||
(1) | Includes $ |
EIG |
EMG |
Total |
||||||||||
(In millions) |
||||||||||||
Balance at December 31, 2017 |
$ | |
$ | |
$ | |
||||||
Goodwill acquired |
|
|
|
|||||||||
Purchase price allocation adjustments and other |
( |
) | |
( |
) | |||||||
Foreign currency translation adjustments |
( |
) | ( |
) | ( |
) | ||||||
Balance at December 31, 2018 |
|
|
|
|||||||||
Goodwill acquired |
|
|
|
|||||||||
Purchase price allocation adjustments and other |
|
( |
) |
( |
) | |||||||
Foreign currency translation adjustments |
|
|
|
|||||||||
Balance at December 31, 2019 |
$ |
|
$ |
|
$ |
|
||||||
2019 |
2018 |
|||||||
(In thousands) |
||||||||
Definite-lived intangible assets (subject to amortization): |
||||||||
Patents |
$ |
|
$ | |
||||
Purchased technology |
|
|
||||||
Customer lists |
|
|
||||||
|
|
|||||||
Accumulated amortization: |
||||||||
Patents |
( |
) |
( |
) | ||||
Purchased technology |
( |
) |
( |
) | ||||
Customer lists |
( |
) |
( |
) | ||||
(826,519 ) |
(703,635 ) |
|||||||
Net intangible assets subject to amortization |
|
|
||||||
Indefinite-lived intangible assets (not subject to amortization): |
||||||||
Trademarks and trade names |
|
|
||||||
$ |
|
$ | |
|||||
December 31, |
||||||||
2019 |
2018 |
|||||||
(In thousands) |
||||||||
INVENTORIES, NET |
||||||||
Finished goods and parts |
$ |
$ | ||||||
Work in process |
||||||||
Raw materials and purchased parts |
||||||||
$ |
$ | |||||||
PROPERTY, PLANT AND EQUIPMENT, NET |
||||||||
Land |
$ |
$ | ||||||
Buildings |
||||||||
Machinery and equipment |
||||||||
Less: Accumulated depreciation |
( |
) |
( |
) | ||||
$ |
$ | |||||||
December 31, |
||||||||
2019 |
2018 |
|||||||
(In thousands) |
||||||||
ACCRUED LIABILITIES AND OTHER |
||||||||
Employee compensation and benefits |
$ |
$ | ||||||
Product warranty obligation |
||||||||
Restructuring |
||||||||
Short term lease liability |
— |
|||||||
Liabilities held for sale |
— |
|||||||
Contingent purchase price |
— |
|||||||
Other |
||||||||
$ |
$ | |||||||
2019 |
2018 |
2017 |
||||||||||
(In thousands) |
||||||||||||
ALLOWANCES FOR POSSIBLE LOSSES ON ACCOUNTS RECEIVABLE |
||||||||||||
Balance at the beginning of the year |
$ | $ | $ | |||||||||
Additions charged to expense |
||||||||||||
Write-offs |
( |
) |
( |
) | ( |
) | ||||||
Foreign currency translation adjustments and other |
( |
) |
( |
) | ||||||||
Balance at the end of the year |
$ |
$ | $ | |||||||||
2019 |
2018 |
2017 |
||||||||||
(In thousands) |
||||||||||||
Income before income taxes: |
||||||||||||
Domestic |
$ |
$ | $ | |||||||||
Foreign |
||||||||||||
Total |
$ |
$ | $ | |||||||||
Provision for income taxes: |
||||||||||||
Current: |
||||||||||||
Federal |
$ |
$ | $ | |||||||||
Foreign |
||||||||||||
State |
||||||||||||
Total current |
||||||||||||
Deferred: |
||||||||||||
Federal |
( |
) | ( |
) | ||||||||
Foreign |
( |
) |
( |
) | ||||||||
State |
( |
) | ||||||||||
Total deferred |
( |
) | ( |
) | ||||||||
Total provision |
$ |
$ | $ | |||||||||
2019 |
2018 |
|||||||
(In thousands) |
||||||||
Noncurrent deferred tax (asset) liability: |
||||||||
Differences in basis of property and accelerated depreciation (1) |
$ |
$ | ||||||
Reserves not currently deductible |
( |
) |
( |
) | ||||
Pensions |
||||||||
Differences in basis of intangible assets and accelerated amortization |
||||||||
Net operating loss carryforwards |
( |
) |
( |
) | ||||
Share-based compensation |
( |
) |
( |
) | ||||
Foreign Tax Credit Carryforwards |
( |
) |
— |
|||||
Unremitted earnings |
||||||||
Other |
( |
) |
( |
) | ||||
Less: Valuation allowance |
||||||||
Portion included in noncurrent assets |
||||||||
Gross noncurrent deferred tax liability |
$ |
$ | ||||||
(1) |
Presented net of deferred tax asset of approximately $ |
2019 |
2018 |
2017 |
||||||||||
U.S. Federal statutory rate |
% |
% | % | |||||||||
State income taxes, net of federal income tax benefit |
||||||||||||
Foreign operations, net |
( |
) |
( |
) | ( |
) | ||||||
U.S. Benefits for Manufacturing, Export and credits |
( |
) |
( |
) | ( |
) | ||||||
Uncertain Tax Items |
( |
) |
||||||||||
Stock compensation |
( |
) |
( |
) | ( |
) | ||||||
Net deferred tax revaluation |
— |
( |
) | ( |
) | |||||||
US Tax on Foreign Earnings |
( |
) | ||||||||||
Other |
( |
) |
( |
) | ||||||||
Consolidated effective tax rate |
% |
% | % | |||||||||
2019 |
2018 |
2017 |
||||||||||
(In millions) |
||||||||||||
Balance at the beginning of the year |
$ |
$ | $ | |||||||||
Additions for tax positions related to the current year |
||||||||||||
Additions for tax positions of prior years |
||||||||||||
Reductions for tax positions of prior years |
( |
) |
( |
) | ( |
) | ||||||
Reductions related to settlements with taxing authorities |
( |
) |
— |
— |
||||||||
Reductions due to statute expirations |
( |
) |
( |
) | ( |
) | ||||||
Balance at the end of the year |
$ |
$ | $ | |||||||||
2019 |
2018 |
|||||||
(In thousands) |
||||||||
U.S. dollar |
$ |
— |
$ | |||||
U.S. dollar |
||||||||
U.S. dollar |
||||||||
U.S. dollar |
||||||||
U.S. dollar |
||||||||
U.S. dollar |
||||||||
U.S. dollar |
||||||||
U.S. dollar |
— |
|||||||
U.S. dollar |
||||||||
U.S. dollar |
||||||||
U.S. dollar |
||||||||
British pound |
||||||||
British pound |
||||||||
British pound |
||||||||
Euro |
||||||||
Euro |
||||||||
Euro |
||||||||
Swiss franc |
||||||||
Revolving credit facility borrowings |
||||||||
Other, principally foreign |
||||||||
Less: Debt issuance costs |
( |
) |
( |
) | ||||
Total debt, net |
||||||||
Less: Current portion, net |
( |
) |
( |
) | ||||
Total long-term debt, net |
$ |
$ | ||||||
2019 |
2018 |
2017 |
||||||||||
(In thousands) |
||||||||||||
Stock option expense |
$ |
|
$ | |
$ | |
||||||
Restricted stock expense |
|
|
|
|||||||||
PRSU expense |
|
|
— |
|||||||||
Total pre-tax expense |
$ |
|
$ | |
$ | |
||||||
2019 |
2018 |
2017 |
||||||||||
Expected volatility |
|
% |
|
% | |
% | ||||||
Expected term (years) |
|
|
|
|||||||||
Risk-free interest rate |
|
% |
|
% | |
% | ||||||
Expected dividend yield |
|
% |
|
% | |
% | ||||||
Black-Scholes-Merton fair value per stock option granted |
$ |
|
$ | |
$ | |
Shares |
Weighted Average Exercise Price |
Weighted Average Remaining Contractual Life |
Aggregate Intrinsic Value |
|||||||||||||
(In thousands) |
(Years) |
(In millions) |
||||||||||||||
Outstanding at the beginning of the year |
|
$ | |
|||||||||||||
Granted |
|
|
||||||||||||||
Exercised |
( |
) |
|
|||||||||||||
Forfeited |
( |
) |
|
|||||||||||||
Expired |
( |
) |
|
|||||||||||||
Outstanding at the end of the year |
|
$ |
|
|
$ |
|
||||||||||
Exercisable at the end of the year |
|
$ |
|
|
$ |
|
||||||||||
Shares |
Weighted Average Grant Date Fair Value |
|||||||
(In thousands) |
||||||||
Nonvested stock options outstanding at the beginning of the year |
|
$ | |
|||||
Granted |
|
|
||||||
Vested |
( |
) |
|
|||||
Forfeited |
( |
) |
|
|||||
Nonvested stock options outstanding at the end of the year |
|
$ |
|
|||||
Shares |
Weighted Average Grant Date Fair Value |
|||||||
(In thousands) |
||||||||
Nonvested restricted stock outstanding at the beginning of the year |
$ | |||||||
Granted |
||||||||
Vested |
( |
) |
||||||
Forfeited |
( |
) |
||||||
Nonvested restricted stock outstanding at the end of the year |
$ |
|||||||
2019 |
2018 |
|||||||
(In thousands) |
||||||||
Change in projected benefit obligation: |
||||||||
Net projected benefit obligation at the beginning of the year |
$ | $ | ||||||
Service cost |
||||||||
Interest cost |
||||||||
Actuarial losses (gains) |
( |
) | ||||||
Gross benefits paid |
( |
) |
( |
) | ||||
Acquisition |
— |
|||||||
Net projected benefit obligation at the end of the year |
$ |
$ | ||||||
Change in plan assets: |
||||||||
Fair value of plan assets at the beginning of the year |
$ | $ | ||||||
Actual return on plan assets |
( |
) | ||||||
Employer contributions |
||||||||
Gross benefits paid |
( |
) |
( |
) | ||||
Acquisition |
— |
|||||||
Fair value of plan assets at the end of the year |
$ |
$ | ||||||
2019 |
2018 |
|||||||
(In thousands) |
||||||||
Change in projected benefit obligation: |
||||||||
Net projected benefit obligation at the beginning of the year |
$ | |
$ | |
||||
Service cost |
|
|
||||||
Interest cost |
|
|
||||||
Foreign currency translation adjustments |
|
( |
) | |||||
Employee contributions |
|
|
||||||
Actuarial losses (gains) |
|
( |
) | |||||
Expenses paid from assets |
( |
) |
( |
) | ||||
Gross benefits paid |
( |
) |
( |
) | ||||
Settlements |
( |
) |
— |
|||||
Plan amendments |
— |
|
||||||
Net projected benefit obligation at the end of the year |
$ |
|
$ | |
||||
Change in plan assets: |
||||||||
Fair value of plan assets at the beginning of the year |
$ |
|
$ | |
||||
Actual return on plan assets |
|
( |
) | |||||
Employer contributions |
|
|
||||||
Employee contributions |
|
|
||||||
Foreign currency translation adjustments |
|
( |
) | |||||
Expenses paid from assets |
( |
) |
( |
) | ||||
Settlements |
( |
) |
— |
|||||
Gross benefits paid |
( |
) |
( |
) | ||||
Fair value of plan assets at the end of the year |
$ |
|
$ | |
||||
2019 |
2018 |
|||||||
(In thousands) |
||||||||
Funded plans |
$ |
|
$ | |
||||
Unfunded plans |
|
|
||||||
Total |
$ |
|
$ | |
||||
2019 |
2018 |
|||||||
(In thousands) |
||||||||
Funded plans |
$ |
|
$ | |
||||
Unfunded plans |
|
|
||||||
Total |
$ |
|
$ | |
||||
2019 |
2018 |
|||||||
U.S. Defined Benefit Pension Plans: |
||||||||
Discount rate |
|
% |
|
% | ||||
Rate of compensation increase (where applicable) |
|
% |
|
% | ||||
Foreign Defined Benefit Pension Plans: |
||||||||
Discount rate |
|
% |
|
% | ||||
Rate of compensation increase (where applicable) |
|
% |
|
% |
2019 |
2018 |
|||||||||||||||||||||||
Asset Class |
Total |
Level 1 |
Level 2 |
Total |
Level 1 |
Level 2 |
||||||||||||||||||
(In thousands) |
||||||||||||||||||||||||
Corporate debt instruments |
$ |
|
$ |
— |
$ |
|
$ | |
$ | — |
$ | |
||||||||||||
Corporate debt instruments – Preferred |
|
— |
|
|
— |
|
||||||||||||||||||
Corporate stocks – Common |
|
|
— |
|
|
— |
||||||||||||||||||
Municipal bonds |
|
— |
|
|
— |
|
||||||||||||||||||
Registered investment companies |
|
|
— |
|
|
— |
||||||||||||||||||
U.S. Government securities |
|
— |
|
|
— |
|
||||||||||||||||||
Total investments |
|
|
|
|
|
|
||||||||||||||||||
Investments measured at net asset value |
|
— |
— |
|
— |
— |
||||||||||||||||||
Total investments |
$ |
|
$ |
|
$ |
|
$ | |
$ | |
$ | |
||||||||||||
2019 |
2018 |
|||||||||||||||
Asset Class |
Total |
Level 3 |
Total |
Level 3 |
||||||||||||
(In thousands) |
||||||||||||||||
Life insurance |
$ |
|
$ |
|
$ | |
$ | |
||||||||
Total investments |
|
|
|
|
||||||||||||
Investments measured at net asset value |
|
— | |
— |
||||||||||||
Total investments |
$ |
|
$ |
|
$ | |
$ | |
||||||||
Life Insurance |
||||
(In thousands) |
||||
Balance, December 31, 2017 |
$ | |
||
Actual return on assets: |
||||
Unrealized losses relating to instruments still held at the end of the year |
( |
) | ||
Realized gains (losses) relating to assets sold during the year |
|
|||
Purchases, sales, issuances and settlements, net |
|
|||
Balance, December 31, 2018 |
|
|||
Actual return on assets: |
||||
Unrealized gains (losses) relating to instruments still held at the end of the year |
|
|||
Realized gains (losses) relating to assets sold during the year |
|
|||
Purchases, sales, issuances and settlements, net |
|
|||
Balance, December 31, 2019 |
$ |
|||
Projected Benefit Obligation Exceeds Fair Value of Assets |
Accumulated Benefit Obligation Exceeds Fair Value of Assets |
|||||||||||||||
2019 |
2018 |
2019 |
2018 |
|||||||||||||
(In thousands) |
||||||||||||||||
Benefit obligation |
$ |
|
$ | |
$ |
|
$ | |
||||||||
Fair value of plan assets |
|
|
|
|
2019 |
2018 |
|||||||
(In thousands) |
||||||||
Funded status asset (liability): |
||||||||
Fair value of plan assets |
$ |
|
$ | |
||||
Projected benefit obligation |
( |
) |
( |
) | ||||
Funded status at the end of the year |
$ |
|
$ | |
||||
Amounts recognized in the consolidated balance sheet consisted of: |
||||||||
Noncurrent asset for pension benefits (other assets) |
$ |
|
$ | |
||||
Current liabilities for pension benefits |
( |
) |
( |
) | ||||
Noncurrent liability for pension benefits |
( |
) |
( |
) | ||||
Net amount recognized at the end of the year |
$ |
|
$ | |
||||
Net amounts recognized: |
2019 |
2018 |
||||||
(In thousands) |
||||||||
Net actuarial loss |
$ |
|
$ | |
||||
Prior service costs |
|
|
||||||
Transition asset |
|
|
||||||
Total recognized |
$ |
|
$ | |
||||
2019 |
2018 |
2017 |
||||||||||
(In thousands) |
||||||||||||
Defined benefit plans: |
||||||||||||
Service cost |
$ |
|
$ | |
$ | |
||||||
Interest cost |
|
|
|
|||||||||
Expected return on plan assets |
( |
) |
( |
) | ( |
) | ||||||
Settlement |
|
— |
— |
|||||||||
Amortization of: |
||||||||||||
Net actuarial loss |
|
|
|
|||||||||
Prior service costs |
|
( |
) | ( |
) | |||||||
Transition asset |
|
|
|
|||||||||
Total net periodic benefit income |
( |
) |
( |
) | ( |
) | ||||||
Other plans: |
||||||||||||
Defined contribution plans |
|
|
|
|||||||||
Foreign plans and other |
|
|
|
|||||||||
Total other plans |
|
|
|
|||||||||
Total net pension expense |
$ |
|
$ | |
$ | |
||||||
2019 |
2018 |
2017 |
||||||||||
U.S. Defined Benefit Pension Plans: |
||||||||||||
Discount rate |
|
% |
|
% | |
% | ||||||
Expected return on plan assets |
|
% |
|
% | |
% | ||||||
Rate of compensation increase (where applicable) |
|
% |
|
% | |
% | ||||||
Foreign Defined Benefit Pension Plans: |
||||||||||||
Discount rate |
|
% |
|
% | |
% | ||||||
Expected return on plan assets |
|
% |
|
% | |
% | ||||||
Rate of compensation increase (where applicable) |
|
% |
|
% | |
% |
2019 |
||||
(In thousands) |
||||
Operating lease cost |
$ |
|
||
Variable lease cost |
|
|||
Total lease cost |
$ |
|
||
December 31, 2019 |
||||
(In thousands) |
||||
Right of use assets, net |
$ |
|
||
Lease liabilities included in Accrued liabilities and other |
|
|||
Lease liabilities included in Other long-term liabilities |
|
|||
Total lease liabilities |
$ |
|
||
2019 |
||||
(In thousands) |
||||
Cash used in operations for operating leases |
$ |
|
||
Right-of-use assets obtained in exchange for new operating liabilities |
$ |
|
||
Weighted-average remaining lease terms – operating leases (years) |
|
|||
Weighted-average discount rate – operating leases |
|
% |
Lease Liability Maturity Analysis |
Operating Leases |
|||
(In thousands) |
||||
2020 |
$ |
|
||
2021 |
|
|||
2022 |
|
|||
2023 |
|
|||
2024 |
|
|||
Thereafter |
|
|||
Total lease payments |
|
|||
Less: imputed interest |
|
|||
$ |
|
|||
2019 |
2018 |
2017 |
||||||||||
(In thousands) |
||||||||||||
Operating income and income before income taxes: |
||||||||||||
Segment operating income (1) : |
||||||||||||
Electronic Instruments |
$ |
$ | $ | |||||||||
Electromechanical |
||||||||||||
Total segment operating income |
||||||||||||
Corporate administrative expenses |
( |
) |
( |
) | ( |
) | ||||||
Consolidated operating income |
||||||||||||
Interest and other expenses, net |
( |
) |
( |
) | ( |
) | ||||||
Consolidated income before income taxes |
$ |
$ | $ | |||||||||
Assets: |
||||||||||||
Electronic Instruments |
$ |
$ | ||||||||||
Electromechanical |
||||||||||||
Total segment assets |
||||||||||||
Corporate |
||||||||||||
Consolidated assets |
$ |
$ | ||||||||||
Additions to property, plant and equipment (2) : |
||||||||||||
Electronic Instruments |
$ |
$ | $ | |||||||||
Electromechanical |
||||||||||||
Total segment additions to property, plant and equipment |
||||||||||||
Corporate |
||||||||||||
Consolidated additions to property, plant and equipment |
$ |
$ | $ | |||||||||
Depreciation and amortization: |
||||||||||||
Electronic Instruments |
$ |
$ | $ | |||||||||
Electromechanical |
||||||||||||
Total segment depreciation and amortization |
||||||||||||
Corporate |
||||||||||||
Consolidated depreciation and amortization |
$ |
$ | $ | |||||||||
(1) | Segment operating income represents net sales less all direct costs and expenses (including certain administrative and other expenses) applicable to each segment but does not include interest expense. |
(2) | Includes $ |
2019 |
2018 |
|||||||
(In thousands) |
||||||||
Long-lived assets from continuing operations (excluding intangible assets): |
||||||||
United States |
$ |
$ | ||||||
International (1) : |
||||||||
United Kingdom |
||||||||
European Union countries |
||||||||
Asia |
||||||||
Other foreign countries |
||||||||
Total international |
||||||||
Total consolidated |
$ |
$ | ||||||
(1) | Represents long-lived assets of foreign-based operations only. |
First Quarter |
Second Quarter |
Third Quarter |
Fourth Quarter |
Total Year |
||||||||||||||||
(In thousands, except per share amounts) |
||||||||||||||||||||
2019 |
||||||||||||||||||||
Net sales |
$ |
|
$ |
|
$ |
|
$ |
|
$ |
|
||||||||||
Operating income |
$ |
|
$ |
|
$ |
|
$ |
|
$ |
|
||||||||||
Net income |
$ |
|
$ |
|
$ |
|
$ |
|
$ |
|
||||||||||
Basic earnings per share (2) |
$ |
|
$ |
|
$ |
|
$ |
|
$ |
|
||||||||||
Diluted earnings per share (2) |
$ |
|
$ |
|
$ |
|
$ |
|
$ |
|
||||||||||
Dividends paid per share |
$ |
|
$ |
|
$ |
|
$ |
|
$ |
|
||||||||||
2018 |
||||||||||||||||||||
Net sales |
$ | |
$ | |
$ | |
$ | |
$ | |
||||||||||
Operating income |
$ | |
$ | |
$ | |
$ | |
$ | |
||||||||||
Net income (1) |
$ | |
$ | |
$ | |
$ | |
$ | |
||||||||||
Basic earnings per share (1) (2) |
$ | |
$ | |
$ | |
$ | |
$ | |
||||||||||
Diluted earnings per share (1) (2) |
$ | |
$ | |
$ | |
$ | |
$ | |
||||||||||
Dividends paid per share |
$ | |
$ | |
$ | |
$ | |
$ | |
(1) | During 2018, the Company recorded a net benefit of $ |
(2) | The sum of quarterly earnings per share may not equal total year earnings per share due to rounding of earnings per share amounts, and differences in weighted average shares and equivalent shares outstanding for each of the periods presented. |
Item 9. |
Changes in and Disagreements with Accountants on Accounting and Financial Disclosure |
Item 9A. |
Controls and Procedures |
Item 9B. |
Other Information |
Item 10. |
Directors, Executive Officers and Corporate Governance |
a) | Directors of the Registrant. |
b) | Executive Officers of the Registrant. |
c) | Section 16(a) Compliance. |
d) | Identification of the Audit Committee. |
e) | Audit Committee Financial Experts. |
f) | Corporate Governance/Nominating Committee. |
g) | Code of Ethics for Chief Executive Officer and Senior Financial Officers. |
Item 11. |
Executive Compensation |
Item 12. |
Security Ownership of Certain Beneficial Owners and Management and Related Stockholder Matters |
Item 13. |
Certain Relationships and Related Transactions, and Director Independence |
Item 14. |
Principal Accounting Fees and Services |
Item 15. |
Exhibits and Financial Statement Schedules |
Exhibit Number |
Description |
Incorporated Herein by Reference to | ||||
3.1 |
Exhibit 3.1 to Form 8-K, 1-12981. | |||||
3.2 |
Exhibit 3.2 to 2019 Form 10-K, 1-12981. | |||||
4.1† |
Exhibit 4 to Form S-8 1-12981. | |||||
4.2† |
Exhibit 4.3 to 2012 Form 10-K, 1-12981. | |||||
4.3† |
Exhibit 4 to Form S-8 1-12981. | |||||
4.4† |
Exhibit 4.5 to 2012 Form 10-K, 1-12981. | |||||
10.1† |
Exhibit 10.4 to Form 10-Q 1-12981. | |||||
10.2† |
Exhibit 10.1 to Form 10-Q 1-12981. | |||||
10.3† |
Exhibit 10.1 to Form 10-Q 1-12981. | |||||
10.5† |
Exhibit 10.5 to 2016 Form 10-K, 1-12981. | |||||
10.6† |
Exhibit 10.3 to Form 10-Q 1-12981. | |||||
10.7† |
Exhibit 10.7 to Form 10-Q 1-12981. |
Exhibit Number |
Description |
Incorporated Herein by Reference to | ||||
10.8† |
Exhibit 10.1 to Form 10-Q 1-12981. | |||||
10.9† |
Exhibit 10.2 to Form 10-Q 1-12981. | |||||
10.10† |
Exhibit 10.3 to Form 10-Q 1-12981. | |||||
10.11† |
Exhibit 10.1 to Form 10-Q 1-12981. | |||||
10.12† |
Exhibit 10.2 to Form 10-Q 1-12981. | |||||
10.13† |
Exhibit 10.1 to Form 8-K 1-12981. | |||||
10.14† |
Exhibit 10.2 to Form 8-K 1-12981. | |||||
10.15† |
Exhibit 10.3 to Form 8-K 1-12981. | |||||
10.16† |
Exhibit 10.4 to Form 8-K 1-12981. | |||||
10.17 |
Exhibit 10.4 to Form 10-Q 1-12981. | |||||
10.18 |
Exhibit 10.1 to Form 8-K 1-12981. | |||||
10.19 |
Exhibit 10.1 to Form 10-Q 1-12981. |
Exhibit Number |
Description |
Incorporated Herein by Reference to | ||||
10.20 |
Exhibit 10.2 to Form 10-Q 1-12981. | |||||
10.24 |
Exhibit 10.1 to Form 8-K 1-12981. | |||||
10.25 |
Exhibit 10.1 to Form 10-Q 1-12981. | |||||
10.26 |
Exhibit 10.1 to Form 8-K 1-12981. | |||||
10.27 |
Exhibit 10.1 to Form 8-K 1-12981. | |||||
21* |
||||||
23* |
||||||
31.1* |
||||||
31.2* |
||||||
32.1* |
||||||
32.2* |
||||||
101.INS* |
XBRL Instance Document. |
|||||
101.SCH* |
XBRL Taxonomy Extension Schema Document. |
|||||
101.CAL* |
XBRL Taxonomy Extension Calculation Linkbase Document. |
|||||
101.DEF* |
XBRL Taxonomy Extension Definition Linkbase Document. |
|||||
101.LAB* |
XBRL Taxonomy Extension Label Linkbase Document. |
|||||
101.PRE* |
XBRL Taxonomy Extension Presentation Linkbase Document. |
† | Management contract or compensatory plan required to be filed pursuant to Item 601 of Regulation S-K. |
* | Filed electronically herewith. |
Item 16. |
Form 10-K Summary |
AMETEK, Inc. | ||||||||
|
|
By: |
/s/ David A. Zapico | |||||
David A. Zapico | ||||||||
Chief Executive Officer | ||||||||
Date: February 20, 2020 |
Signature |
Title |
Date | ||
/s/ David A. Zapico David A. Zapico |
Chairman of the Board of Directors and Chief Executive Officer (Principal Executive Officer) |
February 20, 2020 | ||
/s/ William J. Burke William J. Burke |
Executive Vice President – Chief Financial Officer (Principal Financial Officer) |
February 20, 2020 | ||
/s/ Thomas M. Montgomery Thomas M. Montgomery |
Senior Vice President – Comptroller (Principal Accounting Officer) |
February 20, 2020 | ||
/s/ Thomas A. Amato Thomas A. Amato |
Director |
February 20, 2020 | ||
/s/ TOD E. CARPENTER Tod E. Carpenter |
Director |
February 20, 2020 | ||
/s/ Ruby R. Chandy Ruby R. Chandy |
Director |
February 20, 2020 | ||
/s/ Anthony J. Conti Anthony J. Conti |
Director |
February 20, 2020 | ||
/s/ Steven W. Kohlhagen Steven W. Kohlhagen |
Director |
February 20, 2020 | ||
/s/ Gretchen W. McClain Gretchen W. McClain |
Director |
February 20, 2020 | ||
/s/ Elizabeth R. Varet Elizabeth R. Varet |
Director |
February 20, 2020 | ||
/s/ Dennis K. Williams Dennis K. Williams |
Director |
February 20, 2020 |