000103544312/31/2020false12/31falsetruefalsefalse2020FYtruefalse00010354432020-01-012020-12-31iso4217:USD00010354432020-06-30xbrli:shares00010354432021-01-15xbrli:pure0001035443srt:NorthAmericaMember2020-12-310001035443srt:NorthAmericaMember2020-01-012020-12-3100010354432020-12-3100010354432019-12-310001035443are:IncomefromrentalsMember2020-01-012020-12-310001035443are:IncomefromrentalsMember2019-01-012019-12-310001035443are:IncomefromrentalsMember2018-01-012018-12-310001035443us-gaap:ProductAndServiceOtherMember2020-01-012020-12-310001035443us-gaap:ProductAndServiceOtherMember2019-01-012019-12-310001035443us-gaap:ProductAndServiceOtherMember2018-01-012018-12-3100010354432019-01-012019-12-3100010354432018-01-012018-12-31iso4217:USDxbrli:shares0001035443us-gaap:SeriesDPreferredStockMemberus-gaap:PreferredStockMember2017-12-310001035443us-gaap:CommonStockMember2017-12-310001035443us-gaap:AdditionalPaidInCapitalMember2017-12-310001035443us-gaap:RetainedEarningsMember2017-12-310001035443us-gaap:AccumulatedOtherComprehensiveIncomeMember2017-12-310001035443us-gaap:NoncontrollingInterestMember2017-12-3100010354432017-12-310001035443are:RedeemableNoncontrollingInterestsMember2017-12-310001035443us-gaap:RetainedEarningsMember2018-01-012018-12-310001035443us-gaap:NoncontrollingInterestMember2018-01-012018-12-310001035443are:RedeemableNoncontrollingInterestsMember2018-01-012018-12-310001035443us-gaap:AccumulatedOtherComprehensiveIncomeMember2018-01-012018-12-310001035443us-gaap:AdditionalPaidInCapitalMember2018-01-012018-12-310001035443us-gaap:CommonStockMember2018-01-012018-12-310001035443us-gaap:SeriesDPreferredStockMemberus-gaap:PreferredStockMember2018-01-012018-12-310001035443us-gaap:SeriesDPreferredStockMemberus-gaap:AdditionalPaidInCapitalMember2018-01-012018-12-310001035443us-gaap:SeriesDPreferredStockMemberus-gaap:RetainedEarningsMember2018-01-012018-12-310001035443us-gaap:SeriesDPreferredStockMember2018-01-012018-12-3100010354432019-01-012019-09-300001035443us-gaap:SeriesDPreferredStockMemberus-gaap:PreferredStockMember2018-12-310001035443us-gaap:CommonStockMember2018-12-310001035443us-gaap:AdditionalPaidInCapitalMember2018-12-310001035443us-gaap:RetainedEarningsMember2018-12-310001035443us-gaap:AccumulatedOtherComprehensiveIncomeMember2018-12-310001035443us-gaap:NoncontrollingInterestMember2018-12-3100010354432018-12-310001035443are:RedeemableNoncontrollingInterestsMember2018-12-310001035443us-gaap:RetainedEarningsMember2019-01-012019-12-310001035443us-gaap:NoncontrollingInterestMember2019-01-012019-12-310001035443are:RedeemableNoncontrollingInterestsMember2019-01-012019-12-310001035443us-gaap:AccumulatedOtherComprehensiveIncomeMember2019-01-012019-12-310001035443us-gaap:AdditionalPaidInCapitalMember2019-01-012019-12-310001035443us-gaap:CommonStockMember2019-01-012019-12-310001035443us-gaap:SeriesDPreferredStockMemberus-gaap:PreferredStockMember2019-01-012019-12-310001035443us-gaap:SeriesDPreferredStockMemberus-gaap:AdditionalPaidInCapitalMember2019-01-012019-12-310001035443us-gaap:SeriesDPreferredStockMemberus-gaap:RetainedEarningsMember2019-01-012019-12-310001035443us-gaap:SeriesDPreferredStockMember2019-01-012019-12-310001035443us-gaap:CommonStockMember2019-12-310001035443us-gaap:RetainedEarningsMember2019-01-0100010354432019-01-010001035443us-gaap:SeriesDPreferredStockMemberus-gaap:PreferredStockMember2019-12-310001035443us-gaap:AdditionalPaidInCapitalMember2019-12-310001035443us-gaap:RetainedEarningsMember2019-12-310001035443us-gaap:AccumulatedOtherComprehensiveIncomeMember2019-12-310001035443us-gaap:NoncontrollingInterestMember2019-12-310001035443are:RedeemableNoncontrollingInterestsMember2019-12-310001035443us-gaap:RetainedEarningsMember2020-01-012020-12-310001035443us-gaap:NoncontrollingInterestMember2020-01-012020-12-310001035443are:RedeemableNoncontrollingInterestsMember2020-01-012020-12-310001035443us-gaap:AccumulatedOtherComprehensiveIncomeMember2020-01-012020-12-310001035443us-gaap:AdditionalPaidInCapitalMember2020-01-012020-12-310001035443us-gaap:CommonStockMember2020-01-012020-12-310001035443us-gaap:RetainedEarningsMember2020-01-0100010354432020-01-010001035443us-gaap:CommonStockMember2020-12-310001035443us-gaap:AdditionalPaidInCapitalMember2020-12-310001035443us-gaap:RetainedEarningsMember2020-12-310001035443us-gaap:AccumulatedOtherComprehensiveIncomeMember2020-12-310001035443us-gaap:NoncontrollingInterestMember2020-12-310001035443are:RedeemableNoncontrollingInterestsMember2020-12-310001035443us-gaap:BuildingAndBuildingImprovementsMembersrt:MaximumMember2020-01-012020-12-310001035443us-gaap:LandImprovementsMembersrt:MaximumMember2020-01-012020-12-31are:property0001035443country:CA2020-12-310001035443country:CN2020-12-310001035443are:IncomefromrentalsMemberus-gaap:AccountingStandardsUpdate201409Member2020-01-012020-12-310001035443are:IncomefromrentalsMemberus-gaap:AccountingStandardsUpdate201409Member2019-01-012019-12-310001035443are:RevenuessubjecttootheraccountingguidanceMember2020-01-012020-12-3100010354432019-01-012019-01-010001035443us-gaap:AccountsPayableAndAccruedLiabilitiesMember2019-01-0100010354432020-01-012020-03-3100010354432020-10-012020-12-3100010354432020-07-012020-09-3000010354432020-04-012020-06-300001035443us-gaap:AccountingStandardsUpdate201409Member2020-12-310001035443srt:NorthAmericaMember2019-12-310001035443srt:AsiaMember2020-12-310001035443srt:AsiaMember2019-12-310001035443are:GreaterBostonMember2020-12-31utr:sqft0001035443are:GreaterBostonMemberare:FuturedevelopmentprojectsMember2020-12-310001035443are:GreaterBostonMemberare:ActiveRedevelopmentMember2020-12-310001035443are:GreaterBostonMemberare:OperatingwithfuturedevelopmentandredevelopmentMember2020-12-310001035443are:OperatingpropertiesMemberare:GreaterBostonMember2020-12-310001035443are:GreaterBostonMember2020-01-012020-12-310001035443are:SanFranciscoMember2020-12-310001035443are:SanFranciscoMemberare:FuturedevelopmentprojectsMember2020-12-310001035443are:SanFranciscoMemberare:ActiveRedevelopmentMember2020-12-310001035443are:SanFranciscoMemberare:OperatingwithfuturedevelopmentandredevelopmentMember2020-12-310001035443are:SanFranciscoMemberare:OperatingpropertiesMember2020-12-310001035443are:SanFranciscoMember2020-01-012020-12-310001035443are:SanDiegoMember2020-12-310001035443are:SanDiegoMemberare:FuturedevelopmentprojectsMember2020-12-310001035443are:SanDiegoMemberare:ActiveRedevelopmentMember2020-12-310001035443are:SanDiegoMemberare:OperatingwithfuturedevelopmentandredevelopmentMember2020-12-310001035443are:OperatingpropertiesMemberare:SanDiegoMember2020-12-310001035443are:SanDiegoMember2020-01-012020-12-310001035443are:SeattleMember2020-12-310001035443are:SeattleMemberare:FuturedevelopmentprojectsMember2020-12-310001035443are:SeattleMemberare:ActiveRedevelopmentMember2020-12-310001035443are:SeattleMemberare:OperatingwithfuturedevelopmentandredevelopmentMember2020-12-310001035443are:OperatingpropertiesMemberare:SeattleMember2020-12-310001035443are:SeattleMember2020-01-012020-12-310001035443stpr:MD2020-12-310001035443stpr:MDare:FuturedevelopmentprojectsMember2020-12-310001035443stpr:MDare:ActiveRedevelopmentMember2020-12-310001035443stpr:MDare:OperatingwithfuturedevelopmentandredevelopmentMember2020-12-310001035443stpr:MDare:OperatingpropertiesMember2020-12-310001035443stpr:MD2020-01-012020-12-310001035443are:ResearchTriangleMember2020-12-310001035443are:ResearchTriangleMemberare:FuturedevelopmentprojectsMember2020-12-310001035443are:ResearchTriangleMemberare:ActiveRedevelopmentMember2020-12-310001035443are:ResearchTriangleMemberare:OperatingwithfuturedevelopmentandredevelopmentMember2020-12-310001035443are:ResearchTriangleMemberare:OperatingpropertiesMember2020-12-310001035443are:ResearchTriangleMember2020-01-012020-12-310001035443are:OthermarketsMember2020-12-310001035443are:OthermarketsMemberare:FuturedevelopmentprojectsMember2020-12-310001035443are:OthermarketsMemberare:ActiveRedevelopmentMember2020-12-310001035443are:OthermarketsMemberare:OperatingwithfuturedevelopmentandredevelopmentMember2020-12-310001035443are:OperatingpropertiesMemberare:OthermarketsMember2020-12-310001035443are:OthermarketsMember2020-01-012020-12-310001035443srt:NorthAmericaMemberare:FuturedevelopmentprojectsMember2020-12-310001035443srt:NorthAmericaMemberare:ActiveRedevelopmentMember2020-12-310001035443srt:NorthAmericaMemberare:OperatingwithfuturedevelopmentandredevelopmentMember2020-12-310001035443srt:NorthAmericaMemberare:OperatingpropertiesMember2020-12-310001035443are:BXPGateway601611651GatewayBoulevardMember2020-01-012020-03-310001035443us-gaap:LeasesAcquiredInPlaceMember2020-01-012020-12-310001035443are:AboveandBelowMarketLeasesMember2020-01-012020-12-310001035443us-gaap:SubsequentEventMemberare:A401ParkDriveAnd201BrooklineAvenueMember2021-02-010001035443us-gaap:SubsequentEventMemberare:A401ParkDriveAnd201BrooklineAvenueMember2021-01-012021-02-010001035443us-gaap:SubsequentEventMemberare:A401ParkDriveMember2021-02-010001035443are:A201BrooklineAvenueMemberus-gaap:SubsequentEventMember2021-02-010001035443us-gaap:SubsequentEventMemberare:A401ParkDriveAnd201BrooklineAvenueMemberare:FuturedevelopmentprojectsMember2021-02-010001035443are:AdditionalEntitlementRightsForDevelopmentMemberus-gaap:SubsequentEventMemberare:A401ParkDriveAnd201BrooklineAvenueMember2021-02-010001035443are:AdditionalEntitlementRightsForDevelopmentMemberus-gaap:SubsequentEventMemberare:A401ParkDriveAnd201BrooklineAvenueMember2021-01-012021-02-010001035443us-gaap:SubsequentEventMember2021-02-010001035443are:January2021AcquisitionsMemberus-gaap:SubsequentEventMember2021-01-012021-02-010001035443are:January2021AcquisitionsMemberus-gaap:SubsequentEventMember2021-02-010001035443are:AboveandBelowMarketLeasesMember2020-12-310001035443are:AboveandBelowMarketLeasesMember2019-12-310001035443are:AboveandBelowMarketLeasesMember2019-01-012019-12-310001035443are:AboveandBelowMarketLeasesMember2018-01-012018-12-310001035443us-gaap:LeasesAcquiredInPlaceMember2020-12-310001035443us-gaap:LeasesAcquiredInPlaceMember2019-12-310001035443us-gaap:LeasesAcquiredInPlaceMember2019-01-012019-12-310001035443us-gaap:LeasesAcquiredInPlaceMember2018-01-012018-12-310001035443are:A510TownsendStreetAnd505BrannanStreetMember2020-11-012020-11-300001035443are:A510TownsendStreetAnd505BrannanStreetMember2020-12-310001035443are:A510TownsendStreetAnd505BrannanStreetMember2020-10-012020-12-3100010354432020-01-012020-06-300001035443are:PendingacquisitionMember2020-01-012020-06-300001035443are:A260TownsendStreetMember2020-10-012020-12-310001035443are:A220And2402ndAvenueSouthMember2020-10-012020-12-310001035443are:A945MarketStreetMember2020-07-012020-09-300001035443are:A225BinneyStreetMember2020-12-310001035443are:A75125BinneyStreetMember2020-12-310001035443are:A57CoolidgeAvenueMember2020-12-310001035443are:A409499IllinoisStreetMember2020-12-310001035443are:A1500OwensStreetMember2020-12-310001035443are:InitialownershipinterestMemberare:AlexandriaTechnologyCenterGatewayMember2020-12-310001035443are:A500ForbesBoulevardMember2020-12-310001035443are:A1029010300CampusPointDriveand4110CampusPointCourtMember2020-12-310001035443are:A5200IlluminaWayMember2020-12-310001035443are:A9625TowneCentreDriveMember2020-12-310001035443are:SDTechbyAlexandriaMember2020-12-310001035443are:TheEastlakeLifeScienceCampusByAlexandriaMember2020-12-310001035443us-gaap:EquityMethodInvesteeMemberare:A1655and1715ThirdStreetMember2020-12-310001035443us-gaap:EquityMethodInvesteeMemberare:MenloGatewayMember2020-12-310001035443us-gaap:EquityMethodInvesteeMemberare:A704QuinceOrchardRoadMember2020-12-310001035443are:A57CoolidgeAvenueMember2020-09-300001035443are:A57CoolidgeAvenueMember2020-07-012020-09-300001035443are:InitialownershipinterestMemberare:AlexandriaTechnologyCenterGatewayMember2020-09-300001035443are:AlexandriaTechnologyCenterGatewayMember2020-03-310001035443are:BXPGateway601611651GatewayBoulevardMember2020-03-310001035443are:BXPGateway601611651GatewayBoulevardMemberare:FuturedevelopmentprojectsMember2020-03-310001035443are:BXPGateway681701751GatewayBoulevardMember2020-03-310001035443are:BXPGateway681701751GatewayBoulevardMemberare:FuturedevelopmentprojectsMember2020-03-310001035443are:BXPGateway681701751GatewayBoulevardMember2020-01-012020-03-310001035443are:AlexandriaTechnologyCenterGatewayMemberus-gaap:AdditionalPaidInCapitalMember2020-01-012020-03-310001035443us-gaap:EquityMethodInvesteeMemberare:A14011413ResearchBoulevardMember2020-12-310001035443us-gaap:EquityMethodInvesteeMemberare:A14011413ResearchBoulevardMember2019-12-310001035443us-gaap:EquityMethodInvesteeMemberare:A14011413ResearchBoulevardMember2020-01-012020-03-310001035443are:A9808and9868ScrantonRoadMember2020-04-300001035443are:A9808and9868ScrantonRoadMember2020-04-202020-04-200001035443us-gaap:NoncontrollingInterestMemberare:TheEastlakeLifeScienceCampusByAlexandriaMember2020-11-300001035443are:TheEastlakeLifeScienceCampusByAlexandriaMember2020-11-300001035443are:TheEastlakeLifeScienceCampusByAlexandriaMember2020-10-012020-12-310001035443us-gaap:AdditionalPaidInCapitalMemberare:TheEastlakeLifeScienceCampusByAlexandriaMember2020-10-012020-12-310001035443us-gaap:VariableInterestEntityPrimaryBeneficiaryMember2020-12-310001035443us-gaap:VariableInterestEntityPrimaryBeneficiaryMember2019-12-310001035443us-gaap:EquityMethodInvesteeMemberare:MenloGatewayMember2019-12-310001035443us-gaap:EquityMethodInvesteeMemberare:A704QuinceOrchardRoadMember2019-12-310001035443us-gaap:EquityMethodInvesteeMemberare:A1655and1715ThirdStreetMember2019-12-310001035443are:OtherunconsolidatedrealestatejointventuresMemberus-gaap:EquityMethodInvesteeMember2020-12-310001035443are:OtherunconsolidatedrealestatejointventuresMemberus-gaap:EquityMethodInvesteeMember2019-12-310001035443are:Secureddebtmaturingon31623Memberus-gaap:EquityMethodInvesteeMemberare:A704QuinceOrchardRoadMember2020-01-012020-12-310001035443are:Secureddebtmaturingon31623Memberus-gaap:EquityMethodInvesteeMemberus-gaap:LondonInterbankOfferedRateLIBORMemberare:A704QuinceOrchardRoadMember2020-01-012020-12-310001035443are:Secureddebtmaturingon31623Memberus-gaap:EquityMethodInvesteeMemberare:A704QuinceOrchardRoadMember2020-12-310001035443us-gaap:EquityMethodInvesteeMemberare:A1655and1715ThirdStreetMemberare:Secureddebtmaturingon31025Member2020-01-012020-12-310001035443us-gaap:EquityMethodInvesteeMemberare:A1655and1715ThirdStreetMemberare:Secureddebtmaturingon31025Member2020-12-310001035443us-gaap:EquityMethodInvesteeMemberare:MenloGatewayMemberare:Secureddebtmaturingon5135Member2020-01-012020-12-310001035443us-gaap:EquityMethodInvesteeMemberare:MenloGatewayMemberare:Secureddebtmaturingon5135Member2020-12-310001035443are:Secureddebtmaturingon81035Memberus-gaap:EquityMethodInvesteeMemberare:MenloGatewayMember2020-01-012020-12-310001035443are:Secureddebtmaturingon81035Memberus-gaap:EquityMethodInvesteeMemberare:MenloGatewayMember2020-12-310001035443us-gaap:EquityMethodInvesteeMember2020-12-310001035443srt:MinimumMember2020-01-012020-12-310001035443srt:MaximumMember2020-01-012020-12-3100010354432017-10-012017-10-010001035443are:LandparcelssubjecttoleaseagreementthatcontainsapurchaseoptionMember2020-01-012020-12-3100010354432020-03-310001035443are:A88BluxomeStreetMember2020-12-310001035443are:A88BluxomeStreetMember2020-01-012020-12-310001035443us-gaap:AccountsPayableAndAccruedLiabilitiesMember2020-12-310001035443are:GroundandOperatingLeasesMember2020-12-310001035443are:FundsheldintrustunderthetermsofcertainsecurednotespayableMember2020-12-310001035443are:FundsheldintrustunderthetermsofcertainsecurednotespayableMember2019-12-310001035443are:FundsheldinescrowrelatedtoconstructionprojectsandinvestingactivitiesMember2020-12-310001035443are:FundsheldinescrowrelatedtoconstructionprojectsandinvestingactivitiesMember2019-12-310001035443are:OtherrestrictedcashMember2020-12-310001035443are:OtherrestrictedcashMember2019-12-310001035443are:InvestmentsinpubliclytradedcompaniesMember2020-12-310001035443are:LimitedpartnershipsMember2020-12-310001035443are:EntitieswithobservablepricechangeMemberare:InvestmentsinprivatelyheldentitiesthatdonotreportNAVMember2020-12-310001035443are:InvestmentsinprivatelyheldentitiesthatdonotreportNAVMemberare:EntitieswithoutobservablepricechangesMember2020-12-310001035443are:InvestmentsinpubliclytradedcompaniesMember2019-12-310001035443are:LimitedpartnershipsMember2019-12-310001035443are:EntitieswithobservablepricechangeMemberare:InvestmentsinprivatelyheldentitiesthatdonotreportNAVMember2019-12-310001035443are:InvestmentsinprivatelyheldentitiesthatdonotreportNAVMemberare:EntitieswithoutobservablepricechangesMember2019-12-310001035443are:EntitieswithobservablepricechangeMemberare:InvestmentsinprivatelyheldentitiesthatdonotreportNAVMember2020-01-012020-12-310001035443are:EntitieswithobservablepricechangeMemberare:InvestmentsinprivatelyheldentitiesthatdonotreportNAVMember2019-01-012019-12-310001035443are:EntitieswithobservablepricechangeMemberare:InvestmentsinprivatelyheldentitiesthatdonotreportNAVMember2018-01-012018-12-310001035443are:TotalInvestmentsHeldMember2020-01-012020-12-310001035443are:TotalInvestmentsHeldMember2019-01-012019-12-310001035443are:TotalInvestmentsHeldMember2018-01-012018-12-310001035443are:LimitedpartnershipsMember2020-01-012020-12-310001035443us-gaap:FairValueMeasurementsRecurringMemberare:InvestmentsinpubliclytradedcompaniesMember2020-12-310001035443us-gaap:FairValueInputsLevel1Memberus-gaap:FairValueMeasurementsRecurringMemberare:InvestmentsinpubliclytradedcompaniesMember2020-12-310001035443us-gaap:FairValueInputsLevel2Memberus-gaap:FairValueMeasurementsRecurringMemberare:InvestmentsinpubliclytradedcompaniesMember2020-12-310001035443us-gaap:FairValueMeasurementsRecurringMemberus-gaap:FairValueInputsLevel3Memberare:InvestmentsinpubliclytradedcompaniesMember2020-12-310001035443us-gaap:FairValueMeasurementsRecurringMemberare:InvestmentsinpubliclytradedcompaniesMember2019-12-310001035443us-gaap:FairValueInputsLevel1Memberus-gaap:FairValueMeasurementsRecurringMemberare:InvestmentsinpubliclytradedcompaniesMember2019-12-310001035443us-gaap:FairValueInputsLevel2Memberus-gaap:FairValueMeasurementsRecurringMemberare:InvestmentsinpubliclytradedcompaniesMember2019-12-310001035443us-gaap:FairValueMeasurementsRecurringMemberus-gaap:FairValueInputsLevel3Memberare:InvestmentsinpubliclytradedcompaniesMember2019-12-310001035443are:InvestmentsinprivatelyheldentitiesthatdonotreportNAVMemberare:EntitieswithoutobservablepricechangesMemberus-gaap:FairValueMeasurementsNonrecurringMember2020-12-310001035443us-gaap:FairValueInputsLevel1Memberare:InvestmentsinprivatelyheldentitiesthatdonotreportNAVMemberare:EntitieswithoutobservablepricechangesMemberus-gaap:FairValueMeasurementsNonrecurringMember2020-12-310001035443us-gaap:FairValueInputsLevel2Memberare:InvestmentsinprivatelyheldentitiesthatdonotreportNAVMemberare:EntitieswithoutobservablepricechangesMemberus-gaap:FairValueMeasurementsNonrecurringMember2020-12-310001035443are:InvestmentsinprivatelyheldentitiesthatdonotreportNAVMemberare:EntitieswithoutobservablepricechangesMemberus-gaap:FairValueMeasurementsNonrecurringMemberus-gaap:FairValueInputsLevel3Member2020-12-310001035443us-gaap:CarryingReportedAmountFairValueDisclosureMember2020-12-310001035443us-gaap:FairValueInputsLevel2Memberus-gaap:FairValueMeasurementsNonrecurringMemberus-gaap:EstimateOfFairValueFairValueDisclosureMember2020-12-310001035443us-gaap:FairValueMeasurementsNonrecurringMemberus-gaap:EstimateOfFairValueFairValueDisclosureMember2020-12-310001035443us-gaap:CarryingReportedAmountFairValueDisclosureMemberare:A22BillionUnsecuredSeniorLineOfCreditMember2020-12-310001035443us-gaap:FairValueInputsLevel1Memberus-gaap:FairValueMeasurementsNonrecurringMemberare:A22BillionUnsecuredSeniorLineOfCreditMemberus-gaap:EstimateOfFairValueFairValueDisclosureMember2020-12-310001035443us-gaap:FairValueInputsLevel2Memberus-gaap:FairValueMeasurementsNonrecurringMemberare:A22BillionUnsecuredSeniorLineOfCreditMemberus-gaap:EstimateOfFairValueFairValueDisclosureMember2020-12-310001035443us-gaap:FairValueMeasurementsNonrecurringMemberare:A22BillionUnsecuredSeniorLineOfCreditMemberus-gaap:FairValueInputsLevel3Memberus-gaap:EstimateOfFairValueFairValueDisclosureMember2020-12-310001035443us-gaap:FairValueMeasurementsNonrecurringMemberare:A22BillionUnsecuredSeniorLineOfCreditMemberus-gaap:EstimateOfFairValueFairValueDisclosureMember2020-12-310001035443us-gaap:CommercialPaperMemberus-gaap:CarryingReportedAmountFairValueDisclosureMember2020-12-310001035443us-gaap:CommercialPaperMemberus-gaap:FairValueInputsLevel1Memberus-gaap:FairValueMeasurementsNonrecurringMemberus-gaap:EstimateOfFairValueFairValueDisclosureMember2020-12-310001035443us-gaap:CommercialPaperMemberus-gaap:FairValueInputsLevel2Memberus-gaap:FairValueMeasurementsNonrecurringMemberus-gaap:EstimateOfFairValueFairValueDisclosureMember2020-12-310001035443us-gaap:CommercialPaperMemberus-gaap:FairValueMeasurementsNonrecurringMemberus-gaap:FairValueInputsLevel3Memberus-gaap:EstimateOfFairValueFairValueDisclosureMember2020-12-310001035443us-gaap:CommercialPaperMemberus-gaap:FairValueMeasurementsNonrecurringMemberus-gaap:EstimateOfFairValueFairValueDisclosureMember2020-12-310001035443us-gaap:CarryingReportedAmountFairValueDisclosureMember2019-12-310001035443us-gaap:FairValueInputsLevel2Memberus-gaap:FairValueMeasurementsNonrecurringMemberus-gaap:EstimateOfFairValueFairValueDisclosureMember2019-12-310001035443us-gaap:FairValueMeasurementsNonrecurringMemberus-gaap:EstimateOfFairValueFairValueDisclosureMember2019-12-310001035443us-gaap:CarryingReportedAmountFairValueDisclosureMemberare:A22BillionUnsecuredSeniorLineOfCreditMember2019-12-310001035443us-gaap:FairValueInputsLevel1Memberus-gaap:FairValueMeasurementsNonrecurringMemberare:A22BillionUnsecuredSeniorLineOfCreditMemberus-gaap:EstimateOfFairValueFairValueDisclosureMember2019-12-310001035443us-gaap:FairValueInputsLevel2Memberus-gaap:FairValueMeasurementsNonrecurringMemberare:A22BillionUnsecuredSeniorLineOfCreditMemberus-gaap:EstimateOfFairValueFairValueDisclosureMember2019-12-310001035443us-gaap:FairValueMeasurementsNonrecurringMemberare:A22BillionUnsecuredSeniorLineOfCreditMemberus-gaap:FairValueInputsLevel3Memberus-gaap:EstimateOfFairValueFairValueDisclosureMember2019-12-310001035443us-gaap:FairValueMeasurementsNonrecurringMemberare:A22BillionUnsecuredSeniorLineOfCreditMemberus-gaap:EstimateOfFairValueFairValueDisclosureMember2019-12-310001035443are:SecuredNotesPayableMaturingFebruary62024Member2020-12-310001035443are:SecuredNotesPayableMaturingFebruary62024Member2020-01-012020-12-310001035443are:SecuredNotesPayableMaturingon7126Member2020-12-310001035443are:SecuredNotesPayableMaturingon7126Member2020-01-012020-12-310001035443are:SecuredNotesPayableMaturingJuly12036Member2020-12-310001035443are:SecuredNotesPayableMaturingJuly12036Member2020-01-012020-12-310001035443us-gaap:SecuredDebtMember2020-12-310001035443us-gaap:CommercialPaperMember2020-12-310001035443us-gaap:LondonInterbankOfferedRateLIBORMemberus-gaap:LineOfCreditMember2020-01-012020-12-310001035443us-gaap:LineOfCreditMember2020-01-012020-12-310001035443us-gaap:LineOfCreditMember2020-12-310001035443are:A4.00UnsecuredSeniorNotePayableMember2020-12-310001035443are:A4.00UnsecuredSeniorNotePayableMember2020-01-012020-12-310001035443are:A3.45unsecuredseniornotespayableduein2025Member2020-12-310001035443are:A3.45unsecuredseniornotespayableduein2025Member2020-01-012020-12-310001035443are:A4.30UnsecuredSeniorNotesPayableMember2020-12-310001035443are:A4.30UnsecuredSeniorNotesPayableMember2020-01-012020-12-310001035443are:A3.80UnsecuredSeniorNotesPayableMember2020-12-310001035443are:A3.80UnsecuredSeniorNotesPayableMember2020-01-012020-12-310001035443are:A3.95UnsecuredSeniorNotesPayableMember2020-12-310001035443are:A3.95UnsecuredSeniorNotesPayableMember2020-01-012020-12-310001035443are:A3.95UnsecuredSeniorNotesPayableDuein2028Member2020-12-310001035443are:A3.95UnsecuredSeniorNotesPayableDuein2028Member2020-01-012020-12-310001035443are:UnsecuredSeniorNotesDueinJuly2029Member2020-12-310001035443are:UnsecuredSeniorNotesDueinJuly2029Member2020-01-012020-12-310001035443are:A2.75UnsecuredSeniorNotesPayableDue2029Member2020-12-310001035443are:A2.75UnsecuredSeniorNotesPayableDue2029Member2020-01-012020-12-310001035443are:A4.70UnsecuredSeniorNotesPayableMember2020-12-310001035443are:A4.70UnsecuredSeniorNotesPayableMember2020-01-012020-12-310001035443are:A4.90UnsecuredSeniorNotesPayableMember2020-12-310001035443are:A4.90UnsecuredSeniorNotesPayableMember2020-01-012020-12-310001035443are:A3.375UnsecuredSeniorNotesPayableMember2020-12-310001035443are:A3.375UnsecuredSeniorNotesPayableMember2020-01-012020-12-310001035443are:A1875UnsecuredSeniorNotesPayableMember2020-12-310001035443are:A1875UnsecuredSeniorNotesPayableMember2020-01-012020-12-310001035443are:A4.85UnsecuredSeniorNotePayableMember2020-12-310001035443are:A4.85UnsecuredSeniorNotePayableMember2020-01-012020-12-310001035443are:A4.00UnsecuredSeniorNotesPayablesDue2050Member2020-12-310001035443are:A4.00UnsecuredSeniorNotesPayablesDue2050Member2020-01-012020-12-310001035443us-gaap:UnsecuredDebtMember2020-12-310001035443us-gaap:SecuredDebtMember2020-01-012020-12-310001035443us-gaap:SeniorNotesMember2020-12-310001035443us-gaap:SeniorNotesMember2020-01-012020-12-310001035443us-gaap:CommercialPaperMembersrt:MaximumMember2020-01-012020-12-310001035443us-gaap:CommercialPaperMember2020-01-012020-12-310001035443us-gaap:CommercialPaperMember2020-10-012020-12-310001035443are:A30BillionUnsecuredSeniorLineOfCreditMember2020-10-012020-12-310001035443us-gaap:LondonInterbankOfferedRateLIBORMemberus-gaap:LineOfCreditMember2020-12-310001035443us-gaap:LineOfCreditMember2020-10-060001035443us-gaap:LondonInterbankOfferedRateLIBORMemberus-gaap:LineOfCreditMember2020-10-012020-12-310001035443are:A750millionunsecuredseniorlineofcreditMember2020-06-300001035443are:A750millionunsecuredseniorlineofcreditMember2020-04-012020-06-300001035443are:A750millionunsecuredseniorlineofcreditMemberus-gaap:LondonInterbankOfferedRateLIBORMember2020-04-012020-06-300001035443are:A750millionunsecuredseniorlineofcreditMember2020-07-012020-09-300001035443us-gaap:CommercialPaperMember2019-09-300001035443are:A4.90UnsecuredSeniorNotesPayableMember2020-01-012020-03-310001035443are:A1875UnsecuredSeniorNotesPayableMember2020-07-012020-09-300001035443are:A390UnsecuredSeniorNotesPayableMember2020-09-300001035443are:A390UnsecuredSeniorNotesPayableMember2020-07-012020-09-300001035443are:TotalunsecuredseniornotesissuedsinceJan.12019Member2019-01-012020-12-310001035443are:TotalunsecuredseniornotesissuedsinceJan.12019Member2020-12-310001035443are:TotalunsecuredseniornotesissuedsinceJan.12019Member2020-01-012020-12-310001035443are:SecuredNotesPayableMaturingMarch102023Member2020-10-012020-12-310001035443are:SecuredNotesPayableMaturingMarch102023Member2020-12-310001035443are:SecuredDebtMaturingonJanuary2023Member2020-10-012020-12-310001035443are:SecuredDebtMaturingonJanuary2023Member2020-12-310001035443us-gaap:AccountsPayableAndAccruedLiabilitiesMember2019-12-310001035443us-gaap:SeriesDPreferredStockMember2019-10-012019-10-290001035443us-gaap:SeriesDPreferredStockMember2019-12-310001035443us-gaap:SeriesDPreferredStockMember2020-12-31are:Leaseare:Tenant0001035443are:SingleTenantMemberare:LesseeConcentrationMember2020-01-012020-12-310001035443are:SingleTenantMemberare:LesseeConcentrationMember2020-12-310001035443are:ThreeLargestTenantsMemberare:LesseeConcentrationMemberare:AnnualizedBaseRentMember2020-01-012020-12-310001035443are:FirstLargestTenantMemberare:LesseeConcentrationMemberare:AnnualizedBaseRentMember2020-01-012020-12-310001035443are:SecondLargestTenantMemberare:LesseeConcentrationMemberare:AnnualizedBaseRentMember2020-01-012020-12-310001035443are:ThirdLargestTenantMemberare:LesseeConcentrationMemberare:AnnualizedBaseRentMember2020-01-012020-12-310001035443are:ATMCommonStockOfferingProgramEstablishedFebruary2020Memberare:ForwardEquitySalesAgreementsEnteredInJanuaryAndJuly2020Member2020-01-012020-12-310001035443are:ForwardEquitySalesAgreementsEnteredinJanuary2020Member2020-01-062020-01-060001035443are:ForwardEquitySalesAgreementsEnteredInJuly2020Member2020-07-082020-07-080001035443are:ForwardEquitySalesAgreementsEnteredinJanuary2020Member2020-01-060001035443are:ForwardEquitySalesAgreementsEnteredInJuly2020Member2020-07-080001035443are:ForwardEquitySalesAgreementsEnteredInJanuaryAndJuly2020Member2020-12-310001035443are:ForwardEquitySalesAgreementsEnteredInJanuaryAndJuly2020Member2020-01-012020-12-310001035443are:ATMCommonStockOfferingProgramEstablishedFebruary2020Member2020-02-100001035443are:ForwardEquitySalesAgreementsUnderATMProgramMember2020-10-012020-12-310001035443are:ForwardEquitySalesAgreementsUnderATMProgramMember2020-12-310001035443are:ForwardEquitySalesAgreementsUnderATMProgramMember2020-01-012020-12-310001035443are:ATMCommonStockOfferingProgramEstablishedFebruary2020Member2020-12-310001035443us-gaap:AccumulatedTranslationAdjustmentMember2019-12-310001035443us-gaap:AccumulatedTranslationAdjustmentMember2020-01-012020-12-310001035443us-gaap:AccumulatedTranslationAdjustmentMember2020-12-310001035443are:StockAwardMember2017-12-310001035443are:StockAwardMember2018-01-012018-12-310001035443are:StockAwardMember2018-12-310001035443are:StockAwardMember2019-01-012019-12-310001035443are:StockAwardMember2019-12-310001035443are:StockAwardMember2020-01-012020-12-310001035443are:StockAwardMember2020-12-310001035443are:AlexandriaTechnologyCenterGatewayMemberus-gaap:NoncontrollingInterestMember2020-12-310001035443us-gaap:NoncontrollingInterestMemberare:A9808and9868ScrantonRoadMember2020-12-310001035443us-gaap:NoncontrollingInterestMemberare:TheEastlakeLifeScienceCampusByAlexandriaMember2020-12-310001035443are:FourPropertiesHeldForSaleMember2020-01-012020-12-3100010354432019-01-012019-03-3100010354432019-04-012019-06-3000010354432019-07-012019-09-3000010354432019-10-012019-12-310001035443us-gaap:SubsequentEventMember2021-01-012021-02-010001035443us-gaap:SubsequentEventMemberare:ForwardEquitySalesAgreementsEnteredInJanuary2021Member2021-01-052021-01-050001035443us-gaap:SubsequentEventMemberare:ForwardEquitySalesAgreementsEnteredInJanuary2021Member2021-01-050001035443are:AlexandriaCenterAtKendallSquareInEastCambridgeMassachusettsMember2020-12-310001035443are:TechnologySquareMember2020-12-310001035443are:TheArsenalontheCharlesMember2020-12-310001035443are:OneKendallSquareMember2020-12-310001035443are:A480500ArsenalStreetMember2020-12-310001035443are:A640MemorialDriveMember2020-12-310001035443are:Number780And790MemorialDriveMember2020-12-310001035443are:A167SidneyStreetand99ErieStreetMember2020-12-310001035443are:Number79And96CharlestownNavyYardMember2020-12-310001035443are:A380And420EStreetMember2020-12-310001035443are:A5NeccoStreetMember2020-12-310001035443are:A10NeccoStreetMember2020-12-310001035443are:A15NeccoStreetMember2020-12-310001035443are:A99AStreetMember2020-12-310001035443are:ReservoirWoodsMember2020-12-310001035443are:A275GroveStreetMember2020-12-310001035443are:OneUplandRoadAnd100TechDriveMember2020-12-310001035443are:AlexandriaParkat128Member2020-12-310001035443are:A225266and275SecondAvenueMember2020-12-310001035443are:Number19PresidentialWayMember2020-12-310001035443are:Number100BeaverStreetMember2020-12-310001035443are:A285BearHillRoadMember2020-12-310001035443are:A111and130ForbesBoulevardMember2020-12-310001035443are:Number20WalkupDriveMember2020-12-310001035443are:AlexandriaCenterForScienceAndTechnologyMissionBayMember2020-12-310001035443are:A260TownsendStreetMember2020-12-310001035443are:AlexandriaTechnologyCenterGatewayMember2020-12-310001035443are:A213249259269279EastGrandAvenueMember2020-12-310001035443are:A201HaskinsWayMember2020-12-310001035443are:Number400And450EastJamieCourtMember2020-12-310001035443are:Number500ForbesBoulevardMember2020-12-310001035443are:Number7000ShorelineCourtMember2020-12-310001035443are:Number341And343OysterPointBlvdMember2020-12-310001035443are:A849863MittenRoad866MalcolmRoadMember2020-12-310001035443are:AlexandriaCenterForLifeScienceSanCarlosMember2020-12-310001035443are:A3825and3875FabianWayMember2020-12-310001035443are:A825and835IndustrialRoadMember2020-12-310001035443are:AlexandriaPARCMember2020-12-310001035443are:A333034123450And3460HillviewMember2020-12-310001035443are:Number2425GarciaAveAnd2400And2450BayshorePkyMember2020-12-310001035443are:ShorewayScienceCenterMember2020-12-310001035443are:A1450PageMillRoadMember2020-12-310001035443are:Number3350WestBayshoreRoadMember2020-12-310001035443are:Number2625And2627And2631HanoverStreetMember2020-12-310001035443are:AlexandriaCenterforLifeScienceMember2020-12-310001035443are:A219East42ndStreetMember2020-12-310001035443are:A475030thStreetMember2020-12-310001035443are:AlexandriaLifeScienceFactoryatLongIslandCityMember2020-12-310001035443are:ARESpectrumMember2020-12-310001035443are:TorreyRidgeScienceCenterMember2020-12-310001035443are:ARESunriseMember2020-12-310001035443are:ARENautilusMember2020-12-310001035443are:A1111911255And11355NorthTorreyPinesRoadMember2020-12-310001035443are:A3545CrayCourtMember2020-12-310001035443are:AlexandriaPointMember2020-12-310001035443are:Number5200IlluminaWayMainMember2020-12-310001035443are:UniversityDistrictMember2020-12-310001035443are:A6420And6450SequenceDriveMember2020-12-310001035443are:A99659995SummersRidgeRoadMember2020-12-310001035443are:AREPortolaMember2020-12-310001035443are:A58105820NancyRidgeDriveMember2020-12-310001035443are:Number7330CarrollRoadMember2020-12-310001035443are:A9877WaplesStreetMember2020-12-310001035443are:Number5871OberlinDriveMember2020-12-310001035443are:A39113931398540254031And4045SorrentoValleyBoulevardMember2020-12-310001035443are:A110251103511045110551106511075RoselleStreetMember2020-12-310001035443are:Number13112EveningCreekDriveMember2020-12-310001035443are:TownsgatebyAlexandriaMember2020-12-310001035443are:A400DexterAvenueNorthMember2020-12-310001035443are:A23015thAvenueMember2020-12-310001035443are:Number219TerryAvenueMember2020-12-310001035443are:A601DexterAvenueNorthMember2020-12-310001035443are:A701DexterAvenueNorthMember2020-12-310001035443are:A8304thAvenueSouthMember2020-12-310001035443are:Number3000And3018WesternAvenueMember2020-12-310001035443are:Number410WHarrisonAnd410ElliottAvenueWestMember2020-12-310001035443are:A10104thAvenueSouthMember2020-12-310001035443are:A9800980499009920And9950MedicalCenterDriveMember2020-12-310001035443are:A9704970897129714MedicalCenterDriveMember2020-12-310001035443are:Number1330PiccardDriveMember2020-12-310001035443are:A9605MedicalCenterDriveMember2020-12-310001035443are:Number1500And1550EastGudeDriveMember2020-12-310001035443are:A14920and15010BroschartRoadMember2020-12-310001035443are:Number1405ResearchBoulevardMember2020-12-310001035443are:Number5ResearchPlaceMember2020-12-310001035443are:Number5ResearchCourtMember2020-12-310001035443are:A9920BelwardCampusDriveMember2020-12-310001035443are:Number12301ParklawnDriveMember2020-12-310001035443are:A14200ShadyGroveRoadMember2020-12-310001035443are:AlexandriaTechnologyCenterGaithersburgIMember2020-12-310001035443are:AlexandriaTechnologyCenterGaithersburgIIMember2020-12-310001035443are:Number401ProfessionalDriveMember2020-12-310001035443are:Number950WindRiverLaneMember2020-12-310001035443are:Number620ProfessionalDriveMember2020-12-310001035443are:Number8000And9000And10000VirginiaManorRoadMember2020-12-310001035443are:Number14225NewbrookDriveMember2020-12-310001035443are:AlexandriaCenterForLifeScienceDurhamMember2020-12-310001035443are:AlexandriaCenterForAgTechMember2020-12-310001035443are:AlexandriaCenterForAdvancedTechnologiesMember2020-12-310001035443are:AlexandriaTechnologyCenterAlstonMember2020-12-310001035443are:Number108And110And112And114AlexanderRoadMember2020-12-310001035443are:AlexandriaInnovationCenterResearchTriangleParkMember2020-12-310001035443are:Number7TriangleDriveMember2020-12-310001035443are:Number2525StateHighway54Member2020-12-310001035443are:A407DavisDriveMember2020-12-310001035443are:Number601KeystoneParkDriveMember2020-12-310001035443are:A6040GeorgeWattsHillDriveMember2020-12-310001035443are:Number5TriangleDriveMember2020-12-310001035443are:Number6101QuadrangleDriveMember2020-12-310001035443country:CA2020-12-310001035443are:VariousMember2020-12-310001035443are:ChinaPropertiesMember2020-12-31
UNITED STATES
SECURITIES AND EXCHANGE COMMISSION
Washington, D.C. 20549
FORM 10-K
(Mark One)
x ANNUAL REPORT PURSUANT TO SECTION 13 OR 15(d) OF THE SECURITIES EXCHANGE ACT OF 1934
For the fiscal year ended December 31, 2020
Commission file number 1-12993
ALEXANDRIA REAL ESTATE EQUITIES, INC.
(Exact name of registrant as specified in its charter)
| | | | | | | | |
| Maryland | | 95-4502084 |
| (State or other jurisdiction of incorporation or organization) | | (I.R.S. Employer Identification Number) |
26 North Euclid Avenue, Pasadena, California 91101
(Address of principal executive offices) (Zip code)
(626) 578-0777
(Registrant’s telephone number, including area code)
Securities registered pursuant to Section 12(b) of the Act:
| | | | | | | | |
| Title of each class | Trading Symbol(s) | Name of each exchange on which registered |
| Common Stock, $0.01 par value per share | ARE | New York Stock Exchange |
Securities registered pursuant to Section 12(g) of the Act: None
Indicate by check mark if the registrant is a well-known seasoned issuer, as defined in Rule 405 of the Securities Act. Yes x No o
Indicate by check mark if the registrant is not required to file reports pursuant to Section 13 or Section 15(d) of the Act. Yes o No x
Indicate by check mark whether the registrant (1) has filed all reports required to be filed by Section 13 or 15(d) of the Securities Exchange Act of 1934 during the preceding 12 months (or for such shorter period that the registrant was required to file such reports), and (2) has been subject to such filing requirements for the past 90 days. Yes o No x
Indicate by check mark whether the registrant has submitted electronically every Interactive Data File required to be submitted pursuant to Rule 405 of Regulation S-T (§ 232.405 of this chapter) during the preceding 12 months (or for such shorter period that the registrant was required to submit such files). Yes x No o
Indicate by check mark whether the registrant is a large accelerated filer, an accelerated filer, a non-accelerated filer, a smaller reporting company, or an emerging growth company. See the definitions of “large accelerated filer,” “accelerated filer,” “smaller reporting company,” and “emerging growth company” in Rule 12b-2 of the Exchange Act.
| | | | | | | | | | | | | | |
| Large accelerated filer | x | | Smaller reporting company | o |
| Accelerated filer | o | | Emerging growth company | o |
| Non-accelerated filer | o | | | |
If an emerging growth company, indicate by check mark if the registrant has elected not to use the extended transition period for complying with any new or revised financial accounting standards provided pursuant to Section 13(a) of the Exchange Act. o
Indicate by check mark whether the registrant has filed a report on and attestation to its management’s assessment of the effectiveness of its internal control over financial reporting under Section 404(b) of the Sarbanes-Oxley Act (15 U.S.C. 7262(b)) by the registered public accounting firm that prepared or issued its audit report. x
Indicate by check mark whether the registrant is a shell company (as defined in Rule 12b-2 of the Exchange Act). Yes o No x
The aggregate market value of the shares of Common Stock held by non-affiliates of registrant was approximately $20.2 billion based on the closing price for such shares on the New York Stock Exchange on June 30, 2020.
As of January 15, 2021, 136,692,746 shares of common stock were outstanding.
Documents Incorporated by Reference
Part III of this annual report on Form 10-K incorporates certain information by reference from the registrant’s definitive proxy statement to be filed within 120 days of the end of the fiscal year covered by this annual report on Form 10-K in connection with the registrant’s annual meeting of stockholders to be held on or about May 18, 2021.
INDEX TO FORM 10-K
ALEXANDRIA REAL ESTATE EQUITIES, INC.
| | | | | | | | |
| PART I | Page |
| | |
| | |
| | |
| | |
| | |
| | |
| | |
| | |
| PART II | |
| | |
| | |
| | |
| | |
| | |
| | |
| | |
| | |
| | |
| PART III | |
| | |
| | |
| | |
| | |
| | |
| | |
| PART IV | |
| | |
GLOSSARY
The following abbreviations or acronyms that may be used in this document shall have the adjacent meanings set forth below:
| | | | | |
| |
| |
| |
| ASU | Accounting Standards Update |
| ATM | At the Market |
| BBA | British Bankers’ Association |
| CIP | Construction in Progress |
| |
| EPS | Earnings per Share |
| FASB | Financial Accounting Standards Board |
| |
| |
| FDA | U.S. Food and Drug Administration |
| FDIC | Federal Deposit Insurance Corporation |
| FFO | Funds From Operations |
| GAAP | U.S. Generally Accepted Accounting Principles |
| HVAC | Heating, Ventilation, and Air Conditioning |
| IASB | International Accounting Standards Board |
| IFRS | International Financial Reporting Standards |
| IRS | Internal Revenue Service |
| JV | Joint Venture |
LEED® | Leadership in Energy and Environmental Design |
| LIBOR | London Interbank Offered Rate |
| Nareit | National Association of Real Estate Investment Trusts |
| NAV | Net Asset Value |
| |
| |
| |
| NYSE | New York Stock Exchange |
| REIT | Real Estate Investment Trust |
| RSF | Rentable Square Feet/Foot |
| SEC | Securities and Exchange Commission |
| SF | Square Feet/Foot |
| SoDo | South of Downtown submarket of Seattle |
| SoMa | South of Market submarket of San Francisco |
| |
| U.S. | United States |
| VIE | Variable Interest Entity |
PART I
Forward-looking statements
Certain information and statements included in this annual report on Form 10-K, including, without limitation, statements containing the words “forecast,” “guidance,” “goals,” “projects,” “estimates,” “anticipates,” “believes,” “expects,” “intends,” “may,” “plans,” “seeks,” “should,” or “will,” or the negative of these words or similar words, constitute “forward-looking statements” within the meaning of Section 27A of the Securities Act of 1933, as amended, and Section 21E of the Securities Exchange Act of 1934, as amended. Forward-looking statements involve inherent risks and uncertainties regarding events, conditions, and financial trends that may affect our future plans of operations, business strategy, results of operations, and financial position. A number of important factors could cause actual results to differ materially from those included within or contemplated by the forward-looking statements, including, but not limited to, the description of risks and uncertainties in “Item 1A. Risk factors” in this annual report on Form 10-K. Additional information regarding risk factors that may affect us is included in “Item 7. Management’s discussion and analysis of financial condition and results of operations” in this annual report on Form 10-K. Readers of our annual report on Form 10-K should also read our SEC and other publicly filed documents for further discussion regarding such factors.
As used in this annual report on Form 10-K, references to the “Company,” “Alexandria,” “we,” “us,” and “our” refer to Alexandria Real Estate Equities, Inc. and its consolidated subsidiaries. The following discussion should be read in conjunction with our consolidated financial statements and notes thereto under “Item 15. Exhibits and Financial Statement Schedules” in this annual report on Form 10-K.
ITEM 1. BUSINESS
Overview
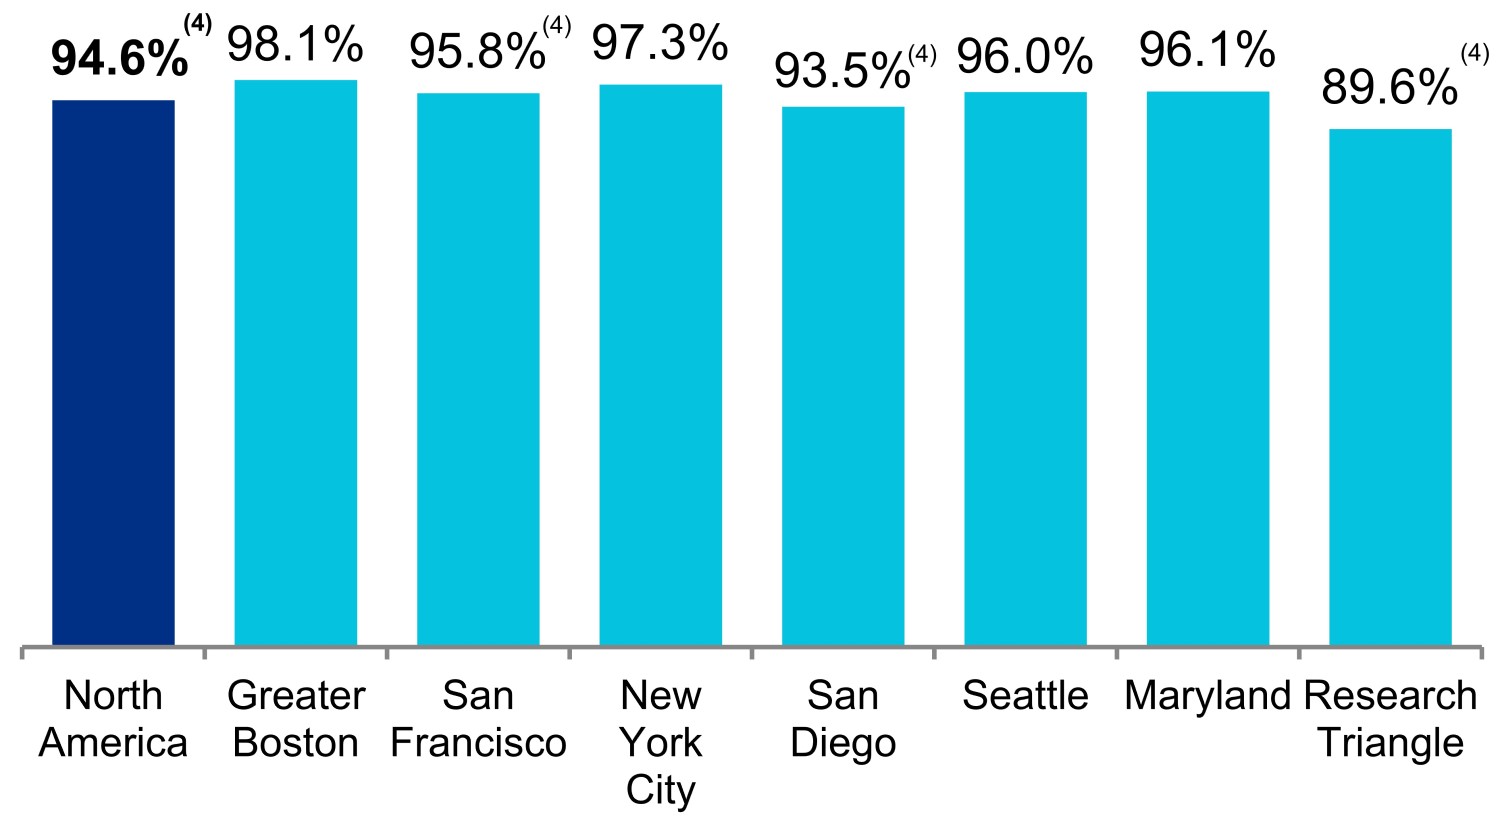
We are a Maryland corporation formed in October 1994 that has elected to be taxed as a REIT for federal income tax purposes. We are an S&P 500® urban office REIT and the first, longest-tenured, and pioneering owner, operator, and developer uniquely focused on collaborative life science, technology, and agtech campuses in AAA innovation cluster locations. We consider AAA locations to be highly desirable for tenancy by life science, technology, and agtech entities because of their close proximity to concentrations of specialized skills, knowledge, institutions, and related businesses. Such locations are generally characterized by high barriers to entry for new landlords, high barriers to exit for tenants, and a limited supply of available space. Founded in 1994, Alexandria pioneered this niche and has since established a significant market presence in key locations, including Greater Boston, San Francisco, New York City, San Diego, Seattle, Maryland, and Research Triangle.
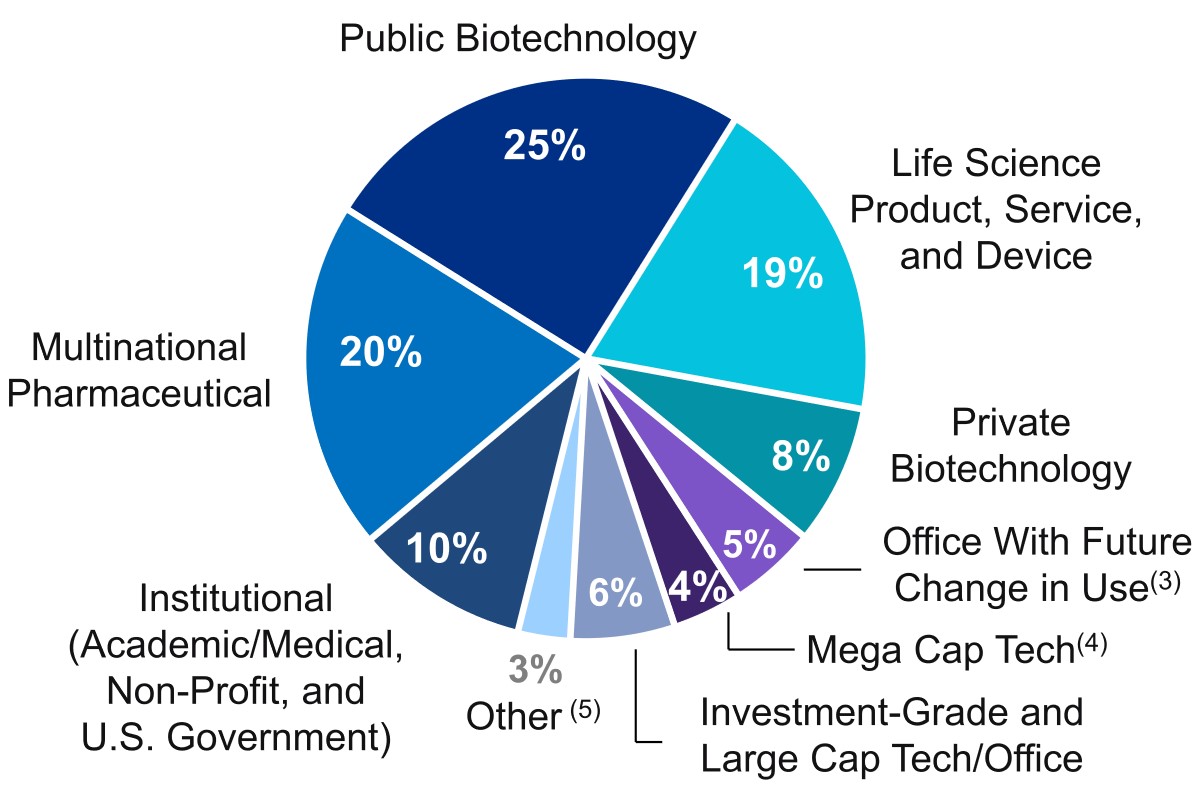
Alexandria develops dynamic urban cluster campuses and vibrant ecosystems that enable and inspire the world’s most brilliant minds and innovative companies to create life-changing scientific and technological breakthroughs. We believe in the utmost professionalism, humility, and teamwork. Alexandria manages its properties through fully integrated regional teams with real estate, life science, technology, and agtech expertise. Our tenants include multinational pharmaceutical companies; public and private biotechnology companies; life science product, service, and medical device companies; digital health, technology, and agtech companies; academic and medical research institutions; U.S. government research agencies; non-profit organizations; and venture capital firms. Alexandria has a longstanding and proven track record of developing Class A properties clustered in urban life science, technology, and agtech campuses that provide its innovative tenants with highly dynamic and collaborative environments that enhance their ability to successfully recruit and retain world-class talent and inspire productivity, efficiency, creativity, and success. Alexandria also provides strategic risk capital to transformative life science, technology, and agtech companies through its venture capital arm. We believe our unique business model and diligent underwriting ensure a high-quality and diverse tenant base that should result in higher occupancy levels, longer lease terms, higher rental income, higher returns, and greater long-term asset value.
As of December 31, 2020, Alexandria’s total market capitalization was $31.9 billion. For the definition of “Total market capitalization,” refer to the “Non-GAAP measures and definitions” section under Item 7 in this annual report on Form 10-K. Our asset base in North America consisted of 49.7 million SF, which includes 31.9 million RSF of operating properties and 3.3 million RSF of Class A properties undergoing construction, 7.1 million RSF of near-term and intermediate-term development and redevelopment projects, and 7.4 million SF of future development projects as of December 31, 2020. These operating properties and development projects include 40 properties that are held by consolidated real estate joint ventures and six properties that are held by unconsolidated real estate joint ventures. The occupancy percentage of our operating properties in North America was 94.6% as of December 31, 2020. Our 10-year average occupancy rate of operating properties as of December 31, 2020, was 96%. Investment-grade or publicly traded large cap tenants represented 55% of our annual rental revenue in effect as of December 31, 2020. Additional information regarding our consolidated and unconsolidated real estate joint ventures is included in “Item 7. Management’s discussion and analysis of financial condition and results of operations” in this annual report on Form 10-K. Additional information regarding risk factors that may affect us is included in “Item 1A. Risk factors” and “Item 7. Management’s discussion and analysis of financial condition and results of operations” in this annual report on Form 10-K.
Business objective and strategies
Our primary business objective is to maximize long-term asset value and shareholder returns based on a multifaceted platform of internal and external growth. A key element of our strategy is our unique focus on Class A properties clustered in urban campuses located in AAA innovation cluster locations. These key urban campus locations are characterized by high barriers to entry for new landlords, high barriers to exit for tenants, and a limited supply of available space. They represent highly desirable locations for tenancy by life science, technology, and agtech entities because of their close proximity to concentrations of specialized skills, knowledge, institutions, and related businesses. Our strategy also includes drawing upon our deep and broad real estate, life science, technology, and agtech relationships in order to identify and attract new and leading tenants and to source additional value-creation real estate.
Our tenant base is broad and diverse within the life science, technology, and agtech industries and reflects our focus on regional, national, and international tenants with substantial financial and operational resources. For a more detailed description of our properties and tenants, refer to “Item 2. Properties” in this annual report on Form 10-K. We have an experienced Board of Directors and are led by an executive and senior management team with extensive experience in the real estate, life science, technology, and agtech industries.
Acquisitions
We seek to identify and acquire high-quality properties in our target cluster markets. Critical evaluation of prospective property acquisitions is an essential component of our acquisition strategy. When evaluating acquisition opportunities, we assess a full range of matters relating to the prospective property or properties, including:
•Proximity to centers of innovation and technological advances;
•Location of the property and our strategy in the relevant market;
•Quality of existing and prospective tenants;
•Condition and capacity of the building infrastructure;
•Physical condition of the structure and common area improvements;
•Quality and generic characteristics of the improvements;
•Opportunities available for leasing vacant space and for re-tenanting or renewing occupied space;
•Availability of and/or ability to add appropriate tenant amenities;
•Availability of land for future ground-up development of new space;
•Opportunities to generate higher rent through redevelopment of existing space;
•The property’s unlevered yields; and
•Our ability to increase the property’s long-term financial returns.
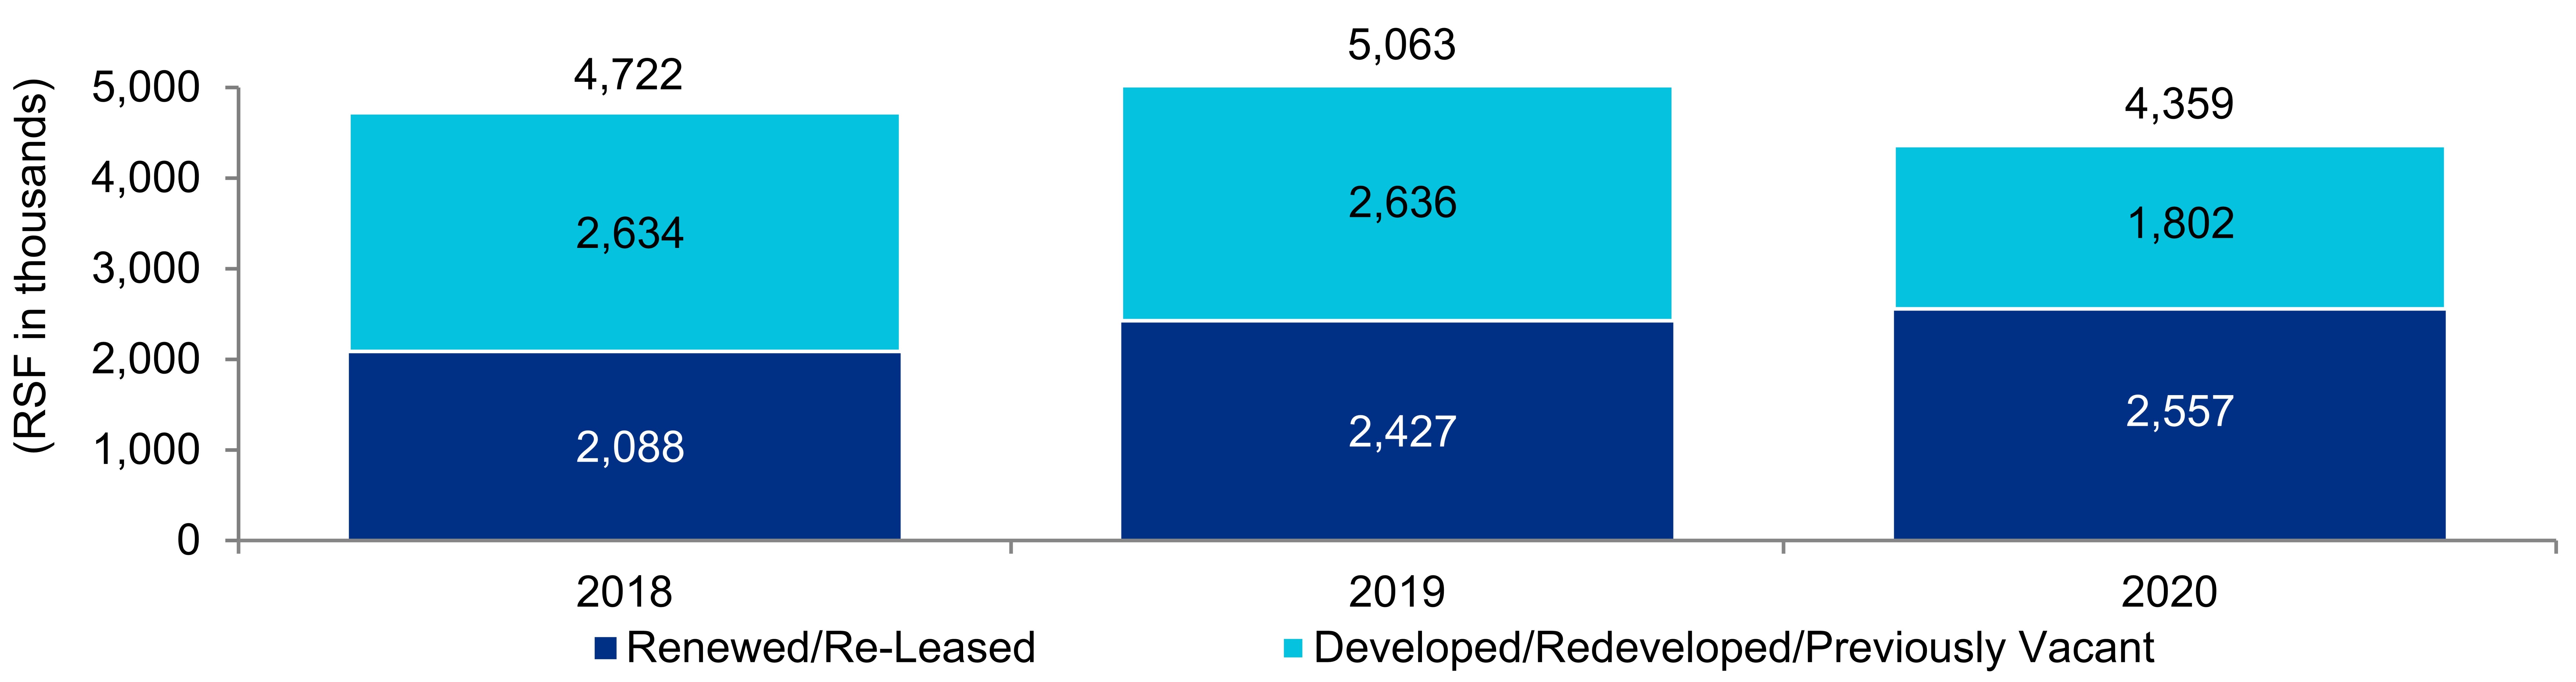
Development, pre-construction, and redevelopment
A key component of our business model is our value-creation development projects. Our development strategy is primarily to pursue selective projects with significant pre-leasing for which we expect to achieve appropriate investment returns and generally match a source of funds for this use. Our value-creation development projects focus on high-quality, generic, and reusable office/laboratory or tech office space to meet the real estate requirements of our diverse group of tenants.
We seek to meet growing demand from our stakeholders and continuously improve the efficiency of our buildings. We have committed to significant building goals to promote wellness and productivity for our buildings’ occupants, including targeting a minimum of LEED® Gold certification on all new ground-up construction projects.
Pre-construction activities include entitlements, permitting, design, site work, and other activities preceding commencement of construction of aboveground building improvements, which are focused on reducing the time required to deliver projects to prospective tenants. These critical activities add significant value to our future ground-up development and are required for the vertical construction of buildings. We normally do not commence vertical construction of new projects prior to achieving significant pre-leasing.
Another key component of our business model is our value-creation redevelopment of existing office, warehouse, or shell space, or newly acquired properties, into high-quality, generic, and reusable office/laboratory space that can be leased at higher rental rates. Our redevelopment strategy generally includes significant pre-leasing of projects prior to the commencement of redevelopment.
Non-real estate investments
We also hold equity investments in publicly traded companies, limited partnerships, and privately held entities primarily involved in the life science, technology, and agtech industries. We invest primarily in highly innovative entities whose focus on the development of therapies and products that advance health and transform patients’ lives is aligned with Alexandria’s purpose of making a positive and meaningful impact on the health, safety, and well-being of the global community. Our status as a REIT limits our ability to make such non-real estate investments. Therefore, we conduct, and will continue to conduct, our non-real estate investment activities in a manner that complies with REIT requirements.
Balance sheet and financial strategy
We seek to maximize balance sheet liquidity and flexibility, cash flows, and cash available for distribution to our stockholders through the ownership, operation, management, and selective acquisition, development, and redevelopment of office/laboratory and tech office space, as well as the management of our balance sheet. In particular, we seek to maximize balance sheet liquidity and flexibility, cash flows, and cash available for distribution to our stockholders by:
•Maintaining access to diverse sources of capital, including operating cash flows after dividends, incremental debt, asset sales, and other capital such as the sale of equity or joint venture capital;
•Maintaining significant liquidity through borrowing capacity under our unsecured senior line of credit and commercial paper program, marketable securities, issuances of forward equity contracts from time to time, and cash, cash equivalents, and restricted cash;
•Continuing to improve our credit profile;
•Minimizing the amount of near-term debt maturities in a single year;
•Maintaining commitment to long-term capital to fund growth;
•Maintaining low to modest leverage;
•Minimizing variable interest rate risk;
•Generating high-quality, strong, and increasing operating cash flows;
•Selectively selling real estate assets, including land parcels and non-core/“core-like” operating assets, and reinvesting the proceeds into our highly leased value-creation development and redevelopment projects;
•Allocating capital to Class A properties located in collaborative life science, technology, and agtech campuses in AAA urban innovation clusters;
•Maintaining geographic diversity in urban intellectual centers of innovation;
•Selectively acquiring high-quality office/laboratory and tech office space in our target urban innovation cluster submarkets at prices that enable us to realize attractive returns;
•Selectively developing properties in our target urban innovation cluster submarkets;
•Selectively redeveloping existing office, warehouse, or shell space, or newly acquired properties, into high-quality, generic, and reusable office/laboratory space that can be leased at higher rental rates in our target urban innovation cluster submarkets;
•Renewing existing tenant space at higher rental rates to the extent possible;
•Minimizing tenant improvement costs;
•Improving investment returns through the leasing of vacant space and the replacing of existing tenants with new tenants at higher rental rates;
•Executing leases with high-quality tenants and proactively monitoring tenant health;
•Maintaining solid occupancy while attaining high rental rates;
•Realizing contractual rental rate escalations; and
•Implementing effective cost control measures, including negotiating pass-through provisions in tenant leases for operating expenses and certain capital expenditures.
Competition
In general, other office/laboratory and tech office properties are located in close proximity to our properties. The amount of rentable space available in any market could have a material effect on our ability to rent space and on the rental rates we can attain for our properties. In addition, we compete for investment opportunities with other REITs, insurance companies, pension and investment funds, private equity entities, partnerships, developers, investment companies, owners/occupants, and foreign investors. Many of these entities have substantially greater financial resources than we do and may be able to invest more than we can or accept more risk than we are willing to accept. These entities may be less sensitive to risks with respect to the creditworthiness of a tenant or the overall expected returns from real estate investments. In addition, as a result of their financial resources, our competitors may offer more free rent concessions, lower rental rates, or higher tenant improvement allowances in order to attract tenants. These leasing incentives could hinder our ability to maintain or raise rents and attract or retain tenants. Competition may also reduce the number of suitable investment opportunities available to us or may increase the bargaining power of property owners seeking to sell. Competition in acquiring existing properties and land, both from institutional capital sources and from other REITs, has been very strong over the past several years; however, we believe we have differentiated ourselves from our competitors. As the first and only publicly traded urban office REIT to focus primarily on the office/laboratory real estate niche, we provide world-class collaborative life science, technology, and agtech campuses in AAA innovation cluster locations and maintain and cultivate many of the most important and strategic relationships in the life science, technology, and agtech industries.
Financial information about our reportable segment
Refer to Note 2 – “Summary of significant accounting policies” to our consolidated financial statements under Item 15 in this annual report on Form 10-K for information about our one reportable segment.
Regulation
General
Properties in our markets are subject to various laws, ordinances, and regulations, including regulations relating to common areas. We believe we have the necessary permits and approvals to operate each of our properties.
Americans with Disabilities Act
Our properties must comply with Title III of the Americans with Disabilities Act of 1990 (“ADA”) to the extent that such properties are “public accommodations” as defined by the ADA. The ADA may require removal of structural barriers to permit access by persons with disabilities in certain public areas of our properties where such removal is readily achievable. We believe that our properties are in substantial compliance with the ADA and that we will not be required to incur substantial capital expenditures to address the requirements of the ADA. However, noncompliance with the ADA could result in the imposition of fines or an award of damages to private litigants. The obligation to make readily achievable accommodations is an ongoing one, and we will continue to assess our properties and make alterations as appropriate in this respect.
Environmental matters
Under various environmental protection laws, a current or previous owner or operator of real estate may be liable for contamination resulting from the presence or discharge of hazardous or toxic substances at that property and may be required to investigate and remediate contamination located on or emanating from that property. Such laws often impose liability without regard to whether the owner or operator knew of, or was responsible for, the presence of the contaminants, and the liability may be joint and several. Previous owners may have used some of our properties for industrial and other purposes, so those properties may contain some level of environmental contamination. The presence of contamination or the failure to remediate contamination at our properties may expose us to third-party liability or may materially adversely affect our ability to sell, lease, or develop the real estate or to borrow using the real estate as collateral.
Some of our properties may have asbestos-containing building materials. Environmental laws require that asbestos-containing building materials be properly managed and maintained and may impose fines and penalties on building owners or operators for failure to comply with these requirements. These laws may also allow third parties to seek recovery from owners or operators for personal injury associated with exposure to asbestos-containing building materials.
In addition, some of our tenants handle hazardous substances and wastes as part of their routine operations at our properties. Environmental laws and regulations subject our tenants, and potentially us, to liability resulting from such activities. Environmental liabilities could also affect a tenant’s ability to make rental payments to us. We require our tenants to comply with these environmental laws and regulations and to indemnify us against any related liabilities.
Independent environmental consultants have conducted Phase I or similar environmental site assessments on the properties in our portfolio. Site assessments are intended to discover and evaluate information regarding the environmental condition of the surveyed property and surrounding properties and do not generally include soil samplings, subsurface investigations, or an asbestos survey. To date, these assessments have not revealed any material environmental liability that we believe would have a material adverse effect on our business, assets, or results of operations. Nevertheless, it is possible that the assessments on our properties have not revealed all environmental conditions, liabilities, or compliance concerns that may have arisen after the review was completed or may arise in the future; and future laws, ordinances, or regulations may also impose additional material environmental liabilities.
Insurance
With respect to our properties, we carry commercial general liability, all-risk property, and business interruption insurance, including loss of rental income coverage. We select policy specifications and insured limits that we believe to be appropriate given the relative risk of loss and the cost of the coverage. In addition, we have obtained earthquake insurance for certain properties located in the vicinity of known active earthquake zones in an amount and with deductibles we believe are commercially reasonable. We also carry environmental insurance and title insurance policies on our properties. We generally obtain title insurance policies when we acquire the property, with each policy covering an amount equal to the initial purchase price of each property. Accordingly, any of our title insurance policies may be in an amount less than the current value of the related property. Additional information regarding risk factors that may affect us is included in “Item 1A. Risk factors” in this annual report on Form 10-K.
Available information
Copies of our annual reports on Form 10-K, quarterly reports on Form 10-Q, and current reports on Form 8-K, including any amendments to the foregoing reports, are available, free of charge, through our corporate website at www.are.com as soon as is reasonably practicable after such material is electronically filed with, or furnished to, the SEC. The current charters of our Board of Directors’ Audit, Compensation, and Nominating & Governance Committees, along with our corporate governance guidelines and Business Integrity Policy and Procedures for Reporting Non-Compliance (the “Business Integrity Policy”), are also available on our corporate website. Additionally, any amendments to, and waivers of, our Business Integrity Policy that apply to our Co-Chief Executive Officers or our Chief Financial Officer will be available free of charge on our corporate website in accordance with applicable SEC and NYSE requirements. Written requests should be sent to Alexandria Real Estate Equities, Inc., 26 North Euclid Avenue, Pasadena, California 91101, Attention: Investor Relations. The public may also download these materials from the SEC’s website at www.sec.gov.
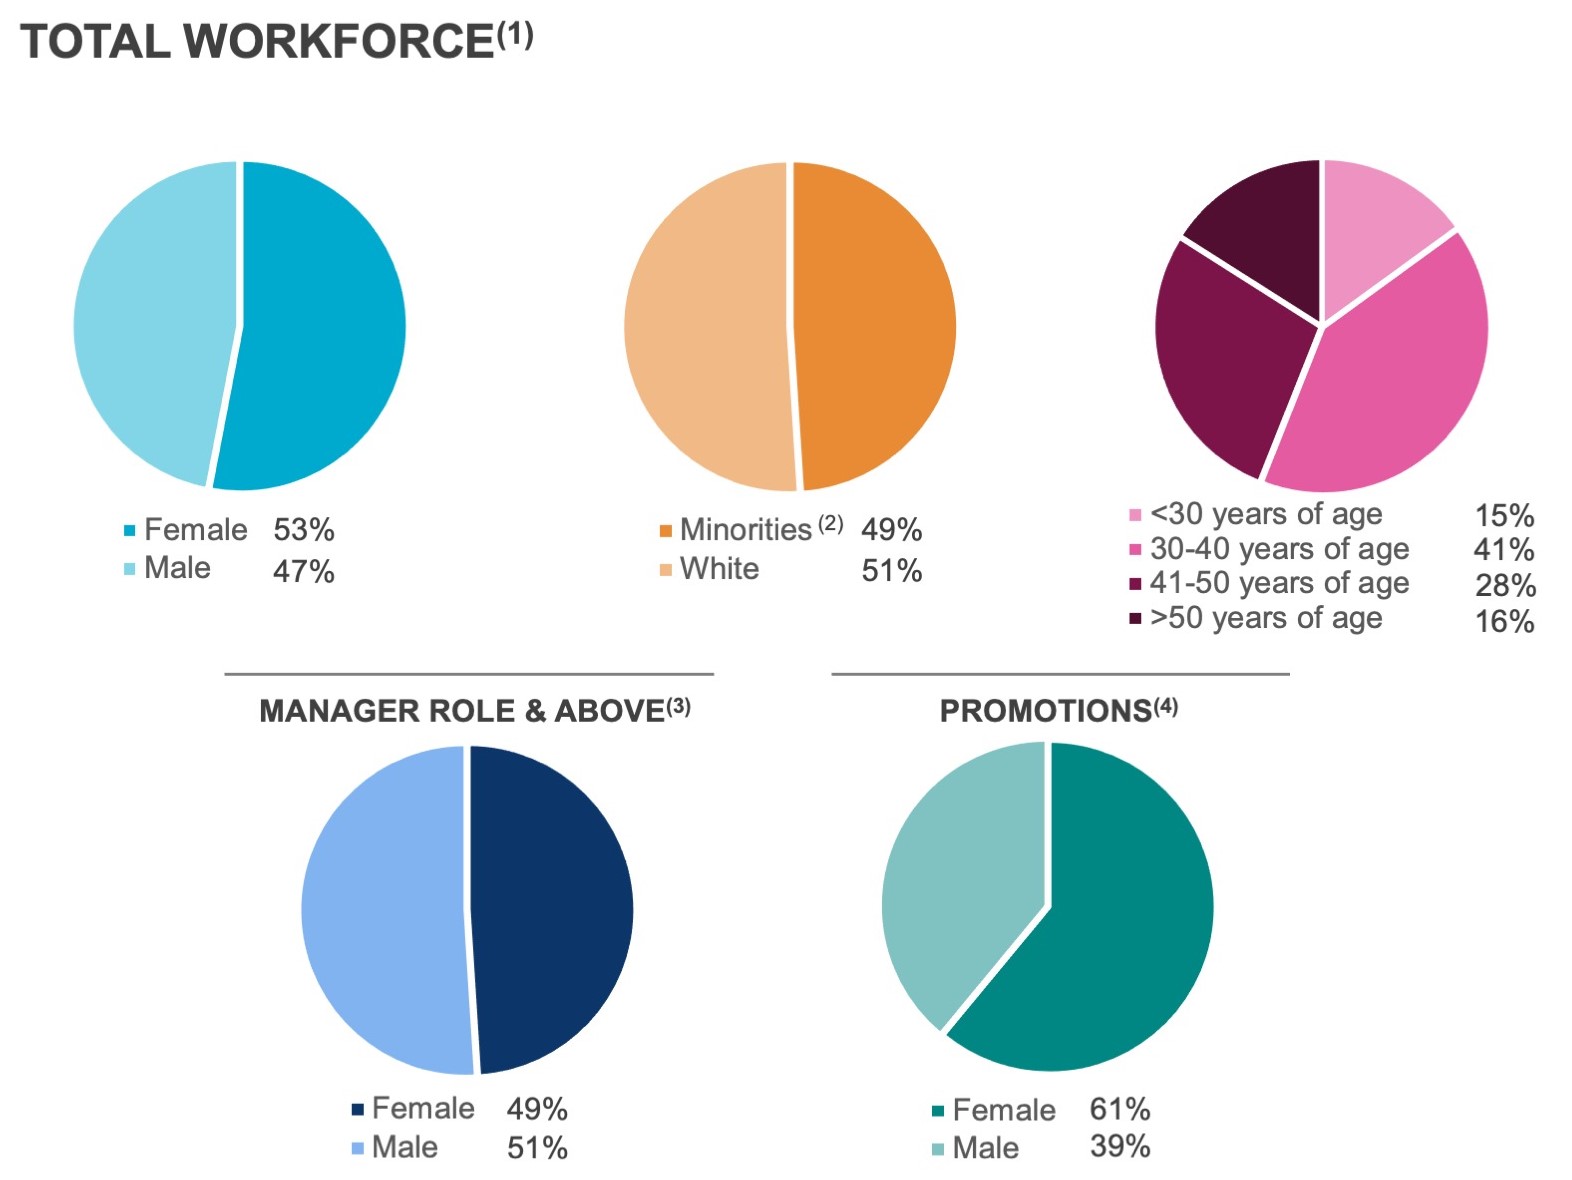
Human Capital
As of December 31, 2020, we had 470 employees. We believe that we have good relations with our employees. We have adopted a Business Integrity Policy that applies to all of our employees, and its receipt and review by each employee is documented and verified annually. In order to promote an exceptional corporate culture, Alexandria continuously monitors employee satisfaction, seeks employee feedback, and seeks opportunities to enhance our offerings. We participate in annual performance reviews with our employees and conduct formal employee surveys, and our talent management team holds annual meetings with employees. The positive employee experience is evidenced by our low voluntary and total turnover rates (averaging 4.1% and 8.1%, respectively, over the last five years, from 2016 to 2020), which are well below the reported median voluntary and total turnover rates of 10% and 18.0%, respectively, in the Nareit 2020 Compensation & Benefits Survey (data for 2019).
We have an exceptional track record of identifying highly qualified candidates for promotion from within the Company. Alexandria’s executive and senior management team, represented by our senior vice presidents and above, consists of 47 individuals, averaging 24 years of real estate experience, including 12 years with Alexandria. Our executive management team alone averages 17 years of experience with Alexandria. Alexandria’s executive and senior management team has unique experience and expertise in creating, owning, and operating highly dynamic and collaborative campuses in key urban life science, technology, and agtech cluster locations. Alexandria’s highly experienced management team also includes regional market directors with leading reputations and longstanding relationships within the life science, technology, and agtech communities in their respective urban innovation clusters. We believe that our expertise, experience, reputation, and key relationships in the real estate, life science, technology, and agtech industries provide Alexandria with significant competitive advantages in attracting new business opportunities.
At Alexandria, people come first. At the outset of the COVID-19 pandemic, we moved swiftly to support our employees’ medical, mental, emotional, physical, and financial health. Our commitment to our people has always been our primary focus, and we continue to devote extraordinary efforts to hire, develop, and retain a healthy and diverse workforce.
Supporting our employees through COVID-19 and beyond
In response to COVID-19-related state and local government orders to stay at home, Alexandria immediately issued a $1,000 emergency bonus to each of our non-officer employees, connected employees to LiveHealth Online support, and shared comprehensive resources and tools to help our team members cope with stress, anxiety, isolation, and loss and also balance work and child care obligations. To further support our employees in prioritizing their health and well-being, the Company temporarily enhanced our existing wellness benefit. This enrichment included reimbursement of fitness and mindfulness applications, online classes, and exercise equipment to help our employees reach their individual wellness goals and stay physically and mentally strong. Additionally, Alexandria has been able to leverage our world-class network to curate a series of internal webinars featuring leading experts on COVID-19 to keep our employees informed and address some of their questions or pressing concerns.
Providing exceptional benefits to support our employees’ well-being, medical and financial health
We provide a comprehensive benefits package intended to meet and exceed the needs of our employees and their families. Our highly competitive offering helps our employees stay healthy, balance their work and personal lives, and meet their financial and retirement goals. We pay 100% of the health insurance premiums for our employees and their families and provide an employee assistance program to help them address a wide range of issues. In addition, Alexandria’s Operation CARE program provides the following services to our employees:
•Alexandria Access. Alexandria’s unparalleled network in the life science community affords us access to deep medical expertise. Alexandria Access makes this expertise available to our employees and their immediate family members who are experiencing an illness or injury and would benefit from specialized expertise.
•Matching Gifts. Alexandria matches each employee’s financial contributions to, or funds raised for, eligible nonprofit organizations on a dollar-for-dollar basis, up to $2,500 per person each calendar year, to double the impact of their charitable gifts.
•Volunteer Time Off. Each Alexandria employee receives 16 hours (two days) per calendar year of paid volunteer time off to use at the eligible non-profit(s) of their choice.
•Volunteer Rewards. When an Alexandria employee volunteers more than 25 hours in any one quarter at an eligible nonprofit(s), Alexandria donates a total of $2,500 to the eligible non-profit(s) of their choice.
Investing in professional development and training
We understand that to attract and retain the best talent, we must provide opportunities for our people to grow and develop. Therefore, we invest in training and development programs to enhance our employees’ engagement, effectiveness, and well-being.
In-person and virtual training topics include project management, business writing, leadership, change management, interviewing, presentations, productivity, conversations crucial to business results, effective one-on-ones, goal setting, delegation,
flexibility, self-direction, and feedback. Our annual mentoring program allows employees to partner with senior leaders throughout the organization and receive career guidance. To customize training and development, we conduct needs assessments and design training programs for specific functional teams as well as offer a highly customized coaching program for high-potential executives, leaders, and teams. We provide access to expert panels and cutting-edge information via webinars in order to share information and support our team. We also provide on-demand learning resources such as LinkedIn Learning for employees to take classes that range from creating effective PowerPoint presentations to understanding how the brain reacts to stress.
To continuously monitor and improve employee performance and engagement, we issue satisfaction surveys and conduct annual performance reviews. Our talent management team additionally conducts formal surveys and holds regular feedback meetings with our employees.
Building a diverse and inclusive workforce
We work every day to create an open and respectful environment where everyone can actively contribute, have equal access to opportunities and resources, be themselves, and realize their potential.
Our Corporate Governance Guidelines highlight the Board of Directors’ focus on diversity, which explicitly states the board’s commitment to considering qualified women and minority director candidates, as well its policy of requesting an initial list of diverse candidates of any search firm it retains. As an Equal Opportunity Employer, we emphasize inclusion through hiring and compensation practices and consider a pool of diverse candidates for open positions and internal advancement opportunities. To address issues related to pay discrimination, we do not ask potential candidates about their current or previous compensation during the hiring process, and we incorporate equal and fair pay reviews into every employment compensation decision. To reinforce our corporate culture of respect, diversity, and inclusion, each of our employees completes anti-harassment training annually.
(1)As of December 31, 2020.
(2)Minorities are defined to include individuals of Asian, Black/African American, Hispanic/Latino, Native American or Pacific Islander, or multiracial background. We determine race and gender based on our employees' self-identification or other information compiled to meet requirements of the U.S. government.
(3)Managers and above include individuals who lead others and/or oversee projects.
(4)Represents a five-year average from 2016 to 2020.
Overview
The following risk factors may adversely affect our overall business, financial condition, results of operations, and cash flows; our ability to make distributions to our stockholders; our access to capital; or the market price of our common stock, as further described in each risk factor below. In addition to the information set forth in this annual report on Form 10-K, one should carefully review and consider the information contained in our other reports and periodic filings that we make with the SEC. Those risk factors could materially affect our overall business, financial condition, results of operations, and cash flows; our ability to make distributions to our stockholders; our access to capital; or the market price of our common stock. The risks that we describe in our public filings are not the only risks that we face. Additional risks and uncertainties not presently known to us, or that we currently consider immaterial, also may materially adversely affect our business, financial condition, and results of operations. Additional information regarding forward-looking statements is included in the beginning of “Part I” in this annual report on Form 10-K.
Risk factors summary
An investment in our securities involves various risks. Such risks, including those set forth in the summary of material risks in this Item 1A, should be carefully considered before purchasing our securities.
Risks related to operating factors
•We may be unable to identify and complete acquisitions, investments, or development or redevelopment projects or to successfully and profitably operate properties.
•We could default on our ground leases or be unable to renew or re-lease our land or space on favorable terms or at all. Our tenants may also be unable to pay us rent.
•The cost of maintaining and improving the quality of our properties may be higher than anticipated, and we may be unable to pass any increased operating costs through to our tenants, which can result in reduced cash flows and profitability.
•We could be held liable for environmental damages resulting from our tenants’ use of hazardous materials, or from harmful mold, poor air quality, or other defects from our properties, or we could face increased costs in complying with other environmental laws.
•The loss of services of any of our senior officers or key employees and increased competition for skilled personnel could adversely affect us and/or increase our labor costs.
•We rely on a limited number of vendors to provide utilities and other services at our properties, and disruption in such services may have an adverse effect on our operations and financial condition.
•Our insurance may not adequately cover all of our potential losses, or we may incur costs due to the financial condition of our insurance carriers.
•We may change business policies without stockholder approval.
•Failure to maintain effective internal control over financial reporting could have a material adverse effect on our business.
•If we failed to qualify as a REIT, we would be taxed at corporate rates and would not be able to take certain deductions when computing our taxable income.
•We may not be able to raise sufficient capital to fund our operations due to adverse changes in our credit ratings, our inability to refinance our existing debt or issue new debt, or our inability to sell existing properties quickly.
•We may invest or spend the net proceeds from our equity or debt offerings in ways with which our investors may not agree and in ways that may not earn a profit.
•Our debt service obligations may restrict our ability to engage in some business activities or cause other adverse effects on our business.
•We face risks and liabilities associated with our investments (including those in connection with short-term liquid investments) and the companies in which we invest (including properties owned through partnerships, limited liability companies, and joint ventures, as well as through our non-real estate venture investment portfolio), which expose us to risks similar to those of our tenant base and additional risks inherent in venture capital investing. We may be limited in our ability to diversify our investments.
Risks related to market and industry factors
•There are limits on ownership of our stock under which a stockholder may lose beneficial ownership of its shares, as well as certain provisions of our charter and bylaws that may delay or prevent transactions that otherwise may be desirable to our stockholders.
•Possible future sales of shares of our common stock could adversely affect its market price.
•We are dependent on the health of the life science, technology, and agtech industries, and changes within these industries, increased competition, or the inability of our tenants and non-real estate equity investments within these industries to obtain funding for research, development, and other operations may adversely impact their ability to make rental payments to us or adversely impact their value.
•Market disruption and volatility, poor economic conditions in the capital markets and global economy, including in connection with the COVID-19 pandemic, and high unemployment levels could adversely affect the value of the companies in which we hold equity investments or the ability of tenants and the companies in which we invest to raise additional capital or access capital from venture capital investors or financial institutions on favorable terms.
Risks related to government and global factors
•Actions, policy, or key leadership changes in government agencies, or changes to laws or regulations, including those related to tax, accounting, debt, derivatives, government spending, or funding (including those related to the FDA, the National Institutes of Health (the “NIH”), the SEC, and other agencies), and drug and healthcare pricing, costs, and programs could have a significant negative impact on the overall economy, our tenants, and our business.
•Partial or complete government shutdown resulting in temporary closures of agencies could adversely affect our tenants (some of which are also government agencies) and the companies in which we invest, including delays in the commercialization of such companies’ products, decreased funding of research and development, or delays surrounding approval of budget proposals.
•The replacement of LIBOR with an alternative reference rate may adversely affect interest expense related to outstanding debt.
•The current outbreak of COVID-19, or the future outbreak of any other highly infectious or contagious diseases, could adversely impact or cause disruption to our financial condition and results of operations, and/or to the financial condition and results of operations of our tenants and non-real estate investments.
Risks related to general and other factors
•Social, political, and economic instability, unrest, significant changes, and other circumstances beyond our control, including circumstances related to changes in the U.S. presidential administration, could adversely affect our business operations.
•Seasonal weather conditions, climate change and severe weather, changes in the availability of transportation or labor, especially in connection with the COVID-19 pandemic, and other related factors may affect our ability to conduct business, the products, and services of our tenants, or the availability of such products and services of our tenants and the companies in which we invest.
•We may be unable to meet our sustainability goals.
•System failures or security incidents through cyber attacks, intrusions, or other methods could disrupt our information technology networks and related systems, cause a loss of assets or data, give rise to remediation or other expenses, expose us to liability under federal and state laws, and subject us to litigation and investigations, which could result in substantial reputational damage and adversely affect our business and financial condition.
•We are subject to risks from potential fluctuations in exchange rates between the U.S. dollar and foreign currencies and downgrades of domestic and foreign government sovereign credit ratings.
We attempt to mitigate the foregoing risks. However, if we are unable to effectively manage the impact of these and other risks, our ability to meet our investment objectives would be substantially impaired and any of the foregoing risks could materially adversely affect our financial condition, results of operations, and cash flows, our ability to make distributions to our stockholders, or the market price of our common stock.
Operating factors
We may be unable to identify and complete acquisitions and successfully operate acquired properties.
We continually evaluate the market of available properties and may acquire properties when opportunities exist. Our ability to acquire properties on favorable terms and successfully operate them may be exposed to significant risks, including, but not limited to the following:
•We may be unable to acquire a desired property because of competition from other real estate investors with significant capital, including both publicly traded REITs and institutional funds;
•Even if we are able to acquire a desired property, competition from other potential acquirers may significantly increase the purchase price or result in other less favorable terms;
•Even if we enter into agreements for the acquisition of properties, these agreements are subject to customary conditions to closing, including completion of due diligence investigations to our satisfaction;
•We may be unable to complete an acquisition because we cannot obtain debt and/or equity financing on favorable terms or at all;
•We may spend more than budgeted amounts to make necessary improvements or renovations to acquired properties;
•We may be unable to quickly and efficiently integrate new acquisitions, particularly acquisitions of operating properties or portfolios of properties, into our existing operations;
•Acquired properties may be subject to reassessment, which may result in higher-than-expected property tax payments;
•Market conditions may result in higher-than-expected vacancy rates and lower-than-expected rental rates; and
•We may acquire properties subject to liabilities and without any recourse, or with only limited recourse, with respect to unknown liabilities, such as liabilities for the remediation of undisclosed environmental contamination; claims by tenants, vendors, or other persons dealing with the former owners of the properties; and claims for indemnification by general partners, directors, officers, and others indemnified by the former owners of the properties.
The realization of any of the above risks could significantly and adversely affect our ability to meet our financial expectations, our financial condition, results of operations, and cash flows, our ability to make distributions to our stockholders, the market price of our common stock, and our ability to satisfy our debt service obligations.
We may suffer economic harm as a result of making unsuccessful acquisitions in new markets.
We may pursue selective acquisitions of properties in markets where we have not previously owned properties. These acquisitions may entail risks in addition to those we face in other acquisitions where we are familiar with the markets, such as the risk of not correctly anticipating conditions or trends in a new market and therefore not being able to generate profit from the acquired property. If this occurs, it could adversely affect our financial condition, results of operations, and cash flows, our ability to make distributions to our stockholders, our ability to satisfy our debt service obligations, and the market price of our common stock.
The acquisition of new properties or the development of new properties may give rise to difficulties in predicting revenue potential.
We may continue to acquire additional properties and/or land and may seek to develop our existing land holdings strategically as warranted by market conditions. These acquisitions and developments could fail to perform in accordance with expectations. If we fail to accurately estimate occupancy levels, rental rates, lease commencement dates, operating costs, or costs of improvements to bring an acquired property or a development property up to the standards established for our intended market position, the performance of the property may be below expectations. Acquired properties may have characteristics or deficiencies affecting their valuation or revenue potential that we have not yet discovered. We cannot assure our stockholders that the performance of properties acquired or developed by us will increase or be maintained under our management.
We may fail to achieve the financial results expected from development or redevelopment projects.
There are significant risks associated with development and redevelopment projects, including, but not limited to, the following possibilities:
•We may not complete development or redevelopment projects on schedule or within budgeted amounts;
•We may be unable to lease development or redevelopment projects on schedule or within budgeted amounts;
•We may encounter project delays or cancellations due to unavailability of necessary labor and construction materials;
•We may expend funds on, and devote management’s time to, development and redevelopment projects that we may not complete;
•We may abandon development or redevelopment projects after we begin to explore them, and as a result, we may lose deposits or fail to recover costs already incurred;
•Market and economic conditions may deteriorate, which can result in lower-than-expected rental rates;
•We may face higher operating costs than we anticipated for development or redevelopment projects, including insurance premiums, utilities, real estate taxes, and costs of complying with changes in government regulations or increases in tariffs;
•We may face higher requirements for capital improvements than we anticipated for development or redevelopment projects, particularly in older structures;
•We may be unable to proceed with development or redevelopment projects because we cannot obtain debt and/or equity financing on favorable terms or at all;
•We may fail to retain tenants that have pre-leased our development or redevelopment projects if we do not complete the construction of these properties in a timely manner or to the tenants’ specifications;
•Tenants that have pre-leased our development or redevelopment projects may file for bankruptcy or become insolvent, which may adversely affect the income produced by, and the value of, our properties or require us to change the scope of the project, which may potentially result in higher construction costs and lower financial returns;
•We may encounter delays, refusals, unforeseen cost increases, and other impairments resulting from third-party litigation, natural disasters, or severe weather conditions;
•We may encounter delays or refusals in obtaining all necessary zoning, land use, building, occupancy, and other required government permits and authorizations; and
•Development or redevelopment projects may have defects we do not discover through our inspection processes, including latent defects that may not reveal themselves until many years after we put a property in service.
The realization of any of the above risks could significantly and adversely affect our ability to meet our financial expectations, our financial condition, results of operations, and cash flows, our ability to make distributions to our stockholders, the market price of our common stock, and our ability to satisfy our debt service obligations.
We could default on leases for land on which some of our properties are located or held for future development.
If we default under the terms of a ground lease obligation, we may lose the ownership rights to the property subject to the lease. Upon expiration of a ground lease and all of its options, we may not be able to renegotiate a new lease on favorable terms, if at all. The loss of the ownership rights to these properties or an increase in rental expense could have a material adverse effect on our financial condition, results of operations, and cash flows, and our ability to satisfy our debt service obligations and make distributions to our stockholders, as well as the market price of our common stock. Refer to “Ground lease obligations” in the “Uses of capital” subsection of the “Capital resources” section under “Item 7. Management’s discussion and analysis of financial condition and results of operations” in this annual report on Form 10-K for additional information on our ground lease obligations.
We may not be able to operate properties successfully and profitably.
Our success depends in large part upon our ability to operate our properties successfully. If we are unable to do so, our business could be adversely affected. The ownership and operation of real estate is subject to many risks that may adversely affect our business and our ability to make payments to our stockholders, including, but not limited to, the following risks:
•Our properties may not perform as we expect;
•We may have to lease space at rates below our expectations;
•We may not be able to obtain financing on acceptable terms; and
•We may underestimate the cost of improvements required to maintain or improve space to meet standards established for the market position intended for that property.
The realization of any of the above risks could significantly and adversely affect our ability to meet our financial expectations, our financial condition, results of operations, and cash flows, our ability to make distributions to our stockholders, the market price of our common stock, and our ability to satisfy our debt service obligations.
We may not be able to attain the expected return on our investments in real estate joint ventures.
As of December 31, 2020, we had several consolidated and unconsolidated real estate joint ventures in which we shared ownership and decision-making power with one or more parties. Our joint venture partners must agree in order for the applicable joint venture to take specific major actions, including budget approvals, acquisitions, sales of assets, debt financing, execution of lease agreements, and vendor approvals. Under these joint venture arrangements, any disagreements between us and our partners may result in delayed decisions. Our inability to take unilateral actions that we believe are in our best interests may result in missed opportunities and an ineffective allocation of resources and could have an adverse effect on the financial performance of the joint venture and our operating results.
We may experience increased operating costs, which may reduce profitability to the extent that we are unable to pass those costs through to our tenants.
Our properties are subject to increases in operating expenses, including insurance, property taxes, utilities, administrative costs, and other costs associated with security, landscaping, and repairs and maintenance of our properties. As of December 31, 2020, approximately 94% of our leases (on an RSF basis) were triple net leases, which require tenants to pay substantially all real estate and other rent-related taxes, insurance, utilities, common area expenses, and other operating expenses (including increases thereto) in addition to base rent.
Our operating expenses may increase as a result of tax reassessments that our properties are subject to on a regular basis (annually, triennially, etc.), which normally result in increases in property taxes over time as property values increase. In California, however, pursuant to the existing state law commonly referred to as Proposition 13, properties are generally reassessed to market value at the time of change in ownership or completion of construction; thereafter, annual property reassessments are limited to 2% of previously assessed values. As a result, Proposition 13 generally results in significant below-market assessed values over time. From time to time, lawmakers and political coalitions initiate efforts to repeal or amend Proposition 13 to eliminate its application to commercial and industrial properties, including by introducing Proposition 15 on the ballot in California, which failed to pass adoption on November 3, 2020.
Our triple net leases allow us to pass through, among other costs, substantially all real estate and rent-related taxes to our tenants in the form of tenant recoveries. Consequently, as a result of our triple net leases, we do not expect potential increases on property taxes as a result of tax reassessments to significantly impact our operating results. We cannot be certain, however, that we will be able to continue to negotiate pass-through provisions related to taxes in tenant leases in the future, or that higher pass-through expenses will not lead to lower base rents in the long run as a result of tenants’ not being able to absorb higher overall occupancy costs. Thus, the repeal of or amendment to Proposition 13 could lead to a decrease in our income from rentals over time. If our operating expenses increase without a corresponding increase in revenues, our profitability could diminish. In addition, we cannot be certain that increased costs will not lead our current or prospective tenants to seek space outside of the state of California, which could significantly hinder our ability to increase our rents or to maintain existing occupancy levels. The repeal of or amendment to Proposition 13 in California may significantly increase occupancy costs for some of our tenants and may adversely impact their financial condition, ability to make rental payments, and ability to renew lease agreements, which in turn could adversely affect our financial condition, results of operations, and cash flows and our ability to make distributions to our stockholders.
In addition, we expect to incur higher costs as a result of doing business in California and other states. For example, compliance with various laws passed in California and civil unrest in Washington may result in cost increases due to new constraints on our business and the effects of potential non-compliance by us or third-party service providers. Any changes in connection with compliance could be time consuming and expensive, while failure to timely implement required changes could subject us to liability for non-compliance, any of which could adversely affect our business, operating results, and financial condition.
The cost of maintaining the quality of our properties may be higher than anticipated, which can result in reduced cash flows and profitability.
If our properties are not as attractive to current and prospective tenants in terms of rent, services, condition, or location as properties owned by our competitors, we could lose tenants or suffer lower rental rates. As a result, we may, from time to time, be required to make significant capital expenditures to maintain the competitiveness of our properties. However, there can be no assurances that any such expenditures would result in higher occupancy or higher rental rates or deter existing tenants from relocating to properties owned by our competitors.
Our inability to renew leases or re-lease space on favorable terms as leases expire may significantly affect our business.
Our revenues are derived primarily from rental payments and reimbursement of operating expenses under our leases. If our tenants experience a downturn in their business or other types of financial distress, they may be unable to make timely payments under their leases. In addition, because of the impact to business environment due to the civil unrest, high cost of living, taxes, and other increased region specific costs of doing business in certain of our markets and submarkets, such as those located in the states of California and Washington, tenants may choose not to renew or re-lease space. Also, if our tenants terminate early or decide not to renew their leases, we may not be able to re-lease the space. Even if tenants decide to renew or lease space, the terms of renewals or new leases, including the cost of any tenant improvements, concessions, and lease commissions, may be less favorable to us than current lease terms. Consequently, we could generate less cash flows from the affected properties than expected, which could negatively impact our business. We may have to divert cash flows generated by other properties to meet our debt service payments, if any, or to pay other expenses related to owning the affected properties.
The inability of a tenant to pay us rent could adversely affect our business.
Our revenues are derived primarily from rental payments and reimbursement of operating expenses under our leases. If our tenants, especially significant tenants, fail to make rental payments under their leases, our financial condition, cash flows, and ability to make distributions to our stockholders could be adversely affected. Additionally, the inability of the U.S. Congress to enact a budget for a fiscal year or the occurrence of partial or complete U.S. government shutdowns may result in financial difficulties for tenants that are dependent on federal funding, which could adversely affect the ability of those tenants to pay us rent.
The bankruptcy or insolvency of a major tenant may also adversely affect the income produced by a property. If any of our tenants becomes a debtor in a case under the U.S. Bankruptcy Code, as amended, we cannot evict that tenant solely because of its bankruptcy. The bankruptcy court may authorize the tenant to reject and terminate its lease with us. Our claim against such a tenant for uncollectible future rent would be subject to a statutory limitation that might be substantially less than the remaining rent actually owed to us under the tenant’s lease. Any shortfall in rent payments could adversely affect our cash flows and our ability to make distributions to our stockholders.
We could be held liable for damages resulting from our tenants’ use of hazardous materials.
Many of our tenants engage in research and development activities that involve controlled use of hazardous materials, chemicals, and biological and radioactive compounds. In the event of contamination or injury from the use of these hazardous materials, we could be held liable for damages that result. This liability could exceed our resources and any recovery available through any applicable insurance coverage, which could adversely affect our ability to make distributions to our stockholders.
Together with our tenants, we must comply with federal, state, and local laws and regulations governing the use, manufacture, storage, handling, and disposal of hazardous materials and waste products. Failure to comply with these laws and regulations, or changes thereto, could adversely affect our business or our tenants’ businesses and their ability to make rental payments to us.
Our properties may have defects that are unknown to us.
Although we thoroughly review the physical condition of our properties before they are acquired, and as they are developed or redeveloped, any of our properties may have characteristics or deficiencies unknown to us that could adversely affect the property’s value or revenue potential.
Our properties may contain or develop harmful mold or suffer from other air quality issues, which could lead to liability for adverse health effects and costs to remedy the problem.
When excessive moisture accumulates in buildings or on building materials, mold may grow, particularly if the moisture problem remains undiscovered or is not addressed over a period of time. Some molds may produce airborne toxins or irritants. Indoor air quality issues can also stem from inadequate ventilation, chemical contamination from indoor or outdoor sources, and other biological contaminants such as pollen, viruses, and bacteria. Indoor exposure to airborne toxins or irritants above certain levels may cause a variety of adverse health effects and symptoms, including allergic or other reactions. As a result, the presence of significant mold or other airborne contaminants at any of our properties could require us to undertake a costly remediation program to contain or remove the mold or other airborne contaminants from the affected property or increase indoor ventilation. In addition, the presence of significant mold or other airborne contaminants could expose us to liability from our tenants, employees of our tenants, and others if property damage or health concerns arise.
We may not be able to obtain additional capital to further our business objectives.
Our ability to acquire, develop, or redevelop properties depends upon our ability to obtain capital. The real estate industry has historically experienced periods of volatile debt and equity capital markets and/or periods of extreme illiquidity. A prolonged period in which we cannot effectively access the public debt or equity markets may result in heavier reliance on alternative financing sources to undertake new investments. An inability to obtain debt or equity capital on acceptable terms could delay or prevent us from acquiring, financing, and completing desirable investments and could otherwise adversely affect our business. Also, the issuance of additional shares of capital stock or interests in subsidiaries to fund future operations could dilute the ownership of our then-existing stockholders. Even as liquidity returns to the market, debt and equity capital may be more expensive than in prior years.
We may not be able to sell our properties quickly to raise capital.
Investments in real estate are relatively illiquid compared to other investments. Accordingly, we may not be able to sell our properties when we desire or at prices acceptable to us in response to changes in economic or other conditions. In addition, the Internal Revenue Code of 1986, as amended (the “Internal Revenue Code”), limits our ability to sell properties held for less than two years. These limitations on our ability to sell our properties may adversely affect our cash flows, our ability to repay debt, and our ability to make distributions to our stockholders.
Adverse changes in our credit ratings could negatively affect our financing ability.
Our credit ratings may affect the amount of capital we can access, as well as the terms and pricing of any debt we may incur. There can be no assurance that we will be able to maintain and/or improve our current credit ratings. In the event that our current credit ratings are downgraded or removed, we would most likely incur higher borrowing costs and experience greater difficulty in obtaining additional financing, which in turn would have a material adverse impact on our financial condition, results of operations, cash flows, and liquidity.
We may not be able to refinance our debt, and/or our debt may not be assumable.
Due to the high volume of real estate debt financing in recent years, the real estate industry may require more funds to refinance debt maturities than are available from lenders. This potential shortage of available funds from lenders and stricter credit underwriting guidelines may limit our ability to refinance our debt as it matures or may adversely affect our financial condition, results of operations, and cash flows, our ability to make distributions to our stockholders, and the market price of our common stock.
We may not be able to borrow additional amounts through the issuance of unsecured bonds or under our unsecured senior line of credit or commercial paper program.
There is no assurance that we will be able to continue to access the unsecured bond market on favorable terms. Our ability to borrow additional amounts through the issuance of unsecured bonds may be negatively impacted by periods of illiquidity in the bond market.
Aggregate borrowings under our unsecured senior line of credit require compliance with certain financial and non-financial covenants. Borrowings under our unsecured senior line of credit are funded by a group of banks. Our ability to borrow additional amounts under our unsecured senior line of credit and commercial paper program may be negatively impacted by a decrease in cash flows from our properties, a default or cross-default under our unsecured senior line of credit and commercial paper program, non-compliance with one or more loan covenants associated with our unsecured senior line of credit, and non-performance or failure of one or more lenders under our unsecured senior line of credit. In addition, we may not be able to refinance or repay outstanding borrowings on our unsecured senior line of credit or commercial paper program.
Our inability to borrow additional amounts on an unsecured basis could delay us in or prevent us from acquiring, financing, and completing desirable investments, which could adversely affect our business; and our inability to refinance or repay amounts under our unsecured senior line of credit or commercial paper program may adversely affect our cash flows, ability to make distributions to our stockholders, financial condition, and results of operations.
If interest rates rise, our debt service costs will increase and the value of our properties may decrease.
Our unsecured senior line of credit bears interest at variable rates, and we may incur additional variable-rate debt in the future. Amounts issued under our commercial paper program typically mature in less than 30 days and no later than 397 days from the date of issuance and require repayment or refinancing upon maturity. Increases in market interest rates would increase our interest expense under these debt instruments and would increase the costs of refinancing existing indebtedness or obtaining new debt. Additionally, increases in market interest rates may result in a decrease in the value of our real estate and a decrease in the market price of our common stock. Accordingly, these increases could adversely affect our financial condition and our ability to make distributions to our stockholders.
Our unsecured senior line of credit restricts our ability to engage in some business activities.
Our unsecured senior line of credit contains customary negative covenants and other financial and operating covenants that, among other things:
•Restrict our ability to incur additional indebtedness;
•Restrict our ability to make certain investments;
•Restrict our ability to merge with another company;
•Restrict our ability to make distributions to our stockholders;
•Require us to maintain financial coverage ratios; and
•Require us to maintain a pool of qualified unencumbered assets.
Complying with these restrictions may prevent us from engaging in certain profitable activities and constrain our ability to effectively allocate capital. Failure to comply with these restrictions may result in our defaulting on these and other loans, which would likely have a negative impact on our operations, financial condition, and ability to make distributions to our stockholders.
Our debt service obligations may have adverse consequences on our business operations.
We use debt to finance our operations, including the acquisition, development, and redevelopment of properties. Our use of debt may have adverse consequences, including, but not limited to, the following:
•Our cash flows from operations may not be sufficient to meet required payments of principal and interest;
•We may be forced to dispose of one or more of our properties, possibly on disadvantageous terms, to make payments on our debt;
•If we default on our debt obligations, the lenders or mortgagees may foreclose on our properties that secure those loans;
•A foreclosure on one of our properties could create taxable income without any accompanying cash proceeds to pay the tax;
•A default under a loan that has cross-default provisions may cause us to automatically default on another loan;
•We may not be able to refinance or extend our existing debt;
•The terms of any refinancing or extension may not be as favorable as the terms of our existing debt;
•We may be subject to a significant increase in the variable interest rates on our unsecured senior line of credit or commercial paper program, which could adversely impact our cash flows and operations; and
•The terms of our debt obligations may require a reduction in our distributions to stockholders.
If our revenues are less than our expenses, we may have to borrow additional funds, and we may not be able to make distributions to our stockholders.
If our properties do not generate revenues sufficient to cover our operating expenses, including our debt service obligations and capital expenditures, we may have to borrow additional amounts to cover fixed costs and cash flow needs. This could adversely affect our ability to make distributions to our stockholders. Factors that could adversely affect the revenues we generate from, and the values of, our properties include, but are not limited to, the following:
•National, local, and worldwide economic and political conditions;
•Competition from other properties;
•Changes in the life science, technology, and agtech industries;
•Real estate conditions in our target markets;
•Our ability to collect rent payments;
•The availability of financing;
•Changes to the financial and banking industries;
•Changes in interest rate levels;
•Vacancies at our properties and our ability to re-lease space;
•Changes in tax or other regulatory laws;
•The costs of compliance with government regulation;
•The lack of liquidity of real estate investments; and
•Increases in operating costs.
In addition, if a lease at a property is not a triple net lease, we will have greater exposure to increases in expenses associated with operating that property. Certain significant expenditures, such as mortgage payments, real estate taxes, insurance, and maintenance costs, are generally fixed and do not decrease when revenues at the related property decrease.
If we fail to effectively manage our debt obligations, we could become highly leveraged, and our debt service obligations could increase to unsustainable levels.
Our organizational documents do not limit the amount of debt that we may incur. Therefore, if we fail to prudently manage our capital structure, we could become highly leveraged. This would result in an increase in our debt service obligations that could adversely affect our cash flows and our ability to make distributions to our stockholders. Higher leverage could also increase the risk of default on our debt obligations or may result in downgrades to our credit ratings.
Failure to meet market expectations for our financial performance would likely adversely affect the market price and volatility of our stock.
Our expected financial results may not be achieved, and actual results may differ materially from our expectations. This may be a result of various factors, including, but not limited to, the following:
•The status of the economy;
•The status of capital markets, including availability and cost of capital;
•Changes in financing terms available to us;
•Negative developments in the operating results or financial condition of tenants, including, but not limited to, their ability to pay rent;
•Our ability to re-lease space at similar rates as leases expire;
•Our ability to reinvest sale proceeds in a timely manner at rates similar to the rate at which assets are sold;
•Regulatory approval and market acceptance of the products and technologies of tenants;
•Liability or contract claims by or against tenants;
•Unanticipated difficulties and/or expenditures relating to future acquisitions;
•Environmental laws affecting our properties;
•Changes in rules or practices governing our financial reporting; and
•Other legal and operational matters, including REIT qualification and key management personnel recruitment and retention.
Failure to meet market expectations, particularly with respect to earnings estimates, funds from operations per share, operating cash flows, and revenues, would likely result in a decline and/or increased volatility in the market price of our common stock or other outstanding securities.
The price per share of our stock may fluctuate significantly.
The market price per share of our common stock may fluctuate significantly in response to many factors, including, but not limited to, the following:
•The availability and cost of debt and/or equity capital;
•The condition of our balance sheet;
•Actual or anticipated capital requirements;
•The condition of the financial and banking industries;
•Actual or anticipated variations in our quarterly operating results or dividends;
•The amount and timing of debt maturities and other contractual obligations;
•Changes in our net income, funds from operations, or guidance;
•The publication of research reports and articles about us, our tenants, the real estate industry, or the life science, technology, and agtech industries;
•The general reputation of REITs and the attractiveness of their equity securities in comparison to other debt or equity securities (including securities issued by other real estate-based companies);
•General stock and bond market conditions, including changes in interest rates on fixed-income securities, that may lead prospective stockholders to demand a higher annual yield from future dividends;
•Fluctuations from general market volatility;
•Changes in our analyst ratings;
•Changes in our corporate credit ratings or credit ratings of our debt or other securities;
•Changes in market valuations of similar companies;
•Adverse market reaction to any additional debt we incur in the future;
•Additions, departures, or other announcements regarding our key management personnel;
•Actions by institutional stockholders;
•Speculation in the press or investment community;
•Terrorist activity adversely affecting the markets in which our securities trade, possibly increasing market volatility and causing the further erosion of business and consumer confidence and spending;
•Government regulatory action and changes in tax laws;
•Fiscal policies or inaction at the U.S. federal government level that may lead to federal government shutdowns or negative impacts on the U.S. economy;
•Global market factors adversely affecting the U.S. economic and political environment;
•The realization of any of the other risk factors included in this annual report on Form 10-K; and
•General market and economic conditions.
Many of the factors listed above are beyond our control. These factors may cause the market price of shares of our common stock to decline, regardless of our financial condition, results of operations, business, or prospects.
Possible future sales of shares of our common stock could adversely affect its market price.
We cannot predict the effect, if any, of future sales of shares of our common stock or the market price of our common stock. Sales of substantial amounts of capital stock (including the conversion or redemption of preferred stock), or the perception that such sales may occur, could adversely affect prevailing market prices for our common stock. Refer to “Other sources” in the “Sources of capital” subsection of the “Capital resources” section under “Item 7. Management’s discussion and analysis of financial condition and results of operations” in this annual report on Form 10-K.
We have reserved a number of shares of common stock for issuance to our directors, officers, and employees pursuant to our Amended and Restated 1997 Stock Award and Incentive Plan (sometimes referred to herein as our “equity incentive plan”). We have filed a registration statement with respect to the issuance of shares of our common stock pursuant to grants under our equity incentive plan. In addition, any shares issued under our equity incentive plan will be available for sale in the public market from time to time without restriction by persons who are not our “affiliates” (as defined in Rule 144 adopted under the Securities Act of 1933, as amended). Affiliates will be able to sell shares of our common stock subject to restrictions under Rule 144.
Our distributions to stockholders may decline at any time.
We may not continue our current level of distributions to our stockholders. Our Board of Directors will determine future distributions based on a number of factors, including, but not limited to, the following:
•The amount of net cash provided by operating activities available for distribution;
•Our financial condition and capital requirements;
•Any decision to reinvest funds rather than to distribute such funds;
•Our capital expenditures;
•The annual distribution requirements under the REIT provisions of the Internal Revenue Code;
•Restrictions under Maryland law; and
•Other factors our Board of Directors deems relevant.
A reduction in distributions to stockholders may negatively impact our stock price.
Distributions on our common stock may be made in the form of cash, stock, or a combination of both.
As a REIT, we are required to distribute at least 90% of our taxable income to our stockholders. Typically, we generate cash for distributions through our operations, the disposition of assets, including partial interest sales, or the incurrence of additional debt. Our Board of Directors may determine in the future to pay dividends on our common stock in cash, in shares of our common stock, or in a combination of cash and shares of our common stock. For example, we may declare dividends payable in cash or stock at the election of each stockholder, subject to a limit on the aggregate cash that could be paid. Any such dividends would be distributed in a manner intended to count in full toward the satisfaction of our annual distribution requirements and to qualify for the dividends paid deduction. While the IRS privately has ruled that such a dividend would so qualify if certain requirements are met, no assurances can be provided that the IRS would not assert a contrary position in the future. Moreover, a reduction in the cash yield on our common stock may negatively impact our stock price.
We have certain ownership interests outside the U.S. that may subject us to risks different from or greater than those associated with our domestic operations.
We have three operating properties in Canada and one operating property in China. Acquisition, development, redevelopment, ownership, and operating activities outside the U.S. involve risks that are different from those we face with respect to our domestic properties and operations. These risks include, but are not limited to:
•Adverse effects of changes in exchange rates for foreign currencies;
•Challenges and/or taxation with respect to the repatriation of foreign earnings or repatriation of proceeds from the sale of one or more of our foreign investments;
•Changes in foreign political, regulatory, and economic conditions, including nationally, regionally, and locally;
•Challenges in managing international operations;
•Challenges in hiring or retaining key management personnel;
•Challenges of complying with a wide variety of foreign laws and regulations, including those relating to real estate, corporate governance, operations, taxes, employment, and legal proceedings;
•Differences in lending practices;
•Differences in languages, cultures, and time zones;
•Changes in applicable laws and regulations in the U.S. that affect foreign operations;
•Challenges in managing foreign relations and trade disputes that adversely affect U.S. and foreign operations;
•Future partial or complete U.S. federal government shutdowns, trade disagreements with other countries, or uncertainties that could affect business transactions within the U.S. and with foreign entities;
•Changes in tax and local regulations with potentially adverse tax consequences and penalties; and
•Foreign ownership and transfer restrictions.
In addition, our foreign investments are subject to taxation in foreign jurisdictions based on local tax laws and regulations and on existing international tax treaties. We have invested in foreign markets under the assumption that our future earnings in each of those countries will be taxed at the current prevailing income tax rates. There are no guarantees that foreign governments will continue to honor existing tax treaties we have relied upon for our foreign investments or that the current income tax rates in those countries will not increase significantly, thus impacting our ability to repatriate our foreign investments and related earnings.
Investments in international markets may also subject us to risks associated with establishing effective controls and procedures to regulate the operations of new offices and to monitor compliance with U.S. laws and regulations, including the Foreign Corrupt Practices Act and similar foreign laws and regulations. The Foreign Corrupt Practices Act and similar applicable anti-corruption laws prohibit individuals and entities from offering, promising, authorizing, or providing payments or anything of value, directly or indirectly, to government officials in order to obtain, retain, or direct business. Failure to comply with these laws could subject us to civil and criminal penalties that could materially adversely affect our results of operations or the value of our international investments. In addition, if we fail to effectively manage our international operations, our overall financial condition, results of operations, and cash flows, and the market price of our common stock could be adversely affected.
Furthermore, we may in the future enter into agreements with non-U.S. entities that are governed by the laws of, and are subject to dispute resolution rules of, another country or region. In some cases, such a country or region might not have a forum that provides us an effective or efficient means for resolving disputes that may arise under these agreements.
We are subject to risks and liabilities in connection with properties owned through partnerships, limited liability companies, and joint ventures.
Our organizational documents do not limit the amount of funds that we may invest in non-wholly owned partnerships, limited liability companies, or joint ventures. Partnership, limited liability company, or joint venture investments involve certain risks, including, but not limited to, the following:
•Upon bankruptcy of non-wholly owned partnerships, limited liability companies, or joint venture entities, we may become liable for the liabilities of the partnership, limited liability company, or joint venture;
•We may share certain approval rights over major decisions with third parties;
•We may be required to contribute additional capital if our partners fail to fund their share of any required capital contributions;
•Our partners, co-members, or joint venture partners might have economic or other business interests or goals that are inconsistent with our business interests or goals and that could affect our ability to lease or re-lease the property, operate the property, or maintain our qualification as a REIT;
•Our ability to sell the interest on advantageous terms when we so desire may be limited or restricted under the terms of our agreements with our partners; and
•We may not continue to own or operate the interests or assets underlying such relationships or may need to purchase such interests or assets at an above-market price to continue ownership.
We generally seek to maintain control of our partnerships, limited liability companies, and joint venture investments in a manner sufficient to permit us to achieve our business objectives. However, we may not be able to do so, and the occurrence of one or more of the events described above could adversely affect our financial condition, results of operations, and cash flows, our ability to make distributions to our stockholders, and the market price of our common stock.
We could incur significant costs due to the financial condition of our insurance carriers.
We insure our properties with insurance companies we believe have good ratings at the time our policies are put into effect. The financial condition of one or more of the insurance companies we hold policies with may be negatively impacted, which can result in their inability to pay on future insurance claims. Their inability to pay future claims may have a negative impact on our financial results. In addition, the failure of one or more insurance companies may increase the cost of renewing our insurance policies or increase the cost of insuring additional properties and recently developed or redeveloped properties.
Our insurance may not adequately cover all potential losses.
If we experience a loss at any of our properties that is not covered by insurance, that exceeds our insurance policy limits, or that is subject to a policy deductible, we could lose the capital invested in the affected property and, possibly, future revenues from that property. In addition, we could continue to be obligated on any mortgage indebtedness or other obligations related to the affected properties. All properties carry comprehensive liability, fire, extended coverage, and rental loss insurance with respect to our properties, including properties partially owned through joint ventures that are managed by our joint venture partners.
We have obtained earthquake insurance for our properties that are located in the vicinity of active earthquake zones in an amount and with deductibles we believe are commercially reasonable. However, a significant portion of our real estate portfolio is located in seismically active regions, including San Francisco, San Diego, and Seattle, and a damaging earthquake in any of these regions could significantly impact multiple properties. As a result, the amount of our earthquake insurance coverage may be insufficient to cover our losses, and aggregate deductible amounts may be material, which could adversely affect our business, financial condition, results of operations, and cash flows. We also carry environmental insurance and title insurance policies for our properties. We generally obtain title insurance policies when we acquire a property, with each policy covering an amount equal to the initial purchase
price of each property. Accordingly, any of our title insurance policies may be in an amount less than the current value of the related property.
Our tenants are also required to maintain comprehensive insurance, including liability and casualty insurance that is customarily obtained for similar properties. There are, however, certain types of losses that we and our tenants do not generally insure against because they are uninsurable or because it is not economical to insure against them. The availability of coverage against certain types of losses, such as from terrorism or toxic mold, has become more limited and, when available, carries a significantly higher cost. We cannot predict whether insurance coverage against terrorism or toxic mold will remain available for our properties because insurance companies may no longer offer coverage against such losses, or such coverage, if offered, may become prohibitively expensive. We have not had material losses from terrorism or toxic mold at any of our properties.
The loss of services of any of our senior officers could adversely affect us.
We depend upon the services and contributions of relatively few senior officers. The loss of services or contributions of any one of them may adversely affect our business, financial condition, and prospects. We use the extensive personal and business relationships that members of our management have developed over time with owners of office/laboratory and tech office properties and with major tenants and venture investment portfolio companies in the life science, technology, and agtech industries. We cannot assure our stockholders that our senior officers will remain employed with us. In California and certain other regions where we have operations, there is intense competition for individuals with skill sets needed for our business. Moreover, we expect that the high cost of living in California, where our headquarters and many of our properties are located, as a result of high state and local taxes and increased home prices, may impair our ability to attract and retain employees in the future. Due to the long-term nature of our investments and properties, we are unable to predict and may be unable to effectively control such costs. If we do not succeed in attracting new personnel and retaining and motivating existing personnel, our business may suffer, and we may be unable to implement our current initiatives or grow effectively.
Failure to maintain effective internal control over financial reporting could have a material adverse effect on our business, results of operations, financial condition, and stock price.
Pursuant to the Sarbanes-Oxley Act of 2002, we are required to provide a report by management on internal control over financial reporting, including management’s assessment of the effectiveness of internal control. Changes to our business will necessitate ongoing changes to our internal control systems and processes. Internal control over financial reporting may not prevent or detect misstatement because of its inherent limitations, including the possibility of human error, the circumvention or overriding of controls, or fraud. Therefore, even effective internal controls can provide only reasonable assurance with respect to the preparation and fair presentation of financial statements. If we fail to maintain the adequacy of our internal controls, including any failure to implement required new or improved controls, or if we experience difficulties in their implementation, our business, results of operations, and financial condition could be materially harmed, we could fail to meet our reporting obligations, and there could be a material adverse effect on the market price of our common stock.
If we failed to qualify as a REIT, we would be taxed at corporate rates and would not be able to take certain deductions when computing our taxable income.
We have elected to be taxed as a REIT under the Internal Revenue Code. If, in any taxable year, we failed to qualify as a REIT:
•We would be subject to federal and state income taxes on our taxable income at regular corporate rates;
•We would not be allowed a deduction for distributions to our stockholders in computing taxable income;
•We would be disqualified from treatment as a REIT for the four taxable years following the year during which we lost qualification, unless we were entitled to relief under the Internal Revenue Code; and
•We would no longer be required by the Internal Revenue Code to make distributions to our stockholders.
As a result of any additional tax liability, we may need to borrow funds or liquidate certain investments in order to pay the applicable tax. Accordingly, funds available for investment or distribution to our stockholders would be reduced for each of the years involved.
Qualification as a REIT involves the application of highly technical and complex provisions of the Internal Revenue Code to our operations and financial results, as well as the determination of various factual matters and circumstances not entirely within our control. There are only limited judicial or administrative interpretations of these provisions. Although we believe that we our current organization and method of operation comply with the rules and regulations promulgated under the Internal Revenue Code to enable us to qualify as a REIT, we cannot assure our stockholders that we are or will remain so qualified.
From time to time, we dispose of properties in transactions qualified under Section 1031 of the Internal Revenue Code (“Section 1031 Exchanges”). If a transaction intended to qualify as a Section 1031 Exchange is later determined by the IRS to be taxable or if we are unable to identify and complete the acquisition of a suitable replacement property to effect a Section 1031 Exchange or if the laws surrounding Section 1031 Exchanges are amended or repealed, we may not be able to dispose of properties on
a tax-deferred basis. In such a case, our earnings and profits and our taxable income would increase, which could increase the dividend income and reduce the return of capital to our stockholders. As a result, we may be required to pay additional dividends to stockholders, or if we do not pay additional dividends, our corporate income tax liability could increase and we may be subject to interest and penalties.
We may not be able to participate in certain sales that the IRS characterizes as “prohibited transactions.” The tax imposed on REITs engaging in prohibited transactions is a 100% tax on net income from the transaction. Whether or not the transaction is characterized as a prohibited transaction is a factual matter. Generally, prohibited transactions are sales or other dispositions of property, other than foreclosures, characterized as held primarily for sale to customers in the ordinary course of business. However, a sale will not be considered a prohibited transaction if it meets certain safe harbor requirements. Although we do not intend to participate in prohibited transactions, there is no guarantee that the IRS would agree with our characterization of our properties or that we will meet the safe harbor requirements.
Federal income tax rules are constantly under review by the U.S. Congress and the IRS. Changes to tax laws could adversely affect our investors or our tenants, and we cannot predict how those changes may affect us in the future. New legislation, U.S. Treasury Department regulations, administrative interpretations, or court decisions could significantly and negatively affect our ability to qualify as a REIT, the federal income tax consequences of such qualification, or an investment in our stock. Also, laws relating to the tax treatment of investment in other types of business entities could change, making an investment in such other entities more attractive relative to an investment in a REIT.
We are dependent on third parties to manage the amenities at our properties.
We retain third-party managers to manage certain amenities at our properties, such as restaurants, conference centers, exercise facilities, and parking garages. Our income from our properties may be adversely affected if these parties fail to provide quality services and amenities with respect to our properties. While we monitor the performance of these third parties, we may have limited recourse if we believe they are not performing adequately. In addition, these third-party managers may operate, and in some cases may own or invest in, properties that compete with our properties, which may result in conflicts of interest. As a result, these third-party managers may have made, and may in the future make, decisions that are not in our best interests.
We rely on a limited number of vendors to provide utilities and certain other services at our properties, and disruption in these services may have a significant adverse effect on our business operations, financial condition, and cash flows.
We rely on a limited number of vendors to provide key services, including, but not limited to, utilities and construction services, at certain of our properties. Our business and property operations may be adversely affected if key vendors fail to adequately provide key services at our properties as a result of natural disasters (such as fires, floods, earthquakes, etc.), power interruptions, bankruptcies, war, acts of terrorism, public health emergencies, cyber attacks, pandemics, or other unanticipated catastrophic events. If a vendor encounters financial difficulty such as bankruptcy or other events beyond our control that cause it to fail to adequately provide utilities, construction, or other important services, we may experience significant interruptions in service and disruptions to business operations at our properties, incur remediation costs, and become subject to claims and damage to our reputation.
In addition, difficulties encountered by key vendors in providing necessary services at our properties could result in significant market rate increases for such services. Our triple net leases allow us to pass through substantially all operating expenses and certain capital expenditures to our tenants in the form of additional rent. However, we cannot be certain that we will be able to continue to negotiate pass-through provisions in tenant leases in the future, which could lead to a decrease in our recovery of operating expenses. If our operating expenses increase without a corresponding increase in revenues, our profitability could diminish. Also, we cannot be certain that increased costs will not lead our current or prospective tenants to seek space elsewhere, which could significantly hinder our ability to increase our rents or to maintain existing occupancy levels. Additionally, this may significantly increase occupancy costs for some of our tenants and may adversely impact their financial condition, ability to make rental payments, and ability to renew their lease agreements.
Pacific Gas and Electric Company (“PG&E”) is the primary public utility company providing electrical and gas service to residential and commercial customers in northern California, including the San Francisco Bay Area. Most of our properties located in our San Francisco market depend on PG&E for the delivery of these essential services. PG&E initiated voluntary reorganization proceedings under Chapter 11 of the U.S. Bankruptcy Code in January 2019 in response to potential liabilities arising from a series of catastrophic wildfires that occurred in Northern California in 2017 and 2018. While PG&E emerged from bankruptcy in July 2020, there is no guarantee that PG&E will be able to sustain safe operations and continue to provide consistent utilities services. During periods of high winds and high fire danger in recent fire seasons, PG&E preemptively shut off power to areas of Central and Northern California. The shutoffs were designed to help guard against fires ignited in areas with high winds and dry conditions. PG&E has warned that it may have to employ shutoffs while the utility company addresses maintenance issues. Future shutoffs of power may impact the reliability of access to a stable power supply at our properties and, in turn, adversely impact our tenants’ businesses. In addition, there is no guarantee that PG&E’s safety measures mandated by regulators will be timely and sufficient to prevent future catastrophic wildfires.
The realization of any of the above risks could significantly and adversely affect our ability to meet our financial expectations, our financial condition, results of operations, and cash flows, our ability to make distributions to our stockholders, the market price of our common stock, and our ability to satisfy our debt service obligations.
We may change our business policies without stockholder approval.
Our Board of Directors determines all of our material business policies, with management’s input, including those related to our:
•Status as a REIT;
•Incurrence of debt and debt management activities;
•Selective acquisition, disposition, development, and redevelopment activities;
•Stockholder distributions; and
•Other policies, as appropriate.
Our Board of Directors may amend or revise these policies at any time without a vote of our stockholders. A change in these policies could adversely affect our business and our ability to make distributions to our stockholders.
There are limits on the ownership of our capital stock under which a stockholder may lose beneficial ownership of its shares and that may delay or prevent transactions that might otherwise be desired by our stockholders.
In order for a company to qualify as a REIT under the Internal Revenue Code, not more than 50% of the value of its outstanding stock may be owned, directly or constructively, by five or fewer individuals or entities (as set forth in the Internal Revenue Code) during the last half of a taxable year. Furthermore, shares of our company’s outstanding stock must be beneficially owned by 100 or more persons during at least 335 days of a taxable year of 12 months or during a proportionate part of a shorter taxable year.
In order for us to maintain our qualification as a REIT, among other things, our charter provides for an ownership limit, which prohibits, with certain exceptions, direct or constructive ownership of shares of stock representing more than 9.8% of the combined total value of our outstanding shares of stock by any person, as defined in our charter. Our Board of Directors, in its sole discretion, may waive the ownership limit for any person. However, our Board of Directors may not grant such waiver if, after giving effect to such waiver, we would be “closely held” under Section 856(h) of the Internal Revenue Code. As a condition to waiving the ownership limit, our Board of Directors may require a ruling from the IRS or an opinion of counsel in order to determine our status as a REIT. Notwithstanding the receipt of any such ruling or opinion, our Board of Directors may impose such conditions or restrictions as it deems appropriate in connection with granting a waiver.
Our charter further prohibits transferring shares of our stock if such transfer would result in our being “closely held” under Section 856(h) of the Internal Revenue Code or would result in shares of our stock being owned by fewer than 100 persons.
The constructive ownership rules are complex and may cause shares of our common stock owned directly or constructively by a group of related individuals or entities to be constructively owned by one individual or entity. A transfer of shares to a person who, as a result of the transfer, violates these limits shall be void or these shares shall be exchanged for shares of excess stock and transferred to a trust for the benefit of one or more qualified charitable organizations designated by us. In that case, the intended transferee will have only a right to share, to the extent of the transferee’s original purchase price for such shares, in proceeds from the trust’s sale of those shares and will effectively forfeit its beneficial ownership of the shares. These ownership limits could delay, defer, or prevent a transaction or a change in control that might involve a premium price for the holders of our common stock or that might otherwise be desired by such holders.
In addition to the ownership limit, certain provisions of our charter and bylaws may delay or prevent transactions that may be deemed to be desirable to our stockholders.
As authorized by Maryland law, our charter allows our Board of Directors to cause us to issue additional authorized but unissued shares of our common stock or preferred stock and to classify or reclassify unissued shares of common or preferred stock without any stockholder approval. Our Board of Directors could establish a series of preferred stock that could delay, defer, or prevent a transaction that might involve a premium price for our common stock or that might, for other reasons, be desired by our common stockholders, or a series of preferred stock that has a dividend preference that may adversely affect our ability to pay dividends on our common stock.
Our charter permits the removal of a director only upon a two-thirds majority of the votes entitled to be cast generally in the election of directors, and our bylaws require advance notice of a stockholder’s intention to nominate directors or to present business for consideration by stockholders at an annual meeting of our stockholders. Our charter and bylaws also contain other provisions that may delay, defer, or prevent a transaction or change in control that involves a premium price for our common stock or that, for other reasons, may be desired by our stockholders.
Market and industry factors
We face substantial competition in our target markets.
The significant competition for business in our target markets could have an adverse effect on our operations. We compete for investment opportunities with:
•Other REITs;
•Insurance companies;
•Pension and investment funds;
•Private equity entities;
•Partnerships;
•Developers;
•Investment companies;
•Owners/occupants; and
•Foreign investors, including sovereign wealth funds.
Many of these entities have substantially greater financial resources than we do and may be able to pay more than we can or accept more risk than we are willing to accept. These entities may be less sensitive to risks with respect to the creditworthiness of a tenant or the geographic concentration of their investments. Competition may also reduce the number of suitable investment opportunities available to us or may increase the bargaining power of property owners seeking to sell. If there is no matching growth in demand, the intensified competition may lead to oversupply of available space comparable to ours and result in the pressure on rental rates and greater incentives awarded to tenants. To maintain our ability to retain current and attract new tenants, we may be forced to reduce the rental rates that our tenants are currently willing to pay or offer greater tenant concessions. Should we encounter intensified competition or oversupply, we cannot be certain that we will be able to compete successfully, maintain our occupancy and rental rates, and continue to expand our business. As a result, our financial condition, results of operations, and cash flows, our ability to pay dividends, and our stock price may be adversely affected.
Poor economic conditions in our markets could adversely affect our business.
Our properties are primarily located in the following markets:
•Greater Boston;
•San Francisco;
•New York City;
•San Diego;
•Seattle;
•Maryland; and
•Research Triangle.
As a result of our geographic concentration, we depend upon the local economic and real estate conditions in these markets. We are therefore subject to increased exposure (positive or negative) to economic, tax, and other competitive factors specific to markets in confined geographic areas. Our operations may also be affected if too many competing properties are built in any of these markets. An economic downturn in any of these markets could adversely affect our operations and our ability to make distributions to our stockholders. We cannot assure our stockholders that these markets will continue to grow or remain favorable to the life science, technology, and agtech industries.
Improvements to our properties are significantly more costly than improvements to traditional office space.
Many of our properties generally contain infrastructure improvements that are significantly more costly than improvements to other property types. Although we have historically been able to recover the additional investment in infrastructure improvements through higher rental rates, there is the risk that we will not be able to continue to do so in the future. Typical improvements include:
•Reinforced concrete floors;
•Upgraded roof loading capacity;
•Increased floor-to-ceiling heights;
•Heavy-duty HVAC systems;
•Enhanced environmental control technology;
•Significantly upgraded electrical, gas, and plumbing infrastructure; and
•Laboratory benches.
We are dependent on the life science, technology, and agtech industries, and changes within these industries may adversely impact our revenues from lease payments, the value of our non-real estate investments, and our results of operations.
In general, our business strategy is to invest primarily in properties used by tenants in the life science, technology, and agtech industries. Through our venture investment portfolio, we also hold investments in companies that, similar to our tenant base, are concentrated in the life science, technology, and agtech industries. Our business could be adversely affected if the life science, technology, and agtech industries are impacted by an economic, financial, or banking crisis, or if the life science, technology, and agtech industries migrate from the U.S. to other countries. Because of our industry focus, events within these industries may have a more pronounced effect on our results of operations and ability to make distributions to our stockholders than if we had more diversified investments. Also, some of our properties may be better suited for a particular life science, technology, or agtech industry tenant and could require significant modification before we are able to re-lease space to another tenant. Generally, our properties may not be suitable for lease to traditional office tenants without significant expenditures on renovations.
Our ability to negotiate contractual rent escalations on future leases and to achieve increases in rental rates will depend upon market conditions and the demand for office/laboratory and tech office space at the time the leases are negotiated and the increases are proposed.
It is common for businesses in the life science, technology, and agtech industries to undergo mergers or consolidations. Mergers or consolidations of life science, technology, and agtech entities in the future could reduce the RSF requirements of our tenants and prospective tenants, which may adversely impact the demand for office/laboratory and tech office space and our future revenue from lease payments and our results of operations.
Some of our current or future tenants may include high-tech companies in their startup or growth phases of their life cycle. Fluctuations in market confidence vested in these companies or adverse changes in economic conditions may have a disproportionate effect on operations of such companies. Deterioration in the financial conditions of our tenants may result in our inability to collect rental payments from them and therefore may negatively impact our results of operations.
Our results of operations depend on our tenants’ research and development efforts and their ability to obtain funding for these efforts.
Our tenant base includes entities in the pharmaceutical, biotechnology, medical device, life science, technology, agtech, and related industries; academic institutions; government institutions; and private foundations. Our tenants base their research and development budgets on several factors, including the need to develop new products, the availability of government and other funding, competition, and the general availability of resources. Our investments through our venture investment portfolio are also in companies that, similar to our tenant base, are concentrated in the life science, technology, and agtech industries.
Research and development budgets fluctuate due to changes in available resources, research priorities, general economic conditions, institutional and government budgetary limitations, and mergers and consolidations of entities. Our business could be adversely impacted by a significant decrease in research and development expenditures by our tenants, our venture investment portfolio companies, or the life science, technology, and agtech industries.
Our tenants also include research institutions whose funding is largely dependent on grants from government agencies, such as the NIH, the National Science Foundation, and similar agencies or organizations. U.S. government funding of research and development is subject to the political process, which is often unpredictable. Other programs, such as Homeland Security or defense, could be viewed by the government as higher priorities. Additionally, proposals to reduce or eliminate budgetary deficits have sometimes included reduced allocations to the NIH and other U.S. government agencies that fund research and development activities. Additionally, the inability of the U.S. Congress to enact a budget for a fiscal year or the occurrence of partial or complete U.S. federal government shutdowns may result in temporary closures of agencies such as the FDA or NIH, which could adversely affect business operations of our tenants who are dependent on government approvals and appropriations. Any shift away from funding of research and development or delays surrounding the approval of government budget proposals may adversely impact our tenants’ operations, which in turn may impact their demand for office/laboratory and tech office space and their ability to make lease payments to us and thus adversely impact our results of operations.
Our life science industry tenants and venture investment portfolio companies are subject to a number of risks unique to their industry, including (i) changes in technology, patent expiration, and intellectual property protection, (ii) high levels of regulation, (iii) failures in the safety and efficacy of their products, and (iv) significant funding requirements for product research and development. These risks may adversely affect our tenants’ ability to make rental payments or satisfy their other lease obligations to us or may impact our venture investment portfolio companies’ value and consequently may materially adversely affect our business, results of operations, financial condition, and stock price.
Changes in technology, patent expiration, and intellectual property rights and protection
•Our tenants and venture investment portfolio companies develop and sell products and services in an industry that is characterized by rapid and significant technological changes, frequent new product and service introductions and enhancements, evolving industry standards, and uncertainty over the implementation of new healthcare reform legislation, which may cause them to lose competitive positions and adversely affect their operations.
•Many of our tenants and venture investment portfolio companies, and their licensors, require patent, copyright, or trade secret protection and/or rights to use third-party intellectual property to develop, make, market, and sell their products and technologies. A tenant or venture investment portfolio company may be unable to commercialize its products or technologies if patents covering such products or technologies are not issued or are successfully challenged, narrowed, invalidated, or circumvented by third parties. Additionally, a third party may own intellectual property that limits a tenant’s or venture investment portfolio company’s ability to bring to market its product or technology without securing a license or other rights to use the third-party intellectual property, which may require the tenant to pay an upfront fee or royalty. Failure to obtain these rights from third parties may make it challenging or impossible for a tenant or venture investment portfolio company to develop and commercialize its products or technologies, which could adversely affect its competitive position and operations.
•Many of our tenants and venture investment portfolio companies depend upon patents to provide exclusive marketing rights for their products. As their product patents expire, competitors of these tenants or venture investment portfolio companies may be able to legally produce and market products similar to those products of our tenants or venture investment portfolio companies, which could have a material adverse effect on their sales and results of operations.
High levels of regulation
•Some of our life science industry tenants and venture investment portfolio companies develop and manufacture drugs that require regulatory approval, including approval from the FDA, prior to being made, marketed, sold, and used. The regulatory approval process to manufacture and market drugs is costly, typically takes many years, requires validation through clinical trials and the use of substantial resources, and is often unpredictable. A tenant or venture investment portfolio company may fail to obtain or may experience significant delays in obtaining these approvals. Even if the tenant or venture investment portfolio company obtains regulatory approvals, marketed products will be subject to ongoing regulatory review and potential loss of approvals.
•The ability of some of our life science industry tenants and venture investment portfolio companies to commercialize any future products successfully will depend in part on the coverage and reimbursement levels set by government authorities, private health insurers, and other third-party payers. Additionally, reimbursements may decrease in the future.
Failures in the safety and efficacy of their products
•Some of our life science industry tenants and venture investment portfolio companies developing potential products may find that their products are not effective, or are even harmful, when tested in humans.
•Some of our life science industry tenants and venture investment portfolio companies depend upon the commercial success of certain products. Even if a product made by a life science industry tenant or venture investment portfolio company is successfully developed and proven safe and effective in human clinical trials, and the requisite regulatory approvals are obtained, subsequent discovery of safety issues with these products could cause product liability events, additional regulatory scrutiny and requirements for additional labeling, loss of approval, withdrawal of products from the market, and the imposition of fines or criminal penalties.
•A drug made by a life science industry tenant or venture investment portfolio company may not be well accepted by doctors and patients, or may be less effective or accepted than a competitor’s drug, even if it is successfully developed.
•The negative results of safety signals arising from the clinical trials of the competitors of our life science industry tenants or venture investment portfolio companies may prompt regulatory agencies to take actions that may adversely affect the clinical trials or products of our tenants or venture investment portfolio companies.
Significant funding requirements for product research and development
•Some of our life science industry tenants and venture investment portfolio companies require significant funding to develop and commercialize their products and technologies, which funding must be obtained from venture capital firms; private investors; public markets; other companies in the life science industry; or federal, state, and local governments. Such funding may become unavailable or difficult to obtain. The ability of each tenant or venture investment portfolio company to raise capital will depend on its financial and operating condition, viability of its products and technology, and the overall condition of the financial, banking, and economic environment, as well as government budget policies.
•Even with sufficient funding, some of our life science industry tenants or venture investment portfolio companies may not be able to discover or identify potential drug targets in humans, or potential drugs for use in humans, or to create tools or technologies that are commercially useful in the discovery or identification of potential drug targets or drugs.
•Some of our life science industry tenants or venture investment portfolio companies may not be able to successfully manufacture their drugs economically, even if such drugs are proven through human clinical trials to be safe and effective in humans.
•Marketed products also face commercialization risk, and some of our life science industry tenants and venture investment portfolio companies may never realize projected levels of product utilization or revenues.
•Negative news regarding the products, the clinical trials, or other business developments of our life science industry tenants or venture investment portfolio companies may cause their stock price or credit profile to deteriorate.
We cannot assure our stockholders that our life science industry tenants or venture investment portfolio companies will be able to develop, make, market, or sell their products and technologies due to the risks inherent in the life science industry. Any life science industry tenant or venture investment portfolio company that is unable to avoid, or sufficiently mitigate, the risks described above may have difficulty making rental payments or satisfying its other lease obligations to us or may have difficulty maintaining the value of our investment. Such risks may also decrease the credit quality of our life science industry tenants and venture investment portfolio companies or cause us to expend more funds and resources on the space leased by these tenants than we originally anticipated. The increased burden on our resources due to adverse developments relating to our life science industry tenants may cause us to achieve lower-than-expected yields on the space leased by these tenants. Negative news relating to our more significant life science industry tenants and venture investment portfolio companies may also adversely impact our stock price.
Our technology industry tenants and venture investment portfolio companies are subject to a number of risks unique to their industry, including (i) an uncertain regulatory environment, (ii) rapid technological changes, (iii) a dependency on the maintenance and security of the Internet infrastructure, (iv) significant funding requirements for product research and development and sales growth, and (v) inadequate intellectual property protections. These risks may adversely affect our tenants’ ability to make rental payments to us or satisfy their other lease obligations or may impact our venture investment portfolio companies’ value, which consequently may materially adversely affect our business, results of operations, financial condition, and stock price.
Uncertain regulatory environment
•Laws and regulations governing the Internet, e-commerce, electronic devices, and other services are evolving. Existing and future laws and regulations and the halting of operations at certain agencies resulting from partial or complete U.S. federal government shutdowns may impede the growth of our technology industry tenants and venture investment portfolio companies. These laws and regulations may cover, among other areas, taxation, worker classification, privacy, data protection, pricing, content, copyrights, distribution, mobile communications, business licensing, and consumer protection.
Rapid technological changes
•The technology industry is characterized by rapid changes in customer requirements and preferences, frequent new product and service introductions, and the emergence of new industry standards and practices. A failure to respond in a timely manner to these market conditions could materially impair the operations of our technology industry tenants and venture investment portfolio companies.
Dependency on the maintenance and security of the Internet infrastructure
•Some of our technology industry tenants and venture investment portfolio companies depend on continued and unimpeded access to the Internet by users of their products and services, as well as access to mobile networks. Internet service providers and mobile network operators may be able to block, degrade, or charge additional fees to these tenants, venture investment portfolio companies, or users of their products and services.
•The Internet has experienced, and is likely to continue to experience, outages and other delays. These outages and delays, as well as problems caused by cyber attacks and computer malware, viruses, worms, and similar programs, may materially affect the ability of our technology industry tenants and venture investment portfolio companies to conduct business.
•Security breaches or network attacks may delay or interrupt the services provided by our technology industry tenants and venture investment portfolio companies and could harm their reputations or subject them to significant liability.
Significant funding requirements for product research and development
•Some of our technology industry tenants and venture investment portfolio companies require significant funding to develop and commercialize their products and technologies, which funding must be obtained from venture capital firms; private investors; public markets; companies in the technology industry; or federal, state, and local governments. Such funding may become unavailable or difficult to obtain. The ability of each tenant or venture investment portfolio company to raise capital will depend on its financial and operating condition, viability of their products, and the overall condition of the financial, banking, governmental budget policies, and economic environment.
•Even with sufficient funding, some of our technology industry tenants and venture investment portfolio companies may not be able to discover or identify potential customers or may not be able to create tools or technologies that are commercially useful.
•Some of our technology industry tenants and venture investment portfolio companies may not be able to successfully manufacture their products economically.
•Marketed products also face commercialization risk, and some of our technology industry tenants and venture investment portfolio companies may never realize projected levels of product utilization or revenues.
•Unfavorable news regarding the products or other business developments of our technology industry tenants or venture investment portfolio companies may cause their stock price or credit profile to deteriorate.
Inadequate intellectual property protections
•The products and services provided by some of our technology industry tenants and venture investment portfolio companies are subject to the threat of piracy and unauthorized copying, and inadequate intellectual property laws and other inadequate protections could prevent them from enforcing or defending their proprietary technologies. These tenants and venture investment portfolio companies may also face legal risks arising out of user-generated content.
•Trademark, copyright, patent, domain name, trade dress, and trade secret protection is very expensive to maintain and may require our technology industry tenants and venture investment portfolio companies to incur significant costs to protect their intellectual property rights.
We cannot assure our stockholders that our technology industry tenants and venture investment portfolio companies will be able to develop, make, market, or sell their products and services due to the risks inherent in the technology industry. Any technology industry tenant or venture investment portfolio company that is unable to avoid, or sufficiently mitigate, the risks described above may have difficulty making rental payments or satisfying its other lease obligations to us or may have difficulty maintaining the value of our investment. Such risks may also decrease the credit quality of our technology industry tenants or venture investment portfolio companies or cause us to expend more funds and resources on the space leased by these tenants than we originally anticipated. The increased burden on our resources due to adverse developments relating to our technology industry tenants may cause us to achieve lower-than-expected yields on the space leased by these tenants. Unfavorable news relating to our more significant technology industry tenants and venture investment portfolio companies may also adversely impact our stock price.
Our agtech industry tenants and venture investment portfolio companies are subject to a number of risks unique to their industry, including (i) uncertain regulatory environment, (ii) seasonality in business, (iii) unavailability of transportation mechanisms for carrying products and raw materials, (iv) changes in costs or constraints on supplies or energy used in operations, (v) strikes or labor slowdowns or labor contract negotiations, and (vi) rapid technological changes in agriculture. These risks may adversely affect our tenants’ ability to make rental payments or satisfy their other lease obligations to us or may impact our venture investment portfolio companies’ value, which consequently may materially adversely affect our business, results of operations, financial condition, and stock price.
Uncertain regulatory environment
•Laws and regulations governing the Internet, e-commerce, electronic devices, and other services and products developed by the agtech industry are evolving. Existing and future laws and regulations and the halting of operations at certain agencies resulting from partial or complete U.S. federal government shutdowns may impede the growth of our agtech industry tenants and venture investment portfolio companies. These laws and regulations may cover, among other areas, taxation, privacy, data protection, pricing, content, copyrights, distribution, mobile communications, business licensing, and consumer protection.
Seasonality in business
•Our agtech industry tenants’ and venture investment portfolio companies’ businesses may fluctuate from time to time due to seasonal weather conditions and other factors out of their control, affecting products and services our agtech industry tenants and venture investment portfolio companies offer.
Unavailability of transportation mechanisms for carrying products and raw materials
•Some of our agtech industry tenants’ and venture investment portfolio companies’ businesses depend on transportation services to deliver their products or to deliver raw materials to their clients. If transportation service providers are unavailable or fail to deliver our agtech industry tenants’ or venture investment portfolio companies’ products in a timely manner, they may be unable to manufacture and deliver their services and products on a timely basis.
Changes in costs or constraints on supplies or energy used in operations
•Similarly, if fuel or other energy prices increase, it may increase transportation costs, which could affect our agtech industry tenants’ and venture investment portfolio companies’ businesses.
Strikes or labor slowdowns or labor contract negotiations
•Our agtech industry tenants and venture investment portfolio companies may face labor strikes, work slowdowns, labor contract negotiations, or other job actions from their employees or third-party contractors. In the event of a strike, work slowdown, or other similar labor unrest, our agtech industry tenants or venture investment portfolio companies may not have the ability to adequately staff their businesses, which could have an adverse effect on their operations and revenue.
Rapid technological changes in agriculture
•The agtech industry is characterized by regular new product and service introductions, and the emergence of new industry standards and practices. A failure to respond in a timely manner to these market conditions could materially impair the operations of our agtech industry tenants and venture investment portfolio companies.
•Technological advances in agriculture could decrease the demand for crop nutrients, energy, and other crop input products and services our agtech industry tenants and venture investment portfolio companies provide. Genetically engineered crops that resist disease and insects could affect the demand for certain of our tenants’ or venture investment portfolio companies’ products. Demand for fuel could decline as technology allows for more efficient usage of equipment.
We cannot assure our stockholders that our agtech industry tenants and venture investment portfolio companies will be able to develop, make, market, or sell their products and services due to the risks inherent in the agtech industry. Any agtech industry tenant or venture investment portfolio company that is unable to avoid, or sufficiently mitigate, the risks described above may have difficulty making rental payments or satisfying its other lease obligations to us. Such risks may also decrease the credit quality of our agtech industry tenants or venture investment portfolio companies or cause us to expend more funds and resources on the space leased by these tenants than we originally anticipated. The increased burden on our resources due to adverse developments relating to our agtech industry tenants may cause us to achieve lower-than-expected yields on the space leased by these tenants. Unfavorable news relating to our more significant agtech industry tenants and venture investment portfolio companies may also adversely impact our stock price.
The companies in which we invest through our non-real estate venture investment portfolio expose us to risks similar to those of our tenant base and additional risks inherent in venture capital investing, which could materially affect our reported asset and liability values and earnings, and may materially and adversely affect our reported results of operations.
Through our strategic venture investment portfolio, we hold investments in companies that, similar to our tenant base, are concentrated in the life science, technology, and agtech industries. The venture investment portfolio companies in which we invest are accordingly subject to risks similar to those posed by our tenant base, including those disclosed in this annual report on Form 10-K. In addition, the companies in which we invest through our venture investment portfolio are subject to the risks inherent in venture capital investing and may be adversely affected by external factors beyond our control and other risks, including, but not limited to the following:
•Risks inherent in venture capital investing, which typically focuses on relatively new and small companies with unproven technologies and limited access to capital and is therefore generally considered more speculative than investment in larger, more established companies;
•Market disruption and volatility, which may adversely affect the value of the companies in which we hold equity investments and, in turn, our ability to realize gains upon sales of these investments.
•Disruptions, uncertainty, or volatility in the capital markets and global economy, which may impact the ability of the companies in which we invest to raise additional capital or access capital from venture capital investors or financial institutions on favorable terms;
•Liquidity of the companies in which we invest, which may (i) impede our ability to realize the value at which these investments are carried if we are required to dispose of them, (ii) make it difficult for us to sell these investments on a timely basis, and (iii) impair the value of such investments;
•Changes in the political climate, potential reforms and changes to government negotiation and regulation, the effect of healthcare reform legislation, including those that may limit pricing of pharmaceutical products and drugs, market prices and conditions, prospects for favorable or unfavorable clinical trial results, new product initiatives, the manufacturing and distribution of new products, product safety and efficacy issues, and new collaborative agreements, all of which may affect the valuation, funding opportunities, business operations, and financial results of the companies in which we invest;
•Changes in U.S. federal government organizations or other agencies, including changes in policy, regulations, budgeting, retention of key leadership and other personnel, administration of drug approvals or restrictions on drug product or service development or commercialization, or a partial or complete future government shutdown resulting in temporary closures of agencies such as the FDA and SEC, could adversely affect the companies in which we invest, including delays in the commercialization of such companies’ products, decreased funding of research and development in the life science, technology, and agtech industries, or delays surrounding approval of budget proposals for any of these industries;
•Impacts or changes in business in connection with the COVID-19 pandemic or for other reasons, including diversion of healthcare resources away from clinical trials, delays, or difficulties enrolling patients or maintaining scheduled appointments in clinical trials, interruptions, and delays in laboratory research due to the reduction in employee resources stemming from social distancing requirements and the desire of employees to avoid contact with people, insufficient
inventory of supplies and reagents necessary for laboratory research due to interruptions in supply chain, delays or difficulties obtaining clinical site locations or engaging clinical site staff, interruptions on clinical site monitoring due to travel restrictions, delays in interacting with or receiving approval from regulatory agencies in connection with research activities or clinical trials, and disruptions to manufacturing facilities and supply lines;
•Reduction in revenue or revenue growth, including in connection with the COVID-19 pandemic, deterioration in the global economy, or other reasons, may impair the value of the companies in which we hold equity investments or impede their ability to raise additional capital; and
•Seasonal weather conditions, changes in availability of transportation or labor, especially in connection with the COVID-19 pandemic, and other related factors may affect the products and services or the availability of the products and services of the companies in which we invest in the agtech sector.
Many of the factors listed above are beyond our control and, if the venture investment portfolio companies are adversely affected by any of the foregoing, could materially affect our reported asset and liability values and earnings and may materially and adversely affect our reported results of operations. The occurrence of any of these adverse events could cause the market price of shares of our common stock to decline regardless of the performance of our primary real estate business.
Market and other external factors may adversely impact the valuation of our equity investments.
We hold equity investments in certain publicly traded companies, limited partnerships, and privately held entities primarily involved in the life science, technology, and agtech industries through our venture investment portfolio. The valuation of these investments is affected by many external factors beyond our control, including, but not limited to, market prices, market conditions, the effect of healthcare reform legislation, prospects for favorable or unfavorable clinical trial results, new product initiatives, the manufacturing and distribution of new products, product safety and efficacy issues, and new collaborative agreements. In addition, partial or complete future government shutdowns that may result in temporary closures of agencies such as the FDA and SEC may adversely affect the processing of initial public offerings, business operations, financial results, and funding for projects of the companies in which we hold equity investments. Unfavorable developments with respect to any of these factors may have an adverse impact on the valuation of our equity investments.
Market and other external factors may negatively impact the liquidity of our equity investments.
We make and hold investments in privately held life science, technology, and agtech companies through our venture investment portfolio. These investments may be illiquid, which could impede our ability to realize the value at which these investments are carried if we are required to dispose of them. The lack of liquidity of these investments may make it difficult for us to sell these investments on a timely basis and may impair the value of these investments. If we are required to liquidate all or a portion of these investments quickly, we may realize significantly less than the amounts at which we had previously valued these investments.
Government factors
Negative impact on economic growth resulting from the combination of federal income tax policy, debt policy, and government spending may adversely affect our results of operations.
Global macroeconomic conditions affect our tenants’ businesses. Instability in the banking and government sectors of the U.S. and/or the negative impact on economic growth resulting from the combination of government tax policy, debt policy, and government spending, may have an adverse effect on the overall economic growth and our future revenue growth and profitability. Volatile, negative, or uncertain economic conditions could undermine business confidence in our significant markets or in other markets and cause our tenants to reduce or defer their spending, which would negatively affect our business. Growth in the markets we serve could be at a slow rate or could stagnate or contract in each case for an extended period of time. Differing economic conditions and patterns of economic growth and contraction in the geographic regions in which we operate and the industries we serve may in the future affect demand for our services. Our revenues and profitability are derived from our tenants in North America, some of which derive significant revenues from their international operations. Ongoing economic volatility and uncertainty affects our business in a number of other ways, including making it more difficult to accurately forecast client demand beyond the short term and to effectively build our revenue and spending plans. Economic volatility and uncertainty are particularly challenging because it may take some time for the effects and resulting changes in demand patterns to manifest themselves in our business and results of operations. Changing demand patterns from economic volatility and uncertainty could have a significant negative impact on our results of operations. These risks may impact our overall liquidity, our borrowing costs, or the market price of our common stock.
Monetary policy actions by the U.S. Federal Reserve could adversely impact our financial condition and our ability to make distributions to our stockholders.
During 2017–2018, the U.S. Federal Reserve gradually increased the target range for the federal funds rate. As of December 31, 2018, the federal funds rate was set at a range from 2.25% to 2.50%. From August 2019 through March 2020, the U.S. Federal Reserve initiated a series of rate cuts. As of December 31, 2020, the federal funds rate was set at a range from 0% to 0.25%. The U.S. Federal Reserve has not indicated any intention to continue to cut the federal funds rate, nor to raise the rate. Should the U.S. Federal Reserve raise the rate in the future, this will likely result in an increase in market interest rates, which may increase our interest expense under our variable-rate borrowings and the costs of refinancing existing indebtedness or obtaining new debt. In addition, increases in market interest rates may result in a decrease in the value of our real estate and a decrease in the market price of our common stock. Increases in market interest rates may also adversely affect the securities markets generally, which could reduce the market price of our common stock without regard to our operating performance. Any such unfavorable changes to our borrowing costs and stock price could significantly impact our ability to raise new debt and equity capital going forward.
Changes to the U.S. tax laws could have a significant negative impact on the overall economy, our tenants, and our business.
Changes to U.S. tax laws that may be enacted in the future could negatively impact the overall economy, government revenues, the real estate industry, our tenants, and us, in ways that cannot be reliably predicted. Furthermore, any future changes to U.S. tax laws may negatively impact certain of our tenants’ operating results, financial condition, and future business plans. Such changes to the tax laws may also result in reduced government revenues, and therefore reduced government spending, which may negatively impact some of our tenants that rely on government funding. For example, the Tax Cuts and Jobs Act of 2017 was enacted on December 20, 2017, and significantly revised the U.S. corporate income tax law by, among other things, reducing the corporate income tax rate to 21% for tax years beginning in 2018, imposing additional limitations on the deductibility of interest, changing the utilization of net operating loss carryforwards, allowing for the expensing of certain capital expenditures, and implementing a modified territorial system. We are currently unable to predict whether any future changes will occur and any impact such changes could have on our operating results, financial condition, and future business operations.
Actual and anticipated changes to the regulations of the healthcare system may have a negative impact on the pricing of drugs, the cost of healthcare coverage, and the reimbursement of healthcare services and products.
The FDA and comparable agencies in other jurisdictions directly regulate many critical activities of life science, technology, and healthcare industries, including the conduct of preclinical and clinical studies, product manufacturing, advertising and promotion, product distribution, adverse event reporting, and product risk management. In both domestic and foreign markets, sales of products depend in part on the availability and amount of reimbursement by third-party payers, including governments and private health plans. Governments may regulate coverage, reimbursement, and pricing of products to control cost or affect utilization of products. Private health plans may also seek to manage cost and utilization by implementing coverage and reimbursement limitations. Substantial uncertainty exists regarding the reimbursement by third-party payers of newly approved healthcare products. The U.S. and foreign governments regularly consider reform measures that affect healthcare coverage and costs. Such reforms may include changes to the coverage and reimbursement of healthcare services and products. In particular, there have been judicial and Congressional challenges to the Patient Protection and Affordable Care Act of 2010, as amended by the Health Care and Education Reconciliation Act (collectively, the “ACA”), which could have an impact on coverage and reimbursement for healthcare terms and services covered by plans authorized by the ACA. During 2017 several attempts were made to amend the ACA; however, no amendment proposal gained the 50-vote support from the U.S. Senate needed to pass a repeal bill. As a result, in October 2017, U.S. President Trump issued an executive order, “Promoting healthcare choice and competition across the United States” (the “Executive Order”). It is expected that the Biden administration will repeal the Executive Order, but it is unknown what other changes the new administration will implement through the U.S. Congress or future executive orders and how these would impact our tenants. Government and other regulatory oversight and future regulatory and government interference with the healthcare systems may adversely impact our tenants’ businesses and our business.
U.S. government tenants may not receive anticipated appropriations, which could hinder their ability to pay us.
U.S. government tenants are subject to government funding. If one or more of our U.S. government tenants fail to receive anticipated appropriations, we may not be able to collect rental amounts due to us. A significant reduction in federal government spending, particularly a sudden decrease due to the recent tax reform or to a sequestration process, which has occurred in recent years, could also adversely affect the ability of these tenants to fulfill lease obligations or decrease the likelihood that they will renew their leases with us. In addition, recent budgetary pressures have resulted in, and may continue to result in, reduced allocations to government agencies that fund research and development activities, such as the NIH. For example, the NIH budget has been, and may continue to be, significantly impacted by the sequestration provisions of the Budget Control Act of 2011, which became effective on March 1, 2013. Past proposals to reduce budget deficits have included reduced NIH and other research and development budgets. Any shift away from the funding of research and development or delays surrounding the approval of government budget proposals may cause our tenants to default on rental payments or delay or forgo leasing our rental space, which could adversely affect our business, financial condition, or results of operations. Additionally, the inability of the U.S. Congress to enact a budget for a future fiscal year or the occurrence of partial or complete U.S. federal government shutdowns could adversely impact demand for our services by limiting federal funding available to our tenants and their customers. In addition, defaults under leases with U.S. government tenants are governed by federal statute and not by state eviction or rent deficiency laws. As of December 31, 2020, leases with U.S. government tenants at our properties accounted for approximately 1.2% of our aggregate annual rental revenue in effect as of December 31, 2020.
Some of our tenants may be subject to increasing government price controls and other healthcare cost-containment measures.
Government healthcare cost-containment measures can significantly affect our tenants’ revenue and profitability. In many countries outside the U.S., government agencies strictly control, directly or indirectly, the prices at which our pharmaceutical industry tenants’ products are sold. In a number of European Union (“EU”) Member States, the pricing and/or reimbursement of prescription pharmaceuticals are subject to governmental control, and legislators, policymakers, and healthcare insurance funds continue to propose and implement cost-containing measures to keep healthcare costs down, due in part to the attention being paid to healthcare cost containment and other austerity measures in the EU. In the U.S., our pharmaceutical industry tenants are subject to substantial pricing pressures from state Medicaid programs, private insurance programs, and pharmacy benefit managers. In addition, many state legislative proposals could further negatively affect pricing and/or reimbursement for our pharmaceutical industry tenants’ products. Also, the pricing environment for pharmaceuticals continues to be in the political spotlight in the U.S. Pharmaceutical and medical device product pricing is subject to enhanced government and public scrutiny and calls for reform. Some states have implemented, and other states are considering, pharmaceutical price controls or patient access constraints under the Medicaid program, and some states are considering price-control regimes that would apply to broader segments of their populations who are not Medicaid eligible. We anticipate that pricing pressures from both governments and private payers inside and outside the U.S. will become more severe over time.
Changes in U.S. federal government funding for the FDA, the NIH, and other government agencies could hinder their ability to hire and retain key leadership and other personnel, properly administer drug innovation, or prevent new products and services from being developed or commercialized by our life science industry tenants and venture investment portfolio companies, which could negatively impact our business.
The ability of the FDA to review and approve new products can be affected by a variety of factors, including budget and funding levels, the ability to hire and retain key personnel, and statutory, regulatory, and policy changes. Average review times at the agency have fluctuated in recent years as a result. In addition, government funding of the NIH and other government agencies that fund research and development activities is subject to the political process, which is inherently fluid and unpredictable.
The ability of the FDA, the NIH, and other government agencies to properly administer their functions is highly dependent on the levels of government funding and the ability to fill key leadership appointments, among various factors. Delays in filling or replacing key positions could significantly impact the ability of the FDA, the NIH, and other agencies to fulfill their functions and could greatly impact healthcare and the drug industry.
In December 2016, the 21st Century Cures Act was signed into law. This legislation is designed to advance medical innovation and empower the FDA with the authority to directly hire positions related to drug and device development and review. In the past, the FDA was often unable to offer key leadership candidates (including scientists) competitive compensation packages as compared to those offered by private industry. The 21st Century Cures Act is designed to streamline the agency’s hiring process and enable the FDA to compete for leadership talent by expanding the narrow ranges that are provided in prior compensation structures.
However, any future government proposals to reduce or eliminate budgetary deficits may include reduced allocations to the FDA, the NIH, and other related government agencies. These budgetary pressures may result in a reduced ability by the FDA and the NIH to perform their respective roles and may have a related impact on academic institutions and research laboratories whose funding is fully or partially dependent on both the level and the timing of funding from government sources.
In October 2020, U.S. President Trump signed a stopgap spending bill in order to extend government funding until December 11, 2020. This bill provided necessary funding to government agencies until more fulsome appropriations were approved to provide funding for the remainder of the 2021 fiscal year. In December 2020, the U.S. Congress passed additional stopgap bills before finally enacting a budget for the 2021 fiscal year on December 27, 2020. It is unclear whether the U.S. federal government will fail to enact a budget in future fiscal years, and if so, it is possible another partial government shutdown similar to the one that took place from December 22, 2018, to January 25, 2019, may occur. If this occurs, the FDA and certain other science agencies may temporarily shut down select non-essential operations. Also, as was the case in the last government shutdown, the FDA may maintain only operations deemed to be essential public health-related functions and halt the acceptance of new medical product applications and routine regulatory and compliance work for medical products and certain drugs and foods during any shutdown.
Disruptions at the FDA and other agencies, such as those resulting from a government shutdown, or uncertainty from stopgap spending bills may slow the time necessary for new drugs and devices to be reviewed and/or approved by necessary government agencies and the healthcare and drug industries’ ability to deliver new products to the market in a timely manner, which would adversely affect our tenants’ operating results and business. Interruptions to the function of the FDA and other government agencies could adversely affect the demand for office/laboratory space and significantly impact our operating results and our business.
Changes in laws and regulations that control drug pricing for government programs may adversely impact our operating results and our business.
The Centers for Medicare & Medicaid Services (“CMS”) is the federal agency within the U.S. Department of Health and Human Services that administers the Medicare program and works in partnership with state governments to administer Medicaid. The Medicare Modernization Act of 2003 that went into effect on January 1, 2006 (which also made changes to the public Part C Medicare health plan program), explicitly prohibits government entities from directly negotiating drug prices with manufacturers. Recently, there has been significant public outcry against price increases viewed to be unfair and unwarranted.
Currently, the outcome of potential reforms and changes to government negotiation/regulation to drug pricing is unknown. Changes in policy that limit prices may reduce the financial incentives for the research and development efforts that lead to discovery and production of new therapies and solutions to life-threatening conditions. Negative impacts of new policies could adversely affect our tenants’ and venture investment portfolio companies’ businesses, including life science, technology, and agtech companies, which may reduce the demand for office/laboratory space and negatively impact our operating results and our business.
The provisions of the Dodd-Frank Wall Street Reform and Consumer Protection Act (the “Dodd-Frank Act”) may subject us to substantial additional federal regulation and may adversely affect our business, results of operations, cash flows, or financial condition.
There are significant corporate governance- and executive compensation-related provisions in the Dodd-Frank Act that required the SEC to adopt additional rules and regulations in these areas. For example, the Dodd-Frank Act requires publicly traded companies to give stockholders a non-binding vote on executive compensation and so-called “golden parachute” payments. Our efforts to comply with these requirements have resulted in, and are likely to continue to result in, an increase in expenses and a diversion of management’s time from other business activities. In addition, provisions of the Dodd-Frank Act that directly affect other participants in the real estate and capital markets, such as banks, investment funds, and interest rate hedge providers, could have indirect, but material, impacts on our business. In 2018, several changes were made to the Dodd-Frank Act, including the repeal of certain provisions that eased restrictions on small and medium-sized banks of the Dodd-Frank Act. It is expected that the Biden administration will reverse a number of U.S. President Trump’s policies, includes those that relate to deregulation, and will increase the number of financial regulators as current vacancies in the bureaucracy are prioritized and filled under the new administration.
Many of the provisions of the Dodd-Frank Act have extended implementation periods and delayed effective dates and will require extensive rulemaking by regulatory authorities. Given the uncertainty associated with the Dodd-Frank Act itself and the manner in which its provisions are implemented by various regulatory agencies and through regulations, the full extent of the impact such requirements will have on our future operations is unclear. The provisions of the Dodd-Frank Act may impact the profitability of business activities, require changes to certain business practices, or otherwise adversely affect our business in general. The Dodd-Frank Act, including current and future rules implementing its provisions and the interpretation of those rules, along with other legislative and regulatory proposals directed at the financial or real estate industry or affecting taxation that are proposed or pending in the U.S. Congress, may limit our revenues, impose fees or taxes on us, and/or intensify the regulatory framework within which we operate in ways that are not currently identifiable. The Dodd-Frank Act also has resulted in, and is expected to continue to result in, substantial changes and dislocations in the banking industry and the financial services sector in ways that could have significant effects on, for example, the availability and pricing of unsecured credit, commercial mortgage credit, and derivatives, such as interest rate swaps, which are important aspects of our business. Accordingly, new laws, regulations, and accounting standards, as well as changes to, or new interpretations of, currently accepted accounting practices in the real estate industry, may adversely affect our results of operations.
Global factors
Changes in the method of determining LIBOR, or the replacement of LIBOR with an alternative reference rate, may adversely affect interest expense related to outstanding debt.
From time to time, we utilize interest rate hedge agreements to manage a portion of our exposure to variable interest rates. Historically, our interest rate hedge agreements primarily related to our borrowings with variable interest rates based on LIBOR. Beginning in 2008, concerns were raised that some of the member banks surveyed by the BBA in connection with the calculation of daily LIBOR across a range of maturities and currencies may have underreported, overreported, or otherwise manipulated the interbank lending rate applicable to them in order to profit on their derivatives positions or to avoid an appearance of capital insufficiency or adverse reputational or other consequences that might have resulted from reporting interbank lending rates higher than those they actually submitted. A number of BBA member banks have entered into settlements with their regulators and law enforcement agencies with respect to alleged manipulation of LIBOR, and investigations have been instigated by regulators and government authorities in various jurisdictions. Other member banks may also enter into such settlements with, or have proceedings brought by, their regulators or law enforcement agencies in the future. If manipulation of LIBOR occurred, it may have resulted in LIBOR having been artificially lower (or higher) than it would otherwise have been. Any such manipulation could have occurred over a substantial period of time.
On September 28, 2012, British regulators published a report on the review of LIBOR. The report concluded that LIBOR should be retained as a benchmark but recommended a comprehensive reform of LIBOR, including replacing the BBA with a new independent administrator of LIBOR. Based on this report, final rules for the regulation and supervision of LIBOR by the Financial Conduct Authority (“FCA”) were published and came into effect on April 2, 2013 (the “FCA Rules”). In particular, the FCA Rules include requirements that (i) an independent LIBOR administrator monitor and survey LIBOR submissions to identify breaches of practice standards and/or potentially manipulative behavior and (ii) firms submitting data to LIBOR establish and maintain a clear conflict-of-interest policy and appropriate systems and controls. In response, ICE Benchmark Administration Limited (“IBA”) was appointed as the independent LIBOR administrator, effective in early 2014. On July 27, 2017, the FCA announced that it would phase out LIBOR as a benchmark by the end of 2021. On November 18, 2020, IBA announced it would consult on its intention to cease the publication of all GBP, EUR, CHF, and JPY LIBOR settings and the one-week and two-month USD LIBOR tenors immediately following the LIBOR publication on December 31, 2021. On November 30, 2020, IBA announced an extension of the LIBOR transition deadline to June 30, 2023, rather than December 31, 2021, for the overnight and one-, three-, six-, and twelve-month USD LIBOR. These decisions are subject to consultation, and announcements of the official cessation of any LIBOR settings will be made separately.
In addition, in November 2014, the U.S. Federal Reserve established a working group composed of large U.S. financial institutions, the Alternative Reference Rates Committee (“ARRC”), to identify a set of alternative interest reference rates to LIBOR. In a May 2016 interim report, the ARRC narrowed its choice to two LIBOR alternatives. The first choice was the Overnight Bank Funding Rate (“OBFR”), which consists of domestic and foreign unsecured borrowing in U.S. dollars. The U.S. Federal Reserve has been calculating and publishing the OBFR since March 2016. The second alternative rate to LIBOR was the Treasury General Collateral Rate, which is composed of repo transactions secured by treasuries or other assets accepted as collateral by the majority of intermediaries in the repo market.
In June 2017, the ARRC selected the Secured Overnight Financing Rate (“SOFR”), a new index calculated by reference to short-term repurchase agreements backed by U.S. Treasury securities, as its preferred replacement for U.S. dollar LIBOR. SOFR is observed and backward looking, which stands in contrast to LIBOR under the current methodology, which is an estimated forward-looking rate and relies, to some degree, on the expert judgment of submitting panel members. Given that SOFR is a secured rate backed by government securities, it does not take into account bank credit risk (as is the case with LIBOR). SOFR is therefore likely to be lower than LIBOR and is less likely to correlate with the funding costs of financial institutions. The first publication of SOFR was released by the Federal Reserve Bank of New York in April 2018.
In April 2019, the ARRC published its recommendations on fallback language for syndicated loans, which the ARRC encourages companies to use in new contracts that reference LIBOR in order to minimize market disruptions when LIBOR ceases to exist. The ARRC suggested two alternative fallback language approaches for syndicated loan contracts:
•“Hardwired Approach,” which clearly specifies the SOFR-based successor rate and spread adjustment to be used when LIBOR ceases to exist.
•“Amendment Approach,” which, unlike the Hardwired Approach, does not reference specific rates or spread adjustments but provides a streamlined amendment approach for negotiating a benchmark replacement and introduces clarity with respect to the fallback trigger events and an adjustment to be applied to the successor rate.
In November 2020, the ARRC published best practice recommendations that new LIBOR cash products should have robust fallback language as soon as possible and new use of LIBOR should cease altogether.
Since 2012, we have been closely monitoring developments related to the transition away from LIBOR and have implemented numerous proactive measures to minimize the potential impact of the transition to the Company, specifically:
•We have proactively reduced outstanding LIBOR-based borrowings under our unsecured senior bank term loans and secured construction loans through repayments. From January 2017 to December 2020, we retired approximately $1.5 billion of such debt.
•We continue to prudently manage outstanding borrowings under our unsecured senior line of credit, our only LIBOR-based debt (excluding $12.7 million LIBOR-based debt held by one of our unconsolidated joint ventures as of December 31, 2020). As of December 31, 2020, we had no borrowings outstanding under our unsecured senior line of credit.
•Our unsecured senior line of credit contains fallback language generally consistent with the ARRC’s Amendment Approach, which provides a streamlined amendment approach for negotiating a benchmark replacement and introduces clarity with respect to the fallback trigger events and an adjustment to be applied to the successor rate.
•We continue to monitor developments by the ARRC and other governing bodies involved in LIBOR transition.
We continue to be proactive in managing the risk of disruption associated with the cessation of LIBOR; however, it is not possible to predict the effect of the FCA Rules, any changes in the methods pursuant to which LIBOR is determined, the administration of LIBOR by IBA, and any other reforms to LIBOR that will be enacted in the United Kingdom and elsewhere. In addition, any changes announced by the FCA, the BBA, IBA, the ARRC, or any other successor governance or oversight body, or future changes adopted by such body, in the method pursuant to which LIBOR is determined, as well as manipulative practices or the cessation thereof, may result in a sudden or prolonged increase or decrease in reported LIBOR, which could have an adverse impact on the level of the index. Fluctuation or discontinuation of LIBOR would affect our interest expense and earnings and the fair value of certain of our financial instruments. We also have certain joint ventures that may require variable-rate construction loans with interest based upon LIBOR plus a spread. From time to time, we utilize interest rate hedge agreements to mitigate our exposure to such interest rate risk on a portion of our debt obligations. However, there is no assurance these arrangements will be effective in reducing our exposure to changes in
interest rates.
It is unclear whether new methods of calculating LIBOR will be established such that it continues to exist after 2021. When LIBOR ceases to exist, we may need to amend the credit and loan agreements with our lenders that utilize LIBOR as a factor in determining the interest rate based on a new standard that is established, if any. The transition to an alternative rate will require careful and deliberate consideration and implementation so as to not disrupt the stability of financial markets. There is no guarantee that a transition from LIBOR to an alternative will not result in financial market disruptions, significant increases in benchmark rates, or borrowing costs to borrowers, any of which could have an adverse effect on our business, results of operations, financial condition, and stock price.
The transition to SOFR may present challenges, including, but not limited to, the illiquidity of SOFR derivatives markets, which could make it difficult for financial institutions to offer SOFR-based debt products, the determination of the spread adjustment required to convert LIBOR to SOFR (and the related determination of a term structure with different maturities), and the greater volatility of SOFR compared to that of LIBOR. Although daily pricing resets for SOFR have been noted to be more volatile than that of LIBOR, especially at month end, there is no sufficient evidence to establish how SOFR volatility compares to that of LIBOR. Whether or not SOFR attains market acceptance as a LIBOR replacement tool remains in question. As such, the future of LIBOR and potential alternatives at this time remains uncertain.
The current outbreak of the novel coronavirus disease, or COVID-19, or the future outbreak of any other highly infectious or contagious diseases, could adversely impact or cause disruption to our financial condition and results of operations. Further, the spread of COVID-19 has caused severe disruptions in the U.S. and global economies, may further disrupt financial markets, and could create widespread business continuity issues.
In recent years, the outbreaks of a number of diseases, including avian influenza, H1N1, and various other “superbugs,” have increased the risk of a pandemic. In December 2019, COVID-19 was reported to have surfaced in Wuhan, China. COVID-19 has since spread around the globe, including the U.S. COVID-19 has been reported in every state in the U.S., including those where we own and operate our properties, have executive offices, and conduct principal operations. On March 11, 2020, the World Health Organization declared COVID-19 a pandemic, and on March 13, 2020, the U.S. declared a national emergency with respect to COVID-19.
The potential impact and duration of the COVID-19 pandemic has had, and continues to have, a significant adverse impact across regional and global economies and financial markets. The global impact of the outbreak has been rapidly evolving and as new cases of the virus have continued, particularly in the U.S., countries around the world and states around the U.S., have reacted by instituting quarantines and restrictions on travel.
Almost every state implemented some form of shelter-in-place or stay-at-home directive between March and May 2020, including, among others, the cities of Boston, San Francisco (including five other San Francisco Bay Area counties), and Seattle, and the states of California, Maryland, Massachusetts, and New York, where we own properties. The lockdown restrictions implemented included quarantines, restrictions on travel, shelter-in-place orders, school closures, restrictions on types of business that may continue to operate, and/or restrictions on types of construction projects that could continue. These quarantines generally came with exceptions for essential healthcare/public health operations; health manufacturing; clinical research, development, and testing for COVID-19; research and laboratory activities; essential manufacturing for pharmaceuticals, vaccines, testing materials, laboratory supplies, medical equipment, instruments; and safety products; essential retail, including pharmacies; essential building services, such as cleaning and maintenance; skilled trades, such as plumbers and electricians; and certain essential construction projects.
Beginning in early May 2020, parts of the U.S. began to ease the lockdown restrictions and allow for the reopening of businesses. The gradual reopening of retail, manufacturing, and office facilities came with required or recommended safety protocols. Due to the increase in the number of COVID-19 cases subsequent to the reopening, in November 2020, parts of the U.S. have implemented additional stay-at-home and lockdown restrictions. Additionally, in recent months, new COVID-19 variants were discovered in the United Kingdom (“U.K.”), among other countries, which have spread globally, including the U.S. While these strains do not appear to cause more severe symptoms in individuals, they have spread faster and more easily upon contact. As a result, more stringent lockdown restrictions have been implemented in regions globally and within the U.S. It is unknown when easing of these lockdowns and another reopening will occur even as COVID-19 vaccines become available across the U.S. via Emergency Use Authorization (“EUA”) by the FDA. There is no assurance that the reopening of businesses, even if those businesses adhere to recommended safety protocols, will enable us or many of our tenants to avoid adverse effects on our and our tenants’ operations and businesses.
As of the date of this report, all our ground-up development projects undergoing construction have resumed construction. New lockdowns instituted by local and state governments may cause our construction projects to have to pause, causing delays on our expected future deliveries. Construction workers are also practicing social distancing and following rules that restrict gathering of large groups of people in close proximity, as well as other appropriate practices, that may slow the pace of construction.
Although critical research and development efforts are continuing in our office/laboratory properties, in certain cases such research and development efforts have fewer workers, and non-critical workers in these buildings and most office buildings are working remotely. When appropriate, certain spaces have been and may continue to be subject to temporary closure for quarantine and proper disinfecting. Our properties and tenant base include a small amount of restaurant, conference center, fitness centers, and retail space, which accounts for approximately 0.5% of our annual rental revenues as of December 31, 2020. Retail tenants in particular continue to be severely impacted by stay-at-home and lockdown restrictions and social distancing protocols that remain in place across all of the markets where our properties are located.
The COVID-19 outbreak has already had a significant adverse impact on the economies of the world, including that of the U.S., and this pandemic, and future pandemics, could trigger a period of prolonged global economic slowdown or recession.
The effects of COVID-19 or another pandemic on our (or our tenants’) ability to successfully operate could be adversely impacted due to, among other factors:
•The continued service and availability of personnel, including our executive officers and other leaders that are part of our management team, and our ability to recruit, attract, and retain skilled personnel. To the extent our management or personnel are impacted in significant numbers by the outbreak of pandemic or epidemic disease and are not available or allowed to conduct work, our business and operating results may be negatively impacted;
•Our (or our tenants’) ability to operate, generally or in affected areas, or delays in the supply of products or services from our vendors that are necessary for us to operate effectively;
•Our tenants’ ability to pay rent on their leases in full and timely and, to the extent necessary, our inability to restructure our tenants’ long-term rent obligations on terms favorable to us or to timely recapture the space for re-leasing (refer to the risk factor on the next page within this Item 1A of this annual report on Form 10-K);
•Difficulty in our accessing debt and equity capital on attractive terms, or at all, and a severe disruption and instability in the global financial markets, or deterioration in credit and financing conditions, which may affect our (or our tenants’) ability to access capital necessary to fund business operations or replace or renew maturing liabilities on a timely basis and may adversely affect the valuation of financial assets and liabilities, any of which could affect our (or our tenants’) ability to meet liquidity and capital expenditure requirements or could have a material adverse effect on our business, financial condition, results of operations, and cash flows;
•Complete or partial closures of, or other operational issues at, one or more of our offices or properties resulting from government action or directives;
•Our (or our tenants’) ability to continue or complete construction as planned for our tenants’ operations, or delays in the supply of materials or labor necessary for construction, which may affect our (or our tenants’) ability to complete construction or to complete it timely, our ability to prevent a lease termination, and our ability to collect rent, which may have a material adverse effect on our business, financial condition, results of operations, and cash flows;
•The cost of implementing precautionary measures against COVID-19, including, but not limited to, potential additional health insurance and labor-related costs;
•Governmental efforts (such as moratoriums on or suspensions of eviction proceedings) that may affect our ability to collect rent or enforce remedies for the failure of our tenants to pay rent;
•Uncertainty related to whether the U.S. Congress or state legislatures will pass additional laws providing for additional economic stimulus packages, governmental funding, or other relief programs, whether such measures will be enacted, whether our tenants will be eligible or will apply for any such funds, whether the funds, if available, could be used by our tenants to pay rent, and whether such funds will be sufficient to supplement our tenants’ rent and other obligations to us;
•Deterioration of global economic conditions and job losses, which may decrease demand for and occupancy levels of our rental properties and may cause our rental rates and property values to be negatively impacted;
•Our dependence on short-term and long-term debt sources, including our unsecured senior line of credit, commercial paper program, and senior notes, which may affect our ability to continue our investing activities and make distributions to our stockholders;
•Declines in the valuation of our properties, which may affect our ability to dispose of assets at attractive prices or to obtain debt financing secured by our properties and may reduce the availability of debt funding;
•Declines in the valuation of our venture investment portfolio, which may (i) impede our ability to realize the value at which these investments are carried if we are required to dispose of them, (ii) make it difficult for us to sell these investments on a timely basis, and (iii) impair the value of such investments;
•Refusal or failure by one or more of our lenders under our credit facility to fund their financing commitment to us, which we may not be able to replace on favorable terms, or at all;
•To the extent we enter into derivative financial instruments, one or more counterparties to our derivative financial instruments could default on their obligations to us or could fail, increasing the risk that we may not realize the benefits of utilizing these instruments;
•Any possession taken of our properties, in whole or in part, by governmental authorities for public purposes in eminent domain proceedings;
•Our level of insurance coverage and recovery we receive under any insurance we maintain, which may be delayed by, or insufficient to fully offset potential/actual losses caused by, COVID-19;
•Any increase in insurance premiums and imposition of large deductibles;
•Our level of dependence on the Internet, as it relates to employees’ working remotely, and increases in malware campaigns and phishing attacks preying on the uncertainties surrounding COVID-19, which may increase our vulnerability to cyber attacks;
•Our ability to ensure business continuity in the event our continuity of operations plan is not effective or is improperly implemented or deployed during a disruption; and
•Our ability to operate, which may cause our business and operating results to decline or may impact our ability to comply with regulatory obligations and may lead to reputational harm and regulatory issues or fines.
While the rapid development and fluidity of the COVID-19 pandemic precludes any prediction as to the ultimate adverse impact of COVID-19, the spread of COVID-19 has resulted in, and may continue to result in, significant disruption of the global financial market and an increase in unemployment in the U.S. Although the FDA has approved certain therapies and two vaccines for emergency use and distribution to certain groups of individuals as of the date of this report, (i) the initial rollout of vaccine distribution
has encountered significant delays, and (ii) there remain uncertainties as to the amount of vaccine available for distribution, the logistics of implementing a national vaccine program, and the overall efficacy of the vaccines once widely administered, especially as
new strains of COVID-19 have been discovered, and the level of resistance these new strains have to the existing vaccines, if any,
remains unknown. Until such therapies and vaccines are widely available and effective, the pandemic and public and private responses to the pandemic may lead to deterioration of economic conditions, an economic downturn, and/or a recession, at a global scale, which could materially affect our (or our tenants’) performance, financial condition, results of operations, and cash flows.
The current outbreak of the novel coronavirus disease, or COVID-19, or the future outbreak of any other highly infectious or contagious diseases, could adversely impact or cause disruption to our tenants’ financial condition and results of operations, which may adversely impact our ability to generate income sufficient to meet operating expenses or generate income and capital appreciation.
Our tenants, many of which conduct business in the life science, technology, or agtech industries, may incur significant costs or losses responding to the outbreak of a contagious disease (such as COVID-19), lose business due to interruption in their operations, or incur other liabilities related to shelter-in-place orders, quarantines, infection, or other related factors. Tenants that experience deteriorating financial conditions as a result of the outbreak of a contagious disease, or the COVID-19 pandemic, may be unwilling or unable to pay rent in full or timely due to bankruptcy, lack of liquidity, lack of funding, operational failures, or other reasons. Our tenants’ defaults and delayed or partial rental payments could adversely impact our rental revenues and operating results.
The negative effects of an outbreak of a contagious disease on our tenants in the life science industry may include, but are not limited to:
•Delays or difficulties in enrolling patients or maintaining scheduled study visits in clinical trials;
•Delays or difficulties in clinical site initiation, including difficulties in recruiting clinical site investigators and clinical site staff;
•Diversion of healthcare resources away from clinical trials, including the diversion of hospitals serving as our tenants’ clinical trial sites and hospital staff supporting the conduct of our tenants’ clinical trials;
•Interruptions of key clinical trial or other research activities, such as clinical trial site monitoring, due to limitations on travel imposed or recommended by federal or state governments, employers, and others;
•Limitations in employee resources that would otherwise be focused on our tenants’ research, business, or clinical trials, including because of sickness of employees or their families, the desire of employees to avoid contact with large groups of people, or as a result of the governmental imposition of shelter-in-place or similar working restrictions;
•Interruptions in supply chain, manufacturing, and global shipping, or other delays that may affect the transport of materials necessary for our tenants’ research, clinical trials, or manufacturing activities;
•Reduction in revenue projections for our tenants’ products due to the prioritization of the treatment of COVID-19 patients over other treatments, such as specialty and elective procedures and non-COVID-19 diagnostics;
•Delays in necessary interactions with ethics committees, regulators, and other important agencies and contractors due to limitations in employee resources or forced furlough of government employees;
•Delays in receiving approval from regulatory authorities to initiate planned clinical trials or research activities;
•Delays in commercialization of our tenants’ products and approval by governmental authorities (such as the FDA and the federal and state Emergency Management Agencies) of our tenants’ products caused by disruptions, funding shortages, or health concerns, as well as by the prioritization by the FDA of the review and approvals of diagnostics, therapeutics, and vaccines that are related to COVID-19;
•Difficulty in retaining staff or rehiring staff in connection with layoffs caused by deteriorating global market conditions;
•Changes in local regulations as part of a response to the COVID-19 outbreak that may require our tenants to change the ways in which their clinical trials are conducted, which may result in unexpected costs or the discontinuation of the clinical trials altogether;
•Refusal or reluctance of the FDA to accept data from clinical trials in affected geographies outside the U.S.;
•Diminishing public trust in healthcare facilities or other facilities, such as medical office buildings, that are treating (or have treated) patients affected by contagious diseases; and
•Inability to access capital on terms favorable to our tenants because of changes in company valuation and/or investor appetite due to a general downturn in economic and financial conditions and the volatility of the market.
The negative effects of an outbreak of a contagious disease on our tenants in the technology industry may include, but are not limited to:
•Reduction in staff productivity due to business closures, alternative working arrangements, or illness of staff and/or illness in the family;
•Reduction in sales of our tenants’ services and products, longer sales cycles, reduction in subscription duration and value, slower adoption of new technologies, and increase in price competition due to economic uncertainties and downturns;
•Disruptions to our tenants’ supply chain, manufacturing vendors, or logistics providers to deliver products or perform services;
•Limitations on business and marketing activities due to travel restrictions and virtualization, or cancellation of customer and employee events;
•Adverse impact on customer relationships and our ability to recognize revenues due to our tenants’ inability to access their clients’ sites for implementation and on-site consulting services;
•Inability to recruit and develop highly skilled employees with appropriate qualifications, to conduct background checks on potential employees, and to provide necessary equipment and training to new and existing employees;
•Network infrastructure and technology system failures of our tenants, or of third-party services used by our tenants, which may result in system interruptions, reputational harm, loss of intellectual property, delays in product development, lengthy interruptions in services, breaches of data security, and loss of critical data;
•Higher employment compensation costs that may not be offset by improved productivity or increased sales; and
•Inability to access capital on terms favorable to our tenants because of changes in company valuation and/or investor appetite due to a general downturn in of economic and financial conditions and the volatility of the market.
The negative effects of an outbreak of a contagious disease on our tenants in the agtech industry may include, but are not limited to:
•Reduction in productive capacity and profitability because of decreased labor availability due, for example, to government restrictions, the inability of employees to report to work, or collective bargaining efforts;
•Potential contract cancellations, project reductions, and reduction in demand for our tenants’ products due to the adverse effect on business confidence and consumer sentiments and the general downturn in economic conditions;
•Disruption of the logistics necessary to import, export, and deliver products to target companies and their customers, as ports and other channels of entry may be closed or may operate at only a portion of capacity;
•Disruptions to manufacturing facilities and supply lines; and
•Inability to access capital on terms favorable to our tenants because of changes in company valuation and/or investor appetite due to a general downturn in economic and financial conditions and the volatility of the market.
The potential impact of a pandemic or outbreak of a contagious disease with respect to our tenants or our properties is difficult to predict and could have a material adverse impact on our tenants’ operations and, in turn, on our revenues, business, and results of operations, as well as the value of our stock. The COVID-19 pandemic, or other pandemics, may directly or indirectly cause the realization of any of the other risk factors included in this annual report on Form 10-K.
Other factors
We may incur significant costs if we fail to comply with laws or if laws change.
Our properties are subject to many federal, state, and local regulatory requirements and to state and local fire, life-safety, and other requirements. If we do not comply with all of these requirements, we may have to pay fines to government authorities or damage awards to private litigants. We do not know whether these requirements will change or whether new requirements will be imposed. Changes in these regulatory requirements could require us to make significant unanticipated expenditures. These expenditures could have an adverse effect on us and our ability to make distributions to our stockholders.
For example, the California Safe Drinking Water and Toxic Enforcement Act, also referred to as Proposition 65, requires “clear and reasonable” warnings be given to persons who are exposed to chemicals known to the State of California to cause cancer or reproductive toxicity. We believe that we comply with Proposition 65 requirements; however, there can be no assurance that we will not be adversely affected by litigation or regulatory enforcement relating to Proposition 65. In addition, there can be no assurance that the costs of compliance with new environmental laws and regulations will not be significant or will not adversely affect our ability to meet our financial expectations, our financial condition, results of operations, and cash flows.
We may incur significant costs in complying with the Americans with Disabilities Act and similar laws.
Under the ADA, places of public accommodation and/or commercial facilities must meet federal requirements related to access and use by disabled persons. We may be required to make substantial capital expenditures at our properties to comply with this law. In addition, non-compliance could result in the imposition of fines or an award of damages to private litigants.
A number of additional federal, state, and local laws and regulations exist regarding access by disabled persons. These regulations may require modifications to our properties or may affect future renovations. These expenditures may have an adverse impact on overall returns on our investments.
We face possible risks and costs associated with the effects of climate change and severe weather.
We cannot predict the rate at which climate change will progress. However, the physical effects of climate change could have a material adverse effect on our properties, operations, and business. For example, most of our properties are located along the east and west coasts of the U.S. To the extent that climate change impacts changes in weather patterns, our markets could experience severe weather, including hurricanes, severe winter storms, and coastal flooding due to increases in storm intensity and rising sea levels. Over time, these conditions could result in declining demand for space at our properties, delays in construction, resulting in increased construction costs, or in our inability to operate the buildings at all. Climate change and severe weather may also have indirect effects on our business by increasing the cost of, or decreasing the availability of, property insurance on terms we find acceptable, by increasing the costs of energy, maintenance, repair of water and/or wind damage, and snow removal at our properties.
Although Congress has not yet enacted comprehensive federal legislation to address climate change, numerous states and municipalities have adopted laws and policies on climate change and emission reduction targets. For example, in July 2019, the Climate Leadership and Community Protection Act was signed into law in New York, establishing a statewide framework to reduce net greenhouse gas emissions to zero by 2050. Also, in May 2019, New York City enacted the Climate Mobilization Act aimed at reducing greenhouse gas emissions and will apply to commercial and residential buildings. In September 2018, SB 100 was signed into law in California, accelerating the state’s renewable portfolio standard target dates and setting a policy of meeting 100% of retail sales from eligible renewables and zero-carbon resources by December 31, 2045. Changes in federal, state, and local legislation and regulation based on concerns about climate change could result in increased capital expenditures on our existing properties and our new development properties (for example, to improve their energy efficiency and/or resistance to severe weather) without a corresponding increase in revenue, which may result in adverse impacts to our net income.
There can be no assurance that climate change and severe weather will not have a material adverse effect on our properties, operations, or business.
We may incur significant costs in complying with environmental laws.
Federal, state, and local environmental laws and regulations may require us, as a current or prior owner or operator of real estate, to investigate and remediate hazardous or toxic substances or petroleum products released at or from any of our properties. The cost of investigating and remediating contamination could be substantial and could exceed the amount of any insurance coverage available to us. In addition, the presence of contamination, or the failure to properly remediate, may adversely affect our ability to lease or sell an affected property, or to borrow funds using that property as collateral.
Under environmental laws and regulations, we may have to pay government entities or third parties for property damage and for investigation and remediation costs incurred by those parties relating to contaminated properties regardless of whether we knew of or caused the contamination. Even if more than one party was responsible for the contamination, we may be held responsible for all of the remediation costs. In addition, third parties may sue us for damages and costs resulting from environmental contamination, or jointly responsible parties may contest their responsibility or be financially unable to pay their share of such costs.
Environmental laws also govern the presence, maintenance, and removal of asbestos-containing building materials. These laws may impose fines and penalties on us for the release of asbestos-containing building materials and may allow third parties to seek recovery from us for personal injury from exposure to asbestos fibers. We have detected asbestos-containing building materials at some of our properties, but we do not expect that they will result in material environmental costs or liabilities for us.
Environmental laws and regulations also require the removal or upgrading of certain underground storage tanks and regulate:
•The discharge of stormwater, wastewater, and any water pollutants;
•The emission of air pollutants;
•The generation, management, and disposal of hazardous or toxic chemicals, substances, or wastes; and
•Workplace health and safety.
Many of our tenants routinely handle hazardous substances and wastes as part of their operations at our properties. Environmental laws and regulations subject our tenants, and potentially us, to liability resulting from these activities. Environmental liabilities could also affect a tenant’s ability to make rental payments to us. We require our tenants to comply with these environmental laws and regulations and to indemnify us against any related liabilities.
Independent environmental consultants have conducted Phase I or similar environmental assessments at our properties. We intend to use consultants to conduct similar environmental assessments on our future acquisitions. This type of assessment generally includes a site inspection, interviews, and a public records review, but no subsurface sampling. These assessments and certain additional investigations of our properties have not to date revealed any environmental liability that we believe would have a material adverse effect on our business, assets, or results of operations.
Additional investigations have included, as appropriate:
•Asbestos surveys;
•Radon surveys;
•Lead-based paint surveys;
•Mold surveys;
•Additional public records review;
•Subsurface sampling; and
•Other testing.
Nevertheless, it is possible that the assessments on our current properties have not revealed, and that assessments on future acquisitions will not reveal, all environmental liabilities. Consequently, there may be material environmental liabilities of which we are unaware that may result in substantial costs to us or our tenants and that could have a material adverse effect on our business.
Environmental, health, or safety matters are subject to evolving regulatory requirements. Costs and capital expenditures relating to the evolving requirements depend on the timing of the promulgation and enforcement of new standards. As discussed in the immediately preceding risk factor, due to concern over the risks of climate change, a more restrictive regulatory framework to reduce greenhouse gas pollution might be implemented, including the adoption of carbon taxes, restrictive permitting, and increased efficiency standards. These requirements could make our operations more expensive and lengthen our project times. The costs of complying with evolving regulatory requirements, including greenhouse gas regulations and policies, could negatively impact our financial results. Moreover, changes in environmental regulations could inhibit or interrupt our operations, or require modifications to our facilities. Accordingly, environmental, health, or safety regulatory matters could result in significant unanticipated costs or liabilities and could have a material adverse effect on our business, financial condition, results of operations, and cash flows, and the market price of our common stock.
We may be unable to meet our sustainability goals.
We seek to make a positive and meaningful impact on the health, safety, and well-being of our tenants, stockholders, employees, and the communities in which we live and work. In support of these efforts, we set specific sustainability goals to reduce the environmental impact of buildings in operation and for new ground-up construction projects. There are significant risks that may prevent us from achieving these goals, including, but not limited to, the following possibilities:
•Change in market conditions may affect our ability to deploy capital for projects that reduce energy consumption, greenhouse gas pollution, and potable water consumption and that provide waste savings.
•Our tenants may be unwilling or unable to accept potential incremental expenses associated with our sustainability programs, including expenses to comply with requirements stipulated under building certification standards such as LEED, WELL, and Fitwel.
The realization of any of the above risks could significantly impact our reputation, our ability to continue developing properties in markets where high levels of LEED certification contribute to our efforts to obtain building permits and entitlements, and our ability to attract tenants who include LEED certification among their priorities when selecting a location to lease.
We may invest or spend the net proceeds from the offering of our unsecured senior notes payable due in January 2024 and April 2026 in ways investors may not agree with and in ways that may not earn a profit.
The net proceeds from the offering of our unsecured senior notes payable due in January 2024 and our unsecured senior notes payable due in April 2026 (collectively the “Green Bonds”) will be used to fund, in whole or in part, Eligible Green Projects (as defined below), including the development and redevelopment of such projects. The net proceeds from these offerings were initially used to reduce the outstanding balance on our unsecured senior line of credit. We then allocated the funds to recently completed and future Eligible Green Projects.
There can be no assurance that the projects funded with the proceeds from the Green Bonds will meet investor criteria and expectations regarding environmental impact and sustainability performance. In particular, no assurance is given that the use of such proceeds for any Eligible Green Projects will satisfy, whether in whole or in part, any present or future investor expectations or requirements regarding any investment criteria or guidelines with which such investor or its investments are required to comply, whether by any present or future applicable law or regulations or by its own bylaws or other governing rules or investment portfolio mandates (in particular with regard to any direct or indirect environmental, sustainability, or social impact of any projects or uses, the subject of or related to, the relevant Eligible Green Projects). Adverse environmental or social impacts may occur during the design, construction, and operation of the projects, or the projects may become controversial or criticized by activist groups or other stakeholders. In addition, although we will limit the use of proceeds from the Green Bonds to Eligible Green Projects, there can be no assurance that one or more development, redevelopment, and tenant improvement projects that we expect will receive a LEED certification will actually receive such certification. Furthermore, from time to time, we may refinance our debt to take advantage of lower market rates or other favorable terms, and we might pursue this strategy in the future in connection with our Green Bonds. If the terms of the refinanced agreements set different or no restrictions on the range of purposes the funds can be allocated to, we can provide no assurance that allocations to future Eligible Green Projects established prior to the refinancing of our Green Bonds will remain unchanged after the refinancing has been completed.
‘‘Eligible Green Projects’’ are defined as:
•New class A development properties that have received or are expected to receive Gold or Platinum LEED certification;
•Existing class A redevelopment properties that have received or are expected to receive Gold or Platinum LEED certification; and
•Tenant improvements that have received or are expected to receive Gold or Platinum LEED certification.
Eligible Green Projects include projects with disbursements made in the three years preceding the applicable issue date of the Green Bonds. We intend to spend the remaining net proceeds from the sale of the Green Bonds within two years following the applicable issue date of the Green Bonds. LEED is a voluntary, third party building certification process developed by the U.S. Green Building Council (‘‘USGBC’’), a non-profit organization. The USGBC developed the LEED certification process to (i) evaluate the environmental performance from a whole-building perspective over a building’s life cycle, (ii) provide a definitive standard for what constitutes a ‘‘green building,’’ (iii) enhance environmental awareness among architects and building contractors, and (iv) encourage the design and construction of energy-efficient, water-conserving buildings that use sustainable or green resources and materials.
Changes in U.S. accounting standards may adversely impact us.
The regulatory boards and government agencies that determine financial accounting standards and disclosures in the U.S., which include the FASB and the IASB (collectively, the “Boards”) and the SEC, continually change and update the financial accounting standards we must follow.
From time to time, the Boards issue ASUs that could have a material effect on our financial condition or results of operations, which in turn could also significantly impact the market price of our common stock. Such potential impacts include, without limitation, significant changes to our balance sheet, significant changes to the timing or methodology of revenue or expense recognition, or significant fluctuations in our reported results of operations, including an increase in our operating expenses or general and administrative expenses related to payroll costs, legal costs, and other out-of-pocket costs incurred in order to comply with the requirements of these ASUs.
Furthermore, in January 2018, we adopted an ASU that amended the accounting for certain equity investments. The core principle of the ASU involves the measurement of equity investments at fair value and the recognition of changes in fair value of those investments during each reporting period in net income. Since adoption, this ASU increased the volatility of our earnings, and is expected to continue introducing volatility to our results of operations, as a result of the guidance requiring us to immediately recognize in net income (i) unrealized gains and losses on our equity investments and (ii) impairments deemed not to be other than temporary under the previous guidance. The increased volatility of our earnings could adversely affect investors’ and analysts’ ability to form reliable expectations of our future performance, which could negatively impact analysts’ “buy,” “sell,” or “hold” recommendations for our common stock. Therefore, our share price could be negatively affected by causes beyond our control.
Any difficulties in the implementation of changes in accounting principles, including the ability to modify our accounting systems and to update our policies, procedures, information systems, and internal controls over financial reporting, could result in materially inaccurate financial statements, which in turn could harm our operating results or cause us to fail to meet our reporting obligations. Significant changes in new ASUs could cause fluctuations in revenue and expense recognition and materially affect our results of operations. We may also experience an increase in general and administrative expenses resulting from additional resources required for the initial implementation of such ASUs. This could adversely affect our reported results of operations, profitability, and financial statements. Additionally, the adoption of new accounting standards could also affect the calculation of our debt covenants. It cannot be assured that we will be able to work with our lenders to successfully amend our debt covenants in response to changes in accounting standards.
Security incidents through cyber attacks, cyber intrusions, or other methods could disrupt our information technology networks and related systems, cause a loss of assets or loss of data, give rise to remediation or other expenses, expose us to liability under federal and state laws, and subject us to litigation and investigations, which could result in substantial reputational damage and materially and adversely affect our business, financial condition, results of operations, and cash flows, and the market price of our common stock.
Information technology, communication networks, and related systems are essential to the operation of our business. We use these systems to manage our tenant and vendor relationships, internal communications, accounting and record-keeping systems, and many other key aspects of our business. Our operations rely on the secure processing, storage, and transmission of confidential and other information in our computer systems and networks, which also depend on the strength of our procedures and the effectiveness of our internal controls.
A security incident may occur through physical break-ins, breaches of our secure network by an unauthorized party, software vulnerabilities, malware, computer viruses, attachments to emails, employee theft or misuse, social engineering, or inadequate use of security controls. Outside parties may attempt to fraudulently induce our employees to disclose sensitive information or transfer funds via illegal electronic spamming, phishing, spoofing, or other tactics. Additionally, cyber attackers can develop and deploy malware, credential theft or guessing tools, and other malicious software programs to gain access to sensitive data or fraudulently obtain assets we hold.
We have implemented security measures to safeguard our systems and data and to manage cybersecurity risk. We monitor and develop our information technology networks and infrastructure, and invest in the development and enhancement of our controls designed to prevent, detect, respond, and mitigate the risk of unauthorized access, misuse, computer viruses, and other events that could have a security impact. We conduct periodic security awareness trainings of our employees to educate them on how to identify and alert management to phishing emails, spoofed or manipulated electronic communications, and other critical security threats. We have implemented monthly phishing tests using a variety of scenarios, including those obtained from phishing samples and intelligence sources. Additionally, we have an internal team and external partners with well-defined processes devoted to responding to threats, including reports of phishing, in real time. We have implemented internal controls around our treasury function, including enhanced payment authorization procedures, verification requirements for new vendor setup and vendor information changes, and bolstered outgoing payment notification process and account reconciliation procedures.
There can be no assurance that our actions, security measures, and controls designed to prevent, detect, or respond to intrusion; to limit access to data; to prevent loss, destruction, alteration, or exfiltration of business information; or to limit the negative impact from such attacks can provide absolute security against a security incident. A significant security incident involving our information systems or those of our tenants, vendors, software creators, cloud providers, cybersecurity service providers, or other third parties with whom we do business could lead to, among other things, the following:
•Theft of our cash, cash equivalents, or other liquid assets, including publicly traded securities;
•Interruption in the operation of our systems, which may result in operational inefficiencies and a loss of profits;
•Unauthorized access to, and destruction, loss, theft, misappropriation, or release of, proprietary, confidential, sensitive, or otherwise valuable information of ours or our tenants, and other business partners, which could be used to compete against us or for disruptive, destructive, or otherwise harmful purposes and outcomes;
•Inability to produce financial and operational data necessary to comply with rules and regulations from the SEC, the IRS, or other state and federal regulatory agencies;
•Our inability to properly monitor our compliance with the rules and regulations regarding our qualification as a REIT;
•Significant management attention and resources required to remedy any damages that result;
•Significant exposure to litigation and regulatory fines, penalties, or other sanctions;
•Violation of our lease agreements or other agreements;
•Damage to our reputation among our tenants, business partners, and investors;
•Loss of business opportunities;
•Difficulties in employee retention and recruitment; and
•Unauthorized access to, and destruction, loss, or denial of service to, the computing systems that manage our buildings.
A principal reason that we cannot provide absolute protection from security incidents is that it may not always be possible to anticipate, detect, or recognize threats to our systems, or to implement effective preventive measures against all security incidents due to, among other things, the frequent change in techniques used in cyber attacks, which may not be recognized until launched, and the wide variety of sources from which a cyber attack can originate. We may not be able to immediately address the consequences of a security incident due to a cyber attack. A successful breach of our computer systems, software, networks, or other technology assets due to a cyber attack could occur and persist for an extended period of time before being detected due to, among other things:
•The breadth of our operations and the high volume of transactions that our systems process;
•The large number of our business partners; and
•The proliferation and increasing sophistication of cyber attacks.
The extent of a particular cyber attack and the steps that we may need to take to investigate the attack may not be immediately clear. Therefore, in the event of an attack, it may take a significant amount of time before such an investigation can be completed. During an investigation, we may not necessarily know the extent of the damage incurred or how best to remediate it, and certain errors or actions could be repeated or compounded before they are discovered and remediated, which could further increase the costs and consequences of a cyber attack.
Even if we are not targeted directly, cyber attacks on the U.S. government, financial markets, financial institutions, or other businesses, including our tenants, vendors, software creators, cloud providers, cybersecurity service providers, and other third parties with whom we do business, have occurred in the past and such events could disrupt our normal business operations and networks in the future. In December 2020, hackers reportedly linked to the Russian government engaged in a massive cyber attack on the U.S. government and major U.S.-based private companies through malware planted in third-party software. As of the date of this report, the full extent of the hack remains unknown, though a number of governmental agencies and private companies, most of which are U.S.-based, have confirmed breaches.
We maintain insurance to protect ourselves against certain losses incurred in the event of a security incident or disruption of our information systems. However, we cannot be certain that the coverage is adequate to compensate for all damages that may arise. In addition, we cannot be certain that such insurance options will remain available to us in the future on commercially reasonable terms, or at all.
General Risk Factors
We face risks associated with short-term liquid investments.
From time to time, we may have significant cash balances that we invested in a variety of short-term investments that are intended to preserve principal value and maintain a high degree of liquidity while providing current income. These investments may include (either directly or indirectly) obligations (including certificates of deposit) of banks, money market funds, treasury bank securities, and other short-term securities. Investments in these securities and funds are not insured against loss of principal. Under certain circumstances, we may be required to redeem all or part of these securities or funds at less than par value. A decline in the value of our investments, or a delay or suspension of our right to redeem them, may have a material adverse effect on our results of operations or financial condition and our ability to pay our obligations as they become due.
Competition for skilled personnel could increase labor costs.
We compete with various other companies in attracting and retaining qualified and skilled personnel. We depend on our ability to attract and retain skilled management personnel who are responsible for the day-to-day operations of the Company. Competitive pressures may require that we enhance our pay and benefits package to compete effectively for such personnel. We may not be able to offset such additional costs by increasing the rates we charge tenants. If there is an increase in these costs or if we fail to attract and retain qualified and skilled personnel, our business and operating results could be adversely affected.
Failure to hedge effectively against interest rate changes may adversely affect our results of operations.
From time to time, we may enter into interest rate hedge agreements to manage some of our exposure to interest rate volatility. Interest rate hedge agreements involve risks, such as the risk that counterparties may fail to honor their obligations under these arrangements. In addition, these arrangements may not be effective in reducing our exposure to changes in interest rates. These risk factors may lead to failure to hedge effectively against changes in interest rates and therefore could adversely affect our results of operations. As of December 31, 2020, we had no interest rate hedge agreements outstanding.
Market volatility may negatively affect our business.
From time to time, the capital and credit markets experience volatility. In some cases, the markets have produced downward pressure on stock prices and credit capacity for certain issuers without regard to those issuers’ underlying financial and/or operating strength. If market disruption and volatility occur, there can be no assurance that we will not experience an adverse effect, which may be material, on our business, financial condition, and results of operations. Market disruption and volatility may adversely affect the value of the companies in which we hold equity investments, including through our non-real estate venture investment portfolio, and we may be required to recognize losses in our earnings. Disruptions, uncertainty, or volatility in the capital markets may also limit our access to capital from financial institutions on favorable terms, or altogether, and our ability to raise capital through the issuance of equity securities could be adversely affected by causes beyond our control through extraordinary disruptions in the global economy and financial systems or through other events.
Changes in financial accounting standards may adversely impact our compliance with financial debt covenants.
Our unsecured senior notes payable contain financial covenants that are calculated based on GAAP at the date the instruments were issued. However, certain debt agreements, including those related to our unsecured senior line of credit, contain financial covenants whose calculations are based on current GAAP, which is subject to future changes. Our unsecured senior line of credit agreement provides that our financial debt covenants be renegotiated in good faith to preserve the original intent of the existing financial covenant when such covenant is affected by an accounting standard change. For those debt agreements that require the renegotiation of financial covenants upon changes in accounting standards, there is no assurance that we will be successful in such negotiations or that the renegotiated covenants will not be more restrictive to us.
Extreme weather and natural or other unforeseen disasters may cause property damage or disrupt operations, which could harm our business and operating results.
We have properties located in areas that may be subject to extreme weather and natural or other disasters, including, but not limited to, earthquakes, winds, floods, hurricanes, fires, power shortages, telecommunication failures, medical epidemics, explosions, or other natural or manmade accidents or incidents. Our corporate headquarters and certain properties are located in areas of California that have historically been subject to earthquakes and wildfires. Such conditions and disastrous events may damage our properties, disrupt our operations, or adversely impact our tenants’ or third-party vendors’ operations. These events may affect our ability to operate our business and have significant negative consequences on our financial and operating results. Damage caused by these events may result in costly repairs for damaged properties or equipment, delays in the development or redevelopment of our construction projects, or interruption of our daily business operations, which may result in increased costs and decreased revenues.
We maintain insurance coverage at levels that we believe are appropriate for our business. However, we cannot be certain that the amount of coverage will be adequate to satisfy damages or losses incurred in the event of another wildfire or other natural or manmade disaster, which may lead to a material adverse effect on our properties, operations, and our business, or those of our tenants.
Failure of the U.S. federal government to manage its fiscal matters or to raise or further suspend the debt ceiling, and changes in the amount of federal debt, may negatively impact the economic environment and adversely impact our results of operations.
The Budget Control Act of 2011 provided for a reduction of $1.1 trillion of U.S. federal government discretionary spending over the succeeding decade (later extended through 2023) through a series of automatic, across-the-board spending cuts known as sequestration. Sequestration went into effect on March 1, 2013, and will remain in effect in the absence of further legislative action.
The U.S. federal government has established a limit on the level of federal debt that the U.S. federal government can have outstanding, often referred to as the debt ceiling. The U.S. Congress has authority to raise or suspend the debt ceiling and to approve the funding of U.S. federal government operations within the debt ceiling, and has done both frequently in the past, often on a relatively short-term basis. In July 2019, congressional leaders passed a two-year deal to raise the U.S. borrowing limit, which reduced the threat of default and significantly raised federal spending limits. Absent appropriate action to mitigate increasing government spending and provide fiscal discipline, the U.S. federal government may encounter similar issues that result in a partial or complete shutdown and/or default of its existing loans as a result of reaching the debt ceiling. If effective legislation to manage the debt ceiling is not enacted and the debt ceiling is reached, the federal government may stop or delay making payments on its obligations. A failure by the U.S. Congress to raise the debt limit to the extent necessary in future fiscal years would increase the risk of default by the U.S. on its obligations, the risk of a lowering of the credit rating of the U.S. federal government, and the risk of other economic dislocations. If the U.S. government fails to complete its budget process, another federal government shutdown may result. Such a failure, or the perceived risk of such a failure, could consequently have a material adverse effect on the financial markets and economic conditions in the U.S. and throughout the world.
An inability of the U.S. federal government to manage its fiscal matters, reduce the duration and scope of sequestration, or manage its debt may result in the loss of economic confidence domestically and globally, reduce investment spending, increase borrowing costs, impact availability and cost of capital, and significantly hinder or reduce economic activity. Furthermore, a failure by the U.S. federal government to enact appropriate fiscal legislation may significantly impact the national and global economic and financial environment and affect our business and the businesses of our tenants. On December 27, 2020, the U.S. federal government was able to enact an appropriations bill for the fiscal year 2021. If, however, the U.S. Congress fails to enact a budget for a given fiscal year’s government operations, it may result in a government shutdown similar to the one that took place from December 22, 2018, to January 25, 2019. The shutdown affected certain key agencies at the federal government level, including the FDA and the SEC, and resulted in partial closures of operations. It is unclear whether the U.S. federal government will fail to enact a budget in future fiscal years, and if so, it is possible another partial government shutdown may occur.
The shutdown in early 2019 had affected certain key agencies at the federal government level, including the SEC, which closed partial non-essential operations. The SEC operated limited functions to address emergency situations involving market integrity and investor protection. However, the SEC suspended key functions, such as those related to enforcement actions and review of applications for initial public offerings. Future closures of the SEC could result in uncertainty regarding regulatory actions, issuance of new or clarifications of existing rules and regulations, disruptions in the initial public offerings of companies, including those of our tenants and companies in which we hold equity investments, and investigations and enforcement actions by the SEC. During this period, the FDA and certain other science agencies temporarily shut down select non-essential operations. Also during this period, the FDA maintained only operations deemed to be essential public health-related functions and halted the acceptance of new medical product applications and routine regulatory and compliance work for medical products and certain drugs and foods during the shutdown. The long-term impacts resulting from a prolonged closure of the SEC, the FDA, and other similar agencies are uncertain and may adversely affect our business operations or our tenants and companies in which we hold equity investments. If economic conditions severely deteriorate as a result of government fiscal gridlock, our operations, or those of our tenants, could be affected, which may adversely impact our financial condition and results of operations. These risks may also impact our overall liquidity, our borrowing costs, or the market price of our common stock.
Changes in laws, regulations, and financial accounting standards may adversely affect our reported results of operations.
As a response, in large part, to perceived abuses and deficiencies in current regulations believed to have caused or exacerbated the recent global financial crisis, legislative, regulatory, and accounting standard-setting bodies around the world are engaged in an intensive, wide-ranging examination and rewriting of the laws, regulations, and accounting standards that have constituted the basic playing field of global and domestic business for several decades. In many jurisdictions, including the U.S., the legislative and regulatory response has included the extensive reorganization of existing regulatory and rule-making agencies and organizations, and the establishment of new agencies with broad powers. This reorganization has disturbed longstanding regulatory and industry relationships and established procedures.
The rule-making and administrative efforts have focused principally on the areas perceived as having contributed to the financial crisis, including banking, investment banking, securities regulation, and real estate finance, with spillover impacts on many other areas. These initiatives have created a degree of uncertainty regarding the basic rules governing the real estate industry, and many other businesses, that is unprecedented in the U.S. at least since the wave of lawmaking, regulatory reform, and government reorganization that followed the Great Depression.
The global financial crisis and the aggressive reaction of the government and accounting profession thereto have occurred against a backdrop of increasing globalization and internationalization of financial and securities regulation that began prior to the recent financial crisis. As a result of this ongoing trend, financial and investment activities previously regulated almost exclusively at a local or national level are increasingly being regulated, or at least coordinated, on an international basis, with national rule-making and standard-setting groups relinquishing varying degrees of local and national control to achieve more uniform regulation and reduce the ability of market participants to engage in regulatory arbitrage between jurisdictions. This globalization trend has continued, arguably with an increased sense of urgency and importance, since the financial crisis.
This high degree of regulatory uncertainty, coupled with considerable additional uncertainty regarding the underlying condition and prospects of global, domestic, and local economies, has created a business environment that makes business planning and projections even more uncertain than is ordinarily the case for businesses in the financial and real estate sectors.
In the commercial real estate sector in which we operate, the uncertainties posed by various initiatives of accounting standard-setting authorities to fundamentally rewrite major bodies of accounting literature constitute a significant source of uncertainty as to the basic rules of business engagement. Changes in accounting standards and requirements, including the potential requirement that U.S. public companies prepare financial statements in accordance with international accounting standards and the adoption of accounting standards likely to require the increased use of “fair value” measures, may have a significant effect on our financial results and on the results of our tenants, which would in turn have a secondary impact on us. New accounting pronouncements and interpretations of existing pronouncements are likely to continue to occur at an accelerated pace as a result of recent Congressional and regulatory actions and continuing efforts by the accounting profession itself to reform and modernize its principles and procedures.
Although we have not been as directly affected by the wave of new legislation and regulation as banks and investment banks, we may also be adversely affected by new or amended laws or regulations; by changes in federal, state, or foreign tax laws and regulations; and by changes in the interpretation or enforcement of existing laws and regulations. In the U.S., the financial crisis and continuing economic slowdown prompted a variety of legislative, regulatory, and accounting profession responses.
The federal legislative response culminated in the enactment on July 21, 2010, of the Dodd-Frank Act. The Dodd-Frank Act contains far-reaching provisions that substantially revise, or provide for the revision of, longstanding, fundamental rules governing the banking and investment banking industries and provide for the broad restructuring of the regulatory authorities in these areas. The Dodd-Frank Act has resulted in, and is expected to continue to result in, profound changes in the ground rules for financial business activities in the U.S. To a large degree, the impacts of the legislative, regulatory, and accounting reforms to date are still not clear.
The ongoing implementation of derivatives regulations could have an adverse impact on our ability to hedge risks associated with our business.
Title VII of the Dodd-Frank Act regulates derivatives transactions, which include certain instruments that we use in our risk management activities. It remains impossible at this time to predict the full effects on our hedging activities of the derivatives-related provisions of the Dodd-Frank Act and rules of the Commodity Futures Trading Commission (“CFTC”) and SEC thereunder, or the timing of such effects. While the CFTC has implemented most of its derivatives-related regulations under the Dodd-Frank Act, it has not yet adopted all of those regulations, and it has proposed revisions to certain of its existing derivatives regulations. The impact of any future new or revised CFTC derivatives regulations, or new or revised CFTC interpretations of existing regulations, is unknown, but they could result in, among other things, increases in the costs to us of swaps and other derivatives contracts, and decreases in the number and/or creditworthiness of available hedge counterparties. Furthermore, at this time, the SEC’s regulations for security-based swaps have generally not yet been implemented, and their potential impact on our ability to hedge risks cannot yet be known.
In addition, we may enter into hedging transactions with counterparties based in the EU, Canada, or other jurisdictions that, like the U.S., are in the process of implementing regulations for derivatives. Non-U.S. regulations may apply to such derivatives transactions. The potential impact of such non-U.S. regulations is not fully known and may include, among other things, increased costs for our hedging transactions.
A global financial stress, high structural unemployment levels, and other events or circumstances beyond our control may adversely affect our industry, business, results of operations, contractual commitments, and access to capital.
The COVID-19 pandemic that has taken place in 2020 across the U.S. and worldwide has precipitated widespread structural economic and financial stress. In addition, from 2008 through 2010, significant concerns over energy costs, geopolitical issues, the availability and cost of credit, the U.S. mortgage market, and a declining real estate market in the U.S. contributed to increased volatility, diminished expectations for the economy and the markets, and high levels of structural unemployment by historical standards. These factors, combined with volatile oil prices and fluctuating business and consumer confidence, precipitated a steep economic decline. Since 2011, the U.S. economy has showed significant signs of improvement, but other economies around the world, including Latin America, continue to demonstrate sluggish, stagnant, or slowing growth. Further, severe financial and structural strains on the banking and financial systems have led to significant lack of trust and confidence in the global credit and financial system. Consumers and money managers have liquidated and may liquidate equity investments, and consumers and banks have held and may hold cash and other lower-risk investments, which has resulted in significant and, in some cases, catastrophic declines in the equity capitalization of companies and failures of financial institutions. Although U.S. bank earnings and liquidity have rebounded in recent years, though tapered by the recent COVID-19 pandemic, the potential of significant future bank credit losses creates uncertainty for the lending outlook.
Further downgrades of the U.S. government’s sovereign credit rating and an economic crisis in Europe could negatively impact our liquidity, financial condition, and earnings.
Previous U.S. debt ceiling and budget deficit concerns, together with sovereign debt conditions in Europe, have increased the possibility of additional downgrades of sovereign credit ratings and economic slowdowns. There is no guarantee that future debt ceiling or federal spending legislation will not fail.
Standard & Poor’s Ratings Services lowered its long-term sovereign credit rating on the U.S. from “AAA” to “AA+” in August 2011, which was affirmed in April 2020. Although Standard & Poor’s Ratings Services maintains a stable outlook on the U.S. credit rating, further fiscal impasses within the federal government may result in future downgrades. Moody’s Investor Services, Inc. affirmed its “Aaa” long-term issuer and senior unsecured ratings in June 2020 and maintains a stable outlook on the U.S. credit rating but has warned that the U.S. fiscal strength has been deteriorating. Fitch Ratings Inc. maintains a “AAA” sovereign rating for U.S. but shifted its outlook from stable to negative in July 2020 to reflect the ongoing deterioration in the U.S. public finances and the absence of a credible fiscal consolidation plan. The impact of any further downgrades to the U.S. government’s sovereign credit rating, or its perceived creditworthiness, is inherently unpredictable and could adversely affect the U.S. and global financial markets and economic conditions.
In addition, certain European nations experienced in the recent past varying degrees of financial stress, including Greece, Ireland, Italy, Portugal, and Spain. Although these economies are continuing to recover or have already gone through a gradual recovery, we do not know whether the economic growth will be slowed by the U.K.’s leaving the EU or whether the prior sovereign financial difficulties within the EU governments will reemerge with a higher degree of negative impact to the financial markets. Market concerns over the direct and indirect exposure of European banks and insurers to these EU peripheral nations have resulted in a widening of credit spreads and increased costs of funding for some EU financial institutions. There can be no assurance that government or other measures to aid economic recovery will be effective.
These developments, and concerns over the U.S. government’s fiscal policies in general, could cause interest rates and borrowing costs to rise, which may negatively impact our ability to access the debt markets on favorable terms. In addition, the lowered credit rating could create broader financial turmoil and uncertainty, which may exert downward pressure on the market price of our common stock. Continued adverse economic conditions could have a material adverse effect on our business, financial condition, and results of operations.
Financial volatility and geopolitical instability outside of the U.S. may adversely impact the U.S. and global economies.
In recent years, as global growth has weakened and trade tensions have heightened, the devastating financial and human impacts of COVID-19 are mostly yet to be seen. Many economies, however, have already experienced financial turmoil, high unemployment, soaring inflation and interest rates, and a significant depreciation of their local currencies. Economies of developing countries like Venezuela and Argentina remain in a long-term crisis, with their current political turmoil exacerbating their economic problems and rendering a bleak near-term outlook. Policies of advanced economies have a profound effect on emerging markets, and ramifications of any trade war involving an advanced economy, like of that between the U.S. and China, could further contribute to the adverse economic and political conditions of emerging and other developed economies. In addition, there are ongoing security concerns about North Korea and Iran’s nuclear weapons and ballistic missile capabilities, uncertainty regarding North Korea and Iran’s actions, and their relations with the U.S. and the international community in general, which have created a global security issue that may adversely affect international business and economic conditions.
During 2018–2019, disputes on trade policy between the U.S. and China resulted in increased tariffs and escalating tensions between the two countries. On January 15, 2020, the two parties signed a trade deal representing the first phase of trade negotiations between the two countries. The agreement reduced certain existing tariffs, obligated China to purchase additional products from the U.S. in 2020 and 2021, and provided for stronger protection of American intellectual property and trade secrets (the “Phase One deal”). The Phase One deal has not been dismantled despite China’s purchase of products falling behind schedule and escalating tensions and sanctions between the two countries during 2020. Newly elected U.S. President Biden has stated that there are no immediate plans to cancel the Phase One deal, but the administration is expected to make changes to the U.S.-China tariff policies. Future trade disputes may result in the imposition of further tariffs or other retaliatory actions that may affect us, the industry in which we operate, or that of our tenants and vendors.
In January 2020, the U.S. imposed new sanctions on Iran after tensions escalated in a U.S. airstrike killing a top Iranian military leader and Iran retaliated with ballistic missile strikes targeted at U.S. bases located in Iraq. The sanctions targeted the construction, mining, manufacturing, and textiles sectors, which are key sectors of Iran’s economy, in an attempt to deny the Iranian government revenues derived from these activities. Tensions with Iran have continued in 2020 under U.S. President Trump, and it is not clear what, if anything, newly elected U.S. President Biden will do in his administration to ease relations between the two countries. If Iran carries out retaliatory actions against the U.S., the U.S. economy, safety, and lives of U.S. residents and businesses may be significantly impacted, resulting in financial volatility and social instability for those affected. This may include, but not be limited to, our company, tenants, employees, investors, and others located in affected communities in which we hold properties.
It is not possible to predict to what extent regional economic and political instability of emerging economies or trade conflicts may negatively impact economies around the world, including the U.S. If these macroeconomic and political issues are not managed
appropriately, they could lead to currency devaluation, sovereign debt increases, banking crises, and other financial and political turmoil and uncertainty. Continued adverse economic conditions could have a material adverse effect on our business, financial condition, and results of operations.
We are subject to risks from potential fluctuations in exchange rates between the U.S. dollar and foreign currencies.
We have properties and operations in countries where the U.S. dollar is not the local currency, and we thus are subject to international currency risk from the potential fluctuations in exchange rates between the U.S. dollar and the local currency. In particular, a significant decrease or volatility in the value of the Canadian dollar or other currencies in countries where we may have an investment could materially affect our results of operations. We may attempt to mitigate such effects by borrowing in the local foreign currency in which we invest. Any international currency gain recognized with respect to changes in exchange rates may not qualify under gross income tests that we must satisfy annually in order to qualify and maintain our status as a REIT.
Adoption of the Basel III standards and other regulatory standards affecting financial institutions may negatively impact our access to financing or affect the terms of our future financing arrangements.
In response to various financial crises and the volatility of financial markets, the Basel Committee on Banking Supervision (the “Basel Committee”) adopted the Basel III regulatory capital framework (“Basel III” or the “Basel III Standards”). The final package of Basel III reforms was approved by the G20 leaders in November 2010. In January 2013, the Basel Committee agreed to delay implementation of the Basel III Standards and expanded the scope of assets permitted to be included in certain banks’ liquidity measurements. U.S. banking regulators have elected to implement substantially all of the Basel III Standards, with implementation of Basel III having commenced in 2014 and incrementally implemented through 2020, though progress was limited during 2020 due to the impact of the COVID-19 pandemic.
Since approving the Basel III Standards, U.S. regulators also issued rules that impose upon the most systemically significant banking organizations in the U.S. supplementary leverage ratio standards (the “SLR Standards”) more stringent than those of the Basel III Standards. In addition, the Federal Reserve Board has adopted a final rule that establishes a methodology to identify whether a U.S. bank holding company is a global systemically important banking organization (“GSIB”). Any firm identified as a GSIB would be subject to a risk-based capital surcharge that is calibrated based on its systemic risk profile. Under the final rule, the capital surcharge began phasing in on January 1, 2016, and became fully effective on January 1, 2019.
On September 3, 2014, U.S. banking regulators issued a final rule to implement the Basel Committee’s liquidity coverage ratio (the “LCR”) in the U.S. (the “LCR Final Rule”). The LCR is intended to promote the short-term resilience of internationally active banking organizations to improve the banking industry’s ability to absorb shocks arising from idiosyncratic or market stress, and to improve the measurement and management of liquidity risk. The LCR Final Rule contains requirements that are in certain respects more stringent than the Basel Committee’s LCR. The LCR measures an institution’s high-quality liquid assets against its net cash outflows. Under the LCR Final Rule, the LCR transition period occurred from 2015 through 2017.
U.S. regulators have also issued and proposed rules that impose additional restrictions on the business activities of financial institutions, including their trading and investment activities. For example, with effect in April 2014, U.S. regulators adopted a final rule implementing a section of the Dodd-Frank Act that has become known as the “Volcker Rule.” The Volcker Rule generally restricts certain U.S. and foreign financial institutions from engaging in proprietary trading and from investing in sponsoring or having certain relationships with “covered funds,” which include private equity funds and hedge funds. Amendments effective in January 2020 have provided a certain level of regulatory relief, particularly pertaining to proprietary trading restrictions, by tailoring the Volker Rule’s application, simplifying certain standards and requirements, and reducing compliance burden. Additional amendments related to “covered funds” are expected. The effects of the Volcker Rule are uncertain, but it is in any event likely to curtail various banking activities, which in turn could result in uncertainties in the financial markets.
The implementation of the Basel III Standards, the SLR Standards, the GSIB capital surcharge, the LCR Final Rule, the Volcker Rule, and other similar rules and regulations could cause an increase in capital requirements for, and place other financial constraints on, both U.S. and foreign financial institutions from which we borrow, which may negatively impact our access to financing or affect the terms of our future financing arrangements.
Changes in the system for establishing U.S. accounting standards may result in adverse fluctuations in our reported asset and liability values and earnings and may materially and adversely affect our reported results of operations.
Accounting for public companies in the U.S. has historically been conducted in accordance with GAAP as established by the FASB, an independent body whose standards are recognized by the SEC as authoritative for U.S. publicly held companies. The IASB is a London-based independent board established in 2001 and charged with the development of IFRS. IFRS generally reflects accounting practices that prevail in Europe and in developed nations in other parts of the world.
IFRS differs in material respects from GAAP. Among other things, IFRS has historically relied more on “fair value” models of accounting for assets and liabilities than GAAP. “Fair value” models are based on periodic revaluation of assets and liabilities, often
resulting in fluctuations in such values as compared to GAAP, which relies more frequently on historical cost as the basis for asset and liability valuation.
The SEC released a final report on its IFRS work plan, which indicates the SEC still needs to analyze and consider whether IFRS should be incorporated into the U.S. financial reporting system. It is unclear at this time how and when the SEC will propose that GAAP and IFRS be harmonized if the decision to incorporate is adopted. In addition, incorporating a new method of accounting and adopting IFRS will be a complex undertaking. We may need to develop new systems and controls based on the principles of IFRS. Since these are new endeavors, and the precise requirements of the pronouncements ultimately adopted are not now known, the magnitude of costs associated with this conversion is uncertain.
We are currently evaluating the impact of the adoption of IFRS on our financial condition and results of operations. Such evaluation cannot be completed, however, without more clarity regarding the specific proposed standards that will be adopted. Until there is more certainty with respect to the standards to be adopted, prospective investors should consider that our conversion to IFRS could have a material adverse impact on our reported results of operations.
Significant developments stemming from recent international trade developments or the U.K.’s referendum on membership in the EU could have a material adverse effect on us.
During his administration, U.S. President Trump imposed significant increases on tariffs on goods imported into the U.S., particularly from China, Mexico, and Canada. The U.S., Mexico, and Canada negotiated and reached an agreement for a new United States-Mexico-Canada Agreement (USMCA), which replaced the North American Free Trade Agreement. Newly elected U.S. President Biden has committed to focus on domestic investment in jobs and education before entering into any new trade deals. Any changes in U.S. social, political, regulatory, and economic conditions or laws and policies governing the healthcare system and drug prices, foreign trade, manufacturing, and development and investment in the territories and countries where we or our tenants operate could adversely affect our operating results and our business.
On January 31, 2020, the U.K. officially withdrew from the EU, but a transitional period was extended through December 31, 2020, to allow for businesses and individuals to adjust to its changes, during which all EU regulations continued to apply to the U.K. A Trade and Cooperation Agreement (“TCA”) was agreed upon by the EU and the U.K. on December 24, 2020, and ratified by the European Council and the U.K. Parliament ahead of the end of the transition period on December 31, 2020. While the TCA has provisions for how both parties will trade, live, and work with one another, financial services are not covered in any detail in the TCA. The nature of much of the future economic and political relationship between the EU and U.K. remains uncertain, and there is no guarantee that both parties will be able to adhere to the terms of the deal effectively. The exit of the U.K. from membership of the EU has created political and economic uncertainty, particularly in the U.K. and the EU, and this uncertainty may last for years. Our business could be affected during this period of uncertainty, and perhaps longer, by the impact of the U.K.’s exit from the EU. In addition, our business could be negatively affected by new trade agreements between the U.K. and other countries, including the U.S., and by the possible imposition of trade or other regulatory barriers in the U.K. These possible negative impacts, and others resulting from the U.K.’s withdrawal from the EU, may adversely affect our operating results and our tenants’ businesses.
Social, political, and economic instability, unrest, and other circumstances beyond our control could adversely affect our business operations.
Our business may be adversely affected by social, political, and economic instability, unrest, or disruption in a geographic region in which we operate, regardless of cause, including legal, regulatory, and policy changes by a new presidential administration in the U.S., protests, demonstrations, strikes, riots, civil disturbance, disobedience, insurrection, or social and other political unrest.
Such events may result in restrictions, curfews, or other actions and give rise to significant changes in regional and global economic conditions and cycles, which may adversely affect our financial condition and operations. In 2020, there were protests in cities throughout the U.S. as well as globally, including in Hong Kong, in connection with civil rights, liberties, and social and governmental reform. While protests have been peaceful in many locations, looting, vandalism, and fires have occurred in cities such as Seattle, Portland, Los Angeles, Washington, D.C., New York City, and Minneapolis that have led to the imposition of mandatory curfews and, in some locations, deployment of the U.S. National Guard. Government actions in an effort to protect people and property, including curfews and restrictions on business operations, may disrupt operations, harm perceptions of personal well-being, and increase the need for additional expenditures on security resources. In addition, action resulting from such social or political unrest may pose significant risks to our personnel, facilities, and operations. The effect and duration of demonstrations, protests, or other factors is uncertain, and we cannot ensure there will not be further political or social unrest in the future or that there will not be other events that could lead to social, political, and economic disruptions. If such events or disruptions persist for a prolonged period of time, our overall business and results of operations may be adversely affected.
In addition, a new U.S. President, Joseph R. Biden, was elected in November 2020. On January 6, 2021, a group of
supporters of President Trump, some of whom were armed and violent, illegally stormed and vandalized the U.S. Capitol as a response to false claims of widespread voter fraud and encouragement from U.S. President Trump to protest the Congressional certification of the U.S. presidential election results. Several people were killed in the incursion. Following the deadly event at the Capitol, on January 13, 2021, the House of Representatives voted to impeach U.S. President Trump for incitement of insurrection. On January
20, 2021, the presidential inauguration of President Biden was carried out with increased security measures but without further major
incident. The aftermath of the November 2020 presidential election, including the January 6, 2021, violent disruption at the Capitol,
has left the U.S. in what many consider to be an extremely heightened state of political and social tension, and it is unclear whether
this tension will dissipate or intensify in coming months and what resulting impacts may occur to adversely affect our business operations or the safety of our employees, our tenants, and the communities in which we operate.
Changes in federal policy, including tax policies, and at regulatory agencies occur over time through policy and personnel changes following elections, which lead to changes involving the level of oversight and focus on certain industries and corporate entities. The nature, timing, and economic and political effects of potential changes to the current legal and regulatory frameworks affecting the life science, technology, and agtech industries, as well as the real estate industry in general, remain highly uncertain. For example, any proposals to make changes related to U.S. tax law, such as those involving Section 1031 Exchanges, may have a material adverse effect on our future business, financial condition, results of operations, and growth prospects. From time to time, we dispose of properties in transactions qualified as Section 1031 Exchanges. If certain proposed changes were ultimately effected and the laws surrounding Section 1031 Exchanges amended or repealed, we may not be able to dispose of properties on a tax-deferred basis. In such a case, our earnings and profits and our taxable income would increase, which could increase dividend income and reduce the return of capital to our stockholders. As a result, we may be required to pay additional dividends to stockholders, or if we do not pay additional dividends, our corporate income tax liability could increase and we may be subject to interest and penalties.
Terrorist attacks may have an adverse impact on our business and operating results and could decrease the value of our assets.
Terrorist attacks such as those that took place on September 11, 2001, could have a material adverse impact on our business, our operating results, and the market price of our common stock. Future foreign or domestic terrorist attacks may result in declining economic activity, which could reduce the demand for, and the value of, our properties. To the extent that any future foreign or domestic terrorist attacks impact our tenants, their businesses similarly could be adversely affected, including their ability to continue to honor their lease obligations.
Our business and operations would suffer in the event of information technology system failures.
Despite system redundancy, the implementation of security measures, and the existence of a disaster recovery plan for our internal information technology systems, our systems are vulnerable to damages from any number of sources, including computer viruses, unauthorized access, energy blackouts, natural disasters, terrorism, war, and telecommunications failures. Any system failure or accident that causes interruptions in our operations could result in a material disruption to our business. We may also incur additional significant costs to remedy damages caused by such disruptions.
Any or all of the foregoing could have a material adverse effect on our financial condition, results of operations, and cash flows, or the market price of our common stock. Additional risks and uncertainties not currently known to us, or that we presently deem to be immaterial, may also have potential to materially adversely affect our business, financial condition, and results of operations.
ITEM 1B. UNRESOLVED STAFF COMMENTS
None.
General
As of December 31, 2020, we had 338 properties in North America containing approximately 35.2 million RSF of operating properties and development and redevelopment of new Class A properties (under construction), including 40 properties that are held by consolidated real estate joint ventures and six properties that are held by unconsolidated real estate joint ventures. Refer to the definitions of “Annual rental revenue” and “Operating statistics” in the “Non-GAAP measures and definitions” section under “Item 7. Management’s discussion and analysis of financial condition and results of operations” in this annual report on Form 10-K for a description of the basis used to compute the aforementioned measures. The occupancy percentage of our operating properties in North America was 94.6% as of December 31, 2020. The exteriors of our properties typically resemble traditional office properties, but the interior infrastructures are designed to accommodate the needs of life science, technology, and agtech tenants. These improvements typically are generic rather than specific to a particular tenant. As a result, we believe that the improvements have long-term value and utility and are usable by a wide range of tenants. Improvements to our properties typically include:
•Reinforced concrete floors;
•Upgraded roof loading capacity;
•Increased floor-to-ceiling heights;
•Heavy-duty HVAC systems;
•Enhanced environmental control technology;
•Significantly upgraded electrical, gas, and plumbing infrastructure; and
•Laboratory benches.
As of December 31, 2020, we held a fee simple interest in each of our properties, with the exception of 36 properties in North America that accounted for approximately 11% of our total number of properties. Of these 36 properties, we held 16 properties in the Greater Boston market, 13 properties in the San Francisco market, two properties in the New York City market, two properties in the Seattle market, one property in the Maryland market, and two properties in the Research Triangle market pursuant to ground leasehold interests. During the year ended December 31, 2020, our ground lease rental expense aggregated 1.4% as a percentage of net operating income. Refer to further discussion in our consolidated financial statements and notes thereto in “Item 15. Exhibits and financial statement schedules” in this annual report on Form 10-K.
As of December 31, 2020, we had 909 leases with a total of 670 tenants, and 167, or 49%, of our 338 properties were single-tenant properties. Leases in our multi-tenant buildings typically have initial terms of four to 11 years, while leases in our single-tenant buildings typically have initial terms of 11 to 21 years. As of December 31, 2020:
•Investment-grade or publicly traded large cap tenants represented 55% of our total annual rental revenue;
•Approximately 94% of our leases (on an RSF basis) contained effective annual rent escalations that were either fixed (generally ranging from approximately 3.0% to 3.5%) or indexed based on a consumer price index or other index;
•Approximately 94% of our leases (on an RSF basis) were triple net leases, which require tenants to pay substantially all real estate taxes, insurance, utilities, repairs and maintenance, common area expenses, and other operating expenses (including increases thereto) in addition to base rent; and
•Approximately 93% of our leases (on an RSF basis) provided for the recapture of capital expenditures (such as HVAC maintenance and/or replacement, roof replacement, and parking lot resurfacing) that we believe would typically be borne by the landlord in traditional office leases.
Our leases also typically give us the right to review and approve tenant alterations to the property. Generally, tenant-installed improvements to the properties are reusable generic improvements and remain our property after termination of the lease at our election. However, we are permitted under the terms of most of our leases to require that the tenant, at its expense, remove certain non-generic improvements and restore the premises to their original condition.
Locations of properties
The locations of our properties are diversified among a number of life science, technology, and agtech cluster markets. The following table sets forth the total RSF, number of properties, and annual rental revenue in effect as of December 31, 2020, in each of our markets in North America (dollars in thousands, except per RSF amounts):
| | | | | | | | | | | | | | | | | | | | | | | | | | | | | | | | | | | | | | | | | | | | | | | | | | | | | | | | |
| | RSF | | Number of Properties | | Annual Rental Revenue |
Market | | Operating | | Development | | Redevelopment | | Total | | % of Total | | | Total | | % of Total | | Per RSF |
Greater Boston | | 8,454,396 | | | — | | | 296,489 | | | 8,750,885 | | | 25 | % | | 72 | | | $ | 507,459 | | | 36 | % | | $ | 61.20 | |
San Francisco | | 7,495,390 | | | 744,715 | | | 92,147 | | | 8,332,252 | | | 24 | | | 61 | | | 362,262 | | | 25 | | | 57.87 | |
New York City | | 1,145,296 | | | — | | | 122,382 | | | 1,267,678 | | | 3 | | | 5 | | | 81,185 | | | 6 | | | 73.68 | |
San Diego | | 6,367,526 | | | 146,456 | | | 79,945 | | | 6,593,927 | | | 19 | | | 80 | | | 233,128 | | | 16 | | | 39.14 | |
Seattle | | 1,747,332 | | | 100,086 | | | 213,976 | | | 2,061,394 | | | 6 | | | 22 | | | 81,477 | | | 6 | | | 48.59 | |
Maryland | | 2,821,574 | | | 261,096 | | | 169,420 | | | 3,252,090 | | | 9 | | | 44 | | | 80,429 | | | 6 | | | 29.97 | |
Research Triangle | | 2,810,670 | | | 410,000 | | | 652,381 | | | 3,873,051 | | | 11 | | | 35 | | | 61,354 | | | 4 | | | 24.38 | |
Canada | | 256,967 | | | — | | | — | | | 256,967 | | | 1 | | | 3 | | | 4,870 | | | — | | | 23.16 | |
| Non-cluster/other markets | | 549,479 | | | — | | | — | | | 549,479 | | | 1 | | | 12 | | | 10,608 | | | 1 | | | 36.64 | |
Properties held for sale | | 225,849 | | | — | | | — | | | 225,849 | | | 1 | | | 4 | | | 6,257 | | | — | | | N/A |
North America | | 31,874,479 | | | 1,662,353 | | | 1,626,740 | | | 35,163,572 | | | 100 | % | | 338 | | | $ | 1,429,029 | | | 100 | % | | $ | 49.08 | |
| | | | 3,289,093 | | | | | | | | | | | | |
Summary of occupancy percentages in North America
The following table sets forth the occupancy percentages for our operating properties and our operating and redevelopment properties in each of our North America markets, excluding properties held for sale, as of the following dates:
| | | | | | | | | | | | | | | | | | | | | | | | | | | | | | | | | | | | | | |
| | | Operating Properties | | Operating and Redevelopment Properties |
| Market | | 12/31/20 | | 12/31/19 | | 12/31/18 | | 12/31/20 | | 12/31/19 | | 12/31/18 |
| Greater Boston | | 98.1 | % | | 99.1 | % | | 98.7 | % | | 94.8 | % | | 97.1 | % | | 98.2 | % |
| San Francisco | | 95.8 | | (1) | 98.3 | | | 100.0 | | | 94.7 | | | 93.6 | | | 96.2 | |
| New York City | | 97.3 | | | 99.2 | | | 98.3 | | | 87.8 | | | 88.1 | | | 87.3 | |
| San Diego | | 93.5 | | (1) | 92.3 | | | 94.7 | | | 92.4 | | | 92.3 | | | 94.7 | |
| Seattle | | 96.0 | | | 98.7 | | | 97.7 | | | 85.5 | | | 98.7 | | | 97.7 | |
| Maryland | | 96.1 | | | 96.7 | | | 96.8 | | | 90.6 | | | 95.2 | | | 94.7 | |
| Research Triangle | | 89.6 | | (1) | 96.5 | | | 95.4 | | | 72.7 | | | 96.5 | | | 85.9 | |
| Subtotal | | 95.5 | | | 97.0 | | | 97.6 | | | 90.7 | | | 94.6 | | | 95.3 | |
| Canada | | 81.8 | | | 93.7 | | | 95.2 | | | 81.8 | | | 93.7 | | | 95.2 | |
| Non-cluster/other markets | | 52.7 | | | 80.1 | | | 79.0 | | | 52.7 | | | 80.1 | | | 79.0 | |
| North America | | 94.6 | % | (1) | 96.8 | % | | 97.3 | % | | 90.0 | % | | 94.4 | % | | 95.1 | % |
(1)Includes 970,199 RSF, or 3.1%, of vacancy in our North America markets, representing lease-up opportunities that will contribute to growth in cash flows at recently acquired properties (noted below). Excluding these acquired vacancies, occupancy of operating properties in North America was 97.7% as of December 31, 2020. The following table provides vacancy detail for our recent acquisitions:
| | | | | | | | | | | | | | | | | | | | | | | | | | | | | | | | | | |
| | | | As of December 31, 2020 | | |
| | | | Vacant | | Occupancy Impact | | | | |
| Property | | Market/Submarket | | RSF | | Region | | Consolidated | | | | | | |
Alexandria Center® for Life Science – Durham | | Research Triangle/Research Triangle | | 251,465 | | | 8.9 | % | | 0.8 | % | | | | | | |
| 601, 611, and 651 Gateway Boulevard | | San Francisco/South San Francisco | | 199,895 | | | 2.7 | % | | 0.6 | | | | | | | |
| SD Tech by Alexandria | | San Diego/Sorrento Mesa | | 71,462 | | | 1.1 | % | | 0.2 | | | | | | | |
| Other acquisitions | | Various | | 447,377 | | | N/A | | 1.5 | | | | | | | |
| | | | 970,199 | | | | | 3.1 | % | | | | | | |
| | | | | | |
Refer to the “Non-GAAP measures and definitions” section under Item 7 in this annual report on Form 10-K for additional information.
Top 20 tenants
85% of Top 20 Annual Rental Revenue From Investment-Grade
or Publicly Traded Large Cap Tenants(1)
Our properties are leased to a high-quality and diverse group of tenants, with no individual tenant accounting for more than 3.7% of our annual rental revenue in effect as of December 31, 2020. The following table sets forth information regarding leases with our 20 largest tenants in North America based upon annual rental revenue in effect as of December 31, 2020 (dollars in thousands, except average market cap):
| | | | | | | | | | | | | | | | | | | | | | | | | | | | | | | | | | | | | | | | | | | | | | | | | | | | | | | | | | | | | | | | | | | | | | | | | | |
| | | | Remaining Lease Term(1) (in Years) | | | Aggregate
RSF | | | | Annual Rental Revenue(1) | | | Percentage of Aggregate Annual Rental Revenue(1) | | Investment-Grade Credit Ratings | | Average Market Cap(1) (in billions) | |
| | | | | | | | | | | | | |
| | Tenant | | | | | | | | | | Moody’s | | S&P | | |
| 1 | | | Bristol-Myers Squibb Company | | | 7.7 | | | | | 896,867 | | | | | $ | 52,460 | | | | 3.7 | % | | | A2 | | A+ | | $ | 137.9 | | |
| 2 | | | Takeda Pharmaceutical Company Ltd. | | | 8.6 | | | | | 606,249 | | | | | 39,342 | | | | 2.8 | | | | Baa2 | | BBB+ | | $ | 56.7 | | |
| 3 | | | Facebook, Inc. | | | 11.0 | | | | | 903,786 | | | | | 38,899 | | | | 2.7 | | | | — | | — | | $ | 668.4 | | |
| 4 | | | Illumina, Inc. | | | 9.6 | | | | | 891,495 | | | | | 35,907 | | | | 2.5 | | | | — | | BBB | | $ | 47.7 | | |
| 5 | | | Sanofi | | | 7.5 | | | | | 494,693 | | | | | 33,868 | | | | 2.4 | | | | A1 | | AA | | $ | 124.0 | | |
| 6 | | | Eli Lilly and Company | | | 8.5 | | | | | 531,784 | | | | | 33,527 | | | | 2.3 | | | | A2 | | A+ | | $ | 142.4 | | |
| 7 | | | Moderna, Inc. | | | 11.4 | | | | | 615,458 | | | | | 32,147 | | | | 2.2 | | | | — | | — | | $ | 24.1 | | |
| 8 | | | Novartis AG | | | 7.6 | | | | | 423,914 | | | | | 30,101 | | | | 2.1 | | | | A1 | | AA- | | $ | 217.7 | | |
| 9 | | | Uber Technologies, Inc. | | | 61.9 | | (2) | | | 1,009,188 | | | | | 27,379 | | | | 1.9 | | | | — | | — | | $ | 62.3 | | |
| 10 | | | Roche | | | 2.7 | | (3) | | | 649,482 | | | | | 24,129 | | | | 1.7 | | | | Aa3 | | AA | | $ | 295.3 | | |
| 11 | | | bluebird bio, Inc. | | | 6.4 | | | | | 312,805 | | | | | 23,142 | | | | 1.6 | | | | — | | — | | $ | 3.7 | | |
| 12 | | | Maxar Technologies | | | 4.5 | | | | | 478,000 | | | | | 21,577 | | | | 1.5 | | | | — | | — | | $ | 1.2 | | |
| 13 | | | Massachusetts Institute of Technology | | | 8.0 | | | | | 257,626 | | | | | 21,145 | | | | 1.5 | | | | Aaa | | AAA | | $ | — | | |
| 14 | | | Jazz Pharmaceuticals, Inc. | | | 9.7 | | | | | 198,041 | | | | | 20,003 | | | | 1.4 | | | | — | | — | | $ | 7.2 | | |
| 15 | | | New York University | | | 10.7 | | | | | 204,691 | | | | | 19,531 | | | | 1.4 | | | | Aa2 | | AA- | | $ | — | | |
| 16 | | | Merck & Co., Inc. | | | 13.4 | | | | | 311,015 | | | | | 19,392 | | | | 1.4 | | | | A1 | | AA- | | $ | 204.9 | | |
| 17 | | | Pfizer Inc. | | | 4.2 | | | | | 416,979 | | | | | 17,762 | | | | 1.2 | | | | A2 | | A+ | | $ | 203.2 | | |
| 18 | | | Amgen Inc. | | | 3.3 | | | | | 407,369 | | | | | 16,838 | | | | 1.2 | | | | Baa1 | | A- | | $ | 135.9 | | |
| 19 | | | United States Government | | | 6.8 | | | | | 284,777 | | | | | 16,601 | | | | 1.2 | | | | Aaa | | AA+ | | $ | — | | |
| 20 | | | athenahealth, Inc. | | | 12.4 | | | | | 333,956 | | | | | 15,413 | | | | 1.1 | | | | — | | — | | $ | — | | |
| | Total/weighted average | | | 11.0 | | (2) | | | 10,228,175 | | | | | $ | 539,163 | | | | 37.8 | % | | | | | | | | |
Annual rental revenue and RSF include 100% of each property managed by us in North America.
(1)Based on aggregate annual rental revenue in effect as of December 31, 2020. Refer to the definitions of “Annual rental revenue” and “Investment-grade or publicly traded large cap tenants” in the “Non-GAAP measures and definitions” section under Item 7 in this annual report on Form 10-K for additional information about our methodology on annual rental revenue from unconsolidated real estate joint ventures and average market capitalization.
(2)Includes (i) ground leases for land at 1455 and 1515 Third Street (two buildings aggregating 422,980 RSF) and (ii) leases at 1655 and 1725 Third Street (two buildings aggregating 586,208 RSF) owned by our unconsolidated joint venture in which we have an ownership interest of 10%. Annual rental revenue is presented using 100% of the annual rental revenue of our consolidated properties and our share of annual rental revenue for our unconsolidated real estate joint ventures. Refer to footnote 1 for additional details. Excluding the ground lease, the weighted-average remaining lease term for our top 20 tenants was 8.4 years as of December 31, 2020.
(3)Includes 197,787 RSF expiring in 2022 at our recently acquired property at 651 Gateway Boulevard in our South San Francisco submarket. Upon expiration of the lease, 651 Gateway Boulevard will be redeveloped into a Class A office/laboratory building. Excluding this 197,787 RSF, the weighted-average remaining term of space occupied by Roche is 3.1 years.
| | | | | | | | |
Long-Duration Cash Flows From High-Quality, Diverse, and
Innovative Tenants |
| | |
Investment-Grade or
Publicly Traded Large Cap Tenants | | Long-Duration Lease Terms |
|
| | |
| 55% | | 7.6 Years |
| of ARE’s | | Weighted-Average |
Annual Rental Revenue(1) | | Remaining Term(2) |
| | |
| Tenant Mix |
|
|
|
|
|
Percentage of ARE’s Annual Rental Revenue(1) |
(1)Represents annual rental revenue in effect as of December 31, 2020. Refer to the “Non-GAAP measures and definitions” section under Item 7 in this annual report on Form 10-K for additional information.
(2)Based on aggregate annual rental revenue in effect as of December 31, 2020. Refer to definition of “Annual rental revenue” in the “Non-GAAP measures and definitions” section under Item 7 in this annual report on Form 10-K for our methodology on annual rental revenue for unconsolidated real estate joint ventures.
(3)Represents annual rental revenue currently generated from office space that is targeted for a future change in use. The weighted-average remaining term of these leases is 3.3 years.
(4)Represents annual rental revenue from publicly traded tenants with an average daily market capitalization greater than $200 billion for the twelve months ended December 31, 2020.
(5)Annual rental revenues from our other tenants, aggregating 3.0%, comprise 2.5% of annual rental revenue from technology, professional services, finance, telecommunications, and construction/real estate companies and only 0.5% from retail-related tenants.
| | | | | |
High-Quality Cash Flows From High Quality Tenants and
Class A Properties in AAA Locations |
| |
Industry-Leading
Tenant Roster | AAA Locations |
| |
| 85% |
of ARE’s Top 20
Annual Rental Revenue(1) From Investment-Grade or Publicly Traded Large Cap Tenants |
| Percentage of ARE’s Annual Rental Revenue(1) |
| |
|
|
Solid Historical
Occupancy(2) | Occupancy Across Key Locations(3) |
| |
| 96% |
| Over 10 Years |
(1)Represents annual rental revenue in effect as of December 31, 2020. Refer to the “Non-GAAP measures and definitions” section under Item 7 in this annual report on Form 10-K for additional information.
(2)Represents average occupancy of operating properties in North America as of each December 31 for the last 10 years.
(3)As of December 31, 2020.
(4)Refer to the “Summary of occupancy percentages in North America” section within this Item 2 for additional information on vacancy at acquired properties.
The following table provides certain information about our properties as of December 31, 2020 (dollars in thousands):
| | | | | | | | | | | | | | | | | | | | | | | | | | | | | | | | | | | | | | | | | | | | | | | | | | | | | | | | | | | |
| | | | | | | | | | | | | | | | Occupancy Percentage | |
| | | | RSF | | Number of Properties | | Annual Rental Revenue | | |
| | | | | | | Operating | | Operating and Redevelopment | |
Market / Submarket / Address | | Operating | | Development | | Redevelopment | | Total | | | | | |
| Greater Boston | | | | | | | | | | | | | | | | | |
| Cambridge/Inner Suburbs | | | | | | | | | | | | | | | | | |
| | Alexandria Center® at Kendall Square | | 2,365,487 | | | — | | | — | | | 2,365,487 | | | 10 | | $ | 168,794 | | | 98.9 | % | | 98.9 | % | |
| | 50, 60, 75/125(1), 100, and 225(1) Binney Street, 161 and 215 First Street, 150 Second Street, 300 Third Street, and 11 Hurley Street | | | | | | | | | | | | | | | | | |
| | Alexandria Technology Square® | | 1,181,635 | | | — | | | — | | | 1,181,635 | | | 7 | | 101,943 | | | 99.7 | | | 99.7 | | |
| | 100, 200, 300, 400, 500, 600, and 700 Technology Square | | | | | | | | | | | | | | | | | |
| | The Arsenal on the Charles | | 539,799 | | | — | | | 296,489 | | | 836,288 | | | 11 | | 21,914 | | | 100.0 | | | 64.5 | | |
| | 311, 321, and 343 Arsenal Street, 300 and 400 North Beacon Street,
1, 2, and 3 Kingsbury Avenue, and 100, 200, and 400 Talcott Avenue | | | | | | | | | | | | | | | | | |
| | Alexandria Center® at One Kendall Square | | 815,156 | | | — | | | — | | | 815,156 | | | 10 | | 67,853 | | | 96.8 | | | 96.8 | | |
| | One Kendall Square – Buildings 100, 200, 300, 400, 500, 600/700, 1400, 1800, 2000, and 399 Binney Street | | | | | | | | | | | | | | | | | |
| | 480 and 500 Arsenal Street | | 234,260 | | | — | | | — | | | 234,260 | | | 2 | | 9,769 | | | 86.6 | | | 86.6 | | |
| | 640 Memorial Drive | | 225,504 | | | — | | | — | | | 225,504 | | | 1 | | 13,860 | | | 100.0 | | | 100.0 | | |
| | 780 and 790 Memorial Drive | | 99,658 | | | — | | | — | | | 99,658 | | | 2 | | 8,292 | | | 100.0 | | | 100.0 | | |
| | 167 Sidney Street and 99 Erie Street | | 54,549 | | | — | | | — | | | 54,549 | | | 2 | | 4,025 | | | 100.0 | | | 100.0 | | |
| | 79/96 13th Street (Charlestown Navy Yard) | | 25,309 | | | — | | | — | | | 25,309 | | | 1 | | 620 | | | 100.0 | | | 100.0 | | |
| | Cambridge/Inner Suburbs | | 5,541,357 | | | — | | | 296,489 | | | 5,837,846 | | | 46 | | 397,070 | | | 98.4 | | | 93.4 | | |
| Seaport Innovation District | | | | | | | | | | | | | | | | | |
| | 380 and 420 E Street | | 195,506 | | | — | | | — | | | 195,506 | | | 2 | | 3,522 | | | 100.0 | | | 100.0 | | |
| | 5 Necco Street | | 87,163 | | | — | | | — | | | 87,163 | | | 1 | | 4,672 | | | 86.6 | | | 86.6 | | |
| | Seaport Innovation District | | 282,669 | | | — | | | — | | | 282,669 | | | 3 | | 8,194 | | | 95.9 | | | 95.9 | | |
| Route 128 | | | | | | | | | | | | | | | | | |
| | Reservoir Woods | | 515,273 | | | — | | | — | | | 515,273 | | | 3 | | 22,004 | | | 100.0 | | | 100.0 | | |
| | 40, 50, and 60 Sylvan Road | | | | | | | | | | | | | | | | | |
| | 275 Grove Street | | 509,702 | | | — | | | — | | | 509,702 | | | 1 | | 22,577 | | | 87.4 | | | 87.4 | | |
| | One Upland Road and 100 Tech Drive | | 443,513 | | | — | | | — | | | 443,513 | | | 2 | | 18,008 | | | 100.0 | | | 100.0 | | |
| | Alexandria Park at 128 | | 343,882 | | | — | | | — | | | 343,882 | | | 8 | | 12,544 | | | 100.0 | | | 100.0 | | |
| | 3 and 6/8 Preston Court, 29, 35, and 44 Hartwell Avenue, 35 and 45/47 Wiggins Avenue, and 60 Westview Street | | | | | | | | | | | | | | | | | |
| | 225, 266, and 275 Second Avenue | | 317,617 | | | — | | | — | | | 317,617 | | | 3 | | 14,073 | | | 100.0 | | | 100.0 | | |
| | 19 Presidential Way | | 144,892 | | | — | | | — | | | 144,892 | | | 1 | | 5,174 | | | 99.8 | | | 99.8 | | |
| | 100 Beaver Street | | 82,330 | | | — | | | — | | | 82,330 | | | 1 | | 4,254 | | | 100.0 | | | 100.0 | | |
| | 285 Bear Hill Road | | 26,270 | | | — | | | — | | | 26,270 | | | 1 | | 1,167 | | | 100.0 | | | 100.0 | | |
| | Route 128 | | 2,383,479 | | | — | | | — | | | 2,383,479 | | | 20 | | 99,801 | | | 97.3 | | | 97.3 | | |
| Route 495 | | | | | | | | | | | | | | | | | |
| | 111 and 130 Forbes Boulevard | | 155,846 | | | — | | | — | | | 155,846 | | | 2 | | 1,745 | | | 100.0 | | | 100.0 | | |
| | 20 Walkup Drive | | 91,045 | | | — | | | — | | | 91,045 | | | 1 | | 649 | | | 100.0 | | | 100.0 | | |
| | Route 495 | | 246,891 | | | — | | | — | | | 246,891 | | | 3 | | 2,394 | | | 100.0 | | | 100.0 | | |
| | Greater Boston | | 8,454,396 | | | — | | | 296,489 | | | 8,750,885 | | | 72 | | $ | 507,459 | | | 98.1 | % | | 94.8 | % | |
| |
(1) We own a partial interest in this property through a real estate joint venture. Refer to the “Joint venture financial information” section under Item 7 in this annual report in Form 10-K for additional details. |
Property listing (continued)
| | | | | | | | | | | | | | | | | | | | | | | | | | | | | | | | | | | | | | | | | | | | | | | | | | | | | | | | | | | |
| | | | | | | | | | | | | | | | Occupancy Percentage | |
| | | | RSF | | Number of Properties | | Annual Rental Revenue | | |
| | | | | | | Operating | | Operating and Redevelopment | |
Market / Submarket / Address | | Operating | | Development | | Redevelopment | | Total | | | | | |
| | | | | | | | | | | | | | | | | | | |
| San Francisco | | | | | | | | | | | | | | | | | |
| Mission Bay | | | | | | | | | | | | | | | | | |
| | Alexandria Center® for Science and Technology – Mission Bay | | 1,990,262 | | | — | | | — | | | 1,990,262 | | | 9 | | $ | 90,364 | | | 99.9 | % | | 99.9 | % | |
| | 1455, 1515, 1655(1), and 1725(1) Third Street, 409 and 499 Illinois Street(1), 1500(1) and 1700 Owens Street, and 455 Mission Bay Boulevard South | | | | | | | | | | | | | | | | | |
| | Mission Bay | | 1,990,262 | | | — | | | — | | | 1,990,262 | | | 9 | | 90,364 | | | 99.9 | | | 99.9 | | |
| | | | | | | | | | | | | | | | | | |
| | | | | | | | | | | | | | | | | | | |
| | | | | | | | | | | | | | | | | | | |
| South San Francisco | | | | | | | | | | | | | | | | | |
| | Alexandria Technology Center® – Gateway | | 1,412,480 | | | — | | | — | | | 1,412,480 | | | 11 | | 54,517 | | | 81.5 | | | 81.5 | | |
| | 600, 601(1), 611(1), 630, 650, 651(1), 681(1), 685(1), 701(1), 901, and 951 Gateway Boulevard | | | | | | | | | | | | | | | | | |
| | 213, 249, 259, 269, and 279 East Grand Avenue | | 919,704 | | | — | | | — | | | 919,704 | | | 5 | | 48,744 | | | 100.0 | | | 100.0 | | |
| | 201 Haskins Way | | — | | | 315,000 | | | — | | | 315,000 | | | 1 | | — | | | N/A | | N/A | |
| | 400 and 450 East Jamie Court | | 163,035 | | | — | | | — | | | 163,035 | | | 2 | | 9,549 | | | 100.0 | | | 100.0 | | |
| | 500 Forbes Boulevard(1) | | 155,685 | | | — | | | — | | | 155,685 | | | 1 | | 6,619 | | | 100.0 | | | 100.0 | | |
| | 7000 Shoreline Court | | 136,395 | | | — | | | — | | | 136,395 | | | 1 | | 8,547 | | | 99.4 | | | 99.4 | | |
| | 341 and 343 Oyster Point Boulevard | | 107,960 | | | — | | | — | | | 107,960 | | | 2 | | 5,767 | | | 100.0 | | | 100.0 | | |
| | 849/863 Mitten Road/866 Malcolm Road | | 103,857 | | | — | | | — | | | 103,857 | | | 1 | | 5,086 | | | 100.0 | | | 100.0 | | |
| | South San Francisco | | 2,999,116 | | | 315,000 | | | — | | | 3,314,116 | | | 24 | | 138,829 | | | 91.3 | | | 91.3 | | |
| Greater Stanford | | | | | | | | | | | | | | | | | |
| | Menlo Gateway(1) | | 772,983 | | | — | | | — | | | 772,983 | | | 3 | | 29,790 | | | 100.0 | | | 100.0 | | |
| | 100 Independence Drive and 125 and 135 Constitution Drive | | | | | | | | | | | | | | | | | |
| | Alexandria Center® for Life Science – San Carlos | | 233,201 | | | 429,715 | | | — | | | 662,916 | | | 5 | | 10,853 | | | 100.0 | | | 100.0 | | |
| | 825, 835, and 960 Industrial Road and 987 and 1075 Commercial Street | | | | | | | | | | | | | | | | | |
| | 3825 and 3875 Fabian Way | | 478,000 | | | — | | | — | | | 478,000 | | | 2 | | 21,577 | | | 100.0 | | | 100.0 | | |
| | Alexandria Stanford Life Science District | | 289,685 | | | — | | | 92,147 | | | 381,832 | | | 4 | | 23,888 | | | 100.0 | | | 75.9 | | |
| | 3160, 3165, 3170, and 3181 Porter Drive | | | | | | | | | | | | | | | | | |
| | Alexandria PARC | | 197,498 | | | — | | | — | | | 197,498 | | | 4 | | 10,164 | | | 85.9 | | | 85.9 | | |
| | 2100, 2200, 2300, and 2400 Geng Road | | | | | | | | | | | | | | | | | |
| | 3330, 3412, 3450, and 3460 Hillview Avenue | | 183,267 | | | — | | | — | | | 183,267 | | | 4 | | 15,180 | | | 100.0 | | | 100.0 | | |
| | 2425 Garcia Avenue/2400/2450 Bayshore Parkway | | 99,208 | | | — | | | — | | | 99,208 | | | 1 | | 4,257 | | | 100.0 | | | 100.0 | | |
| | Shoreway Science Center | | 82,462 | | | — | | | — | | | 82,462 | | | 2 | | 5,340 | | | 100.0 | | | 100.0 | | |
| | 75 and 125 Shoreway Road | | | | | | | | | | | | | | | | | |
| | 1450 Page Mill Road | | 77,634 | | | — | | | — | | | 77,634 | | | 1 | | 8,009 | | | 100.0 | | | 100.0 | | |
| | 3350 West Bayshore Road | | 60,000 | | | — | | | — | | | 60,000 | | | 1 | | 2,191 | | | 62.3 | | | 62.3 | | |
| | | | | | | | | | | | | | | | | | | |
| | 2625/2627/2631 Hanover Street | | 32,074 | | | — | | | — | | | 32,074 | | | 1 | | 1,820 | | | 100.0 | | | 100.0 | | |
| | Greater Stanford | | 2,506,012 | | | 429,715 | | | 92,147 | | | 3,027,874 | | | 28 | | 133,069 | | | 98.0 | | | 94.5 | | |
| | San Francisco | | 7,495,390 | | | 744,715 | | | 92,147 | | | 8,332,252 | | | 61 | | $ | 362,262 | | | 95.8 | % | | 94.7 | % | |
(1) We own a partial interest in this property through a real estate joint venture. Refer to the “Joint venture financial information” section under Item 7 in this annual report in Form 10-K for additional information. | |
Property listing (continued)
| | | | | | | | | | | | | | | | | | | | | | | | | | | | | | | | | | | | | | | | | | | | | | | | | | | | | | | | | | | |
| | | | | | | | | | | | | | | | Occupancy Percentage | |
| | | | RSF | | Number of Properties | | Annual Rental Revenue | | |
| | | | | | | Operating | | Operating and Redevelopment | |
Market / Submarket / Address | | Operating | | Development | | Redevelopment | | Total | | | | | |
| | | | | | | | | | | | | | | | | | | |
| New York City | | | | | | | | | | | | | | | | | |
| New York City | | | | | | | | | | | | | | | | | |
| | Alexandria Center® for Life Science – New York City | | 740,972 | | | — | | | — | | | 740,972 | | | 3 | | $ | 64,994 | | | 95.9 | % | | 95.9 | % | |
| | 430 and 450 East 29th Street | | | | | | | | | | | | | | | | | |
| | 219 East 42nd Street | | 349,947 | | | — | | | — | | | 349,947 | | | 1 | | 14,006 | | | 100.0 | | | 100.0 | | |
| | Alexandria Center® – Long Island City | | 54,377 | | | — | | | 122,382 | | | 176,759 | | | 1 | | 2,185 | | | 100.0 | | | 30.8 | | |
| | 30-02 48th Avenue | | | | | | | | | | | | | | | | | |
| | New York City | | 1,145,296 | | | — | | | 122,382 | | | 1,267,678 | | | 5 | | 81,185 | | | 97.3 | | | 87.8 | | |
| | | | | | | | | | | | | | | | | | | |
| San Diego | | | | | | | | | | | | | | | | | |
| Torrey Pines | | | | | | | | | | | | | | | | | |
| | ARE Spectrum | | 336,461 | | | 146,456 | | | — | | | 482,917 | | | 4 | | 18,072 | | | 100.0 | | | 100.0 | | |
| | 3115 and 3215 Merryfield Row and 3013 and 3033 Science Park Road | | | | | | | | | | | | | | | | | |
| | ARE Torrey Ridge | | 294,326 | | | — | | | — | | | 294,326 | | | 3 | | 10,297 | | | 72.1 | | | 72.1 | | |
| | 10578, 10618, and 10628 Science Center Drive | | | | | | | | | | | | | | | | | |
| | ARE Sunrise | | 236,635 | | | — | | | — | | | 236,635 | | | 3 | | 8,238 | | | 100.0 | | | 100.0 | | |
| | 10931/10933 and 10975 North Torrey Pines Road, 3010 Science Park Road, and 10996 Torreyana Road | | | | | | | | | | | | | | | | | |
| | ARE Nautilus | | 220,651 | | | — | | | — | | | 220,651 | | | 4 | | 10,924 | | | 100.0 | | | 100.0 | | |
| | 3530 and 3550 John Hopkins Court and 3535 and 3565 General Atomics Court | | | | | | | | | | | | | | | | | |
| | 11119, 11255, and 11355 North Torrey Pines Road | | 211,641 | | | — | | | — | | | 211,641 | | | 3 | | 8,738 | | | 100.0 | | | 100.0 | | |
| | 3545 Cray Court | | 118,225 | | | — | | | — | | | 118,225 | | | 1 | | — | | | — | | | — | | |
| | Torrey Pines | | 1,417,939 | | | 146,456 | | | — | | | 1,564,395 | | | 18 | | 56,269 | | | 85.9 | | | 85.9 | | |
| University Town Center | | | | | | | | | | | | | | | | | |
| | Alexandria Point(1) | | 1,435,916 | | | — | | | — | | | 1,435,916 | | | 8 | | 61,391 | | | 99.1 | | | 99.1 | | |
| | 9880(2), 10210, 10260, 10290, and 10300 Campus Point Drive and 4161, 4224, and 4242 Campus Point Court | | | | | | | | | | | | | | | | | |
| | 5200 Illumina Way(1) | | 792,687 | | | — | | | — | | | 792,687 | | | 6 | | 29,977 | | | 100.0 | | | 100.0 | | |
| | University District | | 535,459 | | | — | | | — | | | 535,459 | | | 8 | | 19,979 | | | 100.0 | | | 100.0 | | |
| | 9363, 9393, and 9625(1) Towne Centre Drive, 4755, 4757, and 4767 Nexus Center Drive, and 4555 and 4796 Executive Drive | | | | | | | | | | | | | | | | | |
| | University Town Center | | 2,764,062 | | | — | | | — | | | 2,764,062 | | | 22 | | $ | 111,347 | | | 99.5 | % | | 99.5 | % | |
| |
(1) We own a partial interest in this property through a real estate joint venture. Refer to the “Joint venture financial information” section under Item 7 in this annual report in Form 10-K for additional information. (2) We own 100% of this property. | |
Property listing (continued)
| | | | | | | | | | | | | | | | | | | | | | | | | | | | | | | | | | | | | | | | | | | | | | | | | | | | | | | | | | | |
| | | | | | | | | | | | | | | | Occupancy Percentage | |
| | | | RSF | | Number of Properties | | Annual Rental Revenue | | |
| | | | | | | Operating | | Operating and Redevelopment | |
Market / Submarket / Address | | Operating | | Development | | Redevelopment | | Total | | | | | |
| | | | | | | | | | | | | | | | | | | |
| San Diego (continued) | | | | | | | | | | | | | | | | | |
| Sorrento Mesa | | | | | | | | | | | | | | | | | |
| | SD Tech by Alexandria(1) | | 779,989 | | | — | | | 79,945 | | | 859,934 | | | 13 | | $ | 24,130 | | | 87.3 | % | | 79.2 | % | |
| | 9605, 9645, 9675, 9685, 9725, 9735, 9808, 9855, and 9868 Scranton Road, 5505 Morehouse Drive(2), and 10065, 10121(2), and 10151(2) Barnes Canyon Road | | | | | | | | | | | | | | | | | |
| | 6420 and 6450 Sequence Drive | | 318,200 | | | — | | | — | | | 318,200 | | | 2 | | 8,069 | | | 89.5 | | | 89.5 | | |
| | Summers Ridge Science Park | | 316,531 | | | — | | | — | | | 316,531 | | | 4 | | 11,077 | | | 100.0 | | | 100.0 | | |
| | 9965, 9975, 9985, and 9995 Summers Ridge Road | | | | | | | | | | | | | | | | | |
| | ARE Portola | | 101,857 | | | — | | | — | | | 101,857 | | | 3 | | 3,603 | | | 100.0 | | | 100.0 | | |
| | 6175, 6225, and 6275 Nancy Ridge Drive | | | | | | | | | | | | | | | | | |
| | 5810/5820 Nancy Ridge Drive | | 82,272 | | | — | | | — | | | 82,272 | | | 1 | | 855 | | | 41.4 | | | 41.4 | | |
| | 7330 Carroll Road | | 66,244 | | | — | | | — | | | 66,244 | | | 1 | | 2,431 | | | 100.0 | | | 100.0 | | |
| | 9877 Waples Street | | 63,774 | | | — | | | — | | | 63,774 | | | 1 | | 2,364 | | | 100.0 | | | 100.0 | | |
| | 5871 Oberlin Drive | | 33,817 | | | — | | | — | | | 33,817 | | | 1 | | 892 | | | 50.2 | | | 50.2 | | |
| | Sorrento Mesa | | 1,762,684 | | | — | | | 79,945 | | | 1,842,629 | | | 26 | | 53,421 | | | 88.8 | | | 84.9 | | |
| Sorrento Valley | | | | | | | | | | | | | | | | | |
| | 3911, 3931, 3985, 4025, 4031, 4045, and 4075 Sorrento Valley Boulevard | | 191,406 | | | — | | | — | | | 191,406 | | | 7 | | 5,691 | | | 100.0 | | | 100.0 | | |
| | 11025, 11035, 11045, 11055, 11065, and 11075 Roselle Street | | 121,655 | | | — | | | — | | | 121,655 | | | 6 | | 3,428 | | | 100.0 | | | 100.0 | | |
| | Sorrento Valley | | 313,061 | | | — | | | — | | | 313,061 | | | 13 | | 9,119 | | | 100.0 | | | 100.0 | | |
| I-15 Corridor | | | | | | | | | | | | | | | | | |
| | 13112 Evening Creek Drive | | 109,780 | | | — | | | — | | | 109,780 | | | 1 | | 2,972 | | | 100.0 | | | 100.0 | | |
| | San Diego | | 6,367,526 | | | 146,456 | | | 79,945 | | | 6,593,927 | | | 80 | | 233,128 | | | 93.5 | | | 92.4 | | |
| | | | | | | | | | | | | | | | | | | |
| Seattle | | | | | | | | | | | | | | | | | |
| Lake Union | | | | | | | | | | | | | | | | | |
| | The Eastlake Life Science Campus by Alexandria | | 837,204 | | | 100,086 | | | — | | | 937,290 | | | 8 | | 46,609 | | | 97.6 | | | 97.6 | | |
| | 1165, 1201(1), 1208(1), 1616 and 1551 Eastlake Avenue East, 188 and 199(1) East Blaine Street, and 1600 Fairview Avenue East | | | | | | | | | | | | | | | | | |
| | | | | | | | | | | | | | | | | | | |
| | | | | | | | | | | | | | | | | | | |
| | 400 Dexter Avenue North | | 290,111 | | | — | | | — | | | 290,111 | | | 1 | | 14,820 | | | 100.0 | | | 100.0 | | |
| | 2301 5th Avenue | | 197,135 | | | — | | | — | | | 197,135 | | | 1 | | 9,308 | | | 99.0 | | | 99.0 | | |
| | 219 Terry Avenue North | | 30,705 | | | — | | | — | | | 30,705 | | | 1 | | 1,852 | | | 100.0 | | | 100.0 | | |
| | 601 Dexter Avenue North | | 18,680 | | | — | | | — | | | 18,680 | | | 1 | | 425 | | | 100.0 | | | 100.0 | | |
| | Lake Union | | 1,373,835 | | | 100,086 | | | — | | | 1,473,921 | | | 12 | | $ | 73,014 | | | 98.4 | % | | 98.4 | % | |
| |
(1) We own a partial interest in this property through a real estate joint venture. Refer to the “Joint venture financial information” section under Item 7 in this annual report in Form 10-K for additional information. (2) We own 100% of this property. | |
Property listing (continued)
| | | | | | | | | | | | | | | | | | | | | | | | | | | | | | | | | | | | | | | | | | | | | | | | | | | | | | | | | | | |
| | | | | | | | | | | | | | | | Occupancy Percentage | |
| | | | RSF | | Number of Properties | | Annual Rental Revenue | | |
| | | | | | | Operating | | Operating and Redevelopment | |
Market / Submarket / Address | | Operating | | Development | | Redevelopment | | Total | | | | | |
| | | | | | | | | | | | | | | | | | | |
| Seattle (continued) | | | | | | | | | | | | | | | | | |
| SoDo | | | | | | | | | | | | | | | | | |
| | 830 4th Avenue South | | 42,380 | | | — | | | — | | | 42,380 | | | 1 | | $ | 1,479 | | | 70.5 | % | | 70.5 | % | |
| Elliott Bay | | | | | | | | | | | | | | | | | |
| | 3000/3018 Western Avenue | | 47,746 | | | — | | | — | | | 47,746 | | | 1 | | 1,839 | | | 100.0 | | | 100.0 | | |
| | 410 West Harrison Street and 410 Elliott Avenue West | | 36,724 | | | — | | | — | | | 36,724 | | | 2 | | 415 | | | 36.4 | | | 36.4 | | |
| | Elliott Bay | | 84,470 | | | — | | | — | | | 84,470 | | | 3 | | 2,254 | | | 72.4 | | | 72.4 | | |
| | | | | | | | | | | | | | | | | | |
| Other | | 246,647 | | | — | | | 213,976 | | | 460,623 | | | 6 | | 4,730 | | | 94.9 | | | 50.8 | | |
| | Seattle | | 1,747,332 | | | 100,086 | | | 213,976 | | | 2,061,394 | | | 22 | | 81,477 | | | 96.0 | | | 85.5 | | |
| | | | | | | | | | | | | | | | | | | |
| Maryland | | | | | | | | | | | | | | | | | |
| Rockville | | | | | | | | | | | | | | | | | |
| | 9800, 9804, 9900, 9920, and 9950 Medical Center Drive | | 383,956 | | | 261,096 | | | — | | | 645,052 | | | 8 | | 14,944 | | | 93.1 | | | 93.1 | | |
| | 9704, 9708, 9712, and 9714 Medical Center Drive | | 215,619 | | | — | | | — | | | 215,619 | | | 4 | | 7,926 | | | 100.0 | | | 100.0 | | |
| | 1330 Piccard Drive | | 131,511 | | | — | | | — | | | 131,511 | | | 1 | | 3,810 | | | 100.0 | | | 100.0 | | |
| | 9605 Medical Center Drive | | 115,691 | | | — | | | — | | | 115,691 | | | 1 | | 3,100 | | | 83.1 | | | 83.1 | | |
| | 1500 and 1550 East Gude Drive | | 90,489 | | | — | | | — | | | 90,489 | | | 2 | | 1,411 | | | 77.3 | | | 77.3 | | |
| | 14920 and 15010 Broschart Road | | 86,703 | | | — | | | — | | | 86,703 | | | 2 | | 2,283 | | | 100.0 | | | 100.0 | | |
| | 1405 Research Boulevard | | 72,170 | | | — | | | — | | | 72,170 | | | 1 | | 2,476 | | | 100.0 | | | 100.0 | | |
| | 5 Research Place | | 63,852 | | | — | | | — | | | 63,852 | | | 1 | | 2,743 | | | 100.0 | | | 100.0 | | |
| | 5 Research Court | | 51,520 | | | — | | | — | | | 51,520 | | | 1 | | 1,788 | | | 100.0 | | | 100.0 | | |
| | 9920 Belward Campus Drive | | 51,181 | | | — | | | — | | | 51,181 | | | 1 | | 1,687 | | | 100.0 | | | 100.0 | | |
| | 12301 Parklawn Drive | | 49,185 | | | — | | | — | | | 49,185 | | | 1 | | 1,329 | | | 100.0 | | | 100.0 | | |
| | Rockville | | 1,311,877 | | | 261,096 | | | — | | | 1,572,973 | | | 23 | | 43,497 | | | 94.9 | | | 94.9 | | |
| Gaithersburg | | | | | | | | | | | | | | | | | |
| | Alexandria Technology Center® – Gaithersburg I | | 613,438 | | | — | | | — | | | 613,438 | | | 9 | | 16,177 | | | 96.3 | | | 96.3 | | |
| | 9, 25, 35, 45, 50, and 55 West Watkins Mill Road and 910, 930, and 940 Clopper Road | | | | | | | | | | | | | | | | | |
| | Alexandria Technology Center® – Gaithersburg II | | 315,085 | | | — | | | 169,420 | | | 484,505 | | | 7 | | 7,966 | | | 94.3 | | | 61.3 | | |
| | 700, 704(1), and 708 Quince Orchard Road and 19, 20, 21, and 22 Firstfield Road | | | | | | | | | | | | | | | | | |
| | 401 Professional Drive | | 63,154 | | | — | | | — | | | 63,154 | | | 1 | | 1,833 | | | 100.0 | | | 100.0 | | |
| | 950 Wind River Lane | | 50,000 | | | — | | | — | | | 50,000 | | | 1 | | 1,004 | | | 100.0 | | | 100.0 | | |
| | 620 Professional Drive | | 27,950 | | | — | | | — | | | 27,950 | | | 1 | | 1,207 | | | 100.0 | | | 100.0 | | |
| | Gaithersburg | | 1,069,627 | | | — | | | 169,420 | | | 1,239,047 | | | 19 | | 28,187 | | | 96.2 | | | 83.0 | | |
| Beltsville | | | | | | | | | | | | | | | | | |
| | 8000/9000/10000 Virginia Manor Road | | 191,884 | | | — | | | — | | | 191,884 | | | 1 | | 2,618 | | | 98.4 | | | 98.4 | | |
| Northern Virginia | | | | | | | | | | | | | | | | | |
| | 14225 Newbrook Drive | | 248,186 | | | — | | | — | | | 248,186 | | | 1 | | 6,127 | | | 100.0 | | | 100.0 | | |
| | Maryland | | 2,821,574 | | | 261,096 | | | 169,420 | | | 3,252,090 | | | 44 | | $ | 80,429 | | | 96.1 | % | | 90.6 | % | |
| |
(1) We own a partial interest in this property through a real estate joint venture. Refer to the “Joint venture financial information” section under Item 7 in this annual report in Form 10-K for additional information. |
Property listing (continued)
| | | | | | | | | | | | | | | | | | | | | | | | | | | | | | | | | | | | | | | | | | | | | | | | | | | | | | | | | | | |
| | | | | | | | | | | | | | | | Occupancy Percentage | |
| | | | RSF | | Number of Properties | | Annual Rental Revenue | | |
| | | | | | | Operating | | Operating and Redevelopment | |
Market / Submarket / Address | | Operating | | Development | | Redevelopment | | Total | | | | | |
| | | | | | | | | | | | | | | | | | | |
| Research Triangle | | | | | | | | | | | | | | | | | |
| Research Triangle | | | | | | | | | | | | | | | | | |
| | Alexandria Center® for Life Science – Durham | | 1,585,766 | | | — | | | 652,381 | | | 2,238,147 | | | 16 | | $ | 26,261 | | | 84.1 | % | | 59.6 | % | |
| | 6, 8, 10, 12, 14, 40, 41, 42, and 65 Moore Drive, 21, 25, 27, 29, and 31 Parmer Way, 2400 Ellis Road, and 14 TW Alexander Drive | | | | | | | | | | | | | | | | | |
| | Alexandria Center® for Advanced Technologies | | 100,000 | | | 250,000 | | | — | | | 350,000 | | | 3 | | 2,296 | | | 99.0 | | | 99.0 | | |
| | 6, 8, and 10 Davis Drive | | | | | | | | | | | | | | | | | |
| | Alexandria Center® for AgTech | | 180,400 | | | 160,000 | | | — | | | 340,400 | | | 2 | | 6,488 | | | 95.2 | | | 95.2 | | |
| | 5 and 9 Laboratory Drive | | | | | | | | | | | | | | | | | |
| | Alexandria Technology Center® – Alston | | 186,870 | | | — | | | — | | | 186,870 | | | 3 | | 3,951 | | | 94.7 | | | 94.7 | | |
| | 100, 800, and 801 Capitola Drive | | | | | | | | | | | | | | | | | |
| | 108/110/112/114 TW Alexander Drive | | 158,417 | | | — | | | — | | | 158,417 | | | 1 | | 4,624 | | | 85.8 | | | 85.8 | | |
| | Alexandria Innovation Center® – Research Triangle | | 136,455 | | | — | | | — | | | 136,455 | | | 3 | | 4,108 | | | 100.0 | | | 100.0 | | |
| | 7010, 7020, and 7030 Kit Creek Road | | | | | | | | | | | | | | | | | |
| | 7 Triangle Drive | | 96,626 | | | — | | | — | | | 96,626 | | | 1 | | 3,156 | | | 100.0 | | | 100.0 | | |
| | 2525 East NC Highway 54 | | 82,996 | | | — | | | — | | | 82,996 | | | 1 | | 3,651 | | | 100.0 | | | 100.0 | | |
| | 407 Davis Drive | | 81,956 | | | — | | | — | | | 81,956 | | | 1 | | 1,644 | | | 100.0 | | | 100.0 | | |
| | 601 Keystone Park Drive | | 77,395 | | | — | | | — | | | 77,395 | | | 1 | | 1,375 | | | 100.0 | | | 100.0 | | |
| | 6040 George Watts Hill Drive | | 61,547 | | | — | | | — | | | 61,547 | | | 1 | | 2,148 | | | 100.0 | | | 100.0 | | |
| | 5 Triangle Drive | | 32,120 | | | — | | | — | | | 32,120 | | | 1 | | 1,112 | | | 100.0 | | | 100.0 | | |
| | 6101 Quadrangle Drive | | 30,122 | | | — | | | — | | | 30,122 | | | 1 | | 540 | | | 100.0 | | | 100.0 | | |
| | Research Triangle | | 2,810,670 | | | 410,000 | | | 652,381 | | | 3,873,051 | | | 35 | | 61,354 | | | 89.6 | | | 72.7 | | |
| | | | | | | | | | | | | | | | | | | |
| | | | | | | | | | | | | | | | | |
| Canada | | 256,967 | | | — | | | — | | | 256,967 | | | 3 | | 4,870 | | | 81.8 | | | 81.8 | | |
| | | | | | | | | | | | | | | | | | | |
| Non-cluster/other markets | | 549,479 | | | — | | | — | | | 549,479 | | | 12 | | 10,608 | | | 52.7 | | | 52.7 | | |
| | | | | | | | | | | | | | | | | | | |
| North America, excluding properties held for sale | | 31,648,630 | | | 1,662,353 | | | 1,626,740 | | | 34,937,723 | | | 334 | | 1,422,772 | | | 94.6 | % | | 90.0 | % | |
| | | | | | | | | | | | | | | | | |
| Properties held for sale | | 225,849 | | | — | | | — | | | 225,849 | | | 4 | | 6,257 | | | 51.1 | % | | 51.1 | % | |
| | | | | | | | | | | | | | | | | | | |
| Total – North America | | 31,874,479 | | | 1,662,353 | | | 1,626,740 | | | 35,163,572 | | | 338 | | $ | 1,429,029 | | | | | | |
| | | | | | | | | | | | | | | | | | | |
| |
•Executed a total of 244 leases, with a weighted-average lease term of 7.3 years, for 4.4 million RSF, including 1.0 million RSF related to our development and redevelopment projects, during the year ended December 31, 2020; leasing activity of 2.6 million RSF of renewed and re-leased space represents the highest annual leasing activity in the past 10 years; and
•Strong rental rate increases of 37.6% and 18.3% (cash basis) on renewed and re-leased space, representing our highest annual increase during the past 10 years.
Approximately 59% of the 244 leases executed during the year ended December 31, 2020, did not include concessions for free rent. During the year ended December 31, 2020, we granted tenant concessions/free rent averaging 2.1 months with respect to the 4.4 million RSF leased.
The following chart presents renewed/re-leased space and development/redevelopment/previously vacant space leased for the years ended December 31, 2020, 2019, and 2018:
Lease structure
Our Same Properties total revenue growth of 2.1% for the year ended December 31, 2020, and our Same Properties net operating income and Same Properties net operating income (cash basis) increases for the year ended December 31, 2020, of 2.6% and 5.1%, respectively, benefited significantly from strong market fundamentals. The limited supply of Class A space in AAA locations and strong demand from innovative tenants drove rental rate increases of 37.6% and 18.3% (cash basis) on 2.6 million renewed/re-leased RSF, while a favorable triple net lease structure with contractual annual rent escalations resulted in both a consistent Same Properties operating margin of 73.0% and occupancy of 96.6% across our 209 Same Properties aggregating 20.7 million RSF. As of December 31, 2020, approximately 94% of our leases (on an RSF basis) were triple net leases, which require tenants to pay substantially all real estate taxes, insurance, utilities, repairs and maintenance, common area expenses, and other operating expenses (including increases thereto) in addition to base rent. Additionally, approximately 94% of our leases (on an RSF basis) contained contractual annual rent escalations that were either fixed or based on a consumer price index or another index, and approximately 93% of our leases (on an RSF basis) provided for the recapture of certain capital expenditures.
Leasing activity (continued)
The following table summarizes our leasing activity at our properties for the years ended December 31, 2020 and 2019:
| | | | | | | | | | | | | | | | | | | | | | | | | | |
| | Year Ended December 31, |
| | 2020 | | 2019 |
| | Including
Straight-Line Rent | | Cash Basis | | Including
Straight-Line Rent | | Cash Basis |
(Dollars per RSF) | | | | | | | | |
Leasing activity: | | | | | | | | |
Renewed/re-leased space(1) | | | | | | | | |
Rental rate changes | | 37.6% | (2) | 18.3% | (2) | 32.2% | | 17.6% |
New rates | | $49.51 | | | $46.53 | | | $58.65 | | | $56.19 | |
Expiring rates | | $35.99 | | | $39.32 | | | $44.35 | | | $47.79 | |
RSF | | 2,556,833 | | (2) | | | 2,427,108 | | | |
Tenant improvements/leasing commissions | | $35.08 | | | | | $20.28 | | | |
Weighted-average lease term | | 6.0 years | | | | 5.7 years | | |
| | | | | | | | |
Developed/redeveloped/previously vacant space leased | | | | | | | | |
New rates | | $56.67 | | | $53.61 | | | $55.95 | | | $52.19 | |
RSF | | 1,802,013 | | | | | 2,635,614 | | | |
Tenant improvements/leasing commissions | | $28.17 | | | | | $13.74 | | | |
Weighted-average lease term | | 9.0 years | | | | 9.8 years | | |
| | | | | | | | |
Leasing activity summary (totals): | | | | | | | | |
New rates | | $52.47 | | | $49.46 | | | $57.25 | | | $54.11 | |
RSF | | 4,358,846 | | (3) | | | 5,062,722 | | | |
Tenant improvements/leasing commissions | | $32.22 | | | | | $16.88 | | | |
Weighted-average lease term | | 7.3 years | | | | 7.8 years | | |
| | | | | | | | |
Lease expirations(1) | | | | | | | | |
Expiring rates | | $36.03 | | | $39.01 | | | $43.43 | | | $46.59 | |
RSF | | 3,560,188 | | | | | 2,822,434 | | | |
Leasing activity includes 100% of results for properties in which we have an investment in North America.
(1)Excludes month-to-month leases aggregating 96,383 RSF and 41,809 RSF as of December 31, 2020 and 2019, respectively.
(2)Represents our highest annual rental rate increases and RSF leasing activity for renewed and re-leased space in the past 10 years.
(3)During the year ended December 31, 2020, we granted tenant concessions/free rent averaging 2.1 months with respect to the 4,358,846 RSF leased. Approximately 59% of the leases executed during the year ended December 31, 2020, did not include concessions for free rent.
Summary of contractual lease expirations
The following table summarizes information with respect to the contractual lease expirations at our properties as of December 31, 2020:
| | | | | | | | | | | | | | | | | | | | | | | | | | | | | | | | | | | | | | | | | | | | | | | | | | | | | | | | |
| Year | | RSF | | Percentage of
Occupied RSF | | Annual Rental Revenue
(Per RSF)(1) | | Percentage of Total
Annual Rental Revenue |
| | | | | | | | | | | | | | | | | | |
| 2021 | (2) | | | 1,880,366 | | | | | 6.3 | % | | | | $ | 40.75 | | | | | 5.3 | % | |
| 2022 | | | | 2,512,016 | | | | | 8.4 | % | | | | $ | 45.95 | | | | | 7.9 | % | |
| 2023 | | | | 3,387,053 | | | | | 11.3 | % | | | | $ | 41.50 | | | | | 9.6 | % | |
| 2024 | | | | 2,273,200 | | | | | 7.6 | % | | | | $ | 45.03 | | | | | 7.0 | % | |
| 2025 | | | | 2,366,093 | | | | | 7.9 | % | | | | $ | 46.79 | | | | | 7.6 | % | |
| 2026 | | | | 1,725,242 | | | | | 5.8 | % | | | | $ | 47.71 | | | | | 5.6 | % | |
| 2027 | | | | 2,071,365 | | | | | 6.9 | % | | | | $ | 52.36 | | | | | 7.4 | % | |
| 2028 | | | | 2,449,460 | | | | | 8.2 | % | | | | $ | 49.28 | | | | | 8.3 | % | |
| 2029 | | | | 1,829,233 | | | | | 6.1 | % | | | | $ | 55.68 | | | | | 7.0 | % | |
| 2030 | | | | 2,074,876 | | | | | 6.9 | % | | | | $ | 52.67 | | | | | 7.5 | % | |
| Thereafter | | | 7,386,330 | | | | | 24.6 | % | | | | $ | 52.73 | | | | | 26.8 | % | |
(1)Represents amounts in effect as of December 31, 2020.
(2)Excludes month-to-month leases aggregating 96,383 RSF as of December 31, 2020.
The following tables present information by market with respect to our 2021 and 2022 contractual lease expirations in North America as of December 31, 2020:
| | | | | | | | | | | | | | | | | | | | | | | | | | | | | | | | | | | | | | |
| | 2021 Contractual Lease Expirations (in RSF) | | Annual Rental Revenue
(Per RSF)(4) |
Market | | Leased | | Negotiating/
Anticipating | | Targeted for Development/ Redevelopment(1) | | Remaining
Expiring Leases(2) | | Total(3) | |
| | | | | |
| Greater Boston | | 60,186 | | | 80,265 | | | 266,484 | | | 228,358 | | | 635,293 | | | $ | 44.31 | |
| San Francisco | | 37,839 | | | 233,606 | | | 26,738 | | | 212,785 | | | 510,968 | | | 45.76 | |
| New York City | | — | | | 7,924 | | | — | | | 2,007 | | | 9,931 | | | N/A |
| San Diego | | 101,437 | | | 89,576 | | | 41,475 | | | 213,047 | | | 445,535 | | | 31.73 | |
| Seattle | | — | | | 15,184 | | | — | | | 20,974 | | | 36,158 | | | 49.69 | |
| Maryland | | 33,000 | | | — | | | — | | | 29,865 | | | 62,865 | | | 23.38 | |
| Research Triangle | | 16,942 | | | — | | | — | | | 90,364 | | | 107,306 | | | 31.37 | |
| Canada | | — | | | — | | | — | | | 13,672 | | | 13,672 | | | 23.71 | |
| Non-cluster/other markets | | — | | | — | | | — | | | 58,638 | | | 58,638 | | | 44.70 | |
Total | | 249,404 | | | 426,555 | | | 334,697 | | | 869,710 | | | 1,880,366 | | | $ | 40.75 | |
Percentage of expiring leases | | 13 | % | | 23 | % | | 18 | % | | 46 | % | | 100 | % | | |
| | | | | | | | | | | | |
| | 2022 Contractual Lease Expirations (in RSF) | | Annual Rental Revenue
(Per RSF)(4) |
Market | | Leased | | Negotiating/
Anticipating | | Targeted for Development/ Redevelopment(1) | | Remaining Expiring Leases(5) | | Total | |
| | | | | |
| Greater Boston | | — | | | 7,072 | | | — | | | 568,831 | | (6) | 575,903 | | | $ | 58.15 | |
| San Francisco | | — | | | 10,011 | | | 490,127 | | | 277,836 | | | 777,974 | | | 49.56 | |
| New York City | | 18,120 | | | 27,179 | | | — | | | 2,979 | | | 48,278 | | | N/A |
| San Diego | | 83,104 | | | — | | | 231,585 | | | 243,454 | | | 558,143 | | | 38.55 | |
| Seattle | | — | | | — | | | 51,255 | | | 125,462 | | | 176,717 | | | 36.36 | |
| Maryland | | — | | | — | | | — | | | 74,817 | | | 74,817 | | | 29.40 | |
| Research Triangle | | — | | | — | | | — | | | 221,937 | | | 221,937 | | | 21.77 | |
| Canada | | — | | | — | | | — | | | 28,664 | | | 28,664 | | | 20.97 | |
| Non-cluster/other markets | | — | | | — | | | — | | | 49,583 | | | 49,583 | | | 55.84 | |
Total | | 101,224 | | | 44,262 | | | 772,967 | | | 1,593,563 | | | 2,512,016 | | | $ | 45.95 | |
Percentage of expiring leases | | 4 | % | | 2 | % | | 31 | % | | 63 | % | | 100 | % | | |
| | | | | | | | | | | | |
(1)Represents RSF targeted for development or redevelopment upon expiration of existing in-place leases, primarily related to recently acquired properties. Refer to “Investments in real estate – value-creation square footage currently in rental properties” in the “Non-GAAP measures and definitions” section under Item 7 in this annual report on Form 10-K for additional details on value-creation square feet currently included in rental properties.
(2)The largest remaining contractual lease expirations are three leases ranging from 35,000 RSF to 45,000 RSF.
(3)Excludes month-to-month leases aggregating 96,383 RSF as of December 31, 2020.
(4)Represents amounts in effect as of December 31, 2020.
(5)The largest remaining contractual lease expiration includes Class A office/laboratory buildings aggregating 113,555 RSF in our Cambridge/Inner Suburbs submarket and four other leases ranging from 50,000 RSF to 60,000 RSF.
(6)68% of the remaining expiring leases in Greater Boston are located in our Cambridge/Inner Suburbs submarket.
Investments in real estate
A key component of our business model is our disciplined allocation of capital to the development and redevelopment of new Class A properties located in collaborative life science, technology, and agtech campuses in AAA urban innovation clusters. These projects are focused on providing high-quality, generic, and reusable spaces that meet the real estate requirements of, and are reusable by, a wide range of tenants. Upon completion, each value-creation project is expected to generate a significant increase in rental income, net operating income, and cash flows. Our development and redevelopment projects are generally in locations that are highly desirable to high-quality entities, which we believe results in higher occupancy levels, longer lease terms, higher rental income, higher returns, and greater long-term asset value. Our pre-construction activities are undertaken in order to get the property ready for its intended use and include entitlements, permitting, design, site work, and other activities preceding commencement of construction of aboveground building improvements.
As of the date of this report, construction activities were in process at all of our active construction projects. Construction workers continue to observe social distancing and follow rules that restrict gatherings of large groups of people in close proximity, as
well as adhere to other appropriate measures, which may slow the pace of construction.
Our investments in real estate consisted of the following as of December 31, 2020 (dollars in thousands):
| | | | | | | | | | | | | | | | | | | | | | | | | | | | | | | | | | | | | | | | | | | | |
| | | | Development and Redevelopment | | |
| | Operating | | Under Construction | | Near
Term | | Intermediate
Term | | Future | | Subtotal | | Total |
| Investments in real estate | | | | | | | | | | | | | | |
Book value as of December 31, 2020(1) | | $ | 17,423,908 | | | $ | 1,667,842 | | | $ | 955,207 | | | $ | 452,404 | | | $ | 738,994 | | | $ | 3,814,447 | | | $ | 21,238,355 | |
| | | | | | | | | | | | | | |
Square footage | | | | | | | | | | | | | | |
| Operating | | 31,874,479 | | | — | | | — | | | — | | | — | | | — | | | 31,874,479 | |
| New Class A development and redevelopment properties | | — | | | 3,289,093 | | | 4,931,216 | | | 3,521,115 | | | 9,208,795 | | | 20,950,219 | | | 20,950,219 | |
Value-creation square feet currently included in rental properties(2) | | — | | | — | | | (617,749) | | | (684,030) | | | (1,810,218) | | | (3,111,997) | | | (3,111,997) | |
Total square footage | | 31,874,479 | | | 3,289,093 | | | 4,313,467 | | | 2,837,085 | | | 7,398,577 | | | 17,838,222 | | | 49,712,701 | |
(1)Balances exclude our share of the cost basis associated with our properties held by our unconsolidated real estate joint ventures, which is classified as investments in unconsolidated real estate joint ventures in our consolidated balance sheets.
(2)Refer to “Investments in real estate – value-creation square footage currently in rental properties” in the “Non-GAAP measures and definitions” section under Item 7 in this annual report on Form 10-K for additional details on value-creation square feet currently included in rental properties.
Our real estate asset acquisitions for the year ended December 31, 2020, consisted of the following (dollars in thousands):
| | | | | | | | | | | | | | | | | | | | | | | | | | | | | | | | | | | | | | | | | | | | | | | | | | | | | | | | | | | | | | | | | | | | | | | | | | | | | | | | | | | | | | |
| Property | | Submarket/Market | | Date of Purchase | | Number of Properties | | Operating
Occupancy | | Square Footage | | Unlevered Yields | | Purchase Price |
| | | | Future Development | | Active Redevelopment | | Operating With Future Development/ Redevelopment | | Operating | | Initial Stabilized | | Initial Stabilized (Cash) | |
| | | | | | | |
Year ended December 31, 2020: | | | | | | | | | | | | | | | | | | | | | | | | | | |
Alexandria Center® for Life Science – Durham | | Research Triangle/
Research Triangle | | 8/21/20 | | 16 | | 84 | % | | | — | | | 652,381 | | | 100,145 | | | | 1,485,621 | | | (1) | | | (1) | | | $ | 590,412 | | |
| Reservoir Woods | | Route 128/
Greater Boston | | 8/25/20 | | 3 | | 100 | | | | 440,000 | | | — | | | 515,273 | | | | — | | | (2) | | | (2) | | | | 325,307 | | |
275 Grove Street | | Route 128/ Greater Boston | | 1/10/20 | | 1 | | 99 | | | | — | | | — | | | — | | | | 509,702 | | | 8.0 | % | | | 6.7 | % | | | | 226,512 | | |
601, 611, and 651 Gateway Boulevard (51% interest in consolidated JV) | | South San Francisco/ San Francisco | | 1/28/20 | | 3 | | 73 | | (3) | | 260,000 | | | — | | | 300,010 | | | | 475,993 | | | (2) | | | (2) | | | | (4) | |
| 6420 and 6450 Sequence Drive | | Sorrento Mesa/San Diego | | 11/13/20 | | 2 | | 89 | | (5) | | 709,000 | | | — | | | 202,915 | | | | 115,285 | | | 7.2 | % | (5) | | 6.2 | % | (5) | | | 169,698 | | |
| 380 and 420 E Street | | Seaport Innovation District/Greater Boston | | 10/29/20 | | 2 | | 100 | | | | 1,000,000 | | (6) | — | | | 195,506 | | | | — | | | (2) | | | (2) | | | | 168,500 | | |
| 3181 Porter Drive | | Greater Stanford/
San Francisco | | 8/6/20 | | 1 | | 100 | | | | — | | | — | | | — | | | | 104,011 | | | 7.2 | % | | | 5.0 | % | | | | 115,200 | | |
987 and 1075 Commercial Street | | Greater Stanford/
San Francisco | | 4/14/20 | | 2 | | N/A | | | 700,000 | | (6) | — | | | 26,738 | | | | — | | | (2) | | | (2) | | | | 113,250 | | |
| One Upland Road | | Route 128/Greater Boston | | 8/19/20 | | 1 | | 100 | | | | 450,000 | | | — | | | — | | | | 243,082 | | | 6.3 | % | (7) | | 5.6 | % | (7) | | | 110,257 | | |
3330 and 3412 Hillview Avenue | | Greater Stanford/
San Francisco | | 2/5/20 | | 2 | | 100 | | | | — | | | — | | | — | | | | 106,316 | | | 7.6 | % | | | 4.2 | % | | | | 105,000 | | |
9808 and 9868 Scranton Road(8) | | Sorrento Mesa/San Diego | | 1/10/20 | | 2 | | 88 | | | | — | | | — | | | — | | | | 219,628 | | | 7.3 | % | | | 6.8 | % | | | | 102,250 | | |
| 11255 and 11355 North Torrey Pines Road | | Torrey Pines/San Diego | | 7/22/20 | | 2 | | 100 | | | | 240,000 | | (6) | — | | | 139,135 | | | | — | | | (2) | | | (2) | | | | 97,500 | | |
| 3450 and 3460 Hillview Avenue | | Greater Stanford/
San Francisco | | 10/6/20 | | 2 | | 100 | | | | — | | | — | | | 76,951 | | | | — | | | (2) | | | (2) | | | | 65,748 | | |
| 4555 Executive Drive | | University Town Center/San Diego | | 6/2/20 | | 1 | | 100 | | | | 200,000 | | (6) | — | | | 41,475 | | | | — | | | (2) | | | (2) | | | | 43,000 | | |
| 700 Quince Orchard Road | | Gaithersburg/Maryland | | 10/23/20 | | 1 | | N/A | | | — | | | 169,420 | | | — | | | | — | | | 8.6 | % | | | 7.3 | % | | | | 43,000 | | |
Other | | Various | | Various | | 14 | | 55 | | | | 1,082,713 | | | 277,750 | | | 164,656 | | | | 570,952 | | | N/A | | | N/A | | | | 287,768 | | |
| | | | | | 55 | | 85 | % | | | 5,081,713 | | | 1,099,551 | | | 1,762,804 | | | | 3,830,590 | | | | | | | | | $ | 2,563,402 | | |
| | | | | | | | | | | | | | | | | | | | | | | | | | | | |
| | | | | | | | | | | | | | | | | | | | | | | | | | | | |
| | | | | | | | | | | | | | | | | | | | | | | | | | |
| | | | | | | | | | | | | | | | | | | | | | | | | | |
| | | | | | | | | | | | | | | | | | | | | | | | | | |
| | | | | | | | | | | | | | | | | | | | | | | | | | | | |
(1)The campus includes 16 properties, of which three properties aggregating 652,381 RSF are currently undergoing active redevelopment. We expect to achieve unlevered initial stabilized yields of 6.2% and 5.8% (cash basis) for the 13 operating properties. These operating properties generate 99% of annual rental revenue from investment-grade tenants. Refer to “New Class A development and redevelopment properties: current projects” within this Item 2 in this annual report on Form 10-K for additional details on the three properties undergoing active redevelopment.
(2)We expect to provide total estimated costs and related yields for development and redevelopment projects in the future, subsequent to the commencement of construction.
(3)Includes 199,895 RSF of vacancy as of December 31, 2020. Refer to the “Summary of occupancy percentages in North America” section earlier within this Item 2 in this annual report on Form 10-K for additional details.
(4)Refer to Note 4 – “Consolidated and unconsolidated real estate joint ventures” to our consolidated financial statements under Item 15 in this annual report on Form 10-K for additional details.
(5)The two operating properties are currently 89% occupied, and upon completion of renovations, a lease for 60,432 RSF will commence in the second half of 2021, which will increase occupancy to 100%. We expect to achieve unlevered initial stabilized yields of 7.2% and 6.2% (cash basis) for these operating properties.
(6)Represents total square footage upon completion of development or redevelopment of a new Class A property. Square footage presented includes RSF of buildings currently in operation at properties with inherent future development or redevelopment opportunities. We intend to demolish or redevelop the existing property upon expiration of the existing in-place leases and commencement of future construction. Refer to the definition of “Investments in real estate – value-creation square footage currently in rental properties” in the “Non-GAAP measures and definitions” section under Item 7 in this annual report on Form 10-K for additional information.
(7)Represents unlevered initial stabilized yields for the operating property, excluding excess land.
(8)In April 2020, we completed the sale of properties at 9808 and 9868 Scranton Road to the existing SD Tech by Alexandria consolidated real estate joint venture, of which we own 50%. We received gross proceeds of $51.1 million for the 50% interest in the properties that our joint venture partner acquired through the joint venture. We continue to control and consolidate this joint venture; therefore, we accounted for the sale as an equity transaction with no gain or loss recognized in earnings. Refer to the next page for additional information.
Our completed dispositions of real estate assets during the year ended December 31, 2020, consisted of the following (dollars in thousands, except for sales price per RSF):
| | | | | | | | | | | | | | | | | | | | | | | | | | | | | | | | | | | | | | | | | | | | | | | | | | | | | | | | |
| Property | | Submarket/Market | | Date of Sale | | Interest Sold | | RSF | | Sales Price | | Sales Price per RSF | | Gain | |
| 510 Townsend Street and 505 Brannan Street | | SoMa/San Francisco | | 11/20/20 | | 100% | | 443,479 | | | $ | 560,162 | | (1) | | $ | 1,263 | | | $ | 151,871 | | |
| 945 Market Street | | SoMa/San Francisco | | 9/4/20 | | 99.5% | | 255,765 | | | 198,000 | | | | $ | 774 | | | — | | |
| 9808 and 9868 Scranton Road | | Sorrento Mesa/San Diego | | 4/13/20 | | 50% | | 219,628 | | | 51,104 | | | | $ | 465 | | | (2) | |
| 1201 and 1208 Eastlake Avenue East and 199 East Blaine Street | | Lake Union/Seattle | | 11/24/20 | | 70% | | 321,218 | | | 314,466 | | (3) | | $ | 1,399 | | | (4) | |
| Other | | Various | | Various | | 100% | | 105,614 | | | 13,600 | | | | $ | 129 | | | 2,218 | | |
| | | | | | | | 1,345,704 | | | $ | 1,137,332 | | | | | | $ | 154,089 | | |
| | | | | | | | | | | | | | | | | | |
(1)We completed the dispositions of these two tech office properties at capitalization rates of 5.3% and 5.0% (cash basis) based on annualized net operating income and net operating income (cash basis), respectively, for the three months ended September 30, 2020.
(2)We completed the sale of properties at 9808 and 9868 Scranton Road in our Sorrento Mesa submarket to the existing SD Tech by Alexandria consolidated real estate joint venture, in which we have a 50% ownership interest. We retained control over this real estate joint venture, and therefore, we continue to consolidate these properties. For consolidated joint ventures, we account for the difference between the consideration received and the book value of the interest sold as an equity transaction, with no gain or loss recognized in earnings.
(3)This transaction represents capitalization rate of 4.2%, based on annualized net operating income and net operating income (cash basis) for the three months ended December 31, 2020.
(4)This sale of a partial interest represents consideration in excess of book value aggregating $211.3 million. We retained control over this real estate joint venture, and therefore, we continue to consolidate these properties. For consolidated joint ventures, we account for the consideration in excess of net book value of the interest sold as an equity transaction, with no gain or loss recognized in earnings.
Sustainability
(1)Source: Centers for Disease Control and Prevention, “Overdose Deaths Accelerating During COVID-19,” December 17, 2020.
(1)13 projects have been certified and another 38 projects are in process targeting WELL or Fitwel certification.
(2)Alexandria LaunchLabs® – New York City achieved the WELL Health-Safety Rating in October 2020.
(3)Relative to a 2015 baseline for buildings in operation that Alexandria directly manages.
(4)For buildings in operation that Alexandria indirectly and directly manages.
(5)Reflects sum of annual like-for-like progress from 2015 to 2019.
(6)Reflects progress for all buildings in operation in 2019 that Alexandria indirectly and directly manages.
New Class A development and redevelopment properties: recent deliveries
| | | | | | | | | | | | | | | | | | | | | | |
Alexandria Center® for Life Science – San Carlos | | Alexandria Center® – Long Island City | | 9877 Waples Street | | | | | | |
| San Francisco/Greater Stanford | | New York City/New York City | | San Diego/Sorrento Mesa | | | | | | |
| 96,463 RSF | | 17,716 RSF | | 63,744 RSF | | | | | | |
| | | | | | | | | | |
The following table presents value-creation development and redevelopment of new Class A properties placed into service during the three months ended December 31, 2020 (dollars in thousands):
| | | | | | | | | | | | | | | | | | | | | | | | | | | | | | | | | | | | | | | | | | | | | | | | | | | | | | | | | | | | | | | | | | | | | | | | | | |
| Property/Market/Submarket | | Delivery Date | | Our Ownership Interest | | Dev/Redev | | RSF Placed in Service in 4Q20 | | Occupancy Percentage(1) | | Total Project | | Unlevered Yields |
| | | | | | | Initial Stabilized | | Initial Stabilized (Cash Basis) |
| | | | | | RSF | | Investment | | |
Alexandria Center® for Life Science – San Carlos/San Francisco/Greater Stanford | | December 2020 | | 100% | | Dev | | 96,463 | | | | 100% | | | 526,178 | | | $ | 630,000 | | | | 6.4 | % | | | | 6.1 | % | |
Alexandria Center® – Long Island City/New York City/New York City | | December 2020 | | 100% | | Redev | | 17,716 | | | | 100% | | | 176,759 | | | $ | 184,300 | | | | 5.5 | % | | | | 5.6 | % | |
| 9877 Waples Street/San Diego/Sorrento Mesa | | December 2020 | | 100% | | Redev | | 63,774 | | | | 100% | | | 63,744 | | | $ | 31,000 | | | | 8.8 | % | | | | 8.1 | % | |
| Total | | | | | | | | 177,953 | | | | | | | | | | | | | | | | | |
(1) Relates to total operating RSF placed in service as of the most recent delivery.
New Class A development and redevelopment properties: current projects
| | | | | | | | | | | | | | |
| The Arsenal on the Charles | | 201 Haskins Way | | Alexandria Center® for Life Science – San Carlos |
Greater Boston/
Cambridge/Inner Suburbs | | San Francisco/South San Francisco | | San Francisco/Greater Stanford |
| 296,489 RSF | | 315,000 RSF | | 429,715 RSF |
| | | | |
| | | | | | | | | | | | | | | | | | | | |
| 3160 Porter Drive | | Alexandria Center® – Long Island City | | 3115 Merryfield Row | | 5505 Morehouse Drive |
| San Francisco/Greater Stanford | | New York City/New York City | | San Diego/Torrey Pines | | San Diego/Sorrento Mesa |
| 92,147 RSF | | 122,382 RSF | | 146,456 RSF | | 79,945 RSF |
| | | | | | |
New Class A development and redevelopment properties: current projects (continued)
| | | | | | | | | | | | | | | | |
| 1165 Eastlake Avenue East | | | | 9804 Medical Center Drive | | 9950 Medical Center Drive |
| Seattle/Lake Union | | | | Maryland/Rockville | | Maryland/Rockville |
| 100,086 RSF | | | | 176,832 RSF | | 84,264 RSF |
| | | | | | |
| | | | | | | | | | | | | | | | | | | | |
| 700 Quince Orchard Road | | Alexandria Center® for Life Science – Durham(1) | | Alexandria Center® for AgTech | | Alexandria Center® for Advanced Technologies |
| Maryland/Gaithersburg | | Research Triangle/Research Triangle | | Research Triangle/Research Triangle | | Research Triangle/Research Triangle |
| 169,420 RSF | | 652,381 RSF | | 160,000 RSF | | 250,000 RSF |
| | | | | | |
(1) Represents 2400 Ellis Road in our Alexandria Center® for Life Science – Durham campus.
New Class A development and redevelopment properties: current projects (continued)
The following tables set forth a summary of our new Class A development and redevelopment properties under construction and pre-leased near-term projects as of December 31, 2020 (dollars in thousands):
| | | | | | | | | | | | | | | | | | | | | | | | | | | | | | | | | | | | | | | | | | | | | | | | | | | | | | | | | | | |
Property/Market/Submarket | | | | Square Footage | | Percentage | | | | | |
| Dev/Redev | | In Service | | CIP | | Total | | Leased | | Leased/Negotiating | | Initial Occupancy(1) | |
| Under construction | | | | | | | | | | | | | | | | | | | |
| The Arsenal on the Charles/Greater Boston/Cambridge/Inner Suburbs | | Redev | | 539,799 | | | 296,489 | | | 836,288 | | | 86 | % | | | 92 | % | | | | 2021 | | |
| 201 Haskins Way/San Francisco/South San Francisco | | Dev | | — | | | 315,000 | | | 315,000 | | | 100 | | | | 100 | | | | 2Q21 | |
Alexandria Center® for Life Science – San Carlos/San Francisco/ Greater Stanford | | Dev | | 96,463 | | | 429,715 | | | 526,178 | | | 89 | | | | 100 | | | | 4Q20 | |
| 3160 Porter Drive/San Francisco/Greater Stanford | | Redev | | — | | | 92,147 | | | 92,147 | | | 20 | | | | 20 | | | | | 1H21 | | |
Alexandria Center® – Long Island City/New York City/New York City | | Redev | | 54,377 | | | 122,382 | | | 176,759 | | | 31 | | | | 31 | | | | 4Q20 | |
| 3115 Merryfield Row/San Diego/Torrey Pines | | Dev | | — | | | 146,456 | | | 146,456 | | | 80 | | | | 87 | | | | | 2022 | | |
| 5505 Morehouse Drive/San Diego/Sorrento Mesa | | Redev | | — | | | 79,945 | | | 79,945 | | | 35 | | | | 35 | | | | | 2021 | | |
| 1165 Eastlake Avenue East/Seattle/Lake Union | | Dev | | — | | | 100,086 | | | 100,086 | | | 100 | | | | 100 | | | | 2Q21 | |
| Other/Seattle | | Redev | | 246,647 | | | 213,976 | | | 460,623 | | | 51 | | | | 51 | | | | | 2022 | | |
| 9804 Medical Center Drive/Maryland/Rockville | | Dev | | — | | | 176,832 | | | 176,832 | | | 100 | | | | 100 | | | | | 1Q21 | | |
| 9950 Medical Center Drive/Maryland/Rockville | | Dev | | — | | | 84,264 | | | 84,264 | | | 100 | | | | 100 | | | | | 2021 | | |
| 700 Quince Orchard Road/Maryland/Gaithersburg | | Redev | | — | | | 169,420 | | | 169,420 | | | 100 | | | | 100 | | | | | 2021 | | |
Alexandria Center® for Life Science – Durham/Research Triangle/ Research Triangle(2) | | Redev | | — | | | 652,381 | | | 652,381 | | | 77 | | | | 77 | | | | 1H21/2022 | |
Alexandria Center® for AgTech/Research Triangle/Research Triangle(3) | | Redev/Dev | | 180,400 | | | 160,000 | | | 340,400 | | | 55 | | | | 55 | | | | | 2021 | | |
Alexandria Center® for Advanced Technologies/Research Triangle/ Research Triangle | | Dev | | — | | | 250,000 | | | 250,000 | | (4) | 40 | | (4) | | 55 | | (4) | | 2H21/2022 | |
| | | | 1,117,686 | | | 3,289,093 | | | 4,406,779 | | | 74 | | | | 78 | | | | | | | |
| Pre-leased near-term projects | | | | | | | | | | | | | | | | | | | |
Alexandria Point/San Diego/University Town Center(5) | | Dev | | — | | | 171,102 | | | 171,102 | | | 100 | | | | 100 | | | | | | | |
SD Tech by Alexandria/San Diego/Sorrento Mesa(6) | | Dev | | — | | | 176,428 | | | 176,428 | | | 59 | | | | 59 | | | | | | | |
| | | | — | | | 347,530 | | | 347,530 | | | 79 | | | | 79 | | | | | | | |
| | | | 1,117,686 | | | 3,636,623 | | | 4,754,309 | | | 75 | % | | | 78 | % | | | | | | |
| Key additions in January 2021 | | | | | | | | | | | | | | | | | | | |
| 201 Brookline Avenue/Greater Boston/Fenway | | Dev | | — | | | 510,116 | | | 510,116 | | | 17 | % | | | 25 | % | | | | | | |
| 840 Winter Street/Greater Boston/Route 128 | | Redev | | 30,009 | | | 130,000 | | | 160,009 | | | 19 | % | | | 19 | % | | | | | | |
| | | | 30,009 | | | 640,116 | | | 670,125 | | | | | | | | | | | | |
| | | | 1,147,695 | | | 4,276,739 | | | 5,424,434 | | | | | | | | | | | | |
| | | | | | | | | | | | | | | | | | | |
(1)Initial occupancy dates are subject to leasing and/or market conditions. Construction disruptions resulting from COVID-19 and observance of social distancing measures may further impact construction and occupancy forecasts and will continue to be monitored closely. Multi-tenant projects may have occupancy by tenants over a period of time. Stabilized occupancy may vary depending on single tenancy versus multi-tenancy.
(2)The recently acquired Alexandria Center® for Life Science – Durham redevelopment project includes three properties at 40 Moore Drive, 2400 Ellis Road, and 14 TW Alexander Drive. 2400 Ellis Road is 100% leased, with initial occupancy anticipated in the first half of 2021 and stabilized occupancy expected for the remaining buildings in 2022.
(3)The new strategic collaborative agtech campus consists of Phase I at 5 Laboratory Drive, including campus amenities, and Phase II at 9 Laboratory Drive.
(4)Represents 150,000 RSF with 26% negotiating at 8 Davis Drive and 100,000 RSF that is 100% leased at 10 Davis Drive. Vertical construction at 8 Davis Drive has commenced, and 10 Davis Drive is expected to commence in the second quarter of 2021.
(5)Represents our 4150 Campus Point Court property and is expected to commence vertical construction in the second quarter of 2021.
(6)Represents our 10055 Barnes Canyon Road property and is expected to commence vertical construction in the second quarter of 2021.
New Class A development and redevelopment properties: current projects (continued)
| | | | | | | | | | | | | | | | | | | | | | | | | | | | | | | | | | | | | | | | | | | | | | | | | | | | | | | | | | | | | | |
| | Our Ownership Interest | | | | | | | | | | | Unlevered Yields |
Property/Market/Submarket | | | In Service | | CIP | | Cost to Complete | | Total at
Completion | | Initial Stabilized | | Initial Stabilized (Cash Basis) |
| | | | | | |
| Under construction | | | | | | | | | | | | | | | | | | | | |
| The Arsenal on the Charles/Greater Boston/Cambridge/Inner Suburbs | | 100 | % | | | $ | 391,180 | | | $ | 184,995 | | | $ | 195,825 | | | $ | 772,000 | | | | | 6.2 | % | | | | 5.5 | % | |
| 201 Haskins Way/San Francisco/South San Francisco | | 100 | % | | | — | | | 255,992 | | | $ | 114,008 | | | $ | 370,000 | | | | | 6.4 | % | | | | 6.2 | % | |
Alexandria Center® for Life Science – San Carlos/San Francisco/Greater Stanford | | 100 | % | | | 85,898 | | | 389,460 | | | $ | 154,642 | | | $ | 630,000 | | | | | 6.4 | % | | | | 6.1 | % | |
| 3160 Porter Drive/San Francisco/Greater Stanford | | 100 | % | | | — | | | 60,895 | | | TBD |
Alexandria Center® – Long Island City/New York City/New York City | | 100 | % | | | 33,683 | | | 125,929 | | | $ | 24,688 | | | $ | 184,300 | | | | | 5.5 | % | | | | 5.6 | % | |
| 3115 Merryfield Row/San Diego/Torrey Pines | | 100 | % | | | — | | | 66,609 | | | $ | 85,391 | | | $ | 152,000 | | | | | 6.2 | % | | | | 6.2 | % | |
| 5505 Morehouse Drive/San Diego/Sorrento Mesa | | 100 | % | | | — | | | 16,996 | | | TBD |
1165 Eastlake Avenue East/Seattle/Lake Union | | 100 | % | | | — | | | 106,061 | | | $ | 31,939 | | | $ | 138,000 | | | | | 6.5 | % | (1) | | | 6.3 | % | (1) |
| Other/Seattle | | 100 | % | | | 53,941 | | | 64,323 | | | TBD |
| 9804 Medical Center Drive/Maryland/Rockville | | 100 | % | | | — | | | 85,725 | | | $ | 9,675 | | | $ | 95,400 | | | | | 7.7 | % | | | | 7.2 | % | |
| 9950 Medical Center Drive/Maryland/Rockville | | 100 | % | | | — | | | 40,520 | | | $ | 13,780 | | | $ | 54,300 | | | | | 7.3 | % | | | | 6.8 | % | |
| 700 Quince Orchard Road/Maryland/Gaithersburg | | 100 | % | | | — | | | 45,887 | | | $ | 33,613 | | | $ | 79,500 | | | | | 8.6 | % | | | | 7.3 | % | |
Alexandria Center® for Life Science – Durham/Research Triangle/Research Triangle | | 100 | % | | | — | | | 134,451 | | | $ | 110,549 | | | $ | 245,000 | | | | | 7.5 | % | | | | 6.7 | % | |
Alexandria Center® for AgTech/Research Triangle/Research Triangle | | 100 | % | | | 90,001 | | | 57,394 | | | TBD |
Alexandria Center® for Advanced Technologies/Research Triangle/Research Triangle | | 100 | % | | | — | | | 32,605 | | |
| | | | | 654,703 | | | 1,667,842 | | | | | | | | | | | | | | |
| | | | | | | | | | | | | | | | | | | | |
| Pre-leased near-term projects | | | | | | | | | | | | | | | | | | | | |
| Alexandria Point/San Diego/University Town Center | | 55.0 | % | | | — | | | 26,922 | | | | | | | | | | | | | | |
| SD Tech by Alexandria/San Diego/Sorrento Mesa | | 50.0 | % | | | — | | | 15,310 | | | | | | | | | | | | | | |
| | | | | — | | | 42,232 | | | | | | | | | | | | | | |
| Total | | | | | $ | 654,703 | | | $ | 1,710,074 | | | | | | | | | | | | | | |
(1)Unlevered yields represent anticipated aggregate returns for 1165 Eastlake Avenue East, an amenity-rich research headquarters for Adaptive Biotechnologies Corporation, and 1208 Eastlake Avenue East, an adjacent multi-tenant office/laboratory building.
New Class A development and redevelopment properties: summary of pipeline
The following table summarizes the key information for all our development and redevelopment projects in North America as of December 31, 2020 (dollars in thousands):
| | | | | | | | | | | | | | | | | | | | | | | | | | | | | | | | | | | | | | | | | | | | | | | | | | |
| Property/Submarket | | Our Ownership Interest | | Book Value | | Square Footage | |
| | | Development and Redevelopment | | Total | |
| | | Under Construction | | Near
Term | | Intermediate Term | | Future | | |
| | | | | | | | | | | | | | | | |
| Greater Boston | | | | | | | | | | | | | | | | |
| The Arsenal on the Charles/Cambridge/Inner Suburbs | | 100 | % | | | $ | 202,801 | | | 296,489 | | | 264,056 | | (1)(2) | — | | | — | | | 560,545 | | |
| 325 Binney Street/Cambridge | | 100 | % | | | 128,666 | | | — | | | 450,000 | | (1) | — | | | — | | | 450,000 | | |
| 57 Coolidge Avenue/Cambridge/Inner Suburbs | | 75.0 | % | | | 47,461 | | | — | | | 275,000 | | (1) | — | | | — | | | 275,000 | | |
| 15 Necco Street/Seaport Innovation District | | 97.1 | % | | | 185,049 | | | — | | | 350,000 | | (1) | — | | | — | | | 350,000 | | |
| Reservoir Woods/Route 128 | | 100 | % | | | 42,246 | | | — | | | 202,428 | | (1)(2) | — | | | 752,845 | | (2) | 955,273 | | |
| 10 Necco Street/Seaport Innovation District | | 100 | % | | | 91,032 | | | — | | | — | | | 175,000 | | | — | | | 175,000 | | |
| 215 Presidential Way/Route 128 | | 100 | % | | | 6,803 | | | — | | | — | | | 112,000 | | | — | | | 112,000 | | |
Alexandria Technology Square®/Cambridge | | 100 | % | | | 7,881 | | | — | | | — | | | — | | | 100,000 | | | 100,000 | | |
| 380 and 420 E Street/Seaport Innovation District | | 100 | % | | | 115,818 | | | — | | | — | | | — | | | 1,000,000 | | (2) | 1,000,000 | | |
| 99 A Street/Seaport Innovation District | | 95.5 | % | | | 44,700 | | | — | | | — | | | — | | | 235,000 | | | 235,000 | | |
| One Upland Road and 100 Tech Drive/Route 128 | | 100 | % | | | 8,498 | | | — | | | — | | | — | | | 750,000 | | | 750,000 | | |
| 231 Second Avenue/Route 128 | | 100 | % | | | 1,093 | | | — | | | — | | | — | | | 32,000 | | | 32,000 | | |
| Other value-creation projects | | 100 | % | | | 9,774 | | | — | | | — | | | — | | | 16,955 | | | 16,955 | | |
| | | | | 891,822 | | | 296,489 | | | 1,541,484 | | | 287,000 | | | 2,886,800 | | | 5,011,773 | | |
| San Francisco | | | | | | | | | | | | | | | | |
| 201 Haskins Way/South San Francisco | | 100 | % | | | 255,992 | | | 315,000 | | | — | | | — | | | — | | | 315,000 | | |
Alexandria Center® for Life Science – San Carlos/Greater Stanford | | 100 | % | | | 641,372 | | | 429,715 | | | — | | | 700,000 | | (2) | 587,000 | | (2) | 1,716,715 | | |
| 3160 Porter Drive/Greater Stanford | | 100 | % | | | 60,895 | | | 92,147 | | | — | | | — | | | — | | | 92,147 | | |
| 88 Bluxome Street/SoMa | | 100 | % | | | 300,025 | | | — | | | 1,070,925 | | | — | | | — | | | 1,070,925 | | |
Alexandria Technology Center® – Gateway/South San Francisco | | 45.1 | % | | | 45,814 | | | — | | | 517,010 | | (1)(2) | — | | | 291,000 | | | 808,010 | | |
| 3825 and 3875 Fabian Way/Greater Stanford | | 100 | % | | | — | | | — | | | — | | | 250,000 | | (2) | 228,000 | | (2) | 478,000 | | |
| 3450 and 3460 Hillview Avenue/Greater Stanford | | 100 | % | | | — | | | — | | | — | | | 76,951 | | (2) | — | | | 76,951 | | |
| East Grand Avenue/South San Francisco | | 100 | % | | | 6,112 | | | — | | | — | | | — | | | 90,000 | | | 90,000 | | |
| Other value-creation projects | | 100 | % | | | 55,379 | | | — | | | — | | | 191,000 | | | 25,000 | | | 216,000 | | |
| | | | | $ | 1,365,589 | | | 836,862 | | | 1,587,935 | | | 1,217,951 | | | 1,221,000 | | | 4,863,748 | | |
| | | | | | | | | | | | | | | | |
(1)We expect to commence vertical construction or redevelopment of all or a portion of this project in 2021. (2)Represents total square footage upon completion of development or redevelopment of a new Class A property. Square footage presented includes RSF of buildings currently in operation at properties that also have inherent future development or redevelopment opportunities, for which we have the intent to demolish or redevelop the existing property upon expiration of the existing in-place leases and commencement of future construction. Refer to the definition of “Investments in real estate – value-creation square footage currently in rental properties” in the “Non-GAAP measures and definitions” section under Item 7 in this annual report on Form 10-K for additional information. |
New Class A development and redevelopment properties: summary of pipeline (continued)
| | | | | | | | | | | | | | | | | | | | | | | | | | | | | | | | | | | | | | | | | | | | | | | | | | |
| Property/Submarket | | Our Ownership Interest | | Book Value | | Square Footage | |
| | | Development and Redevelopment | | Total | |
| | | Under Construction | | Near
Term | | Intermediate Term | | Future | | |
| | | | | | | | | | | | | | | | |
| New York City | | | | | | | | | | | | | | | | |
Alexandria Center® – Long Island City/New York City | | 100 | % | | | $ | 125,929 | | | 122,382 | | | — | | | — | | | — | | | 122,382 | | |
| 47-50 30th Street/New York City | | 100 | % | | | 29,351 | | | — | | | 135,938 | | | — | | | — | | | 135,938 | | |
Alexandria Center® for Life Science – New York City/New York City | | 100 | % | | | 58,381 | | | — | | | — | | | 550,000 | | (1) | — | | | 550,000 | | |
| 219 East 42nd Street/New York City | | 100 | % | | | — | | | — | | | — | | | — | | | 579,947 | | (2) | 579,947 | | |
| | | | | 213,661 | | | 122,382 | | | 135,938 | | | 550,000 | | | 579,947 | | | 1,388,267 | | |
| San Diego | | | | | | | | | | | | | | | | |
| 3115 Merryfield Row/Torrey Pines | | 100 | % | | | 66,609 | | | 146,456 | | | — | | | — | | | — | | | 146,456 | | |
| 5505 Morehouse Drive/Sorrento Mesa | | 100 | % | | | 16,996 | | | 79,945 | | | — | | | — | | | — | | | 79,945 | | |
| Alexandria Point/University Town Center | | 55.0 | % | | | 104,646 | | | — | | | 351,102 | | (3) | 249,164 | | (4) | 320,281 | | (4) | 920,547 | | |
| SD Tech by Alexandria/Sorrento Mesa | | 50.0 | % | | | 99,681 | | | — | | | 366,502 | | (3) | 160,000 | | | 333,845 | | | 860,347 | | |
| Townsgate by Alexandria/Del Mar Heights | | 100 | % | | | 22,424 | | | — | | | 185,000 | | | — | | | — | | | 185,000 | | |
| 10931 and 10933 Torrey Pines Road/Torrey Pines | | 100 | % | | | — | | | — | | | — | | | 242,000 | | (4) | — | | | 242,000 | | |
| University District/University Town Center | | 100 | % | | | 54,020 | | | — | | | — | | | 600,000 | | (4)(5) | — | | | 600,000 | | |
| 11255 and 11355 North Torrey Pines Road/Torrey Pines | | 100 | % | | | 106,889 | | | — | | | — | | | — | | | 240,000 | | (4) | 240,000 | | |
| 5200 Illumina Way/University Town Center | | 51.0 | % | | | 12,302 | | | — | | | — | | | — | | | 451,832 | | | 451,832 | | |
| 6450 Sequence Drive and Excess Land/Sorrento Mesa | | 100 | % | | | 35,834 | | | — | | | — | | | — | | | 911,915 | | (4) | 911,915 | | |
| 4045 and 4075 Sorrento Valley Boulevard/Sorrento Valley | | 100 | % | | | 7,671 | | | — | | | — | | | — | | | 149,000 | | (4) | 149,000 | | |
| Other value-creation projects | | 100 | % | | | — | | | — | | | — | | | — | | | 50,000 | | | 50,000 | | |
| | | | | $ | 527,072 | | | 226,401 | | | 902,604 | | | 1,251,164 | | | 2,456,873 | | | 4,837,042 | | |
(1)We are currently negotiating a long-term ground lease with the City of New York for the future site of a new building approximating 550,000 RSF. (2)Includes 349,947 RSF in operation with an opportunity either to convert the existing office space into office/laboratory space through future redevelopment or to expand the building by an additional 230,000 RSF through ground-up development. The building is currently occupied by Pfizer Inc. with a remaining lease term of approximately five years. (3)We expect to commence vertical construction or redevelopment of all or a portion of this project during 2021. (4)Represents total square footage upon completion of development or redevelopment of a new Class A property. Square footage presented includes RSF of buildings currently in operation at properties that also have inherent future development or redevelopment opportunities, for which we have the intent to demolish or redevelop the existing property upon expiration of the existing in-place leases and commencement of future construction. Refer to the definition of “Investments in real estate – value-creation square footage currently in rental properties” in the “Non-GAAP measures and definitions” section under Item 7 in this annual report on Form 10-K for additional information. (5)Includes our recently acquired project at 4555 Executive Drive and 9363, 9373, and 9393 Towne Centre Drive in our University Town Center submarket, which is currently under evaluation for development, subject to future market conditions. |
New Class A development and redevelopment properties: summary of pipeline (continued)
| | | | | | | | | | | | | | | | | | | | | | | | | | | | | | | | | | | | | | | | | | | | | | | | | | |
| Property/Submarket | | Our Ownership Interest | | Book Value | | Square Footage | |
| | | Development and Redevelopment | | Total | |
| | | Under Construction | | Near
Term | | Intermediate Term | | Future | | |
| | | | | | | | | | | | | | | | |
| Seattle | | | | | | | | | | | | | | | | |
| 1165 Eastlake Avenue East/Lake Union | | 100 | % | | | $ | 106,061 | | | 100,086 | | | — | | | — | | | — | | | 100,086 | | |
| 1150 Eastlake Avenue East/Lake Union | | 100 | % | | | 49,196 | | | — | | | 260,000 | | (1) | — | | | — | | | 260,000 | | |
| 701 Dexter Avenue North/Lake Union | | 100 | % | | | 53,612 | | | — | | | 217,000 | | | — | | | — | | | 217,000 | | |
| 601 Dexter Avenue North/Lake Union | | 100 | % | | | 35,356 | | | — | | | — | | | — | | | 188,400 | | (2) | 188,400 | | |
| 1010 4th Avenue South/SoDo | | 100 | % | | | 49,278 | | | — | | | — | | | — | | | 544,825 | | | 544,825 | | |
| 830 4th Avenue South/SoDo | | 100 | % | | | — | | | — | | | — | | | — | | | 52,488 | | (2) | 52,488 | | |
| Other value-creation projects | | 100 | % | | | 70,304 | | | 213,976 | | | 51,255 | | (2) | — | | | 35,000 | | | 300,231 | | |
| | | | | 363,807 | | | 314,062 | | | 528,255 | | | — | | | 820,713 | | | 1,663,030 | | |
| Maryland | | | | | | | | | | | | | | | | |
| 9804 and 9800 Medical Center Drive/Rockville | | 100 | % | | | 87,765 | | | 176,832 | | | 90,000 | | (1) | — | | | — | | | 266,832 | | |
| 9950 Medical Center Drive/Rockville | | 100 | % | | | 40,520 | | | 84,264 | | | — | | | — | | | — | | | 84,264 | | |
| 700 Quince Orchard Road/Gaithersburg | | 100 | % | | | 45,887 | | | 169,420 | | | — | | | — | | | — | | | 169,420 | | |
| 14200 Shady Grove Road/Rockville | | 100 | % | | | 28,668 | | | — | | | 145,000 | | | 145,000 | | | 145,000 | | | 435,000 | | |
| | | | | 202,840 | | | 430,516 | | | 235,000 | | | 145,000 | | | 145,000 | | | 955,516 | | |
| Research Triangle | | | | | | | | | | | | | | | | |
Alexandria Center® for Life Science – Durham/Research Triangle | | 100 | % | | | 134,451 | | | 652,381 | | | — | | | — | | | — | | | 652,381 | | |
Alexandria Center® for Advanced Technologies/Research Triangle | | 100 | % | | | 48,769 | | | 250,000 | | | — | | | 70,000 | | | 700,000 | | | 1,020,000 | | |
Alexandria Center® for AgTech, Phase II/Research Triangle | | 100 | % | | | 57,394 | | | 160,000 | | | — | | | — | | | — | | | 160,000 | | |
| Other value-creation projects | | 100 | % | | | 4,185 | | | — | | | — | | | — | | | 76,262 | | | 76,262 | | |
| | | | | 244,799 | | | 1,062,381 | | | — | | | 70,000 | | | 776,262 | | | 1,908,643 | | |
| Other value-creation projects | | 100 | % | | | 4,857 | | | — | | | — | | | — | | | 322,200 | | | 322,200 | | |
Total pipeline as of December 31, 2020 | | | | | $ | 3,814,447 | | | 3,289,093 | | | 4,931,216 | | | 3,521,115 | | | 9,208,795 | | | 20,950,219 | | (3) |
| | | | | | | | | | | | | | | | |
| Key subsequent and pending acquisitions | | | | | | | | | | | | | | | | |
Alexandria Center® for Life Science – Fenway/Fenway | | | | | | | 510,116 | | | — | | | 305,000 | | | — | | | 815,116 | | |
| 840 Winter Street/Route 128 | | | | | | | 130,000 | | | — | | | — | | | — | | | 130,000 | | |
| Mercer Mega Block/Lake Union | | | | | | | — | | | 800,000 | | | — | | | — | | | 800,000 | | |
| | | | | | | | | | | | | | | | |
| | | | | | | | | | | | | | | | |
| | | | | | | 3,929,209 | | | 5,731,216 | | | 3,826,115 | | | 9,208,795 | | | 22,695,335 | | |
(1)We expect to commence vertical construction or redevelopment of all or a portion of this project during 2021.
(2)Represents total square footage upon completion of development or redevelopment of a new Class A property. Square footage presented includes RSF of buildings currently in operation at properties that also have inherent future development or redevelopment opportunities, for which we have the intent to demolish or redevelop the existing property upon expiration of the existing in-place leases and commencement of future construction. Refer to the definition of “Investments in real estate – value-creation square footage currently in rental properties” in the “Non-GAAP measures and definitions” section under Item 7 in this annual report on Form 10-K for additional information.
(3)Total square footage includes 3,111,997 RSF of buildings currently in operation that will be redeveloped or replaced with new development RSF upon commencement of future construction. Refer to the definition of “Investments in real estate – value-creation square footage currently in rental properties” in the “Non-GAAP measures and definitions” section under Item 7 in this annual report on Form 10-K for additional information.
Summary of capital expenditures
Our construction spending for the year ended December 31, 2020, consisted of the following (in thousands):
| | | | | | | | | | | |
| | Year Ended | |
| Construction Spending | | December 31, 2020 | |
| Additions to real estate – consolidated projects | | $ | 1,445,171 | | |
| Investments in unconsolidated real estate joint ventures | | 3,444 | | |
| Contributions from noncontrolling interests | | (22,045) | | |
| Construction spending (cash basis) | | 1,426,570 | | |
| Change in accrued construction | | 29,819 | | |
| Construction spending | | $ | 1,456,389 | | |
| | | |
| | | |
The following table summarizes the total projected construction spending for the year ending December 31, 2021, which includes interest, property taxes, insurance, payroll, and other indirect project costs (in thousands):
| | | | | | | | | | | |
| | Year Ending | |
| Projected Construction Spending | | December 31, 2021 | |
| Development, redevelopment, and pre-construction projects | | $ | 1,625,000 | | |
| Contributions from noncontrolling interests (consolidated real estate joint ventures) | | (100,000) | | |
| Revenue-enhancing and repositioning capital expenditures | | 150,000 | | |
| Non-revenue-enhancing capital expenditures | | 65,000 | | |
| Guidance midpoint | | $ | 1,740,000 | | |
| | | |
ITEM 3. LEGAL PROCEEDINGS
To our knowledge, no legal proceedings are pending against us, other than routine actions and administrative proceedings, and other actions not deemed material, substantially all of which are expected to be covered by liability insurance and which, in the aggregate, are not expected to have a material adverse effect on our financial condition, results of operations, or cash flows.
ITEM 4. MINE SAFETY DISCLOSURES
Not applicable.
PART II
ITEM 5. MARKET FOR REGISTRANT’S COMMON EQUITY, RELATED STOCKHOLDER MATTERS, AND ISSUER PURCHASES OF EQUITY SECURITIES
Our common stock is traded on the NYSE under the symbol “ARE.” On January 15, 2021, the last reported sales price per share of our common stock was $168.37, and there were 597 holders of record of our common stock (excluding beneficial owners whose shares are held in the name of Cede & Co.).
To maintain our qualification as a REIT, we must make annual distributions to stockholders of at least 90% of our taxable income for the current taxable year, determined without regard to deductions for dividends paid and excluding any net capital gains. Under certain circumstances, we may be required to make distributions in excess of cash flows available for distributions to meet these distribution requirements. In such a case, we may borrow funds or may raise funds through the issuance of additional debt or equity capital. No dividends can be paid on our common stock unless we have paid full cumulative dividends on our preferred stock. From the date of issuance of our preferred stock through December 31, 2020, we have paid full cumulative dividends on our preferred stock. As of December 31, 2020, we had no outstanding shares of preferred stock. Future distributions on our common stock will be determined by, and made at the discretion of, our Board of Directors and will depend on a number of factors, including actual cash available for distribution to our stockholders, our financial condition and capital requirements, the annual distribution requirements under the REIT provisions of the Internal Revenue Code, restrictions under Maryland law, and such other factors as our Board of Directors deems relevant. We cannot assure our stockholders that we will make any future distributions.
Refer to “Item 12. Security ownership of certain beneficial owners and management and related stockholder matters” in this annual report on Form 10-K for information on securities authorized for issuance under equity compensation plans.
ITEM 6. SELECTED FINANCIAL DATA
The following table should be read in conjunction with our consolidated financial statements and notes thereto appearing elsewhere in this annual report on Form 10-K. Refer to “Item 15. Exhibits and financial statement schedules.”
| | | | | | | | | | | | | | | | | | | | | | | | | | | | | | | | |
| | Year Ended December 31, |
| (In thousands, except per share amounts) | | 2020 | | 2019 | | 2018 | | 2017 | | 2016 |
Operating Data: | | | | | | | | | | |
Revenues: | | | | | | | | | | |
Income from rentals | | $ | 1,878,208 | | | $ | 1,516,864 | | | $ | 1,314,781 | | | $ | 1,122,325 | | | $ | 897,475 | |
Other income | | 7,429 | | | 14,432 | | | 12,678 | | | 5,772 | | | 24,231 | |
Total revenues | | 1,885,637 | | | 1,531,296 | | | 1,327,459 | | | 1,128,097 | | | 921,706 | |
Expenses: | | | | | | | | | | |
Rental operations | | 530,224 | | | 445,492 | | | 381,120 | | | 325,609 | | | 278,408 | |
General and administrative | | 133,341 | | | 108,823 | | | 90,405 | | | 75,009 | | | 63,884 | |
Interest | | 171,609 | | | 173,675 | | | 157,495 | | | 128,645 | | | 106,953 | |
Depreciation and amortization | | 698,104 | | | 544,612 | | | 477,661 | | | 416,783 | | | 313,390 | |
Impairment of real estate | | 48,078 | | | 12,334 | | | 6,311 | | | 203 | | | 209,261 | |
Loss on early extinguishment of debt | | 60,668 | | | 47,570 | | | 1,122 | | | 3,451 | | | 3,230 | |
Total expenses | | 1,642,024 | | | 1,332,506 | | | 1,114,114 | | | 949,700 | | | 975,126 | |
| Equity in earnings (losses) of unconsolidated real estate JVs | | 8,148 | | | 10,136 | | | 43,981 | | | 15,426 | | | (184) | |
| Investment income | | 421,321 | | | 194,647 | | | 136,763 | | | — | | | — | |
Gain on sales of real estate – rental properties | | 154,089 | | | 474 | | | 8,704 | | | 270 | | | 3,715 | |
Gain on sales of real estate – land parcels | | — | | | — | | | — | | | 111 | | | 90 | |
| Net income (loss) | | 827,171 | | | 404,047 | | | 402,793 | | | 194,204 | | | (49,799) | |
Net income attributable to noncontrolling interests | | (56,212) | | | (40,882) | | | (23,481) | | | (25,111) | | | (16,102) | |
| Net income (loss) attributable to Alexandria Real Estate Equities, Inc.’s stockholders | | 770,959 | | | 363,165 | | | 379,312 | | | 169,093 | | | (65,901) | |
Dividends on preferred stock | | — | | | (3,204) | | | (5,060) | | | (7,666) | | | (20,223) | |
Preferred stock redemption charge | | — | | | (2,580) | | | (4,240) | | | (11,279) | | | (61,267) | |
Net income attributable to unvested restricted stock awards | | (10,168) | | | (6,386) | | | (6,029) | | | (4,753) | | | (3,750) | |
| Net income (loss) attributable to Alexandria Real Estate Equities, Inc.’s common stockholders | | $ | 760,791 | | | $ | 350,995 | | | $ | 363,983 | | | $ | 145,395 | | | $ | (151,141) | |
| Net income (loss) per share attributable to Alexandria Real Estate Equities, Inc.'s common stockholders: | | | | | | | | | | |
| Basic | | $ | 6.03 | | | $ | 3.13 | | | $ | 3.53 | | | $ | 1.59 | | | $ | (1.99) | |
| Diluted | | $ | 6.01 | | | $ | 3.12 | | | $ | 3.52 | | | $ | 1.58 | | | $ | (1.99) | |
| Weighted-average shares of common stock outstanding – basic | | 126,106 | | | 112,204 | | | 103,010 | | | 91,546 | | | 76,103 | |
| Weighted-average shares of common stock outstanding – diluted | | 126,490 | | | 112,524 | | | 103,321 | | | 92,063 | | | 76,103 | |
Dividends declared per share of common stock | | $ | 4.24 | | | $ | 4.00 | | | $ | 3.73 | | | $ | 3.45 | | | $ | 3.23 | |
| | | | | | | | | | | | | | | | | | | | | | | | | | | | | | | | |
Balance Sheet Data (at year end): | | | | | | | | | | |
Investments in real estate | | $ | 18,092,372 | | | $ | 14,844,038 | | | $ | 11,913,693 | | | $ | 10,298,019 | | | $ | 9,077,972 | |
Total assets | | $ | 22,827,878 | | | $ | 18,390,503 | | | $ | 14,464,956 | | | $ | 12,103,953 | | | $ | 10,354,888 | |
Total debt | | $ | 7,563,286 | | | $ | 6,777,479 | | | $ | 5,478,255 | | | $ | 4,764,807 | | | $ | 4,164,025 | |
Total liabilities | | $ | 9,384,100 | | | $ | 8,224,025 | | | $ | 6,570,242 | | | $ | 5,620,784 | | | $ | 4,972,610 | |
Redeemable noncontrolling interests | | $ | 11,342 | | | $ | 12,300 | | | $ | 10,786 | | | $ | 11,509 | | | $ | 11,307 | |
Total equity | | $ | 13,432,436 | | | $ | 10,154,178 | | | $ | 7,883,928 | | | $ | 6,471,660 | | | $ | 5,370,971 | |
ITEM 6. SELECTED FINANCIAL DATA (CONTINUED)
| | | | | | | | | | | | | | | | | | | | | | | | | | | | | | | | |
| | Year Ended December 31, |
| (Dollars in thousands, except per occupied RSF amounts) | | 2020 | | 2019 | | 2018 | | 2017 | | 2016 |
Other Data: | | | | | | | | | | |
| Net cash provided by operating activities | | $ | 882,510 | | | $ | 683,857 | | | $ | 570,339 | | | $ | 450,882 | | | $ | 393,487 | |
| Net cash used in investing activities | | $ | 3,278,161 | | | $ | 3,641,320 | | | $ | 2,161,760 | | | $ | 1,737,126 | | | $ | 1,498,406 | |
| Net cash provided by financing activities | | $ | 2,750,356 | | | $ | 2,927,482 | | | $ | 1,588,433 | | | $ | 1,420,341 | | | $ | 1,093,775 | |
Number of properties – North America | | 338 | | | 291 | | | 237 | | | 213 | | | 199 | |
RSF – North America (including development and redevelopment projects under construction) | | 35,163,572 | | 29,098,433 | | 24,587,438 | | 21,981,133 | | 19,869,729 |
Occupancy of operating properties – North America | | 94.6% | | 96.8% | | 97.3% | | 96.8% | | 96.6% |
Occupancy of operating and redevelopment properties – North America | | 90.0% | | 94.4% | | 95.1% | | 94.7% | | 95.7% |
Annual rental revenue per occupied RSF – North America | | $ | 49.08 | | | $ | 51.04 | | | $ | 48.42 | | | $ | 48.01 | | | $ | 45.15 | |
| | | | | | | | | | |
| Reconciliation of net income (loss) attributable to Alexandria's common stockholders to funds from operations attributable to Alexandria's common stockholders – diluted: | | | | | | | | | | |
| Net income (loss) attributable to Alexandria Real Estate Equities, Inc.’s common stockholders | | $ | 760,791 | | | $ | 350,995 | | | $ | 363,983 | | | $ | 145,395 | | | $ | (151,141) | |
Depreciation and amortization of real estate assets | | 684,682 | | | 541,855 | | | 477,661 | | | 416,783 | | | 313,390 | |
Noncontrolling share of depreciation and amortization from consolidated real estate JVs | | (61,933) | | | (30,960) | | | (16,077) | | | (14,762) | | | (9,349) | |
Our share of depreciation and amortization from unconsolidated real estate JVs(1) | | 11,413 | | | 6,366 | | | 3,181 | | | 1,551 | | | 2,707 | |
Gain on sales of real estate – rental properties | | (154,089) | | | (474) | | | (8,704) | | | (270) | | | (3,715) | |
Our share of gain on sales of real estate from unconsolidated real estate JVs(1) | | — | | | — | | | (35,678) | | | (14,106) | | | — | |
Gain on sales of real estate – land parcels | | — | | | — | | | — | | | (111) | | | (90) | |
Impairment of real estate – rental properties | | 40,501 | | (3) | 12,334 | | | — | | | 203 | | | 98,194 | |
Assumed conversion of 7.00% Series D cumulative convertible preferred stock(2) | | — | | | 3,204 | | | 5,060 | | | — | | | — | |
| Allocation to unvested restricted stock awards | | (7,018) | | | (5,904) | | | (5,961) | | | (2,920) | | | — | |
Funds from operations attributable to Alexandria’s common stockholders – diluted(4) | | 1,274,347 | | | 877,416 | | | 783,465 | | | 531,763 | | | 249,996 | |
| Unrealized gains on non-real estate investments | | (374,033) | | | (161,489) | | | (99,634) | | | — | | | — | |
| Realized gains on non-real estate investments | | — | | | — | | | (14,680) | | | — | | | (4,361) | |
| Impairment of real estate | | 15,221 | | | — | | | 6,311 | | | — | | | 110,474 | |
Impairment of non-real estate investments | | 24,482 | | | 17,124 | | | 5,483 | | | 8,296 | | | 3,065 | |
Loss on early extinguishment of debt | | 60,668 | | | 47,570 | | | 1,122 | | | 3,451 | | | 3,230 | |
Loss on early termination of interest rate hedge agreements | | — | | | 1,702 | | | — | | | — | | | — | |
| Termination fee | | (86,179) | | | — | | | — | | | — | | | — | |
| Acceleration of stock compensation expense due to executive officer resignation | | 4,499 | | | — | | | — | | | — | | | — | |
Our share of gain on early extinguishment of debt from unconsolidated real estate JVs(1) | | — | | | — | | | (761) | | | — | | | — | |
Preferred stock redemption charge | | — | | | 2,580 | | | 4,240 | | | 11,279 | | | 61,267 | |
Removal of assumed conversion of 7.00% Series D cumulative convertible preferred stock(2) | | — | | | (3,204) | | | (5,060) | | | — | | | — | |
Allocation to unvested restricted stock awards | | 4,790 | | | 1,307 | | | 1,517 | | | (321) | | | (2,356) | |
Funds from operations attributable to Alexandria’s common stockholders – diluted, as adjusted(4) | | $ | 923,795 | | | $ | 783,006 | | | $ | 682,003 | | | $ | 554,468 | | | $ | 421,315 | |
(1)Classified in equity in earnings from unconsolidated real estate joint ventures in our consolidated statements of operations under Item 15 in this annual report on Form 10-K.
(2)Refer to “Weighted-average shares of common stock outstanding – diluted” in the “Non-GAAP measures and definitions” section under Item 7 in this annual report on Form 10-K for additional information.
(3)Includes a $7.6 million impairment of our investment in a recently developed retail property held by our unconsolidated real estate joint venture recognized during the three months ended March 31, 2020. This impairment is classified in equity in earnings of unconsolidated real estate joint ventures within our consolidated statements of operations.
(4)Refer to “Funds from operations and funds from operations, as adjusted, attributable to Alexandria Real Estate Equities, Inc.’s common stockholders” in the “Non-GAAP measures and definitions” section under Item 7 in this annual report on Form 10-K.
ITEM 7. MANAGEMENT’S DISCUSSION AND ANALYSIS OF FINANCIAL CONDITION AND RESULTS OF OPERATIONS
The following discussion should be read in conjunction with our consolidated financial statements and notes thereto under “Item 15. Exhibits and financial statement schedules” in this annual report on Form 10-K. Forward-looking statements involve inherent risks and uncertainties regarding events, conditions, and financial trends that may affect our future plans of operations, business strategy, results of operations, and financial position. A number of important factors could cause actual results to differ materially from those included within or contemplated by such forward-looking statements, including, but not limited to, those described under “Item 7. Management’s discussion and analysis of financial condition and results of operations” in this annual report on Form 10-K. We do not undertake any responsibility to update any of these factors or to announce publicly any revisions to any of the forward-looking statements contained in this or any other document, whether as a result of new information, future events, or otherwise.
As used in this annual report on Form 10-K, references to the “Company,” “Alexandria,” “we,” “us,” and “our” refer to Alexandria Real Estate Equities, Inc. and its consolidated subsidiaries.
The COVID-19 pandemic
In December 2019, a novel coronavirus, which causes respiratory illness and spreads from person to person (COVID-19), was first identified during an investigation into an outbreak in Wuhan, China. The first case of COVID-19 in the U.S. was reported on January 20, 2020. On March 11, 2020, the World Health Organization declared COVID-19 a pandemic, and on March 13, 2020, the U.S. declared a national emergency with respect to COVID-19. As of January 29, 2021, according to the World Health Organization, over 101.0 million novel coronavirus cases have been reported worldwide. The U.S. has reported more than 25.3 million cases of COVID-19 and over 425,670 deaths as of January 29, 2021.
COVID-19 disease, treatment, and measures to combat the pandemic
Most patients with COVID-19 have had mild to severe respiratory illness with symptoms of fever, chills, cough, shortness of breath, fatigue, and loss of taste. Many individuals with COVID-19 are asymptomatic and show limited to no symptoms, highlighting the ongoing challenge of containing the continued spread of COVID-19. Some patients develop pneumonia in both lungs and/or multi-organ failure, which in some cases leads to death. Since scientists shared the virus’s genetic makeup in January 2020, intense research has been underway around the world to develop treatments and vaccines for COVID-19. This has led to the FDA issuing Emergency Use Authorizations (“EUA”s) for therapeutics to treat patients with COVID-19 and, most recently, approving two vaccines for use in the prevention of coronavirus disease caused by COVID-19.
The two approved vaccines were created by Pfizer Inc. (in partnership with BioNTech) and Moderna, Inc. (in partnership with the National Institutes of Health), each a tenant of ours. The U.S. began a large-scale COVID-19 vaccination campaign in December 2020. As of January 29, 2021, according to the U.S. Centers for Disease Control and Prevention, over 4.7 million individuals in the U.S. have been fully vaccinated for COVID-19, and the U.S. will continue to roll out vaccines across the nation, prioritizing frontline and essential workers, the elderly, and individuals considered high risk.
Although the U.S. FDA has approved two vaccines and certain therapies for use as of the date of this report, the initial rollout of vaccine distribution has encountered significant delays, and uncertainties remain as to the amount of vaccine available for distribution, the logistics of implementing a national vaccine program, and the overall efficacy of the vaccines once widely administered, especially as new strains of COVID-19 have been discovered, and the level of resistance these new strains have to the existing vaccines, if any, remains unknown.
In response to the supply and distribution issues surrounding the vaccine, in January 2021, President Biden outlined a plan to create additional vaccination sites, increase the supply and distribution of vaccines, and increase the number of vaccinations administered to Americans. The Biden administration plans to utilize the Defense Production Act to maximize the manufacturing and distribution of vaccines in order to administer 100 million vaccination shots within the first 100 days of holding office.
In addition to the currently approved vaccines, as of January 29, 2021, there are over 60 other potential vaccines in clinical development that may contribute to increasing the supply of vaccines in 2021. The current vaccines in development use a myriad of different scientific approaches to attempt to provoke an immune response, including:
•Genetic vaccines that use part of the coronavirus’s genetic code;
•Viral vector vaccines that use a virus to deliver coronavirus genes into cells;
•Protein-based vaccines that use a coronavirus protein or protein fragment to stimulate the immune system; and
•Whole-virus vaccines that use a weakened or inactivated version of the coronavirus.
Over 60 potential vaccines are currently in human clinical trials, with nearly a third of these in later stages of clinical development. Phase I trials typically include a small number of participants to test safety and dosage as well as to confirm that the vaccine stimulates the immune system. Phase II trials involve hundreds of participants split into groups, such as children and the elderly, to determine whether the vaccine acts differently in each subpopulation. Phase III trials involve delivering the vaccine to tens of thousands of people, observing how many subsequently become infected, and determining the severity of symptoms when compared with volunteer subjects who received a placebo. Regulators in each country will review the trial results to make a determination as to
whether the drug or vaccine should be approved. As of January 29, 2021, there were 20 potential vaccines in Phase III trials, including a number that require only a single dose, rather than two doses for the currently approved vaccines and that are potentially easier to distribute.
Shelter-in-place and stay-at-home orders
On March 19, 2020, California became the first state to set mandatory stay-at-home restrictions to help combat the spread of the coronavirus. The order included the shutdown of all nonessential services, such as dine-in restaurants, bars, gyms, conference or convention centers, and other businesses not deemed to support critical infrastructure. Exceptions for essential services, such as grocery stores, pharmacies, gas stations, food banks, convenience stores, and delivery restaurants, have allowed these services to remain open. Subsequently, almost all states issued similar orders, including New York, Massachusetts, Washington, Maryland, and North Carolina, where our remaining properties outside California are located. Countries around the world also implemented measures to slow the spread of the coronavirus, from national quarantines to school closures or similar types of stay-at-home orders or movement limitations.
Most state orders expired or were rescinded between May and early June 2020, and authorities began reopening businesses, including retail stores, restaurants, bars, salons, houses of worship, entertainment venues such as movie theaters and museums, and manufacturing facilities and offices. Daily new COVID-19 cases in the U.S., which had declined to approximately 18,000 new daily cases by June 9, 2020, from the low- to mid-30,000 daily range in April 2020, began to surge, leading to additional restrictions in many parts of the country. Additionally, in recent months, new COVID-19 variants were discovered in the U.K, among other countries, which have spread globally, including the U.S. While these strains do not appear to cause more severe symptoms in individuals, they have shown to be more infectious than the original strain discovered in China. As a result, more stringent lockdown restrictions have been implemented globally and within the U.S. On January 29, 2021, according to the World Health Organization, 155,203 new cases and 4,100 deaths were reported in the U.S.
Impact to the global and U.S. economy
As a result of the unprecedented measures taken in the U.S. and around the world, the disruption and impact to the U.S. and global economies and financial markets by the COVID-19 pandemic have been significant. In January 2021, the IMF estimated that the global and U.S. economies contracted by 3.5% and 3.4%, respectively, during 2020, in contrast to the expansion of 3.3% and 2.0%, respectively, that IMF projected for the year 2020 in January 2020. However, multiple vaccine approvals have raised hopes for an eventual end to the pandemic, and the rollout of vaccines has contributed to the positive global and U.S. growth projections for 2021, as estimated by IMF in January 2021, of 5.5% and 5.1%, respectively. These projections may be negatively impacted by potential new strains of the virus, renewed lockdowns, or logistical problems with vaccine distribution.
Based on the data provided by the U.S. Bureau of Labor Statistics on January 8, 2021, the unemployment rate in the U.S. is up by 3.2% since February 2020 to 6.7%. The December 2020 data reported 140 thousand jobs lost in December 2020. Stock markets around the globe have rebounded substantially since March 2020; however, since the pandemic was declared, access to capital has become much more challenging for most companies or non-existent for some.
The unprecedented disruption and impact to the U.S. and global economies and financial markets from the COVID-19 pandemic resulted in the U.S. President Trump’s signing into law on March 27, 2020, the Coronavirus Aid, Relief, and Economic Security Act (“CARES Act”), a $2 trillion economic stimulus package. The CARES Act allocated over $140 billion to the U.S. health system to support COVID-19-related manufacturing, production, diagnostics, and treatments, and to accelerate the market entrance of necessary vaccines and cures. The CARES Act also designated $945.4 million specifically to the NIH, a tenant of ours in our Maryland market, to combat COVID-19, which includes, but is not limited to, providing support for research, construction, and acquisition of equipment for vaccine and infectious disease research facilities, including the acquisition of real property.
In addition, on April 24, 2020, the President Trump signed the Paycheck Protection Program and Health Care Enhancement Act into law, which provided an additional $484 billion of relief primarily to assist distressed small businesses and prevent them from shutting their operations and laying off employees. This package designated $75 billion to hospitals and $25 billion for a new COVID-19 testing program. It is too early to determine if the CARES Act and the $484 billion relief package were effective or sufficient to offset some of the most severe economic effects of the pandemic.
On August 8, 2020, President Trump signed four executive actions to provide additional COVID-19 relief along with unemployment benefits of $400 weekly payment to those receiving more than $100 a week in state-funded unemployment benefits through December 6, 2020. On December 27, 2020, a second stimulus package was passed to provide relief aid to Americans during financial hardship, aggregating $900 billion in provisions, which included an additional $600 payment to eligible American adults and $600 for qualifying child dependents, a reinstatement of unemployment benefits of $300 per week through March 14, 2021, an additional $285 billion towards loan programs for small businesses, $82 billion towards education, and additional aid for hard-hit industries, including the airline industry.
On January 14, 2020, then President-elect Biden unveiled a $1.9 trillion “American Rescue Plan” proposal to combat the pandemic and stimulate the economy. The proposal provides additional provisions for increased unemployment benefits, rental assistance, small businesses, state and local governments, educational institutions, and substantial funding towards accelerated distribution of vaccinations and for COVID-19 testing, as well as direct payments of $1,400 to all eligible Americans. The American Rescue Plan is the first of two major spending initiatives expected to be proposed by President Biden in the coming weeks.
Potential ineffectiveness or delay of such relief measures could lead to further deterioration of economic conditions, higher unemployment rates, and prolonged recession, which in turn could materially affect our (or our tenants’ or venture investment portfolio companies’) performance, financial condition, results of operations, and cash flows. See “Item 1A. Risk factors” within “Part I” in this annual report on Form 10-K for additional discussion of the risks posed by the COVID-19 pandemic, and uncertainties we, our tenants, and the national and global economies face as a result.
Executive summary
Operating results
| | | | | | | | | | | | | | | | | | | | |
| | Year Ended December 31, | | | | |
| | 2020 | | 2019 | | |
| Net income attributable to Alexandria’s common stockholders – diluted: | | | | | | | | |
In millions | | $ | 760.8 | | | $ | 351.0 | | | | | |
Per share | | $ | 6.01 | | | $ | 3.12 | | | | | |
| Funds from operations attributable to Alexandria’s common stockholders – diluted, as adjusted: | | | | | | |
In millions | | $ | 923.8 | | | $ | 783.0 | | | | | |
Per share | | $ | 7.30 | | | $ | 6.96 | | | | | |
The operating results shown above include certain items related to corporate-level investing and financing decisions. For additional information, refer to “Funds from operations and funds from operations, as adjusted, attributable to Alexandria Real Estate Equities, Inc.’s common stockholders” in the “Non-GAAP measures and definitions” section and to the tabular presentation of these items in the “Results of operations” section within this Item 7 in this annual report on Form 10-K.
Alexandria and our tenants at the vanguard and heart of the life science ecosystem
Bringing together our unique and pioneering strategic vertical platforms of essential Labspace® real estate, strategic venture investments, impactful thought leadership, and purposeful corporate responsibility, Alexandria is at the vanguard and heart of the vital life science ecosystem that is advancing solutions for COVID-19 and other key challenges to human health. Owing to the efforts of numerous Alexandria tenants, including Pfizer and Moderna, in developing and delivering safe and effective vaccines and therapies to people around the world, the inherent value and critical need for the life science industry has been globally recognized. The essential R&D engine of the biopharma industry continued with productivity and resilience throughout this past year. By maintaining continuous operations across our campuses and facilities, Alexandria has enabled our tenants to continue to pursue their essential, mission-critical research, development, manufacturing, and commercialization efforts to solve the most pressing current and future healthcare challenges.
Strong and flexible balance sheet with significant liquidity
•Investment-grade credit ratings ranked in the top 10% among all publicly traded REITs as of December 31, 2020.
•Net debt and preferred stock to Adjusted EBITDA of 5.3x and fixed-charge coverage ratio of 4.6x represent the lowest and highest, respectively, in the past 10 years.
•$4.1 billion of liquidity as of December 31, 2020.
•No debt maturing prior to 2024.
•10.6 years weighted-average remaining term of debt as of December 31, 2020.
Continued dividend strategy to share growth in cash flows with stockholders
Common stock dividend declared for the three months ended December 31, 2020 of $1.09 per common share, aggregating $4.24 per common share for the year ended December 31, 2020, up 24 cents, or 6%, over the year ended December 31, 2019. Our FFO payout ratio of 60% for the three months ended December 31, 2020, allows us to share growth in cash flows from operating activities with our stockholders while also retaining a significant portion for reinvestment.
A REIT industry-leading, high-quality tenant roster
•55% of annual rental revenue from investment-grade or publicly traded large cap tenants.
•Weighted-average remaining lease term of 7.6 years.
Key strategic transactions that generated capital for investment into our highly leased value-creation pipeline and strategic acquisitions
•During the three months ended December 31, 2020, we completed two strategic transactions that generated capital aggregating $874.6 million for investment into our highly leased development and redevelopment projects and strategic acquisitions:
•Sale of 70% ownership interest in our properties at 1201 and 1208 Eastlake Avenue East and 199 East Blaine Street in our Lake Union submarket for an aggregate sales price of $314.5 million, representing a capitalization rate of 4.2% (cash basis), and setting a new record in Seattle of $1,399 per RSF; and
•Disposition of two tech office buildings at 510 Townsend Street and 505 Brannan Street in our SoMa submarket for an aggregate sales price of $560.2 million, or $1,263 per RSF, representing capitalization rates of 5.3% and 5.0% (cash basis), and a gain on sale of $151.9 million.
Continued solid net operating income and internal growth
•Total revenues of $1.9 billion, up 23.1%, for the year ended December 31, 2020, compared to $1.5 billion for the year ended December 31, 2019.
•Net operating income (cash basis) of $1.2 billion for the year ended December 31, 2020, increased by $249.7 million, or 26.2%, compared to the year ended December 31, 2019.
•94% of our leases contain contractual annual rent escalations approximating 3%.
•Same property net operating income growth of 2.6% and 5.1% (cash basis) for the year ended December 31, 2020, compared to the year ended December 31, 2019.
•Continued solid leasing activity and rental rate growth during 2020 over expiring rates on renewed and re-leased space, representing our highest annual rental rate increases during the past 10 years:
| | | | | | | | | | |
| | | | 2020 |
| Total leasing activity – RSF | | | | 4,358,846 | |
| Leasing of development and redevelopment space – RSF | | | | 1,012,364 | |
| Lease renewals and re-leasing of space: | | | | |
| RSF (included in total leasing activity above) | | | | 2,556,833 | |
| Rental rate increases | | | | 37.6% |
| Rental rate increases (cash basis) | | | | 18.3% |
| | | | |
•Guidance ranges for expected 2021 rental rate increases on lease renewals and re-leasing of space are 29.0% to 32.0%, and 16.0% to 19.0% (cash basis).
High-quality revenues and cash flows, strong margins, and operational excellence
| | | | | | | | | | | | | | |
| As of December 31, 2020 |
| Percentage of annual rental revenue in effect from investment-grade or publicly traded large cap tenants | | | 55 | % | |
| | | | |
| Occupancy of operating properties in North America | | | 94.6 | % | (1) |
| Operating margin | | | 71 | % | (2) |
| Adjusted EBITDA margin | | | 69 | % | (2) |
| Weighted-average remaining lease term: | | | | |
| All tenants | | | 7.6 | years |
| Top 20 tenants | | | 11.0 | years |
| | | | |
(1)Includes 970,199 RSF, or 3.1%, of vacancy in our North America markets, representing lease-up opportunities that will contribute to growth in cash flows at recently acquired properties. Excluding these acquired vacancies, occupancy of operating properties in North America was 97.7% as of December 31, 2020. Refer to the “Summary of occupancy percentages in North America” section under Item 2 in this annual report on Form 10-K for additional information regarding vacancy from recently acquired properties.
(2)For the three months ended December 31, 2020.
Sustained strength in tenant collections during the ongoing COVID-19 pandemic
•We have collected rents and tenant recoveries as follows:
•99.8% for April 1, 2020 through December 31, 2020; and
•99.2% for January 2021 as of January 29, 2021.
•As of December 31, 2020, our tenant receivables balance was $7.3 million.
Strategic acquisitions with significant value-creation opportunities in key submarkets
•During the three months ended December 31, 2020, we completed acquisitions of 16 properties in key submarkets aggregating 3.3 million SF, with significant value-creation opportunities including, 1.9 million RSF of future developments, 383,396 RSF of active redevelopments, and 1.0 million of operating RSF, currently 80% occupied, for an aggregate purchase price of $580.7 million.
•In January 2021, we completed the acquisition of 401 Park Drive, 201 Brookline Avenue, and one future development opportunity, as described in further detail below.
Acquisition of 401 Park Drive and 201 Brookline Avenue
•In January 2021, we acquired 401 Park Drive, 201 Brookline Avenue, and one future development opportunity, located in the heart of our Greater Boston life science cluster market, for a purchase price of $1.48 billion. The future collaborative life science campus, aggregating 1.8 million SF, consists of the following:
•401 Park Drive (operating property with future redevelopment opportunity):
•Highly amenitized Class A office/R&D building aggregating 973,145 RSF, currently 93% occupied with a weighted-average remaining lease term of 8.8 years;
•50% of annual rental revenue generated from investment-grade tenants;
•In-place rents are 38% below market; 30% of the RSF has a weighted-average remaining lease term of 3.3 years with in-place rents approximately 41% below market;
•Initial stabilized yields of 5.7% and 4.5% (cash basis); and
•Future opportunity to redevelop up to 221,000 RSF, or 23% of the building, to office/laboratory space.
•201 Brookline Avenue (active development):
•Office/laboratory building undergoing ground-up development, aggregating 510,116 RSF, targeting initial occupancy in 2022; and
•17% pre-leased to high-quality tenants.
•Future development opportunity for one office/laboratory building for which we are pursuing net new entitlement rights totaling approximately 400,000 SF of office/laboratory along with retail and common spaces.
Highly leased value-creation pipeline, including COVID-19-focused R&D spaces
•Current and pre-leased near-term projects aggregating 4.8 million RSF, including COVID-19-focused R&D spaces, are highly leased/negotiating at 78% and will generate significant revenues and cash flows.
•We commenced development and redevelopment of four projects aggregating 609,797 RSF during the three months ended December 31, 2020, and two projects aggregating 640,116 RSF during January 2021.
•Key development and redevelopment projects placed into service during the three months ended December 31, 2020:
•63,774 RSF at our redevelopment project at 9877 Waples Street in our Sorrento Mesa submarket, 100% leased to Cue Health Inc.; and
•96,463 RSF at our development project at the Alexandria Center® for Life Science – San Carlos in our Greater Stanford submarket, leased to ChemoCentryx, Inc.
•Annual net operating income (cash basis), including our share of unconsolidated real estate joint ventures, is expected to increase by $28 million upon the burn-off of initial free rent on recently delivered projects.
Balance sheet management
Refer to the “Execution of capital strategy” section below within this Item 7 in this annual report on Form 10-K.
Operating summary
| | | | | | | | | | | | | | | | | | | | | | | | | | | | | |
Same Property Net Operating
Income Growth | | Favorable Lease Structure(1) |
| | | Strategic Lease Structure by Owner and Operator of Collaborative Life Science, Technology, and Agtech Campuses |
| Increasing cash flows | | |
| Percentage of leases containing annual rent escalations | 94% |
| Stable cash flows | | |
| Percentage of triple net leases | 94% |
| Lower capex burden | | |
| Percentage of leases providing for the recapture of capital expenditures | 93% |
| | | |
| | | |
Rental Rate Growth:
Renewed/Re-Leased Space | | Margins(2) |
| | | | | | | | | |
| Operating | | | | Adjusted EBITDA |
| 71% | | | | 69% |
| | |
| | | | | | | |
| | | | | | | | |
(1)Percentages calculated based on RSF as of December 31, 2020.
(2)Represents percentages for the three months ended December 31, 2020.
Execution of capital strategy
During 2020, we continued to execute on many of the long-term components of our capital strategy. Some of our key accomplishments include the following:
2020 capital strategy
Key metrics as of December 31, 2020
•$31.9 billion(1) of total market capitalization.
•$24.4 billion of total equity capitalization.
•$4.1 billion of liquidity as of December 31, 2020.
(1) Refer to the “Non-GAAP measures and definitions” section under this Item 7 in this annual report on Form 10-K for the definition of “Total market capitalization.”
| | | | | | | | | | | | | | | | | | | | | | | |
| | As of December 31, 2020 | | Goal for Fourth Quarter of 2021, Annualized |
| | Quarter Annualized | | Trailing 12 Months | |
| Net debt and preferred stock to Adjusted EBITDA | | 5.3x | | | 5.5x | | Less than or equal to 5.2x |
| Fixed-charge coverage ratio | | 4.6x | | | 4.4x | | Greater than or equal to 4.5x |
| | | | | | | |
| | | | | | | | | | |
Value-creation pipeline of new Class A development and redevelopment projects as a percentage of gross investments in real estate | | As of December 31, 2020 | | |
Current and pre-leased near-term projects 78% leased/negotiating | | 8% | | |
Income-producing/potential cash flows/covered land play(1) | | 7% | | |
| Land | | 3% | | |
| | | | |
(1)Includes projects that have existing buildings that are generating or can generate operating cash flows. Also includes development rights associated with existing operating campuses.
Key capital events in 2020
Unsecured senior line of credit
•On October 6, 2020, we amended our unsecured senior line of credit. Key changes include the following:
| | | | | | | | | | | | | | |
| | New Agreement | | Change |
| Commitments available for borrowing | | $3.0 billion | | Up $800 million |
| Interest rate | | LIBOR+0.825% | | Added a 0% LIBOR floor |
| Maturity date | | January 6, 2026 | | Extended 2 years |
| | | | |
•In April 2020, we closed an additional unsecured senior line of credit with $750.0 million of available commitments, which had a maturity date of April 14, 2022, and bore interest at LIBOR plus 1.05%. In addition to the cost of borrowing, this line of credit was subject to an annual facility fee of 0.20% based on the aggregate commitment outstanding. The terms of the $750.0 million unsecured senior line of credit agreement required that the outstanding commitments be reduced by 100% of net cash proceeds from certain new debt transactions and 50% of net cash proceeds from new equity offerings as defined in the agreement. In August 2020, we received cash proceeds from the issuance of our $1.0 billion 1.875% Unsecured Senior Notes, and, pursuant to the terms of the $750.0 million unsecured senior line of credit agreement, all outstanding commitments from the line of credit were reduced to zero, and we terminated this facility.
Commercial paper program
•During 2020, we increased the aggregate amount we may issue under our commercial paper program from $750.0 million to $1.5 billion as of December 31, 2020. Borrowings under our commercial paper program are backed by our $3.0 billion unsecured senior line of credit.
Unsecured senior notes payable
•In March 2020, we completed an offering of $700.0 million of unsecured senior notes payable due on December 15, 2030, at an interest rate of 4.90% for net proceeds of $691.6 million.
•In August 2020, we opportunistically issued $1.0 billion of unsecured senior notes payable due in 2033 at an interest rate of 1.875% (“1.875% Unsecured Senior Notes”).
•We used a portion of the proceeds from our 1.875% Unsecured Senior Notes to refinance $500.0 million of our 3.90% unsecured senior notes payable due in 2023, pursuant to a partial cash tender offer completed on August 5, 2020, and a subsequent call for redemption for the remaining outstanding amounts, which settled on September 4, 2020. As a result of our debt refinancing, we recognized a loss on early extinguishment of debt of $50.8 million, including the write-off of unamortized loan fees
Extinguishment of unsecured senior notes payable, unsecured senior line of credit, and secured notes payable
•In August 2020, we refinanced our 3.90% unsecured senior notes payable due in 2023 aggregating $500.0 million and recognized a loss on early extinguishment of debt aggregating $50.8 million, including the write-off of unamortized loan fees. Additionally, we recognized a loss on early extinguishment of debt aggregating $1.9 million due to the termination of our $750.0 million unsecured senior line of credit.
•In December 2020, we extinguished two secured notes payable aggregating $108.2 million, due in 2023 with a weighted-average interest rate of 3.67%, and recognized losses on early extinguishment of debt aggregating $7.3 million. As a result of these extinguishments, we have no debt maturing until 2024.
Forward equity sales agreements
•In January 2020 and July 2020, we entered into forward equity sales agreements aggregating $1.0 billion and $1.1 billion, respectively, to sell an aggregate of 6.9 million shares for each offering (13.8 million in aggregate) of our common stock, including the exercise of underwriters’ options, at public offering prices of $155.00 per share and $160.50 per share, respectively, before underwriting discounts. During 2020, we issued all 13.8 million shares under these forward equity sales agreements and received net proceeds of $2.1 billion.
•In January 2021, we entered into forward equity sales agreements aggregating $1.1 billion to sell an aggregate of 6.9 million shares of our common stock (including the exercise of underwriters’ option) at a public offering price of $164.00 per share, before underwriting discounts and commissions. We expect to settle these forward equity sales agreements in March 2021.
ATM common stock offering program
•In February 2020, we entered into a new ATM common stock offering program, which allows us to sell up to an aggregate of $850.0 million of our common stock.
•We issued 1.5 million shares of common stock under our ATM program at a price of $159.09 per share (before underwriting discounts), and received net proceeds of $235.0 million in 2020.
•We have 362 thousand shares under our ATM program subject to forward equity sales agreements that remain outstanding at a price of $159.09 per share (before underwriting discounts) as of December 31, 2020. We expect to settle these forward equity sales agreements in 2021 and receive net proceeds of approximately $56.3 million.
•The remaining availability of $547.3 million under this ATM program expired in December 2020 concurrently with the expiration of the associated shelf registration. In January 2021, we filed a new shelf registration and we expect to establish a new ATM program soon in 2021.
Unconsolidated real estate joint venture loan
•In March 2020, our unconsolidated joint venture at 1655 and 1725 Third Street, in which we own a 10% interest, located in Mission Bay/SoMa, refinanced an existing variable-rate secured construction loan with a fixed-rate loan with terms as follows:
| | | | | | | | | | | | | | |
| 100% at Joint Venture Level | | Amended Agreement | | Change |
| Aggregate commitments | | $600.0 million | | Increase of $225.0 million |
| Maturity date | | March 2025 | | Extended by 45 months |
| Interest rate | | Fixed at 4.50% | | Previously LIBOR + 3.70% |
| | | | |
Investments
•Our investments in publicly traded companies and privately held entities aggregated a carrying amount of $1.6 billion, including an adjusted cost basis of $835.4 million and unrealized gains of $775.7 million, as of December 31, 2020.
•Investment income of $421.3 million during the year ended December 31, 2020, consisted of $47.3 million of realized gains, which included $24.5 million of impairments related to investments in privately held entities that do not report NAV, and $374.0 million of unrealized gains.
2021 Capital strategy
During 2021, we intend to continue to execute our capital strategy to achieve further improvements to our credit profile, which will allow us to further improve our cost of capital and continue our disciplined approach to capital allocation. For further information, refer to the “Projected results” section below under this Item 7 in this annual report on Form 10-K. Consistent with 2020, our capital strategy for 2021 includes the following elements:
•Allocate capital to Class A properties located in collaborative life science, technology, and agtech campuses in AAA urban innovation clusters;
•Continue to improve our credit profile;
•Maintain prudent access to diverse sources of capital, which include cash flows from operating activities after dividends, incremental debt supported by our growth in EBITDA, real estate asset sales, non-real estate investment sales, joint venture capital, and other capital such as sales of equity;
•Maintain commitment to long-term capital to fund growth;
•Prudently ladder debt maturities;
•Reduce short-term variable-rate debt;
•Prudently manage equity investments to support corporate-level investment strategies;
•Maintain significant balance sheet liquidity; and
•Maintain a stable and flexible balance sheet.
Given the anticipated delivery of significant incremental EBITDA from our development and redevelopment of new Class A properties, we expect to be able to debt fund a significant portion of construction on a leverage-neutral basis. We expect to continue to maintain access to a diverse source of debt, including unsecured senior notes payable, as well as secured construction loans for our development and redevelopment projects from time to time. We expect to continue to maintain a significant proportion of our net operating income on an unencumbered basis to allow for future flexibility for accessing both unsecured and secured debt markets, although we expect traditional secured mortgage notes payable will remain a small component of our capital structure. In addition to debt funding on a leverage-neutral basis, we intend to supplement our remaining capital needs with net cash flows from operating activities, after dividends and proceeds from real estate asset sales, non-real estate investment sales, partial interest sales, and other debt and equity capital.
Improved cost of capital
As part of our capital strategy to continue strengthening our credit profile, we expect to complete and place into service development and redevelopment projects currently under construction, which we expect will deliver significant incremental EBITDA. The expected growth in our EBITDA in 2021 and beyond should allow us to obtain debt funding on a leverage-neutral basis and provide significant capital to fund our development and redevelopment projects. Additionally, the resulting expected improvement in our balance sheet leverage ratio should allow us to access diverse sources of capital, strengthen our credit profile, and reduce our cost of capital. In addition, we expect to continue to maintain a significant proportion of unencumbered net operating income. For the year ended December 31, 2020, our unencumbered net operating income as a percentage of total net operating income was 96%.
We present our equity investments at fair value whenever fair value or NAV is readily available. Adjustments for our limited partnership investments represent changes in reported NAV as a practical expedient to estimate fair value. For investments without readily available fair values, we adjust the carrying amount whenever such investments have an observable price change, and further adjustments are not made until another price change, if any, is observed. Refer to Note 7 – “Investments” to our consolidated financial statements under Item 15 in this annual report on Form 10-K for additional information.
| | | | | | | | | | | | | | | | | | | | | | | | | | | | | |
| | December 31, 2020 | | | |
| (In thousands) | | Three Months Ended | | Year Ended | | Year Ended December 31, 2019 |
| Realized gains | | $ | 21,599 | | | | $ | 47,288 | | (1) | | $ | 33,158 | | (2) |
| Unrealized gains | | 233,538 | | | | 374,033 | | | | 161,489 | | |
| Investment income | | $ | 255,137 | | | | $ | 421,321 | | | | $ | 194,647 | | |
| | | | | | | | | |
| | | | | | | | | | | | | | | | | | | | | | | | | | | | | |
Investments (In thousands) | | Cost | | Adjustments | | Carrying Amount |
| Fair value: | | | | | | | | | |
Publicly traded companies | | $ | 208,754 | | | | $ | 351,076 | | (3) | | $ | 559,830 | | |
Entities that report NAV | | 334,341 | | | | 327,741 | | | | 662,082 | | |
| | | | | | | | | |
Entities that do not report NAV: | | | | | | | | | |
Entities with observable price changes | | 47,545 | | | | 96,859 | | | | 144,404 | | |
Entities without observable price changes | | 244,798 | | | | — | | | | 244,798 | | |
| December 31, 2020 | | $ | 835,438 | | (4) | | $ | 775,676 | | | | $ | 1,611,114 | | |
| | | | | | | | | |
| September 30, 2020 | | $ | 788,807 | | | | $ | 542,138 | | | | $ | 1,330,945 | | |
(1)Includes impairments related to investments in privately held entities that do not report NAV of $24.5 million for the year ended December 31, 2020.
(2)Includes impairments related to investments in privately held entities that do not report NAV of $17.1 million for the year ended December 31, 2019.
(3)Includes gross unrealized gains and losses of $366.9 million and $15.8 million, respectively, as of December 31, 2020.
(4)Represents 3.2% of total gross assets as of December 31, 2020.
| | | | | | | | |
| Public/Private
Mix (Cost) | |
| | |
| | |
| Tenant/Non-Tenant
Mix (Cost) | |
| | |
Represents an illustrative subset of approximately 100 tenants focused on COVID-19-related efforts, with some of these companies working on multiple efforts that span testing, treatment, and/or vaccine development.
(1)Source: National Institutes of Health, “NIH launches clinical trials network to test COVID-19-related vaccines and other preventive tools,” July 8, 2020.
(1)As of January 29, 2021. Source: U.S. Department of Health & Human Services. Federal funding presented includes the total commitment value.
(2)Source: U.S. Food and Drug Administration, “FDA Takes Additional Action in Fight Against COVID-19 By Issuing Emergency Use Authorization for Second COVID-19 Vaccine,” December 18, 2020.
Alexandria and our innovative tenants are at the vanguard and heart of the life science ecosystem advancing solutions for COVID-19
Safe and effective vaccines and therapies, in addition to widespread testing, continue to be critically needed to combat the global COVID-19 pandemic. By maintaining essential continuous operations across our campuses, Alexandria has enabled several of our life science tenants to pursue mission-critical COVID-19-related research and development. The heroic work being done by so many of our tenants and campus community members to help test for, treat, and prevent COVID-19, as well as provide medical supplies and protective equipment to neighboring hospitals, is profound and inspiring. We are currently tracking approximately 100 tenants across our cluster markets that have contributed meaningful time and resources to advancing solutions for COVID-19.
Developing preventative vaccines
•A prophylactic vaccine is critically needed to resolve the global COVID-19 pandemic. As such, researchers around the world are working tirelessly to develop a safe and effective vaccine in record time. Furthermore to help expedite the development, manufacturing, and distribution of COVID-19 vaccines, the U.S. government initiated an unprecedented public-private collaboration, allocating several billions of dollars to these efforts.
•This support along with the internal vaccine development expertise and innovative technology platforms of our tenants Pfizer Inc. (in partnership with BioNTech) and Moderna, Inc. (in partnership with the National institutes of Health), culminated in the FDA providing Emergency Use Authorization (“EUA”) in December 2020 for their respective mRNA based COVID-19 vaccines. The U.S. has begun a large-scale COVID-19 vaccination campaign and will continue to roll out vaccines across the nation, prioritizing frontline and essential workers, the elderly, and individuals considered high-risk.
•Additional tenants, including AstraZeneca plc, Emergent BioSolutions Inc., FUJIFILM Diosynth Biotechnologies, GlaxoSmithKline, Johnson & Johnson, Novavax, Inc., and Sanofi, have similarly received strong government support for their efforts in the development, manufacturing, and/or distribution of COVID-19 vaccines. Many of these companies will report critical trial data over the coming months, which, if positive, could help bolster the widespread delivery of a safe and effective COVID-19 vaccine around the world.
Advancing new and repurposed therapies
•Safe and effective therapies are important for mitigating the impact of COVID-19, decreasing hospitalizations, and improving patient outcomes overall. On October 22, 2020, the FDA approved Veklury® (remdesivir), developed by our tenant Gilead Sciences, Inc., as the first antiviral treatment approved for COVID-19 patients requiring hospitalization. Subsequently, in November 2020, the FDA granted EUAs to tenant Eli Lilly and Company’s bamlanivimab for the treatment of newly infected high-risk patients with mild or moderate disease, as well as to Regeneron Pharmaceutical’s antibody cocktail for a similar indication.
•In addition, over 300 experimental therapies to treat COVID-19 are being studied in over 900 clinical trials around the world, as well as over more than 150 therapeutic candidates in preclinical development. A substantial number of these programs are sponsored by our tenants, including the following:
•Vir Biotechnology, Inc. and GlaxoSmithKline announced on October 6, 2020, that their most advanced antibody therapy for the early treatment of patients with COVID-19 has entered Phase III and that they expect complete results in the first quarter of 2021.
•AbbVie Inc., Amgen, AstraZeneca plc, Atreca Inc., Enanta Pharmaceuticals, Inc., Novartis AG, and Pfizer Inc. are similarly endeavoring to develop novel therapies and repurpose existing and investigational drugs to provide near-term treatments for moderate and severe COVID-19 patients and those at highest risk.
Improving testing quality and capacity
•Abbott Laboratories, Adaptive Biotechnologies Corporation, Color, Cue Health Inc., Laboratory Corporation of America Holdings, Quest Diagnostics, Quidel Corporation, Roche, Thermo Fisher Scientific Inc., Verily Life Sciences, and others are working to improve testing quality, capacity, and turnaround time to more effectively determine who has an active COVID-19 infection, who has been exposed to the virus, and who has developed immunity against it. The increased availability of widespread COVID-19 testing is critical for curtailing the pandemic and facilitating a safer reopening of workplaces, communities, and society overall.
Industry and corporate leadership: catalyzing and leading the way for positive change to benefit human health and society
Industry leadership
•In January 2020, we announced our first national $100,000 AgTech Innovation Prize competition to recognize startup and early-stage agtech and foodtech companies that demonstrate innovative approaches to addressing challenges related to agriculture, food, and nutrition.
•In June 2020, we announced that Alexandria LaunchLabs® – AgTech awarded its inaugural $100,000 AgTech Innovation Prize to TerMir Inc., an early-stage agtech company aiming to address key, unresolved agricultural, environmental, and human health challenges.
•In January 2020, Alexandria Venture Investments, our strategic venture capital arm, was recognized for a third consecutive year as the most active biopharma investor by new deal volume by Silicon Valley Bank in its “2020 Healthcare Investments and Exits Report.” Alexandria’s venture activity provides us with, among other things, mission-critical data and knowledge of innovations and trends.
•In July 2020, Alexandria Venture Investments was recognized as the most active biopharma investor by new deal volume from 2019 to the six months ended June 30, 2020, by Silicon Valley Bank in its “Mid-Year 2020 Healthcare Investments and Exits Report.”
•In January 2021, Alexandria Venture Investments, our strategic venture capital platform, was recognized for a fourth consecutive year as the most active biopharma corporate investor by new deal volume from 2019 to 2020 by Silicon Valley Bank in its “Healthcare Investments and Exits: Annual Report 2021.”
•In February 2020, Alexandria LaunchLabs® at the Alexandria Center® at One Kendall Square earned the Fitwel Impact Award for the highest Fitwel certification of all time, as well as the highest score in 2019 for a commercial interior space, in the Fitwel 2020 Best in Building Health awards program. This marks the second consecutive year Alexandria LaunchLabs® – Cambridge has held the record for Fitwel’s top certification score. The award recognizes our commitment to supporting high levels of health, wellness, and productivity through the design, construction, and operation of our best-in-class buildings and spaces.
•In March 2020, the Navy SEAL Foundation honored Joel S. Marcus, our executive chairman and founder, and the company with the 2020 Navy SEAL Foundation Patriot Award, which highlights our contributions and unwavering support for the Naval Special Warfare community. We have proudly supported the Navy SEAL Foundation in its mission to provide immediate and ongoing support and assistance to the Naval Special Warfare community and their families since 2010.
•In June 2020, our executive chairman and founder, Joel S. Marcus, had the honor of serving as the keynote speaker for a special fireside chat at the virtual BIO Health Caucus hosted by the Association of University Research Parks, an organization dedicated to guiding leaders to cultivate communities of innovation at global anchor institutions. The virtual fireside, titled “Three Decades of Building Bio Health Facilities and Companies,” covered a broad array of topics that provided a comprehensive view of our essential business, our dynamic cluster locations, and our critical role at the vanguard of the life science ecosystem fighting COVID-19.
•In June 2020, we released our 2019 Corporate Responsibility Report, which reinforces Alexandria’s longstanding environmental, social, and governance commitment, strong progress toward our 2025 environmental impact goals, and critical role at the vanguard and heart of the life science ecosystem advancing solutions for COVID-19.
•In September 2020, Alexandria won the Commercial Brokers Association (“CBA”) Boston Landlord of the Year award. The CBA was established as a freestanding division of the Greater Boston Real Estate Board in 2001 and represents over 400 members in the commercial brokerage community throughout Massachusetts.
•In November 2020, Alexandria was ranked as the #1 public REIT for construction-in-progress in 2019 from Engineering News-Record’s (ENR) Top 50 List. ENR recognize leaders in the construction industry, and its top ranking of our construction activity highlights our commitment to creating and delivering life-changing and essential facilities to our tenant community.
•In December 2020, we achieved the following in the 2020 Global Real Estate Sustainability Benchmark (“GRESB”) Real Estate Assessment: (i) #1 global ranking in the Science & Technology sector, (ii) #1 global ranking and 5 Star Rating (out of 5 stars) in our Diversified Listed Peer Group for highly sustainable development initiatives, and (iii) our third consecutive “A” disclosure score.
Pioneering social responsibility initiatives to continue to drive unique, disruptive, and highly impactful solutions to tackle some of society’s most complex and pressing challenges
Alexandria is profoundly committed to driving forward significant collaborative and innovative solutions to address some of today’s most urgent and widespread societal challenges, including the COVID-19 pandemic, the opioid epidemic, and the educational achievement gap.
At the vanguard and heart of the life science ecosystem’s fight against COVID-19
•As a testament to our comprehensive and industry-leading COVID‑19 prevention guidelines and practices, in October 2020, we became the first-ever company to achieve a Fitwel Viral Response Certification with Distinction, the highest designation within the new Viral Response Module developed by the world’s leading healthy building certification system. Additionally, in November 2020, we achieved the world’s first WELL Health-Safety Rating for Laboratory Space at Alexandria LaunchLabs® – New York City. This latest evidence-based, third-party-verified rating further affirms our longstanding and robust practices to help keep our tenants, employees, visitors, service providers, and key industry stakeholders healthy and safe.
•Throughout the COVID-19 pandemic, Alexandria has been a critical partner to several impactful organizations supporting communities adversely affected by the COVID-19 pandemic. In total, Alexandria has donated more than $1 million to non-profit organizations on the front lines of combating the devastating impact of the COVID-19 pandemic, including Robin Hood, New York City’s largest poverty-fighting organization. As a member of the Robin Hood Board of Directors, Joel S. Marcus has played a key leadership role in the distribution of over $60 million to 575 organizations across all five New York City boroughs, providing critical emergency support for New Yorkers in need through food, housing, financial assistance, job security, and more.
•In lieu of tenant holiday gifts, in December 2020, Alexandria made donations to several regional COVID-19-related non-profit programs, including Seattle Foundation’s COVID-19 Relief Fund, Robin Hood COVID-19 Relief Fund, SF New Deal COVID-19 Relief for San Francisco, Nourish Now in Maryland, and the Greg Hill Foundation’s Restaurant Strong Fund in Boston.
Pioneering a groundbreaking, data-driven, and evidence-based model to help solve the opioid epidemic
•Determined to reverse the trajectory of the U.S. opioid epidemic, which is one of the most pervasive public health challenges in our nation’s history, Alexandria partnered with Verily Life Sciences to establish an innovative, non-profit healthcare ecosystem dedicated to the full and sustained recovery of people living with addiction. Together, we pioneered a fully integrated campus in Dayton, Ohio, to house an evidence-based comprehensive treatment model encompassing a full continuum of care with dedicated facilities and services for treatment, residential housing, group therapy, family reunification, workforce development programs, job placement, and community transition.
•Over the last year, we completed construction of the OneFifteen Outpatient Clinic; the Crisis Stabilization Unit; and most recently, OneFifteen Living, the residential housing component that opened in late 2020.
•Overdose deaths continue to rise dramatically during the COVID-19 pandemic, demonstrating the tremendous need for the OneFifteen ecosystem. Since opening in the fall of 2019, OneFifteen has made a positive and comprehensive impact on the local community and the way addiction is treated, seeing approximately 2,200 patients in 2020, including over 1,150 people during the three months ended December 31, 2020. It is our hope that OneFifteen’s unique approach to treatment will serve as a model of recovery for the rest of the country to replicate.
Building educational foundations for students to pave paths for long-term success and close the achievement gap
•Alexandria is deeply committed to driving educational opportunities and providing the support and resources needed to build the foundations for underserved, low-income students to succeed and become engaged and leading members of society. Understanding that education is one of the most fundamental foundations for a safe, healthy, and good life and essential for opportunity and economic mobility, we have forged deep partnerships in our communities with highly impactful organizations that provide holistic educational resources to underserved populations.
•In December 2020, Alexandria celebrated the culmination of the Emily Krzyzewski Center’s $15 million Game Changer Campaign, in which Alexandria played a critical leadership role. The Emily K Center paves a path to success in higher education for academically focused, low-income K–12 students in Durham, North Carolina. Students receive holistic support that encompasses academic skills development, personal management and leadership training, college planning, and career exploration. Of those who complete Emily K’s Scholars to College program, nearly 100% are accepted to college each year.
•The campaign funds will support ongoing programs to prepare students for life-changing college access while bolstering their achievement and developing their character and leadership; an endowment to ensure support for students in years to come; and a new 7,500 square foot facility designed for the specific needs of college-access programs to provide much needed classroom space as well as rooms for quiet study and one-on-one advising and financial aid discussions.
Results of operations
We present a tabular comparison of items, whether gain or loss, that may facilitate a high-level understanding of our results and provide context for the disclosures included in this annual report on Form 10-K. We believe such tabular presentation promotes a better understanding for investors of the corporate-level decisions made and activities performed that significantly affect comparison of our operating results from period to period. We also believe this tabular presentation will supplement for investors an understanding of our disclosures and real estate operating results. Gains or losses on sales of real estate and impairments of held for sale assets are related to corporate-level decisions to dispose of real estate. Gains or losses on early extinguishment of debt, gains or losses on early termination of interest rate hedge agreements, and preferred stock redemption charges are related to corporate-level financing decisions focused on our capital structure strategy. Significant realized and unrealized gains or losses on non-real estate investments, impairments of real estate and non-real estate investments, and significant termination fees are not related to the operating performance of our real estate assets as they result from strategic corporate-level decisions and external market conditions. Impairments of non-real estate investments are not related to the operating performance of our real estate as they represent the write-down of non-real estate investments when their fair values decline below their respective carrying values due to changes in general market or other conditions outside of our control. Significant items included in the tabular disclosure for current periods are described in further detail under this Item 7 in this annual report on Form 10-K. Items included in net income attributable to Alexandria’s common stockholders were as follows:
| | | | | | | | | | | | | | | | | | | | | | | |
| Year Ended December 31, |
(In millions, except per share amounts) | 2020 | | 2019 | | 2020 | | 2019 |
| Amount | | Per Share – Diluted |
| Unrealized gains on non-real estate investments | $ | 374.0 | | | $ | 161.5 | | | $ | 2.96 | | | $ | 1.44 | |
| Gain on sales of real estate | 154.1 | | | 0.5 | | | 1.22 | | | — | |
| Impairment of real estate | (55.7) | | (1) | (12.3) | | | (0.44) | | | (0.11) | |
| Impairment of non-real estate investments | (24.5) | | | (17.1) | | | (0.19) | | | (0.15) | |
| Loss on early extinguishment of debt | (60.7) | | | (47.6) | | | (0.48) | | | (0.42) | |
| Loss on early termination of interest rate hedge agreements | — | | | (1.7) | | | — | | | (0.02) | |
Termination fee(2) | 86.2 | | | — | | | 0.68 | | | — | |
| Acceleration of stock compensation expense due to executive officer resignation | (4.5) | | | — | | | (0.04) | | | — | |
| Preferred stock redemption charge | — | | | (2.6) | | | — | | | (0.02) | |
| Total | $ | 468.9 | | | $ | 80.7 | | | $ | 3.71 | | | $ | 0.72 | |
(1)Amount includes $7.6 million impairment of our investment in a recently developed retail property held by our unconsolidated real estate joint venture. This impairment was recognized during the three months ended March 31, 2020, and was classified in equity in earnings from unconsolidated real estate joint ventures within our consolidated statements of operations.
(2)Refer to “Income from rentals” in Note 5 – “Leases” to our consolidated financial statements under Item 15 in this annual report on Form 10-K for more information.
Same properties
We supplement an evaluation of our results of operations with an evaluation of operating performance of certain of our properties, referred to as “Same Properties.” For additional information on the determination of our Same Properties portfolio, refer to the definition of “Same property comparisons” in the “Non-GAAP measures and definitions” section under this Item 7 in this annual report on Form 10-K. The following table presents information regarding our Same Properties as of December 31, 2020 and 2019:
| | | | | | | | | | | | | | |
| | December 31, |
| | 2020 | | 2019 |
| Percentage change in net operating income over comparable period from prior year | | 2.6% | | 3.1 | % |
| Percentage change in net operating income (cash basis) over comparable period from prior year | | 5.1% | | 7.1 | % |
| Operating margin | | 73% | | 71% |
| Number of Same Properties | | 209 | | | 192 |
| RSF | | 20,707,818 | | 18,519,783 |
| Occupancy – current-period average | | 96.6% | | 96.6 | % |
| Occupancy – same-period prior-year average | | 96.7% | | 96.3 | % |
The following table reconciles the number of Same Properties to total properties for the year ended December 31, 2020:
| | | | | | | | | | | |
Development – under construction | | Properties | |
| 9804 Medical Center Drive | | 1 | | |
| 9950 Medical Center Drive | | 1 | | |
Alexandria Center® for Life Science – San Carlos | | 2 | | |
| 3115 Merryfield Row | | 1 | | |
| 201 Haskins Way | | 1 | | |
| 1165 Eastlake Avenue East | | 1 | | |
| 9 Laboratory Drive | | 1 | | |
Alexandria Center® for Advanced Technologies | | 2 | | |
| | 10 | | |
| Development – placed into service after January 1, 2019 | | Properties | |
| 399 Binney Street | | 1 | | |
| 279 East Grand Avenue | | 1 | | |
| 188 East Blaine Street | | 1 | | |
| | 3 | | |
Redevelopment – under construction | | Properties | |
| 5505 Morehouse Drive | | 1 | | |
Alexandria Center® – Long Island City | | 1 | | |
| 3160 Porter Drive | | 1 | | |
| The Arsenal on the Charles | | 5 | | |
| 700 Quince Orchard Road | | 1 | | |
Alexandria Center® for Life Science – Durham | | 3 | | |
| | 12 | | |
| Redevelopment – placed into service after January 1, 2019 | | Properties | |
| Alexandria PARC | | 4 | | |
| 9877 Waples Street | | 1 | | |
| 681 and 685 Gateway Boulevard | | 2 | | |
| 266 and 275 Second Avenue | | 2 | | |
| 5 Laboratory Drive | | 1 | | |
| | 10 | | |
| | | |
| | | | | | | | | | | |
| Acquisitions after January 1, 2019 | | Properties | |
| 25, 35, and 45 West Watkins Mill Road | | 3 | | |
| 3170 and 3181 Porter Drive | | 2 | | |
Shoreway Science Center | | 2 | | |
3911, 3931, and 4075 Sorrento Valley Boulevard | | 3 | | |
5 Necco Street | | 1 | | |
601 Dexter Avenue North | | 1 | | |
| 4224/4242 Campus Point Court and 10210 Campus Point Drive | | 3 | | |
3825 and 3875 Fabian Way | | 2 | | |
SD Tech by Alexandria | | 10 | | |
The Arsenal on the Charles | | 6 | | |
| 275 Grove Street | | 1 | | |
| 601, 611, and 651 Gateway Boulevard | | 3 | | |
| 3330, 3412, 3450, and 3460 Hillview Avenue | | 4 | | |
| 9605 Medical Center Drive | | 1 | | |
| 987 and 1075 Commercial Street | | 2 | | |
| 4555 Executive Drive | | 1 | | |
Alexandria Center® for Life Science – Durham | | 13 | | |
| Reservoir Woods | | 3 | | |
| One Upland Road | | 1 | | |
| 830 4th Avenue South | | 1 | | |
| 11255 and 11355 North Torrey Pines Road | | 2 | | |
| 6420 and 6450 Sequence Drive | | 2 | | |
| 380 and 420 E Street | | 2 | | |
Other | | 15 | | |
| | 84 | | |
| | | |
Unconsolidated real estate JV | | 6 | | |
Properties held for sale | | 4 | | |
Total properties excluded from Same Properties | | 129 | | |
Same Properties | | 209 | | (1) |
Total properties in North America as of December 31, 2020 | | 338 | | |
| |
(1)Includes 9880 Campus Point Drive and 3545 Cray Court. The 9880 Campus Point Drive building was occupied through January 2018 and was placed into service during the three months ended September 30, 2020, and 3545 Cray Court is currently undergoing renovations.
Comparison of results for the year ended December 31, 2020, to the year ended December 31, 2019
The following table presents a comparison of the components of net operating income for our Same Properties and Non-Same Properties for the year ended December 31, 2020, compared to the year ended December 31, 2019. Refer to the “Non-GAAP measures and definitions” section under this Item 7 in this annual report on Form 10-K for definitions of “Tenant recoveries” and “Net operating income” and their reconciliations from the most directly comparable financial measures presented in accordance with GAAP, income from rentals and net income, respectively. We provide a comparison of the results for the year ended December 31, 2019, to the year ended December 31, 2018, including a comparison of the components of net operating income for our Same Properties and Non-Same Properties for the year ended December 31, 2019, compared to the year ended December 31, 2018, within the “Results of operations” section in Item 7 of our annual report on Form 10-K for the year ended December 31, 2019.
For additional discussion related to the COVID-19 pandemic and its impact to us, refer to “The COVID-19 pandemic” section under Item 7 in this annual report on Form 10-K. In addition, refer to “Item 1A. Risk factors” in this annual report on Form 10-K for a discussion about risks that COVID-19 directly or indirectly may pose to our business.
| | | | | | | | | | | | | | | | | | | | | | | | | | | | | |
| | Year Ended December 31, | |
| (Dollars in thousands) | | 2020 | | 2019 | | $ Change | | % Change | |
| Income from rentals: | | | | | | | | | |
| Same Properties | | $ | 1,031,126 | | | $ | 1,017,749 | | | $ | 13,377 | | | 1.3 | % | |
Non-Same Properties(1) | | 440,714 | | | 148,039 | | | 292,675 | | | 197.7 | | |
| Rental revenues | | 1,471,840 | | | 1,165,788 | | | 306,052 | | | 26.3 | | |
| | | | | | | | | |
| Same Properties | | 327,815 | | | 313,705 | | | 14,110 | | | 4.5 | | |
| Non-Same Properties | | 78,553 | | | 37,371 | | | 41,182 | | | 110.2 | | |
| Tenant recoveries | | 406,368 | | | 351,076 | | | 55,292 | | | 15.7 | | |
| | | | | | | | | |
| Income from rentals | | 1,878,208 | | | 1,516,864 | | | 361,344 | | | 23.8 | | |
| | | | | | | | | |
| Same Properties | | 368 | | | 444 | | | (76) | | | (17.1) | | |
| Non-Same Properties | | 7,061 | | | 13,988 | | | (6,927) | | | (49.5) | | |
| Other income | | 7,429 | | | 14,432 | | | (7,003) | | | (48.5) | | |
| | | | | | | | | |
| Same Properties | | 1,359,309 | | | 1,331,898 | | | 27,411 | | | 2.1 | | |
| Non-Same Properties | | 526,328 | | | 199,398 | | | 326,930 | | | 164.0 | | |
| Total revenues | | 1,885,637 | | | 1,531,296 | | | 354,341 | | | 23.1 | | |
| | | | | | | | | |
| Same Properties | | 373,416 | | | 370,926 | | | 2,490 | | | 0.7 | | |
| Non-Same Properties | | 156,808 | | | 74,566 | | | 82,242 | | | 110.3 | | |
| Rental operations | | 530,224 | | | 445,492 | | | 84,732 | | | 19.0 | | |
| | | | | | | | | |
| Same Properties | | 985,893 | | | 960,972 | | | 24,921 | | | 2.6 | | |
| Non-Same Properties | | 369,520 | | | 124,832 | | | 244,688 | | | 196.0 | | |
| Net operating income | | $ | 1,355,413 | | | $ | 1,085,804 | | | $ | 269,609 | | | 24.8 | % | |
| | | | | | | | | |
| Net operating income – Same Properties | | $ | 985,893 | | | $ | 960,972 | | | $ | 24,921 | | | 2.6 | % | |
| Straight-line rent revenue | | (67,243) | | | (84,167) | | | 16,924 | | | (20.1) | | |
| Amortization of acquired below-market leases | | (10,791) | | | (13,372) | | | 2,581 | | | (19.3) | | |
| Net operating income – Same Properties (cash basis) | | $ | 907,859 | | | $ | 863,433 | | | $ | 44,426 | | | 5.1 | % | |
(1)Includes a termination fee recognized during the three months ended September 30, 2020. Refer to “Income from rentals” in Note 5 – “Leases” to our consolidated financial statements under Item 15 in this annual report on Form 10-K for detail.
Income from rentals
Total income from rentals for the year ended December 31, 2020, increased by $361.3 million, or 23.8%, to $1.9 billion, compared to $1.5 billion for the year ended December 31, 2019, as a result of increases in rental revenues and tenant recoveries, as discussed below.
Rental revenues
Total rental revenues for the year ended December 31, 2020, increased by $306.1 million, or 26.3%, to $1.5 billion, compared to $1.2 billion for the year ended December 31, 2019. The increase was primarily due to an increase in rental revenues from our Non-Same Properties aggregating $292.7 million primarily related to 1,008,382 RSF of development and redevelopment projects placed into service subsequent to January 1, 2019, and 84 operating properties aggregating 7.8 million RSF acquired subsequent to January 1, 2019, as well as a termination fee of $89.5 million recognized in connection with the termination of our contract for a future lease at our development project at 88 Bluxome Street in our SoMa submarket during the three months ended September 30, 2020. Our annual rental revenue per RSF was $49.08 as of December 31, 2020 compared to $51.04 as of December 31, 2019. The decrease in our rental revenue per RSF was due to our recent acquisitions of Alexandria Center® for Life Science – Durham in our Research Triangle submarket, and acquisitions made during the three months ended December 31, 2020, including 6420 and 6450 Sequence Drive in our Sorrento Mesa submarket of San Diego, and 380 and 420 E Street in our Seaport Innovation District submarket of Greater Boston. Annual rental rates per RSF in our Research Triangle and Seattle markets, in which most of the operating RSF of the aforementioned acquisitions is concentrated, is generally lower than annual rental rates per RSF in our Greater Boston and San Francisco markets where the majority of our operating RSF is located. Excluding these acquisitions, our annual rental revenue per RSF as of December 31, 2020, would have been $51.26. For the definition of “Annual rental revenue” refer to the “Non-GAAP measures and definitions” section under Item 7 in this annual report on Form 10-K.
Rental revenues from our Same Properties for the year ended December 31, 2020, increased by $13.4 million, or 1.3%, to $1.03 billion, compared to $1.02 billion for the year ended December 31, 2019. The increase was primarily due to rental rate increases on lease renewals and re-leasing of space since January 1, 2019. Refer to the “Leasing activity” section of “Item 2. Properties” within “Part I” in this annual report on Form 10-K for additional details. The increase was partially offset by the effect of reduced revenues generated from our transient parking, retail tenants, and amenities, which had limited operations due to COVID-19 restrictions.
The increase in total rental revenues was also partially offset by a $5.4 million reduction to rental revenues recognized during the year ended December 31, 2020, due to specific write-offs and a general allowance related to deferred rent balances of tenants that are or may potentially be impacted by uncertainties surrounding COVID-19.
Tenant recoveries
Tenant recoveries for the year ended December 31, 2020, increased by $55.3 million, or 15.7%, to $406.4 million, compared to $351.1 million for the year ended December 31, 2019. This increase is consistent with the increase in our rental operating expenses of $84.7 million, or 19.0%, as discussed under “Rental operations” below.
Same Properties’ tenant recoveries for the year ended December 31, 2020, increased by $14.1 million, or 4.5%, to $327.8 million, compared to $313.7 million for the year ended December 31, 2019, primarily due to the increase in property tax expenses resulting from higher assessed values of our properties, higher property insurance, and higher repairs and maintenance expenses during the year ended December 31, 2020, as discussed under “Rental operations” below. As of December 31, 2020, 94% of our leases (on an RSF basis) were triple net leases, which require tenants to pay substantially all real estate taxes, insurance, utilities, repairs and maintenance, common area expenses, and other operating expenses (including increases thereto) in addition to base rent.
Other income
Other income for the years ended December 31, 2020 and 2019, was $7.4 million and $14.4 million, respectively, primarily consisting of construction management fees and interest income earned during each respective period. The decrease was primarily a result of lower construction management fees recognized due to the completion of certain projects.
Rental operations
Total rental operating expenses for the year ended December 31, 2020, increased by $84.7 million, or 19.0%, to $530.2 million, compared to $445.5 million for the year ended December 31, 2019. The increase was primarily due to incremental expenses from our Non-Same Properties, primarily related to 1,008,382 RSF of development and redevelopment projects placed into service subsequent to January 1, 2019, and 84 operating properties aggregating 7.8 million RSF acquired subsequent to January 1, 2019.
Same Properties’ rental operating expenses increased by $2.5 million, or 0.7%, to $373.4 million, compared to $370.9 million for the year ended December 31, 2019. The increase was primarily due to an increase in property tax expenses resulting from higher assessed values of our properties, higher property insurance, and higher repairs and maintenance expenses, which were partially offset by reduced operating expenses related to retail tenants and amenities, which had no or limited operations due to COVID-19 restrictions during the year ended December 31, 2020.
General and administrative expenses
General and administrative expenses for the year ended December 31, 2020, increased by $24.5 million, or 22.5%, to $133.3 million, compared to $108.8 million for the year ended December 31, 2019. Approximately $4.5 million of the increase was the result of the acceleration of stock compensation expense recognized in connection with the resignation of an executive officer during the three months ended September 2020. This former executive officer remains a consultant to the Company. A portion of unvested stock outstanding will continue to vest pursuant to the original terms of the awards. This was deemed a modification for accounting purposes due to a significant reduction in future services to the Company, which resulted in an accelerated vesting and recognition of the fair value of the modified award. The remaining increase was primarily due to continued growth in the depth and breadth of our operations in multiple markets, including development and redevelopment projects placed into service and properties acquired subsequent to January 1, 2019, as discussed under “Income from rentals” above. As a percentage of net operating income, our general and administrative expenses for the years ended December 31, 2020 and 2019, were 9.8% and 10.0%, respectively.
Interest expense
Interest expense for the years ended December 31, 2020 and 2019, consisted of the following (dollars in thousands):
| | | | | | | | | | | | | | | | | | | | |
| | Year Ended December 31, | | |
| Component | | 2020 | | 2019 | | Change |
| Interest incurred | | $ | 297,227 | | | $ | 262,238 | | | $ | 34,989 | |
| Capitalized interest | | (125,618) | | | (88,563) | | | (37,055) | |
| Interest expense | | $ | 171,609 | | | $ | 173,675 | | | $ | (2,066) | |
| | | | | | |
Average debt balance outstanding(1) | | $ | 7,762,498 | | | $ | 6,416,773 | | | $ | 1,345,725 | |
Weighted-average annual interest rate(2) | | 3.8 | % | | 4.1 | % | | (0.3) | % |
(1)Represents the average debt balance outstanding during the respective periods.
(2)Represents total interest incurred divided by the average debt balance outstanding in the respective periods.
The net change in interest expense during the year ended December 31, 2020, compared to the year ended December 31, 2019, resulted from the following (dollars in thousands):
| | | | | | | | | | | | | | | | | | | | | | | | | | | | | |
| Component | | Interest Rate(1) | | Effective Date | | Change | |
| Increases in interest incurred due to: | | | | | | | | | |
| Issuances of debt: | | | | | | | | | |
| $650 million unsecured senior notes payable – green bond | | | 4.03 | % | | | June 2018/
March 2019 | | $ | 1,776 | | |
| $350 million unsecured senior notes payable – green bond | | | 3.96 | % | | | March 2019 | | 2,969 | | |
| $300 million unsecured senior notes payable | | | 4.93 | % | | | March 2019 | | 3,236 | | |
| $750 million unsecured senior notes payable | | | 3.48 | % | | | July 2019 | | 13,685 | | |
| $700 million unsecured senior notes payable | | | 3.91 | % | | | July/September 2019 | | 16,572 | | |
| $400 million unsecured senior notes payable | | | 2.87 | % | | | September 2019 | | 7,712 | | |
| $700 million unsecured senior notes payable | | | 5.05 | % | | | March 2020 | | 26,232 | | |
| $1.0 billion unsecured senior notes payable | | | 1.97 | % | | | August 2020 | | 7,661 | | |
| Fluctuations in interest rate and average balance: | | | | | | | | | |
| $1.5 billion commercial paper program | | | | | | | | 1,778 | | |
| Other increase in interest | | | | | | | | 1,570 | | |
| Total increases | | | | | | | | 83,191 | | |
| Decreases in interest incurred due to: | | | | | | | | | |
| Repayments of debt: | | | | | | | | | |
| $550 million unsecured senior notes payable | | | 4.75 | % | | | July/August 2019 | | (14,424) | | |
| $400 million unsecured senior notes payable | | | 2.96 | % | | | July/August 2019 | | (6,257) | | |
| $500 million unsecured senior notes payable | | | 4.04 | % | | | August/September 2020 | | (7,166) | | |
| Secured construction loan | | | 3.29 | % | | | March 2019 | | (1,778) | | |
| Unsecured senior bank term loan | | | Various | | | Various | | (7,335) | | |
Fluctuations in interest rate and average balance: | | | | | | | | | |
| Unsecured senior line of credit | | | | | | | | (11,242) | | |
| Total decreases | | | | | | | | (48,202) | | |
| Change in interest incurred | | | | | | | | 34,989 | | |
| Increase in capitalized interest | | | | | | | | (37,055) | | |
| Total change in interest expense | | | | | | | | $ | (2,066) | | |
(1)Represents the weighted-average interest rate as of the end of the applicable period, including amortization of loan fees, amortization of debt premiums (discounts), and other bank fees.
In anticipation of LIBOR cessation at the end of 2021, we have been actively reducing LIBOR-based borrowings outstanding on our loans. As of December 31, 2020, the outstanding balance on our unsecured senior line of credit, our only LIBOR-based debt (excluding debt held by our unconsolidated joint ventures), was zero.
Depreciation and amortization
Depreciation and amortization expense for the year ended December 31, 2020, increased by $153.5 million, or 28.2%, to $698.1 million, compared to $544.6 million for the year ended December 31, 2019. The increase was primarily due to additional depreciation from 1,008,382 RSF of development and redevelopment projects placed into service subsequent to January 1, 2019, and 84 operating properties aggregating 7.8 million RSF acquired subsequent to January 1, 2019.
Gain on sales of real estate
During the year ended December 31, 2020, we recognized a gain on sales of real estate aggregating $154.1 million, which primarily consisted of the following:
•Gain on sale of $151.9 million recognized in connection with the sale of two tech office properties aggregating 443,479 RSF at 510 Townsend Street and 505 Brannan Street in our SoMa submarket. We completed the sale in November 2020 for an aggregate sales price of $560.2 million.
•Gain on sale of $1.6 million recognized in connection with the sale of 30 Bearfoot Road in our Route 495 submarket. We completed the sale of the real estate asset in August 2020 for a sales price of $3.4 million.
During the year ended December 31, 2019, we recognized a gain on sale of real estate of $474 thousand in connection with the sale of our property at 6138/6150 Nancy Ridge Drive aggregating 56,698 RSF, located in our Sorrento Mesa submarket, which was classified as held for sale during the three months ended June 30, 2019. The gain on sale was recognized in December 2019, upon completion of the sale of the property for a sales price of $6.6 million, or $117 per RSF.
Impairment charges
During the year ended December 31, 2020, we recognized impairment charges aggregating $48.1 million, primarily including:
•Impairment charges aggregating $15.2 million, which mainly consisted of a $10 million write-off of the pre-acquisition deposit for a previously pending acquisition of an operating tech office property for which our revised economic projections declined from our initial underwriting. We recognized this impairment charge in April 2020 concurrently with the submission of our notice to terminate the transaction.
•Impairment charge of $13.5 million recognized during the three months ended December 31, 2020, upon classification of our real estate assets located at 260 Townsend Street in our SoMa submarket as held for sale. We expect to sell this real estate asset during 2021.
•Impairment charge of $11.7 million recognized during the three months ended December 31, 2020, upon classification of our real estate asset located at 220 and 240 2nd Avenue South in our SoDo submarket as held for sale. We expect to sell this real estate asset during 2021.
•Impairment charge of $6.8 million recognized during the three months ended September 30, 2020, upon classification of our real estate asset located at 945 Market Street in our SoMa submarket as held for sale. In September 2020, we completed the sale of the real estate asset for a sales price of $198.0 million with no gain or loss.
During the three months ended December 31, 2019, we decided to sell two of our real estate assets aggregating 123,862 RSF in non-cluster markets to allow for reinvestment of this capital into our highly leased value-creation pipeline. Upon classification as held for sale, we recognized impairment charges aggregating $12.3 million to lower the carrying amounts of these real estate assets to their respective estimated fair value less cost to sell.
For additional information, refer to Note 18 – “Assets classified as held for sale” to our consolidated financial statements under Item 15 in this annual report on Form 10-K.
Investment income
During the year ended December 31, 2020, we recognized investment income aggregating $421.3 million, which consisted of $47.3 million of realized gains and $374.0 million of unrealized gains. Realized gains primarily consisted of $72.5 million of gains on non-real estate investments, partially offset by realized losses on investments in privately held entities that do not report NAV. Unrealized gains of $374.0 million during the year ended December 31, 2020, primarily consisted of increases in fair values of our investments in publicly traded companies and in privately held entities that report NAV. For more information about our investments, refer to Note 7 – “Investments” to our consolidated financial statements under Item 15 in this annual report on Form 10-K. For our impairments accounting policy, refer to the “Investments” section in Note 2 – “Summary of significant accounting policies” to our consolidated financial statements under Item 15 in this annual report on Form 10-K.
During the year ended December 31, 2019, we recognized investment income aggregating $194.6 million, which consisted of $33.2 million of realized gains and $161.5 million of unrealized gains.
Loss on early extinguishment of debt
During the year ended December 31, 2020, we recognized losses on early extinguishment of debt aggregating $60.7 million, consisting of the following:
•$50.8 million, including the write-off of unamortized loan fees, related to the refinancing of our 3.90% unsecured senior notes payable due in 2023 aggregating $500.0 million.
•$7.3 million related to the extinguishment of two secured notes payable in December 2020 aggregating $108.2 million, which were originally due in 2023 and had a weighted-average interest rate of 3.67%. This amount includes a $2.8 million loss on early extinguishment of debt recognized in connection with a legal defeasance that extinguished our secured note payable related to 3545 Cray Court.
•$1.9 million due to the termination of our $750.0 million unsecured senior line of credit.
•$651 thousand related to the write-off of unamortized loan fees upon the amendment of our unsecured senior line of credit in October 6, 2020.
For more information about our extinguishment of debt, refer to the “Extinguishment of unsecured senior notes payable, unsecured senior line of credit, and secured notes payable” section in Note 10 – “Secured and unsecured senior debt” to our consolidated financial statements under Item 15 in this annual report on Form 10-K.
During the year ended December 31, 2019, we recognized losses on early extinguishment of debt aggregating $47.6 million, consisting of the following:
•$40.2 million related to the repayment of the outstanding balance of our unsecured senior bank term loan of $350.0 million and the refinancing of unsecured senior notes payable comprising $400.0 million of 2.75% unsecured senior notes payable due 2020 and $550.0 million of 4.60% unsecured senior notes payable due in 2022.
•$7.1 million, including the write-off of unamortized loan fees, related to early repayment of one secured note payable aggregating $106.7 million, which was originally due in 2020 and bore interest at 7.75%.
•$269 thousand related to the early repayment of the remaining $193.1 million balance of our secured construction loan related to 50/60 Binney Street.
Equity in earnings of unconsolidated real estate joint ventures
During the year ended December 31, 2020, we recognized equity in earnings of unconsolidated real estate joint ventures of $8.1 million. This balance consisted of earnings from our unconsolidated real estate joint ventures of approximately $15.8 million, partially offset by the impairment charge discussed below.
In March 2020, the impact of COVID-19 pandemic and the resulting State of Maryland’s shelter-in-place order led to the closure of a retail center owned by one of our unconsolidated joint ventures. We evaluated the recoverability of our investment in this joint venture and recognized a $7.6 million impairment charge to lower the carrying amount of our investment balance, which primarily consisted of real estate, to its estimated fair value less costs to sell. This impairment charge was classified in equity in earnings of unconsolidated real estate joint ventures within our consolidated statements of operations for the year ended December 31, 2020. Refer to Note 4 – “Consolidated and unconsolidated real estate joint ventures” to our consolidated financial statements under Item 15 in this annual report on Form 10-K for additional information.
During the year ended December 31, 2019, we recognized equity in earnings of unconsolidated real estate joint ventures of $10.1 million, which consisted primarily of earnings recognized due to the delivery of our development project at Menlo Gateway in our Greater Stanford submarket during the three months ended September 30, 2019.
Preferred stock redemption charge
During the year ended December 31, 2019, we repurchased, in privately negotiated transactions, 275,000 outstanding shares of our 7.00% Series D cumulative convertible preferred stock and recognized a preferred stock redemption charge of $2.6 million. As of December 31, 2019 and 2020, we had no outstanding shares of preferred stock.
Other comprehensive income
Total other comprehensive income for the year ended December 31, 2020, increased by $2.4 million to aggregate net unrealized gains of $3.1 million, compared to net unrealized gains of $686 thousand for the year ended December 31, 2019, primarily due to the unrealized gains (losses) on foreign currency translation related to our operations in Canada and China.
Projected results
Based on our current view of existing market conditions and certain current assumptions, we present guidance for EPS attributable to Alexandria’s common stockholders – diluted and funds from operations per share attributable to Alexandria’s common stockholders – diluted for the year ending December 31, 2021, as set forth in the table below. The tables below also provide a reconciliation of EPS attributable to Alexandria’s common stockholders – diluted, the most directly comparable financial measure presented in accordance with GAAP, to funds from operations per share, a non-GAAP measure, and other key assumptions included in our updated guidance for the year ending December 31, 2021. There can be no assurance that actual amounts will be materially higher or lower than these expectations. Refer to our discussion of “Forward-looking statements” in this annual report on Form 10-K.
| | | | | | | | | | | | | | |
| Projected 2021 Earnings per Share and Funds From Operations per Share Attributable to Alexandria’s Common Stockholders – Diluted |
Earnings per share(1) | | $2.14 to $2.34 |
Depreciation and amortization of real estate assets | | | 5.50 | |
| | | | |
| | | | |
Allocation of unvested restricted stock awards | | | (0.04) | |
Funds from operations per share(2) | | $7.60 to $7.80 |
| | | | |
| | | | |
| | |
Midpoint | | | $7.70 | |
| | | | |
(1)Excludes unrealized gains or losses after December 31, 2020, that are required to be recognized in earnings and are excluded from funds from operations per share, as adjusted.
(2)Calculated in accordance with standards established by the Advisory Board of Governors of Nareit (the “Nareit Board of Governors”). Refer to the definition of “Funds from operations and funds from operations, as adjusted, attributable to Alexandria Real Estate Equities, Inc.’s common stockholders” in the “Non-GAAP measures and definitions” section under this Item 7 in this annual report on Form 10-K for additional information.
| | | | | | | | | | | | | | | | | |
Key Assumptions(1) (Dollars in millions) | | 2021 Guidance |
| Low | | High |
| Occupancy percentage for operating properties in North America as of December 31, 2021 | | 95.6% | | 96.2% | |
Lease renewals and re-leasing of space: | | | | | |
Rental rate increases | | 29.0% | | 32.0% | |
Rental rate increases (cash basis) | | 16.0% | | 19.0% | |
Same property performance: | | | | | |
Net operating income increase | | 1.0% | | 3.0% | |
Net operating income increase (cash basis) | | 4.0% | | 6.0% | |
Straight-line rent revenue | | $ | 114 | | | $ | 124 | | |
General and administrative expenses | | $ | 146 | | | $ | 151 | | |
Capitalization of interest | | $ | 167 | | | $ | 177 | | |
Interest expense | | $ | 133 | | | $ | 143 | | |
| | | | | |
(1)Our assumptions presented in the table above are subject to a number of variables and uncertainties, including those discussed as “Forward-looking statements” under “Part I”; “Item 1A. Risk factors”; and “Item 7. Management’s discussion and analysis of financial condition and results of operations” in this annual report on Form 10-K. To the extent our full-year earnings guidance is updated during the year, we will provide additional disclosure supporting reasons for any significant changes to such guidance.
| | | | | | | | | | | |
Key Credit Metrics | | 2021 Guidance | |
| Net debt and preferred stock to Adjusted EBITDA – fourth quarter of 2021, annualized | | Less than or equal to 5.2x | |
| Fixed-charge coverage ratio – fourth quarter of 2021, annualized | | Greater than or equal to 4.5x | |
| | | |
Consolidated and unconsolidated real estate joint ventures
We present components of balance sheet and operating results information for the noncontrolling interest share of our consolidated real estate joint ventures and for our share of investments in unconsolidated real estate joint ventures to help investors estimate balance sheet and operating results information related to our partially owned entities. These amounts are estimated by computing, for each joint venture that we consolidate in our financial statements, the noncontrolling interest percentage of each financial item to arrive at the cumulative noncontrolling interest share of each component presented. In addition, for our real estate joint ventures that we do not control and do not consolidate, we apply our economic ownership percentage to the unconsolidated real estate joint ventures to arrive at our proportionate share of each component presented. Refer to Note 4 – “Consolidated and unconsolidated real estate joint ventures” to our consolidated financial statements under Item 15 in this annual report on Form 10-K for further discussion.
| | | | | | | | | | | | | | | | | | | | | | | | | | |
| Consolidated Real Estate Joint Ventures | | | | |
| Property/Market/Submarket | | Noncontrolling(1) Interest Share | | Operating RSF
at 100% |
| 225 Binney Street/Greater Boston/Cambridge/Inner Suburbs | | | 70.0 | % | | | | 305,212 | |
| 75/125 Binney Street/Greater Boston/Cambridge/Inner Suburbs | | | 60.0 | % | | | | 388,270 | |
| 57 Coolidge Avenue/Greater Boston/Cambridge/Inner Suburbs | | | 25.0 | % | | | | — | | (2) |
| 409 and 499 Illinois Street/San Francisco/Mission Bay | | | 40.0 | % | | | | 455,069 | |
| 1500 Owens Street/San Francisco/Mission Bay | | | 49.9 | % | | | | 158,267 | |
Alexandria Technology Center® – Gateway/San Francisco/South San Francisco(3) | | | 54.9 | % | | | | 1,089,265 | |
| 500 Forbes Boulevard/San Francisco/South San Francisco | | | 90.0 | % | | | | 155,685 | |
Alexandria Point/San Diego/University Town Center(4) | | | 45.0 | % | | | | 1,337,916 | |
5200 Illumina Way/San Diego/University Town Center | | | 49.0 | % | | | | 792,687 | |
9625 Towne Centre Drive/San Diego/University Town Center | | | 49.9 | % | | | | 163,648 | |
SD Tech by Alexandria/San Diego/Sorrento Mesa(5) | | | 50.0 | % | | | | 677,597 | |
The Eastlake Life Science Campus by Alexandria/Seattle/Lake Union(6) | | | 70.0 | % | | | | 321,218 | |
| | | | | | | | |
Unconsolidated Real Estate Joint Ventures | | | | |
| Property/Market/Submarket | | Our Ownership Share(7) | | Operating RSF
at 100% |
| 1655 and 1725 Third Street/San Francisco/Mission Bay | | | 10.0 | % | | | | 586,208 | |
Menlo Gateway/San Francisco/Greater Stanford | | | 49.0 | % | | | | 772,983 | |
704 Quince Orchard Road/Maryland/Gaithersburg | | | 56.8 | % | (8) | | | 80,032 | |
| | | | | | | | |
(1)In addition to the consolidated real estate joint ventures listed, various partners hold insignificant noncontrolling interests in five other joint ventures in North America.
(2)We expect to commence vertical construction of 275,000 RSF during 2021.
(3)Excludes 600, 630, 650, 901, and 951 Gateway Boulevard in our South San Francisco submarket. Noncontrolling interest share is anticipated to be 49% as we make further contributions over time.
(4)Excludes 9880 Campus Point Drive in our University Town Center submarket.
(5)Excludes 5505 Morehouse Drive and 10121 and 10151 Barnes Canyon Road in our Sorrento Mesa submarket.
(6)Excludes 1165, 1616, and 1551 Eastlake Avenue East, 188 East Blaine Street, and 1600 Fairview Avenue East in our Lake Union submarket.
(7)In addition to the unconsolidated real estate joint ventures listed, we hold an interest in two other insignificant unconsolidated real estate joint ventures in North America.
(8)Represents our ownership interest; our voting interest is limited to 50%.
Our unconsolidated real estate joint ventures have the following secured loans that include the following key terms as of December 31, 2020 (dollars in thousands):
| | | | | | | | | | | | | | | | | | | | | | | | | | | | | | | | | | | | | | | | | | | | | | | |
| Unconsolidated Joint Venture | | Our Share | | Maturity Date | | Stated Rate | | Interest Rate(1) | | Debt Balance at 100%(2) | |
| 704 Quince Orchard Road | | 56.8% | | | 3/16/23 | | | L+1.95% | | | 3.22% | (3) | | $ | 12,660 | | |
| 1655 and 1725 Third Street | | 10.0% | | | 3/10/25 | | | 4.50% | | | 4.57% | | | 598,232 | | |
| Menlo Gateway, Phase II | | 49.0% | | | 5/1/35 | | | 4.53% | | | 4.59% | | | 155,942 | | |
| Menlo Gateway, Phase I | | 49.0% | | | 8/10/35 | | | 4.15% | | | 4.18% | | | 139,558 | | |
| | | | | | | | | | | | | | $ | 906,392 | | |
(1)Includes interest expense and amortization of loan fees.
(2)Represents outstanding principal, net of unamortized deferred financing costs, as of December 31, 2020.
(3)Includes a 1.00% LIBOR floor on the interest rate.
The following tables present information related to the operating results and financial positions of our consolidated and unconsolidated real estate joint ventures (in thousands):
| | | | | | | | | | | | | | | | | | | | | | | |
| Noncontrolling Interest Share of Consolidated Real Estate Joint Ventures | | Our Share of Unconsolidated
Real Estate Joint Ventures |
| December 31, 2020 | | December 31, 2020 |
| Three Months Ended | | Year Ended | | Three Months Ended | | Year Ended |
| Total revenues | $ | 42,203 | | | $ | 160,676 | | | $ | 10,474 | | | $ | 41,638 | |
| Rental operations | (11,622) | | | (42,930) | | | (1,679) | | | (5,932) | |
| 30,581 | | | 117,746 | | | 8,795 | | | 35,706 | |
| General and administrative | (120) | | | (504) | | | (29) | | | (217) | |
| Interest | — | | | — | | | (2,197) | | | (8,284) | |
| Depreciation and amortization | (15,032) | | | (61,933) | | | (2,976) | | | (11,413) | |
| Impairment of real estate | — | | | — | | | — | | | (7,644) | |
Fixed returns allocated to redeemable noncontrolling interests(1) | 220 | | | 903 | | | — | | | — | |
| $ | 15,649 | | | $ | 56,212 | | | $ | 3,593 | | | $ | 8,148 | |
| | | | | | | |
Straight-line rent and below-market lease revenue | $ | 1,055 | | | $ | 5,341 | | | $ | 3,946 | | | $ | 21,210 | |
Funds from operations(2) | $ | 30,681 | | | $ | 118,145 | | | $ | 6,569 | | | $ | 27,205 | |
(1)Represents an allocation of joint venture earnings to redeemable noncontrolling interests primarily in one property in our South San Francisco submarket. These redeemable noncontrolling interests earn a fixed return on their investment rather than participate in the operating results of the property.
(2)Refer to the definition of “Funds from operations and funds from operations, as adjusted, attributable to Alexandria Real Estate Equities, Inc.’s common stockholders” in the “Non-GAAP measures and definitions” section under this Item 7 in this annual report on Form 10-K for the definition and the reconciliation from the most directly comparable financial measure presented in accordance with GAAP.
| | | | | | | | | | | | | | |
| December 31, 2020 | |
| Noncontrolling Interest Share of Consolidated Real Estate Joint Ventures | | Our Share of Unconsolidated
Real Estate Joint Ventures | |
| Investments in real estate | $ | 1,568,665 | | | $ | 457,672 | | |
| Cash, cash equivalents, and restricted cash | 49,633 | | | 32,981 | | |
| Other assets | 179,699 | | | 59,342 | | |
| Secured notes payable | — | | | (210,201) | | |
| Other liabilities | (79,931) | | | (7,445) | | |
Redeemable noncontrolling interests | (11,342) | | | — | | |
| $ | 1,706,724 | | | $ | 332,349 | | |
During the years ended December 31, 2020 and 2019, our consolidated real estate joint ventures distributed an aggregate of $87.3 million and $48.2 million, respectively, to our joint venture partners. Refer to our consolidated statements of cash flows and Note 4 – “Consolidated and unconsolidated real estate joint ventures” to our consolidated financial statements under Item 15 in this annual report on Form 10-K for additional information.
Liquidity
| | | | | | | | | | | | | | | | | | | | |
| Liquidity | | Minimal Outstanding Borrowings and Significant Availability on Unsecured Senior
Line of Credit |
| | | (in millions) |
| $4.1B | | |
|
|
|
|
|
| (In millions) | | |
Availability under our unsecured senior line of credit, net of amounts outstanding under our commercial paper program | $ | 2,900 | | |
Outstanding forward equity sales agreements(1) | 56 | | |
| Cash, cash equivalents, and restricted cash | 598 | | |
| Investments in publicly traded companies | 560 | | |
Liquidity as of December 31, 2020 | $ | 4,114 | | |
| | |
| | | | | | |
| | | | | | |
Net Debt and Preferred Stock to Adjusted EBITDA(2) | | Fixed-Charge Coverage Ratio(2) |
| | |
|
|
|
|
|
|
|
|
| | | | |
(1)Represents expected net proceeds from the future settlement of the remaining 362 thousand shares outstanding under our forward equity sales agreements as of December 31, 2020. Excludes forward equity sales agreements aggregating $1.1 billion entered into in January 2021.
(2)Quarter annualized.
We expect to meet certain long-term liquidity requirements, such as requirements for development, redevelopment, other construction projects, capital improvements, tenant improvements, property acquisitions, leasing costs, non-revenue-enhancing capital expenditures, scheduled debt maturities, distributions to noncontrolling interests, and payment of dividends through net cash provided by operating activities, periodic asset sales, strategic real estate joint venture capital, and long-term secured and unsecured indebtedness, including borrowings under our unsecured senior line of credit, issuances under our commercial paper program, and issuances of additional debt and/or equity securities.
We expect to continue meeting our short-term liquidity and capital requirements, as further detailed in this section, generally through our working capital and net cash provided by operating activities. We believe that the net cash provided by operating activities will continue to be sufficient to enable us to make the distributions necessary to continue qualifying as a REIT.
Over the next several years, our balance sheet, capital structure, and liquidity objectives are as follows:
•Retain positive cash flows from operating activities after payment of dividends and distributions to noncontrolling interests for investment in development and redevelopment projects and/or acquisitions;
•Improve credit profile and relative long-term cost of capital;
•Maintain diverse sources of capital, including sources from net cash provided by operating activities, unsecured debt, secured debt, selective real estate asset sales, partial interest sales, non-real estate investment sales, preferred stock, and common stock;
•Maintain commitment to long-term capital to fund growth;
•Maintain prudent laddering of debt maturities;
•Maintain solid credit metrics;
•Maintain significant balance sheet liquidity;
•Mitigate variable-rate debt exposure through the reduction of short-term and medium-term variable-rate bank debt;
•Maintain a large unencumbered asset pool to provide financial flexibility;
•Fund common stock dividends and distributions to noncontrolling interests from net cash provided by operating activities;
•Manage a disciplined level of value-creation projects as a percentage of our gross investments in real estate; and
•Maintain high levels of pre-leasing and percentage leased in value-creation projects.
In addition, refer to “Item 1A. Risk factors” in this annual report on Form 10-K for a discussion about risks that COVID-19 directly or indirectly may pose to our business.
The following table presents the availability under our unsecured senior line of credit less amounts outstanding under our commercial paper program; outstanding forward equity sales agreements; cash, cash equivalents, and restricted cash; and investments in publicly traded companies as of December 31, 2020 (dollars in thousands):
| | | | | | | | | | | | | | | | | | | | | | | | | | |
| Description | | Stated
Rate | | Aggregate
Commitments | | Outstanding
Balance under our Commercial Paper Program | | Remaining Commitments/Liquidity |
Availability under our unsecured senior line of credit | | L+0.825% | | $ | 3,000,000 | | | $ | 99,991 | | | $ | 2,900,000 | |
Outstanding forward equity sales agreements | | | | | | | | 56,291 | |
| Cash, cash equivalents, and restricted cash | | | | | | | | 597,705 | |
| Investments in publicly traded companies | | | | | | | | 559,830 | |
| Total liquidity | | | | | | | | $ | 4,113,826 | |
Cash, cash equivalents, and restricted cash
As of December 31, 2020 and 2019, we had $597.7 million and $242.7 million, respectively, of cash, cash equivalents, and restricted cash. We expect existing cash, cash equivalents, and restricted cash, net cash from operating activities, proceeds from real estate asset sales and partial interest sales, non-real estate investment sales, borrowings under our unsecured senior line of credit, issuances under our commercial paper program, issuances of unsecured notes payable, and issuances of common stock to continue to be sufficient to fund our operating activities and cash commitments for investing and financing activities, such as regular quarterly dividends, distributions to noncontrolling interests, scheduled debt repayments, acquisitions, and certain capital expenditures, including expenditures related to construction activities.
Cash flows
We report and analyze our cash flows based on operating activities, investing activities, and financing activities. The following table summarizes changes in our cash flows for the years ended December 31, 2020 and 2019 (in thousands):
| | | | | | | | | | | | | | | | | |
| Year Ended December 31, | | |
| 2020 | | 2019 | | Change |
| Net cash provided by operating activities | $ | 882,510 | | | $ | 683,857 | | | $ | 198,653 | |
| Net cash used in investing activities | $ | (3,278,161) | | | $ | (3,641,320) | | | $ | 363,159 | |
| Net cash provided by financing activities | $ | 2,750,356 | | | $ | 2,927,482 | | | $ | (177,126) | |
Operating activities
Cash flows provided by operating activities are primarily dependent upon the occupancy level of our asset base, the rental rates of our leases, the collectibility of rent and recovery of operating expenses from our tenants, the timing of completion of development and redevelopment projects, and the timing of acquisitions and dispositions of operating properties. Net cash provided by operating activities for the year ended December 31, 2020, increased to $882.5 million, compared to $683.9 million for the year ended December 31, 2019. This increase was primarily attributable to (i) cash flows generated from our highly leased development and redevelopment projects recently placed into service, (ii) income-producing acquisitions since January 1, 2019, and (iii) increases in rental rates on lease renewals and re-leasing of space since January 1, 2019.
Investing activities
Cash used in investing activities for the years ended December 31, 2020 and 2019, consisted of the following (in thousands):
| | | | | | | | | | | | | | | | | |
| | Year Ended December 31, | | |
| | 2020 | | 2019 | | Increase (Decrease) |
Sources of cash from investing activities: | | | | | |
Sales of non-real estate investments | $ | 141,149 | | | $ | 147,332 | | | $ | (6,183) | |
| Proceeds from sales of real estate | 747,020 | | | 6,619 | | | 740,401 | |
Return of capital from unconsolidated real estate joint ventures | 20,225 | | | 14 | | | 20,211 | |
| Change in escrow deposits | 7,408 | | | — | | | 7,408 | |
| 915,802 | | | 153,965 | | | 761,837 | |
Uses of cash for investing activities: | | | | | |
Purchases of real estate | 2,570,693 | | | 2,259,778 | | | 310,915 | |
Additions to real estate | 1,445,171 | | | 1,224,541 | | | 220,630 | |
Investments in unconsolidated real estate joint ventures | 3,444 | | | 102,081 | | | (98,637) | |
| Change in escrow deposits | — | | | 18,107 | | | (18,107) | |
Additions to non-real estate investments | 174,655 | | | 190,778 | | | (16,123) | |
| 4,193,963 | | | 3,795,285 | | | 398,678 | |
| | | | | |
| Net cash used in investing activities | $ | 3,278,161 | | | $ | 3,641,320 | | | $ | (363,159) | |
The decrease in net cash used in investing activities for the year ended December 31, 2020, was primarily due to an increased source of cash from proceeds from sales of real estate, partially offset by cash used in purchases of real estate and additions to real estate. Refer to Note 3 – “Investments in real estate” to our consolidated financial statements under Item 15 in this annual report on Form 10-K for further information.
Financing activities
Cash flows provided by financing activities for the years ended December 31, 2020 and 2019, consisted of the following (in thousands):
| | | | | | | | | | | | | | | | | |
| Year Ended December 31, | | |
| 2020 | | 2019 | | Change |
Repayments of borrowings from secured notes payable | $ | (84,104) | | | $ | (306,199) | | | $ | 222,095 | |
| Payment for the defeasance of secured note payable | (32,865) | | | — | | | (32,865) | |
Proceeds from issuance of unsecured senior notes payable | 1,697,651 | | | 2,721,169 | | | (1,023,518) | |
Repayments of unsecured senior notes payable | (500,000) | | | (950,000) | | | 450,000 | |
Borrowings from unsecured senior line of credit | 2,700,000 | | | 5,056,000 | | | (2,356,000) | |
Repayments of borrowings from unsecured senior line of credit | (3,084,000) | | | (4,880,000) | | | 1,796,000 | |
Repayments of borrowings from unsecured senior bank term loan | — | | | (350,000) | | | 350,000 | |
Premium paid for early extinguishment of debt | (54,385) | | | (41,351) | | | (13,034) | |
| Proceeds from issuance under commercial paper program | 23,539,400 | | | 2,233,000 | | | 21,306,400 | |
Repayments of borrowings from commercial paper program | (23,439,400) | | | (2,233,000) | | | (21,206,400) | |
Payments of loan fees | (32,309) | | | (27,182) | | | (5,127) | |
| Changes related to debt | 709,988 | | | 1,222,437 | | | (512,449) | |
| | | | | |
Contributions from and sales of noncontrolling interests | 367,613 | | | 1,022,712 | | | (655,099) | |
| Distributions to and purchases of noncontrolling interests | (88,805) | | | (48,225) | | | (40,580) | |
Proceeds from the issuance of common stock | 2,315,862 | | | 1,216,445 | | | 1,099,417 | |
Dividend payments | (532,980) | | | (451,170) | | | (81,810) | |
Taxes paid related to net settlement of equity awards | (21,322) | | | (25,477) | | | 4,155 | |
Repurchase of 7.00% Series D cumulative convertible preferred stock | — | | | (9,240) | | | 9,240 | |
| Net cash provided by financing activities | $ | 2,750,356 | | | $ | 2,927,482 | | | $ | (177,126) | |
Inflation
As of December 31, 2020, approximately 94% of our leases (on an RSF basis) were triple net leases, which require tenants to pay substantially all real estate taxes, insurance, utilities, repairs and maintenance, common area expenses, and other operating expenses (including increases thereto) in addition to base rent. Approximately 94% of our leases (on an RSF basis) contained effective annual rent escalations that were either fixed (generally ranging from 3.0% to 3.5%) or indexed based on a consumer price index or other indices. Accordingly, we do not believe that our cash flows or earnings from real estate operations are subject to significant risks from inflation. A period of inflation, however, could cause an increase in the cost of our variable-rate borrowings, including borrowings related to our unsecured senior line of credit and secured construction loans held by our unconsolidated joint ventures.
Capital resources
We expect that our principal liquidity needs for the year ending December 31, 2021, will be satisfied by the following multiple sources of capital, as shown in the table below. There can be no assurance that our sources and uses of capital will not be materially higher or lower than these expectations.
| | | | | | | | | | | | | | | | | | | | | | | | | | | | | |
Key Sources and Uses of Capital (In millions) | | 2021 Guidance | | Certain Completed Items |
| Range | | Midpoint | |
| Sources of capital: | | | | | | | | | |
| Net cash provided by operating activities after dividends | | $ | 210 | | | $ | 250 | | | $ | 230 | | | | |
| Incremental debt | | 730 | | | 740 | | | 735 | | | |
| 2020 debt capital proceeds held in cash | | 150 | | | 250 | | | 200 | | | | |
Real estate dispositions and partial interest sales(1) | | 1,250 | | | 1,500 | | | 1,375 | | | | |
| Common equity | | 1,700 | | | 2,100 | | | 1,900 | | | $ | 1,141 | | (2) |
| Total sources of capital | | $ | 4,040 | | | $ | 4,840 | | | $ | 4,440 | | | | |
| | | | | | | | | |
| Uses of capital: | | | | | | | | | |
| Construction | | $ | 1,590 | | | $ | 1,890 | | | $ | 1,740 | | | | |
| Acquisitions | | 2,450 | | | 2,950 | | | 2,700 | | | $ | 1,602 | | |
| | | | | | | | |
| Total uses of capital | | $ | 4,040 | | | $ | 4,840 | | | $ | 4,440 | | | | |
| | | | | | | | | |
Incremental debt (included above): | | | | | | | | | |
Issuance of unsecured senior notes payable(3) | | $ | 700 | | | $ | 1,100 | | | $ | 900 | | | | |
| | | | | | | | | |
| Unsecured senior line of credit, commercial paper program, and other | | 30 | | | (360) | | | (165) | | | | |
| Incremental debt | | $ | 730 | | | $ | 740 | | | $ | 735 | | | | |
(1)In December 2020, three office buildings aggregating 146,842 RSF met the criteria to be classified as held for sale. We expect to complete the sale of these properties in 2021 for a total estimated sales price of $78.1 million, including the buyer’s assumption of a $28.2 million secured note payable related to one of the buildings. Upon the buildings being classified as held for sale, we recognized impairment charges aggregating $25.2 million.
(2)Represents forward equity sales agreements that we expect to settle in 2021 and receive net proceeds of approximately $1.1 billion.
(3)In addition to our guidance range, we may seek opportunities to refinance our $650 million unsecured senior notes payable green bond due in 2024 prior to its maturity, subject to market conditions.
The key assumptions behind the sources and uses of capital in the table above include a favorable capital market environment, performance of our core operating properties, lease-up and delivery of current and future development and redevelopment projects, and leasing activity. Our expected sources and uses of capital are subject to a number of variables and uncertainties, including those discussed as “Forward-looking statements” under “Part 1”; “Item 1A. Risk factors” and “Item 7. Management’s discussion and analysis of financial condition and results of operations” in this annual report on Form 10-K. We expect to update our forecast of sources and uses of capital on a quarterly basis.
Sources of capital
Net cash provided by operating activities after dividends
We expect to retain $210.0 million to $250.0 million of net cash flows from operating activities after payment of common stock dividends, and distributions to noncontrolling interests for the year ending December 31, 2021. For purposes of this calculation, changes in operating assets and liabilities are excluded as they represent timing differences. We also excluded significant contract termination fees that represent an ancillary source of cash that is not associated with any ongoing activity at any of our operating properties. For the year ending December 31, 2021, we expect our recently delivered projects, our highly pre-leased value-creation projects expected to be completed and along with contributions from Same Properties and recently acquired properties, to contribute significant increases in income from rentals, net operating income, and cash flows. We anticipate significant contractual near-term growth in annual cash rents of $28 million related to the commencement of contractual rents on the projects recently placed into service that are near the end of their initial free rent period. Refer to the “Cash flows” section within this Item 7 in this annual report on Form 10-K for a discussion of cash flows provided by operating activities for the year ended December 31, 2020.
Debt
As of December 31, 2020, we have no outstanding balance on our unsecured senior line of credit. Our unsecured senior line of credit bears an interest rate of LIBOR plus 0.825%. In addition to the cost of borrowing, the unsecured senior line of credit is subject to an annual facility fee of 0.15% based on the aggregate commitments outstanding. On October 6, 2020, we amended our unsecured senior line of credit to increase commitments available for borrowing by $800 million to an aggregate of $3.0 billion and to extend the maturity date to January 6, 2026. Among other things, the amended credit agreement includes a 0% LIBOR floor on the interest rate and is subject to certain annual sustainability measures entitling us to a temporary reduction in the interest rate margin of one basis point, but not below zero percent per year.
We use our unsecured senior line of credit to fund working capital, construction activities, and, from time to time, acquisition of properties. Borrowings under the unsecured senior line of credit bear interest at a “Eurocurrency Rate,” a “LIBOR Floating Rate,” or a “Base Rate” specified in the unsecured senior line of credit agreement plus, in any case, the Applicable Margin. The Eurocurrency Rate specified in the unsecured senior line of credit agreement is, as applicable, the rate per annum equal to either (i) the LIBOR or a successor rate thereto as agreed to by the administrative agent and the Company for loans denominated in a LIBOR quoted currency (i.e., U.S. dollars, euro, sterling, or yen), (ii) the average annual yield rates applicable to Canadian dollar bankers’ acceptances for loans denominated in Canadian dollars, (iii) the Bank Bill Swap Reference Bid rate for loans denominated in Australian dollars, or (iv) the rate designated with respect to the applicable alternative currency for loans denominated in a non-LIBOR quoted currency (other than Canadian or Australian dollars). The LIBOR Floating Rate means, for any day, one-month LIBOR, or a successor rate thereto as agreed to by the administrative agent and the Company for loans denominated in U.S. dollars. The Base Rate means, for any day, a fluctuating rate per annum equal to the highest of (i) the federal funds rate plus 1/2 of 1.00%, (ii) the rate of interest in effect for such day as publicly announced from time to time by the Administrative Agent as its “prime rate,” and (iii) the Eurocurrency Rate plus 1.00%. Our unsecured senior line of credit contains a feature that allows lenders to competitively bid on the interest rate for borrowings under the facility. This may result in an interest rate that is below the stated rate.
We expect to fund a portion of our capital needs in 2021 from the settlement of our outstanding forward equity sales agreements, from sales of our common stock under our ATM program, from issuances under our commercial paper program discussed below, from borrowings under our unsecured senior line of credit, and from real estate dispositions and partial interest sales.
We established a commercial paper program that provides us with the ability to issue up to $1.5 billion of commercial paper notes generally with a maturity of 30 days or less and with a maximum maturity of 397 days from the date of issuance. Our commercial paper program is backed by our unsecured senior line of credit, and at all times we expect to retain a minimum undrawn amount of borrowing capacity under our unsecured senior line of credit equal to any outstanding balance on our commercial paper program. We use borrowings under the program to fund short-term capital needs. The notes issued under our commercial paper program are sold under customary terms in the commercial paper market. They are typically issued at a discount to par, representing a yield to maturity dictated by market conditions at the time of issuance. In the event we are unable to issue commercial paper notes or refinance outstanding commercial paper notes under terms equal to or more favorable than those under the unsecured senior line of credit, we expect to borrow under the unsecured senior line of credit at LIBOR plus 0.825%. The commercial paper notes sold during the year ended December 31, 2020, were issued at a weighted-average yield to maturity of 0.26%. As of December 31, 2020, we had $100.0 million of outstanding notes under our commercial paper program.
In March 2020, we completed an offering of $700.0 million of unsecured senior notes payable due on December 15, 2030, at an interest rate of 4.90% for net proceeds of $691.6 million. The net proceeds were used to reduce the outstanding indebtedness under our unsecured senior line of credit and commercial paper program.
In August 2020, we completed an offering of $1.0 billion of unsecured senior notes payable due on February 1, 2033, at an interest rate of 1.875% for net proceeds of $989.1 million. A portion of the proceeds was used to refinance our 3.90% unsecured senior notes payable due in 2023, aggregating $500.0 million, pursuant to a partial cash tender offer and a subsequent call for redemption. On August 5, 2020, we tendered $247.0 million, or 49.4%, of our outstanding 3.90% unsecured senior notes payable and settled the call for redemption of the remaining outstanding balance on September 4, 2020. As a result of our debt refinancing, we recognized a loss on early extinguishment of debt of $50.8 million, including the write-off of unamortized loan fees.
In December 2020, we extinguished two secured notes payable aggregating $108.2 million due in 2023 with a weighted-average interest rate of 3.67% and recognized losses on early extinguishment of debt aggregating $7.3 million. As a result of these extinguishments, we have no debt maturing until 2024.
Since January 1, 2019, we have completed the issuances of $4.4 billion in unsecured senior notes, with a weighted-average interest rate of 3.48% and a weighted-average maturity of 14.1 years, as of December 31, 2020.
Refer to Note 10 – “Secured and unsecured senior debt” to our consolidated financial statements under Item 15 in this annual report on Form 10-K for additional information.
Proactive management of transition away from LIBOR
LIBOR has been used extensively in the U.S. and globally as a reference rate for various commercial and financial contracts, including variable-rate debt and interest rate swap contracts. However, it is expected that LIBOR will no longer be used after June 30, 2023. To address the increased risk of LIBOR discontinuation, in the U.S. the Alternative Reference Rates Committee (“ARRC”) was established to help ensure the successful transition from LIBOR. In June 2017, the ARRC selected SOFR, a new index calculated by reference to short-term repurchase agreements backed by U.S. Treasury securities, as its preferred replacement for U.S. dollar LIBOR. We have been closely monitoring developments related to the transition away from LIBOR and have implemented numerous proactive measures to minimize the potential impact of the transition to the Company, specifically:
•We have proactively eliminated outstanding LIBOR-based borrowings under our unsecured senior bank term loans and secured construction loans through repayments. From January 2017 through December 2020, we retired approximately $1.5 billion of such debt.
•During 2020, we increased the aggregate amount of our commercial paper program to $1.5 billion from $750.0 million. This program provides us with ability to issue commercial paper notes bearing interest at short-term fixed rates, generally with a maturity of 30 days or less and with a maximum maturity of 397 days from the date of issuance. Our commercial paper program is not subject to LIBOR and is used for funding short-term working capital needs. As of December 31, 2020, we had $100.0 million of outstanding notes under our commercial paper program.
•We continue to prudently manage outstanding borrowings under our unsecured senior line of credit, our only LIBOR-based debt (excluding $12.7 million LIBOR-based debt held by one of our unconsolidated joint ventures as of December 31, 2020). As of December 31, 2020, we had no borrowings outstanding under our unsecured senior line of credit.
•Our unsecured senior line of credit contains fallback language generally consistent with the ARRC’s Amendment Approach, which provides a streamlined amendment approach for negotiating a benchmark replacement and introduces clarity with respect to the fallback trigger events and an adjustment to be applied to the successor rate.
•We continue to monitor developments by the ARRC and other governing bodies involved in LIBOR transition.
Refer to Note 10 – “Secured and unsecured senior debt” to our consolidated financial statements under Item 15 and “Item 1A. Risk factors” in this annual report on Form 10-K for additional information about our management of risks related to the transition away from LIBOR.
Real estate dispositions and partial interest sales
We expect to continue the disciplined execution of select sales of operating assets. Future sales will provide an important source of capital to fund a portion of pending and recently completed opportunistic acquisitions and our highly leased value-creation development and redevelopment projects, and also provide significant capital for growth over the next two to three quarters. We may also consider additional sales of partial interests in core Class A properties and/or development projects. For 2021, we expect real estate dispositions and partial interest sales ranging from $1.3 billion to $1.5 billion. The amount of asset sales necessary to meet our forecasted sources of capital will vary depending upon the amount of EBITDA associated with the assets sold.
During the year ended December 31, 2020, we received proceeds of $1.1 billion, primarily related to our sale of properties at 510 Townsend Street, 505 Brannan Street, and 945 Market Street in our SoMa submarket, our sale of properties at 9808 and 9868 Scranton Road in our Sorrento Mesa submarket, and our partial interest sale of properties at 1201 and 1208 Eastlake Avenue East and 199 East Blaine Street in our Lake Union submarket. The proceeds received were used primarily to fund development and redevelopment projects in our highly leased value-creation pipeline and to fund acquisitions completed in 2020.
As a REIT, generally we are subject to a 100% tax on the net income from real estate asset sales that the IRS characterizes as “prohibited transactions.” We do not expect our sales will be categorized as prohibited transactions. However, unless we meet certain “safe harbor” requirements, whether a real estate asset sale is a prohibited transaction will be based on the facts and circumstances of the sale. Our real estate asset sales may not always meet such safe harbor requirements. Refer to “Item 1A. Risk factors” in this annual report on Form 10-K for additional information about the “prohibited transaction” tax.
Common equity transactions
During the year ended December 31, 2020, we completed issuances and executed forward equity sales agreements for an aggregate of 15.7 million shares of common stock, including the exercise of an underwriters’ option, for aggregate net proceeds of approximately $2.4 billion, as follows:
•In January 2020 and July 2020, we entered into forward equity sales agreements aggregating $1.0 billion and $1.1 billion, respectively, to sell an aggregate of 6.9 million shares for each offering (13.8 million in aggregate) of our common stock, including the exercise of underwriters’ options, at public offering prices of $155.00 per share and $160.50 per share, respectively, before underwriting discounts. During 2020, we issued all 13.8 million shares under these forward equity sales agreements and received net proceeds of $2.1 billion.
•In February 2020, we entered into an ATM common stock offering program, which allowed us to sell up to an aggregate of $850.0 million of our common stock.
•We issued 1.5 million shares of common stock under our ATM program at a price of $159.09 per share (before underwriting discounts), and received net proceeds of $235.0 million during 2020.
•We have 362 thousand shares under our ATM program subject to forward equity sales agreements that remain outstanding at a price of $159.09 per share (before underwriting discounts) As of December 31, 2020. We expect to settle these forward equity sales agreements in 2021 and receive net proceeds of approximately $56.3 million.
•The remaining availability of $547.3 million under this ATM program expired in December 2020 concurrently with the expiration of the associated shelf registration. In January 2021, we filed a new shelf registration statement and expect to establish a new ATM program soon in 2021.
Other sources
Under our current shelf registration statement filed with the SEC, we may offer common stock, preferred stock, debt, and other securities. These securities may be issued, from time to time, at our discretion based on our needs and market conditions, including, as necessary, to balance our use of incremental debt capital.
Additionally, we hold interests, together with joint venture partners, in real estate joint ventures that we consolidate in our financial statements. These joint venture partners may contribute equity into these entities primarily related to their share of funds for construction and financing-related activities. During the year ended December 31, 2020, we received $367.6 million of contributions from and sales of noncontrolling interests.
Uses of capital
Summary of capital expenditures
One of our primary uses of capital relates to the development, redevelopment, pre-construction, and construction of properties. We currently have projects in our growth pipeline aggregating 3.3 million RSF of Class A office/laboratory and tech office space undergoing construction, 7.1 million RSF of near-term and intermediate-term development and redevelopment projects, and 7.4 million SF of future development projects in North America. We incur capitalized construction costs related to development, redevelopment, pre-construction, and other construction activities. We also incur additional capitalized project costs, including interest, property taxes, insurance, and other costs directly related and essential to the development, redevelopment, pre-construction, or construction of a project, during periods when activities necessary to prepare an asset for its intended use are in progress. Refer to the “New Class A development and redevelopment properties: current projects” and “Summary of capital expenditures” subsections of the “Investments in real estate” section under Item 2 in this annual report on Form 10-K for more information on our capital expenditures.
We capitalize interest cost as a cost of the project only during the period for which activities necessary to prepare an asset for its intended use are ongoing, provided that expenditures for the asset have been made and interest cost has been incurred. Capitalized interest for the years ended December 31, 2020 and 2019, of $125.6 million and $88.6 million, respectively, was classified in investments in real estate. Indirect project costs, including construction administration, legal fees, and office costs that clearly relate to projects under development or construction, are capitalized as incurred during the period an asset is undergoing activities to prepare it for its intended use. We capitalized payroll and other indirect project costs related to development, redevelopment, pre-construction, and construction projects, which aggregated $61.0 million and $43.2 million for the years ended December 31, 2020 and 2019, respectively. The increase in capitalized payroll and other indirect project costs for the year ended December 31, 2020, compared to the same period in 2019 was primarily due to an increase in our value-creation pipeline projects undergoing construction and pre-construction activities aggregating 11 projects with 7.2 million RSF in 2020 over 2019. Pre-construction activities include entitlements, permitting, design, site work, and other activities preceding commencement of construction of aboveground building improvements. The advancement of pre-construction efforts is focused on reducing the time required to deliver projects to prospective tenants. These critical activities add significant value for future ground-up development and are required for the vertical construction of buildings. Should we cease activities necessary to prepare an asset for its intended use, the interest, taxes, insurance, and certain other direct project costs related to this asset would be expensed as incurred. Expenditures for repairs and maintenance are expensed as incurred.
Fluctuations in our development, redevelopment, and construction activities could result in significant changes to total expenses and net income. For example, had we experienced a 10% reduction in development, redevelopment, and construction activities without a corresponding decrease in indirect project costs, including interest and payroll, total expenses would have increased by approximately $18.7 million for the year ended December 31, 2020.
We use third-party brokers to assist in our leasing activity, who are paid on a contingent basis upon successful leasing. We are required to capitalize initial direct costs related to successful leasing transactions that result directly from and are essential to the lease transaction and would not have been incurred had that lease transaction not been successfully executed. During the year ended December 31, 2020, we capitalized total initial direct leasing costs of $61.2 million. Costs that we incur to negotiate or arrange a lease regardless of its outcome, such as fixed employee compensation, tax, or legal advice to negotiate lease terms, and other costs, are expensed as incurred.
Acquisitions
Refer to the “Acquisitions” section in Note 3 – “Investments in real estate” and to Note 4 – “Consolidated and unconsolidated real estate joint ventures” to our consolidated financial statements under Item 15 in this annual report on Form 10-K for detailed information on our acquisitions.
Dividends
During the years ended December 31, 2020 and 2019, we paid the following dividends (in thousands):
| | | | | | | | | | | | | | | | | |
| Year Ended December 31, | | |
| 2020 | | 2019 | | Change |
| Common Stock | $ | 532,980 | | | $ | 447,029 | | | $ | 85,951 | |
| Series D Convertible Preferred Stock | — | | | 4,141 | | | (4,141) | |
| | $ | 532,980 | | | $ | 451,170 | | | $ | 81,810 | |
The increase in dividends paid on our common stock during the year ended December 31, 2020, compared to the year ended December 31, 2019, was primarily due to an increase in number of common shares outstanding subsequent to January 1, 2019, as a result of issuances of common stock under our ATM program and settlement of forward equity sales agreements, and partially due to the increase in the related dividends to $4.18 per common share paid during the year ended December 31, 2020, from $3.94 per common share paid during the year ended December 31, 2019.
The decrease in dividends paid on our Series D Convertible Preferred Stock during the year ended December 31, 2020, compared to the year ended December 31, 2019, was due to the repurchase of 275,000 outstanding shares of our Series D Convertible Preferred Stock and the conversion of the remaining 2.3 million outstanding shares of our Series D Convertible Preferred Stock into shares of our common stock during 2019. As a result, we had no outstanding shares of Series D Convertible Preferred Stock as of December 31, 2020.
Contractual obligations and commitments
Contractual obligations as of December 31, 2020, consisted of the following (in thousands):
| | | | | | | | | | | | | | | | | | | | | | | | | | | | | |
| | | Payments by Period |
| Total | | 2021 | | 2022–2023 | | 2024–2025 | | Thereafter |
Secured and unsecured debt(1)(2) | $ | 7,598,130 | | | $ | 3,420 | | | $ | 7,364 | | | $ | 1,433,593 | | | $ | 6,153,753 | |
Estimated interest payments on fixed-rate debt(3) | 3,077,819 | | | 279,393 | | | 558,689 | | | 492,553 | | | 1,747,184 | |
| Ground lease obligations – operating leases | 798,589 | | | 17,127 | | | 34,750 | | | 35,115 | | | 711,597 | |
| Ground lease obligations – finance lease | 35,868 | | | 415 | | | 836 | | | 844 | | | 33,773 | |
Other obligations | 27,215 | | | 1,776 | | | 5,253 | | | 5,583 | | | 14,603 | |
Total | $ | 11,537,621 | | | $ | 302,131 | | | $ | 606,892 | | | $ | 1,967,688 | | | $ | 8,660,910 | |
(1)Amounts represent principal amounts due and exclude unamortized premiums (discounts) and deferred financing costs reflected in the consolidated balance sheets under Item 15 in this annual report on Form 10-K.
(2)Payment dates reflect any extension options that we control.
(3)Amounts are based upon contractual interest rates, including interest payment dates and scheduled maturity dates.
Secured notes payable
Secured notes payable as of December 31, 2020, consisted of four notes secured by nine properties. Our secured notes payable typically require monthly payments of principal and interest and had a weighted-average interest rate of approximately 3.53%. As of December 31, 2020, the total book value of our investments in real estate securing debt was approximately $880.1 million. Additionally, as of December 31, 2020, our entire secured notes payable balance of $230.9 million, including unamortized discounts and deferred financing costs, was fixed-rate debt. Refer to Note 10 – “Secured and unsecured senior debt” to our consolidated financial statements under Item 15 in this annual report on Form 10-K for information on our repayments of secured notes payable during the year ended December 31, 2020.
Unsecured senior notes payable and unsecured senior line of credit
The requirements of, and our actual performance with respect to, the key financial covenants under our unsecured senior notes payable as of December 31, 2020, were as follows:
| | | | | | | | | | | | | | |
Covenant Ratios(1) | | Requirement | | December 31, 2020 |
| Total Debt to Total Assets | | Less than or equal to 60% | | 31% |
| Secured Debt to Total Assets | | Less than or equal to 40% | | 1% |
Consolidated EBITDA(2) to Interest Expense | | Greater than or equal to 1.5x | | 8.6x |
| Unencumbered Total Asset Value to Unsecured Debt | | Greater than or equal to 150% | | 305% |
(1)All covenant ratio titles utilize terms as defined in the respective debt agreements.
(2)The calculation of consolidated EBITDA is based on the definitions contained in our loan agreements and is not directly comparable to the computation of EBITDA as described in Exchange Act Release No. 47226.
In addition, the terms of the indentures, among other things, limit the ability of the Company, Alexandria Real Estate Equities, L.P., and the Company’s subsidiaries to (i) consummate a merger, or consolidate or sell all or substantially all of the Company’s assets, and (ii) incur certain secured or unsecured indebtedness.
The requirements of, and our actual performance with respect to, the key financial covenants under our unsecured senior line of credit as of December 31, 2020, were as follows:
| | | | | | | | | | | | | | | | | |
Covenant Ratios (1) | | Requirement | | December 31, 2020 |
| Leverage Ratio | | Less than or equal to 60.0% | | 27.5% | |
| Secured Debt Ratio | | Less than or equal to 45.0% | | 0.8% | |
| Fixed-Charge Coverage Ratio | | Greater than or equal to 1.50x | | 3.91x | |
| Unsecured Interest Coverage Ratio | | Greater than or equal to 1.75x | | 6.64x | |
(1)All covenant ratio titles utilize terms as defined in each respective credit agreement.
Estimated interest payments
Estimated interest payments on our fixed-rate debt were calculated based upon contractual interest rates, including interest payment dates and scheduled maturity dates. As of December 31, 2020, 99% of our debt was fixed-rate debt. For additional information regarding our debt, refer to Note 10 – “Secured and unsecured senior debt” to our consolidated financial statements under Item 15 in this annual report on Form 10-K.
Ground lease obligations
Operating lease agreements
Ground lease obligations as of December 31, 2020, included leases for 36 of our properties, which accounted for approximately 11% of our total number of properties. Excluding one ground lease that expires in 2036 related to one operating property with a net book value of $7.1 million as of December 31, 2020, our ground lease obligations have remaining lease terms ranging from approximately 33 to 94 years, including available extension options that we are reasonably certain to exercise.
As of December 31, 2020, the remaining contractual payments under ground and office lease agreements in which we are the lessee aggregated $798.6 million and $27.2 million, respectively. We are required to recognize a right-of-use asset and a related liability to account for our future obligations under operating lease arrangements in which we are the lessee. The operating lease liability is measured based on the present value of the remaining lease payments, including payments during the term under our extension options that we are reasonably certain to exercise. The right-of-use asset is equal to the corresponding operating lease liability, adjusted for the initial direct leasing cost and any other consideration exchanged with the landlord prior to the commencement of the lease, as well as adjustments to reflect favorable or unfavorable terms of an acquired lease when compared with market terms at the time of acquisition. As of December 31, 2020, the present value of the remaining contractual payments, aggregating $825.8 million, under our operating lease agreements, including our extension options that we are reasonably certain to exercise, was $345.8 million, which was classified in accounts payable, accrued expenses, and other liabilities in our consolidated balance sheets. As of December 31, 2020, the weighted-average remaining lease term of operating leases in which we are the lessee was approximately 43 years, and the weighted-average discount rate was 4.88%. Our corresponding operating lease right-of-use assets, adjusted for initial direct leasing costs and other consideration exchanged with the landlord prior to the commencement of the lease, aggregated $335.9 million. We classify the right-of-use asset in other assets in our consolidated balance sheets. Refer to the “Lease accounting” section in Note 2 – “Summary of significant accounting policies” to our consolidated financial statements under Item 15 in this annual report on Form 10-K.
Commitments
As of December 31, 2020, remaining aggregate costs under contract for the construction of properties undergoing development, redevelopment, and improvements under the terms of leases approximated $1.2 billion. We expect payments for these obligations to occur over one to three years, subject to capital planning adjustments from time to time. We may have the ability to cease the construction of certain properties, which would result in the reduction of our commitments. In addition, we have letters of credit and performance obligations aggregating $11.1 million primarily related to construction projects.
We are committed to funding approximately $210.6 million for non-real estate investments primarily related to our investments in privately held entities that report NAV. Our funding commitments expire at various dates over the next 11 years, with a weighted-average expiration of 8.3 years as of December 31, 2020.
Exposure to environmental liabilities
In connection with the acquisition of all of our properties, we have obtained Phase I environmental assessments to ascertain the existence of any environmental liabilities or other issues. The Phase I environmental assessments of our properties have not revealed any environmental liabilities that we believe would have a material adverse effect on our financial condition or results of operations taken as a whole, nor are we aware of any material environmental liabilities that have occurred since the Phase I environmental assessments were completed. In addition, we carry a policy of pollution legal liability insurance covering exposure to certain environmental losses at substantially all of our properties.
Accumulated other comprehensive loss
The following table presents the change in accumulated other comprehensive loss attributable to Alexandria Real Estate Equities, Inc.’s stockholders during the year ended December 31, 2020, due to the changes in the foreign exchange rates for our real estate investments in Canada and Asia. We reclassify unrealized foreign currency translation gains and losses into net income as we dispose of these holdings.
| | | | | | | | |
| | | Total |
| Balance as of December 31, 2019 | | $ | (9,749) | |
| | |
| Other comprehensive income before reclassifications | | 3,124 | |
| Net other comprehensive income | | 3,124 | |
| | |
| Balance as of December 31, 2020 | | $ | (6,625) | |
Issuer and guarantor subsidiary summarized financial information
Alexandria Real Estate Equities, Inc. (the “Issuer”) has sold certain debt securities registered under the Securities Act of 1933, as amended, that are fully and unconditionally guaranteed by Alexandria Real Estate Equities, L.P. (the “LP” or the “Guarantor Subsidiary”), an indirectly 100% owned subsidiary of the Issuer. The Issuer’s other subsidiaries, including, but not limited to, the subsidiaries that own substantially all of its real estate (collectively, the “Combined Non-Guarantor Subsidiaries”), will not provide a guarantee of such securities, including the subsidiaries that are partially or 100% owned by the LP. The following summarized financial information presents on a combined basis for the Issuer and the Guarantor Subsidiary balance sheet financial information as of December 31, 2020 and 2019, and results of operations and comprehensive income for the years ended December 31, 2020 and 2019. The information presented below excludes eliminations necessary to arrive at the information on a consolidated basis. In presenting the summarized financial statements, the equity method of accounting has been applied to (i) the Issuer’s interests in the Guarantor Subsidiary, (ii) the Guarantor Subsidiary’s interests in the Combined Non-Guarantor Subsidiaries, and (iii) the Combined Non-Guarantor Subsidiaries’ interests in the Guarantor Subsidiary, where applicable, even though all such subsidiaries meet the requirements to be consolidated under GAAP. All assets and liabilities have been allocated to the Issuer and the Guarantor Subsidiary generally based on legal entity ownership.
The following tables present combined summarized financial information as of December 31, 2020 and 2019, and for the years ended December 31, 2020 and 2019, for the Issuer and Guarantor Subsidiary. Amounts provided do not represent our total consolidated amounts (in thousands):
| | | | | | | | | | | | | | |
| | December 31, |
| | 2020 | | 2019 |
| Assets: | | | | |
| Cash, cash equivalents, and restricted cash | | $ | 404,802 | | | $ | 4,432 | |
| Other assets | | 100,689 | | | 71,036 | |
| Total assets | | $ | 505,491 | | | $ | 75,468 | |
| | | | |
| Liabilities: | | | | |
| Unsecured senior notes payable | | $ | 7,232,370 | | | $ | 6,044,127 | |
| Unsecured senior line of credit and commercial paper | | 99,991 | | | 384,000 | |
| Other liabilities | | 341,621 | | | 278,858 | |
| Total liabilities | | $ | 7,673,982 | | | $ | 6,706,985 | |
| | | | |
| | | | | | | | | | | | | | |
| | Year Ended December 31, |
| | 2020 | | 2019 |
| Total revenues | | $ | 22,946 | | | $ | 22,731 | |
| Total expenses | | (355,370) | | | (317,896) | |
| Net loss | | (332,424) | | | (295,165) | |
| Net income attributable to unvested restricted stock awards and preferred stock | | (10,168) | | | (12,170) | |
Net loss attributable to Alexandria Real Estate Equities, Inc.’s common stockholders | | $ | (342,592) | | | $ | (307,335) | |
| | | | |
Critical accounting policies
Our consolidated financial statements have been prepared in accordance with GAAP. The preparation of these financial statements in conformity with GAAP requires us to make estimates, judgments, and assumptions that affect the reported amounts of assets, liabilities, revenues, and expenses. We base these estimates, judgments, and assumptions on historical experience and on various other factors that we believe to be reasonable under the circumstances.
We continually evaluate the policies and estimates we use to prepare our consolidated financial statements. Changes in estimates or policies applied could affect our financial position and specific items in our results of operations that are used by our stockholders, potential investors, industry analysts, and lenders in their evaluation of our performance. Our significant accounting policies are described in Note 2 – “Summary of significant accounting policies” to our consolidated financial statements under Item 15 in this annual report on Form 10-K.
REIT compliance
We have elected to be taxed as a REIT under the Internal Revenue Code. Qualification as a REIT involves the application of highly technical and complex provisions of the Internal Revenue Code to our operations and financial results, and the determination of various factual matters and circumstances not entirely within our control. We believe that our current organization and method of operation comply with the rules and regulations promulgated under the Internal Revenue Code to enable us to qualify, and continue to qualify, as a REIT. However, it is possible that we have been organized or have operated in a manner that would not allow us to qualify as a REIT, or that our future operations could cause us to fail to qualify.
If we fail to qualify as a REIT in any taxable year, then we will be required to pay federal and state income taxes on our taxable income at regular corporate rates. If we lose our REIT status, then our net earnings available for investment or distribution to our stockholders will be significantly reduced for each of the years involved and we will no longer be required to make distributions to our stockholders.
Investments in real estate
Recognition of real estate acquired
We evaluate each acquisition of real estate or in-substance real estate (including equity interests in entities that predominantly hold real estate assets) to determine whether the integrated set of assets and activities acquired meets the definition of a business and needs to be accounted for as a business combination. An acquisition of an integrated set of assets and activities that does not meet the definition of a business is accounted for as an asset acquisition.
For acquisitions of real estate or in-substance real estate that are accounted for as business combinations, we allocate the acquisition consideration (excluding acquisition costs) to the assets acquired, liabilities assumed, noncontrolling interests, and previously existing ownership interests at fair value as of the acquisition date. Assets include intangible assets such as tenant relationships, acquired in-place leases, and favorable intangibles associated with in-place leases in which we are the lessor. Liabilities include unfavorable intangibles associated with in-place leases in which we are the lessor. In addition, for acquired in-place finance or operating leases in which we are the lessee, acquisition consideration is allocated to lease liabilities and related right-of-use assets, adjusted to reflect favorable or unfavorable terms of the lease when compared with market terms. Any excess (deficit) of the consideration transferred relative to the fair value of the net assets acquired is accounted for as goodwill (bargain purchase gain). Acquisition costs related to business combinations are expensed as incurred.
Generally, we expect that acquisitions of real estate or in-substance real estate will not meet the definition of a business because substantially all of the fair value is concentrated in a single identifiable asset or group of similar identifiable assets (i.e., land, buildings, and related intangible assets). The accounting model for asset acquisitions is similar to the accounting model for business combinations except that the acquisition consideration (including acquisition costs) is allocated to the individual assets acquired and liabilities assumed on a relative fair value basis. Any excess (deficit) of the consideration transferred relative to the sum of the fair value of the assets acquired and liabilities assumed is allocated to the individual assets and liabilities based on their relative fair values. As a result, asset acquisitions do not result in the recognition of goodwill or a bargain purchase gain. Incremental and external direct acquisition costs (such as legal and other third-party services) are capitalized.
We exercise judgment to determine the key assumptions used to allocate the purchase price of real estate acquired among its components. The allocation of the consideration to the various components of properties acquired during the year can have an effect on our net income due to the useful depreciable and amortizable lives applicable to each component and the recognition of the related depreciation and amortization expense in our consolidated statements of operations. We apply judgment in utilizing available comparable market information to assess relative fair value. We assess the relative fair values of tangible and intangible assets and liabilities based on available comparable market information, including estimated replacement costs, rental rates, and recent market transactions. In addition, we may use estimated cash flow projections that utilize appropriate discount and capitalization rates.
Estimates of future cash flows are based on a number of factors, including the historical operating results, known and anticipated trends, and market/economic conditions that may affect the property.
The value of tangible assets acquired is based upon our estimation of fair value on an “as if vacant” basis. The value of acquired in-place leases includes the estimated costs during the hypothetical lease-up period and other costs that would have been incurred in the execution of similar leases under the market conditions at the acquisition date of the acquired in-place lease. The value of above-market lease assets and below-market lease liabilities reflects the difference between (i) the contractual rents to be paid over the remaining term for each in-place lease and (ii) the estimated current market lease rates using available comparable market information and tenant credit quality. If there is a bargain fixed-rate renewal option for the period beyond the noncancelable lease term of an in-place lease, we evaluate intangible factors such as the business conditions in the industry in which the lessee operates, the economic conditions in the area in which the property is located, and the ability of the lessee to sublease the property during the renewal term, in order to determine the likelihood that the lessee will renew. When we determine there is reasonable assurance that such bargain purchase option will be exercised, we consider the option in determining the intangible value of such lease and its related amortization period. We also recognize the relative fair values of assets acquired, the liabilities assumed, and any noncontrolling interest in acquisitions of less than a 100% interest when the acquisition constitutes a change in control of the acquired entity.
We completed acquisitions of 55 properties for a total purchase price of $2.6 billion during the year ended December 31, 2020. These transactions were accounted for as asset acquisitions, and the purchase price of each was allocated based on the relative fair value of the asset acquired and liabilities assumed.
Depreciation and amortization
The values allocated to buildings and building improvements, land improvements, tenant improvements, and equipment are depreciated on a straight-line basis using the shorter of the respective ground lease term, estimated useful life, or up to 40 years, for buildings and building improvements; estimated life, or up to 20 years, for land improvements; the respective lease term or estimated useful life for tenant improvements; and the shorter of the lease term or estimated useful life for equipment. The values of acquired in-place leases and associated favorable intangibles (i.e., acquired above-market leases) are classified in other assets in our consolidated balance sheets and are amortized over the remaining terms of the related leases as a reduction of income from rentals in our consolidated statements of operations. The values of unfavorable intangibles (i.e., acquired below-market leases) associated with acquired in-place leases are classified in accounts payable, accrued expenses, and other liabilities in our consolidated balance sheets and are amortized over the remaining terms of the related leases, as an increase in income from rentals in our consolidated statements of operations.
Capitalized project costs
We capitalize project costs, including pre-construction costs, interest, property taxes, insurance, and other costs directly related and essential to the development, redevelopment, pre-construction, or construction of a project. Capitalization of development, redevelopment, pre-construction, and construction costs is required while activities are ongoing to prepare an asset for its intended use. Fluctuations in our development, redevelopment, pre-construction, and construction activities could result in significant changes to total expenses and net income. Costs incurred after a project is substantially complete and ready for its intended use are expensed as incurred. Should development, redevelopment, pre-construction, or construction activity cease, interest, property taxes, insurance, and certain other costs would no longer be eligible for capitalization and would be expensed as incurred. Expenditures for repairs and maintenance are expensed as incurred.
Properties classified as held for sale
A property is classified as held for sale when all of the following criteria for a plan of sale have been met: (i) management, having the authority to approve the action, commits to a plan to sell the property; (ii) the property is available for immediate sale in its present condition, subject only to terms that are usual and customary; (iii) an active program to locate a buyer and other actions required to complete the plan to sell have been initiated; (iv) the sale of the property is probable and is expected to be completed within one year; (v) the property is being actively marketed for sale at a price that is reasonable in relation to its current fair value; and (vi) actions necessary to complete the plan of sale indicate that it is unlikely that significant changes to the plan will be made or that the plan will be withdrawn. Depreciation of assets ceases upon designation of a property as held for sale.
If the disposal of a property represents a strategic shift that has (or will have) a major effect on our operations or financial results, such as (i) a major line of business, (ii) a major geographic area, (iii) a major equity method investment, or (iv) other major parts of an entity, then the operations of the property, including any interest expense directly attributable to it, are classified as discontinued operations in our consolidated statements of operations, and amounts for all prior periods presented are reclassified from continuing operations to discontinued operations. The disposal of an individual property generally will not represent a strategic shift and therefore will typically not meet the criteria for classification as a discontinued operation.
Impairment of long-lived assets
Prior to and subsequent to the end of each quarter, we review current activities and changes in the business conditions of all of our long-lived assets to determine the existence of any triggering events or impairment indicators requiring an impairment analysis. If triggering events or impairment indicators are identified, we review an estimate of the future undiscounted cash flows, including, if necessary, a probability-weighted approach if multiple outcomes are under consideration.
Long-lived assets to be held and used, including our rental properties, CIP, land held for development, right-of-use assets related to operating leases in which we are the lessee, and intangibles, are individually evaluated for impairment when conditions exist that may indicate that the carrying amount of a long-lived asset may not be recoverable. The carrying amount of a long-lived asset to be held and used is not recoverable if it exceeds the sum of the undiscounted cash flows expected to result from the use and eventual disposition of the asset. Triggering events or impairment indicators for long-lived assets to be held and used, including our rental properties, CIP, land held for development, and intangibles, are assessed by project and include significant fluctuations in estimated net operating income, occupancy changes, significant near-term lease expirations, current and historical operating and/or cash flow losses, construction costs, estimated completion dates, rental rates, and other market factors. We assess the expected undiscounted cash flows based upon numerous factors, including, but not limited to, construction costs, available market information, current and historical operating results, known trends, current market/economic conditions that may affect the property, and our assumptions about the use of the asset, including, if necessary, a probability-weighted approach if multiple outcomes are under consideration.
Upon determination that an impairment has occurred, a write-down is recognized to reduce the carrying amount to its estimated fair value. If an impairment loss is not required to be recognized, the recognition of depreciation or amortization is adjusted prospectively, as necessary, to reduce the carrying amount of the real estate to its estimated disposition value over the remaining period that the asset is expected to be held and used. We may adjust depreciation of properties that are expected to be disposed of or redeveloped prior to the end of their useful lives.
We use the held for sale impairment model for our properties classified as held for sale. The held for sale impairment model is different from the held and used impairment model. Under the held for sale impairment model, an impairment loss is recognized if the carrying amount of the long-lived asset classified as held for sale exceeds its fair value less cost to sell. Because of these two different models, it is possible for a long-lived asset previously classified as held and used to require the recognition of an impairment charge upon classification as held for sale.
Equity investments
We hold investments in publicly traded companies and privately held entities primarily involved in the life science, technology, and agtech industries. As a REIT, we generally limit our ownership percentage in the voting stock of each individual entity to less than 10%.
Our investments in publicly traded companies are classified as investments with readily determinable fair values and are carried at fair value, with changes in fair value recognized in net income. The fair values for our investments in publicly traded companies are determined based on sales prices/quotes available on securities exchanges and therefore generally require no judgment to determine fair value. Investments in privately held entities that report NAV per share, such as our privately held investments in limited partnerships, are carried at fair value using NAV as a practical expedient, with changes in fair value recognized in net income. As a result, fair value estimation for these investments generally requires limited judgment. Investments in privately held entities that do not report NAV are measured at cost, adjusted for observable price changes and impairments, with changes recognized in net income. Observable price changes result from, among other things, equity transactions for the same issuer executed during the reporting period, including subsequent equity offerings or other reported equity transactions related to the same issuer. For these equity transactions to be considered observable price changes of the same issuer, we evaluate whether these transactions have similar rights and obligations, including voting rights, distribution preferences, conversion rights, and other factors, to the investments we hold.
We monitor investments in privately held entities that do not report NAV per share throughout the year for new developments, including operating results, prospects and results of clinical trials, new product initiatives, new collaborative agreements, capital-raising events, and merger and acquisition activities. These investments are evaluated on the basis of a qualitative assessment for indicators of impairment by monitoring the presence of the following triggering events or impairment indicators: (i) a significant deterioration in the earnings performance, asset quality, or business prospects of the investee; (ii) a significant adverse change in the regulatory, economic, or technological environment of the investee, (iii) a significant adverse change in the general market condition, including the research and development of technology and products that the investee is bringing or attempting to bring to the market, or (iv) significant concerns about the investee’s ability to continue as a going concern. If such indicators are present, we are required to estimate the investment’s fair value and immediately recognize an impairment loss in an amount equal to the investment’s carrying value in excess of its estimated fair value.
Liability and right-of-use assets related to operating leases in which we are the lessee
We have operating lease agreements in which we are the lessee consisting of ground and office leases. At the lease commencement date (or at the acquisition date if the lease is acquired as part of a real estate acquisition), we are required to recognize a liability to account for our future obligations under these operating leases, and a corresponding right-of-use asset.
The lease liability is measured based on the present value of the future lease payments, including payments during the term under our extension options that we are reasonably certain to exercise. The present value of the future lease payments is calculated for each operating lease using each respective remaining lease term and a corresponding estimated incremental borrowing rate, which is the interest rate that we estimate we would have to pay to borrow on a collateralized basis over a similar term for an amount equal to the lease payments. Subsequently, the lease liability is accreted by applying a discount rate established at the lease commencement date to the lease liability balance as of the beginning of the period and is reduced by the payments made during the period. We classify the operating lease liability in accounts payable, accrued expenses, and other liabilities in our consolidated balance sheets.
The right-of-use asset is measured based on the corresponding lease liability, adjusted for initial direct leasing costs and any other consideration exchanged with the landlord prior to the commencement of the lease, as well as adjustments to reflect favorable or unfavorable terms of an acquired lease when compared with market terms at the time of acquisition. Subsequently, the right-of-use asset is amortized on a straight-line basis during the lease term. We classify the right-of-use asset in other assets in our consolidated balance sheets. Refer to the “Lessee Accounting” subsection of “Lease Accounting” section within Note 2 – “Summary of significant accounting policies” to our consolidated financial statements under Item 15 in this annual report on Form 10-K.
Monitoring of tenant credit quality
During the term of each lease, we monitor the credit quality and any related material changes of our tenants by (i) monitoring the credit rating of tenants that are rated by a nationally recognized credit rating agency, (ii) reviewing financial statements of the tenants that are publicly available or that are required to be delivered to us pursuant to the applicable lease, (iii) monitoring news reports regarding our tenants and their respective businesses, and (iv) monitoring the timeliness of lease payments.
Allowance for credit losses
On January 1, 2020, we adopted an accounting standard that requires companies to estimate and recognize lifetime expected losses, rather than incurred losses, which results in the earlier recognition of credit losses even if the expected risk of credit loss is remote. The accounting standard applies to most financial assets including trade receivables and direct financing leases. The standard does not apply to the receivables arising from operating leases. Upon adoption of the new standard on January 1, 2020, we recognized a credit loss adjustment related to adoption of this accounting standard as a cumulative adjustment to retained earnings. For details, refer to the “Allowance for credit losses” section in Note 2 – “Summary of significant accounting policies”
We have one lease classified as a direct financing lease subject to this standard. In this direct financing lease, the payment obligation of the lessee is collateralized by real estate property. At each reporting date, we estimate the current credit loss related to this asset by assessing the probability of default on this lease based on the lessee’s financial condition, credit rating, business prospects, remaining lease term, and expected value of the underlying collateral upon its repossession, and, if necessary, we recognize a credit loss adjustment. We recognized subsequent credit loss adjustments related to our direct financing lease in our consolidated statements of operations during the year ended December 31, 2020. For further details, refer to Note 5 – “Leases” to our consolidated financial statements.
Non-GAAP measures and definitions
This section contains additional information of certain non-GAAP financial measures and the reasons why we use these supplemental measures of performance and believe they provide useful information to investors, as well as the definitions of other terms used in this annual report on Form 10-K.
Funds from operations and funds from operations, as adjusted, attributable to Alexandria Real Estate Equities, Inc.’s common stockholders
GAAP-basis accounting for real estate assets utilizes historical cost accounting and assumes that real estate values diminish over time. In an effort to overcome the difference between real estate values and historical cost accounting for real estate assets, the Nareit Board of Governors established funds from operations as an improved measurement tool. Since its introduction, funds from operations has become a widely used non-GAAP financial measure among equity REITs. We believe that funds from operations is helpful to investors as an additional measure of the performance of an equity REIT. Moreover, we believe that funds from operations, as adjusted, allows investors to compare our performance to the performance of other real estate companies on a consistent basis, without having to account for differences recognized because of real estate acquisition and disposition decisions, financing decisions, capital structure, capital market transactions, variances resulting from the volatility of market conditions outside of our control, or other corporate activities that may not be representative of the operating performance of our properties.
On January 1, 2019, we adopted standards established by the Nareit Board of Governors in its November 2018 White Paper (the “Nareit White Paper”) on a prospective basis. The Nareit White Paper defines funds from operations as net income (computed in accordance with GAAP), excluding gains or losses on sales of real estate, and impairments of real estate, plus depreciation and amortization of operating real estate assets, and after adjustments for our share of consolidated and unconsolidated partnerships and real estate joint ventures. Impairments represent the write-down of assets when fair value over the recoverability period is less than the carrying value due to changes in general market conditions and do not necessarily reflect the operating performance of the properties during the corresponding period.
We compute funds from operations, as adjusted, as funds from operations calculated in accordance with the Nareit White Paper, excluding significant gains, losses, and impairments realized on non-real estate investments, unrealized gains or losses on non-real estate investments, gains or losses on early extinguishment of debt, gains or losses on early termination of interest rate hedge agreements, significant termination fees, acceleration of stock compensation expense due to the resignation of an executive officer, preferred stock redemption charges, deal costs, the income tax effect related to such items, and the amount of such items that is allocable to our unvested restricted stock awards. Neither funds from operations nor funds from operations, as adjusted, should be considered as alternatives to net income (determined in accordance with GAAP) as indications of financial performance, or to cash flows from operating activities (determined in accordance with GAAP) as measures of liquidity, nor are they indicative of the availability of funds for our cash needs, including our ability to make distributions.
The following table reconciles net income to funds from operations for the share of consolidated real estate joint ventures attributable to noncontrolling interests and our share of unconsolidated real estate joint ventures for the year ended December 31, 2020:
| | | | | | | | | | | | | | | | | | | | | | | |
| Noncontrolling Interest Share of Consolidated Real Estate Joint Ventures | | Our Share of Unconsolidated
Real Estate Joint Ventures |
| December 31, 2020 | | December 31, 2020 |
| (in thousands) | Three Months Ended | | Year Ended | | Three Months Ended | | Year Ended |
| Net income | $ | 15,649 | | | $ | 56,212 | | | $ | 3,593 | | | $ | 8,148 | |
Depreciation and amortization | 15,032 | | | 61,933 | | | 2,976 | | | 11,413 | |
| Impairment of real estate | — | | | — | | | — | | | 7,644 | |
| Funds from operations | $ | 30,681 | | | $ | 118,145 | | | $ | 6,569 | | | $ | 27,205 | |
| | | | | | | |
The following tables present a reconciliation of net income attributable to Alexandria Real Estate Equities, Inc.’s common stockholders, the most directly comparable financial measure presented in accordance with GAAP, including our share of amounts from consolidated and unconsolidated real estate joint ventures, to funds from operations attributable to Alexandria Real Estate Equities, Inc.’s common stockholders – diluted, and funds from operations attributable to Alexandria Real Estate Equities, Inc.’s common stockholders – diluted, as adjusted, and the related per share amounts for the years ended December 31, 2020, 2019, and 2018. Per share amounts may not add due to rounding.
| | | | | | | | | | | | | | | | | |
| Year Ended December 31, |
| (In thousands) | 2020 | | 2019 | | 2018 |
| Net income attributable to Alexandria Real Estate Equities, Inc.’s common stockholders – basic and diluted | $ | 760,791 | | | $ | 350,995 | | | $ | 363,983 | |
| Depreciation and amortization of real estate assets | 684,682 | | | 541,855 | | | 477,661 | |
Noncontrolling share of depreciation and amortization from consolidated real estate JVs | (61,933) | | | (30,960) | | | (16,077) | |
Our share of depreciation and amortization from unconsolidated real estate JVs | 11,413 | | | 6,366 | | | 3,181 | |
| Gain on sales of real estate | (154,089) | | | (474) | | | (8,704) | |
Our share of gain on sales of real estate from unconsolidated real estate JVs | — | | | — | | | (35,678) | |
Impairment of real estate – rental properties | 40,501 | | (1) | 12,334 | | | — | |
Assumed conversion of 7.00% Series D cumulative convertible preferred stock | — | | | 3,204 | | | 5,060 | |
Allocation to unvested restricted stock awards | (7,018) | | | (5,904) | | | (5,961) | |
Funds from operations attributable to Alexandria Real Estate Equities, Inc.’s common stockholders – diluted(2) | 1,274,347 | | | 877,416 | | | 783,465 | |
| Unrealized gains on non-real estate investments | (374,033) | | | (161,489) | | | (99,634) | |
Realized gains on non-real estate investments | — | | | — | | | (14,680) | |
| Impairment of real estate | 15,221 | | | — | | | — | |
Impairment of real estate – land parcels | — | | | — | | | 6,311 | |
Impairment of non-real estate investments | 24,482 | | | 17,124 | | | 5,483 | |
Loss on early extinguishment of debt | 60,668 | | | 47,570 | | | 1,122 | |
Loss on early termination of interest rate hedge agreements | — | | | 1,702 | | | — | |
| Termination fee | (86,179) | | | — | | | — | |
| Acceleration of stock compensation expense due to executive officer resignation | 4,499 | | | — | | | — | |
Our share of gain on early extinguishment of debt from unconsolidated real estate JVs | — | | | — | | | (761) | |
Preferred stock redemption charge | — | | | 2,580 | | | 4,240 | |
Removal of assumed conversion of 7.00% Series D cumulative convertible preferred stock | — | | | (3,204) | | | (5,060) | |
Allocation to unvested restricted stock awards | 4,790 | | | 1,307 | | | 1,517 | |
Funds from operations attributable to Alexandria Real Estate Equities, Inc.’s common stockholders – diluted, as adjusted | $ | 923,795 | | | $ | 783,006 | | | $ | 682,003 | |
(1)Includes a $7.6 million impairment of our investment in a recently developed retail property held by our unconsolidated real estate joint venture recognized during the three months ended March 31, 2020. This impairment is classified in equity in earnings of unconsolidated real estate joint ventures within our consolidated statements of operations.
(2)Calculated in accordance with standards established by the Nareit Board of Governors.
| | | | | | | | | | | | | | | | | | | | |
| | Year Ended December 31, |
| (Per share) | | 2020 | | 2019 | | 2018 |
| Net income per share attributable to Alexandria Real Estate Equities, Inc.’s common stockholders – diluted | | $ | 6.01 | | | $ | 3.12 | | | $ | 3.52 | |
| Depreciation and amortization of real estate assets | | 5.01 | | | 4.60 | | | 4.50 | |
| Gain on sales of real estate | | (1.22) | | | — | | | (0.08) | |
Our share of gain on sales of real estate from unconsolidated real estate JVs | | — | | | — | | | (0.35) | |
Impairment of real estate – rental properties | | 0.32 | | | 0.11 | | | — | |
Allocation to unvested restricted stock awards | | (0.05) | | | (0.06) | | | (0.06) | |
| Funds from operations per share attributable to Alexandria Real Estate Equities, Inc.’s common stockholders – diluted | | 10.07 | | | 7.77 | | | 7.53 | |
| Unrealized gains on non-real estate investments | | (2.96) | | | (1.44) | | | (0.96) | |
| Realized losses (gains) on non-real estate investments | | — | | | — | | | (0.14) | |
| Impairment of real estate | | 0.12 | | | — | | | — | |
Impairment of real estate – land parcels | | — | | | — | | | 0.06 | |
Impairment of non-real estate investments | | 0.19 | | | 0.15 | | | 0.05 | |
Loss on early extinguishment of debt | | 0.48 | | | 0.42 | | | 0.01 | |
Loss on early termination of interest rate hedge agreements | | — | | | 0.02 | | | — | |
| Termination fee | | (0.68) | | | — | | | — | |
| Acceleration of stock compensation expense due to executive officer resignation | | 0.04 | | | — | | | — | |
Our share of gain on early extinguishment of debt from unconsolidated real estate JVs | | — | | | — | | | (0.01) | |
Preferred stock redemption charge | | — | | | 0.02 | | | 0.04 | |
Allocation to unvested restricted stock awards | | 0.04 | | | 0.02 | | | 0.02 | |
Funds from operations per share attributable to Alexandria Real Estate Equities, Inc.’s common stockholders – diluted, as adjusted | | $ | 7.30 | | | $ | 6.96 | | | $ | 6.60 | |
| | | | | | |
Weighted-average shares of common stock outstanding(1) for calculations of: | | | | | | |
EPS – diluted | | 126,490 | | | 112,524 | | | 103,321 | |
Funds from operations – diluted, per share | | 126,490 | | | 112,966 | | | 104,048 | |
Funds from operations – diluted, as adjusted, per share | | 126,490 | | | 112,524 | | | 103,321 | |
(1)Refer to the definition of “Weighted-average shares of common stock outstanding – diluted” within this section of this Item 7 in this annual report on Form 10-K for additional information.
Adjusted EBITDA and Adjusted EBITDA margin
We use Adjusted EBITDA as a supplemental performance measure of our operations, for financial and operational decision-making, and as a supplemental means of evaluating period-to-period comparisons on a consistent basis. Adjusted EBITDA is calculated as earnings before interest, taxes, depreciation, and amortization (“EBITDA”), excluding stock compensation expense, gains or losses on early extinguishment of debt, gains or losses on sales of real estate, impairments of real estate, and significant termination fees. Adjusted EBITDA also excludes unrealized gains or losses and significant realized gains and impairments that result from our non-real estate investments. These non-real estate investment amounts are classified in our consolidated statements of operations outside of revenues.
We believe Adjusted EBITDA provides investors with relevant and useful information as it allows investors to evaluate the operating performance of our business activities without having to account for differences recognized because of investing and financing decisions related to our real estate and non-real estate investments, our capital structure, capital market transactions, and variances resulting from the volatility of market conditions outside of our control. For example, we exclude gains or losses on the early extinguishment of debt to allow investors to measure our performance independent of our indebtedness and capital structure. We believe that adjusting for the effects of impairments and gains or losses on sales of real estate, significant impairments and gains on the sale of non-real estate investments, and significant termination fees allows investors to evaluate performance from period to period on a consistent basis without having to account for differences recognized because of investing and financing decisions related to our real estate and non-real estate investments or other corporate activities that may not be representative of the operating performance of our properties.
In addition, we believe that excluding charges related to stock compensation and unrealized gains or losses facilitates for investors a comparison of our business activities across periods without the volatility resulting from market forces outside of our control. Adjusted EBITDA has limitations as a measure of our performance. Adjusted EBITDA does not reflect our historical expenditures or future requirements for capital expenditures or contractual commitments. While Adjusted EBITDA is a relevant measure of performance, it does not represent net income (loss) or cash flows from operations calculated and presented in accordance with GAAP, and it should not be considered as an alternative to those indicators in evaluating performance or liquidity.
In order to calculate Adjusted EBITDA margin, we also make comparable adjustments to our revenues. We adjust our total revenues by realized gains, losses, and impairments related to our non-real estate investments and significant termination fees to arrive at revenues, as adjusted. Our calculation of Adjusted EBITDA margin divides Adjusted EBITDA by our revenues, as adjusted. We believe that consistent application of these comparable adjustments to both components of Adjusted EBITDA margin provides a more useful calculation for the comparison across periods.
The following table reconciles net income (loss) and revenues, the most directly comparable financial measures calculated and presented in accordance with GAAP, to Adjusted EBITDA and revenues, as adjusted, respectively, for the three months and years ended December 31, 2020 and 2019 (dollars in thousands):
| | | | | | | | | | | | | | | | | | | | | | | | | | |
| | Three Months Ended December 31, | | Year Ended December 31, |
| | 2020 | | 2019 | | 2020 | | 2019 |
| Net income | | $ | 457,133 | | | $ | 216,053 | | | $ | 827,171 | | | $ | 404,047 | |
| Interest expense | | 37,538 | | | 45,493 | | | 171,609 | | | 173,675 | |
Income taxes | | 2,053 | | | 1,269 | | | 7,230 | | | 4,343 | |
Depreciation and amortization | | 177,750 | | | 140,518 | | | 698,104 | | | 544,612 | |
Stock compensation expense | | 11,394 | | | 10,239 | | | 43,502 | | | 43,640 | |
Loss on early extinguishment of debt | | 7,898 | | | — | | | 60,668 | | | 47,570 | |
Gain on sales of real estate | | (152,503) | | | (474) | | | (154,089) | | | (474) | |
| Unrealized gains on non-real estate investments | | (233,538) | | | (148,268) | | | (374,033) | | | (161,489) | |
Impairment of real estate | | 25,177 | | | 12,334 | | | 55,722 | | | 12,334 | |
Impairment of non-real estate investments | | — | | | 9,991 | | | 24,482 | | | 17,124 | |
| Termination fee | | — | | | — | | | (86,179) | | | — | |
Adjusted EBITDA | | $ | 332,902 | | | $ | 287,155 | | | $ | 1,274,187 | | | $ | 1,085,382 | |
| | | | | | | | |
Revenues | | $ | 463,720 | | | $ | 408,114 | | | $ | 1,885,637 | | | $ | 1,531,296 | |
| Non-real estate investments – realized gains | | 21,599 | | | 4,399 | | | 47,288 | | | 33,158 | |
Impairment of non-real estate investments | | — | | | 9,991 | | | 24,482 | | | 17,124 | |
| Termination fee | | — | | | — | | | (86,179) | | | — | |
Revenues, as adjusted | | $ | 485,319 | | | $ | 422,504 | | | $ | 1,871,228 | | | $ | 1,581,578 | |
| | | | | | | | |
Adjusted EBITDA margin | | 69% | | 68% | | 68% | | 69% |
Annual rental revenue
Annual rental revenue represents the annualized fixed base rental obligations, calculated in accordance with GAAP, for leases in effect as of the end of the period, related to our operating RSF. Annual rental revenue is presented using 100% of the annual rental revenue of our consolidated properties and our share of annual rental revenue for our unconsolidated real estate joint ventures. Annual rental revenue per RSF is computed by dividing annual rental revenue by the sum of 100% of the RSF of our consolidated properties and our share of the RSF of properties held in unconsolidated real estate joint ventures. As of December 31, 2020, approximately 94% of our leases (on an RSF basis) were triple net leases, which require tenants to pay substantially all real estate taxes, insurance, utilities, repairs and maintenance, common area expenses, and other operating expenses (including increases thereto) in addition to base rent. Annual rental revenue excludes these operating expenses recovered from our tenants. Amounts recovered from our tenants related to these operating expenses, along with base rent, are classified in income from rentals in our consolidated statements of operations.
Cash interest
Cash interest is equal to interest expense calculated in accordance with GAAP plus capitalized interest, less amortization of loan fees and debt premiums (discounts). Refer to the definition of “Fixed-charge coverage ratio” in this section under this Item 7 in this annual report on 10-K for a reconciliation of interest expense, the most directly comparable financial measure calculated and presented in accordance with GAAP, to cash interest.
Class A properties and AAA locations
Class A properties are properties clustered in AAA locations that provide innovative tenants with highly dynamic and collaborative environments that enhance their ability to successfully recruit and retain world-class talent and inspire productivity, efficiency, creativity, and success. Class A properties generally command higher annual rental rates than other classes of similar properties.
AAA locations are in close proximity to concentrations of specialized skills, knowledge, institutions, and related businesses. Such locations are generally characterized by high barriers to entry for new landlords, high barriers to exit for tenants, and a limited supply of available space.
Development, redevelopment, and pre-construction
A key component of our business model is our disciplined allocation of capital to the development and redevelopment of new Class A properties, and property enhancements identified during the underwriting of certain acquired properties, located in collaborative life science, technology, and agtech campuses in AAA urban innovation clusters. These projects are generally focused on providing high-quality, generic, and reusable spaces that meet the real estate requirements of, and are reusable by, a wide range of tenants. Upon completion, each value-creation project is expected to generate a significant increase in rental income, net operating income, and cash flows. Our development and redevelopment projects are generally in locations that are highly desirable to high-quality entities, which we believe results in higher occupancy levels, longer lease terms, higher rental income, higher returns, and greater long-term asset value.
Development projects generally consist of the ground-up development of generic and reusable facilities. Redevelopment projects consist of the permanent change in use of office, warehouse, and shell space into office/laboratory, tech office, or agtech space. We generally will not commence new development projects for aboveground construction of new Class A office/laboratory, tech office, and agtech space without first securing significant pre-leasing for such space, except when there is solid market demand for high-quality Class A properties.
Pre-construction activities include entitlements, permitting, design, site work, and other activities preceding commencement of construction of aboveground building improvements. The advancement of pre-construction efforts is focused on reducing the time required to deliver projects to prospective tenants. These critical activities add significant value for future ground-up development and are required for the vertical construction of buildings. Ultimately, these projects will provide high-quality facilities and are expected to generate significant revenue and cash flows.
Development, redevelopment, and pre-construction spending also includes the following costs: (i) certain tenant improvements and renovations that will be reimbursed, (ii) amounts to bring certain acquired properties up to market standard and/or other costs identified during the acquisition process (generally within two years of acquisition), and (iii) permanent conversion of space for highly flexible, move-in-ready office/laboratory space to foster the growth of promising early- and growth-stage life science companies.
Revenue-enhancing and repositioning capital expenditures represent spending to reposition or significantly change the use of a property, including through improvement in the asset quality from Class B to Class A.
Non-revenue-enhancing capital expenditures represent costs required to maintain the current revenues of a stabilized property, including the associated costs for renewed and re-leased space.
Fixed-charge coverage ratio
Fixed-charge coverage ratio is a non-GAAP financial measure representing the ratio of Adjusted EBITDA to fixed charges. We believe this ratio is useful to investors as a supplemental measure of our ability to satisfy fixed financing obligations and preferred stock dividends. Cash interest is equal to interest expense calculated in accordance with GAAP plus capitalized interest, less amortization of loan fees and debt premiums (discounts).
The following table reconciles interest expense, the most directly comparable financial measure calculated and presented in accordance with GAAP, to cash interest and fixed charges for the three months ended December 31, 2020 and 2019 (dollars in thousands):
| | | | | | | | | | | | | | |
| | Three Months Ended December 31, |
| | 2020 | | 2019 |
| Adjusted EBITDA | | $ | 332,902 | | | $ | 287,155 | |
| | | | |
| Interest expense | | $ | 37,538 | | | $ | 45,493 | |
| Capitalized interest | | 37,589 | | | 23,822 | |
| Amortization of loan fees | | (2,905) | | | (2,241) | |
| Amortization of debt premiums | | 869 | | | 907 | |
| Cash interest and fixed charges | | $ | 73,091 | | | $ | 67,981 | |
| | | | |
| Fixed-charge coverage ratio: | | | | |
| – period annualized | | 4.6x | | 4.2x |
| – trailing 12 months | | 4.4x | | 4.2x |
Initial stabilized yield (unlevered)
Initial stabilized yield is calculated as the estimated amounts of net operating income at stabilization divided by our investment in the property. Our initial stabilized yield excludes the benefit of leverage. Our cash rents related to our value-creation projects are generally expected to increase over time due to contractual annual rent escalations. Our estimates for initial stabilized yields, initial stabilized yields (cash basis), and total costs at completion represent our initial estimates at the commencement of the project. We expect to update this information upon completion of the project, or sooner if there are significant changes to the expected project yields or costs.
•Initial stabilized yield reflects rental income, including contractual rent escalations and any rent concessions over the term(s) of the lease(s), calculated on a straight-line basis.
•Initial stabilized yield (cash basis) reflects cash rents at the stabilization date after initial rental concessions, if any, have elapsed and our total cash investment in the property.
Investment-grade or publicly traded large cap tenants
Investment-grade or publicly traded large cap tenants represent tenants that are investment-grade rated or publicly traded companies with an average daily market capitalization greater than $10 billion for the twelve months ended December 31, 2020, as reported by Bloomberg Professional Services. In addition, we monitor the credit quality and related material changes of our tenants. Material changes that cause a tenant’s market capitalization to decline below $10 billion, which are not immediately reflected in the twelve-month average, may result in their exclusion from this measure.
Investments in real estate – value-creation square footage currently in rental properties
The square footage presented in the table below includes RSF of buildings in operation as of December 31, 2020, primarily representing lease expirations at recently acquired properties that also have inherent future development or redevelopment opportunities, for which we have the intent to demolish or redevelop the existing property upon expiration of the existing in-place leases and commencement of future construction:
| | | | | | | | | | | | | | | | | | | | | | | | | | | | | | | | |
| | Dev/Redev | | RSF lease expirations going into
development and redevelopment |
| Property/Submarket | | | 2021 | | 2022 | | Thereafter | | Total |
| Near-term projects: | | | | | | | | | | |
| The Arsenal on the Charles/Cambridge/Inner Suburbs | | Redev | | 64,056 | | | — | | | — | | | 64,056 | |
| 50 and 60 Sylvan Road/Route 128 | | Redev | | 202,428 | | | — | | | — | | | 202,428 | |
| 651 Gateway Boulevard/South San Francisco | | Redev | | — | | | 197,787 | | | 102,223 | | (1) | 300,010 | |
| Other/Seattle | | Redev | | — | | | 51,255 | | | — | | | 51,255 | |
| | | | 266,484 | | | 249,042 | | | 102,223 | | | 617,749 | |
| | | | | | | | | | |
| Intermediate-term projects: | | | | | | | | | | |
| 3825 Fabian Way/Greater Stanford | | Redev | | — | | | 250,000 | | | — | | | 250,000 | |
| 3450 and 3460 Hillview Avenue/Greater Stanford | | Redev | | — | | | 42,340 | | | 34,611 | | | 76,951 | |
| 987 and 1075 Commercial Street/Greater Stanford | | Dev | | 26,738 | | | — | | | — | | | 26,738 | |
| 10931 and 10933 North Torrey Pines Road/Torrey Pines | | Dev | | — | | | 92,450 | | | — | | | 92,450 | |
| 10260 Campus Point Drive/University Town Center | | Dev | | — | | | — | | | 109,164 | | | 109,164 | |
9363 and 9393 Towne Centre Drive/
University Town Center | | Dev | | — | | | — | | | 87,252 | | | 87,252 | |
| 4555 Executive Drive/University Town Center | | Dev | | 41,475 | | | — | | | — | | | 41,475 | |
| | | | 68,213 | | | 384,790 | | | 231,027 | | | 684,030 | |
| Future projects: | | | | | | | | | | |
| 380 and 420 E Street/Seaport Innovation District | | Dev | | — | | | — | | | 195,506 | | | 195,506 | |
| 40 Sylvan Road/Route 128 | | Redev | | — | | | — | | | 312,845 | | | 312,845 | |
| 3875 Fabian Way/Greater Stanford | | Redev | | — | | | — | | | 228,000 | | | 228,000 | |
| 960 Industrial Road/Greater Stanford | | Dev | | — | | | — | | | 110,000 | | | 110,000 | |
| 219 East 42nd Street/New York City | | Dev | | — | | | — | | | 349,947 | | | 349,947 | |
| 11255 and 11355 North Torrey Pines Road/Torrey Pines | | Dev | | — | | | 139,135 | | | — | | | 139,135 | |
| 4161 Campus Point Court/University Town Center | | Dev | | — | | | — | | | 159,884 | | | 159,884 | |
| 6450 Sequence Drive/Sorrento Mesa | | Redev | | — | | | — | | | 202,915 | | | 202,915 | |
| 4045 and 4075 Sorrento Valley Boulevard/Sorrento Valley | | Dev | | — | | | — | | | 50,926 | | | 50,926 | |
| 601 Dexter Avenue North/Lake Union | | Dev | | — | | | — | | | 18,680 | | | 18,680 | |
| 830 4th Avenue South/SoDo | | Dev | | — | | | — | | | 42,380 | | | 42,380 | |
| | | | — | | | 139,135 | | | 1,671,083 | | | 1,810,218 | |
| | | | 334,697 | | | 772,967 | | | 2,004,333 | | | 3,111,997 | |
(1) Represents vacant square footage as of December 31, 2020.
Joint venture financial information
We present components of balance sheet and operating results information related to our real estate joint ventures, which are not presented, or intended to be presented, in accordance with GAAP. We present the proportionate share of certain financial line items as follows: (i) for each real estate joint venture that we consolidate in our financial statements, which are controlled by us through contractual rights or majority voting rights, but of which we own less than 100%, we apply the noncontrolling interest economic ownership percentage to each financial item to arrive at the amount of such cumulative noncontrolling interest share of each component presented; and (ii) for each real estate joint venture that we do not control and do not consolidate, and are instead controlled jointly or by our joint venture partners through contractual rights or majority voting rights, we apply our economic ownership percentage to each financial item to arrive at our proportionate share of each component presented.
The components of balance sheet and operating results information related to our real estate joint ventures do not represent our legal claim to those items. For each entity that we do not wholly own, the joint venture agreement generally determines what equity holders can receive upon capital events, such as sales or refinancing, or in the event of a liquidation. Equity holders are normally entitled to their respective legal ownership of any residual cash from a joint venture only after all liabilities, priority distributions, and claims have been repaid or satisfied.
We believe this information can help investors estimate the balance sheet and operating results information related to our partially owned entities. Presenting this information provides a perspective not immediately available from consolidated financial statements and one that can supplement an understanding of the joint venture assets, liabilities, revenues, and expenses included in our consolidated results.
The components of balance sheet and operating results information related to our real estate joint ventures are limited as an analytical tool as the overall economic ownership interest does not represent our legal claim to each of our joint ventures’ assets, liabilities, or results of operations. In addition, joint venture financial information may include financial information related to the unconsolidated real estate joint ventures that we do not control. We believe that in order to facilitate for investors a clear understanding of our operating results and our total assets and liabilities, joint venture financial information should be examined in conjunction with our consolidated statements of operations and balance sheets. Joint venture financial information should not be considered an alternative to our consolidated financial statements, which are prepared in accordance with GAAP.
Net cash provided by operating activities after dividends
Net cash provided by operating activities after dividends includes the deduction for distributions to noncontrolling interests. For purposes of this calculation, changes in operating assets and liabilities are excluded as they represent timing differences.
Net debt and preferred stock to Adjusted EBITDA
Net debt and preferred stock to Adjusted EBITDA is a non-GAAP financial measure that we believe is useful to investors as a supplemental measure in evaluating our balance sheet leverage. Net debt and preferred stock is equal to the sum of total consolidated debt less cash, cash equivalents, and restricted cash, plus preferred stock outstanding as of the end of the period. Refer to the definition of “Adjusted EBITDA and Adjusted EBITDA margin” under Item 7 in this annual report on Form 10-K for further information on the calculation of Adjusted EBITDA.
The following table reconciles debt to net debt and preferred stock and computes the ratio to Adjusted EBITDA as of December 31, 2020 and 2019 (dollars in thousands):
| | | | | | | | | | | |
| December 31, |
| 2020 | | 2019 |
| Secured notes payable | $ | 230,925 | | | $ | 349,352 | |
| Unsecured senior notes payable | 7,232,370 | | | 6,044,127 | |
| Unsecured senior line of credit and commercial paper | 99,991 | | | 384,000 | |
| Unamortized deferred financing costs | 56,312 | | | 47,299 | |
| Cash and cash equivalents | (568,532) | | | (189,681) | |
| Restricted cash | (29,173) | | | (53,008) | |
| Preferred stock | — | | | — | |
| Net debt and preferred stock | $ | 7,021,893 | | | $ | 6,582,089 | |
| | | |
Adjusted EBITDA: | | | |
– quarter annualized | $ | 1,331,608 | | | $ | 1,148,620 | |
| – trailing 12 months | $ | 1,274,187 | | | $ | 1,085,382 | |
| | | |
| Net debt and preferred stock to Adjusted EBITDA: | | | |
| – quarter annualized | 5.3 | x | | 5.7 | x |
| – trailing 12 months | 5.5 | x | | 6.1 | x |
Net operating income, net operating income (cash basis), and operating margin
The following table reconciles net income to net operating income, and to net operating income (cash basis) for the years ended December 31, 2020, 2019, and 2018 (dollars in thousands):
| | | | | | | | | | | | | | | | | | | | |
| | Year Ended December 31, |
| | 2020 | | 2019 | | 2018 |
| Net income | | $ | 827,171 | | | $ | 404,047 | | | $ | 402,793 | |
| | | | | | |
| Equity in earnings of unconsolidated real estate joint ventures | | (8,148) | | | (10,136) | | | (43,981) | |
| General and administrative expenses | | 133,341 | | | 108,823 | | | 90,405 | |
| Interest expense | | 171,609 | | | 173,675 | | | 157,495 | |
Depreciation and amortization | | 698,104 | | | 544,612 | | | 477,661 | |
| Impairment of real estate | | 48,078 | | | 12,334 | | | 6,311 | |
| Loss on early extinguishment of debt | | 60,668 | | | 47,570 | | | 1,122 | |
| Gain on sales of real estate | | (154,089) | | | (474) | | | (8,704) | |
| Investment income | | (421,321) | | | (194,647) | | | (136,763) | |
| Net operating income | | 1,355,413 | | | 1,085,804 | | | 946,339 | |
| Straight-line rent revenue | | (96,676) | | | (104,235) | | | (93,883) | |
| Amortization of acquired above- and below-market leases | | (57,244) | | | (29,813) | | | (21,938) | |
| Net operating income (cash basis) | | $ | 1,201,493 | | | $ | 951,756 | | | $ | 830,518 | |
| | | | | | |
| Net operating income (from above) | | $ | 1,355,413 | | | $ | 1,085,804 | | | $ | 946,339 | |
| Total revenues | | $ | 1,885,637 | | | $ | 1,531,296 | | | $ | 1,327,459 | |
| Operating margin | | 72% | | 71% | | 71% |
Net operating income is a non-GAAP financial measure calculated as net income, the most directly comparable financial measure calculated and presented in accordance with GAAP, excluding equity in the earnings of our unconsolidated real estate joint ventures, general and administrative expenses, interest expense, depreciation and amortization, impairments of real estate, gains or losses on early extinguishment of debt, gains or losses on sales of real estate, and investment income or loss. We believe net operating income provides useful information to investors regarding our financial condition and results of operations because it primarily reflects
those income and expense items that are incurred at the property level. Therefore, we believe net operating income is a useful measure for investors to evaluate the operating performance of our consolidated real estate assets. Net operating income on a cash basis is net operating income adjusted to exclude the effect of straight-line rent and amortization of acquired above- and below-market lease revenue adjustments required by GAAP. We believe that net operating income on a cash basis is helpful to investors as an additional measure of operating performance because it eliminates straight-line rent revenue and the amortization of acquired above- and below-market leases.
Furthermore, we believe net operating income is useful to investors as a performance measure for our consolidated properties because, when compared across periods, net operating income reflects trends in occupancy rates, rental rates, and operating costs, which provide a perspective not immediately apparent from net income or loss. Net operating income can be used to measure the initial stabilized yields of our properties by calculating net operating income generated by a property divided by our investment in the property. Net operating income excludes certain components from net income in order to provide results that are more closely related to the results of operations of our properties. For example, interest expense is not necessarily linked to the operating performance of a real estate asset and is often incurred at the corporate level rather than at the property level. In addition, depreciation and amortization, because of historical cost accounting and useful life estimates, may distort comparability of operating performance at the property level. Impairments of real estate have been excluded in deriving net operating income because we do not consider impairments of real estate to be property-level operating expenses. Impairments of real estate relate to changes in the values of our assets and do not reflect the current operating performance with respect to related revenues or expenses. Our impairments of real estate represent the write-down in the value of the assets to the estimated fair value less cost to sell. These impairments result from investing decisions or a deterioration in market conditions. We also exclude realized and unrealized investment income or loss, which results from investment decisions that occur at the corporate level related to non-real estate investments in publicly traded companies and certain privately held entities. Therefore, we do not consider these activities to be an indication of operating performance of our real estate assets at the property level. Our calculation of net operating income also excludes charges incurred from changes in certain financing decisions, such as losses on early extinguishment of debt, as these charges often relate to corporate strategy. Property operating expenses included in determining net operating income primarily consist of costs that are related to our operating properties, such as utilities, repairs, and maintenance; rental expense related to ground leases; contracted services, such as janitorial, engineering, and landscaping; property taxes and insurance; and property-level salaries. General and administrative expenses consist primarily of accounting and corporate compensation, corporate insurance, professional fees, office rent, and office supplies that are incurred as part of corporate office management. We calculate operating margin as net operating income divided by total revenues.
We believe that in order to facilitate for investors a clear understanding of our operating results, net operating income should be examined in conjunction with net income or loss as presented in our consolidated statements of operations. Net operating income should not be considered as an alternative to net income or loss as an indication of our performance, nor as an alternative to cash flows as a measure of our liquidity or our ability to make distributions.
Operating statistics
We present certain operating statistics related to our properties, including number of properties, RSF, occupancy percentage, leasing activity, and contractual lease expirations as of the end of the period. We believe these measures are useful to investors because they facilitate an understanding of certain trends for our properties. We compute the number of properties, RSF, occupancy percentage, leasing activity, and contractual lease expirations at 100% for all properties in which we have an investment, including properties owned by our consolidated and unconsolidated real estate joint ventures. For operating metrics based on annual rental revenue, refer to the definition of “Annual rental revenue” in this “Non-GAAP measures and definitions” section.
Same property comparisons
As a result of changes within our total property portfolio during the comparative periods presented, including changes from assets acquired or sold, properties placed into development or redevelopment, and development or redevelopment properties recently placed into service, the consolidated total income from rentals, as well as rental operating expenses in our operating results, can show significant changes from period to period. In order to supplement an evaluation of our results of operations over a given quarterly or annual period, we analyze the operating performance for all consolidated properties that were fully operating for the entirety of the comparative periods presented, referred to as same properties. We separately present quarterly and year-to-date same property results to align with the interim financial information required by the SEC in our management’s discussion and analysis of our financial condition and results of operations. These same properties are analyzed separately from properties acquired subsequent to the first day in the earliest comparable quarterly or year-to-date period presented, properties that underwent development or redevelopment at any time during the comparative periods, unconsolidated real estate joint ventures, properties classified as held for sale, and corporate entities (legal entities performing general and administrative functions), which are excluded from same property results. Additionally, termination fees, if any, are excluded from the results of same properties. Refer to the “Same properties” subsection in the “Results of operations” section within this Item 7 in this annual report on Form 10-K for additional information.
Stabilized occupancy date
The stabilized occupancy date represents the estimated date on which the project is expected to reach occupancy of 95% or greater.
Tenant recoveries
Tenant recoveries represent revenues comprising reimbursement of real estate taxes, insurance, utilities, repairs and maintenance, common area expenses, and other operating expenses and earned in the period during which the applicable expenses are incurred and the tenant’s obligation to reimburse us arises.
We classify rental revenues and tenant recoveries generated through the leasing of real estate assets within revenue in income from rentals in our consolidated statements of operations. We provide investors with a separate presentation of rental revenues and tenant recoveries in the “Comparison of results for the year ended December 31, 2020, to the year ended December 31, 2019” subsection of the “Results of operations” section within this Item 7 because we believe it promotes investors’ understanding of our operating results. We believe that the presentation of tenant recoveries is useful to investors as a supplemental measure of our ability to recover operating expenses under our triple net leases, including recoveries of utilities, repairs and maintenance, insurance, property taxes, common area expenses, and other operating expenses, and of our ability to mitigate the effect to net income for any significant variability to components of our operating expenses.
The following table reconciles income from rentals to tenant recoveries for the years ended December 31, 2020, 2019, and 2018 (in thousands):
| | | | | | | | | | | | | | | | | | | | |
| | Year Ended December 31, |
| | 2020 | | 2019 | | 2018 |
| Income from rentals | | $ | 1,878,208 | | | $ | 1,516,864 | | | $ | 1,314,781 | |
| Rental revenues | | (1,471,840) | | | (1,165,788) | | | (1,010,718) | |
| Tenant recoveries | | $ | 406,368 | | | $ | 351,076 | | | $ | 304,063 | |
| | | | | | |
Total market capitalization
Total market capitalization is equal to the outstanding shares of common stock at the end of the period multiplied by the closing price on the last trading day of the period (i.e., total equity capitalization), plus total debt outstanding at period-end.
Unencumbered net operating income as a percentage of total net operating income
Unencumbered net operating income as a percentage of total net operating income is a non-GAAP financial measure that we believe is useful to investors as a performance measure of the results of operations of our unencumbered real estate assets as it reflects those income and expense items that are incurred at the unencumbered property level. Unencumbered net operating income is derived from assets classified in continuing operations, which are not subject to any mortgage, deed of trust, lien, or other security interest, as of the period for which income is presented.
The following table summarizes unencumbered net operating income as a percentage of total net operating income for the years ended December 31, 2020 and 2019 (dollars in thousands):
| | | | | | | | | | | |
| Year Ended December 31, |
| 2020 | | 2019 |
Unencumbered net operating income | $ | 1,295,520 | | | $ | 1,024,619 | |
Encumbered net operating income | 59,893 | | | 61,185 | |
| Total net operating income | $ | 1,355,413 | | | $ | 1,085,804 | |
Unencumbered net operating income as a percentage of total net operating income | 96% | | 94% |
Weighted-average shares of common stock outstanding – diluted
From time to time, we enter into capital market transactions, including forward equity sales agreements (“Forward Agreements”), to fund acquisitions, to fund construction of our highly leased development and redevelopment projects, and for general working capital purposes. We are required to consider the potential dilutive effect of our forward equity sales agreements under the treasury stock method while the forward equity sales agreements are outstanding. As of December 31, 2020, we had Forward Agreements outstanding to sell an aggregate of 362 thousand shares of common stock.
Prior to the conversion of our remaining outstanding shares in October 2019, we considered the effect of assumed conversion of our outstanding 7.00% Series D Convertible Preferred Stock when determining potentially dilutive incremental shares to our common stock. When calculating the assumed conversion, we add back to net income or loss the dividends paid on our Series D Convertible Preferred Stock to the numerator and then include additional common shares assumed to have been issued (as displayed in the table below) to the denominator of the per share calculation. The effect of the assumed conversion is considered separately for our per share calculations of net income or loss; funds from operations, computed in accordance with the definition in the Nareit White Paper; and funds from operations, as adjusted. Prior to the conversion of our remaining outstanding shares in October 2019, our Series D Convertible Preferred Stock was dilutive and assumed to be converted when quarterly and annual basic EPS, funds from operations, or funds from operations, as adjusted, exceeded approximately $1.75 and $7.00 per share, respectively, subject to conversion ratio adjustments and the impact of repurchases of our Series D Convertible Preferred Stock. The effect of the assumed conversion was included when it was dilutive on a per share basis. The dilutive effect to both numerator and denominator may result in a per share effect of less than a half cent, which would appear as zero in our per share calculation, even when the dilutive effect to the numerator alone appears in our reconciliation. Refer to Note 12 – “Earnings per share” and Note 15 – “Stockholders’ equity” to our consolidated financial statements under Item 15 in this annual report on Form 10-K for more information related to our forward equity sales agreements.
The weighted-average shares of common stock outstanding used in calculating EPS – diluted, funds from operations per share – diluted, and funds from operations per share – diluted, as adjusted, for the years ended December 31, 2020, 2019 and 2018, are calculated as follows (in thousands):
| | | | | | | | | | | | | | | | | |
| Year Ended December 31, |
| 2020 | | 2019 | | 2018 |
| Weighted-average shares of common stock outstanding: | | | | | |
| Basic shares for EPS | 126,106 | | | 112,204 | | | 103,010 | |
| Outstanding forward equity sales agreements | 384 | | | 320 | | | 311 | |
Series D Convertible Preferred Stock | — | | | — | | | — | |
| Diluted shares for EPS | 126,490 | | | 112,524 | | | 103,321 | |
| | | | | |
| Basic shares for EPS | 126,106 | | | 112,204 | | | 103,010 | |
Outstanding forward equity sales agreements | 384 | | | 320 | | | 311 | |
Series D Convertible Preferred Stock | — | | | 442 | | | 727 | |
| Diluted shares for FFO | 126,490 | | | 112,966 | | | 104,048 | |
| | | | | |
Basic shares for EPS | 126,106 | | | 112,204 | | | 103,010 | |
Outstanding forward equity sales agreements | 384 | | | 320 | | | 311 | |
Series D Convertible Preferred Stock | — | | | — | | | — | |
| Diluted shares for FFO, as adjusted | 126,490 | | | 112,524 | | | 103,321 | |
ITEM 7A. QUANTITATIVE AND QUALITATIVE DISCLOSURES ABOUT MARKET RISK
Interest rate risk
The primary market risk to which we believe we may be exposed is interest rate risk, which may result from many factors, including government monetary and tax policies, domestic and international economic and political considerations, and other factors that are beyond our control.
In order to modify and manage the interest rate characteristics of our outstanding debt and to limit the effects of interest rate risks on our operations, we may utilize a variety of financial instruments, including interest rate hedge agreements, caps, floors, and other interest rate exchange contracts. The use of these types of instruments to hedge a portion of our exposure to changes in interest rates may carry additional risks, such as counterparty credit risk and the legal enforceability of hedge agreements. As of December 31, 2020, we did not have any outstanding interest rate hedge agreements.
Our future earnings and fair values relating to our outstanding debt are primarily dependent upon prevalent market rates of interest. The following table illustrates the effect of a 1% change in interest rates, assuming an interest rate floor of 0%, on our fixed- and variable-rate debt as of December 31, 2020 and 2019 (in thousands):
| | | | | | | | | | | |
| December 31, |
| 2020 | | 2019 |
| Annualized effect on future earnings due to variable-rate debt: | | | |
| Rate increase of 1% | $ | (407) | | | $ | (3,600) | |
| Rate decrease of 1% | $ | 89 | | | $ | 3,600 | |
| | | |
| Effect on fair value of total consolidated debt: | | | |
| Rate increase of 1% | $ | (700,861) | | | $ | (527,768) | |
| Rate decrease of 1% | $ | 795,966 | | | $ | 605,862 | |
These amounts are determined by considering the effect of the hypothetical interest rates on our borrowings as of December 31, 2020 and 2019, respectively. These analyses do not consider the effects of the reduced level of overall economic activity that could exist in such an environment. Furthermore, in the event of a change of such magnitude, we would consider taking actions to further mitigate our exposure to the change. Because of the uncertainty of the specific actions that would be taken and their possible effects, the sensitivity analyses assume no changes in our capital structure.
Equity price risk
We have exposure to equity price market risk because of our equity investments in publicly traded companies and privately held entities. All of our investments in actively traded public companies are reflected in the consolidated balance sheets at fair value. Our investments in privately held entities that report NAV per share are measured at fair value using NAV as a practical expedient to fair value. Our equity investments in privately held entities that do not report NAV per share are measured at cost less impairments, adjusted for observable price changes during the period. Changes in fair value of public investments, changes in NAV per share reported by privately held entities, and observable price changes of privately held entities that do not report NAV per share are classified as investment income in our consolidated statements of operations. There is no assurance that future declines in value will not have a material adverse effect on our future results of operations. The following table illustrates the effect that a 10% change in the value of our equity investments would have on earnings as of December 31, 2020 and 2019 (in thousands):
| | | | | | | | | | | |
| December 31, |
| 2020 | | 2019 |
| Equity price risk: | | | |
| Fair value increase of 10% | $ | 161,111 | | | $ | 114,059 | |
| Fair value decrease of 10% | $ | (161,111) | | | $ | (114,059) | |
Foreign currency exchange rate risk
We have exposure to foreign currency exchange rate risk related to our subsidiaries operating in Canada and Asia. The functional currencies of our foreign subsidiaries are the local currencies in each respective country. Gains or losses resulting from the translation of our foreign subsidiaries’ balance sheets and statements of operations are classified in accumulated other comprehensive income (loss) as a separate component of total equity and are excluded from net income (loss). Gains or losses will be reflected in our consolidated statements of operations when there is a sale or partial sale of our investment in these operations or upon a complete or substantially complete liquidation of the investment. The following table illustrates the effect that a 10% change in foreign currency rates relative to the U.S. dollar would have on our potential future earnings and on the fair value of our net investment in foreign subsidiaries based on our current operating assets outside the U.S. as of December 31, 2020 and 2019 (in thousands):
| | | | | | | | | | | |
| December 31, |
| 2020 | | 2019 |
| Effect on potential future earnings due to foreign currency exchange rate: | | | |
| Rate increase of 10% | $ | 118 | | | $ | 107 | |
| Rate decrease of 10% | $ | (118) | | | $ | (107) | |
| | | |
| Effect on the fair value of net investment in foreign subsidiaries due to foreign currency exchange rate: | | | |
| Rate increase of 10% | $ | 9,740 | | | $ | 10,120 | |
| Rate decrease of 10% | $ | (9,740) | | | $ | (10,120) | |
This sensitivity analysis assumes a parallel shift of all foreign currency exchange rates with respect to the U.S. dollar; however, foreign currency exchange rates do not typically move in such a manner, and actual results may differ materially.
Our exposure to market risk elements for the year ended December 31, 2020, was consistent with the risk elements presented above, including the effects of changes in interest rates, equity prices, and foreign currency exchange rates.
ITEM 8. FINANCIAL STATEMENTS AND SUPPLEMENTARY DATA
The information required by this Item is included as a separate section in this annual report on Form 10-K. Refer to “Item 15. Exhibits and Financial Statement Schedules.”
ITEM 9. CHANGES IN AND DISAGREEMENTS WITH ACCOUNTANTS ON ACCOUNTING AND FINANCIAL DISCLOSURE
None.
ITEM 9A. CONTROLS AND PROCEDURES
Evaluation of disclosure controls and procedures
As of December 31, 2020, we had performed an evaluation, under the supervision of our Co-Chief Executive Officers (“Co-CEOs”) and our Chief Financial Officer (“CFO”), of the effectiveness of the design and operation of our disclosure controls and procedures. These controls and procedures have been designed to ensure that information required for disclosure is recorded, processed, summarized, and reported within the requisite time periods. Based on our evaluation, the Co-CEOs and the CFO concluded that our disclosure controls and procedures were effective as of December 31, 2020.
Changes in internal control over financial reporting
There has not been any change in our internal control over financial reporting during the three months ended December 31, 2020, that has materially affected, or is reasonably likely to materially affect, our internal control over financial reporting.
Management’s annual report on internal control over financial reporting
The management of Alexandria Real Estate Equities, Inc. and its subsidiaries (the “Company”) is responsible for establishing and maintaining adequate internal control over financial reporting. Internal control over financial reporting is defined in Rule 13a-15(f) and 15d-15(f) promulgated under the Securities Exchange Act of 1934, as amended, and is a process designed by, or under the supervision of, the Co-CEOs and the CFO and effected by the Company’s Board of Directors, management, and other personnel to provide reasonable assurance regarding the reliability of financial reporting and the preparation of financial statements for external reporting purposes in accordance with GAAP. The Company’s internal control over financial reporting includes those policies and procedures that (i) pertain to the maintenance of records that, in reasonable detail, accurately and fairly reflect the transactions and dispositions of assets; (ii) provide reasonable assurance that transactions are recorded as necessary to permit preparation of financial statements in accordance with GAAP, and that receipts and expenditures are being made only in accordance with the authorizations of the Company’s management and directors; and (iii) provide reasonable assurance regarding prevention or timely detection of unauthorized acquisition, use, or disposition of assets that could have a material effect on the financial statements.
Because of its inherent limitations, internal control over financial reporting may not prevent or detect misstatements. Projections of any evaluation of effectiveness to future periods are subject to the risk that controls may become inadequate because of changes in conditions, or that the degree of compliance with the policies or procedures may deteriorate.
Management has assessed the effectiveness of the Company’s internal control over financial reporting as of December 31, 2020 and 2019. In making its assessment, management has utilized the criteria set forth by the Committee of Sponsoring Organizations (“COSO 2013”) of the Treadway Commission in Internal Control – Integrated Framework (2013 framework). Management concluded that based on its assessment, the Company’s internal control over financial reporting was effective as of December 31, 2020. The effectiveness of our internal control over financial reporting as of December 31, 2020, has been audited by Ernst & Young LLP, an independent registered accounting firm, as stated in its report, which is included herein.
Report of Independent Registered Public Accounting Firm
To the Stockholders and Board of Directors of Alexandria Real Estate Equities, Inc.
Opinion on Internal Control over Financial Reporting
We have audited Alexandria Real Estate Equities, Inc.’s internal control over financial reporting as of December 31, 2020, based on criteria established in Internal Control-Integrated Framework issued by the Committee of Sponsoring Organizations of the Treadway Commission (2013 framework) (the COSO criteria). In our opinion, Alexandria Real Estate Equities, Inc. (the Company) maintained, in all material respects, effective internal control over financial reporting as of December 31, 2020, based on the COSO criteria.
We also have audited, in accordance with the standards of the Public Company Accounting Oversight Board (United States) (PCAOB), the consolidated balance sheets of the Company as of December 31, 2020 and 2019, and the related consolidated statements of operations, comprehensive income, changes in stockholders’ equity and noncontrolling interests and cash flows for each of the three years in the period ended December 31, 2020 and the related notes and financial statement schedule, and our report dated February 1, 2021, expressed an unqualified opinion thereon.
Basis for Opinion
The Company’s management is responsible for maintaining effective internal control over financial reporting and for its assessment of the effectiveness of internal control over financial reporting included in the accompanying management’s annual report on internal control over financial reporting. Our responsibility is to express an opinion on the Company’s internal control over financial reporting based on our audit. We are a public accounting firm registered with the PCAOB and are required to be independent with respect to the Company in accordance with the U.S. federal securities laws and the applicable rules and regulations of the Securities and Exchange Commission and the PCAOB.
We conducted our audit in accordance with the standards of the PCAOB. Those standards require that we plan and perform the audit to obtain reasonable assurance about whether effective internal control over financial reporting was maintained in all material respects.
Our audit included obtaining an understanding of internal control over financial reporting, assessing the risk that a material weakness exists, testing and evaluating the design and operating effectiveness of internal control based on the assessed risk, and performing such other procedures as we considered necessary in the circumstances. We believe that our audit provides a reasonable basis for our opinion.
Definition and Limitations of Internal Control over Financial Reporting
A company’s internal control over financial reporting is a process designed to provide reasonable assurance regarding the reliability of financial reporting and the preparation of financial statements for external purposes in accordance with generally accepted accounting principles. A company’s internal control over financial reporting includes those policies and procedures that (1) pertain to the maintenance of records that, in reasonable detail, accurately and fairly reflect the transactions and dispositions of the assets of the company; (2) provide reasonable assurance that transactions are recorded as necessary to permit preparation of financial statements in accordance with generally accepted accounting principles, and that receipts and expenditures of the company are being made only in accordance with authorizations of management and directors of the company; and (3) provide reasonable assurance regarding prevention or timely detection of unauthorized acquisition, use, or disposition of the company’s assets that could have a material effect on the financial statements.
Because of its inherent limitations, internal control over financial reporting may not prevent or detect misstatements. Also, projections of any evaluation of effectiveness to future periods are subject to the risk that controls may become inadequate because of changes in conditions, or that the degree of compliance with the policies or procedures may deteriorate.
/s/ Ernst & Young LLP
Los Angeles, California
February 1, 2021
ITEM 9B. OTHER INFORMATION
None.
PART III
ITEM 10. DIRECTORS, EXECUTIVE OFFICERS, AND CORPORATE GOVERNANCE
The information required by this Item is incorporated herein by reference from our definitive proxy statement for our 2021 annual meeting of stockholders to be filed pursuant to Regulation 14A within 120 days after the end of our fiscal year (the “2021 Proxy Statement”) under the captions “Board of Directors and Executive Officers,” and “Corporate Governance Guidelines and Code of Ethics.”
ITEM 11. EXECUTIVE COMPENSATION
The information required by this Item is incorporated herein by reference from our 2021 Proxy Statement under the caption “Executive Compensation.”
ITEM 12. SECURITY OWNERSHIP OF CERTAIN BENEFICIAL OWNERS AND MANAGEMENT AND RELATED STOCKHOLDER MATTERS
The following table sets forth information on the Company’s equity compensation plan as of December 31, 2020:
Equity Compensation Plan Information
| | | | | | | | | | | | | | | | | | | | |
| | Number of securities to be
issued upon exercise of
outstanding options,
warrants, and rights
(a) | | Weighted-average
exercise price of
outstanding options,
warrants, and rights
(b) | | Number of securities
remaining available for
future issuance under
equity compensation plans
(excluding securities
reflected in column (a))
(c) |
Equity Compensation Plan Approved by Stockholders — Amended and Restated 1997 Stock Award and Incentive Plan | | — | | — | | 3,080,980 |
The other information required by this Item is incorporated herein by reference from our 2021 Proxy Statement under the caption “Security Ownership of Certain Beneficial Owners and Management.”
ITEM 13. CERTAIN RELATIONSHIPS AND RELATED TRANSACTIONS, AND DIRECTOR INDEPENDENCE
The information required by this Item is incorporated herein by reference from our 2021 Proxy Statement under the captions “Certain Relationships and Related Transactions,” “Policies and Procedures with Respect to Related-Person Transactions,” and “Director Independence.”
ITEM 14. PRINCIPAL ACCOUNTANT FEES AND SERVICES
The information required by this Item is incorporated herein by reference from our 2021 Proxy Statement under the caption “Fees Billed by Independent Registered Public Accountants.”
PART IV
ITEM 15. EXHIBITS AND FINANCIAL STATEMENT SCHEDULES
(a)(1) and (2) Financial Statements and Financial Statement Schedule
The financial statements and financial statement schedule required by this Item are included as a separate section in this annual report on Form 10-K beginning on page F-1.
| | | | | |
| Page |
| |
| |
| Audited Consolidated Financial Statements of Alexandria Real Estate Equities, Inc.: | |
| |
Consolidated Financial Statements for the Years Ended December 31, 2020, 2019, and 2018: | |
| |
| |
| |
| |
| |
| |
(a)(3) Exhibits
| | | | | | | | | | | | | | | | | | | | |
Exhibit
Number | | Exhibit Title | | Incorporated by Reference to: | | Date Filed |
| 3.1* | | | | Form 10-Q | | August 14, 1997 |
| 3.2* | | | | Form 10-Q | | August 14, 1997 |
| 3.3* | | | | Form 8-K | | May 12, 2017 |
| 3.4* | | | | Form 10-Q | | August 13, 1999 |
| 3.5* | | | | Form 8-K | | February 10, 2000 |
| 3.6* | | | | Form 8-K | | February 10, 2000 |
| 3.7* | | | | Form 8-A | | January 18, 2002 |
| 3.8* | | | | Form 8-A | | June 28, 2004 |
| 3.9* | | | | Form 8-K | | March 25, 2008 |
| 3.10* | | | | Form 8-K | | March 14, 2012 |
| 3.11* | | | | Form 8-K | | May 12, 2017 |
| 3.12* | | | | Form 8-K | | August 2, 2018 |
| 4.1* | | | | Form 10-Q | | May 5, 2011 |
| 4.2* | | Indenture, dated as of February 29, 2012, among the Company, as Issuer, Alexandria Real Estate Equities, L.P., as Guarantor, and the Bank of New York Mellon Trust Company, N.A., as Trustee | | Form 8-K | | February 29, 2012 |
| 4.3* | | Supplemental Indenture No. 4, dated as of July 18, 2014, among the Company, as Issuer, Alexandria Real Estate Equities, L.P., as Guarantor, and the Bank of New York Mellon Trust Company, N.A., as Trustee | | Form 8-K | | July 18, 2014 |
| | | | | | | | | | | | | | | | | | | | |
Exhibit
Number | | Exhibit Title | | Incorporated by Reference to: | | Date Filed |
| 4.4* | | | | Form 8-K | | July 18, 2014 |
| 4.5* | | Indenture, dated as of November 17, 2015, among the Company, as Issuer, Alexandria Real Estate Equities, L.P., as Guarantor, and Wilmington Trust, National Association, as Trustee | | Form 8-K | | November 17, 2015 |
| 4.6* | | Supplemental Indenture No. 1, dated as of November 17, 2015, among the Company, as Issuer, Alexandria Real Estate Equities, L.P., as Guarantor, and Wilmington Trust, National Association, as Trustee | | Form 8-K | | November 17, 2015 |
| 4.7* | | | | Form 8-K | | November 17, 2015 |
| 4.8* | | Supplemental Indenture No. 2, dated as of June 10, 2016, among the Company, as Issuer, Alexandria Real Estate Equities, L.P., as Guarantor, and Wilmington Trust, National Association, as Trustee | | Form 8-K | | June 10, 2016 |
| 4.9* | | | | Form 8-K | | June 10, 2016 |
| 4.10* | | | | Form 8-K | | March 3, 2017 |
| 4.11* | | | | Form 8-K | | March 3, 2017 |
| 4.12* | | | | Form 8-K | | March 3, 2017 |
| 4.13* | | | | Form 8-K | | November 20, 2017 |
| 4.14* | | | | Form 8-K | | November 20, 2017 |
| 4.15* | | | | Form 8-K | | June 21, 2018 |
| 4.16* | | | | Form 8-K | | March 21, 2019 |
| 4.17* | | | | Form 8-K | | June 21, 2018 |
| 4.18* | | | | Form 8-K | | June 21, 2018 |
| 4.19* | | | | Form 8-K | | June 21, 2018 |
| 4.20* | | | | Form 8-K | | March 21, 2019 |
| 4.21* | | | | Form 8-K | | March 21, 2019 |
| 4.22* | | | | Form 8-K | | March 21, 2019 |
| 4.23* | | | | Form 8-K | | March 21, 2019 |
| 4.24* | | | | Form 8-K | | July 15, 2019 |
| 4.25* | | | | Form 8-K | | July 15, 2019 |
| 4.26* | | | | Form 8-K | | July 15, 2019 |
| 4.27* | | | | Form 8-K | | September 12, 2019 |
| 4.28* | | | | Form 8-K | | July 15, 2019 |
| | | | | | | | | | | | | | | | | | | | |
Exhibit
Number | | Exhibit Title | | Incorporated by Reference to: | | Date Filed |
| 4.29* | | | | Form 8-K | | September 12, 2019 |
| 4.30* | | | | Form 8-K | | September 12, 2019 |
| 4.31* | | | | Form 8-K | | March 26, 2020 |
| 4.32* | | | | Form 8-K | | March 26, 2020 |
| 4.33* | | | | Form 8-K | | August 5, 2020 |
| 4.34* | | | | Form 8-K | | August 5, 2020 |
| 4.35* | | | | Form 10-K | | February 4, 2020 |
| 10.1 | | Credit Agreement, effective as of October 6, 2020, among the Company, as the Borrower, Alexandria Real Estate Equities, L.P., as a Guarantor, Citibank, N.A., as Administrative Agent, and the Other Lenders Party thereto, Citibank, N.A., BofA Securities, Inc., JPMorgan Chase Bank, N.A., Goldman Sachs Bank USA, RBC Capital Markets, Bank of Nova Scotia, Mizuho Bank, Ltd., Sumitomo Mitsui Banking Corporation, and U.S. Bank National Association, as Joint Lead Arrangers, Citibank, N.A., BofA Securities, Inc, JPMorgan Chase Bank, N.A., Goldman Sachs Bank USA, and RBC Capital Markets, as Joint Bookrunners, Bank of America, N.A., JPMorgan Chase Bank, N.A., Goldman Sachs Bank USA, and Royal Bank of Canada, as Co-Syndication Agents, and Bank of Nova Scotia, Mizuho Bank, Ltd., Sumitomo Mitsui Banking Corporation, U.S. Bank National Association, Bank of the West, Barclays Bank PLC, Capital One, N.A., BBVA USA f/k/a Compass Bank, Fifth Third Bank, PNC Bank, National Association, Regions Bank, TD Bank, N.A., and Truist Bank, as Co-Documentation Agents | | N/A | | Filed herewith |
| 10.2* | (1) | | | Form 8-K | | June 9, 2020 |
| 10.3* | (1) | | | Form S-11 | | May 5, 1997 |
| 10.4* | (1) | | | Form S-11 | | May 5, 1997 |
| 10.5* | (1) | | | Form S-11 | | May 5, 1997 |
| 10.6* | (1) | | | Form 10-K | | January 30, 2018 |
| 10.7* | (1) | | | Form 10-K | | January 30, 2018 |
| 10.8* | (1) | | | Form 10-K | | January 30, 2018 |
| 10.9* | (1) | | | Form 10-K | | January 30, 2018 |
| 10.10* | (1) | | | Form 10-K | | March 1, 2011 |
| 10.11* | (1) | | | Form 10-K | | March 1, 2011 |
| | | | | | | | | | | | | | | | | | | | |
Exhibit
Number | | Exhibit Title | | Incorporated by Reference to: | | Date Filed |
| 10.12* | (1) | | | Form 8-K | | April 7, 2015 |
| 10.13* | (1) | | | Form 8-K | | July 3, 2017 |
| 10.14* | (1) | | | Form 10-Q | | May 1, 2018 |
| 10.15* | (1) | | | Form 8-K | | January 18, 2019 |
| 10.16* | (1) | | | Form 10-Q | | July 27, 2020 |
| 10.17* | (1) | | | Form 10-Q | | May 1, 2018 |
| 10.18* | (1) | | | Form 10-Q | | July 31, 2018 |
| 10.19* | (1) | | | Form 10-Q | | May 1, 2018 |
| 10.20* | (1) | | | Form 10-Q | | July 31, 2018 |
| 10.21 | (1) | | | N/A | | Filed herewith |
| 10.22 | (1) | | | N/A | | Filed herewith |
| 10.23 | (1) | | | N/A | | Filed herewith |
| 10.24* | (1) | | | Form 8-K | | June 17, 2010 |
| 10.25* | (1) | | | Form 10-Q | | November 9, 2011 |
| 10.26* | (1) | | | Form 10-K | | March 1, 2011 |
| 14.1 | | | | N/A | | Filed herewith |
| 21.1 | | | | N/A | | Filed herewith |
| 22.0 | | | | N/A | | Filed herewith |
| 23.1 | | | | N/A | | Filed herewith |
| 31.1 | | | | N/A | | Filed herewith |
| 31.2 | | | | N/A | | Filed herewith |
| 31.3 | | | | N/A | | Filed herewith |
| 31.4 | | | | N/A | | Filed herewith |
| 32.0 | | | | N/A | | Filed herewith |
| | | | | | | | | | | | | | | | | | | | |
Exhibit
Number | | Exhibit Title | | Incorporated by Reference to: | | Date Filed |
| 101.1 | | The following materials from the Company’s annual report on Form 10-K for the year ended December 31, 2020, formatted in iXBRL (Inline eXtensible Business Reporting Language): (i) Consolidated Balance Sheets as of December 31, 2020 and 2019, (ii) Consolidated Statements of Operations for the years ended December 31, 2020, 2019, and 2018, (iii) Consolidated Statements of Comprehensive Income for the years ended December 31, 2020, 2019, and 2018, (iv) Consolidated Statements of Changes in Stockholders’ Equity and Noncontrolling Interests for the years ended December 31, 2020, 2019, and 2018, (v) Consolidated Statements of Cash Flows for the years ended December 31, 2020, 2019, and 2018, (vi) Notes to Consolidated Financial Statements, and (vii) Schedule III - Consolidated Financial Statement Schedule of Real Estate and Accumulated Depreciation of the Company. | | N/A | | Filed herewith |
| 104 | | Cover Page Interactive Data File (embedded within the Inline XBRL document) | | N/A | | Filed herewith |
(*) Incorporated by reference.
(1) Management contract or compensatory arrangement.
SIGNATURES
Pursuant to the requirements of Section 13 or 15(d) of the Securities Exchange Act of 1934, the registrant has duly caused this annual report on Form 10-K to be signed on its behalf by the undersigned, thereunto duly authorized.
| | | | | | | | | | | |
| | | ALEXANDRIA REAL ESTATE EQUITIES, INC.
|
| Dated: | February 1, 2021 | By: | /s/ Joel S. Marcus |
| | | Joel S. Marcus Executive Chairman (Principal Executive Officer) |
| | | |
| | | /s/ Stephen A. Richardson |
| | | Stephen A. Richardson Co-Chief Executive Officer (Principal Executive Officer) |
| | | |
| | | /s/ Peter M. Moglia |
| | | Peter M. Moglia Co-Chief Executive Officer and Co-Chief Investment Officer (Principal Executive Officer) |
KNOW ALL THOSE BY THESE PRESENTS, that each person whose signature appears below constitutes and appoints Joel S. Marcus, as his or her true and lawful attorney-in-fact and agent, with full power of substitution and resubstitution, for him or her and in his or her name, place, and stead, in any and all capacities, to sign any and all amendments to this annual report on Form 10-K, and to file the same, with exhibits thereto and other documents in connection therewith, if any, with the Securities and Exchange Commission, granting unto said attorney-in-fact and agent, full power and authority to do and perform each and every act and thing requisite and necessary to be done, as fully to all intents and purposes as he might or could do in person, hereby ratifying and confirming all that said attorney-in-fact and agent of their substitute or substitutes may lawfully do or cause to be done by virtue hereof.
Pursuant to the requirements of the Securities Exchange Act of 1934, this annual report on Form 10-K has been signed below by the following persons on behalf of the Registrant and in the capacities and on the dates indicated.
| | | | | | | | | | | | | | |
| Signature | | Title | | Date |
| | | | |
| /s/ Joel S. Marcus | | Executive Chairman
(Principal Executive Officer) | | February 1, 2021 |
| Joel S. Marcus | |
| | | | |
| /s/ Stephen A. Richardson | | Co-Chief Executive Officer
(Principal Executive Officer) | | February 1, 2021 |
| Stephen A. Richardson | |
| | | | |
| /s/ Peter M. Moglia | | Co-Chief Executive Officer and Co-Chief Investment Officer
(Principal Executive Officer) | | February 1, 2021 |
| Peter M. Moglia | |
| | | | |
| /s/ Dean A. Shigenaga | | President and Chief Financial Officer
(Principal Financial Officer) | | February 1, 2021 |
| Dean A. Shigenaga | |
| | | | |
| /s/ Andres R. Gavinet | | Chief Accounting Officer
(Principal Accounting Officer) | | February 1, 2021 |
| Andres R. Gavinet | |
| | | | |
| /s/ Steven R. Hash | | Lead Director | | February 1, 2021 |
| Steven R. Hash | |
| | | | |
| /s/ John L. Atkins, III | | Director | | January 27, 2021 |
| John L. Atkins, III | |
| | | | |
| /s/ James P. Cain | | Director | | January 28, 2021 |
| James P. Cain | |
| | | | |
| /s/ Maria C. Freire | | Director | | February 1, 2021 |
| Maria C. Freire | |
| | | | |
| /s/ Jennifer Friel Goldstein | | Director | | February 1, 2021 |
| Jennifer Friel Goldstein | |
| | | | |
| /s/ Richard H. Klein | | Director | | February 1, 2021 |
| Richard H. Klein | |
| | | | |
| /s/ James H. Richardson | | Director | | February 1, 2021 |
| James H. Richardson | |
| | | | |
| /s/ Michael A. Woronoff | | Director | | February 1, 2021 |
| Michael A. Woronoff | |
Report of Independent Registered Public Accounting Firm
To the Stockholders and Board of Directors of Alexandria Real Estate Equities, Inc.
Opinion on the Financial Statements
We have audited the accompanying consolidated balance sheets of Alexandria Real Estate Equities, Inc. (the Company), as of December 31, 2020 and 2019, and the related consolidated statements of operations, comprehensive income, changes in stockholders’ equity and noncontrolling interests and cash flows for each of the three years in the period ended December 31, 2020, and the related notes and financial statement schedule listed in the Index at Item 15 (collectively referred to as the “consolidated financial statements”). In our opinion, the consolidated financial statements present fairly, in all material respects, the financial position of the Company at December 31, 2020 and 2019, and the results of its operations and its cash flows for each of the three years in the period ended December 31, 2020, in conformity with U.S. generally accepted accounting principles.
We also have audited, in accordance with the standards of the Public Company Accounting Oversight Board (United States) (PCAOB), the Company’s internal control over financial reporting as of December 31, 2020, based on criteria established in Internal Control - Integrated Framework issued by the Committee of Sponsoring Organizations of the Treadway Commission (2013 framework) and our report dated February 1, 2021 expressed an unqualified opinion thereon.
Basis for Opinion
These financial statements are the responsibility of the Company’s management. Our responsibility is to express an opinion on the Company’s financial statements based on our audits. We are a public accounting firm registered with the PCAOB and are required to be independent with respect to the Company in accordance with the U.S. federal securities laws and the applicable rules and regulations of the Securities and Exchange Commission and the PCAOB.
We conducted our audits in accordance with the standards of the PCAOB. Those standards require that we plan and perform the audit to obtain reasonable assurance about whether the financial statements are free of material misstatement, whether due to error or fraud. Our audits included performing procedures to assess the risks of material misstatement of the financial statements, whether due to error or fraud, and performing procedures that respond to those risks. Such procedures included examining, on a test basis, evidence regarding the amounts and disclosures in the financial statements. Our audits also included evaluating the accounting principles used and significant estimates made by management, as well as evaluating the overall presentation of the financial statements. We believe that our audits provide a reasonable basis for our opinion.
Critical Audit Matter
The critical audit matter communicated below is a matter arising from the current period audit of the financial statements that was communicated or required to be communicated to the audit committee and that: (1) relates to accounts or disclosures that are material to the financial statements and (2) involved our especially challenging, subjective, or complex judgments. The communication of the critical audit matter does not alter in any way our opinion on the consolidated financial statements, taken as a whole, and we are not, by communicating the critical audit matter below, providing a separate opinion on the critical audit matter or on the accounts or disclosures to which it relates.
Recognition of acquired real estate – Purchase price accounting
| | | | | | | | |
Description of the Matter | | As more fully disclosed in Notes 2 and 3 to the consolidated financial statements, during 2020, the Company completed the acquisition of 55 properties for a total purchase price of $2.6 billion. The transactions were accounted for as asset acquisitions, and the purchase prices were allocated based on the relative fair values of the assets acquired (including land, buildings and improvements, and the intangible value of acquired above-market leases, acquired in-place leases, tenant relationships and other intangible assets) and liabilities assumed (including the intangible value of acquired below-market leases and other intangible liabilities). The fair value of tangible and intangible assets and liabilities is based on available comparable market information, including estimated replacement costs, rental rates, recent market transactions, and estimated cash flow projections that utilize appropriate discount and capitalization rates. Estimates of future cash flows are based on a number of factors, including the historical operating results, known and anticipated trends, and market or economic conditions, that may affect the property.
Auditing the Company’s estimate of the fair value of the acquired tangible and intangible assets and liabilities involves significant estimation uncertainty due to the judgment used by management in selecting key assumptions based on recent comparable transactions or market data, which are primarily unobservable inputs, and the sensitivity of the estimates to changes in assumptions. The allocation of purchase price to the components of properties acquired could have an effect on the Company’s net income due to the useful depreciable and amortizable lives applicable to each component and the recognition and classification of the related depreciation or amortization expense in the Company’s consolidated statements of operations. |
| | |
How we Addressed the Matter in Our Audit | | Our audit procedures related to the key assumptions utilized in the Company’s purchase price accounting for acquired real estate included the following procedures, among others:
We tested the design and operating effectiveness of controls over the Company’s process for determining and reviewing the key inputs and assumptions used in estimating the fair value of acquired assets and liabilities and allocating purchase price to the various components.
We evaluated the incorporation of the key assumptions in the purchase price accounting model and recalculated the model’s results. To test the fair values of acquired tangible and intangible assets and liabilities used in the purchase price allocation, we performed procedures to evaluate the valuation methods and significant assumptions used by management. We evaluated the completeness and accuracy of the underlying data supporting the determination of the various inputs. Our internal valuation specialists assisted us in evaluating the methodology used by the Company and considered the consistency of the land and building values, estimated replacement costs, market rental rates, ground lease rates and discount rates with external data sources. |
/s/ Ernst & Young LLP
We have served as the Company’s auditor since 1994.
Los Angeles, California
February 1, 2021
Alexandria Real Estate Equities, Inc.
Consolidated Balance Sheets
(In thousands, except share and per share amounts)
| | | | | | | | | | | |
| December 31, |
| 2020 | | 2019 |
| Assets | | | |
Investments in real estate | $ | 18,092,372 | | | $ | 14,844,038 | |
Investments in unconsolidated real estate joint ventures | 332,349 | | | 346,890 | |
Cash and cash equivalents | 568,532 | | | 189,681 | |
Restricted cash | 29,173 | | | 53,008 | |
Tenant receivables | 7,333 | | | 10,691 | |
Deferred rent | 722,751 | | | 641,844 | |
Deferred leasing costs | 272,673 | | | 270,043 | |
Investments | 1,611,114 | | | 1,140,594 | |
Other assets | 1,191,581 | | | 893,714 | |
Total assets | $ | 22,827,878 | | | $ | 18,390,503 | |
| | | |
| Liabilities, Noncontrolling Interests, and Equity | | | |
Secured notes payable | $ | 230,925 | | | $ | 349,352 | |
Unsecured senior notes payable | 7,232,370 | | | 6,044,127 | |
| Unsecured senior line of credit and commercial paper | 99,991 | | | 384,000 | |
Accounts payable, accrued expenses, and other liabilities | 1,669,832 | | | 1,320,268 | |
Dividends payable | 150,982 | | | 126,278 | |
Total liabilities | 9,384,100 | | | 8,224,025 | |
| | | |
Commitments and contingencies | | | |
| | | |
Redeemable noncontrolling interests | 11,342 | | | 12,300 | |
| | | |
Alexandria Real Estate Equities, Inc.’s stockholders’ equity: | | | |
Common stock, $0.01 par value per share, 200,000,000 shares authorized as of December 31, 2020 and 2019; 136,690,329 and 120,800,315 shares issued and outstanding as of December 31, 2020 and 2019, respectively | 1,367 | | | 1,208 | |
| Additional paid-in capital | 11,730,970 | | | 8,874,367 | |
| Accumulated other comprehensive loss | (6,625) | | | (9,749) | |
Alexandria Real Estate Equities, Inc.’s stockholders’ equity | 11,725,712 | | | 8,865,826 | |
Noncontrolling interests | 1,706,724 | | | 1,288,352 | |
Total equity | 13,432,436 | | | 10,154,178 | |
Total liabilities, noncontrolling interests, and equity | $ | 22,827,878 | | | $ | 18,390,503 | |
The accompanying notes are an integral part of these consolidated financial statements.
Alexandria Real Estate Equities, Inc.
Consolidated Statements of Operations
(In thousands, except per share amounts)
| | | | | | | | | | | | | | | | | |
| Year Ended December 31, |
| 2020 | | 2019 | | 2018 |
Revenues: | | | | | |
Income from rentals | $ | 1,878,208 | | | $ | 1,516,864 | | | $ | 1,314,781 | |
Other income | 7,429 | | | 14,432 | | | 12,678 | |
Total revenues | 1,885,637 | | | 1,531,296 | | | 1,327,459 | |
| | | | | |
Expenses: | | | | | |
Rental operations | 530,224 | | | 445,492 | | | 381,120 | |
General and administrative | 133,341 | | | 108,823 | | | 90,405 | |
Interest | 171,609 | | | 173,675 | | | 157,495 | |
Depreciation and amortization | 698,104 | | | 544,612 | | | 477,661 | |
Impairment of real estate | 48,078 | | | 12,334 | | | 6,311 | |
Loss on early extinguishment of debt | 60,668 | | | 47,570 | | | 1,122 | |
Total expenses | 1,642,024 | | | 1,332,506 | | | 1,114,114 | |
| | | | | |
| Equity in earnings of unconsolidated real estate joint ventures | 8,148 | | | 10,136 | | | 43,981 | |
| Investment income | 421,321 | | | 194,647 | | | 136,763 | |
Gain on sales of real estate – rental properties | 154,089 | | | 474 | | | 8,704 | |
| Net income | 827,171 | | | 404,047 | | | 402,793 | |
Net income attributable to noncontrolling interests | (56,212) | | | (40,882) | | | (23,481) | |
| Net income attributable to Alexandria Real Estate Equities, Inc.’s stockholders | 770,959 | | | 363,165 | | | 379,312 | |
Dividends on preferred stock | — | | | (3,204) | | | (5,060) | |
Preferred stock redemption charge | — | | | (2,580) | | | (4,240) | |
Net income attributable to unvested restricted stock awards | (10,168) | | | (6,386) | | | (6,029) | |
| Net income attributable to Alexandria Real Estate Equities, Inc.’s common stockholders | $ | 760,791 | | | $ | 350,995 | | | $ | 363,983 | |
| | | | | |
| Net income per share attributable to Alexandria Real Estate Equities, Inc.’s common stockholders: | | | | | |
| Basic | $ | 6.03 | | | $ | 3.13 | | | $ | 3.53 | |
| Diluted | $ | 6.01 | | | $ | 3.12 | | | $ | 3.52 | |
The accompanying notes are an integral part of these consolidated financial statements.
Alexandria Real Estate Equities, Inc.
Consolidated Statements of Comprehensive Income
(In thousands)
| | | | | | | | | | | | | | | | | |
| Year Ended December 31, |
| 2020 | | 2019 | | 2018 |
| Net income | $ | 827,171 | | | $ | 404,047 | | | $ | 402,793 | |
| Other comprehensive income (loss) | | | | | |
| Unrealized gains (losses) on interest rate hedge agreements: | | | | | |
| Unrealized interest rate hedge (losses) gains during the period | — | | | (1,763) | | | 1,622 | |
| Reclassification of amortization to interest expense included in net income | — | | | (1,777) | | | (4,941) | |
| Reclassification of losses related to terminated interest rate hedge instruments to interest expense included in net income | — | | | 1,702 | | | — | |
| Unrealized gains (losses) on interest rate hedge agreements, net | — | | | (1,838) | | | (3,319) | |
| | | | | |
| Unrealized gains (losses) on foreign currency translation: | | | | | |
| Unrealized foreign currency translation gains (losses) arising during the period | 3,124 | | | 2,524 | | | (7,369) | |
| Unrealized gains (losses) on foreign currency translation, net | 3,124 | | | 2,524 | | | (7,369) | |
| | | | | |
| Total other comprehensive income (loss) | 3,124 | | | 686 | | | (10,688) | |
| Comprehensive income | 830,295 | | | 404,733 | | | 392,105 | |
| Less: comprehensive income attributable to noncontrolling interests | (56,212) | | | (40,882) | | | (23,481) | |
| Comprehensive income attributable to Alexandria Real Estate Equities, Inc.’s stockholders | $ | 774,083 | | | $ | 363,851 | | | $ | 368,624 | |
The accompanying notes are an integral part of these consolidated financial statements.
Alexandria Real Estate Equities, Inc.
Consolidated Statements of Changes in Stockholders’ Equity and Noncontrolling Interests
(Dollars in thousands)
| | | | | | | | | | | | | | | | | | | | | | | | | | | | | | | | | | | | | | | | | | | | | | | | | | | | | | | | |
| | Alexandria Real Estate Equities, Inc.’s Stockholders’ Equity | | | | | | |
| | 7.00% Series D
Cumulative
Convertible
Preferred
Stock | | Number of
Common
Shares | | Common
Stock | | Additional
Paid-In Capital | | Retained
Earnings | | Accumulated
Other
Comprehensive Income | | Noncontrolling
Interests | | Total
Equity | | Redeemable
Noncontrolling
Interests |
| Balance as of December 31, 2017 | | $ | 74,386 | | | 99,783,686 | | | $ | 998 | | | $ | 5,824,258 | | | $ | — | | | $ | 50,024 | | | $ | 521,994 | | | $ | 6,471,660 | | | $ | 11,509 | |
| Net income | | — | | | — | | | — | | | — | | | 379,312 | | | — | | | 22,618 | | | 401,930 | | | 863 | |
| Total other comprehensive loss | | — | | | — | | | — | | | — | | | — | | | (10,688) | | | — | | | (10,688) | | | — | |
Reclassification of net unrealized gains on non-real estate investments upon adoption of new ASU on financial instruments on January 1, 2018 | | — | | | — | | | — | | | — | | | 140,521 | | | (49,771) | | | — | | | 90,750 | | | — | |
Contributions from and sales of noncontrolling interests | | — | | | — | | | — | | | 257 | | | — | | | — | | | 27,161 | | | 27,418 | | | 857 | |
Redemption of noncontrolling interests | | — | | | — | | | — | | | — | | | — | | | — | | | — | | | — | | | (1,597) | |
Distributions to noncontrolling interests | | — | | | — | | | — | | | — | | | — | | | — | | | (29,810) | | | (29,810) | | | (846) | |
Issuance of common stock | | — | | | 10,915,120 | | | 109 | | | 1,304,531 | | | — | | | — | | | — | | | 1,304,640 | | | — | |
Issuance pursuant to stock plan | | — | | | 313,010 | | | 3 | | | 45,975 | | | — | | | — | | | — | | | 45,978 | | | — | |
Repurchases of 7.00% Series D preferred stock | | (10,050) | | | — | | | — | | | 314 | | | (4,240) | | | — | | | — | | | (13,976) | | | — | |
Dividends declared on common stock ($3.73 per share) | | — | | | — | | | — | | | — | | | (398,914) | | | — | | | — | | | (398,914) | | | — | |
Dividends declared on preferred stock ($1.75 per share) | | — | | | — | | | — | | | — | | | (5,060) | | | — | | | — | | | (5,060) | | | — | |
| Reclassification of distributions in excess of earnings | | — | | | — | | | — | | | 111,619 | | | (111,619) | | | — | | | — | | | — | | | — | |
| Balance as of December 31, 2018 | | 64,336 | | | 111,011,816 | | | 1,110 | | | 7,286,954 | | | — | | | (10,435) | | | 541,963 | | | 7,883,928 | | | 10,786 | |
| Net income | | — | | | — | | | — | | | — | | | 363,165 | | | — | | | 40,007 | | | 403,172 | | | 875 | |
| Total other comprehensive income | | — | | | — | | | — | | | — | | | — | | | 686 | | | — | | | 686 | | | — | |
Contributions from and sales of noncontrolling interests | | — | | | — | | | — | | | 381,162 | | | — | | | — | | | 753,777 | | | 1,134,939 | | | 1,469 | |
Distributions to noncontrolling interests | | — | | | — | | | — | | | — | | | — | | | — | | | (47,395) | | | (47,395) | | | (830) | |
Issuance of common stock | | — | | | 8,723,076 | | | 87 | | | 1,216,358 | | | — | | | — | | | — | | | 1,216,445 | | | — | |
Issuance pursuant to stock plan | | — | | | 666,836 | | | 7 | | | 67,906 | | | — | | | — | | | — | | | 67,913 | | | — | |
Taxes paid related to net settlement of equity awards | | — | | | (179,008) | | | (2) | | | (25,475) | | | — | | | — | | | — | | | (25,477) | | | — | |
Repurchases of 7.00% Series D preferred stock | | (6,875) | | | — | | | — | | | 215 | | | (2,580) | | | — | | | — | | | (9,240) | | | — | |
Conversion of 7.00% Series D preferred stock | | (57,461) | | | 577,595 | | | 6 | | | 57,355 | | | — | | | — | | | — | | | (100) | | | — | |
Dividends declared on common stock ($4.00 per share) | | — | | | — | | | — | | | — | | | (463,964) | | | — | | | — | | | (463,964) | | | — | |
Dividends declared on preferred stock ($1.3125 per share) | | — | | | — | | | — | | | — | | | (3,204) | | | — | | | — | | | (3,204) | | | — | |
| Cumulative effect of adjustment upon adoption of lease ASUs on January 1, 2019 | | — | | | — | | | — | | | — | | | (3,525) | | | — | | | — | | | (3,525) | | | — | |
Reclassification of distributions in excess of earnings | | — | | | — | | | — | | | (110,108) | | | 110,108 | | | — | | | — | | | — | | | — | |
| Balance as of December 31, 2019 | | $ | — | | | 120,800,315 | | | $ | 1,208 | | | $ | 8,874,367 | | | $ | — | | | $ | (9,749) | | | $ | 1,288,352 | | | $ | 10,154,178 | | | $ | 12,300 | |
Alexandria Real Estate Equities, Inc.
Consolidated Statements of Changes in Stockholders’ Equity and Noncontrolling Interests (continued)
(Dollars in thousands)
| | | | | | | | | | | | | | | | | | | | | | | | | | | | | | | | | | | | | | | | | | | | | | | | | | |
| Alexandria Real Estate Equities, Inc.’s Stockholders’ Equity | | | | | | |
| | Number of
Common
Shares | | Common
Stock | | Additional
Paid-In Capital | | Retained
Earnings | | Accumulated
Other
Comprehensive
Income | | Noncontrolling
Interests | | Total
Equity | | Redeemable
Noncontrolling
Interests |
| Balance as of December 31, 2019 | | 120,800,315 | | | $ | 1,208 | | | $ | 8,874,367 | | | $ | — | | | $ | (9,749) | | | $ | 1,288,352 | | | $ | 10,154,178 | | | $ | 12,300 | |
| Net income | | — | | | — | | | — | | | 770,959 | | | — | | | 55,309 | | | 826,268 | | | 903 | |
| Total other comprehensive income | | — | | | — | | | — | | | — | | | 3,124 | | | — | | | 3,124 | | | — | |
Contributions from and sales of noncontrolling interests | | — | | | — | | | 267,432 | | | — | | | — | | | 449,726 | | | 717,158 | | | 281 | |
| Distributions to and redemption of noncontrolling interests | | — | | | — | | | — | | | — | | | — | | | (86,663) | | | (86,663) | | | (2,142) | |
Issuance of common stock | | 15,337,916 | | | 153 | | | 2,315,709 | | | — | | | — | | | — | | | 2,315,862 | | | — | |
Issuance pursuant to stock plan | | 688,599 | | | 7 | | | 83,992 | | | — | | | — | | | — | | | 83,999 | | | — | |
Taxes paid related to net settlement of equity awards | | (136,501) | | | (1) | | | (21,321) | | | — | | | — | | | — | | | (21,322) | | | — | |
Dividends declared on common stock ($4.24 per share) | | — | | | — | | | — | | | (557,684) | | | — | | | — | | | (557,684) | | | — | |
| Cumulative effect of adjustment upon adoption of credit loss ASU on January 1, 2020 | | — | | | — | | | — | | | (2,484) | | | — | | | — | | | (2,484) | | | — | |
Reclassification of distributions in excess of earnings | | — | | | — | | | 210,791 | | | (210,791) | | | — | | | — | | | — | | | — | |
| Balance as of December 31, 2020 | | 136,690,329 | | | $ | 1,367 | | | $ | 11,730,970 | | | $ | — | | | $ | (6,625) | | | $ | 1,706,724 | | | $ | 13,432,436 | | | $ | 11,342 | |
The accompanying notes are an integral part of these consolidated financial statements.
| | | | | | | | | | | | | | | | | |
Alexandria Real Estate Equities, Inc. Consolidated Statements of Cash Flows (In thousands) |
| Year Ended December 31, |
| 2020 | | 2019 | | 2018 |
Operating Activities | | | | | |
| Net income | $ | 827,171 | | | $ | 404,047 | | | $ | 402,793 | |
| Adjustments to reconcile net income to net cash provided by operating activities: | | | | | |
| Depreciation and amortization | 698,104 | | | 544,612 | | | 477,661 | |
| Impairment of real estate | 48,078 | | | 12,334 | | | 6,311 | |
| Gain on sales of real estate | (154,089) | | | (474) | | | (8,704) | |
| Loss on early extinguishment of debt | 60,668 | | | 47,570 | | | 1,122 | |
| Equity in earnings of unconsolidated real estate joint ventures | (8,148) | | | (10,136) | | | (43,981) | |
| Distributions of earnings from unconsolidated real estate joint ventures | 5,908 | | | 2,796 | | | 430 | |
| Amortization of loan fees | 10,494 | | | 9,105 | | | 10,271 | |
| Amortization of debt premiums | (3,555) | | | (3,777) | | | (2,406) | |
| Amortization of acquired above- and below-market leases | (57,244) | | | (29,813) | | | (21,938) | |
| Deferred rent | (96,676) | | | (104,235) | | | (93,883) | |
| Stock compensation expense | 43,502 | | | 43,640 | | | 35,019 | |
| Investment income | (421,321) | | | (194,647) | | | (136,763) | |
Changes in operating assets and liabilities: | | | | | |
| Tenant receivables | 2,804 | | | (897) | | | 435 | |
| Deferred leasing costs | (61,067) | | | (54,455) | | | (57,088) | |
| Other assets | (10,997) | | | (20,825) | | | (20,849) | |
| Accounts payable, accrued expenses, and other liabilities | (1,122) | | | 39,012 | | | 21,909 | |
| Net cash provided by operating activities | 882,510 | | | 683,857 | | | 570,339 | |
| | | | | |
Investing Activities | | | | | |
| Proceeds from sales of real estate | 747,020 | | | 6,619 | | | 20,190 | |
| Additions to real estate | (1,445,171) | | | (1,224,541) | | | (927,168) | |
| Purchases of real estate | (2,570,693) | | | (2,259,778) | | | (1,037,180) | |
| Change in escrow deposits | 7,408 | | | (18,107) | | | (2,000) | |
| Acquisitions of interest in unconsolidated real estate joint ventures | — | | | — | | | (35,922) | |
| Investments in unconsolidated real estate joint ventures | (3,444) | | | (102,081) | | | (116,008) | |
| Return of capital from unconsolidated real estate joint ventures | 20,225 | | | 14 | | | 68,592 | |
| Additions to non-real estate investments | (174,655) | | | (190,778) | | | (235,943) | |
| Sales of non-real estate investments | 141,149 | | | 147,332 | | | 103,679 | |
| Net cash used in investing activities | $ | (3,278,161) | | | $ | (3,641,320) | | | $ | (2,161,760) | |
| | | | | | | | | | | | | | | | | |
Alexandria Real Estate Equities, Inc. Consolidated Statements of Cash Flows (In thousands) |
| Year Ended December 31, |
| 2020 | | 2019 | | 2018 |
Financing Activities | | | | | |
| Borrowings from secured notes payable | $ | — | | | $ | — | | | $ | 17,784 | |
| Repayments of borrowings from secured notes payable | (84,104) | | | (306,199) | | | (156,888) | |
| Payment for the defeasance of secured note payable | (32,865) | | | — | | | — | |
| Proceeds from issuance of unsecured senior notes payable | 1,697,651 | | | 2,721,169 | | | 899,321 | |
| Repayments of unsecured senior notes payable | (500,000) | | | (950,000) | | | — | |
| Borrowings from unsecured senior line of credit | 2,700,000 | | | 5,056,000 | | | 4,741,000 | |
| Repayments of borrowings from unsecured senior line of credit | (3,084,000) | | | (4,880,000) | | | (4,583,000) | |
| Proceeds from issuance under commercial paper program | 23,539,400 | | | 2,233,000 | | | — | |
| Repayments of borrowings from commercial paper program | (23,439,400) | | | (2,233,000) | | | — | |
| Repayments of borrowings from unsecured senior bank term loan | — | | | (350,000) | | | (200,000) | |
| Premium paid for early extinguishment of debt | (54,385) | | | (41,351) | | | — | |
| Payments of loan fees | (32,309) | | | (27,182) | | | (19,292) | |
| Taxes paid related to net settlement of equity awards | (21,322) | | | (25,477) | | | — | |
| Repurchase of 7.00% Series D cumulative convertible preferred stock | — | | | (9,240) | | | (13,976) | |
| Proceeds from issuance of common stock | 2,315,862 | | | 1,216,445 | | | 1,293,301 | |
| Dividends on common stock | (532,980) | | | (447,029) | | | (380,632) | |
| Dividends on preferred stock | — | | | (4,141) | | | (5,207) | |
| Contributions from and sales of noncontrolling interests | 367,613 | | | 1,022,712 | | | 28,275 | |
| Distributions to and purchases of noncontrolling interests | (88,805) | | | (48,225) | | | (32,253) | |
Net cash provided by financing activities | 2,750,356 | | | 2,927,482 | | | 1,588,433 | |
| | | | | |
| Effect of foreign exchange rate changes on cash, cash equivalents, and restricted cash | 311 | | | 540 | | | (2,068) | |
| | | | | |
| Net increase (decrease) in cash, cash equivalents, and restricted cash | 355,016 | | | (29,441) | | | (5,056) | |
Cash, cash equivalents, and restricted cash as of the beginning of period | 242,689 | | | 272,130 | | | 277,186 | |
Cash, cash equivalents, and restricted cash as of the end of period | $ | 597,705 | | | $ | 242,689 | | | $ | 272,130 | |
| | | | | |
Supplemental Disclosure and Non-Cash Investing and Financing Activities: | | | | | |
| Cash paid during the period for interest, net of interest capitalized | $ | 161,351 | | | $ | 146,165 | | | $ | 127,093 | |
| Accrued construction for current-period additions to real estate | $ | 275,454 | | | $ | 220,773 | | | $ | 244,147 | |
| Assumption of secured notes payable in connection with purchase of properties | $ | — | | | $ | (28,200) | | | $ | — | |
| Right-of-use asset | $ | 87,554 | | | $ | 269,189 | | | $ | — | |
| Lease liability | $ | (87,554) | | | $ | (275,175) | | | $ | — | |
| Payable for purchase of real estate | $ | — | | | $ | — | | | $ | (65,000) | |
| Contribution of assets from real estate joint venture partner | $ | 350,000 | | | $ | 115,167 | | | $ | — | |
| Issuance of noncontrolling interest to joint venture partner | $ | (292,930) | | | $ | — | | | $ | — | |
| Issuance of common stock for conversion of 7.00% Series D preferred stock | $ | — | | | $ | 57,461 | | | $ | — | |
The accompanying notes are an integral part of these consolidated financial statements.
Alexandria Real Estate Equities, Inc.
Notes to Consolidated Financial Statements
1. ORGANIZATION AND BASIS OF PRESENTATION
Alexandria Real Estate Equities, Inc. (NYSE:ARE), an S&P 500® urban office REIT, is the first, longest-tenured, and pioneering owner, operator, and developer uniquely focused on collaborative life science, technology, and agtech campuses in AAA innovation cluster locations. As used in this annual report on Form 10-K, references to the “Company,” “Alexandria,” “ARE,” “we,” “us,” and “our” refer to Alexandria Real Estate Equities, Inc. and its consolidated subsidiaries. The accompanying consolidated financial statements include the accounts of Alexandria Real Estate Equities, Inc. and its consolidated subsidiaries. All significant intercompany balances and transactions have been eliminated.
Any references to our market capitalization, number or quality of buildings or tenants, quality of location, square footage, number of leases, or occupancy percentage, and any amounts derived from these values in these notes to consolidated financial statements are unaudited.
2. SUMMARY OF SIGNIFICANT ACCOUNTING POLICIES
Consolidation
On an ongoing basis, as circumstances indicate the need for reconsideration, we evaluate each legal entity that is not wholly owned by us in accordance with the consolidation guidance. Our evaluation considers all of our variable interests, including equity ownership, as well as fees paid to us for our involvement in the management of each partially owned entity. To fall within the scope of the consolidation guidance, an entity must meet both of the following criteria:
•The entity has a legal structure that has been established to conduct business activities and to hold assets; such entity can be in the form of a partnership, limited liability company, or corporation, among others; and
•We have a variable interest in the legal entity – i.e., variable interests that are contractual, such as equity ownership, or other financial interests that change with changes in the fair value of the entity’s net assets.
If an entity does not meet both criteria above, we apply other accounting literature, such as the cost or equity method of accounting. If an entity does meet both criteria above, we evaluate such entity for consolidation under either the variable interest model if the legal entity meets any of the following characteristics to qualify as a VIE, or under the voting model for all other legal entities that are not VIEs.
A legal entity is determined to be a VIE if it has any of the following three characteristics:
1) The entity does not have sufficient equity to finance its activities without additional subordinated financial support;
2) The entity is established with non-substantive voting rights (i.e., the entity deprives the majority economic interest holder(s) of voting rights); or
3) The equity holders, as a group, lack the characteristics of a controlling financial interest. Equity holders meet this criterion if they lack any of the following:
•The power, through voting rights or similar rights, to direct the activities of the entity that most significantly influence the entity’s economic performance, as evidenced by:
•Substantive participating rights in day-to-day management of the entity’s activities; or
•Substantive kick-out rights over the party responsible for significant decisions;
•The obligation to absorb the entity’s expected losses; or
•The right to receive the entity’s expected residual returns.
Our real estate joint ventures consist of limited partnerships or limited liability companies. For an entity structured as a limited partnership or a limited liability company, our evaluation of whether the equity holders (equity partners other than the general partner or the managing member of a joint venture) lack the characteristics of a controlling financial interest includes the evaluation of whether the limited partners or non-managing members (the noncontrolling equity holders) lack both substantive participating rights and substantive kick-out rights, defined as follows:
•Participating rights provide the noncontrolling equity holders the ability to direct significant financial and operating decisions made in the ordinary course of business that most significantly influence the entity’s economic performance.
•Kick-out rights allow the noncontrolling equity holders to remove the general partner or managing member without cause.
If we conclude that any of the three characteristics of a VIE are met, including that the equity holders lack the characteristics of a controlling financial interest because they lack both substantive participating rights and substantive kick-out rights, we conclude that the entity is a VIE and evaluate it for consolidation under the variable interest model.
2. SUMMARY OF SIGNIFICANT ACCOUNTING POLICIES (continued)
Variable interest model
If an entity is determined to be a VIE, we evaluate whether we are the primary beneficiary. The primary beneficiary analysis is a qualitative analysis based on power and benefits. We consolidate a VIE if we have both power and benefits — that is, (i) we have the power to direct the activities of a VIE that most significantly influence the VIE’s economic performance (power), and (ii) we have the obligation to absorb losses of or the right to receive benefits from the VIE that could potentially be significant to the VIE (benefits). We consolidate VIEs whenever we determine that we are the primary beneficiary. Refer to Note 4 – “Consolidated and unconsolidated real estate joint ventures” to our consolidated financial statements for information on specific joint ventures that qualify as VIEs. If we have a variable interest in a VIE but are not the primary beneficiary, we account for our investment using the equity method of accounting.
Voting model
If a legal entity fails to meet any of the three characteristics of a VIE (i.e., insufficiency of equity, existence of non-substantive voting rights, or lack of a controlling financial interest), we then evaluate such entity under the voting model. Under the voting model, we consolidate the entity if we determine that we, directly or indirectly, have greater than 50% of the voting shares and that other equity holders do not have substantive participating rights. Refer to Note 4 – “Consolidated and unconsolidated real estate joint ventures” to our consolidated financial statements for further information on our unconsolidated real estate joint ventures that qualify for evaluation under the voting model.
Use of estimates
The preparation of consolidated financial statements in conformity with GAAP requires us to make estimates and assumptions that affect the reported amounts of assets, liabilities, and equity; the disclosure of contingent assets and liabilities as of the date of the consolidated financial statements; and the amounts of revenues and expenses during the reporting period. Actual results could materially differ from those estimates.
Reportable segment
We are engaged in the business of providing space for lease to the life science, technology, and agtech industries. Our properties are similar in that they provide space for lease to the aforementioned industries, consist of improvements that are generic and reusable, are primarily located in AAA urban innovation cluster locations, and have similar economic characteristics. Our chief operating decision makers review financial information for our entire consolidated operations when making decisions related to assessing our operating performance, and review financial information for our individual properties when determining how to allocate resources related to capital expenditures. We have aggregated the properties into one reportable segment as the properties share similar long-term economic characteristics and have other similarities, including the fact that they are operated using consistent business strategies, are typically located in major metropolitan areas, and have similar tenant mixes. The financial information disclosed herein represents all of the financial information related to our one reportable segment.
Investments in real estate
Evaluation of business combination or asset acquisition
We evaluate each acquisition of real estate or in-substance real estate (including equity interests in entities that predominantly hold real estate assets) to determine whether the integrated set of assets and activities acquired meets the definition of a business and needs to be accounted for as a business combination. An acquisition of an integrated set of assets and activities that does not meet the definition of a business is accounted for as an asset acquisition. If either of the following criteria is met, the integrated set of assets and activities acquired would not qualify as a business:
•Substantially all of the fair value of the gross assets acquired is concentrated in either a single identifiable asset or a group of similar identifiable assets; or
•The integrated set of assets and activities is lacking, at a minimum, an input and a substantive process that together significantly contribute to the ability to create outputs (i.e., revenue generated before and after the transaction).
An acquired process is considered substantive if:
•The process includes an organized workforce (or includes an acquired contract that provides access to an organized workforce) that is skilled, knowledgeable, and experienced in performing the process;
•The process cannot be replaced without significant cost, effort, or delay; or
•The process is considered unique or scarce.
2. SUMMARY OF SIGNIFICANT ACCOUNTING POLICIES (continued)
Generally, our acquisitions of real estate or in-substance real estate do not meet the definition of a business because substantially all of the fair value is concentrated in a single identifiable asset or group of similar identifiable assets (i.e., land, buildings, and related intangible assets) or because the acquisition does not include a substantive process in the form of an acquired workforce or an acquired contract that cannot be replaced without significant cost, effort, or delay. When evaluating acquired service or management contracts, we consider the nature of the services performed, the terms of the contract relative to similar arm’s-length contracts, and the availability of comparable vendors in evaluating whether the acquired contract constitutes a substantive process.
Recognition of real estate acquired
We evaluate each acquisition of real estate or in-substance real estate (including equity interests in entities that predominantly hold real estate assets) to determine whether the integrated set of assets and activities acquired meets the definition of a business and needs to be accounted for as a business combination. An acquisition of an integrated set of assets and activities that does not meet the definition of a business is accounted for as an asset acquisition.
For acquisitions of real estate or in-substance real estate that are accounted for as business combinations, we allocate the acquisition consideration (excluding acquisition costs) to the assets acquired, liabilities assumed, noncontrolling interests, and previously existing ownership interests at fair value as of the acquisition date. Assets include intangible assets such as tenant relationships, acquired in-place leases, and favorable intangibles associated with in-place leases in which we are the lessor. Liabilities include unfavorable intangibles associated with in-place leases in which we are the lessor. In addition, for acquired in-place finance or operating leases in which we are the lessee, acquisition consideration is allocated to lease liabilities and related right-of-use assets, adjusted to reflect favorable or unfavorable terms of the lease when compared with market terms. Any excess (deficit) of the consideration transferred relative to the fair value of the net assets acquired is accounted for as goodwill (bargain purchase gain). Acquisition costs related to business combinations are expensed as incurred.
Generally, we expect that acquisitions of real estate or in-substance real estate will not meet the definition of a business because substantially all of the fair value is concentrated in a single identifiable asset or group of similar identifiable assets (i.e., land, buildings, and related intangible assets). The accounting model for asset acquisitions is similar to the accounting model for business combinations, except that the acquisition consideration (including acquisition costs) is allocated to the individual assets acquired and liabilities assumed on a relative fair value basis. Any excess (deficit) of the consideration transferred relative to the sum of the fair value of the assets acquired and liabilities assumed is allocated to the individual assets and liabilities based on their relative fair values. As a result, asset acquisitions do not result in the recognition of goodwill or a bargain purchase gain. Incremental and external direct acquisition costs (such as legal and other third-party services) are capitalized.
We exercise judgment to determine the key assumptions used to allocate the purchase price of real estate acquired among its components. The allocation of the consideration to the various components of properties acquired during the year can have an effect on our net income due to the useful depreciable and amortizable lives applicable to each component and the recognition of the related depreciation and amortization expense in our consolidated statements of operations. We apply judgment in utilizing available comparable market information to assess relative fair value. We assess the relative fair values of tangible and intangible assets and liabilities based on available comparable market information, including estimated replacement costs, rental rates, and recent market transactions. In addition, we may use estimated cash flow projections that utilize appropriate discount and capitalization rates. Estimates of future cash flows are based on a number of factors, including the historical operating results, known and anticipated trends, and market/economic conditions that may affect the property.
The value of tangible assets acquired is based upon our estimation of fair value on an “as if vacant” basis. The value of acquired in-place leases includes the estimated costs during the hypothetical lease-up period and other costs that would have been incurred in the execution of similar leases under the market conditions at the acquisition date of the acquired in-place lease. If there is a bargain fixed-rate renewal option for the period beyond the noncancelable lease term of an in-place lease, we evaluate intangible factors such as the business conditions in the industry in which the lessee operates, the economic conditions in the area in which the property is located, and the ability of the lessee to sublease the property during the renewal term, in order to determine the likelihood that the lessee will renew. When we determine there is reasonable assurance that such bargain purchase option will be exercised, we consider the option in determining the intangible value of such lease and its related amortization period. We also recognize the relative fair values of assets acquired, the liabilities assumed, and any noncontrolling interest in acquisitions of less than a 100% interest when the acquisition constitutes a change in control of the acquired entity.
The values allocated to buildings and building improvements, land improvements, tenant improvements, and equipment are depreciated on a straight-line basis using the shorter of the respective ground lease term, estimated useful life, or up to 40 years, for buildings and building improvements; estimated life, or up to 20 years, for land improvements; the respective lease term or estimated useful life for tenant improvements; and the shorter of the lease term or estimated useful life for equipment. The values of acquired in-place leases and associated favorable intangibles (i.e., acquired above-market leases) are classified in other assets in our consolidated balance sheets and are amortized over the remaining terms of the related leases as a reduction of income from rentals in our consolidated statements of operations. The values of unfavorable intangibles (i.e., acquired below-market leases) associated with acquired in-place leases are classified in accounts payable, accrued expenses, and other liabilities in our consolidated balance sheets and are amortized over the remaining terms of the related leases as an increase in income from rentals in our statements of operations.
2. SUMMARY OF SIGNIFICANT ACCOUNTING POLICIES (continued)
Capitalized project costs
We capitalize project costs, including pre-construction costs, interest, property taxes, insurance, and other costs directly related and essential to the development, redevelopment, pre-construction, or construction of a project. Capitalization of development, redevelopment, pre-construction, and construction costs is required while activities are ongoing to prepare an asset for its intended use. Fluctuations in our development, redevelopment, pre-construction, and construction activities could result in significant changes to total expenses and net income. Costs incurred after a project is substantially complete and ready for its intended use are expensed as incurred. Should development, redevelopment, pre-construction, or construction activity cease, interest, property taxes, insurance, and certain other costs would no longer be eligible for capitalization and would be expensed as incurred. Expenditures for repairs and maintenance are expensed as incurred.
Real estate sales
A property is classified as held for sale when all of the following criteria for a plan of sale have been met: (i) management, having the authority to approve the action, commits to a plan to sell the property; (ii) the property is available for immediate sale in its present condition, subject only to terms that are usual and customary; (iii) an active program to locate a buyer and other actions required to complete the plan to sell have been initiated; (iv) the sale of the property is probable and is expected to be completed within one year; (v) the property is being actively marketed for sale at a price that is reasonable in relation to its current fair value; and (vi) actions necessary to complete the plan of sale indicate that it is unlikely that significant changes to the plan will be made or that the plan will be withdrawn. Depreciation of assets ceases upon designation of a property as held for sale.
If the disposal of a property represents a strategic shift that has (or will have) a major effect on our operations or financial results, such as (i) a major line of business, (ii) a major geographic area, (iii) a major equity method investment, or (iv) other major parts of an entity, then the operations of the property, including any interest expense directly attributable to it, are classified as discontinued operations in our consolidated statements of operations, and amounts for all prior periods presented are reclassified from continuing operations to discontinued operations. The disposal of an individual property generally will not represent a strategic shift and therefore will typically not meet the criteria for classification as a discontinued operation.
We recognize gains/losses on real estate sales in accordance with the accounting standard on the derecognition of nonfinancial assets arising from contracts with noncustomers. Our ordinary output activities consist of the leasing of space to our tenants in our operating properties, not the sales of real estate. Therefore, sales of real estate (in which we are the seller) qualify as contracts with noncustomers. In our transactions with noncustomers, we apply certain recognition and measurement principles consistent with our method of recognizing revenue arising from contracts with customers. Derecognition of the asset is based on the transfer of control. If a real estate sales contract includes our ongoing involvement with the property, then we evaluate each promised good or service under the contract to determine whether it represents a separate performance obligation, constitutes a guarantee, or prevents the transfer of control. If a good or service is considered a separate performance obligation, an allocated portion of the transaction price is recognized as revenue as we transfer the related good or service to the buyer.
The recognition of gain or loss on the sale of a partial interest also depends on whether we retain a controlling or noncontrolling interest in the property. If we retain a controlling interest in the property upon completion of the sale, we continue to reflect the asset at its book value, record a noncontrolling interest for the book value of the partial interest sold, and recognize additional paid-in capital for the difference between the consideration received and the partial interest at book value. Conversely, if we retain a noncontrolling interest upon completion of the sale of a partial interest of real estate, we would recognize a gain or loss as if 100% of the real estate were sold.
Impairment of long-lived assets
Prior to and subsequent to the end of each quarter, we review current activities and changes in the business conditions of all of our long-lived assets to determine the existence of any triggering events or impairment indicators requiring an impairment analysis. If triggering events or impairment indicators are identified, we review an estimate of the future undiscounted cash flows, including, if necessary, a probability-weighted approach if multiple outcomes are under consideration.
2. SUMMARY OF SIGNIFICANT ACCOUNTING POLICIES (continued)
Long-lived assets to be held and used, including our rental properties, CIP, land held for development, right-of-use assets related to operating leases in which we are the lessee, and intangibles, are individually evaluated for impairment when conditions exist that may indicate that the carrying amount of a long-lived asset may not be recoverable. The carrying amount of a long-lived asset to be held and used is not recoverable if it exceeds the sum of the undiscounted cash flows expected to result from the use and eventual disposition of the asset. Triggering events or impairment indicators for long-lived assets to be held and used are assessed by project and include significant fluctuations in estimated net operating income, occupancy changes, significant near-term lease expirations, current and historical operating and/or cash flow losses, construction costs, estimated completion dates, rental rates, and other market factors. We assess the expected undiscounted cash flows based upon numerous factors, including, but not limited to, construction costs, available market information, current and historical operating results, known trends, current market/economic conditions that may affect the asset, and our assumptions about the use of the asset, including, if necessary, a probability-weighted approach if multiple outcomes are under consideration.
Upon determination that an impairment has occurred, a write-down is recognized to reduce the carrying amount to its estimated fair value. If an impairment charge is not required to be recognized, the recognition of depreciation or amortization is adjusted prospectively, as necessary, to reduce the carrying amount of the real estate to its estimated disposition value over the remaining period that the asset is expected to be held and used. We may adjust depreciation of properties that are expected to be disposed of or redeveloped prior to the end of their useful lives.
We use the held for sale impairment model for our properties classified as held for sale. The held for sale impairment model is different from the held and used impairment model. Under the held for sale impairment model, an impairment charge is recognized if the carrying amount of the long-lived asset classified as held for sale exceeds its fair value less cost to sell. Because of these two different models, it is possible for a long-lived asset previously classified as held and used to require the recognition of an impairment charge upon classification as held for sale.
International operations
In addition to operating properties in the U.S., we have three operating properties in Canada and one operating property in China. The functional currency for our subsidiaries operating in the U.S. is the U.S. dollar. The functional currencies for our foreign subsidiaries are the local currencies in each respective country. The assets and liabilities of our foreign subsidiaries are translated into U.S. dollars at the exchange rate in effect as of the financial statement date. Revenue and expense accounts of our foreign subsidiaries are translated using the weighted-average exchange rate for the periods presented. Gains or losses resulting from the translation are classified in accumulated other comprehensive income as a separate component of total equity and are excluded from net income.
Whenever a foreign investment meets the criteria for classification as held for sale, we evaluate the recoverability of the investment under the held for sale impairment model. We may recognize an impairment charge if the carrying amount of the investment exceeds its fair value less cost to sell. In determining an investment’s carrying amount, we consider its net book value and any cumulative unrealized foreign currency translation adjustment related to the investment.
The appropriate amounts of foreign exchange rate gains or losses classified in accumulated other comprehensive income are reclassified to net income when realized upon the sale of our investment or upon the complete or substantially complete liquidation of our investment.
Investments
We hold investments in publicly traded companies and privately held entities primarily involved in the life science, technology, and agtech industries. As a REIT, we generally limit our ownership of each individual entity’s voting stock to less than 10%.
Our equity investments (except those accounted for under the equity method and those that result in consolidation of the investee) are measured as follows:
•Investments in publicly traded companies are classified as investments with readily determinable fair values and are presented at fair value in our consolidated balance sheets, with changes in fair value recognized in net income. The fair values for our investments in publicly traded companies are determined based on sales prices or quotes available on securities exchanges.
•Investments in privately held entities without readily determinable fair values fall into two categories:
•Investments in privately held entities that report NAV per share, such as our privately held investments in limited partnerships, are presented at fair value using NAV as a practical expedient, with changes in fair value recognized in net income. We use NAV per share reported by limited partnerships generally without adjustment, unless we are aware of information indicating that the NAV reported by a limited partnership does not accurately reflect the fair value of the investment at our reporting date. We disclose the timing of liquidation of an investee’s assets and the date when redemption restrictions will lapse (or indicate if this timing is unknown) if the investee has communicated this information to us or has announced it publicly.
2. SUMMARY OF SIGNIFICANT ACCOUNTING POLICIES (continued)
•Investments in privately held entities that do not report NAV per share are accounted for using a measurement alternative under which these investments are measured at cost, adjusted for observable price changes and impairments, with changes recognized in net income.
For investments in privately held entities that do not report NAV per share, an observable price arises from an orderly transaction for an identical or similar investment of the same issuer, which is observed by an investor without expending undue cost and effort. Observable price changes result from, among other things, equity transactions of the same issuer executed during the reporting period, including subsequent equity offerings or other reported equity transactions related to the same issuer. To determine whether these transactions are indicative of an observable price change, we evaluate, among other factors, whether these transactions have similar rights and obligations, including voting rights, distribution preferences, and conversion rights to the investments we hold.
We monitor investments in privately held entities that do not report NAV per share throughout the year for new developments, including operating results, prospects and results of clinical trials, new product initiatives, new collaborative agreements, capital-raising events, and merger and acquisition activities. These investments are evaluated on the basis of a qualitative assessment for indicators of impairment by monitoring the presence of the following triggering events or impairment indicators: (i) a significant deterioration in the earnings performance, asset quality, or business prospects of the investee; (ii) a significant adverse change in the regulatory, economic, or technological environment of the investee, (iii) a significant adverse change in the general market condition, including the research and development of technology and products that the investee is bringing or attempting to bring to the market, or (iv) significant concerns about the investee’s ability to continue as a going concern. If such indicators are present, we are required to estimate the investment’s fair value and immediately recognize an impairment charge in an amount equal to the investment’s carrying value in excess of its estimated fair value.
Investments in privately held entities are accounted for under the equity method, unless our interest in the entity is deemed to be so minor that we have virtually no influence over the entity’s operating and financial policies. Under the equity method of accounting, we initially recognize our investment at cost and adjust the carrying amount of the investment to recognize our share of the earnings or losses of the investee subsequent to the date of our investment. We had no non-real estate investments accounted for under the equity method as of December 31, 2020.
We recognize both realized and unrealized gains and losses in our consolidated statements of operations, classified within investment income. Unrealized gains and losses represent changes in fair value for investments in publicly traded companies, changes in NAV, as a practical expedient to estimate fair value, for investments in privately held entities that report NAV per share, and observable price changes on our investments in privately held entities that do not report NAV per share. Impairments are realized losses, which result in an adjusted cost, and represent charges to reduce the carrying values of investments in privately held entities that do not report NAV per share to their estimated fair value. Realized gains and losses represent the difference between proceeds received upon disposition of investments and their historical or adjusted cost.
In April 2019, the FASB issued an accounting standard that amends the financial instruments standard by clarifying that all private investments that do not report NAV per share and are adjusted under the measurement alternative (for observable price changes and impairments) described above represent nonrecurring fair value measurement adjustments and therefore require applicable fair value disclosures, including disclosures about the level of the fair value hierarchy within which the fair value measurements are categorized. The accounting standard became effective for us and was adopted on January 1, 2020. Beginning in 2020, pursuant to the requirements of this new standard, we provide incremental fair value disclosures related to our investments in privately held entities that do not report NAV per share in Note 9 – “Fair value measurements” to our consolidated financial statements.
Revenues
The table below provides detail of our consolidated total revenues for the years ended December 31, 2020 and 2019 (in thousands):
| | | | | | | | | | | | | | |
| | Year Ended December 31, |
| | 2020 | | 2019 |
| Income from rentals: | | | | |
| Revenues subject to the lease accounting standard: | | | | |
| Operating leases | | $ | 1,854,427 | | | $ | 1,465,692 | |
| Direct financing lease | | 2,469 | | | 2,421 | |
| Revenues subject to the lease accounting standard | | 1,856,896 | | | 1,468,113 | |
| Revenues subject to the revenue recognition accounting standard | | 21,312 | | | 48,751 | |
| Income from rentals | | 1,878,208 | | | 1,516,864 | |
| Other income | | 7,429 | | | 14,432 | |
| Total revenues | | $ | 1,885,637 | | | $ | 1,531,296 | |
2. SUMMARY OF SIGNIFICANT ACCOUNTING POLICIES (continued)
During the year ended December 31, 2020, revenues that were subject to the lease accounting standard aggregated $1.9 billion and represented 98.5% of our total revenues. During the year ended December 31, 2020, our total revenues also included $28.7 million, or 1.5%, subject to other accounting guidance. Our other income consisted primarily of construction management fees and interest income earned during the year ended December 31, 2020. For a detailed discussion related to our revenue streams, refer to the “Lease accounting” and “Recognition of revenue arising from contracts with customers” sections within this Note 2 to our consolidated financial statements.
Lease accounting
Transition
On January 1, 2019, we adopted a new lease accounting standard that sets principles for the recognition, measurement, presentation, and disclosure of leases for both parties to a lease agreement (i.e., lessees and lessors). The new lease accounting standard required the use of the modified retrospective transition method. Upon adoption of the new lease accounting standard, we elected the following practical expedients and accounting policies provided by this lease standard:
•Package of practical expedients – required us not to reevaluate our existing or expired leases as of January 1, 2019, under the new lease accounting standard.
•Optional transition method practical expedient – required us to apply the new lease accounting standard prospectively from the adoption date of January 1, 2019.
•Single component accounting policy – required us to account for lease and nonlease components within a lease under the new lease accounting standard if certain criteria are met.
•Land easements practical expedient – required us to continue to account for land easements existing as of January 1, 2019, under the accounting standards applied to them prior to January 1, 2019.
•Short-term lease accounting policy – required us not to record the related lease liabilities and right-of-use assets for operating leases in which we are the lessee with a term of 12 months or less.
Upon adoption of the new lease accounting standard, we elected the package of practical expedients and the optional transition method, which permitted January 1, 2019, to be our initial application date. Our election of the package of practical expedients and the optional transition method allowed us not to reassess:
•Whether any contracts effective prior to January 1, 2019, were leases or contained leases. This practical expedient was primarily applicable to entities that had contracts containing embedded leases. As of December 31, 2018, we had no such contracts; therefore, this practical expedient had no effect on us.
•The lease classification for any leases that commenced prior to January 1, 2019. Our election of the package of practical expedients required us not to revisit the classification of our leases that commenced prior to January 1, 2019. For example, all of our leases that were classified as operating leases in accordance with the lease accounting standards in effect prior to January 1, 2019, continued to be classified as operating leases after adoption of the new lease standard.
•Previously capitalized initial direct costs for any leases that commenced prior to January 1, 2019. Our election of the package of practical expedients and the optional transition method required us not to reassess whether initial direct leasing costs capitalized prior to the adoption of the new lease accounting standard in connection with the leases that commenced prior to January 1, 2019, qualified for capitalization under the new lease accounting standard.
We applied the package of practical expedients consistently to all leases (i.e., in which we were the lessee or the lessor) that commenced before January 1, 2019. The election of this package permitted us to “run off” our leases that commenced before January 1, 2019, for the remainder of their lease terms and to apply the new lease accounting standard to leases commencing or modified after January 1, 2019.
For our leases that commenced prior to January 1, 2019, under the package of practical expedients and optional transition method, we were not required to reassess whether initial direct leasing costs capitalized prior to the adoption of the new lease accounting standard in connection with such leases qualified for capitalization under the new lease accounting standard. Therefore, we continue to amortize these initial direct leasing costs over their respective lease terms.
On January 1, 2019, as required by the new lease accounting standard, we recognized a cumulative adjustment to retained earnings aggregating $3.5 million to write off initial direct leasing costs that were capitalized in connection with leases that were executed but had not commenced before January 1, 2019. These costs were capitalized in accordance with the lease accounting standards existing prior to January 1, 2019, and would not qualify for capitalization under the new lease accounting standard.
2. SUMMARY OF SIGNIFICANT ACCOUNTING POLICIES (continued)
Under the package of practical expedients, all of our operating leases existing as of January 1, 2019, in which we were the lessee, continued to be classified as operating leases subsequent to the adoption of the new lease accounting standard. In accordance with the lease accounting standard adopted on January 1, 2019, we classified the present value of the remaining future rental payments associated with these operating leases in our consolidated balance sheets. Consequently, on January 1, 2019, we recognized a lease liability aggregating $218.7 million, which represented the present value of the remaining future rental payments aggregating $590.3 million related to our ground and office leases, in which we were the lessee, existing as of January 1, 2019.
This liability was classified within accounts payable, accrued expenses, and other liabilities in our consolidated balance sheets and included approximately $27.0 million reclassified out of the deferred rent liabilities balance in accordance with the new lease standard. We have also recognized a corresponding right-of-use asset, which was classified within other assets in our consolidated balance sheets. The present value of the remaining lease payments was calculated for each operating lease existing as of January 1, 2019, in which we were the lessee by using each respective remaining lease term and a corresponding estimated incremental borrowing rate. The incremental borrowing rate is the interest rate that we estimated we would have to pay to borrow on a collateralized basis over a similar term for an amount equal to the lease payments.
Subsequent application of the new lease accounting standard
Definition of a lease
When we enter into a contract or amend an existing contract, we evaluate whether the contract meets the definition of a lease. To meet the definition of a lease, the contract must meet all three criteria:
(i)One party (lessor) must hold an identified asset;
(ii)The counterparty (lessee) must have the right to obtain substantially all of the economic benefits from the use of the asset throughout the period of the contract; and
(iii)The counterparty (lessee) must have the right to direct the use of the identified asset throughout the period of the contract.
Lease classification
The criteria to determine whether a lease should be accounted for as a finance lease for lessees or a sales-type lease for lessors include any of the following:
(i)Ownership is transferred from lessor to lessee by the end of the lease term;
(ii)An option to purchase is reasonably certain to be exercised;
(iii)The lease term is for the major part of the underlying asset’s remaining economic life;
(iv)The present value of lease payments equals or exceeds substantially all of the fair value of the underlying asset; or
(v)The underlying asset is specialized and is expected to have no alternative use at the end of the lease term.
If any of these criteria is met, a lease is classified as a finance lease by the lessee and as a sales-type lease by the lessor. If none of the criteria are met, a lease is classified as an operating lease by the lessee but may still qualify as a direct financing lease or an operating lease for the lessor. The existence of a residual value guarantee from an unrelated third party other than the lessee may qualify the lease as a direct financing lease by the lessor. Otherwise, the lease is classified as an operating lease by the lessor. Therefore, lessees apply a dual approach by classifying leases as either finance or operating leases based on the principle of whether the lease is effectively a financed purchase of the leased asset by the lessee. This classification will determine whether the lease expense is recognized based on an effective interest method or on a straight-line basis over the term of the lease, which corresponds to a similar evaluation performed by lessors.
Lessor accounting
Costs to execute leases
We capitalize initial direct costs, which represent only incremental costs of a lease that would not have been incurred if the lease had not been obtained. Costs that we incur to negotiate or arrange a lease, regardless of its outcome, such as for fixed employee compensation, tax, or legal advice to negotiate lease terms, and other costs, are expensed as incurred.
2. SUMMARY OF SIGNIFICANT ACCOUNTING POLICIES (continued)
Operating leases
We account for the revenue from our lease contracts by utilizing the single component accounting policy. This policy requires us to account for, by class of underlying asset, the lease component and nonlease component(s) associated with each lease as a single component if two criteria are met:
(i)The timing and pattern of transfer of the lease component and the nonlease component(s) are the same; and
(ii)The lease component would be classified as an operating lease if it were accounted for separately.
Lease components consist primarily of fixed rental payments, which represent scheduled rental amounts due under our leases, and contingent rental payments. Nonlease components consist primarily of tenant recoveries representing reimbursements of rental operating expenses under our triple net lease structure, including recoveries for utilities, repairs and maintenance, and common area expenses.
If the lease component is the predominant component, we account for all revenues under such lease as a single component in accordance with the lease accounting standard. Conversely, if the nonlease component is the predominant component, all revenues under such lease are accounted for in accordance with the revenue recognition accounting standard. Our operating leases qualify for the single component accounting, and the lease component in each of our leases is predominant. Therefore, we account for all revenues from our operating leases under the lease accounting standard and classify these revenues as income from rentals in our consolidated statements of operations.
We commence recognition of income from rentals related to the operating leases at the date the property is ready for its intended use by the tenant and the tenant takes possession or controls the physical use of the leased asset. Income from rentals related to fixed rental payments under operating leases is recognized on a straight-line basis over the respective operating lease terms. We classify amounts expected to be received in later periods as deferred rent in our consolidated balance sheets. Amounts received currently but recognized as revenue in future periods are classified in accounts payable, accrued expenses, and other liabilities in our consolidated balance sheets.
Income from rentals related to variable payments includes tenant recoveries, and contingent rental payments. Tenant recoveries, including reimbursements of utilities, repairs and maintenance, common area expenses, real estate taxes and insurance, and other operating expenses, are recognized as revenue in the period during which the applicable expenses are incurred and the tenant’s obligation to reimburse us arises. Income from rentals related to other variable payments is recognized when associated contingencies are removed.
We assess collectibility from our tenants of future lease payments for each of our operating leases. If we determine that collectibility is probable, we recognize income from rentals based on the methodology described above. If we determine that collectibility is not probable, we recognize an adjustment to lower our income from rentals. Furthermore, we may recognize a general allowance at a portfolio level (not the individual level), if we do not expect to collect future lease payments in full.
Due to the uncertainties posed to the business and operations of our tenants by the COVID-19 pandemic, during the three months ended March 31, 2020, we recognized an adjustment aggregating $1.6 million to lower our income from rentals and deferred rent related to certain leases where we determined that the collection of future lease payments was not probable. For these leases, we ceased the recognition of income from rentals on a straight-line basis and began the recognition of income from rentals on a cash basis as lease payments are collected. We will not resume straight-line recognition of income from rentals for these leases until we determine that collectibility of future payments related to these leases is probable. During the three months ended June 30, 2020, September 30, 2020, and December 31, 2020, no further adjustments were required.
During the year ended December 31, 2020, we also recorded a general allowance aggregating $3.8 million, which was primarily incurred and recognized during the three months ended March 31, 2020, for a pool of deferred rent balances, which at the portfolio level (not the individual level) was not expected to be collected in full through the lease term. We recorded the general allowance as a reduction of our income from rentals and deferred rent balance within our consolidated statements of operations and consolidated balance sheets, respectively.
Direct financing and sales-type leases
As of December 31, 2020, we had one direct financing lease and no sales-type leases. Income from rentals related to our direct financing lease is recognized over the lease term using the effective interest rate method. At lease commencement, we record an asset within other assets in our consolidated balance sheets, which represents our net investment in the direct financing lease. This initial net investment is determined by aggregating the total future lease payments attributable to the direct financing lease and the estimated residual value of the property less unearned income. Over the lease term, the investment in the direct financing lease is reduced and rental income is recognized as income from rentals in our consolidated statements of operations, producing a constant periodic rate of return on the net investment in the direct financing lease.
2. SUMMARY OF SIGNIFICANT ACCOUNTING POLICIES (continued)
We evaluate our net investment in the direct financing lease for impairment under the new current expected credit loss standard that we adopted on January 1, 2020. For more information, refer to the “Allowance for credit losses” section within this Note 2 to our consolidated financial statements.
Lessee accounting
We have operating lease agreements in which we are the lessee consisting of ground and office leases. At the lease commencement date (or at the acquisition date if the lease is acquired as part of a real estate acquisition), we are required to recognize a liability to account for our future obligations under these operating leases, and a corresponding right-of-use asset.
The lease liability is measured based on the present value of the future lease payments, including payments during the term under our extension options that we are reasonably certain to exercise. The present value of the future lease payments is calculated for each operating lease using each respective remaining lease term and a corresponding estimated incremental borrowing rate, which is the interest rate that we estimate we would have to pay to borrow on a collateralized basis over a similar term for an amount equal to the lease payments. Subsequently, the lease liability is accreted by applying a discount rate established at the lease commencement date to the lease liability balance as of the beginning of the period and is reduced by the payments made during the period. We classify the operating lease liability in accounts payable, accrued expenses, and other liabilities in our consolidated balance sheets.
The right-of-use asset is measured based on the corresponding lease liability, adjusted for initial direct leasing costs and any other consideration exchanged with the landlord prior to the commencement of the lease, as well as adjustments to reflect favorable or unfavorable terms of an acquired lease when compared with market terms at the time of acquisition. Subsequently, the right-of-use asset is amortized on a straight-line basis during the lease term. We classify the right-of-use asset in other assets in our consolidated balance sheets.
Recognition of revenue arising from contracts with customers
We recognize revenues associated with transactions arising from contracts with customers, excluding revenues subject to the lease accounting standard discussed in the “Lease accounting” section above, in accordance with the revenue recognition accounting standard. A customer is distinguished from a noncustomer by the nature of the goods or services that are transferred. Customers are provided with goods or services that are generated by a company’s ordinary output activities, whereas noncustomers are provided with nonfinancial assets that are outside of a company’s ordinary output activities.
We generally recognize revenue representing the transfer of goods and services to customers in an amount that reflects the consideration to which we expect to be entitled in the exchange. In order to determine the recognition of revenue from customer contracts, we use a five-step model to (i) identify the contract with the customer, (ii) identify the performance obligations in the contract, (iii) determine the transaction price, including variable consideration to the extent that it is probable that a significant future reversal will not occur, (iv) allocate the transaction price to the performance obligations in the contract, and (v) recognize revenue when (or as) we satisfy the performance obligation.
We identify contractual performance obligations and determine whether revenue should be recognized at a point in time or over time, based on when control of goods and services transfers to a customer. We consider whether we control the goods or services prior to the transfer to the customer in order to determine whether we should account for the arrangement as a principal or agent. If we determine that we control the goods or services provided to the customer, then we are the principal to the transaction, and we recognize the gross amount of consideration expected in the exchange. If we simply arrange but do not control the goods or services being transferred to the customer, then we are considered to be an agent to the transaction, and we recognize the net amount of consideration we are entitled to retain in the exchange.
Total revenues subject to the revenue recognition accounting standard and classified within income from rentals in our consolidated statements of operations for the year ended December 31, 2020, included $21.3 million primarily related to short-term parking revenues associated with long-term lease agreements. During the year ended December 31, 2019, revenues subject to the revenue recognition accounting standard and classified within income from rentals in our consolidated statements of operations were $48.8 million primarily related to short-term parking revenues associated with long-term lease agreements and revenues generated from our transient parking, retail tenants, and amenities. Short-term parking revenues do not qualify for the single lease component practical expedient, discussed in the “Lessor accounting” subsection of the “Lease accounting” section within this Note 2, due to the difference in the timing and pattern of transfer of our parking service obligations and associated lease components within the same lease agreement. We recognize short-term parking revenues in accordance with the revenue recognition accounting standard when the service is provided and the performance obligation is satisfied, which normally occurs at a point in time.
2. SUMMARY OF SIGNIFICANT ACCOUNTING POLICIES (continued)
Monitoring of tenant credit quality
During the term of each lease, we monitor the credit quality and any related material changes of our tenants by (i) monitoring the credit rating of tenants that are rated by a nationally recognized credit rating agency, (ii) reviewing financial statements of the tenants that are publicly available or that are required to be delivered to us pursuant to the applicable lease, (iii) monitoring news reports regarding our tenants and their respective businesses, and (iv) monitoring the timeliness of lease payments.
Allowance for credit losses
On January 1, 2020, we adopted an accounting standard (further clarified in subsequently issued updates) that requires companies to estimate and recognize lifetime expected losses, rather than incurred losses, which results in the earlier recognition of credit losses even if the expected risk of credit loss is remote. The accounting standard applies to most financial assets measured at amortized cost and certain other instruments, including trade and other receivables, loans, held-to-maturity debt securities, net investments in leases arising from sales-type and direct financing leases, and off-balance-sheet credit exposures (e.g., loan commitments). The standard does not apply to the receivables arising from operating leases. An assessment of the collectibility of operating lease payments and the recognition of an adjustment to lease income based on this assessment is governed by the lease accounting standard discussed in the “Lease accounting” section earlier within this Note 2 to our consolidated financial statements.
Upon adoption of the accounting standard, we had one lease subject to this standard classified as a direct financing lease with a net investment balance aggregating $39.9 million prior to the credit loss adjustment. In this direct financing lease, the payment obligation of the lessee is collateralized by real estate property. Historically, we have had no collection issues related to this direct financing lease; therefore, we assessed the probability of default on this lease based on the lessee’s financial condition, credit rating, business prospects, remaining lease term, and expected value of the underlying collateral upon its repossession. Based on the aforementioned considerations, we estimated a credit loss adjustment related to this direct financing lease aggregating $2.2 million, which was recognized as a cumulative adjustment to retained earnings and as a reduction of the investment in the direct financing lease balance from $39.9 million to $37.7 million in our consolidated balance sheets on January 1, 2020. Subsequent to the initial recognition, at each reporting date we recognize a credit loss adjustment, if necessary, for our current estimate of expected credit losses, which is classified within rental operations in our consolidated statements of operations. For further details, refer to Note 5 – “Leases” to our consolidated financial statements.
In addition to our direct financing lease, the accounting standard on credit losses applies to our receivables that result from revenue transactions within the scope of the revenue recognition accounting standard discussed in the “Recognition of revenue arising from contracts with customers” section earlier within this Note 2. Upon adoption of the standard on January 1, 2020, our receivables resulting from revenue transactions within the scope of revenue recognition accounting standard aggregated $16.1 million. Among other factors, we considered the short-term nature of these receivables, our positive assessment of the financial condition and business prospects of the payors, and minimal historical collectibility issues. Based on the aforementioned considerations, we estimated the credit loss related to our trade receivables to approximate $259 thousand, which was recognized as a cumulative adjustment to retained earnings and as a reduction of the trade receivables balance in our consolidated balance sheets on January 1, 2020.
Income taxes
We are organized and operate as a REIT pursuant to the Internal Revenue Code (the “Code”). Under the Code, a REIT that distributes at least 90% of its REIT taxable income to its stockholders annually (excluding net capital gains) and meets certain other conditions is not subject to federal income tax on its distributed taxable income, but could be subject to certain federal, foreign, state, and local taxes. We distribute 100% of our taxable income annually; therefore, a provision for federal income taxes is not required. In addition to our REIT returns, we file federal, foreign, state, and local tax returns for our subsidiaries. We file with jurisdictions located in the U.S., Canada, India, China, and other international locations. Our tax returns are subject to routine examination in various jurisdictions for the 2014 through 2019 calendar years.
Employee and non-employee share-based payments
We have implemented an entity-wide accounting policy to account for forfeitures of share-based awards granted to employees and non-employees when they occur. As a result of this policy, we recognize expense on share-based awards with time-based vesting conditions without reductions for an estimate of forfeitures. This accounting policy only applies to service condition awards. For performance condition awards, we continue to assess the probability that such conditions will be achieved. Expenses related to forfeited awards are reversed as forfeitures occur. In addition, all nonforfeitable dividends paid on share-based payment awards are initially classified in retained earnings and reclassified to compensation cost only if forfeitures of the underlying awards occur. Our employee and non-employee share-based awards are measured on the grant date and recognized over the recipient’s required service period.
2. SUMMARY OF SIGNIFICANT ACCOUNTING POLICIES (continued)
Forward equity sales agreements
We account for our forward equity sales agreements in accordance with the accounting guidance governing financial instruments and derivatives. As of December 31, 2020, none of our forward equity sales agreements were deemed to be liabilities as they did not embody obligations to repurchase our shares, nor did they embody obligations to issue a variable number of shares for which the monetary value was predominantly fixed, varied with something other than the fair value of our shares, or varied inversely in relation to our shares. We also evaluated whether the agreements met the derivatives and hedging guidance scope exception to be accounted for as equity instruments and concluded that the agreements can be classified as equity contracts based on the following assessment: (i) none of the agreements’ exercise contingencies were based on observable markets or indices besides those related to the market for our own stock price and operations; and (ii) none of the settlement provisions precluded the agreements from being indexed to our own stock.
Issuer and guarantor subsidiaries of guaranteed securities
In March 2020, the SEC issued an amendment to existing guidance to reduce and simplify financial disclosure requirements for issuers and guarantors of registered debt offerings. The guidance became effective for filings on or after January 4, 2021, with early adoption permitted. Upon evaluation of the guidance, we elected to early adopt the amendment during the three months ended March 31, 2020.
Generally, a parent entity must provide separate subsidiary issuer or guarantor financial statements, unless it qualifies for disclosure exceptions provided in the amendment. Under the previous guidance, a parent entity was required to fully own the subsidiary issuer or guarantor and guarantee its registered security fully and unconditionally to qualify for disclosure exceptions. Pursuant to the amendment, a parent entity may be eligible for disclosure exceptions if it meets the following criteria:
•The subsidiary issuer or guarantor is a consolidated subsidiary of the parent company, and
•The subsidiary issues a registered security that is:
•Issued jointly and severally with the parent company, or
•Fully and unconditionally guaranteed by the parent company.
A parent entity that meets the above criteria may instead present summarized financial information (“alternative disclosures”). We evaluated the criteria and determined that we are eligible for the disclosure exceptions, which allow us to provide alternative disclosures.
The amendment also allows for further simplification of disclosure requirements for entities that qualify for the alternative disclosures. A parent entity was previously required to provide disclosures within the footnotes to the consolidated financial statements. However, the amendment allows for such disclosures to be provided outside of the consolidated financial statements, including within the “Management’s discussion and analysis of financial condition and results of operations” section under Item 7 in this annual report on Form 10-K. As such, our disclosures are no longer presented in our consolidated financial statements and have been relocated to the “Management’s discussion and analysis of financial condition and results of operations” section in Item 7 in this annual report on Form 10-K.
Loan fees
Fees incurred in obtaining long-term financing are capitalized and classified with the corresponding debt instrument appearing on our consolidated balance sheet. Loan fees related to our unsecured senior line of credit are classified within other assets. Capitalized amounts are amortized over the term of the related loan, and the amortization is classified in interest expense in our consolidated statements of operations.
Joint venture distributions
We use the “nature of the distribution” approach to determine the classification within our statement of cash flows of cash distributions received from equity method investments, including our unconsolidated joint ventures. Under this approach, distributions are classified based on the nature of the underlying activity that generated the cash distributions. If we lack the information necessary to apply this approach in the future, we will be required to apply the “cumulative earnings” approach as an accounting change on a retrospective basis. Under the cumulative earnings approach, distributions up to the amount of cumulative equity in earnings recognized are classified as cash inflows from operating activities, and those in excess of that amount are classified as cash inflows from investing activities.
2. SUMMARY OF SIGNIFICANT ACCOUNTING POLICIES (continued)
Restricted cash
We present cash and cash equivalents separately from restricted cash within our consolidated balance sheets. We include restricted cash with cash and cash equivalents when reconciling the beginning-of-period and end-of-period total amounts shown in the consolidated statements of cash flows. We provide a reconciliation between the balance sheets and statements of cash flows, as required when the balance includes more than one line item for cash, cash equivalents, and restricted cash. We also provide a disclosure of the nature of the restrictions related to material restricted cash balances.
3. INVESTMENTS IN REAL ESTATE
Our consolidated investments in real estate, including real estate assets held for sale as described in Note 18 – “Assets classified as held for sale” to our consolidated financial statements, consisted of the following as of December 31, 2020 and 2019 (in thousands):
| | | | | | | | | | | | | | |
| | December 31, |
| | 2020 | | 2019 |
| Rental properties: | | | | |
| Land (related to rental properties) | | $ | 2,550,571 | | | $ | 2,225,785 | |
| Buildings and building improvements | | 13,364,561 | | | 11,775,132 | |
| Other improvements | | 1,508,776 | | | 1,277,862 | |
| Rental properties | | 17,423,908 | | | 15,278,779 | |
| Development and redevelopment of new Class A properties: | | | | |
Development and redevelopment projects | | 3,075,453 | | | 2,057,084 | |
| Future development projects | | 738,994 | | | 182,746 | |
| Gross investments in real estate | | 21,238,355 | | | 17,518,609 | |
Less: accumulated depreciation | | (3,178,024) | | | (2,704,657) | |
Net investments in real estate – North America | | 18,060,331 | | | 14,813,952 | |
Net investments in real estate – Asia | | 32,041 | | | 30,086 | |
Investments in real estate | | $ | 18,092,372 | | | $ | 14,844,038 | |
3. INVESTMENTS IN REAL ESTATE (continued)
Acquisitions
Our real estate asset acquisitions during the year ended December 31, 2020, consisted of the following (dollars in thousands):
| | | | | | | | | | | | | | | | | | | | | | | | | | | | | | | | | | | | | | | | | |
| | | | Square Footage | | | |
| Market | | Number of Properties | | Future Development | | Active Redevelopment | | Operating With Future Development/Redevelopment | | Operating | | Purchase Price | |
| Greater Boston | | 7 | | 1,890,000 | | | — | | | 710,779 | | | 752,784 | | | $ | 830,576 | | |
| San Francisco | | 10 | | 960,000 | | | — | | | 403,699 | | | 686,320 | | | 399,198 | | (1) |
| San Diego | | 7 | | 1,149,000 | | | — | | | 383,525 | | | 334,913 | | | 412,448 | | |
| Seattle | | — | | — | | | — | | | — | | | — | | | — | | |
| Maryland | | 1 | | — | | | 169,420 | | | — | | | — | | | 43,000 | | |
| Research Triangle | | 16 | | — | | | 652,381 | | | 100,145 | | | 1,485,621 | | | 590,412 | | |
| Other | | 14 | | 1,082,713 | | | 277,750 | | | 164,656 | | | 570,952 | | | 287,768 | | |
Year ended December 31, 2020 | | 55 | | 5,081,713 | | | 1,099,551 | | | 1,762,804 | | | 3,830,590 | | | $ | 2,563,402 | | (2) |
(1)In January 2020, we formed a real estate joint venture with subsidiaries of Boston Properties, Inc. Amount excludes our partner’s contributed real estate assets with a total fair market value of $350.0 million. Refer to Note 4 – “Consolidated and unconsolidated real estate joint ventures” to our consolidated financial statements for additional information.
(2)Represents the aggregate contractual purchase price of our acquisitions, which differ from purchases of real estate in our consolidated statements of cash flows due to closing costs and other acquisition adjustments such as prorations of rents and expenses.
Based upon our evaluation of each acquisition, we determined that substantially all of the fair value related to each acquisition is concentrated in a single identifiable asset or a group of similar identifiable assets, or is associated with a land parcel with no operations. Accordingly, each transaction did not meet the definition of a business and therefore was accounted for as an asset acquisition. In each of these transactions, we allocated the total consideration for each acquisition to the individual assets and liabilities acquired on a relative fair value basis.
During the year ended December 31, 2020, we acquired 55 properties for an aggregate purchase price of $2.6 billion. In connection with our acquisitions, we recorded in-place leases aggregating $286.1 million and below-market leases in which we are the lessor aggregating $151.1 million. As of December 31, 2020, the weighted-average amortization period remaining on our in-place and below-market leases acquired during the year ended December 31, 2020, was 8.0 years and 10.1 years, respectively, and 8.8 years in total.
For the discussion of our formation of consolidated real estate joint venture, refer to the “Formation of consolidated real estate joint ventures, impairment of an unconsolidated real estate joint venture, and sales of partial interests” section in Note 4 – “Consolidated and unconsolidated real estate joint ventures” to our consolidated financial statements.
Real estate assets acquired in January 2021
In January 2021, we acquired 401 Park Drive, 201 Brookline Avenue, and one future development opportunity, aggregating 1.8 million SF, located in the heart of our Greater Boston life science cluster market, for a purchase price of $1.48 billion. The future collaborative life science campus consists of an operating property with a future redevelopment opportunity at 401 Park Drive, aggregating 973,145 RSF, an active development at 201 Brookline Avenue aggregating 510,116 RSF, and a future development opportunity for one office/laboratory building for which we are pursuing net new entitlement rights totaling approximately 400,000 SF. Achievement of entitlement rights greater than 305,000 SF will increase our purchase price by a maximum of $97.9 million.
In January 2021, we also completed the acquisitions of three properties for an aggregate purchase price of $118.9 million, comprising 345,678 RSF of operating properties and active redevelopment strategically located across multiple markets.
Acquired below-market leases
The balances of acquired below-market tenant leases existing as of December 31, 2020 and 2019, and related accumulated amortization, classified in accounts payable, accrued expenses, and other liabilities in our consolidated balance sheets as of December 31, 2020 and 2019, were as follows (in thousands):
| | | | | | | | | | | | | | |
| | December 31, |
| | 2020 | | 2019 |
| Acquired below-market leases | | $ | 477,377 | | | $ | 326,255 | |
| Accumulated amortization | | (189,302) | | | (131,482) | |
| | $ | 288,075 | | | $ | 194,773 | |
3. INVESTMENTS IN REAL ESTATE (continued)
For the years ended December 31, 2020, 2019, and 2018, we recognized in rental revenues approximately $57.8 million, $30.3 million, and $22.3 million, respectively, related to the amortization of acquired below-market leases existing as of the end of each respective year.
The weighted-average amortization period of the value of acquired below-market leases existing as of December 31, 2020, was approximately 5.6 years, and the estimated annual amortization of the value of acquired below-market leases as of December 31, 2020, is as follows (in thousands):
| | | | | | | | |
| Year | | Amount |
| 2021 | | $ | 42,002 | |
| 2022 | | 34,847 | |
| 2023 | | 31,112 | |
| 2024 | | 28,094 | |
| 2025 | | 24,788 | |
| Thereafter | | 127,232 | |
| Total | | $ | 288,075 | |
Acquired in-place leases
The balances of acquired in-place leases, and related accumulated amortization, classified in other assets in our consolidated balance sheets as of December 31, 2020 and 2019, were as follows (in thousands):
| | | | | | | | | | | | | | |
| | December 31, |
| | 2020 | | 2019 |
| Acquired in-place leases | | $ | 712,380 | | | $ | 426,280 | |
| Accumulated amortization | | (250,056) | | | (144,630) | |
| | $ | 462,324 | | | $ | 281,650 | |
Amortization for these intangible assets, classified in depreciation and amortization expense in our consolidated statements of operations, was approximately $105.4 million, $49.1 million, and $34.3 million for the years ended December 31, 2020, 2019, and 2018, respectively. The weighted-average amortization period of the value of acquired in-place leases was approximately 8.1 years, and the estimated annual amortization of the value of acquired in-place leases as of December 31, 2020, is as follows (in thousands):
| | | | | | | | |
| Year | | Amount |
| 2021 | | $ | 101,193 | |
| 2022 | | 70,441 | |
| 2023 | | 57,368 | |
| 2024 | | 43,174 | |
| 2025 | | 35,747 | |
| Thereafter | | 154,401 | |
| Total | | $ | 462,324 | |
Sales of real estate assets
During the year ended December 31, 2020, we sold partial interests in the following properties: (i) 681, 685, and 701 Gateway Boulevard in our South San Francisco submarket during the three months ended March 31, 2020, (ii) 9808 and 9868 Scranton Road in our Sorrento Mesa submarket during the three months ended June 30, 2020, and (iii) 1201 and 1208 Eastlake Avenue East and 199 East Blaine Street in our Lake Union submarket during the three months ended December 31, 2020. For the discussion of our sales of partial interests, refer to the “Formation of consolidated real estate joint ventures, impairment of an unconsolidated real estate joint venture, and sales of partial interests” section in Note 4 – “Consolidated and unconsolidated real estate joint ventures” to our consolidated financial statements.
510 Townsend Street and 505 Brannan Street
In November 2020, we completed the sale of two tech office properties aggregating 443,479 RSF at 510 Townsend Street and 505 Brannan Street in our SoMa submarket for an aggregate sales price of $560.2 million and recognized a gain of $151.9 million.
3. INVESTMENTS IN REAL ESTATE (continued)
Impairment charges
During the year ended December 31, 2020, we recognized impairment charges aggregating $48.1 million, primarily including:
•Impairment charges aggregating $15.2 million, which primarily consisted of a $10 million write-off of the pre-acquisition deposit for a previously pending acquisition of an operating tech office property for which our revised economic projections declined from our initial underwriting. We recognized this impairment charge in April 2020 concurrently with the submission of our notice to terminate the transaction.
•Impairment charge of $13.5 million recognized during the three months ended December 31, 2020, upon classification of our real estate assets located at 260 Townsend Street in our SoMa submarket as held for sale. We expect to sell this real estate asset during 2021.
•Impairment charge of $11.7 million recognized during the three months ended December 31, 2020, upon classification of our real estate asset located at 220 and 240 2nd Avenue South in our SoDo submarket as held for sale. We expect to sell this real estate asset during 2021.
•Impairment charge of $6.8 million recognized during the three months ended September 30, 2020, upon classification of our real estate asset located at 945 Market Street in our SoMa submarket as held for sale. In September 2020, we completed the sale of the real estate asset for a sales price of $198.0 million with no gain or loss.
4. CONSOLIDATED AND UNCONSOLIDATED REAL ESTATE JOINT VENTURES
From time to time, we enter into joint venture agreements through which we own a partial interest in real estate entities that own, develop, and operate real estate properties. As of December 31, 2020, our real estate joint ventures held the following properties:
| | | | | | | | | | | | | | | | | | | | | | | | | | | | | |
| Property | | Market | | Submarket | | Our Ownership Interest(1) |
Consolidated joint ventures(2): | | | | | | | | |
| 225 Binney Street | | Greater Boston | | Cambridge/Inner Suburbs | | | 30.0 | % | |
| 75/125 Binney Street | | Greater Boston | | Cambridge/Inner Suburbs | | | 40.0 | % | |
| 57 Coolidge Avenue | | Greater Boston | | Cambridge/Inner Suburbs | | | 75.0 | % | |
| 409 and 499 Illinois Street | | San Francisco | | Mission Bay | | | 60.0 | % | |
| 1500 Owens Street | | San Francisco | | Mission Bay | | | 50.1 | % | |
| Alexandria Technology Center® – Gateway(3) | | San Francisco | | South San Francisco | | | 45.1 | % | |
| 500 Forbes Boulevard | | San Francisco | | South San Francisco | | | 10.0 | % | |
| Alexandria Point(4) | | San Diego | | University Town Center | | | 55.0 | % | |
| 5200 Illumina Way | | San Diego | | University Town Center | | | 51.0 | % | |
| 9625 Towne Centre Drive | | San Diego | | University Town Center | | | 50.1 | % | |
| SD Tech by Alexandria(5) | | San Diego | | Sorrento Mesa | | | 50.0 | % | |
| The Eastlake Life Science Campus by Alexandria(6) | | Seattle | | Lake Union | | | 30.0 | % | |
| | | | | | | | | |
Unconsolidated joint ventures(2): | | | | | | | | |
| 1655 and 1725 Third Street | | San Francisco | | Mission Bay | | | 10.0 | % | |
| Menlo Gateway | | San Francisco | | Greater Stanford | | | 49.0 | % | |
| 704 Quince Orchard Road | | Maryland | | Gaithersburg | | | 56.8 | % | (7) |
(1)Refer to the table on the next page that shows the categorization of our joint ventures under the consolidation framework.
(2)In addition to the real estate joint ventures listed, various partners hold insignificant noncontrolling interests in five other consolidated joint ventures in North America and we hold an interest in two other insignificant unconsolidated real estate joint ventures in North America.
(3)Excludes 600, 630, 650, 901, and 951 Gateway Boulevard in our South San Francisco submarket.
(4)Excludes 9880 Campus Point Drive in our University Town Center submarket.
(5)Excludes 5505 Morehouse Drive and 10121 and 10151 Barnes Canyon Road in our Sorrento Mesa submarket.
(6)Excludes 1165, 1616, and 1551 Eastlake Avenue East, 188 East Blaine Street, and 1600 Fairview Avenue East in our Lake Union submarket.
(7)Represents our ownership interest; our voting interest is limited to 50%.
Our consolidation policy is fully described under the “Consolidation” section in Note 2 – “Summary of significant accounting policies” to our consolidated financial statements. Consolidation accounting is highly technical, but its framework is primarily based on the controlling financial interests and benefits of the joint ventures.
We generally consolidate a joint venture that is a legal entity that we control (i.e., we have the power to direct the activities of the joint venture that most significantly affect its economic performance) through contractual rights, regardless of our ownership interest, and where we determine that we have benefits through the allocation of earnings or losses and fees paid to us that could be significant to the joint venture (the “VIE model”).
We also generally consolidate joint ventures when we have a controlling financial interest through voting rights and where our voting interest is greater than 50% (the “voting model”). Voting interest differs from ownership interest for some joint ventures.
We account for joint ventures that do not meet the consolidation criteria under the equity method of accounting by recognizing our share of income and losses.
4. CONSOLIDATED AND UNCONSOLIDATED REAL ESTATE JOINT VENTURES (continued)
The table below shows the categorization of our joint ventures under the consolidation framework:
| | | | | | | | | | | | | | | | | | | | | | | | | | | | | |
Property(1) | | Consolidation Model | | Voting Interest | | Consolidation Analysis | | Conclusion |
| | | | | | | | | |
225 Binney Street | | VIE model
| | Not applicable under VIE model | | We have: | | Consolidated |
75/125 Binney Street | | | | (i) | The power to direct the activities of the joint venture that most significantly affect its economic performance; and
| |
| 57 Coolidge Avenue | |
| 409 and 499 Illinois Street | |
| 1500 Owens Street | | |
Alexandria Technology Center® – Gateway | | |
500 Forbes Boulevard | | (ii) | Benefits that can be significant to the joint venture. |
| Alexandria Point | | |
5200 Illumina Way | | Therefore, we are the primary beneficiary of each VIE |
9625 Towne Centre Drive | |
SD Tech by Alexandria | | |
| The Eastlake Life Science Campus by Alexandria | | |
Menlo Gateway | | | We do not control the joint venture and are therefore not the primary beneficiary | Equity method of accounting |
|
704 Quince Orchard Road | | Voting model | | Does not exceed 50% | Our voting interest is 50% or less | |
1655 and 1725 Third Street | |
(1) In addition to the real estate joint ventures listed, various partners hold insignificant noncontrolling interests in five other consolidated joint ventures in North America and we hold an interest in two other insignificant unconsolidated real estate joint ventures in North America.
Formation of consolidated real estate joint ventures, impairment of an unconsolidated real estate joint venture, and sales of partial interests
57 Coolidge Avenue
In July 2020, we formed a real estate joint venture with a local developer and investor to acquire a land parcel aggregating approximately 275,000 SF at 57 Coolidge Avenue in our Cambridge/Inner Suburbs submarket for a contractual purchase price of approximately $32.6 million. Our ownership interest in the joint venture is 75%.
As part of the joint venture agreement, we are responsible for activities that most significantly impact the economic performance of the joint venture. In addition, our joint venture partner lacks kick-out rights over our role as property manager. Therefore, we determined that our joint venture partner does not have a controlling financial interest, and consequently this joint venture should be accounted for as a VIE. We also determined that we are the primary beneficiary of the joint venture because we are responsible for activities that most significantly impact the economic performance of the joint venture, and also have the obligation to absorb losses of or the right to receive benefits from the joint venture that could potentially be significant to the joint venture. Accordingly, we have consolidated the joint venture under the variable interest model.
Refer to the “Consolidation” section in Note 2 – “Summary of significant accounting policies” to our consolidated financial statements for additional information.
Alexandria Technology Center® – Gateway
In January 2020, we formed a real estate joint venture with subsidiaries of Boston Properties, Inc. We currently own 45% of the real estate joint venture and are expecting to increase our ownership to 51%. Our partner contributed three office buildings, aggregating 776,003 RSF, at 601, 611, and 651 Gateway Boulevard, and land supporting 260,000 SF of future development with aggregate fair market value of $350.0 million. We contributed one office building, one office/laboratory building, one amenity building, aggregating 313,262 RSF, at 701, 681, and 685 Gateway Boulevard, respectively, and land supporting 377,000 SF of future development with aggregate fair market value of $281.9 million. This future campus in our South San Francisco submarket will aggregate 1.7 million RSF.
4. CONSOLIDATED AND UNCONSOLIDATED REAL ESTATE JOINT VENTURES (continued)
As part of the joint venture agreement, we are responsible for activities that most significantly impact the economic performance of the joint venture. In addition, our joint venture partner lacks kick-out rights over our role as property manager. Therefore, we determined that our joint venture partner does not have a controlling financial interest, and consequently this joint venture should be accounted for as a VIE. We also determined that we are the primary beneficiary of the joint venture because we are responsible for activities that most significantly impact the economic performance of the joint venture, and also have the obligation to absorb losses of or the right to receive benefits from the joint venture that could potentially be significant to the joint venture. Accordingly, we have consolidated the joint venture under the variable interest model.
We retained controlling interests and the contributed properties remain consolidated in our financial statements; therefore, no adjustments were made to the carrying values of these properties, and no gain was recognized in our consolidated statements of operations. We accounted for this transaction as an equity transaction with an adjustment of $55.8 million to our additional paid-in capital. The carrying amounts of our partner’s share of assets and liabilities are reported at historical cost within a noncontrolling interest balance of our consolidated statement of shareholders’ equity.
Refer to the “Consolidation” section in Note 2 – “Summary of significant accounting policies” to our consolidated financial statements for additional information.
1401/1413 Research Boulevard
In January 2015, we formed a joint venture with a local retail developer and operator by contributing a land parcel located in our Rockville submarket of Maryland. The joint venture developed a retail shopping center aggregating approximately 90,000 RSF, which was primarily funded by a $26.2 million construction loan that is non-recourse to us and matures in May 2021. As of December 31, 2019, our investment in this joint venture was $7.7 million, which primarily consisted of the value of the retail shopping center, and was accounted for under the equity method of accounting as we did not have a controlling interest.
In March 2020, as a result of the impact of COVID-19 pandemic and the State of Maryland’s shelter-in-place orders, which led to the closure of the retail center, and the near-term debt maturity of the secured loan, we evaluated the recoverability of our investment and recognized a $7.6 million impairment charge to lower the carrying amount of our investment balance, which primarily consisted of real estate, to its estimated fair value less costs to sell. The estimated real estate impairment charge reduced our investment balance in the joint venture to zero dollars and was classified in equity in earnings of unconsolidated real estate joint ventures within our consolidated statements of operations for the year ended December 31, 2020.
9808 and 9868 Scranton Road
In April 2020, we completed the sale of properties aggregating 219,628 RSF at 9808 and 9868 Scranton Road in our Sorrento Mesa submarket to the existing SD Tech by Alexandria consolidated real estate joint venture, of which we own 50%. The gross proceeds received from our partner for its 50% interest in the properties were $51.1 million. We continue to control and consolidate this joint venture; therefore, we accounted for the difference between the consideration received and the book value of the interest sold as an equity transaction with no gain recognized in earnings.
The Eastlake Life Science Campus by Alexandria
In November 2020, we completed the sale of a 70% interest in our properties at 1201 and 1208 Eastlake Avenue East and 199 East Blaine Street, aggregating 321,218 RSF, located in our Lake Union submarket, for an aggregate sales price of $314.5 million. We formed a joint venture with the buyer of the partial interest and hold a 30% ownership interest in this joint venture.
As part of the joint venture agreement, we are responsible for activities that most significantly impact the economic performance of the joint venture. In addition, our joint venture partner lacks kick-out rights over our role as property manager. Therefore, we determined that our joint venture partner does not have a controlling financial interest, and consequently this joint venture should be accounted for as a VIE. We also determined that we are the primary beneficiary of the joint venture because we are responsible for activities that most significantly impact the economic performance of the joint venture, and also have the obligation to absorb losses of or the right to receive benefits from the joint venture that could potentially be significant to the joint venture. Accordingly, we have consolidated the joint venture under the variable interest model.
We determined that we have a controlling interest in the joint venture, and therefore we continue to consolidate these properties. Accordingly, we accounted for the difference between consideration received and the book value of the interest sold as an equity financing transaction and recorded $211.3 million as an adjustment to additional paid-in capital, with no gain recognized in earnings. This transaction did not qualify as a sale of real estate and did not result in purchase accounting adjustment to the carrying value. Accordingly, the carrying amounts of our partner’s share of assets and liabilities are reported at historical cost within a noncontrolling interest balance of our consolidated statement of shareholders’ equity.
Refer to the “Consolidation” section in Note 2 – “Summary of significant accounting policies” to our consolidated financial statements for additional information.
4. CONSOLIDATED AND UNCONSOLIDATED REAL ESTATE JOINT VENTURES (continued)
Consolidated VIEs’ balance sheet information
The table below aggregates the balance sheet information of our consolidated VIEs as of December 31, 2020 and 2019 (in thousands):
| | | | | | | | | | | | | | |
| | December 31, |
| | 2020 | | 2019 |
| Investments in real estate | | $ | 3,196,215 | | | $ | 2,678,476 | |
| Cash and cash equivalents | | 95,565 | | | 81,021 | |
| Other assets | | 341,524 | | | 280,343 | |
| Total assets | | $ | 3,633,304 | | | $ | 3,039,840 | |
| | | | |
| Secured notes payable | | $ | — | | | $ | — | |
| Other liabilities | | 183,237 | | | 149,471 | |
| Total liabilities | | 183,237 | | | 149,471 | |
| Redeemable noncontrolling interests | | 1,731 | | | 2,388 | |
| Alexandria Real Estate Equities, Inc.’s share of equity | | 1,742,039 | | | 1,600,729 | |
| Noncontrolling interests’ share of equity | | 1,706,297 | | | 1,287,252 | |
| Total liabilities and equity | | $ | 3,633,304 | | | $ | 3,039,840 | |
| | | | |
In determining whether to aggregate the balance sheet information of consolidated VIEs, we considered the similarity of each VIE, including the primary purpose of these entities to own, manage, operate, and lease real estate properties owned by the VIEs, and the similar nature of our involvement in each VIE as a managing member. Due to the similarity of the characteristics, we present the balance sheet information of these entities on an aggregated basis. None of our consolidated VIEs’ assets have restrictions that limit their use to settle specific obligations of the VIE. There are no creditors or other partners of our consolidated VIEs that have recourse to our general credit. Our maximum exposure to our consolidated VIEs is limited to our variable interests in each VIE.
Unconsolidated real estate joint ventures
Our maximum exposure to our unconsolidated VIEs is limited to our investment in each VIE. Our investments in unconsolidated real estate joint ventures, accounted for under the equity method of accounting presented in our consolidated balance sheets of December 31, 2020 and 2019, consisted of the following (in thousands):
| | | | | | | | | | | | | | |
| | December 31, |
| Property | | 2020 | | 2019 |
Menlo Gateway | | $ | 300,622 | | $ | 288,408 |
704 Quince Orchard Road | | 4,961 | | 4,748 |
1655 and 1725 Third Street | | 14,939 | | 37,016 |
Other | | 11,827 | | 16,718 |
| | $ | 332,349 | | $ | 346,890 |
Our unconsolidated real estate joint ventures have the following secured loans that include the following key terms as of December 31, 2020 (dollars in thousands):
| | | | | | | | | | | | | | | | | | | | | | | | | | | | | | | | | | | | | | | | | | | | | | | |
| Unconsolidated Joint Venture | | Our Share | | Maturity Date | | Stated Rate | | Interest Rate(1) | | Debt Balance at 100%(2) | |
| 704 Quince Orchard Road | | 56.8% | | | 3/16/23 | | | L+1.95% | | | 3.22% | (3) | | $ | 12,660 | | |
| 1655 and 1725 Third Street | | 10.0% | | | 3/10/25 | | | 4.50% | | | 4.57% | | | 598,232 | | |
| Menlo Gateway, Phase II | | 49.0% | | | 5/1/35 | | | 4.53% | | | 4.59% | | | 155,942 | | |
| Menlo Gateway, Phase I | | 49.0% | | | 8/10/35 | | | 4.15% | | | 4.18% | | | 139,558 | | |
| | | | | | | | | | | | | | $ | 906,392 | | |
(1)Includes interest expense and amortization of loan fees.
(2)Represents outstanding principal, net of unamortized deferred financing costs, as of December 31, 2020.
(3)Includes a 1.00% LIBOR floor on the interest rate.
5. LEASES
We are subject to the lease accounting standard that sets principles for the recognition, measurement, presentation, and disclosure of leases for both parties to a lease agreement (i.e., lessees and lessors).
As a lessor, we are required to disclose, among other things, the following:
•A description of the nature of leases, including terms for any variable payments, options to extend or terminate, and options to purchase the underlying asset;
•Tabular presentation of undiscounted cash flows to be received over the next five years and thereafter separately for operating leases and direct financing leases;
•The amount of lease income and its location on the statements of operations;
•Income classified separately for operating leases and direct financing leases; and
•Our risk management strategy to mitigate declines in residual value of the leased assets.
As a lessee, we are required to disclose, among other things, the following:
•A description of the nature of leases, including terms for any variable payments, options to extend or terminate, and options to purchase the underlying asset;
•The amounts of lease liabilities and corresponding right-of-use assets and their respective locations in the balance sheet;
•The weighted-average remaining lease term and weighted-average discount rate of leases;
•Tabular presentation of undiscounted cash flows of our remaining lease payment obligations over the next five years and thereafter; and
•Total lease costs, including cash paid, amounts expensed, and amounts capitalized.
Refer to the “Lease accounting” section in Note 2 – “Summary of significant accounting policies” to our consolidated financial statements for additional information.
Leases in which we are the lessor
As of December 31, 2020, we had 338 properties aggregating 31.9 million operating RSF located in key locations, including Greater Boston, San Francisco, New York City, San Diego, Seattle, Maryland, and Research Triangle. We focus on developing Class A properties in AAA innovation cluster locations, which we consider to be highly desirable for tenancy by life science, technology, and agtech entities. Such locations are generally characterized by high barriers to entry for new landlords, high barriers to exit for tenants, and a limited supply of available space. As of December 31, 2020, all leases in which we are the lessor were classified as operating leases with the exception of one direct financing lease. Our operating leases and direct financing lease are described below.
Operating leases
As of December 31, 2020, our 338 properties were subject to operating lease agreements. Two of these properties, representing two land parcels, are subject to lease agreements that each contain an option for the lessee to purchase the underlying asset from us at fair market value during each of the 30-day periods commencing on the dates that are 15 years, 30 years, and 74.5 years after the rent commencement date of October 1, 2017. The remaining lease term related to each of the two land parcels is 71.9 years. Our leases generally contain options to extend lease terms at prevailing market rates at the time of expiration. Certain operating leases contain early termination options that require advance notification and payment of a penalty, which in most cases is substantial enough to be deemed economically disadvantageous by a tenant to exercise. Future lease payments to be received under the terms of our operating lease agreements, excluding expense reimbursements, in effect as of December 31, 2020, are outlined in the table below (in thousands):
| | | | | | | | |
| Year | | Amount |
| 2021 | | $ | 1,234,654 | |
| 2022 | | 1,251,446 | |
| 2023 | | 1,222,980 | |
| 2024 | | 1,114,259 | |
| 2025 | | 1,035,300 | |
| Thereafter | | 6,328,067 | |
| Total | | $ | 12,186,706 | |
Refer to Note 3 – “Investments in real estate” to our consolidated financial statements for additional information about our owned real estate assets, which are the underlying assets under our operating leases.
Direct financing lease
As of December 31, 2020, we had one direct financing lease agreement for a parking structure with a remaining lease term of 71.9 years. The lessee has an option to purchase the underlying asset at fair market value during each of the 30-day periods commencing on the dates that are 15 years, 30 years, and 74.5 years after the rent commencement date of October 1, 2017. The components of net investment in our direct financing lease as of December 31, 2020 and 2019, are summarized in the table below (in thousands):
| | | | | | | | | | | | | | |
| | December 31, |
| | 2020 | | 2019 |
| Gross investment in direct financing lease | | $ | 258,751 | | | $ | 260,457 | |
| Less: unearned income | | (218,072) | | | (220,541) | |
| Less: allowance for credit losses | | (2,839) | | | — | |
| Net investment in direct financing lease | | $ | 37,840 | | | $ | 39,916 | |
On January 1, 2020, we adopted an accounting standard that requires companies to estimate and recognize expected losses, rather than incurred losses, which results in the earlier recognition of credit losses even if the expected risk of credit loss is remote. This new accounting standard applies to our direct financing lease described above. Upon adoption of the new standard on January 1, 2020, we recognized a credit loss adjustment related to this direct financing lease aggregating $2.2 million. During the three months ended March 31, 2020, we updated our assessment of the current estimated credit loss related to this direct financing lease and estimated the loss to increase to $2.8 million as of March 31, 2020. As a result, we recognized an additional credit loss adjustment of $614 thousand classified within rental operations in our consolidated statement of operations for the year ended December 31, 2020. No adjustment to the estimated credit loss balance was required during the three months ended June 30, 2020, September 30, 2020, and December 31, 2020. For further details, refer to the “Allowance for credit losses” section in Note 2 – “Summary of significant accounting policies” to our consolidated financial statements.
Future lease payments to be received under the terms of our direct financing lease as of December 31, 2020, are outlined in the table below (in thousands):
| | | | | | | | |
| Year | | Total |
| 2021 | | $ | 1,756 | |
| 2022 | | 1,809 | |
| 2023 | | 1,863 | |
| 2024 | | 1,919 | |
| 2025 | | 1,976 | |
| Thereafter | | 249,428 | |
| Total | | $ | 258,751 | |
Income from rentals
Our total income from rentals includes revenue related to agreements for the rental of our real estate, which primarily includes revenues subject to the lease accounting standard and revenue recognition accounting standard as shown below (in thousands):
| | | | | | | | | | | | | | |
| | Year Ended December 31, |
| | 2020 | | 2019 |
| Income from rentals: | | | | |
| Revenues subject to the lease accounting standard: | | | | |
| Operating leases | | $ | 1,854,427 | | | $ | 1,465,692 | |
| Direct financing lease | | 2,469 | | | 2,421 | |
| Revenues subject to the lease accounting standard | | 1,856,896 | | | 1,468,113 | |
| Revenues subject to the revenue recognition accounting standard | | 21,312 | | | 48,751 | |
| Income from rentals | | $ | 1,878,208 | | | $ | 1,516,864 | |
Our revenues that are subject to the revenue recognition accounting standard and are classified in income from rentals consist primarily of short-term parking revenues that are not considered lease revenues under the lease accounting standard. Refer to the “Revenues” and “Recognition of revenue arising from contracts with customers” sections in Note 2 – “Summary of significant accounting policies” to our consolidated financial statements for additional information.
During the year ended December 31, 2020, we executed an agreement with Pinterest, Inc. to terminate our contract related to a future lease of 488,899 RSF at our 88 Bluxome Street development project, which has not commenced vertical construction, located in our SoMa submarket. We expect demolition of the existing building at the site prior to the commencement of vertical construction of the project. We received a contract termination fee of $89.5 million and incurred expenses of $3.3 million, resulting in an aggregate termination fee of $86.2 million. The contract termination fee of $89.5 million was classified within income from rentals, and related expenses of $3.3 million were classified within rental operations in our consolidated statements of operations for the year ended December 31, 2020.
Deferred leasing costs
The following table summarizes our deferred leasing costs as of December 31, 2020 and 2019 (in thousands):
| | | | | | | | | | | | | | |
| | December 31, |
| | 2020 | | 2019 |
| Deferred leasing costs | | $ | 679,300 | | | $ | 631,416 | |
| Accumulated amortization | | (406,627) | | | (361,373) | |
| Deferred leasing costs, net | | $ | 272,673 | | | $ | 270,043 | |
Residual value risk management strategy
Our leases do not have guarantees of residual value on the underlying assets. We manage risk associated with the residual value of our leased assets by (i) evaluating each potential acquisition of real estate to determine whether it meets our business objective to invest primarily in high-demand markets with limited supply of available space, (ii) directly managing our leased properties, conducting frequent property inspections, proactively addressing potential maintenance issues before they arise, and timely resolving any occurring issues, (iii) carefully selecting our tenants and monitoring their credit quality throughout their respective lease terms, and (iv) focusing on making continuous improvements to our sustainability efforts and achievement of our sustainability goals for ground-up development of new buildings, which are targeting Gold or Platinum LEED® certification. Our environmentally focused design decisions, careful selection of construction materials, and continuous monitoring of our properties throughout their lives are expected to promote the durability of building infrastructure and enhance residual value of our properties.
Leases in which we are the lessee
Operating lease agreements
We have operating lease agreements in which we are the lessee consisting of ground and office leases. Certain of these leases have options to extend or terminate the contract terms upon meeting certain criteria. There are no notable restrictions or covenants imposed by the leases, nor guarantees of residual value.
We recognize a right-of-use asset, which is classified within other assets in our consolidated balance sheets, and a related liability, which is classified within accounts payable, accrued expenses, and other liabilities in our consolidated balance sheets, to account for our future obligations under ground and office lease arrangements in which we are the lessee. Refer to the “Lessee accounting” subsection of the “Lease accounting” section in Note 2 – “Summary of significant accounting policies” to our consolidated financial statements.
As of December 31, 2020, the present value of the remaining contractual payments aggregating $825.8 million, under our operating lease agreements, including our extension options that we are reasonably certain to exercise, was $345.8 million. Our corresponding operating lease right-of-use assets, adjusted for initial direct leasing costs and other consideration exchanged with the landlord prior to the commencement of the lease, aggregated $335.9 million. As of December 31, 2020, the weighted-average remaining lease term of operating leases in which we are the lessee was approximately 43 years, and the weighted-average discount rate was 4.88%. The weighted-average discount rate is based on the incremental borrowing rate estimated for each lease, which is the interest rate that we estimate we would have to pay to borrow on a collateralized basis over a similar term for an amount equal to the lease payments.
Ground lease obligations as of December 31, 2020, included leases for 36 of our properties, which accounted for approximately 11% of our total number of properties. Excluding one ground lease that expires in 2036 related to one operating property with a net book value of $7.1 million as of December 31, 2020, our ground lease obligations have remaining lease terms ranging from approximately 33 years to 94 years, including extension options that we are reasonably certain to exercise.
The reconciliation of future lease payments, under noncancelable operating ground and office leases in which we are the lessee, to the operating lease liability reflected in our consolidated balance sheet as of December 31, 2020, is presented in the table below (in thousands):
| | | | | | | | |
| Year | | Total |
| 2021 | | $ | 18,903 | |
| 2022 | | 19,915 | |
| 2023 | | 20,088 | |
| 2024 | | 20,334 | |
| 2025 | | 20,364 | |
| Thereafter | | 726,200 | |
| Total future payments under our operating leases in which we are the lessee | | 825,804 | |
| Effect of discounting | | (480,054) | |
| Operating lease liability | | $ | 345,750 | |
Lessee operating costs
Operating lease costs relate to our ground and office leases in which we are the lessee. Ground leases generally require fixed annual rent payments and may also include escalation clauses and renewal options. Our operating lease obligations related to our office leases have remaining terms of up to 14 years, exclusive of extension options. For the years ended December 31, 2020, 2019, and 2018, our costs for operating leases in which we are the lessee were as follows (in thousands):
| | | | | | | | | | | | | | | | | | | | |
| | Year Ended December 31, |
| | 2020 | | 2019 | | 2018 |
| Gross operating lease costs | | $ | 23,518 | | | $ | 19,740 | | | $ | 16,102 | |
| Capitalized lease costs | | (3,529) | | | (1,452) | | | (340) | |
| Expenses for operating leases in which we are the lessee | | $ | 19,989 | | | $ | 18,288 | | | $ | 15,762 | |
| | | | | | |
For the years ended December 31, 2020, 2019, and 2018, amounts paid and classified as operating activities in our consolidated statements of cash flows for leases in which we are the lessee, were $20.8 million, $17.7 million, and $14.8 million, respectively.
6. CASH, CASH EQUIVALENTS, AND RESTRICTED CASH
Cash, cash equivalents, and restricted cash consisted of the following as of December 31, 2020 and 2019 (in thousands):
| | | | | | | | | | | |
| December 31, |
| | 2020 | | 2019 |
| Cash and cash equivalents | $ | 568,532 | | | $ | 189,681 | |
| Restricted cash: | | | |
| Funds held in trust under the terms of certain secured notes payable | 17,256 | | | 24,331 | |
| Funds held in escrow related to construction projects and investing activities | 4,580 | | | 23,252 | |
| Other | 7,337 | | | 5,425 | |
| 29,173 | | | 53,008 | |
| Total | $ | 597,705 | | | $ | 242,689 | |
7. INVESTMENTS
We hold investments in publicly traded companies and privately held entities primarily involved in the life science, technology, and agtech industries, as further described below.
Investments in publicly traded companies
Our investments in publicly traded companies are classified as investments with readily determinable fair values and are presented at fair value in our consolidated balance sheets, with changes in fair value classified in investment income in our consolidated statements of operations.
Investments in privately held companies
Our investments in privately held entities consist of (i) investments in entities that report NAV, and (ii) investments in privately held entities that do not report NAV. These investments are accounted for as follows:
Investments in privately held entities that report NAV
Investments in entities that report NAV, such as our privately held investments in limited partnerships, are presented at fair value using NAV as a practical expedient, with changes in fair value recognized in net income. We use NAV reported by limited partnerships generally without adjustment, unless we are aware of information indicating that the NAV reported by a limited partnership does not accurately reflect the fair value of the investment at our reporting date.
Investments in privately held entities that do not report NAV
Investments in privately held entities that do not report NAV are carried at cost, adjusted for observable price changes and impairments, with changes recognized in net income. These investments continue to be evaluated on the basis of a qualitative assessment for indicators of impairment by utilizing the same monitoring criteria described in the “Investments” section in Note 2 – “Summary of significant accounting policies” to our consolidated financial statements, and by monitoring the presence of the following impairment indicators:
(i)a significant deterioration in the earnings performance, credit rating, asset quality, or business prospects of the investee,
(ii)a significant adverse change in the regulatory, economic, or technological environment of the investee,
(iii)a significant adverse change in the general market condition of either the geographical area or the industry in which the investee operates, and/or
(iv)significant concerns about the investee’s ability to continue as a going concern.
If such indicators are present, we are required to estimate the investment’s fair value and immediately recognize an impairment charge in an amount equal to the investment’s carrying value in excess of its estimated fair value.
Investments in privately held entities are accounted for under the equity method, unless our interest in the entity is deemed to be so minor that we have virtually no influence over the entity’s operating and financial policies. Under the equity method of accounting, we initially recognize our investment at cost and adjust the carrying amount of the investment to recognize our share of the earnings or losses of the investee subsequent to the date of our investment. We had no non-real estate investments accounted for under the equity method as of December 31, 2020.
Investment income/loss recognition and classification
We classify unrealized and realized gains and losses on our investments within investment income in our consolidated statements of operations. Unrealized gains and losses represent:
(i)changes in fair value for investments in publicly traded companies,
(ii)changes in NAV, as a practical expedient to estimate fair value, for investments in privately held entities that report NAV, and/or
(iii)observable price changes of our investments in privately held entities that do not report NAV.
An observable price arises from an orderly transaction for an identical or similar investment of the same issuer. Observable price changes result from, among other things, equity transactions of the same issuer executed during the reporting period, including subsequent equity offerings or other reported equity transactions related to the same issuer. To determine whether these transactions are indicative of an observable price change, we evaluate, among other factors, whether these transactions have similar rights and obligations, including voting rights, distribution preferences, and conversion rights to the investments we hold.
7. INVESTMENTS (continued)
Realized gains and losses represent the difference between proceeds received upon disposition of investments and their historical or adjusted cost. Impairments are realized losses, which result in an adjusted cost, and represent charges to reduce the carrying values of investments in privately held entities that do not report NAV to their estimated fair value.
The following tables summarize our investments as of December 31, 2020, and 2019 (in thousands):
| | | | | | | | | | | | | | | | | |
| December 31, 2020 |
| Cost | | Unrealized
Gains (Losses) | | Carrying Amount |
| Investments: | | | | | |
| Publicly traded companies | $ | 208,754 | | | $ | 351,076 | | | $ | 559,830 | |
| Entities that report NAV | 334,341 | | | 327,741 | | | 662,082 | |
| Entities that do not report NAV: | | | | | |
Entities with observable price changes | 47,545 | | | 96,859 | | | 144,404 | |
Entities without observable price changes | 244,798 | | | — | | | 244,798 | |
| Total investments | $ | 835,438 | | | $ | 775,676 | | | $ | 1,611,114 | |
| | | | | | | | | | | | | | | | | |
| December 31, 2019 |
| Cost | | Unrealized
Gains (Losses) | | Carrying Amount |
| Investments: | | | | | |
| Publicly traded companies | $ | 148,109 | | | $ | 170,528 | | | $ | 318,637 | |
| Entities that report NAV | 271,276 | | | 162,626 | | | 433,902 | |
| Entities that do not report NAV: | | | | | |
Entities with observable price changes | 42,045 | | | 68,489 | | | 110,534 | |
Entities without observable price changes | 277,521 | | | — | | | 277,521 | |
| Total investments | $ | 738,951 | | | $ | 401,643 | | | $ | 1,140,594 | |
Cumulative gains and losses on investments in privately held entities that do not report NAV still held as of December 31, 2020, aggregated to a gain of $66.8 million, which consisted of upward adjustments of $97.2 million and downward adjustments and impairments of $30.4 million.
Our investment income for the years ended December 31, 2020, 2019, and 2018, consisted of the following (in thousands):
| | | | | | | | | | | | | | | | | | | | |
| | Year Ended December 31, |
| | 2020 | | 2019 | | 2018 |
| Realized gains | | $ | 47,288 | | | $ | 33,158 | | | $ | 37,129 | |
| Unrealized gains | | 374,033 | | | 161,489 | | | 99,634 | |
| Investment income | | $ | 421,321 | | | $ | 194,647 | | | $ | 136,763 | |
| | | | | | |
During the year ended December 31, 2020, gains and losses on investments in privately held entities that do not report NAV still held at December 31, 2020, aggregated to a gain of $3.1 million, which consisted of upward adjustments of $36.7 million and downward adjustments and impairments of $33.6 million.
During the year ended December 31, 2019, gains and losses on investments in privately held entities that do not report NAV still held at December 31, 2019, aggregated to a loss of $12.7 million, which consisted of downward adjustments and impairments of $18.0 million and upward adjustments of $5.2 million.
During the year ended December 31, 2018, gains and losses on investments in privately held entities that do not report NAV still held at December 31, 2018, aggregated to a gain of $58.6 million, which consisted of upward adjustments of $64.3 million and downward adjustments and impairments of $5.7 million.
Unrealized gains related to investments still held at December 31, 2020, 2019, and 2018, aggregated $392.7 million, $184.6 million, and $114.4 million during the years ended December 31, 2020, 2019, and 2018, respectively.
7. INVESTMENTS (continued)
Refer to the “Investments” section in Note 2 – “Summary of significant accounting policies” to our consolidated financial statements for additional information.
Investments in privately held entities that report NAV
We are committed to funding approximately $210.6 million for all investments in privately held entities primarily related to our investments in limited partnerships. Our funding commitments expire at various dates over the next 11 years, with a weighted-average expiration of 8.3 years as of December 31, 2020. These investments are not redeemable by us, but we may receive distributions from these investments throughout their term. Our investments in privately held entities that report NAV generally have expected initial terms in excess of 10 years. The weighted-average remaining term during which these investments are expected to be liquidated was 5.1 years as of December 31, 2020.
8. OTHER ASSETS
The following table summarizes the components of other assets as of December 31, 2020 and 2019 (in thousands):
| | | | | | | | | | | |
| December 31, |
| 2020 | | 2019 |
| Acquired in-place leases | $ | 462,324 | | | $ | 281,650 | |
| Deferred compensation plan | 31,057 | | | 22,225 | |
| Deferred financing costs – unsecured senior line of credit | 24,124 | | | 13,064 | |
| Deposits | 13,861 | | | 31,028 | |
| Furniture, fixtures, and equipment | 31,130 | | | 23,031 | |
| Net investment in direct financing lease | 37,840 | | | 39,916 | |
| Notes receivable | 3,424 | | | 435 | |
| Operating lease right-of-use asset | 335,920 | | | 264,709 | |
| Other assets | 30,620 | | | 32,040 | |
| Prepaid expenses | 67,667 | | | 11,324 | |
| Property, plant, and equipment | 153,614 | | | 174,292 | |
| Total | $ | 1,191,581 | | | $ | 893,714 | |
9. FAIR VALUE MEASUREMENTS
We provide fair value information about all financial instruments for which it is practicable to estimate fair value. We measure and disclose the estimated fair value of financial assets and liabilities by utilizing a fair value hierarchy that distinguishes between data obtained from sources independent of the reporting entity and the reporting entity’s own assumptions about market participant assumptions. This hierarchy consists of three broad levels, as follows: (i) quoted prices in active markets for identical assets or liabilities (Level 1), (ii) significant other observable inputs (Level 2), and (iii) significant unobservable inputs (Level 3). Significant other observable inputs can include quoted prices for similar assets or liabilities in active markets, as well as inputs that are observable for the asset or liability, such as interest rates, foreign exchange rates, and yield curves. Significant unobservable inputs are typically based on an entity’s own assumptions, since there is little, if any, related market activity. In instances in which the determination of the fair value measurement is based on inputs from different levels of the fair value hierarchy, the level in the fair value hierarchy within which the entire fair value measurement falls is based on the lowest level of input that is significant to the fair value measurement in its entirety. Our assessment of the significance of a particular input to the fair value measurement in its entirety requires judgment and considers factors specific to the asset or liability.
Assets and liabilities measured at fair value on a recurring basis
The following table sets forth the assets that we measure at fair value on a recurring basis by level in the fair value hierarchy (in thousands). There were no liabilities measured at fair value on a recurring basis as of December 31, 2020, and 2019. In addition, there were no transfers of assets measured at fair value on a recurring basis to or from Level 3 in the fair value hierarchy during the year ended December 31, 2020.
9. FAIR VALUE MEASUREMENTS (continued)
| | | | | | | | | | | | | | | | | | | | | | | | | | |
| | | | Fair Value Measurement Using |
| Description | | Total | | Quoted Prices in
Active Markets
for Identical Assets
(Level 1) | | Significant
Other
Observable Inputs
(Level 2) | | Significant
Unobservable
Inputs
(Level 3) |
| Investments in publicly traded companies: | | | | | | | | |
| As of December 31, 2020 | | $ | 559,830 | | | $ | 559,830 | | | $ | — | | | $ | — | |
| As of December 31, 2019 | | $ | 318,637 | | | $ | 318,637 | | | $ | — | | | $ | — | |
Our investments in publicly traded companies represent investments with readily determinable fair values, and are carried at fair value, with changes in fair value classified in net income. We also hold investments in privately held entities, which consist of (i) investments that report NAV, and (ii) investments that do not report NAV, as further described below.
Our investments in privately held entities that report NAV, such as our privately held investments in limited partnerships, are carried at fair value using NAV as a practical expedient, with changes in fair value classified in net income. As of December 31, 2020 and 2019, the carrying values of investments in privately held entities that report NAV aggregated $662.1 million and $433.9 million, respectively. These investments are excluded from the fair value hierarchy above as required by the fair value accounting standards. We estimate the fair value of each of our investments in limited partnerships based on the most recent NAV reported by each limited partnership. As a result, the determination of fair values of our investments in privately held entities that report NAV generally does not involve significant estimates, assumptions, or judgments.
Assets and liabilities measured at fair value on a nonrecurring basis
On January 1, 2020, we adopted a new accounting standard described within the “Investments” section in Note 2 – “Summary of significant accounting policies” to our consolidated financial statements. Beginning in 2020, in accordance with this new accounting standard, we provide fair value disclosures, including disclosures about the level in the fair value hierarchy, for our investments in privately held entities that do not report NAV, which were adjusted to their fair value by applying the measurement alternative described within the “Investments” section in Note 2 – “Summary of significant accounting policies” to our consolidated financial statements.
The following table sets forth the assets measured at fair value on a nonrecurring basis by level within the fair value hierarchy as of December 31, 2020 (in thousands). These investments were measured at various times during the period from January 1, 2018, to December 31, 2020.
| | | | | | | | | | | | | | | | | | | | | | | | | | | | | | | | |
| | | | Fair Value Measurement Using |
| Description | | Total | | Quoted Prices in
Active Markets
for Identical Assets
(Level 1) | | Significant
Other
Observable Inputs
(Level 2) | | | Significant
Unobservable
Inputs
(Level 3) |
Investments in privately held entities that do not report NAV | | $ | 157,871 | | | $ | — | | | $ | 144,404 | | (1) | | $ | 13,467 | | (2) |
| | | | | | | | | | |
(1)This balance represents the total carrying amount of our equity investments in privately held entities with observable price changes, included in our total investments balance of $1.6 billion in our consolidated balance sheets as of December 31, 2020. For more information, refer to Note 7 – “Investments” to our consolidated financial statements.
(2)This amount is included in the $244.8 million balance of investments in privately held entities without observable price changes disclosed in Note 7 – “Investments” to our consolidated financial statements and represents the carrying amount of investments in privately held entities that do not report NAV for which impairments have been recognized in accordance with the measurement alternative guidance described within the “Investments” section in Note 2 – “Summary of significant accounting policies” to our consolidated financial statements.
Our investments in privately held entities that do not report NAV are measured at cost, adjusted for observable price changes and impairments, with changes recognized in net income. These investments are evaluated on a nonrecurring basis based on the observable price changes in orderly transactions for the identical or similar investment of the same issuer. Further adjustments are not made until another observable transaction occurs. Therefore, the determination of fair values of our investments in privately held entities that do not report NAV does not involve significant estimates and assumptions or subjective and complex judgments.
We also subject our investments in privately held entities that do not report NAV to a qualitative assessment for indicators of impairment. If indicators of impairment are present, we are required to estimate the investment’s fair value and immediately recognize an impairment charge in an amount equal to the investment’s carrying value in excess of its estimated fair value.
The estimates of fair value typically incorporate valuation techniques that include an income approach reflecting a discounted cash flow analysis, and a market approach that includes a comparative analysis of acquisition multiples and pricing multiples generated by market participants. In certain instances, we may use multiple valuation techniques for a particular investment and estimate its fair value based on an average of multiple valuation results.
9. FAIR VALUE MEASUREMENTS (continued)
Refer to the “Formation of consolidated real estate joint ventures, impairment of an unconsolidated real estate joint venture, and sales of partial interests” section in Note 4 – “Consolidated and unconsolidated real estate joint ventures,” Note 7 – “Investments,” and Note 18 – “Assets classified as held for sale” to our consolidated financial statements for further discussion on assets and liabilities measured at fair value on a nonrecurring basis.
The carrying values of cash and cash equivalents, restricted cash, tenant receivables, deposits, notes receivable, accounts payable, accrued expenses, and other short-term liabilities approximate their fair value.
The fair values of our secured notes payable, unsecured senior notes payable, unsecured senior line of credit, and commercial paper were estimated using widely accepted valuation techniques, including discounted cash flow analyses using significant other observable inputs such as available market information on discount and borrowing rates with similar terms, maturities, and credit ratings. Because the valuations of our financial instruments are based on these types of estimates, the actual fair value of our financial instruments may differ materially if our estimates do not prove to be accurate. Additionally, the use of different market assumptions or estimation methods may have a material effect on the estimated fair value amounts.
As of December 31, 2020 and 2019, the book and estimated fair values of our secured notes payable, unsecured senior notes payable, unsecured senior line of credit, and amounts outstanding under our commercial paper program were as follows (in thousands):
| | | | | | | | | | | | | | | | | | | | | | | | | | | | | |
| December 31, 2020 |
| Book Value | | Fair Value Hierarchy | | Estimated Fair Value |
| | Quoted Prices in
Active Markets
for Identical Assets
(Level 1) | | Significant
Other
Observable Inputs
(Level 2) | | Significant
Unobservable
Inputs
(Level 3) | |
| Liabilities: | | | | | | | | | |
| Secured notes payable | $ | 230,925 | | | $ | — | | | $ | 249,782 | | | $ | — | | | $ | 249,782 | |
| Unsecured senior notes payable | $ | 7,232,370 | | | $ | — | | | $ | 8,447,845 | | | $ | — | | | $ | 8,447,845 | |
Unsecured senior line of credit | $ | — | | | $ | — | | | $ | — | | | $ | — | | | $ | — | |
| Commercial paper program | $ | 99,991 | | | $ | — | | | $ | 99,998 | | | $ | — | | | $ | 99,998 | |
| | | | | | | | | | | | | | | | | | | | | | | | | | | | | |
| December 31, 2019 |
| Book Value | | Fair Value Hierarchy | | Estimated Fair Value |
| | Quoted Prices in
Active Markets
for Identical Assets
(Level 1) | | Significant
Other
Observable Inputs
(Level 2) | | Significant
Unobservable
Inputs
(Level 3) | |
| Liabilities: | | | | | | | | | |
| Secured notes payable | $ | 349,352 | | | $ | — | | | $ | 363,344 | | | $ | — | | | $ | 363,344 | |
| Unsecured senior notes payable | $ | 6,044,127 | | | $ | — | | | $ | 6,571,668 | | | $ | — | | | $ | 6,571,668 | |
Unsecured senior line of credit | $ | 384,000 | | | $ | — | | | $ | 383,928 | | | $ | — | | | $ | 383,928 | |
10. SECURED AND UNSECURED SENIOR DEBT
The following table summarizes our outstanding indebtedness and respective principal payments as of December 31, 2020 (dollars in thousands):
| | | | | | | | | | | | | | | | | | | | | | | | | | | | | | | | | | | | | | | | | | | | | | | | | | | | | | | | | | | | | | | | | | | | | | | | | | | | | |
| | Stated
Rate | | Interest Rate (1) | | Maturity Date (2) | | Principal Payments Remaining for the Periods Ending December 31, | | | | Unamortized (Deferred Financing Cost), (Discount) Premium | | | |
| Debt | | | | | 2021 | | 2022 | | 2023 | | 2024 | | 2025 | | Thereafter | | Principal | | | Total | |
| Secured notes payable | | | | | | | | | | | | | | | | | | | | | | | | | |
| Greater Boston | | 4.82 | % | | 3.40 | % | | 2/6/24 | | $ | 3,394 | | | $ | 3,564 | | | $ | 3,742 | | | $ | 183,527 | | | $ | — | | | $ | — | | | $ | 194,227 | | | 8,344 | | | $ | 202,571 | | |
| San Francisco | | 4.14 | % | | 4.42 | | | 7/1/26 | | — | | | — | | | — | | | — | | | — | | | 28,200 | | | 28,200 | | | (549) | | | 27,651 | | |
| San Francisco | | 6.50 | % | | 6.50 | | | 7/1/36 | | 26 | | | 28 | | | 30 | | | 32 | | | 34 | | | 553 | | | 703 | | | — | | | 703 | | |
| Secured debt weighted average interest rate/subtotal | | 4.74 | % | | 3.53 | | | | | 3,420 | | | 3,592 | | | 3,772 | | | 183,559 | | | 34 | | | 28,753 | | | 223,130 | | | 7,795 | | | 230,925 | | |
| | | | | | | | | | | | | | | | | | | | | | | | | |
Commercial paper program(3) | | 0.27 | % | (3) | 0.29 | | (3) | (3) | | — | | (3) | — | | | — | | | — | | | — | | | 100,000 | | (3) | 100,000 | | | (9) | | | 99,991 | | |
| Unsecured senior line of credit | | L+0.825 | % | | N/A | | 1/6/26 | | — | | | — | | | — | | | — | | | — | | | — | | | — | | | — | | | — | | |
| Unsecured senior notes payable – green bond | | 4.00 | % | | 4.03 | | | 1/15/24 | | — | | | — | | | — | | | 650,000 | | | — | | | — | | | 650,000 | | | (356) | | | 649,644 | | |
| Unsecured senior notes payable | | 3.45 | % | | 3.62 | | | 4/30/25 | | — | | | — | | | — | | | — | | | 600,000 | | | — | | | 600,000 | | | (3,804) | | | 596,196 | | |
| Unsecured senior notes payable | | 4.30 | % | | 4.50 | | | 1/15/26 | | — | | | — | | | — | | | — | | | — | | | 300,000 | | | 300,000 | | | (2,465) | | | 297,535 | | |
| Unsecured senior notes payable – green bond | | 3.80 | % | | 3.96 | | | 4/15/26 | | — | | | — | | | — | | | — | | | — | | | 350,000 | | | 350,000 | | | (2,599) | | | 347,401 | | |
| Unsecured senior notes payable | | 3.95 | % | | 4.13 | | | 1/15/27 | | — | | | — | | | — | | | — | | | — | | | 350,000 | | | 350,000 | | | (3,062) | | | 346,938 | | |
| Unsecured senior notes payable | | 3.95 | % | | 4.07 | | | 1/15/28 | | — | | | — | | | — | | | — | | | — | | | 425,000 | | | 425,000 | | | (2,986) | | | 422,014 | | |
| Unsecured senior notes payable | | 4.50 | % | | 4.60 | | | 7/30/29 | | — | | | — | | | — | | | — | | | — | | | 300,000 | | | 300,000 | | | (1,908) | | | 298,092 | | |
| Unsecured senior notes payable | | 2.75 | % | | 2.87 | | | 12/15/29 | | — | | | — | | | — | | | — | | | — | | | 400,000 | | | 400,000 | | | (3,688) | | | 396,312 | | |
| Unsecured senior notes payable | | 4.70 | % | | 4.81 | | | 7/1/30 | | — | | | — | | | — | | | — | | | — | | | 450,000 | | | 450,000 | | | (3,535) | | | 446,465 | | |
| Unsecured senior notes payable | | 4.90 | % | | 5.05 | | | 12/15/30 | | — | | | — | | | — | | | — | | | — | | | 700,000 | | | 700,000 | | | (7,843) | | | 692,157 | | |
| Unsecured senior notes payable | | 3.375 | % | | 3.48 | | | 8/15/31 | | — | | | — | | | — | | | — | | | — | | | 750,000 | | | 750,000 | | | (6,897) | | | 743,103 | | |
| Unsecured senior notes payable | | 1.875 | % | | 1.97 | | | 2/1/33 | | — | | | — | | | — | | | — | | | — | | | 1,000,000 | | | 1,000,000 | | | (10,559) | | | 989,441 | | |
| Unsecured senior notes payable | | 4.85 | % | | 4.93 | | | 4/15/49 | | — | | | — | | | — | | | — | | | — | | | 300,000 | | | 300,000 | | | (3,332) | | | 296,668 | | |
| Unsecured senior notes payable | | 4.00 | % | | 3.91 | | | 2/1/50 | | — | | | — | | | — | | | — | | | — | | | 700,000 | | | 700,000 | | | 10,404 | | | 710,404 | | |
| Unsecured debt weighted average interest rate/subtotal | | | | 3.76 | | | | | — | | | — | | | — | | | 650,000 | | | 600,000 | | | 6,125,000 | | | 7,375,000 | | | (42,639) | | | 7,332,361 | | |
| Weighted-average interest rate/total | | | | 3.76 | % | | | | $ | 3,420 | | | $ | 3,592 | | | $ | 3,772 | | | $ | 833,559 | | | $ | 600,034 | | | $ | 6,153,753 | | | $ | 7,598,130 | | | $ | (34,844) | | | $ | 7,563,286 | | |
(1)Represents the weighted-average interest rate as of the end of the applicable period, including amortization of loan fees, amortization of debt premiums (discounts), and other bank fees.
(2)Reflects any extension options that we control.
(3)Refer to footnote 2 on the next page.
10. SECURED AND UNSECURED SENIOR DEBT (continued)
The following table summarizes our secured and unsecured senior debt as of December 31, 2020 (dollars in thousands):
| | | | | | | | | | | | | | | | | | | | | | | | | | | | | | | | | | | | | | |
| Fixed-Rate Debt | |
Variable-Rate Debt | | | | | | Weighted-Average | |
| | | | | | | Interest Rate(1) | | Remaining Term
(in years) | |
| | | Total | | Percentage | | | |
| Secured notes payable | $ | 230,925 | | | $ | — | | | $ | 230,925 | | | 3.1 | % | | 3.53 | % | | 3.4 | |
| Unsecured senior notes payable | 7,232,370 | | | — | | | 7,232,370 | | | 95.6 | | | 3.81 | | | 10.9 | |
| Unsecured senior line of credit | — | | | — | | | — | | | — | | | N/A | | 5.0 | |
| Commercial paper program | — | | | 99,991 | | | 99,991 | | | 1.3 | | | 0.29 | | | (2) | |
| Total/weighted average | $ | 7,463,295 | | | $ | 99,991 | | | $ | 7,563,286 | | | 100.0 | % | | 3.76 | % | | 10.6 | (2) |
| Percentage of total debt | 99 | % | | 1 | % | | 100 | % | | | | | | | |
(1)Represents the weighted-average interest rate as of the end of the applicable period, including expense/income related to the amortization of loan fees, amortization of debt premiums (discounts), and other bank fees.
(2)The commercial paper notes bear interest at short-term fixed rates and can generally be issued with a maturity of 30 days or less and with a maximum maturity of 397 days from the date of issuance. Borrowings under the program are used to fund short-term capital needs and are backed by our unsecured senior line of credit. The commercial paper outstanding as of December 31, 2020, matured on January 13, 2021. In the event we are unable to issue commercial paper notes or refinance outstanding borrowings under terms equal to or more favorable than those under our unsecured senior line of credit, we expect to borrow under the unsecured senior line of credit at L+0.825%. As such, we calculate the weighted-average remaining term of our commercial paper using the maturity date of our unsecured senior line of credit. Using the maturity date of our outstanding commercial paper, the consolidated weighted-average maturity of our debt remains at 10.6 years. The commercial paper notes sold during the three months ended December 31, 2020, were issued at a weighted-average yield to maturity of 0.26% and had a weighted-average maturity term of 12 days.
Unsecured senior line of credit
We use our unsecured senior line of credit to fund working capital, construction activities, and, from time to time, acquisition of properties. Borrowings under the unsecured senior line of credit bear interest at a “Eurocurrency Rate,” a “LIBOR Floating Rate,” or a “Base Rate” specified in the amended unsecured senior line of credit agreement plus, in any case, the Applicable Margin. The Eurocurrency Rate specified in the amended unsecured senior line of credit agreement is, as applicable, the rate per annum equal to either (i) the LIBOR or a successor rate thereto as agreed to by the administrative agent and the Company for loans denominated in a LIBOR quoted currency (i.e., U.S. dollars, euro, sterling, or yen), (ii) the average annual yield rates applicable to Canadian dollar bankers’ acceptances for loans denominated in Canadian dollars, (iii) the Bank Bill Swap Reference Bid rate for loans denominated in Australian dollars, or (iv) the rate designated with respect to the applicable alternative currency for loans denominated in a non-LIBOR quoted currency (other than Canadian or Australian dollars). The LIBOR Floating Rate means, for any day, one-month LIBOR, or a successor rate thereto as agreed to by the administrative agent and the Company for loans denominated in U.S. dollars. The Base Rate means, for any day, a fluctuating rate per annum equal to the highest of (i) the federal funds rate plus 1/2 of 1.00%, (ii) the rate of interest in effect for such day as publicly announced from time to time by Bank of America as its “prime rate,” and (iii) the Eurocurrency Rate plus 1.00%. Our unsecured senior line of credit contains a feature that allows lenders to competitively bid on the interest rate for borrowings under the facility. This may result in an interest rate that is below the stated rate. In addition to the cost of borrowing, the facility is subject to an annual facility fee of 0.15% based on the aggregate commitments outstanding.
On October 6, 2020, we amended our unsecured senior line of credit and recognized a loss on early extinguishment of debt of $651 thousand related to the write-off of unamortized loan fees. Among other things, the amended credit agreement includes a 0% LIBOR floor on the interest rate and is subject to certain annual sustainability measures entitling us to a temporary reduction in the interest rate margin of one basis point, but not below zero percent per year. Other key changes are summarized below:
| | | | | | | | | | | | | | |
| | New Agreement | | Change |
| Commitments available for borrowing | | $3.0 billion | | Increased by $800 million |
| Interest rate | | LIBOR+0.825% | | Added a 0% LIBOR floor |
| Maturity date | | January 6, 2026 | | Extended 2 years |
$750 million unsecured senior line of credit
In April 2020, we closed an additional unsecured senior line of credit with $750.0 million of available commitments, which had a maturity date of April 14, 2022, and bore interest at LIBOR plus 1.05%. In addition to the cost of borrowing, this line of credit was subject to an annual facility fee of 0.20% based on the aggregate commitment outstanding.
10. SECURED AND UNSECURED SENIOR DEBT (continued)
The terms of the $750.0 million unsecured senior line of credit agreement required that the outstanding commitments be reduced by 100% of net cash proceeds from certain new debt transactions and 50% of net cash proceeds from new equity offerings as defined in the agreement. In August 2020, we received cash proceeds from the issuance of our $1.0 billion 1.875% Unsecured Senior Notes, and, pursuant to the terms of the $750.0 million unsecured senior line of credit agreement, all outstanding commitments from the additional line of credit were reduced to zero, and we terminated this facility. During the three months ended September 30, 2020, we wrote off unamortized fees related to the terminated facility aggregating $1.9 million, which is classified within loss on early extinguishment of debt in our consolidated statements of operations.
$1.5 billion commercial paper program
In September 2019, we established a $750.0 million commercial paper program, which received credit ratings of A-2 from S&P Global Ratings and Prime-2 from Moody’s Investors Service. During 2020, we increased the aggregate amount we may issue from time to time under our commercial paper program from $750.0 million to $1.5 billion. Under this program, commercial paper notes can generally be issued with a maturity of 30 days or less and with a maximum maturity of 397 days from the date of issuance. Our commercial paper program is backed by our unsecured senior line of credit, and at all times we expect to retain a minimum undrawn amount of borrowing capacity under our unsecured senior line of credit equal to any outstanding notes issued under our commercial paper program. We use the net proceeds from the issuances of the notes for general working capital and other general corporate purposes. General corporate purposes may include, but are not limited to, the repayment of other debt and selective development, redevelopment, or acquisition of properties.
During the three months ended December 31, 2020, we issued commercial paper notes at a weighted-average yield to maturity of 0.26%. As of December 31, 2020, we had $100.0 million of outstanding notes under our commercial paper program.
Unsecured senior notes payable
As of December 31, 2020, we have unsecured senior notes payable aggregating $7.2 billion, which are unsecured obligations of the Company and are fully and unconditionally guaranteed by Alexandria Real Estate Equities, L.P., a 100% owned subsidiary of the Company. The unsecured senior notes payable rank equally in right of payment with all other senior unsecured indebtedness. However, the unsecured senior notes payable are subordinate to existing and future mortgages and other secured indebtedness (to the extent of the value of the collateral securing such indebtedness) and to all existing and future preferred equity and liabilities, whether secured or unsecured, of the Company’s subsidiaries, other than Alexandria Real Estate Equities, L.P. In addition, the terms of the indentures, among other things, limit the ability of the Company, Alexandria Real Estate Equities, L.P., and the Company’s subsidiaries to (i) consummate a merger, or consolidate or sell all or substantially all of the Company’s assets, and (ii) incur certain secured or unsecured indebtedness.
In March 2020, we completed an offering of $700.0 million of unsecured senior notes payable due on December 15, 2030, at an interest rate of 4.90% for net proceeds of $691.6 million. The net proceeds were used to reduce the outstanding indebtedness under our unsecured senior line of credit and commercial paper program.
In August 2020, we completed an offering of $1.0 billion of unsecured senior notes payable due on February 1, 2033, at an interest rate of 1.875% for net proceeds of $989.1 million (“1.875% Unsecured Senior Notes”). A portion of the proceeds was used to refinance our 3.90% unsecured senior notes payable due in 2023, aggregating $500.0 million, pursuant to a partial cash tender offer completed on August 5, 2020, and a subsequent call for redemption for the remaining outstanding amounts. The redemption was settled on September 4, 2020. The remaining proceeds were used to fund pending and recently completed acquisitions and construction of our highly leased development and redevelopment projects. As a result of our debt refinancing, we recognized a loss on early extinguishment of debt of $50.8 million, including the write-off of unamortized loan fees.
Since January 1, 2019, we have completed the issuances of $4.4 billion in unsecured senior notes, with a weighted-average interest rate of 3.48% and a weighted-average maturity of 14.1 years as of December 31, 2020.
10. SECURED AND UNSECURED SENIOR DEBT (continued)
Extinguishment of unsecured senior notes payable, unsecured senior line of credit, and secured notes payable
During the year ended December 31, 2020, we extinguished the following debt and recognized losses on early extinguishment of debt, as described below:
•Refinanced our 3.90% unsecured senior notes payable due in 2023 aggregating $500.0 million and recognized a loss on early extinguishment of debt aggregating $50.8 million, including the write-off of unamortized loan fees.
•Terminated our $750.0 million unsecured senior line of credit and recognized a loss on early extinguishment of debt aggregating $1.9 million.
•Repaid our secured note payable aggregating $78.0 million in December 2020, originally due in 2023 with an effective interest rate of 3.19%, and recognized a loss on early extinguishment of debt aggregating $4.5 million.
•Extinguished our secured note payable aggregating $30.2 million due in 2023 with an effective interest rate of 4.90%, which was repaid in December 2020 via a legal defeasance and recognized a loss on early extinguishment of debt of $2.8 million.
Interest expense
The following table summarizes interest expense for the years ended December 31, 2020, 2019, and 2018 (in thousands):
| | | | | | | | | | | | | | | | | | | | |
| | Year Ended December 31, |
| | 2020 | | 2019 | | 2018 |
| Interest incurred | | $ | 297,227 | | | $ | 262,238 | | | $ | 223,715 | |
| Capitalized interest | | (125,618) | | | (88,563) | | | (66,220) | |
| Interest expense | | $ | 171,609 | | | $ | 173,675 | | | $ | 157,495 | |
11. ACCOUNTS PAYABLE, ACCRUED EXPENSES, AND OTHER LIABILITIES
The following table summarizes the components of accounts payable, accrued expenses, and other liabilities as of December 31, 2020 and 2019 (in thousands):
| | | | | | | | | | | |
| December 31, |
| 2020 | | 2019 |
| Accounts payable and accrued expenses | $ | 285,021 | | | $ | 198,994 | |
| Accrued construction | 333,271 | | | 275,818 | |
| Acquired below-market leases | 288,075 | | | 194,773 | |
| Conditional asset retirement obligations | 47,070 | | | 14,037 | |
| Deferred rent liabilities | 4,495 | | | 2,897 | |
| Operating lease liability | 345,750 | | | 271,808 | |
| Unearned rent and tenant security deposits | 276,751 | | | 275,863 | |
| Other liabilities | 89,399 | | | 86,078 | |
| Total | $ | 1,669,832 | | | $ | 1,320,268 | |
As of December 31, 2020 and 2019, our conditional asset retirement obligations liability primarily consisted of the soil and groundwater remediation liabilities associated with certain of our properties. Some of our properties may contain asbestos or may be subjected to other hazardous or toxic substances, which, under certain conditions, require remediation. We engage independent environmental consultants to conduct Phase I or similar environmental assessments at our properties. This type of assessment generally includes a site inspection, interviews, and a public records review, asbestos, lead-based paint and mold surveys, subsurface sampling, and other testing. We recognize a liability for the fair value of a conditional asset retirement obligation (including asbestos) when the fair value of the liability can be reasonably estimated. In addition, environmental laws and regulations subject our tenants, and potentially us, to liability that may result from our tenants’ routinely handling hazardous substances and wastes as part of their operations at our properties. These assessments and investigations of our properties have not to date revealed any additional environmental liability that we believe would have a material adverse effect on our business and financial statements, or would require additional disclosures or recognition in our financial statements.
12. EARNINGS PER SHARE
From time to time, we enter into forward equity sales agreements, which are discussed in Note 15 – “Stockholders’ equity” to our consolidated financial statements. We considered the potential dilution resulting from the forward equity sales agreements on the EPS calculations. At inception, the agreements do not have an effect on the computation of basic EPS as no shares are delivered until settlement. The common shares issued upon the settlement of the forward equity sales agreements, weighted for the period these common shares were outstanding, are included in the denominator of basic EPS. To determine the dilution resulting from the forward equity sales agreements during the period of time prior to settlement, we calculate the number of weighted-average shares outstanding – diluted using the treasury stock method.
In October 2019, we elected to convert 2.3 million outstanding shares of our 7.00% Series D convertible preferred stock (“Series D Convertible Preferred Stock”) into shares of our common stock. As of December 31, 2020, we had no shares of our Series D Convertible Preferred Stock outstanding. For the period in 2019 during which our Series D Convertible Preferred Stock was outstanding, we calculated the number of weighted-average shares outstanding – diluted using the if-converted method. Shares of Alexandria Real Estate Equities, Inc.’s common shares issued upon conversion, weighted for the period the common shares were outstanding, were included in the denominator for the period after the date of conversion.
We account for unvested restricted stock awards that contain nonforfeitable rights to dividends as participating securities and include these securities in the computation of EPS using the two-class method. Our forward equity sales agreements are not participating securities and are therefore not included in the computation of EPS using the two-class method. Under the two-class method, we allocate net income (after amounts attributable to noncontrolling interests, dividends on preferred stock, and preferred stock redemption charge) to common stockholders and unvested restricted stock awards by using the weighted-average shares of each class outstanding for quarter-to-date and year-to-date periods independently, based on their respective participation rights to dividends declared (or accumulated) and undistributed earnings.
The table below is a reconciliation of the numerators and denominators of the basic and diluted EPS computations for the years ended December 31, 2020, 2019, and 2018 (in thousands, except per share amounts):
| | | | | | | | | | | | | | | | | |
| Year Ended December 31, |
| 2020 | | 2019 | | 2018 |
| Net income | $ | 827,171 | | | $ | 404,047 | | | $ | 402,793 | |
Net income attributable to noncontrolling interests | (56,212) | | | (40,882) | | | (23,481) | |
Dividends on preferred stock | — | | | (3,204) | | | (5,060) | |
Preferred stock redemption charge | — | | | (2,580) | | | (4,240) | |
Net income attributable to unvested restricted stock awards | (10,168) | | | (6,386) | | | (6,029) | |
| Numerator for basic and diluted EPS – net income attributable to Alexandria Real Estate Equities, Inc.’s common stockholders | $ | 760,791 | | | $ | 350,995 | | | $ | 363,983 | |
| | | | | |
Denominator for basic EPS – weighted-average shares of common stock outstanding | 126,106 | | | 112,204 | | | 103,010 | |
Dilutive effect of forward equity sales agreements | 384 | | | 320 | | | 311 | |
Denominator for diluted EPS – weighted-average shares of common stock outstanding | 126,490 | | | 112,524 | | | 103,321 | |
| Net income per share attributable to Alexandria Real Estate Equities, Inc.’s common stockholders: | | | | | |
Basic | $ | 6.03 | | | $ | 3.13 | | | $ | 3.53 | |
Diluted | $ | 6.01 | | | $ | 3.12 | | | $ | 3.52 | |
13. INCOME TAXES
We have elected to be taxed as a REIT, under the Internal Revenue Code of 1986, as amended, or the Code. We believe we have qualified and continue to qualify as a REIT. Under the Code, a REIT that distributes at least 90% of its REIT taxable income to its shareholders annually and meets certain other conditions is not subject to federal income taxes, but could be subject to certain state, local, and foreign taxes. We distribute 100% of our taxable income annually; therefore, a provision for federal income taxes is not required.
We distributed all of our REIT taxable income in 2019 and 2018 and, as a result, did not incur federal income tax in those years on such income. For the year ended December 31, 2020, we expect our distributions to exceed our REIT taxable income and, as a result, do not expect to incur federal income tax. We expect to finalize our 2020 REIT taxable income when we file our 2020 federal income tax return in 2021.
The income tax treatment of distributions and dividends declared on our common stock and our Series D Convertible Preferred Stock for the years ended December 31, 2020, 2019, and 2018, was as follows (unaudited):
| | | | | | | | | | | | | | | | | | | | | | | | | | | | | |
| Common Stock | | Series D Convertible Preferred Stock(1) |
| | Year Ended December 31, |
| | 2020 | | 2019 | | 2018 | | 2019 | | 2018 |
| Ordinary income | 65.7 | % | | 62.4 | % | | 69.9 | % | | 64.4 | % | | 72.7 | % |
| Return of capital | 13.2 | | | 3.2 | | | 3.8 | | | — | | | — | |
| Capital gains at 25% | — | | | 2.2 | | | 0.1 | | | 2.2 | | | 0.1 | |
| Capital gains at 20% | 21.1 | | | 32.2 | | | 26.2 | | | 33.4 | | | 27.2 | |
| Total | 100.0 | % | | 100.0 | % | | 100.0 | % | | 100.0 | % | | 100.0 | % |
| | | | | | | | | |
| Dividends declared | $ | 4.24 | | | $ | 4.00 | | | $ | 3.73 | | | $ | 1.3125 | | | $ | 1.75 | |
(1)Refer to Note 15 – “Stockholders’ equity” to our consolidated financial statements for information regarding the conversion of our Series D Convertible Preferred Stock.
Beginning in 2018, the Tax Cuts and Jobs Act of 2017 added Section 199A to allow for a new tax deduction based on certain qualified business income. Section 199A provides eligible individual taxpayers a deduction of up to 20% of their qualified REIT dividends.
Our dividends declared in a given quarter are generally paid during the subsequent quarter. The taxability information presented above for our dividends paid in 2020 is based upon management’s estimate. Our federal tax return for 2020 is due on or before October 15, 2021, assuming we file for an extension of the due date. Our federal tax returns for previous tax years have not been examined by the IRS. Consequently, the taxability of distributions and dividends is subject to change.
In addition to our REIT tax returns, we file federal, state, and local tax returns for our subsidiaries. We file with jurisdictions located in the U.S., Canada, India, China, and other international locations and may be subject to audits, assessments, or other actions by local taxing authorities. We recognize tax benefits of uncertain tax positions only if it is more likely than not that the tax position will be sustained, based solely on its technical merits, with the taxing authority having full knowledge of all relevant information. The measurement of a tax benefit for an uncertain tax position that meets the “more likely than not” threshold is based on a cumulative probability model under which the largest amount of tax benefit recognized is the amount with a greater than 50% likelihood of being realized upon ultimate settlement with the taxing authority that has full knowledge of all relevant information.
As of December 31, 2020, there were no material unrecognized tax benefits. We do not anticipate a significant change to the total amount of unrecognized tax benefits within the next 12 months.
Interest expense and penalties, if any, are recognized in the first period during which the interest or penalties begin accruing, according to the provisions of the relevant tax law at the applicable statutory rate of interest. We did not incur any significant tax-related interest expense or penalties for the years ended December 31, 2020, 2019, and 2018.
13. INCOME TAXES (continued)
The following reconciles net income (determined in accordance to GAAP) to taxable income as filed with the IRS for the years ended December 31, 2019 and 2018 (in thousands and unaudited):
| | | | | | | | | | | | | | |
| | Year Ended December 31, |
| | 2019 | | 2018 |
| Net income | | $ | 404,047 | | | $ | 402,793 | |
| Net income attributable to noncontrolling interests | | (40,882) | | | (23,481) | |
| Book/tax differences: | | | | |
| Rental revenue recognition | | (132,979) | | | (65,901) | |
| Depreciation and amortization | | 177,627 | | | 161,514 | |
| Share-based compensation | | 30,756 | | | 30,771 | |
| Interest expense | | (13,687) | | | (6,414) | |
| Sales of property | | 66,717 | | | (39,393) | |
| Impairments | | 12,334 | | | — | |
| Non-real estate investment income | | (96,353) | | | (110,322) | |
| Other | | 7,565 | | | 9,522 | |
| Taxable income before dividend deduction | | 415,145 | | | 359,089 | |
Dividend deduction necessary to eliminate taxable income(1) | | (415,145) | | | (359,089) | |
| Estimated income subject to federal income tax | | $ | — | | | $ | — | |
(1)Total common stock and preferred stock dividend distributions paid were approximately $451.2 million and $385.8 million during the years ended December 31, 2019 and 2018, respectively.
14. COMMITMENTS AND CONTINGENCIES
Employee retirement savings plan
We have a retirement savings plan pursuant to Section 401(k) of the Internal Revenue Code (the “Code) whereby our employees may contribute a portion of their compensation to their respective retirement accounts in an amount not to exceed the maximum allowed under the Code. In addition to employee contributions, we have elected to provide company discretionary profit-sharing contributions (subject to statutory limitations), which amounted to approximately $6.2 million, $4.9 million, and $4.1 million for the years ended December 31, 2020, 2019, and 2018, respectively. Employees who participate in the plan are immediately vested in their contributions and in the contributions made on their behalf by the Company.
Concentration of credit risk
We maintain our cash and cash equivalents at insured financial institutions. The combined account balances at each institution periodically exceed the FDIC insurance coverage of $250,000, and, as a result, there is a concentration of credit risk related to amounts in excess of FDIC insurance coverage. We have not experienced any losses to date on our invested cash.
We are dependent on rental revenue from relatively few tenants. The inability of any single tenant to make its lease payments could adversely affect our operations. As of December 31, 2020, we had 909 leases with a total of 670 tenants, and 167, or 49%, of our 338 properties were each leased to a single tenant. As of December 31, 2020, our three largest tenants, accounted for 3.7%, 2.8%, and 2.7% of our aggregate annual rental revenue individually, or 9.2% in the aggregate.
Commitments
As of December 31, 2020, remaining aggregate costs under contract for the construction of properties undergoing development, redevelopment, and improvements under the terms of leases approximated $1.2 billion. We expect payments for these obligations to occur over one year to three years, subject to capital planning adjustments from time to time. We may have the ability to cease the construction of certain properties, which would result in the reduction of our commitments. In addition, we have letters of credit and performance obligations aggregating $11.1 million primarily related to construction projects.
We are committed to funding approximately $210.6 million for non-real estate investments primarily related to our investments in limited partnerships. Our funding commitments expire at various dates over the next 11 years, with a weighted-average remaining period of 8.3 years as of December 31, 2020.
15. STOCKHOLDERS’ EQUITY
Common equity transactions
During the year ended December 31, 2020, we completed issuances and executed forward equity sales agreements for an aggregate of 15.7 million shares of common stock, including the exercise of an underwriters’ option, for aggregate net proceeds of approximately $2.4 billion, as follows:
•In January 2020 and July 2020, we entered into forward equity sales agreements aggregating $1.0 billion and $1.1 billion, respectively, to sell an aggregate of 6.9 million shares for each offering (13.8 million in aggregate) of our common stock, including the exercise of underwriters’ options, at public offering prices of $155.00 per share and $160.50 per share, respectively, before underwriting discounts. During 2020, we issued all 13.8 million shares under these forward equity sales agreements and received net proceeds of $2.1 billion.
•In February 2020, we entered into an ATM common stock offering program, which allowed us to sell up to an aggregate of $850.0 million of our common stock.
•We issued 1.5 million shares of common stock under our ATM program at a price of $159.09 per share (before underwriting discounts), and received net proceeds of $235.0 million during 2020.
•We have 362 thousand shares under our ATM program subject to forward equity sales agreements that remain outstanding at a price of $159.09 per share (before underwriting discounts) as of December 31, 2020. We expect to settle these forward equity sales agreements in 2021 and receive net proceeds of approximately $56.3 million.
•The remaining availability of $547.3 million under this ATM program expired in December 2020 concurrently with the expiration of the associated shelf registration. In January 2021, we filed a new shelf registration and expect to establish a new ATM program soon in 2021.
7.00% Series D cumulative convertible preferred stock repurchases and conversion
As of December 31, 2020 and 2019, we had no outstanding shares of our Series D Convertible Preferred Stock. During the year ended December 31, 2019, we repurchased, in privately negotiated transactions, 275,000 outstanding shares of our Series D Convertible Preferred Stock at an aggregate price of $9.2 million, or $33.60 per share. We recognized a preferred stock redemption charge of $2.6 million during the year ended December 31, 2019, including the write-off of original issuance costs of approximately $215 thousand. Also, in September 2019, we had elected to convert the remaining 2.3 million outstanding shares of our Series D Convertible Preferred Stock into shares of our common stock. The Series D Convertible Preferred Stock became eligible for mandatory conversion at our discretion, at a set conversion rate of 0.2513 shares of common stock to one share of preferred stock, upon our common stock price’s exceeding $149.46 per share for the specified period of time required to cause the mandatory conversion. In October 2019, we converted the Series D Convertible Preferred Stock into 578 thousand shares of common stock. This conversion was accounted for as an equity transaction, and we did not recognize a gain or loss.
During the years ended December 31, 2019 and 2018, we declared cash dividends on our Series D Convertible Preferred Stock aggregating $3.2 million, or $1.3125 per share, and $5.1 million, or $1.75 per share, respectively.
Accumulated other comprehensive loss
The following table presents the changes in accumulated other comprehensive loss attributable to Alexandria Real Estate Equities, Inc.’s stockholders during the year ended December 31, 2020, which was entirely due to net unrealized gains on foreign currency translation related to our operations in Canada and China (in thousands):
| | | | | | | | | | | | |
| | | | | Total | | |
| Balance as of December 31, 2019 | | | | $ | (9,749) | | | |
| | | | | | |
| Other comprehensive income before reclassifications | | | | 3,124 | | | |
| Net other comprehensive income | | | | 3,124 | | | |
| | | | | | |
| Balance as of December 31, 2020 | | | | $ | (6,625) | | | |
15. STOCKHOLDERS’ EQUITY (continued)
Common stock, preferred stock, and excess stock authorizations
Our charter authorizes the issuance of 200.0 million shares of common stock, of which 136.7 million shares were issued and outstanding as of December 31, 2020. Our charter also authorizes the issuance of up to 100.0 million shares of preferred stock, none of which were issued and outstanding as of December 31, 2020. In addition, 200.0 million shares of “excess stock” (as defined in our charter) are authorized, none of which were issued and outstanding as of December 31, 2020.
Additional paid-in capital
During the year ended December 31, 2020, we sold partial interests in the following properties: (i) 681, 685, and 701 Gateway Boulevard in our South San Francisco submarket during the three months ended March 31, 2020, (ii) 9808 and 9868 Scranton Road in our Sorrento Mesa submarket during the three months ended June 30, 2020, and (iii) 1201 and 1208 Eastlake Avenue East and 199 East Blaine Street in our Lake Union submarket during the three months ended December 31, 2020. For the discussion of our sales of partial interests, refer to the “Formation of consolidated real estate joint ventures, impairment of an unconsolidated real estate joint venture, and sales of partial interests” section in Note 4 – “Consolidated and unconsolidated real estate joint ventures” to our consolidated financial statements.
16. SHARE-BASED COMPENSATION
Stock plan
For the purpose of attracting and retaining the highest-quality personnel, providing for additional incentives, and promoting the success of our Company, we have historically issued two forms of share-based compensation under our equity incentive plan: (i) options to purchase common stock and (ii) restricted stock. We have not granted any options since 2002. Each restricted share issued reduced our share reserve by three shares (3:1 ratio) prior to March 23, 2018, and by one share (1:1 ratio) on and after March 23, 2018. As of December 31, 2020, there were 3,080,980 shares reserved for the granting of future options and stock awards under the equity incentive plan.
In addition, our stock plan permits us to issue share awards to our employees, non-employees, and non-employee directors. A share award is an award of common stock that (i) may be fully vested upon issuance or (ii) may be subject to the risk of forfeiture under Section 83 of the Internal Revenue Code. Shares issued generally vest over a four-year period from the date of issuance, and the sale of the shares is restricted prior to the date of vesting. Certain time-based restricted share awards are also subject to an additional one-year holding period after vesting.The unearned portion of time-based awards is amortized as stock compensation expense on a straight-line basis over the vesting period. Certain restricted share awards are subject to vesting based upon the satisfaction of levels of performance and market conditions. Failure to satisfy the threshold performance conditions will result in the forfeiture of shares. Forfeiture of share awards with time-based or performance-based restrictions results in a reversal of previously recognized share-based compensation expense. Forfeiture of share awards with market-based restrictions does not result in a reversal of previously recognized share-based compensation expense.
The following is a summary of the stock awards activity under our equity incentive plan and related information for the years ended December 31, 2020, 2019, and 2018:
| | | | | | | | | | | | | | | | | | | | | | | | | | |
| | | | Number of Share Awards | | Weighted-Average
Grant Date
Fair Value Per Share |
| Outstanding at December 31, 2017 | | | | 1,394,582 | | | $ | 95.79 | | |
| Granted | | | | 741,244 | | | $ | 121.20 | | |
| Vested | | | | (403,120) | | | $ | 103.83 | | |
| Forfeited | | | | (20,330) | | | $ | 106.38 | | |
| Outstanding at December 31, 2018 | | | | 1,712,376 | | | $ | 105.22 | | |
| Granted | | | | 768,625 | | | $ | 134.70 | | |
| Vested | | | | (666,836) | | | $ | 96.77 | | |
| Forfeited | | | | (14,480) | | | $ | 119.88 | | |
| Outstanding at December 31, 2019 | | | | 1,799,685 | | | $ | 119.59 | | |
| Granted | | | | 753,473 | | | $ | 147.71 | | |
| Vested | | | | (688,599) | | | $ | 115.57 | | |
| Forfeited | | | | (39,279) | | | $ | 117.76 | | |
| Outstanding at December 31, 2020 | | | | 1,825,280 | | | $ | 132.95 | | |
| | | | | | | | |
| | Year Ended December 31, |
| (In thousands) | | 2020 | | 2019 | | 2018 |
Total grant date fair value of stock awards vested | | $ | 79,578 | | | $ | 64,530 | | | $ | 41,854 | |
Total gross compensation recognized for stock awards | | $ | 80,651 | | | $ | 68,036 | | | $ | 57,341 | |
| Capitalized stock compensation | | $ | 37,149 | | | $ | 24,396 | | | $ | 22,322 | |
Certain restricted stock awards granted during 2017 through 2020 are subject to performance and market conditions. The grant date fair value of these awards is determined using a Monte Carlo simulation pricing model using the following assumptions for 2020, 2019, and 2018, respectively: (i) expected term of 3.0 years, 3.0 years, and 3.0 years (equal to the remaining performance measurement period at the grant date), (ii) volatility of 17.0%, 18.0%, and 16.0% (approximating a blended average of implied and historical volatilities), (iii) dividend yield of 2.8%, 3.2%, and 3.1%, and (iv) risk-free rate of 1.63%, 2.60%, and 2.15%.
As of December 31, 2020, there was $193.1 million of unrecognized compensation related to unvested share awards under the equity incentive plan, which is expected to be recognized over the next four years and has a weighted-average vesting period of approximately 19 months.
17. NONCONTROLLING INTERESTS
Noncontrolling interests represent the third-party interests in certain entities in which we have a controlling interest. These entities owned 40 properties as of December 31, 2020, which are included in our consolidated financial statements. Noncontrolling interests are adjusted for additional contributions and distributions, the proportionate share of the net earnings or losses, and other comprehensive income or loss. Distributions, profits, and losses related to these entities are allocated in accordance with the respective operating agreements. During the years ended December 31, 2020 and 2019, we distributed $87.3 million and $48.2 million, respectively, to our consolidated real estate joint venture partners.
Certain of our noncontrolling interests have the right to require us to redeem their ownership interests in the respective entities. We classify these ownership interests in the entities as redeemable noncontrolling interests outside of total equity in our consolidated balance sheets. Redeemable noncontrolling interests are adjusted for additional contributions and distributions, the proportionate share of the net earnings or losses, and other comprehensive income or loss. If the amount of a redeemable noncontrolling interest is less than the maximum redemption value at the balance sheet date, such amount is adjusted to the maximum redemption value. Subsequent declines in the redemption value are recognized only to the extent that previous increases have been recognized.
During the year ended December 31, 2020, we sold noncontrolling interests in the following properties:
•55% interest in 681, 685, and 701 Gateway Boulevard in our South San Francisco submarket,
•50% interest in 9808 and 9868 Scranton Road in our Sorrento Mesa submarket, and
•70% interest in 1201 and 1208 Eastlake Avenue East and 199 East Blaine Street in our Lake Union submarket.
For detail, refer to the “Formation of consolidated real estate joint ventures, impairment of an unconsolidated real estate joint venture, and sales of partial interests” section in Note 4 – “Consolidated and unconsolidated real estate joint ventures” to our consolidated financial statements.
18. ASSETS CLASSIFIED AS HELD FOR SALE
As of December 31, 2020, five properties aggregating 559,993 RSF were classified as held for sale in our consolidated financial statements, none of which met the criteria for classification as discontinued operations. Accordingly, we ceased depreciation of these properties upon their classification as held for sale.
During the year ended December 31, 2020, we recognized impairment charges aggregating $48.1 million, including $32.9 million to lower the carrying amounts of our real estate assets classified as held for sale during the year to their estimated fair values less costs to sell. These charges primarily related to the following real estate assets:
•Impairment charge of $13.5 million recognized during the three months ended December 31, 2020, upon classification of our real estate assets located at 260 Townsend Street in our SoMa submarket as held for sale. We expect to sell this real estate asset during 2021.
•Impairment charge of $11.7 million recognized during the three months ended December 31, 2020, upon classification of our real estate asset located at 220 and 240 2nd Avenue South in our SoDo submarket as held for sale. We expect to sell this real estate asset during 2021.
•Impairment charge of $6.8 million recognized during the three months ended September 30, 2020, upon classification of our real estate asset located at 945 Market Street in our SoMa submarket as held for sale. In September 2020, we completed the sale of the real estate asset for a sales price of $198.0 million with no gain or loss.
18. ASSETS CLASSIFIED AS HELD FOR SALE (continued)
Refer to “Impairment of long-lived assets” in Note 2 – “Summary of significant account policies” to our consolidated financial statements for additional information.
The following is a summary of net assets as of December 31, 2020 and 2019, for our real estate investments that were classified as held for sale as of each respective date (in thousands):
| | | | | | | | | | | |
| December 31, |
| 2020 | | 2019 |
| Total assets | $ | 117,879 | | | $ | 59,412 | |
| Total liabilities | (33,081) | | | (2,860) | |
| Total accumulated other comprehensive (loss) income | (841) | | | 536 | |
| Net assets classified as held for sale | $ | 83,957 | | | $ | 57,088 | |
19. QUARTERLY FINANCIAL DATA (unaudited)
The following is a summary of consolidated financial information on a quarterly basis for 2020 and 2019 (in thousands, except per share amounts):
| | | | | | | | | | | | | | | | | | | | | | | | | | | | | |
| | Quarter | |
| 2020 | | First | | Second | | Third | | Fourth | |
Total revenues | | $ | 439,919 | | | $ | 436,956 | | | $ | 545,042 | | | $ | 463,720 | | |
| Net income attributable to Alexandria Real Estate Equities, Inc.’s common stockholders | | $ | 16,840 | | | $ | 226,600 | | | $ | 79,326 | | | $ | 435,923 | | |
| | | | | | | | | |
| Net income per share attributable to Alexandria Real Estate Equities, Inc.’s common stockholders: | | | | | | | | | |
Basic(1) | | $ | 0.14 | | | $ | 1.82 | | | $ | 0.64 | | | $ | 3.26 | | |
Diluted(1) | | $ | 0.14 | | | $ | 1.82 | | | $ | 0.63 | | | $ | 3.26 | | |
| | | | | | | | | |
| | Quarter | |
| 2019 | | First | | Second | | Third | | Fourth | |
Total revenues | | $ | 358,842 | | | $ | 373,856 | | | $ | 390,484 | | | $ | 408,114 | | |
| Net income (loss) attributable to Alexandria Real Estate Equities, Inc.’s common stockholders | | $ | 123,598 | | | $ | 76,330 | | | $ | (49,773) | | | $ | 199,618 | | |
| | | | | | | | | |
| Net income (loss) per share attributable to Alexandria Real Estate Equities, Inc.’s common stockholders: | | | | | | | | | |
Basic(1) | | $ | 1.11 | | | $ | 0.68 | | | $ | (0.44) | | | $ | 1.75 | | |
Diluted(1) | | $ | 1.11 | | | $ | 0.68 | | | $ | (0.44) | | | $ | 1.74 | | |
(1)Quarterly earnings per common share amounts may not total to the annual amounts due to rounding and due to the increase in the weighted-average shares of common stock outstanding.
20. SUBSEQUENT EVENTS
Real estate assets acquired in January 2021
In January 2021, we completed the acquisitions of five properties for an aggregate purchase price of $1.6 billion, comprising 2.1 million RSF of operating and active redevelopment strategically located across multiple markets. Refer to Note 3 – “Investments in real estate” to our consolidated financial statements for additional information.
Forward equity sales agreements in January 2021
In January 2021, we entered into forward equity sales agreements aggregating $1.1 billion to sell an aggregate of 6.9 million shares of our common stock (including the exercise of underwriters’ option) at a public offering price of $164.00 per share, before underwriting discounts and commissions.
Alexandria Real Estate Equities, Inc. and Subsidiaries
Schedule III
Consolidated Financial Statement Schedule of Real Estate and Accumulated Depreciation
December 31, 2020
(Dollars in thousands)
| | | | | | | | | | | | | | | | | | | | | | | | | | | | | | | | | | | | | | | | | | | | | | | | | | | | | | | | | | | | | | | | | | | | | | | | | | |
| | | | | | Initial Costs | | Costs Capitalized Subsequent to Acquisitions | | Total Costs | | | | | | | | |
| Property | | Market | | Encumbrances | | Land | | Buildings & Improvements | | Buildings & Improvements | | Land | | Buildings & Improvements | | Total(1) | | Accumulated Depreciation(2) | | Net Cost Basis | | Date of Construction(3) | | Date
Acquired |
Alexandria Center® at Kendall Square | | Greater Boston | | $ | — | |
| $ | 279,668 | | | $ | 205,491 | | | $ | 1,454,369 | | | $ | 279,668 | | | $ | 1,659,860 | | | $ | 1,939,528 | | | $ | (303,549) | | | $ | 1,635,979 | | | 2000 - 2017 | | 2005 - 2015 |
Alexandria Technology Square® | | Greater Boston | | — | | | — | | | 619,658 | | | 267,679 | | | — | | | 887,337 | | | 887,337 | | | (278,440) | | | 608,897 | | | 2001 - 2012 | | 2006 |
| The Arsenal on the Charles | | Greater Boston | | — | | | 181,797 | | | 354,611 | | | 57,573 | | | 181,797 | | | 412,184 | | | 593,981 | | | (8,598) | | | 585,383 | | | 2000 - 2017 | | 2019 |
Alexandria Center® at One Kendall Square | | Greater Boston | | 202,571 | | | 349,952 | | | 483,816 | | | 353,302 | | | 349,952 | | | 837,118 | | | 1,187,070 | | | (111,731) | | | 1,075,339 | | | 1985 - 2019 | | 2016 - 2017 |
| 480 and 500 Arsenal Street | | Greater Boston | | — | | | 9,773 | | | 12,773 | | | 91,521 | | | 9,773 | | | 104,294 | | | 114,067 | | | (43,922) | | | 70,145 | | | 2001 - 2003 | | 2000 - 2001 |
| 640 Memorial Drive | | Greater Boston | | — | | | — | | | 174,878 | | | 967 | | | — | | | 175,845 | | | 175,845 | | | (44,074) | | | 131,771 | | | 2011 | | 2015 |
| 780 and 790 Memorial Drive | | Greater Boston | | — | | | — | | | — | | | 54,916 | | | — | | | 54,916 | | | 54,916 | | | (25,952) | | | 28,964 | | | 2002 | | 2001 |
| 167 Sidney Street and 99 Erie Street | | Greater Boston | | — | | | — | | | 12,613 | | | 13,881 | | | — | | | 26,494 | | | 26,494 | | | (8,070) | | | 18,424 | | | 2006 - 2012 | | 2005 - 2006 |
| 79/96 13th Street (Charlestown Navy Yard) | | Greater Boston | | — | | | — | | | 6,247 | | | 8,708 | | | — | | | 14,955 | | | 14,955 | | | (6,239) | | | 8,716 | | | 2012 | | 1998 |
| 380 and 420 E Street | | Greater Boston | | — | | | 156,355 | | | 9,229 | | | 2,237 | | | 156,355 | | | 11,466 | | | 167,821 | | | (222) | | | 167,599 | | | 2013 | | 2020 |
| 5 Necco Street | | Greater Boston | | — | | | 41,958 | | | 41,546 | | | 2,227 | | | 41,958 | | | 43,773 | | | 85,731 | | | (1,299) | | | 84,432 | | | 2019 | | 2019 |
| 10 Necco Street | | Greater Boston | | — | | | 67,743 | | | 13,357 | | | 9,932 | | | 67,743 | | | 23,289 | | | 91,032 | | | (598) | | | 90,434 | | | N/A | | 2019 |
| 15 Necco Street | | Greater Boston | | — | | | 167,853 | | | 993 | | | 15,610 | | | 167,853 | | | 16,603 | | | 184,456 | | | (1) | | | 184,455 | | | N/A | | 2019 |
| 99 A Street | | Greater Boston | | — | | | 31,671 | | | 878 | | | 13,041 | | | 31,671 | | | 13,919 | | | 45,590 | | | (939) | | | 44,651 | | | 1968 | | 2018 |
| Reservoir Woods | | Greater Boston | | — | | | 88,840 | | | 214,038 | | | 2,513 | | | 88,840 | | | 216,551 | | | 305,391 | | | (1,820) | | | 303,571 | | | 2009 - 2010 | | 2020 |
| 275 Grove Street | | Greater Boston | | — | | | 70,476 | | | 150,159 | | | 1,043 | | | 70,476 | | | 151,202 | | | 221,678 | | | (3,702) | | | 217,976 | | | 2000 | | 2020 |
| One Upland Road and 100 Tech Drive | | Greater Boston | | — | | | 34,353 | | | 206,477 | | | 792 | | | 34,353 | | | 207,269 | | | 241,622 | | | (8,552) | | | 233,070 | | | 2007 - 2015 | | 2018 - 2020 |
| Alexandria Park at 128 | | Greater Boston | | — | | | 10,439 | | | 41,596 | | | 80,494 | | | 10,439 | | | 122,090 | | | 132,529 | | | (48,078) | | | 84,451 | | | 1997 - 2010 | | 1998 - 2008 |
| 225, 266, and 275 Second Avenue | | Greater Boston | | — | | | 17,086 | | | 69,994 | | | 62,250 | | | 17,086 | | | 132,244 | | | 149,330 | | | (26,687) | | | 122,643 | | | 2014 - 2018 | | 2014 - 2017 |
| 19 Presidential Way | | Greater Boston | | — | | | 12,833 | | | 27,333 | | | 24,983 | | | 12,833 | | | 52,316 | | | 65,149 | | | (20,356) | | | 44,793 | | | 1999 | | 2005 |
| 100 Beaver Street | | Greater Boston | | — | | | 1,466 | | | 9,046 | | | 26,102 | | | 1,466 | | | 35,148 | | | 36,614 | | | (8,478) | | | 28,136 | | | 2006 | | 2005 |
| 285 Bear Hill Road | | Greater Boston | | — | | | 422 | | | 3,538 | | | 6,910 | | | 422 | | | 10,448 | | | 10,870 | | | (2,671) | | | 8,199 | | | 2013 | | 2011 |
| 111 and 130 Forbes Boulevard | | Greater Boston | | — | | | 3,146 | | | 15,725 | | | 4,268 | | | 3,146 | | | 19,993 | | | 23,139 | | | (6,777) | | | 16,362 | | | 2006 | | 2006 - 2007 |
| 20 Walkup Drive | | Greater Boston | | — | | | 2,261 | | | 7,099 | | | 9,029 | | | 2,261 | | | 16,128 | | | 18,389 | | | (4,271) | | | 14,118 | | | 2012 | | 2006 |
Alexandria Center® for Science and Technology – Mission Bay | | San Francisco | | — | | | 211,450 | | | 210,211 | | | 466,874 | | | 211,450 | | | 677,085 | | | 888,535 | | | (164,476) | | | 724,059 | | | 2007 - 2014 | | 2004 - 2017 |
| 260 Townsend Street | | San Francisco | | 27,651 | | | 26,392 | | | 33,921 | | | (12,883) | | | 26,392 | | | 21,038 | | | 47,430 | | | (1,585) | | | 45,845 | | | 2017 | | 2019 |
| 88 Bluxome Street | | San Francisco | | — | | | 148,551 | | | 21,514 | | | 129,960 | | | 148,551 | | | 151,474 | | | 300,025 | | | (23,098) | | | 276,927 | | | N/A | | 2017 |
Alexandria Technology Center® – Gateway | | San Francisco | | — | | | 193,004 | | | 364,078 | | | 180,021 | | | 193,004 | | | 544,099 | | | 737,103 | | | (82,363) | | | 654,740 | | | 1984 - 2019 | | 2002 - 2020 |
| 213, 249, 259, 269, and 279 East Grand Avenue | | San Francisco | | — | | | 59,199 | | | — | | | 544,282 | | | 59,199 | | | 544,282 | | | 603,481 | | | (68,787) | | | 534,694 | | | 2008 - 2019 | | 2004 |
| 201 Haskins Way | | San Francisco | | — | | | 32,245 | | | 1,287 | | | 222,460 | | | 32,245 | | | 223,747 | | | 255,992 | | | (1,445) | | | 254,547 | | | N/A | | 2017 |
| | | | | | | | | | | | | | | | | | | | | | | | | | | | | | | | | | | | | | | | | | | | | | | | | | | | | | | | | | | | | | | | | | | | | | | | | | |
| | | | | | Initial Costs | | Costs Capitalized Subsequent to Acquisitions | | Total Costs | | | | | | | | |
| Property | | Market | | Encumbrances | | Land | | Buildings & Improvements | | Buildings & Improvements | | Land | | Buildings & Improvements | | Total(1) | | Accumulated Depreciation(2) | | Net Cost Basis | | Date of Construction(3) | | Date
Acquired |
| 400 and 450 East Jamie Court | | San Francisco | | — | | | — | | | — | | | 119,875 | | | — | | | 119,875 | | | 119,875 | | | (53,671) | | | 66,204 | | | 2012 | | 2002 |
| 500 Forbes Boulevard | | San Francisco | | — | | | 35,596 | | | 69,091 | | | 17,503 | | | 35,596 | | | 86,594 | | | 122,190 | | | (29,344) | | | 92,846 | | | 2001 | | 2007 |
| 7000 Shoreline Court | | San Francisco | | — | | | 7,038 | | | 39,704 | | | 27,196 | | | 7,038 | | | 66,900 | | | 73,938 | | | (21,413) | | | 52,525 | | | 2001 | | 2004 |
| 341 and 343 Oyster Point Boulevard | | San Francisco | | — | | | 7,038 | | | — | | | 43,966 | | | 7,038 | | | 43,966 | | | 51,004 | | | (19,488) | | | 31,516 | | | 2009 - 2013 | | 2000 |
| 849/863 Mitten Road/866 Malcolm Road | | San Francisco | | — | | | 3,211 | | | 8,665 | | | 27,482 | | | 3,211 | | | 36,147 | | | 39,358 | | | (14,485) | | | 24,873 | | | 2012 | | 1998 |
Alexandria Center® for Life Science – San Carlos | | San Francisco | | — | | | 291,516 | | | 5,689 | | | 430,199 | | | 291,516 | | | 435,888 | | | 727,404 | | | (6,034) | | | 721,370 | | | 1974 - 2020 | | 2017 - 2020 |
| 3825 and 3875 Fabian Way | | San Francisco | | — | | | 194,424 | | | 54,519 | | | 2,293 | | | 194,424 | | | 56,812 | | | 251,236 | | | (2,986) | | | 248,250 | | | 1969 - 2014 | | 2019 |
| Alexandria Stanford Life Science District | | San Francisco | | — | | | — | | | 260,931 | | | 38,072 | | | — | | | 299,003 | | | 299,003 | | | (15,691) | | | 283,312 | | | 1998 - 2019 | | 2003 - 2020 |
| Alexandria PARC | | San Francisco | | — | | | 72,859 | | | 53,309 | | | 22,970 | | | 72,859 | | | 76,279 | | | 149,138 | | | (6,274) | | | 142,864 | | | 1984 - 2019 | | 2018 |
| 3330, 3412, 3450, and 3460 Hillview Avenue | | San Francisco | | — | | | — | | | 161,717 | | | 3,366 | | | — | | | 165,083 | | | 165,083 | | | (2,859) | | | 162,224 | | | 1978 - 2018 | | 2020 |
| 2425 Garcia Avenue/2400/2450 Bayshore Parkway | | San Francisco | | 703 | | | 1,512 | | | 21,323 | | | 26,261 | | | 1,512 | | | 47,584 | | | 49,096 | | | (23,940) | | | 25,156 | | | 2008 | | 1999 |
| Shoreway Science Center | | San Francisco | | — | | | 20,049 | | | 48,554 | | | 183 | | | 20,049 | | | 48,737 | | | 68,786 | | | (2,527) | | | 66,259 | | | 2016 | | 2019 |
| 1450 Page Mill Road | | San Francisco | | — | | | — | | | 84,467 | | | 105 | | | — | | | 84,572 | | | 84,572 | | | (7,749) | | | 76,823 | | | 2017 | | 2017 |
| 3350 West Bayshore Road | | San Francisco | | — | | | 4,800 | | | 6,693 | | | 32,398 | | | 4,800 | | | 39,091 | | | 43,891 | | | (6,587) | | | 37,304 | | | 1982 | | 2005 |
| 2625/2627/2631 Hanover Street | | San Francisco | | — | | | — | | | 6,628 | | | 11,941 | | | — | | | 18,569 | | | 18,569 | | | (11,027) | | | 7,542 | | | 2000 | | 1999 |
Alexandria Center® for Life Science | | New York City | | — | | | — | | | — | | | 869,765 | | | — | | | 869,765 | | | 869,765 | | | (199,418) | | | 670,347 | | | 2010 - 2016 | | 2006 |
| 219 East 42nd Street | | New York City | | — | | | 141,266 | | | 63,312 | | | 3,449 | | | 141,266 | | | 66,761 | | | 208,027 | | | (22,633) | | | 185,394 | | | 1995 | | 2018 |
| 47-50 30th Street | | New York City | | — | | | 22,746 | | | 53,093 | | | 83,773 | | | 22,746 | | | 136,866 | | | 159,612 | | | (1,080) | | | 158,532 | | | 1926 | | 2018 |
Alexandria Center® – Long Island City | | New York City | | — | | | 25,000 | | | — | | | 4,350 | | | 25,000 | | | 4,350 | | | 29,350 | | | — | | | 29,350 | | | 1942 | | 2019 |
| ARE Spectrum | | San Diego | | — | | | 32,361 | | | 80,957 | | | 231,597 | | | 32,361 | | | 312,554 | | | 344,915 | | | (64,571) | | | 280,344 | | | 2008 - 2017 | | 2007 - 2012 |
| ARE Torrey Ridge | | San Diego | | — | | | 22,124 | | | 152,840 | | | 58,297 | | | 22,124 | | | 211,137 | | | 233,261 | | | (45,047) | | | 188,214 | | | 2003 - 2004 | | 2016 |
| ARE Sunrise | | San Diego | | — | | | 5,408 | | | 17,947 | | | 77,646 | | | 5,408 | | | 95,593 | | | 101,001 | | | (58,692) | | | 42,309 | | | 2000 - 2015 | | 1994 - 2004 |
| ARE Nautilus | | San Diego | | — | | | 6,684 | | | 27,600 | | | 124,147 | | | 6,684 | | | 151,747 | | | 158,431 | | | (52,941) | | | 105,490 | | | 2009 - 2012 | | 1994 - 1997 |
| 11119, 11255, and 11355 North Torrey Pines Road | | San Diego | | — | | | 113,931 | | | 38,453 | | | 37,105 | | | 113,931 | | | 75,558 | | | 189,489 | | | (22,971) | | | 166,518 | | | 1980 - 2012 | | 2007 - 2020 |
| 3545 Cray Court | | San Diego | | — | | | 7,056 | | | 53,944 | | | 44,298 | | | 7,056 | | | 98,242 | | | 105,298 | | | (40,636) | | | 64,662 | | | 1998 | | 2014 |
| Alexandria Point | | San Diego | | — | | | 88,016 | | | 393,713 | | | 460,807 | | | 88,016 | | | 854,520 | | | 942,536 | | | (133,773) | | | 808,763 | | | 1988 - 2019 | | 2010 - 2019 |
| 5200 Illumina Way | | San Diego | | — | | | 38,340 | | | 96,606 | | | 195,693 | | | 38,340 | | | 292,299 | | | 330,639 | | | (57,220) | | | 273,419 | | | 2004 - 2017 | | 2010 |
| University District | | San Diego | | — | | | 61,753 | | | 49,692 | | | 208,922 | | | 61,753 | | | 258,614 | | | 320,367 | | | (93,805) | | | 226,562 | | | 1989 - 2018 | | 1998 - 2020 |
| SD Tech by Alexandria | | San Diego | | — | | | 81,428 | | | 254,069 | | | 58,893 | | | 81,428 | | | 312,962 | | | 394,390 | | | (10,487) | | | 383,903 | | | 1988 - 2015 | | 2013 - 2020 |
| 6420 and 6450 Sequence Drive | | San Diego | | — | | | 79,145 | | | 87,550 | | | 914 | | | 79,145 | | | 88,464 | | | 167,609 | | | (335) | | | 167,274 | | | 1998 | | 2020 |
| Summers Ridge Science Park | | San Diego | | — | | | 21,154 | | | 102,046 | | | 3,572 | | | 21,154 | | | 105,618 | | | 126,772 | | | (8,142) | | | 118,630 | | | 2005 | | 2018 |
| ARE Portola | | San Diego | | — | | | 6,991 | | | 25,153 | | | 39,960 | | | 6,991 | | | 65,113 | | | 72,104 | | | (15,388) | | | 56,716 | | | 2005 - 2012 | | 2007 |
| 5810/5820 Nancy Ridge Drive | | San Diego | | — | | | 3,492 | | | 18,285 | | | 12,976 | | | 3,492 | | | 31,261 | | | 34,753 | | | (11,316) | | | 23,437 | | | 2000 | | 2004 |
| 7330 Carroll Road | | San Diego | | — | | | 2,650 | | | 19,878 | | | 1,931 | | | 2,650 | | | 21,809 | | | 24,459 | | | (7,896) | | | 16,563 | | | 2007 | | 2010 |
| | | | | | | | | | | | | | | | | | | | | | | | | | | | | | | | | | | | | | | | | | | | | | | | | | | | | | | | | | | | | | | | | | | | | | | | | | |
| | | | | | Initial Costs | | Costs Capitalized Subsequent to Acquisitions | | Total Costs | | | | | | | | |
| Property | | Market | | Encumbrances | | Land | | Buildings & Improvements | | Buildings & Improvements | | Land | | Buildings & Improvements | | Total(1) | | Accumulated Depreciation(2) | | Net Cost Basis | | Date of Construction(3) | | Date
Acquired |
| 9877 Waples Street | | San Diego | | — | | | 5,092 | | | 11,908 | | | 10,403 | | | 5,092 | | | 22,311 | | | 27,403 | | | — | | | 27,403 | | | 2020 | | 2020 |
| 5871 Oberlin Drive | | San Diego | | — | | | 1,349 | | | 8,016 | | | 18,242 | | | 1,349 | | | 26,258 | | | 27,607 | | | (2,242) | | | 25,365 | | | 2004 | | 2010 |
| 3911, 3931, 3985, 4025, 4031, 4045, and 4075 Sorrento Valley Boulevard | | San Diego | | — | | | 18,177 | | | 42,723 | | | 24,997 | | | 18,177 | | | 67,720 | | | 85,897 | | | (28,914) | | | 56,983 | | | 2007 - 2015 | | 2010 - 2019 |
| 11025, 11035, 11045, 11055, 11065, and 11075 Roselle Street | | San Diego | | — | | | 4,156 | | | 11,571 | | | 45,388 | | | 4,156 | | | 56,959 | | | 61,115 | | | (15,222) | | | 45,893 | | | 2006 - 2014 | | 1997 - 2014 |
| 13112 Evening Creek Drive | | San Diego | | — | | | 7,393 | | | 27,950 | | | 232 | | | 7,393 | | | 28,182 | | | 35,575 | | | (14,889) | | | 20,686 | | | 2007 | | 2007 |
| Townsgate by Alexandria | | San Diego | | — | | | 16,416 | | | — | | | 6,008 | | | 16,416 | | | 6,008 | | | 22,424 | | | — | | | 22,424 | | | N/A | | 2018 |
| The Eastlake Life Science Campus by Alexandria | | Seattle | | — | | | 51,750 | | | 83,012 | | | 598,297 | | | 51,750 | | | 681,309 | | | 733,059 | | | (149,713) | | | 583,346 | | | 1997 - 2019 | | 2002 - 2020 |
| 400 Dexter Avenue North | | Seattle | | — | | | 11,342 | | | — | | | 224,090 | | | 11,342 | | | 224,090 | | | 235,432 | | | (31,427) | | | 204,005 | | | 2017 | | 2007 |
| 2301 5th Avenue | | Seattle | | — | | | 6,543 | | | 76,180 | | | 1,634 | | | 6,543 | | | 77,814 | | | 84,357 | | | (5,212) | | | 79,145 | | | 2002 | | 2018 |
| 219 Terry Avenue North | | Seattle | | — | | | 1,819 | | | 2,302 | | | 19,975 | | | 1,819 | | | 22,277 | | | 24,096 | | | (8,104) | | | 15,992 | | | 2012 | | 2007 |
| 601 Dexter Avenue North | | Seattle | | — | | | 29,412 | | | 408 | | | 5,950 | | | 29,412 | | | 6,358 | | | 35,770 | | | — | | | 35,770 | | | 1985 | | 2019 |
| 701 Dexter Avenue North | | Seattle | | — | | | 35,316 | | | 719 | | | 17,576 | | | 35,316 | | | 18,295 | | | 53,611 | | | (727) | | | 52,884 | | | 1984 | | 2018 |
| 830 4th Avenue South | | Seattle | | — | | | 6,500 | | | 12,062 | | | 768 | | | 6,500 | | | 12,830 | | | 19,330 | | | (133) | | | 19,197 | | | 1995 | | 2020 |
| 3000/3018 Western Avenue | | Seattle | | — | | | 1,432 | | | 7,497 | | | 24,294 | | | 1,432 | | | 31,791 | | | 33,223 | | | (19,282) | | | 13,941 | | | 2000 | | 1998 |
| 410 West Harrison/410 Elliott Avenue West | | Seattle | | — | | | 3,857 | | | 1,989 | | | 12,723 | | | 3,857 | | | 14,712 | | | 18,569 | | | (5,913) | | | 12,656 | | | 2006 - 2008 | | 2004 |
| 1010 4th Avenue South | | Seattle | | — | | | 46,200 | | | — | | | 3,078 | | | 46,200 | | | 3,078 | | | 49,278 | | | — | | | 49,278 | | | N/A | | 2020 |
| 9800, 9804, 9900, 9920, and 9950 Medical Center Drive | | Maryland | | — | | | 20,219 | | | 112,543 | | | 256,636 | | | 20,219 | | | 369,179 | | | 389,398 | | | (84,469) | | | 304,929 | | | 1985 - 2018 | | 2004 - 2017 |
| 9704, 9708, 9712, and 9714 Medical Center Drive | | Maryland | | — | | | 10,258 | | | 74,173 | | | 1,449 | | | 10,258 | | | 75,622 | | | 85,880 | | | (5,192) | | | 80,688 | | | 2015 | | 2018 |
| 1330 Piccard Drive | | Maryland | | — | | | 2,800 | | | 11,533 | | | 35,783 | | | 2,800 | | | 47,316 | | | 50,116 | | | (20,507) | | | 29,609 | | | 2005 | | 1997 |
| 9605 Medical Center Drive | | Maryland | | — | | | — | | | 24,911 | | | 5,416 | | | — | | | 30,327 | | | 30,327 | | | (470) | | | 29,857 | | | 2004 | | 2020 |
| 1500 and 1550 East Gude Drive | | Maryland | | — | | | 1,523 | | | 7,731 | | | 7,584 | | | 1,523 | | | 15,315 | | | 16,838 | | | (9,756) | | | 7,082 | | | 1995 - 2003 | | 1997 |
| 14920 and 15010 Broschart Road | | Maryland | | — | | | 4,904 | | | 15,846 | | | 5,847 | | | 4,904 | | | 21,693 | | | 26,597 | | | (6,613) | | | 19,984 | | | 1998 - 1999 | | 2004 - 2010 |
| 1405 Research Boulevard | | Maryland | | — | | | 899 | | | 21,946 | | | 14,975 | | | 899 | | | 36,921 | | | 37,820 | | | (16,303) | | | 21,517 | | | 2006 | | 1997 |
| 5 Research Place | | Maryland | | — | | | 1,466 | | | 5,708 | | | 30,340 | | | 1,466 | | | 36,048 | | | 37,514 | | | (15,910) | | | 21,604 | | | 2010 | | 2001 |
| 5 Research Court | | Maryland | | — | | | 1,647 | | | 13,258 | | | 24,099 | | | 1,647 | | | 37,357 | | | 39,004 | | | (15,484) | | | 23,520 | | | 2007 | | 2004 |
| 9920 Belward Campus Drive | | Maryland | | — | | | 2,732 | | | 12,308 | | | 86 | | | 2,732 | | | 12,394 | | | 15,126 | | | (847) | | | 14,279 | | | 2007 | | 2018 |
| 12301 Parklawn Drive | | Maryland | | — | | | 1,476 | | | 7,267 | | | 1,435 | | | 1,476 | | | 8,702 | | | 10,178 | | | (3,168) | | | 7,010 | | | 2007 | | 2004 |
| 14200 Shady Grove Road | | Maryland | | — | | | 25,000 | | | — | | | 3,668 | | | 25,000 | | | 3,668 | | | 28,668 | | | — | | | 28,668 | | | N/A | | 2019 |
Alexandria Technology Center® – Gaithersburg I | | Maryland | | — | | | 20,980 | | | 121,952 | | | 47,454 | | | 20,980 | | | 169,406 | | | 190,386 | | | (41,239) | | | 149,147 | | | 1992 - 2019 | | 1997 - 2019 |
Alexandria Technology Center® – Gaithersburg II | | Maryland | | — | | | 13,942 | | | 64,573 | | | 42,823 | | | 13,942 | | | 107,396 | | | 121,338 | | | (30,683) | | | 90,655 | | | 2000 - 2020 | | 1997 - 2020 |
| 401 Professional Drive | | Maryland | | — | | | 1,129 | | | 6,941 | | | 10,477 | | | 1,129 | | | 17,418 | | | 18,547 | | | (7,792) | | | 10,755 | | | 2007 | | 1996 |
| 950 Wind River Lane | | Maryland | | — | | | 2,400 | | | 10,620 | | | 1,050 | | | 2,400 | | | 11,670 | | | 14,070 | | | (3,633) | | | 10,437 | | | 2009 | | 2010 |
| 620 Professional Drive | | Maryland | | — | | | 784 | | | 4,705 | | | 7,353 | | | 784 | | | 12,058 | | | 12,842 | | | (6,324) | | | 6,518 | | | 2012 | | 2005 |
| | | | | | | | | | | | | | | | | | | | | | | | | | | | | | | | | | | | | | | | | | | | | | | | | | | | | | | | | | | | | | | | | | | | | | | | | | |
| | | | | | Initial Costs | | Costs Capitalized Subsequent to Acquisitions | | Total Costs | | | | | | | | |
| Property | | Market | | Encumbrances | | Land | | Buildings & Improvements | | Buildings & Improvements | | Land | | Buildings & Improvements | | Total(1) | | Accumulated Depreciation(2) | | Net Cost Basis | | Date of Construction(3) | | Date
Acquired |
| 8000/9000/10000 Virginia Manor Road | | Maryland | | — | | | — | | | 13,679 | | | 9,301 | | | — | | | 22,980 | | | 22,980 | | | (10,953) | | | 12,027 | | | 2003 | | 1998 |
| 14225 Newbrook Drive | | Maryland | | — | | | 4,800 | | | 27,639 | | | 21,233 | | | 4,800 | | | 48,872 | | | 53,672 | | | (18,339) | | | 35,333 | | | 2006 | | 1997 |
Alexandria Center® for Life Science – Durham | | Research Triangle | | — | | | 48,652 | | | 471,263 | | | 27,030 | | | 48,652 | | | 498,293 | | | 546,945 | | | (2,953) | | | 543,992 | | | 1985 - 2013 | | 2020 |
Alexandria Center® for AgTech | | Research Triangle | | — | | | 2,801 | | | 6,756 | | | 140,316 | | | 2,801 | | | 147,072 | | | 149,873 | | | (5,304) | | | 144,569 | | | 2018 | | 2017 - 2018 |
Alexandria Center® for Advanced Technologies | | Research Triangle | | — | | | 9,029 | | | 10,712 | | | 51,436 | | | 9,029 | | | 62,148 | | | 71,177 | | | (13,540) | | | 57,637 | | | 2012 | | 2012 |
Alexandria Technology Center® – Alston | | Research Triangle | | — | | | 1,430 | | | 17,482 | | | 31,646 | | | 1,430 | | | 49,128 | | | 50,558 | | | (24,867) | | | 25,691 | | | 1985 - 2009 | | 1998 |
| 108/110/112/114 TW Alexander Drive | | Research Triangle | | — | | | — | | | 376 | | | 43,348 | | | — | | | 43,724 | | | 43,724 | | | (21,263) | | | 22,461 | | | 2000 | | 1999 |
Alexandria Innovation Center® – Research Triangle | | Research Triangle | | — | | | 1,065 | | | 21,218 | | | 30,362 | | | 1,065 | | | 51,580 | | | 52,645 | | | (20,653) | | | 31,992 | | | 2005 - 2008 | | 2000 |
| 7 Triangle Drive | | Research Triangle | | — | | | 701 | | | — | | | 32,516 | | | 701 | | | 32,516 | | | 33,217 | | | (8,183) | | | 25,034 | | | 2011 | | 2005 |
| 2525 East NC Highway 54 | | Research Triangle | | — | | | 713 | | | 12,827 | | | 20,700 | | | 713 | | | 33,527 | | | 34,240 | | | (11,380) | | | 22,860 | | | 1995 | | 2004 |
| 407 Davis Drive | | Research Triangle | | — | | | 1,229 | | | 17,733 | | | 1,028 | | | 1,229 | | | 18,761 | | | 19,990 | | | (4,028) | | | 15,962 | | | 1998 | | 2013 |
| 601 Keystone Park Drive | | Research Triangle | | — | | | 785 | | | 11,546 | | | 7,112 | | | 785 | | | 18,658 | | | 19,443 | | | (6,653) | | | 12,790 | | | 2009 | | 2006 |
| 6040 George Watts Hill Drive | | Research Triangle | | — | | | — | | | — | | | 26,344 | | | — | | | 26,344 | | | 26,344 | | | (3,926) | | | 22,418 | | | 2015 | | 2014 |
| 5 Triangle Drive | | Research Triangle | | — | | | 161 | | | 3,409 | | | 12,578 | | | 161 | | | 15,987 | | | 16,148 | | | (5,947) | | | 10,201 | | | 1981 | | 1998 |
| 6101 Quadrangle Drive | | Research Triangle | | — | | | 951 | | | 3,982 | | | 11,316 | | | 951 | | | 15,298 | | | 16,249 | | | (3,709) | | | 12,540 | | | 2012 | | 2008 |
| Canada | | Canada | | — | | | 10,350 | | | 43,884 | | | 18,382 | | | 10,350 | | | 62,266 | | | 72,616 | | | (27,478) | | | 45,138 | | | 2004 - 2012 | | 2005 - 2007 |
| Various | | Various | | — | | | 162,537 | | | 185,905 | | | 306,676 | | | 162,537 | | | 492,581 | | | 655,118 | | | (61,474) | | | 593,644 | | | Various | | Various |
| Total – North America | | | | 230,925 | | | 4,200,638 | | | 7,319,297 | | | 9,718,420 | | | 4,200,638 | | | 17,037,717 | | | 21,238,355 | | | (3,178,024) | | | 18,060,331 | | | | | |
| Asia | | | | — | | | — | | | — | | | 36,455 | | | — | | | 36,455 | | | 36,455 | | | (4,414) | | | 32,041 | | | 2015 | | 2008 |
| | | | $ | 230,925 | | | $ | 4,200,638 | | | $ | 7,319,297 | | | $ | 9,754,875 | | | $ | 4,200,638 | | | $ | 17,074,172 | | | $ | 21,274,810 | | | $ | (3,182,438) | | | $ | 18,092,372 | | | | | |
Alexandria Real Estate Equities, Inc.
Consolidated Financial Statement Schedule of Rental Properties and Accumulated Depreciation
December 31, 2020
(Dollars in thousands)
(1)As of December 31, 2020, the total cost of our real estate assets aggregated $21.3 billion, which exceeded the cost of real estate for federal income tax purposes aggregating $20.4 billion by approximately $881.3 million.
(2)The depreciable life ranges up to 40 years for buildings and improvements, up to 20 years for land improvements, and the term of the respective lease for tenant improvements.
(3)Represents the later of the date of original construction or the date of the latest renovation.
Alexandria Real Estate Equities, Inc.
Consolidated Financial Statement Schedule of Real Estate and Accumulated Depreciation
December 31, 2020
(In thousands)
A summary of activity of consolidated investments in real estate and accumulated depreciation is as follows:
| | | | | | | | | | | | | | | | | | | | |
| | December 31, |
| Real Estate | | 2020 | | 2019 | | 2018 |
Balance at beginning of period | | $ | 17,552,956 | | | $ | 14,181,780 | | | $ | 12,178,255 | |
Acquisitions (including real estate, land, and joint venture consolidation) | | 2,825,537 | | | 2,240,376 | | | 1,057,036 | |
Additions to real estate | | 1,505,152 | | | 1,143,035 | | | 959,410 | |
Deductions (including dispositions and direct financing leases) | | (608,835) | | | (12,235) | | | (12,921) | |
Balance at end of period | | $ | 21,274,810 | | | $ | 17,552,956 | | | $ | 14,181,780 | |
| | | | | | |
| | December 31, |
| Accumulated Depreciation | | 2020 | | 2019 | | 2018 |
Balance at beginning of period | | $ | 2,708,918 | | | $ | 2,268,087 | | | $ | 1,880,236 | |
Depreciation expense on properties | | 530,226 | | | 448,661 | | | 390,471 | |
Sale of properties | | (56,706) | | | (7,830) | | | (2,620) | |
Balance at end of period | | $ | 3,182,438 | | | $ | 2,708,918 | | | $ | 2,268,087 | |