UNITED STATES
SECURITIES AND EXCHANGE COMMISSION
WASHINGTON, D.C. 20549
FORM 10-K
(Mark One)
ý | ANNUAL REPORT PURSUANT TO SECTION 13 OR 15(d) OF THE SECURITIES EXCHANGE ACT OF 1934 |
For the fiscal period ended September 30, 2017
OR
¨ | TRANSITION REPORT PURSUANT TO SECTION 13 OR 15(d) OF THE SECURITIES EXCHANGE ACT OF 1934 |
Commission File Number 000-30407
SONIC FOUNDRY, INC.
(Exact name of registrant as specified in its charter)
MARYLAND | 39-1783372 | |
(State or other jurisdiction of incorporation or organization) | (I.R.S. Employer Identification No.) | |
222 W. Washington Ave, Madison, WI 53703 | (608) 443-1600 | |
(Address of principal executive offices) | (Issuer’s telephone number) | |
Securities registered pursuant to Section 12(b) of the Act: None
Securities registered pursuant to Section 12(g) of the Act: Common stock par value $0.01 per share
Indicate by check mark if the registrant is a well-known seasoned issuer as defined in Rule 405 of the Securities Act. Yes ¨ No ý
Indicate by check mark if the registrant is not required to file reports pursuant to Section 13 or 15(d) of the Act. Yes ¨ No ý
Indicate by check mark whether the registrant (1) has filed all reports required to be filed by Section 13 or 15(d) of the Securities Exchange Act of 1934 during the preceding 12 months (or for such shorter period that the registrant was required to file such reports), and (2) has been subject to such filing requirements for the past 90 days. Yes ý No ¨
Indicate by check mark if disclosure of delinquent filers pursuant to Item 405 of Regulation S-K is not contained herein, and will not be contained, to the best of registrant’s knowledge, in definitive proxy or information statements incorporated by reference in Part III of this Form 10-K or any amendment to this Form 10-K. Yes ý No ¨
Indicate by check mark whether the registrant has submitted electronically and posted on its corporate Web site, if any, every Interactive Data File required to be submitted and posted pursuant to Rule 405 of Regulation S-T (§ 232.405 of this chapter) during the preceding 12 months (or for such shorter period that the registrant was required to submit and post such files). Yes ý No ¨
Indicate by check mark whether the registrant is a large accelerated filer, an accelerated filer, a non-accelerated filer, a small reporting company, or an emerging growth company. See the definitions of “large accelerated filer,” “accelerated filer”, “smaller reporting company”, and "emerging growth company" in Rule 12b-2 of the Exchange Act.
Large accelerated filer | ¨ | Accelerated filer | ¨ | |||
Non-accelerated filer | ¨ | Smaller reporting company | x | |||
Emerging growth company | ¨ | |||||
If an emerging growth company, indicate by check mark if the registrant has elected not to use the extended transition period for complying with any new or revised financial accounting standards provided pursuant to Section 13(a) of the Exchange Act. ¨
Indicate by check mark whether the registrant is a shell company (as defined in Rule 12b-2 of the Act). Yes ¨ No ý
The aggregate market value of the registrant’s common stock held by non-affiliates computed by reference to the price at which the common equity was last sold, or the average bid and asked price of such common equity, as of the last business day of the Registrant’s most recently completed second fiscal quarter was approximately $19,284,000.
The number of shares outstanding of the registrant’s common equity was 4,458,075 as of December 29, 2017.
1
DOCUMENTS INCORPORATED BY REFERENCE
Portions of the Proxy Statement for the 2018 Annual Meeting of Stockholders are incorporated by reference into Part III. A definitive Proxy Statement pursuant to Regulation 14A will be filed with the Commission no later than January 28, 2018.
2
TABLE OF CONTENTS
PAGE NO. | ||
3
This annual report on Form 10-K (this "Report") contains statements that are considered forward-looking statements within the meaning of Section 27A of the Securities Act of 1933, as amended, and its rules and regulations (the "Securities Act"), and Section 21E of the Securities Exchange Act of 1934, as amended, and its rules and regulations (the "Exchange Act"). When used in this Report, the words “anticipate”, “expect”, “plan”, “believe”, “seek”, “estimate” and similar expressions are intended to identify such forward-looking statements. These are statements that relate to future periods and include, but are not limited to, statements about the features, benefits and performance of our Rich Media products, our ability to introduce new product offerings and increase revenue from existing products, expected expenses including those related to selling and marketing, product development and general and administrative, our beliefs regarding the health and growth of the market for our products, anticipated increase in our customer base, expansion of our products functionalities, expected revenue levels and sources of revenue, expected impact, if any, of legal proceedings, the adequacy of liquidity and capital resources, and expected growth in business. Forward-looking statements are subject to risks and uncertainties that could cause actual results to differ materially from those projected. These risks and uncertainties include, but are not limited to, market acceptance for our products, our ability to attract and retain customers and distribution partners for existing and new products, our ability to control our expenses, our ability to recruit and retain employees, the ability of distribution partners to successfully sell our products, legislation and government regulation, shifts in technology, global and local business conditions, our ability to effectively maintain and update our products and service portfolio, the strength of competitive offerings, the prices being charged by those competitors, and the risks discussed elsewhere herein. These forward-looking statements speak only as of the date hereof. We expressly disclaim any obligation or undertaking to release publicly any updates or revisions to any forward-looking statements contained herein to reflect any change in our expectations with regard thereto or any change in events, conditions or circumstances on which any such statement is based.
PART I
ITEM 1. BUSINESS
Who We Are
Sonic Foundry, Inc. (NASDAQ: SOFO) (the "Company") is the trusted global leader for video capture, management and webcasting solutions in education, business and government. Mediasite transforms communications, training, education and events for more than 4,700 customers in over 65 countries. Sonic Foundry is a leader in Aragon Research’s Globe™ for Video Content Management, winner of Frost & Sullivan’s Global Market Share Leadership Award in Lecture Capture Solutions for seven consecutive years, a leader in Forrester’s Enterprise Video Platforms and Webcasting Wave™ and a challenger in Gartner’s Magic Quadrant™ for enterprise video content management.
Sonic Foundry, Inc. was founded in 1991, incorporated in Wisconsin in March 1994 and merged into a Maryland corporation of the same name in October 1996. Our executive offices are located at 222 West Washington Ave., Madison, Wisconsin 53703 and our telephone number is (608) 443-1600. Our Sonic Foundry International B.V. ("Sonic Foundry International") (formerly Media Mission B.V.) office is located in the Netherlands, and our Mediasite K.K. ("Mediasite KK" or "MSKK") office is located in Japan. Our corporate website is www.sonicfoundry.com. In the “Investors” section of our website we make available, free of charge, our annual report on Form 10-K, quarterly reports on Form 10-Q, current reports on Form 8-K and amendments to reports required to be filed pursuant to Sections 13(a) and 15(d) of the Securities Exchange Act of 1934, as soon as reasonably practicable after the filing of such reports with the Securities and Exchange Commission.
Challenges We Address
Every organization faces a fundamental need to share information and communicate efficiently. Universities and colleges connect instructors with students to educate and prepare the next generation. Businesses strive for effective communication and collaboration among employees to provide value to customers. Government agencies must keep partners, stakeholders and constituents informed to operate effectively. And yet, communication and e-learning challenges remain, including how to:
• | Improve learners’ academic and professional success |
• | Keep geographically-dispersed audiences and mobile teams connected |
• | Boost productivity and overall organizational knowledge |
• | Reduce logistical and financial impacts of day-to-day communications |
Sonic Foundry Solutions
Sonic Foundry transforms the way organizations share and use information with these video solutions:
Mediasite Video Platform
Mediasite Video Platform is a scalable on-premises solution to publish, stream, manage, search and analyze all video. With Mediasite Video Platform, enterprises and education institutions:
• | Stream live and on-demand video to any device |
4
• | Create an enterprise or campus YouTube with Mediasite Showcase |
• | Automatically publish video to their learning management system (LMS), content management system (CMS), training portal or any website |
• | Deepen engagement and improve learning with polls, ask-a-question, surveys and other interactive tools |
• | Search everything with fully indexed audio, video and slide content |
• | Monitor who is watching what videos when to measure learner engagement and outcomes |
• | Centrally manage and secure any video |
Mediasite Video Cloud
Mediasite Video Cloud is a secure, reliable SaaS (Software as a Service) solution offering the same capabilities as Mediasite Video Platform to publish, stream, manage, search and analyze all video. Customers conveniently host and manage all of their content with Mediasite Video Cloud, or use as needed for large events to divert heavy viewing traffic from their on-premises Mediasite Video Platform. Our co-located and high availability data center and experienced team successfully manage customers’ cloud-based video streaming in secure, fault-tolerant environment.
Mediasite Capture Solutions
Valuable knowledge and expertise is shared every minute, but what’s the best way to capture that knowledge before it evaporates into thin air? Mediasite provides flexible options to record and upload any video-based content from anywhere.
• | My Mediasite: My Mediasite makes it a snap for instructors, employees and students to create great looking videos, screencasts and slideshows from their computers or mobile devices. From demos and video training to flipped classes, lectures and assignments, everything to record, upload, manage and publish personal videos is in one simple-to-use tool, requiring no pro video skills. |
• | Mediasite RL Recorders: The RL Series of built-in room appliances uses schedule-based capture and advanced audio/video integration to fully automate video and content recording in lecture halls, training rooms, simulation labs and auditoriums. Instructors and speakers teach and present as they are most comfortable, free from technology worries and confident that everything they say and show is captured. |
• | Mediasite RL Mini: Our latest video capture solution, the Mini, provides the automation and high-quality capture Mediasite is known for in a compact, affordable device, ensuring even more students never miss a lecture. With the Mini, there’s no need for AV in the room. Instructors simply plug in their laptop and camera and start teaching. The plug-and-play device makes it easy to build or expand an automated lecture capture programs in community colleges, vocational-tech schools, small departments and even K12 classrooms. |
• | Mediasite Catch: Our latest video capture solution, Mediasite Catch, provides a scalable, economical solution to extend video capture to any classrooms on campus, even if they’re not equipped with extensive audio/video capabilities. Combining the reliability of Mediasite’s recorder-based scheduling automation with the affordability and simplicity of podium-based software, Mediasite Catch provides faculty a worry-free classroom recording experience. |
• | Mediasite ML Recorders: Anyone can be a video producer with the ML Series of portable recording solutions to capture and stream broadcast-quality video. Designed for on-the-go webcasting, hybrid events, guest speakers and conferences, Mediasite ML’s lightweight design moves easily from location to location and can be set up and ready to record in only a few minutes. |
• | Mediasite Join: Real-time video is how today’s best teams, businesses and schools collaborate, exchange ideas and get things done. But too often great ideas, subject matter expertise and important details are forgotten or left behind when a video call ends. Mediasite Join automatically records video and web conferences, transforming them into valuable, searchable video on demand. As a cloud service, it’s the easiest way to capture and preserve any video call or meeting. |
Mediasite Events
Mediasite Events is a leading global provider of live and on-demand webcasting services for conferences, hybrid events and high-profile broadcasts, supplying turnkey streaming solutions for hundreds of events each year. Fortune 500 companies, universities, associations, sporting events and charitable organizations use Mediasite Events to produce high-quality online event experiences. With Mediasite Events, customers:
• | Expand their audience reach by streaming to those that cannot attend in person |
• | Maximize event ROI by generating additional revenue streams from video recordings |
• | Differentiate themselves from competing events |
• | Bolster training and communication effectiveness with interactive video and audience engagement tools |
• | Build stronger teams and deepen morale |
• | Save travel time and money |
• | Improve retention and learning outcomes |
5
Mediasite Services
Organizations maximize their return on video with these additional Mediasite Services:
• | Advanced Integration Services: The value of Mediasite grows when customers’ video assets and streaming workflows seamlessly integrate with the systems that drive their online learning, training or communication strategies. Mediasite Advanced Integration Services provides the resources and expertise to incorporate Mediasite video creation, management and delivery processes into existing or planned application platforms, infrastructures and workflows. Leveraging Mediasite’s open architecture and application programming interfaces (APIs), Sonic Foundry developers collaborate with customers to scope, design and implement a Mediasite solution tailored to their unique requirements. |
• | Installation Services: Sonic Foundry provides on-site consulting and installation services to help customers optimize deployments and efficiently integrate Mediasite within existing AV and IT infrastructures, processes and workflows. |
• | Training Services: Expert Sonic Foundry trainers provide the necessary knowledge transfer so organizations feel confident in using, managing and leveraging Mediasite’s capabilities. On-site training is customized to specific requirements and skill levels, while online training provides convenient anytime access to a web-based catalog of training modules. |
Mediasite Customer Care
Standard and Premium Customer Care plans give customers peace of mind knowing that they have access to expert technical skills at the level they need.
With a Mediasite Standard Customer Care plan, customers are entitled to:
• | Software upgrades and updates for Mediasite Video Platform and Mediasite Capture Solutions |
• | Unlimited technical support assistance |
• | Mediasite Recorder hardware warranty extension |
• | Advanced Mediasite Recorder replacement |
• | Authorized access to the Mediasite Customer Care Portal for 24/7 case management, software downloads, documentation, the Mediasite Knowledge Base and other technical resources |
• | Authorized access to the Mediasite Community for online training videos, customer-exclusive webcasts, peer-to-peer best practice sharing and more |
Premium Customer Assurance clients receive the most comprehensive access to Sonic Foundry’s world-class technical expertise by selecting the services that are of greatest value to their organization. A customized Premium Plan includes everything in the Standard Plan, plus any combination of these services:
• | Priority technical support with queue bypass and support case escalation |
• | Proactive Mediasite version administration and management |
• | Mediasite roadmap discussions with Sonic Foundry’s executive team |
Additionally, customers who add Mediasite Monitoring Service get near real time monitoring of all Mediasite assets, proactive incident notification and Sonic Foundry support response for critical issues, exceptions and anticipated issues that may impact day-to-day Mediasite operations.
Nearly all of our customers purchase a Customer Care plan when they purchase Mediasite Video Platform or Mediasite Capture Solutions.
Annual service contracts for Mediasite Video Cloud, include a Standard Customer Care plan.
What Sets Mediasite Apart?
For enterprises to maximize their return on video, it takes more than capturing, storing and streaming content. The true impact and power of video is realized when content is transformed into highly interactive learning experiences rich with searchable metadata and detailed viewing statistics. Mediasite provides:
• | Complete platform addressing the entire video lifecycle - From content creation and delivery to retention and management. Mediasite’s portfolio of video solutions provides customers maximum flexibility and scalability to develop a comprehensive enterprise video strategy. |
• | Interactive, consistent playback experiences across devices - Mediasite involves the viewer in their online video experience with polls, bookmarks, sharing, ask-a-question, resource links and more. Plus, Mediasite’s consistent playback experience across all devices significantly reduces learning curves and accelerates adoption and content mastery. |
6
• | Auto-indexing and powerful video search - As a video search pioneer for over a decade, we have substantial experience in search precision. Mediasite SmartSearch automatically makes all videos as searchable as text, so keywords can be found anywhere - in audio, slides, handwriting, video or tags. |
• | Deep viewership analytics - Mediasite’s powerful video analytics and built-in reports show exactly who is watching what and when. It’s the deep insight users need to understand viewing behaviors and engagement, to measure video’s impact and value and make informed decisions. |
• | Unmatched support network - Sonic Foundry and the growing Mediasite Community provide a reliable, collaborative support network for all Mediasite customers. Our worldwide network of field-based system engineers and responsive customer care ensure that customers have resources committed to their success. Plus, with nearly 2,000 active customers, the Mediasite Community is one of the most vibrant and growing user communities for video, webcasting, lecture capture and e-learning. Members share ideas and get feedback year-round from community experts through a private online portal, customer-exclusive webcasts and unrivaled networking and learning opportunities at the global Mediasite user conference and other regional customer events. |
Sonic Foundry Solutions in Higher Education:
Among post-secondary institutions, Mediasite is used for all academic and campus environments, including:
• | Lecture capture |
• | Flipped classroom instruction: students view lectures from home and use classroom time for discussion |
• | Blended, hybrid and distance learning |
• | Continuing education |
• | Campus YouTube |
• | Special events: commencement, guest speakers, sporting events, etc. |
• | Faculty training and development |
• | Student video projects |
• | Recruitment and admissions |
• | University business: leadership meetings, alumni relations, outreach |
Higher education institutions consistently report that Mediasite:
• | Improves student learning outcomes |
• | Keeps their institution competitive by supporting higher enrollment and/or tuition without new classrooms |
• | Empowers faculty with technology supporting new teaching pedagogies both in the classroom and online |
• | Boosts campus outreach, recruitment efforts and awareness of campus events |
• | Helps campuses manage, secure and search all campus video |
To remain relevant, colleges and universities are striving to differentiate themselves through technical leadership as a means to attract tech-savvy students, while balancing their campus technology improvements with systems that faculty will embrace and adopt. As a result, the education market is restructuring and increasing investments around online learning.
Historically, graduate programs and STEM (science, technology, engineering and math)-oriented degree programs in schools of medicine, nursing, engineering or business have comprised the majority of our academic customer base. We are now experiencing heightened market demand for academic video within undergraduate and community college programs as well.
Frost & Sullivan analysts report that the academic lecture capture market is “characterized by seismic shifts in the technological demands of students, growing institutional adoption of online programs to increase student enrollment, the increasing use of multi-source video capture to enrich user experience, and deeper in-video metadata schema to improve searchability.” Further, they estimate the lecture capture market is expected to grow at a compound annual growth rate (CAGR) of 20.6% from 2015 to 2022. (Global Lecture Capture Analysis report, 2016).
The visible integration of video-based learning into core university applications like learning management systems (LMSes) and the success of bundled online learning technology solutions are two healthy indicators for the widespread adoption of campus video. LMSes like Canvas by Instructure, Brightspace™, Blackboard®, Moodle and Sakai are ubiquitous in the education enterprise. As the foundation for e-learning, these systems are rapidly evolving to be students’ single-source portal for all course-related materials including recorded lecture and assignment videos. Mediasite’s packaged LMS integrations and support for the Learning Tools Interoperability (LTI) standard, address the need to make learning content accessible to students when and where they need it. Similarly, video management platforms are emerging as repositories for campus’ media-centric content. These platforms provide additional opportunities through which to make Mediasite content accessible to faculty, staff and students.
7
Sonic Foundry Solutions in the Enterprise:
Executives, event planners and line-of-business managers for human resources, talent development, sales, marketing, and customer service are pushing for more video in their organizations to improve communication, collaboration and results.
Mediasite has numerous applications within medium to large corporate, healthcare and government enterprises:
In corporate enterprises it is used for:
• | Executive communications: town hall meetings, all-hands meetings |
• | Workforce development: onboarding and training, HR communications, policy documentation |
• | Secure corporate YouTube |
• | Sales, marketing and customer support |
• | Investor relations: earnings calls, analyst briefings, annual reports |
• | Conferences and events: user group, sales and annual meetings |
In health-related enterprises it is used for:
• | Continuing medical education, medical conferences and seminars |
• | Grand rounds, simulations and procedural training |
• | Pharmaceutical and new product education |
• | Caregiver and patient education |
• | Emergency response coordination and public health announcements |
• | Research and collaboration |
In government agencies it is used for:
• | Training and compliance |
• | Inter- and intra-agency communications |
• | Legislative proceedings |
• | Constituent outreach, committee meetings, public safety announcements |
• | Relief work, military coordination, emergency preparedness |
Through interviews across these verticals, enterprise customers report that Mediasite:
• | Expands training and communications opportunities |
• | Cuts travel and meeting expenses |
• | Boosts efficiency by allowing participants to watch when it’s convenient to avoid interruptions and increase retention |
• | Helps build stronger teams through direct management and employee communications |
Aragon Research reports that rich interactive content produced in marketing webinars, webcasts, training, sales communications and other interactions is poised for explosive growth. In its May 2017 research note, The Aragon Globe for Enterprise Video 2017, the firm predicts that “the cut over to video as a dominant content type will occur between 2018 and 2019,” and that “the demand for enterprise video platforms that allow for the right video to be searched for and found quickly will increase as the volume of video in the enterprise grows.”
Future Direction
Video management, webcasting and lecture capture are becoming an everyday part of the way people work and learn. We strive to shorten the time it takes to not only capture and distribute information but to also transform video into more interactive, discoverable content with rich management, search and analytics capabilities. As a company, we are helping create and manage the video libraries of tomorrow. Our ongoing innovations focus on supporting this vision by:
• | Advancing enterprise video content management to accommodate organizations’ existing digital video assets, content generated from third-party video sources and the corresponding metadata associated with those video assets. |
• | Introducing new applications to easily publish, search and retrieve videos from a video library as well as expanding and automating Mediasite’s powerful multi-modal search capabilities. |
• | Offering the industry’s widest variety of content capture solutions capable of scaling economically across entire organizations and allowing anyone, on any device, to capture and share their knowledge or expertise. |
• | Delivering content capture solutions that test the limits of recording, synchronizing and playing back multiple high definition video sources. |
• | Supporting consistent, interactive content playback experiences across all viewing devices. |
8
• | Deepening integration with core enterprise platforms including collaborative platforms like video and web conferencing, learning and course management systems (LMS/CMS), content management systems and student information systems (SIS). |
• | Introducing market-driven innovations to our Mediasite Video Cloud offering. |
Segment Information
We have determined that in accordance with the Financial Accounting Standards Board (“FASB”) Accounting Standards Codification (“ASC”) 280-10, Segment Reporting, we operate in three operating segments, however these segments meet the criteria for aggregation for reporting purposes as one reporting segment as of September 30, 2017.
Billings and Distribution
Our services are typically billed and collected in advance of providing the service which requires minimal cost to perform in the future. Billings, which are a non-GAAP measure, are a better indicator of customer activity and cash flow than revenue is, in management’s opinion, and is therefore used by management as a key operational indicator. Billings is computed by combining revenue with the change in unearned revenue.
Our largest individual customers are typically value added resellers (“VARs”) and distributors since the majority of our end users require additional complementary products and services which we do not provide. Accordingly, in fiscal 2017 and 2016 one master distributor, Synnex Corporation (“Synnex”), contributed 11 percent and 14 percent, respectively, of total world-wide billings. A second master distributor, Starin Marketing, Inc. (“Starin”), contributed 15 percent and 13 percent of total world-wide billings in fiscal 2017 and 2016, respectively. As master distributors, Synnex and Starin fulfill transactions to VARs, end users and other distributors. No other customer represented over 10 percent of billings in 2017 or 2016.
Sales
We sell and market our offerings through a sales force that manages a channel of value-added resellers, system integrators, consultants and distributors. These third party representatives specialize in understanding both audio/video systems and IT networking. In fiscal 2017, we utilized three master distributors in the U.S. and approximately 240 resellers, and sold our products to over 1,275 total end users. Our focus has been primarily in the United States and primarily to customers we have identified as having the greatest potential for high use; that is, organizations with presenters, trainers, lecturers, marketers, event planners and leaders who have a routine need to communicate to many people in higher education, government, health and certain corporate markets. Despite our historical attention on the United States market, reseller, customer interest and sales outside the United States has grown and accordingly, we made two international acquisitions in fiscal 2014 in the Netherlands and Japan, significantly increasing our international headcount in sales, operations, technical and administrative positions. To date, we have sold our products to customers in over 65 countries outside the United States. Total non-GAAP billings for Mediasite product and support outside the United States totaled 43 percent and 38 percent in fiscal 2017 and 2016, respectively.
Market expansion: Over half our revenue is realized from the education market. Recent trends including the economic recovery are driving more students, particularly adult learners, to seek online education options. Similarly, demand for lecture capture within undergraduate, community college and blended learning programs is demonstrating growth. This development represents an emerging trend beyond the traditional academic customer base for the company, which has primarily consisted of post-graduate, distance learning and technical degree programs.
For our higher education as well as corporate, government and association clients, we anticipate economic conditions will expand market demand for more outsourced services versus licensed sales. Over the last two years, the company has made extensive capital and technology investments to advance its services model with turnkey event webcasting, a comprehensive cloud-based Software as a Service (SaaS) datacenter, and e-commerce capabilities that position us well to deliver more diversified business services.
With Mediasite Events, we continue to see growing demand for conference webcasting and streaming. These event-based communication, education and training applications, combined with outsourced webcasting services, are expected to drive the company’s corporate sales activities going forward.
Repeat orders: Many customers initially purchase a small number of Mediasite Recorders to test or pilot in a department, school or business unit. A successful pilot project and the associated increase in webcasting demand from other departments or schools
9
leads to follow up, multiple Recorder orders as well as increased Mediasite Video Platform or Mediasite Video Cloud capacity. In fiscal 2017, 92 percent of billings were to preexisting customers compared to 90 percent of billings in fiscal 2016.
Renewals: As is typical in the industry, we offer annual support and maintenance service contract extensions for a fee to our customer base. Nearly all customers purchase a Customer Care plan with their initial Mediasite Recorders and Mediasite Video Platform, and the majority renew their contracts annually.
Marketing
In the enterprise, our marketing strategy is based on a cross-industry approach with programs targeting a blend of IT and line of business decision makers responsible for video initiatives in corporate communications, training and development, live webcasting and/or corporate events. The addition of Mediasite Join to our family of enterprise video solutions boosts demand generation marketing to specifically target use cases for streaming and managing the rapidly growing amount of unified communication and collaboration (UCC)-generated video. The medical/healthcare, pharmaceutical and technology segments are particularly strong enterprise markets for us.
Across higher education institutions, Mediasite maintains its market leadership position for scalable and affordable lecture capture and video management. Our marketing focuses on professional schools of business, academic health, law and engineering. Mediasite Join provides new demand generation opportunities as UCC technologies are the basis of many distance learning programs.
Spanning both education and enterprise are marketing programs targeting continuing education. Across these two macro markets we maintain a balanced blend of new demand generation and customer nurturing, to drive Mediasite expansion and add-on business in existing accounts.
Our integrated marketing strategy leverages:
• | Customer success stories regularly shared through our best practices webinar series, speaking placements at industry events, email marketing, industry guest columns and blog |
• | Thought leadership content created and curated from customer successes, Sonic Foundry subject matter experts (SMEs) and industry experts in the form of ebooks, whitepapers, videos, best practice toolkits and more |
• | The Mediasite Community, a vibrant online community of 2000+ users and its companion community events including the global Mediasite User Conference, Unleash; Mediasite Summits in Europe and Australia/New Zealand; and year-round regional chapter meetings |
Sonic Foundry also has field sales/support offices in Europe, Japan and China to deliver its marketing message and execute region-specific marketing programs.
Operations
We contract with a third party to build the hardware for our Mediasite Recorders and purchase quantities sufficient to fill specific customer orders, including purchases of inventory by resellers. Quantities are maintained in inventory by the third party provider and shipped directly to the end customer or reseller. The hardware manufacturer provides a limited one-year warranty on the hardware, which we pass on to our customers who purchase a Mediasite Customer Care support and maintenance plan. We believe there are alternative sources of manufacturing for our recorders and believe there are numerous additional sources and alternatives to the existing production process. We have experienced delays in production of our products and component parts used in our products in the past and expect to continue to maintain excess quantities of inventory in the future to mitigate the risk of such delays. To date, we have not experienced any material returns due to product defects.
OTHER INFORMATION
Competition
Various vendors provide lecture capture, enterprise webcasting or video content management capabilities, but few offer an end-to-end solution that addresses all phases of the video content lifecycle (capture, delivery, transformation and management) in a single platform like Mediasite.
Lecture capture solutions designed specifically for higher education differ in their technology approach.
10
• | Appliance- or room-based lecture capture provides a fully integrated system with complete recording automation for live or on-demand content. The automated, pre-scheduled workflow results in the greatest faculty and staff adoption and largest volumes of recorded content in the shortest amount of time. |
• | Software-based lecture capture that resides on a podium or computer in the classroom also captures and publishes rich media content, but relies on campus- or user-supplied hardware. |
• | Desktop capture tools reside on individual users’ laptops or computers allowing them to record user-generated content. |
Few lecture capture vendors offer a mix of all lecture capture approaches to best suit customers’ needs. Most vendors, including Crestron, Panopto and Tegrity, support only one approach to lecture capture. Likewise, a very small number of vendors provide an integrated platform like Mediasite to archive and manage video and rich media recorded with their solution. Most rely on a third-party platform, typically the institution’s learning or course management system, to publish, search and secure content.
Enterprise video management solutions serve as centralized media repositories that facilitate the delivery, publishing and management of on-demand video. Unlike Mediasite, most platforms do not include a video capture, webcasting or live streaming component, but instead ingest or import video-based content captured by other third-party devices or solutions. Also, most other platforms focus on ingesting video-only content rather than rich video which combines multiple synchronous video and/or slide streams into an interactive media experience.
Some current and potential customers develop their own home-grown lecture capture, webcasting or video content solutions which may also compete with Mediasite. However, we often find many of these organizations are now looking for a commercial solution that offers comprehensive management capabilities, requires fewer resources and internal maintenance and delivers a less cumbersome workflow.
Intellectual Property
The status of United States patent protection in the Internet industry is not well defined and will evolve as the U.S. Patent and Trademark Office grants additional patents. Currently four U.S patents have been issued to us and we may seek additional patents in the future. We do not know if any future patent application will result in any patents being issued with the scope of the claims we seek, if such patents are issued at all. We do not know whether our patents which have been issued or any patents we may receive in the future will be challenged, invalidated or be of any value. It is difficult to monitor unauthorized use of technology, particularly in foreign countries where the laws may not protect our proprietary rights as fully as in the United States, and our competitors may independently develop technology similar to ours. We will continue to seek patent and other intellectual property protections, when appropriate, for those aspects of our technology that we believe constitute innovations providing significant competitive advantages. Any future, patent applications may not result in the issuance of valid patents.
Our success depends in part upon our rights to proprietary technology. We rely on a combination of copyright, trade secret, trademark and contractual protection to establish and protect our proprietary rights. We have registered three U.S. and four foreign country trademarks. We require our employees to enter into confidentiality and nondisclosure agreements upon commencement of employment. Before we will disclose any confidential aspects of our services, technology or business plans to customers, potential business distribution partners and other non-employees, we routinely require such persons to enter into confidentiality and nondisclosure agreements. In addition, we require all employees, and those consultants involved in the deployment of our services, to agree to assign to us any proprietary information, inventions or other intellectual property they generate, or come to possess, while employed by us. Despite our efforts to protect our proprietary rights, unauthorized parties may attempt to copy or otherwise obtain and use our services or technology. These precautions may not prevent misappropriation or infringement of our intellectual property.
Third parties may infringe or misappropriate our copyrights, trademarks and similar proprietary rights. In addition, we may be subject to claims of alleged infringement of patents and other intellectual property rights of third parties or may be required to defend against alleged infringement claims filed against our customers due to indemnification agreements. We may be unaware of filed patent applications which have not yet been made public and which relate to our services.
Intellectual property claims may be asserted against us in the future. Intellectual property litigation is expensive and time-consuming and could divert management’s attention away from running our business. Intellectual property litigation could also require us to develop non-infringing technology or enter into royalty or license agreements. These royalty or license agreements, if required, may not be available on acceptable terms, if at all. Our failure or inability to develop non-infringing technology or license the proprietary rights on a timely basis would harm our business.
11
Research and Development
We believe that our future success will depend in part on our ability to continue to develop new business, and to enhance our existing business. Accordingly, we invest a significant amount of our resources in research and development activities. During the fiscal years ended September 30, 2017 and 2016, we spent $7.2 million and $6.8 million, respectively, on internal research and development activities in our business. These amounts represent 20% and 18%, respectively, of total revenue in each of those years. The increase reflects our decision to accelerate development on identified new products as well as enhancements to existing products.
Global Expansion
We acquired Sonic Foundry International in the Netherlands and Mediasite KK in Japan in fiscal 2014. With these acquisitions, we significantly expanded our global market reach in the Asia-Pacific Region and Europe, and accelerate our commitment to enterprise video communication world-wide.
Employees
At September 30, 2017 and 2016, we had 188 and 205 full-time employees, respectively. Our employees are not represented by a labor union, nor are they subject to a collective bargaining agreement. We have never experienced a work stoppage and believe that our employee relations are satisfactory.
ITEM 1A. RISK FACTORS
YOU SHOULD CAREFULLY CONSIDER THE RISKS DESCRIBED BELOW BEFORE MAKING AN INVESTMENT DECISION. THE RISKS DESCRIBED BELOW ARE NOT THE ONLY ONES WE FACE. ADDITIONAL RISKS THAT WE ARE NOT PRESENTLY AWARE OF OR THAT WE CURRENTLY BELIEVE ARE IMMATERIAL MAY ALSO IMPAIR OUR BUSINESS OPERATIONS. OUR BUSINESS COULD BE HARMED BY ANY OR ALL OF THESE RISKS. THE TRADING PRICE OF OUR COMMON STOCK COULD DECLINE SIGNIFICANTLY DUE TO ANY OF THESE RISKS, AND YOU MAY LOSE ALL OR PART OF YOUR INVESTMENT. IN ASSESSING THESE RISKS, YOU SHOULD ALSO REFER TO THE OTHER INFORMATION CONTAINED OR INCORPORATED BY REFERENCE IN THIS ANNUAL REPORT ON FORM 10-K, INCLUDING OUR CONSOLIDATED FINANCIAL STATEMENTS AND RELATED NOTES.
We may need to raise additional capital.
At September 30, 2017, we had cash of $1.2 million, $1.1 million of which was in our foreign operations. There was a remaining amount of $2.22 million available under our line of credit facility with Silicon Valley Bank at September 30, 2017, with $1.65 million outstanding and a credit limit of $3.87 million in total. The Company has historically financed its operations primarily through cash from sales of equity securities, and to a limited extent, cash from operations and through bank credit facilities. The Company has a history of operating losses, although in fiscal 2017 it generated cash from operations of $0.7 million. While the Company expects to increase revenue in fiscal 2018 and reduce operating expense, we cannot ensure that revenue will grow as anticipated and, if revenue is determined to be growing at a rate less than anticipated and expenses are not sufficiently reduced, our line of credit may not be sufficient to support working capital needs, and our ability to develop, maintain, and sell our products could be negatively impacted. In addition, although the Company anticipates that we will be in compliance with all provisions of its debt facilities, our financial condition may, in the future, cause us to be in non-compliance with such provisions. If our line of credit is not sufficient to support working capital needs or if our financial condition causes us to be in non-compliance with certain provisions of our debt facilities, we may have to borrow additional money from other debt providers or raise additional equity capital.
In the event we need to borrow additional money or raise additional equity capital, we may not be able to do so on acceptable terms and conditions. If we are in non-compliance with the covenants of our existing debt facility, other lenders may be unwilling to lend us capital and we may not be able to raise equity from independent investors. In that event, we may seek to raise money from entities that are affiliated with the Company, as we have done in the past. However, most equity investors will require that their investment be in the form of preferred stock. An investment in preferred stock by insiders may cause us to be in non-compliance with certain of Nasdaq’s listing rules, in particular Nasdaq Rule 5640 (the “Voting Rights Rule”) and Nasdaq Rule 5635(c) (the “Equity Compensation Rule”), the latter of which requires stockholder approval of any issuance of preferred stock to a company
12
insider which is convertible into common stock at below the market price of the common stock. Due to these rules, equity investments by persons or entities affiliated with the Company may not be available.
In the event we are able to borrow money, we may incur significant interest charges, which could harm our profitability. Holders of debt would also have rights, preferences or privileges senior to those of existing holders of our common stock. In the event we are able to raise additional equity, the terms of such financing may dilute the ownership interests of current investors and cause our stock price to fall significantly. We may not be able to secure debt or equity financing upon acceptable terms, if at all. If we cannot raise funds on acceptable terms, our business, operating results, and financial condition could be negatively impacted. The Company believes its cash position and available credit is adequate to accomplish its business plan through at least the next twelve months.
If the funds held by our foreign subsidiaries are needed for our operations in the United States, the repatriation of some of these funds to the United States could require payment of additional U.S. taxes.
We have a history of losses.
Our investments in growing revenues have generated losses in most years. Despite our plans to grow revenue and reduce expenses in fiscal 2018, we may not realize sufficient revenues to reach or sustain profitability on a quarterly or annual basis. For the year ended September 30, 2017, we had a gross margin of $26.1 million on revenue of $36.0 million with which to cover selling, marketing, product development and general and administrative costs. Our selling, marketing, product development and general and administrative costs have historically been a significant percentage of our revenue, due partly to the expense of developing leads, the relatively long period required to convert leads into sales associated with selling products that are not yet considered “mainstream” technology investments and the cost of developing and maintaining those products. Fluctuations in profitability or failure to maintain profitability have and will likely impact the price of our stock in the future.
Multiple unit deals are needed for continued success.
We need to sell multiple units to educational, corporate and government institutions in order to sell most efficiently and remain profitable. In fiscal 2017 and fiscal 2016, 92% and 90% of billings was generated by sales to existing customers, respectively. In particular, sales of multiple units to corporate customers have lagged behind results achieved in the higher education market; consequently, we have allocated more resources to the higher education market. While we have addressed a strategy to leverage existing customers, better address the needs of potential new customers, and close multiple unit transactions, a customer may choose not to make expected purchases of our products. The failure of our customers to make expected purchases will harm our business.
If a sufficient number of customers do not accept our products, our business may not succeed.
The use of video as a mainstream communication tool and the market for content management software is in an early stage. We cannot predict how the market for our products will develop, and part of our strategic challenge will be to convince enterprise customers of the productivity, improved communications, cost savings, suitability and other benefits of our products. In higher education the decision to include lecture capture technology in the classroom is often influenced by the professor teaching the class, who sometimes views lecture capture technology as a threat to their job. The market for content delivery solutions is very complex, includes many products and solutions that address various aspects of customer needs and as a result it is often difficult for customers and channel partners to understand how our products and services compare. Further, corporate customers may use video as a tool, but may choose to rely upon their own IT infrastructure and resources to manage their video content. Because many companies generally are predisposed to maintaining control of their IT systems and infrastructure, there may be resistance to using software as a service provided by a third party. Our future revenue and revenue growth rates will depend in large part on our success in delivering these products effectively, creating market acceptance for these products and meeting customer’s needs for new or enhanced products. If we fail to do so, our products will not achieve widespread market acceptance, and we may not generate sufficient revenue to offset our product development and selling and marketing costs, which will hurt our business.
Manufacturing disruption or capacity constraints would harm our business.
We subcontract the manufacture of our recorders to one third-party contract manufacturer. Although we believe there are multiple sources of supply from other contract manufacturers as well as multiple suppliers of component parts required by our contract manufacturer, a disruption of supply of component parts or completed products, even if short term, would have a material negative impact on our revenues. Likewise we are susceptible to any material change in terms such as pricing, level of services performed
13
or changes to payment terms by our contract manufacturer. Many component parts currently have long delivery lead times or cease production of certain components with limited notice in which to evaluate or obtain alternate supply, requiring conservative estimation of production requirements. Lengthening lead times, product design changes and other third party manufacturing disruptions have caused delays in delivery in the past. In order to compensate for supply delays, we have sourced components from off-shore locations, used cross component parts, paid significantly higher prices or premium fees to expedite delivery for short supply components. We have typically maintained greater amounts of inventory as insurance against delays but currently hold substantially lower quantities of inventory in order to improve liquidity. Many of these strategies have increased our costs or require substantial resources to maintain and may not be sufficient to ensure against a product shortage. We depend on our subcontract manufacturer to produce our products efficiently while maintaining high levels of quality despite frequent changes in configuration and scheduling imposed by us. Any manufacturing or component defects, delay in production or changes in product features will likely cause customer dissatisfaction and may harm our reputation. Moreover, any incapacitation of the manufacturing site due to destruction, natural disaster or similar events could result in a loss of product inventory. As a result of any of the foregoing, we may not be able to meet demand for our products, which could negatively affect revenues in the quarter of the disruption or longer depending upon the magnitude of the event, and could harm our reputation.
We may not be able to innovate to meet the needs of our target market.
Our future success will continue to depend upon our ability to develop new products, product enhancements or service offerings that address future needs of our target markets and to respond to these changing standards and practices on a timely basis. The success of new products, product enhancements or service offerings depend on several factors, including the timely completion, quality and market acceptance of the product, enhancement or service. Our fiscal 2018 business plan includes an expectation for revenue contribution from both new and existing customers associated with the introduction of lower priced hardware and software recorders in locations that can’t support our more comprehensive solutions. There can be no assurance that we will be successful in achieving our revenue expectations from these new products or that we are able to retain existing customers in our more comprehensive solutions. Our revenue could be reduced if we do not capitalize on our current market leadership by timely development of innovative new products, product enhancements or service offerings that will increase the likelihood that our products and services will be accepted in preference to the products and services of our current and future competitors.
If our marketing and lead generation efforts are not successful, our business will be harmed.
We believe that continued marketing efforts will be critical to achieve widespread acceptance of our products. Our marketing campaigns may not be successful given the expense required. For example, failure to adequately generate and develop sales leads could cause our future revenue to decrease. In addition, our inability to generate and cultivate sales leads into large organizations, where there is the potential for significant use of our products, could have a material effect on our business. We may not be able to identify and secure the number of strategic sales leads necessary to help generate marketplace acceptance of our products. If our marketing or lead-generation efforts are not successful, our business and operating results will be harmed.
There is a great deal of competition in the market for our products, which could lower the demand for our products and have a negative impact on our operations.
The market for our products and services is intensely competitive, dynamic and subject to rapid technological change. The intensity of the competition and the pace of change are expected to increase in the future. Increased competition has and will likely continue to result in price reductions, reduced gross margins and may result in loss of market share, any one of which could seriously harm our business. Competitors vary in size and in the scope and breadth of the products and services offered, many of which have greater financial resources, greater name recognition, more employees and greater financial, technical, marketing, public relations and distribution resources than we have. In addition, new competitors with greater financial resources may arise through partnerships, distribution agreements, mergers, acquisitions or other types of transactions at any time. In particular, large companies have begun to make investments in and/or partner with smaller companies to enter the lecture capture and video management markets.
Various vendors provide lecture capture, enterprise webcasting or video content management capabilities, but few offer an end-to-end solution that addresses all phases of the video content lifecycle (capture, delivery, transformation and management) in a single platform like Mediasite.
Lecture capture solutions designed specifically for higher education differ in their technology approach.
14
• | Appliance- or room-based lecture capture provides a fully integrated system with complete recording automation for live or on-demand content. The automated, pre-scheduled workflow results in the greatest faculty and staff adoption and largest volumes of recorded content in the shortest amount of time. |
• | Software-based lecture capture that resides on a podium or computer in the classroom also captures and publishes rich media content, but relies on campus- or user-supplied hardware. |
• | Desktop capture tools reside on individual users’ laptops or computers allowing them to record user-generated content. |
Few lecture capture vendors, offer a mix of all lecture capture approaches to best suit customers’ needs. Most vendors, including Crestron, Panopto and Tegrity, support only one approach to lecture capture. Likewise, a very small number of vendors provide an integrated platform like Mediasite to archive and manage video and rich media recorded with their solution. Most rely on a third-party platform, typically the institution’s learning or course management system, to publish, search and secure content.
Enterprise video management solutions (e.g. Kaltura, Qumu) serve as centralized media repositories that facilitate the delivery, publishing and management of on-demand video. Unlike Mediasite, most platforms do not include a video capture, webcasting or live streaming component, but instead ingest or import video-based content captured by other third-party devices or solutions. Also, most other platforms focus on ingesting video-only content rather than rich video which combines multiple synchronous video and/or slide streams into an interactive media experience.
Some current and potential customers develop their own home-grown lecture capture, webcasting or video content solutions which may also compete with Mediasite. However, we often find many of these organizations are now looking for a commercial solution that offers comprehensive management capabilities, requires fewer resources and internal maintenance and delivers a less cumbersome workflow.
The competitive environment may require us to make changes in our products, pricing, licensing, services, or marketing to maintain and extend our current technology. Price concessions or the emergence of other pricing, licensing, and distribution strategies or technology solutions of competitors may reduce our revenue, margins or market share. Other changes we have to make in response to competition could cause us to expend significant financial and other resources, disrupt our operations, strain relationships with partners, release products and enhancements before they are thoroughly tested or result in customer dissatisfaction, any of which could harm our operating results and stock price.
Because most of our service contracts are renewable on an annual basis, a reduction in our service renewal rate could significantly reduce our revenues.
Our clients have no obligation to renew their content hosting agreements, customer support contracts or other annual service contracts after the expiration of the initial period, which is typically one year, and some clients have elected not to do so. A decline in renewal rates could cause our revenues to decline. We have limited historical data with respect to rates of renewals, so we cannot accurately predict future renewal rates. Our renewal rates may decline or fluctuate as a result of a number of factors, including client dissatisfaction with our products and services, our slow response to customer technical inquiries, our failure to update our products to maintain their attractiveness in the market, deteriorating economic conditions or budgetary constraints or changes in budget priorities faced by our clients.
Because we generally recognize revenues ratably over the term of our service contracts, downturns or upturns in service transactions will not be fully reflected in our operating results until future periods.
We recognize most of our revenues from service contracts monthly over the terms of their agreements, which are typically 12 months, although terms have ranged from less than one month to 48 months. As a result, much of the service revenue we report in each quarter is attributable to agreements entered into during previous quarters. Consequently, a decline in sales, client renewals or market acceptance of our products in any one quarter will not necessarily be fully reflected in the revenues in that quarter and will negatively affect our revenues and profitability in future quarters. This ratable revenue recognition also makes it difficult for us to rapidly increase our revenues through additional sales in any period, as revenues from new clients must be recognized over the applicable agreement term.
Our business is susceptible to risks associated with international operations.
International product and service billings ranged from 38% to 43% of our total billings in each of the past two years and are expected to continue to account for a significant portion of our business in the future, particularly as a result of growth in the
15
operations of businesses acquired in fiscal 2014 in the Netherlands and Japan. International sales are subject to a variety of risks, including:
• | Difficulties in establishing and managing international subsidiaries, distribution channels and operations; |
• | Difficulties in selling, servicing and supporting overseas products, translating products into foreign languages and compliance with local hardware requirements; |
• | Difficulties in managing the demands of large international deployments, many of which distract key sales personnel from opportunities in other parts of the world; |
• | Challenges associated with management transition; |
• | Challenges related to language or cultural differences; |
• | The uncertainty of laws and enforcement in certain countries, such as China, relating to the protection of intellectual property or requirements for product certification, protection of personal data or other restrictions; |
• | Competitive pressure impacting other parts of the world; |
• | Multiple and possibly overlapping tax structures; |
• | Currency and exchange rate fluctuations; |
• | Difficulties in collecting accounts receivable in foreign countries, including complexities in documenting letters of credit; |
• | Economic or political changes in international markets; |
• | Restrictions on access to the Internet; and |
• | Difficulty in complying with international employment related requirements |
The length of our sales and deployment cycles are uncertain, which may cause our revenue and operating results to vary significantly from quarter to quarter and year to year.
During our sales cycle, we spend considerable time and expense providing information to prospective customers about the use and benefits of our products without generating corresponding revenue. Our expense levels are relatively fixed in the short-term and based in part on our expectations of future revenue. Therefore, any delay in our sales cycle could cause significant variations in our operating results, particularly because a relatively small number of customer orders represent a large portion of our revenue.
Our largest potential sources of revenue are educational institutions, large corporations and government entities that often require long testing and approval processes before making a decision to purchase our products, particularly when evaluating our products for inclusion in new buildings under construction, high dollar transactions or competitive bids. In general, the process of selling our products to a potential customer may involve lengthy negotiations, collaborations with consultants, designers and architects, time consuming installation processes and changes in network infrastructure in excess of what we or our VARs are able to provide. In addition, educational institutions that started with small pilots are committing to more complex installations and expanding to include undergraduate classrooms, which, due to the increased size of these types of transactions, typically require a longer sales cycle. Also, our enterprise accounts are less motivated by seasonal sales and promotions, and therefore are frequently difficult to finalize. As a result of these factors, our sales and deployment cycles are unpredictable. Our sales and deployment cycles are also subject to delays as a result of customer-specific factors over which we have little or no control, including budgetary constraints, existing infrastructure technical issues and internal approval procedures, particularly with customers or potential customers that rely on government funding.
Our products are aimed toward a broadened user base within our key markets and these products are relatively early in their product life cycles. We cannot predict how the market for our products will develop, and part of our strategic challenge will be to convince targeted users of the productivity, improved communications and test scores, cost savings and other benefits. Accordingly, it is likely that delays in our sales cycles with these products will occur and this could cause significant variations in our operating results.
Sales of some of our products have experienced seasonal fluctuations which have affected sequential growth rates for these products, particularly in our first fiscal quarter. For example, there is generally a slowdown for sales of our products in the higher education and corporate markets in the first fiscal quarter of each year. Seasonal fluctuations could negatively affect our business, which could cause our operating results to fall short of anticipated results for such quarters. As such, we believe that quarter-to-quarter comparisons of our revenues, operating results and cash flows may not be meaningful and should not be relied upon as an indication of future performance.
16
Our operating results are hard to predict as a significant amount of our sales typically occur at the end of a quarter and the mix of product and service orders may vary significantly.
Revenue for any particular quarter is extremely difficult to predict with any degree of certainty. We typically ship products within a short time after we receive an order and therefore, we do not have an order backlog with which to estimate future revenue. In addition, orders from our channel partners are based on the level of demand from end-user customers. Any decline or uncertainty in end-user demand could negatively impact end-user orders, which could in turn significantly negatively affect orders from our channel partners in any given quarter. Accordingly, our expectations for both short and long-term future revenue is based almost exclusively on our own estimate of future demand based on the pipeline of sales opportunities we manage, rather than on firm channel partner orders. Our expense and inventory levels are based largely on these estimates. In addition, our events business is particularly unpredictable and subject to variation due to the short time-frame between when we learn of an opportunity and when the event occurs. Further, the majority of our product orders are received in the last month of a quarter; thus, the unpredictability of the receipt of these orders could negatively impact our future results. We historically have received all or nearly all our channel partner orders in the last month of a quarter and often in the last few days of the quarter. Accordingly, any significant shortfall in demand for our products or services in relation to our expectations, even if the result was a short term delay in orders, would have an adverse impact on our operating results.
We have experienced growing demand for our hosting and event services as well as a growing preference from our customers in purchasing our annually licensed software. As a result, we have seen an increase in service billings and recurring revenue as a percentage of total billings. We expect this trend to continue which we expect to improve predictability of revenue and gross margins but will delay the impact on revenue of any increase or decrease in billings during any particular quarter. We subcontract for some services required by our events customers, such as onsite management labor and closed captioning. We typically charge for such services at a lower margin than other services. The percentage of billings represented by services, provided either directly or indirectly, is also likely to fluctuate from quarter to quarter due to seasonality of event services and other factors. Since content hosting and support services are typically billed in advance of providing the service, revenue is initially deferred, leading to reduced current period revenue with a corresponding negative impact to profits or losses in periods of significant increase in the percentage of our billings for deferred services.
We are subject to risks associated with our channel partners’ product inventories and product sell-through.
We sell a significant amount of our products to strategic audio video (A/V) distributors such as Synnex Corporation and Starin Marketing, Inc. as well as other international distributors, such as Dalian Pushi Technology in China, and channel partners who maintain their own inventory of our products for sale to dealers and end-users. If these channel partners are unable to sell an adequate amount of their inventory of our products in a given quarter to dealers and end-users or if channel partners decide to decrease their inventories for any reason, such as a long-term continuation or increase, in global economic uncertainty, dissatisfaction with inventory turn rates or profitability and downturn in technology spending, the volume of our sales to these channel partners and our revenue would be negatively affected. In addition, if channel partners decide to purchase more inventory, due to product availability or other reasons, than is required to satisfy end-user demand or if end-user demand does not keep pace with the additional inventory purchases, channel inventory could grow in any particular quarter, which could adversely affect product revenue in the subsequent quarter. In addition, we also face the risk that some of our channel partners have inventory levels in excess of future anticipated sales. If such sales do not occur in the time frame anticipated by these channel partners for any reason, these channel partners may substantially decrease the amount of product they order from us in subsequent periods, which would harm our business.
If stock balancing returns or price adjustments exceed our reserves, our operating results could be adversely affected.
We provide three of our distributors with stock balancing return rights, which generally permit our distributors to return products, subject to ordering an equal dollar amount of alternate products. We also provide price protection rights to certain distributors. Price protection rights require that we grant retroactive price adjustments for inventories of our products held by distributors if we lower our prices for those products within a specified time period. To cover our exposure to these product returns and price adjustments, we establish reserves based on our evaluation of historical product trends and current marketing plans. However, we cannot be assured that our reserves will be sufficient to cover our future product returns and price adjustments. If we inadequately forecast reserves, it may compromise our ability to recognize revenue to these distributors at the time of shipment. As a result, we would not be able to recognize revenue until these three distributors sell the inventory to the final end user, which would have a material adverse effect on revenues in the period covered by that change.
17
Economic conditions could materially adversely affect the Company.
Weakness in domestic markets and global uncertainties exist in many areas of focus for us including the United Kingdom, Japan and the Middle East. Many of our customers rely on local, state or Federal government funding, both domestically and international. Japan experienced a decline in its gross domestic product in 2013, 2014 and 2015. While it appears Japanese government subsidies are again supporting growth in higher education, any future delay or elimination of government programs will have a negative impact on our operations in Japan. Any continuing unfavorable economic conditions could continue to negatively affect, our business, operating results or financial condition, which could in turn affect our stock price. Weak economic conditions and the resulting impact on the availability of public funds along with the possibility of state and local budget cuts and reduced university enrollment could lead to a reduction in demand for our products and services. In addition, a prolonged economic downturn could cause insolvency of key suppliers resulting in product delays, inability of customers to obtain credit to finance purchases of the Company’s products and inability or delay of our channel partners and other customers to pay accounts receivable owed to us.
Economic conditions may have a disproportionate effect on the sale of our products.
Many of our customers will look at the total A/V equipment and labor cost to outfit a typical conference room or lecture hall as one amount for budgetary purposes. Consequently, although our products represent only a portion of the total cost, the cost of the entire project of outfitting a room or conference hall may be considered excessive and may not survive budgetary constraints. Alternatively, our resellers may modify their quotes to end customers by eliminating our products or substituting less expensive products supplied by our competitors in order to win opportunities within budget constraints. Event service partners may similarly suggest that customers eliminate recording and webcasting as a means of reducing event cost. Consequently, declines in spending by government, educational or corporate institutions due to budgetary constraints may have a disproportionate impact on the Company and result in a material adverse impact on our financial condition.
We could lose revenues if there are changes in the spending policies or budget priorities for government funding of colleges, universities, schools and other education providers.
Most of our customers and potential customers are public colleges, universities, schools and other education providers who depend substantially on government funding. Accordingly, any general decrease, delay or change in federal, state or local funding for colleges, universities, schools and other education providers could cause our current and potential customers to reduce or delay their purchases of our products and services, or to decide not to renew service contracts, either of which could cause us to lose revenues. In addition, a specific reduction in governmental funding support for products such as ours would also cause us to lose revenues. Unfavorable economic conditions may result in further budget cuts and lead to lower overall spending, including information technology spending, by our current and potential clients, which may cause our revenues to decrease.
We depend in part on the success of our relationships with third-party resellers and integrators.
Our success depends on various third-party relationships, particularly in our non-higher education business, with certain international geographies and our events services operations. The relationships include third party resellers as well as system integrators that assist with implementations of our products and sourcing of our products and services. Identifying partners, negotiating and documenting relationships with them and maintaining their relationships require significant time and resources from us. In addition, our agreements with our resellers and integrators are typically non-exclusive and do not prohibit them from working with our competitors or from offering competing products or services. We have limited control, if any, as to whether these strategic partners devote adequate resources to promoting, selling and implementing our products as compared to our competitor’s products. Our competitors may be effective in providing incentives to third parties to favor their products or services. If we are unsuccessful in establishing or maintaining our relationships with these third parties, our ability to compete in the marketplace or to maintain or grow our revenue could be impaired and our operating results would suffer.
Our cash flow could fluctuate due to the potential difficulty of collecting our receivables.
A significant portion of our sales are fulfilled by VARs, regional distributors or master distributors. As an example, 26% of our billings in fiscal 2017 were to Synnex Corporation and Starin Marketing Inc., two master distributors who fulfill demand from other distributors, VARs or end-users. While our VARs typically maintain payment terms consistent with other end-users, our master distributors have longer payment terms and a delay in payment may occur as a result of a number of factors including changes in demand, general economic factors, financial performance, inventory levels or disputes over payments. Our distributor in China is still early in the process of building a team to address demand in China, is under-funded and, therefore, is significantly
18
behind in their payments to us. Any delay from Synnex, Starin, or other large distributors or VARs, could have a material impact on the collections of our receivables during a particular quarter.
We offer credit terms to some of our international customers; however, payments tend to go beyond terms in certain countries and advances allowable on accounts receivable from international customers under our revolving line of credit are calculated using a lower advance rate than domestic receivables, exclude certain countries and are limited to $1 million. Therefore, as Europe, Asia and other international regions grow, accounts receivable balances will likely increase as compared to previous years and our ability to finance the increase will be limited.
Supporting our existing and growing customer base and implementing large customer deployments could strain our personnel resources and infrastructure, and if we are unable to scale our operations and increase productivity, customer satisfaction and our business will be harmed.
Frequent enhancements to our software puts pressure on our customers to install, maintain and train their personnel on its use. Further, frequent releases of the software can lead to less product stability. As a result, our customer care and engineering resources have come under, and are expected in the future to come under significant pressure in providing the high-quality of technical support our customers expect during periods of high demand. We may be unable to respond quickly enough to accommodate short-term increases in customer demand for support services. Increased customer demand for these services, without corresponding revenues, could increase costs and adversely affect our operating results. In addition, our sales process is highly dependent on our applications and business reputation and on positive recommendations from our existing customers. Any failure to maintain high-quality technical support, or a market perception that we do not maintain high-quality support, could adversely affect our reputation, our ability to sell our products and services to existing and prospective customers, and our business, operating results and financial position.
As we target more of our sales efforts at larger initial transactions, we face increasingly complex deployments requiring substantial technical and management resources, including in some cases significant product customization and integration with other applications or hardware. Customers making large expenditures for our products and services typically have higher expectations of product and service operability and response time if issues arise. Some of these customers have asked us to host their content and have significant amounts of legacy content to transfer to our datacenter. Such increased activity and storage demand on our data centers put additional strain on our personnel and hosting infrastructure. Our hosting customers typically require a high level of access, data security and need to capture and store multiple high definition streams. Such requirements require costly enhancements to our infrastructure. High demand on technical and management resources to manage large transactions distract personnel from existing customers, development of new products and other important activities which could lead to potential customer dissatisfaction, product development delays or other issues associated with the distraction.
If a customer is not satisfied with the quality of work performed by us or a third party or with the type of services or solutions delivered, then we could incur additional costs to address the situation and delay recognition of revenue, the profitability of that work might be impaired, and the customer’s dissatisfaction with our services could damage our ability to obtain additional work from that customer. In addition, negative publicity related to our customer relationships, regardless of its accuracy, may further damage our business by affecting our ability to compete for new business with current and prospective customers.
The market price of our common stock may be subject to volatility
The trading prices of the securities of technology companies have been highly volatile. Factors affecting the market price of our common stock include:
• | Variations in our operating results, earnings per share, cash flows from operating activities, deferred revenue and other financial metrics and non-financial metrics, and how those results compare to investor expectations; |
• | Our announcement of actual results for a fiscal period that are higher or lower than expected results or our announcement of revenue or earnings guidance that is higher or lower than expected, including as a result of difficulty forecasting seasonal variations in our financial condition and operating results; |
• | Changes in the estimates of our operating results or changes in recommendations by securities analysts that elect to follow our common stock; |
• | Announcements of technological innovations, new services or service enhancements, strategic alliances or significant agreements by us or by our competitors; |
19
• | Announcements by us or by our competitors of mergers or other strategic acquisitions, or rumors of such transactions involving us or our competitors; |
• | Announcements of customer additions and customer cancellations or delays in customer purchases; |
• | Recruitment or departure of key personnel; |
• | Disruptions in our service due to computer hardware, software, network or data center problems; |
• | The economy as a whole, market conditions in our industry and the industries of our customers; |
• | The issuance of shares of common stock and preferred stock by us, whether in connection with an acquisition or a capital raising transaction; |
• | Low trading volumes of our shares and inconsistent trading activity; |
• | Issuance of debt and other convertible securities; and |
• | Any other factors discussed herein. |
In addition, if the market for technology stocks or the stock market in general experiences uneven investor confidence, the market price of our common stock could decline for reasons unrelated to our business, operating results or financial condition. The market price of our common stock might also decline in reaction to events that affect other companies within, or outside, our industry even if these events do not directly affect us.
Accounting regulations and related interpretations and policies, particularly those related to revenue recognition, cause us to defer revenue recognition into future periods for all or portions of our products and services.
Revenue recognition for our products and services is complex and subject to multiple sources of authoritative guidance, some of which are new, as well as varied interpretations and implementation practices for such rules. These rules require us to apply judgment in determining revenue recognition. In certain situations, we may have to defer the entire amount of revenue from a transaction, even when the product has already shipped. This may occur when the customer has delayed payment on the transaction, or in certain other circumstances, such as when we agree to extend payment terms on other invoices from such customer. In addition, we always defer revenue when services are included in a transaction, and not performed. Other factors that are considered in revenue recognition include those such as vendor specific objective evidence (VSOE), best estimate of selling price and the inclusion of other services and contingencies to payment terms. We expect that we will continue to defer portions or, in certain circumstances with respect to a particular customer, all of our product or service billings because of these factors, and to the extent that management’s judgment is incorrect it could result in an increase in the amount of revenue deferred in any one period. The amounts deferred may be significant and may vary from quarter to quarter depending on, among other factors, compliance with payment terms, the mix of products sold, combination of products and services sold together or contractual terms.
Additional changes in authoritative guidance, including the interpretation of "Revenue from Contracts with Customers (Topic 606)", or changes in practice in applying such rules could also cause us to defer the recognition of revenue to future periods or recognize lower revenue. See Note 1 - Accounting Policies of the Notes to Financial Statements (Part II, Item 8 of this Form 10-K) for further discussion.
Goodwill impairment could negatively impact our net income and stockholders' equity.
Goodwill is not amortized, but is tested for impairment at the reporting unit level. Goodwill is required to be tested for impairment annually and between annual tests if events or circumstances indicate that it is more likely than not that the fair value of a reporting unit is less than its carrying amount. The fair value of each reporting unit was initially measured as of July 1, 2017, in accordance with the routine annual test performed as of July 1, 2017. However, fair value of the reporting units was reevaluated at the end of Q4 2017 due to the decline in the Company's stock price during the quarter. As a result, the Company recorded $600 thousand of goodwill impairment based on the fair value of reporting units measured as of September 30, 2017, which reduced the carrying value of goodwill on our balance sheet to $10.5 million.
There are numerous additional risks that may cause the fair value of a reporting unit to fall below its carrying amount, which could lead to the measurement and recognition of goodwill impairment. In addition to a decline in market capitalization, these additional risks include, but are not limited to, adverse changes in legal factors or the business climate, adverse action or assessment by a regulator, the loss of key personnel, a more-likely-than-not expectation that all or a significant portion of a reporting unit may be disposed of, failure to realize anticipated synergies from acquisitions, significant negative variances between actual and expected financial results, and lowered expectations of future financial results. Any further decline in the Company's market capitalization would increase the risk of further goodwill impairment.
20
Currency exchange rate fluctuations could result in higher costs and decreased margins and earnings.
The functional currency of our foreign subsidiaries in the Netherlands is the Euro and in Japan is the Japanese Yen. They are subject to foreign currency exchange rate risk. The conversion rate of the Yen to the US Dollar rose from 101 at the start of fiscal 2017 and was approximately 112 at the end of fiscal 2017. Similarly, at the beginning of fiscal 2017, the Euro was trading at .89 and was approximately .85 as compared to the US Dollar at the end of fiscal 2017. The strength of the dollar impacted our ability to export profitably to Japan in fiscal 2017, and may continue to fluctuate. Any increase in the exchange rate of the US Dollar compared to the Euro or the Japanese Yen will impact our future operating results and financial position.
We may need to make acquisitions or form strategic alliances or partnerships in order to remain competitive in our market, and recent acquisitions, strategic alliances or partnerships, including the acquisition of Mediasite KK and Sonic Foundry International, could be difficult to integrate, disrupt our business and dilute stockholder value.
We completed the acquisitions of Mediasite KK in Japan and MediaMission (now Sonic Foundry International) in the Netherlands in fiscal 2014. As a result of these acquisitions, we are integrating products, services, dispersed operations, management systems and very different cultures. In the future, we may acquire or form strategic alliances or partnerships with other businesses in order to remain competitive or to acquire new technologies. Acquisitions and investments involve numerous risks, including:
• | The potential failure to achieve the expected benefits of the combination or acquisition; |
• | Difficulties in and the cost of integrating operations, technologies, services and personnel; |
• | Diversion of financial and managerial resources from existing operations; |
• | Risk of entering new markets in which we have little or no experience or where competitors may have stronger market positions; |
• | Potential write-offs of acquired assets or investments, and potential financial and credit risks associated with acquired customers; |
• | Potential loss of key employees; |
• | Inability to generate sufficient revenue to offset acquisition or investment costs; |
• | The inability to maintain relationships with customers and partners of the acquired business; |
• | The difficulty of transitioning the acquired technology onto our existing platforms and maintaining the security standards consistent with our other services for such technology; |
• | Potential unknown liabilities associated with the acquired businesses; |
• | Unanticipated expenses related to acquired technology and its integration into existing technology; |
• | Negative impact to our results of operations because of the depreciation and amortization of amounts related to acquired intangible assets, fixed assets and deferred compensation, and the loss of acquired deferred revenue and unbilled deferred revenue; |
• | Delays in customer purchases due to uncertainty related to any acquisition; |
• | The need to implement controls, procedures and policies at the acquired company; |
• | Challenges caused by distance, language and cultural differences; |
• | In the case of foreign acquisitions, the challenges associated with integrating operations across different cultures and languages and currency, technological, employee and other regulatory risks and uncertainties in the economic, social and political conditions associated with specific countries; and |
• | The tax effects of any such acquisitions. |
Our failure to successfully manage the acquisitions of Mediasite KK and Sonic Foundry International, or other future acquisitions, strategic alliances or partnerships could seriously harm our operating results. In addition, our stockholders would be diluted if we finance the future acquisitions, strategic alliances or partnerships by incurring convertible debt or issuing equity securities.
If potential customers or competitors use open source software to develop products that are competitive with our products and services, we may face decreased demand and pressure to reduce the prices for our products.
The growing acceptance and prevalence of open source software may make it easier for competitors or potential competitors to develop software applications that compete with our products, or for customers and potential customers to internally develop software applications that they would otherwise have licensed from us. One of the aspects of open source software is that it can be modified or used to develop new software that competes with proprietary software applications, such as ours. Such competition can develop without the degree of overhead and lead time required by traditional proprietary software companies. As open source offerings become more prevalent, customers may defer or forego purchases of our products, which could reduce our sales and lengthen the sales cycle for our products or result in the loss of current customers to open source solutions. If we are unable to
21
differentiate our products from competitive products based on open source software, demand for our products and services may decline, and we may face pressure to reduce the prices of our products, which would hurt our profitability. If our use of open-source is challenged and construes unfavorably, our operating results could be adversely impacted.
We use open source software in our application suite. Although we monitor our use of open source software closely, the terms of many open source licenses have not been interpreted by United States courts, and there is risk that such licenses could be construed in a manner that imposes unanticipated conditions or restrictions on our ability to commercialize our products. In such event, we could be required to re-engineer our technology or to discontinue offering all or a portion of our products in the event re-engineering cannot be accomplished on a timely basis, any of which could adversely affect our business, operating results and financial condition.
Our customers may use our products to share confidential and sensitive information, and if our system security is breached, our reputation could be harmed and we may lose customers.
Our customers may use our products and services to share confidential and sensitive information, the security of which is critical to their business. Third parties may attempt to breach our security for customer hosted content or the networks of our customers. Malicious third-parties may also conduct attacks designed to temporarily deny customers access to our services. Customers may take inadequate security precautions with their sensitive information and may inadvertently make that information public. We may be liable to our customers or subject to fines for a breach in security, and any breach could harm our reputation and cause us to lose customers. In addition, customers are vulnerable to computer viruses, physical or electronic break-ins and similar disruptions, which could lead to interruptions, delays or loss of data. We may be required to expend significant capital and other resources to further protect against security breaches or to resolve problems caused by any breach, including litigation-related expenses if we are sued.
Privacy concerns and laws, evolving regulation of cloud computing, cross-border data transfer restrictions and other domestic or foreign regulations may limit the use and adoption of our solutions and adversely affect our business.
Regulation related to the provision of services on the Internet is increasing, as federal, state and foreign governments continue to adopt new laws and regulations addressing data privacy and the collection, processing, storage and use of personal information, including health data. In some cases foreign data privacy laws and regulations, such as the European Union’s Data Protection Directive, and the country-specific regulations that implement that directive, also govern the processing of personal information. While our European customers can confirm our participation in the EU Privacy Shield program as support that we comply with the European Union Directive on the protection of personal data, they may still have concerns about our processing of personal data and may decide not to host content with us. Further, laws are increasingly aimed at the use of personal information for marketing purposes, such as the European Union’s e-Privacy Directive, and the country-specific regulations that implement that directive. Such laws and regulations are subject to differing interpretations and may be inconsistent among jurisdictions. These and other requirements could reduce demand for our solutions, restrict our ability to support our customers, or even offer our services and solutions in certain locations. We expect to acquire software and hardware in fiscal 2018 in order to enhance our ability to defend and to detect intrusions to our network infrastructure. These enhancements will be expensive and require significant staff time to deploy and develop, and there is no assurance that they will be effective.
In addition to government activity, privacy advocacy and other industry groups have established or may establish new self-regulatory standards that may place additional burdens on us. Many of our customers in the European Union face increasingly complex procurement requirements that have delayed some projects and caused us not to be successful in winning other opportunities. If we are unable to maintain these certifications or meet these standards, it could adversely affect our ability to provide our solutions to certain customers and could harm our business.
Our customers and potential customers do business in a variety of industries, including financial services, the public sector, healthcare and telecommunications. Regulators in certain industries have adopted and may in the future adopt regulations or interpretive positions regarding the use of cloud computing and other outsourced services. The costs of compliance with, and other burdens imposed by, industry-specific laws, regulations and interpretive positions may limit customers’ use and adoption of our services and reduce overall demand for our services.
The costs of compliance with and other burdens imposed by laws, regulations and standards may limit the use and adoption of our service and reduce overall demand for it, or lead to significant fines, penalties or liabilities for any noncompliance.
22
Furthermore, concerns regarding data privacy may cause the users of our customers’ data to resist providing the data necessary to allow our customers to use our service effectively. Even the perception that the privacy of personal information is not satisfactorily protected or does not meet regulatory requirements could inhibit sales of our products or services, and could limit adoption of our cloud-based solutions.
Operational failures in our network infrastructure could disrupt our remote hosting services, cause us to lose clients and sales to potential clients and result in increased expenses and reduced revenues.
Unanticipated problems affecting our network systems could cause interruptions or delays in the delivery of the hosting services we provide to some of our clients. We are not equipped to provide full disaster recovery to all of our hosted clients. If there are operational failures in our network infrastructure that cause interruptions, slower response times, loss of data or extended loss of service for our remotely hosted clients, we may be required to issue credits or pay penalties, current clients may terminate their contracts or elect not to renew them and we may lose sales to potential clients. We have recently acquired additional hardware and systems, expect to make more significant investments in hardware (primarily for storage) and outsourced most aspects of our network infrastructure to three providers. As a result, we are reliant on third parties for network availability so outages may be outside our control and we may need to acquire additional hardware in order to provide an appropriate level of redundancy required by our customers.
We license technology from third parties. If we are unable to maintain these licenses, our operations and financial condition may be negatively impacted.
We license technology from third parties. The loss of, our inability to maintain, or changes in material terms of these licenses could result in increased cost or delayed sales of our software and services, or may cause us to remove features from our products or services. We anticipate that we will continue to license technology from third parties in the future. This technology may not continue to be available on commercially reasonable terms, if at all. Although we do not believe that we are substantially dependent on any individual licensed technology, some of the component technologies that we license from third parties could be difficult for us to replace. The impairment of these third-party relationships, especially if this impairment were to occur in unison, could result in delays in the delivery of our software and services until equivalent technology, if available, is identified, licensed and integrated. This delay could adversely affect our operating results and financial condition.
The technology underlying our products and services is complex and may contain unknown defects that could harm our reputation, result in product liability or decrease market acceptance of our products.
The technology underlying our products is complex and includes software that is internally developed, software licensed from third parties and hardware purchased from third parties. These products have, and will in the future, contain errors or defects, particularly when first introduced or when new versions or enhancements are released. We may not discover defects that affect our current or new applications or enhancements until after they are sold and our insurance coverage may not be sufficient to cover our exposure. Any defects in our products and services could:
• | Damage our reputation; |
• | Cause our customers to initiate product liability suits against us; |
• | Increase our product development resources; |
• | Cause customers to cancel orders, ask for partial refunds or potential customers to purchase competitive products or services; |
• | Delay release or market acceptance of our products, or otherwise adversely impact our relationships with our customers; and |
• | Cause us to allocate valuable engineering resources to fix our existing products, which may cause us to allocate fewer resources toward developing new products, or toward adding features to our existing products. |
If we are viewed only as a commodity supplier, our margins and valuations will shrink.
We need to provide value-added services in order to avoid being viewed as a commodity supplier. This entails building long-term customer relationships and developing features that will distinguish our products. Our technology is complex and is often confused with other products and technologies in the market place, including video conferencing, streaming and collaboration.
We have developed lower cost hardware, software products and cloud solutions to better address the more cost conscious customers. Such products have more limited features compared to our existing products. While we believe we can preserve the market for our full-featured products due to differentiation between the two and migration to full featured products, release of lower cost
23
products could reduce gross margin and demand for products sold at higher prices. Potential large scale deployments of our products often include the lower cost products we sell, putting greater pressure on gross margin due to expectations for greater volume discounts.
If we fail to build long-term customer relationships, develop features that distinguish our products in the market place and address the market for lower function and cost solutions, our margins will shrink and our stock may become less valuable to investors.
Our success depends upon the proprietary aspects of our technology.
Our success and ability to compete depend to a significant degree upon the protection of our proprietary technology. We currently have four U.S. patents that have been issued to us. We may seek additional patents in the future. However, it is possible that:
• | Any patents acquired by or issued to us may not be broad enough to protect us. |
• | Any issued patent could be successfully challenged by one or more third parties, which could result in our loss of the right to prevent others from exploiting the inventions claimed in those patents. |
• | Current and future competitors may independently develop similar technology, duplicate our services or design around any of our patents. |
• | Effective patent protection, including effective legal-enforcement mechanisms against those who violate our patent-related assets, may not be available in every country in which we do or plan to do business. |
• | We may not have the resources to enforce our patents or may determine the potential benefits are not worth the cost and risk of ultimately being unsuccessful. |
We also rely upon trademark, copyright and trade secret laws, which may not be sufficient to protect our intellectual property.
We also rely on a combination of laws, such as copyright, trademark and trade secret laws, and contractual restrictions, such as confidentiality agreements and licenses, to establish and protect our technology. We have registered three U.S. and four foreign country trademarks. These forms of intellectual property protection are critically important to our ability to establish and maintain our competitive position. However, it is possible that:
• | Third parties may infringe or misappropriate our copyrights, trademarks and similar proprietary rights. |
• | Laws and contractual restrictions may not be sufficient to prevent misappropriation of our technology or to deter others from developing similar technologies, particularly in foreign countries where the laws may not protect our proprietary rights as fully or as readily as Unites States laws. Our recent growth in activities in China will likely increase this risk. |
• | There have been attacks on certain patent systems, increasing the likelihood of changes to established laws, including in the United States. We cannot predict the long-term effects of any potential changes, which could be detrimental to our licensing program. |
• | Effective trademark, copyright and trade secret protection, including effective legal-enforcement mechanisms against those who violate our trademark, copyright or trade secret assets, may be cost prohibitive or unavailable or limited in foreign countries. |
• | Contractual agreements may not provide meaningful protection for our trade secrets, know-how or other proprietary information in the event of any unauthorized use, misappropriation or disclosure of such trade secrets, know-how or other proprietary information. |
• | Other companies may claim common law trademark rights based upon state or foreign laws that precede the federal registration of our marks. |
• | Policing unauthorized use of our services and trademarks is difficult, expensive and time-consuming, and we may be unable to determine the extent of any unauthorized use. |
Reverse engineering, unauthorized copying or other misappropriation of our proprietary technology could enable third parties to benefit from our technology without paying us for it, which would significantly harm our business.
If other parties bring infringement or other claims against us, we may incur significant costs or lose customers.
Other companies may obtain patents or other proprietary rights that would limit our ability to conduct our business and could assert that our technologies infringe their proprietary rights. We have incurred substantial costs to defend against such claims in the past and could incur legal costs in the future, even if without merit, and intellectual property litigation could force us to cease using key technology, obtain a license or redesign our products. In the course of our business, we may sell certain systems to our customers, and in connection with such sale, we may agree to indemnify these customers from claims made against them by third parties for patent infringement related to these systems, which could harm our business.
24
If we lose key personnel or fail to integrate replacement personnel successfully, our ability to manage our business could be impaired.
Our future success depends upon the continued service of our key management, technical, sales and other critical personnel, particularly our Chief Executive Officer. Most of our officers and other key personnel are employees-at-will, and we cannot assure that we will be able to retain them. Key personnel have left our company in the past, sometimes to accept employment with companies that sell similar products or services to existing or potential customers of ours. There will likely be additional departures of key personnel from time to time in the future and such departures could result in additional competition, loss of customers or confusion in the marketplace. As we seek to replace such departures, or expand our business, the hiring of qualified sales, technical and support personnel has been difficult due to the limited number of qualified professionals. The loss of any key employee could result in significant disruptions to our operations, including adversely affecting the timeliness of product releases, the successful implementation and completion of company initiatives and the results of our operations. In addition, we do not have life insurance policies on any of our key employees. If we lose the services of any of our key employees, the integration of replacement personnel could be time consuming, may cause disruptions to our operations and may be unsuccessful.
We face risks associated with government regulation of the internet and related legal uncertainties.
Currently, few existing laws or regulations specifically apply to the Internet, other than laws generally applicable to businesses. Many Internet-related laws and regulations, however, are pending and may be adopted in the United States, in individual states and local jurisdictions and in other countries. These laws may relate to many areas that impact our business, including encryption, network and information security, and the convergence of traditional communication services, such as telephone services, with Internet communications, taxes and wireless networks. These types of regulations could differ between countries and other political and geographic divisions both inside and outside the United States. Non-U.S. countries and political organizations may impose, or favor, more and different regulation than that which has been proposed in the United States, thus furthering the complexity of regulation. In addition, state and local governments within the United States may impose regulations in addition to, inconsistent with, or stricter than federal regulations. The adoption of such laws or regulations, and uncertainties associated with their validity, interpretation, applicability and enforcement, may affect the available distribution channels for, and the costs associated with, our products and services. The adoption of such laws and regulations may harm our business.
Exercise of outstanding options and warrants will result in further dilution.
The issuance of shares of common stock upon the exercise of our outstanding options and warrants will result in dilution to the interests of our stockholders, and may reduce the trading price of our common stock.
At September 30, 2017, we had 135 thousand outstanding warrants and 1.8 million of outstanding stock options granted under our stock option plans, 1.4 million of which are immediately exercisable.
While nearly all outstanding warrants and options are currently priced above the market price of our common stock, dilution to the interests of our stockholders will likely occur if or when they are exercised. Additional options and warrants may be issued in the future at prices not less than 85% of the fair market value of the underlying security on the date of grant. Exercises of these options, or even the potential of their exercise may have an adverse effect on the trading price of our common stock. The holders of our options are likely to exercise them at times when the market price of the common stock exceeds the exercise price of the securities. Accordingly, the issuance of shares of common stock upon exercise of the options will likely result in dilution of the equity represented by the then outstanding shares of common stock held by other stockholders. Holders of our options can be expected to exercise or convert them at a time when we would, in all likelihood, be able to obtain any needed capital on terms, which are more favorable to us than the exercise terms provided, by these options.
Our ability to utilize our net operating loss carryforwards may be limited.
The use of our net operating loss carryforwards may have limitations resulting from certain future ownership changes, time limitations or other factors under the Internal Revenue Code and other taxing authorities.
If our net operating loss carryforwards are limited, and we have taxable income which exceeds the available net operating loss carryforwards for that period, we would incur an income tax liability even though net operating loss carryforwards may be available in future years prior to their expiration. Any such income tax liability may adversely affect our future cash flow, financial position and financial results.
25
Our business is subject to changing regulations regarding corporate governance and public disclosure that will increase both our costs and the risk of noncompliance.
As a publicly traded company we are subject to significant regulations, including the Sarbanes-Oxley Act of 2002. While we have developed and instituted a corporate compliance program based on what we believe are the current best practices and continue to update the program in response to newly implemented regulatory requirements and guidance, we cannot assure that we are or will be in compliance with all potentially applicable regulations.
Although our non-affiliate market capitalization was less than $75 million at March 31, 2017 and we were therefore not required to have an auditor attestation on our internal controls over financial reporting for fiscal 2017, SEC rules may in the future require us to have such an attestation if our non-affiliate market capitalization exceeds a certain threshold. We have found material weaknesses in our internal control over financial reporting in the past and cannot assure that in the future our management or our auditors, will not find additional material weaknesses in connection with our internal control over financial reporting pursuant to Section 404 of the Sarbanes-Oxley Act. We also cannot assure that we could correct all such weaknesses to allow our management to attest that we have maintained effective internal controls over financial reporting as of the end of our fiscal year in time to enable our independent registered public accounting firm to attest that such assessment will have been fairly stated in our Annual Report on Form 10-K to be filed with the Securities and Exchange Commission or attest that we have maintained effective internal control over financial reporting as of the end of our fiscal year. If we fail to comply with any of these regulations, we could be subject to a range of regulatory actions, fines, or other sanctions or litigation. In addition, the disclosure of any material weakness in our internal control over financial reporting could have a negative impact on our stock price.
Provisions of our charter documents and Maryland law could also discourage an acquisition of our company that would benefit our stockholders.
Provisions of our articles of incorporation and by-laws may make it more difficult for a third party to acquire control of our company, even if a change in control would benefit our stockholders. Our articles of incorporation authorize our board of directors, without stockholder approval, to issue one or more series of preferred stock, which could have voting and conversion rights that adversely affect or dilute the voting power of the holders of common stock. Furthermore, our articles of incorporation provide for a classified board of directors, which means that our stockholders may vote upon the retention of only one or two of our five directors each year. Moreover, Maryland corporate law restricts certain business combination transactions with “interested stockholders” and limits voting rights upon certain acquisitions of “control shares.” In addition, even when there are no interested stockholders involved in a transaction, Maryland law requires that a transaction involving a merger, consolidation, transfer of assets, or share exchange, must be approved by the affirmative vote of at least two-thirds of the Company’s stockholders.
Our executive officers, directors, and several stockholders and their affiliated entities together beneficially own, on an “as converted basis”, over 32% of our outstanding common stock. As a result, these stockholders, if they act together or in a block, could have significant influence over most matters that require approval by our stockholders, including the approval of significant corporate transactions, even if other stockholders oppose them. This concentration of ownership might also have the effect of delaying or preventing a change of control of our company that other stockholders may view as beneficial.
ITEM 1B. UNRESOLVED STAFF COMMENTS
None.
ITEM 2. PROPERTIES
Our principal office is located in Madison, Wisconsin in a leased facility of approximately 26,000 square feet. The building serves as our corporate headquarters, accommodating our general and administrative, product development and selling and marketing departments. We believe this facility is adequate for our needs. The current lease term for this office expires on December 31, 2018. The rent for the remainder of the lease period is approximately $57 thousand per month.
Our operations in Japan are managed in Tokyo, Japan in a leased facility of approximately 9,874 square feet with a term expiring on December 31, 2020. The facility includes sales, technical and administrative functions. The rent for the remainder of the lease period is approximately $39 thousand per month.
26
Our European operations are managed in Utrecht, Netherlands in a leased facility of approximately 3,886 square feet with a term expiring on January 31, 2019. The facility includes sales, technical and administrative functions. The rent for the remainder of the lease period is approximately $5 thousand per month.
ITEM 3. LEGAL PROCEEDINGS
None.
ITEM 4. MINE SAFETY DISCLOSURES
Not applicable.
27
PART II
ITEM 5. MARKET FOR REGISTRANT’S COMMON EQUITY, RELATED STOCKHOLDER MATTERS, AND ISSUER PURCHASES OF EQUITY SECURITIES
Price Range of Common Stock
Our common stock was initially traded on the American Stock Exchange under the symbol “SFO,” beginning with our initial public offering in April of 1998. On April 24, 2000, our common stock began trading on the NASDAQ Global Market under the symbol “SOFO.” Effective September 16, 2009, we transferred the listing of our common stock to the NASDAQ Capital Market. The following table sets forth, for the periods indicated, the high and low sale prices per share of our common stock as reported on the NASDAQ Global or Capital Markets.
High | Low | ||||||
Year Ended September 30, 2018: | |||||||
First Quarter (through December 29, 2017) | $ | 3.87 | $ | 2.05 | |||
Year Ended September 30, 2017: | |||||||
First Quarter | 5.92 | 3.75 | |||||
Second Quarter | 5.35 | 4.50 | |||||
Third Quarter | 5.25 | 3.72 | |||||
Fourth Quarter | 4.13 | 3.03 | |||||
Year Ended September 30, 2016: | |||||||
First Quarter | 8.25 | 5.00 | |||||
Second Quarter | 6.98 | 4.28 | |||||
Third Quarter | 8.51 | 5.76 | |||||
Fourth Quarter | 6.50 | 5.75 | |||||
Dividends
The Company has not paid any cash dividends and does not intend to pay any cash dividends in the foreseeable future. The Company is prohibited from paying any cash dividends pursuant to the terms of the loan and security agreement with Silicon Valley Bank.
Holders
At December 29, 2017, there were 226 common stockholders of record and approximately 3,700 total shareholders. Many shares are held by brokers and other institutions on behalf of shareholders.
Equity Compensation Plan Information
Plan category | Number of securities to be issued upon exercise of outstanding options | Weighted average exercise price of outstanding options | Number of securities remaining available for future issuance | ||||||
(a) | (b) | (c) | |||||||
Equity compensation plans approved by security holders (1) | 1,756,643 | $ | 7.83 | 1,056,390 | |||||
Equity compensation plans not approved by security holders (2) | 48,800 | 11.24 | — | ||||||
Total | 1,805,443 | $ | 8.33 | 1,056,390 | |||||
(1) | Consists of the 2009 Stock Incentive Plan, Employee Incentive Stock Option Plan and the Directors Stock Option Plans. For further information regarding these plans, reference is made to Note 5 of the financial statements. |
(2) | Consists of the Non-Qualified Stock Option Plan. For further information regarding this plan, reference is made to Note 5 of the financial statements. |
28
The graph below compares the cumulative total stockholder return on our common stock from September 30, 2012 through and including September 30, 2017 with the cumulative total return on The NASDAQ Stock Market (US only) and the RDG Technology Composite. The graph assumes that $100 was invested in our common stock on September 30, 2012 for each of the indexes and that all dividends were reinvested. Unless otherwise specified, all dates refer to the last day of each month presented. The comparisons in the graph below are based on historical data, with our common stock prices based on the closing price on the dates indicated, and are not intended to forecast the possible future performance of our common stock.
COMPARISON OF 5 YEAR CUMULATIVE TOTAL RETURN*
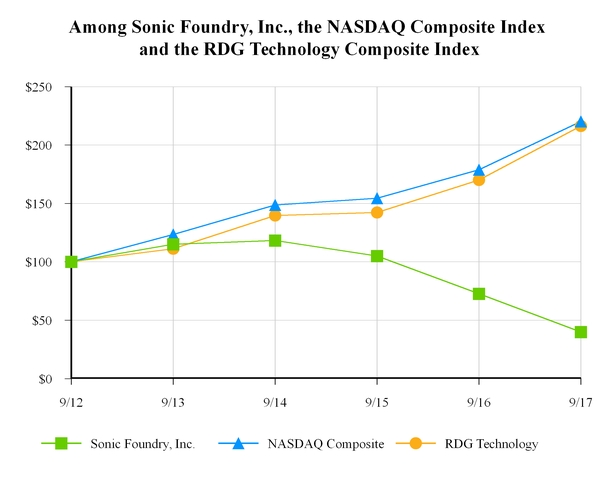
*$100 invested on 9/30/12 in stock or index, including reinvestment of dividends Fiscal year ending September 30.
ITEM 6. SELECTED CONSOLIDATED FINANCIAL DATA
The selected financial and operating data were derived from our consolidated financial statements. The selected financial data set forth below is qualified in its entirety by, and should be read in conjunction with, “Management’s Discussion and Analysis of Financial Condition and Results of Operations” and our financial statements and notes thereto appearing elsewhere in this annual report on Form 10-K (in thousands except per share data).
29
Years Ended September 30, | |||||||||||||||||||
2017 | 2016 | 2015 | 2014 | 2013 | |||||||||||||||
Statement of Operations Data: | |||||||||||||||||||
Revenue | $ | 36,000 | $ | 37,975 | $ | 36,459 | $ | 35,830 | $ | 27,756 | |||||||||
Cost of revenue | 9,867 | 9,985 | 10,635 | 10,275 | 7,696 | ||||||||||||||
Gross margin | 26,133 | 27,990 | 25,824 | 25,555 | 20,060 | ||||||||||||||
Operating expenses | 30,091 | 30,266 | 29,916 | 28,637 | 20,698 | ||||||||||||||
Impairment of goodwill | 600 | — | — | — | — | ||||||||||||||
Income (loss) from operations | (4,558 | ) | (2,276 | ) | (4,092 | ) | (3,082 | ) | (638 | ) | |||||||||
Gain on investment in Mediasite KK | — | — | — | 1,390 | — | ||||||||||||||
Equity in earnings from investment in Mediasite KK | — | — | — | 38 | 209 | ||||||||||||||
Other income (expense), net | (65 | ) | (178 | ) | 46 | 173 | (123 | ) | |||||||||||
Interest expense, net | (495 | ) | (594 | ) | (372 | ) | (231 | ) | — | ||||||||||
Provision for income taxes | 79 | (269 | ) | (107 | ) | (1,104 | ) | (240 | ) | ||||||||||
Net loss | $ | (5,039 | ) | $ | (3,317 | ) | $ | (4,525 | ) | $ | (2,816 | ) | $ | (792 | ) | ||||
Dividends on preferred stock | $ | (169 | ) | - | - | - | - | ||||||||||||
Net loss attributable to shareholders | $ | (5,208 | ) | $ | (3,317 | ) | $ | (4,525 | ) | $ | (2,816 | ) | $ | (792 | ) | ||||
Basic net income (loss) per common share | $ | (1.17 | ) | $ | (0.76 | ) | $ | (1.04 | ) | $ | (0.67 | ) | $ | (0.20 | ) | ||||
Diluted net income (loss) per common share | $ | (1.17 | ) | $ | (0.76 | ) | $ | (1.04 | ) | $ | (0.67 | ) | $ | (0.20 | ) | ||||
Weighted average common shares: – Basic | 4,436,333 | 4,389,421 | 4,332,576 | 4,174,191 | 3,932,692 | ||||||||||||||
– Diluted | 4,436,333 | 4,389,421 | 4,332,576 | 4,174,191 | 3,932,692 | ||||||||||||||
Balance Sheet Data at September 30: | 2017 | 2016 | 2015 | 2014 | 2013 | ||||||||||||||
Cash and cash equivalents | $ | 1,211 | $ | 1,794 | $ | 1,976 | $ | 4,344 | $ | 3,482 | |||||||||
Working capital | (4,833 | ) | (3,720 | ) | (618 | ) | 18 | 2,575 | |||||||||||
Total assets | 28,356 | 33,082 | 34,803 | 34,623 | 24,333 | ||||||||||||||
Long-term liabilities | 8,147 | 7,249 | 8,435 | 7,268 | 3,585 | ||||||||||||||
Stockholders’ equity | 3,118 | 6,516 | 7,803 | 11,315 | 10,704 | ||||||||||||||
ITEM 7. MANAGEMENT’S DISCUSSION AND ANALYSIS OF FINANCIAL CONDITION AND RESULTS OF OPERATIONS
The financial and business analysis below provides information that Sonic Foundry, Inc. (the “Company”) believes is relevant to an assessment and understanding of the Company’s consolidated financial position and results of operations. This financial and business analysis should be read in conjunction with the consolidated financial statements and related notes.
This report includes estimates, projections, statements relating to our business plans, objectives, and expected operating results that are “forward-looking statements” within the meaning of the Private Securities Litigation Reform Act of 1995, Section 27A of the Securities Act of 1933, and Section 21E of the Securities Exchange Act of 1934. Forward-looking statements may appear throughout this report, including the following sections: “Management’s Discussion and Analysis,” and “Risk Factors.” These forward-looking statements generally are identified by the words “believe,” “project,” “expect,” “anticipate,” “estimate,” “intend,” “strategy,” “future,” “opportunity,” “plan,” “may,” “should,” “will,” “would,” “will be,” “will continue,” “will likely result,” and similar expressions. Forward-looking statements are based on current expectations and assumptions that are subject to risks and uncertainties that may cause actual results to differ materially. We describe risks and uncertainties that could cause actual results and events to differ materially in “Risk Factors” (Part 1, Item 1A of this Form 10-K), “Quantitative and Qualitative Disclosures about Market Risk” (Part II, Item 7A of this Form 10-K), and in this Item 7. We undertake no obligation to update or revise publicly any forward-looking statements, whether because of new information, future events, or otherwise.
Overview
30
Sonic Foundry, Inc. is the trusted global leader for video capture, management and streaming solutions. Trusted by educational institutions, corporations and government entities, Mediasite Video Platform quickly and cost-effectively automates the capture, management, delivery and search of live and on-demand streaming video and rich media. Mediasite transforms communications, training, education and events for our customers.
Critical Accounting Policies
We have identified the following as critical accounting policies to our Company and have discussed the development, selection of estimates and the disclosure regarding them with the audit committee of the board of directors:
• | Revenue recognition, allowance for doubtful accounts and reserves; |
• | Impairment of long-lived assets; |
• | Valuation allowance for net deferred tax assets; and |
• | Accounting for stock-based compensation. |
Revenue Recognition, Allowance for Doubtful Accounts and Reserves
General
Revenue is recognized when persuasive evidence of an arrangement exists, delivery occurs or services are rendered, the sales price is fixed or determinable and collectability is reasonably assured. Revenue is deferred when undelivered products or services are essential to the functionality of delivered products, customer acceptance is uncertain, significant obligations remain, or the fair value of undelivered elements is unknown. Typically, the Company does not offer customers the right to return product, other than for exchange or repair pursuant to a warranty or stock rotation. The Company’s policy is to reduce revenue if it incurs an obligation for price rebates or other such programs during the period the obligation is reasonably estimated to occur. The following policies apply to the Company’s major categories of revenue transactions.
We currently are evaluating the impact of a new standard related to revenue recognition, which we anticipate will have a material impact on our consolidated financial statements. See Note 1 - Accounting Policies of the Notes to Financial Statements (Part II, Item 8 of this Form 10-K) for further discussion.
Products
Products are considered delivered, and revenue is recognized, when title and risk of loss have been transferred to the customer or upon customer acceptance if non-delivered products or services are essential to the functionality of delivered products. Under the terms and conditions of the sale, this occurs at the time of shipment to the customer. Product revenue currently represents sales of our Mediasite recorders and Mediasite related products such as our server software and other software licenses. If a license is time-based, the revenue is recognized over the term of the license agreement.
Services
The Company sells support and content hosting contracts to our customers, typically one year in length, and records the related revenue ratably over the contractual period. Our support contracts cover phone and electronic technical support availability over and above the level provided by our distributors, software upgrades on a when and if available basis, advance hardware replacement and an extension of the standard hardware warranty from 90 days to one year. The manufacturers the Company contracts with to build the units provide a limited one-year warranty on the hardware. The Company also sells installation, training, event webcasting, and customer content hosting services. Revenue for those services is recognized when performed in the case of installation, training and event webcasting services. Occasionally, the Company will sell customization services to enhance the server software. Revenue from those services is recognized when performed, if perfunctory, or under contract accounting. Service amounts invoiced to customers in excess of revenue recognized are recorded as deferred revenue until the revenue recognition criteria are met.
Revenue Arrangements that Include Multiple Elements
Sales of software, with or without installation, training, and post customer support fall within the scope of the software revenue recognition rules. Under the software revenue recognition rules, the fee from a multiple-deliverable arrangement is allocated to each of the undelivered elements based upon vendor-specific objective evidence (VSOE), which is limited to the price charged
31
when the same deliverable is sold separately, with the residual value from the arrangement allocated to the delivered element. The portion of the fee that is allocated to each deliverable is then recognized as revenue when the criteria for revenue recognition are met with respect to that deliverable. If VSOE does not exist for all of the undelivered elements, then all revenue from the arrangement is typically deferred until all elements have been delivered to the customer.
In the case of the Company’s hardware products with embedded software, the Company has determined that the hardware and software components function together to deliver the product’s essential functionality, and therefore, the revenue from the sale of these products is accounted for under the revenue recognition rules for tangible products whereby the fee from a multiple-deliverable arrangement is allocated to each of the deliverables based upon their relative selling prices as determined by a selling-price hierarchy. A deliverable in an arrangement qualifies as a separate unit of accounting if the delivered item has value to the customer on a stand-alone basis. A delivered item that does not qualify as a separate unit of accounting is combined with the other undelivered items in the arrangement and revenue is recognized for those combined deliverables as a single unit of accounting. The selling price used for each deliverable is based upon VSOE if available, from third-party evidence (TPE) if VSOE is not available, and best estimate of selling price (ESP) if neither VSOE nor TPE are available. TPE is the price of the Company’s or any competitor’s largely interchangeable products or services in stand-alone sales to similarly situated customers. ESP is the price at which the Company would sell the deliverable if it were sold regularly on a stand-alone basis, considering market conditions and entity-specific factors. All revenue arrangements, excluding the sale of all software-only products and associated services, have been accounted for under this guidance.
The selling prices used in the relative selling price allocation method are as follows: (1) the Company’s products and services are based upon VSOE and (2) hardware products with embedded software, for which VSOE does not exist, are based upon ESP. The Company does not believe TPE exists for any of these products and services because they are differentiated from competing products and services in terms of functionality and performance and there are no competing products or services that are largely interchangeable. Management establishes ESP for hardware products with embedded software using a cost plus margin approach with consideration for market conditions, such as the impact of competition and geographic considerations, and entity-specific factors, such as the cost of the product and the Company’s profit objectives. Management believes that ESP is reflective of reasonable pricing of that deliverable as if priced on a stand-alone basis. When a sales transaction includes deliverables that are divided between Accounting Standards Codification (ASC) Topic 605 and ASC Subtopic 985-605, the Company allocates the selling price using the relative selling price method whereas value is allocated using an ESP for software developed using a percent of list price approach. The other deliverables are valued using ESP or VSOE as previously discussed.
While the pricing model, currently in use, captures all critical variables, unforeseen changes due to external market forces may result in a revision of the inputs. These modifications may result in the consideration allocation differing from the one presently in use. Absent a significant change in the pricing inputs or the way in which the industry structures its deals, future changes in the pricing model are not expected to materially affect our allocation of arrangement consideration.
Management has established VSOE for hosting services. Billings for hosting are spread ratably over the term of the hosting agreement, with the typical hosting agreement having a term of 12 months, with renewal on an annual basis. The Company sells most hosting contracts without the inclusion of products. When the hosting arrangement is sold in conjunction with product, the product revenue is recognized immediately while the remaining hosting revenue is spread ratably over the term of the hosting agreement. The selling price is allocated between these elements using the relative selling price method. The Company uses ESP for development of the selling price for hardware products with embedded software.
The Company also offers hosting services bundled with events services. The Company uses VSOE to establish relative selling prices for its events services. The Company recognizes events revenue when the event takes place and recognizes the hosting revenue over the term of the hosting agreement. The total amount of the arrangement is allocated to each element based on the relative selling price method.
Reserves
The Company reserves for stock rotations, price adjustments, rebates, and sales incentives to reduce revenue and accounts receivable for these and other credits granted to customers. Such reserves are recorded at the time of sale and are calculated based on historical information (such as rates of product stock rotations) and the specific terms of sales programs, taking into account any other known information about likely customer behavior. If actual customer behavior differs from our expectations, it may compromise our ability to recognize revenue to these distributors at the time of shipment. Also, if the Company determines that it can no longer
32
accurately estimate amounts for stock rotations and sales incentives, the Company would not be able to recognize revenue until resellers sell the inventory to the final end user.
Credit Evaluation and Allowance for Doubtful Accounts
We assess the realization of our receivables by performing ongoing credit evaluations of our customers’ financial condition. Through these evaluations, we may become aware of a situation where a customer may not be able to meet its financial obligations due to deterioration of its financial viability, credit ratings or bankruptcy. Our reserve requirements are based on the best facts available to us and are reevaluated and adjusted as additional information is received. Our reserves are also based on amounts determined by using percentages applied to certain aged receivable categories. These percentages are determined by a variety of factors including, but not limited to, current economic trends, historical payment and bad debt write-off experience. Allowance for doubtful accounts for accounts receivable and financing receivables was $575,000 at September 30, 2017 and $225,000 at September 30, 2016.
Impairment of long-lived assets
Goodwill has an indefinite useful life and is recorded at cost and not amortized but, instead, tested at least annually for impairment. We assess the impairment of goodwill on an annual basis or whenever events or changes in circumstances indicate that the fair value of these assets is less than the carrying value. If a qualitative assessment is used and the Company determines that the fair value of goodwill is more likely than not (i.e., a likelihood of more than 50%) less than its carrying amount, a quantitative impairment test will be performed. If goodwill is quantitatively assessed for impairment, the Company compares the estimated fair value of the reporting unit to which goodwill is allocated to its carrying value. The amount of impairment, if any, is equal to the amount by which the carrying value of the reporting unit exceeds its fair value.
For purposes of the fiscal 2017 and 2016 tests, goodwill balances are evaluated within three separate reporting units. In fiscal 2016, we performed a two-step goodwill test and determined that the fair value of goodwill was more than the carrying value. In fiscal 2017, we performed a quantitative analysis and determined that the fair value of one of the Company's reporting units is less than its carrying value, and that the fair value of the remaining reporting units is greater than their respective carrying values. The Company recognized impairment charges of $600 thousand and $0 as of September 30, 2017 and 2016, respectively.
Long-lived assets and intangible assets other than goodwill are evaluated for impairment whenever events or changes in circumstances indicate that the carrying value of an asset may not be recoverable based on expected undiscounted cash flows attributable to that asset. For the year ended September 30, 2017, it was determined that changes in circumstances were present, primarily the decline in the Company's market capitalization during the fiscal year. However, after performing analysis of undiscounted cash flows attributable to our long-lived assets along with other relevant factors, it was determined that there is no impairment of long-lived and intangible assets other than goodwill. Key assumptions utilized in the analysis of undiscounted cash flows for each asset or asset group being tested included 1) whether cash flows were attributable solely to the asset or group, or to an entire reporting unit; and 2) the useful lives of the asset or asset group. Forecasts used in the analysis were also consistent with those used in determining fair value of reporting units during goodwill impairment testing. For the year ended September 30, 2016, no events or changes in circumstances occurred that required this analysis.
Valuation allowance for net deferred tax assets
Deferred tax assets and liabilities are determined based on differences between the financial statement and tax bases of assets and liabilities using enacted tax rates in effect in the years in which the differences are expected to reverse. We do not provide for U.S. income taxes on the undistributed earnings of our foreign subsidiaries, which we consider to be permanently invested outside of the U.S.
We make judgments regarding the realizability of our deferred tax assets. The balance sheet carrying value of our net deferred tax assets is based on whether we believe that it is more likely than not that we will generate sufficient future taxable income to realize these deferred tax assets after consideration of all available evidence. We regularly review our deferred tax assets for recoverability considering historical profitability, projected future taxable income, the expected timing of the reversals of existing temporary differences and tax planning strategies. In assessing the need for a valuation allowance, we consider both positive and negative evidence related to the likelihood of realization of the deferred tax assets. The weight given to the positive and negative evidence is commensurate with the extent to which the evidence may be objectively verified. As such, it is generally difficult for positive evidence regarding projected future taxable income exclusive of reversing taxable temporary differences to outweigh objective
33
negative evidence of recent financial reporting losses. Generally, cumulative loss in recent years is a significant piece of negative evidence that is difficult to overcome in determining that a valuation allowance is not needed.
As of September 30, 2017 and 2016, valuation allowances have been established for all U.S. and for certain foreign deferred tax assets which we believe do not meet the “more likely than not” criteria for recognition. If we are subsequently able to utilize all or a portion of the deferred tax assets for which a valuation allowance has been established, then we may be required to recognize these deferred tax assets through the reduction of the valuation allowance which could result in a material benefit to our results of operations in the period in which the benefit is determined.
Accounting for stock-based compensation
The Company uses a lattice valuation model to account for all employee stock options granted. The lattice valuation model is a more flexible analysis to value options because of its ability to incorporate inputs that change over time, such as actual exercise behavior of option holders. The Company uses historical data to estimate the option exercise and employee departure behavior in the lattice valuation model. Expected volatility is based on historical volatility of the Company’s stock. The Company considers all employees to have similar exercise behavior and therefore has not identified separate homogenous groups for valuation. The expected term of options granted is derived from the output of the option pricing model and represents the period of time that options granted are expected to be outstanding. The risk-free rate for periods the options are expected to be outstanding is based on the U.S. Treasury yields in effect at the time of grant. Forfeitures are based on actual behavior patterns.
All transactions in which goods or services are the consideration received for the issuance of equity instruments are accounted for based on the fair value of the consideration received or the fair value of the equity instrument issued, whichever is more reliably measured.
RESULTS OF OPERATIONS
You should read the following discussion of our results of operations and financial condition in conjunction with our consolidated financial statements and related notes thereto included in Item 8 of this Annual Report on Form 10-K.
Revenue
Revenue from our business includes the sale of Mediasite recorders and server software products and related services contracts, such as customer support, installation, customization services, training, content hosting and event services. We market our products to educational institutions, corporations and government agencies that need to deploy, manage, index and distribute video content on Internet-based networks. We reach both our domestic and international markets through reseller networks, a direct sales effort and partnerships with system integrators.
Revenue in fiscal 2017 totaled $36.0 million, compared to $38.0 million in fiscal 2016, a decrease of 5%. Revenue consisted of the following:
• | Product and other revenue from the sale of Mediasite recorder units and server software decreased from $16.2 million in fiscal 2016 to $14.9 million in fiscal 2017. Revenue for 208 recorders billed in Q4-2015 and shipped in Q1-2017 to an international customer was recognized during Q1-2017, and the units are included in the units sold figures shown below. The average sales price per unit decreased in fiscal 2017 primarily due to an increase in demand for our low-cost, reduced function recorder. |
2017 | 2016 | ||
Units sold | 1,544 | 1,474 | |
Rack to mobile ratio | 9.1 to 1 | 5.9 to 1 | |
Average sales price, excluding support (000’s) | $7.1 | $7.9 | |
Refresh Units | 457 | 426 | |
• | Services revenue represents the portion of fees charged for Mediasite customer support contracts amortized over the length of the contract, typically 12 months, as well as training, installation, event and content hosting services. Services revenue decreased from $21.7 million in fiscal 2016 to $21.1 million in fiscal 2017 due primarily to a decrease in customer support |
34
contract revenues as compared to fiscal 2016. At September 30, 2017, $14.3 million of revenue was deferred, of which we expect to recognize $11.3 million in the next twelve months, including approximately $4.6 million in the quarter ending December 31, 2017. At September 30, 2016, $14.1 million of revenue was deferred.
• | Other revenue relates to freight charges billed separately to our customers. |
Gross Margin
Total gross margin in fiscal 2017 was $26.1 million or 73% compared to $28.0 million or 74% in fiscal 2016. The significant components of cost of revenue include:
• | Material and freight costs for Mediasite recorders. Costs for fiscal 2017 Mediasite recorder hardware and other costs totaled $3.5 million compared to $3.8 million in fiscal 2016. Freight costs were $259 thousand, and labor and allocated costs were $1.7 million in fiscal 2017 compared to $278 thousand and $1.6 million, respectively, in fiscal 2016. The remaining $644 thousand in fiscal 2017 and $750 thousand in fiscal 2016 relate to material and freight costs for Sonic Foundry International and MSKK. |
• | Services costs. Staff wages and other costs allocated to cost of service revenues were $1.9 million in fiscal 2017 and $2.0 million in fiscal 2016, respectively, resulting in gross margin on services of 82% in fiscal 2017 and 84% in fiscal 2016, respectively. The remaining $1.8 million in fiscal 2017 and $1.5 million in fiscal 2016 relate to costs of providing content hosting, events and technical support services at Sonic Foundry International and MSKK. |
The Company expects the gross margin percentage to remain consistent or slightly increase in fiscal 2018 mainly as a result of an expected increase in software revenue.
Operating Expenses
Selling and Marketing Expenses
Selling and marketing expenses include wages and commissions for sales, marketing and business development personnel, print advertising and various promotional expenses for our products. Timing of these costs may vary greatly depending on introduction of new products and services or entrance into new markets, or participation in major tradeshows.
Selling and marketing expense decreased $889 thousand, or 5%, from $17.8 million in fiscal 2016 to $16.9 million in fiscal 2017. Fluctuations in the major categories include:
• | Advertising and tradeshow expenses increased $160 thousand. |
• | Public relations expense increased by $123 thousand due to entering into a new contract. |
• | Salary, commissions and benefits expenses decreased by $302 thousand as a result of decreased headcount. |
• | Expenses related to business meetings and travel and entertainment decreased by $161 thousand, primarily due to expense management and venue changes for company meetings. |
• | Overall costs allocated to selling & marketing decreased by $683 thousand, primarily as a result of lower stock compensation and bonus expense. |
• | Selling and marketing expenses for Sonic Foundry International and MSKK accounted for $355 thousand and $2.7 million, respectively in fiscal 2017, an aggregate decrease of $33 thousand from the prior year. |
At September 30, 2017, we had 119 employees in selling and marketing, a decrease from 132 employees at September 30, 2016. Of the 119 employees in selling and marketing at September 30, 2017, 44 are employed by our foreign subsidiaries. We do not anticipate growth in selling and marketing headcount in fiscal 2018.
General and Administrative Expenses
General and administrative (“G&A”) expenses consist of personnel and related costs associated with the facilities, finance, legal, human resources and information technology departments, as well as other expenses not fully allocated to functional areas.
G&A expenses increased by $313 thousand, or 6%, to $5.9 million in fiscal 2017 from $5.6 million in fiscal 2016. Fluctuations in major categories include:
35
• | Increase in compensation and benefits of $34 thousand due to an increase in compensation rates and benefits. |
• | Increase in bad debt expense of $369 thousand due to increased allowance for doubtful accounts. |
• | Professional services increased by $123 thousand due to an increase in bank fees, investor relations and audit related expenses. |
• | Travel and entertainment decreased by $69 thousand due reduced travel and changes in policy. |
• | Decrease in costs allocable to G&A of $105 thousand, primarily as a result of lower stock compensation and bonus expense. |
• | G&A expenses for Sonic Foundry International and MSKK accounted for $152 thousand and $896 thousand, respectively in fiscal 2017, an aggregate increase of $9 thousand from the prior year. |
At September 30, 2017, we had 26 full-time employees in G&A, a decrease from 27 full-time employees at September 30, 2016. Of the 26 employees in G&A at September 30, 2017, 12 are employed by our foreign subsidiaries. We do not anticipate growth in G&A headcount in fiscal 2018.
Product Development Expenses
Product development expenses include salaries and wages of the software research and development staff and an allocation of benefits, facility and administrative expenses.
Product development expenses increased $401 thousand, or 6%, from $6.8 million in fiscal 2016 to $7.2 million in fiscal 2017. Fluctuations include:
• | Increase in compensation and benefits of $593 thousand due to a higher average headcount during the year, an increase in compensation rates, and the expansion of our international quality assurance team. |
• | Professional services decreased by $128 thousand due to decreased use of outsourced labor. |
• | Costs allocated from G&A decreased by $291 thousand. |
• | Product development expenses for Sonic Foundry International and MSKK accounted for $376 thousand and $266 thousand, respectively for fiscal 2017, an aggregate increase of $203 thousand from the prior year related to the subsidiaries. |
At September 30, 2017, we had 43 full-time employees in product development compared to 46 employees at September 30, 2016. Of the 43 employees in product development at September 30, 2017, 9 are employed by our foreign subsidiaries. There were no software development efforts in fiscal 2017 or 2016 that qualified for capitalization. We do not anticipate growth in product development headcount in fiscal 2018.
Impairment of Goodwill
The Company recognized an impairment loss of $600 thousand for goodwill related to the Mediasite KK reporting unit during the quarter ended September 30, 2017. This non-cash loss was primarily due to delays in expected growth related to partner relationships in Japan, resulting in revenues and operating cash flows being lower than expected for the reporting unit in FY17. As a consequence, management forecasts were revised and additional risk factors were applied. There were no impairment charges recorded during fiscal 2016.
Other Income and Expense, Net
Interest expense for fiscal 2017 decreased $99 thousand compared to fiscal 2016 due primarily to a lower balance of debt outstanding with Partners for Growth IV, L.P. (“PFG”) and other related costs. Included in interest expense for fiscal 2017 is $95 thousand of expense related to the discounts and related accretion on the PFG Loan and Warrant Debt. There was $88 thousand of expense related to the discounts and related accretion on the PFG Loan and Warrant Debt included in interest expense in fiscal 2016.
During the year ended September 30, 2017, a gain of $55 thousand was recorded related to the fair value remeasurement on the derivative liability associated with the PFG Loan and Warrant Debt. In the year ended September 30, 2016, a gain of $57 thousand was recorded related to the fair value remeasurement on the derivative liability associated with the PFG Loan and Warrant Debt.
In the year ended September 30, 2017, a foreign currency exchange loss of $6 thousand was realized related to re-measurement of the subordinated notes payable related to the Company’s foreign subsidiaries. In the year ended September 30, 2016, a foreign currency gain of $3 thousand was recorded related to the remeasurement.
36
Provisions Related to Income Taxes
The Company records a non-cash deferred tax liability related to tax amortization of goodwill acquired in 2001. The income tax benefit related to this amortization was $8 thousand in fiscal 2017 and the expense related to this amortization was $240 thousand in fiscal 2016.
Foreign Currency Translation Adjustment
The Company’s wholly-owned subsidiaries operate in Japan and the Netherlands, and utilize the Japanese Yen and Euro, respectively, as their functional currency. Assets and liabilities of the Company’s foreign operations are translated into US dollars at period end exchange rates whiles revenues and expenses are translated using average rates for the period. Gains and losses from the translation are deferred and included in accumulated other comprehensive loss on the consolidated statements of operations.
For the year ended September 30, 2017, the Company’s foreign currency translation adjustment was a loss of $412 thousand compared to a gain of $939 thousand in the year ended September 30, 2016. The loss in fiscal 2017 is attributable to the weakening in the Japanese Yen and the Euro compared to the US dollar during the period as compared to fiscal 2016.
LIQUIDITY AND CAPITAL RESOURCES
The Company’s primary sources of liquidity are its cash, revolving line of credit, and in fiscal 2017, cash from operating activities. During fiscal 2017, the Company generated $671 thousand of cash from operating activities compared with $1.7 million of cash generated from operating activities in fiscal 2016. The decrease in cash generated from operating activities was primarily due to an increase in the Company's net loss in fiscal 2017 as compared to fiscal 2016.
Capital expenditures for property and equipment were $839 thousand in fiscal 2017 compared to $339 thousand in fiscal 2016.
The Company used $474 thousand of cash from financing activities during fiscal 2017, mainly as a result of net payments on the line of credit and notes payable, reduced by proceeds from the sale of common and preferred stock of $1.3 million. The Company used proceeds of $1.6 million in fiscal 2016 due to net payments on the line of credit and notes payable.
At September 30, 2017, the Company had a $4.0 million revolving line of credit with Silicon Valley Bank. The line of credit bears interest at prime rate plus 2.00%. At September 30, 2017, outstanding borrowings were $1.6 million. The highest balance on the line of credit during the year was $3.5 million. At September 30, 2017, there was a remaining amount of $2.2 million available under the line of credit for advances. At September 30, 2016, outstanding borrowings were $1.6 million.
At September 30, 2017, the Company had $278 thousand of notes payable with Silicon Valley Bank and $491 thousand of notes payable, net of warrant debt discounts, with PFG. At September 30, 2016, the Company had $1.1 million outstanding related to notes payable with Silicon Valley Bank and $1.3 million of notes payable, net of warrant debt discounts, with PFG. The Company used cash for a net $1.7 million in payments on notes during fiscal 2017 compared to cash used for a net $1.2 million in payments on notes in the same period of fiscal 2016. These amounts include payments on subordinated notes payable as a result of the acquisitions completed in fiscal 2014. In connection with the Loan and Security Agreement and Warrant with PFG, amortization expense of $73 thousand related to the debt discount was incurred as a non-cash interest expense in fiscal 2017. In fiscal 2016, amortization expense of $71 thousand was recorded related to the debt discount with PFG.
At September 30, 2017 approximately $1.1 million of cash and cash equivalents was held by the Company’s foreign subsidiaries.
The Company is currently in discussions to grant modified payment terms to an international distributor with an outstanding receivables balance of $2.1 million, $1.5 million of which is deferred for revenue recognition purposes. The modification, once finalized, will likely extend due dates of invoices outstanding, which may delay related cash receipts. Invoices to be extended currently have due dates ranging from June 2017 to June 2018. See Note 1, Financing Receivables for additional details.
The Company believes its cash position plus available resources is adequate to accomplish its business plan through at least the next twelve months. We will likely evaluate operating and capital lease opportunities to finance equipment purchases in the future and anticipate utilizing the Company’s revolving line of credit to support working capital needs. We may also seek additional equity financing, or issue additional shares previously registered in our available shelf registration.
37
Contractual Obligations
The following summarizes our contractual obligations at September 30, 2017 and the effect those obligations are expected to have on our liquidity and cash flow in future periods (in thousands):
Contractual Obligations: | Total | Less than 1 Year | Years 2-3 | Years 4-5 | Over 5 years | ||||||||||||||
Product purchase commitments | $ | 535 | $ | 535 | $ | — | $ | — | $ | — | |||||||||
Operating lease obligations | 2,493 | 1,239 | 1,136 | 118 | — | ||||||||||||||
Capital lease obligations (a) | 533 | 279 | 240 | 14 | — | ||||||||||||||
Notes payable (a) | 841 | 841 | — | — | — | ||||||||||||||
(a) | Includes fixed and determinable interest payments |
ITEM 7A. QUANTITATIVE AND QUALITATIVE DISCLOSURES ABOUT MARKET RISK
Derivative Financial Instruments
Pursuant to Item 305 of Regulation S-K, the Company, as a smaller reporting company, is not required to provide the information required by this item.
Interest Rate Risk
Our cash equivalents, which consist of overnight money market funds, are subject to interest rate fluctuations, however, we believe this risk is minimal due to the short-term nature of these investments.
At September 30, 2017, $1.9 million of the Company’s $2.9 million in outstanding debt is variable rate. We do not expect that an increase in the level of interest rates would have a material impact on our Consolidated Financial Statements. We monitor our positions with, and the credit quality of, the financial institutions that are party to any of our financial transactions.
Foreign Currency Exchange Rate Risk
The functional currency of our foreign subsidiaries in the Netherlands is the Euro and in Japan is the Japanese Yen. They are subject to foreign currency exchange rate risk. Any increase or decrease in the exchange rate of the U.S. Dollar compared to the Euro or Japanese Yen will impact our future operating results and financial position.
ITEM 8. CONSOLIDATED FINANCIAL STATEMENTS AND SUPPLEMENTARY DATA
Report of Independent Registered Public Accounting Firm
To the Shareholders, Audit Committee and Board of Directors
Sonic Foundry, Inc. and Subsidiaries
Madison, WI
We have audited the accompanying consolidated balance sheets of Sonic Foundry, Inc. and Subsidiaries (the “Company”) as of September 30, 2017 and 2016, and the related consolidated statements of operations, comprehensive loss, stockholders’ equity, and cash flows for the years then ended. These consolidated financial statements are the responsibility of the company’s management. Our responsibility is to express an opinion on these consolidated financial statements based on our audits.
We conducted our audits in accordance with the standards of the Public Company Accounting Oversight Board (United States). Those standards require that we plan and perform the audit to obtain reasonable assurance about whether the consolidated financial statements are free of material misstatement. The company is not required to have, nor were we engaged to perform, an audit of its internal control over financial reporting. Our audits included consideration of its internal control over financial reporting as a basis for designing audit procedures that are appropriate in the circumstances, but not for the purpose of expressing an opinion on the effectiveness of the company’s internal control over financial reporting. Accordingly, we express no such opinion. An audit includes examining, on a test basis, evidence supporting the amounts and disclosures in the consolidated financial statements. An
38
audit also includes assessing the accounting principles used and significant estimates made by management as well as evaluating the overall consolidated financial statement presentation. We believe that our audits provide a reasonable basis for our opinion.
In our opinion, the consolidated financial statements referred to above present fairly, in all material respects, the financial position of Sonic Foundry, Inc. and Subsidiaries as of September 30, 2017 and 2016, and the results of their operations and cash flows for the years then ended, in conformity with U.S. generally accepted accounting principles.
/s/ Baker Tilly Virchow Krause, LLP
Madison, Wisconsin
January 12, 2018
39
Sonic Foundry, Inc.
Consolidated Balance Sheets
(in thousands, except for share and per share data)
September 30, | |||||||
2017 | 2016 | ||||||
Assets | |||||||
Current assets: | |||||||
Cash and cash equivalents | $ | 1,211 | $ | 1,794 | |||
Accounts receivable, net of allowances of $375 and $225 | 7,903 | 9,769 | |||||
Financing receivables, current, net of allowances of $200 and $0 | 925 | 726 | |||||
Inventories | 986 | 1,904 | |||||
Investment in sales-type lease, current | 148 | — | |||||
Prepaid expenses and other current assets | 1,085 | 1,404 | |||||
Total current assets | 12,258 | 15,597 | |||||
Property and equipment: | |||||||
Leasehold improvements | 1,041 | 879 | |||||
Computer equipment | 6,101 | 5,837 | |||||
Furniture and fixtures | 789 | 825 | |||||
Total property and equipment | 7,931 | 7,541 | |||||
Less accumulated depreciation and amortization | 6,181 | 5,510 | |||||
Property and equipment, net | 1,750 | 2,031 | |||||
Other assets: | |||||||
Goodwill | 10,455 | 11,310 | |||||
Customer relationships, net of amortization of $990 and $723 | 1,505 | 1,882 | |||||
Product rights, net of amortization of $411 and $287 | 261 | 385 | |||||
Financing receivables, long-term | 1,310 | 1,151 | |||||
Investment in sales-type lease, long-term | 407 | — | |||||
Other long-term assets | 410 | 726 | |||||
Total assets | $ | 28,356 | $ | 33,082 | |||
Liabilities and stockholders’ equity | |||||||
Current liabilities: | |||||||
Revolving line of credit | $ | 2,065 | $ | 1,772 | |||
Accounts payable | 1,314 | 961 | |||||
Accrued liabilities | 1,387 | 1,883 | |||||
Unearned revenue | 11,332 | 12,834 | |||||
Current portion of capital lease and financing arrangements | 256 | 283 | |||||
Current portion of notes payable, net of discounts | 737 | 1,491 | |||||
Current portion of subordinated note payable | — | 93 | |||||
Total current liabilities | 17,091 | 19,317 | |||||
Long-term portion of unearned revenue | 2,970 | 1,257 | |||||
Long-term portion of capital lease and financing arrangements | 244 | 231 | |||||
Long-term portion of notes payable and warrant debt, net of discounts | 123 | 871 | |||||
Derivative liability, at fair value | 12 | 67 | |||||
Other liabilities | 372 | 259 | |||||
Deferred tax liability | 4,426 | 4,564 | |||||
Total liabilities | 25,238 | 26,566 | |||||
Commitments and contingencies | |||||||
Stockholders’ equity: | |||||||
Preferred stock, $.01 par value, authorized 500,000 shares; none issued | — | — | |||||
9% Preferred stock, Series A, voting, cumulative, convertible, $.01 par value (liquidation preference of $1,000 per share), authorized 2,500 shares; 1,510 shares issued and outstanding, at amounts paid in | 1,280 | — | |||||
40
Sonic Foundry, Inc.
Consolidated Balance Sheets
(in thousands, except for share and per share data)
5% Preferred stock, Series B, voting, cumulative, convertible, $.01 par value (liquidation preference at par), authorized 1,000,000 shares, none issued | — | — | |||||
Common stock, $.01 par value, authorized 10,000,000 shares; 4,470,791 and 4,424,275 shares issued and 4,458,075 and 4,411,559 shares outstanding | 45 | 44 | |||||
Additional paid-in capital | 197,836 | 197,064 | |||||
Accumulated deficit | (195,253 | ) | (190,214 | ) | |||
Accumulated other comprehensive loss | (595 | ) | (183 | ) | |||
Receivable for common stock issued | (26 | ) | (26 | ) | |||
Treasury stock, at cost, 12,716 shares | (169 | ) | (169 | ) | |||
Total stockholders’ equity | 3,118 | 6,516 | |||||
Total liabilities and stockholders’ equity | $ | 28,356 | $ | 33,082 | |||
See accompanying notes to the consolidated financial statements.
41
Sonic Foundry, Inc.
Consolidated Statements of Operations
(in thousands, except for share and per share data)
Years Ended September 30, | |||||||
2017 | 2016 | ||||||
Revenue: | |||||||
Product and other | $ | 14,883 | $ | 16,241 | |||
Services | 21,117 | 21,734 | |||||
Total revenue | 36,000 | 37,975 | |||||
Cost of revenue: | |||||||
Product and other | 6,097 | 6,459 | |||||
Services | 3,770 | 3,526 | |||||
Total cost of revenue | 9,867 | 9,985 | |||||
Gross margin | 26,133 | 27,990 | |||||
Operating expenses: | |||||||
Selling and marketing | 16,912 | 17,801 | |||||
General and administrative | 5,941 | 5,628 | |||||
Product development | 7,238 | 6,837 | |||||
Impairment of goodwill | 600 | — | |||||
Total operating expenses | 30,691 | 30,266 | |||||
Loss from operations | (4,558 | ) | (2,276 | ) | |||
Non-operating income (expenses): | |||||||
Interest expense, net | (495 | ) | (594 | ) | |||
Other expense | (65 | ) | (178 | ) | |||
Total non-operating expenses | (560 | ) | (772 | ) | |||
Loss before income taxes | (5,118 | ) | (3,048 | ) | |||
Provision for income taxes | 79 | (269 | ) | ||||
Net loss | $ | (5,039 | ) | $ | (3,317 | ) | |
Dividends on preferred stock | (169 | ) | — | ||||
Net loss attributable to common stockholders | $ | (5,208 | ) | $ | (3,317 | ) | |
Loss per common share: | |||||||
Basic net loss per common share | $ | (1.17 | ) | $ | (0.76 | ) | |
Diluted net loss per common share | $ | (1.17 | ) | $ | (0.76 | ) | |
Weighted average common shares – Basic | 4,436,333 | 4,389,421 | |||||
– Diluted | 4,436,333 | 4,389,421 | |||||
See accompanying notes to the consolidated financial statements.
42
Years Ended September 30, | |||||||
2017 | 2016 | ||||||
Net loss | $ | (5,039 | ) | $ | (3,317 | ) | |
Foreign currency translation adjustment | (412 | ) | 939 | ||||
Comprehensive loss | $ | (5,451 | ) | $ | (2,378 | ) | |
See accompanying notes to the consolidated financial statements.
43
Common stock | Preferred stock | Additional paid-in capital | Accumulated deficit | Accumulated other comprehensive loss | Receivable for common stock issued | Treasury stock | Total | ||||||||||||||||||||||||
Balance, September 30, 2015 | $ | 44 | $ | — | $ | 195,973 | $ | (186,897 | ) | $ | (1,122 | ) | $ | (26 | ) | $ | (169 | ) | $ | 7,803 | |||||||||||
Stock compensation | — | — | 847 | — | — | — | — | 847 | |||||||||||||||||||||||
Issuance of common stock | — | — | 244 | — | — | — | — | 244 | |||||||||||||||||||||||
Foreign currency translation adjustment | — | — | — | — | 939 | — | — | 939 | |||||||||||||||||||||||
Net loss | — | — | — | (3,317 | ) | — | — | — | (3,317 | ) | |||||||||||||||||||||
Balance, September 30, 2016 | $ | 44 | $ | — | $ | 197,064 | $ | (190,214 | ) | $ | (183 | ) | $ | (26 | ) | $ | (169 | ) | $ | 6,516 | |||||||||||
Stock compensation | — | — | 754 | — | — | — | — | 754 | |||||||||||||||||||||||
Issuance of common stock | 1 | — | 48 | — | — | — | — | 49 | |||||||||||||||||||||||
Issuance of preferred stock | — | 1,250 | — | — | — | — | — | 1,250 | |||||||||||||||||||||||
Preferred stock dividends | 30 | (30 | ) | — | — | — | — | — | |||||||||||||||||||||||
Foreign currency translation adjustment | — | — | — | — | (412 | ) | — | — | (412 | ) | |||||||||||||||||||||
Net loss | — | — | — | (5,039 | ) | — | — | — | (5,039 | ) | |||||||||||||||||||||
Balance, September 30, 2017 | $ | 45 | $ | 1,280 | $ | 197,836 | $ | (195,253 | ) | $ | (595 | ) | $ | (26 | ) | $ | (169 | ) | $ | 3,118 | |||||||||||
See accompanying notes to the consolidated financial statements.
44
Years Ended September 30, | |||||||
2017 | 2016 | ||||||
Operating activities | |||||||
Net loss | $ | (5,039 | ) | $ | (3,317 | ) | |
Adjustments to reconcile net loss to net cash provided by operating activities: | |||||||
Amortization of other intangibles | 555 | 652 | |||||
Depreciation and amortization of property and equipment | 1,422 | 1,553 | |||||
Impairment of goodwill | 600 | — | |||||
Loss on sale of fixed assets | 8 | 72 | |||||
Provision for doubtful accounts - including financing receivables | 349 | 75 | |||||
Deferred taxes | (103 | ) | 341 | ||||
Stock-based compensation expense related to stock options and warrants | 622 | 861 | |||||
Remeasurement gain on subordinated debt | (6 | ) | (3 | ) | |||
Remeasurement gain on derivative liability | (55 | ) | (58 | ) | |||
Changes in operating assets and liabilities: | |||||||
Accounts receivable | 1,613 | 2,887 | |||||
Financing receivables | (558 | ) | (1,546 | ) | |||
Inventories | 904 | 514 | |||||
Prepaid expenses and other current assets | 89 | (532 | ) | ||||
Accounts payable and accrued liabilities | (109 | ) | (966 | ) | |||
Other long-term liabilities | 129 | (60 | ) | ||||
Unearned revenue | 250 | 1,243 | |||||
Net cash provided by operating activities | 671 | 1,716 | |||||
Investing activities | |||||||
Purchases of property and equipment | (839 | ) | (339 | ) | |||
Net cash used in investing activities | (839 | ) | (339 | ) | |||
Financing activities | |||||||
Proceeds from notes payable | — | 500 | |||||
Proceeds from line of credit | 23,257 | 17,845 | |||||
Payments on notes payable | (1,727 | ) | (1,693 | ) | |||
Payments on line of credit | (22,928 | ) | (17,958 | ) | |||
Payment of debt issuance costs | (26 | ) | (36 | ) | |||
Proceeds from issuance of preferred stock, common stock and warrants | 1,298 | 66 | |||||
Payments on capital lease and financing arrangements | (348 | ) | (278 | ) | |||
Net cash used in financing activities | (474 | ) | (1,554 | ) | |||
Changes in cash and cash equivalents due to changes in foreign currency | 59 | (5 | ) | ||||
Net decrease in cash and cash equivalents | (583 | ) | (182 | ) | |||
Cash and cash equivalents at beginning of year | 1,794 | 1,976 | |||||
Cash and cash equivalents at end of year | $ | 1,211 | $ | 1,794 | |||
Supplemental cash flow information: | |||||||
Interest paid | $ | 505 | $ | 529 | |||
Income taxes paid, foreign | 111 | 27 | |||||
Non-cash financing and investing activities: | |||||||
Property and equipment financed by capital lease or accounts payable | 341 | 402 | |||||
Debt discount | — | 16 | |||||
Stock issued for board of director's fees | 133 | 164 | |||||
45
Deemed dividend for beneficial conversion feature of preferred stock | 139 | — | |||||
Preferred stock dividend paid in additional shares | 30 | — | |||||
Warrants issued for investor relations services | — | 14 | |||||
See accompanying notes to the consolidated financial statements.
46
1. Basis of Presentation and Significant Accounting Policies
Business
Sonic Foundry, Inc. (the Company) is in the business of providing enterprise solutions and services for the web communications market.
Principles of Consolidation
The accompanying consolidated financial statements include the accounts of the Company and its wholly-owned subsidiaries, Sonic Foundry Media Systems, Inc., Sonic Foundry International B.V. (formerly Media Mission B.V.) and Mediasite K.K. All significant intercompany transactions and balances have been eliminated. The name change for the subsidiary formerly known as Media Mission B.V. occurred in October 2016.
Prior to January 2014, the Company owned approximately 26% of Mediasite KK and accounted for its investment under the equity method of accounting. On January 14, 2014, the Company purchased the remaining 74% of Mediasite KK.
Reclassifications
Reclassifications have been made to the September 30, 2016 financial statements to conform to the September 30, 2017 presentation. These reclassifications had no effect on the Company’s net loss or stockholders’ equity as previously reported. See Financing Receivables below for additional details.
Use of Estimates
In preparing financial statements in conformity with accounting principles generally accepted in the United States of America (US GAAP), management is required to make estimates and assumptions that affect the reported amounts of assets and liabilities, the disclosure of contingent assets and liabilities at the date of the consolidated financial statements and the reported amounts of revenue and expense during the period. Actual results could differ from those estimates.
Revenue Recognition
General
Revenue is recognized when persuasive evidence of an arrangement exists, delivery occurs or services are rendered, the sales price is fixed or determinable and collectability is reasonably assured. Revenue is deferred when undelivered products or services are essential to the functionality of delivered products, customer acceptance is uncertain, significant obligations remain, or the fair value of undelivered elements is unknown. Typically, the Company does not offer customers the right to return product, other than for exchange or repair pursuant to a warranty or stock rotation. The Company’s policy is to reduce revenue if it incurs an obligation for price rebates or other such programs during the period the obligation is reasonably estimated to occur. The following policies apply to the Company’s major categories of revenue transactions.
Products
Products are considered delivered, and revenue is recognized, when title and risk of loss have been transferred to the customer or upon customer acceptance if non-delivered products or services are essential to the functionality of delivered products. Under the terms and conditions of the sale, this occurs at the time of shipment to the customer. Product revenue currently represents sales of our Mediasite recorder and Mediasite related products such as our server software and other software licenses. If a license is time-based, the revenue is recognized over the term of the license agreement.
Services
The Company sells support and content hosting contracts to our customers, typically one year in length, and records the related revenue ratably over the contractual period. Our support contracts cover phone and electronic technical support availability over and above the level provided by our distributors, software upgrades on a when and if available basis, advance hardware replacement and an extension of the standard hardware warranty from 90 days to one year. The manufacturers the Company contracts with to build the units provide a limited one-year warranty on the hardware. The Company also sells installation, training, event webcasting,
47
and customer content hosting services. Revenue for those services is recognized when performed in the case of installation, training and event webcasting services. Occasionally, the Company will sell customization services to enhance the server software. Revenue from those services is recognized when performed, if perfunctory, or under contract accounting. Service amounts invoiced to customers in excess of revenue recognized are recorded as deferred revenue until the revenue recognition criteria are met.
Revenue Arrangements that Include Multiple Elements
Sales of software, with or without installation, training, and post customer support fall within the scope of the software revenue recognition rules. Under the software revenue recognition rules, the fee from a multiple-deliverable arrangement is allocated to each of the undelivered elements based upon vendor-specific objective evidence (VSOE), which is limited to the price charged when the same deliverable is sold separately, with the residual value from the arrangement allocated to the delivered element. The portion of the fee that is allocated to each deliverable is then recognized as revenue when the criteria for revenue recognition are met with respect to that deliverable. If VSOE does not exist for all of the undelivered elements, then all revenue from the arrangement is typically deferred until all elements have been delivered to the customer.
In the case of the Company’s hardware products with embedded software, the Company has determined that the hardware and software components function together to deliver the product’s essential functionality, and therefore, the revenue from the sale of these products is accounted for under the revenue recognition rules for tangible products whereby the fee from a multiple-deliverable arrangement is allocated to each of the deliverables based upon their relative selling prices as determined by a selling-price hierarchy. A deliverable in an arrangement qualifies as a separate unit of accounting if the delivered item has value to the customer on a stand-alone basis. A delivered item that does not qualify as a separate unit of accounting is combined with the other undelivered items in the arrangement and revenue is recognized for those combined deliverables as a single unit of accounting. The selling price used for each deliverable is based upon VSOE if available, from third-party evidence (TPE) if VSOE is not available, and best estimate of selling price (ESP) if neither VSOE nor TPE are available. TPE is the price of the Company’s or any competitor’s largely interchangeable products or services in stand-alone sales to similarly situated customers. ESP is the price at which the Company would sell the deliverable if it were sold regularly on a stand-alone basis, considering market conditions and entity-specific factors. All revenue arrangements, excluding the sale of all software-only products and associated services, have been accounted for under this guidance.
The selling prices used in the relative selling price allocation method are as follows: (1)the Company’s products and services are based upon VSOE and (2) hardware products with embedded software, for which VSOE does not exist, are based upon ESP. The Company does not believe TPE exists for any of these products and services because they are differentiated from competing products and services in terms of functionality and performance and there are no competing products or services that are largely interchangeable. Management establishes ESP for hardware products with embedded software using a cost plus margin approach with consideration for market conditions, such as the impact of competition and geographic considerations, and entity-specific factors, such as the cost of the product and the Company’s profit objectives. Management believes that ESP is reflective of reasonable pricing of that deliverable as if priced on a stand-alone basis. When a sales transaction includes deliverables that are divided between Accounting Standards Codification (ASC) Topic 605 and ASC Subtopic 985-605, the Company allocates the selling price using the relative selling price method whereas value is allocated using an ESP for software developed using a percent of list price approach. The other deliverables are valued using ESP or VSOE as previously discussed.
While the pricing model, currently in use, captures all critical variables, unforeseen changes due to external market forces may result in a revision of the inputs. These modifications may result in the consideration allocation differing from the one presently in use. Absent a significant change in the pricing inputs or the way in which the industry structures its transactions, future changes in the pricing model are not expected to materially affect our allocation of arrangement consideration.
Management has established VSOE for hosting services. Billings for hosting are spread ratably over the term of the hosting agreement, with the typical hosting agreement having a term of 1 year, with renewal on an annual basis. The Company sells most hosting contracts without the inclusion of products. When the hosting arrangement is sold in conjunction with product, the product revenue is recognized immediately while the remaining hosting revenue is spread ratably over the term of the hosting agreement. The selling price is allocated between these elements using the relative selling price method. The Company uses ESP for development of the selling price for hardware products with embedded software.
The Company also offers hosting services bundled with events services. The Company uses VSOE to establish relative selling prices for its events services. The Company recognizes events revenue when the event takes place and recognizes the hosting
48
revenue over the term of the hosting agreement. The total amount of the arrangement is allocated to each element based on the relative selling price method.
Reserves
The Company reserves for stock rotations, price adjustments, rebates, and sales incentives to reduce revenue and accounts receivable for these and other credits granted to customers. Such reserves are recorded at the time of sale and are calculated based on historical information (such as rates of product stock rotations) and the specific terms of sales programs, taking into account any other known information about likely customer behavior. If actual customer behavior differs from our expectations, it may compromise our ability to recognize revenue to these distributors at the time of shipment. Also, if the Company determines that it can no longer accurately estimate amounts for stock rotations and sales incentives, the Company would not be able to recognize revenue until resellers sell the inventory to the final end user.
Shipping and Handling
The Company’s shipping and handling costs billed to customers are included in other revenue. Costs related to shipping and handling are included in cost of revenue and are recorded at the time of shipment to the customer.
Concentration of Credit Risk and Other Risks and Uncertainties
As of September 30, 2017, of the $1.2 million in cash and cash equivalents, $103 thousand is deposited with 2 major U.S. financial institutions. At times, deposits in these institutions exceed the amount of insurance provided on such deposits. The Company has not experienced any losses on such amounts and believes that it is not exposed to any significant credit risk on these balances. The remaining $1.1 million of cash and cash equivalents is held by our foreign subsidiaries in financial institutions in Japan and the Netherlands and held in their local currency. The cash held in foreign financial institutions is not guaranteed.
We assess the realization of our receivables by performing ongoing credit evaluations of our customers’ financial condition. Through these evaluations, we may become aware of a situation where a customer may not be able to meet its financial obligations due to deterioration of its financial viability, credit ratings or bankruptcy. Our reserve requirements are based on the best facts available to us and are reevaluated and adjusted as additional information is received. Our reserves are also based on amounts determined by using percentages applied to certain aged receivable categories. These percentages are determined by a variety of factors including, but not limited to, current economic trends, historical payment and bad debt write-off experience. Allowance for doubtful accounts for accounts receivable and financing receivables was $575,000 at September 30, 2017 and $225,000 at September 30, 2016.
We had billings for Mediasite product and support services as a percentage of total billings to one distributor of approximately 11% in 2017 and 14% in 2016 and to a second distributor of approximately 15% in 2017 and 13% in 2016. At September 30, 2017 and 2016, these two distributors represented 23% and 28% of total accounts receivable, respectively.
Currently all of our product inventory purchases are from one third-party contract manufacturer. Although we believe there are multiple sources of supply from other contract manufacturers as well as multiple suppliers of component parts required by the contract manufacturers, a disruption of supply of component parts or completed products, even if short term, would have a material negative impact on our revenues. At September 30, 2017 and 2016, this supplier represented 27% and 40%, respectively, of total accounts payable. We also license technology from third parties that is embedded in our software. We believe there are alternative sources of similar licensed technology from other third parties that we could also embed in our software, although it could create potential programming related issues that might require engineering resources.
Cash and Cash Equivalents
The Company considers all highly liquid investments purchased with an original maturity of three months or less to be cash equivalents. As of September 30, 2017, of the $1.2 million aggregate cash and cash equivalents held by the Company, the amount of cash and cash equivalents held by our foreign subsidiaries was $1.1 million. If the funds held by our foreign subsidiaries were needed for our operations in the United States, the repatriation of some of these funds to the United States could require payment of additional U.S. taxes.
Trade Accounts Receivable
49
The majority of the Company’s accounts receivable are due from entities in, or distributors or value added resellers to, the education, corporate and government sectors. Credit is extended based on evaluation of a customer’s financial condition and, generally, collateral is not required. Accounts receivable are typically due within 30 days and are stated at amounts due from customers net of an allowance for doubtful accounts. Accounts outstanding longer than the contractual payment terms are considered to be past due. The Company determines its allowance by considering a number of factors, including the length of time trade accounts receivable are past due, the Company’s previous loss history, the customer’s current ability to pay its obligation to the Company, and the condition of the general economy and the industry as a whole. The Company writes-off accounts receivable when they become uncollectible, and payments subsequently received on such receivables are credited to the allowance for doubtful accounts. Interest is not accrued on past due receivables.
Financing Receivables
Financing receivables consist of customer receivables resulting from the sale of the Company's products and services, primarily software and long-term customer support contracts, and are presented net of allowance for losses. The Company has a single portfolio consisting of fixed-term receivables, which is further segregated into two classes based on products, customer type, and credit risk evaluation.
The Company generally determines its allowance for losses on financing receivables at the customer class level by considering a number of factors, including the length of time financing receivable are past due, historical and anticipated experience, the customer’s current ability to pay its obligation, and the condition of the general economy and the industry as a whole. The Company writes-off financing receivables when they become uncollectible, and payments subsequently received on such receivables are credited to the allowance for financing receivable losses. Interest is not accrued on past due receivables. There was an allowance of $200 thousand and $0 at September 30, 2017 and 2016, respectively.
The Company's financing receivables are aggregated into the following categories:
Long-term customer support contracts: These contracts are typically entered into in conjunction with sale-type lease arrangements, over the life of which the Company agrees to provide support services similar to those offered within Mediasite Customer Care plans. Contract terms range from 3-5 years, and payments are generally due from the customer annually on the contract anniversary. There was $384 thousand and $0 of receivables outstanding for long-term customer support contracts as of September 30, 2017 and 2016, respectively. All amounts due were current as of the balance sheet date and there are no credit losses expected to be incurred related to long-term support contracts.
Product receivables: Amounts due primarily represent sales of perpetual software licenses to a single international distributor on invoices outstanding for product delivered from March 2016 through June 2017. In prior years receivables related to this customer were classified as trade accounts receivable, however these were reclassified to financing receivables as of September 30, 2017 (and also within the September 30, 2016 consolidated balance sheets and statements of cash flows for comparability) as the Company is currently in the process of considering revised payment terms, potentially extending through December 2018. There was $2.1 million receivable as of September 30, 2017, $1.5 million of which has been deferred for revenue recognition purposes due to a history of delayed payment. As of September 30, 2016, $1.9 million was receivable from this customer, of which $625 thousand was deferred. The Company delivered $901 thousand of product to this customer and received payment of $726 thousand in FY2017. As a result of the circumstances described, the entire allowance for losses on financing receivables of $200 thousand is considered attributable to this class of customer as of September 30, 2017.
As of September 30, 2017 financing receivables consisted of the following (in thousands):
September 30, 2017 | September 30, 2016 | ||||||
Customer support contracts, current and long-term, gross | $ | 384 | $ | — | |||
Product receivables, gross | $ | 2,051 | $ | 1,877 | |||
Allowance for losses on financing receivables | $ | (200 | ) | $ | — | ||
$ | 2,235 | $ | 1,877 | ||||
50
Investment in Sales-Type Lease
The Company has entered into sales-type lease arrangements with certain customers, consisting of recorders leased with terms ranging from 3-5 years. All amounts due are current as of the balance sheet date.
As of September 30, 2017 investment in sales-type leases consisted of the following (in thousands):
September 30, 2017 | September 30, 2016 | ||||||
Investment in sales-type lease | $ | 555 | $ | — | |||
$ | 555 | $ | — | ||||
Inventory Valuation
Inventory consists of raw materials and supplies used in the assembly of Mediasite recorders and finished units. Inventory of completed units and spare parts are carried at the lower of cost or market, with cost determined on a first-in, first-out basis.
Inventory consists of the following (in thousands):
September 30, | |||||||
2017 | 2016 | ||||||
Raw materials and supplies | $ | 156 | $ | 149 | |||
Finished goods | 830 | 1,755 | |||||
$ | 986 | $ | 1,904 | ||||
Capitalized Software Development Costs
Software development costs incurred in conjunction with product development are charged to research and development expense until technological feasibility is established. Thereafter, until the product is released for sale, software development costs are capitalized and reported at the net realizable value of the related product. Typically the period between achieving technological feasibility of the Company’s products and the general availability of the products has been short. Consequently, software development costs qualifying for capitalization are typically immaterial and are generally expensed to research and development costs. During 2013, the Company’s My Mediasite product release required software capitalization since there was a longer period between technological feasibility and the general availability of the product. Upon product release, the amortization of software development costs is determined annually as the greater of the amount computed using the ratio of current gross revenues for the products to their total of current and anticipated future gross revenues or the straight-line method over the estimated economic life of the products, expected to be three years. Amortization expense of software development costs of $0 thousand and $104 thousand is included in Cost of Revenue – Product for each of the years ending September 30, 2017 and 2016, respectively. The gross amount of capitalized external and internal development costs was $533 thousand at September 30, 2017 and 2016. There were no software development efforts that qualified for capitalization for the years ended September 30, 2017 or 2016, respectively.
Property and Equipment
Property and equipment are recorded at cost and are depreciated using the straight-line method for financial reporting purposes. The estimated useful lives used to calculate depreciation are as follows:
Years | |
Leasehold improvements | 5 to 10 years |
Computer equipment | 3 to 5 years |
Furniture and fixtures | 5 to 7 years |
Impairment of Long-Lived Assets
Goodwill has an indefinite useful life and is recorded at cost and not amortized but, instead, tested at least annually for impairment. We assess the impairment of goodwill on an annual basis or whenever events or changes in circumstances indicate that the fair value of these assets is less than the carrying value. If a qualitative assessment is used and the Company determines that the fair
51
value of goodwill is more likely than not (i.e., a likelihood of more than 50%) less than its carrying amount, a quantitative impairment test will be performed. If goodwill is quantitatively assessed for impairment, the Company compares the estimated fair value of the reporting unit to which goodwill is allocated to its carrying value. The amount of impairment, if any, is equal to the amount by which the carrying value of the reporting unit exceeds its fair value.
For purposes of the fiscal 2017 and 2016 tests, goodwill balances are evaluated within three separate reporting units. In fiscal 2016, we performed a two-step goodwill test and determined that the fair value of goodwill was more than the carrying value. In fiscal 2017, we performed a quantitative analysis and determined that the fair value of one of the Company's reporting units is less than its carrying value, and that the fair value of the remaining reporting units is greater than their respective carrying values. The Company recognized impairment charges of $600 thousand and $0 as of September 30, 2017 and 2016, respectively.
Long-lived assets and intangible assets other than goodwill are evaluated for impairment whenever events or changes in circumstances indicate that the carrying value of an asset may not be recoverable based on expected undiscounted cash flows attributable to that asset. For the year ended September 30, 2017, it was determined that changes in circumstances were present, primarily the decline in the Company's market capitalization during the fiscal year. However, after performing analysis of undiscounted cash flows attributable to our long-lived assets along with other relevant factors, it was determined that there is no impairment of long-lived and intangible assets other than goodwill. Key assumptions utilized in the analysis of discounted cash flows for each asset or asset group being tested included 1) whether cash flows were attributable solely to the asset or group, or to an entire reporting unit; and 2) the useful lives of the asset or asset group. Forecasts used in the discounted cash flow analysis were also consistent with those used in determining fair value of reporting units during goodwill impairment testing. For the year ended September 30, 2016, no events or changes in circumstances occurred that required this analysis. For the year ended September 30, 2016, no events or changes in circumstances occurred that required this analysis.
Comprehensive Loss
Comprehensive loss includes disclosure of financial information that historically has not been recognized in the calculation of net income. Our comprehensive loss encompasses net loss and foreign currency translation adjustments. Assets and liabilities of international operations that have a functional currency that is not in U.S. dollars are translated into U.S. dollars at year-end exchange rates, and revenue and expense items are translated using weighted average exchange rates. Any adjustments arising on translation are included in shareholders’ equity as an element of accumulated other comprehensive loss.
Advertising Expense
Advertising costs included in selling and marketing, are expensed when the advertising first takes place. Advertising expense was $479 thousand and $403 thousand for years ended September 30, 2017 and 2016, respectively.
Research and Development Costs
Research and development costs are expensed in the period incurred, unless they meet the criteria for capitalized software development costs.
Income Taxes
Deferred tax assets and liabilities are determined based on differences between the financial statement and tax bases of assets and liabilities using enacted tax rates in effect in the years in which the differences are expected to reverse. We do not provide for U.S. income taxes on the undistributed earnings of our foreign subsidiaries, which we consider to be permanently invested outside of the U.S.
We make judgments regarding the realizability of our deferred tax assets. The balance sheet carrying value of our net deferred tax assets is based on whether we believe that it is more likely than not that we will generate sufficient future taxable income to realize these deferred tax assets after consideration of all available evidence. We regularly review our deferred tax assets for recoverability considering historical profitability, projected future taxable income, the expected timing of the reversals of existing temporary differences and tax planning strategies. In assessing the need for a valuation allowance, we consider both positive and negative evidence related to the likelihood of realization of the deferred tax assets. The weight given to the positive and negative evidence is commensurate with the extent to which the evidence may be objectively verified. As such, it is generally difficult for positive evidence regarding projected future taxable income exclusive of reversing taxable temporary differences to outweigh objective
52
negative evidence of recent financial reporting losses. Generally, cumulative loss in recent years is a significant piece of negative evidence that is difficult to overcome in determining that a valuation allowance is not needed.
As of September 30, 2017 and 2016, valuation allowances have been established for all U.S. and for certain foreign deferred tax assets which we believe do not meet the “more likely than not” criteria for recognition.
The Company also accounts for the uncertainty in income taxes related to the recognition and measurement of a tax position and measurement of a tax position taken or expected to be taken in an income tax return. The Company follows the applicable accounting guidance on derecognition, classification, interest and penalties, accounting in interim periods and disclosure related to the uncertainty in income tax positions.
Fair Value of Financial Instruments
Nonfinancial Assets Measured at Fair Value on a Nonrecurring Basis
The Company’s goodwill, intangible assets and other long-lived assets are nonfinancial assets that were acquired either as part of a business combination, individually or with a group of other assets. These nonfinancial assets were initially measured and recognized at amounts equal to the fair value determined as of the date of acquisition. Fair value measurements of reporting units are estimated using an income approach involving discounted or undiscounted cash flow models and the public company guideline method that contain certain Level 3 inputs requiring management judgment, including projections of economic conditions and customer demand, revenue and margins, changes in competition, operating costs, working capital requirements, and new product introductions. Fair value measurements of the reporting units associated with the Company’s goodwill balances are estimated at least annually at the beginning of the fourth quarter of each fiscal year for purposes of impairment testing. Fair value measurements associated with the Company’s intangible assets and other long-lived assets are estimated when events or changes in circumstances such as market value, asset utilization, physical change, legal factors, or other matters indicate that the carrying value may not be recoverable.
In determining the fair value of financial assets and liabilities, the Company currently utilizes market data or other assumptions that it believes market participants would use in pricing the asset or liability in the principal or most advantageous market, and adjusts for non-performance and/or other risk associated with the Company as well as counterparties, as appropriate. When considering market participant assumptions in fair value measurements, the following fair value hierarchy distinguishes between observable and unobservable inputs, which are categorized in one of the following levels:
Level 1 Inputs: Unadjusted quoted prices which are available in active markets for identical assets or liabilities accessible to the Company at the measurement date.
Level 2 Inputs: Inputs other than quoted prices included in Level 1 inputs that are observable for the asset or liability, either directly or indirectly, for substantially the full term of the asset or liability.
Level 3 Inputs: Unobservable inputs for the asset or liability used to measure fair value to the extent that observable inputs are not available, thereby allowing for situations in which there is little, if any, market activity for the asset or liability at measurement date.
The hierarchy gives the highest priority to Level 1, as this level provides the most reliable measure of fair value, while giving the lowest priority to Level 3.
Financial Liabilities Measured at Fair Value on a Recurring Basis
The initial fair values of PFG debt and warrant debt (see Note 3) were based on the present value of expected future cash flows and assumptions about current interest rates and the creditworthiness of the Company (Level 3). The fair value of the bifurcated conversion feature represented by the warrant derivative liability, which is measured at fair value on a recurring basis is based on a Black Scholes option pricing model with assumptions for stock price, exercise price, volatility, expected term, risk free interest rate and dividend yield similar to those described for share-based compensation which were generally observable (Level 2).
Financial liabilities measured at fair value on a recurring basis are summarized below (in thousands):
53
September 30, 2017 | Level 1 | Level 2 | Level 3 | Total Fair Value | |||||||||||
Derivative liability | $ | — | $ | 12 | $ | — | $ | 12 | |||||||
September 30, 2016 | Level 1 | Level 2 | Level 3 | Total Fair Value | |||||||||||
PFG debt, net of discount | $ | — | $ | — | $ | 1,225 | $ | 1,225 | |||||||
Warrant debt | — | — | 102 | 102 | |||||||||||
Derivative liability | — | 67 | — | 67 | |||||||||||
$ | — | $ | 67 | $ | 1,327 | $ | 1,394 | ||||||||
Included below is a summary of the changes in our Level 3 fair value measurements (in thousands):
PFG Debt, net of discount | Warrant Debt | ||||||
Balance as of September 30, 2016 | $ | 1,225 | $ | 102 | |||
Activity during the period: | |||||||
Payments to PFG | (807 | ) | — | ||||
Change in fair value | 73 | 21 | |||||
Balance as of September 30, 2017 | $ | 491 | $ | 123 | |||
Financial Instruments Not Measured at Fair Value
The Company’s other financial instruments consist primarily of cash and cash equivalents, accounts receivable, investment in sales-type lease, financing receivables, accounts payable and debt instruments, excluding the PFG debt. The book values of cash and cash equivalents, accounts receivable, investment in sales-type lease, debt (excluding the PFG debt) and accounts payable are considered to be representative of their respective fair values. The carrying value of capital lease obligations and debt (excluding the PFG debt), including the current portion, approximates fair market value as the variable and fixed rate approximates the current market rate of interest available to the Company.
Legal Contingencies
In June 2014, the Company entered into a settlement agreement with Astute Technology, LLC (“Astute”). The key terms of the agreement were: 1) a grant of a non-revocable license of Astute patents to the Company; 2) a grant of a fully paid, non-refundable license of certain Sonic Foundry patents to Astute; 3) both Astute and our customer agreed to identify three meetings they currently capture that the other party will not seek or respond to any request for proposal; and 4) a payment of $1.35 million to Astute. Pursuant to the settlement agreement, the payments were made in three equal amounts with the first paid in June 2014, the second paid in October 2014 and the final installment paid in March 2015. The Company contributed $1.1 million of the $1.35 million payable to Astute with our customer paying the residual amount. Of the $1.1 million, $428 thousand related to prior use and was recorded as a charge to income during fiscal 2014. The remaining $672 thousand was recorded as a product right asset, which is being amortized, on a straight-line basis, over the remaining life of the patents, through 2020. Future amounts due to Astute were accrued for as of the time of settlement.
No legal contingencies were recorded for the either of the years ended September 30, 2017 or 2016, respectively.
Stock-Based Compensation
The Company uses a lattice valuation model to account for all employee stock options granted. The lattice valuation model is a more flexible analysis to value options because of its ability to incorporate inputs that change over time, such as actual exercise behavior of option holders. The Company uses historical data to estimate the option exercise and employee departure behavior in the lattice valuation model. Expected volatility is based on historical volatility of the Company’s stock. The Company considers all employees to have similar exercise behavior and therefore has not identified separate homogeneous groups for valuation. The expected term of options granted is derived from the output of the option pricing model and represents the period of time that options granted are expected to be outstanding. The risk-free rate for periods the options are expected to be outstanding is based
54
on the U.S. Treasury yields in effect at the time of grant. Forfeitures are based on actual behavior patterns. The expected exercise factor and forfeiture rates are calculated using historical exercise and forfeiture activity for the previous three years.
The fair value of each option grant is estimated using the assumptions in the following table:
Years Ending September 30, | |||
2017 | 2016 | ||
Expected life | 4.7 - 4.9 years | 4.9 – 5.0 years | |
Risk-free interest rate | 1.08%-1.51% | 0.84%-1.23% | |
Expected volatility | 56.98%-62.21% | 53.8%-57.2% | |
Expected forfeiture rate | 10.17%-11.72% | 10.3 %-11.8% | |
Expected exercise factor | 1.29-1.35 | 1.35-1.44 | |
Expected dividend yield | —% | —% | |
Common Stock Warrants
On December 22, 2014, the company issued 74,802 warrants to two individuals, one of which is the Chairman of the Company’s Board of Directors, in combination with the sale of a like number of shares of common stock. These warrants were immediately exercisable, expire five years after the date of issuance and have an exercise price of $14.00. The remaining contractual life of these outstanding warrants as of September 30, 2017 was 2.23 years. The fair value of the warrants was determined using the lattice model and the same inputs as those used for valuing the Company’s stock option fair value. The fair value of the warrants was $133 thousand at the date of issuance. The Company determined that the warrants are freestanding and do not fall within the scope of ASC 480 or ASC 815. The warrants were recorded in conjunction with the stock issued.
See Note 3, Credit Arrangements for disclosures on additional warrants issued during fiscal 2015.
Preferred stock and dividends
In May 2017, the Company created a new series of preferred stock entitled "9% Cumulative Voting Convertible Preferred Stock, Series A" (the "Preferred Stock, Series A"). One thousand shares were authorized with a stated value and liquidation preference of $1,000 per share. In August 2017, 1,500 additional shares were authorized for an aggregated total of 2,500 shares. Holders of the Preferred Stock, Series A will receive monthly dividends at an annual rate of 9%, payable in additional shares of Preferred Stock, Series A. Dividends declared on the preferred stock are earned monthly as additional shares and accounted for as a reduction to paid-in capital since the Company is currently in an accumulated deficit position. Each share of Preferred Stock, Series A is convertible into that number of shares of common stock determined by dividing $4.23 into the liquidation amount. As of September 30, 2017, 1,510 shares of Preferred Stock, Series A have been issued and are outstanding.
The Company considered relevant guidance when accounting for the issuance of preferred stock, and determined that the preferred shares meet the criteria for equity classification. Dividends accrued on preferred shares will be shown as a reduction to net income (or an increase in net loss) for purposes of calculating earnings per share.
Per Share Computation
Basic earnings (loss) per share has been computed using the weighted-average number of shares of common stock outstanding during the period, less shares that may be repurchased, and excludes any dilutive effects of options and warrants. In periods where the Company reports net income, diluted net income per share is computed using common equivalent shares related to outstanding options and warrants to purchase common stock. The numerator for the calculation of basic and diluted earnings per share is net income (loss). The following table sets forth the computation of basic and diluted weighted average shares used in the earnings per share calculations:
55
Years Ending September 30, | |||||
2017 | 2016 | ||||
Denominator for basic earnings (loss) per share | |||||
-weighted average common shares | 4,436,333 | 4,389,421 | |||
Effect of dilutive options and warrants (treasury method) | — | — | |||
Denominator for diluted earnings (loss) per share | |||||
-adjusted weighted average common shares | 4,436,333 | 4,389,421 | |||
Options and warrants outstanding during each year, but not included in the computation of diluted earnings (loss) per share because they are antidilutive | 1,940,245 | 1,737,624 | |||
Recent Accounting Pronouncements
In May 2014, the Financial Accounting Standards Board (the "FASB") issued Accounting Standards Update ("ASU") 2014-09, “Revenue from Contracts with Customers (Topic 606)”. The guidance substantially converges final standards on revenue recognition between the FASB and the International Accounting Standards Board providing a framework on addressing revenue recognition issues and, upon its effective date, replaces almost all existing revenue recognition guidance, including industry-specific guidance, in current U.S. generally accepted accounting principles. The FASB subsequently issued a one-year deferral of the effective date for the new revenue reporting standard for entities reporting under U.S. GAAP. In accordance with the deferral, the guidance is effective for annual reporting periods beginning after December 15, 2017. Subsequently, the FASB issued ASU 2016-08, "Revenue from Contracts with Customers (Topic 606): Principal versus Agent Considerations" ("ASU 2016-08"); ASU 2016-10, "Revenue from Contracts with Customers (Topic 606): Identifying Performance Obligations and Licensing" ("ASU 2016-10"); and ASU 2016-12, "Revenue from Contracts with Customers (Topic 606): Narrow-Scope Improvements and Practical Expedients" ("ASU 2016-12"). The Company must adopt ASU 2016-08, ASU 2016-10 and ASU 2016-12 with ASU 2014-09.
We anticipate that adoption of FASB Topic 606 will have a material impact on our consolidated financial statements. While we are continuing to assess all potential impacts of the standard, particularly regarding expenses, the Company believes the most significant impact will relate to accounting for software license revenue. We expect revenue related to recorders, customer support, hosting, and events services to remain largely unchanged. Specifically, under the new standard we expect to recognize revenue for annual or multi-year software licenses predominantly at the time of billing rather than ratably over the license term as is current practice. Due to the complexity of certain of our customer contracts, the actual revenue recognition treatment required under the standard will be dependent on contract-specific terms, and may vary in some instances from recognition at the time of billing.
In July 2015, the FASB issued ASU 2015-11, "Inventory (Topic 330)" ("ASU 2015-11"). The amendments in ASU 2015-11 require an entity to measure inventory at the lower of cost and net realizable value. The amendments in ASU 2015-11 are effective for fiscal years beginning after December 15, 2016 and interim periods within those years. Early adoption is permitted. The amendments should be applied prospectively with earlier application permitted as of the beginning of an interim or annual reporting period. The Company does not believe the implementation of this standard will result in a material impact to its financial statements.
In November 2015, the FASB issued ASU 2015-17, "Income Taxes (Topic 740)", ("ASU 2015-17"). ASU 2015-17 simplifies the presentation of deferred income taxes. The amendments in ASU 2015-17 are effective for financial statements issued for annual periods beginning after December 15, 2016, including interims periods within those annual periods. The amendments may be applied either prospectively to all deferred tax liabilities and assets or retrospectively to all periods presented. The Company does not believe the implementation of this standard will result in a material impact to its financial statements.
In January 2016, the FASB issued ASU 2016-01, "Financial Instruments - Overall (Subtopic 825-10)", ("ASU 2016-01"). ASU 2016-01 addresses certain aspects of recognition, measurement, presentation, and disclosure of financial instruments. The amendments in ASU 2016-01 are effective for fiscal years beginning after December 15, 2017, including interim periods within those fiscal years. The amendments should be applied by means of a cumulative-effect adjustment to the balance sheet as of the beginning of the fiscal year of adoption. The amendments related to equity securities without readily determinable fair values should be applied prospectively to equity investments that exist at the date of the adoption. The Company is currently evaluating this guidance and its impact to the financial statements.
56
In February 2016, the FASB issued ASU 2016-02, "Leases (Topic 842)", ("ASU 2016-02"). ASU 2016-02 aims to increase transparency and comparability among organizations by recognizing lease assets and lease liabilities on the balance sheet and disclosing key information about leasing arrangements. The amendments in ASU 2016-02 are effective for fiscal years beginning after December 15, 2018, including interim periods within those fiscal years, for public entities. Early application of the amendment is permitted. The Company is currently reviewing this guidance and its impact to the financial statements.
In March 2016, the FASB issued ASU 2016-05, "Derivatives and Hedging (Topic 815)", ("ASU 2016-05"). ASU 2016-05 clarifies the effect of novation related to a derivative instrument. The amendments in ASU 2016-05 are effective for fiscal years beginning after December 15, 2016, and interim periods within those fiscal years. An entity has the option to apply the amendments in ASU 2016-05 on either a prospective or a modified retrospective basis. The Company is currently evaluating this guidance and its impact to the financial statements.
In March 2016, the FASB issued ASU 2016-06, "Derivatives and Hedging (Topic 815)", ("ASU 2016-06"). ASU 2016-06 clarify the requirements for assessing whether contingent call (put) options that can accelerate the payment of principal on debt instruments are clearly and closely related to their debt hosts. The amendments in ASU 2016-06 are effective for fiscal years beginning after December 15, 2016, and interim periods within those fiscal years. Entities should apply the amendments on a modified retrospective basis to existing debt instruments as of the beginning of the fiscal year for which the amendments are effective. The Company is currently evaluating this guidance and its impact to the financial statements.
In March 2016, the FASB issued ASU 2016-09, "Compensation-Stock Compensation (Topic 718)", ("ASU 2016-09"). ASU 2016-09 simplifies the accounting for share-based payment transactions. The amendments in ASU 2016-09 are effective for annual periods beginning after December 15, 2016, and interim periods within those annual periods. The Company is currently evaluating this guidance and its impact to the financial statements.
In May 2016, the FASB issued ASU 2016-11, "Revenue Recognition (Topic 605) and Derivatives and Hedging (Topic 815)", ("ASU 2016-11"). ASU 2016-11 rescinds SEC paragraphs pursuant to the SEC Staff Announcement, "Rescission of Certain SEC Staff Observer Comments upon Adoption of Topic 606", and the SEC Staff Announcement, "Determining Whether the Host Contract in a Hybrid Financial Instrument Issued in the Form of a Share is More Akin to Debt or Equity", announced at the March 3, 2016 Emerging Issues Task Force (EITF) meeting. The effective dates in ASU 2016-11 coincide with the effective dates of Topic 606 (ASU 2014-09) and ASU 2014-16. The Company is currently evaluating the impact of adopting ASU 2014-09 and related amendments, such as ASU 2016-11, to determine the impact, if any, it may have on our financial statements. The Company previously reviewed ASU 2014-16 and determined that is it not applicable.
In August 2016, the FASB issued ASU 2016-15, "Statement of Cash Flows (Topic 230)", ("ASU 2016-15"). ASU 2016-15 addresses classification of certain cash receipts and cash payments within the statement of cash flows. The amendments are effective for fiscal years beginning after December 15, 2017, and interim periods with those fiscal years. The Company is currently evaluating this guidance and its impact to the financial statements.
In October 2016, the FASB issued ASU 2016-16, "Income Taxes (Topic 740)", ("ASU 2016-16"). ASU 2016-16 prohibits the recognition of current and deferred income taxes for an intra-entity transfer until the asset has been sold to an outside party. The amendment in ASU 2016-16 are effective for annual reporting periods beginning after December 15, 2017, including interim reporting periods within those annual reporting periods. The Company is currently evaluating this guidance and its impact to the financial statements.
In January 2017, the FASB issued ASU 2017-01 "(ASC Topic 805), Business Combination: Clarifying the Definition of a Business", ("ASU 2017-01"). The amendments in this ASU change the definition of a business to assist with evaluating when a set of transferred assets and activities is a business. The Company is required to adopt the guidance in the first quarter of fiscal 2019. Early adoption is permitted. The Company is in the process of assessing the impact, if any, of this ASU on its consolidated financial statements.
In February 2017, the FASB issued ASU 2017-05, "Other Income - Gains and Losses from the Derecognition of Nonfinancial Assets (Subtopic 610-20): Clarifying the Scope of Asset Derecognition Guidance and Accounting for Partial Sales of Nonfinancial Assets", ("ASU 2017-05"). ASU 2017-05 clarifies the scope of Subtopic 610-20, Other Income-Gains and Losses from the Derecognition of Nonfinancial Assets, which provides guidance for recognizing gains and losses from the transfer of nonfinancial assets in contracts with noncustomers. The amendments in ASU 2017-05 are effective for annual reporting periods beginning after December 15, 2017, including interim reporting periods within those annual reporting periods. The Company is in the process of assessing the impact, if any, of this ASU on its consolidated financial statements.
57
In March 2017, the FASB issued ASU 2017-07, "Compensation-Retirement Benefits (Topic 715): Improving the Presentation of Net Periodic Pension Cost and Net Periodic Postretirement Benefit Cost", ("ASU 2017-07"). ASU 2017-07 was issued to improve the presentation of net periodic pension cost and net periodic postretirement benefit cost within an entity's financial statements. The amendments in ASU 2017-07 are effective for annual reporting periods beginning after December 15, 2017, including interim reporting periods within those annual reporting periods. The Company is currently evaluating this guidance and its impact to the consolidated financial statements.
In May 2017, the FASB issued ASU 2017-09, "Compensation-Stock Compensation (Topic 718)", ("ASU 2017-09"). The amendments in ASU 2017-09 provide guidance about which changes to the terms or conditions of a share-based payment award require an entity to apply modification accounting in Topic 718. The amendments in ASU 2017-09 are effective for annual reporting periods beginning after December 15, 2017, including interim reporting periods within those annual reporting periods. The Company is in the process of assessing the impact, if any, of this ASU on its consolidated financial statements.
In July 2017, the FASB issued ASU 2017-11, "Earnings Per Share (Topic 260); Distinguishing Liabilities from Equity (Topic 480); Derivatives and Hedging (Topic 815)", ("ASU 2017-11"). This update was issued to address complexities in accounting for certain equity-linked financial instruments containing down round features. The amendment changes the classification analysis of these financial instruments (or embedded features) so that equity classification is no longer precluded. The amendments in ASU 2017-11 are effective for annual reporting periods beginning after December 15, 2018, including interim reporting periods within those annual reporting periods. Early adoption is permitted. The Company is in the process of assessing the impact, if any, of this ASU on its consolidated financial statements.
Accounting standards that have been issued but are not yet effective by the FASB or other standards-setting bodies that do not require adoption until a future date, which are not discussed above, are not expected to have a material impact on the Company’s financial statements upon adoption.
Recently Adopted Accounting Pronouncements
In August 2014, the FASB issued No. ASU 2014-15, "Presentation of Financial Statements — Going Concern" ("ASU 2014-15"), which requires management to evaluate relevant conditions, events and certain management plans that are known or reasonably knowable that when, considered in the aggregate, raise substantial doubt about an entity's ability to continue as a going concern within one year after the date that financial statements are issued. This ASU is effective for interim and annual reporting periods ending after December 15, 2016, and early adoption is permitted. ASU 2014-15 was early adopted by the Company on March 31, 2017, and did not have a material impact on the consolidated financial statements.
In January 2017, the FASB issued ASU 2017-04, "Intangibles - Goodwill and Other (Topic 350): Simplifying the Test for Goodwill Impairment, ("ASU 2017-04"). ASU 2017-04 simplifies the subsequent measurement of goodwill by allowing an entity to perform its annual, or interim, goodwill impairment test by comparing the fair value of a reporting unit with its carrying amount. An entity should recognize an impairment charge for the amount by which the carrying amount exceeds the reporting unit’s fair value; however, the loss recognized should not exceed the total amount of goodwill allocated to that reporting unit. This update also eliminates the requirements for any reporting unit with a zero or negative carrying amount to perform a qualitative assessment and, if it fails that qualitative test, to perform Step 2 of the goodwill impairment test. The amendments in ASU 2017-04 are effective for annual reporting periods beginning after December 15, 2019, including interim reporting periods within those annual reporting periods. ASU 2017-04 was early adopted by the Company for the year ending September 30, 2017. The adoption may have had a material impact on the consolidated financial statements as a goodwill impairment charge was recognized for one of the Company's reporting units in the current year (which was measured based on the updated guidance outlined in ASU 2017-04), and a second reporting unit has a negative carrying amount. However, in accordance with the newly adopted requirements, a Step 2 analysis was not performed for either reporting unit, which could have resulted in additional impairment of goodwill under previous guidance. See Note 8 for further discussion of goodwill.
2. Commitments
The Company leases certain equipment under capital lease and financing agreements expiring through January 2022. Capital leases that are currently outstanding on equipment included in fixed assets have a cost of $1.0 million and accumulated depreciation of
58
$571 thousand at September 30, 2017. Minimum lease payments, including principal and interest, are summarized in the table below.
Fiscal Year (in thousands) | Capital | ||
2018 | $ | 279,025 | |
2019 | 181,359 | ||
2020 | 58,887 | ||
2021 | 11,482 | ||
2022 | 2,689 | ||
Total payments | 533,441 | ||
Less interest | (33,314 | ) | |
Total | $ | 500,127 | |
The Company leases certain facilities and equipment under operating lease agreements expiring at various times through December 31, 2020. Total rent expense on all operating leases was approximately $1.3 million and $1.6 million for the years ended September 30, 2017 and 2016, respectively.
In November 2011, the Company occupied office space related to a lease agreement entered into on June 28, 2011. The lease term is from November 2011 through December 2018. The lease includes a tenant improvement allowance of $613 thousand that was recorded as a leasehold improvement liability and is being amortized as a credit to rent expense on a straight-line basis over the lease term. At September 30, 2017, the unamortized balance was $95 thousand.
The following is a schedule by year of future minimum lease payments under operating leases:
Fiscal Year (in thousands) | Operating | ||
2018 | $ | 1,239 | |
2019 | 661 | ||
2020 | 474 | ||
2021 | 119 | ||
2022 | — | ||
Total | $ | 2,493 | |
The Company enters into unconditional purchase commitments on a regular basis for the supply of Mediasite product. At September 30, 2017, the Company has an obligation to purchase $535 thousand of Mediasite product, which is not recorded on the Company’s Consolidated Balance Sheet.
The Company enters into license agreements that generally provide indemnification against intellectual property claims for its customers as well as indemnification agreements with certain service providers, landlords and other parties in the normal course of business. The Company has not incurred any material costs as a result of such indemnifications, or accrued any liabilities related to such obligations in the consolidated financial statements, except as noted above related to Astute (Note 1).
3. Credit Arrangements
Silicon Valley Bank
The Company and its wholly owned subsidiary, Sonic Foundry Media Systems, Inc. (the “Companies”) entered into the Second Amended and Restated Loan and Security Agreement with Silicon Valley Bank, dated June 27, 2011, as amended by the First, Second, Third, Fourth, Fifth, Sixth, and Seventh Amendments, dated May 31, 2013, January 10, 2014, March 31, 2014, January 27, 2015, May 13, 2015, October 5, 2015, and February 8, 2016 (the Second Amended and Restated Loan Agreement, as amended by the First, Second, Third, Fourth, Fifth, Sixth, and Seventh Amendments, collectively, the “Second Amended and Restated Loan Agreement”). The Second Amended and Restated Loan Agreement provides for a revolving line of credit in the maximum principal amount of $4,000,000. Interest accrued on the revolving line of credit at the variable per annum rate equal to the Prime Rate (as defined) plus one and one-quarter percent (1.25%). The Second Amended and Restated Loan Agreement provides for an advance
59
rate on domestic receivables of 80%, and an advance rate on foreign receivables of 75% of the lesser of (x) Foreign Eligible Accounts (as defined) or (y) $1,000,000. The maturity date of the revolving credit facility was January 31, 2017. Under the Second Amended and Restated Loan Agreement, a term loan was entered into on January 27, 2015 in the original principal amount of $2,500,000 which accrues interest at the variable per annum rate equal to the Prime Rate (as defined) plus two and three-quarters percent (which currently equates to an interest rate of 7.00%), and is being repaid in 36 equal monthly principal payments, beginning in February 2015. The Second Amended and Restated Loan Agreement also requires Sonic Foundry to comply with certain financial covenants, including (i) a liquidity financial covenant, which requires minimum Liquidity (as defined), tested with respect to the Company only (excluding the subsidiaries) of at least 1.50:1.00 at the last day of each month and (ii) a covenant that requires a Minimum EBITDA, as defined, on a trailing six month period, of at least $1.00 plus the net change in Deferred Revenue, as defined, with such covenant measured as of the last day of each fiscal quarter. Collections from accounts receivable are directly applied to the outstanding obligations under the revolving line of credit.
On December 9, 2016, the Companies entered into an Eighth Amendment to the Second Amended and Restated Loan and Security Agreement (the "Eighth Amendment") with Silicon Valley Bank. The Eighth Amendment: (i) extended the revolving line of credit maturity date to January 31, 2019, (ii) increased maximum subsidiary indebtedness allowable to $1,000,000 outstanding at any one time and (iii) provided for a "streamline period", during which bank reporting is due monthly when a streamline period is in effect and weekly when a streamline period is not in effect.
On March 22, 2017, the Companies entered into a Ninth Amendment to the Second Amended and Restated Loan and Security Agreement (the "Ninth Amendment") with Silicon Valley Bank. Under the Ninth Amendment: (i) the Liquidity covenant was modified to require minimum Liquidity (as defined) with respect to the Company only, on a monthly basis, of at least 1.6:1.0 for each month-end that is not the last day of a fiscal quarter, and 1.75:1.0 for each month-end that is the last day of a fiscal quarter, replacing the previous Liquidity requirement of 1.5:1.0 at the last day of each month; (ii) the streamline threshold pursuant to which bank reporting can be made monthly rather than weekly was increased; and (iii) certain collection procedures and reporting requirements regarding account debtors and request for advances were modified.
On May 10, 2017, the Companies entered into a Waiver and Tenth Amendment to the Second Amended and Restated Loan and Security Agreement (the "Tenth Amendment") with Silicon Valley Bank. The Tenth Amendment: (i) waived the existing default under the Second Amended and Restated Loan Agreement by virtue of the Companies’ failure to comply with the minimum EBITDA financial covenant for the compliance period ended March 31, 2017; (ii) modified the interest rate applicable to the Revolving Line to the variable per annum rate equal to the Prime Rate plus two percent (2.00%) which currently equates to 6.25%; (iii) modified the Minimum EBITDA financial covenant, to require the Companies to achieve, commencing with the period ending June 30, 2017, measured as of the last day of each fiscal quarter, on a trailing six (6) month basis ending as of the date of measurement, (a) EBITDA (negative EBITDA) plus (b) the net change in Deferred Revenue (as defined) during such measurement period, of at least (x) for the period ending June 30, 2017, no worse than negative Five Hundred Thousand Dollars (-$500,000); and (y) for the period ending September 30, 2017, and each quarterly period ending thereafter, Zero Dollars ($0.00) and (iv) required the Companies to receive, on or before September 30, 2017, net proceeds of not less than Seven Hundred Fifty Thousand Dollars ($750,000) from the issuance and sale of additional equity (which can be in the form of convertible indebtedness) or Subordinated Debt (subject to a Subordination Agreement in form and substance acceptable to Silicon Valley Bank, in Silicon Valley Bank’s reasonable discretion) of the Companies, to be issued to investors of similar character and quality as the investors in the Companies as of the Effective Date.
At September 30, 2017, a balance of $278 thousand was outstanding on the term loan with Silicon Valley Bank, with an effective interest rate of seven percent (7.00%). At September 30, 2017, a balance of $1.6 million was outstanding on the revolving line of credit with Silicon Valley Bank, with an effective interest rate of six-and-one-quarter percent (6.25%). At September 30, 2016, a balance of $1.1 million was outstanding on the term loans with Silicon Valley Bank and a balance of $1.6 million was outstanding on the revolving line of credit. At September 30, 2017, there was a remaining amount of $2.2 million available under the line of credit facility for advances.
The Second Amended and Restated Agreement, as amended, contains events of default that include, among others, non-payment of principal or interest, inaccuracy of any representation or warranty, violation of covenants, bankruptcy and insolvency events, material judgments, cross defaults to certain other indebtedness, and material adverse changes. The occurrence of an event of default could result in the acceleration of the Companies’ obligations under the Second Amended Agreement, as amended. At September 30, 2017, the Company was in compliance with all covenants in the Second Amended and Restated Loan Agreement, as amended.
60
On December 22, 2017, the Company entered into an Eleventh Amendment to the Second Amended and Restated Loan and Security Agreement (the “Eleventh Amendment”) with Silicon Valley Bank. Under the Eleventh Amendment: the Minimum EBITDA covenant was modified to require Minimum EBITDA (as defined) plus the net change in Deferred Revenue, (i) for the period ending December 31, 2017, measured on a trailing three (3) month basis, to be no less than negative ($1,900,000); (ii) for the quarterly period ending March 31, 2018, measured on a trailing three (3) month basis, to be no less than Zero Dollars, and (iii) for the quarterly period ending June 30, 2018, and each quarterly period thereafter, in each case measured on a trailing six month basis, to be no less than Zero Dollars.
Pursuant to the Second Amended Agreement, as amended, the Companies pledged as collateral to Silicon Valley Bank substantially all non-intellectual property business assets. The Companies also entered into an Intellectual Property Security Agreement with respect to intellectual property assets.
Partners for Growth IV, L.P.
On May 13, 2015, Sonic Foundry, Inc., entered into a Loan and Security Agreement (the “Loan and Security Agreement”) with Partners for Growth IV, L.P. (“PFG”), (the “Loan and Security Agreement”).
The Loan and Security Agreement provides for a Term Loan in the amount of $2,000,000, which can be disbursed in two (2) Tranches as follows: Tranche 1 was drawn in the amount of $1,500,000 shortly after execution thereof; and Tranche 2 in the amount of $500,000, was drawn on December 15, 2015.
Each tranche of the Term Loan bears interest at 10.75% per annum. Tranche 1 of the Term Loan was payable interest only until November 30, 2015. Beginning on December 1, 2015, principal is due in 30 equal monthly principal installments, plus accrued interest, continuing until May 1, 2018, when the principal balance is to be paid in full. Tranche 2 of the Term Loan is payable in 29 equal monthly principal installments, plus accrued interest, beginning January 1, 2015 and continuing until May 1, 2018.
The principal of the Term Loan may be prepaid at any time after May 13, 2016 without a prepayment fee.
Coincident with execution of the Loan and Security Agreement, the Company entered into a Warrant Agreement (“Warrant”) with PFG. Pursuant to the terms of the Warrant, the Company issued to PFG a warrant to purchase up to 50,000 shares of common stock of the Company at an exercise price of $9.66 per share, subject to certain adjustments, of which 37,500 were exercisable with the disbursement of Tranche 1 and 12,500 became exercisable with the disbursement under Tranche 2. Pursuant to the Warrant, PFG is also entitled, under certain conditions, to require the Company to exchange the Warrant for the sum of $200,000. Each warrant issued has an exercise term of 5 years from the date of issuance. On August 12, 2015, the Company and PFG entered into a waiver agreement to waive a then existing covenant default and to change the exercise price of the aforementioned warrants from $9.66 per share to $6.80 per share.
The warrants can be settled for cash in the event of acquisition of the company, any liquidation of the company, or expiration of the warrant. The Company has determined the cash payment date to be the expiration date (May 14, 2020). Due to the fixed payment amount on the expiration date, the warrant structure is in substance a debt arrangement (the “Warrant Debt”) with a zero interest rate, a fixed maturity date and a feature that makes the debt convertible to common stock. The Warrant Debt had a fair value of $80 thousand at the time of issuance. The derivative had a fair value of $136 thousand. The conversion feature is an embedded derivative; thus, for accounting purposes, the conversion feature is bifurcated and accounted for separately from the PFG Debt and Warrant Debt as a derivative liability measured at fair value at each reporting period.
On February 8, 2017, the Company and PFG entered into a Modification No. 2 to the Loan and Security Agreement (“Modification No. 2”). Under Modification No. 2: (i) the Minimum EBITDA covenant default for December 31, 2016 was waived (ii) the Liquidity covenant was modified to require minimum Liquidity (as defined) with respect to the Company only, on a monthly basis, of at least 1.60:1.00 for the first and second month of each quarterly fiscal period; and 1.75:1.00 for the third month of each quarterly fiscal period, replacing the previous Liquidity requirement of 1.5:1.0 for each month-end.
On May 11, 2017, the Company and PFG entered into a Waiver and Modification No. 3 to the Loan and Security Agreement ("Modification No. 3"). Modification No. 3: (i) waived the minimum EBITDA covenant default for the compliance period ended March 31, 2017; (ii) modified the Minimum EBITDA financial covenant to conform to the terms of the Tenth Amendment with Silicon Valley Bank, and (iii) required the Company to receive additional equity or Subordinated Debt, to conform to the terms of the Tenth Amendment with Silicon Valley Bank.
61
As of September 30, 2017, the estimated fair value of the derivative liability associated with the warrants issued in connection with the Loan and Security Agreement, was $12 thousand as compared with $67 thousand at September 30, 2016. The change in the fair value of the derivative liability was recorded as a gain of $55 thousand included in other income.
The proceeds from the Loan and Security Agreement were allocated between the PFG Debt and the Warrant Debt (inclusive of its conversion feature) based on their relative fair value on the date of issuance which resulted in initial carrying values of $1.8 million and $216 thousand, respectively. The conversion feature of $216 thousand is treated together as a debt discount on the PFG Debt and will be accreted to interest expense under the effective interest method over the three-year term of the PFG Debt and the five-year term of the Warrant Debt. For fiscal 2017, the Company recorded accretion of discount expenses associated with the warrants issued with the PFG loan of $21 thousand as well as $73 thousand related to amortization of the debt discount. For fiscal 2016, the Company recorded accretion of discount expense associated with the warrants issued with the PFG loan of $17 thousand as well as $71 thousand related to amortization of the debt discount.
The fair values of term debt and warrant debt are based on the present value of expected future cash flows and assumptions about current interest rates and the creditworthiness of the Company (Level 3). At December 14, 2015, the carrying amounts of the Company’s term debt and warrant debt totaled $1.8 million and $216 thousand, respectively. At December 14, 2015, the Company’s term debt and warrant debt were recorded at fair value. At September 30, 2017, the derivative liability was remeasured at fair value. The fair value of the bifurcated conversion feature represented by the warrant derivative liability is based on a Black Scholes option pricing model with assumptions for stock price, exercise price, volatility, expected term, risk free interest rate and dividend yield similar to those described previously for share-based compensation which were generally observable (Level 2).
At September 30, 2017, a balance of $491 thousand was outstanding on the term debt with PFG, with an effective interest rate of ten-and-three-quarters percent (10.75%). At September 30, 2016, a balance of $1.3 million with outstanding on the term debt with PFG.
The Term Loan is collateralized by substantially all the Company’s assets, including intellectual property, subject to a first lien held by Silicon Valley Bank, The Term Loan requires compliance with the same financial covenants as set forth in the loan from Silicon Valley Bank. At September 30, 2017, the Company was in compliance with all covenants in the Loan and Security Agreement, as amended.
On December 28, 2017, the Company and PFG entered into a Modification No. 4 to the Loan and Security Agreement (“Modification No. 4”). Modification No. 4: the Minimum EBITDA covenant was modified to require Minimum EBITDA (as defined) plus the net change in Deferred Revenue (i) for the period ending December 31, 2017, measured on a trailing three (3) month basis, to be no less than negative ($1,900,000); (ii) for the quarterly period ending March 31, 2018, measured on a trailing three (3) month basis, to be no less than Zero Dollars, and (iii) for the quarterly period ending June 30, 2018, and each quarterly period thereafter, in each case measured on a trailing six month basis, to be no less than Zero Dollars.
Other Indebtedness
At September 30, 2017, a balance of $417 thousand was outstanding on the line of credit with Mitsui Sumitomo Bank. At September 30, 2016, a balance of $198 thousand was outstanding on the line of credit. The notes and credit facility are both related to Mediasite K.K., and both accrue an annual interest rate of approximately one-and-one half percent (1.575%).
At September 30, 2017, no balance was outstanding on the subordinated note payable related to the acquisition of Sonic Foundry International. The outstanding balance was $93 thousand at September 30, 2016.
In the year ended September 30, 2017, a foreign currency gain of $6 thousand was realized related to re-measurement of the subordinated notes payable related to the Company’s foreign subsidiaries. In the year ended September 30, 2016, a foreign currency gain of $3 thousand was recorded related to the remeasurement.
The annual principal payments on the notes payable to SVB and PFG are as follows:
Fiscal Year (in thousands) | |||
2018 | $ | 816 | |
Plus warrant debt & discount | 76 | ||
Total | $ | 892 | |
62
4. Accrued Liabilities
Accrued liabilities consists of the following (in thousands):
September 30, | |||||||
2017 | 2016 | ||||||
Accrued compensation | $ | 871 | $ | 1,258 | |||
Accrued expenses | 211 | 365 | |||||
Accrued interest & taxes | 288 | 257 | |||||
Other accrued liabilities | 17 | 3 | |||||
Total | $ | 1,387 | $ | 1,883 | |||
The Company accrues expenses as they are incurred. Accrued compensation includes wages, vacation, commissions and bonuses. Accrued expenses is mainly related to stock compensation, professional fees and amounts owed to suppliers. Other accrued liabilities is made up of employee-related expenses.
5. Stock Options and Employee Stock Purchase Plan
On March 5, 2009, Stockholders approved adoption of the 2009 Stock Incentive Plan (the “2009 Plan”). The 2009 Plan, beginning October 1, 2009, replaced two former employee stock option plans that terminated coincident with the effectiveness of the 2009 Plan. On March 7, 2012, Stockholders approved an amendment to increase the number of shares of common stock subject to this plan by 600,000 and to increase the number of shares for the directors’ stock option plan by 50,000 shares. On March 6, 2014, Stockholders approved an amendment to increase the number of shares of common stock subject to the 2009 Plan by 800,000. On March 7, 2017, Stockholders approved an amendment to increase the number of shares of common stock subject to the 2009 Plan by 900,000 to an aggregated total of 2,700,000 shares of common stock. Stockholders also approved an increase in the number of shares for the directors' stock option plan of 50,000. The Company maintains a directors’ stock option plan under which options may be issued to purchase up to an aggregate of 150,000 shares of common stock. Each non-employee director, who is re-elected or who continues as a member of the board of directors on each annual meeting date and on each subsequent meeting of Stockholders, will be granted options to purchase 2,000 shares of common stock under the directors’ plan, or at other times or amounts at the discretion of the Board of Directors.
Each option entitles the holder to purchase one share of common stock at the specified option price. The exercise price of each option granted under the plans was set at the fair market value of the Company’s common stock at the respective grant date. Options vest at various intervals and expire at the earlier of termination of employment, discontinuance of service on the board of directors, ten years from the grant date or at such times as are set by the Company at the date of grant.
The Company has applied a graded (tranche-by-tranche) attribution method and expenses share-based compensation on an accelerated basis over the vesting period of the share award, net of estimated forfeitures.
The number of shares available for grant under these stockholder approved plans at September 30, is as follows:
63
Qualified Employee Stock Option Plans | Director Stock Option Plans | ||||
Shares available for grant at September 30, 2015 | 586,031 | 17,000 | |||
Options granted | (233,381 | ) | (10,500 | ) | |
Options forfeited | 14,239 | — | |||
Shares available for grant at September 30, 2016 | 366,889 | 6,500 | |||
Stockholder approval to increase shares | 900,000 | 50,000 | |||
Options granted | (312,020 | ) | (8,500 | ) | |
Options forfeited | 53,521 | — | |||
Shares available for grant at September 30, 2017 | 1,008,390 | 48,000 | |||
The following table summarizes information with respect to outstanding stock options under all plans:
Years Ended September 30, | |||||||||||||||
2017 | 2016 | ||||||||||||||
Options | Weighted Average Exercise Price | Options | Weighted Average Exercise Price | ||||||||||||
Outstanding at beginning of year | 1,602,822 | $ | 9.51 | 1,449,409 | $ | 10.03 | |||||||||
Granted | 320,520 | 4.73 | 243,881 | 7.16 | |||||||||||
Exercised | — | — | (2,968 | ) | 6.74 | ||||||||||
Forfeited | (117,899 | ) | 14.62 | (87,500 | ) | 11.02 | |||||||||
Outstanding at end of year | 1,805,443 | $ | 8.33 | 1,602,822 | $ | 9.51 | |||||||||
Exercisable at end of year | 1,260,609 | 1,062,837 | |||||||||||||
Weighted average fair value of options granted during the year | $ | 1.82 | $ | 2.62 | |||||||||||
The options outstanding at September 30, 2017 have been segregated into three ranges for additional disclosure as follows:
Options Outstanding | Options Exercisable | ||||||||||||||
Exercise Prices | Options Outstanding at September 30, 2017 | Weighted Average Remaining Contractual Life | Weighted Average Exercise Price | Options Exercisable at September 30, 2017 | Weighted Average Exercise Price | ||||||||||
$ 3.20 to $4.88 | 302,695 | 9.22 | $ | 4.72 | 6,650 | $ | 4.70 | ||||||||
5.00 to 9.81 | 1,190,948 | 5.67 | 8.18 | 960,219 | 8.22 | ||||||||||
10.00 to 24.90 | 311,800 | 4.49 | 12.41 | 293,740 | 12.54 | ||||||||||
1,805,443 | 1,260,609 | ||||||||||||||
As of September 30, 2017, there was $571 thousand of total unrecognized compensation cost related to non-vested stock-based compensation, with total forfeiture adjusted unrecognized compensation costs of $450 thousand. The cost is expected to be recognized over a weighted-average life of 1.8 years.
A summary of the status of the Company’s non-vested shares under all plans at September 30, 2017 and for the year then ended is presented below:
64
Shares | Weighted Average Grant Date Fair Value | |||||
Non-vested shares at October 1, 2016 | 539,985 | $ | 3.21 | |||
Granted | 320,520 | 1.82 | ||||
Vested | (276,430 | ) | 3.14 | |||
Forfeited | (39,241 | ) | 2.56 | |||
Non-vested shares at September 30, 2017 | 544,834 | $ | 2.42 | |||
Stock-based compensation recorded in the year ended September 30, 2017 was $611 thousand. Stock-based compensation recorded in the year ended September 30, 2016 was $847 thousand. There was no cash received from exercises under all stock options plans and warrants for the years ended September 30, 2017 or 2016. There were no tax benefits realized for tax deductions from option exercises for the years ended September 30, 2017 and 2016. The Company currently expects to satisfy stock-based awards with registered shares available to be issued.
The Company also has an Employee Stock Purchase Plan (Purchase Plan) under which an aggregate of 200,000 common shares may be issued. The Stockholders approved an amendment to increase the number of shares of common stock subject to the plan from 150,000 to 200,000 at the Company’s annual meeting in March 2017. All employees who have completed 90 days of employment with the Company on the first day of each offering period and customarily work twenty hours per week or more are eligible to participate in the Purchase Plan. An employee who, after the grant of an option to purchase, would hold common stock and/or hold outstanding options to purchase stock possessing 5% or more of the total combined voting power or value of the Company will not be eligible to participate. Eligible employees may make contributions through payroll deductions of up to 10% of their compensation. No participant in the Purchase Plan is permitted to purchase common stock under the Purchase Plan if such option would permit his or her rights to purchase stock under the Purchase Plan to accrue at a rate that exceeds $25,000 of the fair market value of such shares, or that exceeds 1,000 shares, for each calendar year. The Company makes a bi-annual offering to eligible employees of options to purchase shares of common stock under the Purchase Plan on the first trading day of January and July. Each offering period is for a period of 6 months from the date of the offering, and each eligible employee as of the date of offering is entitled to purchase shares of common stock at a purchase price equal to the lower of 85% of the fair market value of common stock on the first or last trading day of the offering period. A total of 60,662 shares are available to be issued under the plan. There were 13,046 and 14,708 shares purchased by employees during fiscal 2017 and 2016, respectively. The Company recorded stock compensation expense under this plan of $12 and $19 thousand during fiscal 2017 and 2016, respectively. Cash received from issuance of stock under this plan was $48 and $66 thousand during fiscal 2017 and 2016, respectively.
6. Income Taxes
The provision for income taxes consists of the following (in thousands):
Years Ended September 30, | |||||||
2017 | 2016 | ||||||
Current tax expense (benefit) U.S. | $ | (96 | ) | $ | 136 | ||
Current tax expense (benefit) foreign | 17 | 133 | |||||
Deferred income tax expense | — | — | |||||
Provision for income taxes | $ | (79 | ) | $ | 269 | ||
U.S. and foreign components of income (loss) before income taxes were as follows (in thousands):
65
Years Ended September 30, | |||||||
2017 | 2016 | ||||||
U.S. | $ | (5,225 | ) | $ | (3,504 | ) | |
Foreign | 107 | 456 | |||||
Income (loss) before income taxes | $ | (5,118 | ) | $ | (3,048 | ) | |
The reconciliation of income tax expense (benefit) computed at the appropriate country specific rate to income tax expense (benefit) is as follows (in thousands):
Years Ended September 30, | |||||||
2017 | 2016 | ||||||
Income tax expense (benefit) at statutory rate | $ | (1,800 | ) | $ | (1,036 | ) | |
State income tax expense (benefit) | (192 | ) | (130 | ) | |||
Foreign tax activity | 41 | 9 | |||||
R&D tax credit expiration | — | — | |||||
Permanent differences, net | 469 | 274 | |||||
Adjustment of temporary differences to income tax returns | — | — | |||||
Change in valuation allowance | 1,403 | 1,152 | |||||
Income tax expense (benefit) | $ | (79 | ) | $ | 269 | ||
The significant components of the deferred tax accounts recognized for financial reporting purposes are as follows (in thousands):
September 30, | |||||||
2017 | 2016 | ||||||
Deferred tax assets: | |||||||
Net operating loss and other carryforwards | $ | 35,529 | $ | 34,563 | |||
Common stock options | 1,246 | 1,134 | |||||
Unearned revenue | 520 | 389 | |||||
Other | 650 | 423 | |||||
Total deferred tax assets | 37,945 | 36,509 | |||||
Deferred tax liabilities: | |||||||
Other | (146 | ) | (144 | ) | |||
Total deferred tax liabilities | (146 | ) | (144 | ) | |||
Net deferred tax asset | 37,799 | 36,365 | |||||
Valuation allowance | (37,702 | ) | (36,299 | ) | |||
Equity gains on investment in Mediasite KK | (916 | ) | (916 | ) | |||
Customer relationships | (570 | ) | (718 | ) | |||
Goodwill amortization | (2,940 | ) | (2,930 | ) | |||
Net deferred tax liability for goodwill and intangible assets amortization | $ | (4,329 | ) | $ | (4,498 | ) | |
The Company has a $97 thousand and $66 thousand deferred tax asset at September 30, 2017 and 2016, respectively, recorded within the prepaid expenses and other current assets and other long-term assets lines on the consolidated balance sheet and is primarily related to net operating losses of MSKK.
At September 30, 2017, the Company had net operating loss carryforwards of approximately $97 million for U.S. Federal and $44 million for state tax purposes. For Federal tax purposes, the carryforwards expire in varying amounts between 2019 and 2037. For state tax purposes, the carryforwards expire in varying amounts between 2017 and 2036. Utilization of the Company’s net operating loss may be subject to substantial annual limitation due to the ownership change limitations provided by the Internal Revenue
66
Code and similar state provisions. Such an annual limitation could result in the expiration of the net operating loss carryforwards before utilization. In addition, the Company has research and development tax credit carryforwards of approximately $418 thousand, which expire in varying amounts between 2019 and 2020.
The Company maintains an additional paid-in-capital (APIC) pool which represents the excess tax benefits related to share-based compensation that are available to absorb future tax deficiencies. If the amount of future tax deficiencies is greater than the available APIC pool, the Company records the excess as income tax expense in its consolidated statements of income. For fiscal 2017 and fiscal 2016, the Company had a sufficient APIC pool to cover any tax deficiencies recorded and as a result, these deficiencies did not affect its results of operations. At September 30, 2017, the Company has $1.1 million of net operating loss carry forwards for which a benefit would be recorded in APIC when realized.
Earnings of the Company’s foreign subsidiaries are generally subject to U.S. taxation upon repatriation to the U.S. and the Company’s tax provision reflects the related incremental U.S. tax except for certain foreign subsidiaries whose unremitted earnings are considered to be indefinitely reinvested. No deferred tax liability has been recognized with regard to the remittance of such earnings after MSKK and Sonic Foundry International BV acquisitions were completed. At September 30, 2017, unremitted earnings of $925 thousand for foreign subsidiaries were deemed to be indefinitely reinvested.
Beginning with an acquisition in fiscal year 2002, the Company has amortized Goodwill for tax purposes over a 15 year life. Tax amortization is not applicable to the goodwill from the foreign acquisitions that took place during fiscal 2014 since the foreign goodwill is non-deductible for US federal tax purposes.
The difference between the book and tax balance of certain of the company’s goodwill creates a deferred tax liability and an annual tax expense. Because of the long term nature of the goodwill timing difference, tax planning strategies cannot be utilized with respect to the deferred tax liability. The Company’s tax rate differs from the expected tax rate each reporting period as a result of the aforementioned items. The balance of the Deferred Tax Liability was $4.4 million at September 30, 2017 and $4.6 million at September 30, 2016, respectively. The Company recorded a deferred tax liability related to the Customer Relationship intangibles value acquired as part of the purchase of Sonic Foundry International BV and Mediasite KK. The Company also recorded tax expense related to the “step-up” gain on its original equity investment in Mediasite KK. The Company has some other temporary differences related to its Mediasite KK subsidiary.
In accordance with accounting guidance for uncertainty in income taxes, the Company has concluded that a reserve for income tax contingencies is not necessary. The Company’s practice is to recognize interest and/or penalties related to income tax matters in income tax expense. The Company had no accruals for interest and penalties on the Company’s Condensed Consolidated Balance Sheets at September 30, 2017 or September 30, 2016 and has not recognized any interest or penalties in the Condensed Consolidated Statements of Operations for either of the years ended September 30, 2017 or 2016.
The Company is subject to taxation in the U.S., Netherlands, Japan and various state jurisdictions. All of the Company’s tax years are subject to examination by the U.S., Dutch, Japanese and state tax authorities due to the carryforward of unutilized net operating losses.
On December 22, 2017, the Tax Cuts and Jobs Act (the “Act”) was signed into United States tax law and included numerous provisions that will affect businesses. Given this date of enactment, our financial statements for the year ended September 30, 2017 do not reflect the impact of this legislation. We are currently undergoing an analysis of the tax reform law and its impact to the financial statements and tax footnote disclosures. We are also evaluating any impact the tax reform law will have on the realizability of deferred tax assets and carryforwards. A more detailed analysis will be completed in our quarterly report for the period in which the law was enacted.
7. Savings Plan
The Company’s defined contribution 401(k) savings plan covers substantially all employees meeting certain minimum eligibility requirements. Participating employees can elect to defer a portion of their compensation and contribute it to the plan on a pretax basis. The Company may also match certain amounts and/or provide additional discretionary contributions, as defined. The Company made matching contributions of $321 thousand and $426 thousand during the years ended September 30, 2017 and 2016, respectively. The Company made no additional discretionary contributions during 2017 and 2016.
8. Goodwill and Other Intangible Assets
67
Goodwill and intangible assets that have indefinite useful lives are recorded at cost and are not amortized but, instead, tested at least annually for impairment. The Company assesses the impairment of goodwill on an annual basis or whenever events or changes in circumstances indicate that the fair value of these assets is less than the carrying value.
The Company performs annual goodwill impairment test as of July 1, and tested goodwill recognized in connection with the acquisitions of Mediasite, Sonic Foundry International and Mediasite KK. For purposes of the test, goodwill on the Company’s books is evaluated within three separate reporting units. The fair values of the reporting units were initially measured as of July 1, 2017, in accordance with annual testing procedures, and were reevaluated at the end of Q4 2017 as a result of the decline in the Company's stock price during the quarter. Goodwill related to the Sonic Foundry (Mediasite) and Sonic Foundry International reporting units was found not to be impaired, however, the Company recognized an impairment loss of $600 thousand for goodwill related to the Mediasite KK reporting unit as of September 30, 2017. This non-cash loss was primarily due to delays in expected growth related to partner relationships in Japan, resulting in revenues and operating cash flows being lower than expected for the reporting unit in FY17. As a consequence, management forecasts were revised and additional risk factors were applied. The fair value of the Mediasite KK reporting unit was estimated using a combination of market comparables (level 1 inputs) and expected present value of future cash flows (level 3 inputs). See Fair Value of Financial Instruments section in Note 1 for additional discussion regarding fair value measurement of reporting units.
The Sonic Foundry (Mediasite) reporting unit, to which $7.6 million of goodwill is allocated, had a negative carrying amount on September 30, 2017. This reporting unit is considered to be an operating segment on its own and is not part of any other reportable segment.
The changes in the carrying amount of goodwill for the years ended September 30, 2017 and 2016, respectively, are as follows:
Balance as of September 30, 2015 | $ | 10,853 | |
Foreign currency translation adjustment | 457 | ||
Balance as of September 30, 2016 | 11,310 | ||
Accumulated impairment losses | (600 | ) | |
Foreign currency translation adjustment | (255 | ) | |
Balance as of September 30, 2017 | $ | 10,455 | |
The following tables present details of the Company’s total intangible assets that are being amortized at September 30, 2017 and 2016:
(in thousands) | Life (years) | Gross | Accumulated Amortization at September 30, 2017 | Balance at September 30, 2017 | ||||||
Amortizable: | ||||||||||
Customer relationships | 10 | 2,495 | 990 | 1,505 | ||||||
Software development costs | 3 | 533 | 533 | — | ||||||
Product rights | 6 | 672 | 411 | 261 | ||||||
Total | 3,700 | 1,934 | 1,766 | |||||||
68
(in thousands) | Life (years) | Gross | Accumulated Amortization at September 30, 2016 | Balance at September 30, 2016 | ||||||
Amortizable: | ||||||||||
Customer relationships | 10 | 2,605 | 723 | 1,882 | ||||||
Software development costs | 3 | 533 | 533 | — | ||||||
Product rights | 6 | 672 | 287 | 385 | ||||||
Total | 3,810 | 1,543 | 2,267 | |||||||
Estimated amortization expense for each of the five subsequent fiscal years is expected to be (in thousands):
Fiscal Year (in thousands) | |||
2018 | $ | 389 | |
2019 | 362 | ||
2020 | 302 | ||
2021 | 273 | ||
2022 | 266 | ||
Thereafter | 174 | ||
Total | $ | 1,766 | |
69
9. Related-Party Transactions
The Company incurred fees of $143 thousand and $126 thousand during the years ended September 30, 2017 and 2016, respectively, to a law firm whose partner is a director and stockholder of the Company. The Company had accrued liabilities for unbilled services to the same law firm of $55 and $45 thousand at September 30, 2017 and 2016, respectively.
As of September 30, 2017 and 2016, the Company had a loan outstanding to an executive totaling $26 thousand. The loan is collateralized by Company stock.
On December 22, 2014, the company issued 74,802 warrants to two individuals in combination with the sale of a like number of shares of common stock, one of which is the Chairman of the Company’s Board of Directors. These warrants were immediately exercisable, expire 5 years after the date of issuance and have an exercise price of $14.00.
On May 30, 2017, the Company sold to Mark Burish $500 thousand of shares of Preferred Stock, Series A, at $910 per share. On June 8, 2017, the Company sold to Andrew Burish $200 thousand of shares of Preferred Stock, Series A, at $910 per share. On June 8, 2017, the Company sold to Mark Burish an additional $50 thousand of shares of Preferred Stock, Series A, at $910 per share. On August 23, 2017, the Company sold to Mark Burish an additional $500 thousand of shares of Preferred Stock, Series A, at $762.85 per share. Mark Burish is a director of the Company and both Mark and Andrew Burish beneficially own more than 5% of the Company’s common stock. These transactions were approved by a special committee of disinterested directors.
10. Segment Information
We have determined that in accordance with the Financial Accounting Standards Board (“FASB”) Accounting Standards Codification (“ASC”) 280-10, Segment Reporting, we operate in three operating segments, however these segments meet the criteria for aggregation for reporting purposes as one reporting segment as of September 30, 2017.
The following summarizes revenue by geographic region (in thousands):
Years Ended September 30, | |||||||
2017 | 2016 | ||||||
United States | $ | 21,476 | $ | 22,686 | |||
Europe and Middle East | 4,720 | 4,843 | |||||
Asia | 8,267 | 8,760 | |||||
Other | 1,537 | 1,686 | |||||
Total | $ | 36,000 | $ | 37,975 | |||
11. Customer Concentration
In the fiscal year ended September 30, 2017 and 2016, two distributors represented 26% and 27% of total revenue, respectively. At September 30, 2017 and 2016, these two distributors represented 23% and 28% of total accounts receivable, respectively.
12. Legal Proceedings
From time to time, the Company is subject to legal proceedings or claims arising from its normal course of operations. The Company accrues for costs related to loss contingencies when such costs are probable and reasonably estimable. As of September 30, 2017, the Company is not aware of any material pending legal proceedings or threatened litigation that would have a material adverse effect on the Company’s financial condition or results of operations.
13. Quarterly Financial Data (unaudited)
The following table sets forth selected quarterly financial information for the years ended September 30, 2017 and 2016. The operating results are not necessarily indicative of results for any future period.
70
Quarterly Financial Data | |||||||||||||||||||||||||||||||
(in thousands except per share data) | Q4-’17 | Q3-’17 | Q2-’17 | Q1-’17 | Q4-’16 | Q3-’16 | Q2-’16 | Q1-’16 | |||||||||||||||||||||||
Revenue | $ | 8,300 | $ | 9,833 | $ | 8,560 | $ | 9,307 | $ | 9,455 | $ | 9,817 | $ | 9,612 | $ | 9,091 | |||||||||||||||
Gross margin | 6,113 | 7,247 | 6,064 | 6,709 | 7,102 | 7,235 | 7,273 | 6,380 | |||||||||||||||||||||||
Income (loss) from operations | (1,411 | ) | (371 | ) | (1,274 | ) | (1,502 | ) | (493 | ) | (452 | ) | (214 | ) | (1,117 | ) | |||||||||||||||
Net income (loss) | (1,585 | ) | (489 | ) | (1,456 | ) | (1,509 | ) | (847 | ) | (552 | ) | (711 | ) | (1,207 | ) | |||||||||||||||
Basic and diluted net income (loss) per share | $ | (0.37 | ) | $ | (0.13 | ) | $ | (0.33 | ) | $ | (0.34 | ) | $ | (0.19 | ) | $ | (0.13 | ) | $ | (0.16 | ) | $ | (0.28 | ) | |||||||
14. Subsequent Events
On November 9, 2017, the Company sold to Mark Burish $500 thousand of shares of Preferred Stock, Series A, at $762.85 per share. Mark Burish is a director of the Company and beneficially owns more than 5% of the Company’s common stock. All sales of Preferred Stock, Series A, were approved by a special committee of disinterested directors.
On December 22, 2017, the Company entered into an Eleventh Amendment to the Second Amended and Restated Loan and Security Agreement (the “Eleventh Amendment”) with Silicon Valley Bank (“Silicon Valley”). Under the Eleventh Amendment: (i) the Minimum EBITDA covenant was modified to require Minimum EBITDA (as defined) plus the net change in Deferred Revenue for the period ending December 31, 2017, measured on a trailing three (3) month basis, no worse than negative ($1,900,000); for the quarterly period ending March 31, 2018, measured on a trailing three (3) month basis, no less than Zero Dollars and for the quarterly period ending June 30, 2018, and each quarterly period thereafter, in each case measured on a trailing six month basis, no less than Zero Dollars.
On December 28, 2017, the Company also entered into a Modification No. 4 to the Loan and Security Agreement (“Modification No. 4”) with Partners for Growth IV, L.P., which sets forth the same financial covenant modifications as set forth above.
ITEM 9. CHANGES IN AND DISAGREEMENTS WITH ACCOUNTANTS ON ACCOUNTING AND FINANCIAL DISCLOSURE
Not applicable.
ITEM 9A. CONTROLS AND PROCEDURES
Disclosure Controls and Procedures
Based on evaluations at September 30, 2017, our principal executive officer and principal financial officer, with the participation of our management team, have evaluated the effectiveness of our disclosure controls and procedures (as defined in Rules 13a-15 (e) and 15d-15 (e) under the Securities Exchange Act). Disclosure controls and procedures ensure that information required to be disclosed by us in reports that we file or submit under the Securities Exchange Act is recorded, processed, summarized and reported within the time periods specified in the rules and forms of the SEC, and that material information relating to the Company is accumulated and communicated to management, including our principal executive officer and our principal financial officer, as appropriate to allow timely decisions regarding required disclosures. Based on this evaluation, our principal executive officer and principal financial officer concluded that our disclosure controls and procedures were not effective as of September 30, 2017 solely as a result of a material weakness identified. This material weakness is discussed further in Management’s Report on Internal Control over Financial Reporting below.
Limitations on the effectiveness of Controls and Permitted Omission from Management’s Assessment
Our internal control over financial reporting is designed to provide reasonable assurance regarding the reliability of financial reporting and the preparation of financial statements for external purposes in accordance with generally accepted accounting principles. All internal control systems, no matter how well designed, have inherent limitations, including the possibility of human
71
error and the circumvention or overriding of controls. Accordingly, even effective internal controls can only provide reasonable assurance with respect to financial statement preparation. Also, projections of any evaluation of effectiveness to future periods are subject to the risk that controls may become inadequate because of changes in conditions, or that the degree of compliance with the policies or procedures may deteriorate.
Management’s Report on Internal Control Over Financial Reporting
Our management is responsible for establishing and maintaining adequate internal control over financial reporting, as such term is defined in Exchange Act Rules 13a-15(f).
Under the supervision and with the participation of our management, including our principal executive officer and principal financial officer, we conducted an evaluation of the effectiveness of our internal control over financial reporting based on the framework in the 2013 Internal Control- Integrated Framework, issued by the Committee of Sponsoring Organizations of the Treadway Commission (the “2013 COSO Framework”) on May 14, 2013. The 2013 COSO Framework outlines the 17 underlying principles and the following fundamental components of a company’s internal control: (i) control environment, (ii) risk assessment, (iii) control activities, (iv) information and communication, and (v) monitoring. The 2013 Framework was adopted in the fiscal year ended September 30, 2015.
Based on this evaluation, our principal executive officer and principal financial officer concluded that our internal controls over financial reporting were not effective as of September 30, 2017 due to an identified material weakness in internal control. The material weakness relates to controls over identifying and performing an impairment analysis and the preparation of consolidated financial information specific to the subsequent measurement of goodwill and long-lived and intangible assets, which has been remediated as of Q1 2018.
In light of the material weakness described above, additional procedures were performed by our management to ensure that the condensed consolidated financial statements included in this report were prepared in accordance with U.S. generally accepted accounting principles.
Based on evaluations at September 30, 2017, our principal executive officer and principal financial officer, with the participation of our management team, have evaluated the effectiveness of our disclosure controls and procedures (as defined in Rules 13a-15 (e) and 15d-15 (e) under the Securities Exchange Act). Disclosure controls and procedures ensure that information required to be disclosed by us in reports that we file or submit under the Securities Exchange Act is recorded, processed, summarized and reported within the time periods specified in the rules and forms of the SEC, and that material information relating to the Company is accumulated and communicated to management, including our principal executive officer and our principal financial officer, as appropriate to allow timely decisions regarding required disclosures. Based on this evaluation, our principal executive officer and principal financial officer concluded that our disclosure controls and procedures were not effective as of September 30, 2017 solely as a result of a material weakness identified, which is described in the paragraphs above.
This Annual Report on Form 10-K does not include an attestation report of our registered public accounting firm regarding internal control over financial reporting. Management’s report was not subject to attestation by the Company’s independent registered public accounting firm, as allowed by the SEC.
Changes in Internal Control Over Financial Reporting
We have not made any change to our internal control over financial reporting that has materially affected, or is reasonably likely to materially affect, our internal control over financial reporting.
Remediation
We have made changes to our methods and processes used in evaluating the Company's goodwill and other long-lived and intangible assets for potential impairment. The primary change in the current year was engaging with outside valuation experts to assist with the application of best practices in determining fair values used for purposes of testing goodwill and other long-lived and intangible assets, as required by ASC topics 350 and 360, respectively. In future periods, we will continue to utilize outside experts for the determination of fair values when applicable, including measuring the fair value of reporting units during the annual test for goodwill impairment when quantitative analysis is performed. There can be no assurances that we have fully remediated the
72
weakness in controls over financial reporting. However, we feel that our remediation efforts to strengthen processes and controls in place related to measurement of goodwill have adequately addressed the aforementioned material weakness.
ITEM 9B. OTHER INFORMATION
None.
73
PART III
ITEM 10. DIRECTORS, EXECUTIVE OFFICERS, AND CORPORATE GOVERNANCE
The information required by Item 10 of Form 10-K with respect to directors and executive officers is incorporated herein by reference to the information contained in the section entitled “Proposal One: Election of Directors” and “Executive Officers of Sonic”, respectively, in the Company’s definitive Proxy Statement to be filed with the Securities and Exchange Commission in connection with the solicitation of proxies for the Company’s 2017 Annual Meeting of Stockholders, which will be filed no later than January 28, 2018 (the “Proxy Statement”).
Item 405 of Regulation S-K calls for disclosure of any known late filings or failure by an insider to file a report required by Section 16(a) of the Securities Act. This information is contained in the Section entitled “Section 16(a) Beneficial Ownership Reporting Compliance” in the Proxy Statement and is incorporated herein by reference.
Item 401 of Regulation S-K calls for disclosure of whether or not the Company has a financial expert serving on the audit committee of its Board of Directors, and if so who that individual is. This information is contained in the Section entitled “Meetings and Committees of Directors” in the Proxy Statement and is incorporated herein by reference.
Item 407 of Regulation S-K calls for disclosure of whether or not the Company has an audit committee and a financial expert serving on the audit committee of the Board of Directors, and if so, who that individual is. Item 407 also requires disclosure regarding the Company’s nominating committee and the director nomination process. This information is contained in the section entitled “Meetings and Committees of Directors” in the Proxy Statement and is incorporated herein by reference.
Sonic Foundry has adopted a code of ethics that applies to all officers and employees, including Sonic Foundry’s principal executive officer, its principal financial officer, and persons performing similar functions. This code of ethics is available, without charge, to any investor who requests it. Requests should be addressed in writing to Mr. Kenneth A. Minor, Corporate Secretary, 222 West Washington Avenue, Madison, Wisconsin 53703.
ITEM 11. EXECUTIVE COMPENSATION
The information required by Item 11 of Form 10-K is incorporated herein by reference to the information contained in the sections entitled “Directors Compensation”, “Executive Compensation and Related Information” and “Compensation Committee Interlocks and Insider Participation” in the Proxy Statement.
ITEM 12. SECURITY OWNERSHIP OF CERTAIN BENEFICIAL OWNERS AND MANAGEMENT AND RELATED STOCKHOLDER MATTERS
The information required by Item 12 of Form 10-K is incorporated herein by reference to the information contained in the sections entitled “Security Ownership of Certain Beneficial Owners and Management” in the Proxy Statement. Information related to equity compensation plans is set forth in Item 5 herein.
ITEM 13. CERTAIN RELATIONSHIPS AND RELATED TRANSACTIONS, AND DIRECTOR INDEPENDENCE
The information required by Item 13 of Form 10-K is incorporated herein by reference to the information contained in the section entitled “Certain Transactions” and “Meetings and Committees of Directors” in the Proxy Statement.
ITEM 14. PRINCIPAL ACCOUNTING FEES AND SERVICES
The information required by Item 14 of Form 10-K is incorporated herein by reference to the information contained in the section entitled “Ratification of Appointment of Independent Auditors – Fiscal 2016 and 2017 Audit Fee Summary” in the Proxy Statement.
74
PART IV
ITEM 15. EXHIBITS AND FINANCIAL STATEMENT SCHEDULES
(a) | The following financial statements are filed as part of this report: |
1 | Financial Statements furnished are listed in the Table of Contents provided in response to Item 8. |
2 | Exhibits. |
NUMBER | DESCRIPTION | ||
3.1 | |||
3.2 | |||
3.3 | |||
3.4 | |||
10.1* | |||
10.2* | |||
10.3* | |||
10.4* | |||
10.5 | |||
10.6 | |||
10.7 | |||
10.8 | |||
10.9* | |||
10.10* | |||
10.11 | |||
75
10.12 | Forms of Subscription Agreements, Lock-Up Agreements and Warrant Agreements dated December 22, 2014 among Sonic Foundry, Inc. and Mark Burish, and Sonic Foundry, Inc. and Andrew Burish, filed as Exhibits 10.1, 10.2, and 10.3 to the Form 8-K filed on December 30, 2014 and hereby incorporated by reference. | ||
10.13 | |||
10.14 | |||
10.15 | |||
10.16 | |||
10.17 | |||
10.18 | |||
10.19 | |||
10.20 | |||
10.21 | |||
10.22 | |||
10.23 | |||
10.24 | |||
10.25 | |||
10.26 | |||
10.27 | |||
10.28 | |||
10.29 | |||
10.30 | |||
76
10.31 | |||
10.32 | |||
10.33 | |||
10.34 | |||
10.35 | |||
10.36 | |||
21 | |||
23.1 | |||
31.1 | |||
31.2 | |||
32 | |||
101 | The following materials from the Sonic Foundry, Inc. Form 10-K for the year ended September 30, 2017 formatted in Extensible Business Reporting Language (XBRL): (i) the Consolidated Statements of Operations, (ii) the Consolidated Balance Sheets, (iii) the Consolidated Statements of Comprehensive Loss, (iv) the Consolidated Statements of Stockholder’s Equity, (v) the Consolidated Statements of Cash Flows and (vi) Notes to Consolidated Financial Statements. | ||
Registrant will furnish upon request to the Securities and Exchange Commission a copy of all exhibits, annexes and schedules attached to each contract referenced in item 10.
* | Compensatory Plan or Arrangement |
77
SIGNATURES
Pursuant to the requirement of Section 13 or 15(d) of the Securities Exchange Act of 1934, the registrant has duly caused this report to be signed on its behalf by the undersigned thereunto duly authorized.
Sonic Foundry, Inc.
(Registrant)
By: | /s/ Gary R. Weis | |
Gary R. Weis Chairman and Chief Executive Officer | ||
Date: | January 12, 2018 | |
Pursuant to the requirements of the Securities Exchange Act of 1934, this report has been signed by the following persons in the capacities and on the dates indicated.
Signature | Title | Date | ||
/s/ Gary R. Weis | Chief Executive Officer and Director | January 12, 2018 | ||
/s/ Kenneth A. Minor | Chief Financial Officer and Secretary | January 12, 2018 | ||
/s/ Mark D. Burish | Chair and Director | January 12, 2018 | ||
/s/ Frederick H. Kopko, Jr. | Director | January 12, 2018 | ||
/s/ Brian T. Wiegand | Director | January 12, 2018 | ||
/s/ Nelson A. Murphy | Director | January 12, 2018 | ||
/s/ David F. Slayton | Director | January 12, 2018 | ||
78