UNITED STATES
SECURITIES AND EXCHANGE COMMISSION
Washington, D.C. 20549
FORM 10-K
|
þ
|
ANNUAL REPORT UNDER SECTION 13 OR 15(d) OF THE SECURITIES EXCHANGE ACT OF 1934
|
For the Fiscal Year Ended March 31, 2013
|
o
|
TRANSITION REPORT UNDER SECTION 13 OR 15(d) OF THE SECURITIES EXCHANGE ACT OF 1934
|
Commission file number: 0-7914

(Exact Name of Registrant as Specified in its Charter)
|
Delaware
|
84-0592823
|
|
|
(State of Incorporation or Organization)
|
(I.R.S. Employer Identification No.)
|
|
|
633 17th Street, Suite 2320 Denver, Colorado
|
80202-3619
|
|
|
(Address of principal executive office)
|
(Zip Code)
|
(303) 296-3076
(Registrant’s telephone number, including area code)
Securities registered pursuant to Section 12(b) of the Act:
|
Title of each class
|
Name of each exchange on which registered
|
|
|
Common Stock, $0.001 par value per share
|
NYSE MKT LLC
|
Securities registered under Section 12(g) of the Act: NONE
Indicate by check mark if the registrant is a well-known seasoned issuer, as defined in Rule 405 of the Securities Act. Yes o No þ
Indicate by check mark if the registrant is not required to file reports pursuant to Section 13 or 15(d) of the Exchange Act. Yes o No þ
Indicate by check mark whether the issuer (1) has filed all reports required to be filed by Section 13 or 15(d) of the Exchange Act during the past 12 months (or for such shorter period that the registrant was required to file such reports), and (2) has been subject to the filing requirements for the past 90 days. Yes þ No o
Indicate by check mark whether the registrant has submitted electronically and posted on its corporate Website, if any, every Interactive Data File required to be submitted and posted pursuant to Rule 405 of Regulation S-T during the preceding 12 months (or for such shorter period that the registrant was required to post such filed). Yes þ No o
Indicate by check mark if disclosure of delinquent filers pursuant to Item 405 of Regulation S-K (§ 229.405 of this chapter) is not contained herein, and will not be contained, to the best of registrant’s knowledge, in definitive proxy or information statements incorporated by reference in Part III of this Form 10-K or any amendment to this Form 10-K. þ
Indicate by check mark whether the registrant is a large accelerated filer, an accelerated filer, a non-accelerated filer, or a smaller reporting company. See definition of “large accelerated filer”, “accelerated filer” and “smaller reporting company” in Rule 12b-2 of the Exchange Act (check one):
|
Large accelerated filer o
|
|
Accelerated filer o
|
|
Non-accelerated filer o
(Do not check if a smaller reporting company)
|
|
Smaller reporting company þ
|
Indicate by check mark whether the registrant is a shell company (as defined in Rule 12b-2 of the Exchange Act). Yes o No þ
Registrant’s revenues for its most recent fiscal year: $11,378,000
The aggregate market value of registrant’s common stock held by non-affiliates was approximately $18,882,156 as of the registrant’s most recently completed second fiscal quarter.
As of June 13, 2013, 1,732,250 shares of the registrant’s common stock were outstanding.
DOCUMENTS INCORPORATED BY REFERENCE
Certain information required by Items 10, 11, 12, 13 and 14 of Part III is incorporated by reference from portions of the registrant's definitive Proxy Statement for its 2013 Annual Meeting of Shareholders to be filed, pursuant to Regulation 14A, no later than 120 days after March 31, 2013.
FORWARD-LOOKING STATEMENTS
This Current Report on Form 10-K, including information incorporated herein by reference, contains forward-looking statements as defined in the Private Securities Litigation Reform Act of 1995. These statements are subject to risks and uncertainties and are based on the beliefs and assumptions of management and information currently available to management. The use of any statements containing the words "anticipate," "intend," "believe," "estimate," "project," "expect," "predict," "plan," "should," "likely," "may," "will," "continue" or similar expressions are intended to identify such statements. All statements other than statements of historical facts that address activities that we intend, expect or anticipate will or may occur in the future are forward-looking statements. All forward-looking statements should be evaluated with the understanding of their inherent uncertainty. Forward-looking statements relate to, among other things:
● our strategies, either existing or anticipated;
● our future financial position, including anticipated liquidity;
● our ability to satisfy obligations from cash generated from operations;
● amounts and nature of future capital expenditures, including future share repurchases;
● acquisitions and other business opportunities;
● operating costs and other expenses, including asset retirement obligation expenses;
● wells expected to be drilled, other anticipated exploration efforts and associated expenses;
● estimates of proved oil and natural gas reserves, deferred tax assets, and depletion rates;
● our ability to meet additional acreage, seismic and/or drilling cost requirements; and
● other estimates and assumptions we use in our accounting policies.
Factors that could cause actual results to differ materially from our expectations include, among others, such things as:
● loss of senior management or technical personnel;
● oil and natural gas prices and production costs;
● our ability to replace oil and natural gas reserves, including changes in reserve estimates resulting from expected oil and gas prices, production rates, tax rates and production costs;
● our ability to remain in compliance with the financial covenants related to our Credit Facility may be affected by events beyond our control, including market prices for our oil and gas. Any future inability to comply with these covenants, unless waived by the Bank, could adversely affect our liquidity by rendering us unable to borrow further under the Credit Facility;
● exploitation, development, production and exploration results, including mechanical failure;
● the estimated costs of asset retirement obligation, including whether or not those retirement costs, in whole or in part, are ever actually incurred in the future;
● the potential unavailability of drilling rigs and other field equipment and services;
● the existence of unanticipated liabilities relating to existing properties or those acquired in the future, including environmental liabilities;
● factors affecting the nature and timing of our capital expenditures, including the availability of service contractors and equipment;
● the willingness and ability of third parties to honor their contractual commitments;
● permitting issues;
● the nature, extent and duration of workovers;
● the impact and costs related to compliance with or changes in laws governing our operations;
● acquisitions and other business opportunities (or the lack thereof) that may be pursued by us;
● competition for properties and the effect of such competition on the price of those properties;
● economic, market or business conditions, including any change in interest rates or inflation;
● the lack of available capital and financing;
● risk factors consistent with comparable companies within our industry, especially companies with similar market capitalization and/or employee census; and
● weather or other factors, many of which are beyond our control.
Furthermore, forward-looking statements are made based on our current assessment available at the time. Subsequently obtained information concerning the merits of any property, as well as changes in estimated exploration and development costs and ownership interest, may result in revisions to our expectations and intentions and, thus, we may alter our plans regarding any exploration and development activities.
Although we believe that the expectations reflected in such forward-looking statements are reasonable, those expectations may prove to be incorrect. As with comparable companies within our industry, there are numerous factors that could cause actual results to differ materially from our expectations. All forward-looking statements speak only as of the date made. All subsequent written and oral forward-looking statements attributable to us, or persons acting on our behalf, are expressly qualified in their entirety by these cautionary statements. Except as required by law, we undertake no obligation to update any forward-looking statement to reflect events or circumstances after the date on which it is made or to reflect the occurrence of anticipated or unanticipated events or circumstances.
2
GLOSSARY OF TERMS
Unless otherwise indicated in this report, natural gas volumes are stated at the legal pressure base of the state or geographic area in which the reserves are located at 60 degrees Fahrenheit. Crude oil and natural gas equivalents are determined using the ratio of six Mcf of natural gas to one barrel of crude oil, condensate or natural gas liquids.
The following definitions shall apply to the technical terms used in this report:
Terms used to describe quantities of crude oil and natural gas:
“Bbl” – Barrel or 42 U.S. gallons liquid volume.
“BOE” – Barrels of crude oil equivalent.
“Condensate” – A mixture of hydrocarbons that exists in the gaseous phase at original reservoir temperature and pressure, but that, when produced, is in the liquid phase at surface pressure and temperature.
“Mcf” – Thousand cubic feet of gas.
Terms used to describe our interests in wells and acreage:
“Gross acres” – The number of acres in which we own a gross working interest.
“Gross well” – A well in which we own a working interest.
“Net acres” – Our percentage ownership of gross acreage. Net acres are deemed to exist when the sum of fractional ownership working interests in gross acres equals one (e.g., a 10% working interest in a lease covering 640 gross acres is equivalent to 64 net acres).
“Net well” – Deemed to exist when the sum of fractional ownership working interests in gross wells equals one.
“Developed acreage” – Acreage consisting of leased acres spaced or assignable to productive wells. Acreage included in spacing units of infill wells is classified as developed acreage at the time production commences from the initial well in the spacing unit. As such, the addition of an infill well does not have any impact on a company’s amount of developed acreage.
“Development well” – A well drilled within the proved area of a crude oil or natural gas reservoir to the depth of stratigraphic horizon (rock layer or formation) noted to be productive for the purpose of extracting proved crude oil or natural gas reserves.
“Disposal well” – A well-used for the disposal of water resulting from the production of oil and gas. Oil and gas reservoirs are usually found in porous rocks, which also contain saltwater. This saltwater, which accompanies the oil and gas to the surface, is disposed over time through injection into underground porous rock formations not productive of oil or gas.
“Dry hole” – An exploratory or development well found to be incapable of producing either crude oil or natural gas in sufficient quantities to justify completion as a crude oil or natural gas well.
“Exploratory well” – A well drilled to find and produce crude oil or natural gas in an unproved area, to find a new reservoir in a field previously found to be producing crude oil or natural gas in another reservoir, or to extend a known reservoir.
“Injector well” – A well-used for the injection of water, gas, steam or CO2 into an oil-or gas producing reservoir/unit in order to maintain reservoir pressure, heat the oil or lower its viscosity, in order to increase oil and /or gas recovery and to safely dispose of the salt and/or fresh water produced with oil and natural gas.
“Productive well” – An exploratory or a development well that is not a dry hole.
3
“Undeveloped acreage” – Leased acres on which wells have not been drilled or completed to a point that would permit the production of economic quantities of crude oil and natural gas, regardless of whether or not such acreage contains proved reserves. Undeveloped acreage includes net acres under the bit until a productive well is established in the spacing unit.
“Unproved property” – A property or part of a property with no proved reserves.
“Unsuccessful efforts” – Drilling activities that result in a dry hole. Costs associated with unsuccessful efforts are part of the cost to discover reserves, therefore are capitalized in the full cost pool.
Terms used to describe seismic activity and operations:
“Fracturing” – The injection of water, sand and additives under hydraulic pressure into prospective rock formations at depth to stimulate oil and natural gas production.
“Horizontal Drilling” – A drill rig operation of drilling vertically to a defined depth and then mechanically steering the drill bit to drill horizontal within a designated zone typically defined as the prospective pay zone to be completed for oil and/or gas.
“Hydraulic stimulation technology” – A synonym for “fracturing.” A process that results in the creation of fractures in rocks. The fracturing is done from a wellbore drilled into reservoir rock formations at depth to increase the rate and ultimate recovery of oil and natural gas.
“Plugging and abandonment” – The sealing off of fluids in the strata penetrated by a well so that the fluids from one stratum will not escape into another or to the surface. Regulations of all states require plugging of abandoned wells.
“Recompletion” – The process of re-entering an existing wellbore that is either producing or not producing and completing new reservoirs in an attempt to establish or increase existing production.
“Workover” – Operations on a producing well to restore or increase production.
Terms used to describe the legal ownership of our oil and natural gas properties:
“Revenue interest” – The amount or percentage of revenue/proceeds derived from a producing well that the owner is entitled to receive.
“Working interest” – The amount or percentage of costs that an owner is required to pay of drilling and production expenses. It also gives the owners, in the aggregate, the right to drill, produce and conduct operating activities on the property.
Terms used to assign a present value to or to classify our reserves:
“PV-10” – The estimated future cash flow, discounted at a rate of 10% per annum, with no price or cost escalation or de-escalation in accordance with guidelines promulgated by the SEC.
“Proved developed non-producing reserves” – Proved crude oil and natural gas reserves that are developed behind pipe, shut-in or that can be recovered through improved recovery only after the necessary equipment has been installed, or when the costs to do so are relatively minor. Shut-in reserves are expected to be recovered from (1) completion intervals which are open at the time of the estimate but which have not started producing, (2) wells that were shut-in for market conditions or pipeline connections, or (3) wells not capable of production for mechanical reasons. Behind-pipe reserves are expected to be recovered from zones in existing wells that will require additional completion work or future recompletion prior to the start of production.
“Proved developed reserves” – Reserves that can be expected to be recovered through existing wells with existing equipment and operating methods. Additional crude oil and natural gas expected to be obtained through the application of fluid injection or other improved recovery techniques for supplementing the natural forces and mechanisms of primary recovery are included in “proved developed reserves” only after testing by a pilot project or after the operation of an installed program has confirmed through production response that increased recovery will be achieved.
4
“Proved reserves” – Proved crude oil and natural gas reserves are those quantities of crude oil and natural gas, which, by analysis of geoscience and engineering data, can be estimated with reasonable certainty to be economically producible – from a given date forward, from known reservoirs, and under existing economic conditions, operating methods, and government regulations – prior to the time at which contracts providing the right to operate expire, unless evidence indicates that renewal is reasonably certain, regardless of whether deterministic or probabilistic methods are used for the estimation. The project to extract the hydrocarbons must have commenced or the operator must be reasonably certain that it will commence the project within a reasonable time.
“Proved undeveloped reserves” – Proved crude oil and natural gas reserves that are expected to be recovered from new wells on undrilled acreage or from existing wells where a relatively major expenditure is required for development. Reserves on undrilled acreage are limited to those drilling units offsetting productive units that are reasonably certain of production when drilled. Proved reserves for other undrilled units are claimed only where it can be demonstrated with certainty that there is continuity of production from the existing productive formation. Estimates for proved undeveloped reserves are not attributed to any acreage for which an application of fluid injection or other improved recovery technique is contemplated, unless such techniques have been proven effective by actual tests in the area and in the same reservoir.
“Standardized Measure” – The present value of estimated future cash inflows from proved natural gas and oil reserves, less future development and production costs and future income tax expenses, using prices and costs as of the date of estimation without future escalation, without giving effect to hedging activities, non-property related expenses such as general and administrative expenses, debt service and depreciation, depletion and amortization and discounted using an annual discount rate of 10% to reflect timing of future cash flows.
Other Terms:
“Farmout” – An agreement under which the owner of a working interest in an oil or natural gas lease typically assigns the working interest or a portion of the working interest to another party who desires to drill on the leased acreage. Generally, the assignee is required to drill one or more wells in order to earn its interest in the acreage. The assignor usually retains a royalty or reversionary interest in the lease. The interest received by an assignee is a "farmin" while the interest transferred by the assignor is a "farmout."
“Field” – An area consisting of either a single reservoir or multiple reservoirs, all grouped on or related to the same individual geological structural feature and/or stratigraphic condition.
“Play” – An accumulation of oil and/or natural gas resources known to exist, or thought to exist based on geotechnical research, over a large area expanse.
“Prospect” – A location where hydrocarbons such as oil and gas are believed to be present in quantities which are economically feasible to produce.
“Reservoir” – A porous and permeable underground formation containing a natural accumulation of producible oil and/or natural gas that is confined by impermeable rock or water barriers and is separate from other reservoirs.
“Resources” – Quantities of oil and gas estimated to exist in naturally occurring accumulations. A portion of the resources may be estimated to be recoverable, and another portion may be considered to be unrecoverable. Resources include both discovered and undiscovered accumulations.
5
Form 10-K
March 31, 2013
Table of Contents
6
Overview
Earthstone Energy, Inc. was incorporated in Delaware in 1969 as Basic Earth Science Systems, Inc. We changed our name in 2010 to Earthstone Energy, Inc. Earthstone Energy, Inc. (“Earthstone” or “the Company” or “we” or “our” or “us”) is a growth-oriented independent oil and gas exploration and production company primarily engaged in the exploration, development and production of oil and natural gas properties. We have an established production base that generates positive cash flow from operating activities and profits. Our operating activities are concentrated in the North Dakota and Montana portions of the Williston Basin and south Texas. As of March 31, 2013, our estimated net proved oil and natural gas reserves were 2,457,000 Bbls of oil and condensate and 2,786,000 Mcfs of natural gas.
Strategy
Our primary objective is to enhance shareholder wealth by increasing our net asset value, net reserves and cash flow through acquisitions, exploration, development, exploitation, and divestiture of oil and gas properties following a balanced risk strategy.
The four key components of our growth strategy are:
|
|
●
|
|
Identification and acquisition of strategic and significant producing properties; strategic and significant in that they are either accretive to our existing production or will provide an increase to the Company’s existing production base.
|
|
|
|
|
|
|
●
|
Utilization of strategic partners with industry experience in the specific geographic areas in which we desire to expand.
|
||
|
|
●
|
|
Cost effective implementation of internally and externally generated exploration and development drilling projects.
|
|
|
|
|
|
|
|
●
|
|
Boosting cash flows from existing oil and natural gas production through a combination of cost control and the exploitation of behind-pipe potential.
|
Our primary operational focus is in the Montana and North Dakota portions of the Williston Basin. This oil rich basin has been, and will continue to be, allocated the majority of our capital expenditure budget. We have been involved in the Williston Basin since the early 1980’s and only in south Texas does the Company have a longer history. Accordingly, we have a significant understanding of, and exposure to, both the local geology and geologic processes.
In addition to the Williston Basin, we are pursuing a new exploration project in the Nebraska portion of the Denver-Julesburg (DJ) basin. While the Nebraska panhandle has long been a producing region with a high density of shallow wells, it has only been sparsely explored in its deeper horizons. We expect to drill two or three deep wells (6,500 feet) in this area in the next 18 months to explore the Permian and Pennsylvanian formations. If successful, our efforts in this area could expand significantly. This venture is expected to mark a new chapter for us as we move from a strategy of participating in small non-operated well interests to larger interests where Earthstone is the operator.
Last year, non-operated drilling projects comprised the majority of capital expenditures. In the coming year we expect this trend to continue despite our Nebraska project, due to the size of the Bakken exposure we now have in North Dakota. We expect to continue to emphasize the acquisition of producing properties. However, these efforts are typically not predictable and are opportunistic in nature.
Historically, we have not placed emphasis on acquiring new, large, non-producing acreage positions. In the coming year, as our existing inventory of North Dakota acreage is developed, we could see the need to shift capital expenditure dollars into undeveloped acreage in this area. In addition, as we move forward with our Nebraska exploration the need may arise to supplement our acreage position in this area.
We will be focusing on keeping our operating costs under control. However, we expect rig and vendor service costs to continue to escalate, especially in North Dakota and Montana, due to high demand. Maintaining a low overhead structure is fundamental to our cost containment. However, over the last two years we have expanded and/or restructured our staff; to increase our operational capability in preparation for Nebraska, to more closely monitor and maintain our Bakken acreage and to comply with increased regulation. We are using and will continue to use the services of independent consultants and contractors to perform various professional services. We believe that this use of third-party service providers enhances our ability to contain general and administrative expenses.
We caution that the following expectations may be altered by subsequent events or other, more attractive opportunities that may present themselves in the future.
On-Going Activities
Williston Basin. The Williston basin continues to be our highest area of activity, both in terms of cash flow from existing properties and expenditures for drilling efforts as well as the acquisition of producing properties. We have several areas within the Williston basin where we expect drilling operations to commence and/or continue this calendar year. These areas are the Banks and Bonetrail Fields in McKenzie County, North Dakota, and the Rush Mountain Field in Sheridan County, Montana. While not our primary area of focus, we continue to deploy capital in areas beyond the Williston Basin to exploit reserve potential both on existing properties and new prospects.
Banks Field — McKenzie County, North Dakota. In the last year, we completed and brought onto production 17 wells in the prospect. Of these 17 wells, 12 are being operated by Brigham Exploration Company. Zenergy Inc. is the operator of 2 of the wells, 1 well is being operated by Oasis Petroleum, Inc. and 2 wells are being operated by Newfield Exploration. We, with our strategic partners, have commenced drilling of 29 wells, but as of March 31, 2013, these wells have not been completed. Of the 29 wells, per SEC criteria, 10 are considered to be Proved Developed Non-Producing and 19 are considered to be Proved Undeveloped. Based on information available at this time, we are anticipating an additional 61 wells in this prospect.
Indian Hill Field — McKenzie County, North Dakota. We currently have an interest in 2 horizontal Bakken wells in the Indian Hill Field. With improving hydraulic stimulation technology, a number of Bakken horizontal wells have been drilled in the area near our existing acreage. We anticipate that this acreage will be developed in the coming year.
Elm Coulee Field — Richland County, Montana. We have an interest in four horizontal Bakken wells in the Elm Coulee Field and several, legacy, vertical wells that hold Bakken acreage. Most areas in the Elm Coulee Field contain two wells per spacing unit. Now that this field is reaching maturity, it is not unreasonable to expect select areas of this field to be developed with three wells per spacing unit. We believe it is likely that this will occur in the coming year.
Bailey, Champion & Murphy Creek Fields — Dunn County, North Dakota. Prior to the year ended March 31, 2013, we had an interest in five producing wells. During the year ended March 31, 2013, we participated with Marathon in the drilling of four additional wells, all of which were producing by year end.
Mondak Field — McKenzie County, North Dakota. We had an interest in three horizontal Bakken wells in the Mondak Field, all of which are producing wells. This acreage is currently developed for one well per spacing unit. However, we anticipate that this acreage will be developed for two wells per spacing unit in the future.
Divide County, North Dakota — Sheridan County, Montana. In the past year, several companies have drilled horizontal Bakken wells in these two counties, resulting in strong production figures. In Sheridan county, in 2012 and 2013, we acquired three producing wells in each year, along with each wells’ associated acreage. In addition, in the Rush Mountain Field of Sheridan County, we participated with Vess Oil Corporation in the drilling of a horizontal Ratcliffe well at a 10% ownership level. In the current year, we expect to participate in the drilling of an additional well on this prospect.
Permo-Penn Play, Nebraska, DJ Basin. We have acquired approximately 70 square miles of 3D seismic data and 30,000 acres of leasehold; primarily in Cheyenne County. We anticipate drilling two or three wells over the next 18 months to define our geologic concept. The deeper formations in this area are relatively unexplored; in some cases less than one deep well per township. Unlike the shallower zones, these deeper formations are typically carbonates (limestones and dolomites), similar to the formations we experience in the Williston Basin. Also similar to the Williston Basin, multiple formations are productive; with several million barrel fields. However, unlike the Williston basin, these wells are much shallower and are inexpensive by Williston standards. Our initial efforts are expected to be vertical well penetrations, in that we do not see this as a resource play. However, as we gain better knowledge of the deposits, we may incorporate horizontal drilling into our exploration efforts. We will be the Operator and has a 45% working interest in this venture.
Reserves
During the year ended March 31, 2013, our proved reserves in BOE and PV-10 increased approximately 119% and 42%, respectively (from March 31, 2012). Additional information about our reserves and the calculation of reserves may be referenced in Item 2. “Properties.”
Contemplated Activities
We are continually evaluating other drilling and acquisition opportunities for possible participation. The absence of news and/or press releases should not be interpreted as a lack of development or activity. Generally, at any one time, we are engaged in various stages of evaluation in connection with one or more drilling or acquisition opportunities. Unless required by applicable law, our policy is generally to not disclose the specifics of any such opportunity until such time as that transaction is finalized and we have entered into a definitive agreement regarding the same and then, only when such transaction is material to our business. Similarly, we do not speculate on the outcome of such ventures until the drilling, production or other results are available and have been verified by us.
We may alter or vary all or part of these contemplated activities based upon changes in circumstances, including, but not limited to, unforeseen opportunities, inability to negotiate favorable acquisitions, farmouts, joint ventures, or divestitures, commodity prices, lack of cash flow, lack of funding and/or other events which we are not able to anticipate.
Segment Information and Major Customers
Industry segment. We are engaged only in the upstream segment of the oil and gas industry, which comprises exploration, production, and development for and of crude oil and natural gas. While we operate a small number of oil wells, we do not own or operate any gas gathering or processing plant facilities nor do we possess sufficient volume on any pipeline to market our product to end users. All of our operations are conducted in the United States. Consequently, we presently report under a single industry segment.
Markets. We are a small company and, as such, have no impact on the market for our product and little control over the price received. Markets for crude oil and natural gas are volatile and are subject to wide fluctuations depending on numerous factors beyond our control, including other sources of production, competitive fuels and proximity and capacity of pipelines or other means of transportation, seasonality, economic conditions, foreign imports, political conditions in other energy producing countries, OPEC market actions, and domestic government regulations and policies. Substantially all of our natural gas production is sold at prevailing wellhead gas prices, subject to additional charges customary to an area.
The oil and gas business is not generally seasonal in nature, although unusual weather extremes for extended periods may increase or decrease demand for oil and natural gas products temporarily. Additionally, catastrophic events, such as hurricanes or other supply disruptions, may also temporarily increase the demand for oil and gas supplies from areas unaffected by supply disruptions. Such events and their impacts on oil and gas commodity prices may cause fluctuations in quarterly or annual revenue and earnings. Also, because of the location of many of our properties in Montana and North Dakota, severe weather conditions, especially in the winter months, could have a material adverse effect on our operations and cash flow.
Major Customers. During the year ended March 31, 2013, approximately 35% of our oil and natural gas production revenues were received from sales to six purchasers (compared to 43% to nine purchasers in the previous fiscal year). The remaining 65% of our revenue was received from non-operated properties where we have no direct contact with the purchaser. On these properties our portion of the product is marketed on our behalf by the 26 different companies who operate these wells. These 26 companies may, unbeknownst to us, market to one or more of the same purchasers to whom we sell directly. Therefore, we are unable to ascertain the total extent of combined purchaser concentration. To the extent of our knowledge, in the event of the bankruptcy of any one of these purchasers, or purchasers on non-operated properties, it has been estimated that the reduction in annual revenue would be less than 10%. It is not expected that the loss of any one of these purchasers would cause a material adverse impact on the Company’s results from operations, as alternative markets for oil and natural gas production are readily available.
Competition
The oil and gas industry is a highly competitive and speculative business. We encounter strong competition from major and independent oil companies in all phases of our operations. In this arena, we must compete with many companies having financial resources and technical staffs significantly larger than our own. Furthermore, having pursued an acquisition strategy for over a decade, we did not develop an in-house geologic or geophysical infrastructure, as have many of our competitors. Rather than incur the time and expense to develop in-house capability, we chose to enter joint ventures with other companies having such resources to accelerate our efforts. Competition is intense with respect to acquisitions and the purchase of large producing properties. Due to the limited capital resources available to us, we have historically focused on smaller and/or marginal properties with behind-pipe potential in our acquisition efforts. Ultimately, our future success will depend on our ability to develop or acquire additional reserves at costs that allow us to remain competitive.
Employees
As of March 31, 2013, we had fourteen full-time, three part-time employees and six part-time contractors. Five of these employees are primarily field laborers and are located at our subsidiary’s (Basic Petroleum Services, Inc.) field office in Bruni, Texas, forty-five miles southeast of Laredo, Texas. In addition, in other areas, we have six contract field workers on a part-time retainer basis. We believe our employee and contractor relations are good.
Regulations
General. Our company is affected in varying degrees by federal, state, regional and local laws and regulations, including, but not limited to, laws governing well spacing, air emissions, water discharges, reporting requirements, endangered species, marketing, prices, taxes, allowable rates of production and the plugging and abandonment of wells, the subsequent rehabilitation of the well site locations, occupational health and safety, control of toxic substances, and other matters involving environmental protection. These laws are continually changing and, in general, are becoming more restrictive. We have expended, and expect to expend in the future, significant funds to comply with such laws and regulations. Changes to current local, state or federal laws and regulations in the jurisdictions where we operate could require additional capital expenditures and result in an increase in our costs. Although we are unable to predict what additional legislation, if any, might be proposed or enacted, additional regulatory requirements could impact the economics of our projects.
Environmental matters. We are subject to various federal, state, regional and local laws and regulations related to the discharge of materials into, and the protection of, the environment. These laws and regulations, among other things, may impose a liability on the owner or the lessee for the cost of pollution cleanup resulting from operations, subject the owner or lessee to a liability for pollution damages, require the suspension or cessation of operations in affected areas and impose restrictions on injection into subsurface formations in order to prevent the contamination of ground water.
While the Company engages in hydraulic fracturing activities, this method of stimulating oil and gas production has been in use since the 1940s, and is a common and proven technology used in exploration and production by the oil and gas industry in all oil and gas producing states without any known or significant risks to the environment. In this regard, it should be noted that the Environmental Protection Agency amended the Underground Injection Control provisions of the federal Safe Drinking Water Act to exclude hydraulic fracturing from the definition of “underground injection.” Furthermore, each state has comprehensive laws and regulations to provide for safe well construction practices and operations to ensure the protection of drinking water sources. To our knowledge, the Company is, and remains, in compliance with all Federal, State and local provisions which have been enacted or adopted regulating the discharge of materials into the environment, or otherwise relating to the protection of the environment. With regards to the magnitude of our use of hydraulic fracturing of oil & gas wells, the Company holds a minority interest in a number of wells that are under the management and control of far larger companies who apply various stimulation strategies. The Company’s ownership varies on these new drilling projects from 0.1% to 10% interest depending on the specific well. With these small interests, in the unlikely event that a containment failure were to occur on a single well, it is not likely that the event would have a material financial or operational impact on the Company.
Potential environmental effects may also arise from the use of disposal and injector wells. We hold a working interest in seven disposal and seven injector wells, nine of which we operate, the remaining of which are owned and operated by third parties whose disposal practices are outside of our control.
Although environmental requirements do have a substantial impact upon the energy industry, these requirements do not appear to affect us any differently than other companies in this industry who operate in a given geographic area. We are not aware of any environmental claims which could have a material impact upon our financial condition, results of operations, or cash flows. Such regulations have increased the resources required and costs associated with planning, designing, drilling, operating and both installing and abandoning oil and natural gas wells and facilities. We maintain insurance coverage that we believe is customary in the industry.
Available Information
We make available on our website, earthstoneenergy.com, under “Investor Relations, SEC Filings,” free of charge, our annual reports on Form 10-K, quarterly reports on Form 10-Q, current reports on Form 8-K, and amendments to those reports as soon as reasonably practicable after we electronically file or furnish them to the U.S. Securities and Exchange Commission (“SEC”).
Our Code of Business Conduct and Ethics, Board of Directors Committee Charters (Audit, Nominating, and Compensation Committees), and Whistleblower Policy are also available on our website under “Investor Relations, Corporate Governance.”
While we acknowledge that we have certain risk factors, “smaller reporting companies” are not required to provide information under this Item. Therefore, the absence of reporting under this Item should not be construed to indicate that we have no risk factors. Instead, we recognize that we have the same or similar risk factors as other comparable companies within our industry, especially companies with similar market capitalization and/or employee census.
None.
Producing Properties: Location and Impact
As of March 31, 2013, we owned a working interest in 138 gross producing oil wells, 3 gross producing gas wells, 7 disposal wells and 7 injector wells in six states: North Dakota, Montana, Texas, Louisiana, Colorado and Wyoming.
Productive Wells
|
Gross Wells
|
Net Wells
|
|||||||||||||||
|
|
|
Oil
|
|
|
Gas
|
|
|
Oil
|
|
|
Gas
|
|
||||
|
|
|
|
|
|
|
|
|
|
|
|
|
|
|
|
|
|
|
North Dakota
|
|
|
74
|
|
|
|
2
|
|
|
|
9.05
|
|
|
|
0.04
|
|
|
Montana
|
|
|
29
|
|
|
|
—
|
|
|
|
10.21
|
|
|
|
—
|
|
|
Texas
|
|
|
32
|
|
|
|
—
|
|
|
|
26.34
|
|
|
|
—
|
|
|
Louisiana
|
|
|
2
|
|
|
|
—
|
|
|
|
0.11
|
|
|
|
—
|
|
|
Colorado
|
|
|
—
|
|
|
|
1
|
|
|
|
—
|
|
|
|
0.05
|
|
|
Wyoming
|
|
|
1
|
|
|
|
—
|
|
|
|
0.47
|
|
|
|
—
|
|
|
|
|
|
|
|
|
|
|
|
|
|
|
|
|
|
|
|
|
Total
|
|
|
138
|
|
|
|
3
|
|
|
|
46.18
|
|
|
|
0.09
|
|
Production
Specific production data relative to our oil and natural gas producing properties can be found in the Selected Financial Information table in Item 7. “Management’s Discussion and Analysis of Financial Condition and Results of Operations.”
Reserves
As of March 31, 2013, our estimated proved oil and natural gas reserves in barrels of oil equivalent (“BOE”) was 2,921,000, a 119% increase from the prior year end’s estimated proved oil and natural gas reserves of 1,335,000 BOE. This increase primarily reflects the addition of new wells.
Geographically, our reported reserves are located in two primary areas: the Williston basin in North Dakota and Montana and onshore south Texas. While we hold interests in producing wells outside of these two primary locations, we are not reporting reserves for such properties due to their insignificance. The following table summarizes the estimated proved developed oil and natural gas reserves for these two areas as of March 31, 2013:
Estimated Proved Developed Oil and Gas Reserves by Area
|
|
Net Oil
|
Net Gas
|
||||||||||||||
|
|
(Bbls)
|
(Mcf)
|
BOE
|
%
|
||||||||||||
|
|
||||||||||||||||
|
Williston Basin
|
859,000 | 997,000 | 1,025,000 | 71.6 | % | |||||||||||
|
|
||||||||||||||||
|
South Texas/Onshore Gulf Coast
|
406,000 | — | 406,000 | 28.4 | % | |||||||||||
|
|
||||||||||||||||
|
Total
|
1,265,000 | 997,000 | 1,431,000 | 100.0 | % | |||||||||||
Preparation of Proved Reserves Estimates
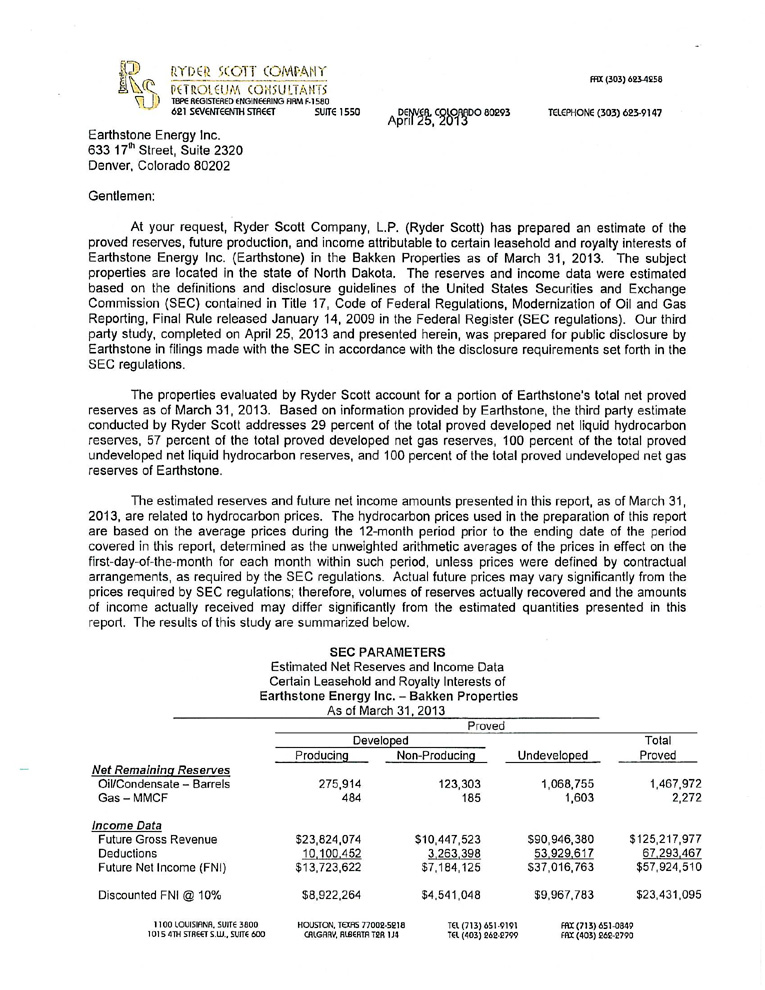
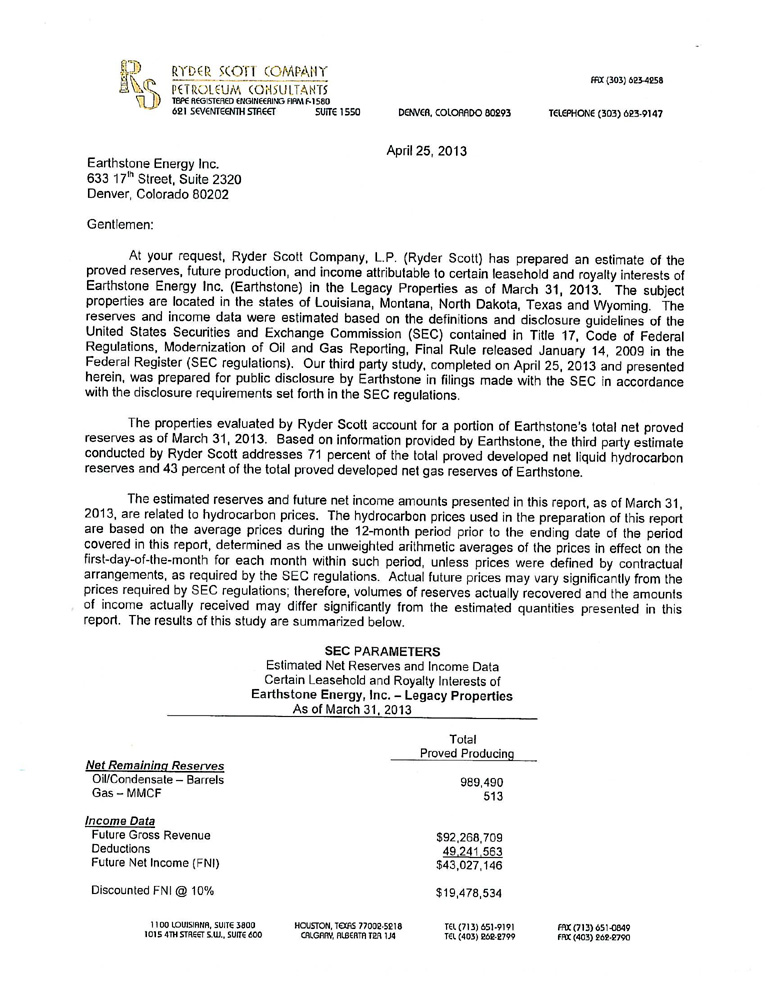
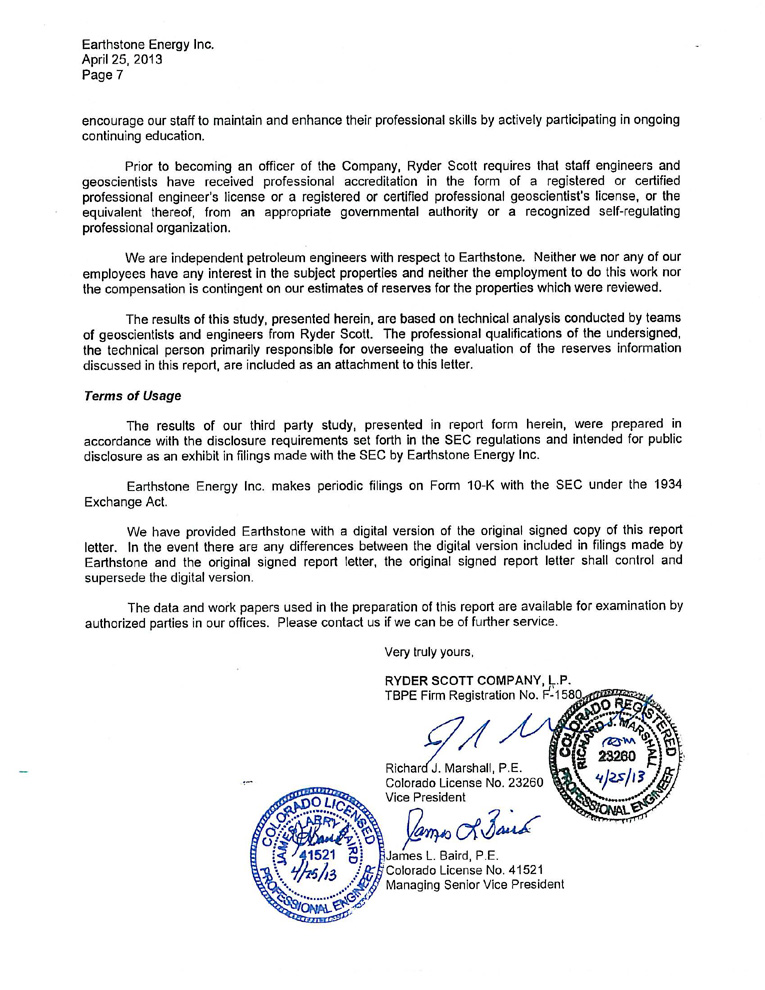
Our policies regarding internal controls over the recording of reserve estimates require reserve estimates to be in compliance with SEC rules, regulations and guidance. All of our reported oil and natural gas reserves have been estimated as of March 31, 2013 and 2012, by the Ryder Scott Company (“Ryder Scott”) of Houston, Texas. Ryder Scott is an independent petroleum engineering consulting firm that has been providing petroleum consulting services throughout the world for over seventy years. Ryder Scott is employee owned and maintains offices in Houston, Texas; Denver, Colorado; and Calgary, Alberta, Canada. Ryder Scott has over eighty engineers and geoscientists on their permanent staff. The office of Ryder Scott that prepared our reserves estimates is registered in the state of Texas (License #F-1580). Ryder Scott prepared our reserve estimate based upon a review of property interests being appraised, historical production, lease operating expenses and price differentials for our wells. Additionally, authorizations for expenditure ("AFEs"), geological and geophysical data, and other engineering data that complies with SEC guidelines are among that which we provide to such engineer for consideration in estimating our underground accumulations of crude oil and natural gas. This information was reviewed by Ray Singleton, our President and Chief Executive Officer, to ensure accuracy and completeness of the data prior to and after submission to Ryder Scott. Mr. Singleton received a Bachelor of Science degree in Petroleum Engineering from Texas A&M University. In his capacity as an engineer, Mr. Singleton prepared reserve and economic estimates during his employment with both Amoco Production Company and Champlin Petroleum. Mr. Singleton continued providing economic evaluations for approximately 40 different clients through his engineering consulting firm, Singleton & Associates, from 1982 to 1988, and thereafter for Earthstone Energy, Inc. since his employment in 1988. In addition, Mr. Singleton is currently a member of the Society of Petroleum Engineers. The report of Ryder Scott dated April 25, 2013, which contains further discussions of the reserve estimates and evaluations prepared by Ryder Scott as well as the qualifications of Ryder Scott’s technical personnel responsible for overseeing such estimates and evaluations, is attached as Exhibit 99.3 to this report.
Technologies Used in Preparation of Proved Reserves Estimates
All of the proved producing reserves attributable to producing wells and/or reservoirs were estimated by performance methods. These performance methods used are limited to decline curve analysis which utilized extrapolations of historical production and pressure data available through March 31, 2013. The data used in this analysis was obtained from public data sources and was considered sufficient for calculating producing reserves. The proved undeveloped reserves were estimated by the analogy method. The analogy method uses pertinent well data obtained from public data sources that were available through March 31, 2013.
Oil and gas reserves and the estimates of the present value of future net revenues were determined based on prices and costs as prescribed by SEC and FASB guidelines. Reserve calculations involve the estimate of future net recoverable reserves of oil and gas and the timing and amount of future net revenues to be received. Such estimates are not precise and are based on assumptions regarding a variety of factors, many of which are variable and uncertain. Proved oil and gas reserves are the estimated quantities of oil and gas that geological and engineering data demonstrate with reasonable certainty to be recoverable in future years from known reservoirs under existing economic and operating conditions. Proved developed oil and gas reserves are those expected to be recovered through existing wells with existing equipment and operating methods. Proved reserves were estimated in accordance with guidelines established by the SEC and FASB, which require that reserves estimates be prepared under existing economic and operating conditions with no provision for price and cost escalations except by contractual arrangements.
The following table sets forth certain information regarding estimates of our oil and gas reserves as of March 31, 2013. All of our reserves are located in the United States.
Estimated Proved Developed and Undeveloped Oil and Gas Reserves
|
|
Proved Developed
|
|||||||||||||||
|
|
Producing
|
Non-Producing
|
Proved Undeveloped
|
Total Proved
|
||||||||||||
|
|
||||||||||||||||
|
Net Remaining Reserves
|
||||||||||||||||
|
Oil/Condensate - Bbls
|
1,265,000
|
123,000
|
1,069,000
|
2,457,000
|
||||||||||||
|
Plant Products - Bbls
|
―
|
―
|
―
|
―
|
||||||||||||
|
Gas – Mcf
|
997,000
|
185,000
|
1,604,000
|
2,786,000
|
||||||||||||
The process of estimating oil and gas reserves is complex and involves decisions and assumptions in the evaluation of available geological, geophysical, engineering and economic data. Therefore, these estimates are inherently imprecise. Actual future production, oil and gas prices, revenues, taxes, development expenditures, operating expenses and quantities of recoverable oil and gas reserves most likely will vary from those estimated. Any significant variance could materially affect the estimated quantities and present value of reserves set forth in this Annual Report on Form 10-K. In addition, estimates of proved reserves are subject to revision to reflect production history, results of exploration and development, prevailing oil and gas prices and other factors, many of which are beyond our control. Accordingly, reserve estimates are often different from the quantities of crude oil and natural gas that are ultimately recovered and are highly dependent upon the accuracy of the assumptions upon which they are based.
Additional information pertaining to our proved reserves is set forth under the heading "Unaudited Oil and Gas Reserves Information" in the notes to the consolidated financial statements included later in this Annual Report on Form 10-K.
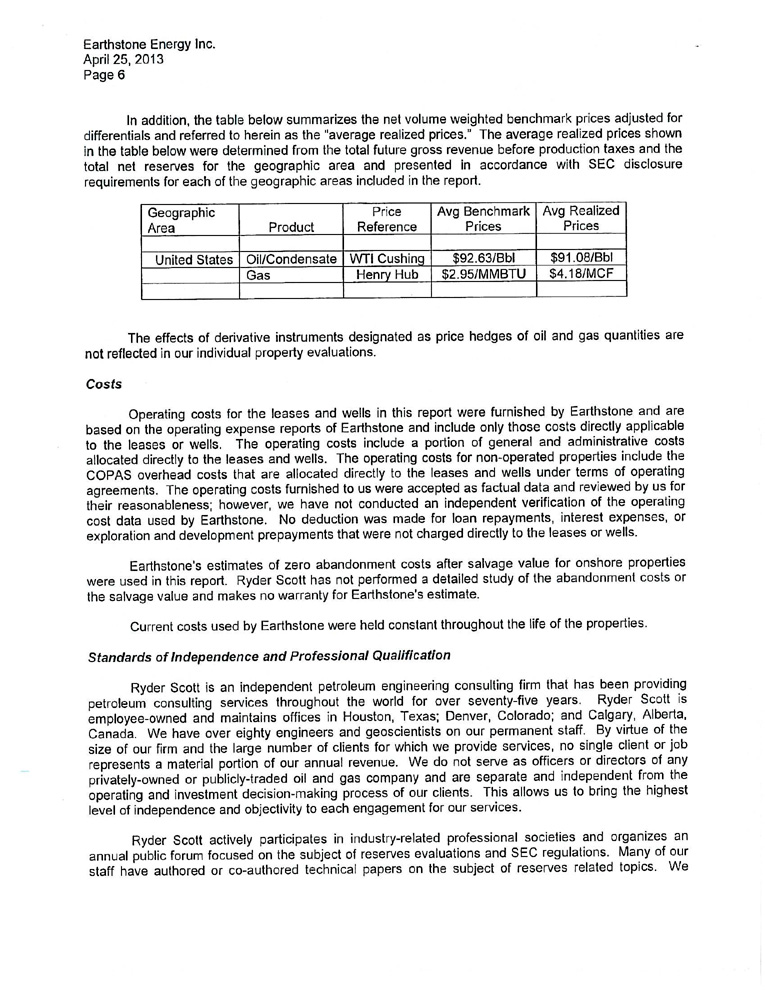
Oil and Gas Production and Sales Prices
Refer to Selected Financial Information in Item 7. “Management’s Discussion and Analysis of Financial Condition and Results of Operations” wherein we present our net oil and gas production, the average sales price, and the average cost of production per BOE, for the years ended March 31, 2013 and 2012.
Drilling Activities
The following table sets forth our gross and net working interests in exploratory and development wells drilled during the years ended March 31, 2013, 2012 and 2011, respectively:
Exploratory and Developmental Wells Drilled
|
|
2013
|
2012
|
2011
|
|||||||||||||||||||||
|
|
Gross
|
Net
|
Gross
|
Net
|
Gross
|
Net
|
||||||||||||||||||
|
Exploratory
|
|
|
|
|
|
|
||||||||||||||||||
|
Productive
|
|
|
|
|
|
|
||||||||||||||||||
|
Oil
|
― | ― | ― | ― | ― | ― | ||||||||||||||||||
|
Gas
|
― | ― | ― | ― | ― | ― | ||||||||||||||||||
|
Dry holes
|
― | ― | ― | ― | ― | ― | ||||||||||||||||||
|
Total
|
― | ― | ― | ― | ― | ― | ||||||||||||||||||
|
|
||||||||||||||||||||||||
|
Development
|
||||||||||||||||||||||||
|
Productive
|
||||||||||||||||||||||||
|
Oil
|
20 | 0.508 | 18 | 0.74 | 20 | 5.11 | ||||||||||||||||||
|
Gas
|
― | ― | ― | ― | 2 | 0.17 | ||||||||||||||||||
|
Dry holes
|
― | ― | ― | ― | ― | ― | ||||||||||||||||||
|
Total
|
20 | 0.508 | 18 | 0.74 | 22 | 5.28 | ||||||||||||||||||
Leasehold Acreage
We lease the rights to explore for and produce oil and gas from mineral owners. Leases (quantified in acres) expire after their primary term unless oil or gas production is established. Prior to establishing production, leases are generally considered undeveloped. After production is established, leases are considered developed or “held-by-production.” Our acreage is comprised of developed and undeveloped acreage as follows:
Gross and Net Acreage
|
Developed Acreage
|
Undeveloped Acreage
|
|||||||||||||||
|
|
|
Gross
|
|
|
Net
|
|
|
Gross
|
|
|
Net
|
|
||||
|
|
|
|
|
|
|
|
|
|
|
|
|
|
|
|
|
|
|
Louisiana
|
|
|
687
|
|
|
|
51
|
|
|
|
—
|
|
|
|
—
|
|
|
Montana
|
|
|
8,491
|
|
|
|
3,331
|
|
|
|
12,765
|
|
|
|
3,775
|
|
|
Nebraska
|
—
|
—
|
31,308
|
12,237
|
||||||||||||
|
North Dakota
|
|
|
25,733
|
|
|
|
3,202
|
|
|
|
5,251
|
|
|
|
611
|
|
|
Texas
|
|
|
3,080
|
|
|
|
2,486
|
|
|
|
—
|
|
|
|
—
|
|
|
Utah
|
|
|
—
|
|
|
|
—
|
|
|
|
42,736
|
|
|
|
441
|
|
|
Wyoming
|
|
|
1,555
|
|
|
|
329
|
|
|
|
40
|
|
|
|
1
|
|
|
|
|
|
|
|
|
|
|
|
|
|
|
|
|
|
|
|
|
Total
|
|
|
39,546
|
|
|
|
9,399
|
|
|
|
92,100
|
|
|
|
17,065
|
|
Undeveloped acreage includes leasehold interests on which wells have not been drilled or completed to the point that would permit the production of commercial quantities of natural gas and oil.
Field Service Equipment
As of March 31, 2013, our sole active subsidiary, Basic Petroleum Services, Inc. located in Bruni, Texas, owned a house/field office, a shallow pulling rig, a backhoe, a large winch truck, a skid-mounted cementing unit, four pickup trucks and various ancillary service vehicles. None of the vehicles are encumbered.
Office Lease
We currently lease approximately 7,000 square feet of office space in downtown Denver, Colorado from an independent third party for approximately $9,880 per month plus maintenance fees. The lease term ends on April 30, 2016. For additional information see Note 7 to the consolidated financial statements.
None.
ITEM 5 MARKET FOR REGISTRANT’S COMMON EQUITY, RELATED SHAREHOLDER MATTERS AND ISSUER PURCHASES OF EQUITY SECURITIES
Price Range of Common Stock, Number of Holders and Dividend Policy
Our common stock is currently quoted on NYSE MKT under the ticker symbol “ESTE.” Prior to December 20, 2011, our stock was traded on NASDAQ Global Select Market and prior to January 26, 2011, on the Over-the-Counter Bulletin Board (“OTCBB”) under the symbol “BSIC.”
The closing bid price on NYSE MKT of our common stock on June 12, 2013, was $13.54.
The following table sets forth the range of high and low bid quotations of our common stock for each of the periods indicated below as reported by the NYSE MKT. These quotations reflect inter-dealer prices, without retail mark-up, mark-down or commission and may not necessarily represent actual transactions.
|
Year Ended March 31,
|
||||||||||||||||
|
2013
|
2012
|
|||||||||||||||
|
|
High
|
Low
|
High
|
Low
|
||||||||||||
|
|
|
|
||||||||||||||
|
First Quarter¹
|
$ | 22.75 | $ | 15.54 | $ | N/A | $ | N/A | ||||||||
|
Second Quarter¹
|
16.25 | 13.44 | N/A | N/A | ||||||||||||
|
Third Quarter¹
|
18.11 | 14.74 | 15.72 | 15.21 | ||||||||||||
|
Fourth Quarter¹
|
18.50 | 15.74 | 26.70 | 15.47 | ||||||||||||
_____________________
|
¹
|
Our common stock commenced trading on NYSE MKT (Amex) on December 20, 2011.
|
The following table sets forth the range of high and low bid quotations of our common stock for each of the periods indicated below as reported by the NYSE Amex. These quotations reflect inter-dealer prices, without retail mark-up, mark-down or commission and may not necessarily represent actual transactions.
|
Year Ended
|
||||||||
|
March 31, 2012
|
||||||||
|
|
High
|
Low
|
||||||
|
|
||||||||
|
First Quarter¹
|
$ | 21.25 | $ | 12.30 | ||||
|
Second Quarter¹
|
15.60 | 10.60 | ||||||
|
Third Quarter¹
|
16.60 | 10.77 | ||||||
|
Fourth Quarter²
|
N/A | N/A | ||||||
__________________
|
¹
|
Our common stock commenced trading on NASDAQ on January 26, 2011.
|
|
|
²
|
Our common stock commenced trading on NYSE MKT (then Amex) on December 20, 2011. See table above.
|
As of June 13, 2013, we had approximately 1,945 shareholders of record. We have never paid a cash dividend on our common stock. Any future dividend on common stock will be at the discretion of the Board of Directors and will be dependent upon the Company’s earnings and financial condition, receipt of our lender’s consent and other factors. Our Board of Directors presently has no plans to pay any dividends in the foreseeable future.
Unregistered Sales of Equity Securities
Not applicable.
Securities Authorized For Issuance under Equity Compensation Plans
The following table contains information with respect to our Director Compensation Plan and Equity Incentive Compensation Plan as of March 31, 2013.
Equity Compensation Plan Information
|
Plan Category
|
Number of securities to be issued upon exercise of outstanding options, warrants and rights
|
Weighted-average
exercise
price of outstanding options, warrants
and rights
|
Number of securities remaining available for future issuance under equity compensation plans
|
|||||||||
|
|
|
|
|
|||||||||
|
Equity compensation plans approved
by security holders¹
|
― | N/A | 141,259 | |||||||||
|
Equity compensation plans not approved
by security holders²
|
― | N/A | 10,186 | |||||||||
|
|
||||||||||||
|
Total
|
― | N/A | 151,445 | |||||||||
___________________
|
¹
|
Equity Incentive Compensation Plan
|
|
|
²
|
Director Compensation Plan
|
The 2011 Equity Incentive Compensation Plan (“the Equity Plan”) was adopted by the Board of Directors on July 14, 2011, subject to the approval of our Stockholders, which was obtained on September 23, 2011, making the Plan effective as of September 23, 2011. The Equity Plan was established to promote our interests and the interests of our Stockholders by encouraging the participants, namely employees, to increase their equity interest in us, thereby giving them an added incentive to work toward the Company’s continued growth and success, all the while enabling us to compete for the services of the individuals needed for our continued growth and success. Awards are in the form of restricted shares of common stock. These awards are subject to such restrictions as the Compensation Committee of the Board of Directors may impose, including vesting and risk of forfeiture.
The Equity Plan allows up to 150,000 shares of the Company’s common stock to be issued to personnel under the Plan. During the year ended March 31, 2013, 9,027 shares were granted. Subsequent to the grants, 286 shares were forfeited. No shares were granted during the year ended March 31, 2012. Subsequent to March 31, 2013, 5,013 shares have been granted. Accordingly, as of June 13, 2013, 136,246 shares of common stock remain available for issuance under the Equity Plan.
The Board adopted a Director Compensation Plan (“the Director Plan”), effective April 1, 2007, which provides for a combination of cash and equity incentive compensation to attract and retain qualified and experienced director candidates. Under the Director Plan, each independent, non-employee director receives an annual grant of restricted shares having a fair market value equal to $36,000 on April 1 of each year as further described below. The number of shares included in each annual grant is determined based upon the average closing price of the ten trading days preceding April 1 of each year.
The Director Plan allows up to 50,728 shares of the Company’s common stock to be issued, subject to certain restrictions and vesting, of which 4,929 shares were granted during the year, ended March 31, 2013, for a total of 40,542 shares that have been granted as of March 31, 2013. As of the year ended March 31, 2013, 10,186 shares of common stock remain available for issuance under the Plan.
Grants of shares of restricted stock vest one-third each year over three years. In accordance with the terms of the Plan, if a Director’s participation as a member of the Board ceases or is terminated for any reason prior to the date the shares of restricted stock are fully vested, the unvested portion of the restricted stock shall be automatically forfeited and shall revert back to the Company. The aggregate number of restricted stock awards outstanding and subject to vesting at March 31, 2013, for each non-employee director was as follows: Robertson – 4,342 shares; Rodgers – 4,342; and Calerich – 3,071.
In addition, on April 1, 2013, each of the three non-employee directors was granted 2,175 shares of restricted stock on April 1, 2013, subject to vesting and forfeiture, resulting in 3,661 shares of common stock remaining available for issuance under the Plan as of June 13, 2013. All restricted shares are considered issued and outstanding shares of the Company’s common stock at the grant date and have the same dividend and voting rights as other common stock.
Purchases of Equity Securities
The following summarizes monthly share repurchase activity for the fourth quarter of the year ended March 31, 2013:
|
|
Total Number of Shares Purchased
|
Average Price Paid Per Share
|
Number of Shares Purchased as Part of a Publicly Announced Plan
|
Maximum Shares that May Yet be Purchased under the Plan
|
||||||||||||
|
January 1, 2013 - January 31, 2013
|
— | $ | — | — | 103,284 | |||||||||||
|
February 1, 2013 - February 28, 2013
|
— | $ | — | — | 103,284 | |||||||||||
|
March 1, 2013 - March 31, 2013
|
— | $ | — | — | 103,284 | |||||||||||
|
|
||||||||||||||||
|
Total
|
— | — | ||||||||||||||
As a “smaller reporting company,” we are not required to provide this information.
The following discussion and analysis should be read in conjunction with our financial statements and related notes and the other information appearing in this report. As used in this report, unless the context otherwise indicates, references to “we,” “our,” “ours,” and “us” refer to Earthstone Energy, Inc. and its subsidiary collectively.
As an oil and natural gas producer, our revenue, cash flow from operations, other income and profitability, reserve values, access to capital and future rate of growth are substantially dependent upon the prevailing prices of crude oil and natural gas. Declines in commodity prices will materially and adversely affect our financial condition, liquidity, ability to obtain financing and operating results. Lower commodity prices may reduce the amount of crude oil and natural gas that we can produce economically. Prevailing prices for such commodities are subject to wide fluctuation in response to relatively minor changes in supply and demand and a variety of additional factors beyond our control, such as global, political and economic conditions. Historically, prices received for crude oil and natural gas production have been volatile and unpredictable, and such volatility is expected to continue. Most of our production is sold at market prices. Generally, if the commodity indexes fall, the price that we receive for our production will also decline. Therefore, the amount of revenue that we realize is to a large extent determined by factors beyond our control.
Liquidity and Capital Resources
Liquidity Outlook. Our primary source of funding is the net cash flow from the sale of our oil and natural gas production. The profitability and cash flow generated by our operations in any particular accounting period will be directly related to: (a) the volume of oil and gas produced and sold, (b) the average realized prices for oil and gas sold, and (c) lifting costs. Critical to meeting our working capital requirements are the funds available from our credit facility. Our initial borrowing base under the $25 million credit facility was set at $6,000,000. Redetermination of the borrowing base is available to us on a semi-annual basis and/or we may elect a special redetermination interim to these scheduled redeterminations. We anticipate as new production comes online, that we will be able to adjust upwards the borrowing base under our credit facility and thus increase our debt as may be needed. At the current price of oil, we believe the cash generated from operations, along with existing cash balances and available borrowings from our credit facility, should enable us to meet our existing and normal recurring obligations and potential development opportunities during the next year and beyond.
Overview of our Capital Structure. We recognize the importance of developing our capital resource base in order to pursue our objectives. However, subsequent to our last public offering in 1980, debt financing has been the sole source of external funding. In addition to our routine production-related costs, general and administrative expenses and, when necessary, debt repayment requirements, we require capital to fund our exploratory and development drilling efforts and the acquisition of additional properties as well as the enhancement of held and newly acquired properties.
We have received numerous inquiries regarding the possibility of funding our efforts through equity contributions or debt instruments. Given strong cash flows, and the relatively modest nature of our current drilling projects, we have thus far declined these overtures. Our primary concern in this area is the dilution of our existing shareholders. However, going forward, given that one of the key components of our growth strategy is to expand our oil and natural gas reserve base through drilling and/or acquisitions, if we were presented with a significant opportunity and available cash and bank debt financing were insufficient, it is possible we would consider alternative forms of additional financing.
Hedging. During the years ended March 31, 2013 and 2012, we did not participate in any hedging activities, nor did we have any open futures or option contracts. Additional information concerning our hedging activities appears in Note 1 to the consolidated financial statements.
Working Capital. As of March 31, 2013, we had a working capital surplus of $775,000 (a current ratio of 1.14:1) compared to a working capital surplus as of March 31, 2012 of $6,572,000 (a current ratio of 2.91:1). The decrease in current ratio is primarily a result of the use of cash for the acquisition, development and exploration of oil and gas properties.
Cash Flow. Cash provided by operating activities decreased from $5,278,000 for the year ended March 31, 2012 to $3,867,000 for the year ended March 31, 2013. This change related primarily to the timing and collection of accounts receivable and the timing and payment of accounts payable and accrued liabilities.
Overall, net cash used in investing activities increased from the previous year from $2,467,000 for the year ended March 31, 2012 to $12,417,000 for the year ended March 31, 2013. During the year ended March 31, 2013, $12,243,000 was expended on the acquisition of producing properties, new horizontal Bakken wells in the Williston basin and on additional acreage, as compared to $7,687,000 during the year ended March 31, 2012. Investing activities in the year ended March 31, 2012 were offset by receipt of $5,404,000 from the sale of its Colorado properties.
Net cash provided by financing activities for the year ended March 31, 2013 was $3,952,000 due to borrowings on the Company’s credit facility, offset by certain fees and costs for that borrowing. Net cash used in financing activities for the year ended March 31, 2012 was $84,000, utilized entirely for treasury share acquisition. The Company’s share buyback program was adopted in October 2008 and will terminate in October 2013, if not extended before then.
Capital Expenditures
The amounts presented herein are presented on an accrual basis, and as such may not be consistent with the amounts presented on the consolidated statements of cash flows under investing activities for expenditures on oil and gas property, which are presented on a cash basis.
During the year ended March 31, 2013, we spent $13,900,000 on various projects. This compares to $8,757,000 for the year ended March 31, 2012. During the year ended March 31, 2013, capital expenditures were comprised of drilling and completions of wells producing as of year-end (57%), drilling of wells to be completed as of calendar year end (39%), and leaseholds (4%). The majority (97%) of capital expenditures occurred in the Williston basin. The remainder was spent in other areas on property improvements and leasehold acreage.
As of March 31, 2013, we have AFEs totaling $6,500,000 for our share in completion costs of new wells in which we share a working interest. At present cash flow levels, we expect to have sufficient funds available for our share of both the outstanding AFEs and any additional acreage, seismic and/or drilling cost requirements that might arise from our existing opportunities. We may alter or vary all or part of any planned capital expenditures for reasons including, but not limited to changes in circumstances, unforeseen opportunities, the inability to negotiate favorable acquisition, farmout, joint venture or divestiture terms, commodity prices, lack of cash flow, and lack of additional funding.
We are continually evaluating drilling and acquisition opportunities for possible participation. Typically, at any one time, several opportunities are in various stages of evaluation. Our policy is to not disclose the specifics of a project or prospect, nor to speculate on such ventures, until such time as those various opportunities are finalized and undertaken. We caution that the absence of news and/or press releases should not be interpreted as a lack of development or activity
Divestitures/Abandonments
On January 31, 2012, we completed the divestiture and sale of the Company’s working and/or override interests in 38 wells in Weld County, Colorado to an unrelated third party for $5,900,000. After customary adjustments and expenses, the net proceeds from the transaction were $5,400,000. The adjusted purchase price was impacted by commissions, sales costs and post effective date revenue and expense modifications to the purchase price. The wells were considered non-core properties for the Company, given the Company’s focus on other areas, primarily the Williston Basin.
Impact of Inflation and Pricing
We deal primarily in U.S. dollars. Inflation has not had a material impact on the Company in recent years because of the relatively low rates of inflation in the United States. However, the oil and natural gas industry can be cyclical and the demand for production places pressure on the economic stability and pricing within the industry. Typically, as prices for oil and natural gas increase, associated costs rise. Conversely, cost declines are likely to lag and may not adjust downward in proportion to declining prices. Changes in prices impact our revenues, estimates of reserves, assessments of any impairment of oil and natural gas properties, as well as values of properties being acquired or sold. Price changes have the potential to affect our ability to raise capital, borrow money, and retain personnel. While we do not presently expect business costs to materially rise, higher prices for oil and natural gas could result in increases in the costs of materials, services and personnel.
Other Commitments
Other than the aforementioned outstanding AFEs, we do not have any other commitments beyond our office lease and software maintenance contracts. See Note 7 to the consolidated financial statements.
Results of Operations
Selected Financial Information
The following provides selected financial information and averages for the years ended March 31, 2013 and 2012. Certain prior year amounts may have been reclassified to conform to the current presentation.
|
|
Year Ended
March 31,
|
|||||||
|
|
2013
|
2012
|
||||||
|
|
||||||||
|
Revenue
|
||||||||
|
Oil
|
$ | 10,283,000 | $ | 10,401,000 | ||||
|
Gas
|
699,000 | 1,155,000 | ||||||
|
Total revenue2
|
10,982,000 | 11,556,000 | ||||||
|
|
||||||||
|
Total production expense3
|
4,424,000 | 4,480,000 | ||||||
|
|
||||||||
|
Gross profit
|
$ | 6,558,000 | $ | 7,076,000 | ||||
|
|
||||||||
|
Depletion expense
|
$ | 1,951,000 | $ | 1,065,000 | ||||
|
|
||||||||
|
Sales volume
|
||||||||
|
Oil (Bbls)
|
122,655 | 114,960 | ||||||
|
Gas (Mcf) 1
|
107,076 | 160,409 | ||||||
|
|
||||||||
|
Average sales price4
|
||||||||
|
Oil (per Bbl)
|
$ | 83.84 | $ | 90.47 | ||||
|
Gas (per Mcf)
|
$ | 6.53 | $ | 7.20 | ||||
|
|
||||||||
|
Average per BOE
|
||||||||
|
Production expense3,4
|
$ | 31.49 | $ | 31.62 | ||||
|
Gross profit4
|
$ | 46.68 | $ | 49.94 | ||||
|
Depletion expense4
|
$ | 13.89 | $ | 7.52 | ||||
__________________
|
1
|
Due to the timing and accuracy of sales information received from a third party operator as described in “Volumes and Prices” below, sales volume amounts may not be indicative of actual production or future performance.
|
|
|
2
|
Amount does not include water service and disposal revenue. For the year ended March 31, 2013, this revenue amount is net of $396,000 in well service and water disposal revenue, which would otherwise total $11,378,000 in revenue for the year ended March 31, 2013, compared to $156,000 to total $11,712,000 for the year ended March 31, 2012.
|
|
|
3
|
Overall lifting cost (oil and gas production expenses and production taxes)
|
|
|
4
|
Averages calculated based upon non-rounded figures
|
The Year Ended March 31, 2013 Compared with the Year Ended March 31, 2012
Overview. Net income for the year ended March 31, 2013, was $1,780,000 compared to $3,279,000 for the year ended March 31, 2012. Nominal decreases in sales volumes, coupled with decreases in the sales price per barrel of oil equivalent (“BOE”), fairly constant production costs and increases in general and administrative (“G&A”) expense, resulted in the decrease in net income.
Revenues. Oil and natural gas sales revenue decreased $574,000 (5%) from $11,556,000 for the year ended March 31, 2012 to $10,982,000 for the year ended March 31, 2013, due to an overall 4% lower realized price per BOE and a 1% overall decrease in sales volumes.
Volumes and Prices. On an equivalent barrel basis, sales were 141,000 BOE for the year ended March 31, 2013 compared to 142,000 BOE for the year ended March 31, 2012.
Oil sales volumes increased 7% from 114,960 barrels for the year ended March 31, 2012 to 122,655 barrels for the year ended March 31, 2013, while the average price per barrel decreased 7% from $90.47 for the year ended March 31, 2012 to $83.84 for the year ended March 31, 2013. The rise in oil volumes resulted from production from newly producing wells offset, partially, by declines in existing wells.
Natural gas sales volumes decreased 33% from 160,409 Mcf for the year ended March 31, 2012 to 107,076 Mcf for the year ended March 31, 2013, while the average price per Mcf decreased 9%, from $7.20 for the year ended March 31, 2012 to $6.53 for the year ended March 31, 2013. The decrease in volumes is primarily related to the sale of our working and/or override interests in 38 wells in Weld County, Colorado completed on January 31, 2012.
Production Expenses. Production expenses are comprised of the following items:
|
Year Ended
March 31,
|
||||||||
|
2013
|
2012
|
|||||||
|
Lease operating expenses
|
$ | 2,563,000 | $ | 2,470,000 | ||||
|
Production taxes
|
971,000 | 937,000 | ||||||
|
Workover expenses
|
816,000 | 789,000 | ||||||
|
Transportation and other expenses
|
74,000 | 284,000 | ||||||
| $ | 4,424,000 | $ | 4,480,000 | |||||
Oil and natural gas production expense decreased $56,000 (1%) for the year ended March 31, 2013, as compared to the year ended March 31, 2012. The two principal components of oil and gas production expense are routine lease operating expenses (“LOE”) and workovers. Routine expenses typically include such items as daily well maintenance, utilities, fuel, water disposal and minor surface equipment repairs. Workovers primarily include downhole repairs and are generally random in nature. Although workovers are expected, they can be much more frequent in some wells than others and their associated costs can be significant. Therefore, workovers account for more dramatic fluctuations in oil and gas expense from period to period.
LOE, production taxes, and transportation and other expenses increased $93,000 (4%), increased $34,000 (4%), and decreased $210,000 (74%), respectively, for the year ended March 31, 2013, as compared to the year ended March 31, 2012. Production taxes as a percent of oil and natural gas sales revenue were at 8.8% for the year ended March 31, 2013 versus 8.1% for the year ended March 31, 2012, due to an increase in the number of North Dakota wells. Workover expense increased $27,000 (3%) from $789,000 for the year ended March 31, 2012 to $816,000 for the year ended March 31, 2013.
The overall lifting cost (oil and natural gas production expense plus production taxes) per BOE decreased $0.13 (0%) from $31.62 for the year ended March 31, 2012 to $31.49 for the year ended March 31, 2013. This decrease resulted from the increase in LOE offset by the decrease in transportation and other costs described above. This lifting cost per equivalent barrel is not indicative of all wells, and certain high cost wells could be shut-in should oil prices drop below certain levels.
Other Expenses.
Depletion and depreciation expense increased $901,000 (81%) from $1,116,000 for the year ended March 31, 2012 to $2,017,000 for the year ended March 31, 2013 due to the addition of numerous higher cost North Dakota wells to the depletion base. These newer North Dakota wells reflect a higher investment per well than the remaining, unexpensed depletion base associated with our legacy properties. Correspondingly, depletion expense per BOE increased from $7.52 for the year ended March 31, 2012 to $13.89 for the year ended March 31, 2013.
General and administrative (“G&A”) expense increased $549,000 (26%) from $2,076,000 for the year ended March 31, 2012, to $2,625,000 for the year ended March 31, 2013. Demand and competition for experienced oil and gas personnel remains high, especially in the Denver area. As a result, ninety-eight percent of the aforementioned increase relates to personnel costs comprised of salary increases, bonuses, recruiting fees and additional salaries associated with new employees. The sum of various other administrative costs account for the remaining two percent fluctuation in the expense. As a percent of total sales revenue, G&A expense increased from 18% for the year ended March 31, 2012 to 23% for the year ended March 31, 2013.
Income Tax. For the year ended March 31, 2013, we recorded income tax expense of $302,000. This amount consisted of a current period expense of $62,000, and deferred tax expense of $240,000. Our effective income tax rate decreased from 16.6% for the year ended March 31, 2012 to 14.5% for the year ended March 31, 2013. Our effective income tax rate was lower for the year ended March 31, 2013, primarily due to the prior period tax gain on the sale of the D-J Basin properties, offset by the utilization of greater percentage depletion as a result of recognizing the gain from the these properties.
Critical Accounting Policies and Estimates
See Note 1 to the consolidated financial statements.
Recent Accounting Pronouncements
In December 2011, the FASB issued ASU 2011-11, Balance Sheet (Topic 210): Disclosures about Offsetting Assets and Liabilities. This ASU requires the Company to disclose both net and gross information about assets and liabilities that have been offset, if any, and the related arrangements. The disclosures under this new guidance are required to be provided retrospectively for all comparative periods presented. The Company is required to implement this guidance effective for the first quarter of fiscal 2014 and does not expect the adoption of ASU 2011-11 to have a material impact on its consolidated financial statements.
Various other accounting pronouncements have been recently issued, most of which represented technical corrections to the accounting literature or were applicable to specific industries, and are not expected to have a material effect on our financial position, results of operations, or cash flows.
Off Balance Sheet Arrangements
We have no significant off balance sheet transactions, arrangements or obligations.
As a “smaller reporting company,” we are not required to provide the information.
Table of Contents
Consolidated Financial Statements
and Accompanying Notes
March 31, 2013 and 2012
|
|
Page
|
|||
| 27 | ||||
| 28-29 | ||||
| 30 | ||||
| 31 | ||||
| 32 | ||||
| 33-43 | ||||
Board of Directors and Shareholders
Earthstone Energy, Inc.
Denver, Colorado
We have audited the accompanying consolidated balance sheets of Earthstone Energy, Inc. and Subsidiaries (the “Company”) as of March 31, 2013 and 2012, and the related statements of operations, shareholders’ equity, and cash flows for the years then ended. These consolidated financial statements are the responsibility of the Company’s management. Our responsibility is to express an opinion on these consolidated financial statements based on our audits.
We conducted our audits in accordance with the standards of the Public Company Accounting Oversight Board (United States). Those standards require that we plan and perform the audit to obtain reasonable assurance about whether the financial statements are free of material misstatement. The Company is not required to have, nor were we engaged to perform, an audit of its internal control over financial reporting. Our audits included consideration of internal control over financial reporting as a basis for designing audit procedures that are appropriate in the circumstances, but not for the purpose of expressing an opinion on the effectiveness of the Company’s internal control over financial reporting. Accordingly, we express no such opinion. An audit also includes examining, on a test basis, evidence supporting the amounts and disclosures in the financial statements, assessing the accounting principles used and significant estimates made by management, as well as evaluating the overall financial statement presentation. We believe that our audits provide a reasonable basis for our opinion.
In our opinion, the consolidated financial statements referred to above present fairly, in all material respects, the financial position of Earthstone Energy, Inc. as of March 31, 2013 and 2012, and the results of their operations and their cash flows for the years then ended in conformity with accounting principles generally accepted in the United States of America.
/s/ EKSH LLLP
Denver, Colorado
June 13, 2013
27
|
Consolidated Balance Sheets
|
||||||||||||||||
|
Page 1 of 2
|
|
March 31,
|
March 31,
|
|||||||
|
2013
|
2012
|
|||||||
|
Assets
|
||||||||
|
Current assets:
|
||||||||
|
Cash and cash equivalents
|
$ | 2,180,000 | $ | 6,778,000 | ||||
|
Accounts receivable:
|
||||||||
|
Oil and gas sales
|
3,055,000 | 2,389,000 | ||||||
|
Joint interest and other receivables, net of allowance of ($38,000) and ($60,000), respectively
|
328,000 | 90,000 | ||||||
|
Other current assets
|
814,000 | 749,000 | ||||||
|
Total current assets
|
6,377,000 | 10,006,000 | ||||||
|
Oil and gas properties, full cost method:
|
||||||||
|
Proved properties
|
53,265,000 | 37,112,000 | ||||||
|
Unproved properties
|
2,156,000 | 4,409,000 | ||||||
|
Accumulated depletion and impairment
|
(27,729,000 | ) | (25,778,000 | ) | ||||
|
Net oil and gas properties
|
27,692,000 | 15,743,000 | ||||||
|
Support equipment and other non-current assets, net of accumulated depreciation of ($416,000) and ($383,000), respectively
|
611,000 | 457,000 | ||||||
|
Total non-current assets
|
28,303,000 | 16,200,000 | ||||||
|
Total assets
|
$ | 34,680,000 | $ | 26,206,000 | ||||
See accompanying notes to consolidated financial statements
|
Earthstone Energy, Inc.
|
||||||||||||||||
|
Consolidated Balance Sheets
|
||||||||||||||||
|
Page 2 of 2
|
|
March 31,
|
March 31,
|
|||||||
|
2013
|
2012
|
|||||||
|
Liabilities and Shareholders’ Equity
|
||||||||
|
Current liabilities:
|
||||||||
|
Accounts payable
|
$ | 1,631,000 | $ | 824,000 | ||||
|
Accrued liabilities
|
3,971,000 | 2,610,000 | ||||||
|
Total current liabilities
|
5,602,000 | 3,434,000 | ||||||
|
Long-term liabilities:
|
||||||||
|
Long term debt
|
4,000,000 | - | ||||||
|
Deferred tax liability
|
2,971,000 | 2,731,000 | ||||||
|
Asset retirement obligation, less current portion
|
1,809,000 | 1,693,000 | ||||||
|
Total long-term liabilities
|
8,780,000 | 4,424,000 | ||||||
|
Total liabilities
|
14,382,000 | 7,858,000 | ||||||
|
Shareholders’ Equity:
|
||||||||
|
Preferred shares, $0.001 par value, 600,000 authorized and none issued or outstanding
|
- | - | ||||||
|
Common shares, $0.001 par value, 6,400,000 shares authorized and 1,802,000 and 1,788,000 shares issued, respectively
|
18,000 | 18,000 | ||||||
|
Additional paid-in capital
|
23,278,000 | 23,108,000 | ||||||
|
Treasury stock, at cost, 82,000 shares
|
(457,000 | ) | (457,000 | ) | ||||
|
Accumulated deficit
|
(2,541,000 | ) | (4,321,000 | ) | ||||
|
Total shareholders’ equity
|
20,298,000 | 18,348,000 | ||||||
|
Total liabilities and shareholders’ equity
|
$ | 34,680,000 | $ | 26,206,000 | ||||
See accompanying notes to consolidated financial statements
|
Consolidated Statements of Operations
|
|
Year ended March 31,
|
||||||||
|
2013
|
2012
|
|||||||
|
Revenues:
|
||||||||
|
Oil and gas sales
|
$ | 10,982,000 | $ | 11,556,000 | ||||
|
Well service and water-disposal revenue
|
396,000 | 156,000 | ||||||
|
Total revenues
|
11,378,000 | 11,712,000 | ||||||
|
Expenses:
|
||||||||
|
Oil and gas production
|
3,453,000 | 3,543,000 | ||||||
|
Production tax
|
971,000 | 937,000 | ||||||
|
Well service and water-disposal
|
94,000 | 6,000 | ||||||
|
Depletion and depreciation
|
2,017,000 | 1,116,000 | ||||||
|
Accretion of asset retirement obligation
|
177,000 | 172,000 | ||||||
|
General and administrative
|
2,625,000 | 2,076,000 | ||||||
|
Total expenses
|
9,337,000 | 7,850,000 | ||||||
|
Income from operations
|
2,041,000 | 3,862,000 | ||||||
|
Other income (expense):
|
||||||||
|
Interest and other income
|
62,000 | 75,000 | ||||||
|
Interest and other expenses
|
(21,000 | ) | (6,000 | ) | ||||
|
Total other income
|
41,000 | 69,000 | ||||||
|
Income before income tax
|
2,082,000 | 3,931,000 | ||||||
|
Current income tax expense
|
62,000 | 240,000 | ||||||
|
Deferred income tax expense
|
240,000 | 412,000 | ||||||
|
Total income tax expense
|
302,000 | 652,000 | ||||||
|
Net income
|
$ | 1,780,000 | $ | 3,279,000 | ||||
|
Per share amounts:
|
||||||||
|
Basic
|
$ | 1.03 | $ | 1.92 | ||||
|
Diluted
|
$ | 1.03 | $ | 1.92 | ||||
|
Weighted average common shares outstanding:
|
||||||||
|
Basic
|
1,720,712 | 1,709,178 | ||||||
|
Diluted
|
1,720,712 | 1,709,178 | ||||||
See accompanying notes to consolidated financial statements
|
Consolidated Statements of Shareholders' Equity
|
||||||||||||||||
|
Years ended March 31, 2013 and 2012
|
|
Additional
|
||||||||||||||||||||||||||||
|
Common shares
|
paid-in
|
Treasury shares
|
Accumulated
|
|||||||||||||||||||||||||
|
Shares
|
Amount
|
capital
|
Shares
|
Amount
|
deficit
|
Total
|
||||||||||||||||||||||
|
Balances at March 31, 2011
|
1,782,000 | $ | 18,000 | $ | 23,020,000 | (76,000 | ) | $ | (373,000 | ) | $ | (7,600,000 | ) | $ | 15,065,000 | |||||||||||||
|
Purchase of treasury shares
|
- | - | - | (6,000 | ) | (84,000 | ) | - | (84,000 | ) | ||||||||||||||||||
|
Share-based compensation
|
6,000 | - | 88,000 | - | - | - | 88,000 | |||||||||||||||||||||
|
Net income
|
- | - | - | - | - | 3,279,000 | 3,279,000 | |||||||||||||||||||||
|
Balances at March 31, 2012
|
1,788,000 | $ | 18,000 | $ | 23,108,000 | (82,000 | ) | $ | (457,000 | ) | $ | (4,321,000 | ) | $ | 18,348,000 | |||||||||||||
|
Share-based compensation
|
14,000 | - | 170,000 | - | - | - | 170,000 | |||||||||||||||||||||
|
Net income
|
- | - | - | - | - | 1,780,000 | 1,780,000 | |||||||||||||||||||||
|
Balances at March 31, 2013
|
1,802,000 | $ | 18,000 | $ | 23,278,000 | (82,000 | ) | $ | (457,000 | ) | $ | (2,541,000 | ) | $ | 20,298,000 | |||||||||||||
See accompanying notes to consolidated financial statements
|
Consolidated Statements of Cash Flows
|
|
Year ended March 31,
|
||||||||
|
2013
|
2012
|
|||||||
|
Cash flows from operating activities:
|
||||||||
|
Net income
|
$ | 1,780,000 | $ | 3,279,000 | ||||
|
Adjustments to reconcile net income to net cash provided by operating activities:
|
||||||||
|
Depletion and depreciation
|
2,017,000 | 1,116,000 | ||||||
|
Deferred income tax expense
|
240,000 | 412,000 | ||||||
|
Accretion of asset retirement obligation
|
177,000 | 172,000 | ||||||
|
Share-based compensation
|
170,000 | 88,000 | ||||||
|
Amortization of deferred financing costs
|
2,000 | - | ||||||
|
Change in:
|
||||||||
|
Accounts receivable
|
(904,000 | ) | (476,000 | ) | ||||
|
Other current assets
|
(74,000 | ) | (4,000 | ) | ||||
|
Accounts payable and accrued liabilities
|
459,000 | 691,000 | ||||||
|
Net cash provided by operating activities
|
3,867,000 | 5,278,000 | ||||||
|
Cash flows from investing activities:
|
||||||||
|
Oil and gas properties
|
(12,243,000 | ) | (7,687,000 | ) | ||||
|
Proceeds from sale of oil and gas property and equipment
|
- | 5,404,000 | ||||||
|
Purchases of support equipment and other non-current assets
|
(174,000 | ) | (184,000 | ) | ||||
|
Net cash used in investing activities
|
(12,417,000 | ) | (2,467,000 | ) | ||||
|
Cash flows from financing activities:
|
||||||||
|
Borrowings on long term debt
|
4,000,000 | - | ||||||
|
Deferred financing costs
|
(48,000 | ) | - | |||||
|
Purchase of treasury shares
|
- | (84,000 | ) | |||||
|
Net cash provided by (used in) financing activities
|
3,952,000 | (84,000 | ) | |||||
|
Cash and cash equivalents:
|
||||||||
|
Net (decrease) increase in cash and cash equivalents
|
(4,598,000 | ) | 2,727,000 | |||||
|
Cash and cash equivalents, beginning of year
|
6,778,000 | 4,051,000 | ||||||
|
Cash and cash equivalents, end of year
|
$ | 2,180,000 | $ | 6,778,000 | ||||
|
Supplemental disclosure of cash flow information:
|
||||||||
|
Cash paid for interest
|
$ | 15,000 | $ | - | ||||
|
Cash paid for income tax
|
$ | 341,000 | $ | 1,000 | ||||
|
Non-cash:
|
||||||||
|
Increase in oil and gas property due to asset retirement obligation
|
$ | 102,000 | $ | 133,000 | ||||
|
Accrued capital expenditures
|
$ | 1,546,000 | $ | 957,000 | ||||
|
Prepaid capital expenditures
|
$ | 9,000 | $ | 230,000 | ||||
See accompanying notes to consolidated financial statements
|
Notes to Consolidated Financial Statements
|
||||||||||||||||
|
March 31, 2013
|
|
1. Summary of Significant Accounting Policies
|
|
Organization and Nature of Operations. Earthstone Energy, Inc. was originally organized in July 1969 as Basic Earth Science Systems, Inc. and changed its name in 2011 to Earthstone Energy, Inc. The Company is principally engaged in the acquisition, exploration, development, and production of crude oil and natural gas properties, primarily operating in the North Dakota and Montana portions of the Williston basin and south Texas.
|
|
Principles of Consolidation. The consolidated financial statements include the accounts of Earthstone Energy, Inc. and its wholly-owned subsidiary. All significant intercompany accounts and transactions have been eliminated. The Company does not have any unconsolidated special purpose entities.
|
|
At the directive of the Securities and Exchange Commission to use “plain English” in public filings, the Company uses such terms as “we,” “our,” “us” or “the Company” in place of Earthstone Energy, Inc. and its wholly-owned subsidiary. When such terms are used in this manner throughout the notes to the audited consolidated financial statements, they are in reference only to the corporation, Earthstone Energy, Inc. and its subsidiaries, and are not used in reference to the Board of Directors, corporate officers, management, or any individual employee or group of employees.
|
|
Basis of Presentation. The Company prepares its financial statements in accordance with accounting principles generally accepted in the United States of America ("U.S. GAAP").
|
|
Oil and Gas Sales. We derive revenue primarily from the sale of produced natural gas and crude oil. Revenues from production on properties in which the Company shares an economic interest with other owners are recognized on the basis of the Company's interest. Revenues are reported on a gross basis for the amounts received before taking into account production taxes and transportation costs, which are reported as separate expenses. Revenue is recorded and receivables are accrued using the sales method, which occurs in the month production is delivered to the purchaser, at which time ownership of the oil is transferred to the purchaser. Payment is generally received between 30 and 90 days after the date of production. Collection of the revenue may vary depending on the status of wells or the performance of the operator. Estimates of the amount of production delivered to purchasers and the prices at which it was delivered are necessary at year end. Management’s knowledge of the Company’s properties, their historical performance, the anticipated effect of weather conditions during the month of production, NYMEX and local spot market prices, and other factors are the basis for these estimates. Variances between estimates and the actual amounts received are recorded when payment is received, or when better information is available.
|
|
Oil and Gas Reserves. Oil and gas reserves represent theoretical, estimated quantities of crude oil and natural gas which geological and engineering data estimate with reasonable certainty to be recoverable in future years from known reservoirs under existing economic and operating conditions. There are numerous uncertainties inherent in estimating oil and gas reserves and their values, including many factors beyond the Company’s control. Accordingly, reserve estimates are different from the future quantities of oil and gas that are ultimately recovered and the corresponding lifting costs associated with the recovery of these reserves.
|
|
Oil and Gas Property. The Company uses the full cost method of accounting for costs related to its oil and gas property. Accordingly, all costs associated with the acquisition, exploration and development of oil and gas reserves (including the costs of unsuccessful efforts) are capitalized. These costs include land acquisition costs, geological and geophysical expense, carrying charges on non-producing properties, costs of drilling, and overhead charges directly related to acquisition and exploration activities.
|
|
Under the full cost method, no gain or loss is recognized upon the sale or abandonment of oil and gas property unless non-recognition of such gain or loss would significantly alter the relationship between capitalized costs and proved oil and gas reserves.
|
|
Capitalized costs are subject to a ceiling test, as prescribed by Securities and Exchange Commission (“SEC”) regulations, that limits such pooled costs to the aggregate of the present value of future net cash flows attributable to proved oil and gas reserves, less future cash outflows associated with the asset retirement obligation that have been accrued plus the lower of cost or estimated fair value of unproved properties not being amortized less any associated tax effects. Prices are held constant for the productive life of each well. If the full cost pool of capitalized oil and gas property costs exceeds the ceiling, the excess is reflected as a non-cash charge to earnings. The write-down is permanent and not reversible in future periods, even though higher oil and gas prices in the future may subsequently and significantly increase the ceiling amount. As of the balance sheet date, capitalized costs did not exceed the ceiling test limit.
|
|
For the years ended March 31, 2013 and 2012, the oil and natural gas prices used to calculate the full cost ceiling limitation are the 12 month average prices, calculated as the unweighted arithmetic average price of oil and gas on the first day of each month for each of the 12 months prior to the last day of the reporting period (unless prices are defined by contractual arrangements) and net cash flows are discounted at 10 percent.
|
|
Unproved properties are excluded from the ceiling test. Instead, these property costs are periodically reviewed for impairment by reviewing the status of the activity on those properties and surrounding properties either held by us or other parties.
|
|
Capitalized costs of oil and gas property, excluding those pertaining to unproved properties, are depleted on a composite units-of-production method based on estimated proved reserves. For depletion purposes, the volume of reserves and production is converted into a common unit of measure at the energy equivalent conversion rate of six thousand cubic feet of natural gas to one barrel of crude oil. Investments in unproved properties and major development projects are not amortized until proved reserves associated with the projects can be determined or until impairment occurs. If the results of an assessment indicate that the properties are impaired, the amount of the impairment is added to the capitalized costs to be amortized.
|
|
Oil and Gas Production Costs. Costs incurred to operate and maintain wells and related equipment and facilities are expensed as incurred. Production costs (also referred to as lifting costs) include the costs of labor to operate the wells and related equipment and facilities, repairs and maintenance, materials, supplies, and fuel consumed and supplies utilized in operating the wells and related equipment and facilities, property taxes and insurance applicable to proved properties and wells and related equipment and facilities, and severance taxes.
|
|
Asset Retirement Obligation. The Company's activities are subject to various laws and regulations, including legal and contractual obligation to plug, reclaim, remediate, or otherwise restore oil and gas property at the time such asset ceases to be productive. An asset retirement obligation ("ARO") is initially measured at fair value and recorded as a liability with a corresponding asset when incurred if a reasonable estimate of fair value can be made. This is typically when a well is completed or an asset is placed in service. When the ARO is initially recorded, the Company capitalizes the cost by increasing the carrying value of the full cost pool. Over time, the liability increases for the change in its present value (and accretion expense is recorded), while the capitalized cost decreases by way of depletion of the full cost pool. Estimates are reviewed quarterly and adjusted in the period in which new information results in a change of estimate.
|
|
Income Tax. Income taxes are computed using the asset and liability method. Accordingly, deferred tax assets and liabilities are recognized for the future tax consequences attributable to differences between the financial statement carrying amounts of existing assets and liabilities, their respective tax bases as well as the effect of net operating losses, tax credits and tax credit carry-forwards. Deferred tax assets and liabilities are measured using enacted tax rates expected to apply to taxable income in the year in which the differences are expected to be recovered or settled. The effect on deferred tax assets and liabilities of a change in income tax rates is recognized in the results of operations in the period that includes the enactment date.
|
|
No significant uncertain tax positions were identified as of any date on or before March 31, 2013. The Company’s policy is to recognize interest and penalties related to uncertain tax benefits in income tax expense. As of March 31, 2013, the Company has not recognized any interest or penalties related to uncertain tax benefits. For further information, see Note 9 below.
|
|
Earnings Per Share. Basic and diluted earnings per share are computed by dividing net income by the weighted average number of common shares outstanding for the period. As of the balance sheet date, no dilutive securities were outstanding.
|
|
Cash and Cash Equivalents. All highly liquid investments with original maturities of ninety days or less are considered to be cash equivalents. During the period and at the balance sheet date, balances of cash and cash equivalents exceeded the federally insured limit.
|
|
Fair Value Measurements. Financial instruments and nonfinancial assets and liabilities, whether measured on a recurring or non-recurring basis, are recorded at fair value. A fair value hierarchy, established by the Financial Accounting Standards Board, prioritizes the inputs used to measure fair value. The hierarchy gives the highest priority to unadjusted quoted prices in active markets for identical assets or liabilities (Level 1 measurements) and the lowest priority to unobservable inputs (Level 3 measurements).
|
|
The Company’s financial instruments consist of cash and cash equivalents, trade receivables, trade payables and accrued liabilities, all of which are considered to be representative of their fair market value, due to the short-term and highly liquid nature of these instruments.
|
|
As discussed in Note 6, the Company incurred asset retirement obligations of $69,000 and an additional $33,000 related to revisions in estimated liabilities for the year ended March 31, 2013 and asset retirement obligations of $133,000 during the year ended March 31, 2012, the value of which was determined using unobservable pricing inputs (or Level 3 inputs). The Company uses the income valuation technique to estimate the fair value of the obligation using several assumptions and judgments about the ultimate settlement amounts, inflation factors, credit adjusted discount rates, and timing of settlement.
|
|
Hedging Activities. We had no hedging activities in the years ended March 31, 2013 and 2012. Hedging strategies, or absence of hedging, may vary or change due to change of circumstances, unforeseen opportunities, inability to fund margin requirements, lending institution requirements and other events which we are not able to anticipate.
|
|
Support Equipment. Support equipment (including such items as vehicles, well servicing equipment, and office furniture and equipment) is stated at the lower of cost or market. Depreciation of support equipment is computed using primarily the straight-line method over periods ranging from five to seven years.
|
|
Inventory. Inventory, consisting primarily of tubular goods and oil field equipment to be used in future drilling operations or repair operations, is stated at the lower of cost or market, cost being determined by the FIFO method. See also Notes 2 and 3 below.
|
|
Commitments. The Company is committed to $9,880 per month plus maintenance fees on a 7,000 square foot office space located in downtown Denver, Colorado. The lease term ends on April 30, 2016. The Company does not have any off-balance sheet financing transactions, arrangements or obligations.
|
|
Major Customers and Operating Region. The Company operates exclusively within the United States of America. All of the Company's assets are employed in and all of its revenues are derived from the oil and gas industry. Individual external purchasers of 10% or more of the Company’s oil and gas production revenue for the years ended March 31, 2013 and 2012 were as follows:
|
|
2013
|
2012
|
|||||||
|
Valero Energy Corp.
|
17 | % | 20 | % | ||||
|
Plains Marketing LP
|
10 | % | 11 | % | ||||
|
Total
|
27 | % | 31 | % | ||||
|
For the years ended March 31, 2013 and 2012, approximately 65% and 57%, respectively, of Earthstone’s oil and gas revenue was from non-operated properties where the Company has no direct contact with the actual purchaser. On these properties, Earthstone’s portion of the product was marketed by the 26 different companies who operate these wells. These 26 companies may, unbeknownst to us, market to one or more of the same purchasers to whom we sell directly. Therefore, we are unable to ascertain the total extent of combined purchaser concentration. To the extent of our knowledge, in the event of the bankruptcy of any one of these purchasers, it has been estimated that the reduction in annual revenue would be less than 10%. It is not expected that the loss of any one of these purchasers would cause a material adverse impact on the Company’s results from operations, as alternative markets for oil and gas production are readily available.
|
|
Bad Debt Expense. A charge is recognized in general and administrative expenses and an allowance is established against specific receivable balances from joint interest owners in instances where working interest owners dispute amounts billed for their proportionate share in the cost of wells which the Company operates. As individual disputes are resolved, either the expense is reversed in the period of the resolution or the receivable is written down.
|
|
Share-Based Compensation. The Company recognizes all equity-based compensation as share-based compensation expense, included in general and administrative expenses, based on the fair value of the compensation measured at the grant date. The expense is recognized over the vesting period of the grant. See Note 8 below for information.
|
|
Use of Estimates. The preparation of financial statements in conformity with U.S. GAAP requires estimates and assumptions that affect the reported amounts of assets and liabilities at the date of the financial statements and the reported amounts of revenues and expenses during the reporting period. These estimates and assumptions concern matters that are inherently uncertain. Estimates and assumptions are revised periodically and the effects of revisions are reflected in the financial statements in the period it is determined to be necessary. Actual results could differ from those estimates.
|
|
Reclassifications. Certain prior year amounts were reclassified to conform to current presentation. Such reclassifications had no effect on the prior year net income, accumulated deficit, net assets or total shareholders' equity.
|
|
Recent Accounting Pronouncements. In December 2011, the FASB issued ASU 2011-11, Balance Sheet (Topic 210): Disclosures about Offsetting Assets and Liabilities. This ASU requires the Company to disclose both net and gross information about assets and liabilities that have been offset, if any, and the related arrangements. The disclosures under this new guidance are required to be provided retrospectively for all comparative periods presented. The Company is required to implement this guidance effective for the first quarter of fiscal 2014 and does not expect the adoption of ASU 2011-11 to have a material impact on its consolidated financial statements.
|
|
Various other accounting pronouncements have been recently issued, most of which represented technical corrections to the accounting literature or were applicable to specific industries, and are not expected to have a material effect on our financial position, results of operations, or cash flows.
|
|
2. Other Current Assets
|
|
Other current assets as of March 31, 2013 and 2012 consisted of:
|
|
2013
|
2012
|
|||||||
|
|
||||||||
|
Lease and well equipment inventory
|
$ | 371,000 | $ | 412,000 | ||||
|
Drilling and completion cost prepayments
|
210,000 | 230,000 | ||||||
|
Prepaid income tax
|
112,000 | - | ||||||
|
Prepaid insurance premiums
|
88,000 | 73,000 | ||||||
|
Other current assets
|
33,000 | 34,000 | ||||||
|
Total other current assets
|
$ | 814,000 | $ | 749,000 | ||||
|
Lease and well equipment inventory included in other current assets represents well-site production equipment owned by us that has been removed from wells that we operate. This occurs when we plug a well or replace defective, damaged or suspect equipment on a producing well. In this case, salvaged equipment is valued at prevailing market prices, removed from the full cost pool and made available for sale. This equipment is carried on the balance sheet at a value not to exceed the original carrying value established at the time it was placed in inventory. This equipment is intended for resale to third parties at current fair market prices. Sale of this equipment is expected to occur in less than one year. This policy does not preclude us from further transferring serviceable equipment to other wells that we operate, on an as-needed basis.
|
|
Drilling and completion cost prepayments represent cash expenditures advanced by us to outside operators prior to the commencement of drilling and/or completion operations on a well.
|
|
3. Other Non-Current Assets
|
|
Other current non-current assets as of March 31, 2013 and 2012 consisted of:
|
|
2013
|
2012
|
|||||||
|
Support equipment and lease and well equipment inventory
|
$ | 500,000 | $ | 397,000 | ||||
|
Plugging bonds
|
65,000 | 60,000 | ||||||
|
Deferred financing costs
|
46,000 | - | ||||||
|
Total other non-current assets
|
$ | 611,000 | $ | 457,000 | ||||
|
Support equipment represents non-oil and gas property (including such items as vehicles, office furniture and equipment and well servicing equipment) and is stated at the lower of cost or market. Depreciation of support equipment was $66,000 and $51,000 for the years ended March 31, 2013 and 2012, respectively, which was computed using primarily the straight-line method over periods ranging from five to seven years.
|
|
Non-current lease and well equipment inventory, unlike the equipment inventory in other current assets that is held for resale, is intended for use on leases that we operate. This equipment inventory represents well-site production equipment that we own that has either been purchased or has been removed from wells that we operate. When placed in inventory, new equipment is valued at cost and salvaged equipment is valued at prevailing market prices. The inventory is carried at the lower of the original carrying value or fair market value.
|
|
Plugging bonds represent Certificates of Deposit furnished by us to third parties who supply plugging bonds to federal and state agencies where we operate wells. These funds are classified as restricted.
|
|
Deferred financing costs represent fees and expenses incurred in connection with the origination of our credit facility in December, 2012. These costs will be amortized on a straight line basis over the five year term of the facility.
|
|
4. Accrued Liabilities
|
|
Other current liabilities as of March 31, 2013 and 2012 consisted of:
|
|
2013
|
2012
|
|||||||
|
Accrued operations payable
|
$ | 2,933,000 | $ | 1,472,000 | ||||
|
Accrued compensation
|
429,000 | 445,000 | ||||||
|
Short term asset retirement obligation
|
296,000 | 133,000 | ||||||
|
Accrued income tax payable and other
|
213,000 | 393,000 | ||||||
|
Revenue and production taxes payable
|
100,000 | 167,000 | ||||||
|
Total accrued liabilities
|
$ | 3,971,000 | $ | 2,610,000 | ||||
|
5. Long Term Debt
|
|
On December 21, 2012 the Company entered into a $25 million senior secured revolving bank credit facility (the Credit Facility) with the Bank of Oklahoma (the Bank). The initial borrowing base on the Credit Facility is $6 million. The maturity date of the Credit Facility is December 21, 2017 and provides for a borrowing base subject to redetermination semi-annually each June and December and for certain unscheduled redeterminations. The Credit Facility is secured by mortgages on certain Company properties and an assignment of all the proceeds from severed and extracted hydrocarbons from the properties described in the mortgages. Until further notice, the Bank has suspended their right to receive the proceeds directly.
|
|
The Credit Facility contains negative covenants that limit the Company's ability, among other things, to pay any cash dividends, incur additional indebtedness, sell assets, enter into hedging contracts, change the nature of its business or operations, merge, consolidate or make investments. In addition, the Company is required to maintain a ratio of debt to EBITDAX (as defined in the credit agreement) of no greater than 4.0 to 1.0 and a current ratio (as defined in the credit agreement) of no less than 1.0 to 1.0. As of March 31, 2013, the Company was in compliance with all of the financial covenants under the Credit Facility.
|
|
Payments of interest are due quarterly in arrears at prime plus 0.75% to 1.75% or LIBOR plus 1.75% to 2.75%, depending on the Company's level of borrowing and election at the date of borrowing. Commitment fees on the unused amounts of the Credit Facility are due quarterly at rates from 0.35% to 0.50% on the unused amounts of the Credit Facility. At closing, the Company paid a borrowing base fee of $30,000, or 0.5%, on the $6 million borrowing base. These costs have been recorded as deferred financing costs and will be amortized over the term of the note. Additional deferred financing fees in the amount of $18,000 related to legal expenses and other costs to originate the credit facility have been recorded at March 31, 2013. These costs will be amortized over the term on the facility. Amortization of deferred financing fees in the amount of $2,000 were recorded during the year ended March 31, 2013. Additional borrowing base fees may be payable upon future increases in the borrowing base, if any. As of March 31, 2013, the Company had an outstanding balance under the Credit Facility of $4 million. In May 2013, the Company drew $1,000,000 on the Credit Facility, resulting in an outstanding balance of $5,000,000 as of June 2013.
|
|
6. Asset Retirement Obligation
|
|
For the purpose of determining the fair value of the asset retirement obligation incurred during the year ended March 31, 2013, the Company assumed an inflation rate of 4%, an estimated average asset life of 30 years, and a credit adjusted risk free interest rate of 7.73%.
|
|
The following reconciles the value of the asset retirement obligation for the periods presented. This included a short term obligation of $296,000 and $133,000 as of March 31, 2013 and 2012, respectively, which was a component of accrued liabilities on the balance sheets:
|
|
2013
|
2012
|
|||||||
|
Asset retirement obligation, beginning of the year
|
$ | 1,826,000 | $ | 1,922,000 | ||||
|
Liabilities settled
|
- | (401,000 | ) | |||||
|
Liabilities incurred
|
69,000 | 133,000 | ||||||
|
Revisions in estimated liabilities
|
33,000 | - | ||||||
|
Accretion
|
177,000 | 172,000 | ||||||
|
Asset retirement obligation, end of the year
|
2,105,000 | 1,826,000 | ||||||
|
Less current portion
|
(296,000 | ) | (133,000 | ) | ||||
|
Asset retirement obligation, less current portion
|
$ | 1,809,000 | $ | 1,693,000 | ||||
|
7. Commitments
|
|
Office rent expense was approximately $158,000 and $145,000 for the years ended March 31, 2013 and 2012, respectively (including building maintenance charges). The Company is committed to a total of $366,000 for the remaining term on its 7,000 square foot office space located in downtown Denver, Colorado, ending April 30, 2016.
|
|
The Company also has commitments pertaining to software, phone and copy machine maintenance contracts totaling $7,000, $2,000, $1,000 and $1,000 for the years ending March 31, 2014, 2015, 2016 and 2017, respectively.
|
|
8. Shareholders' Equity
|
|
Preferred Shares. The Company has 600,000 shares of authorized preferred stock with a par value of $0.001 available for issuance in such series and preferences as determined by the Board of Directors. Since inception, the Company has not issued any preferred shares.
|
|
Common Shares. The Company has authorized 6,400,000 shares of common stock with a par value of $0.001. The total issued common stock as of March 31, 2013, was 1,802,000 common shares.
|
|
Share-Based Compensation. On March 8, 2007, the Board of Directors adopted a Director Compensation Plan (“the Plan”) allotting up to 50,728 shares of the Company’s common stock to be issued to independent, non-employee directors. In connection with the Plan, an annual stock grant equal to $36,000 is awarded to each independent director. The number of shares included in each grant is calculated based upon the average closing price of the ten trading days preceding each April 1st anniversary date. Shares are subject to certain restrictions and vesting.
|
|
During the year ended March 31, 2013, 4,929 shares of common stock reserved for issuance under the Plan were authorized for issuance. Accordingly, as of March 31, 2013, 10,186 shares of common stock remain available for issuance under the Plan. Grants of shares of restricted stock vest one-third each year over three years. In accordance with the terms of the Plan, if a director’s participation as a member of the Board ceases or is terminated for any reason prior to the date the shares of restricted stock are fully vested, the unvested portion of the restricted stock shall be automatically forfeited and shall revert back to the Company. The aggregate number of restricted stock awards outstanding and subject to vesting at March 31, 2013, for each non-employee director was as follows: Robertson – 4,342 shares; Rodgers – 4,342; and Calerich – 3,071. In addition, each of the three independent directors was granted 2,175 shares of restricted stock on April 1, 2013, subject to vesting and forfeiture. All restricted shares are considered issued and outstanding shares of the Company’s common stock at the grant date and have the same dividend and voting rights as other common stock.
|
|
A summary of the status of the Company’s nonvested shares under the Director Compensation Plan as of March 31, 2013 and 2012, and changes during the years ended on those dates is presented below:
|
|
2013
|
2012
|
|||||||||||||||
|
Weighted
|
Weighted
|
|||||||||||||||
|
Average
|
Average
|
|||||||||||||||
|
Grant
|
Grant
|
|||||||||||||||
|
Date Fair
|
Date Fair
|
|||||||||||||||
|
Shares
|
Value
|
Shares
|
Value
|
|||||||||||||
|
Nonvested shares, beginning of year
|
14,779 | $ | 186,000 | 17,662 | $ | 153,000 | ||||||||||
|
Granted
|
4,929 | 108,000 | 5,601 | 108,000 | ||||||||||||
|
Vested
|
(7,953 | ) | (87,000 | ) | (8,484 | ) | (75,000 | ) | ||||||||
|
Forfeited
|
- | - | - | - | ||||||||||||
|
Nonvested shares, end of year
|
11,755 | $ | 207,000 | 14,779 | $ | 186,000 | ||||||||||
|
As of March 31, 2013, there was $110,000 of total unrecognized compensation cost related to nonvested share-based compensation arrangements granted under the Director Compensation Plan. That cost is expected to be recognized over a weighted-average period of 1.30 years.
|
|
Share-based compensation expense of $100,000 and $88,000 was recognized during the years ended March 31, 2013 and 2012, respectively, for restricted share grants to independent directors.
|
|
The 2011 Equity Incentive Compensation Plan (“the Equity Plan”) was adopted by the Board of Directors on July 14, 2011, subject to the approval of our Stockholders, which was obtained on September 23, 2011, making the Plan effective as of September 23, 2011. The Equity Plan was established to promote our interests and the interests of our Stockholders by encouraging the participants, namely employees, to increase their equity interest in us, thereby giving them an added incentive to work toward the Company’s continued growth and success, all the while enabling us to compete for the services of the individuals needed for our continued growth and success. Awards are in the form of restricted shares of common stock. These awards are subject to such restrictions as the Compensation Committee of the Board of Directors may impose, including vesting and risk of forfeiture.
|
|
The Equity Plan allows up to 150,000 shares of the Company’s common stock to be issued to personnel under the Plan. During the year ended March 31, 2013, 9,027 shares were granted. Subsequent to the grants, 286 shares were forfeited. No shares were granted during the year ended March 31, 2012. Subsequent to March 31, 2013, 5,013 shares have been granted. Accordingly, as of June 13, 2013, 136,246 shares of common stock remain available for issuance under the Equity Plan.
|
|
A summary of the status of the Company’s nonvested shares under the Equity Incentive Compensation Plan as of March 31, 2013 and 2012, and changes during the years ended on those dates is presented below:
|
||||||||||||||||
|
2013
|
2012
|
|||||||||||||||
|
Weighted
|
Weighted
|
|||||||||||||||
|
Average
|
Average
|
|||||||||||||||
|
Grant
|
Grant
|
|||||||||||||||
|
Date Fair
|
Date Fair
|
|||||||||||||||
|
Shares
|
Value
|
Shares
|
Value
|
|||||||||||||
|
Nonvested shares, beginning of year
|
- | $ | - | - | $ | - | ||||||||||
|
Granted
|
9,027 | 155,162 | - | - | ||||||||||||
|
Vested
|
(1,275 | ) | (20,833 | ) | - | - | ||||||||||
|
Forfeited
|
(286 | ) | (6,250 | ) | - | - | ||||||||||
|
Nonvested shares, end of year
|
7,466 | $ | 128,079 | - | $ | - | ||||||||||
|
Share-based compensation expense of $70,000 and $0 was recognized during the years ended March 31, 2013 and 2012, respectively, for restricted share grants to employees.
|
|
As of March 31, 2013, there was $78,000 of total unrecognized compensation cost related to nonvested share-based compensation arrangements granted under the Equity Incentive Compensation Plan. That cost is expected to be recognized over a weighted-average period of 1.36 years.
|
|
Treasury Shares. On October 22, 2008, the Company’s Board of Directors authorized a share buyback program for the Company to repurchase up to 50,000 shares of its common stock for a period of up to 18 months. The program does not require the Company to repurchase any specific number of shares, and the Company may terminate the repurchase program at any time. On November 13, 2009, the Board of Directors increased the number of shares authorized for repurchase to 150,000. On February 10, 2010, the Board extended the termination date of the program from April 22, 2010 to October 22, 2011. Upon plan expiration, the Board again extended the program with a termination date of October 22, 2013. During the year ended March 31, 2013, no shares were purchased under the share buyback program. During the year ended March 31, 2012, 6,156 shares were repurchased under the share buyback program and 103,284 shares remain available for future repurchase. No treasury shares have been retired.
|
|
9. Income Tax
|
|
The provision for income tax for the years ending March 31, 2013 and 2012 is comprised of the following:
|
|
Year Ended March 31,
|
||||||||
|
2013
|
2012
|
|||||||
|
Current:
|
||||||||
|
Federal
|
$ | 40,000 | $ | 215,000 | ||||
|
State
|
22,000 | 25,000 | ||||||
|
Total current income tax
|
62,000 | 240,000 | ||||||
|
Deferred:
|
||||||||
|
Federal
|
226,000 | 382,000 | ||||||
|
State
|
14,000 | 30,000 | ||||||
|
Total deferred income tax
|
240,000 | 412,000 | ||||||
|
Income tax expense
|
$ | 302,000 | $ | 652,000 | ||||
|
A reconciliation between the income tax provision at the statutory rate on income tax and the income tax provision for the years ended March 31, 2013 and 2012 is as follows:
|
||||||||
|
Year Ended March 31,
|
||||||||
|
2013
|
2012
|
|||||||
|
Federal tax at statutory rate
|
$ | 708,000 | $ | 1,336,000 | ||||
|
State taxes, net of federal benefit
|
18,000 | 68,000 | ||||||
|
Excess percentage depletion
|
(415,000 | ) | (486,000 | ) | ||||
|
Changes related to tax return amendments
|
- | (131,000 | ) | |||||
|
Changes in state rates and other adjustments to deferred taxes
|
(9,000 | ) | (135,000 | ) | ||||
|
Income tax expense
|
$ | 302,000 | $ | 652,000 | ||||
|
Effective rate expressed as a percentage of income before income tax
|
14.5 | % | 16.6 | % | ||||
|
The overall effective tax rate expressed as a percentage of book income before income tax for the year ended March 31, 2013 was 14.5%, as compared to the year ended March 31, 2012 when it was 16.6%, was lower due to an over lower state income tax rate resulting from a change in the Company's state apportionment factors. The change in the state apportionment factors relate to the sale of the Company's Colorado oil and gas properties during the year ended March 31, 2012 and the resulting reduction in Colorado oil and gas revenue in the current year.
|
|
|
|
Net income tax payments were $341,000 and $1,000 for the years ended March 31, 2013 and 2012, respectively.
|
|
Net deferred tax assets and liabilities were comprised of:
|
Year Ended March 31,
|
|||||||
|
2013
|
2012
|
|||||||
|
Deferred tax assets:
|
||||||||
|
Statutory depletion carry-forward
|
$ | 1,467,000 | $ | 1,232,000 | ||||
|
Other accruals
|
131,000 | 88,000 | ||||||
|
Allowance for doubtful accounts
|
14,000 | 22,000 | ||||||
|
|
||||||||
|
Gross deferred tax assets
|
1,612,000 | 1,342,000 | ||||||
|
|
||||||||
|
Deferred tax liabilities:
|
||||||||
|
Depreciation, depletion and intangible drilling costs
|
(4,583,000 | ) | (4,073,000 | ) | ||||
|
Gross deferred tax liabilities
|
(4,583,000 | ) | (4,073,000 | ) | ||||
|
Net deferred tax liabilities
|
$ | (2,971,000 | ) | $ | (2,731,000 | ) | ||
|
Projections of future income taxes and their timing require significant estimates with respect to future operating results. Accordingly, deferred taxes may change significantly as more information and data is gathered with respect to such events as changes in commodity prices, their effect on the estimate of oil and gas reserves and the depletion of these long-lived reserves.
|
|
The Company is subject to U.S. federal income tax and income tax from multiple state jurisdictions. The tax years remaining subject to examination by tax authorities are the years ended March 31, 2010 through 2013.
|
|
10. Related Party Transactions
|
|
The Company maintains a policy permitting officers or directors to assign to the Company or receive assignments from the Company in oil and gas prospects, but only on the same terms and conditions as accepted by independent third parties. This policy also allows officers or directors and the Company to participate together in oil and gas prospects generated by independent third parties, but only on the same terms and conditions as accepted by non-related third parties. During the years ended March 31, 2013 and 2012, no director or officer participated with the Company in any new oil and gas transaction. In prior years, Mr. Singleton has participated with the Company in the acquisition of producing properties on the same terms and conditions as other third parties. As such, Mr. Singleton paid for his proportionate share of the acquisition costs at the time of the acquisition. With respect to his working interest in the four producing wells in which he currently has an ownership, as of March 31, 2013, the Company had no accrued balance due to or due from Mr. Singleton. As of March 31, 2012, the Company had an accrued balance due from Mr. Singleton of $1,000 for his share of operating expenses on these wells for which timely payment was subsequently received.
|
|
11. Oil and Gas Properties
|
|
The aggregate amount of capitalized costs related to oil and gas property and the aggregate amount of related accumulated depletion and impairment as of March 31, 2013 and 2012 are as follows:
|
|
2013
|
2012
|
|||||||
|
Proved properties
|
$ | 53,265,000 | $ | 37,112,000 | ||||
|
Unproved properties
|
2,156,000 | 4,409,000 | ||||||
|
Less accumulated depletion and impairment
|
(27,729,000 | ) | (25,778,000 | ) | ||||
|
Total oil and gas properties
|
$ | 27,692,000 | $ | 15,743,000 | ||||
|
On January 31, 2012, we completed the divestiture and sale of the Company’s working and/or override interests in 38 wells in Weld County, Colorado to an unrelated third party for $5,900,000. After customary post-closing adjustments and expenses, the net proceeds from the transaction were $5,400,000. The adjusted purchase price was impacted by commissions, sales costs and post effective date revenue and expense modifications to the purchase price. Under the full cost method, no gain or loss is recognized upon the sale or abandonment of oil and gas property unless non-recognition of such gain or loss would significantly alter the relationship between capitalized costs and proved oil and gas reserves.
|
|
The following shows, by category and year incurred, the oil and gas property costs applicable to unproved property that were excluded from the full cost pool depletion computation as of March 31, 2013:
|
|
Total
|
||||||||||||||||
|
Exploration
|
Development
|
Acquisition
|
Unproved
|
|||||||||||||
|
Costs Incurred During Year Ended
|
Costs
|
Costs
|
Costs
|
Property
|
||||||||||||
|
March 31, 2013
|
$ | - | $ | 341,000 | $ | 247,000 | $ | 588,000 | ||||||||
|
March 31, 2012
|
- | - | 427,000 | 427,000 | ||||||||||||
|
Prior Years
|
- | - | 1,141,000 | 1,141,000 | ||||||||||||
|
Total
|
$ | - | $ | 341,000 | $ | 1,815,000 | $ | 2,156,000 | ||||||||
|
Costs incurred in oil and gas property development, exploration and acquisition activities during the years ended March 31, 2013 and 2012 are summarized as follows:
|
|
2013
|
2012
|
|||||||
|
Development costs
|
$ | 13,077,000 | $ | 7,624,000 | ||||
|
Exploration costs
|
- | - | ||||||
|
Acquisitions:
|
||||||||
|
Proved
|
- | 335,000 | ||||||
|
Unproved
|
823,000 | 798,000 | ||||||
|
Total costs of development, exploration and acquisition activities
|
$ | 13,900,000 | $ | 8,757,000 | ||||
|
12. Subsequent Events
|
|
On May 21, 2013 the Company drew $1,000,000 on it's Credit Facility, resulting in an outstanding balance of $5,000,000 as of June 13, 2013.
|
|
13. Unaudited Oil and Gas Reserves Information
|
|
As of March 31, 2013 and 2012, 100% of the estimated oil and gas reserves presented herein were derived from reports prepared by independent petroleum engineering firm Ryder Scott Company.
|
|
Proved developed reserves are reserves expected to be recovered through existing wells with existing equipment and operating methods. Proved undeveloped reserves are reserves expected to be recovered through wells yet to be completed.
|
|
Analysis of Changes in Proved Reserves. Estimated quantities of proved developed reserves (all of which are located within the United States), as well as the changes in proved developed reserves during the periods indicated, are presented in the following tables:
|
Proved Reserves
|
March 31, 2013
|
March 31, 2012
|
March 31, 2011
|
||||||||||||||||||||||
|
Oil
|
Gas
|
Oil
|
Gas
|
Oil
|
Gas
|
|||||||||||||||||||
|
(Bbls)
|
(Mcf)
|
(Bbls)
|
(Mcf)
|
(Bbls)
|
(Mcf)
|
|||||||||||||||||||
|
Proved Reserves:
|
||||||||||||||||||||||||
|
Balance, beginning of year
|
1,227,000 | 646,000 | 1,015,000 | 735,000 | 818,000 | 912,000 | ||||||||||||||||||
|
Revisions of previous estimates1
|
101,000 | 148,000 | 38,000 | 8,000 | 167,000 | (106,000 | ) | |||||||||||||||||
|
Extensions and discoveries2
|
1,245,000 | 1,936,000 | 295,000 | 351,000 | 62,000 | 39,000 | ||||||||||||||||||
|
Sales of reserves in place
|
- | - | (31,000 | ) | (221,000 | ) | - | - | ||||||||||||||||
|
Improved recovery
|
7,000 | 163,000 | 2,000 | - | 6,000 | 61,000 | ||||||||||||||||||
|
Purchase of reserves
|
- | - | 17,000 | - | 55,000 | 1,000 | ||||||||||||||||||
|
Production3
|
(123,000 | ) | (107,000 | ) | (109,000 | ) | (227,000 | ) | (93,000 | ) | (172,000 | ) | ||||||||||||
|
Balance, end of year
|
2,457,000 | 2,786,000 | 1,227,000 | 646,000 | 1,015,000 | 735,000 | ||||||||||||||||||
|
Proved developed reserves:
|
||||||||||||||||||||||||
|
Balance, beginning of year
|
1,077,000 | 515,000 | 1,015,000 | 735,000 | 727,000 | 912,000 | ||||||||||||||||||
|
Balance, end of year
|
1,388,000 | 1,182,000 | 1,077,000 | 515,000 | 1,015,000 | 735,000 | ||||||||||||||||||
|
Proved undeveloped reserves:
|
||||||||||||||||||||||||
|
Balance, beginning of year
|
150,000 | 131,000 | - | - | 91,000 | - | ||||||||||||||||||
|
Balance, end of year
|
1,069,000 | 1,604,000 | 150,000 | 131,000 | - | - | ||||||||||||||||||
|
1
|
Revisions of Previous Estimates – Estimates reflect an overall steady trend of increases in oil and gas prices since December 2008, when prices reached a 5-year low.
|
|
|
2
|
Extensions and Discoveries – Additions during the year ended March 31, 2013 consisted of 103 wells, 102 in North Dakota and 1 in Louisiana. Extensions and discoveries during the year ended March 31, 2012 were 19 wells, all of which are located in North Dakota. Additions during the year ended March 31, 2011, consisted of eleven new wells – North Dakota (7), Montana (2), Colorado (1) and Texas (1).
|
|
|
3
|
Production – Volumes of oil and gas that were produced were removed from reserves during the year.
|
|
|
The table below sets forth a standardized measure of the estimated discounted future net cash flows attributable to the Company’s proved oil and gas reserves. Estimated future cash inflows were computed by applying the 12 month average price of oil and gas on the first day of each month to the estimated future production of proved oil and gas reserves as of March 31, 2013, 2012, and 2011. The future production and development costs represent the estimated future expenditures to be incurred in producing and developing the proved reserves, assuming continuation of existing economic conditions. Discounting the annual net cash flows at 10% illustrates the impact of timing on these future cash flows.
|
||
Standardized Measure of Estimated Discounted Future Net Cash Flows
|
For the years ended March 31,
|
||||||||||||
|
2013
|
2012
|
2011
|
||||||||||
|
Future cash inflows
|
$ | 217,487,000 | $ | 116,925,000 | $ | 81,053,000 | ||||||
|
Future cash outflows:
|
||||||||||||
|
Production cost
|
(88,280,000 | ) | (53,568,000 | ) | (41,185,000 | ) | ||||||
|
Development cost
|
(28,255,000 | ) | (2,757,000 | ) | - | |||||||
|
Future income tax
|
(25,675,000 | ) | (14,614,000 | ) | (6,545,000 | ) | ||||||
|
Future net cash flows
|
75,277,000 | 45,986,000 | 33,323,000 | |||||||||
|
Adjustment to discount future annual net cash flows at 10%
|
(43,661,000 | ) | (22,803,000 | ) | (15,826,000 | ) | ||||||
|
Standardized measure of discounted future net cash flows
|
$ | 31,616,000 | $ | 23,183,000 | $ | 17,497,000 | ||||||
The following table summaries the principal factors comprising the changes in the standardized measure of estimated discounted net ash flows for each of the years ended March 31, 2013, 2012 and 2011:
Changes in Standardized Measure of Estimated Discounted Future Net Cash Flows
|
For the years ended March 31,
|
||||||||||||
|
2013
|
2012
|
2011
|
||||||||||
|
Standardized measure, beginning of year
|
$ | 23,183,000 | $ | 17,497,000 | $ | 12,514,000 | ||||||
|
Sales of oil and gas, net of production cost
|
(7,514,000 | ) | (8,156,000 | ) | (5,204,000 | ) | ||||||
|
Net change in sales prices, net of production cost
|
(9,091,000 | ) | 5,135,000 | 5,886,000 | ||||||||
|
Discoveries, extensions and improved recoveries, net of future development cost
|
21,075,000 | 10,285,000 | 1,567,000 | |||||||||
|
Change in future development costs
|
- | - | - | |||||||||
|
Development costs incurred during the period that reduced future development cost
|
(2,757,000 | ) | - | - | ||||||||
|
Sales of reserves in place
|
- | (1,761,000 | ) | - | ||||||||
|
Revisions of quantity estimates
|
2,036,000 | 916,000 | 3,806,000 | |||||||||
|
Accretion of discount
|
3,780,000 | 2,113,000 | 1,874,000 | |||||||||
|
Net change in income tax
|
3,320,000 | (3,312,000 | ) | 3,685,000 | ||||||||
|
Purchase of reserves
|
- | 352,000 | 1,408,000 | |||||||||
|
Changes in timing of rates of production
|
(2,416,000 | ) | 114,000 | (8,039,000 | ) | |||||||
|
Standardized measure, end of year
|
$ | 31,616,000 | $ | 23,183,000 | $ | 17,497,000 | ||||||
None.
Disclosure Controls and Procedures
As defined in Rules 13a-15(e) and 15d-15(e) of the Exchange Act, the phrase “disclosure controls and procedures” means controls and other procedures of an issuer that are designed to ensure that information required to be disclosed by the issuer in the reports that it files or submits under the Exchange Act is recorded, processed, summarized and reported, within the time periods specified in the SEC’s rules and forms. Disclosure controls and procedures include controls and procedures designed to ensure that information required to be disclosed by us in reports that we file or submit under the Exchange Act is accumulated and communicated to our management, including our Chief Executive Officer and Interim Chief Financial Officer, as appropriate to allow timely decisions regarding required disclosure.
We conducted an evaluation of the effectiveness of the design and operation of our disclosure controls and procedures as of March 31, 2013. This evaluation was conducted under the supervision and with the participation of management, including our Chief Executive Officer and Interim Chief Financial Officer. Based on this evaluation, our Chief Executive Officer and Interim Chief Financial Officer concluded that, as of March 31, 2013, our disclosure controls and procedures were effective.
Changes in Internal Control Over Financial Reporting
There were no changes in our internal control over financial reporting during our last fiscal quarter that materially affected, or are reasonably likely to materially affect, our internal control over financial reporting.
Management's Annual Report on Internal Control Over Financial Reporting
The management of Earthstone Energy, Inc. is responsible for establishing and maintaining adequate internal control over financial reporting for the Company as defined in Rules 13a-15(f) and 15d-15(f) of the Exchange Act. This system is designed to provide reasonable assurance regarding the reliability of financial reporting and the preparation of financial statements for external purposes in accordance with accounting principles generally accepted in the United States of America.
Our internal control over financial reporting includes those policies and procedures that:
(i) pertain to the maintenance of records that, in reasonable detail, accurately and fairly reflect the transactions and dispositions of the assets of the Company;
(ii) provide reasonable assurance that transactions are recorded as necessary to permit preparation of financial statements in accordance with generally accepted accounting principles, and that receipts and expenditures of the Company are being made only in accordance with authorizations of management and the Directors of the Company; and
(iii) provide reasonable assurance regarding prevention or timely detection of unauthorized acquisition, use, or disposition of the Company's assets that could have a material effect on the financial statements.
Because of its inherent limitations, a system of internal control over financial reporting can provide only reasonable assurance and may not prevent or detect misstatements. Further, because of changes in conditions, effectiveness of internal controls over financial reporting may vary over time.
Under the supervision of, and with the participation of our management, including the Chief Executive Officer and Interim Chief Financial Officer, we conducted an evaluation of the effectiveness of the Company’s internal control over financial reporting based on the framework and criteria established in Internal Control-Integrated Framework, issued by the Committee of Sponsoring Organizations of the Treadway Commission. Based on this evaluation, management concluded that the Company's internal control over financial reporting was effective as of March 31, 2013.
Management’s report was not subject to attestation by the Company’s independent registered public accounting firm pursuant to rules of the Securities and Exchange Commission that permit the Company to provide only management’s report in this Annual Report on Form 10-K. Therefore, this Annual Report on Form 10-K does not include such an attestation.
None.
Information relating to this item will be included in an amendment to this report or in the proxy statement for our 2013 annual shareholders’ meeting and is incorporated by reference in this report.
Information relating to this item will be included in an amendment to this report or in the proxy statement for our 2013 annual shareholders’ meeting and is incorporated by reference in this report.
Information relating to this item will be included in an amendment to this report or in the proxy statement for our 2013 annual shareholders’ meeting and is incorporated by reference in this report.
Information relating to this item will be included in an amendment to this report or in the proxy statement for our 2013 annual shareholders’ meeting and is incorporated by reference in this report.
Information relating to this item will be included in an amendment to this report or in the proxy statement for our 2013 annual shareholders’ meeting and is incorporated by reference in this report.
|
(a)
|
Documents filed as part of this Annual Report on Form 10-K.
|
|
|
(1)
|
Financial Statements
|
|
|
All financial statements as set forth under Item 8 of this report.
|
||
|
(2)
|
Supplementary Financial Statement Schedules
|
|
|
None.
|
||
|
(3)
|
Exhibits
|
|
|
See (b) below.
|
||
|
(b)
|
Exhibits
|
|
|
The following exhibits are filed pursuant to Item 601 of Regulation S-K:
|
||
|
Exhibit No.
|
|
Document
|
|
3(i)a
|
|
Restated Certificate of Incorporation of Earthstone Energy, Inc., effective May 12, 1981, as amended by (i) Certificate of Amendment of Certificate of Incorporation, effective November 20, 1986; (ii) Certificate of Amendment of Certificate of Incorporation, effective July 1, 1996; and (iii) Certificate of Designations of Series A Junior Participating Preferred Stock, effective February 5, 2009, incorporated by reference to Exhibit 3(i) of our Quarterly Report on Form 10-Q for the quarter ended December 31, 2009, filed with the SEC on February 17, 2009.
|
|
3(i)b
|
|
Amended and Restated Certificate of Incorporation as approved by shareholders of the Company at the Company’s 2009 Annual Meeting of Shareholders and the amendments to the Company’s Certificate of Incorporation previously disclosed in the Company’s proxy statement on Schedule 14A filed with the Securities and Exchange Commission on November 5, 2009, incorporated by reference to Exhibit 3(i) on Form 8-K filed with the SEC on March 3, 2010.
|
|
3(i)c
|
|
Certificate of Amendment to Certificate of Incorporation dated December 20, 2010 are incorporated by reference to Exhibit 3(i) on Form 8-K filed with the SEC on January 4, 2011.
|
|
3(ii)a
|
|
Bylaws of Earthstone Energy, Inc., dated July 15, 1986, as amended by First Amendment to Bylaws, dated February 4, 2009, incorporated by reference to Exhibit 3(ii) of our Quarterly Report on Form 10-Q for the quarter ended December 31, 2009, filed with the SEC on February 17, 2009.
|
|
3(ii)b
|
|
Amended and Restated Bylaws reflecting changes made to the Company’s Certificate of Incorporation to remove certain outdated and redundant provisions that existed in our prior Bylaws with respect to corporate governance, shareholder and director meeting procedures, and indemnification procedures. Changes to the Bylaws include, among other things: (i) amendments to reflect the new name of the Company; (ii) expansion of certain provisions with respect to shareholders’ meetings and record dates; (iii) amendments in respect of corporate governance, board committees, and board meetings; (iv) amendments to certain provisions in respect of officers and their duties; (v) amendments to certain provisions in respect of share certificates; and (vi) removal of indemnification provisions are incorporated by reference to Exhibit 3(ii) on Form 8-K filed with the SEC on March 3, 2010.
|
|
3(ii)c
|
|
Amended and Restated Bylaws of Earthstone Energy, Inc., dated February 4, 2009, as amended on November 22, 2011, to add a new Section 2.13 to the Bylaws which indicates that the transfer books and records of the Company will not be closed for any purpose, incorporated by reference to Exhibit 3(ii)c of our Current Report on Form 8-K, filed with the SEC on November 23, 2011.
|
|
4.1
|
|
Rights Agreement, dated February 4, 2009, between Earthstone Energy, Inc. and Corporate Stock Transfer, Inc., incorporated by reference to Exhibit 4.1 of our Current Report on Form 8-K, filed with the SEC on February 5, 2009.
|
|
4.2
|
Specimen Stock Certificate of Earthstone Energy, Inc., incorporated by reference to Exhibit 4.2 of our Annual Report on Form 10-K for the year ended March 31, 2011, filed with the SEC on June 16, 2011..
|
|
|
10.1
|
|
Oil and Gas Incentive Compensation Plan, dated April 1, 1980, as amended, incorporated by reference to our Annual Report on Form 10-K for the year ended March 31, 1985, filed with the SEC.
|
|
10.3
|
|
Performance Bonus Plan, dated effective April 1, 2007, incorporated by reference to Exhibit 10.3 of our Amended 10-K/A, filed with the SEC on October 9, 2009.
|
|
10.4
|
|
Director Compensation Plan, dated effective April 1, 2007, incorporated by reference to Exhibit 10.4 of our Amended 10-K/A, filed with the SEC on October 9, 2009 as amended by board resolution dated March 31, 2010, incorporated by reference to Exhibit 10.4 of our Annual Report on Form 10-K for the year ended March 31, 2010, filed with the SEC on June 18, 2010.
|
|
10.5
|
|
Form of Restricted Stock Agreement pursuant to the Director Compensation Plan, incorporated by reference to Exhibit 10(ii) of the Annual Report on Form 10-KSB for the year ended March 31, 2008, filed with the SEC on July 11, 2008.
|
|
10.6
|
|
Part-Time Employment and Confidentiality Agreement, effective March 31, 2008, between Joseph Young and Earthstone, incorporated by reference to Exhibit 10.6 of our Amended 10-K/A, filed with the SEC on October 9, 2009.
|
|
10.7
|
|
Financial Consulting Agreement, effective March 16, 2011, between QAS, LLC and Earthstone, incorporated by reference to Exhibit 10.7 of our Annual Report on Form 10-K for the year ended March 31, 2011, filed with the SEC on June 16, 2011.
|
|
10.8
|
|
2011 Equity Incentive Compensation Plan, effective September 23, 2011, incorporated by reference to Appendix A, of Schedule 14A, filed with the SEC on July 29, 2011.
|
|
10.9
|
|
Financial Consulting Agreement, effective December 12, 2012, between SJM Financial and Accounting
and Earthstone, incorporated by reference to Exhibit 10.9 of our Annual Report on Form 10-K for the year ended March 31, 2013, filed with the SEC on June 13, 2013.
|
|
14.1
|
|
Code of Business Conduct and Ethics, incorporated by reference to Exhibit 14.1 of our Annual Report on Form 10-KSB/A for the year ended March 31, 2004, filed with the SEC on May 11, 2005.
|
|
21
|
|
Subsidiary List, incorporated by reference to Exhibit 21 of our Amended 10-K/A, filed with the SEC on October 9, 2009.
|
|
|
Certification Pursuant to Section 302 of the Sarbanes-Oxley Act of 2002 (Ray Singleton, President and Chief Executive Officer), filed herewith.
|
|
|
|
Certification Pursuant to Section 302 of the Sarbanes-Oxley Act of 2002 (Paul Maniscalco, Interim Chief Financial Officer), filed herewith.
|
|
|
|
Certification Pursuant to 18 U.S.C. §1350, as Adopted Pursuant to Section 906 of the Sarbanes-Oxley Act of 2002 (Ray Singleton, President and Chief Executive Officer), filed herewith.
|
|
|
|
Certification Pursuant to 18 U.S.C. §1350, as Adopted Pursuant to Section 906 of the Sarbanes-Oxley Act of 2002 (Paul Maniscalco, Interim Chief Financial Officer), filed herewith.
|
|
|
99.1
|
|
Nominating Committee Charter, adopted September 28, 2009, incorporated by reference to Exhibit 99.1 of our Amended 10-K/A, filed with the SEC on October 9, 2009.
|
|
99.2
|
|
Compensation Committee Charter, adopted September 28, 2009, incorporated by reference to Exhibit 99.2 of our Amended 10-K/A, filed with the SEC on October 9, 2009.
|
|
Report of Ryder Scott Company, filed herewith.
|
||
|
101
|
The following materials from the Company’s quarterly report on Form 10-K for the year ended March 31, 2013, formatted in XBRL (Extensible Business Reporting Language): (i) the Consolidated Balance Sheets, (ii) the Consolidated Statements of Operations, (iii) the Consolidated Statements of Shareholders’ Equity, (iv) Consolidated Statements of Cash Flows, and (v) Notes to Consolidated Financial Statements, tagged as blocks of text.
|
In accordance with the requirements of Section 13 or 15(d) of the Securities Exchange Act of 1934, the registrant has duly caused this amendment to be signed on its behalf by the undersigned, thereunto duly authorized by the following in the capacities and on the dates indicated.
EARTHSTONE ENERGY, INC.
|
|
|
|
|
Name and Capacity
|
|
Date
|
|
|
|
|
|
By: /s/ Ray Singleton
|
|
June 13, 2013
|
|
|
|
|
|
Ray Singleton, President and
|
|
|
|
Chief Executive Officer
|
|
|
|
By: /s/ Paul Maniscalco
|
|
June 13, 2013
|
|
|
|
|
|
Paul Maniscalco, Interim Chief Financial Officer
|
|
|
|
|
|
In accordance with the Exchange Act, this report has been signed below by the following persons on behalf of the registrant and in the capacities and on the dates indicated.
|
Name and Capacity
|
|
Date
|
|
|
|
|
|
By: /s/ Ray Singleton
|
|
June 13, 2013
|
|
|
|
|
|
Ray Singleton, Director
|
|
|
|
|
|
|
|
By: /s/ Richard K. Rodgers
|
|
June 13, 2013
|
|
|
|
|
|
Richard K. Rodgers, Director and
|
|
|
|
Compensation Committee Chairman
|
|
|
|
|
|
|
|
By: /s/ Monroe W. Robertson
|
|
June 13, 2013
|
|
|
|
|
|
Monroe W. Robertson, Director and
|
|
|
|
Audit Committee Chairman
|
|
|
|
|
||
|
By: /s/ Andrew P. Calerich
|
June 13, 2013
|
|
|
Andrew P. Calerich, Director
|
49