-
UNITED STATES
SECURITIES AND EXCHANGE COMMISSION
WASHINGTON, D.C. 20549
FORM
ANNUAL REPORT PURSUANT TO SECTION 13 OR 15(d) OF THE SECURITIES EXCHANGE ACT OF 1934 FOR THE FISCAL YEAR ENDED | |
TRANSITION REPORT PURSUANT TO SECTION 13 OR 15(d) OF THE SECURITIES EXCHANGE ACT OF 1934 |
Commission File Number
(Exact name of registrant as specified in its charter)
| ||
(State or other jurisdiction of incorporation or organization) | (IRS Employer Identification No.) | |
(Address of principal executive offices) | (Zip Code) |
Registrant’s telephone number, including area code: (
Securities registered pursuant to Section 12(b) of the Act:
Title of each class | Trading Symbol | Name of each exchange on which registered |
Securities registered pursuant to Section 12(g) of the Act: None
Indicate by check mark if the registrant is a well-known seasoned issuer, as defined in Rule 405 of the Securities Act.
Indicate by check mark if the registrant is not required to file reports pursuant to Section 13 or Section 15(d) of the Act. Yes ◻
Indicate by check mark whether the registrant (1) has filed all reports required to be filed by Section 13 or 15(d) of the Securities Exchange Act of 1934 during the preceding 12 months (or for such shorter period that the registrant was required to file such reports), and (2) has been subject to such filing requirements for the past 90 days.
Indicate by check mark whether the registrant has submitted electronically every Interactive Data File required to be submitted pursuant to Rule 405 of Regulation S-T (§ 232.405 of this chapter) during the preceding 12 months (or for such shorter period that the registrant was required to submit such files).
Indicate by check mark whether the registrant is a large accelerated filer, an accelerated filer, a non-accelerated filer, a smaller reporting company, or an emerging growth company. See the definitions of “large accelerated filer,” “accelerated filer,” “smaller reporting company,” and “emerging growth company” in Rule 12b-2 of the Exchange Act.
Accelerated filer ◻ | |||
Non-accelerated filer ◻ | Smaller reporting company | Emerging growth company |
If an emerging growth company, indicate by check mark if the registrant has elected not to use the extended transition period for complying with any new or revised financial accounting standards provided pursuant to Section 13(a) of the Exchange Act. ◻
Indicate by check mark whether the registrant has filed a report on and attestation to its management’s assessment of the effectiveness of its internal control over financial reporting under Section 404(b) of the Sarbanes-Oxley Act (15 U.S.C. 7262(b)) by the registered public accounting firm that prepared or issued its audit report.
If securities are registered pursuant to Section 12(b) of the Act, indicate by check mark whether the financial statements of the registrant included in the filing reflect the correction of an error to previously issued financial statements. ◻
Indicate by check mark whether any of those error corrections are restatements that required a recovery analysis of incentive-based compensation received by any of the registrant’s executive officers during the relevant recovery period pursuant to §240.10D-1(b). ◻
Indicate by check mark whether the registrant is a shell company (as defined in Rule 12b-2 of the Act). Yes
The aggregate market value of the voting stock held by non-affiliates of the registrant computed by reference to the price at which the common equity was last sold as of June 30, 2022, was approximately $
As of February 21, 2023, Registrant had outstanding
DOCUMENTS INCORPORATED BY REFERENCE
Portions of registrant’s definitive proxy statement referenced in Part III, Items 10 through 14 of this report, to be filed prior to May 1, 2023, are incorporated herein by reference.
STEEL DYNAMICS, INC.
Table of Contents
PART I
Special Note Regarding Forward-Looking Statements
Throughout this report, or in other reports or registration statements filed from time to time with the Securities and Exchange Commission under the Securities Exchange Act of 1934, or under the Securities Act of 1933, as well as in documents we incorporate by reference herein or here from, or in press releases or oral statements made by our officers or Regulation FD authorized representatives, we may make statements that express our opinions, expectations, or projections regarding future events or future results, in contrast with statements that reflect present or historical facts. These predictive statements, which we generally precede or accompany by such typical conditional words as “anticipate,” “intend,” “believe,” “estimate,” “plan,” “seek,” “project” or “expect,” or by the words “may,” “will,” or “should,” are intended to operate as “forward-looking statements” of the kind permitted by the Private Securities Litigation Reform Act of 1995, incorporated in Section 27A of the Securities Act of 1933 and Section 21E of the Securities Exchange Act of 1934. Such forward-looking statements involve both known and unknown risks, uncertainties and other factors that may cause our actual results, performance or achievements to be materially different from any future results, performance or achievements expressed or implied by such forward-looking statements. That legislation protects such predictive and cautionary statements by creating a “safe harbor” from liability in the event that a particular prediction does not turn out as anticipated.
While we always intend to express our best judgment when we make statements about what we believe will occur in the future, and although we base these statements on assumptions that we believe to be reasonable when made, these forward-looking statements are not a guarantee of performance, and you should not place undue reliance on such statements. Forward-looking statements are subject to many uncertainties and other variable circumstances, many of which are outside of our control, that could cause our actual results and experience to differ materially from those we thought would occur.
The following listing represents some, but not necessarily all, of the factors that may cause actual results to differ from those we may have anticipated or predicted:
Global and National Risks
● | domestic and global economic factors including periods of slower than anticipated economic growth and the risk of a recession; |
● | global steelmaking overcapacity and imports of steel into the United States, together with increased scrap prices; |
● | pandemics, epidemics, widespread illness or other health issues, such as COVID-19 or its variants; |
Industry Risks
● | the cyclical nature of the steel industry and some of the industries we serve; |
● | volatility and major fluctuations in prices and availability of scrap metal, scrap substitutes and supplies, and our potential inability to pass higher costs on to our customers; |
● | cost and availability of electricity, natural gas, oil, or other energy resources are subject to volatile market conditions; |
● | increased environmental, greenhouse gas emissions and sustainability considerations or regulations; |
● | compliance with and changes in environmental and remediation requirements; |
1
Operational and Commercial Risks
● | significant price and other forms of competition from other steel and aluminum producers, scrap processors and alternative materials; |
● | availability of an adequate source of supply of scrap for our metals recycling operations; |
● | cybersecurity threats and risks to the security of our sensitive data and information technology; |
● | the implementation of our growth strategy; |
● | litigation and legal compliance; |
● | unexpected equipment downtime or shutdowns; |
● | governmental agencies may refuse to grant or renew some of our licenses and permits required to operate our businesses; |
● | our senior unsecured credit facility contains, and any future financing agreements may contain, restrictive covenants that may limit our flexibility; and |
● | the impact of impairment charges. |
We also refer you to and urge you to carefully read the section entitled Risk Factors at Item 1A of this report to better understand some of the principal risks and uncertainties inherent in our businesses or in owning our securities, as well as the section entitled Management Discussion and Analysis of Financial Condition and Results of Operations at Item 7. You should also review the notes to consolidated financial statements under headings in Note 1. Use of Estimates and in Note 9. Commitments and Contingencies.
Any forward-looking statements which we make in this report, or in any of the documents that are incorporated by reference herein or here from, speak only as of the date of such statement, and we undertake no ongoing obligation to update such statements. Comparisons of results between current and any prior periods are not intended to express any future trends or indications of future performance, unless expressed as such, and should only be viewed as historical data.
2
ITEM 1. BUSINESS
Steel Dynamics, Inc. is one of the largest domestic steel producers and metal recyclers in the United States, based on estimated steelmaking and steel coating capacity of approximately 16 million tons and actual metals recycling volumes as of December 31, 2022, with one of the most diversified product and end market portfolios in the domestic steel industry, combined with meaningful downstream steel fabrication operations. The company’s primary sources of revenue are from the manufacture and sale of steel products, the processing and sale of recycled ferrous and nonferrous metals, and the fabrication and sale of steel joists and deck products.
We refer to our founding principles as our six core strategic pillars. They bring us together with a common focus, and they provide the foundation upon which we operate and grow. Our unique entrepreneurial culture and business model benefit us operationally, financially, and through the responsible use of our resources in diverse economic environments. Innovation in all forms is essential to our success, and our teams focus on how to do things “smarter” within our current operations, as well as how we continue to grow. This means creating solutions for our teammates, customers, suppliers, and other stakeholders. It also includes finding ways to “do business” with fewer resources and less environmental impact. Our six strategic pillars and the team’s execution of them each day has driven our success and sustainability.
● | Health & Safety – Creating and maintaining a safe work environment is the foundation of our decision making. Health and safety are always at the forefront and are a constant topic of conversation across the company. Our goal is zero injuries—no accidents. |
● | Entrepreneurial Culture – Fosters a team of energetic, positive, driven, innovative and diverse individuals by utilizing open communication and meaningful performance-based compensation aligned to our strategic focus. |
● | Customer Commitment – We focus on being a preferred partner of our customers by providing quality products and unique supply chain solutions to meet their current and future needs. |
● | Strategic Sustainable Growth – We focus on strategic growth with intentional margin expansion and consistency through-the-cycle. |
● | Innovation – Through individual creativity and ingenuity, our teams drive innovation to improve safety, quality, productivity, and resource sustainability. We strive to provide unique, superior products, customer supply chain solutions, and next-generation technologies and processes. |
● | Financial Strength – Through our adaptable value-added product diversification, vertically connected businesses model, coupled with our highly variable operating cost structure and performance-based incentive compensation, along with our continued operating innovations and efficiency, we achieve higher utilization and lower costs, which provide strong cash flow generation through both strong and weak market cycles. |
Differentiated Model - Uniquely Steel Dynamics
Competitively advantaged differentiation is core to our long-term value creation strategy. We set ourselves apart in every aspect of our business with a spirit of excellence.
3
Unique Entrepreneurial Culture
Our entrepreneurial culture is at the core of our success and is driven by our extensive performance-based incentive compensation philosophy from those on the plant floor to our senior leadership. Over 60% of a production team member’s total potential compensation is “at risk” to both quality production and cost-effectiveness metrics. Over 85% of our senior leadership team’s total potential compensation is “at risk” to companywide financial performance metrics that encourage long-term value creation, including return on equity, growth, cash generation, and return on invested capital measures. We believe diversity within our teams enhances broad-based thinking, innovation, and value creation. Our common goal of consistently achieving excellence in all we do is reflected in the esprit de corps that permeates our team.
Diversified, Value-Added Product Offerings and Supply-Chain Solutions
We have one of the most diversified, high-margin product offerings within the domestic steel industry. We have a track record of profitable growth, driving diversification in both end markets and value-added product offerings to sustain higher volume and profitability through varying market environments. Over 70% of our steel and steel fabrication sales are considered value-added. Throughout our history and today, we seek to provide unique supply-chain alternatives for our customers to increase efficiency, to reduce time and costs, and to promote decarbonization opportunities. Growing with our customers in this way has proven to be invaluable in creating long-lasting relationships and product development.
The majority of our steelmaking operations are in locations near sustainable sources of scrap metals and near our customer base, allowing us to realize freight savings for inbound scrap as well as for outbound steel products destined for our customers. This also allows us to provide consistent on-time delivery to our customer base with relatively short lead times, further solidifying our customer relationships.
This diversified portfolio of products enables us to access a broad range of markets, serve a large customer base, and helps mitigate our market exposure to any one product or sector, resulting in increased through-cycle steel mill utilization. In addition, our value-added steel product offerings help to balance our exposure to commodity grade products supplied by other steel manufacturers. We will continue to seek additional opportunities and to collaborate with our customers to anticipate their future needs by further expanding our range of products and offerings.
Our Southwest-Sinton Flat Roll Division (Sinton) is a prime example of our internal growth and differentiated business model. This electric arc furnace (EAF) flat roll steel mill has approximately 3.0 million tons of annual steel production capacity, currently including two value-added coating lines comprised of a galvanizing line with annual coating capacity of 550,000 tons with galvalume capability, and a paint line with annual coating capacity of 250,000 tons. We are also currently building four additional value-added flat roll steel coating lines comprised of an additional paint line and galvanizing line located onsite at Sinton and a paint line and galvanizing line at our Heartland Flat Roll Division. These new coating lines are expected to begin operating in the second half of 2023.
As with all our growth initiatives, we seek to competitively differentiate ourselves through service, product capability and quality, and supply-chain solutions. Sinton is a “next-generation” EAF flat roll steel mill, which has the capability to provide higher-strength, tougher grades of flat roll steel for the energy and automotive markets. These ultra-high-strength steel products are not currently readily available from other domestic steel producers. Sinton is adhering to the same sustainability model as our other steelmaking facilities, utilizing state-of-the-art environmental controls and processes to produce high quality sustainable steel. Sinton was fully commissioned during the first half of 2022, and operations have continued to ramp up as the team navigated unexpected challenges related to power and equipment during 2022.
Sinton has significant competitive advantages, including geographic market positioning, power accessibility, competitive freight for the intended customers, proximity to a deep-water port and site constructability. Our Sinton, Texas location allows us to strategically target underserved markets that are largely reliant on imports with long lead times and lower product quality capabilities, providing customers throughout the Southwest United States and Mexico significant freight benefits and shorter lead times allowing them to realize working capital advantages. Six steel
4
customers have located onsite, representing over 1.8 million tons of annual flat roll steel processing and consumption capacity.
Vertically Connected Businesses and Pull-Through Volume Advantage
Our vertically connected businesses contribute to our higher through-cycle steel production and overall profitability. Our internal manufacturing businesses are a significant competitive advantage supporting higher and more stable through-cycle earnings and cash flow generation. Our steel fabrication operations and downstream processing locations use a significant amount of steel in their operations. During weaker steel demand environments, we can source more of their steel needs internally, and during strong steel demand environments, we have optionality to also purchase their steel needs externally. Ultimately, we optimize our companywide profitability and minimize earnings volatility. In 2022, our own steel consuming businesses purchased 1.7 million tons of steel from our steel mills, representing 14% of our total 2022 steel shipments.
A strategic and synergistic relationship also exists between our steel mills and metals recycling operations. Our metals recycling platform is the largest supplier of recycled ferrous scrap to our steel operations. This allows us to manage companywide working capital, as lower scrap volume is required at our steel mills. We are also able to source higher-quality scrap for our steel mills, optimizing cost and quality.
Technically Advanced, Low-Cost, Highly-Efficient Operations
We operate some of the most technically advanced and environmentally responsible steel mills in the world. Our steel mills generate a fraction of the greenhouse gas emissions (GHG) per ton of steel produced as compared to traditional blast furnace steel production and the average global steel industry. Our value-added product diversification, vertically connected businesses, and performance-based incentive compensation programs support our efficient, environmentally responsible, and competitively advantaged footprint. Coupled with our low-cost, highly variable operating cost structure and our continued operating innovation and efficiency, we are one of the most profitable and low-cost domestic steel producers.
Transformational Growth / New Aluminum Flat Roll Mill
In July 2022, we announced our new planned $2.5 billion project to construct and operate a 650,000 metric ton aluminum flat rolled products mill in Columbus, Mississippi, with two supporting satellite recycling aluminum slab centers. Our unique performance-based operating culture, coupled with our experience in successfully constructing and operating cost-effective, highly profitable carbon flat roll steel mills, positions us exceptionally well to execute strategic opportunities and to deliver strong long-term value creation. A significant number of our steel customers are also consumers and processors of aluminum flat rolled products. This investment will allow us to broaden our ability to serve both our existing and new customers by adding high-quality, low-carbon flat rolled aluminum to our product portfolio. The state-of-the-art aluminum flat roll mill will utilize a significant amount of aluminum scrap, and as such is also a complementary extension of the company’s metals recycling platform. The product offering will be supported by various value-added finishing lines, including CASH (continuous annealing solutions heat treating) lines, continuous coating, and various slitting and packaging operations. The rolling mill is currently expected to begin operations in 2025.
Sustainability
Sustainability is a part of our long-term value creation strategy. We are dedicated to our people, our communities and our environment. We are committed to operating our business with the highest integrity and have been since our founding. We only produce steel using EAF technology with recycled ferrous scrap as the primary raw material. EAF steelmaking technology generates a mere fraction of the carbon emissions produced and energy intensity required by traditional blast furnace steelmaking technology. We believe EAF production is currently the steelmaking technology that provides the least environmental impact, is the most cost efficient, and provides the most flexibility, and as such, has been our method of growth. We encourage the use of new technologies and processes to reduce our impact on the environment, including a strategic focus on carbon mitigation.
5
In 2021, we announced that we are taking further action to reduce our environmental footprint through our 2025, 2030, and 2050 goals for GHG emissions reduction and increased renewable energy usage.
We intentionally developed a vertically connected operating model, further strengthening our company. Our metals recycling platform collects and processes scrap from manufacturing and end-of-life items, such as automobiles, appliances, and machinery. This processed scrap is then sold to end-users for reuse, including our EAF steel mills, which produce new steel from the scrapped material. Our steel is then sold to consumers that both further process and manufacture end products. We sell a meaningful amount of steel to our own manufacturing businesses that in turn sell finished products to consumers. Ultimately, when these products reach the end of their useful lives, they can be collected as scrap and used again in our steelmaking operations, creating our circular manufacturing model.
Our growth strategy focuses on increasing through-cycle cash generation and providing growth opportunities for our people, partners, communities, and shareholders, all while keeping the sustainability of resources and carbon impact in focus.
We endeavor for continual improvement in minimizing carbon dioxide emissions, while maintaining compliance with emission limit regulations. We monitor our GHG emissions by regularly reviewing furnace performance and efficiency. We analyze the latest available technologies to also determine whether emissions can be minimized. In 2022, we announced a strategic joint venture, SDI Biocarbon Solutions, LLC. The joint venture plans to construct and operate a biocarbon production facility in Columbus, Mississippi to supply our EAF steel mill with a renewable alternative to fossil fuel carbon using our joint venture partner Aymium’s patented technology. The facility is expected to produce up to 228,000 metric tons per year, resulting in an estimated 35% reduction in our steel mills’ Scope 1 GHG emissions. Operations are planned to begin early 2024.
Experienced Leadership Team / Fosters an Entrepreneurial Culture
Our senior leadership team is highly experienced and has a proven track record in the steel, metals recycling, and steel fabrication industries, as well as in the construction and start-up of new operations. Our leadership objectives are closely aligned with our stakeholders through meaningful stock ownership positions and performance-based incentive compensation programs that are correlated to the company’s profitability and operational performance in relationship to our steel manufacturing peers. We emphasize decentralized operational decision making and responsibility, while continuing to maintain appropriate corporate governance and risk oversight. We reward teamwork, innovation, and operating efficiency, and focus on maintaining the effectiveness of our performance-driven incentive bonus plans that are designed to maximize overall productivity and align the interests of our leadership and teams with our stakeholders.
Name | Age | Position | ||
Mark D. Millett | 63 | Chairman, President and Chief Executive Officer | ||
Theresa E. Wagler | 52 | Executive Vice President, Chief Financial Officer, and Corporate Secretary | ||
Miguel Alvarez | 55 | Senior Vice President, Metals Recycling | ||
Chris A. Graham | 58 | Senior Vice President, Long Products Steel Group | ||
Glenn A. Pushis | 57 | Senior Vice President, Special Projects | ||
Barry T. Schneider | 54 | Senior Vice President, Flat Roll Steel Group | ||
James S. Anderson | 62 | Senior Vice President, Steel Fabrication |
Mark D. Millett co-founded the company in 1993. Mr. Millett has been the Board Chair since May 2021 and has been our President and Chief Executive Officer since January 2012. Prior to that, he held various positions within the company, including President and Chief Operating Officer, Executive Vice President of Metals Recycling and Ferrous Resources, and Executive Vice President of Flat Roll Operations. Mr. Millett was responsible for the design, construction, and start-up operation of all of our steel mills, including our Butler, Indiana flat roll, melting, and casting operations. Mr. Millett currently serves as Chairman of the Steel Manufacturers Association (SMA). During 2019, Mr. Millett was named the recipient of the James F. Collins Achievement in Advocacy Award by the SMA. During 2014 and 2022, Mr. Millet was named Steelmaker of the Year by the Association of Iron and Steel Technology. Mr. Millett earned his bachelor’s degree in metallurgy from the University of Surrey, England.
6
Theresa E. Wagler has been our Executive Vice President, Chief Financial Officer and Corporate Secretary since May 2007. Ms. Wagler joined the Steel Dynamics corporate finance team in 1998, and has held various finance and accounting positions, including Chief Accounting Officer and Vice President and Corporate Controller. She is responsible for and oversees accounting and taxation, treasury, risk management, legal, information technology and cybersecurity, human resources, sustainability strategy, and strategic business development functions, as well as, financial planning and analysis, investor relations, and corporate communications. Ms. Wagler also has various operational responsibilities directly overseeing two operating joint ventures. Prior to joining Steel Dynamics, Ms. Wagler was a certified public accountant with Ernst & Young LLP. She graduated cum laude from Taylor University with a bachelor’s degree in accounting and systems analysis. In addition, Ms. Wagler serves as a director and chair of the audit committee of CF Industries Holdings, Inc., a public company, and also serves as a director for Trine University and for the Metals Service Center Institute.
Miguel Alvarez transitioned to the role of Senior Vice President, Metals Recycling, upon the retirement of Russ B. Rinn (formerly the Executive Vice President, Metals Recycling) in March 2022. In this role, Mr. Alvarez is responsible for OmniSource’s ferrous and nonferrous metals recycling operations including marketing, trading and logistics activities. Prior to this role, Mr. Alvarez served as Senior Vice President, Southwest United States and Mexico, since February 2019. Prior to joining Steel Dynamics, Mr. Alvarez served in leadership positions at BlueScope; this included leading BlueScope’s North American metal buildings business with manufacturing facilities in the United States and Mexico, and being responsible for BlueScope’s only North American electric arc furnace flat roll steel mill as President of North Star BlueScope Steel. Mr. Alvarez earned a bachelor’s degree in industrial engineering and an MBA from Tecnológico de Monterrey, México.
Christopher A. Graham has been our Senior Vice President, Long Products Steel Group, since February 2019. In this role, Mr. Graham is responsible for the company’s four long product steel mills, along with a downstream finishing operation and the company’s copper rod manufacturing facility. Prior to that, Mr. Graham served as Senior Vice President, Downstream Manufacturing and President of New Millennium Building Systems, responsible for the company’s steel fabrication and downstream manufacturing operations, and other operational and leadership roles. Mr. Graham was also a part of the team that constructed the company’s first steel mill in Butler, Indiana, in 1994. Mr. Graham earned a bachelor's degree in business management from Western Governors University and an MBA from the University of Saint Francis.
Glenn A. Pushis has been our Senior Vice President, Special Projects, since February 2019. Mr. Pushis is responsible for the successful design and construction of the company’s newly announced aluminum flat roll mill. From 2019 until 2022, Mr. Pushis was responsible for the successful design and construction of the Southwest-Sinton Flat Roll Division developed to serve the Southwestern United States and Mexico. He has extensive experience in this capacity and has been instrumental in numerous construction projects for Steel Dynamics since its founding. Prior to that, Mr. Pushis served as Senior Vice President, Long Products Steel Group, responsible for the company’s four long product steel mills. Mr. Pushis has been with Steel Dynamics since 1994, holding various operational and leadership roles, including roles within the Engineered Bar Products Division and the Butler Flat Roll Division. He was also part of the team that constructed the company’s first steel mill in Butler, Indiana, in 1994. Mr. Pushis earned a bachelor’s degree in mechanical engineering from Purdue University and his MBA from Indiana University.
Barry T. Schneider has been our Senior Vice President, Flat Roll Steel Group, since March 2016. Mr. Schneider is responsible for the company’s entire flat roll steel operations, including the company’s two flat roll steel mills and numerous flat roll processing, coating, and distribution operations. Before that, Mr. Schneider served in various operational and leadership roles within the company’s steel operations, including our Engineered Bar Products Division and Butler Flat Roll Division. He was also part of the team that constructed the company’s first steel mill in Butler, Indiana, in 1994. Mr. Schneider earned a bachelor's degree in mechanical engineering and a master of science in engineering management from Rose-Hulman Institute of Technology. He also received an Executive Certificate in Technology, Operations, and Value Chain Management from the MIT Sloan School of Management. In addition, Mr. Schneider serves as a director for the Association of Iron & Steel Technology.
James S. Anderson was promoted to our Senior Vice President, Steel Fabrication in March 2022 from his former role as Vice President, Steel Fabrication and President of New Millennium Building Systems, since February 2019. In
7
this role, Mr. Anderson is responsible for the company's steel fabrication operations. Prior to that, Mr. Anderson served as the Chief Operating Officer of New Millennium Building Systems, and was the general manager of The Techs three flat roll galvanizing lines. Mr. Anderson earned a bachelor's degree in metallurgical engineering from Grove City College and an MBA from the University of Pittsburgh.
Human Capital / Valuing People
We value the dedicated people whose passion, innovation, and spirit of excellence have helped successfully grow our company and serve our customers. We have a culture of transparency and trust, fostered through individual empowerment and accountability that drives decision making throughout our business. Our performance-based incentive compensation programs align our people with the interests of our strategic long-term growth and our customers, communities, and shareholders. We know our teams will do what is right and that trust comes from effective communication and transparency. The Steel Dynamics team consisted of approximately 12,060 full-time team members at December 31, 2022.
Health and Safety
Valuing people includes providing a healthy and safe work environment and creating a culture of safety that extends beyond the workplace, into our homes and communities. Safety is and always will be our primary focus and core value. We intend for each individual to arrive at the workplace safely and return home safely each day. This is achievable when we all work together. It requires commitment from leadership and team members at every level to take ownership and responsibility for their safety and the safety of others. Under no circumstance does the desire to maximize production or earnings override the priority of individual safety.
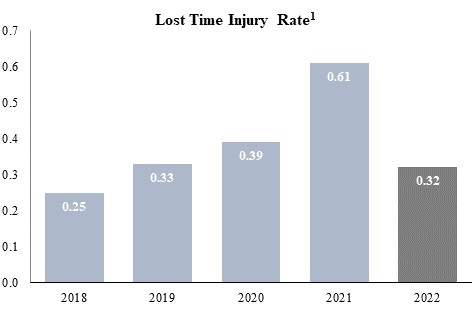
Safety is our first core strategic pillar — it is the foundation of our decision making. Safety is always at the forefront and is discussed regularly across the company, whether led by a team member from the plant floor, a supervisor, or a manager. Leadership is engaged and continuously evaluates where we can improve. We believe having every individual engaged in safety will lead to zero injuries. We are committed to achieving world-class safety performance throughout our operations. This commitment is foundational and integral to our culture. Working as one team, we will achieve it.
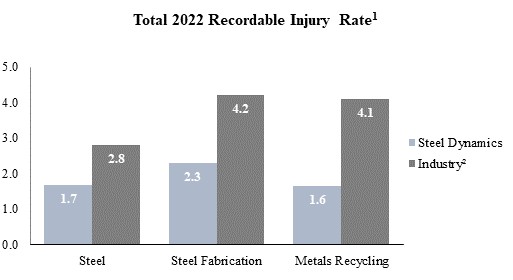
Our total recordable injury rate compared to industry benchmarks and lost time injury rates for 2022 are as follows:
8
1 Total Recordable Injury Rate is defined as OSHA recordable incidents x 200,000 / hours worked. Lost Time Injury Rate is defined as OSHA days away from work cases x 200,000 / hours worked.
2 Source: 2021 U.S. DOL Bureau of Labor Statistics
Compensation Structure
We believe in empowering our teams and rewarding them for their achievements through a four-tiered, performance-based compensation framework. The various components of our compensation programs promote a balance of high-return growth, effective capital investment, low-cost operations, and risk mitigation. By rewarding our teams based on their performance as an individual, as a team, as a company, and based on shareholder interests, we believe we have the ultimate alignment with our external constituents. This is achieved through the following methods:
● | Individual performance awards consist of an individual’s base compensation, which is determined by their individual performance, responsibilities, and skills. |
● | Team performance awards are based on departmental results, rewarding cost effectiveness and quality production. Our performance-based incentive programs reward team members for reducing waste and increasing efficiency, while also producing quality products for our customers. These awards can be well over 100% of base wages, based on strong performance and on the teams doing things that are within their control. |
● | Companywide performance awards unite everyone through our profit-sharing program, which is based on consolidated pretax profitability, and our 401(k) match, which is based on consolidated return on assets. |
● | Alignment with our shareholders and the pursuit of long-term value creation is fostered through the issuance of restricted stock units. Each full-time, non-union, United States-based team member receives annual equity awards. These awards generally have a two-year vesting period, supporting retention and companywide strategy alignment. |
Our team-based culture and competitive pay structure supported continued high retention. In 2022, our overall employee retention was approximately 81%, with domestic and steel operations retention of 87% and 91%, respectively.
9
Our compensation framework helps ensure that we remain strong with best-in-class performance and retain top talent even in economic downturns. We all share in the company’s successes, as well as the challenges.
Talent Development and Educational Opportunities
Our people represent the foundation of our six strategic pillars. Their continued education and talent development are paramount to our success. Our educational assistance and development programs encourage personal growth so individuals can remain current in their areas of responsibility, as well as develop new skills for advancement. Our senior leadership plays a key role in our development programs, linking our culture to critical, proven leadership concepts. As we continue to grow, building talent and creating opportunities within our teams is one of our most important tasks and is critical to our long-term success.
Workplace Philosophy
Our people are the foundation of our success and are our most important resource. Our culture safeguards all people and requires each person to be treated fairly and with dignity. We have equal employment opportunity, no tolerance for harassment of any kind, respect for human rights, inclusion, and diversity – all of which focus on our expectations of treating every person with the utmost respect. Our leadership receives recurring training on these critical topics.
We provide equal employment opportunities to all individuals and applicants. This philosophy of fairness extends to work assignments, opportunities for advancement, compensation, training opportunities, and all other aspects of employment. All job-related considerations are based on merit and ability, without regard to race, color, religion, creed, sex, sexual orientation, gender identity or expression, national origin, genetics, age, marital or veteran status, pregnancy, the presence of handicaps or disabilities, or any other basis protected by law. We provide accommodations as required by applicable laws, including for disabilities and religious beliefs.
We respect human rights, which includes providing safe work environments for our people, providing fair compensation based on job responsibilities and performance, and ensuring all team members meet minimum age requirements and eligible working status to qualify for employment.
We do not tolerate harassment or disrespect of an individual or group for any reason. Harassment of a team member is prohibited, both in the workplace and off the premises. We forbid harassment by any personnel of a customer, vendor, or any other person. Likewise, we prohibit harassment of our teams in any way related to their interactions with customers, vendors, or any other person related to their work responsibilities.
We recognize the value of having a business that reflects diversity of backgrounds and experiences. Our teams and colleagues represent the diversity of the communities where we live and work and our employee population is representative of our industry and communities. We work together as a unified team and respect each other as individuals. Our team-based compensation structure reinforces this philosophy. We strive to create a welcoming, open, and inclusive environment, ensuring the best ideas are heard and valued regardless of the position or the individual. We believe these ideals will continue to drive our success.
Segments
We have three reporting segments: steel operations, metals recycling operations, and steel fabrication operations. Refer to Notes 1 and 13 in the notes to consolidated financial statements in Part II, Item 8 of this Form 10-K for additional segment information.
10
Steel Operations Segment |
Steel operations consist of our EAF steel mills, producing steel from ferrous scrap and scrap substitutes, utilizing continuous casting, automated rolling mills and numerous steel coating and processing lines. Our steel operations sell directly to end-users, steel fabricators, and service centers. These products are used in numerous industry sectors, including the construction, automotive, manufacturing, transportation, heavy and agriculture equipment, and pipe and tube (including OCTG) markets. Our steel operations accounted for 65%, 72% and 74% of our consolidated net sales during 2022, 2021 and 2020, respectively. We currently are predominantly a domestic steel company, with exported sales representing 5% of our steel segment net sales during 2022, and 4% during 2021 and 2020.
Our steel operations consist primarily of steelmaking and numerous coating operations. In 2022, we had approximately 9.4 million tons of flat roll steel annual shipping capacity. We have an additional 2.0 million tons of flat roll steel shipping capacity through The Techs and our Heartland Flat Roll Division, as well as distribution of metallic coated and pre-painted products through United Steel Supply (USS). We have annual flat roll galvanizing capability of 4.7 million tons and painting capability of 1.5 million tons. We also have approximately 4.6 million tons of long product steel capacity at our long products divisions.
Capacities represent manufacturing capabilities based on steel mill configuration and related employee support. These capacities do not represent expected volumes in a given year. In addition, estimates of steel mill capacity are highly dependent on the specific product mix manufactured. Each of our steel mills can and do roll many different types and sizes of products; therefore, our capacity estimates assume a typical product mix.
11
The following chart summarizes our steel operations primary products and the estimated percentage of tons sold by end market:
12
SHEET STEEL PRODUCTS
Our sheet steel products, consisting of hot rolled, cold rolled and coated steel products are currently produced by our Butler, Columbus, and Sinton Flat Roll Divisions, and our numerous downstream coating lines, including The Techs, Heartland Flat Roll Division, and USS (Steel Processing divisions). Our sheet steel operations represented 77%, 73% and 69% of steel operations net sales in 2022, 2021, and 2020, respectively. We produced 8.3 million tons of sheet steel at these facilities in 2022, including Sinton, and 7.6 million tons in 2021 and 2020.
We shipped the following sheet steel products volumes at the following facilities (tons):
2022 | 2021 | 2020 | ||||||
Butler, Columbus, and Sinton | 6,771,141 | 5,868,734 | 5,889,735 | |||||
Flat Roll divisions | ||||||||
Steel Processing divisions | 1,673,967 | 1,653,433 | 1,699,428 | |||||
The following chart summarizes the types of sheet steel products sold by sales dollars, during the respective years, with cold rolled and coated products representing value-added products:
Customers. Steel processors and service centers typically act as intermediaries between primary sheet steel producers and the many end-user manufacturers that require further processing of hot roll coils. The additional processing performed by the intermediate steel processors and service centers include pickling, galvanizing, cutting to length, slitting to size, leveling, blanking, shape correcting, edge rolling, shearing and stamping. We believe that our intermediate steel processor and service center customers will remain an integral part of our customer base. The Columbus and Sinton Flat Roll divisions allow us to capitalize on the industrial markets in the Southern United States and Mexico, as well as further expand our customer base in painted, line pipe and other pipe products. Galvanized flat rolled products produced by our Butler, Columbus, and Sinton Flat Roll divisions are similar and are sold to a similar customer base. The Techs and Heartland Flat Roll Division specialize in the galvanizing of specific types of flat roll steels in primarily non-automotive applications, servicing a variety of customers in the heating, ventilation and air conditioning (HVAC), construction, agriculture and consumer goods markets. USS adds a complementary distribution
13
channel for metallic coated and pre-painted flat roll steel coils to the roll-former market, serving the roofing and siding industry. This connects us to a rapidly growing industry sector with customers that do not historically purchase steel directly from a steel producer. USS provides continued growth to one of our highest-margin flat roll steel products. Our sheet steel operations also provide a substantial portion (51% in 2022) of the sheet steel utilized in our steel fabrication operations.
The following chart summarizes the types of end customers who purchased our sheet steel products, by sales dollars, during the respective years:
LONG PRODUCTS
Our long steel products consist of a wide array of differentiating products produced by our four mills and Vulcan Threaded Products, Inc. (Vulcan), a downstream finishing operation.
Structural and Rail Division produces a variety of parallel flange beams and channel sections, as well as flat bars and large unequal leg angles, and reinforcing bar including custom cut-to-length, smooth bar, and coiled. We also produce standard strength carbon, intermediate alloy hardness, and premium grade rails in 40 to 320 feet length for the railroad industry. Our state-of-the art heat treating system allows us to produce high quality premium rail, which has been certified by all Class I railroads. In addition, our rail-welding facility has the ability to weld (Continuous Welded Rail) in lengths up to 1,600 feet, which offers substantial savings to the railroads both in terms of initial capital cost and through reduced maintenance. We also utilize Structural and Rail Division’s excess capacity to supply our Engineered Bar Products Division with pull-through volume of billets to utilize its excess rolling capacity.
Engineered Bar Products Division produces a broad range of engineered special-bar-quality (SBQ), merchant-bar-quality (MBQ) and other engineered round steel bars. We also have a bar finishing facility, which provides various downstream finishing operations for SBQ steel bars, including turning, polishing, straightening, chamfering, precision saw-cutting, and heat-treating capabilities. Vulcan produces threaded rod product, and cold drawn and heat treated bar, creating strategic pull-through demand to our Engineered Bar Products Division’s special-bar-quality products.
14
Roanoke Bar Division produces merchant products, including channels, angles, flats, merchant rounds, and reinforcing steel bar. Excess steel billet production is sold to mills without sufficient melting capacities, including our Steel of West Virginia facility. Our steel fabrication operations also purchase angles from Roanoke Bar Division.
Steel of West Virginia produces a wide array of specialty shapes and light structural steel and frequently performs fabrication and finishing operations on those products, such as cutting to length, additional straightening, hole punching, shot blasting, welding, galvanizing, and coating. Through this array of products and additional finishing, we create custom finished products that are generally placed directly into our customers’ assembly operations.
We shipped the following long products volumes at each of these facilities (tons):
2022 | 2021 | 2020 | ||||||
Structural and Rail Division | 1,865,405 | 1,933,433 | 1,663,915 | |||||
Rail shipments (included above) | 299,795 | 301,847 | 283,141 | |||||
Engineered Bar Products Division | 894,374 | 809,808 | 630,870 | |||||
Roanoke Bar Division | 589,449 | 595,879 | 505,387 | |||||
Steel of West Virginia | 363,832 | 356,353 | 328,998 |
Customers. The principal customers for our structural steel products are steel service centers, steel fabricators and various manufacturers. Service centers provide key distribution channels for the mills and value-add services to the end-user. A growing number of fabricators and end-users request to source some of their steel products directly from the mill. The steel rail marketplace in the United States, Canada and Mexico is specialized and defined, with eight Class I railroads and a large distribution network.
SBQ products are principally consumed by cold finishers, forgers, intermediate processors, OEM manufacturers, steel service centers, and distributors, as well as pull-through volume to Vulcan. Our MBQ products are sold primarily to steel service centers, as well as reinforcing bar distributors, joist producers (such as our New Millennium Building Systems), and OEMs. Some of the excess steel billet production at the Roanoke Bar Division is sold to mills without sufficient melting capacities, including our Steel of West Virginia facility. Our steel fabrication operations also purchase angles from Roanoke Bar Division. Steel of West Virginia’s customers are primarily OEMs producing solar panel structures, truck trailers, industrial lift trucks, merchant products, guardrail posts, manufactured housing, mining, and off-highway construction equipment. Steel of West Virginia’s flexible manufacturing capabilities enable us to meet demand for a variety of custom-ordered and designed products. Many of these products are produced in small quantities for low volume end-uses resulting in a wide variety of customers, the largest of which are in the truck trailer and industrial lift truck industries.
Steel Operations Segment Competition
The markets in which we conduct business are highly competitive with an abundance of competition in the carbon steel industry from North American and foreign integrated and mini-mill steelmaking and processing operations. We compete in numerous industry sections, most significantly tied to the construction, automotive, and other manufacturing sectors. In many applications within these industry sections, steel competes with other materials, such as aluminum, cement, composites, plastics, carbon fiber, glass and wood. Some of our products are commodities, subject to their own cyclical fluctuations in supply and demand. However, we are focused on providing a broad range of diversified value-added products that de-emphasize commodity steel. The primary competitive influences on products we sell are price, quality and value-added services.
15
Metals Recycling Operations Segment |
Metals Recycling operations include both ferrous and nonferrous scrap metal processing, transportation, marketing, brokerage and scrap management services, strategically located primarily in close proximity to our steel mills and other end-user scrap consumers, throughout the United States, and Central and Northern Mexico. During 2022, we completed the acquisition of ROCA ACERO, S.A. de C.V. (ROCA), following the August 2020 acquisition of Zimmer, S.A. de C.V., both Mexican metals recycling companies, combined to do business as OmniSource Mexico, which is an important part of our raw material procurement strategy for Sinton. Our metals recycling operations accounted for 10%, 12% and 11% of our consolidated net sales during 2022, 2021 and 2020, respectively. Export sales represented 14%, 11% and 10% of metals recycling segment net sales during 2022, 2021 and 2020, respectively.
We shipped the following from our metals recycling operations:
2022 | 2021 | 2020 | ||||||
Ferrous metal total (gross tons) | 5,301,774 | 5,442,478 | 4,591,881 | |||||
Shipments to our steel mills | 3,475,662 | 3,574,668 | 3,184,451 | |||||
Percent of total to our steel mills | 66% | 66% | 69% | |||||
Nonferrous metals (thousands of pounds) | 1,053,852 | 1,093,472 | 977,882 |
We sell various grades of processed ferrous scrap primarily to steel mills and foundries. Ferrous scrap metal is the primary raw material for EAFs, including our steel mills. In addition, we sell various grades of nonferrous metals including copper, brass, aluminum, and stainless steel, to smelters, refineries, alloy manufacturers, specialty mills and other consumers.
We purchase processed and unprocessed ferrous and nonferrous scrap metals, in a variety of forms for our metals recycling facilities.
Ferrous scrap comes from two primary sources:
● | Manufacturing industrial facilities, metal fabrication plants, and machine shops, which generate ferrous scrap referred to as prompt or industrial scrap, and |
● | Scrap dealers, retail individuals, auto wreckers, demolition firms and others who provide steel and iron scrap, referred to as obsolete scrap. Obsolete scrap includes scrap recycled from end-of-life items, such as automobiles, appliances, and machinery. |
Nonferrous scrap comes from three primary sources:
● | Manufacturers and other nonferrous scrap sources, which generate or sell scrap aluminum, copper, stainless steel, and other nonferrous metals, |
● | Producers of items such as electric wire, telecommunication service providers, aerospace, defense and recycling companies that generate nonferrous scrap consisting primarily of copper wire, aluminum beverage cans, and various other metals and alloys, and |
● | Retail transactions conducted with the general public who sell material directly to our facilities, collected from a variety of sources. |
We do not purchase a significant amount of scrap metal from a single source or from a limited number of major sources. Market demand and the composition, quality, size, weight, and location of the materials are the primary factors that determine prices.
16
Products. Our metals recycling operations primarily involve the purchase, processing, and resale of ferrous and nonferrous scrap metals into reusable forms and grades. We process an array of ferrous products through a variety of methods, including sorting, shredding, shearing, cutting, and breaking. Our major ferrous products include heavy melting steel, busheling, bundled scrap, shredded scrap and other scrap metal products, such as steel turnings and cast iron. These products vary in properties or attributes related to cleanness, size of individual pieces, and residual alloys. The necessary characteristics of the ferrous products are determined by the specific needs and requirements of the consumer and affect the individual product’s relative value. We process numerous grades of nonferrous products, including aluminum, brass, copper, stainless steel, and other nonferrous metals. Additionally, we provide transportation logistics (truck, rail, and river barge), marketing, brokerage, and scrap management services, providing competitive price and cost advantages to our suppliers and customers. We design, install, and manage customized scrap management programs for industrial manufacturing companies.
Customers. We sell various grades of processed ferrous scrap to end-users, such as EAF steel mills, integrated steelmakers, foundries, secondary smelters, and metal brokers, who aggregate materials for other large users. Ferrous scrap metal is the primary raw material for EAFs, such as our steel mills. Most of our ferrous scrap customers purchase processed scrap through negotiated spot sales contracts which establish a quantity purchase for the month. The price we charge for ferrous scrap depends upon market demand, composition, quality, size, weight, and transportation costs, as well as the quality and grade of the scrap. We sell various grades of processed nonferrous scrap to end-users such as aluminum sheet and ingot manufacturers, brass and bronze ingot makers, copper refineries, mills, smelters, specialty steelmakers, alloy manufacturers, wire and cable producers, utilities, and telephone networks. The price we charge for nonferrous scrap also depends upon market demand and pricing, transportation costs, as well as the quality and grade of the scrap.
Competition. Scrap is a global commodity influenced by conditions in a number of industrialized and emerging markets throughout Asia, Europe and North America. The markets for scrap metals are highly competitive, both in the purchase of raw or unprocessed scrap, and the sale of processed scrap. With regard to the purchase of unprocessed scrap, we compete with numerous independent recyclers, as well as smaller scrap companies engaged only in collecting obsolete scrap. In many cases, we also purchase unprocessed scrap metal from smaller scrap dealers and other processors. Successful procurement of materials is determined primarily by the price offered by the purchaser for the raw scrap and the proximity of our processing facility to the source of the raw scrap. Both ferrous and nonferrous scrap sell as a commodity in both domestic and international markets, which are affected, sometimes significantly, by relative economic conditions, currency fluctuations, and the availability and cost of transportation. Competition for sales of processed scrap is based primarily on the price, quality, and location of the scrap metals, as well as the level of service provided in terms of reliability and timing of delivery.
We also face potential competition for sales of processed scrap from other producers of steel products, such as EAFs and integrated steel mills, some of which, like us, are also vertically connected in the scrap metals recycling business. In addition, other steel mills may compete with us in attempting to secure scrap supply through direct purchasing from our scrap suppliers. Scrap metal processors also face competition from substitutes for prepared ferrous scrap, such as pig iron, pelletized iron, hot briquetted iron (HBI), direct reduced iron (DRI), and other forms of processed iron.
The industry is highly fragmented with many smaller, regional, national and global companies, which have multiple locations in areas in which our metals recycling operations also operate. No single scrap metals recycler has a significant market share in the domestic market.
17
Steel Fabrication Operations Segment |
Our steel fabrication operations include seven New Millennium Building Systems plants that primarily serve the non-residential construction industry throughout the United States. We have a national operating footprint that allows us to serve the entire domestic non-residential construction market, as well as national accounts, such as large retail chains and e-commerce distribution channels.
Steel fabrication operations accounted for 19%, 10%, and 9% of our consolidated net sales during 2022, 2021 and 2020, respectively. We sold 856,000, 789,000, and 666,000 tons of joist and deck products during 2022, 2021, and 2020, respectively.
Products. Our steel fabrication operations produce steel non-residential building components, including steel joists, trusses, girders, and steel deck. Our joist products include bowstring, arched, scissor, double-pitched and single-pitched joists. Our deck products include a full range of steel decking: roof, form, cellular, composite floor, specialty architectural, floor systems, and bridge deck.
Customers and Markets. Our primary steel fabrication operations customers are non-residential steel fabricators, metal building companies, general construction contractors, developers, owners, brokers, governmental entities, and e-commerce data centers and warehouses. Our customers are located throughout the United States, including national accounts. Our steel fabrication operations maintain approximately one-third of the total domestic steel joist and deck market for bookings, of approximately 2.1 million tons, 3.6 million tons. and 2.4 million tons during 2022, 2021 and 2020, respectively.
Competition. We compete with other North American joist and steel deck producers primarily on the basis of price, quality, customer service, and proximity to the customer. Our national footprint allows us to service the entire domestic non-residential construction market, as well as national accounts such as large retail chains, including their distribution warehouse facilities, and certain specialty deck customers.
18
Other Information |
Sources, Availability, and Cost of Steel and Other Operations’ Raw Materials
Scrap Metals. The principal raw material of our EAF steel operations is recycled ferrous scrap derived from, among other sources, "home scrap”, generated internally at our steel mills themselves; industrial scrap, generated as a by-product of manufacturing; obsolete scrap recycled from end-of-life automobiles, appliances, and machinery, and demolition scrap, recycled from obsolete structures, containers and machines.
Recycled ferrous scrap typically comprises more than 80% of the metallic melt mix in EAF steelmaking, in contrast to integrated mill steelmaking, where the proportion of scrap has traditionally been approximately 25% to 35%. Depending upon the scrap substitute material that may be available from time to time, and the relative cost of such material, the percentage of scrap used in our steelmaking operations could be increased or reduced in our metallic melt mix.
Many variables can impact ferrous scrap prices, all of which reflect the pushes and pulls of the supply demand equation. These factors include the level of domestic steel production (high quality low-residual scrap is a by-product of manufacturing activity), the level of exports of scrap from the United States, and the amount of obsolete scrap recycled. In addition, historical domestic ferrous scrap prices typically have a strong correlation and spread to global pig iron pricing. Generally, as domestic steel demand increases, so does scrap demand and resulting scrap prices. The reverse is also normally, but not always, true with scrap prices following steel prices downward when supply exceeds demand. When scrap prices greatly accelerate, this can challenge one of the principal elements of an EAF based steel mill’s traditional lower cost structure—the cost of its metallic raw material.
Iron Units. In addition to scrap, pig iron, DRI, HBI, and internally sourced liquid pig iron are used in our EAF steel mill production. During 2022, 2021, and 2020 we consumed 12.0 million, 11.0 million, and 10.4 million tons, respectively, of metallic materials in our steelmaking furnaces, of which, iron units other than scrap, represented approximately 13% of the tons in 2022, 2021, and 2020.
Energy Resources
Electricity. Electricity is a significant input required in our EAF steel operations, representing approximately 4% of steel production costs of goods sold in 2022, 2021 and 2020. We have entered into fixed price electricity contracts for the Butler Flat Roll Division, Columbus Flat Roll Division, Roanoke Bar Division and Steel of West Virginia, while our Engineered Bar Products Division has a combination of fixed pricing and market pricing for the various components of the electrical services (demand charge, energy charge, riders, etc.). Our Sinton Flat Roll Division purchases electricity at current market prices. Our Structural and Rail Division purchases electricity at current market prices and through fixed price forward contracts.
Research and Development
Our research and development activities have consisted of efforts to expand, develop and improve our steel products and operating processes, such as our Sinton Flat Roll Division, and our efforts to develop and improve alternative ironmaking technologies. Most of these research and development efforts have been conducted in-house by our employees.
19
Environmental Matters
Our operations are subject to substantial and evolving local, state, and federal environmental, health and safety laws and regulations concerning, among other things, emissions to the air, discharges to surface and ground water and to sewer systems, and the generation, handling, storage, transportation, treatment and disposal of solid and hazardous wastes and secondary materials. Our operations are dependent upon permits regulating discharges into the environment or the use and handling of by-products in order to operate our facilities. We dedicate considerable resources aimed at achieving compliance with federal, state and local laws concerning the environment. While we do not currently believe that our future compliance efforts with such provisions will have a material adverse effect on our results of operations, cash flows or financial condition, this is subject to change in the ever-evolving regulatory environment in which we operate.
Since the interpretation and enforcement of environmental laws and regulations that may be enacted from time to time are subject to changing social or political pressures, our environmental capital expenditures and costs for environmental compliance may increase in the future. In addition, due to the possibility of unanticipated regulatory or other developments, the amount and timing of future environmental expenditures may vary substantially from those currently anticipated. The cost of current and future environmental compliance may also place our operations at a competitive disadvantage with respect to foreign producers, which may not be required to undertake equivalent costs in their operations.
Pursuant to the Resource Conservation and Recovery Act (RCRA), which governs the treatment, handling and disposal of solid and hazardous wastes, the United States Environmental Protection Agency (United States EPA) and authorized state or local environmental agencies may conduct inspections to identify alleged violations or areas where there may have been releases of solid or hazardous constituents into the environment and require the facilities to pay penalties and/or take corrective action to address any such releases. RCRA also allows citizens in certain situations to bring suits against regulated facilities for potential damages and cleanup. Many of our facilities generate wastes subject to RCRA. Our operations produce various by-products, some of which, for example EAF dust, are often categorized as hazardous waste, requiring special handling for disposal or for the recovery of metallics. We collect by-products in pollution control equipment such as baghouses, and then recycle or appropriately dispose of the by-products. While we cannot predict the future actions of the regulators or other interested parties, the potential exists for required corrective action, the costs of which could be substantial.
Under the Comprehensive Environmental Response, Compensation and Liability Act, known as CERCLA or Superfund, the United States EPA, state agencies and, in some instances, private parties have the authority to impose joint and several liability for the remediation of contaminated properties upon generators of hazardous substances, current and former site owners and operators, transporters and other potentially responsible parties, regardless of fault or the legality of the original disposal activity. Many states have statutes and regulatory authorities similar to CERCLA that can also apply. We have a number of material handling agreements with various contractors to properly dispose of or recycle our EAF dust and certain other by-products of our operations. However, we cannot assure that, even if there has been no fault by us, we may not still be cited as a hazardous substances generator by reason of an environmental cleanup at one of our facilities or a site to which our by-products were transported.
The Clean Water Act and similar state and local laws apply to aspects of our operations and impose regulatory restrictions related to the discharge of wastewater, storm water and dredged or fill material. The United States EPA, state agencies and, in certain instances, private parties have the ability to bring suit alleging violations and seeking penalties and injunctive relief. The Clean Water Act’s provisions can also require new or expanded water treatment investments to be made and can limit or even prohibit certain current or planned activities at our operations.
The Clean Air Act and analogous state and local laws require many of our facilities to obtain and maintain air permits in order to operate. Air permits can impose new or expanded obligations to limit or prevent current or future emissions and to add costly pollution control equipment. Enforcement for alleged violations can be brought by the United States EPA, state agencies, and in certain instances private parties, and can result in penalties and injunctive relief.
20
In addition, there are a number of other environmental, health and safety laws and regulations that apply to our facilities and may affect our operations. By way of example and not of limitation, certain portions of the federal Toxic Substances Control Act, Oil Pollution Act, Safe Drinking Water Act and Emergency Planning and Community Right-to-Know Act, as well as state and local laws and regulations implemented by the regulatory agencies, apply to aspects of our facilities’ operations. Our current and planned operations in Mexico are similarly subject to federal, state and local environmental requirements applicable to those operations. In some instances, we may also be subject to other foreign governments’ regulations and international treaties and laws. Many of these laws allow both the governments and citizens in certain situations to bring suits against regulated facilities for alleged environmental violations. Finally, our operations could in certain situations be subject to toxic tort suits brought by citizens or other third parties alleging causes of action such as nuisance, negligence, trespass, infliction of emotional distress, or other claims alleging personal injury, property damage, or other harms.
Available Information
Our internet website address is www.steeldynamics.com. We make available on our internet website, under "Investors,” free of charge, as soon as reasonably practicable after such materials are electronically filed with, or furnished to, the Securities and Exchange Commission, our Annual Report on Form 10-K, Quarterly Reports on Form 10-Q, Current Reports on Form 8-K and amendments to those reports, as well as press releases, ownership reports pursuant to Section 16(a) of the Securities Act of 1933, our Code of Ethics for Principal Executive Officers and Senior Financial Officers, our Code of Business Conduct and Ethics, and any amendments thereto or waivers thereof, as well as our Audit, Compensation, and Corporate Governance and Nominating Committee Charters. The contents of our or any other website are not incorporated into this report.
21
ITEM 1A. RISK FACTORS
Many factors may have an effect on our business, results of operations, financial condition and cash flows. We are subject to various risks resulting from changing economic, environmental, regulatory, political, industry, business and financial conditions. The factors described below are some of the risks that could materially negatively impact us.
Global and National Risks Related to our Business
Our industry, as well as the industries of many of our customers and suppliers upon whom we are dependent, is affected by domestic and global economic factors including periods of slower than anticipated economic growth and the risk of a recession.
Our financial results are substantially dependent not only upon overall economic conditions in the United States and globally, including North America, Europe and in Asia, but also as they may affect one or more of the industries upon which we depend for the sale of our products. Global or domestic actions or conditions, including political actions, trade policies or restrictions, such as the United States-Mexico-Canada Agreement (USMCA), proposed or actual changes in tax laws, such as those introduced, proposed or actual regulation, such as those related to the environment, increasing interest rates, terrorism, acts of war or hostility, natural disasters, or pandemics, epidemics, widespread illness or other health issues, such as COVID-19 or its variants, could result in changing economic conditions in the United States and globally, disruptions to or slowdowns in our business, our supply chain, or our global or domestic industry, or those of our customers or suppliers upon whom we are dependent. Additionally, periods of slower than anticipated economic growth could reduce customer confidence and adversely affect demand for our products and further adversely affect our business, results of operations, financial condition and cash flows. Metals industries have historically been vulnerable to significant declines in consumption and product pricing during periods of economic downturn or continued uncertainty, including the pace of domestic non-residential construction activity.
Our business is also dependent upon certain industries, such as construction, automotive, manufacturing, transportation, heavy and agriculture equipment, and pipe and tube (including OCTG) markets, and these industries are also cyclical in nature and have recently experienced supply chain disruptions. Therefore, these industries may experience their own fluctuations in demand for our products based on such things as economic conditions, interest rates, supply chain disruptions, raw material and energy costs, consumer demand, the rate of inflation and infrastructure funding decisions by governments. Many of these factors are beyond our control. As a result of volatility in our industry or in the industries we serve, we may have difficulty increasing or maintaining our level of sales or profitability. A downturn in our industry or the industries we serve may adversely affect our business, results of operations, financial condition and cash flows.
A prospective decline in consumer and business confidence and spending, which is often coupled with reductions in the availability of credit or increased cost of credit and interest rates, as well as volatility in the capital and credit markets, may adversely affect the business and economic environment in which we operate and the profitability of our business. We are also exposed to risks associated with the creditworthiness of our customers and suppliers, which during times of increased interest rates can be intensified. If the availability of credit to fund or support the continuation and expansion of our customers’ business operations is curtailed or if the cost of that credit is increased, the resulting inability of our customers or of their customers to either access credit or absorb the increased cost of that credit may adversely affect our business by reducing our sales or by increasing our exposure to losses from uncollectible customer accounts. A disruption of the credit markets could also result in financial instability of some of our customers and suppliers. The consequences of such adverse effects could include the interruption of production at the facilities of our customers, the reduction, delay or cancellation of customer orders, delays or interruptions of the supply of raw materials we purchase, and bankruptcy of customers, suppliers or other creditors. Any of these events may adversely affect our business, results of operations, financial condition and cash flows.
22
Global steelmaking overcapacity and imports of steel into the United States may adversely affect United States steel prices, which, together with increased scrap prices, may adversely affect our business, results of operations, financial condition and cash flows.
Global steelmaking capacity currently exceeds global consumption of steel products, which adversely affects United States and global steel prices. Such excess capacity sometimes results in steel manufacturers in certain countries exporting steel and steel products, including pre-fabricated long product steel, at prices that are lower than prevailing domestic prices, and sometimes at or below their cost of production. Excessive imports of steel and steel products, including pre-fabricated steel, into the United States, may exert downward pressure on United States steel and steel products prices, which adversely affects our business, results of operations, financial condition and cash flows. Fluctuations in the value of the dollar can also affect imports, as a strong United States dollar makes imported products less expensive, potentially resulting in more imports of steel products into the United States by our foreign competitors. Furthermore, recent additions of domestic steel capacity as well as anticipated additional domestic steel capacity could increase this global overcapacity. This, in turn, has led to and may further lead to increased domestic demand for ferrous scrap resulting in increased scrap prices. Our results of operations, financial condition and cash flows are driven primarily from the metal spread achieved from the price we sell steel and steel products compared to the price of our metallic raw materials, including scrap. During prolonged periods of steel and steel products overcapacity, leading to lower selling prices, combined with high demand for scrap and raw materials, leading to higher buying prices, our metal spreads could be compressed, which may adversely affect our business, results of operations, financial condition and cash flows.
United States steel producers compete with many foreign producers, including those in China, Vietnam and other Asian and European countries. Competition from foreign producers is typically strong and is periodically exacerbated by weakening of the economies of certain foreign steelmaking countries, at times due to imports of steel involving dumping and subsidy abuses by foreign steel producers. Some foreign steel producers are owned, controlled or subsidized by foreign governments. As a result, decisions by these producers with respect to their production, sales and pricing are sometimes influenced to a greater degree by political and economic policy considerations than by prevailing market conditions, realities of the marketplace or consideration of profit or loss. Additionally, low iron ore prices, resulting in disruption of the scrap price correlation to iron ore, leads to reduced global costs to produce steel, further depressing steel import prices. A higher volume of steel imports into the United States tends to occur at depressed prices when foreign steelmaking countries experience periods of economic difficulty, decreased demand for steel products or excess capacity. The global steelmaking overcapacity is exacerbated by Chinese steel production capacity that far exceeds that country’s demand and has made China a major global exporter of steel, resulting in weakened global steel pricing than otherwise would be expected. While measures to curb unfair trade such as tariffs, duties or quotas, and the renegotiation of trade agreements with other countries, including the USMCA, have decreased the volume of steel and steel products imports, domestic steel and steel products prices remain negatively impacted by excessive imports of steel and steel products. Should current tariffs, duties or quotas expire or be relaxed, repealed or circumvented by importers of steel and steel products, or should trade agreements be renegotiated, downward pressure may be exerted on United States steel and steel products prices, which may adversely affect our business, results of operations, financial condition and cash flows.
Pandemics, epidemics, widespread illness or other health issues, such as COVID-19 or its variants, may adversely affect our business, results of operations, financial condition, cash flows, liquidity, and stock price.
Pandemics, epidemics, widespread illness or other health issues, such as a resurgence of COVID-19 or its variants, may adversely affect our business, results of operations, financial condition, cash flows, liquidity and stock price. Government actions globally, including United States federal and state governmental actions, related to COVID-19 and its variants have impacted and may further impact demand for our products, our supply chain, and our employees. The response to COVID-19 has adversely affected and may continue to adversely affect us and the economy generally, as a result of, among other things, labor shortages, supply chain disruptions, inflation and rising interest rates.
23
Additionally, while our operations have not been curtailed, virus variants that are more contagious or more severe could reduce demand for our products and thus, reduce the productivity of our operations and adversely affect our business, results of operations, financial condition and cash flows. We or certain of our customers and suppliers have and may continue to experience supply chain disruptions, which may adversely affect our operations. Reduced demand for our products or raw material supply availability due to shutdowns or slowdowns in businesses may further adversely affect our volumes and margins, results of operations, financial condition and cash flows.
Industry Risks Related to our Business
Our level of production and our sales and earnings are subject to significant fluctuations as a result of the cyclical nature of the steel industry and some of the industries we serve.
The steel manufacturing business is cyclical in nature, and the selling price of the steel we make may fluctuate significantly due to many factors beyond our control. Furthermore, a number of our products are commodities, subject to their own cyclical fluctuations in supply and demand in both metal consuming and metal generating industries, including the construction and manufacturing industries. The timing, magnitude and duration of these cycles and the resulting price fluctuations are difficult to predict. The sale of our manufactured steel products is directly affected by demand for our products in other cyclical industries, such as construction, automotive, manufacturing, transportation, heavy and agriculture equipment, and pipe and tube (including OCTG) markets. Economic difficulties, stagnant or slow global economies, supply/demand imbalances, supply chain disruptions, periods of heightened inflation or increased interest rates, and currency fluctuations in the United States or globally may decrease the demand for our products or increase the amount of imports of steel into the United States, which may decrease our sales, margins and profitability.
Volatility and major fluctuations in prices and availability of scrap metal, scrap substitutes, and supplies, and our potential inability to pass higher costs on to our customers, may constrain operating levels and reduce profit margins.
Steel producers require large amounts of raw materials, including ferrous scrap metal and scrap substitute products such as pig iron, pelletized iron and other supplies such as zinc, graphite electrodes and ferroalloys. The principal raw material of our EAF steel operations is recycled ferrous scrap derived from, among other sources, “home scrap”, generated internally at steel mills themselves, industrial scrap, generated as a by-product of manufacturing, obsolete scrap, recycled from end-of-life automobiles, appliances, and machinery, and demolition scrap, recycled from obsolete structures, containers and machines. The prices for scrap are subject to market forces largely beyond our control, including demand by United States and foreign steel producers of which there has been recent capacity additions and expected further additions, freight costs and speculation. The scrap metal recycling industry has historically been, and is expected to remain, highly cyclical and the prices for scrap have varied significantly in the past, may vary significantly in the future and do not necessarily fluctuate in tandem with the price of steel. Moreover, some of our integrated steel producer competitors are not as dependent as we are on ferrous scrap as a part of their raw material melt mix, which, during periods of high scrap costs relative to the cost of blast furnace iron used by the integrated producers, give them a raw material cost advantage over EAF mills. However, given environmental considerations of investors, customers and regulators, additional EAF mills may be constructed, leading to increased demand in ferrous scrap possibly resulting in higher scrap prices. While our vertical integration into the metals recycling business and our liquid pig-iron operations are expected to enable us to continue being a cost-effective supplier to our own steelmaking operations, for some of our metallics requirements, we still rely on other metallics and raw material suppliers, as well as upon general industry supply conditions for the balance of our needs.
The availability and prices of raw materials and supplies, particularly those with positive environmental attributes, may also be negatively affected by new, existing, or changing laws, regulations, sanctions or embargoes, including those that may impose output limitations or higher costs associated with climate change or GHG allocation by suppliers, interruptions in production, accidents or natural disasters, changes in exchange rates, global price fluctuations, the availability and cost of transportation, and competing uses, all of which may be heighted during times of war or hostilities, including those occurring in Eastern Europe as it relates to global pig iron supply. As a major producer of galvanized steel products, we purchase and consume a large amount of zinc, which if purchased at high prices, may adversely affect our profit margins. Any inability to secure a consistent, cost-effective and timely supply of our raw materials and supplies may adversely affect our business, financial condition, results of operations and cash flows.
24
Additionally, our inability to pass on all or any substantial part of any cost increases, whether due to positive environmental attributes, inflation, supply and demand imbalances, or otherwise, or to provide for our customers’ needs because of the potential unavailability of raw materials, supplies or required environmental attributes, may result in production slowdowns or curtailments or may otherwise adversely affect our business, financial condition, results of operations and cash flows.
The cost and availability of electricity, natural gas, oil and other energy resources are subject to volatile market conditions.
We consume large amounts of energy to melt scrap, reheat semi-finished products for rolling into finished products and perform other steps necessary to our production process. We rely on third parties for the supply of energy resources we require in our production activities. The prices for and availability of electricity, natural gas, oil and other energy resources, including renewable or other clean energy sources, are subject to regulation and volatile market conditions, often affected by weather conditions as well as political, environmental and economic factors beyond our control. As large consumers of electricity and natural gas, we must have dependable delivery in order to operate. Accordingly, we are at risk in the event of an energy disruption, including power outages, power unavailability or inability to obtain power with sufficient desired environmental attributes. Prolonged blackouts or curtailments or disruptions caused by natural disasters or by political or environmental considerations would substantially disrupt our production. Since a significant portion of our finished products are delivered by truck, unforeseen fluctuations in the price of fuel would also adversely affect our costs or the costs of many of our customers.
Increased environmental, GHG emissions and sustainability considerations from our customers or related regulations could affect demand for our products and add significant costs.
Customers, investors and regulators have increased their focus on the environment, GHG emissions and sustainability. We are committed to the environment and sustainability. In 2021, we announced that we are taking further action to reduce our environmental footprint through our 2025, 2030, and 2050 goals for GHG emission reduction and increased renewable energy usage. We believe that achievement of these goals will comport with expectations of our customers and investors, but certain customers and investors may have differing requirements. To achieve these goals, our operational costs may increase and we have had and will continue to have additional capital expenditures, some of which we may not be able to pass along to our customers. Any failure to timely meet these goals, or other requirements of customers or investors, may have an adverse effect on our business, results of operations and stock price.
Additionally, governmental agencies, regulators, investors or other groups may introduce, request or require environmental monitoring, disclosures or regulations in response to the potential impacts of climate change. International treaties or agreements may also result in increasing regulation of GHG emissions, including the introduction of carbon emissions limitations or trading mechanisms. Any such regulation or disclosure requirement could impose significant costs on our operations and on the operations of our customers and suppliers, including increased energy, capital equipment, emissions controls, environmental monitoring and reporting and other costs in order to comply with current or future laws, regulations or demands concerning the environment, climate change, GHG emissions and sustainability. Any adopted future regulations could negatively impact our ability, and that of our customers and suppliers, to compete with companies situated in areas not subject to or not complying with such limitations, or could affect our environmental disclosures for any allowances, offsets or credits. We may see an increase in costs relating to our assets that emit GHGs as a result of these initiatives, which may impact our operations directly or through our customers and suppliers. Until the timing, scope and extent of any future regulation becomes known, we cannot predict the effect on our financial condition, operating performance and ability to compete.
Compliance with and changes in environmental and remediation requirements may result in substantially increased capital requirements and operating costs.
Existing laws or regulations, as currently interpreted or as may be interpreted in the future, as well as future laws or regulations, may adversely affect our results of operations and financial condition.
25
We are subject to numerous local, state, federal and international statutory and regulatory environmental requirements relating to, among other things:
●the generation, storage, treatment, handling and disposal of solid and hazardous waste and secondary materials;
● | the discharge of materials into the air, including periodic changes to the National Ambient Air Quality Standards and to emission standards; |
●the management, treatment and discharge of wastewater and storm water;
●the use and treatment of groundwater;
●the remediation of soil and groundwater contamination;
●climate change legislation or regulation;
●the need for and the ability to timely obtain air, water or other environmental permits;
●the timely reporting of certain chemical usage, content, storage and releases;
●the remediation and reclamation of land used in our operations;
●natural resource protections; and
●the protection of our employees’ health and safety.
Compliance with environmental laws and regulations, which affect our EAF steelmaking, metals recycling, liquid pig-iron, and copper and aluminum production operations, is a significant factor in our business. We are required to obtain and comply with environmental permits and licenses, and failure to obtain or renew or the violation of any permit or license may result in substantial fines and penalties, capital expenditures, operational changes, suspension of operations and/or the closure of a subject facility. Similarly, delays, increased costs and/or the imposition of onerous conditions to the securing or renewal of permits may adversely affect these operations.
Uncertainty regarding adequate pollution control levels, testing and sampling procedures, and new pollution control technology are factors that may increase our future compliance expenditures. We are unable to predict the ultimate cost of future compliance with environmental requirements or their effect on our operations. Although we strive to be in substantial compliance with all applicable laws and regulations, legal requirements frequently change and are subject to interpretation such that regulatory agencies may bring enforcement actions for alleged noncompliance. Private parties might also bring claims against us under citizen suit provisions and/or for property damage or personal injury allegedly resulting from our operations. New laws, regulations and changing interpretations by regulatory authorities, together with uncertainty regarding the application of existing requirements, are among the factors that may increase our future expenditures to comply with environmental requirements. The cost of complying with existing laws or regulations as currently interpreted or reinterpreted in the future, or with future laws or regulations, may adversely affect our results of operations and financial condition.
Our operations produce significant amounts of by-products, some of which are handled as solid or hazardous waste or as hazardous secondary materials. For example, our steel mills generate EAF dust, which the United States Environmental Protection Agency (United States EPA) and other regulatory authorities classify as hazardous waste and regulate accordingly unless recycled in an exempt manner.
In addition, the feed materials for the shredders operated by our metals recycling operations include automobile bodies. A portion of the feed materials consist of currently unrecyclable material known as shredder residue. If laws or regulations or the interpretation of the laws or regulations change with regard to EAF dust or shredder residue or other by-products created by our operations, we may incur significant additional expenditures.
26
Federal and state environmental laws enable federal and state agencies and certain private parties to recover from owners, operators, generators and transporters the cost of investigation and cleanup of sites at which wastes or hazardous substances were disposed and/or migrated. In connection with these laws, we may be required to clean up contamination discovered at our sites including contamination that may have been caused by former owners or operators of the sites, to conduct additional cleanup at sites that have already had some cleanup performed, to address emerging and newly-regulated contaminants such as per- and polyfluoroalkyl substances (PFAS) and 1,4-dioxane, and/or to perform cleanup with regard to sites formerly used in connection with our operations.
In addition, we may be required to pay for, or to pay a portion of, the costs of cleanup at sites to which we sent materials for disposal or recycling, notwithstanding that the original disposal or recycling activity may have complied with all regulatory requirements then in effect. Under certain laws, a party can be held jointly and severally liable for all of the cleanup costs associated with a disposal site. In practice, a liable party often splits the costs of cleanup with other potentially responsible parties. We have received notices from the United States EPA, state agencies and third parties that we have been identified as potentially responsible for the costs of investigating and cleaning up a number of disposal sites. In most cases, many other parties are also named as potentially responsible parties and also contribute to payment of those costs.
Because cleanup liability can in some cases be imposed retroactively on activities that occurred many years ago, and because federal and state agencies are still discovering sites that pose a threat to public health or the environment, we can provide no assurance that we will not become liable for significant costs associated with investigation and remediation of cleanup sites.
Operational and Commercial Risks Related to our Business
We may face significant price and other forms of competition from other steel and aluminum producers, scrap processors and alternative materials, which may adversely affect our business, financial condition, results of operations and cash flows.
The global markets in which steel companies and scrap processors conduct business are highly competitive and became even more so due to consolidations in the steel and scrap industries. Additionally, in many applications, steel competes with other materials, such as aluminum, cement, composites, plastics, carbon fiber, glass and wood. Increased use of alternative materials for any reason, including as a response to regulations or customer demands, could decrease demand for steel or force other steel producers into new products or markets that compete more directly with us, and combined with increased competition could cause us to lose market share, increase expenditures or reduce pricing, any one of which may adversely affect our business, financial condition, results of operations and cash flows.
Additionally, during 2022 we announced our planned project to construct and operate a recycled aluminum flat roll mill with an anticipated annual production capacity of 650,000 tonnes of finished products to be located in Columbus, Mississippi, with two supporting satellite recycling aluminum slab centers. Although we anticipate being able to effectively compete in the aluminum industry, along with the other risks described herein, we may face unexpected and enhanced competition, which may adversely affect the expected contributions of our aluminum operations and our resulting business, financial condition, results of operations and cash flows.
27
Availability of an adequate source of supply of scrap is required for our metals recycling operations.
We procure our scrap inventory from numerous sources. These suppliers generally are not bound by long-term contracts and generally have no obligation to sell recyclable metal to us. In periods of low industry scrap prices, scrap suppliers may elect to hold recyclable metal to wait for higher prices or intentionally slow their metal collection activities. If a substantial number of scrap suppliers cease selling recyclable metal to us, we may be unable to recycle metal at desired levels which may adversely affect our results of operations and financial condition. In addition, a slowdown of industrial production in the United States reduces the supply of industrial grades of metal to the metals recycling industry, resulting in our having less recyclable metal available to process and sell. Further, additional EAF steel mill construction could increase the demand for scrap, potentially resulting in higher scrap prices or periods of decreased scrap supply. Any inability to secure scrap for our EAF steel mills could adversely affect our business, results of operations, financial condition and cash flows.
We are subject to cybersecurity threats and may face risks to the security of our sensitive data and information technology which may adversely affect our business, results of operations, financial condition and cash flows.
Increased global cybersecurity and information technology security requirements, vulnerabilities and threats and a rise in sophisticated and targeted cybercrime, all of which may be heightened during times of war or hostilities, pose a risk to the security and functionality of our systems and information networks, and to the confidentiality, availability and integrity of sensitive data, including intellectual property, proprietary information, financial information, customer and supplier information, and personally identifiable information. Additionally, such cybersecurity vulnerabilities or attacks could result in an interruption of the functionality of our automated and electronically controlled manufacturing operating systems, which, if compromised, could cease, threaten, delay or slow down our ability to melt, roll or otherwise process steel or any of our other products for the duration of such interruption. Our customers and suppliers may also store certain of our sensitive information on their information technology systems, which if breached or attacked, could likewise expose our sensitive information. Similarly, information system vendors and software suppliers may experience a cybersecurity or information technology breach that exposes our systems or sensitive data. Any of these cybersecurity and information technology breaches or disruptions may result in reputational harm and may adversely affect our business, results of operations, financial condition and cash flows.
Although we believe we have adopted procedures, training programs, and controls to adequately protect our sensitive data, networks and information and operating technology and systems, there can be no assurance that a system or network failure, or cybersecurity breach or attack, will be prevented, whether due to attacks by cyber criminals or due to employee, contractor or other error or malfeasance. This could lead to system interruption, production delays or downtimes and operational disruptions, and the disclosure, modification or destruction of sensitive data, which may adversely affect our reputation, customer and supplier relationships, financial results and results of operations, and could result in litigation or regulatory investigations, actions, fines or penalties, as well as increased cybersecurity monitoring and protection costs, including the cost or availability of insurance. Additionally, as cybersecurity threats continue to evolve and become more sophisticated, we may need to invest additional time, resources and finances to protect the security of our sensitive data, systems and information networks. We maintain an information security risk insurance policy to mitigate the impact of cybersecurity threats. We did not experience any material information security breaches or third-party information security breaches during 2022, 2021, or 2020 and we did not incur any net expenses from information security breach penalties and settlements during 2022, 2021, or 2020.
28
We may face risks associated with the implementation of our growth strategy.
Our growth strategy subjects us to various risks. As part of our growth strategy, we may expand existing facilities, enter into new business lines, products or process initiatives, acquire or build additional plants, acquire other businesses and assets, enter into joint ventures, or form strategic alliances that we believe will complement our existing business. These expansions and transactions, including our announced planned recycled aluminum flat roll mill with an anticipated annual production capacity of 650,000 tonnes of finished products to be located in Columbus, Mississippi, may involve some or all of the following risks:
● the risk of entering business lines or product, domestic, or foreign markets, in which we have little experience, including the aluminum industry;
● the risk of a newly constructed facility being completed over budget or not on time, including due to equipment delays or labor shortages;
● the risk of not being able to adequately obtain sufficient labor to efficiently build or staff a new facility;
● the risk of expected markets, products, customers and demand for products produced by a new facility being lower than expected;
● the risk of new product development, technology development or customer acquisition and penetration being more costly or difficult than expected;
● the difficulty of competing for acquisitions and other growth opportunities with companies having materially greater financial resources than us;
● the inability to realize anticipated synergies or other expected benefits;
● the difficulty of integrating new or acquired operations and personnel into our existing operations;
● the potential disruption of ongoing operations;
● the diversion of financial resources or management attention to new operations or acquired businesses;
● the loss of key employees, customers or suppliers of acquired businesses;
● the potential exposure to unknown liabilities;
● the inability of management to maintain uniform standards, controls, procedures and policies;
● the difficulty of managing the growth of a larger company;
● the risk of becoming involved in labor, commercial, or regulatory disputes or litigation related to the new operations or acquired businesses;
● the risk of becoming more highly leveraged;
● the risk of contractual or operational liability to other venture participants or to third parties as a result of our participation;
● the inability to work efficiently with joint venture or strategic alliance partners; and
● the difficulties of terminating joint ventures or strategic alliances.
29
As our Sinton Flat Roll Division ramps up, we have faced and could continue to face start-up inefficiencies. Delays in achieving full operational capacity may adversely affect our prospects, business, financial condition, results of operations and cash flows.
These expansions or transactions might be required for us to remain competitive, but we may not be able to complete any such expansions or transactions on favorable terms or obtain financing, if necessary. Future expansions and transactions may not improve our competitive position and business prospects as anticipated, and if they do not, our business, financial condition, results of operations and cash flows may be adversely affected.
We are subject to litigation and legal compliance risks which may adversely affect our financial condition, results of operations and liquidity.
We are involved from time to time in various litigation matters, including administrative proceedings, regulatory proceedings, governmental investigations, environmental matters, and commercial and construction contract disputes, none of which at the present time are expected to have a material impact on our financial conditions, results of operations or liquidity. For additional information regarding legal proceedings please refer to Item 3. Legal Proceedings.
In addition to risks associated with our environmental and other regulatory compliance, our international operations are subject to complex foreign and United States laws and regulations, including the Foreign Corrupt Practices Act and other anti-bribery laws, regulations related to import-export controls, the Office of Foreign Assets Control, and other laws and regulations, each of which may increase our cost of doing business and expose us to increased risk.
Unexpected equipment downtime or shutdowns may adversely affect our business, financial condition, results of operations and cash flows.
Interruptions in our production capabilities may adversely affect our production costs, products available for sale and earnings during the affected period. In addition to equipment failures, our facilities are subject to the risk of catastrophic loss due to unanticipated events such as fires, explosions or violent weather conditions. Our manufacturing processes are dependent upon critical pieces of steelmaking equipment, such as our EAFs, continuous casters and rolling equipment, some of which are controlled by our information technology systems, as well as electrical equipment, such as transformers. This equipment may, on occasion, be out of service as a result of unanticipated failures or other events, including equipment failure, power surges, cybersecurity breaches or attacks or system failures. Further, we have experienced and may continue to experience start-up inefficiencies at our Sinton Flat Roll Division. We have experienced and in the future may experience plant shutdowns or periods of reduced production as a result of equipment failures or other events. Supply chain disruptions and labor shortages have and may continue to exacerbate the effects of equipment failures. These disruptions may adversely affect our business, financial condition, results of operations and cash flows.
Governmental agencies may refuse to grant or renew some of our licenses and permits required to operate our businesses.
Some of our operations must receive licenses and air, water and other permits and approvals from federal, state and local governments to conduct certain of our operations or to build, expand or acquire new facilities. Governmental agencies, non-governmental organizations, and members of the public sometimes resist the establishment of certain types of facilities in their communities. There can be no assurance that future approvals, licenses and permits will be granted or that we will be able to maintain and renew the approvals, licenses and permits we currently hold. Failure to do so may adversely affect our business, financial condition, results of operations and cash flows.
30
Our senior unsecured credit facility contains, and any future financing agreements may contain, restrictive covenants that may limit our flexibility.
Restrictions and covenants in our existing debt agreements, including our senior unsecured credit facility, and any future financing agreements, may impair our ability to finance future operations or capital needs or to engage in other business activities. A breach of any of the restrictions or covenants could cause a default under our senior unsecured credit facility, our senior notes, or our other debt. A significant portion of our indebtedness may then become immediately due and payable.
Under our senior unsecured credit facility, we are required to maintain certain financial covenants. Our ability to meet such covenants or other restrictions can be affected by events beyond our control. If a default were to occur, the lenders could elect to declare all amounts then outstanding to be immediately due and payable and terminate all commitments to extend further credit.
Impairment charges may adversely affect our results of operations.
Occasionally, assumptions that we have made regarding products or businesses we have acquired or sought to develop, about the sustainability of markets we sought to exploit, or about industry conditions that underlie our decision making when we elected to capitalize a venture turn out differently than anticipated. In such instances, the fair value of such assets may fall below their carrying value recorded on our balance sheet.
Accordingly, we periodically test goodwill, long-lived tangible and intangible assets and right of use assets to determine whether their estimated fair value is in fact less than their value recorded on our balance sheet. If we determine that the fair value of any of these assets, from whatever cause, is less than the value recorded on our balance sheet, we are required to incur non-cash asset impairment charges that adversely affect our results of operations. There can be no assurances that market dynamics or other factors may not result in future impairment charges.
ITEM 1B. UNRESOLVED STAFF COMMENTS
None.
31
ITEM 2. PROPERTIES
The following table describes our significant properties as of December 31, 2022. These properties are owned by us, and not subject to any significant encumbrances, or are leased by us. We believe these properties are suitable and adequate for our current operations and are appropriately utilized. For additional information regarding our significant facilities please refer to Item 1. Business.
Site | Site | |||||||
Acreage | Acreage | |||||||
Operations | Location | Description | Owned | Leased | ||||
Steel Operations Segment * | ||||||||
Butler Flat Roll Division: | ||||||||
Butler Operations | Butler, IN | Flat Roll Steel Mill and Coating Facility | 993 | — | ||||
Jeffersonville Operations | Jeffersonville, IN | Flat Roll Steel Coating Facility | 27 | 10 | ||||
Iron Dynamics | Butler, IN | Liquid Ironmaking Facility | 25 | — | ||||
Columbus Flat Roll Division | Columbus, MS | Flat Roll Steel Mill and Coating Facility | 1,387 | — | ||||
Sinton Flat Roll Division | Sinton, TX | Flat Roll Steel Mill and Coating Facility | 2,487 | — | ||||
The Techs | Pittsburgh, PA | Flat Roll Steel Coating Facilities | 16 | 2 | ||||
Heartland Flat Roll Division | Terre Haute, IN | Flat Roll Steel Cold-Rolling and Coating Facility | 246 | — | ||||
United Steel Supply | IN, MS, OR, and TX | Distributor of Painted Galvalume® Flat Roll Steel | 40 | 3 | ||||
Structural and Rail Division | Columbia City, IN | Structural and Rail Steel Mill | 814 | — | ||||
Engineered Bar Products Division | Pittsboro, IN | Engineered Bar Steel Mill and Finishing Facility | 312 | — | ||||
Vulcan Threaded Products | Pelham, AL | Bar Steel Processing Facility | 31 | — | ||||
Roanoke Bar Division | Roanoke, VA | Merchant Bar Steel Mill | 302 | — | ||||
Steel of West Virginia | WV, KY, and TN | Specialty Shapes Steel Mill and Finishing | 139 | 6 | ||||
and Coating Facilities | ||||||||
Metals Recycling Operations Segment | ||||||||
OmniSource: | ||||||||
Alabama | Birmingham, AL | Ferrous Scrap Processing | 59 | — | ||||
Indiana | Multiple Cities | Ferrous and Nonferrous Scrap Processing | 456 | 26 | ||||
Michigan | Multiple Cities | Ferrous and Nonferrous Scrap Processing | 186 | — | ||||
Mississippi | Multiple Cities | Ferrous and Nonferrous Scrap Processing | 54 | 13 | ||||
North Carolina | Multiple Cities | Ferrous and Nonferrous Scrap Processing | 346 | — | ||||
Ohio | Multiple Cities | Ferrous and Nonferrous Scrap Processing | 212 | 21 | ||||
Oklahoma | Sand Springs, OK | Ferrous Scrap Processing | — | 10 | ||||
Tennessee | Multiple Cities | Ferrous and Nonferrous Scrap Processing | 65 | — | ||||
Texas | Multiple Cities | Ferrous and Nonferrous Scrap Processing | 75 | — | ||||
Virginia | Multiple Cities | Ferrous and Nonferrous Scrap Processing | 121 | — | ||||
Mexico | Multiple Cities | Ferrous and Nonferrous Scrap Processing | — | 70 | ||||
Steel Fabrication Operations Segment | ||||||||
New Millennium Building Systems: | ||||||||
Joist and Deck Operations | Butler, IN | Steel Joist and Deck Fabrication Facility | 156 | — | ||||
Joist Operations | Fallon, NV | Steel Joist Fabrication Facility | 53 | — | ||||
Joist and Deck Operations | Hope, AR | Steel Joist and Deck Fabrication Facility | 245 | 7 | ||||
Joist Operations | Juarez, MX | Steel Joist Fabrication Facility | 17 | — | ||||
Joist and Deck Operations | Lake City, FL | Steel Joist and Deck Fabrication Facility | 75 | — | ||||
Deck Operations | Memphis, TN | Deck Fabrication Facility | 19 | — | ||||
Joist and Deck Operations | Salem, VA | Steel Joist and Deck Fabrication Facility | 113 | — | ||||
The company’s corporate headquarters is in Fort Wayne, Indiana on 20 owned acres. Our copper rod and wire facility, a controlled subsidiary, is in New Haven, Indiana on 35 owned acres.
*Our 2022 steel mill production utilization was 92% of our estimated annual steelmaking capability, exclusive of Sinton which started up steel operations in 2022.
ITEM 3. LEGAL PROCEEDINGS
We are involved in various litigation matters, including administrative proceedings, regulatory proceedings, governmental investigations, environmental matters, and commercial and construction contract disputes, none of which are currently expected to have a material impact on our financial condition, results of operations, or liquidity.
32
We may also be involved from time to time in various governmental investigations, regulatory proceedings or judicial actions seeking penalties, injunctive relief, and/or remediation under federal, state and local environmental laws and regulations. The United States EPA has conducted such investigations and proceedings involving us, in some instances along with state environmental regulators, under various environmental laws, including RCRA, CERCLA, the Clean Water Act and the Clean Air Act. Some of these matters have resulted in fines or penalties, exclusive of interest and costs, which did not exceed $1 million in aggregate, as of December 31, 2022.
ITEM 4. MINE SAFETY DISCLOSURES
Information required to be furnished pursuant to Item 4 concerning mine safety disclosure matters by Section 1503(a) of the Dodd-Frank Wall Street Reform and Consumer Protection Act and Item 104 of Regulation S-K (17 CFR 229.104), is included in Exhibit 95 to this annual report.
33
PART II
ITEM 5. MARKET FOR REGISTRANT’S COMMON EQUITY, RELATED STOCKHOLDER MATTERS AND ISSUER PURCHASES OF EQUITY SECURITIES
The information required by Item 5 with respect to securities authorized for issuance under equity compensation plans is set forth in Part III, Item 12 of this Form 10-K. Our common stock trades on The NASDAQ Global Select Stock Market under the symbol STLD.
As of February 21, 2023, we had 171,577,705 shares of common stock outstanding and held beneficially by approximately 23,700 stockholders based on our security position listing. Because many of the shares were held by depositories, brokers and other nominees, the number of registered holders (approximately 1,320) is not representative of the number of beneficial holders.
Issuer Purchases of Equity Securities
We purchased the following equity securities registered by us pursuant to Section 12 of the Exchange Act during the three months ended December 31, 2022.
Period | Total Number of Shares Purchased | Average Price Paid per Share | Total Number of Shares Purchased as Part of Publicly Announced Program(1) | Maximum Dollar Value of Shares That May Yet be Purchased Under the Program (in thousands) (1) | |||||||
Quarter ended December 31, 2022 | |||||||||||
October 1-31 | 1,493,698 | $ | 83.68 | 1,493,698 | $ | 120,501 | |||||
November 1-30 | 1,419,306 | 99.35 | 1,419,306 | 1,479,496 | |||||||
December 1 - 31 | 1,402,142 | 104.85 | 1,402,142 | 1,332,506 | |||||||
4,315,146 | 4,315,146 |
(1) | In February 2022, our board of directors authorized a share repurchase program of up to $1.25 billion of our common stock. This program was exhausted in November 2022. In November 2022, our board of directors authorized an additional share repurchase program of up to $1.5 billion of our common stock. |
34
Total Return Graph
On December 22, 2022, Steel Dynamics, Inc. was added to the S&P 500. As such, we have added the S&P 500 index to the comparison of 5 year cumulative total returns in the graph below.
35
ITEM 7. MANAGEMENT’S DISCUSSION AND ANALYSIS OF FINANCIAL CONDITION AND RESULTS OF OPERATIONS
Forward-Looking Statements
This report contains some predictive statements about future events, including statements related to conditions in domestic or global economies, conditions in steel, aluminum, and recycled metals market places, Steel Dynamics' revenues, costs of purchased materials, future profitability and earnings, and the operation of new, existing or planned facilities. These statements, which we generally precede or accompany by such typical conditional words as "anticipate", "intend", "believe", "estimate", "plan", "seek", "project", or "expect", or by the words "may", "will", or "should", are intended to be made as "forward-looking", subject to many risks and uncertainties, within the safe harbor protections of the Private Securities Litigation Reform Act of 1995. These statements speak only as of this date and are based upon information and assumptions, which we consider reasonable as of this date, concerning our businesses and the environments in which they operate. Such predictive statements are not guarantees of future performance, and we undertake no duty to update or revise any such statements. Some factors that could cause such forward-looking statements to turn out differently than anticipated include: (1) domestic and global economic factors; (2) global steelmaking overcapacity and imports of steel, together with increased scrap prices; (3) pandemics, epidemics, widespread illness or other health issues, such as COVID-19 or its variants; (4) the cyclical nature of the steel industry and the industries we serve; (5) volatility and major fluctuations in prices and availability of scrap metal, scrap substitutes and supplies, and our potential inability to pass higher costs on to our customers; (6) cost and availability of electricity, natural gas, oil, or other energy resources are subject to volatile market conditions; (7) increased environmental, greenhouse gas emissions and sustainability considerations or regulations; (8) compliance with and changes in environmental and remediation requirements; (9) significant price and other forms of competition from other steel and aluminum producers, scrap processors and alternative materials; (10) availability of an adequate source of supply of scrap for our metals recycling operations; (11) cybersecurity threats and risks to the security of our sensitive data and information technology; (12) the implementation of our growth strategy; (13) litigation and legal compliance; (14) unexpected equipment downtime or shutdowns; (15) governmental agencies may refuse to grant or renew some of our licenses and permits; (16) our senior unsecured credit facility contains, and any future financing agreements may contain, restrictive covenants that may limit our flexibility; and (17) the impacts of impairment charges.
More specifically, we refer you to our more detailed explanation of these and other factors and risks that may cause such predictive statements to turn out differently, as set forth in the sections titled Special Note Regarding Forward-Looking Statements at the beginning of Part I of this Report and Item 1A. Risk Factors, as well as in other subsequent reports we file with the Securities and Exchange Commission. These reports are available publicly on the Securities and Exchange Commission website, www.sec.gov, and on our website, www.steeldynamics.com under “Investors – SEC Filings.”
Operating Statement Classifications
Net Sales. Net sales from our operations are a factor of volumes shipped, product mix and related pricing. We charge premium prices for certain grades of steel, product dimensions, certain smaller volumes, and for value-added processing or coating of our steel products. Except for the steel fabrication operations, we recognize revenues from sales and the allowance for estimated returns and claims from these sales at the point in time control of the product transfers to the customer, upon shipment or delivery. Our steel fabrication operations recognize revenues over time based on completed fabricated tons to date as a percentage of total tons required for each contract.
Costs of Goods Sold. Our costs of goods sold represent all direct and indirect costs associated with the manufacture of our products. The principal elements of these costs are scrap and scrap substitutes (which represent the most significant single component of our consolidated costs of goods sold), steel substrate, direct and indirect labor and related benefits, alloys, zinc, transportation and freight, repairs and maintenance, utilities such as electricity and natural gas, and depreciation.
37
Selling, General and Administrative Expenses. Selling, general and administrative expenses consist of all costs associated with our sales, finance and accounting, and administrative departments, including, among other items, labor and related benefits, and professional services.
Companywide profit sharing and amortization of intangible assets are each separately presented in the statement of income.
Interest Expense, net of Capitalized Interest. Interest expense consists of interest associated with our senior credit facilities and other debt, net of interest costs that are required to be capitalized during the construction period of certain capital investment projects
Other (Income) Expense, net. Other income consists of interest income earned on our temporary cash deposits and short-term investments; any other non-operating income activity, including income from investments in unconsolidated affiliates accounted for under the equity method. Other expense consists of any non-operating costs, such as certain acquisition and financing expenses.
2022 Overview
During 2022, domestic steel demand continued to be strong throughout the year, supported most significantly by the construction, automotive, industrial, and energy sectors. Customer steel inventories remained below historical averages for most of the year, allowing for steady order patterns. This strong market environment allowed annual average steel selling prices to remain at historically high levels, with steady steel operations segment metal spreads compared to 2021, partially offset by additional costs of $439 million during start-up at Sinton. Our metals recycling operations experienced a challenging pricing environment in 2022, with ferrous scrap prices generally falling throughout the year. Metal spread compression, coupled with lower volumes, resulted in significantly lower operating income. Our steel fabrication operations segment achieved significantly higher record operating income and record shipments during 2022, on continued strong non-residential construction demand, record average selling prices and stable average steel product pricing. The symbiotic relationship among our three operating segments resulted in record companywide financial and operational performance during 2022.
We achieved record 2022 operational and financial results.
● | Record net sales of $22.3 billion |
● | Record operating income of $5.1 billion and net income of $3.9 billion |
● | Record cash flow from operations of $4.5 billion |
● | Record steel and steel fabrication shipments of 12.2 million and 856,000 tons, respectively |
● | Record steel fabrication operating income of $2.4 billion |
● | Share repurchases of $1.8 billion of our common stock, representing 12% of our outstanding shares |
Consolidated operating income for 2022 increased $790.7 million, or 18%, to $5.1 billion, compared to $4.3 billion in 2021. Net income attributable to Steel Dynamics, Inc. for 2022 increased $648.6 million, or 20%, to $3.9 billion, compared to 2021. Diluted earnings per share attributable to Steel Dynamics, Inc. was $20.92 for 2022, compared to $15.56 for 2021.
Refer to Item 7. Management’s Discussion and Analysis of Financial Condition and Results of Operations in Part II of our Annual Report on Form 10-K for the year ended December 31, 2021, for additional information regarding results of operations for the year ended December 31, 2021, as compared to the year ended December 31, 2020, and segment operating results for 2021 as compared to 2020.
38
Segment Operating Results (dollars in thousands)
Years Ended December 31, | |||||||||
2022 | % Change | 2021 | |||||||
Net sales | |||||||||
Steel Operations | $ | 15,100,917 | 8% | $ | 14,023,133 | ||||
Metals Recycling Operations | 4,395,636 | (4)% | 4,590,121 | ||||||
Steel Fabrication Operations | 4,257,207 | 141% | 1,764,710 | ||||||
Other | 1,288,984 | 2% | 1,266,971 | ||||||
25,042,744 | 21,644,935 | ||||||||
Intra-company | (2,781,970) | (3,236,085) | |||||||
$ | 22,260,774 | 21% | $ | 18,408,850 | |||||
Operating income (loss) | |||||||||
Steel Operations | $ | 3,095,348 | (29)% | $ | 4,360,488 | ||||
Metals Recycling Operations | 117,266 | (36)% | 181,986 | ||||||
Steel Fabrication Operations | 2,424,655 | 564% | 365,250 | ||||||
Other | (599,828) | (9)% | (551,725) | ||||||
5,037,441 | 4,355,999 | ||||||||
Intra-company | 54,381 | (54,894) | |||||||
$ | 5,091,822 | 18% | $ | 4,301,105 |
39
Steel Operations Segment |
Steel operations consist of our electric arc furnace steel mills, producing steel from ferrous scrap and scrap substitutes, utilizing continuous casting, automated rolling mills, numerous value-added downstream steel coating and processing operations, and distribution operations. Our steel operations sell directly to end-users, steel fabricators, and service centers. These products are used in numerous industry sectors, including the construction, automotive, manufacturing, transportation, heavy and agriculture equipment, and pipe and tube (including OCTG) markets. Steel operations accounted for 65% and 72% of our consolidated net sales during 2022 and 2021, respectively. See Item 1. Business for further information on Steel Operations segment operations.
Steel Operations Shipments (tons):
Years Ended December 31, | |||||||
2022 | % Change | 2021 | |||||
Total shipments | 12,158,168 | 8% | 11,217,640 | ||||
Intra-segment shipments | (1,353,824) | (1,106,525) | |||||
Steel Operations Segment shipments | 10,804,344 | 7% | 10,111,115 | ||||
External shipments | 10,410,469 | 9% | 9,559,617 |
40
Segment Results 2022 vs. 2021
During 2022, domestic steel demand remained strong from the construction, automotive, industrial, and energy sectors, resulting in record shipments of 10.8 million tons in 2022, including 828,000 tons from Sinton. Average product pricing for our steel operations, though higher year over year compared to 2021, experienced steady declines throughout 2022 for sheet steel products, which had risen to record levels at the end of 2021. Conversely, long products realized higher selling prices through the majority of 2022. Steel operations segment shipments increased 7% in 2022 compared to 2021, as Sinton started up production throughout the year, with average selling prices remaining steady. Net sales for the steel operations segment were 8% higher in 2022 when compared to 2021, due to stable average steel selling prices and record volumes.
Metallic raw materials used in our electric arc furnaces represent our single most significant steel manufacturing cost, generally comprising approximately 55% to 65% of our steel mill operations’ manufacturing costs. Our metallic raw material cost consumed in our steel mills increased $28 per net ton, or 6%, in 2022 compared to 2021.
As a result of scrap costs increasing more than average selling prices, specifically for sheet steel products, metal spread (which we define as the difference between average steel mill selling prices and the cost of ferrous scrap consumed in our steel mills) decreased slightly in 2022 compared to 2021. Due to metal spread compression and additional costs during start-up at Sinton, operating income for the steel operations decreased 29%, to $3.1 billion, in 2022 compared to 2021.
41
Metals Recycling Operations Segment |
Metals recycling operations includes both ferrous and nonferrous scrap metal processing, transportation, marketing, brokerage, and scrap management services. In October 2022, we completed our acquisition of ROCA ACERO, S.A. de C.V. (ROCA), whose post-acquisition operations are included in 2022 results. Our steel mills utilize a large portion (approximately 66% in 2022 and 2021) of the ferrous scrap sold by our metals recycling operations as raw material in our steelmaking operations, and the remainder is sold to other consumers, such as other steel manufacturers and foundries. Metals recycling operations accounted for 10% and 12% of our consolidated net sales during 2022 and 2021, respectively.
Metals Recycling Operations Shipments:
Years Ended December 31, | ||||||||
2022 | % Change | 2021 | ||||||
Ferrous metal (gross tons) | ||||||||
Total | 5,301,774 | (3)% | 5,442,478 | |||||
Inter-company | (3,475,662) | 3% | (3,574,668) | |||||
External shipments | 1,826,112 | (2)% | 1,867,810 | |||||
Nonferrous metal (thousands of pounds) | ||||||||
Total | 1,053,852 | (4)% | 1,093,472 | |||||
Inter-company | (138,407) | (2)% | (135,914) | |||||
External shipments | 915,445 | (4)% | 957,558 |
Segment Results 2022 vs. 2021
Our metals recycling operations faced a challenging price environment during 2022. Domestic steel mill utilization rates decreased to approximately 78% in 2022 from 81% in the prior year, impacting demand for ferrous scrap. Net sales for our metals recycling operations decreased 4% in 2022 as compared to 2021, driven by lower shipments and average selling values. Ferrous scrap average selling prices decreased 4% during 2022 compared to 2021, falling nine out of twelve months during the year, while nonferrous average selling prices increased 3%. Ferrous metal spread (which we define as the difference between average selling prices and the cost of purchased scrap) decreased 2%, while nonferrous metal spread also decreased 2% in 2022 compared to 2021. Metals recycling operations operating income in 2022 of $117.3 million decreased $64.7 million, or 36%, from the record in 2021, due to decreased ferrous and nonferrous shipments and metal spread.
42
Steel Fabrication Operations Segment |
Steel fabrication operations include seven New Millennium Building Systems joist and deck plants located throughout the United States, and in Northern Mexico. Revenues from these plants are generated from the fabrication of steel joists, girders, trusses, and steel deck used within the non-residential construction industry. Steel fabrication operations accounted for 19% and 10% of our consolidated net sales during 2022 and 2021, respectively.
Segment Results 2022 vs. 2021
Our steel fabrication operations benefited in 2022 from a steady non-residential construction market, as order activity remained strong throughout the year, resulting in record shipments and significantly higher selling prices. Our order backlog for steel fabrication extends through the first half of 2023. Record net sales for the segment of $4.3 billion increased 141% during 2022, compared to 2021, as shipments increased 8%, and average selling prices increased 123%, or $2,740 per ton.
The purchase of various steel products is the largest single cost of production for our steel fabrication operations, historically representing approximately two-thirds of the total cost of manufacturing, increasing to approximately three-fourths during 2022 and 2021 consistent with the historically higher steel costs. The average cost of steel consumed increased 24% in 2022, as compared to 2021. Selling prices per ton increased more than steel input costs per ton, resulting in metal spread (which we define as the difference between average selling prices and the cost of purchased steel) increasing 258% in 2022 compared to 2021. This expanded metal spread, coupled with record shipments, resulted in record operating income of $2.4 billion in 2022 compared to $365.3 million in 2021.
43
Other Operations |
Consolidated Results 2022 vs. 2021
Selling, General and Administrative Expenses. Selling, general and administrative expenses decreased $98.4 million, or 15%, to $545.6 million during 2022 compared to 2021, representing 2.5% and 3.5% of net sales, respectively. This decrease is due primarily to a $27.7 million decrease in equity-based compensation expense, as well as decreased costs of $64.5 million related to Sinton that were included in selling, general and administrative expenses prior to the completion of the mill’s construction and start-up in early 2022.
Companywide profit sharing expense was $452.6 million in 2022 (including $22.5 million of additional companywide special compensation awarded to all non-executive eligible team members in recognition of the company’s exceptional annual performance), an increase of $64.4 million from the $388.1 million earned during 2021, consistent with increased pretax income. Refer to Note 11. Retirement Plans to the consolidated financial statements elsewhere in this report for further information.
Interest Expense, net of Capitalized Interest. During 2022, interest expense of $91.5 million increased 60% from $57.2 million during 2021. The higher interest expense in 2022 compared to 2021 was due to higher capitalized interest in 2021 ($50.5 million, compared to $15.8 million in 2022) related to the construction of Sinton.
Other (Income) Expense, net. Net other income was $20.8 million in 2022, compared to net other expense of $34.8 million in 2021. The net other income in 2022 compared to net other expense in 2021 was due primarily to an increase in interest income of $28.0 million associated with our increased invested cash and short-term investment balances, as well as an increase in net earnings from equity investments of $18.6 million.
Income Tax Expense. During 2022, income tax expense of $1.1 billion, at an effective income tax rate of 22.7%, increased 19% from the $962.3 million of income tax expense, at an effective income tax rate of 22.9%, during 2021, consistent with increased pretax earnings. Refer to Note 4. Income Taxes to the consolidated financial statements elsewhere in this report for additional information.
Included in the balance of unrecognized tax benefits at December 31, 2022, are potential benefits of $25.1 million that, if recognized, would affect the effective tax rate. We recognize interest and penalties related to our tax contingencies on a net-of-tax basis in income tax expense. During the year ended December 31, 2022, we recognized expense from the increase of interest expense and penalties of $480,000, net of tax. In addition to the unrecognized tax benefits noted above, we had $1.2 million accrued for the payment of interest and penalties at December 31, 2022.
We file income tax returns in the United States federal jurisdiction as well as income tax returns in various state jurisdictions. The tax years 2019 through 2021 remain open to examination by the Internal Revenue Service and various state and local jurisdictions. At this time, we do not believe there will be any significant examination adjustments that would result in a material change to our financial position, results of operations or cash flows. It is reasonably possible that the amount of unrecognized tax benefits could change in the next twelve months in an amount ranging from zero to $3.3 million, as a result of the expiration of the statute of limitations and other federal and state income tax audits.
44
Liquidity and Capital Resources
Capital Resources and Long-term Debt. Our business is capital intensive and requires substantial expenditures for, among other things, the purchase and maintenance of equipment used in our operations, and to remain in compliance with environmental laws. Our short-term and long-term liquidity needs arise primarily from working capital requirements, capital expenditures, including expansion projects, principal and interest payments related to our outstanding indebtedness (no significant principal payments until 2024), dividends to our shareholders, and potential stock repurchases and acquisitions or investments. We have met and intend to continue to meet these liquidity requirements primarily with available cash and cash provided by operations, and long-term borrowings, and we also have availability under our unsecured Revolver. Our liquidity at December 31, 2022, is as follows (in thousands):
Cash and equivalents | $ | 1,628,417 | |||||||
Short-term investments | 628,215 | ||||||||
Unsecured revolver availability | 1,190,899 | ||||||||
Total liquidity | $ | 3,447,531 |
Our total outstanding debt of $3.1 billion at December 31, 2022 is consistent with December 31, 2021. Our total long-term debt to capitalization ratio (representing our long-term debt, including current maturities, divided by the sum of our long-term debt, redeemable noncontrolling interests, and our total stockholders’ equity) was 27.7% and 32.9% at December 31, 2022, and 2021, respectively, decreasing due to the growth in stockholders’ equity from undistributed 2022 earnings.
Our unsecured credit agreement has a senior unsecured revolving credit facility (Facility), which provides a $1.2 billion unsecured Revolver, and matures in December 2024. Subject to certain conditions, we have the opportunity to increase the Facility size by $500.0 million. The unsecured Revolver is available to fund working capital, capital expenditures, and other general corporate purposes. The Facility contains financial covenants and other covenants pertaining to our ability to incur indebtedness and permit liens on certain assets. Our ability to borrow funds within the terms of the unsecured Revolver is dependent upon our continued compliance with the financial and other covenants. At December 31, 2022, we had $1.2 billion of availability on the Revolver, $9.1 million of outstanding letters of credit and other obligations which reduce availability, and there were no borrowings outstanding.
The financial covenants under our Facility state that we must maintain an interest coverage ratio of not less than 2.50:1.00. Our interest coverage ratio is calculated by dividing our last-twelve-months (LTM) consolidated Adjusted EBITDA (earnings before interest, taxes, depreciation, amortization, and certain other non-cash transactions as allowed in the Facility) by our LTM gross interest expense, less amortization of financing fees. In addition, a debt to capitalization ratio of not more than 0.60:1.00 must be maintained. At December 31, 2022, our interest coverage ratio and debt to capitalization ratio were 54.42:1.00 and 0.27:1.00, respectively. We were, therefore, in compliance with these covenants at December 31, 2022, and we anticipate we will continue to be in compliance during the next twelve months.
Working Capital. We generated cash flow from operations of $4.5 billion in 2022 compared to $2.2 billion in 2021. Operational working capital (representing amounts invested in trade receivables and inventories, less current liabilities other than income taxes payable and debt) decreased $112.5 million, or 3%, to $3.2 billion at December 31, 2022, due primarily to decreased inventory values, consistent with decreased steel and scrap selling prices as steel fabrication customer accounts increased with higher selling prices in the fourth quarter of 2022 compared to the same period in 2021.
45
Capital Investments. During 2022, we invested $908.9 million in property, plant and equipment, primarily within our steel operations segment, compared with $1.0 billion invested during 2021. Spending at Sinton decreased in 2022 versus 2021 as we completed the construction phase in early 2022. We enter 2023 with ample liquidity of $3.4 billion and anticipated operating cash flow generation to provide for our planned 2023 capital requirements, including the four new flat roll coating lines at Sinton and Heartland. We announced in July our plans to invest $2.5 billion in a new state-of-the-art low-carbon aluminum flat roll mill with two supporting satellite recycled aluminum slab centers, which is planned to be funded by available cash and cash flow from operations. Expenditures began in the third quarter of 2022 and are expected to continue through 2025.
Cash Dividends. As a reflection of continued confidence in our current and future cash flow generation capability and financial position, we increased our quarterly cash dividend by 31% to $0.34 per share in the first quarter of 2022 (from $0.26 per share in 2021), resulting in declared cash dividends of $245.3 million during 2022, compared to $210.9 million during 2021. We paid cash dividends of $237.2 million and $213.0 million during 2022 and 2021, respectively. Our board of directors, along with executive management, approves the payment of dividends on a quarterly basis. The determination to pay cash dividends in the future is at the discretion of our board of directors, after taking into account various factors, including our financial condition, results of operations, outstanding indebtedness, current and anticipated cash needs and growth plans.
Other. Our board of directors has authorized share repurchase programs during prior years, the most recent of which occurred in November 2022 for a program of up to $1.5 billion of the company’s common stock. Under the share repurchase programs, purchases take place as and when we determine in open market or private transactions made based upon the market price of our common stock, the nature of other investment opportunities or growth projects, our cash flows from operations, and general economic conditions. The share repurchase programs do not require us to acquire any specific number of shares, and may be modified, suspended, extended or terminated by us at any time. The share repurchase programs do not have an expiration date. There were $1.8 billion and $1.1 billion of share repurchases during 2022 and 2021, respectively. As of December 31, 2022, we had $1.3 billion remaining available to purchase under the November 2022 share repurchase program. See Part II, Item 5. Market for Registrant’s Common Equity, Related Stockholder Matters and Issuer Purchases of Equity Securities for additional information.
Our ability to meet our debt service obligations and reduce our total debt will depend upon our future performance which, in turn, will depend upon general economic, financial, and business conditions, along with competition, legislation and regulatory factors that are largely beyond our control. In addition, we cannot assure that our operating results, cash flows, access to credit markets and capital resources will be sufficient for repayment of our indebtedness in the future. We believe that based upon current levels of operations and anticipated growth, cash flows from operations, together with other available sources of funds, including borrowings under our Revolver, if necessary, will be adequate for the next twelve months for making required payments of principal and interest on our indebtedness, funding working capital requirements, and funding anticipated capital expenditures.
Contractual Obligations and Other Long-Term Liabilities
We have the following minimum commitments under contractual obligations, including purchase obligations, as defined by the Securities and Exchange Commission. A “purchase obligation” is defined as an agreement to purchase goods or services that is enforceable and legally binding and that specifies all significant terms, including fixed or minimum quantities to be purchased; fixed, minimum or variable price provisions; and the approximate timing of the transaction.
Long-term debt and estimated interest. Refer to Note 3. Long-Term Debt to the consolidated financial statements elsewhere in this report for our long-term debt maturities. Estimated interest payments on our senior unsecured notes were determined based on their outstanding balances through maturity at their contractual interest rates, as detailed in Note 3. Estimated interest payments also include a 0.175% commitment fee on our available Revolver, and an average interest rate of 5.5% on our other debt of $63.7 million. Our estimated interest payments are $102.2 million, $98.3 million, $80.3 million, $75.0 million, $54.6 million, for the years 2023 through 2027, respectively, and $393.2 million thereafter.
46
Purchase obligations. We have commitments for the purchase of commodities such as electricity, water, natural gas and its transportation services, fuel, air products, zinc, and electrodes. Refer to Note 9. Commitments and Contingencies to the consolidated financial statements elsewhere in this report for this information.
Construction commitments. We have firm contracts with various vendors for the completion of certain construction projects at our various divisions at December 31, 2022. Refer to Note 9. Commitments and Contingencies to the consolidated financial statements elsewhere in this report for this information.
Lease commitments. We have entered into operating leases relating principally to transportation and other equipment, and some real estate. Refer to Note 12. Leases to the consolidated financial statements elsewhere in this report for this information.
Unrecognized tax benefits. We expect to make cash outlays in the future related to our unrecognized tax benefits; however, due to the uncertainty of the timing, we are unable to make reasonably reliable estimates regarding the period of cash settlement with the respective taxing authorities. Refer to Note 4. Income Taxes to the consolidated financial statements elsewhere in this report for this information.
Other Matters
Environmental and Other Contingencies
We have incurred, and in the future will continue to incur, capital expenditures and operating expenses for matters relating to environmental control, remediation, monitoring and compliance. During 2022, we incurred costs related to the monitoring and compliance of environmental matters in the amount of approximately $47.7 million and capital expenditures related to environmental compliance of approximately $9.8 million. Of the costs incurred during 2022 for monitoring and compliance, approximately 70% were related to the normal transportation of certain types of waste produced in our steelmaking processes and other facilities, in accordance with legal requirements. We incurred combined environmental remediation costs of approximately $398,000 at all of our facilities during 2022. We have an accrual of $6.2 million recorded for environmental remediation related to our metals recycling operations, and $2.6 million related to our idled Minnesota ironmaking operations. We believe, apart from our dependence on environmental construction and operating permits for our existing and any future manufacturing facilities, that compliance with current environmental laws and regulations is not likely to have a materially adverse effect on our financial condition, results of operations or liquidity. However, environmental laws and regulations evolve and change, and we may become subject to more stringent environmental laws and regulations in the future, such as the impact of United States government or various governmental agencies introducing regulatory changes in response to the potential of climate change.
Critical Accounting Estimates
Management’s Discussion and Analysis of Our Financial Condition and Results of Operations is based upon our consolidated financial statements, which have been prepared in accordance with accounting principles generally accepted in the United States. We review the accounting estimates we use in reporting our financial results on a regular basis. The preparation of these financial statements requires us to make estimates and judgments that affect the reported amounts of assets, liabilities, revenues and expenses and related disclosure of contingent liabilities. We evaluate the appropriateness of these estimations and judgments on an ongoing basis. We base our estimates on historical experience and on various other assumptions that are believed to be reasonable under the circumstances, the results of which form the basis for making judgments about the carrying value of assets and liabilities that are not readily apparent from other sources. Results may differ from these estimates due to actual outcomes being different from those on which we based our assumptions. We believe the following critical accounting estimates affect our more significant judgments and estimates used in the preparation of our consolidated financial statements.
47
Impairments of Long-Lived Tangible and Definite-Lived Intangible Assets. We review long-lived assets for impairment whenever events or changes in circumstances indicate the carrying amount of such assets may not be fully recoverable. Impairment losses are recorded on long-lived assets used in operations when indicators of impairment are present and the undiscounted cash flows estimated to be generated by those assets are less than the assets’ carrying amounts. The impairment loss is measured by comparing the fair value of the asset to its carrying amount. We consider various factors and determine whether an impairment test is necessary, including by way of examples, a significant and prolonged deterioration in operating results and/or projected cash flows, significant changes in the extent or manner in which an asset is used, technological advances with respect to assets which would potentially render them obsolete, our strategy and capital planning, and the economic environment in markets to be served. When determining future cash flows and if necessary, fair value, we must make judgments as to the expected utilization of assets and estimated future cash flows related to those assets. We consider historical and anticipated future results, general economic and market conditions, the impact of planned business and operational strategies and all other available information at the time the estimates are made. Those estimates and judgments may or may not ultimately prove accurate.
Events occurred during the fourth quarter of 2020, that represented impairment indicators related to the company’s noncore oil and gas joint ventures. Therefore, the company undertook a fourth quarter 2020 assessment of the recoverability of the carrying amounts of these joint ventures’ property, plant and equipment. Based on the joint ventures’ outlook at the time of this 2020 assessment, the company concluded that the carrying amounts of its property, plant and equipment were fully impaired. This assessment resulted in a total non-cash asset impairment charge of $19.4 million, which include amounts attributable to noncontrolling interests of $2.4 million, that in total served to reduce net income attributable to Steel Dynamics, Inc. by $12.0 million for the year ended December 31, 2020.
Goodwill.
Our goodwill, relating to various business combinations, consisted of the following at December 31 (in thousands):
2022 | 2021 | |||||||
Steel Operations Segment | $ | 272,133 | $ | 272,133 | ||||
Metals Recycling Operations Segment | 228,009 | 179,777 | ||||||
Steel Fabrication Operations Segment | 1,925 | 1,925 | ||||||
$ | 502,067 | $ | 453,835 |
At least once annually (as of October 1), or when indicators of impairment exist, the company performs an impairment test for goodwill. Goodwill is allocated to various reporting units, which are generally one level below the company’s operating segments. The fair value of the reporting unit is determined by using an estimate of future cash flows utilizing a risk-adjusted discount rate to calculate the net present value of future cash flows (income approach), and for some years by using a market approach based upon an analysis of valuation metrics of comparable peer companies, using Level 3 fair value inputs as provided for under ASC 820. If the fair value exceeds the carrying value of the reporting unit, there is no impairment. If the carrying amount exceeds the fair value, we recognize an impairment loss in the amount by which the carrying value of the net assets assigned to the reporting unit exceeds the fair value of the reporting unit, with the impairment loss not to exceed the amount of goodwill allocated to the reporting unit.
Key assumptions used to determine the estimated fair value of each reporting unit under the discounted cash flows method (income approach) include: (a) expected cash flows for the five-year period following the testing date (including market share, sales volumes and prices, costs to produce and estimated capital needs); (b) an estimated terminal value using a terminal year growth rate determined based on the growth prospects of the reporting unit; and (c) a risk-adjusted discount rate based on management’s best estimate of market participants’ after-tax weighted average cost of capital and market risk premiums. Key assumptions used to determine the estimated fair value of each reporting unit under the market approach include the expected revenues and cash flows in the next year. We consider historical and anticipated future results, general economic and market conditions, the impact of planned business and operational strategies and all available information at the time the fair values of its reporting units are estimated. Those estimates and judgments may or may not ultimately prove accurate.
48
Goodwill acquired in past transactions are naturally more susceptible to impairment, primarily due to the fact that they are recorded at fair value based on operating plans and economic conditions at the time of acquisition. Consequently, if operating results and/or economic conditions deteriorate after an acquisition, it could result in the impairment of the acquired asset. A deterioration of economic conditions may not only negatively impact the estimated operating cash flows used in our cash flow models but may also negatively impact other assumptions used in our analyses, including, but not limited to, the estimated cost of capital and/or discount rates. Additionally, we are required to ensure that assumptions used to determine fair value in our analyses are consistent with the assumptions a hypothetical marketplace participant would use. As a result, the cost of capital and/or discount rates used in our analyses may increase or decrease based on market conditions and trends, regardless of whether our actual cost of capital has changed. Therefore, we may recognize an impairment in spite of realizing actual cash flows that are approximately equal to or greater than our previously forecasted amounts. Accordingly, discount rate scenario analysis is performed to evaluate the impact on estimated reporting unit fair values.
Our fourth quarter 2022, 2021, and 2020 annual goodwill impairment analyses did not result in any impairment charges. Management does not believe that it is reasonably likely that our reporting units will fail the goodwill impairment test in the near term, as the determined fair value of the reporting units with goodwill exceeded their carrying value by more than an insignificant amount. Changes in judgments and estimates underlying our analysis of goodwill for possible impairment, including expected future operating cash flows and discount rate, could decrease the estimated fair value of our reporting units in the future and could result in an impairment of goodwill.
Income Taxes. We are required to estimate our income taxes as a part of the process of preparing our consolidated financial statements. This requires us to estimate our actual current tax exposure together with assessing temporary differences resulting from differing treatments of items for tax and accounting purposes. These differences result in deferred tax assets and liabilities, which are included within our consolidated balance sheet. We must then assess the likelihood that our deferred tax assets will be recovered from future taxable income and, to the extent we believe that recovery is not likely, we must establish a valuation allowance. We also establish reserves to reduce some or all of the tax benefit of any of our tax positions at the time we determine that the positions become uncertain. We adjust these reserves, including any impact on the related interest and penalties, in light of changing facts and circumstances, such as the progress of a tax audit. A number of years may elapse before a particular matter for which we have established a reserve is audited by a taxing authority and finally resolved. The number of years with open tax audits varies depending on the tax jurisdiction. A tax benefit that has been previously reserved because of a failure to meet the "more likely than not" recognition threshold would be recognized in our income tax expense in the first interim period when the uncertainty disappears. Settlement of any particular issue would usually require the use of cash.
49
ITEM 7A. QUANTITATIVE AND QUALITATIVE DISCLOSURES ABOUT MARKET RISK
Market Risk
In the normal course of business, we are exposed to interest rate changes. Our objectives in managing fluctuations in interest rates are to limit the impact of these rate changes on earnings and cash flows and to lower overall borrowing costs. To achieve these objectives, we may use interest rate swaps to manage net exposure to interest rate changes related to our portfolio of borrowings; however, we have not done so during 2022, 2021, or 2020.
The following table represents the principal cash repayments and related weighted-average interest rates by maturity date for our long-term debt, as of December 31, 2022 (in thousands):
Interest Rate Risk | ||||||||||||||
Fixed Rate | Variable Rate | |||||||||||||
Average | Average | |||||||||||||
Principal | Rate | Principal | Rate | |||||||||||
Expected maturity date: | ||||||||||||||
2023 | $ | 2,254 | 4.1% | $ | 55,080 | 5.6% | ||||||||
2024 | 401,800 | 2.8 | - | |||||||||||
2025 | 401,608 | 2.4 | - | |||||||||||
2026 | 401,481 | 5.0 | - | |||||||||||
2027 | 351,142 | 1.7 | - | |||||||||||
Thereafter | 1,500,361 | 3.3 | - | |||||||||||
Total debt outstanding | $ | 3,058,646 | 3.2% | $ | 55,080 | 5.6% | ||||||||
Fair value | $ | 2,677,777 | $ | 55,080 |
Commodity Risk
In the normal course of business, we are exposed to the market risk and price fluctuations related to the sale of our products and to the purchase of raw materials used in our operations, such as metallic raw materials, electricity, water, natural gas and its transportation services, fuel, air products, zinc, and electrodes. Our risk strategy associated with product sales has generally been to obtain competitive prices for our products and to allow operating results to reflect market price movements dictated by supply and demand.
Our risk strategy associated with the purchase of raw materials utilized within our operations has generally been to make some commitments with suppliers relating to future expected requirements for some commodities such as electricity, water, natural gas and its transportation services, fuel, air products, zinc, and electrodes. Refer to Note 9. Commitments and Contingencies to the consolidated financial statements elsewhere in this report for additional information.
In our metals recycling and steel operations, we have certain fixed price contracts with various customers and suppliers for future delivery of nonferrous and ferrous metals. Our risk strategy has been to enter into base metal financial contracts with the goal to protect the profit margin, within certain parameters, that was contemplated when we entered into the transaction with the customer or vendor. At December 31, 2022, we had a cumulative unrealized loss associated with these financial contracts of $3.1 million, substantially all of which have settlement dates in 2023. We believe the customer contracts associated with the financial contracts will be fully consummated. Refer to Note 7. Derivative Financial Instruments to the consolidated financial statements elsewhere in this report for additional information.
50
ITEM 8. CONSOLIDATED FINANCIAL STATEMENTS AND SUPPLEMENTARY DATA
INDEX TO CONSOLIDATED FINANCIAL STATEMENTS
51
MANAGEMENT’S REPORT ON INTERNAL CONTROL OVER FINANCIAL REPORTING
The management of Steel Dynamics, Inc. is responsible for the preparation and integrity of the company’s consolidated financial statements and for establishing and maintaining adequate internal control over financial reporting, as such term is defined in Rule 13a – 15(f) of the Exchange Act, for the company (including its consolidated subsidiaries). We maintain accounting and internal control systems which are intended to provide reasonable assurance that assets are safeguarded against loss from unauthorized use or disposition, transactions are executed in accordance with management’s authorization, and accounting records are reliable for preparing financial statements in accordance with accounting principles generally accepted in the United States. We are dedicated to ensuring that we maintain the high standards of financial accounting and reporting that we have established. Our culture demands integrity and an unyielding commitment to strong internal control practices and policies.
Internal control over financial reporting includes those policies and procedures that (1) pertain to the maintenance of records that, in reasonable detail, accurately and fairly reflect the transactions and dispositions of our assets; (2) provide reasonable assurance that transactions are recorded as necessary to permit preparation of the financial statements in accordance with generally accepted accounting principles; and provide reasonable assurance that our receipts and expenditures are being made only in accordance with authorizations of our management and directors; and (3) provide reasonable assurance regarding prevention or timely detection of unauthorized acquisition, use or disposition of our assets that could have a material effect on our financial statements.
Because of its inherent limitations, internal control over financial reporting may not always prevent or detect misstatements. Also, projections of any evaluation of effectiveness to future periods are subject to the risk that controls may become inadequate because of changes in conditions, or that the degree of compliance with policies and procedures may deteriorate.
We acquired ROCA ACERO, S.A. de C.V. “ROCA” on October 1, 2022. In conducting our evaluation of the effectiveness of our internal control over financial reporting as of December 31, 2022, we have elected to exclude ROCA from our evaluation in the year of acquisition as permitted by the Securities and Exchange Commission. ROCA constituted approximately 1% of the company’s total and net assets as of December 31, 2022, and 0.3% of the company’s net sales for the year then ended.
Under the supervision and with the participation of our management, including our principal executive officer and our principal financial officer, we conducted an evaluation of the effectiveness of our internal control over financial reporting. The framework on which such evaluation was based upon is contained in the report entitled “Internal Control—Integrated Framework” issued by the Committee of Sponsoring Organizations of the Treadway Commission (2013 Framework) (the “COSO criteria”). Based on that evaluation, management concluded that our internal control over financial reporting was effective as of December 31, 2022, the end of the period covered by this report.
/s/ Mark D. Millett |
| /s/ Theresa E. Wagler |
Chief Executive Officer | Executive Vice President and Chief Financial Officer | |
(Principal Executive Officer) | (Principal Financial Officer) |
52
REPORT OF INDEPENDENT REGISTERED PUBLIC ACCOUNTING FIRM
To the Stockholders and the Board of Directors of Steel Dynamics, Inc.
Opinion on Internal Control Over Financial Reporting
We have audited Steel Dynamics, Inc.’s internal control over financial reporting as of December 31, 2022, based on criteria established in Internal Control—Integrated Framework issued by the Committee of Sponsoring Organizations of the Treadway Commission (2013 framework) (the COSO criteria). In our opinion, Steel Dynamics, Inc. (the Company) maintained, in all material respects, effective internal control over financial reporting as of December 31, 2022, based on the COSO criteria.
As indicated in the accompanying Management's Report on Internal Control Over Financial Reporting, management's assessment of and conclusion on the effectiveness of internal control over financial reporting did not include the internal controls of ROCA ACERO, S.A. de C.V., which is included in the 2022 consolidated financial statements of the Company and constituted 1% of total and net assets, respectively, as of December 31, 2022 and 0.3% of net sales for the year then ended. Our audit of internal control over financial reporting of the Company also did not include an evaluation of the internal control over financial reporting of ROCA ACERO, S.A. de C.V.
We also have audited, in accordance with the standards of the Public Company Accounting Oversight Board (United States) (PCAOB), the consolidated balance sheets of Steel Dynamics, Inc. as of December 31, 2022 and 2021, the related consolidated statements of income, comprehensive income, equity, and cash flows for each of the three years in the period ended December 31, 2022, and the related notes and our report dated February 28, 2023 expressed an unqualified opinion thereon.
Basis for Opinion
The Company’s management is responsible for maintaining effective internal control over financial reporting and for its assessment of the effectiveness of internal control over financial reporting included in the accompanying Management’s Report on Internal Control Over Financial Reporting. Our responsibility is to express an opinion on the Company’s internal control over financial reporting based on our audit. We are a public accounting firm registered with the PCAOB and are required to be independent with respect to the Company in accordance with the U.S. federal securities laws and the applicable rules and regulations of the Securities and Exchange Commission and the PCAOB.
We conducted our audit in accordance with the standards of the PCAOB. Those standards require that we plan and perform the audit to obtain reasonable assurance about whether effective internal control over financial reporting was maintained in all material respects.
Our audit included obtaining an understanding of internal control over financial reporting, assessing the risk that a material weakness exists, testing and evaluating the design and operating effectiveness of internal control based on the assessed risk, and performing such other procedures as we considered necessary in the circumstances. We believe that our audit provides a reasonable basis for our opinion.
53
Definition and Limitations of Internal Control Over Financial Reporting
A company’s internal control over financial reporting is a process designed to provide reasonable assurance regarding the reliability of financial reporting and the preparation of financial statements for external purposes in accordance with generally accepted accounting principles. A company’s internal control over financial reporting includes those policies and procedures that (1) pertain to the maintenance of records that, in reasonable detail, accurately and fairly reflect the transactions and dispositions of the assets of the company; (2) provide reasonable assurance that transactions are recorded as necessary to permit preparation of financial statements in accordance with generally accepted accounting principles, and that receipts and expenditures of the company are being made only in accordance with authorizations of management and directors of the company; and (3) provide reasonable assurance regarding prevention or timely detection of unauthorized acquisition, use, or disposition of the company’s assets that could have a material effect on the financial statements.
Because of its inherent limitations, internal control over financial reporting may not prevent or detect misstatements. Also, projections of any evaluation of effectiveness to future periods are subject to the risk that controls may become inadequate because of changes in conditions, or that the degree of compliance with the policies or procedures may deteriorate.
/s/
February 28, 2023
54
REPORT OF INDEPENDENT REGISTERED PUBLIC ACCOUNTING FIRM
To the Stockholders and the Board of Directors of Steel Dynamics, Inc.
Opinion on the Financial Statements
We have audited the accompanying consolidated balance sheets of Steel Dynamics, Inc. (the Company) as of December 31, 2022 and 2021, the related consolidated statements of income, comprehensive income, equity and cash flows for each of the three years in the period ended December 31, 2022, and the related notes (collectively referred to as the “consolidated financial statements”). In our opinion, the consolidated financial statements present fairly, in all material respects, the financial position of the Company at December 31, 2022 and 2021, and the results of its operations and its cash flows for each of the three years in the period ended December 31, 2022, in conformity with U.S. generally accepted accounting principles.
We also have audited, in accordance with the standards of the Public Company Accounting Oversight Board (United States) (PCAOB), the Company’s internal control over financial reporting as of December 31, 2022, based on criteria established in Internal Control-Integrated Framework issued by the Committee of Sponsoring Organizations of the Treadway Commission (2013 framework), and our report dated February 28, 2023 expressed an unqualified opinion thereon.
Basis for Opinion
These financial statements are the responsibility of the Company's management. Our responsibility is to express an opinion on the Company’s financial statements based on our audits. We are a public accounting firm registered with the PCAOB and are required to be independent with respect to the Company in accordance with the U.S. federal securities laws and the applicable rules and regulations of the Securities and Exchange Commission and the PCAOB.
We conducted our audits in accordance with the standards of the PCAOB. Those standards require that we plan and perform the audit to obtain reasonable assurance about whether the financial statements are free of material misstatement, whether due to error or fraud. Our audits included performing procedures to assess the risks of material misstatement of the financial statements, whether due to error or fraud, and performing procedures that respond to those risks. Such procedures included examining, on a test basis, evidence regarding the amounts and disclosures in the financial statements. Our audits also included evaluating the accounting principles used and significant estimates made by management, as well as evaluating the overall presentation of the financial statements. We believe that our audits provide a reasonable basis for our opinion.
Critical Audit Matter
The critical audit matter communicated below is a matter arising from the current period audit of the financial statements that was communicated or required to be communicated to the audit committee and that: (1) relates to accounts or disclosures that are material to the financial statements and (2) involved our especially challenging, subjective or complex judgments. The communication of the critical audit matter does not alter in any way our opinion on the consolidated financial statements, taken as a whole, and we are not, by communicating the critical audit matter below, providing a separate opinion on the critical audit matter or on the account or disclosure to which it relates.
55
Valuation of Goodwill | |
Description of | At December 31, 2022, the Company’s goodwill was approximately $502 million. As discussed in Note 1 of the consolidated financial statements, the Company performs an impairment test for goodwill at least annually or when indicators of impairment exist. |
Auditing management’s goodwill impairment test was complex and judgmental due to the significant estimation required to determine the fair value of the reporting units. In particular, the fair value estimate was sensitive to significant assumptions, such as estimates of future cash flows and changes in the risk-adjusted discount rate, which are affected by expectations about future market or economic conditions and the impact of planned business and operation strategies. |
How We | We obtained an understanding, evaluated the design and tested the operating effectiveness of controls over the Company’s goodwill impairment review process, including controls over management’s review of the assumptions and methodologies used in the calculation of the fair value of the reporting units, as well as the Company’s review of the completeness and accuracy of the data used in the Company’s analysis. |
To test the estimated fair value of each of the Company’s reporting units, we performed audit procedures that included, among others, testing the underlying assumptions used in the Company’s analysis, testing the completeness and accuracy of the underlying estimates of future cash flows used by management and testing the calculation of the fair value of each reporting unit. We compared the assumptions used by management to historical results. We assessed the historical accuracy of management’s estimates and performed sensitivity analyses over certain assumptions used by management to evaluate the changes in the fair value of each of the reporting units that would result from changes in those assumptions. |
/s/ Ernst & Young LLP
We have served as the Company’s auditor since 1999.
Indianapolis, Indiana
February 28, 2023
56
STEEL DYNAMICS, INC.
CONSOLIDATED BALANCE SHEETS
(in thousands, except share data)
| ||||||
December 31, | ||||||
Assets | 2022 | 2021 | ||||
Current assets | ||||||
Cash and equivalents | $ | | $ | | ||
Short-term investments | | - | ||||
Accounts receivable, net of allowances for credit losses of $ | ||||||
as of December 31, 2022, and December 31, 2021, respectively | | | ||||
Accounts receivable-related parties | |