UNITED STATES
SECURITIES AND EXCHANGE COMMISSION
Washington, D.C. 20549
FORM 10-K
(Mark One)
x | ANNUAL REPORT PURSUANT TO SECTION 13 OR 15(d) OF THE SECURITIES EXCHANGE ACT OF 1934 |
For the fiscal year ended January 28, 2017
or
¨ | TRANSITION REPORT PURSUANT TO SECTION 13 OR 15(d) OF THE SECURITIES EXCHANGE ACT OF 1934 |
For the transition period from to
Commission file number 001-12107
ABERCROMBIE & FITCH CO.
(Exact name of registrant as specified in its charter)
Delaware | 31-1469076 | |
(State or other jurisdiction of incorporation or organization) | (I.R.S. Employer Identification No.) | |
6301 Fitch Path, New Albany, Ohio | 43054 | |
(Address of principal executive offices) | (Zip Code) | |
Registrant’s telephone number, including area code: (614) 283-6500
Securities registered pursuant to Section 12(b) of the Act:
Title of each class | Name of each exchange on which registered | |
Class A Common Stock, $0.01 Par Value | New York Stock Exchange | |
Securities registered pursuant to Section 12(g) of the Act: None
Indicate by check mark if the Registrant is a well-known seasoned issuer, as defined in Rule 405 of the Securities Act. x Yes ¨ No
Indicate by check mark if the Registrant is not required to file reports pursuant to Section 13 or Section 15(d) of the Act. ¨ Yes x No
Indicate by check mark whether the Registrant (1) has filed all reports required to be filed by Section 13 or 15(d) of the Securities Exchange Act of 1934 during the preceding 12 months (or for such shorter period that the Registrant was required to file such reports), and (2) has been subject to such filing requirements for the past 90 days. x Yes ¨ No
Indicate by check mark whether the Registrant has submitted electronically and posted on its corporate Web site, if any, every Interactive Data File required to be submitted and posted pursuant to Rule 405 of Regulation S-T during the preceding 12 months (or for such shorter period that the Registrant was required to submit and post such files). x Yes ¨ No
Indicate by check mark if disclosure of delinquent filers pursuant to Item 405 of Regulation S-K is not contained herein, and will not be contained, to the best of Registrant’s knowledge, in definitive proxy or information statements incorporated by reference in Part III of this Form 10-K or any amendment to this Form 10-K. ¨
Indicate by check mark whether the Registrant is a large accelerated filer, an accelerated filer, a non-accelerated filer, or a smaller reporting company. See the definitions of “large accelerated filer,” “accelerated filer” and “smaller reporting company” in Rule 12b-2 of the Exchange Act:
Large accelerated filer x | Accelerated filer ¨ | Non-accelerated filer ¨ | Smaller reporting company ¨ | |||
(Do not check if a smaller reporting company) | ||||||
Indicate by check mark whether the Registrant is a shell company (as defined in Rule 12b-2 of the Act). ¨ Yes x No
Aggregate market value of the Registrant’s Class A Common Stock (the only outstanding common equity of the Registrant) held by non-affiliates of the Registrant (for this purpose, executive officers and directors of the Registrant are considered affiliates) as of July 29, 2016: $1,390,361,149.
Number of shares outstanding of the Registrant’s common stock as of March 22, 2017: 67,985,481 shares of Class A Common Stock.
DOCUMENT INCORPORATED BY REFERENCE:
Portions of the Registrant’s definitive proxy statement for the Annual Meeting of Stockholders, to be held on June 15, 2017, are incorporated by reference into Part III of this Annual Report on Form 10-K.
ABERCROMBIE & FITCH CO.
TABLE OF CONTENTS
ITEM 1. | ||
ITEM 1A. | ||
ITEM 1B. | ||
ITEM 2. | ||
ITEM 3. | ||
ITEM 4. | ||
ITEM 5. | ||
ITEM 6. | ||
ITEM 7. | ||
ITEM 7A. | ||
ITEM 8. | ||
ITEM 9. | ||
ITEM 9A. | ||
ITEM 9B. | ||
ITEM 10. | ||
ITEM 11. | ||
ITEM 12. | ||
ITEM 13. | ||
ITEM 14. | ||
ITEM 15. | ||
ITEM 16. | ||
PART I
ITEM 1. | BUSINESS. |
GENERAL.
Abercrombie & Fitch Co. (“A&F”), a company incorporated in Delaware in 1996, through its subsidiaries (collectively, A&F and its subsidiaries are referred to as “Abercrombie & Fitch” or the “Company”), is a specialty retailer who primarily sells its products through store and direct-to-consumer operations, as well as through various wholesale, franchise and licensing arrangements. The Company offers a broad array of apparel products, including knit tops, woven shirts, graphic t-shirts, fleece, sweaters, jeans, woven pants, shorts, outerwear, dresses, intimates and swimwear; and personal care products and accessories for men, women and kids under the Abercrombie & Fitch, abercrombie kids, Hollister and Gilly Hicks brands. The Company has operations in North America, Europe, Asia and the Middle East. As of January 28, 2017, the Company operated 709 stores in the United States (“U.S.”) and 189 stores outside of the U.S.
The Company’s fiscal year ends on the Saturday closest to January 31, typically resulting in a fifty-two week year, but occasionally giving rise to an additional week, resulting in a fifty-three week year. Fiscal years are designated in the consolidated financial statements and notes, as well as the remainder of this Annual Report on Form 10-K, by the calendar year in which the fiscal year commenced. All references herein to “Fiscal 2016” represent the fifty-two week fiscal year ended January 28, 2017; to “Fiscal 2015” represent the fifty-two week fiscal year ended January 30, 2016; and to “Fiscal 2014” represent the fifty-two week fiscal year ended January 31, 2015. In addition, all references herein to “Fiscal 2017” represent the fifty-three week fiscal year that will end on February 3, 2018.
A&F makes available free of charge on its Internet website, www.abercrombie.com, under “Investors, SEC Filings,” its annual reports on Form 10-K, quarterly reports on Form 10-Q, current reports on Form 8-K and amendments to those reports filed or furnished pursuant to Section 13(a) or Section 15(d) of the Securities Exchange Act of 1934, as amended (the “Exchange Act”), as well as A&F’s definitive proxy materials filed pursuant to Section 14 of the Exchange Act, as soon as reasonably practicable after A&F electronically files such material with, or furnishes it to, the Securities and Exchange Commission (“SEC”). The SEC maintains a website that contains electronic filings by A&F and other issuers at www.sec.gov. In addition, the public may read and copy any materials A&F files with the SEC at the SEC’s Public Reference Room at 100 F Street, N.E., Washington, D.C. 20549. The public may obtain information on the operation of the Public Reference Room by calling the SEC at 1-800-SEC-0330.
The Company has included its Internet website addresses throughout this filing as textual references only. The information contained within these Internet websites is not incorporated into this Annual Report on Form 10-K.
DESCRIPTION OF OPERATIONS.
Brands.
Abercrombie & Fitch. The Abercrombie & Fitch brand is the iconic global specialty retailer of high quality, casual luxury apparel and accessories for men and women. With an updated attitude that reflects the confidence of today’s 20+ consumer, Abercrombie & Fitch remains true to its 125-year heritage of creating expertly crafted products with an effortless, American style. It is the namesake brand of Abercrombie & Fitch Co.
abercrombie kids. abercrombie kids creates smart and creative apparel of enduring quality that celebrates the wide-eyed wonder of children from 3 to 14 years. Its products are made for play - tough enough to stand up to everyday adventures, while never compromising comfort, softness or safety.
Hollister. The quintessential retail brand of the global teen consumer, Hollister celebrates the liberating spirit of the endless summer inside everyone. Inspired by California’s laidback attitude, Hollister’s clothes are designed to be lived in and made your own, for wherever life takes you. Hollister provides an engaging, welcoming and unique shopping experience around the globe.
Gilly Hicks. Gilly Hicks, “the brand to start and end your day with,” carries bras, bralettes, undies, swimwear, loungewear and sleepwear. Gilly Hicks product is designed to be effortless and comfortable to align with our customers’ on-the-go, busy lifestyle.
Refer to the “RESULTS OF OPERATIONS” in “ITEM 7. MANAGEMENT’S DISCUSSION AND ANALYSIS OF FINANCIAL CONDITION AND RESULTS OF OPERATIONS” of this Annual Report on Form 10-K for information regarding net sales by brand and by geography.
3
FINANCIAL INFORMATION ABOUT SEGMENTS.
The Company determines its segments on the same basis that it uses to allocate resources and assess performance. All of the Company’s operating segments sell a similar group of products — apparel, personal care products and accessories for men, women and kids. The Company determined its brand-based operating segments as of January 28, 2017 to be Abercrombie, which includes the Company’s Abercrombie & Fitch and abercrombie kids brands; and Hollister, which includes the Company's Hollister and Gilly Hicks brands. These operating segments have similar economic characteristics, classes of consumers, products and production and distribution methods, and have been aggregated into one reportable segment. Refer to Note 17, “SEGMENT REPORTING,” of the Notes to Consolidated Financial Statements included in “ITEM 8. FINANCIAL STATEMENTS AND SUPPLEMENTARY DATA” of this Annual Report on Form 10-K for further discussion of the Company’s operating segments and reportable segment.
The following charts illustrate the Company's net sales mix by brand and geography for Fiscal 2016:
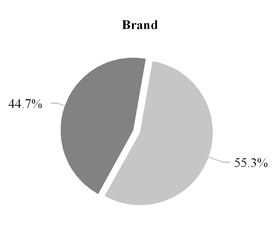

Abercrombie(1) | Hollister(2) | International | United States | |||||
(1) Includes Abercrombie & Fitch and abercrombie kids brands.
(2) Includes Hollister and Gilly Hicks brands.
STORE OPERATIONS.
At the end of Fiscal 2016, the Company operated 898 stores. The following table details the number of retail stores operated by the Company at January 28, 2017:
Abercrombie(1) | Hollister(2) | Total | ||||
United States | 311 | 398 | 709 | |||
International | 44 | 145 | 189 | |||
Total | 355 | 543 | 898 | |||
(1) | Includes Abercrombie & Fitch and abercrombie kids brands. Excludes one international franchise store as of January 28, 2017. |
(2) | Includes Hollister and Gilly Hicks brands. Excludes three international franchise stores as of January 28, 2017. |
CUSTOMER ENGAGEMENT.
We put the customer at the center of everything we do. The Company seeks to intimately understand its customers and inspire them through rich brand experiences wherever, whenever and however they choose to shop. The Company engages with its customers through in-store interactions, social media platforms, mobile applications, loyalty programs, online surveys and customer reviews, and is continuously receiving and responding to customer feedback. Our Abercrombie and Hollister customer relationship management programs provide a platform to develop direct relationships with our customers. Our brands have a strong base of globally diverse followers on key social media platforms. The Company also engages with key influencers such as celebrities, bloggers and stylists to share its product and communicate its brand identity. The Company endeavors to be at the forefront of exploring new ways in which our customers may want to engage with our brands. This allows us to better understand who our customers are, what they value and aspire to, how they shop and behave and what they expect from our brands.
4
OMNICHANNEL AND DIRECT-TO-CONSUMER OPERATIONS.
As our customers increasingly shop across multiple channels, the Company has developed, and continues to expand, its robust omnichannel capabilities. These capabilities now include “ship-from-store,” “order-in-store,” “reserve-in-store” and “purchase-online-pickup-in-store.” The Company continues to invest in these and other omnichannel initiatives in order to create a more seamless shopping experience for its customers.
The Company operates 30 desktop and mobile websites for its brands globally. The websites are available in 11 languages, accept 29 currencies and ship to more than 120 countries. Total net sales through direct-to-consumer operations, including shipping and handling revenue, were $856.8 million for Fiscal 2016, representing approximately 26% of total net sales.
WHOLESALE, FRANCHISE AND LICENSING OPERATIONS .
The Company continues to expand its brand reach through various wholesale, franchise and licensing arrangements. Total net sales from wholesale, franchise and licensing operations were $36.1 million for Fiscal 2016, representing approximately 1% of total net sales. As of January 28, 2017, the Company's franchisees operated four international franchise stores, all of which are located in Mexico.
MERCHANDISE SUPPLIERS.
Meeting the Company's objective of delivering compelling, on-trend, high-quality product assortments to its customers is dependent upon its network of third-party vendors. During Fiscal 2016, the Company sourced merchandise through approximately 150 vendors located throughout the world, primarily in Asia and Central America. The Company did not source more than 10% of its merchandise from any single factory or supplier during Fiscal 2016. The Company pursues a global sourcing strategy that includes relationships with vendors in 17 countries, as well as the U.S. The Company’s foreign sourcing of merchandise is negotiated and settled in U.S. Dollars.
All product sources, including independent manufacturers and suppliers, must achieve and maintain the Company’s high quality standards, which are an integral part of the Company’s identity. The Company has established supplier product quality standards to ensure the high quality of fabrics and other materials used in the Company’s products. The Company utilizes both home office and field employees to help monitor compliance with the Company’s supplier product quality standards.
Before the Company begins production, factories, including subcontractors of the factories, must go through a quality assurance assessment to ensure they meet Company standards. All factories are contractually required to adhere to the Company's Vendor Code of Conduct, and go through social audits, which include on-site walk-throughs to appraise the physical working conditions and health and safety practices, and to review payroll and age documentation. Social audits of the factories are performed at least every two years after the initial audit. The Company partners with suppliers that respect local laws and share our dedication to utilizing best practices in human rights, labor rights, environmental practices and workplace safety.
DISTRIBUTION AND MERCHANDISE INVENTORY.
The Company's distribution network is built to deliver stock to its stores and fulfill direct-to-consumer orders with speed and efficiency. The Company’s merchandise is shipped to the Company’s distribution centers (“DCs”) where it is received and inspected before being shipped to stores or direct-to-consumer customers. The Company has two Company-owned DCs located in New Albany, Ohio, one of which is a dedicated direct-to-consumer facility, and one third-party DC located in Reno, Nevada that service our North American stores and direct-to-consumer customers outside of Europe and Asia. The Company uses a third-party DC in the Netherlands for the distribution of merchandise to stores and direct-to-consumer customers located in Europe, a third-party DC in China for the distribution of merchandise to stores and direct-to-consumer customers located in China, a third-party DC in Hong Kong for the distribution of merchandise to stores and direct-to-consumer customers located in Asia, and a third-party DC in the United Arab Emirates for the distribution of merchandise to stores located in the Middle East. The Company utilizes primarily one contract carrier to ship merchandise and related materials to its North American stores and direct-to-consumer customers, and several contract carriers for its European and Asian stores and direct-to-consumer customers.
5
INFORMATION SYSTEMS.
The Company’s management information systems consist of a full range of retail, merchandising and financial systems. The systems include applications related to point-of-sale, direct-to-consumer, inventory management, supply chain, planning, sourcing, merchandising and financial reporting. The Company continues to invest in technology to upgrade core systems to enhance efficiencies, including the support of its direct-to-consumer operations, omnichannel capabilities, customer relationship management tools and loyalty programs.
SEASONAL BUSINESS.
The retail apparel market has two principal selling seasons: the Spring season which includes the first and second fiscal quarters (“Spring”); and the Fall season which includes the third and fourth fiscal quarters (“Fall”). As is typical in the apparel industry, the Company experiences its greatest sales activity during the Fall season due to Back-to-School (August) and Holiday (November and December) sales periods.
TRADEMARKS.
The trademarks Abercrombie & Fitch®, abercrombie®, Hollister®, Gilly Hicks® and the “Moose” and “Seagull” logos are registered with the U.S. Patent and Trademark Office and registered or pending with the registries of countries where stores are located or likely to be located in the future. In addition, these trademarks are either registered, or the Company has applications for registration pending, with the registries of many of the foreign countries in which the manufacturers of the Company’s products are located. The Company has also registered, or has applied to register, certain other trademarks in the U.S. and around the world. The Company believes its products are identified by its trademarks and, therefore, its trademarks are of significant value. Each registered trademark has a duration of 10 to 20 years, depending on the date it was registered, and the country in which it is registered, and is subject to an indefinite number of renewals for a like period upon continued use and appropriate application. The Company intends to continue using its core trademarks and to renew each of its registered trademarks that remain in use.
COMPETITION.
We operate in a rapidly evolving and highly competitive retail business environment. Our competitors include individual and chain specialty apparel retailers, local, regional, national and international department stores, discount stores and online businesses. Additionally, there is competition for consumer discretionary spending from other product and experiential categories, such as technology, restaurants, travel and media content.
Consumers are increasingly shopping online and via mobile devices, which enable consumers to quickly and conveniently comparison shop for product availability and by price.
We compete primarily on the basis of brand experience, customer service, product selection, quality, store location and price.
ASSOCIATE RELATIONS.
As of March 22, 2017, the Company employed approximately 43,000 associates, of which approximately 35,000 were part-time associates, which equates to approximately 5,000 full-time equivalents. On average, the Company employed approximately 16,000 full-time equivalents during Fiscal 2016.
The Company believes it maintains a good relationship with its associates. However, in the normal course of business, the Company is party to lawsuits involving former and current associates.
ENVIRONMENTAL MATTERS.
Compliance with domestic and international regulations related to environmental matters has not had, nor is it expected to have, any material effect on the Company’s capital expenditures, earnings or competitive position based on information and circumstances known to the Company at this time.
OTHER INFORMATION.
Additional information about the Company’s business, including its revenues and profits for the last three fiscal years and gross square footage of stores, is set forth under “ITEM 7. MANAGEMENT’S DISCUSSION AND ANALYSIS OF FINANCIAL CONDITION AND RESULTS OF OPERATIONS” of this Annual Report on Form 10-K.
6
EXECUTIVE OFFICERS OF THE REGISTRANT.
Set forth below is certain information regarding the executive officers of A&F as of March 22, 2017:
Stacia Andersen, 46, has been Brand President of Abercrombie & Fitch and abercrombie kids since June 2016. Prior to joining A&F, Ms. Andersen served in various positions with Target Corporation (“Target”), a general merchandise retailer selling products through Target stores and digital channels, from 1993 until December 2015. Most recently, Ms. Andersen served as Senior Vice President Merchandising, Apparel, Accessories and Baby, from May 2014 to December 2015, and as Senior Vice President Merchandising, Home and Seasonal from October 2009 to May 2014. Prior to serving as a Senior Vice President Merchandising, Ms. Andersen served as President, Target Sourcing Services/Associated Merchandising Corporation, from February 2006 to October 2009, and before that, in various sourcing and merchandising positions.
Robert E. Bostrom, 64, has been Senior Vice President, General Counsel and Corporate Secretary of A&F since January 2014. Since August 2014, Mr. Bostrom has been a member of the Board of Directors of NeuLion, Inc. From December 2012 to December 2013, Mr. Bostrom was Co-Chairman of the Financial Regulatory and Compliance Practice of Greenberg Traurig LLP, an international law firm. From August 2011 to November 2012, Mr. Bostrom was Co-Head of the Global Financial Institutions and Funds Sector of Dentons US LLP (formerly, SNR Denton), an international law firm. From February 2006 to August 2011, Mr. Bostrom was Executive Vice President, General Counsel and Corporate Secretary of the Federal Home Loan Mortgage Corporation (also known as Freddie Mac). Prior to Freddie Mac, Mr. Bostrom was the Managing Partner of the New York office of Winston & Strawn LLP, a Member of that firm’s Executive Committee and Head of its Financial Institutions Practice.
Joanne C. Crevoiserat, 53, has been Executive Vice President, Chief Operating Officer and Chief Financial Officer of A&F since February 2017, Executive Vice President and Chief Financial Officer of A&F since May 2014. Ms. Crevoiserat served as Interim Principal Executive Officer of A&F from June 2016 to February 2017 and a member of the Office of the Chairman of A&F from October 2015 to February 2017. Prior to joining A&F, Ms. Crevoiserat served in a number of senior management roles at Kohl’s Inc., which operates family-oriented department stores and a website featuring apparel, footwear, accessories, soft home products and housewares. From June 2012 to April 2014, Ms. Crevoiserat was the Executive Vice President of Finance of Kohl’s and from November 2008 to June 2012, she served as the Executive Vice President of Merchandise Planning and Allocation of Kohl’s. Prior to her time with Kohl’s, Ms. Crevoiserat held senior finance positions with Wal-Mart Stores and May Department Stores, including Chief Financial Officer of the Filene’s, Foley’s and Famous-Barr brands.
Fran Horowitz, 53, has been Chief Executive Officer and a director of A&F since February 2017. Prior thereto, she had served as President & Chief Merchandising Officer for all brands of A&F since December 2015 and was a member of the Office of the Chairman of A&F from December 2014 to February 2017. Ms. Horowitz also held the position of Brand President of Hollister from October 2014 to December 2015. Before joining Hollister, from October 2013 to October 2014, Ms. Horowitz served as the President of Ann Taylor Loft, a division of Ann Inc., the parent company of three specialty retail fashion brands in North America. Prior to her time with Ann Taylor Loft, from February 2005 to October 2012, she held various roles at Express, Inc., a specialty apparel and accessories retailer of women’s and men’s merchandise, including Executive Vice President of Women’s Merchandising and Design from May 2010 to November 2012. Before her time with Express, Inc., Ms. Horowitz spent 13 years at Bloomingdale’s in various women’s merchandising roles, including Vice President Divisional Merchandise Manager. Since March 2017, Ms. Horowitz has served on the Board of Directors of SeriousFun Children's Network, Inc., a Connecticut non-profit corporation.
Kristin Scott, 49, has been Brand President of Hollister since August 2016. Before joining Hollister, she served in various positions with Victoria’s Secret, a specialty retailer of women’s intimate and other apparel which sells products at Victoria’s Secret stores and online, from December 2007 until April 2016. Most recently, Ms. Scott served as Executive Vice President, GMM Merchandising from March 2013 to April 2016, Senior Vice President, GMM Merchandising from March 2009 to March 2013 and Senior Vice President, GMM Merchandising - Stores from December 2007 to March 2009. Prior to her time with Victoria’s Secret, Ms. Scott served in merchandising positions at the Vice President level with Gap Outlet, Marshall Fields and Target.
As previously announced, in conjunction with the appointment of Fran Horowitz to Chief Executive Officer of A&F, the Board dissolved the Office of the Chairman, effective February 1, 2017. The Office of the Chairman was formed in December 2014 to allow for effective management of the Company during a transition in leadership. The executive officers serve at the pleasure of the Board of Directors of A&F.
7
ITEM 1A. | RISK FACTORS |
FORWARD-LOOKING STATEMENTS AND RISK FACTORS.
We caution that any forward-looking statements (as such term is defined in the Private Securities Litigation Reform Act of 1995) contained in this Annual Report on Form 10-K or made by us, our management or our spokespeople involve risks and uncertainties and are subject to change based on various factors, many of which may be beyond our control. Words such as “estimate,” “project,” “plan,” “believe,” “expect,” “anticipate,” “intend” and similar expressions may identify forward-looking statements. Except as may be required by applicable law, we undertake no obligation to publicly update or revise any forward-looking statements.
Forward-looking statements are not guarantees of future performance and involve certain risks, uncertainties and assumptions that are difficult to predict. The following factors, among others, could affect our financial performance and could cause actual results to differ materially from those expressed or implied in any of the forward-looking statements:
• | changes in global economic and financial conditions, and the resulting impact on consumer confidence and consumer spending, as well as other changes in consumer discretionary spending habits, could have a material adverse effect on our business, results of operations and liquidity; |
• | our inability to anticipate customer demand and changing fashion trends and to manage our inventory commensurately could adversely impact our sales levels and profitability; |
• | our market share may be negatively impacted by increasing competition and pricing pressures from companies with brands or merchandise competitive with ours; |
• | direct-to-consumer sales channels are a significant component of our growth strategy, and the failure to successfully develop our position in these channels could have an adverse impact on our results of operations; |
• | our ability to conduct business in international markets may be adversely affected by legal, regulatory, political and economic risks; |
• | our inability to successfully implement our strategic plans could have a negative impact on our growth and profitability; |
• | our failure to protect our reputation could have a material adverse effect on our brands; |
• | our business could suffer if our information technology systems are disrupted or cease to operate effectively; |
• | we may be exposed to risks and costs associated with cyber-attacks, credit card fraud and identity theft that would cause us to incur unexpected expenses and reputation loss; |
• | fluctuations in foreign currency exchange rates could adversely impact our financial condition and results of operations; |
• | changes in the cost, availability and quality of raw materials, labor, transportation and trade relations could cause manufacturing delays and increase our costs; |
• | we depend upon independent third parties for the manufacture and delivery of all our merchandise, and a disruption of the manufacture or delivery of our merchandise could result in lost sales and could increase our costs; |
• | our ability to attract customers to our stores depends, in part, on the success of the shopping malls or area attractions that our stores are located in or around; |
• | we rely on the experience and skills of our senior executive officers, the loss of whom could have a material adverse effect on our business; |
• | our reliance on DCs makes us susceptible to disruptions or adverse conditions affecting our supply chain; |
• | our litigation exposure could have a material adverse effect on our financial condition and results of operations; |
• | our inability or failure to adequately protect our trademarks could have a negative impact on our brand image and limit our ability to penetrate new markets; |
• | fluctuations in our tax obligations and effective tax rate may result in volatility in our operating results; |
• | extreme weather conditions and the seasonal nature of our business may cause net sales to fluctuate and negatively impact our results of operations; |
• | our facilities, systems and stores, as well as the facilities and systems of our vendors and manufacturers, are vulnerable to natural disasters, pandemic disease and other unexpected events, any of which could result in an interruption to our business and adversely affect our operating results; |
• | the impact of war or acts of terrorism could have a material adverse effect on our operating results and financial condition; |
• | changes in the regulatory or compliance landscape could adversely affect our business and results of operations; |
• | our Asset-Based Revolving Credit Agreement and our Term Loan Agreement include restrictive covenants that limit our flexibility in operating our business; and, |
• | compliance with changing regulations and standards for accounting, corporate governance and public disclosure could adversely affect our business, results of operations and reported financial results. |
This list of important factors is not exclusive.
8
The following sets forth a description of the preceding risk factors that we believe may be relevant to an understanding of our business. These risk factors could cause actual results to differ materially from those expressed or implied in any of our forward-looking statements.
Changes in global economic and financial conditions, and the resulting impact on consumer confidence and consumer spending, as well as other changes in consumer discretionary spending habits, could have a material adverse effect on our business, results of operations and liquidity.
Our business depends on consumer demand for our merchandise. Consumer purchases of discretionary items, including our merchandise, can be adversely impacted by recessionary periods and other periods where disposable income is adversely affected. Our performance is subject to factors that affect worldwide economic conditions including unemployment, consumer credit availability, consumer debt levels, reductions in net worth based on declines in the financial, residential real estate and mortgage markets, sales and personal income tax rates, fuel and energy prices, interest rates, consumer confidence in future economic and political conditions, consumer perceptions of personal well-being and security, the value of the U.S. Dollar versus foreign currencies and other macroeconomic factors. Additionally, changes in consumer preferences and discretionary spending habits may negatively impact the specialty retail market. Global economic uncertainty and changing consumer preferences and discretionary spending habits could have a material adverse effect on our results of operations, liquidity and capital resources if reduced consumer demand for our merchandise should occur. It could also impact our ability to fund growth and/or result in our becoming reliant on external financing, the availability and cost of which may be uncertain.
The economic conditions and factors described above could adversely affect the productivity of our stores, as well as adversely affect the pace of opening new stores, or their productivity once opened. Finally, the economic environment may exacerbate some of the risks noted below, including consumer demand, strain on available resources, our international growth strategy, availability of real estate, interruption of the flow of merchandise from key vendors and manufacturers, and foreign currency exchange rate fluctuations.
Our inability to anticipate customer demand and changing fashion trends and to manage our inventory commensurately could adversely impact our sales levels and profitability.
Our success largely depends on our ability to anticipate and gauge the fashion preferences of our customers and provide merchandise that satisfies constantly shifting demands in a timely manner. Because we enter into agreements for the manufacture and purchase of merchandise well in advance of the applicable selling season, we are vulnerable to changes in consumer preferences and demand, pricing shifts, and the sub-optimal selection and timing of merchandise purchases. Moreover, there can be no assurance that we will continue to anticipate consumer demands and accurately plan inventory successfully in the future. Changing consumer preferences and fashion trends, whether we are able to anticipate, identify and respond to them or not, could adversely impact our sales. Inventory levels for certain merchandise styles no longer considered to be “on trend” may increase, leading to higher markdowns to sell through excess inventory and therefore, lower than planned margins. A distressed economic and retail environment, in which many of our competitors continue to engage in aggressive promotional activities increases the importance of reacting appropriately to changing consumer preferences and fashion trends. Conversely, if we underestimate consumer demand for our merchandise, or if our manufacturers fail to supply quality products in a timely manner, we may experience inventory shortages, which may negatively impact customer relationships, diminish brand loyalty and result in lost sales. Any of these events could significantly harm our operating results and financial condition.
9
Our market share may be negatively impacted by increasing competition and pricing pressures from companies with brands or merchandise competitive with ours.
The sale of apparel and personal care products through stores and direct-to-consumer channels is a highly competitive business with numerous participants, including individual and chain specialty apparel retailers, local, regional, national and international department stores, discount stores and online businesses. The substantial sales growth in the direct-to-consumer channel within the last few years has encouraged the entry of many new competitors and an increase in competition from established companies. We face a variety of competitive challenges, including:
• | anticipating and quickly responding to changing consumer demands or preferences better than our competitors; |
• | maintaining favorable brand recognition and effective marketing of our products to consumers in several diverse demographic markets; |
• | sourcing merchandise efficiently; |
• | developing innovative, high-quality merchandise in styles that appeal to our consumers and in ways that favorably distinguish us from our competitors; and, |
• | countering the aggressive pricing and promotional activities of many of our competitors without diminishing the aspirational nature of our brands and brand equity. |
In light of the competitive challenges we face, we may not be able to compete successfully in the future. Further, increases in competition could reduce our sales and harm our operating results and business.
Direct-to-consumer sales channels are a significant component of our growth strategy, and the failure to successfully develop our position in these channels could have an adverse impact on our results of operations.
We sell merchandise for each brand over the Internet, both domestically and internationally. Consumers are increasingly shopping online and via mobile devices, and we have made significant investments in capital spending and labor to develop these channels, invested in digital media to attract new customers and developed localized fulfillment, shipping and customer service operations. There is no assurance that we will be able to continue to successfully maintain or expand our direct-to-consumer sales channels and respond to shifting consumer traffic patterns and direct-to-consumer buying trends. As omnichannel retailing continues to grow and evolve, our customers increasingly interact with our brands through a variety of media including smart phones and tablets, and our success depends on our ability to introduce innovative means of engaging our customers. Our inability to adequately respond to these risks and uncertainties or to successfully maintain and expand our direct-to-consumer business may have an adverse impact on our results of operations.
In addition, direct-to-consumer operations are subject to numerous risks, including reliance on third-party computer hardware/software and service providers, data breaches, violations of state, federal or international laws, including those relating to online privacy, credit card fraud, telecommunication failures and electronic break-ins and similar disruptions, and disruption of Internet service. Changes in foreign governmental regulations may also negatively impact our ability to deliver product to our customers. Our failure to successfully respond to these risks might adversely affect sales in our direct-to-consumer business as well as damage our reputation and brands.
10
Our ability to conduct business in international markets may be adversely affected by legal, regulatory, political and economic risks.
We are subject to domestic laws, including the Foreign Corrupt Practices Act, in addition to the laws of the foreign countries in which we operate. If any of our overseas operations, or our associates or agents, violate such laws, we could become subject to sanctions or other penalties that could negatively affect our reputation, business and operating results.
Additionally, we may face operational issues that could negatively affect our reputation, business and operating results, unless we can:
• | address the different operational characteristics present in each country in which we operate, including employment and labor, transportation, logistics, real estate, lease provisions and local reporting or legal requirements; |
• | hire, train and retain qualified personnel; |
• | maintain good relations with individual associates and groups of associates; |
• | avoid work stoppages or other labor-related issues in our European stores where associates are represented by workers’ councils and unions; |
• | retain acceptance from foreign customers; |
• | manage inventory effectively to meet the needs of existing stores on a timely basis; |
• | manage foreign currency exchange risks effectively. |
Failure to address one or more of the factors above could have a material adverse effect on our results of operations.
Our inability to successfully implement our strategic plans could have a negative impact on our growth and profitability.
Our ability to execute our long-term strategies successfully and in a timely fashion is subject to various risks and uncertainties as described under this “Risk Factors” section. Specifically, these risks can be categorized into market risk, execution risk and customer acceptance risk. Market risk includes consumer spending, actions of brand competitors and changes in demographics or preferences of our target customer. Achieving the goals of our long-term strategy is also dependent on us executing the strategy successfully. Finally, the initiatives we implement in connection with our long-term strategy may not resonate with our customers. It may take longer than anticipated to generate the expected benefits from our long-term strategy and there can be no guarantee that these initiatives will result in improved operating results. In addition, failure to successfully implement our long-term strategy could have a negative impact on our growth and profitability.
Our failure to protect our reputation could have a material adverse effect on our brands.
Our ability to maintain our reputation is critical to our brands. Our reputation could be jeopardized if we fail to maintain high standards for merchandise quality and integrity, if our third-party vendors fail to comply with our vendor code of conduct, if any third parties with which we have a business relationship fail to represent our brands in a manner consistent with our brand image and customer experience standards or as a result of a cyber-attack. Any negative publicity about these types of concerns may reduce demand for our merchandise. Failure to comply with ethical, social, product, labor, health and safety, accounting or environmental standards, or related political considerations, could also jeopardize our reputation and potentially lead to various adverse consumer actions, including boycotts. Public perception about our products or our stores, whether justified or not, could impair our reputation, involve us in litigation, damage our brands and have a material adverse effect on our business. Damage to our reputation or loss of consumer confidence for any of these or other reasons could have a material adverse effect on our results of operations and financial condition, as well as require additional resources to rebuild our reputation.
Our business could suffer if our information technology systems are disrupted or cease to operate effectively.
We rely heavily on our information technology systems to operate our websites; record and process transactions; respond to customer inquiries; manage inventory; purchase, sell and ship merchandise on a timely basis; and maintain cost-efficient operations. Given the significant number of transactions that are completed annually, it is vital to maintain constant operation of our computer hardware and software systems and maintain cyber security. Despite efforts to prevent such an occurrence, our information technology systems may be vulnerable from time to time to damage or interruption from computer viruses, power outages, third-party intrusions, inadvertent or intentional breach by our employees and other technical malfunctions. If our systems are damaged, or fail to function properly, we may have to make monetary investments to repair or replace the systems, and we could endure delays in our operations.
While we regularly evaluate our information technology systems and requirements, we are aware of the inherent risks associated with replacing and modifying these systems, including inaccurate system information, system disruptions and user acceptance
11
and understanding. Any material disruption or slowdown of our systems, including a disruption or slowdown caused by our failure to successfully upgrade our systems, could cause information, including data related to customer orders, to be lost or delayed. Such a loss or delay, especially if the disruption or slowdown occurred during our peak selling seasons, could have a material adverse effect on our results of operations.
We may be exposed to risks and costs associated with cyber-attacks, credit card fraud and identity theft that would cause us to incur unexpected expenses and reputation loss.
In the standard course of business, we process customer information, including payment information, through our stores and direct-to-consumer programs. Rapidly evolving technologies and types of cyber-attacks may result in this information being compromised or breached. The retail industry in particular has been the target of many recent cyber-attacks, and as a result, there is heightened concern over the security of personal information transmitted over or accessible through the Internet, consumer identity theft and user privacy. We endeavor to protect consumer identity and payment information through the implementation of security technologies, processes and procedures. It is possible that an individual or group could defeat our security measures and access sensitive customer and associate information. Actual or anticipated cyber-attacks may cause us to incur increasing costs, including costs to deploy additional personnel and protective technologies, train employees, and engage third-party experts and consultants. Exposure of customer data through any means could materially harm the Company by, but not limited to, reputation loss, regulatory fines and penalties, legal liability and costs of litigation.
Fluctuations in foreign currency exchange rates could adversely impact our financial condition and results of operations.
The functional currency of our foreign subsidiaries is generally the local currency in which each entity operates, while our consolidated financial statements are presented in U.S. Dollars. Therefore, we must translate revenues, expenses, assets and liabilities from functional currencies into U.S. Dollars at exchange rates in effect during, or at the end of the reporting period. In addition, our international subsidiaries transact in currencies other than their functional currency, including intercompany transactions, which results in foreign currency transaction gains or losses. Furthermore, we purchase substantially all of our inventory in U.S. Dollars. As a result, our sales and gross profit rate from international operations will be negatively impacted during periods of a strengthened U.S. dollar relative to the functional currencies of our foreign subsidiaries, as was the case in Fiscal 2016. Additionally, tourism spending may be affected by changes in currency exchange rates, and as a result, sales in our flagship stores and other stores with higher tourism traffic have, at times, been adversely impacted, and may continue to be adversely impacted, by fluctuations in currency exchange rates. Certain events, such as the June 2016 decision by the United Kingdom to leave the European Union (“Brexit”) and the November 2016 U.S. elections have increased global economic and political uncertainty and caused volatility in foreign currency exchange rates. Our business and results of operations may be impacted by these developments. For Fiscal 2016, 63.8%, 23.1% and 13.1% of the Company's net sales were attributable to the U.S., Europe and other geographic areas, respectively.
Changes in cost, availability and quality of raw materials, labor, transportation, and trade relations could cause manufacturing delays and increase our costs.
Changes in the cost, availability and quality of the fabrics or other raw materials used to manufacture our merchandise could have a material adverse effect on our cost of sales, or our ability to meet customer demand. The prices for such fabrics depend largely on the market prices for the raw materials used to produce them, particularly cotton, as well as the cost of compliance with sourcing laws. The price and availability of such raw materials may fluctuate significantly, depending on many factors, including crop yields and weather patterns. Such factors may be exacerbated by legislation and regulations associated with global climate change. In addition, the cost of labor at many of our third-party manufacturers has been increasing significantly, and as the middle class in developing countries continues to grow, it is unlikely such cost pressure will abate. The Company is also susceptible to fluctuations in the cost of transportation. We may not be able to pass all or a portion of higher raw materials prices or labor or transportation costs on to our customers, which could adversely affect our gross margin and results of our operations. The results of the November 2016 U.S. elections have introduced greater uncertainty with respect to trade policies, tariffs and government regulations affecting trade between the U.S. and other countries. Major developments in trade relations, such as the imposition of unilateral tariffs on imported products, could have a material adverse effect on our business, results of operations and liquidity.
12
We depend upon independent third parties for the manufacture and delivery of all our merchandise, and a disruption of the manufacture or delivery of our merchandise could result in lost sales and could increase our costs.
We do not own or operate any manufacturing facilities. As a result, the continued success of our operations is tied to our timely receipt of quality merchandise from third-party manufacturers. We source the majority of our merchandise outside of the U.S. through arrangements with approximately 150 vendors which includes foreign manufacturers located throughout the world, primarily in Asia and Central America. Political, social or economic instability in Asia and Central America, or in other regions in which our manufacturers are located, could cause disruptions in trade, including exports to the U.S. A manufacturer’s inability to ship orders in a timely manner or meet our quality standards could cause delays in responding to consumer demands and negatively affect consumer confidence or negatively impact our competitive position, any of which could have a material adverse effect on our financial condition and results of operations.
Other events that could disrupt the timely delivery of our merchandise include new trade law provisions or regulations, reliance on a limited number of shipping carriers, significant labor disputes and significant delays in the delivery of cargo due to port security considerations. Furthermore, we are susceptible to increases in fuel costs which may increase the cost of distribution. If we are not able to pass this cost on to our customers, our financial condition and results of operations could be adversely affected.
Our ability to attract customers to our stores depends, in part, on the success of the shopping malls or area attractions that our stores are located in or around.
In order to generate customer traffic, we locate many of our stores in prominent locations within successful shopping malls or street locations. Our stores benefit from the ability of the malls’ “anchor” tenants, generally large department stores and other area attractions, to generate consumer traffic in the vicinity of our stores. We cannot control the loss of an anchor or other significant tenant in a shopping mall in which we have a store; the development of new shopping malls in the U.S. or around the world; the availability or cost of appropriate locations; competition with other retailers for prominent locations; or the success of individual shopping malls. All of these factors may impact our ability to meet our productivity targets for our domestic stores and our growth objectives for our international stores and could have a material adverse effect on our financial condition or results of operations. In addition, some malls that were in prominent locations when we opened our stores may cease to be viewed as prominent. If this trend continues or if the popularity of mall shopping continues to decline generally among our customers, our sales may decline, which would impact our gross profits and net income.
Part of our future growth is dependent on our ability to operate stores in desirable locations with capital investment and lease costs providing the opportunity to earn a reasonable return. We cannot be sure as to when or whether such desirable locations will become available at reasonable costs.
We rely on the experience and skills of our senior executive officers, the loss of whom could have a material adverse effect on our business.
Our senior executive officers closely supervise all aspects of our business including the design of our merchandise and the operation of our stores. Our senior executive officers have substantial experience and expertise in the retail business and have an integral role in the growth and success of our brands. If we were to lose the benefit of the involvement of multiple senior executives, our business could be adversely affected. Competition for such senior executive officers is intense, and we cannot be sure we will be able to attract, retain and develop a sufficient number of qualified senior executive officers in future periods.
13
Our reliance on DCs makes us susceptible to disruptions or adverse conditions affecting our supply chain.
We rely on two Company-owned DCs and five third-party DCs to manage the receipt, storage, sorting, packing and distribution of our merchandise. The Company has two Company-owned DCs located in New Albany, Ohio, one of which is a dedicated direct-to-consumer facility, and one third-party DC located in Reno, Nevada that service our North American stores and direct-to-consumer customers outside of Europe and Asia. The Company uses a third-party DC in the Netherlands for the distribution of merchandise to stores and direct-to-consumer customers located in Europe, a third-party DC in China for the distribution of merchandise to stores and direct-to-consumer customers located in China, a third-party DC in Hong Kong for the distribution of merchandise to stores and direct-to-consumer customers located in Asia, and a third-party DC in the United Arab Emirates for the distribution of merchandise to stores located in the Middle East. The Company utilizes primarily one contract carrier to ship merchandise and related materials to its North American stores and direct-to-consumer customers, and several contract carriers for its European and Asian stores and direct-to-consumer customers. As a result, our operations are susceptible to local and regional factors, such as system failures, accidents, economic and weather conditions, natural disasters, demographic and population changes, as well as other unforeseen events and circumstances. If our distribution operations were disrupted, our ability to replace inventory in our stores and process direct-to-consumer and wholesale orders could be interrupted and sales could be negatively impacted.
Our litigation exposure could have a material adverse effect on our financial condition and results of operations.
We, along with third parties we do business with, are involved, from time to time, in litigation arising in the ordinary course of business. Litigation matters may include, but are not limited to, contract disputes, employment-related actions, labor relations, commercial litigation, intellectual property rights and shareholder actions. Any litigation that we become a party to could be costly and time consuming and could divert our management and key personnel from our business operations. Our current litigation exposure could be impacted by litigation trends, discovery of damaging facts with respect to legal matters pending against us or determinations by judges, juries or other finders of fact that are not in accordance with management’s evaluation of existing claims. Should management’s evaluation prove incorrect, our exposure could greatly exceed expectations and have a material adverse effect on our financial condition, results of operations or cash flows.
Our inability or failure to adequately protect our trademarks could have a negative impact on our brand image and limit our ability to penetrate new markets.
We believe our core trademarks, Abercrombie & Fitch®, abercrombie®, Hollister®, Gilly Hicks® and the “Moose” and “Seagull” logos, are an essential element of our strategy. We have obtained or applied for federal registration of these trademarks with the U.S. Patent and Trademark Office and the registries of countries where stores are located or likely to be located in the future. In addition, we own registrations and have pending applications for other trademarks in the U.S. and have applied for or obtained registrations from the registries in many foreign countries in which our stores or our manufacturers are located. There can be no assurance that we will obtain registrations that have been applied for or that the registrations we obtain will prevent the imitation of our products or infringement of our intellectual property rights by others. Although brand security initiatives are in place, we cannot guarantee that our efforts against the counterfeiting of our brands will be successful. If a third-party copies our products in a manner that projects lesser quality or carries a negative connotation, our brand image could be materially adversely affected.
Because we have not yet registered all of our trademarks in all categories, or in all foreign countries in which we source or offer our merchandise now, or may in the future, our international expansion and our merchandising of products using these marks could be limited. The pending applications for international registration of various trademarks could be challenged or rejected in those countries because third parties of whom we are not currently aware have already registered similar marks in those countries. Accordingly, it may be possible, in those foreign countries where the status of various applications is pending or unclear, for a third-party owner of the national trademark registration for a similar mark to prohibit the manufacture, sale or exportation of branded goods in or from that country. Our inability to register our trademarks or purchase or license the right to use our trademarks or logos in these jurisdictions could limit our ability to obtain supplies from, or manufacture in, less costly markets or penetrate new markets should our business plan include selling our merchandise in those non-U.S. jurisdictions.
Fluctuations in our tax obligations and effective tax rate may result in volatility in our operating results.
We are subject to income taxes in many U.S. and foreign jurisdictions. In addition, our products are subject to import and excise duties and/or sales, consumption or value-added taxes (“VAT”) in many jurisdictions. We record tax expense based on our estimates of future payments, which include reserves for estimates of probable settlements of foreign and domestic tax audits. At any one time, many tax years are subject to audit by various taxing jurisdictions. The results of these audits and negotiations with taxing authorities may affect the ultimate settlement of these issues. As a result, we expect that throughout the year there could
14
be ongoing variability in our quarterly tax rates as taxable events occur and exposures are evaluated. In addition, our effective tax rate in any given financial reporting period may be materially impacted by changes in the mix and level of earnings or losses by taxing jurisdictions or by changes to existing accounting rules or regulations. Fluctuations in duties could also have a material impact on our financial condition, results of operations or cash flows. In some international markets, we are required to hold and submit VAT to the appropriate local tax authorities. Failure to correctly calculate or submit the appropriate amounts could subject us to substantial fines and penalties that could have an adverse effect on our financial condition, results of operations or cash flows. In addition, tax law may be enacted in the future, domestically or abroad, that impacts our current or future tax structure and effective tax rate.
A number of proposals for broad U.S. corporate tax reform are currently being considered by various legislative and administrative bodies, including a border-adjustment tax, other increased taxes on imports, and limiting the ability to defer U.S. taxation on earnings outside the U.S. Such changes could have a material adverse effect on our business, results of operations and liquidity.
Extreme weather conditions and the seasonal nature of our business may cause net sales to fluctuate and negatively impact our results of operations.
Historically, our operations have been seasonal, with a significant amount of net sales and operating income occurring in the fourth fiscal quarter. Severe weather conditions and changes in weather patterns can influence customer trends, consumer traffic and shopping habits. As a result of this seasonality, net sales and net income during any fiscal quarter cannot be used as an accurate indicator of our annual results. Unseasonable weather may diminish demand for our seasonal merchandise. In addition, severe weather can also decrease customer traffic in our stores and reduce sales and profitability. As a result of this seasonality, net sales and net income during any fiscal quarter cannot be used as an accurate indicator of our annual results. Any factors negatively affecting us during the third and fourth fiscal quarters of any year, including inclement weather, could have a material adverse effect on our financial condition and results of operations for the entire year.
Our facilities, systems and stores, as well as the facilities and systems of our vendors and manufacturers, are vulnerable to natural disasters, pandemic disease and other unexpected events, any of which could result in an interruption to our business and adversely affect our operating results.
Our retail stores, corporate offices, distribution centers, infrastructure projects and direct-to-consumer operations, as well as the operations of our vendors and manufacturers, are vulnerable to damage from natural disasters, pandemic disease and other unexpected events. If any of these events result in damage to our facilities, systems or stores, or the facilities or systems of our vendors or manufacturers, we may experience interruptions in our business until the damage is repaired, resulting in the potential loss of customers and revenues. In addition, we may incur costs in repairing any damage which exceeds our applicable insurance coverage.
The impact of war or acts of terrorism could have a material adverse effect on our operating results and financial condition.
The continued threat of terrorism and the associated heightened security measures and military actions in response to acts of terrorism have disrupted commerce. Further acts of terrorism or future conflicts may disrupt commerce and undermine consumer confidence and consumer spending by causing domestic and/or tourist traffic in malls and the Company’s flagship and other stores to decline, which could negatively impact our sales revenue. Furthermore, an act of terrorism or war, or the threat thereof, or any other unforeseen interruption of commerce, could negatively impact our business by interfering with our ability to obtain merchandise from foreign manufacturers. Our inability to obtain merchandise from our foreign manufacturers or substitute other manufacturers, at similar costs and in a timely manner, could adversely affect our operating results and financial condition.
15
Changes in the regulatory or compliance landscape could adversely affect our business and results of operations.
We are subject to numerous laws and regulations, including customs, truth-in-advertising, securities laws, consumer protection, general privacy, health information privacy, identity theft, online privacy, employee health and safety, international minimum wage laws, unsolicited commercial communication and zoning and occupancy laws and ordinances that regulate retailers generally and/or govern the importation, intellectual property, promotion and sale of merchandise and the operation of retail stores, direct-to-consumer operations and distribution centers. Laws and regulations at the state, federal and international levels frequently change, and the ultimate cost of compliance cannot be precisely estimated. If these laws and regulations were to change, or were violated by our management, associates, suppliers, vendors or other parties with whom we do business, the costs of certain merchandise could increase, or we could experience delays in shipments of our merchandise, be subject to fines or penalties, temporary or permanent store closures, increased regulatory scrutiny or suffer reputational harm, which could reduce demand for our merchandise and adversely affect our business and results of operations. Any changes in regulations, the imposition of additional regulations, or the enactment of any new or more stringent legislation including the areas referenced above, could adversely affect our business and results of operations.
Our Asset-Based Revolving Credit Agreement and our Term Loan Agreement include restrictive covenants that limit our flexibility in operating our business.
Our Asset-Based Revolving Credit Agreement, as amended, expires on August 7, 2019 and our Term Loan Agreement, as amended, has a maturity date of August 7, 2021. Both our Asset-Based Revolving Credit Agreement and our Term Loan Agreement contain restrictive covenants that, subject to specified exemptions, restrict our ability to incur indebtedness, grant liens, make certain investments, pay dividends or distributions on our capital stock and engage in mergers. The inability to obtain credit on commercially reasonable terms in the future when these facilities expire could adversely impact our liquidity and results of operations. In addition, market conditions could potentially impact the size and terms of a replacement facility or facilities.
Compliance with changing regulations and standards for accounting, corporate governance and public disclosure could adversely affect our business, results of operations and reported financial results.
Changing regulatory requirements for corporate governance and public disclosure, including SEC regulations and the Financial Accounting Standards Board’s accounting standards requirements are creating additional complexities for public companies. For example, in July 2010, the Dodd-Frank Wall Street Reform and Consumer Protection Act (“the Dodd-Frank Act”), was enacted. There are significant corporate governance and executive compensation related provisions in the Dodd-Frank Act that have required the SEC to adopt additional rules and regulations in these areas.
Stockholder activism, the current political environment, financial reform legislation and the current high level of government intervention and regulatory reform may lead to substantial new regulations and disclosure obligations. In addition, the expected future requirement to transition to, or converge with, international financial reporting standards may create uncertainty and additional complexities. These changing regulatory requirements may lead to additional compliance costs, as well as the diversion of our management’s time and attention from strategic business activities and could have a significant effect on our reported results for the affected periods.
ITEM 1B. | UNRESOLVED STAFF COMMENTS |
None.
16
ITEM 2. | PROPERTIES |
The Company’s headquarters and support functions occupy 501 acres, consisting of the home office, distribution and shipping facilities centralized on a campus-like setting in New Albany, Ohio, all of which are owned by the Company. Additionally, the Company leases small facilities to house its design and sourcing support centers in Hong Kong, New York City, New York and Los Angeles, California, as well as offices in the United Kingdom, Japan, Switzerland, Italy, Hong Kong and China.
All of the retail stores operated by the Company, as of March 22, 2017, are located in leased facilities, primarily in shopping centers. The leases expire at various dates, between 2017 and 2031.
The Company’s home office, distribution and shipping facilities, design support centers and stores are currently suitable and adequate.
As of March 22, 2017, the Company’s 897 stores were located as follows:
U.S. & U.S. Territories: | ||||||||||
Alabama | 3 | Louisiana | 5 | Ohio | 26 | |||||
Arizona | 14 | Maine | 3 | Oklahoma | 4 | |||||
Arkansas | 3 | Maryland | 12 | Oregon | 6 | |||||
California | 105 | Massachusetts | 27 | Pennsylvania | 28 | |||||
Colorado | 6 | Michigan | 18 | Rhode Island | 2 | |||||
Connecticut | 15 | Minnesota | 9 | South Carolina | 8 | |||||
Delaware | 5 | Mississippi | 3 | Tennessee | 13 | |||||
District Of Columbia | 1 | Missouri | 4 | Texas | 66 | |||||
Florida | 67 | Montana | 1 | Utah | 5 | |||||
Georgia | 19 | Nebraska | 2 | Vermont | 1 | |||||
Hawaii | 7 | Nevada | 9 | Virginia | 21 | |||||
Idaho | 2 | New Hampshire | 9 | Washington | 16 | |||||
Illinois | 26 | New Jersey | 36 | West Virginia | 3 | |||||
Indiana | 10 | New Mexico | 3 | Wisconsin | 8 | |||||
Iowa | 4 | New York | 42 | Puerto Rico | 2 | |||||
Kansas | 5 | North Carolina | 16 | |||||||
Kentucky | 8 | North Dakota | 1 | |||||||
International: | ||||||||||
Austria | 6 | Hong Kong | 3 | Republic of Korea | 3 | |||||
Belgium | 3 | Ireland | 2 | Singapore | 1 | |||||
Canada | 18 | Italy | 11 | Spain | 12 | |||||
China | 27 | Japan | 11 | Sweden | 3 | |||||
Denmark | 1 | Kuwait | 2 | United Kingdom | 34 | |||||
France | 15 | Netherlands | 4 | United Arab Emirates | 6 | |||||
Germany | 25 | Poland | 1 | |||||||
17
ITEM 3. LEGAL PROCEEDINGS
The Company is a defendant in lawsuits and other adversarial proceedings arising in the ordinary course of business. Legal costs incurred in connection with the resolution of claims and lawsuits are generally expensed as incurred, and the Company establishes reserves for the outcome of litigation where losses are deemed probable and reasonably estimable. The Company’s assessment of the current exposure could change in the event of the discovery of additional facts. As of January 28, 2017, the Company had accrued charges of approximately $6 million for certain legal contingencies. In addition, there are certain claims and legal proceedings pending against the Company for which accruals have not been established. Actual liabilities may exceed the amounts reserved, and there can be no assurance that final resolution of these matters will not have a material adverse effect on the Company’s financial condition, results of operations or cash flows.
ITEM 4. | MINE SAFETY DISCLOSURES |
Not applicable.
18
PART II
ITEM 5. | MARKET FOR REGISTRANT’S COMMON EQUITY, RELATED STOCKHOLDER MATTERS AND ISSUER PURCHASES OF EQUITY SECURITIES |
A&F’s Class A Common Stock (the “Common Stock”) is traded on the New York Stock Exchange under the symbol “ANF.” The table below sets forth the high and low sales prices of A&F’s Common Stock on the New York Stock Exchange for Fiscal 2016 and Fiscal 2015:
Sales Price | ||||||||
High | Low | |||||||
Fiscal 2016 | ||||||||
4th quarter | $ | 17.35 | $ | 11.29 | ||||
3rd quarter | $ | 23.29 | $ | 14.71 | ||||
2nd quarter | $ | 27.37 | $ | 16.49 | ||||
1st quarter | $ | 32.83 | $ | 23.45 | ||||
Fiscal 2015 | ||||||||
4th quarter | $ | 28.21 | $ | 18.55 | ||||
3rd quarter | $ | 22.25 | $ | 15.42 | ||||
2nd quarter | $ | 23.72 | $ | 19.36 | ||||
1st quarter | $ | 26.50 | $ | 19.34 | ||||
Dividends are declared at the discretion of A&F’s Board of Directors. A quarterly dividend, of $0.20 per share outstanding, was declared in each of February, May, August and November in Fiscal 2016 and Fiscal 2015. Dividends were paid in each of March, June, September and December in Fiscal 2016. A&F’s Board of Directors reviews the dividend on a quarterly basis and establishes the dividend rate based on A&F’s financial condition, results of operations, capital requirements, current and projected cash flows, business prospects and other factors which the directors deem relevant.
As of March 22, 2017, there were approximately 3,200 stockholders of record. However, when including investors holding shares in broker accounts under street name A&F estimates that there are approximately 34,300 stockholders.
The following table provides information regarding the purchase of shares of the Common Stock of A&F made by or on behalf of A&F or any “affiliated purchaser” as defined in Rule 10b-18(a)(3) under the Securities Exchange Act of 1934, as amended, during each fiscal month of the quarterly period ended January 28, 2017:
Period (fiscal month) | Total Number of Shares Purchased(1) | Average Price Paid per Share | Total Number of Shares Purchased as Part of Publicly Announced Plans or Programs(2) | Maximum Number of Shares that May Yet be Purchased under the Plans or Programs(3) | |||||||||
October 30, 2016 through November 26, 2016 | 1,284 | $ | 15.37 | — | 6,503,656 | ||||||||
November 27, 2016 through December 31, 2016 | 16,544 | $ | 14.62 | — | 6,503,656 | ||||||||
January 1, 2017 through January 28, 2017 | 9,155 | $ | 11.71 | — | 6,503,656 | ||||||||
Total | 26,983 | $ | 13.67 | — | 6,503,656 | ||||||||
(1) | All of the 26,983 shares of A&F’s Common Stock purchased during the thirteen-week period ended January 28, 2017 represented shares which were withheld for tax payments due upon the exercise of employee stock appreciation rights and the vesting of restricted stock units and restricted share awards. |
(2) | No shares were repurchased during the thirteen-week period ended January 28, 2017 pursuant to A&F’s publicly announced stock repurchase authorization. On August 14, 2012, A&F’s Board of Directors authorized the repurchase of 10.0 million shares of A&F’s Common Stock, which was announced on August 15, 2012. |
(3) | The number shown represents, as of the end of each period, the maximum number of shares of Common Stock that may yet be purchased under A&F’s publicly announced stock repurchase authorization described in footnote 2 above. The shares may be purchased, from time-to-time, depending on market conditions. |
During Fiscal 2015, A&F repurchased approximately 2.5 million shares of A&F’s Common Stock in the open market with a cost of approximately $50.0 million. Repurchases made during Fiscal 2015 were pursuant to authorizations of A&F’s Board of Directors.
19
The following graph shows the changes, over the five-year period ended January 28, 2017 (the last day of A&F’s Fiscal 2016) in the value of $100 invested in (i) shares of A&F’s Common Stock; (ii) the Standard & Poor’s 500 Stock Index (the “S&P 500 Index”); (iii) the Standard & Poor’s Midcap 400 Stock Index (the “S&P Midcap 400 Index”); and (iv) the Standard & Poor’s Apparel Retail Composite Index (the “S&P Apparel Retail Index”), including reinvestment of dividends. The plotted points represent the closing price on the last trading day of the fiscal year indicated.
PERFORMANCE GRAPH(1)
COMPARISON OF FIVE-YEAR CUMULATIVE TOTAL RETURN*
Among Abercrombie & Fitch Co., the S&P 500 Index, the S&P Midcap 400 Index and the S&P Apparel Retail Index
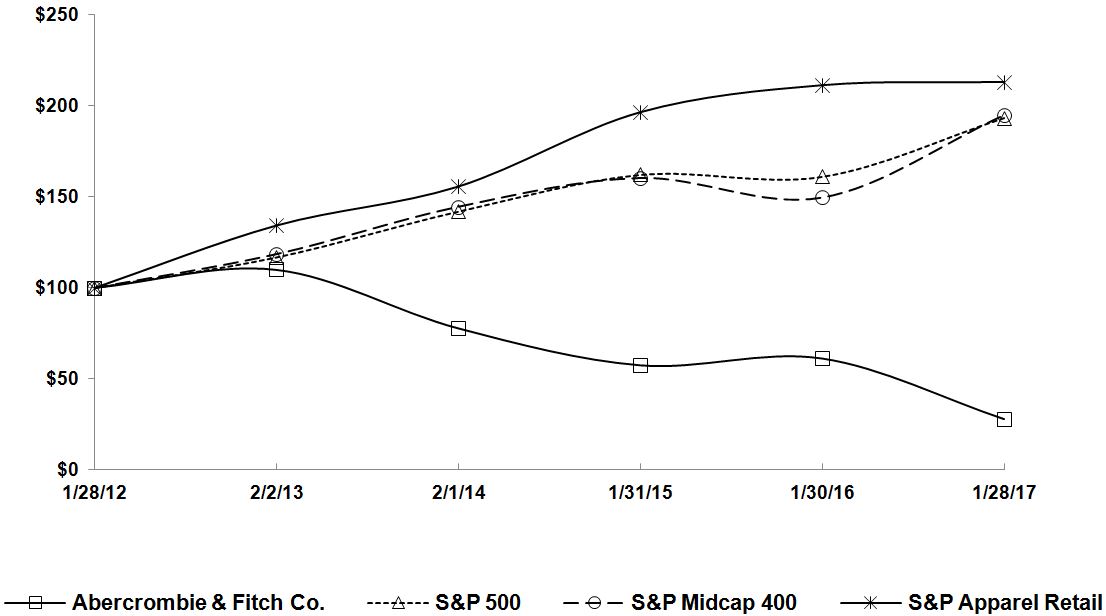
*$100 invested on 1/28/12 in stock or 1/28/12 in index, including reinvestment of dividends. Indexes calculated on month-end basis.
Copyright© 2017 Standard & Poor's, a division of S&P Global. All rights reserved.
In Fiscal 2013, A&F was removed as a component of the S&P 500 Index and became a component of the S&P Midcap 400 Index.
(1) This graph shall not be deemed to be “soliciting material” or to be “filed” with the SEC or subject to SEC Regulation 14A or to the liabilities of Section 18 of the Securities Exchange Act of 1934, as amended (the “Exchange Act”), except to the extent that A&F specifically requests that the graph be treated as soliciting material or specifically incorporates it by reference into a filing under the Securities Act of 1933, as amended, or the Exchange Act.
20
ITEM 6. | SELECTED FINANCIAL DATA |
The following financial information is derived from our Consolidated Financial Statements. The information presented below should be read in conjunction with “ITEM 7. MANAGEMENT’S DISCUSSION AND ANALYSIS OF FINANCIAL CONDITION AND RESULTS OF OPERATION” and the Company’s Consolidated Financial Statements and notes thereto included in “ITEM 8. FINANCIAL STATEMENTS AND SUPPLEMENTARY DATA” of this Annual Report on Form 10-K. We have also included certain non-financial information to enhance the understanding of our business.
(Thousands, except per share and per square foot amounts, ratios and store data)
Fiscal 2016 | Fiscal 2015 | Fiscal 2014 | Fiscal 2013 | Fiscal 2012(1) | |||||||||||||||
Statements of operations data | |||||||||||||||||||
Net sales | $ | 3,326,740 | $ | 3,518,680 | $ | 3,744,030 | $ | 4,116,897 | $ | 4,510,805 | |||||||||
Gross profit | $ | 2,028,568 | $ | 2,157,543 | $ | 2,313,570 | $ | 2,575,435 | $ | 2,816,709 | |||||||||
Operating income | $ | 15,188 | $ | 72,838 | $ | 113,519 | $ | 80,823 | $ | 374,233 | |||||||||
Net income attributable to A&F | $ | 3,956 | $ | 35,576 | $ | 51,821 | $ | 54,628 | $ | 237,011 | |||||||||
Net income per basic share attributable to A&F | $ | 0.06 | $ | 0.52 | $ | 0.72 | $ | 0.71 | $ | 2.89 | |||||||||
Net income per diluted share attributable to A&F | $ | 0.06 | $ | 0.51 | $ | 0.71 | $ | 0.69 | $ | 2.85 | |||||||||
Basic weighted-average shares outstanding | 67,878 | 68,880 | 71,785 | 77,157 | 81,940 | ||||||||||||||
Diluted weighted-average shares outstanding | 68,284 | 69,417 | 72,937 | 78,666 | 83,175 | ||||||||||||||
Cash dividends declared per share | $ | 0.80 | $ | 0.80 | $ | 0.80 | $ | 0.80 | $ | 0.70 | |||||||||
Balance sheet data | |||||||||||||||||||
Working capital(2) | $ | 653,300 | $ | 644,277 | $ | 679,016 | $ | 752,344 | $ | 617,023 | |||||||||
Current ratio(3) | 2.34 | 2.20 | 2.40 | 2.32 | 1.89 | ||||||||||||||
Cash and equivalents | $ | 547,189 | $ | 588,578 | $ | 520,708 | $ | 600,116 | $ | 643,505 | |||||||||
Total assets | $ | 2,295,757 | $ | 2,433,039 | $ | 2,505,167 | $ | 2,850,997 | $ | 2,987,401 | |||||||||
Borrowings, net | $ | 262,992 | $ | 286,235 | $ | 293,412 | $ | 135,000 | $ | — | |||||||||
Leasehold financing obligations | $ | 46,397 | $ | 47,440 | $ | 50,521 | $ | 60,726 | $ | 63,942 | |||||||||
Total stockholders’ equity | $ | 1,252,039 | $ | 1,295,722 | $ | 1,389,701 | $ | 1,729,493 | $ | 1,818,268 | |||||||||
Return on average stockholders’ equity(4) | — | % | 3 | % | 3 | % | 3 | % | 13 | % | |||||||||
Other financial and operating data | |||||||||||||||||||
Net cash provided by operating activities | $ | 184,591 | $ | 309,941 | $ | 312,480 | $ | 175,493 | $ | 684,171 | |||||||||
Net cash used for investing activities | $ | (136,746 | ) | $ | (122,567 | ) | $ | (175,074 | ) | $ | (173,861 | ) | $ | (247,238 | ) | ||||
Net cash used for financing activities | $ | (83,793 | ) | $ | (106,875 | ) | $ | (181,453 | ) | $ | (40,831 | ) | $ | (380,071 | ) | ||||
Capital expenditures | $ | 140,844 | $ | 143,199 | $ | 174,624 | $ | 163,924 | $ | 339,862 | |||||||||
Free cash flow(5) | $ | 43,747 | $ | 166,742 | $ | 137,856 | $ | 11,569 | $ | 344,309 | |||||||||
Comparable sales(6) | (5 | )% | (3 | )% | (8 | )% | (11 | )% | (1 | )% | |||||||||
Net store sales per average gross square foot | $ | 343 | $ | 360 | $ | 381 | $ | 417 | $ | 485 | |||||||||
Total number of stores open | 898 | 932 | 969 | 1,006 | 1,041 | ||||||||||||||
Total store square footage at end of period | 7,007 | 7,292 | 7,517 | 7,736 | 7,958 | ||||||||||||||
(1) | Fiscal 2012 was a fifty-three week year. |
(2) | Working capital is computed by subtracting current liabilities from current assets. |
(3) | Current ratio is computed by dividing current assets by current liabilities. |
(4) | Return on average stockholders’ equity is computed by dividing net income attributable to A&F by the average stockholders’ equity balance. |
(5) | Free cash flow is computed by subtracting capital expenditures from the GAAP financial measure of net cash provided by operating activities, both of which are disclosed above in the table preceding the measure of free cash flow. The Company believes that the non-GAAP measure of free cash flow is useful to investors to understand available cash flows generated from operations less cash flows used for capital expenditures. The closest GAAP financial measure is net cash provided by operating activities. The non-GAAP financial measure of free cash flow should not be used in isolation or as an alternative to net cash provided by operating activities or an indicator of the ongoing performance of the Company. It is also not intended to supersede or replace the Company’s GAAP financial measure. |
(6) | Comparable sales is defined as the aggregate of: (1) year-over-year sales for stores that have been open as the same brand at least one year and whose square footage has not been expanded or reduced by more than 20% within the past year, with prior year’s net sales converted at the current year’s exchange rate to remove the impact of currency fluctuation, and (2) year-over-year direct-to-consumer sales with prior year’s net sales converted at the current year’s exchange rate to remove the impact of currency fluctuation. Beginning with Fiscal 2012, comparable sales include comparable direct-to-consumer sales. |
21
ITEM 7. | MANAGEMENT’S DISCUSSION AND ANALYSIS OF FINANCIAL CONDITION AND RESULTS OF OPERATIONS |
OVERVIEW
BUSINESS SUMMARY
The Company is a specialty retailer who primarily sells its products through store and direct-to-consumer operations, as well as through various wholesale, franchise and licensing arrangements. The Company offers a broad array of apparel products, including knit tops, woven shirts, graphic t-shirts, fleece, sweaters, jeans, woven pants, shorts, outerwear, dresses, intimates and swimwear; and personal care products and accessories for men, women and kids under the Abercrombie & Fitch, abercrombie kids, Hollister and Gilly Hicks brands. The Company has operations in North America, Europe, Asia and the Middle East.
The Company’s fiscal year ends on the Saturday closest to January 31, typically resulting in a fifty-two week year, but occasionally giving rise to an additional week, resulting in a fifty-three week year. For purposes of this “ITEM 7. MANAGEMENT’S DISCUSSION AND ANALYSIS OF FINANCIAL CONDITION AND RESULTS OF OPERATIONS,” the fifty-two week period ended January 28, 2017 is compared to the fifty-two week period ended January 30, 2016 and the fifty-two week period ended January 30, 2016 is compared to the fifty-two week period ended January 31, 2015.
The Company has two operating segments: Abercrombie, which includes the Company’s Abercrombie & Fitch and abercrombie kids brands; and Hollister. These operating segments have similar economic characteristics, classes of consumers, products, and production and distribution methods, and have been aggregated into one reportable segment.
SUMMARY RESULTS OF OPERATIONS
The table below summarizes the Company's results of operations and reconciles GAAP financial measures to non-GAAP financial measures for the fifty-two week periods ended January 28, 2017 and January 30, 2016. Additional discussion about why the Company believes that these non-GAAP financial measures are useful to investors is provided below under “NON-GAAP FINANCIAL MEASURES.”
January 28, 2017 | January 30, 2016 | |||||||||||||||||||||||
(in thousands, except change in comparable sales, gross profit rate and per share amounts) | GAAP | Excluded Items(1) | Non-GAAP | GAAP | Excluded Items(1) | Non-GAAP | ||||||||||||||||||
Fifty-two Weeks Ended | ||||||||||||||||||||||||
Net sales | $ | 3,326,740 | $ | — | $ | 3,326,740 | $ | 3,518,680 | $ | — | $ | 3,518,680 | ||||||||||||
Change in comparable sales(2) | (5 | )% | — | % | (5 | )% | (3 | )% | — | % | (3 | )% | ||||||||||||
Gross profit rate | 61.0 | % | — | % | 61.0 | % | 61.3 | % | 0.6 | % | 61.9 | % | ||||||||||||
Operating income | $ | 15,188 | $ | (11,926 | ) | $ | 3,262 | $ | 72,838 | $ | 63,657 | $ | 136,495 | |||||||||||
Net income (loss) attributable to A&F | $ | 3,956 | $ | (8,026 | ) | $ | (4,070 | ) | $ | 35,576 | $ | 42,471 | $ | 78,047 | ||||||||||
Net income (loss) per diluted share attributable to A&F | $ | 0.06 | $ | (0.12 | ) | $ | (0.06 | ) | $ | 0.51 | $ | 0.61 | $ | 1.12 | ||||||||||
(1) | Refer to “RESULTS OF OPERATIONS,” in “ITEM 7. MANAGEMENT’S DISCUSSION AND ANALYSIS OF FINANCIAL CONDITION AND RESULTS OF OPERATIONS,” for details on excluded items. |
(2) | Changes in comparable sales are calculated on a constant currency basis by converting prior year store and online sales at current year exchange rates. For inclusion in this calculation, a store must have been open as the same brand at least one year and its square footage must not have been expanded or reduced by more than 20% within the past year. |
As of January 28, 2017, the Company had $547.2 million in cash and equivalents, and $268.3 million in gross borrowings outstanding under its term loan facility. Net cash provided by operating activities was $184.6 million for Fiscal 2016. The Company also used cash of $140.8 million for capital expenditures, $54.1 million to pay dividends and $25.0 million to pay down debt during Fiscal 2016.
22
CURRENT TRENDS AND OUTLOOK
Despite a challenging retail environment in Fiscal 2016, the performance of our largest brand, Hollister, demonstrates the potential for our brands when brand voice, product and brand experience are aligned and attuned to our customer. The Abercrombie brand revitalization continues, with many of the lessons learned from Hollister being applied to position Abercrombie for future growth.
Overall we continue to make significant progress on our strategic initiatives. We stayed close to our customers and began to communicate evolved identities for each of our brands. In addition, we made improvements to the customer experience through the roll out of store remodels and a loyalty program for Hollister and to the seamless shopping experience through investments in direct-to-consumer and omnichannel capabilities across both brands. We also continue to execute our store closure and right sizing program.
While the environment is likely to remain challenging in Fiscal 2017, we continue to execute on our strategic priorities to position our business for sustainable growth.
For Fiscal 2017, we expect:
• | The comparable sales trend to improve for the full year, but to remain challenging for the first half; with Hollister comparable sales to maintain or grow and the Abercrombie comparable sales trend to improve. |
• | Continued adverse effects from foreign currency on sales and operating income. |
• | A gross margin rate flat to the Fiscal 2016 adjusted non-GAAP rate of 61.0%, but to be pressured in the first quarter. |
• | Actions already taken to reduce expense by approximately $100 million, enabling investments in revenue driving activities and resulting in net operating expense down approximately 3% from Fiscal 2016 adjusted non-GAAP operating expense of $2.025 billion, with a commitment to pursue further expense reductions throughout the year. |
• | Net income attributable to noncontrolling interests of approximately $4 million. |
• | A weighted average diluted share count of approximately 68 million shares, excluding the effect of potential share buybacks. |
We expect the core tax rate for the full year to be in the mid 30s and to remain highly sensitive to jurisdictional mix and at lower levels of pre-tax earnings. In addition, we also expect to incur a discrete non-cash income tax charge of approximately $9 million in the first quarter of Fiscal 2017 as a result of a change in share-based compensation accounting standards, the adverse effect of which will be included in the effective tax rate.
With regard to capital allocation, we are targeting capital expenditures to be approximately $100 million for Fiscal 2017, including approximately $70 million for store updates and new stores and approximately $20 million for direct-to-consumer and omnichannel capabilities and IT investments to support growth and continuous profit improvement initiatives.
We plan to open approximately six full-price stores in Fiscal 2017, including approximately four in the U.S and approximately two in international markets. We also plan to open approximately two new outlet stores. In addition, we anticipate closing approximately 60 stores in the U.S. during Fiscal 2017 through natural lease expirations.
23
NON-GAAP FINANCIAL MEASURES
This Annual Report on Form 10-K includes discussion of certain financial measures under “RESULTS OF OPERATIONS” on both a GAAP and a non-GAAP basis. The Company believes that each of the non-GAAP financial measures presented in this “ITEM 7. MANAGEMENT’S DISCUSSION AND ANALYSIS OF FINANCIAL CONDITION AND RESULTS OF OPERATIONS” are useful to investors as they provide a measure of the Company’s operating performance excluding the effect of certain items which the Company believes do not reflect its future operating outlook, and therefore supplements investors’ understanding of comparability across periods. Management used these non-GAAP financial measures during the periods presented to assess the Company’s performance and to develop expectations for future operating performance. These non-GAAP financial measures should be used supplemental to, not as an alternative to, the Company’s GAAP financial results, and may not be the same as similar measures presented by other companies.
Changes in comparable sales are calculated on a constant currency basis by converting prior year store and online sales at current year exchange rates. For the purpose of this calculation, a store must have been open as the same brand at least one year and its square footage must not have been expanded or reduced by more than 20% within the past year.
In addition, the following financial measures are disclosed on a GAAP basis and, as applicable, on a non-GAAP basis excluding items relating to asset impairment, indemnification recovery, claims settlement benefits, inventory write-down, net, legal settlement charges, store fixture disposal, profit improvement initiative, lease termination and store closure costs and restructuring benefit: cost of sales, exclusive of depreciation and amortization; gross profit; stores and distribution expense; marketing, general and administrative expense; other operating income, net; operating income (loss); income tax expense (benefit); effective tax rate; net income (loss) attributable to A&F; and net income (loss) per diluted share attributable to A&F. Certain of these GAAP and non-GAAP measures are also expressed as a percentage of net sales. The income tax effect of non-GAAP items is calculated as the difference in income tax expense (benefit) with and without the non-GAAP adjustments to income before income taxes based upon the tax laws and statutory income tax rates of the affected tax jurisdictions.
24
KEY BUSINESS INDICATORS
The following measurements are among the key business indicators reviewed by various members of management to gauge the Company’s results:
• | Comparable sales, defined as the aggregate of: (1) year-over-year sales for stores that have been open as the same brand at least one year and whose square footage has not been expanded or reduced by more than 20% within the past year, with prior year’s net sales converted at the current year’s foreign currency exchange rate to remove the impact of currency fluctuation, and (2) year-over-year direct-to-consumer sales with prior year’s net sales converted at the current year’s foreign currency exchange rate to remove the impact of currency fluctuation; |
• | Comparative results of operations with prior year’s results converted at the current year’s foreign currency exchange rate to remove the impact of currency fluctuation; |
• | Gross profit and gross margin rate; |
• | Cost of sales, exclusive of depreciation and amortization, as a percentage of net sales; |
• | Selling margin, defined as sales price less original cost, by brand and product category; |
• | Stores and distribution expense as a percentage of net sales; |
• | Marketing, general and administrative expense as a percentage of net sales; |
• | Operating income and operating income as a percentage of net sales; |
• | Net income and net income attributable to A&F; |
• | Inventory per gross square foot and inventory to sales ratio; |
• | Cash flow and liquidity determined by the Company’s current ratio, working capital and free cash flow; |
• | Store metrics such as sales per gross square foot, average number of transactions per store and store contribution (defined as store sales less direct costs of operating the store); |
• | Transactional metrics such as traffic and conversion, average unit retail price, average unit cost, average units per transaction and average transaction values; and |
• | Return on invested capital and return on equity. |
While not all of these metrics are disclosed publicly by the Company due to the proprietary nature of the information, the Company publicly discloses and discusses many of these metrics within this Management’s Discussion and Analysis of Financial Condition and Results of Operations.
RESULTS OF OPERATIONS
FISCAL 2016 COMPARED TO FISCAL 2015
Net Sales
Fiscal 2016 | Fiscal 2015 | ||||||||||||||||
(in thousands) | Net Sales | Change in Comparable Sales(1) | Net Sales | Change in Comparable Sales(1) | Net Sales $ Change | Net Sales % Change | |||||||||||
Abercrombie(2) | $ | 1,487,024 | (11)% | $ | 1,640,992 | (6)% | $ | (153,968 | ) | (9)% | |||||||
Hollister | 1,839,716 | —% | 1,877,688 | —% | (37,972 | ) | (2)% | ||||||||||
Total net sales | $ | 3,326,740 | (5)% | $ | 3,518,680 | (3)% | $ | (191,940 | ) | (5)% | |||||||
United States | $ | 2,123,808 | (5)% | $ | 2,282,040 | (3)% | $ | (158,232 | ) | (7)% | |||||||
International | 1,202,932 | (6)% | 1,236,640 | (1)% | (33,708 | ) | (3)% | ||||||||||
Total net sales | $ | 3,326,740 | (5)% | $ | 3,518,680 | (3)% | $ | (191,940 | ) | (5)% | |||||||
(1) | Changes in comparable sales are calculated on a constant currency basis by converting prior year store and online sales at current year exchange rates. For inclusion in this calculation, a store must have been open as the same brand at least one year and its square footage must not have been expanded or reduced by more than 20% within the past year. |
(2) | Includes Abercrombie & Fitch and abercrombie kids brands. |
For Fiscal 2016, net sales decreased 5% compared to Fiscal 2015, primarily attributable to a 5% decrease in comparable sales, which was driven by the Abercrombie brand.
25
Cost of Sales, Exclusive of Depreciation and Amortization
Fiscal 2016 | Fiscal 2015 | ||||||||||
(in thousands) | % of Net Sales | % of Net Sales | |||||||||
Cost of sales, exclusive of depreciation and amortization | $ | 1,298,172 | 39.0% | $ | 1,361,137 | 38.7% | |||||
Inventory write-down, net(1) | — | —% | (20,647 | ) | (0.6)% | ||||||
Adjusted non-GAAP cost of sales, exclusive of depreciation and amortization | $ | 1,298,172 | 39.0% | $ | 1,340,490 | 38.1% | |||||
Gross profit | $ | 2,028,568 | 61.0% | $ | 2,157,543 | 61.3% | |||||
Inventory write-down, net(1) | — | —% | 20,647 | 0.6% | |||||||
Adjusted non-GAAP gross profit | $ | 2,028,568 | 61.0% | $ | 2,178,190 | 61.9% | |||||
(1) | Inventory write-down charges related to a first quarter of Fiscal 2015 decision to accelerate the disposition of certain aged merchandise, net of recoveries. |
For Fiscal 2016, cost of sales, exclusive of depreciation and amortization as a percentage of net sales increased by approximately 30 basis points for Fiscal 2016 as compared to Fiscal 2015, which included a $20.6 million net inventory write-down. Excluding the $20.6 million net inventory write-down, Fiscal 2016 adjusted non-GAAP cost of sales, exclusive of depreciation and amortization as a percentage of net sales increased by approximately 90 basis points as compared to Fiscal 2015, primarily due to the adverse effects from changes in foreign currency exchange rates of approximately 60 basis points and lower average unit retail.
Stores and Distribution Expense
Fiscal 2016 | Fiscal 2015 | ||||||||||
(in thousands) | % of Net Sales | % of Net Sales | |||||||||
Stores and distribution expense | $ | 1,578,460 | 47.4% | $ | 1,604,214 | 45.6% | |||||
Store fixture disposal | — | —% | (4,200 | ) | (0.1)% | ||||||
Lease termination and store closure costs | — | —% | (1,756 | ) | —% | ||||||
Charges related to the Company's profit improvement initiative | — | —% | (709 | ) | —% | ||||||
Adjusted non-GAAP stores and distribution expense | $ | 1,578,460 | 47.4% | $ | 1,597,549 | 45.4% | |||||
For Fiscal 2016, stores and distribution expense as a percentage of net sales increased by approximately 190 basis points as compared to Fiscal 2015, primarily due to the deleveraging effect from negative comparable sales, higher direct-to-consumer expense and a lease termination charge of $15.6 million related to the A&F flagship store in Hong Kong, partially offset by benefits from foreign currency exchange rates, the realization of savings on lower sales and expense reduction efforts. Excluding certain items presented in the table above, Fiscal 2016 adjusted non-GAAP stores and distribution expense as a percent of net sales increased by approximately 200 basis points as compared to Fiscal 2015.
For Fiscal 2016, shipping and handling costs, including costs incurred to store, move and prepare product for shipment and costs incurred to physically move product to the customer, associated with direct-to-consumer operations were $125.4 million as compared to $115.0 million for Fiscal 2015.
For Fiscal 2016, handling costs, including costs incurred to store, move and prepare product for shipment to stores, were $41.5 million as compared to $44.5 million for Fiscal 2015.
Shipping and handling costs are included in stores and distribution expense on the Consolidated Statements of Operations and Comprehensive Income (Loss).
26
Marketing, General and Administrative Expense
Fiscal 2016 | Fiscal 2015 | ||||||||||
(in thousands) | % of Net Sales | % of Net Sales | |||||||||
Marketing, general and administrative expense | $ | 453,202 | 13.6% | $ | 470,321 | 13.4% | |||||
Indemnification recovery(1) | 6,000 | 0.2% | — | —% | |||||||
Legal settlement charges(2) | — | —% | (15,753 | ) | (0.4)% | ||||||
Charges related to the Company's profit improvement initiative | — | —% | (1,770 | ) | (0.1)% | ||||||
Adjusted non-GAAP marketing, general and administrative expense | $ | 459,202 | 13.8% | $ | 452,798 | 12.9% | |||||
(1) | Includes benefits related to an indemnification recovery of certain legal settlements which were recognized in the second quarter of Fiscal 2015. |
(2) | Accrued expense for certain proposed legal settlements. |
For Fiscal 2016, marketing, general and administrative expense as a percentage of net sales increased by approximately 30 basis points as compared to Fiscal 2015, primarily due to the deleveraging effect from negative comparable sales and higher marketing expenses, partially offset by the net year-over-year impact of certain items presented in the table above, lower compensation expense and expense reduction efforts. Excluding certain items presented in the table above, Fiscal 2016 adjusted non-GAAP marketing, general and administrative expense as a percentage of net sales increased by approximately 90 basis points as compared to Fiscal 2015.
Restructuring Benefit
For Fiscal 2015, benefits associated with the restructuring of the Gilly Hicks brand were $1.6 million.
Asset Impairment
For Fiscal 2016, the Company incurred non-cash asset impairment charges of $7.9 million, primarily related to the Company’s abercrombie kids flagship store in London, as compared to $18.2 million for Fiscal 2015, primarily related to the Company’s Abercrombie & Fitch flagship store in Hong Kong and a decision to remove certain store fixtures in connection with changes to the Abercrombie and Hollister store experiences.
Other Operating Income, Net
Fiscal 2016 | Fiscal 2015 | ||||||||||
(in thousands) | % of Net Sales | % of Net Sales | |||||||||
Other operating income, net | $ | 26,212 | 0.8% | $ | 6,441 | 0.2% | |||||
Claims settlement benefits(1) | (12,282 | ) | (0.4)% | — | —% | ||||||
Lease termination and store closure costs(2) | — | —% | 2,211 | 0.1% | |||||||
Adjusted non-GAAP other operating income, net | $ | 13,930 | 0.4% | $ | 8,652 | 0.2% | |||||
(1) | Includes benefits related to a settlement of certain economic loss claims associated with the April 2010 Deepwater Horizon oil spill. |
(2) | Includes charges related to a release of cumulative translation adjustment as the Company substantially completed the liquidation of its Australian operations. |
For Fiscal 2016, other operating income, net was $26.2 million and included $12.3 million of claims settlement benefits, as compared to $6.4 million for Fiscal 2015. Excluding certain items presented in the table above, Fiscal 2016 adjusted other operating income, net as a percentage of net sales increased 20 basis points as compared to Fiscal 2015, primarily due to higher gift card breakage due to the initial recognition of international gift card breakage of $4.8 million and higher foreign currency related gains, partially offset by insurance recoveries last year of $2.2 million.
27
Operating Income
Fiscal 2016 | Fiscal 2015 | ||||||||||
(in thousands) | % of Net Sales | % of Net Sales | |||||||||
Operating income | $ | 15,188 | 0.5% | $ | 72,838 | 2.1% | |||||
Asset impairment | 6,356 | 0.2% | 18,209 | 0.5% | |||||||
Indemnification recovery(1) | (6,000 | ) | (0.2)% | — | —% | ||||||
Claims settlement benefits(2) | (12,282 | ) | (0.4)% | — | —% | ||||||
Inventory write-down, net(3) | — | —% | 20,647 | 0.6% | |||||||
Legal settlement charges(4) | — | —% | 15,753 | 0.4% | |||||||
Store fixture disposal | — | —% | 4,200 | 0.1% | |||||||
Lease termination and store closure costs | — | —% | 3,967 | 0.1% | |||||||
Charges related to the Company's profit improvement initiative | — | —% | 2,479 | 0.1% | |||||||
Restructuring benefit | — | —% | (1,598 | ) | —% | ||||||
Adjusted non-GAAP operating income | $ | 3,262 | 0.1% | $ | 136,495 | 3.9% | |||||
(1) | Includes benefits related to an indemnification recovery of certain legal settlements which were recognized in the second quarter of Fiscal 2015. |
(2) | Includes benefits related to a settlement of certain economic loss claims associated with the April 2010 Deepwater Horizon oil spill. |
(3) | Includes inventory write-down charges related to a first quarter of Fiscal 2015 decision to accelerate the disposition of certain aged merchandise, net of recoveries. |
(4) | Accrued expense for certain proposed legal settlements. |
For Fiscal 2016, operating income as a percentage of net sales decreased by approximately 160 basis points as compared to Fiscal 2015, primarily driven by the deleveraging effect from negative comparable sales, a reduction in the gross profit rate and higher marketing and direct-to-consumer expense, partially offset by the net year-over-year impact of certain items in the above table and expense reduction efforts. Excluding certain items presented in the table above, Fiscal 2016 adjusted non-GAAP operating income as a percentage of net sales was approximately 10 basis points as compared to adjusted non-GAAP operating income of approximately 390 basis points for Fiscal 2015.
Interest Expense, Net
Fiscal 2016 | Fiscal 2015 | ||||||||||
(in thousands) | % of Net Sales | % of Net Sales | |||||||||
Interest expense | $ | 23,078 | 0.7% | $ | 22,601 | 0.6% | |||||
Interest income | (4,412 | ) | (0.1)% | (4,353 | ) | (0.1)% | |||||
Interest expense, net | $ | 18,666 | 0.6% | $ | 18,248 | 0.5% | |||||
Income Tax (Benefit) Expense
Fiscal 2016 | Fiscal 2015 | ||||||||||
(in thousands, except ratios) | Effective Tax Rate | Effective Tax Rate | |||||||||
Income tax (benefit) expense | $ | (11,196 | ) | 321.9% | $ | 16,031 | 29.4% | ||||
Tax effect of excluded items(1) | (3,900 | ) | 21,186 | ||||||||
Adjusted non-GAAP tax income tax (benefit) expense | $ | (15,096 | ) | 98.0% | $ | 37,217 | 31.5% | ||||
(1) | Refer to “Operating Income,” for details of excluded items. The Company computed the tax effect of excluded items as the difference between the effective tax rate calculated with and without the non-GAAP adjustments on income (loss) before taxes and provision for income taxes. |
After October 31, 2015, the Company began recognizing deferred U.S. income taxes on undistributed net income generated by foreign subsidiaries, which is no longer considered to be indefinitely invested outside of the U.S. This change is reflected in the Company’s income tax expense recognized for Fiscal 2016 and Fiscal 2015.
The Company's effective tax rate is sensitive to jurisdictional mix and lower absolute levels of consolidated pre-tax earnings. The effective tax rate was 321.9% for Fiscal 2016 compared to 29.4% for Fiscal 2015. Excluding certain items, as presented above in the table under “Operating Income,” the adjusted non-GAAP effective tax rate was 98.0% for Fiscal 2016 compared to 31.5% for Fiscal 2015. The effective tax rate and the adjusted non-GAAP effective tax rate for Fiscal 2016 reflect a benefit of $4.5 million related to the realization of foreign currency losses and a discrete benefit of $2.4 million related to a tax regulatory change. In
28
Fiscal 2015, the effective tax rate and the adjusted non-GAAP effective tax rate reflect discrete benefits of $7.4 million and $5.4 million, respectively, related to a release of a valuation allowance and other discrete tax items.
As of January 28, 2017, the Company had approximately $90.4 million in net deferred tax assets, which included approximately $13.5 million and $11.3 million of net deferred tax assets in Japan and Switzerland, respectively. The realization of the net deferred tax assets will depend upon the future generation of sufficient taxable profits in these jurisdictions. While the Company believes it is more likely than not that the net deferred tax assets will be realized, it is not certain. Should circumstances change, the net deferred tax assets may become subject to a valuation allowance in the future. Additional valuation allowances would result in additional tax expense.
Net Income and Net Income per Share Attributable to A&F
For Fiscal 2016, net income and net income per diluted share attributable to A&F were $4.0 million and $0.06, respectively, as compared to net income and net income per diluted share attributable to A&F of $35.6 million and $0.51, respectively, for Fiscal 2015. Excluding certain items above under “Operating Income," and “Income Tax (Benefit) Expense,” Fiscal 2016 adjusted non-GAAP net loss and net loss per diluted share attributable to A&F were $4.1 million and $0.06, respectively, as compared to adjusted non-GAAP net income and net income per diluted share attributable to A&F of $78.0 million and $1.12, respectively, for Fiscal 2015.
FISCAL 2015 COMPARED TO FISCAL 2014
Net Sales
Fiscal 2015 | Fiscal 2014 | ||||||||||||||||
(in thousands) | Net Sales | Change in Comparable Sales | Net Sales | Change in Comparable Sales | Net Sales $ Change | Net Sales % Change | |||||||||||
Abercrombie(1) | $ | 1,640,992 | (6)% | $ | 1,771,299 | (5)% | $ | (130,307 | ) | (7)% | |||||||
Hollister | 1,877,688 | —% | 1,947,869 | (10)% | (70,181 | ) | (4)% | ||||||||||
Other(2) | — | —% | 24,862 | —% | (24,862 | ) | —% | ||||||||||
Total net sales | $ | 3,518,680 | (3)% | $ | 3,744,030 | (8)% | $ | (225,350 | ) | (6)% | |||||||
United States | $ | 2,282,040 | (3)% | $ | 2,408,427 | (6)% | $ | (126,387 | ) | (5)% | |||||||
International | 1,236,640 | (1)% | 1,335,603 | (12)% | (98,963 | ) | (7)% | ||||||||||
Total net sales | $ | 3,518,680 | (3)% | $ | 3,744,030 | (8)% | $ | (225,350 | ) | (6)% | |||||||
(1) | Includes Abercrombie & Fitch and abercrombie kids brands. |
(2) | Represents net sales from the Company’s Gilly Hicks operations. |
For Fiscal 2015, net sales decreased 6% compared to Fiscal 2014, primarily attributable to the adverse effect from changes in foreign currency exchange rates (based on converting prior year sales at current year foreign currency exchange rates) of approximately $153 million, or approximately 4%, and a 3% decrease in comparable sales, partially offset by the net impact of store openings, closings and remodels.
29
Cost of Sales, Exclusive of Depreciation and Amortization
Fiscal 2015 | Fiscal 2014 | ||||||||||
(in thousands) | % of Net Sales | % of Net Sales | |||||||||
Cost of sales, exclusive of depreciation and amortization | $ | 1,361,137 | 38.7% | $ | 1,430,460 | 38.2% | |||||
Inventory write-down, net(1) | (20,647 | ) | (0.6)% | — | —% | ||||||
Adjusted non-GAAP cost of sales, exclusive of depreciation and amortization | $ | 1,340,490 | 38.1% | $ | 1,430,460 | 38.2% | |||||
Gross profit | $ | 2,157,543 | 61.3% | $ | 2,313,570 | 61.8% | |||||
Inventory write-down, net(1) | 20,647 | 0.6% | — | —% | |||||||
Adjusted non-GAAP gross profit | $ | 2,178,190 | 61.9% | $ | 2,313,570 | 61.8% | |||||
(1) | Inventory write-down charges related to a first quarter of Fiscal 2015 decision to accelerate the disposition of certain aged merchandise, net of recoveries. |
For Fiscal 2015, cost of sales, exclusive of depreciation and amortization as a percentage of net sales increased by approximately 50 basis points as compared to Fiscal 2014, primarily due to the adverse effects from changes in foreign currency exchange rates and a net inventory write-down of $20.6 million in Fiscal 2015, partially offset by an increase in average unit retail on a constant currency basis (based on converting prior year sales at current year foreign currency exchange rates, divided by number of units sold) and a decrease in average unit cost. Excluding the $20.6 million net inventory write-down, Fiscal 2015 adjusted non-GAAP cost of sales, exclusive of depreciation and amortization as a percentage of net sales decreased by approximately 10 basis points as compared to Fiscal 2014.
Stores and Distribution Expense
Fiscal 2015 | Fiscal 2014 | ||||||||||
(in thousands) | % of Net Sales | % of Net Sales | |||||||||
Stores and distribution expense | $ | 1,604,214 | 45.6% | $ | 1,703,051 | 45.5% | |||||
Store fixture disposal | (4,200 | ) | (0.1)% | — | —% | ||||||
Lease termination and store closure costs | (1,756 | ) | —% | (5,612 | ) | (0.1)% | |||||
Charges related to the Company's profit improvement initiative | (709 | ) | —% | (2,723 | ) | (0.1)% | |||||
Adjusted non-GAAP stores and distribution expense | $ | 1,597,549 | 45.4% | $ | 1,694,716 | 45.3% | |||||
For Fiscal 2015, stores and distribution expense as a percentage of net sales increased by approximately 10 basis points as compared to Fiscal 2014, primarily due to the deleveraging effect from lower net sales and higher direct-to-consumer expense, partially offset by expense reduction efforts.
For Fiscal 2015, shipping and handling costs, including costs incurred to store, move and prepare product for shipment and costs incurred to physically move product to the customer, associated with direct-to-consumer operations were $115.0 million as compared to $108.1 million for Fiscal 2014.
For Fiscal 2015, handling costs, including costs incurred to store, move and prepare product for shipment to stores, were $44.5 million as compared to $52.2 million for Fiscal 2014.
Shipping and handling costs are included in stores and distribution expense on the Consolidated Statements of Operations and Comprehensive Income (Loss).
30
Marketing, General and Administrative Expense
Fiscal 2015 | Fiscal 2014 | ||||||||||
(in thousands) | % of Net Sales | % of Net Sales | |||||||||
Marketing, general and administrative expense | $ | 470,321 | 13.4% | $ | 458,820 | 12.3% | |||||
Legal settlement charges(1) | (15,753 | ) | (0.4)% | — | —% | ||||||
Charges related to the Company's profit improvement initiative | (1,770 | ) | (0.1)% | (3,776 | ) | (0.1)% | |||||
Corporate governance matters(2) | — | —% | (12,644 | ) | (0.3)% | ||||||
Adjusted non-GAAP marketing, general and administrative expense | $ | 452,798 | 12.9% | $ | 442,400 | 11.8% | |||||
(1) | Accrued expense for certain proposed legal settlements. |
(2) | Includes legal, advisory and other charges related to certain corporate governance matters. |
For Fiscal 2015, marketing, general and administrative expense as a percentage of net sales increased by approximately 110 basis points as compared to Fiscal 2014, primarily driven by by the deleveraging effect of from lower net sales, higher compensation related expense and certain proposed legal settlement charges of $15.8 million, partially offset by the net year-over-year impact of corporate governance matters related charges and expense reduction efforts.
Restructuring (Benefit) Charge
For Fiscal 2015, benefits associated with the restructuring of the Gilly Hicks brand were $1.6 million as compared to charges of $8.4 million in Fiscal 2014.
Asset Impairment
For Fiscal 2015, the Company incurred non-cash asset impairment charges of $18.2 million as compared to $45.0 million for Fiscal 2014, primarily related to stores whose asset carrying values were determined not to be recoverable and exceeded fair value. For Fiscal 2015, the non-cash asset impairment charges primarily related to the Company's Abercrombie & Fitch flagship store in Hong Kong as well as certain fixtures that were removed in connection with changes to the Abercrombie and Hollister store experiences. For Fiscal 2014, store-related asset impairment charges primarily related to the Company's Abercrombie & Fitch flagship store locations in Tokyo, Japan and Seoul, Korea, as well as nine Hollister stores and nine abercrombie kids stores. Additionally, the Company incurred charges of approximately $11.3 million in Fiscal 2014 to record the expected loss on the sale of the Company-owned aircraft.
Other Operating Income, Net
Fiscal 2015 | Fiscal 2014 | ||||||||||
(in thousands) | % of Net Sales | % of Net Sales | |||||||||
Other operating income, net | $ | 6,441 | 0.2% | $ | 15,239 | 0.4% | |||||
Lease termination and store closure costs(1) | 2,211 | 0.1% | — | —% | |||||||
Adjusted non-GAAP other operating income, net | $ | 8,652 | 0.2% | $ | 15,239 | 0.4% | |||||
(1) | Includes charges related to a release of cumulative translation adjustment as the Company substantially completed the liquidation of its Australian operations. |
For Fiscal 2015, other operating income, net was $6.4 million as compared to $15.2 million for Fiscal 2014. For Fiscal 2015, other operating income, net included income of $2.2 million related to insurance recoveries and $4.7 million related to gift card breakage, partially offset by losses of $1.5 million related to foreign currency transactions. For Fiscal 2014, other operating income, net included income of $10.2 million related to insurance recoveries and $5.8 million related to gift card breakage, and losses of $2.0 million related to foreign currency transactions.
31
Operating Income
Fiscal 2015 | Fiscal 2014 | ||||||||||
(in thousands) | % of Net Sales | % of Net Sales | |||||||||
Operating income | $ | 72,838 | 2.1% | $ | 113,519 | 3.0% | |||||
Inventory write-down, net(1) | 20,647 | 0.6% | — | —% | |||||||
Asset impairment(2) | 18,209 | 0.5% | 44,988 | 1.2% | |||||||
Legal settlement charges(3) | 15,753 | 0.4% | — | —% | |||||||
Store fixture disposal | 4,200 | 0.1% | — | —% | |||||||
Charges related to the Company's profit improvement initiative | 2,479 | 0.1% | 6,499 | 0.2% | |||||||
Lease termination and store closure costs(4) | 3,967 | 0.1% | 5,612 | 0.1% | |||||||
Restructuring (benefit) charge | (1,598 | ) | —% | 8,431 | 0.2% | ||||||
Corporate governance matters(5) | — | —% | 12,644 | 0.3% | |||||||
Adjusted non-GAAP operating income | $ | 136,495 | 3.9% | $ | 191,693 | 5.1% | |||||
(1) | Inventory write-down charges related to a first quarter of Fiscal 2015 decision to accelerate the disposition of certain aged merchandise, net of recoveries. |
(2) | Includes impairment charges related to stores whose asset carrying values were determined not to be recoverable and exceeded fair value, for Fiscal 2014, a fair value adjustment to the Company-owned aircraft, and for Fiscal 2015, certain store fixtures in connection with changes to the Abercrombie and Hollister store experiences. |
(3) | Includes charges related to certain proposed legal settlements. |
(4) | Includes charges related to lease terminations and store closures, including charges related to a release of cumulative translation adjustment as the Company substantially completed the liquidation of its Australian operations. |
(5) | Includes legal, advisory and other charges related to certain corporate governance matters. |
For Fiscal 2015, operating income as a percentage of net sales decreased by approximately 100 basis points as compared to Fiscal 2014, primarily due to the deleveraging effect of negative comparable sales, higher direct-to-consumer costs and higher compensation related expense, partially offset by expense reduction efforts, an increase in average unit retail on a constant currency basis (based on converting prior year sales at current year foreign currency exchange rates, divided by number of units sold), a decrease in average unit cost and the the year-over-year impact of certain items presented in the above table. Excluding certain items presented in the table above, Fiscal 2015 adjusted non-GAAP operating income as a percentage of net sales decreased approximately 120 basis points as compared to Fiscal 2014.
Interest Expense, Net
Fiscal 2015 | Fiscal 2014 | ||||||||||
(in thousands) | % of Net Sales | % of Net Sales | |||||||||
Interest expense | $ | 22,601 | 0.6% | $ | 18,305 | 0.5% | |||||
Interest income | (4,353 | ) | (0.1)% | (3,940 | ) | (0.1)% | |||||
Interest expense, net | $ | 18,248 | 0.5% | $ | 14,365 | 0.4% | |||||
For Fiscal 2015 interest expense, net increased as compared to Fiscal 2014, primarily due to an increase in the average principal balance and a higher interest rate on debt outstanding.
Income Tax Expense
Fiscal 2015 | Fiscal 2014 | ||||||||||
(in thousands, except ratios) | Effective Tax Rate | Effective Tax Rate | |||||||||
Income tax expense | $ | 16,031 | 29.4% | $ | 47,333 | 47.7% | |||||
Tax effect of excluded items(1) | 21,186 | 17,686 | |||||||||
Adjusted non-GAAP income tax expense | $ | 37,217 | 31.5% | $ | 65,019 | 36.7% | |||||
(1) | Refer to “Operating Income,” for details of excluded items. The Company computed the tax effect of excluded items as the difference between the effective tax rate calculated with and without the non-GAAP adjustments on income (loss) before taxes and provision for income taxes. |
With respect to the Company’s annual effective tax rate, undistributed net income generated by foreign subsidiaries after October 31, 2015 is no longer considered to be indefinitely invested outside of the U.S. Accordingly, the Company recognized deferred U.S. income taxes on net income generated after October 31, 2015. This change is reflected in the Company’s income tax expense recognized for Fiscal 2015.
32
For Fiscal 2015, the Company's income tax expense as a percentage of income before taxes was 29.4% as compared to 47.7% for Fiscal 2014. Excluding certain items presented above in the table "Operating Income," Fiscal 2015 adjusted non-GAAP income tax expense as a percentage of income before taxes was 31.5% for Fiscal 2015 compared to 36.7% for Fiscal 2014. The effective tax rate and the adjusted non-GAAP effective tax rate for Fiscal 2015 reflect discrete benefits of $7.4 million and $5.4 million, respectively, related to a release of a valuation allowance and other discrete tax items.
Net Income and Net Income per Share Attributable to A&F
For Fiscal 2015, net income and net income per diluted share attributable to A&F was $35.6 million and $0.51, respectively, as compared to net income and net income per diluted share attributable to A&F of $51.8 million and $0.71, respectively, for Fiscal 2014. Excluding certain items presented above under “Operating Income,” and “Income Tax Expense,” Fiscal 2015 adjusted non-GAAP net income and net income per diluted share attributable to A&F was $78.0 million and $1.12, respectively, as compared to adjusted non-GAAP net income and net income per diluted share attributable to A&F of $112.3 million and $1.54, respectively, for Fiscal 2014.
LIQUIDITY AND CAPITAL RESOURCES
HISTORICAL SOURCES AND USES OF CASH
Seasonality of Cash Flows
The Company’s business has two principal selling seasons: the Spring season, which includes the first and second fiscal quarters (“Spring”), and the Fall season, which includes the third and fourth fiscal quarters (“Fall”). As is typical in the apparel industry, the Company experiences its greatest sales activity during the Fall season due to Back-to-School and Holiday sales periods. The Company relies on excess operating cash flows, which are largely generated in the Fall season, to fund operations throughout the year and to reinvest in the business to support future growth. The Company also has a revolving credit facility available as a source of additional funding.
Asset-Based Revolving Credit Facility
The Company has a senior secured revolving credit facility with availability of up to $400 million (the “ABL Facility”), subject to a borrowing base. The ABL Facility is available for working capital, capital expenditures and other general corporate purposes. The ABL Facility will mature on August 7, 2019. No borrowings were outstanding under the ABL Facility as of January 28, 2017.
Amounts borrowed under the ABL Facility bear interest, at the Company’s option, at either an adjusted LIBOR rate plus a margin of 1.25% to 1.75% per annum, or an alternate base rate plus a margin of 0.25% to 0.75% per annum based on average historical excess availability during the preceding quarter. The Company is also required to pay a fee of 0.25% per annum on undrawn commitments under the ABL Facility. Customary agency fees and letter of credit fees are also payable in respect of the ABL Facility.
As of January 28, 2017, the borrowing base on the ABL Facility was $239.9 million. As of March 22, 2017, the Company had not drawn on the ABL Facility, but had approximately $1.7 million in outstanding stand-by letters of credit under the ABL Facility.
Term Loan Facility
The Company has a term loan agreement, which provides for a term loan facility of $300 million (the “Term Loan Facility” and, together with the ABL Facility, the “2014 Credit Facilities”). The Term Loan Facility was issued at a $3 million, or 1.0%, discount. In addition, the Company recorded deferred financing fees associated with the issuance of the 2014 Credit Facilities of $5.8 million in aggregate, of which $3.2 million was paid to lenders. The Company is amortizing the debt discount and deferred financing fees over the respective contractual terms of the 2014 Credit Facilities.
33
The Company’s Term Loan debt is presented in the Consolidated Balance Sheets, net of the unamortized discount and fees paid to lenders. Net borrowings as of January 28, 2017 and January 30, 2016 were as follows:
(in thousands) | January 28, 2017 | January 30, 2016 | |||||
Borrowings, gross at carrying amount | $ | 268,250 | $ | 293,250 | |||
Unamortized discount | (1,764 | ) | (1,929 | ) | |||
Unamortized fees paid to lenders | (3,494 | ) | (5,086 | ) | |||
Borrowings, net | 262,992 | 286,235 | |||||
Less: short-term portion of borrowings, net | — | — | |||||
Long-term portion of borrowings, net | $ | 262,992 | $ | 286,235 | |||
The Term Loan Facility will mature on August 7, 2021 and amortizes at a rate equal to 0.25% of the original principal amount per quarter, beginning with the fourth quarter of Fiscal 2014. The Term Loan Facility is subject to (a) beginning in 2016, an annual mandatory prepayment in an amount equal to 0% to 50% of the Company’s excess cash flows in the preceding fiscal year, depending on the Company’s leverage ratio and (b) certain other mandatory prepayments upon receipt by the Company of proceeds of certain debt issuances, asset sales and casualty events, subject to certain exceptions specified therein, including reinvestment rights, less any voluntary payments made. The Company made a repayment of $25 million in January 2017, in prepayment of its scheduled Fiscal 2017 through Fiscal 2021 amortization and a portion of the amount of principal due at maturity.
At the Company’s option, borrowings under the Term Loan Facility will bear interest at either (a) an adjusted LIBOR rate no lower than 1.00% plus a margin of 3.75% per annum or (b) an alternate base rate plus a margin of 2.75% per annum. Customary agency fees are also payable pursuant to the Term Loan Facility. The interest rate on borrowings under the Term Loan Facility was 4.75% as of January 28, 2017.
The Company’s credit facilities are described in Note 11, “BORROWINGS” of the Notes to the Consolidated Financial Statements included in “ITEM 8. FINANCIAL STATEMENT AND SUPPLEMENTARY DATA,” of this Annual Report on Form 10-K.
Operating Activities
Net cash provided by operating activities was $184.6 million for Fiscal 2016 compared to $309.9 million for Fiscal 2015 and $312.5 million for Fiscal 2014. The year-over-year decrease in net cash provided by operating activities for Fiscal 2016 as compared to Fiscal 2015 was primarily driven by lower net income, adjusted for non-cash items, the extension of vendor payment terms in the second quarter of Fiscal 2015 and incentive compensation payments in the first quarter of Fiscal 2016, partially offset by the return of long-term lease deposits of $26.6 million and a $25.1 million decrease in cash paid for income taxes. Significant changes in the underlying drivers of net cash provided by operating activities for Fiscal 2015 as compared to Fiscal 2014 related primarily to changes in accounts payable and accrued expenses and inventories, net. For Fiscal 2015, the Company had a $51.1 million net cash inflow associated with an increase in accounts payable and accrued expenses resulting from the Company's extension of vendor payment terms, as compared to a $37.4 million net cash outflow for Fiscal 2014 associated with a decrease in accounts payable and accrued expenses driven by cash payments related to Gilly Hicks restructuring for Fiscal 2014. The Company also experienced $41.6 million less of a cash inflow from the year-over-year reduction in inventory balances for Fiscal 2015 as compared to Fiscal 2014.
Investing Activities
Cash outflows for investing activities in Fiscal 2016, Fiscal 2015 and Fiscal 2014 were used primarily for store updates and new store construction, direct-to-consumer and omnichannel capabilities and information technology investments. Fiscal 2015 cash investing activities also included proceeds from the sale of a Company-owned aircraft.
Financing Activities
For Fiscal 2016, cash outflows for financing activities consisted primarily of the payment of dividends of $54.1 million and the repayment of borrowings of $25.0 million. For Fiscal 2015, cash outflows for financing activities consisted primarily of the payment of dividends of $55.1 million and the repurchase of A&F’s Common Stock of $50.0 million. For Fiscal 2014, cash outflows for financing activities consisted primarily of the repurchase of A&F’s Common Stock of $285.0 million, the repayment of borrowings of $195.8 million and the payment of dividends of $57.4 million. For Fiscal 2014, cash inflows from financing activities consisted primarily of proceeds from borrowings of $357.0 million.
34
During Fiscal 2015, A&F repurchased approximately 2.5 million shares of A&F’s Common Stock in the open market with a market value of approximately $50.0 million. During Fiscal 2014, A&F repurchased approximately 7.3 million shares of A&F’s Common Stock, of which approximately 3.5 million shares with a market value of approximately $135.0 million were purchased in the open market and approximately 3.8 million shares with an aggregate cost of $150.0 million were purchased pursuant to an accelerated share repurchase agreement.
As of January 28, 2017, A&F had approximately 6.5 million remaining shares available for repurchase as part of the A&F Board of Directors’ previously approved authorizations.
FUTURE CASH REQUIREMENTS AND SOURCES OF CASH
Over the next twelve months, the Company’s primary cash requirements will be to fund operating activities, including the acquisition of inventory, and obligations related to compensation, leases, taxes and other operating activities, as well as to fund capital expenditures, marketing initiatives, quarterly dividends to stockholders subject to approval by A&F’s Board of Directors and debt service, including voluntary repayments, or required repayments, if any, based on annual excess cash flows, as defined in the term loan agreement. The Company has availability under the ABL Facility as a source of additional funding.
The Company may repurchase shares of its Common Stock and, if it were to do so, would anticipate funding such repurchases by utilizing free cash flow generated from operations or proceeds from the ABL Facility.
As of January 28, 2017, $305.3 million of the Company’s $547.2 million of cash and equivalents was held by foreign affiliates. The Company is not dependent on dividends from its foreign affiliates to fund its U.S. operations or pay dividends to A&F’s stockholders. Unremitted earnings from foreign affiliates generally would become subject to U.S. income tax if remitted as dividends or lent to A&F or a U.S. affiliate. As of January 28, 2017, approximately $80 million, consisting primarily of previously taxed income and net income for which U.S. deferred taxes have been provided, could be repatriated to the U.S. without any additional U.S. income tax expense.
OFF-BALANCE SHEET ARRANGEMENTS
The Company uses in the ordinary course of business stand-by letters of credit under the existing ABL Facility. The Company had $1.7 million in stand-by letters of credit outstanding as of January 28, 2017. The Company has no other off-balance sheet arrangements.
CONTRACTUAL OBLIGATIONS
Payments due by period | ||||||||||||||||||||
(in thousands) | Total | Less than 1 year | 1-3 years | 3-5 years | More than 5 years | |||||||||||||||
Operating lease obligations (1) | $ | 1,556,771 | $ | 352,811 | $ | 514,967 | $ | 319,284 | $ | 369,709 | ||||||||||
Long-term debt obligations | 268,250 | — | — | 268,250 | — | |||||||||||||||
Purchase obligations | 276,718 | 230,223 | 35,610 | 10,516 | 369 | |||||||||||||||
Other obligations (2) | 137,919 | 25,506 | 31,217 | 40,189 | 41,007 | |||||||||||||||
Capital lease obligations | 2,425 | 1,610 | 790 | 25 | — | |||||||||||||||
Totals | $ | 2,242,083 | $ | 610,150 | $ | 582,584 | $ | 638,264 | $ | 411,085 | ||||||||||
(1) | Includes leasehold financing obligations of $46.4 million. Refer to Note 2, “SUMMARY OF SIGNIFICANT ACCOUNTING POLICIES,” of the Notes to Consolidated Financial Statements included in “ITEM 8. FINANCIAL STATEMENTS AND SUPPLEMENTARY DATA” of this Annual Report on Form 10-K for additional information. |
(2) | Includes estimated interest payments based on the interest rate as of January 28, 2017 and assuming normally scheduled principal payments. |
Long-term debt obligations consist of principal payments under the Term Loan Agreement. Refer to Note 11, “BORROWINGS,” of the Notes to Consolidated Financial Statements included in “ITEM 8. FINANCIAL STATEMENTS AND SUPPLEMENTARY DATA” of this Annual Report on Form 10-K for additional information.
Operating lease obligations consist primarily of non-cancelable future minimum lease commitments related to store operating leases. See Note 2, “SUMMARY OF SIGNIFICANT ACCOUNTING POLICIES--Leased facilities,” of the Notes to Consolidated Financial Statements included in “ITEM 8. FINANCIAL STATEMENTS AND SUPPLEMENTARY DATA” of this Annual Report on Form 10-K, for further discussion. Excluded from the obligations above are amounts related to portions of lease terms that are currently cancelable at the Company’s discretion. While included in the obligations above, in many instances, the Company has options to terminate certain leases if stated sales volume levels are not met or the Company ceases operations in a given country.
35
Operating lease obligations do not include common area maintenance (“CAM”), insurance, marketing or tax payments for which the Company is also obligated. Total expense related to CAM, insurance, marketing and taxes was $164.0 million in Fiscal 2016.
The purchase obligations category represents purchase orders for merchandise to be delivered during Fiscal 2017 and commitments for fabric expected to be used during upcoming seasons. In addition, purchase obligations include agreements to purchase goods or services including information technology contracts and third-party distribution center service contracts.
Other obligations consist primarily of asset retirement obligations and the Supplemental Executive Retirement Plan. See Note 16, “SAVINGS AND RETIREMENT PLANS,” of the Notes to Consolidated Financial Statements included in “ITEM 8. FINANCIAL STATEMENTS AND SUPPLEMENTARY DATA” of this Annual Report on Form 10-K, for further discussion.
Due to uncertainty as to the amounts and timing of future payments, the contractual obligations table above does not include tax (including accrued interest and penalties) of $1.5 million related to uncertain tax positions at January 28, 2017. Deferred taxes are also not included in the preceding table. For further discussion, see Note 10, “INCOME TAXES,” of the Notes to Consolidated Financial Statements included in “ITEM 8. FINANCIAL STATEMENTS AND SUPPLEMENTARY DATA” of this Annual Report on Form 10-K.
A&F has historically paid quarterly dividends on its Common Stock. There are no amounts included in the above table related to dividends due to the fact that dividends are subject to determination and approval by A&F’s Board of Directors.
36
STORE ACTIVITY
During the year, the Company opened ten international full-price stores, two international outlet stores, four U.S. full-price stores and four U.S. outlet stores. In addition, the Company closed 53 U.S. stores and one international store.
Store count and gross square footage by brand and geography for Fiscal 2016 and Fiscal 2015, respectively were as follows:
Abercrombie (1) | Hollister (2) | Total | |||||||||||||||
United States | International | United States | International | United States | International | ||||||||||||
January 31, 2015 | 361 | 32 | 433 | 135 | 794 | 167 | |||||||||||
New | 13 | 7 | 2 | 8 | 15 | 15 | |||||||||||
Closed | (34 | ) | — | (21 | ) | (4 | ) | (55 | ) | (4 | ) | ||||||
January 30, 2016 | 340 | 39 | 414 | 139 | 754 | 178 | |||||||||||
New | 5 | 6 | 3 | 6 | 8 | 12 | |||||||||||
Closed | (34 | ) | (1 | ) | (19 | ) | — | (53 | ) | (1 | ) | ||||||
January 28, 2017 | 311 | 44 | 398 | 145 | 709 | 189 | |||||||||||
Gross square feet (in thousands): | |||||||||||||||||
January 30, 2016 | 2,634 | 619 | 2,856 | 1,183 | 5,490 | 1,802 | |||||||||||
January 28, 2017 | 2,411 | 641 | 2,737 | 1,218 | 5,148 | 1,859 | |||||||||||
(1) | Abercrombie includes the Company’s Abercrombie & Fitch and abercrombie kids brands. Prior period store counts have been restated to combine Abercrombie & Fitch stores with abercrombie kids carveouts into one store. The change reduced total stores by eight stores as of January 31, 2015. Excludes one international franchise store as of January 28, 2017 and January 30, 2016. |
(2) | Excludes three international franchise stores as of January 28, 2017 and two international franchise stores as of January 30, 2016. |
CAPITAL EXPENDITURES
Capital expenditures totaled $140.8 million, $143.2 million and $174.6 million for Fiscal 2016, Fiscal 2015 and Fiscal 2014, respectively. A summary of capital expenditures is as follows:
(in thousands) | Fiscal 2016 | Fiscal 2015 | Fiscal 2014 | |||||||||
New store construction, store refreshes and remodels | $ | 73,053 | $ | 71,675 | $ | 86,316 | ||||||
Home office, distribution centers and information technology | 67,791 | 71,524 | 88,291 | |||||||||
Total capital expenditures | $ | 140,844 | $ | 143,199 | $ | 174,607 | ||||||
The Company expects capital expenditures to be approximately $100 million for Fiscal 2017, which will be prioritized toward store updates and new stores, as well as direct-to-consumer and omnichannel and information technology investments to support growth initiatives.
RECENT ACCOUNTING PRONOUNCEMENTS
See Note 2, “SUMMARY OF SIGNIFICANT ACCOUTING POLICIES - Recent accounting pronouncements,” of the Notes to the Consolidated Financial Statements included in “ITEM 8. FINANCIAL STATEMENT AND SUPPLEMENTARY DATA,” of this Annual Report on Form 10-K for recent accounting pronouncements, including the expected dates of adoption and anticipated effects on our Consolidated Financial Statements.
CRITICAL ACCOUNTING POLICIES AND ESTIMATES
The Company’s discussion and analysis of its financial condition and results of operations are based upon the Company’s consolidated financial statements which have been prepared in accordance with accounting principles generally accepted in the United States of America. The preparation of these consolidated financial statements requires the Company to make estimates and assumptions that affect the reported amounts of assets, liabilities, revenues and expenses. Since actual results may differ from those estimates, the Company revises its estimates and assumptions as new information becomes available.
37
The Company believes the following policies are the most critical to the portrayal of the Company’s financial condition and results of operations.
Policy | Effect if Actual Results Differ from Assumptions | |
Revenue Recognition | ||
The Company reserves for sales returns through estimates based on historical returns experience, recent sales activity and various other assumptions that management believes to be reasonable. | The Company has not made any material changes in the accounting methodology used to determine the sales return reserve over the past three fiscal years. | |
The Company does not expect material changes to the underlying assumptions used to measure the sales return reserve as of January 28, 2017. However, actual results could vary from estimates and could result in material gains or losses. | ||
Inventory Valuation | ||
The Company reviews inventories on a quarterly basis. The Company reduces the inventory valuation when the carrying cost of specific inventory items on hand exceeds the amount expected to be realized from the ultimate sale or disposal of the goods, through a lower of cost or market (“LCM”) adjustment. The valuation reserve is established to reduce inventory to its net realizable value based on the Company’s consideration of multiple factors and assumptions including demand forecasts, current sales volumes, expected sell-off activity, composition and aging of inventory, historical recoverability experience and risk of obsolescence from changes in economic conditions or customer preferences. | The Company does not expect material changes to the underlying assumptions used to measure the shrink reserve or the LCM reserve as of January 28, 2017. However, actual results could vary from estimates and could significantly impact the ending inventory valuation at cost, as well as gross margin. An increase or decrease in the LCM reserve of 10% would have affected pre-tax income by approximately $1.8 million for Fiscal 2016. | |
Additionally, as part of inventory valuation, an inventory shrink estimate is made each quarter that reduces the value of inventory for lost or stolen items, based on sales volumes, average unit costs, historical losses and actual shrink results from previous physical inventories. | An increase or decrease in the inventory shrink accrual of 10% would have affected pre-tax income by approximately $0.8 million for Fiscal 2016. | |
Long-lived Assets | ||
Long-lived assets, primarily comprised of leasehold improvements, furniture, fixtures and equipment, are tested for recoverability whenever events or changes in circumstances indicate that the carrying amount of the long-lived asset might not be recoverable. These include, but are not limited to, material declines in operational performance, a history of losses, an expectation of future losses, other than temporary adverse market conditions and store closure or relocation decisions. On at least a quarterly basis, the Company reviews for indicators of impairment at the individual store level, the lowest level for which cash flows are identifiable. | Impairment loss calculations involve uncertainty due to the nature of the assumptions that management is required to make, including estimating projected cash flows and selecting the discount rate that best reflects the risk inherent in future cash flows. If actual results are not consistent with the estimates and assumptions used, there may be a material impact on the Company’s financial condition or results of operation. As of January 28, 2017, stores that were tested for impairment and not impaired had a net book value of $6.8 million and had undiscounted cash flows which were in the range of 100% to 150% of their respective net asset values. | |
38
Policy | Effect if Actual Results Differ from Assumptions | |
Long-lived Assets (Continued) | ||
Stores that display an indicator of impairment are subjected to an impairment assessment. The Company’s impairment assessment requires management to make assumptions and judgments related, but not limited, to management’s expectations for future operations and projected cash flows. The key assumptions used in the Company’s undiscounted future cash flow models include sales, gross margin and, to a lesser extent, operating expenses. An impairment loss would be recognized when these undiscounted future cash flows are less than carrying amount of the asset group. In the circumstance of impairment, the loss would be measured as the excess of the carrying amount of the asset group over its fair value. The key assumptions used in estimating the fair value of impaired assets may include projected cash flows and discount rate. | For stores assessed by management as having indicators of impairment, a 10% decrease in the sales assumption used to project future cash flows in the impairment testing performed as of January 28, 2017 would have increased the Fiscal 2016 impairment charge by $3.4 million. | |
Income Taxes | ||
The provision for income taxes is determined using the asset and liability approach. Tax laws often require items to be included in tax filings at different times than the items are being reflected in the financial statements. A current liability is recognized for the estimated taxes payable for the current year. Deferred taxes represent the future tax consequences expected to occur when the reported amounts of assets and liabilities are recovered or paid. Deferred taxes are adjusted for enacted changes in tax rates and tax laws. Valuation allowances are recorded to reduce deferred tax assets when it is more likely than not that a tax benefit will not be realized. | The Company does not expect material changes in the judgments, assumptions or interpretations used to calculate the tax provision for Fiscal 2016. However, changes in these judgments, assumptions or interpretations may occur and could have a material impact on the Company’s income tax provision. As of the end of Fiscal 2016, the Company had recorded valuation allowances of $2.5 million. | |
Historically, the Company has not provided a provision for U.S. income tax on undistributed net income from non-U.S. subsidiaries as the Company had determined that such profits were indefinitely reinvested outside the U.S. However, in connection with the corporate restructuring to support omnichannel growth that was completed in Fiscal 2015, the Company determined that undistributed net income earned through October 31, 2015 and earnings and profits (as defined under the Internal Revenue Code and accompanying regulations) in excess of net income would remain indefinitely reinvested outside of the U.S. while undistributed net income earned after October 31, 2015 would not be indefinitely reinvested. Accordingly, the Company has provided deferred U.S. income taxes for net income generated after October 31, 2015 from our non-U.S. subsidiaries. | The Company has approximately $334 million of undistributed earnings and profits (as defined under the Internal Revenue Code and accompanying regulations), which includes approximately $126.6 million in net income that the Company considers indefinitely reinvested outside of the U.S. and for which the Company has not provided U.S. deferred income taxes. If the Company’s indefinite reinvestment position, or U.S. and/or international tax laws changes in the future, there may be a material impact on the Company's provision for income taxes in the period the change occurs. | |
Legal Contingencies | ||
The Company is a defendant in lawsuits and other adversarial proceedings arising in the ordinary course of business. Legal costs incurred in connection with the resolution of claims and lawsuits are expensed as incurred, and the Company establishes reserves for the outcome of litigation where it is probable that a loss has been incurred and such loss is estimable. Significant judgment may be applied in assessing the probability of loss and in estimating the amount of such losses. | Actual liabilities may exceed or be less than the amounts reserved, and there can be no assurance that the final resolution of these matters will not have a material adverse effect on the Company’s financial condition, results of operations or cash flows. | |
39
ITEM 7A. | QUANTITATIVE AND QUALITATIVE DISCLOSURES ABOUT MARKET RISK |
Investment Securities
The Company maintains its cash equivalents in financial instruments, primarily money market funds, with original maturities of three months or less.
The irrevocable rabbi trust (the “Rabbi Trust”) is intended to be used as a source of funds to match respective funding obligations to participants in the Abercrombie & Fitch Co. Nonqualified Savings and Supplemental Retirement Plan I, the Abercrombie & Fitch Co. Nonqualified Savings and Supplemental Retirement Plan II and the Supplemental Executive Retirement Plan. The Rabbi Trust assets primarily consist of trust-owned life insurance policies which are recorded at cash surrender value. The change in cash surrender value of the trust-owned life insurance policies held in the Rabbi Trust resulted in realized gains of $3.1 million, $3.1 million and $3.2 million for Fiscal 2016, Fiscal 2015 and Fiscal 2014, respectively, recorded in interest expense, net on the Consolidated Statements of Operations and Comprehensive Income (Loss).
The Rabbi Trust assets are included in other assets on the Consolidated Balance Sheets as of January 28, 2017 and January 30, 2016, and are restricted in their use as noted above.
Interest Rate Risks
The Company has approximately $268.3 million in gross borrowings outstanding under its term loan facility (the “Term Loan Facility”) and no borrowings outstanding under its senior secured revolving credit facility (the “ABL Facility” and, together with the Term Loan Facility, the “2014 Credit Facilities”). The 2014 Credit Facilities carry interest rates that are tied to LIBOR, or an alternate base rate, plus a margin. The interest rate on the Term Loan Facility has a 100 basis point LIBOR floor, and assuming no changes in the Company’s financial structure as it stands, an increase in market interest rates of 100 basis points would increase annual interest expense of approximately $2.1 million. This hypothetical analysis for Fiscal 2016 may differ from the actual change in interest expense due to various conditions which may result in changes in interest rates under the Company’s 2014 Credit Facilities.
Foreign Exchange Rate Risk
A&F’s international subsidiaries generally operate with functional currencies other than the U.S. Dollar. Since the Company’s Consolidated Financial Statements are presented in U.S. Dollars, the Company must translate revenues, expenses, assets and liabilities from functional currencies into U.S. Dollars at exchange rates in effect during or at the end of the reporting period. The fluctuation in the value of the U.S. Dollar against other currencies affects the reported amounts of revenues, expenses, assets and liabilities. The potential impact of currency fluctuation increases as international expansion increases.
A&F and its subsidiaries have exposure to changes in foreign currency exchange rates associated with foreign currency transactions and forecasted foreign currency transactions, including the sale of inventory between subsidiaries and foreign currency denominated assets and liabilities. The Company has established a program that primarily utilizes foreign currency exchange forward contracts to partially offset the risks associated with the effects of certain foreign currency transactions and forecasted transactions. Under this program, increases or decreases in foreign currency exposures are partially offset by gains or losses on forward contracts, to mitigate the impact of foreign currency gains or losses. The Company does not use forward contracts to engage in currency speculation. All outstanding foreign currency exchange forward contracts are recorded at fair value at the end of each fiscal period.
The fair value of outstanding foreign currency exchange forward contracts included in other current assets was $6.0 million and $4.2 million as of January 28, 2017 and January 30, 2016, respectively. The fair value of outstanding foreign currency exchange forward contracts included in other liabilities was insignificant as of January 28, 2017 and January 30, 2016. Foreign currency exchange forward contracts are sensitive to changes in foreign currency exchange rates. The Company assessed the risk of loss in fair values from the effect of a hypothetical 10% devaluation of the U.S. Dollar against the exchange rates for foreign currencies under contract. The results would decrease derivative contract fair values by approximately $14.5 million. As the Company’s foreign currency exchange forward contracts are primarily designated as cash flow hedges of forecasted transactions, the hypothetical change in fair value would be largely offset by the net change in fair values of the underlying hedged items.
40
ITEM 8. | FINANCIAL STATEMENTS AND SUPPLEMENTARY DATA |
ABERCROMBIE & FITCH CO.
CONSOLIDATED STATEMENTS OF OPERATIONS AND COMPREHENSIVE INCOME (LOSS)
(Thousands, except per share amounts)
2016 | 2015 | 2014 | |||||||||
Net sales | $ | 3,326,740 | $ | 3,518,680 | $ | 3,744,030 | |||||
Cost of sales, exclusive of depreciation and amortization | 1,298,172 | 1,361,137 | 1,430,460 | ||||||||
Gross profit | 2,028,568 | 2,157,543 | 2,313,570 | ||||||||
Stores and distribution expense | 1,578,460 | 1,604,214 | 1,703,051 | ||||||||
Marketing, general and administrative expense | 453,202 | 470,321 | 458,820 | ||||||||
Restructuring (benefit) charge | — | (1,598 | ) | 8,431 | |||||||
Asset impairment | 7,930 | 18,209 | 44,988 | ||||||||
Other operating income, net | (26,212 | ) | (6,441 | ) | (15,239 | ) | |||||
Operating income | 15,188 | 72,838 | 113,519 | ||||||||
Interest expense, net | 18,666 | 18,248 | 14,365 | ||||||||
(Loss) income before taxes | (3,478 | ) | 54,590 | 99,154 | |||||||
Income tax (benefit) expense | (11,196 | ) | 16,031 | 47,333 | |||||||
Net income | 7,718 | 38,559 | 51,821 | ||||||||
Less: Net income attributable to noncontrolling interests | 3,762 | 2,983 | — | ||||||||
Net income attributable to A&F | $ | 3,956 | $ | 35,576 | $ | 51,821 | |||||
Net income per share attributable to A&F | |||||||||||
Basic | $ | 0.06 | $ | 0.52 | $ | 0.72 | |||||
Diluted | $ | 0.06 | $ | 0.51 | $ | 0.71 | |||||
Weighted-average shares outstanding | |||||||||||
Basic | 67,878 | 68,880 | 71,785 | ||||||||
Diluted | 68,284 | 69,417 | 72,937 | ||||||||
Dividends declared per share | $ | 0.80 | $ | 0.80 | $ | 0.80 | |||||
Other comprehensive (loss) income | |||||||||||
Foreign currency translation, net of tax | $ | (6,931 | ) | $ | (22,516 | ) | $ | (77,929 | ) | ||
Derivative financial instruments, net of tax | 248 | (8,523 | ) | 15,266 | |||||||
Other comprehensive loss | (6,683 | ) | (31,039 | ) | (62,663 | ) | |||||
Comprehensive income (loss) | 1,035 | 7,520 | (10,842 | ) | |||||||
Less: Comprehensive income attributable to noncontrolling interests | 3,762 | 2,983 | — | ||||||||
Comprehensive (loss) income attributable to A&F | $ | (2,727 | ) | $ | 4,537 | $ | (10,842 | ) | |||
The accompanying Notes are an integral part of these Consolidated Financial Statements.
41
ABERCROMBIE & FITCH CO.
CONSOLIDATED BALANCE SHEETS
(Thousands, except par value amounts)
January 28, 2017 | January 30, 2016 | ||||||
Assets | |||||||
Current assets: | |||||||
Cash and equivalents | $ | 547,189 | $ | 588,578 | |||
Receivables | 93,384 | 56,868 | |||||
Inventories, net | 399,795 | 436,701 | |||||
Other current assets | 98,932 | 96,833 | |||||
Total current assets | 1,139,300 | 1,178,980 | |||||
Property and equipment, net | 824,738 | 894,178 | |||||
Other assets | 331,719 | 359,881 | |||||
Total assets | $ | 2,295,757 | $ | 2,433,039 | |||
Liabilities and stockholders’ equity | |||||||
Current liabilities: | |||||||
Accounts payable | $ | 187,017 | $ | 184,175 | |||
Accrued expenses | 273,044 | 321,237 | |||||
Short-term portion of deferred lease credits | 20,076 | 23,303 | |||||
Income taxes payable | 5,863 | 5,988 | |||||
Total current liabilities | 486,000 | 534,703 | |||||
Long-term liabilities: | |||||||
Long-term portion of deferred lease credits | 76,321 | 89,256 | |||||
Long-term portion of borrowings, net | 262,992 | 286,235 | |||||
Leasehold financing obligations | 46,397 | 47,440 | |||||
Other liabilities | 172,008 | 179,683 | |||||
Total long-term liabilities | 557,718 | 602,614 | |||||
Stockholders’ equity | |||||||
Class A Common Stock - $0.01 par value: 150,000 shares authorized and 103,300 shares issued at each of January 28, 2017 and January 30, 2016 | 1,033 | 1,033 | |||||
Paid-in capital | 396,590 | 407,029 | |||||
Retained earnings | 2,474,703 | 2,530,196 | |||||
Accumulated other comprehensive loss, net of tax | (121,302 | ) | (114,619 | ) | |||
Treasury stock, at average cost: 35,542 and 35,952 shares at January 28, 2017 and January 30, 2016, respectively | (1,507,589 | ) | (1,532,576 | ) | |||
Total Abercrombie & Fitch Co. stockholders’ equity | 1,243,435 | 1,291,063 | |||||
Noncontrolling interests | 8,604 | 4,659 | |||||
Total stockholders’ equity | 1,252,039 | 1,295,722 | |||||
Total liabilities and stockholders’ equity | $ | 2,295,757 | $ | 2,433,039 | |||
The accompanying Notes are an integral part of these Consolidated Financial Statements.
42
ABERCROMBIE & FITCH CO.
CONSOLIDATED STATEMENTS OF STOCKHOLDERS’ EQUITY
(Thousands, except per share amounts)
Common stock | Paid-in capital | Non-controlling interest | Retained earnings | Accumulated other comprehensive loss | Treasury stock | Total stockholders’ equity | |||||||||||||||||||
Shares outstanding | Par value | Shares | At average cost | ||||||||||||||||||||||
Balance, February 1, 2014 | 76,402 | $ | 1,033 | $ | 433,620 | $ | — | $ | 2,556,270 | $ | (20,917 | ) | 26,898 | $ | (1,240,513 | ) | $ | 1,729,493 | |||||||
Net income | 51,821 | 51,821 | |||||||||||||||||||||||
Purchase of common stock | (7,324 | ) | 7,324 | (285,038 | ) | (285,038 | ) | ||||||||||||||||||
Dividends ($0.80 per share) | (57,362 | ) | (57,362 | ) | |||||||||||||||||||||
Share-based compensation issuances and exercises | 274 | (17,884 | ) | (56 | ) | (274 | ) | 12,989 | (4,951 | ) | |||||||||||||||
Tax effect of share-based compensation issuances and exercises | (4,626 | ) | (4,626 | ) | |||||||||||||||||||||
Share-based compensation expense | 23,027 | 23,027 | |||||||||||||||||||||||
Net change in unrealized gains or losses on derivative financial instruments | 15,266 | 15,266 | |||||||||||||||||||||||
Foreign currency translation adjustments | (77,929 | ) | (77,929 | ) | |||||||||||||||||||||
Balance, January 31, 2015 | 69,352 | $ | 1,033 | $ | 434,137 | $ | — | $ | 2,550,673 | $ | (83,580 | ) | 33,948 | $ | (1,512,562 | ) | $ | 1,389,701 | |||||||
Net income | 2,983 | 35,576 | 38,559 | ||||||||||||||||||||||
Purchase of common stock | (2,461 | ) | 2,461 | (50,033 | ) | (50,033 | ) | ||||||||||||||||||
Dividends ($0.80 per share) | (55,145 | ) | (55,145 | ) | |||||||||||||||||||||
Share-based compensation issuances and exercises | 457 | (37,220 | ) | (908 | ) | (457 | ) | 30,019 | (8,109 | ) | |||||||||||||||
Tax effect of share-based compensation issuances and exercises | (18,247 | ) | (18,247 | ) | |||||||||||||||||||||
Share-based compensation expense | 28,359 | 28,359 | |||||||||||||||||||||||
Net change in unrealized gains or losses on derivative financial instruments | (8,523 | ) | (8,523 | ) | |||||||||||||||||||||
Foreign currency translation adjustments | (22,516 | ) | (22,516 | ) | |||||||||||||||||||||
Contributions from noncontrolling interests, net | 1,676 | 1,676 | |||||||||||||||||||||||
Balance, January 30, 2016 | 67,348 | $ | 1,033 | $ | 407,029 | $ | 4,659 | $ | 2,530,196 | $ | (114,619 | ) | 35,952 | $ | (1,532,576 | ) | $ | 1,295,722 | |||||||
Net income | 3,762 | 3,956 | 7,718 | ||||||||||||||||||||||
Dividends ($0.80 per share) | (54,066 | ) | (54,066 | ) | |||||||||||||||||||||
Share-based compensation issuances and exercises | 410 | (25,043 | ) | (5,383 | ) | (410 | ) | 24,987 | (5,439 | ) | |||||||||||||||
Tax effect of share-based compensation issuances and exercises | (7,516 | ) | (7,516 | ) | |||||||||||||||||||||
Share-based compensation expense | 22,120 | 22,120 | |||||||||||||||||||||||
Net change in unrealized gains or losses on derivative financial instruments | 248 | 248 | |||||||||||||||||||||||
Foreign currency translation adjustments | (6,931 | ) | (6,931 | ) | |||||||||||||||||||||
Contributions from noncontrolling interests, net | 183 | 183 | |||||||||||||||||||||||
Balance, January 28, 2017 | 67,758 | $ | 1,033 | $ | 396,590 | $ | 8,604 | $ | 2,474,703 | $ | (121,302 | ) | 35,542 | $ | (1,507,589 | ) | $ | 1,252,039 | |||||||
The accompanying Notes are an integral part of these Consolidated Financial Statements.
43
ABERCROMBIE & FITCH CO.
CONSOLIDATED STATEMENTS OF CASH FLOWS
(Thousands)
2016 | 2015 | 2014 | |||||||||
Operating activities | |||||||||||
Net income | $ | 7,718 | $ | 38,559 | $ | 51,821 | |||||
Adjustments to reconcile net income to net cash provided by operating activities | |||||||||||
Depreciation and amortization | 195,414 | 213,680 | 226,421 | ||||||||
Asset impairment | 7,930 | 18,209 | 47,084 | ||||||||
Loss on disposal | 3,836 | 11,082 | 5,794 | ||||||||
Amortization of deferred lease credits | (24,557 | ) | (28,619 | ) | (38,437 | ) | |||||
(Benefit from) provision for deferred income taxes | (7,866 | ) | 7,469 | 1,676 | |||||||
Share-based compensation | 22,120 | 28,359 | 23,027 | ||||||||
Changes in assets and liabilities | |||||||||||
Inventories, net | 24,452 | 21,253 | 62,854 | ||||||||
Accounts payable and accrued expenses | (32,647 | ) | 51,050 | (37,394 | ) | ||||||
Lessor construction allowances | 10,288 | 11,082 | 13,182 | ||||||||
Income taxes | (8,528 | ) | (45,027 | ) | (34,659 | ) | |||||
Long-term lease deposits | 26,649 | (1,237 | ) | (1,570 | ) | ||||||
Other assets | (32,291 | ) | 9,204 | 8,458 | |||||||
Other liabilities | (7,927 | ) | (25,123 | ) | (15,777 | ) | |||||
Net cash provided by operating activities | 184,591 | 309,941 | 312,480 | ||||||||
Investing activities | |||||||||||
Purchases of property and equipment | (140,844 | ) | (143,199 | ) | (174,624 | ) | |||||
Proceeds from sale of property and equipment | 4,098 | 11,109 | — | ||||||||
Other investing activities | — | 9,523 | (450 | ) | |||||||
Net cash used for investing activities | (136,746 | ) | (122,567 | ) | (175,074 | ) | |||||
Financing activities | |||||||||||
Purchase of treasury stock | — | (50,033 | ) | (285,038 | ) | ||||||
Repayments of borrowings | (25,000 | ) | (6,000 | ) | (195,750 | ) | |||||
Proceeds from borrowings | — | — | 357,000 | ||||||||
Dividends paid | (54,066 | ) | (55,145 | ) | (57,362 | ) | |||||
Other financing activities | (4,727 | ) | 4,303 | (303 | ) | ||||||
Net cash used for financing activities | (83,793 | ) | (106,875 | ) | (181,453 | ) | |||||
Effect of exchange rates on cash | (5,441 | ) | (12,629 | ) | (35,361 | ) | |||||
Net (decrease) increase in cash and equivalents | (41,389 | ) | 67,870 | (79,408 | ) | ||||||
Cash and equivalents, beginning of period | 588,578 | 520,708 | 600,116 | ||||||||
Cash and equivalents, end of period | $ | 547,189 | $ | 588,578 | $ | 520,708 | |||||
Significant non-cash investing activities | |||||||||||
Change in accrual for construction in progress | $ | (6,104 | ) | $ | 12,859 | $ | 6,525 | ||||
Supplemental information | |||||||||||
Cash paid for interest | $ | 15,254 | $ | 16,060 | $ | 18,609 | |||||
Cash paid for income taxes, net of refunds | $ | 23,651 | $ | 48,702 | $ | 74,685 | |||||
The accompanying Notes are an integral part of these Consolidated Financial Statements.
44
ABERCROMBIE & FITCH CO.
NOTES TO CONSOLIDATED FINANCIAL STATEMENTS
1. NATURE OF BUSINESS
Abercrombie & Fitch Co. (“A&F”), a company incorporated in Delaware in 1996, through its subsidiaries (collectively, A&F and its subsidiaries are referred to as “Abercrombie & Fitch” or the “Company”), is a specialty retailer who primarily sells its products through store and direct-to-consumer operations, as well as through various wholesale, franchise and licensing arrangements. The Company offers a broad array of apparel products, including knit tops, woven shirts, graphic t-shirts, fleece, sweaters, jeans, woven pants, shorts, outerwear, dresses, intimates and swimwear; and personal care products and accessories for men, women and kids under the Abercrombie & Fitch, abercrombie kids, Hollister and Gilly Hicks brands. The Company has operations in North America, Europe, Asia and the Middle East.
2. SUMMARY OF SIGNIFICANT ACCOUNTING POLICIES
Principles of consolidation
The accompanying Consolidated Financial Statements include historical financial statements of, and transactions applicable to, the Company and reflect its assets, liabilities, results of operations and cash flows.
The Company has interests in a United Arab Emirates business venture and in a Kuwait business venture with Majid al Futtaim Fashion L.L.C. (“MAF”), each of which meets the definition of a variable interest entity (“VIE”). The Company is deemed to be the primary beneficiary of these VIEs; therefore, the Company has consolidated the operating results, assets and liabilities of these VIEs, with MAF’s portion of net income presented as net income attributable to noncontrolling interests (“NCI”) in the Company’s Consolidated Statements of Operations and Comprehensive Income (Loss) and MAF’s portion of equity presented as NCI in the Consolidated Balance Sheets.
Fiscal year
The Company’s fiscal year ends on the Saturday closest to January 31. All references herein to “Fiscal 2016” represent the fifty-two week fiscal year ended January 28, 2017; to “Fiscal 2015” represent the fifty-two week fiscal year ended January 30, 2016; and to “Fiscal 2014” represent the fifty-two week fiscal year ended January 31, 2015. In addition, all references herein to “Fiscal 2017” represent the fifty-three week fiscal year that will end on February 3, 2018.
Use of estimates
The preparation of financial statements, in conformity with accounting principles generally accepted in the United States, requires management to make estimates and assumptions that affect the reported amounts of assets and liabilities and disclosure of contingent assets and liabilities at the date of the financial statements and the reported amounts of net sales and expenses during the reporting period. Due to the inherent uncertainty involved with estimates, actual results may differ.
Cash and equivalents
Cash and equivalents include amounts on deposit with financial institutions, United States treasury bills and other investments, primarily held in money market accounts, with original maturities of less than three months.
45
Restricted cash
Any cash that is legally restricted from use is recorded in Other Assets on the Consolidated Balance Sheets. The restricted cash balance was $20.4 million and $20.6 million on January 28, 2017 and January 30, 2016, respectively. Restricted cash includes various cash deposits with international banks that are used as collateral for customary non-debt banking commitments and deposits into trust accounts to conform to standard insurance security requirements.
Receivables
Receivables primarily include credit card receivables, construction allowances, value added tax (“VAT”) receivables, trade receivables, income tax receivables and other tax credits or refunds.
As part of the normal course of business, the Company has approximately three to four days of proceeds from sales transactions outstanding with its third-party credit card vendors at any point. The Company classifies these outstanding balances as credit card receivables. Construction allowances are recorded for certain store lease agreements for improvements completed by the Company. VAT receivables are payments the Company has made on purchases of goods that will be recovered as those goods are sold. Trade receivables are amounts billed by the Company to wholesale, franchise and licensing partners in the ordinary course of business. Income tax receivable represents refunds of certain tax payments along with net operating loss and credit carryback claims for which we expect to receive refunds within the next 12 months.
Inventories, net
Inventories are valued at the lower of cost or market on a weighted-average cost basis. The Company reduces the carrying value of inventory through a lower of cost or market adjustment, the impact of which is reflected in cost of sales, exclusive of depreciation and amortization on the Consolidated Statements of Operations and Comprehensive Income (Loss). The lower of cost or market reserve is based on an analysis of historical experience, composition and aging of the inventory and management’s judgment regarding future demand and market conditions.
Additionally, as part of inventory valuation, inventory shrinkage estimates based on historical trends from actual physical inventories are made each period that reduce the inventory value for lost or stolen items. The Company performs physical inventories on a periodic basis and adjusts the shrink reserve accordingly. See Note 4, “INVENTORIES, NET,” for further discussion.
Other current assets
Other current assets include prepaid rent, current store supplies, derivative contracts and other prepaids.
Property and equipment, net
Depreciation and amortization of property and equipment are computed for financial reporting purposes on a straight-line basis using the following service lives:
Category of Property and Equipment | Service Lives | |
Information technology | 3 - 7 years | |
Furniture, fixtures and equipment | 3 - 15 years | |
Leasehold improvements | 3 - 15 years | |
Other property and equipment | 3 - 20 years | |
Buildings | 30 years | |
Leasehold improvements are amortized over either their respective lease terms or their service lives, whichever is shorter. The cost of assets sold or retired and the related accumulated depreciation or amortization are removed from the accounts with any resulting gain or loss included in net income. Maintenance and repairs are charged to expense as incurred. Major remodels and improvements that extend the service lives of the related assets are capitalized.
Long-lived assets, primarily comprised of leasehold improvements, furniture, fixtures and equipment, are tested for recoverability whenever events or changes in circumstances indicate that the carrying amount of the long-lived assets might not be recoverable.
46
These include, but are not limited to, material declines in operational performance, a history of losses, an expectation of future losses, other than temporary adverse market conditions and store closure or relocation decisions. On at least a quarterly basis, the Company reviews for indicators of impairment at the individual store level, the lowest level for which cash flows are identifiable.
Stores that display an indicator of impairment are subjected to an impairment assessment. The Company’s impairment assessment requires management to make assumptions and judgments related, but not limited, to management’s expectations for future operations and projected cash flows. The key assumptions used in the Company’s undiscounted future cash flow models include sales, gross margin and, to a lesser extent, operating expenses.
An impairment loss would be recognized when these undiscounted future cash flows are less than the carrying amount of the asset group. In the circumstance of impairment, the loss would be measured as the excess of the carrying amount of the asset group over its fair value. The key assumptions used in estimating the fair value of impaired assets may include projected cash flows and discount rate. See Note 5, “PROPERTY AND EQUIPMENT, NET,” for further discussion.
The Company expenses all internal-use software costs incurred in the preliminary project stage and capitalizes certain direct costs associated with the development and purchase of internal-use software within property and equipment. Capitalized costs are amortized on a straight-line basis over the estimated useful lives of the software, generally not exceeding seven years.
Income taxes
Income taxes are calculated using the asset and liability method. Deferred tax assets and liabilities are recognized based on the difference between the financial statement carrying amounts of existing assets and liabilities and their respective tax bases. Deferred tax assets and liabilities are measured using current enacted tax rates in effect for the years in which those temporary differences are expected to reverse. Inherent in the determination of the Company’s income tax liability and related deferred income tax balances are certain judgments and interpretations of enacted tax law and published guidance with respect to applicability to the Company’s operations. The Company is subject to audit by taxing authorities, usually several years after tax returns have been filed, and the taxing authorities may have differing interpretations of tax laws. Valuation allowances are established to reduce deferred tax assets to the amount expected to be realized when it is more likely than not that some portion or all of the deferred tax assets will not be realized.
The Company records tax expense or benefit that does not relate to ordinary income in the current fiscal year discretely in the period in which it occurs. Examples of such types of discrete items include, but are not limited to: changes in estimates of the outcome of tax matters related to prior years, assessments of valuation allowances, return-to-provision adjustments, tax-exempt income, the settlement of tax audits and changes in tax legislation and/or regulations.
In the fourth quarter of Fiscal 2015, the Company restructured its international operations to support its omnichannel initiatives. As a result of the restructuring, the Company no longer believes that future net income as of the date of the restructuring will be indefinitely reinvested and as such is providing a deferred U.S. income tax liability for the additional taxes due upon a future repatriation.
See Note 10, “INCOME TAXES,” for a discussion regarding the Company’s policies for uncertain tax positions.
Foreign currency translation and transactions
The functional currencies of the Company’s foreign subsidiaries are generally the respective local currencies in the countries in which they operate. Assets and liabilities denominated in foreign currencies are translated into U.S. Dollars (the reporting currency) at the exchange rate prevailing at the balance sheet date. Equity accounts denominated in foreign currencies are translated into U.S. Dollars at historical exchange rates. Revenues and expenses denominated in foreign currencies are translated into U.S. Dollars at the monthly average exchange rate for the period. Gains and losses resulting from foreign currency transactions are included in the results of operations; whereas, translation adjustments and inter-company loans of a long-term investment nature are reported as an element of Other Comprehensive Income (Loss). Foreign currency transactions resulted in a gain of $0.4 million for Fiscal 2016, a loss of $1.5 million for Fiscal 2015 and a loss of $2.0 million for Fiscal 2014.
Derivative instruments
See Note 14, “DERIVATIVE INSTRUMENTS.”
47
Stockholders’ equity
At January 28, 2017 and January 30, 2016, there were 150.0 million shares of A&F’s Class A Common Stock, $0.01 par value, authorized, of which 67.8 million and 67.3 million were outstanding at January 28, 2017 and January 30, 2016, respectively, and 106.4 million shares of Class B Common Stock, $0.01 par value, authorized, of which none were outstanding at January 28, 2017 and January 30, 2016.
Holders of Class A Common Stock generally have identical rights to holders of Class B Common Stock, except holders of Class A Common Stock are entitled to one vote per share while holders of Class B Common Stock are entitled to three votes per share on all matters submitted to a vote of stockholders.
Revenue recognition
The Company recognizes sales at the time the customer takes possession of the merchandise. Amounts relating to shipping and handling billed to customers in a sale transaction are classified as net sales and the related direct shipping and handling costs are classified as stores and distribution expense in the Company’s Consolidated Statements of Operations and Comprehensive Income (Loss). Sales are recorded net of an allowance for estimated returns, associate discounts, and promotions and other similar customer incentives. The Company estimates reserves for sales returns based on historical experience. The sales return reserve was $9.8 million, $8.9 million and $9.5 million at January 28, 2017, January 30, 2016 and January 31, 2015, respectively.
The Company sells gift cards in its stores and through direct-to-consumer operations. The Company accounts for gift cards sold to customers by recognizing a liability at the time of sale. Gift cards sold to customers do not expire or lose value over periods of inactivity. The liability remains on the Company’s books until the Company recognizes income from gift cards. Income from gift cards is recognized at the earlier of redemption by the customer (recognized as net sales) or when the Company determines that the likelihood of redemption is remote, referred to as gift card breakage (recognized as other operating income). The Company determines the probability of the gift card being redeemed to be remote based on historical redemption patterns. The gift card liability was $29.7 million and $36.4 million at January 28, 2017 and January 30, 2016, respectively.
The Company is not required by law to escheat the value of unredeemed gift cards to the jurisdictions in which it operates.
The Company's revenue under franchise and license arrangements generally consists of royalties earned upon sale of merchandise by franchise and license partners to retail customers. Under wholesale arrangements, revenue is generally recognized at the time ownership passes to the partner.
Tax amounts collected as part of sales transactions are not included in the Company's net sales.
Cost of sales, exclusive of depreciation and amortization
Cost of sales, exclusive of depreciation and amortization, is primarily comprised of cost incurred to ready inventory for sale, including product costs, freight, and import cost, as well as provisions for reserves for shrink and lower of cost or market. Gains and losses associated with foreign currency exchange forward contracts related to hedging of inventory purchases are also recognized in cost of sales, exclusive of depreciation and amortization when the inventory being hedged is sold.
48
Stores and distribution expense
Stores and distribution expense includes store payroll, store management, rent, utilities and other landlord expenses, depreciation and amortization, repairs and maintenance and other store support functions, as well as direct-to-consumer expense and distribution center (“DC”) expense.
Shipping and handling costs, including costs incurred to store, move and prepare product for shipment, and costs incurred to physically move product to customers, associated with direct-to-consumer operations, were $125.4 million, $115.0 million and $108.1 million for Fiscal 2016, Fiscal 2015 and Fiscal 2014, respectively. Handling costs, including costs incurred to store, move and prepare product for shipment to stores, were $41.5 million, $44.5 million and $52.2 million for Fiscal 2016, Fiscal 2015 and Fiscal 2014, respectively. These amounts are recorded in stores and distribution expense in the Company’s Consolidated Statements of Operations and Comprehensive Income (Loss).
Costs incurred to physically move product to stores is recorded in cost of sales, exclusive of depreciation and amortization in the Company’s Consolidated Statements of Operations and Comprehensive Income (Loss).
Marketing, general & administrative expense
Marketing, general and administrative expense includes: photography and social media; store marketing; home office compensation, except for those departments included in stores and distribution expense; information technology; outside services such as legal and consulting; relocation; recruiting; samples; and travel expenses.
Other operating income, net
Other operating income, net included income of $2.2 million and $10.2 million related to insurance recoveries for Fiscal 2015 and Fiscal 2014, respectively; and income of $10.3 million, $4.7 million and $5.8 million for Fiscal 2016, Fiscal 2015 and Fiscal 2014, respectively, related to gift card balances whose likelihood of redemption has been determined to be remote. Fiscal 2016 gift card breakage is inclusive of $4.8 million related to the initial recognition of international gift card breakage. For Fiscal 2016, the Company recognized a $12.3 million gain in other operating income, net in connection with a settlement of certain economic loss claims associated with the April 2010 Deepwater Horizon oil spill.
Advertising costs
Advertising costs are comprised of in-store photography, e-mail distribution and other digital direct advertising and other media advertising and are reported on the Consolidated Statements of Operations and Comprehensive Income (Loss). Advertising costs related specifically to direct-to-consumer operations are expensed as incurred as a component of stores and distribution expense. The production of in-store photography and signage are expensed when the marketing campaign commences as a component of marketing, general and administrative expense. All other advertising costs are expensed as incurred as a component of marketing, general and administrative expense. The Company recognized $110.1 million, $80.7 million and $84.6 million in advertising expense in Fiscal 2016, Fiscal 2015 and Fiscal 2014, respectively.
Leased facilities
The Company leases property for its stores under operating leases. Lease agreements may contain construction allowances, rent escalation clauses and/or contingent rent provisions.
Annual store rent is comprised of a fixed minimum amount and/or contingent rent based on a percentage of sales. For construction allowances, the Company records a deferred lease credit on the Consolidated Balance Sheets and amortizes the deferred lease credit as a reduction of rent expense on the Consolidated Statements of Operations and Comprehensive Income (Loss) over the term of the lease. For scheduled rent escalation clauses during the lease term, the Company records minimum rental expense on a straight-line basis over the term of the lease on the Consolidated Statements of Operations and Comprehensive Income (Loss). The difference between rent expense and the amounts paid under the lease, less amounts attributable to the repayment of construction allowances recorded as deferred rent, is included in accrued expenses and other liabilities on the Consolidated Balance Sheets. The term over which the Company amortizes construction allowances and minimum rental expenses on a straight-line basis begins on the date of initial possession, which is generally when the Company enters the space and begins construction.
49
Certain leases provide for contingent rents, which are determined as a percentage of gross sales. The Company records a contingent rent liability in accrued expenses on the Consolidated Balance Sheets, and the corresponding rent expense on the Consolidated Statements of Operations and Comprehensive Income (Loss) on a ratable basis over the measurement period when it is determined that achieving the specified levels during the fiscal year is probable. In addition, most leases require payment of real estate taxes, insurance and certain common area maintenance costs in addition to future minimum lease payments.
A summary of rent expense follows:
(in thousands) | 2016 | 2015 | 2014 | ||||||||
Store rent: | |||||||||||
Fixed minimum(1) | $ | 408,575 | $ | 404,836 | $ | 432,794 | |||||
Contingent | 11,690 | 10,161 | 8,886 | ||||||||
Deferred lease credits amortization | (24,557 | ) | (28,619 | ) | (38,437 | ) | |||||
Total store rent expense | 395,708 | 386,378 | 403,243 | ||||||||
Buildings, equipment and other | 5,772 | 3,849 | 4,619 | ||||||||
Total rent expense | $ | 401,480 | $ | 390,227 | $ | 407,862 | |||||
(1) Includes lease termination fees of $15.5 million, $3.3 million and $12.4 million for Fiscal 2016, Fiscal 2015 and Fiscal 2014, respectively. Fiscal 2015 includes a benefit of $1.6 million related to better than expected lease exit terms associated with the closure of the Gilly Hicks stand-alone stores. Fiscal 2014 includes lease termination fees of $6.8 million related to the Gilly Hicks restructuring.
At January 28, 2017, the Company was committed to non-cancelable leases with remaining terms of less than one year to 15 years. Excluded from the obligations below are portions of lease terms that are currently cancelable at the Company’s discretion without condition. While included in the obligations below, in many instances the Company has options to terminate certain leases if stated sales volume levels are not met or the Company ceases operations in a given country, which may be subject to lease termination policies. A summary of operating lease commitments, including leasehold financing obligations, under non-cancelable leases follows:
(in thousands) | |||
Fiscal 2017 | $ | 350,503 | |
Fiscal 2018 | $ | 289,742 | |
Fiscal 2019 | $ | 221,797 | |
Fiscal 2020 | $ | 178,719 | |
Fiscal 2021 | $ | 139,477 | |
Thereafter | $ | 369,709 | |
Leasehold financing obligations
In certain lease arrangements, the Company is involved in the construction of a building and is deemed to be the owner of the construction project. In those instances, the Company records an asset for the amount of the total project costs, including the portion funded by the landlord, and an amount related to the value attributed to the pre-existing leased building in property and equipment, net, and a corresponding financing obligation in leasehold financing obligations, on the Consolidated Balance Sheets. Once construction is complete, if it is determined that the asset does not qualify for sale-leaseback accounting treatment, the Company continues to amortize the obligation over the lease term and depreciates the asset over its useful life. The Company allocates a portion of its rent obligation to the assets which are owned for accounting purposes as a reduction of the financing obligation and interest expense. As of January 28, 2017 and January 30, 2016, the Company had $46.4 million and $47.4 million, respectively, of long-term liabilities related to leasehold financing obligations. Total interest expense related to landlord financing obligations was $5.7 million, $5.3 million and $6.2 million for Fiscal 2016, Fiscal 2015 and Fiscal 2014, respectively.
Store pre-opening expenses
Pre-opening expenses related to new store openings are expensed as incurred and are reflected as a component of “stores and distribution expense.”
50
Design and development costs
Costs to design and develop the Company’s merchandise are expensed as incurred and are reflected as a component of “marketing, general and administrative expense.”
Net income per share attributable to A&F
Net income per basic and diluted share attributable to A&F is computed based on the weighted-average number of outstanding shares of common stock.
The following table presents weighted-average shares outstanding and anti-dilutive shares:
(in thousands) | 2016 | 2015 | 2014 | |||||
Shares of common stock issued | 103,300 | 103,300 | 103,300 | |||||
Weighted-average treasury shares | (35,422 | ) | (34,420 | ) | (31,515 | ) | ||
Weighted-average — basic shares | 67,878 | 68,880 | 71,785 | |||||
Dilutive effect of share-based compensation awards | 406 | 537 | 1,152 | |||||
Weighted-average — diluted shares | 68,284 | 69,417 | 72,937 | |||||
Anti-dilutive shares (1) | 6,107 | 8,967 | 6,144 | |||||
(1) | Reflects the total number of shares related to outstanding share-based compensation awards that have been excluded from the computation of net income per diluted share because the impact would have been anti-dilutive. |
Share-based compensation
See Note 13, “SHARE-BASED COMPENSATION.”
51
Recent accounting pronouncements
The following table provides a brief description of recent accounting pronouncements that could affect the Company’s financial statements:
Accounting Standards Update (ASU) | Description | Date of Adoption | Effect on the Financial Statements or Other Significant Matters | |||
Standards not yet adopted | ||||||
ASU 2015-11, Simplifying the Measurement of Inventory | This update amends ASC 330, Inventory. The new guidance applies to inventory measured using first-in, first-out (FIFO) or average cost. Under this amendment, inventory should be measured at the lower of cost and net realizable value, which is the estimated selling price in the ordinary course of business, less reasonably predictable costs of completion, disposal, and transportation. | January 29, 2017* | The Company does not expect the adoption of this guidance to have a material impact on its consolidated financial statements. | |||
ASU 2016-09, Compensation—Stock Compensation | This update amends ASC 718, Compensation. Under the new guidance, tax benefits and certain tax deficiencies arising from the settlement of share-based payments will be recognized as income tax benefits or expenses in the statement of operations, whereas under the current guidance such benefits and deficiencies are recorded in additional paid-in-capital. The cash flow effects of the tax benefit will be reported in cash flows from operating activities, whereas they are currently reported in cash flows from financing activities. This guidance also allows for entities to make a policy election to estimate forfeitures or account for them when they occur. | January 29, 2017* | Based on share-based compensation awards currently outstanding at current stock prices, the adoption of this guidance will result in additional non-cash income tax expense of approximately $9 million and $15 million in Fiscal 2017 and 2018, respectively, primarily related to the expiration of certain stock appreciation rights. The Company does not expect share-based compensation awards currently outstanding to have a material impact on income tax expense beyond Fiscal 2018. | |||
ASU 2014-09, Revenue from Contracts with Customers | This update supersedes the revenue recognition requirements in ASC 605, Revenue Recognition. The new guidance requires entities to recognize revenue in a way that depicts the transfer of promised goods or services to customers in an amount that reflects the consideration which the entity expects to be entitled to in exchange for those goods or services. | February 4, 2018 | The Company is currently evaluating the impact that this guidance will have on its consolidated financial statements. | |||
ASU 2016-02, Leases | This update supersedes the leasing requirements in ASC 840, Leases. The new guidance requires an entity to recognize lease assets and lease liabilities on the balance sheet and disclose key leasing information that depicts the lease rights and obligations of an entity. | February 3, 2019* | The Company is currently evaluating the impact that this guidance will have on its consolidated financial statements, but expects that it will result in a significant increase in the Company’s long-term assets and long-term liabilities on the Company's consolidated balance sheets. | |||
* Early adoption is permitted.
52
3. FAIR VALUE
Fair value is the price that would be received to sell an asset or paid to transfer a liability in an orderly transaction between market participants at the measurement date. The inputs used to measure fair value are prioritized based on a three-level hierarchy. The three levels of inputs to measure fair value are as follows:
• | Level 1—inputs are unadjusted quoted prices for identical assets or liabilities that are available in active markets that the Company can access at the measurement date. |
• | Level 2—inputs are other than quoted market prices included within Level 1 that are observable for assets or liabilities, directly or indirectly. |
• | Level 3—inputs to the valuation methodology are unobservable. |
The lowest level of significant input determines the placement of the entire fair value measurement in the hierarchy. The three levels of the hierarchy and the distribution within it of the Company’s assets and liabilities, which are measured at fair value on a recurring basis, were as follows:
Assets and Liabilities at Fair Value as of January 28, 2017 | |||||||||||||||
(in thousands) | Level 1 | Level 2 | Level 3 | Total | |||||||||||
Assets: | |||||||||||||||
Trust-owned life insurance policies (at cash surrender value) | $ | — | $ | 99,655 | $ | — | $ | 99,655 | |||||||
Money market funds | 94,026 | — | — | 94,026 | |||||||||||
Derivative financial instruments | — | 6,041 | — | 6,041 | |||||||||||
Total assets | $ | 94,026 | $ | 105,696 | $ | — | $ | 199,722 | |||||||
Liabilities: | |||||||||||||||
Derivative financial instruments | $ | — | $ | 492 | $ | — | $ | 492 | |||||||
Total liabilities | $ | — | $ | 492 | $ | — | $ | 492 | |||||||
Assets and Liabilities at Fair Value as of January 30, 2016 | |||||||||||||||
(in thousands) | Level 1 | Level 2 | Level 3 | Total | |||||||||||
Assets: | |||||||||||||||
Money market funds | $ | 311,349 | $ | — | $ | — | $ | 311,349 | |||||||
Derivative financial instruments | — | 4,166 | — | 4,166 | |||||||||||
Total assets | $ | 311,349 | $ | 4,166 | $ | — | $ | 315,515 | |||||||
The Level 2 assets and liabilities consist of trust-owned life insurance policies and derivative financial instruments, primarily foreign currency exchange forward contracts. The fair value of foreign currency exchange forward contracts is determined by using quoted market prices of the same or similar instruments, adjusted for counterparty risk.
Fair value of borrowings:
The Company’s borrowings under the Company’s credit facilities are carried at historical cost in the accompanying Consolidated Balance Sheets. For disclosure purposes, the Company estimated the fair value of borrowings outstanding based on market rates for similar types of debt, which are considered to be Level 2 inputs.
The carrying amount and fair value of the Company’s term loan facility were as follows:
(in thousands) | January 28, 2017 | January 30, 2016 | |||||
Gross borrowings outstanding, carrying amount | $ | 268,250 | $ | 293,250 | |||
Gross borrowings outstanding, fair value | $ | 260,551 | $ | 284,453 | |||
No borrowings were outstanding under the Company’s senior secured revolving credit facility as of January 28, 2017 or January 30, 2016. See Note 11, “BORROWINGS,” for further discussion of the Company’s credit facilities.
53
4. INVENTORIES, NET
Inventories, net consisted of:
(in thousands) | January 28, 2017 | January 30, 2016 | |||||
Inventories | $ | 425,807 | $ | 466,918 | |||
Less: Lower of cost or market reserve | (18,402 | ) | (19,616 | ) | |||
Less: Shrink reserve | (7,610 | ) | (10,601 | ) | |||
Inventories, net | $ | 399,795 | $ | 436,701 | |||
The inventory balance, net of reserves, included inventory in transit from vendors of $79.2 million and $71.7 million at January 28, 2017 and January 30, 2016, respectively. Inventory in transit is considered to be merchandise owned by the Company that has not yet been received at a Company distribution center.
5. PROPERTY AND EQUIPMENT, NET
Property and equipment, net consisted of:
(in thousands) | January 28, 2017 | January 30, 2016 | |||||
Land | $ | 36,875 | $ | 37,451 | |||
Buildings | 282,564 | 287,081 | |||||
Furniture, fixtures and equipment | 691,918 | 682,013 | |||||
Information technology | 480,352 | 479,269 | |||||
Leasehold improvements | 1,224,398 | 1,283,613 | |||||
Construction in progress | 54,080 | 19,875 | |||||
Other | 1,952 | 3,135 | |||||
Total | $ | 2,772,139 | $ | 2,792,437 | |||
Less: Accumulated depreciation and amortization | (1,947,401 | ) | (1,898,259 | ) | |||
Property and equipment, net | $ | 824,738 | $ | 894,178 | |||
Long-lived assets, primarily comprised of leasehold improvements, furniture, fixtures and equipment, are tested for recoverability whenever events or changes in circumstances indicate that the carrying amount of the long-lived assets might not be recoverable. These include, but are not limited to, material declines in operational performance, a history of losses, an expectation of future losses, other than temporary adverse market conditions and store closure or relocation decisions. On at least a quarterly basis, the Company reviews for indicators of impairment at the individual store level, the lowest level for which cash flows are identifiable.
Stores that display an indicator of impairment are subjected to an impairment assessment. The Company’s impairment assessment requires management to make assumptions and judgments related, but not limited, to management’s expectations for future operations and projected cash flows. The key assumptions used in the Company’s undiscounted future cash flow models include sales, gross margin and, to a lesser extent, operating expenses.
An impairment loss would be recognized when these undiscounted future cash flows are less than the carrying amount of the asset group. In the circumstance of impairment, the loss would be measured as the excess of the carrying amount of the asset group over its fair value. The key assumptions used in estimating the fair value of impaired assets may include projected cash flows and discount rate.
Fair value of the Company’s store-related assets is determined at the individual store level, primarily using a discounted cash flow model that utilizes Level 3 inputs. The estimation of future cash flows from operating activities requires significant estimates of factors that include future sales, gross margin performance and operating expenses. In instances where the discounted cash flow analysis indicates a negative value at the store level, the market exit price based on historical experience, and other comparable market data where applicable, is used to determine the fair value by asset type.
54
In Fiscal 2016, the Company incurred non-cash asset impairment charges of $7.9 million as it was determined that the carrying value of certain assets would not be recoverable and exceeded fair value. The asset impairment charges primarily related to the Company's abercrombie kids flagship store in London.
In Fiscal 2015, the Company incurred non-cash asset impairment charges of $18.2 million as it was determined that the carrying value of certain assets would not be recoverable and exceeded fair value. The asset impairment charges primarily related to the Company’s Abercrombie & Fitch flagship store in Hong Kong.
In Fiscal 2014, the Company incurred non-cash asset impairment charges of $45.0 million, excluding impairment charges incurred in connection with the Gilly Hicks restructuring, as it was determined that the carrying value of certain assets would not be recoverable and exceeded fair value. The asset impairment charges primarily related to the Company’s Abercrombie & Fitch flagship store locations in Tokyo, Japan and Seoul, Korea, as well as nine abercrombie kids stores and nine Hollister stores. Additionally, in connection with the Company’s plan to sell its corporate aircraft, the asset was classified as available-for-sale and the Company incurred charges of approximately $11.3 million to record the expected loss on the disposal of the asset. The fair value of the Company’s corporate aircraft was determined using a market approach utilizing Level 2 inputs.
The Company had $35.6 million and $37.3 million of construction project assets in property and equipment, net at January 28, 2017 and January 30, 2016, respectively, related to the construction of buildings in certain lease arrangements where the Company is deemed to be the owner of the construction project.
6. RABBI TRUST ASSETS
Investments of Rabbi Trust assets consisted of the following:
(in thousands) | January 28, 2017 | January 30, 2016 | |||||
Rabbi Trust assets: | |||||||
Trust-owned life insurance policies (at cash surrender value) | $ | 99,655 | $ | 96,567 | |||
Money market funds | 20 | 23 | |||||
Total Rabbi Trust assets | $ | 99,675 | $ | 96,590 | |||
The irrevocable rabbi trust (the “Rabbi Trust”) is intended to be used as a source of funds to match respective funding obligations to participants in the Abercrombie & Fitch Co. Nonqualified Savings and Supplemental Retirement Plan I, the Abercrombie & Fitch Co. Nonqualified Savings and Supplemental Retirement Plan II and the Supplemental Executive Retirement Plan. The Rabbi Trust assets primarily consist of trust-owned life insurance policies which are recorded at cash surrender value. The change in cash surrender value of the trust-owned life insurance policies held in the Rabbi Trust resulted in realized gains of $3.1 million, $3.1 million and $3.2 million for Fiscal 2016, Fiscal 2015 and Fiscal 2014, respectively, recorded in interest expense, net on the Consolidated Statements of Operations and Comprehensive Income (Loss).
The Rabbi Trust assets are included in other assets on the Consolidated Balance Sheets and are restricted in their use as noted above.
55
7. OTHER ASSETS
Other assets consisted of:
(in thousands) | January 28, 2017 | January 30, 2016 | |||||
Rabbi Trust | $ | 99,675 | $ | 96,590 | |||
Deferred tax assets | 91,141 | 89,677 | |||||
Long-term deposits | 40,451 | 64,098 | |||||
Intellectual property | 27,092 | 28,057 | |||||
Long-term supplies | 22,050 | 25,475 | |||||
Restricted cash | 20,443 | 20,581 | |||||
Prepaid income tax on intercompany items | 6,400 | 7,344 | |||||
Other | 24,467 | 28,059 | |||||
Other assets | $ | 331,719 | $ | 359,881 | |||
Long-term supplies include, but are not limited to, hangers, frames, sign holders, security tags, back-room supplies and construction materials. Intellectual property primarily includes trademark assets associated with the Company’s international operations, consisting of finite-lived and indefinite-lived intangible assets of approximately $13.4 million and $13.7 million, respectively, as of January 28, 2017, and approximately $14.4 million and $13.7 million, respectively, as of January 30, 2016. The Company’s finite-lived intangible assets are amortized over a useful life of 10 to 20 years. Restricted cash includes various cash deposits with international banks that are used as collateral for customary non-debt banking commitments and deposits into trust accounts to conform to standard insurance security requirements. Other includes prepaid leases and various other assets.
8. ACCRUED EXPENSES
Accrued expenses consisted of:
(in thousands) | January 28, 2017 | January 30, 2016 | |||||
Accrued payroll and related costs | $ | 37,235 | $ | 60,464 | |||
Construction in progress | 36,853 | 43,129 | |||||
Accrued taxes | 34,077 | 37,203 | |||||
Gift card liability | 29,685 | 36,384 | |||||
Accrued rent | 29,410 | 24,739 | |||||
Other | 105,784 | 119,318 | |||||
Accrued expenses | $ | 273,044 | $ | 321,237 | |||
Accrued payroll and related costs include salaries, incentive compensation, benefits, withholdings and other payroll related costs. Other accrued expenses include expenses incurred but not yet paid related to outside services associated with store and home office operations.
9. DEFERRED LEASE CREDITS
Deferred lease credits are derived from payments received from landlords to wholly or partially offset store construction costs and are classified between current and long-term liabilities. The amounts, which are amortized over the respective terms of the related leases, consisted of the following:
(in thousands) | January 28, 2017 | January 30, 2016 | |||||
Deferred lease credits | $ | 442,788 | $ | 472,279 | |||
Amortized deferred lease credits | (346,391 | ) | (359,720 | ) | |||
Total deferred lease credits, net | 96,397 | 112,559 | |||||
Less: short-term portion of deferred lease credits | (20,076 | ) | (23,303 | ) | |||
Long-term portion of deferred lease credits | $ | 76,321 | $ | 89,256 | |||
56
10. INCOME TAXES
Income (loss) before taxes was comprised of:
(in thousands) | Fiscal 2016 | Fiscal 2015 | Fiscal 2014 | ||||||||
Domestic | $ | (52,041 | ) | $ | 8,412 | $ | 100,115 | ||||
Foreign | 48,563 | 46,178 | (961 | ) | |||||||
Income (loss) before taxes | $ | (3,478 | ) | $ | 54,590 | $ | 99,154 | ||||
Domestic (loss) income above includes intercompany charges to foreign affiliates for management fees, cost-sharing, royalties and interest, but does not include a portion of foreign income that is currently includable on the U.S. federal income tax return.
Income tax (benefit) expense consisted of:
(in thousands) | Fiscal 2016 | Fiscal 2015 | Fiscal 2014 | ||||||||
Current: | |||||||||||
Federal | $ | (18,888 | ) | $ | (3,124 | ) | $ | 21,287 | |||
State | (74 | ) | (434 | ) | 1,944 | ||||||
Foreign | 15,633 | 12,120 | 28,614 | ||||||||
(3,329 | ) | 8,562 | 51,845 | ||||||||
Deferred: | |||||||||||
Federal | (5,787 | ) | 9,224 | 8,971 | |||||||
State | (346 | ) | 3,297 | 1,783 | |||||||
Foreign | (1,734 | ) | (5,052 | ) | (15,266 | ) | |||||
(7,867 | ) | 7,469 | (4,512 | ) | |||||||
Income tax (benefit) expense | $ | (11,196 | ) | $ | 16,031 | $ | 47,333 | ||||
Reconciliation between the statutory federal income tax rate and the effective tax rate is as follows:
Fiscal 2016(1) | Fiscal 2015 | Fiscal 2014 | ||||||
U.S. Federal income tax rate | 35.0 | % | 35.0 | % | 35.0 | % | ||
State income tax, net of U.S. federal income tax effect | 5.0 | 4.6 | 4.3 | |||||
Foreign taxation of non-U.S. operations | 248.9 | (10.2 | ) | 5.4 | ||||
U.S. taxation of non-U.S. operations(2) | (212.6 | ) | 20.0 | — | ||||
Net change in valuation allowances | (16.5 | ) | (8.7 | ) | 6.6 | |||
Audit and other adjustments to prior years’ accruals | (0.1 | ) | (8.7 | ) | (1.3 | ) | ||
Statutory tax rate and law changes | 94.3 | 4.2 | 0.2 | |||||
Permanent items | 122.3 | (4.6 | ) | (1.1 | ) | |||
Credit items | 43.8 | (2.3 | ) | (1.2 | ) | |||
Other items, net | 1.8 | 0.1 | (0.2 | ) | ||||
Total | 321.9 | % | 29.4 | % | 47.7 | % | ||
(1) | Given the low level of income in absolute dollars in Fiscal 2016, effective tax rate reconciling items that may have been considered de minimis in prior years in terms of absolute dollars and on a percentage basis are amplified on a percentage basis in the current year even as the absolute dollar value of the reconciling items are similar to prior years. Accordingly, year over year comparability may be difficult as a result of the amplifying effect of the lower levels of income. |
(2) | U.S. branch operations in Canada and Puerto Rico are subject to tax at the full U.S. tax rates. As a result, income from these operations do not create reconciling items. |
The jurisdictional location of pre-tax income (loss) may represent a significant component of the Company’s effective tax rate as income tax rates outside the U.S. are generally lower than the U.S. statutory income tax rate. Furthermore, the impact of changes in the jurisdictional location of pre-tax income (loss) on the Company’s effective tax rate will be amplified on a percentage basis at lower levels of consolidated pre-tax income (loss) in absolute dollars. The taxation of non-U.S. operations line item in the table above excludes items related to the Company’s non-U.S. operations reported separately in the appropriate corresponding line items.
57
For Fiscal 2016, the impact of taxation of non-U.S. operations on the Company's effective income tax rate was primarily related to the Company's Swiss and Hong Kong subsidiaries, along with the Company's Non-Controlling Interest (NCI). For Fiscal 2016, the Company’s Swiss subsidiary earned pre-tax income of $18.7 million with a jurisdictional effective tax rate of negative 11.0%. Hong Kong incurred pre-tax losses of $12.6 million with a jurisdictional effective tax rate of negative 4.5%. With respect to the NCI, the subsidiaries incurred pre-tax income of $3.8 million with no jurisdictional tax effect.
For Fiscal 2015, the impact of taxation of non-U.S. operations on the Company’s effective income tax rate was primarily related to the Company’s subsidiaries in Australia, Switzerland and Hong Kong. For Fiscal 2015, the Company’s Australian subsidiary incurred pre-tax losses of $4.9 million, with no jurisdictional tax effect, related to the closure of the Company’s Australian operations. For Fiscal 2015, the Company’s Swiss subsidiary earned pre-tax income of $1.9 million with a jurisdictional effective tax rate of negative 745%. The Swiss jurisdictional effective tax rate included the impact of the Company’s omnichannel restructuring as well as the release of a valuation allowance. For Fiscal 2015, the Company’s subsidiary in Hong Kong incurred pre-tax losses of $6.8 million with a jurisdictional effective tax rate of 15.8%, slightly below the statutory tax rate of 16.5%.
For Fiscal 2014, the impact of taxation of non-U.S. operations on the Company’s effective income tax rate was primarily related to the Company’s Australian and Swiss subsidiaries. For Fiscal 2014, the Company’s Australian subsidiary incurred pre-tax losses of $8.4 million with a jurisdictional effective tax rate of negative 5.6%. The Australian jurisdictional effective tax rate included the impact of the closure of the Company’s Australian operations. For Fiscal 2014, the Company’s Swiss subsidiary incurred pre-tax losses of $2.6 million with a jurisdictional effective tax rate of negative 218.4%. The Swiss jurisdictional effective tax rate included the impact of the establishment of a valuation allowance.
The effect of temporary differences which gives rise to deferred income tax assets (liabilities) were as follows:
(in thousands) | January 28, 2017 | January 30, 2016 | |||||
Deferred tax assets: | |||||||
Deferred compensation | $ | 54,552 | $ | 62,679 | |||
Accrued expenses and reserves | 13,168 | 19,862 | |||||
Rent | 33,917 | 36,929 | |||||
Net operating losses (NOL), tax credit and other carryforwards | 26,812 | 14,248 | |||||
Investments in subsidiaries | 8,791 | 2,895 | |||||
Other | 3,030 | 619 | |||||
Valuation allowances | (2,429 | ) | (1,643 | ) | |||
Total deferred tax assets | $ | 137,841 | $ | 135,589 | |||
Deferred tax liabilities: | |||||||
Property, equipment and intangibles | $ | (20,177 | ) | $ | (20,708 | ) | |
Inventory | (11,955 | ) | (9,480 | ) | |||
Store supplies | (4,892 | ) | (6,054 | ) | |||
Prepaid expenses | (3,262 | ) | (3,653 | ) | |||
Undistributed net income of non-U.S. subsidiaries | (5,609 | ) | (4,390 | ) | |||
Other | (950 | ) | (1,011 | ) | |||
Total deferred tax liabilities | (46,845 | ) | (45,296 | ) | |||
Net deferred income tax assets | $ | 90,996 | $ | 90,293 | |||
Accumulated other comprehensive loss is shown net of deferred tax assets and deferred tax liabilities, resulting in a deferred tax liability of $0.6 million and $1.7 million as of January 28, 2017 and January 30, 2016, respectively. Accordingly, these deferred taxes are not reflected in the table above.
As of January 28, 2017, the Company had deferred tax assets related to foreign and state NOL carryforwards of $14.9 million and $1.2 million, respectively, that could be utilized to reduce future years’ tax liabilities. If not utilized, a portion of the foreign NOL carryovers will begin to expire in 2017 and a portion of state NOL will begin to expire in 2021. Some foreign NOL have an indefinite carryforward period.
As of January 28, 2017, the Company had deferred tax assets related to foreign tax credit carryforwards of approximately $7 million that could be utilized to reduce future years’ tax liabilities. If not utilized, the credit carryforwards will begin to expire in 2027. The utilization of credit carryforwards may be limited in a given year.
58
The Company believes it is more likely than not that NOLs, charitable contributions carryforwards and credit carryforwards would reduce future years’ tax liabilities in the U.S., various states and certain foreign jurisdictions less any associated valuation allowance. All valuation allowances have been reflected through the Consolidated Statements of Operations and Comprehensive Income (Loss). No other valuation allowances have been provided for deferred tax assets because management believes that it is more likely than not that the full amount of the net deferred tax assets will be realized in the future. While the Company does not expect material adjustments to the total amount of valuation allowances within the next 12 months, changes in assumptions may occur based on the information then currently available. In such case, the Company will record an adjustment in the period in which a determination is made.
A reconciliation of the beginning and ending amounts of uncertain tax positions is as follows:
(in thousands) | Fiscal 2016 | Fiscal 2015 | Fiscal 2014 | ||||||||
Uncertain tax positions, beginning of the year | $ | 2,455 | $ | 3,212 | $ | 4,182 | |||||
Gross addition for tax positions of the current year | 67 | 13 | 152 | ||||||||
Gross addition for tax positions of prior years | 19 | 598 | 33 | ||||||||
Reductions of tax positions of prior years for: | |||||||||||
Lapses of applicable statutes of limitations | (1,211 | ) | (986 | ) | (348 | ) | |||||
Settlements during the period | (40 | ) | (64 | ) | (4 | ) | |||||
Changes in judgment/ excess reserve | (51 | ) | (318 | ) | (803 | ) | |||||
Uncertain tax positions, end of year | $ | 1,239 | $ | 2,455 | $ | 3,212 | |||||
Tax benefits from uncertain tax positions are recognized when it is more likely than not that the position will be sustained upon examination, including resolutions of any related appeals or litigation processes, based on the technical merits. The amount recognized is measured as the largest amount of tax benefit that is greater than 50 percent likely of being realized upon settlement. The Company’s effective tax rate includes the impact of reserve provisions and changes to reserves on uncertain tax positions that are not more likely than not to be sustained upon examination as well as related interest and penalties.
A number of years may elapse before a particular matter, for which the Company has established a reserve, is audited and finally resolved. The number of years with open tax audits varies depending on the tax jurisdiction. While it is often difficult to predict the final outcome or the timing of resolution of any particular tax matter, the Company believes that its reserves reflect the probable outcome of known tax contingencies. Unfavorable settlement of any particular issue would require use of the Company’s cash. Favorable resolution would be recognized as a reduction to the Company’s effective tax rate in the period of resolution.
The amount of the above uncertain tax positions at January 28, 2017, January 30, 2016 and January 31, 2015, which would impact the Company’s effective tax rate if recognized, was $1.2 million, $2.5 million and $3.2 million, respectively.
The Company recognizes accrued interest and penalties related to uncertain tax positions as a component of income tax expense. During Fiscal 2016, the Company recognized a $0.2 million benefit related to net interest and penalties, compared to a $0.9 million benefit recognized during Fiscal 2015. Interest and penalties of $0.3 million were accrued at the end of Fiscal 2016, compared to $0.5 million accrued at the end of Fiscal 2015.
The Internal Revenue Service (“IRS”) is currently conducting an examination of the Company’s U.S. federal income tax return for Fiscal 2016 as part of the IRS’ Compliance Assurance Process program. The IRS examinations for Fiscal 2015 and prior years have been completed and settled. State and foreign returns are generally subject to examination for a period of three to five years after the filing of the respective return. The Company has various state and foreign income tax returns in the process of examination, administrative appeals or litigation. The outcome of the examinations is not expected to have a material impact on the Company’s financial statements. The Company believes that some of these audits and negotiations will conclude within the next 12 months and that it is reasonably possible the amount of uncertain income tax positions, including interest, may change by an immaterial amount due to settlements of audits and expiration of statutes of limitations.
The Company does not expect material adjustments to the total amount of uncertain tax positions within the next 12 months, but the outcome of tax matters is uncertain and unforeseen results can occur.
As of January 28, 2017, a provision for U.S. income tax has not been recorded on approximately $126.6 million of unremitted income generated through the third quarter of Fiscal 2015 of non-U.S. subsidiaries that the Company has determined to be
59
indefinitely reinvested outside the U.S. The potential U.S. deferred income tax liability if the foreign net income were to be repatriated in the future, net of any foreign income or withholding taxes previously paid, is approximately $25 million. The Company has recorded $5.6 million of deferred U.S. income taxes on $27.3 million of net income generated after October 31, 2015, which is not considered to be invested indefinitely.
11. BORROWINGS
Asset-Based Revolving Credit Facility
On August 7, 2014, A&F, through its subsidiary Abercrombie & Fitch Management Co. (“A&F Management”) as the lead borrower (with A&F and certain other subsidiaries as borrowers or guarantors), entered into an asset-based revolving credit agreement. The agreement, as amended, provides for a senior secured revolving credit facility of up to $400 million (the “ABL Facility”), subject to a borrowing base, with a letter of credit sub-limit of $100 million and an accordion feature allowing A&F to increase the revolving commitment by up to $100 million subject to specified conditions. The ABL Facility is available for working capital, capital expenditures and other general corporate purposes. The ABL Facility will mature on August 7, 2019.
Obligations under the ABL Facility are unconditionally guaranteed by A&F and certain of its subsidiaries. The ABL Facility is secured by a first-priority security interest in certain working capital of the borrowers and guarantors consisting of inventory, accounts receivable and certain other assets. The ABL Facility is also secured by a second-priority security interest in certain property and assets of the borrowers and guarantors, including certain fixed assets, intellectual property, stock of subsidiaries and certain after-acquired material real property.
Amounts borrowed under the ABL Facility bear interest, at the Company’s option, at either an adjusted LIBOR rate plus a margin of 1.25% to 1.75% per annum, or an alternate base rate plus a margin of 0.25% to 0.75% per annum. The initial applicable margins with respect to LIBOR loans and base rate loans, including swing line loans, under the ABL Facility are 1.50% and 0.50% per annum, respectively, and are subject to adjustment each fiscal quarter based on average historical excess availability during the preceding quarter. The Company is also required to pay a fee of 0.25% per annum on undrawn commitments under the ABL Facility. Customary agency fees and letter of credit fees are also payable in respect of the ABL Facility.
No borrowings were outstanding under the ABL Facility as of January 28, 2017.
Term Loan Facility
A&F, through its subsidiary A&F Management as the borrower (with A&F and certain other subsidiaries as guarantors), also entered into a term loan agreement on August 7, 2014, which, as amended, provides for a term loan facility of $300 million (the “Term Loan Facility” and, together with the ABL Facility, the “2014 Credit Facilities”). A portion of the proceeds of the Term Loan Facility was used to repay the outstanding balance of approximately $127.5 million under the Company’s 2012 Term Loan Agreement, to repay outstanding borrowings of approximately $60 million under the Company’s 2011 Credit Agreement and to pay fees and expenses associated with the transaction.
The Term Loan Facility was issued at a 1.0% discount. In addition, the Company recorded deferred financing fees associated with the issuance of the 2014 Credit Facilities of $5.8 million in aggregate, of which $3.2 million was paid to lenders. The Company is amortizing the debt discount and deferred financing fees over the respective contractual terms of the 2014 Credit Facilities.
The Company’s Term Loan debt is presented in the Consolidated Balance Sheets, net of the unamortized discount and fees paid to lenders. Net borrowings as of January 28, 2017 and January 30, 2016 were as follows:
(in thousands) | January 28, 2017 | January 30, 2016 | |||||
Borrowings, gross at carrying amount | $ | 268,250 | $ | 293,250 | |||
Unamortized discount | (1,764 | ) | (1,929 | ) | |||
Unamortized fees paid to lenders | (3,494 | ) | (5,086 | ) | |||
Borrowings, net | 262,992 | 286,235 | |||||
Less: short-term portion of borrowings | — | — | |||||
Long-term portion of borrowings, net | $ | 262,992 | $ | 286,235 | |||
60
The Term Loan Facility will mature on August 7, 2021 and amortizes at a rate equal to 0.25% of the original principal amount per quarter, beginning with the fourth quarter of Fiscal 2014. The Company made a repayment of $25 million in January 2017, in prepayment of its scheduled Fiscal 2017 through Fiscal 2021 amortization and a portion of the amount of principal due at maturity. The Term Loan Facility is subject to (a) beginning in 2016, an annual mandatory prepayment in an amount equal to 0% to 50% of the Company’s excess cash flows in the preceding fiscal year, depending on the Company’s leverage ratio and (b) certain other mandatory prepayments upon receipt by the Company of proceeds of certain debt issuances, asset sales and casualty events, subject to certain exceptions specified therein, including reinvestment rights, less any voluntary payments made. The final principal installment of $268.3 million on the Term Loan Facility will be due in Fiscal 2021.
All obligations under the Term Loan Facility are unconditionally guaranteed by A&F and certain of its subsidiaries. The Term Loan Facility is secured by a first-priority security interest in certain property and assets of the borrowers and guarantors, including certain fixed assets, intellectual property, stock of subsidiaries and certain after-acquired material real property. The Term Loan Facility is also secured by a second-priority security interest in certain working capital of the borrowers and guarantors consisting of inventory, accounts receivable and certain other assets, with certain exceptions.
At the Company’s option, borrowings under the Term Loan Facility will bear interest at either (a) an adjusted LIBOR rate no lower than 1.00% plus a margin of 3.75% per annum or (b) an alternate base rate plus a margin of 2.75% per annum. Customary agency fees are also payable in respect of the Term Loan Facility. The interest rate on borrowings under the Term Loan Facility was 4.75% as of January 28, 2017.
Representations, Warranties and Covenants
The 2014 Credit Facilities contain various representations, warranties and restrictive covenants that, among other things and subject to specified exceptions, restrict the ability of A&F and its subsidiaries to incur indebtedness (including guarantees), grant liens, make investments, pay dividends or distributions with respect to capital stock, make prepayments on other indebtedness, engage in mergers, dispose of certain assets or change the nature of their business. In addition, excess availability equal to the greater of 10% of the loan cap or $30 million must be maintained under the ABL Facility. The 2014 Credit Facilities do not otherwise contain financial maintenance covenants.
The Company was in compliance with the covenants under the 2014 Credit Facilities as of January 28, 2017.
12. OTHER LIABILITIES
Other liabilities consisted of:
(in thousands) | January 28, 2017 | January 30, 2016 | |||||
Accrued straight-line rent | $ | 82,241 | $ | 90,445 | |||
Deferred compensation | 44,531 | 48,058 | |||||
Other | 45,236 | 41,180 | |||||
Other liabilities | $ | 172,008 | $ | 179,683 | |||
Deferred compensation includes the Supplemental Executive Retirement Plan (the “SERP”), the Abercrombie & Fitch Co. Savings and Retirement Plan and the Abercrombie & Fitch Nonqualified Savings and Supplemental Retirement Plan, all further discussed in Note 16, “SAVINGS AND RETIREMENT PLANS,” as well as deferred Board of Directors compensation and other accrued retirement benefits.
61
13. SHARE-BASED COMPENSATION
Financial Statement Impact
The Company recognized share-based compensation expense of $22.1 million, $28.4 million and $23.0 million for Fiscal 2016, Fiscal 2015 and Fiscal 2014, respectively. The Company also recognized tax benefits related to share-based compensation of $8.3 million, $10.6 million and $8.6 million for Fiscal 2016, Fiscal 2015 and Fiscal 2014, respectively.
The fair value of share-based compensation awards is recognized as compensation expense primarily on a straight-line basis over the awards’ requisite service period, net of estimated forfeitures, with the exception of performance share awards. Performance share award expense is primarily recognized in the performance period of the awards’ requisite service period. For awards that are expected to result in a tax deduction, a deferred tax asset is recorded in the period in which share-based compensation expense is recognized. A current tax deduction arises upon the vesting of restricted stock units and performance share awards or the exercise of stock options and stock appreciation rights and is principally measured at the award’s intrinsic value. If the tax deduction is greater than the recorded deferred tax asset, the tax benefit associated with any excess deduction is considered an excess tax benefit and is recognized as additional paid-in capital. If the tax deduction is less than the recorded deferred tax asset, the resulting difference, or shortfall, is first charged to additional paid-in capital, to the extent of the windfall pool of excess tax benefits, with any remainder recognized as tax expense. See Note 2, “SUMMARY OF SIGNIFICANT ACCOUTING POLICIES - Recent accounting pronouncements,” of the Notes to the Consolidated Financial Statements for recent accounting pronouncements, including the expected date of adoption and anticipated effect on our Consolidated Financial Statements, related to changes in the financial reporting of stock compensation.
The Company adjusts share-based compensation expense on a quarterly basis for actual forfeitures and for changes to the estimate of expected award forfeitures. The effect of adjusting the forfeiture rate is recognized in the period the forfeiture estimate is changed. The effect of adjustments for forfeitures was $3.4 million, $5.6 million and $2.6 million for Fiscal 2016, Fiscal 2015 and Fiscal 2014, respectively.
The Company issues shares of Common Stock from treasury stock upon exercise of stock options and stock appreciation rights and vesting of restricted stock units, including those converted from performance share awards. As of January 28, 2017, the Company had sufficient treasury stock available to settle stock options, stock appreciation rights, restricted stock units and performance share awards outstanding. Settlement of stock awards in Common Stock also requires that the Company have sufficient shares available in stockholder-approved plans at the applicable time.
In the event, at each reporting date as of which share-based compensation awards remain outstanding, there are not sufficient shares of Common Stock available to be issued under the Abercrombie & Fitch Co. 2016 Long-Term Incentive Plan for Directors (the “2016 Directors LTIP”) and the Abercrombie & Fitch Co. 2016 Long-Term Incentive Plan for Associates (the “2016 Associates LTIP”), or under a successor or replacement plan, the Company may be required to designate some portion of the outstanding awards to be settled in cash, which would result in liability classification of such awards. The fair value of liability-classified awards is re-measured each reporting date until such awards no longer remain outstanding or until sufficient shares of Common Stock become available to be issued under the existing plans or under a successor or replacement plan. As long as the awards are required to be classified as a liability, the change in fair value would be recognized in current period expense based on the requisite service period rendered.
Plans
As of January 28, 2017, the Company had two primary share-based compensation plans: (i) the 2016 Directors LTIP, with 350,000 shares of the Company's Common Stock authorized for issuance, under which the Company is authorized to grant stock options, stock appreciation rights, restricted stock, restricted stock units and deferred stock awards to non-associate members of the Company's Board of Directors; and (ii) the 2016 Associates LTIP, with 3,500,000 shares of the Company's Common Stock authorized for issuance, under which the Company is authorized to grant stock options, stock appreciation rights, restricted stock, restricted stock units and performance share awards to associates of the Company. The Company also has six other share-based compensation plans under which it granted stock options, stock appreciation rights, restricted stock units and performance share awards to associates of the Company and stock options and restricted stock units to non-associate members of the Company’s Board of Directors in prior years.
62
The 2016 Directors LTIP, a stockholder-approved plan, permits the Company to annually grant awards to non-associate directors, subject to the following limits:
• | For non-associate directors: awards with an aggregate fair market value on the date of the grant of no more than $300,000; |
• | For the non-associate director occupying the role of Non-Executive Chairman of the Board (if any): additional awards with an aggregate fair market value on the date of grant of no more than $500,000; and |
• | For the non-associate director occupying the role of Executive Chairman of the Board (if any): additional awards with an aggregate fair market value on the date of grant of no more than $2,500,000. |
Under the 2016 Directors LTIP, restricted stock units are subject to a minimum vesting period ending no sooner than the early of (i) the first anniversary of the grant date or (ii) the date of the next regularly scheduled annual meeting of stockholders held after the grant date.
The 2016 Associates LTIP, a stockholder-approved plan, permits the Company to annually grant one or more types of awards covering up to an aggregate of 1.0 million of underlying shares of the Company’s Common Stock to any associate of the Company. Under the 2016 Associates LTIP, for restricted stock units that have performance-based vesting, performance must be measured over a period of at least one year and restricted stock units that do not have performance-based vesting, vesting in full may not occur more quickly than in pro-rata installments over a period of three years from the date of the grant, with the first installment vesting no sooner than the first anniversary of the date of the grant.
Under the 2016 Directors LTIP, any stock options or stock appreciation rights granted must have a minimum vesting period ending no sooner than the earlier of (i) the first anniversary of the grant date or (ii) the date of the next regularly scheduled annual meeting of the stockholders held after the grant date and must have a term that does not exceed a period of ten years from the grant date, subject to forfeiture under the terms of the 2016 Directors LTIP. Under the 2016 Associates LTIP, any stock options or stock appreciation rights granted must have a minimum vesting period of one year and a term that does not exceed a period of ten years from the grant date, subject to forfeiture under the terms of the 2016 Associates LTIP.
Each of the 2016 Directors LTIP and the 2016 Associates LTIP provide for accelerated vesting of awards if there is a change of control and certain other conditions specified in each plan are met.
Stock Options
The following table summarizes stock option activity for Fiscal 2016:
Number of Underlying Shares | Weighted- Average Exercise Price | Aggregate Intrinsic Value | Weighted-Average Remaining Contractual Life | |||||||||
Outstanding at January 30, 2016 | 271,000 | $ | 63.05 | |||||||||
Granted | — | — | ||||||||||
Exercised | (2,000 | ) | 22.87 | |||||||||
Forfeited or expired | (79,200 | ) | 31.53 | |||||||||
Outstanding at January 28, 2017 | 189,800 | $ | 76.62 | $ | — | 0.7 | ||||||
Stock options exercisable at January 28, 2017 | 189,900 | $ | 76.62 | $ | — | 0.7 | ||||||
The Company did not grant any stock options during Fiscal 2016, Fiscal 2015 and Fiscal 2014. The total intrinsic value of stock options exercised was insignificant during Fiscal 2016, Fiscal 2015 and Fiscal 2014. As of January 28, 2017, there was no unrecognized compensation cost related to currently outstanding stock options.
63
Stock Appreciation Rights
The following table summarizes stock appreciation rights activity for Fiscal 2016:
Number of Underlying Shares | Weighted-Average Exercise Price | Aggregate Intrinsic Value | Weighted-Average Remaining Contractual Life | |||||||||
Outstanding at January 30, 2016 | 5,301,115 | $ | 45.02 | |||||||||
Granted | — | — | ||||||||||
Exercised | (10,483 | ) | 22.45 | |||||||||
Forfeited or expired | (1,211,582 | ) | 37.19 | |||||||||
Outstanding at January 28, 2017 | 4,079,050 | $ | 47.49 | $ | — | 2.6 | ||||||
Stock appreciation rights exercisable at January 28, 2017 | 3,532,119 | $ | 50.62 | $ | — | 1.9 | ||||||
Stock appreciation rights expected to become exercisable in the future as of January 28, 2017 | 436,030 | $ | 27.72 | $ | — | 7.7 | ||||||
The Company estimates the fair value of stock appreciation rights using the Black-Scholes option-pricing model, which requires the Company to estimate the expected term of the stock appreciation rights and expected future stock price volatility over the expected term. Estimates of expected terms, which represent the expected periods of time the Company believes stock appreciation rights will be outstanding, are based on historical experience. Estimates of expected future stock price volatility are based on the volatility of the Company’s Common Stock price for the most recent historical period equal to the expected term of the stock appreciation right, as appropriate. The Company calculates the volatility as the annualized standard deviation of the differences in the natural logarithms of the weekly stock closing price, adjusted for stock splits and dividends.
No stock appreciation rights were granted in Fiscal 2016. The weighted-average assumptions used in the Black-Scholes option-pricing model for stock appreciation rights granted during Fiscal 2015 and Fiscal 2014 were as follows:
Executive Officers | All Other Associates | ||||||||||||||
2015 | 2014 | 2015 | 2014 | ||||||||||||
Grant date market price | $ | 22.46 | $ | 35.08 | $ | 22.42 | $ | 37.05 | |||||||
Exercise price | $ | 22.46 | $ | 35.49 | $ | 22.42 | $ | 37.22 | |||||||
Fair value | $ | 9.11 | $ | 12.85 | $ | 8.00 | $ | 12.92 | |||||||
Assumptions: | |||||||||||||||
Price volatility | 49 | % | 49 | % | 49 | % | 50 | % | |||||||
Expected term (years) | 6.1 | 4.9 | 4.3 | 4.1 | |||||||||||
Risk-free interest rate | 1.5 | % | 1.6 | % | 4.2 | % | 1.4 | % | |||||||
Dividend yield | 1.7 | % | 2.0 | % | 1.7 | % | 1.9 | % | |||||||
Compensation expense for stock appreciation rights is recognized on a straight-line basis over the awards’ requisite service period, net of forfeitures. As of January 28, 2017, there was $2.5 million of total unrecognized compensation cost, net of estimated forfeitures, related to stock appreciation rights. The unrecognized compensation cost is expected to be recognized over a weighted-average period of 13 months.
The total intrinsic value of stock appreciation rights exercised during Fiscal 2016, Fiscal 2015 and Fiscal 2014 was $0.1 million, $4.3 million and $1.5 million, respectively. The grant date fair value of stock appreciation rights that vested during Fiscal 2016, Fiscal 2015 and Fiscal 2014 was $4.3 million, $4.9 million and $7.4 million, respectively.
64
Restricted Stock Units
The following table summarizes activity for restricted stock units for Fiscal 2016:
Service-based Restricted Stock Units | Performance-based Restricted Stock Units | Market-based Restricted Stock Units | ||||||||||||||||||
Number of Underlying Shares | Weighted- Average Grant Date Fair Value | Number of Underlying Shares | Weighted- Average Grant Date Fair Value | Number of Underlying Shares | Weighted- Average Grant Date Fair Value | |||||||||||||||
Unvested at January 30, 2016 | 1,671,597 | $ | 28.13 | 185,500 | $ | 23.42 | 117,711 | $ | 25.00 | |||||||||||
Granted | 1,182,198 | 24.57 | 129,725 | 25.70 | 129,734 | 31.01 | ||||||||||||||
Adjustments for performance achievement | — | — | — | — | — | — | ||||||||||||||
Vested | (678,033 | ) | 29.96 | (32,625 | ) | 36.12 | — | — | ||||||||||||
Forfeited | (260,301 | ) | 26.81 | (78,677 | ) | 24.22 | (62,553 | ) | 31.91 | |||||||||||
Unvested at January 28, 2017 | 1,915,461 | $ | 25.47 | 203,923 | $ | 22.53 | 184,892 | $ | 26.89 | |||||||||||
Fair value of both service-based and performance-based restricted stock units is calculated using the market price of the underlying common stock on the date of grant reduced for anticipated dividend payments on unvested shares. In determining fair value, the Company does not take into account performance-based vesting requirements. Performance-based vesting requirements are taken into account in determining the number of awards expected to vest. For market-based restricted stock units, fair value is calculated using a Monte Carlo simulation with the number of shares that ultimately vest dependent on the Company’s total stockholder return measured against the total stockholder return of a select group of peer companies over a three-year period. For an award with performance-based or market-based vesting requirements, the number of shares that ultimately vest can vary from 0% to 200% of target depending on the level of achievement of performance criteria. Unvested shares related to restricted stock units with performance-based vesting conditions are reflected at 100% of their target vesting amount in the table above.
Service-based restricted stock units are expensed on a straight-line basis over the total requisite service period, net of forfeitures. Performance-based restricted stock units subject to graded vesting are expensed on an accelerated attribution basis, net of forfeitures. Market-based restricted stock units without graded vesting features are expensed on a straight-line basis over the requisite service period, net of forfeitures.
As of January 28, 2017, there was $24.7 million and $2.2 million of total unrecognized compensation cost, net of estimated forfeitures, related to service-based and market-based restricted stock units, respectively. The unrecognized compensation cost is expected to be recognized over a weighted-average period of 16 months and 15 months for service-based and market-based restricted stock units, respectively.
Additional information pertaining to restricted stock units for Fiscal 2016, Fiscal 2015 and Fiscal 2014 follows:
(in thousands) | Fiscal 2016 | Fiscal 2015 | Fiscal 2014 | ||||||||
Service-based restricted stock units: | |||||||||||
Total grant date fair value of awards granted | $ | 29,047 | $ | 23,101 | $ | 33,075 | |||||
Total grant date fair value of awards vested | 20,314 | 23,608 | 17,078 | ||||||||
Performance-based restricted stock units: | |||||||||||
Total grant date fair value of awards granted | $ | 3,334 | $ | 2,278 | $ | 4,709 | |||||
Total grant date fair value of awards vested | 1,178 | 1,861 | 515 | ||||||||
Market-based restricted stock units: | |||||||||||
Total grant date fair value of awards granted | $ | 4,023 | $ | 2,158 | $ | 3,756 | |||||
Total grant date fair value of awards vested | — | — | — | ||||||||
65
The weighted-average assumptions used for market-based restricted stock units in the Monte Carlo simulation during Fiscal 2016 and Fiscal 2015 were as follows:
Fiscal 2016 | Fiscal 2015 | ||||||
Grant date market price | $ | 28.06 | $ | 22.46 | |||
Fair value | $ | 31.01 | $ | 19.04 | |||
Assumptions: | |||||||
Price volatility | 45 | % | 45 | % | |||
Expected term (years) | 2.7 | 2.8 | |||||
Risk-free interest rate | 1 | % | 0.9 | % | |||
Dividend yield | 3 | % | 3.5 | % | |||
Average volatility of peer companies | 34.5 | % | 34.0 | % | |||
Average correlation coefficient of peer companies | 0.3415 | 0.3288 | |||||
14. DERIVATIVE INSTRUMENTS
The Company is exposed to risks associated with changes in foreign currency exchange rates and uses derivative instruments, primarily forward contracts, to manage the financial impacts of these exposures. The Company does not use forward contracts to engage in currency speculation and does not enter into derivative financial instruments for trading purposes.
In order to qualify for hedge accounting treatment, a derivative instrument must be considered highly effective at offsetting changes in either the hedged item’s cash flows or fair value. Additionally, the hedge relationship must be documented to include the risk management objective and strategy, the hedging instrument, the hedged item, the risk exposure, and how hedge effectiveness will be assessed prospectively and retrospectively. The extent to which a hedging instrument has been, and is expected to continue to be, effective at offsetting changes in fair value or cash flows is assessed and documented at least quarterly. Any hedge ineffectiveness is reported in current period earnings and hedge accounting is discontinued if it is determined that the derivative instrument is not highly effective.
For derivative instruments that either do not qualify for hedge accounting or are not designated as hedges, all changes in the fair value of the derivative instrument are recognized in earnings. For qualifying cash flow hedges, the effective portion of the change in the fair value of the derivative instrument is recorded as a component of other comprehensive income (loss) (“OCI”) and recognized in earnings when the hedged cash flows affect earnings. The ineffective portion of the derivative instrument gain or loss is recognized in current period earnings. The effectiveness of the hedge is assessed based on changes in the fair value attributable to changes in spot prices. The changes in the fair value of the derivative instrument related to the changes in the difference between the spot price and the forward price are excluded from the assessment of hedge effectiveness and are also recognized in current period earnings. If the cash flow hedge relationship is terminated, the derivative instrument gains or losses that are deferred in OCI will be recognized in earnings when the hedged cash flows occur. However, for cash flow hedges that are terminated because the forecasted transaction is not expected to occur in the original specified time period, or a two-month period thereafter, the derivative instrument gains or losses are immediately recognized in earnings.
The Company uses derivative instruments, primarily forward contracts designated as cash flow hedges, to hedge the foreign currency exposure associated with forecasted foreign-currency-denominated intercompany inventory sales to foreign subsidiaries and the related settlement of the foreign-currency-denominated intercompany receivables. Fluctuations in exchange rates will either increase or decrease the Company’s intercompany equivalent cash flows and affect the Company’s U.S. Dollar earnings. Gains or losses on the foreign currency exchange forward contracts that are used to hedge these exposures are expected to partially offset this variability. Foreign currency exchange forward contracts represent agreements to exchange the currency of one country for the currency of another country at an agreed upon settlement date. These forward contracts typically have a maximum term of twelve months. The sale of the inventory to the Company’s customers will result in the reclassification of related derivative gains and losses that are reported in accumulated other comprehensive loss (“AOCL”). Substantially all of the unrealized gains or losses related to designated cash flow hedges as of January 28, 2017 will be recognized in cost of sales, exclusive of depreciation and amortization over the next twelve months.
66
The Company presents its derivative assets and derivative liabilities at their gross fair values on the Consolidated Balance Sheets. However, the Company's master netting and other similar arrangements allow net settlements under certain conditions.
As of January 28, 2017, the Company had outstanding the following foreign currency exchange forward contracts that were entered into to hedge either a portion, or all, of forecasted foreign-currency-denominated intercompany inventory sales, the resulting settlement of the foreign-currency-denominated intercompany accounts receivable, or both:
(in thousands) | Notional Amount(1) | ||
Euro | $ | 77,247 | |
British pound | $ | 25,751 | |
Canadian dollar | $ | 14,380 | |
Japanese yen | $ | 10,492 | |
(1) | Amounts reported are the U.S. Dollar notional amounts outstanding as of January 28, 2017. |
The Company also uses foreign currency exchange forward contracts to hedge certain foreign-currency-denominated net monetary assets/liabilities. Examples of monetary assets/liabilities include cash balances, receivables and payables. Fluctuations in exchange rates result in transaction gains/(losses) being recorded in earnings as U.S. GAAP requires that monetary assets/liabilities be remeasured at the spot exchange rate at quarter-end or upon settlement. The Company has chosen not to apply hedge accounting to these instruments because there are no differences in the timing of gain or loss recognition on the hedging instruments and the hedged items.
As of January 28, 2017, the Company had outstanding the following foreign currency exchange forward contracts that were entered into to hedge foreign currency denominated net monetary assets/liabilities:
(in thousands) | Notional Amount(1) | ||
Euro | $ | 18,813 | |
Japanese yen | $ | 1,767 | |
British pound | $ | 1,249 | |
Swedish krona | $ | 1,020 | |
(1) | Amounts reported are the U.S. Dollar notional amounts outstanding as of January 28, 2017. |
The location and amounts of derivative fair values on the Consolidated Balance Sheets as of January 28, 2017 and January 30, 2016 were as follows:
Asset Derivatives | Liability Derivatives | ||||||||||||||||||
(in thousands) | Location | January 28, 2017 | January 30, 2016 | Location | January 28, 2017 | January 30, 2016 | |||||||||||||
Derivatives designated as hedging instruments: | |||||||||||||||||||
Foreign currency exchange forward contracts | Other current assets | $ | 5,920 | $ | 4,097 | Accrued expenses | $ | 486 | $ | — | |||||||||
Derivatives not designated as hedging instruments: | |||||||||||||||||||
Foreign currency exchange forward contracts | Other current assets | $ | 122 | $ | 69 | Accrued expenses | $ | 6 | $ | — | |||||||||
Total | Other current assets | $ | 6,042 | $ | 4,166 | Accrued expenses | $ | 492 | $ | — | |||||||||
Refer to Note 3, “FAIR VALUE,” for further discussion of the determination of the fair value of derivative instruments.
67
The location and amounts of derivative gains and losses for Fiscal 2016 and Fiscal 2015 on the Consolidated Statements of Operations and Comprehensive Income (Loss) were as follows:
Fiscal 2016 | Fiscal 2015 | ||||||||
(in thousands) | Location | Gain/(Loss) | Gain/(Loss) | ||||||
Derivatives not designated as hedging instruments: | |||||||||
Foreign currency exchange forward contracts | Other operating income, net | $ | 627 | $ | 751 | ||||
Effective Portion | Ineffective Portion and Amount Excluded from Effectiveness Testing | ||||||||||||||||||||||||||
Amount of Gain (Loss) Recognized in OCI on Derivative Contracts (1) | Location of Gain (Loss) Reclassified from AOCL into Earnings | Amount of Gain (Loss) Reclassified from AOCL into Earnings (2) | Location of Gain Recognized in Earnings on Derivative Contracts | Amount of Gain Recognized in Earnings on Derivative Contracts (3) | |||||||||||||||||||||||
(in thousands) | January 28, 2017 | January 30, 2016 | January 28, 2017 | January 30, 2016 | January 28, 2017 | January 30, 2016 | |||||||||||||||||||||
Derivatives in cash flow hedging relationships: | |||||||||||||||||||||||||||
Foreign currency exchange forward contracts | $ | 7,078 | $ | 7,204 | Cost of sales, exclusive of depreciation and amortization | $ | 6,195 | $ | 15,596 | Other operating income, net | $ | 1,873 | $ | 242 | |||||||||||||
(1) | The amount represents the change in fair value of derivative contracts due to changes in spot rates. |
(2) | The amount represents the reclassification from AOCL into earnings when the hedged item affects earnings, which is when merchandise is sold to the Company’s customers. |
(3) | The amount represents the change in fair value of derivative contracts due to changes in the difference between the spot price and forward price that is excluded from the assessment of hedge effectiveness and, therefore, recognized in earnings. |
15. ACCUMULATED OTHER COMPREHENSIVE LOSS
The activity in accumulated other comprehensive loss for Fiscal 2016 was as follows:
Fiscal 2016 | |||||||||||
(in thousands) | Foreign Currency Translation Adjustment | Unrealized Gain (Loss) on Derivative Financial Instruments | Total | ||||||||
Beginning balance at January 30, 2016 | $ | (119,196 | ) | $ | 4,577 | $ | (114,619 | ) | |||
Other comprehensive (loss) income before reclassifications | (7,091 | ) | 7,078 | (13 | ) | ||||||
Reclassified from accumulated other comprehensive loss(1) | — | (6,195 | ) | (6,195 | ) | ||||||
Tax effect | 160 | (635 | ) | (475 | ) | ||||||
Other comprehensive loss | (6,931 | ) | 248 | (6,683 | ) | ||||||
Ending balance at January 28, 2017 | $ | (126,127 | ) | $ | 4,825 | $ | (121,302 | ) | |||
(1) | For Fiscal 2016, a gain was reclassified from accumulated other comprehensive income (loss) to the cost of sales, exclusive of depreciation and amortization on the Consolidated Statement of Operations and Comprehensive Income (Loss). |
68
The activity in accumulated other comprehensive loss for Fiscal 2015 was as follows:
Fiscal 2015 | |||||||||||
(in thousands) | Foreign Currency Translation Adjustment | Unrealized Gain (Loss) on Derivative Financial Instruments | Total | ||||||||
Beginning balance January 31, 2015 | $ | (96,680 | ) | $ | 13,100 | $ | (83,580 | ) | |||
Other comprehensive (loss) income before reclassifications | (22,623 | ) | 7,204 | (15,419 | ) | ||||||
Reclassified from accumulated other comprehensive loss(1) | — | (15,596 | ) | (15,596 | ) | ||||||
Tax effect | 107 | (131 | ) | (24 | ) | ||||||
Other comprehensive loss | (22,516 | ) | (8,523 | ) | (31,039 | ) | |||||
Ending balance at January 30, 2016 | $ | (119,196 | ) | $ | 4,577 | $ | (114,619 | ) | |||
(1) | For Fiscal 2015, a gain was reclassified from accumulated other comprehensive income (loss) to cost of sales, exclusive of depreciation and amortization on the Consolidated Statement of Operations and Comprehensive Income (Loss). Additionally, a foreign currency translation loss related to the Company's dissolution of its Australian operations was reclassified to other operating income, net. |
The activity in accumulated other comprehensive loss for Fiscal 2014 was as follows:
Fiscal 2014 | |||||||||||
(in thousands) | Foreign Currency Translation Adjustment | Unrealized Gain (Loss) on Derivative Financial Instruments | Total | ||||||||
Beginning balance February 1, 2014 | $ | (18,751 | ) | $ | (2,166 | ) | $ | (20,917 | ) | ||
Other comprehensive (loss) income before reclassifications | (76,891 | ) | 16,572 | (60,319 | ) | ||||||
Reclassified from accumulated other comprehensive loss(1) | — | (440 | ) | (440 | ) | ||||||
Tax effect | (1,038 | ) | (866 | ) | (1,904 | ) | |||||
Other comprehensive (loss) income | (77,929 | ) | 15,266 | (62,663 | ) | ||||||
Ending balance at January 31, 2015 | $ | (96,680 | ) | $ | 13,100 | $ | (83,580 | ) | |||
(1) | For Fiscal 2014, a gain was reclassified from accumulated other comprehensive income (loss) to cost of sales, exclusive of depreciation and amortization on the Consolidated Statement of Operations and Comprehensive Income (Loss). |
16. SAVINGS AND RETIREMENT PLANS
The Company maintains the Abercrombie & Fitch Co. Savings & Retirement Plan, a qualified plan. All U.S. associates are eligible to participate in this plan if they are at least 21 years of age. In addition, the Company maintains the Abercrombie & Fitch Co. Nonqualified Savings and Supplemental Retirement, composed of two sub-plans (Plan I and Plan II). Plan I contains contributions made through December 31, 2004, while Plan II contains contributions made on and after January 1, 2005. Participation in these plans is based on service and compensation. The Company’s contributions are based on a percentage of associates’ eligible annual compensation. The cost of the Company’s contributions to these plans was $11.1 million, $15.4 million and $13.8 million for Fiscal 2016, Fiscal 2015 and Fiscal 2014, respectively.
69
17. SEGMENT REPORTING
The Company has two operating segments: Abercrombie, which includes the Company’s Abercrombie & Fitch and abercrombie kids brands; and Hollister. These operating segments have similar economic characteristics, classes of consumers, products, and production and distribution methods, and have been aggregated into one reportable segment.
The following table provides the Company’s net sales by operating segment for Fiscal 2016, Fiscal 2015 and Fiscal 2014.
(in thousands) | Fiscal 2016 | Fiscal 2015 | Fiscal 2014 | ||||||||
Abercrombie | $ | 1,487,024 | $ | 1,640,992 | $ | 1,771,299 | |||||
Hollister | 1,839,716 | 1,877,688 | 1,947,869 | ||||||||
Other (1) | — | — | 24,862 | ||||||||
Total | $ | 3,326,740 | $ | 3,518,680 | $ | 3,744,030 | |||||
(1) | Represents net sales from the Company’s Gilly Hicks operations. |
The following table provides the Company’s net sales by geographic area for Fiscal 2016, Fiscal 2015 and Fiscal 2014.
(in thousands) | Fiscal 2016 | Fiscal 2015 | Fiscal 2014 | ||||||||
United States | $ | 2,123,808 | $ | 2,282,040 | $ | 2,408,427 | |||||
Europe | 768,630 | 832,923 | 959,981 | ||||||||
Other | 434,302 | 403,717 | 375,622 | ||||||||
Total | $ | 3,326,740 | $ | 3,518,680 | $ | 3,744,030 | |||||
The following table provides the Company’s long-lived assets by geographic area for Fiscal 2016, Fiscal 2015 and Fiscal 2014.
(in thousands) | Fiscal 2016 | Fiscal 2015 | Fiscal 2014 | ||||||||
United States | $ | 543,923 | $ | 548,983 | $ | 556,967 | |||||
Europe | 215,124 | 263,977 | 332,435 | ||||||||
Other | 92,783 | 109,275 | 105,542 | ||||||||
Total | $ | 851,830 | $ | 922,235 | $ | 994,944 | |||||
18. CONTINGENCIES
The Company is a defendant in lawsuits and other adversarial proceedings arising in the ordinary course of business. Legal costs incurred in connection with the resolution of claims and lawsuits are generally expensed as incurred, and the Company establishes reserves for the outcome of litigation where losses are deemed probable and reasonably estimable. The Company’s assessment of the current exposure could change in the event of the discovery of additional facts. As of January 28, 2017, the Company had accrued charges of approximately $6 million for certain legal contingencies. In addition, there are certain claims and legal proceedings pending against the Company for which accruals have not been established. Actual liabilities may exceed the amounts reserved, and there can be no assurance that final resolution of these matters will not have a material adverse effect on the Company’s financial condition, results of operations or cash flows.
For Fiscal 2016, the Company recognized a $12.3 million gain in other operating income, net in connection with a settlement of certain economic loss claims associated with the April 2010 Deepwater Horizon oil spill.
70
19. QUARTERLY FINANCIAL DATA (UNAUDITED)
Summarized unaudited quarterly financial results for Fiscal 2016 and Fiscal 2015 are presented below. See “RESULTS OF OPERATIONS,” in “ITEM 7. MANAGEMENT’S DISCUSSION AND ANALYSIS OF FINANCIAL CONDITION AND RESULTS OF OPERATIONS,” of this Annual Report on Form 10-K for information regarding items included below that could affect comparability between quarter results.
(in thousands, except per share amounts) | |||||||||||||||
Fiscal Quarter 2016 | First | Second | Third | Fourth | |||||||||||
Net sales | $ | 685,483 | $ | 783,160 | $ | 821,734 | $ | 1,036,363 | |||||||
Gross profit | $ | 425,721 | $ | 477,107 | $ | 510,739 | $ | 615,001 | |||||||
Net (loss) income | $ | (38,630 | ) | $ | (12,031 | ) | $ | 8,274 | $ | 50,105 | |||||
Net (loss) income attributable to A&F(2) | $ | (39,587 | ) | $ | (13,129 | ) | $ | 7,881 | $ | 48,791 | |||||
Net (loss) income per diluted share attributable to A&F(1) | $ | (0.59 | ) | $ | (0.19 | ) | $ | 0.12 | $ | 0.71 | |||||
(in thousands, except per share amounts) | |||||||||||||||
Fiscal Quarter 2015 | First | Second | Third | Fourth | |||||||||||
Net sales | $ | 709,422 | $ | 817,756 | $ | 878,572 | $ | 1,112,930 | |||||||
Gross profit | $ | 411,549 | $ | 509,862 | $ | 559,787 | $ | 676,345 | |||||||
Net (loss) income | $ | (63,246 | ) | $ | 612 | $ | 42,285 | $ | 58,908 | ||||||
Net (loss) income attributable to A&F(3)(4) | $ | (63,246 | ) | $ | (810 | ) | $ | 41,891 | $ | 57,741 | |||||
Net (loss) income per diluted share attributable to A&F(1) | $ | (0.91 | ) | $ | (0.01 | ) | $ | 0.60 | $ | 0.85 | |||||
(1) | Net income (loss) per diluted share for each of the quarters was computed using the weighted average number of shares outstanding during the quarter while the full year is computed using the average of the weighted average number of shares outstanding each quarter; therefore, the sum of the quarters may not equal the total for the year. |
(2) | Net income (loss) attributable to A&F for Fiscal 2016 included certain items related to asset impairment, indemnification recoveries and claims settlement benefits. These items adversely impacted net income (loss) attributable to A&F by $3.7 million and $6.5 million for the second and third quarters of Fiscal 2016, respectively. |
(3) | Net income (loss) attributable to A&F for Fiscal 2015 included certain items related to inventory write-down, asset impairment, legal settlement charges, store fixture disposal, the Company’s profit improvement initiative, lease termination and store closure costs and restructuring. These items adversely impacted net income (loss) attributable to A&F by $26.1 million, $9.4 million and $16.0 million for the first, second and fourth quarters of Fiscal 2015, respectively, and increased net income attributable to A&F by $9.0 million for the third quarter of Fiscal 2015. |
(4) | Net income (loss) attributable to A&F for Fiscal 2015 included the correction of certain errors relating to prior periods. The impact of the amounts recorded out-of-period resulted in a decrease in net income attributable to A&F of $2.6 million and $1.9 million for the second and fourth quarters of Fiscal 2015, respectively, and an increase in net income attributable to A&F of $1.2 million for the third quarter of Fiscal 2015. The Company does not believe these corrections were material to any current or prior interim or annual periods that were affected. |
71
Report of Independent Registered Public Accounting Firm
To the Board of Directors and Stockholders of
Abercrombie & Fitch Co.
In our opinion, the accompanying consolidated financial statements listed in the index appearing under Item 15(a)(1) present fairly, in all material respects, the financial position of Abercrombie & Fitch Co. and its subsidiaries (the Company) at January 28, 2017 and January 30, 2016, and the results of their operations and their cash flows for each of the three years in the period ended January 28, 2017 in conformity with accounting principles generally accepted in the United States of America. Also in our opinion, the Company maintained, in all material respects, effective internal control over financial reporting as of January 28, 2017, based on criteria established in Internal Control - Integrated Framework (2013) issued by the Committee of Sponsoring Organizations of the Treadway Commission (COSO). The Company's management is responsible for these financial statements, for maintaining effective internal control over financial reporting and for its assessment of the effectiveness of internal control over financial reporting, included in Management's Annual Report on Internal Control over Financial Reporting appearing under Item 9A. Our responsibility is to express opinions on these financial statements and on the Company's internal control over financial reporting based on our integrated audits. We conducted our audits in accordance with the standards of the Public Company Accounting Oversight Board (United States). Those standards require that we plan and perform the audits to obtain reasonable assurance about whether the financial statements are free of material misstatement and whether effective internal control over financial reporting was maintained in all material respects. Our audits of the financial statements included examining, on a test basis, evidence supporting the amounts and disclosures in the financial statements, assessing the accounting principles used and significant estimates made by management, and evaluating the overall financial statement presentation. Our audit of internal control over financial reporting included obtaining an understanding of internal control over financial reporting, assessing the risk that a material weakness exists, and testing and evaluating the design and operating effectiveness of internal control based on the assessed risk. Our audits also included performing such other procedures as we considered necessary in the circumstances. We believe that our audits provide a reasonable basis for our opinions.
A company’s internal control over financial reporting is a process designed to provide reasonable assurance regarding the reliability of financial reporting and the preparation of financial statements for external purposes in accordance with generally accepted accounting principles. A company’s internal control over financial reporting includes those policies and procedures that (i) pertain to the maintenance of records that, in reasonable detail, accurately and fairly reflect the transactions and dispositions of the assets of the company; (ii) provide reasonable assurance that transactions are recorded as necessary to permit preparation of financial statements in accordance with generally accepted accounting principles, and that receipts and expenditures of the company are being made only in accordance with authorizations of management and directors of the company; and (iii) provide reasonable assurance regarding prevention or timely detection of unauthorized acquisition, use, or disposition of the company’s assets that could have a material effect on the financial statements.
Because of its inherent limitations, internal control over financial reporting may not prevent or detect misstatements. Also, projections of any evaluation of effectiveness to future periods are subject to the risk that controls may become inadequate because of changes in conditions, or that the degree of compliance with the policies or procedures may deteriorate.
/s/ PricewaterhouseCoopers LLP
Columbus, Ohio
March 27, 2017
72
ITEM 9. | CHANGES IN AND DISAGREEMENTS WITH ACCOUNTANTS ON ACCOUNTING AND FINANCIAL DISCLOSURE |
None.
ITEM 9A. | CONTROLS AND PROCEDURES |
Disclosure Controls and Procedures
A&F maintains disclosure controls and procedures (as defined in Rules 13a-15(e) and 15d-15(e) under the Securities Exchange Act of 1934, as amended (the “Exchange Act”)) that are designed to provide reasonable assurance that information required to be disclosed in the reports that A&F files or submits under the Exchange Act is recorded, processed, summarized and reported within the time periods specified in the SEC’s rules and forms, and that such information is accumulated and communicated to A&F’s management, including the principal executive officer and the principal financial officer, as appropriate to allow timely decisions regarding required disclosures. Because of inherent limitations, disclosure controls and procedures, no matter how well designed and operated, can provide only reasonable, and not absolute, assurance that the objectives of disclosure controls and procedures are met.
A&F’s management, including the Chief Executive Officer of A&F and the Executive Vice President, Chief Operating Officer and Chief Financial Officer of A&F evaluated the effectiveness of A&F’s design and operation of its disclosure controls and procedures as of the end of the fiscal year ended January 28, 2017. The Chief Executive Officer of A&F and the Executive Vice President, Chief Operating Officer and Chief Financial Officer of A&F concluded that A&F’s disclosure controls and procedures were effective at a reasonable level of assurance as of January 28, 2017, the end of the period covered by this Annual Report on Form 10-K.
Management’s Annual Report on Internal Control Over Financial Reporting
The management of A&F is responsible for establishing and maintaining adequate internal control over financial reporting. A&F’s internal control over financial reporting (as defined in Rules 13a-15(f) and 15d-15(f) under the Exchange Act) is a process designed to provide reasonable assurance regarding the reliability of financial reporting and the preparation of financial statements for external purposes in accordance with accounting principles generally accepted in the United States of America.
Because of its inherent limitations, internal control over financial reporting may not prevent or detect misstatements. Also, projections of any evaluations of effectiveness to future periods are subject to the risk that controls may become inadequate because of changes in conditions, or that the degree of compliance with the policies or procedures may deteriorate. Accordingly, even an effective system of internal control over financial reporting will provide only reasonable assurance with respect to financial statement preparation.
With the participation of the Chief Executive Officer and Executive Vice President, Chief Operating Officer and Chief Financial Officer of A&F, management evaluated the effectiveness of A&F’s internal control over financial reporting as of January 28, 2017 using criteria established in the Internal Control-Integrated Framework (2013) issued by the Committee of Sponsoring Organizations of the Treadway Commission (“COSO”). Based on the assessment of A&F’s internal control over financial reporting, under the criteria described in the preceding sentence, management has concluded that, as of January 28, 2017, A&F’s internal control over financial reporting was effective.
A&F’s independent registered public accounting firm, PricewaterhouseCoopers LLP, has issued an audit report on the effectiveness of A&F’s internal control over financial reporting as of January 28, 2017 as stated in their report, which is included in “ITEM 8. FINANCIAL STATEMENTS AND SUPPLEMENTARY DATA” of this Annual Report on Form 10-K.
Changes in Internal Control Over Financial Reporting
There were no changes in A&F’s internal control over financial reporting during the fourth quarter ended January 28, 2017 that materially affected, or are reasonably likely to materially affect, A&F’s internal control over financial reporting.
ITEM 9B. | OTHER INFORMATION |
None.
73
PART III
ITEM 10. | DIRECTORS, EXECUTIVE OFFICERS AND CORPORATE GOVERNANCE |
Directors, Executive Officers and Persons Nominated or Chosen to Become Directors or Executive Officers
Information concerning directors and executive officers of A&F as well as persons nominated or chosen to become directors or executive officers is incorporated by reference from the text to be included under the caption “PROPOSAL 1 — ELECTION OF DIRECTORS” in A&F’s definitive Proxy Statement for the Annual Meeting of Stockholders to be held on June 15, 2017 and from the text under the caption “EXECUTIVE OFFICERS OF THE REGISTRANT” at the end of “ITEM 1. BUSINESS” in PART I of this Annual Report on Form 10-K.
Compliance with Section 16(a) of the Exchange Act
Information concerning beneficial ownership reporting compliance under Section 16(a) of the Securities Exchange Act of 1934, as amended, is incorporated by reference from the text to be included under the caption “SECURITY OWNERSHIP OF CERTAIN BENEFICIAL OWNERS AND MANAGEMENT — Section 16(a) Beneficial Ownership Reporting Compliance,” in A&F’s definitive Proxy Statement for the Annual Meeting of Stockholders to be held on June 15, 2017.
Code of Business Conduct and Ethics
The Board of Directors has adopted the Abercrombie & Fitch Co. Code of Business Conduct and Ethics, which is available on the “Corporate Governance” page of the Company’s website at www.abercrombie.com, accessible through the “Investors” page.
Audit and Finance Committee
Information concerning A&F’s Audit and Finance Committee, including the determination that the Audit and Finance Committee has at least one “audit committee financial expert” (as defined under applicable SEC rules) serving on the Audit and Finance Committee, is incorporated by reference from the text to be included under the caption “PROPOSAL 1 — ELECTION OF DIRECTORS — Committees of the Board — Audit and Finance Committee,” in A&F’s definitive Proxy Statement for the Annual Meeting of Stockholders to be held on June 15, 2017.
Procedures by which Stockholders May Recommend Nominees to A&F’s Board of Directors
Information concerning the procedures by which stockholders of A&F may recommend nominees to A&F’s Board of Directors is incorporated by reference from the text to be included under the captions “PROPOSAL 1 — ELECTION OF DIRECTORS — Director Qualifications and Consideration of Director Candidates” and “PROPOSAL 1 — ELECTION OF DIRECTORS — Director Nominations,” in A&F’s definitive Proxy Statement for the Annual Meeting of Stockholders to be held on June 15, 2017. These procedures have not materially changed from those described in A&F’s definitive Proxy Statement for the Annual Meeting of Stockholders held on June 16, 2016.
ITEM 11. EXECUTIVE COMPENSATION
Information regarding executive compensation is incorporated by reference from the text to be included under the captions “PROPOSAL 1 — ELECTION OF DIRECTORS — Compensation of Directors,” “PROPOSAL 1 — ELECTION OF DIRECTORS — Board Role in Risk Oversight,” “PROPOSAL 1 — ELECTION OF DIRECTORS — Compensation and Organization Committee Interlocks and Insider Participation,” “COMPENSATION DISCUSSION AND ANALYSIS,” “REPORT OF THE COMPENSATION AND ORGANIZATION COMMITTEE ON EXECUTIVE COMPENSATION” and “EXECUTIVE OFFICER COMPENSATION,” in A&F’s definitive Proxy Statement for the Annual Meeting of Stockholders to be held on June 15, 2017.
74
ITEM 12. | SECURITY OWNERSHIP OF CERTAIN BENEFICIAL OWNERS AND MANAGEMENT AND RELATED STOCKHOLDER MATTERS |
Information concerning the security ownership of certain beneficial owners and management is incorporated by reference from the text to be included under the caption “SECURITY OWNERSHIP OF CERTAIN BENEFICIAL OWNERS AND MANAGEMENT” in A&F’s definitive Proxy Statement for the Annual Meeting of Stockholders to be held on June 15, 2017.
Information regarding the number of securities to be issued and remaining available under equity compensation plans of the Company as of January 28, 2017 is incorporated by reference from the text to be included under the caption “EQUITY COMPENSATION PLANS” in A&F’s definitive Proxy Statement for the Annual Meeting of Stockholders to be held on June 15, 2017.
ITEM 13. | CERTAIN RELATIONSHIPS AND RELATED TRANSACTIONS, AND DIRECTOR INDEPENDENCE |
Information concerning certain relationships and transactions involving the Company and certain related persons within the meaning of Item 404(a) of SEC Regulation S-K as well as information concerning A&F’s policies and procedures for the review, approval or ratification of transactions with related persons is incorporated by reference from the text to be included under the caption “PROPOSAL 1 — ELECTION OF DIRECTORS — Certain Relationships and Related Person Transactions” in A&F’s definitive Proxy Statement for the Annual Meeting of Stockholders to be held on June 15, 2017.
Information concerning the independence of the directors of A&F is incorporated by reference from the text to be included under the captions “PROPOSAL 1 — ELECTION OF DIRECTORS — Director Independence”, “PROPOSAL 1 — ELECTION OF DIRECTORS — Board Leadership Structure”and “PROPOSAL 1 — ELECTION OF DIRECTORS — Committees of the Board” in A&F’s definitive Proxy Statement for the Annual Meeting of Stockholders to be held on June 15, 2017.
ITEM 14. PRINCIPAL ACCOUNTANT FEES AND SERVICES
Information concerning the pre-approval policies and procedures of A&F’s Audit and Finance Committee and the fees for services rendered by the Company’s principal independent registered public accounting firm is incorporated by reference from the text to be included under captions “AUDIT AND FINANCE COMMITTEE MATTERS — Pre-Approval Policy” and “AUDIT AND FINANCE COMMITTEE MATTERS — Fees of Independent Registered Public Accounting Firm” in A&F’s definitive Proxy Statement for the Annual Meeting of Stockholders to be held on June 15, 2017.
75
PART IV
ITEM 15. | EXHIBITS AND FINANCIAL STATEMENT SCHEDULES |
(a) The following documents are filed as a part of this Annual Report on Form 10-K:
(1) Consolidated Financial Statements:
Consolidated Statements of Operations and Comprehensive Income (Loss) for the fiscal years ended January 28, 2017, January 30, 2016 and January 31, 2015.
Consolidated Balance Sheets at January 28, 2017 and January 30, 2016.
Consolidated Statements of Stockholders’ Equity for the fiscal years ended January 28, 2017, January 30, 2016 and January 31, 2015.
Consolidated Statements of Cash Flows for the fiscal years ended January 28, 2017, January 30, 2016 and January 31, 2015.
Notes to Consolidated Financial Statements.
Report of Independent Registered Public Accounting Firm — PricewaterhouseCoopers LLP.
(2) Consolidated Financial Statement Schedules:
All financial statement schedules for which provision is made in the applicable accounting regulations of the SEC are omitted because the required information is either presented in the consolidated financial statements or notes thereto, or is not applicable, required or material.
(3) Exhibits:
The documents listed below are filed or furnished with this Annual Report on Form 10-K as exhibits or incorporated into this Annual Report on Form 10-K by reference as noted:
76
Exhibit No. | Document |
3.1 | Amended and Restated Certificate of Incorporation of A&F as filed with the Delaware Secretary of State on August 27, 1996, incorporated herein by reference to Exhibit 3.1 to A&F’s Quarterly Report on Form 10-Q for the quarterly period ended November 2, 1996 (File No. 001-12107). |
3.2 | Certificate of Designation of Series A Participating Cumulative Preferred Stock of A&F as filed with the Delaware Secretary of State on July 21, 1998, incorporated herein by reference to Exhibit 3.2 to A&F’s Annual Report on Form 10-K for the fiscal year ended January 30, 1999 (File No. 001-12107). |
3.3 | Certificate of Decrease of Shares Designated as Class B Common Stock as filed with the Delaware Secretary of State on July 30, 1999, incorporated herein by reference to Exhibit 3.3 to A&F’s Quarterly Report on Form 10-Q for the quarterly period ended July 31, 1999 (File No. 001-12107). |
3.4 | Certificate of Amendment of the Amended and Restated Certificate of Incorporation of Abercrombie & Fitch Co. as filed with the Delaware Secretary of State on June 16, 2011, incorporated herein by reference to Exhibit 3.1 to A&F’s Current Report on Form 8-K dated and filed June 17, 2011 (File No. 001-12107). |
3.5 | Amended and Restated Certificate of Incorporation of A&F, reflecting amendments through the date of this Annual Report on Form 10-K, incorporated herein by reference to Exhibit 3.2 to A&F’s Quarterly Report on Form 10-Q for the quarterly period ended July 30, 2011 (File No. 001-12107). [This document represents the Amended and Restated Certificate of Incorporation of Abercrombie & Fitch Co. in compiled form incorporating all amendments. This compiled document has not been filed with the Delaware Secretary of State.] |
3.6 | Certificate regarding Approval of Amendment to Section 2.03 of Amended and Restated Bylaws of Abercrombie & Fitch Co. by Stockholders of Abercrombie & Fitch Co. at Annual Meeting of Stockholders held on June 10, 2009, incorporated herein by reference to Exhibit 3.1 to A&F’s Current Report on Form 8-K dated and filed June 16, 2009 (File No. 001-12107). |
3.7 | Certificate regarding Approval of Addition of New Article IX of Amended and Restated Bylaws by Board of Directors of Abercrombie & Fitch Co. on June 10, 2009, incorporated herein by reference to Exhibit 3.2 to A&F’s Current Report on Form 8-K dated and filed June 16, 2009 (File No. 001-12107). |
3.8 | Certificate regarding Approval of Amendments to Sections 1.09 and 2.04 of Amended and Restated Bylaws of Abercrombie & Fitch Co. by Board of Directors of Abercrombie & Fitch Co. on November 15, 2011, incorporated herein by reference to Exhibit 3.1 to A&F’s Current Report on Form 8-K dated and filed November 21, 2011 (File No. 001-12107). |
3.9 | Amended and Restated Bylaws of Abercrombie & Fitch Co. reflecting amendments through the date of this Annual Report in Form 10-K, incorporated herein by reference to Exhibit 3.2 to A&F’s Quarterly Report on Form 10-Q for the quarterly period ended October 29, 2011 (File No. 001-12107). [This document represents the Amended and Restated Bylaws of Abercrombie & Fitch Co. in compiled form incorporating all amendments.] |
4.1 | Agreement to furnish instruments and agreements defining rights of holders of long-term debt. |
10.1* | Abercrombie & Fitch Co. Incentive Compensation Performance Plan, incorporated herein by reference to Exhibit 10.1 to A&F’s Current Report on Form 8-K dated and filed June 18, 2012 (File No. 001-12107). |
10.2* | 1998 Restatement of the Abercrombie & Fitch Co. 1996 Stock Plan for Non-Associate Directors (reflects amendments through January 30, 2003 and the two-for-one stock split distributed June 15, 1999 to stockholders of record on May 25, 1999), incorporated herein by reference to Exhibit 10.3 to A&F’s Annual Report on Form 10-K for the fiscal year ended February 1, 2003 (File No. 001-12107). |
10.3* | Abercrombie & Fitch Co. 2002 Stock Plan for Associates (as amended and restated May 22, 2003), incorporated herein by reference to Exhibit 10.4 to A&F’s Quarterly Report on Form 10-Q for the quarterly period ended May 3, 2003 (File No. 001-12107). |
10.4* | Amended and Restated Employment Agreement, entered into effective as of August 15, 2005, by and between A&F and Michael S. Jeffries, including as Exhibit A thereto the Abercrombie & Fitch Co. Supplemental Executive Retirement Plan (Michael S. Jeffries) effective February 2, 2003, incorporated herein by reference to Exhibit 10.1 to A&F’s Current Report on Form 8-K dated and filed August 26, 2005 (File No. 001-12107). [NOTE: Only the Abercrombie & Fitch Co. Supplemental Executive Retirement Plan (Michael S. Jeffries) is still in effect.] |
10.5* | Abercrombie & Fitch Co. Directors’ Deferred Compensation Plan (as amended and restated May 22, 2003) — as authorized by the Board of Directors of A&F on December 17, 2007, to become one of two plans following the division of said Abercrombie & Fitch Co. Directors’ Deferred Compensation Plan (as amended and restated May 22, 2003) into two separate plans effective January 1, 2005 and to be named the Abercrombie & Fitch Co. Directors’ Deferred Compensation Plan (Plan I) [terms to govern “amounts deferred” (within the meaning of Section 409A of the Internal Revenue Code of 1986, as amended) in taxable years beginning before January 1, 2005 and any earnings thereon], incorporated herein by reference to Exhibit 10.7 to A&F’s Quarterly Report on Form 10-Q for the quarterly period ended May 3, 2003 (File No. 001-12107). |
77
10.6* | Abercrombie & Fitch Nonqualified Savings and Supplemental Retirement Plan (January 1, 2001 Restatement) — as authorized by the Compensation Committee of the A&F Board of Directors on August 14, 2008, to become one of two sub-plans following the division of said Abercrombie & Fitch Nonqualified Savings and Supplemental Retirement Plan (January 1, 2001 Restatement) into two sub-plans effective immediately before January 1, 2009 and to be named the Abercrombie & Fitch Co. Nonqualified Savings and Supplemental Retirement Plan I [terms to govern amounts “deferred” (within the meaning of Section 409A of the Internal Revenue Code of 1986, as amended) before January 1, 2005, and any earnings thereon], incorporated herein by reference to Exhibit 10.9 to A&F’s Annual Report on Form 10-K for the fiscal year ended February 1, 2003 (File No. 001-12107). |
10.7* | First Amendment to the Abercrombie & Fitch Co. Nonqualified Savings and Supplemental Retirement Plan I (Plan I) (January 1, 2001 Restatement), as authorized by the Compensation Committee of the A&F Board of Directors on August 14, 2008 and executed on behalf of A&F on September 3, 2008, incorporated herein by reference to Exhibit 10.13 to A&F’s Quarterly Report on Form 10-Q for the quarterly period ended August 2, 2008 (File No. 001-12107). |
10.8* | Abercrombie & Fitch Co. Nonqualified Savings and Supplemental Retirement Plan (II) — as authorized by the Compensation Committee of the A&F Board of Directors on August 14, 2008, to become one of two sub-plans following the division of the Abercrombie & Fitch Nonqualified Savings and Supplemental Retirement Plan (January 1, 2001 Restatement) into two sub-plans effective immediately before January 1, 2009 and to be named the Abercrombie & Fitch Co. Nonqualified Savings and Supplemental Retirement Plan II [terms to govern amounts “deferred” (within the meaning of Section 409A of the Internal Revenue Code of 1986, as amended) in taxable years beginning on or after January 1, 2005, and any earnings thereon], incorporated herein by reference to Exhibit 10.12 to A&F’s Quarterly Report on Form 10-Q for the quarterly period ended August 2, 2008 (File No. 001-12107). |
10.9* | Abercrombie & Fitch Co. 2003 Stock Plan for Non-Associate Directors, incorporated herein by reference to Exhibit 10.9 to A&F’s Quarterly Report on Form 10-Q for the quarterly period ended May 3, 2003 (File No. 001-12107). |
10.10* | Form of Stock Option Agreement used for grants under the Abercrombie & Fitch Co. 2003 Stock Plan for Non-Associate Directors after November 28, 2004 and before June 13, 2007, incorporated herein by reference to Exhibit 10.22 to A&F’s Quarterly Report on Form 10-Q for the quarterly period ended October 30, 2004 (File No. 001-12107). |
10.11* | Form of Stock Option Agreement (Nonstatutory Stock Options) used for grants under the Abercrombie & Fitch Co. 2002 Stock Plan for Associates on or after March 6, 2006 and before June 13, 2007, incorporated herein by reference to Exhibit 10.36 to A&F’s Annual Report on Form 10-K for the fiscal year ended January 28, 2006 (File No. 001-12107). |
10.12* | Abercrombie & Fitch Co. 2005 Long-Term Incentive Plan, incorporated herein by reference to Exhibit 10.1 to A&F’s Current Report on Form 8-K dated and filed June 17, 2005 (File No. 001-12107). |
10.13* | Summary of Terms of the Annual Restricted Stock Unit Grants made to the Non-Associate Directors of A&F under the 2016 Long-Term Incentive Plan for Directors in Fiscal 2016. |
10.14* | Summary of Compensation Structure for Non-Associate Directors of A&F for Fiscal 2016. |
10.15* | Form of Restricted Stock Unit Award Agreement for Associates used for grants under the Abercrombie & Fitch Co. 2005 Long-Term Incentive Plan on or after March 6, 2006, incorporated herein by reference to Exhibit 10.34 to A&F’s Annual Report on Form 10-K for the fiscal year ended January 28, 2006 (File No. 001-12107). |
10.16* | Trust Agreement, made as of October 16, 2006, between A&F and Wilmington Trust Company, incorporated herein by reference to Exhibit 10.1 to A&F’s Current Report on Form 8-K dated and filed October 17, 2006 (File No. 001-12107). |
10.17* | Amended and Restated Abercrombie & Fitch Co. 2007 Long-Term Incentive Plan, incorporated herein by reference to Exhibit 10.1 to A&F’s Current Report on Form 8-K dated and filed June 17, 2011 (File No. 001-12107). |
10.18* | Form of Stock Option Agreement used to evidence the grant of nonstatutory stock options to associates (employees) of A&F and its subsidiaries under the Amended and Restated Abercrombie & Fitch Co. 2007 Long-Term Incentive Plan (formerly known as the Abercrombie & Fitch Co. 2007 Long-Term Incentive Plan) after August 21, 2007, incorporated herein by reference to Exhibit 10.1 to A&F’s Current Report on Form 8-K dated and filed August 27, 2007 (File No. 001-12107). |
10.19* | Form of Restricted Stock Unit Award Agreement used to evidence the grant of restricted stock units to associates (employees) of A&F and its subsidiaries under the Amended and Restated Abercrombie & Fitch Co. 2007 Long-Term Incentive Plan (formerly known as the Abercrombie & Fitch Co. 2007 Long-Term Incentive Plan) after August 21, 2007 and prior to March 26, 2013, incorporated herein by reference to Exhibit 10.2 to A&F’s Current Report on Form 8-K dated and filed August 27, 2007 (File No. 001-12107). |
10.20* | Form of Restricted Stock Unit Award Agreement used to evidence the grant of restricted stock units to Executive Vice Presidents of A&F and its subsidiaries under the Abercrombie & Fitch Co. 2005 Long-Term Incentive Plan on and after March 4, 2008 and prior to March 26, 2013, incorporated herein by reference to Exhibit 10.1 to A&F’s Current Report on Form 8-K dated and filed March 6, 2008 (File No. 001-12107). |
10.21* | Abercrombie & Fitch Co. Associate Stock Purchase Plan (Effective July 1, 1998), incorporated herein by reference to Exhibit 1 to the Schedule 13D filed by Michael S. Jeffries on May 2, 2006. |
78
10.22* | Form of Stock Appreciation Right Agreement used to evidence the grant of stock appreciation rights to associates (employees) of A&F and its subsidiaries under the Amended and Restated Abercrombie & Fitch Co. 2007 Long-Term Incentive Plan (formerly known as the Abercrombie & Fitch Co. 2007 Long-Term Incentive Plan) on and after February 12, 2009 and prior to March 26, 2013, incorporated herein by reference to Exhibit 10.1 to A&F’s Current Report on Form 8-K dated and filed February 17, 2009 (File No. 001-12107). |
10.23* | Form of Stock Appreciation Right Agreement used to evidence the Semi-Annual Grants of stock appreciation rights to Michael S. Jeffries under the Abercrombie & Fitch Co. 2007 Long-Term Incentive Plan (now known as the Amended and Restated Abercrombie & Fitch Co. 2007 Long-Term Incentive Plan) as contemplated by the Employment Agreement, entered into as of December 19, 2008, by and between A&F and Michael S. Jeffries, incorporated herein by reference to Exhibit 10.2 to A&F’s Current Report on Form 8-K dated and filed February 17, 2009 (File No. 001-12107). |
10.24* | Form of Stock Appreciation Right Agreement used to evidence the grant of stock appreciation rights to associates (employees) of Abercrombie & Fitch Co. and its subsidiaries under the Abercrombie & Fitch Co. 2005 Long-Term Incentive Plan after February 12, 2009 and prior to March 26, 2013, incorporated herein by reference to Exhibit 10.6 to A&F’s Current Report on Form 8-K dated and filed February 17, 2009 (File No. 001-12107). |
10.25* | Abercrombie & Fitch Co. Directors’ Deferred Compensation Plan (Plan II) — as authorized by the Board of Directors of A&F on December 17, 2007, to become one of two plans following the division of the Abercrombie & Fitch Co. Directors’ Deferred Compensation Plan (as amended and restated May 22, 2003) into two separate plans effective January 1, 2005 and to be named Abercrombie & Fitch Co. Directors’ Deferred Compensation Plan (Plan II) [terms to govern “amounts deferred” (within the meaning of Section 409A of the Internal Revenue Code of 1986, as amended) in taxable years beginning on or after January 1, 2005 and any earnings thereon], incorporated herein by reference to Exhibit 10.50 to A&F’s Annual Report on Form 10-K for the fiscal year ended January 31, 2009 (File No. 001-12107). |
10.26* | Form of Stock Appreciation Right Agreement used to evidence the grant of stock appreciation rights to associates (employees) of A&F and its subsidiaries under the Amended and Restated Abercrombie & Fitch Co. 2007 Long-Term Incentive Plan on or after March 26, 2013 and prior to August 20, 2013, incorporated herein by reference to Exhibit 10.1 to A&F’s Current Report on Form 8-K dated and filed April 29, 2013 (File No. 001-12107). |
10.27* | Form of Stock Appreciation Right Agreement used to evidence the grant of stock appreciation rights to associates (employees) of A&F and its subsidiaries under the Abercrombie & Fitch Co. 2005 Long-Term Incentive Plan on or after March 26, 2013 and prior to August 20, 2013, incorporated herein by reference to Exhibit 10.2 to A&F’s Current Report on Form 8-K dated and filed April 29, 2013 (File No. 001-12107). |
10.28* | Form of Restricted Stock Unit Award Agreement used to evidence the grant of restricted stock units to associates (employees) of A&F and its subsidiaries under the Amended and Restated Abercrombie & Fitch Co. 2007 Long-Term Incentive Plan on or after March 26, 2013 and prior to August 20, 2013, incorporated herein by reference to Exhibit 10.3 to A&F’s Current Report on Form 8-K dated and filed April 29, 2013 (File No. 001-12107). |
10.29* | Form of Restricted Stock Unit Award Agreement used to evidence the grant of restricted stock units to associates (employees) of A&F and its subsidiaries under the Abercrombie & Fitch Co. 2005 Long-Term Incentive Plan on or after March 26, 2013 and prior to August 20, 2013, incorporated herein by reference to Exhibit 10.4 to A&F’s Current Report on Form 8-K dated and filed April 29, 2013 (File No. 001-12107). |
10.30* | Form of Performance Share Award Agreement used to evidence the grant of performance shares to associates (employees) of A&F and its subsidiaries under the Amended and Restated Abercrombie & Fitch Co. 2007 Long-Term Incentive Plan on or after March 26, 2013 and prior to August 20, 2013, incorporated herein by reference to Exhibit 10.5 to A&F’s Current Report on Form 8-K dated and filed April 29, 2013 (File No. 001-12107). |
10.31* | Form of Performance Share Award Agreement used to evidence the grant of performance shares to associates (employees) of A&F and its subsidiaries under the Abercrombie & Fitch Co. 2005 Long-Term Incentive Plan on or after March 26, 2013 and prior to August 20, 2013, incorporated herein by reference to Exhibit 10.6 to A&F’s Current Report on Form 8-K dated and filed April 29, 2013 (File No. 001-12107). |
10.32* | Form of Stock Appreciation Right Agreement used to evidence the grant of stock appreciation rights to associates (employees) of A&F and its subsidiaries, subject to special non-competition and non-solicitation agreements, under the Amended and Restated Abercrombie & Fitch Co. 2007 Long-Term Incentive Plan on or after March 26, 2013 and prior to August 20, 2013, incorporated herein by reference to Exhibit 10.7 to A&F’s Current Report on Form 8-K dated and filed April 29, 2013 (File No. 001-12107). |
10.33* | Form of Stock Appreciation Right Agreement used to evidence the grant of stock appreciation rights to associates (employees) of A&F and its subsidiaries, subject to special non-competition and non-solicitation agreements, under the Abercrombie & Fitch Co. 2005 Long-Term Incentive Plan on or after March 26, 2013 and prior to August 20, 2013, incorporated herein by reference to Exhibit 10.8 to A&F’s Current Report on Form 8-K dated and filed April 29, 2013 (File No. 001-12107). |
10.34* | Form of Restricted Stock Unit Award Agreement used to evidence the grant of restricted stock units to associates (employees) of A&F and its subsidiaries, subject to special non-competition and non-solicitation agreements, under the Amended and Restated Abercrombie & Fitch Co. 2007 Long-Term Incentive Plan on or after March 26, 2013 and prior to August 20, 2013, incorporated herein by reference to Exhibit 10.9 to A&F’s Current Report on Form 8-K dated and filed April 29, 2013 (File No. 001-12107). |
79
10.35* | Form of Restricted Stock Unit Award Agreement used to evidence the grant of restricted stock units to associates (employees) of A&F and its subsidiaries, subject to special non-competition and non-solicitation agreements, under the Abercrombie & Fitch Co. 2005 Long-Term Incentive Plan on or after March 26, 2013 and prior to August 20, 2013, incorporated herein by reference to Exhibit 10.10 to A&F’s Current Report on Form 8-K dated and filed April 29, 2013 (File No. 001-12107). |
10.36* | Form of Performance Share Award Agreement used to evidence the grant of performance shares to associates (employees) of A&F and its subsidiaries, subject to special non-competition and non-solicitation agreements, under the Amended and Restated Abercrombie & Fitch Co. 2007 Long-Term Incentive Plan on or after March 26, 2013 and prior to August 20, 2013, incorporated herein by reference to Exhibit 10.11 to A&F’s Current Report on Form 8-K dated and filed April 29, 2013 (File No. 001-12107). |
10.37* | Form of Performance Share Award Agreement used to evidence the grant of performance shares to associates (employees) of A&F and its subsidiaries, subject to special non-competition and non-solicitation agreements, under the Abercrombie & Fitch Co. 2005 Long-Term Incentive Plan on or after March 26, 2013 and prior to August 20, 2013, incorporated herein by reference to Exhibit 10.12 to A&F’s Current Report on Form 8-K dated and filed April 29, 2013 (File No. 001-12107). |
10.38* | Form of Stock Appreciation Right Award Agreement used for grants of awards after August 20, 2013 under the Amended and Restated Abercrombie & Fitch Co. 2007 Long-Term Incentive Plan [For associates (employees); grant of award forms all or part of the consideration for the execution by associate of Non-Competition and Non-Solicitation Agreement], incorporated herein by reference to Exhibit 10.1 to A&F’s Quarterly Report on Form 10-Q for the quarterly period ended November 2, 2013 (File No. 001-12107). |
10.39* | Form of Stock Appreciation Right Award Agreement used for grants of awards after August 20, 2013 under the Amended and Restated Abercrombie & Fitch Co. 2007 Long-Term Incentive Plan [For associates (employees); grant of award not associated with execution of Non-Competition and Non-Solicitation Agreement], incorporated herein by reference to Exhibit 10.2 to A&F’s Quarterly Report on Form 10-Q for the quarterly period ended November 2, 2013 (File No. 001-12107). |
10.40* | Form of Restricted Stock Unit Award Agreement used for grants of awards after August 20, 2013 under the Amended and Restated Abercrombie & Fitch Co. 2007 Long-Term Incentive Plan [For associates (employees); grant of award forms all or part of the consideration for the execution by associate of Non-Competition and Non-Solicitation Agreement], incorporated herein by reference to Exhibit 10.3 to A&F’s Quarterly Report on Form 10-Q for the quarterly period ended November 2, 2013 (File No. 001-12107). |
10.41* | Form of Restricted Stock Unit Award Agreement used for grants of awards after August 20, 2013 under the Amended and Restated Abercrombie & Fitch Co. 2007 Long-Term Incentive Plan [For associates (employees); grant of award not associated with execution of Non-Competition and Non-Solicitation Agreement], incorporated herein by reference to Exhibit 10.4 to A&F’s Quarterly Report on Form 10-Q for the quarterly period ended November 2, 2013 (File No. 001-12107). |
10.42* | Form of Performance Share Award Agreement used for grants of awards after August 20, 2013 under the Amended and Restated Abercrombie & Fitch Co. 2007 Long-Term Incentive Plan [For associates (employees); grant of award forms all or part of the consideration for the execution by associate of Non-Competition and Non-Solicitation Agreement], incorporated herein by reference to Exhibit 10.5 to A&F’s Quarterly Report on Form 10-Q for the quarterly period ended November 2, 2013 (File No. 001-12107). |
10.43* | Form of Performance Share Award Agreement used for grants of awards after August 20, 2013 under the Amended and Restated Abercrombie & Fitch Co. 2007 Long-Term Incentive Plan [For associates (employees); grant of award not associated with execution of Non-Competition and Non-Solicitation Agreement], incorporated herein by reference to Exhibit 10.6 to A&F’s Quarterly Report on Form 10-Q for the quarterly period ended November 2, 2013 (File No. 001-12107). |
10.44* | Form of Stock Appreciation Right Award Agreement used for grants of awards after August 20, 2013 under the Abercrombie & Fitch Co. 2005 Long-Term Incentive Plan [For associates (employees); grant of award forms all or part of the consideration for the execution by associate of Non-Competition and Non-Solicitation Agreement], incorporated herein by reference to Exhibit 10.8 to A&F’s Quarterly Report on Form 10-Q for the quarterly period ended November 2, 2013 (File No. 001-12107). |
10.45* | Form of Stock Appreciation Right Award Agreement used for grants of awards after August 20, 2013 under the Abercrombie & Fitch Co. 2005 Long-Term Incentive Plan [For associates (employees); grant of award not associated with execution of Non-Competition and Non-Solicitation Agreement], incorporated herein by reference to Exhibit 10.9 to A&F’s Quarterly Report on Form 10-Q for the quarterly period ended November 2, 2013 (File No. 001-12107). |
10.46* | Form of Restricted Stock Unit Award Agreement used for grants of awards after August 20, 2013 under the Abercrombie & Fitch Co. 2005 Long-Term Incentive Plan [For associates (employees); grant of award forms all or part of the consideration for the execution by associate of Non-Competition and Non-Solicitation Agreement], incorporated herein by reference to Exhibit 10.10 to A&F’s Quarterly Report on Form 10-Q for the quarterly period ended November 2, 2013 (File No. 001-12107). |
80
10.47* | Form of Restricted Stock Unit Award Agreement used for grants of awards after August 20, 2013 under the Abercrombie & Fitch Co. 2005 Long-Term Incentive Plan [For associates (employees); grant of award not associated with execution of Non-Competition and Non-Solicitation Agreement], incorporated herein by reference to Exhibit 10.11 to A&F’s Quarterly Report on Form 10-Q for the quarterly period ended November 2, 2013 (File No. 001-12107). |
10.48* | Form of Performance Share Award Agreement used for grants of awards after August 20, 2013 under the Abercrombie & Fitch Co. 2005 Long-Term Incentive Plan [For associates (employees); grant of award forms all or part of the consideration for the execution by associates of Non-Competition and Non-Solicitation Agreement], incorporated herein by reference to Exhibit 10.12 to A&F’s Quarterly Report on Form 10-Q for the quarterly period ended November 2, 2013 (File No. 001-12107). |
10.49* | Form of Performance Share Award Agreement used for grants of awards after August 20, 2013 under the Abercrombie & Fitch Co. 2005 Long-Term Incentive Plan [For associates (employees); grant of award not associated with execution of Non-Competition and Non-Solicitation Agreement], incorporated herein by reference to Exhibit 10.13 to A&F’s Quarterly Report on Form 10-Q for the quarterly period ended November 2, 2013 (File No. 001-12107). |
10.50* | Form of Performance Share Award Agreement used for grants of awards to participants involved in the profit improvement initiative under the Abercrombie & Fitch Co. 2005 Long-Term Incentive Plan [For associates (employees); grant of award not associated with execution of Non-Competition and Non-Solicitation Agreement], incorporated herein by reference to Exhibit 10.7 to A&F’s Quarterly Report on Form 10-Q for the quarterly period ended November 2, 2013 (File No. 001-12107). |
10.51* | Letter, dated April 3, 2014, from Abercrombie & Fitch to Joanne C. Crevoiserat setting forth terms of employment as Executive Vice President and Chief Financial Officer, and accepted by Joanne C. Crevoiserat on April 8, 2014, together with the related Agreement, made and entered into April 27, 2014, executed by Joanne C. Crevoiserat on April 8, 2014 and by Abercrombie & Fitch Management Co. on April 27, 2014, incorporated herein by reference to Exhibit 10.1 to A&F’s Quarterly Report on Form 10-Q for the quarterly period ended May 3, 2014 (File No. 001-12107). |
10.52 | Credit Agreement, dated as of August 7, 2014 (the “2014 ABL Credit Agreement”), among Abercrombie & Fitch Management Co., as lead borrower for the borrowers and guarantors named therein; Wells Fargo Bank, National Association, as administrative agent, collateral agent, a letter of credit issuer and swing line lender; PNC Bank, National Association, as syndication agent and a letter of credit issuer; JPMorgan Chase Bank, N.A., as documentation agent and a letter of credit issuer; Wells Fargo Bank, National Association, PNC Capital Markets LLC and J.P. Morgan Securities LLC, as joint lead arrangers and joint bookrunners; and the other lenders party thereto, incorporated herein by reference to Exhibit 10.3 to A&F’s Quarterly Report on Form 10-Q for the quarterly period ended August 2, 2014 (File No. 001-12107).† |
10.53 | Term Loan Credit Agreement, dated as of August 7, 2014 (the “2014 Term Loan Credit Agreement”), among Abercrombie & Fitch Management Co., as borrower; Abercrombie & Fitch Co. and certain of its wholly-owned subsidiaries, as guarantors; Wells Fargo Bank, National Association, as administrative agent and collateral agent; PNC Bank, National Association and JPMorgan Chase Bank, N.A., as syndication agents; Goldman Sachs Lending Partners, as documentation agent; Wells Fargo Securities, LLC, PNC Capital Markets LLC, J.P. Morgan Securities LLC and Goldman Sachs Lending Partners, as joint lead arrangers and joint book-runners; and the other lenders party thereto, incorporated herein by reference to Exhibit 10.4 to A&F’s Quarterly Report on Form 10-Q for the quarterly period ended August 2, 2014 (File No. 001-12107).† |
10.54 | Guaranty, dated as of August 7, 2014, made by Abercrombie & Fitch Co., as guarantor, and certain of its wholly-owned subsidiaries, each as a guarantor, in favor of Wells Fargo Bank, National Association, as administrative agent and collateral agent for its own benefit and the benefit of the other Credit Parties (as defined in the 2014 ABL Credit Agreement), and the Credit Parties, incorporated herein by reference to Exhibit 10.5 to A&F’s Quarterly Report on Form 10-Q for the quarterly period ended August 2, 2014 (File No. 001-12107). |
10.55 | Term Loan Guaranty, dated as of August 7, 2014, made by Abercrombie & Fitch Co., as guarantor, and certain of its wholly-owned subsidiaries, each as a guarantor, in favor of Wells Fargo Bank, National Association, as administrative agent and collateral agent for its own benefit and for the benefit of the other Credit Parties (as defined in the 2014 Term Loan Credit Agreement), and the Credit Parties, incorporated herein by reference to Exhibit 10.6 to A&F’s Quarterly Report on Form 10-Q for the quarterly period ended August 2, 2014 (File No. 001-12107). |
10.56 | Security Agreement, dated as of August 7, 2014, made by Abercrombie & Fitch Management Co., as lead borrower for itself and the other Borrowers (as defined in the 2014 ABL Credit Agreement), Abercrombie & Fitch Co. and certain of its wholly-owned subsidiaries, in their respective capacities as a guarantor, and the other borrowers and guarantors from time to time party thereto, in favor of Wells Fargo Bank, National Association, as administrative agent and collateral agent for the Credit Parties (as defined in the 2014 ABL Credit Agreement), incorporated herein by reference to Exhibit 10.7 to A&F’s Quarterly Report on Form 10-Q for the quarterly period ended August 2, 2014 (File No. 001-12107).† |
81
10.57 | Term Loan Security Agreement, dated as of August 7, 2014, made by Abercrombie & Fitch Management Co., as borrower, Abercrombie & Fitch Co. and certain of its wholly-owned subsidiaries, in their respective capacities as a guarantor, and the other guarantors from time to time party thereto, in favor of Wells Fargo Bank, National Association, as administrative agent and collateral agent for the Credit Parties (as defined in the 2014 Term Loan Credit Agreement), incorporated herein by reference to Exhibit 10.8 to A&F’s Quarterly Report on Form 10-Q for the quarterly period ended August 2, 2014 (File No. 001-12107).† |
10.58 | Intercreditor Agreement, dated as of August 7, 2014, by and between Wells Fargo Bank, National Association, in its capacity as “ABL Agent,” and Wells Fargo Bank, National Association, in its capacity as “Term Agent,” incorporated herein by reference to Exhibit 10.9 to A&F’s Quarterly Report on Form 10-Q for the quarterly period ended August 2, 2014 (File No. 001-12107). |
10.59* | Employment Offer, accepted October 9, 2014, between Fran Horowitz and A&F, incorporated herein by reference to Exhibit 10.1 to A&F’s Current Report on Form 8-K dated and filed October 15, 2014 (File No. 001-12107). |
10.60 | First Amendment to Credit Agreement, dated as of September 10, 2015, entered into by Abercrombie & Fitch Management Co., as the Lead Borrower, and the other Borrowers and Guarantors party thereto, with the Lenders party thereto and Wells Fargo Bank, National Association, as administrative agent for the Lenders, incorporated herein by reference to Exhibit 10.4 to A&F’s Quarterly Report on Form 10-Q for the quarterly period ended October 31, 2015 (File No. 001-12107). |
10.61 | First Amendment to Term Loan Credit Agreement, dated as of September 10, 2015, entered into by Abercrombie & Fitch Management Co., as Borrower, Abercrombie & Fitch Co., as Parent, and the other Guarantors party thereto, with the Lenders party thereto and Wells Fargo Bank, National Association, as administrative agent for the Lenders, incorporated herein by reference to Exhibit 10.5 to A&F’s Quarterly Report on Form 10-Q for the quarterly period ended October 31, 2015 (File No. 001-12107). |
10.62* | Form of Director and Officer Indemnification Agreement, incorporated herein by reference to Exhibit 10.1 to A&F’s Current Report on Form 8-K dated and filed October 21, 2014 (File No. 001-12107). |
10.63* | Retirement Agreement, dated December 8, 2014, between Michael S. Jeffries and A&F, incorporated herein by reference to Exhibit 10.1 to A&F’s Current Report on Form 8-K filed December 9, 2014 (File No. 001-12107). |
10.64* | Agreement entered into between Abercrombie & Fitch Management Co. and Jonathan E. Ramsden as of July 7, 2015, the execution date by Abercrombie & Fitch Management Co., incorporated herein by reference to Exhibit 10.1 to A&F’s Current Report on Form 8-K dated and filed July 9, 2015 (File No. 001-12107). |
10.65* | Form of Agreement entered into between Abercrombie & Fitch Management Co. and Fran Horowitz as of July 7, 2015, the execution date by Abercrombie & Fitch Management Co., incorporated herein by reference to Exhibit 10.2 to A&F’s Current Report on Form 8-K, dated and filed July 9, 2015 (File No. 001-12107). |
10.66* | Form of Agreement entered into between Abercrombie & Fitch Management Co. and Robert E. Bostrom as of July 7, 2015, the execution date by Abercrombie & Fitch Management Co., incorporated herein by reference to Exhibit 10.3 to A&F’s Quarterly Report on Form 10-Q for the quarterly period ended August 1, 2015 (File No. 001-12107). |
10.67* | Agreement entered into between Abercrombie & Fitch Management Co. and Joanne C. Crevoiserat as of October 15, 2015, the execution date by Abercrombie & Fitch Management Co., incorporated herein by reference to Exhibit 10.2 to A&F’s Current Report on Form 8-K, dated and filed October 19, 2015 (File No. 001-12107). |
10.68* | Abercrombie & Fitch Co. Nonqualified Savings and Supplemental Retirement Plan (II), as amended and restated effective as of January 1, 2014, incorporated herein by reference to Exhibit 10.3 to A&F’s Current Report on Form 8-K, dated and filed October 19, 2015 (File No. 001-12107). |
10.69* | First Amendment to the Abercrombie & Fitch Co. Nonqualified Savings and Supplemental Retirement Plan (II), as approved on October 14, 2015, incorporated herein by reference to Exhibit 10.4 to A&F’s Current Report on Form 8-K, dated and filed October 19, 2015 (File No. 001-12107). |
10.70* | Letter, dated December 16, 2015, from Abercrombie & Fitch Management Co. to Fran Horowitz setting forth terms of employment as President and Chief Merchandising Officer, and accepted by Fran Horowitz on December 19, 2015, incorporated herein by reference to Exhibit 10.74 to A&F's Annual Report on Form 10-K for the fiscal year ended January 30, 2016 (File No. 001-12107). |
10.71* | Offer Letter from Abercrombie & Fitch to Stacia Andersen, executed by Ms. Andersen on May 11, 2016, incorporated herein by reference to Exhibit 10.1 to A&F's Current Report on Form 8-K, dated and filed May 23, 2016 (File No. 001-12107). |
10.72* | Executive Agreement entered into between Abercrombie & Fitch Management Co. and Stacia Andersen, effective as of May 20, 2016, the execution date by Abercrombie & Fitch Management Co., incorporated herein by reference to Exhibit 10.2 to A&F's Current Report on Form 8-K, dated and filed May 23, 2016 (File No. 001-12107). |
10.73* | Offer Letter from Abercrombie & Fitch to Kristin Scott, executed by Ms. Scott on May 15, 2016, incorporated herein by reference to Exhibit 10.3 to A&F's Current Report on Form 8-K, dated and filed May 23, 2016 (File No. 001-12107). |
10.74* | Executive Agreement entered into between Abercrombie & Fitch Management Co. and Kristin Scott, effective as of May 20, 2016, the execution date by Abercrombie & Fitch Management Co., incorporated herein by reference to Exhibit 10.4 to A&F's Current Report on Form 8-K, dated and filed May 23, 2016 (File No. 001-12107). |
82
10.75* | Abercrombie & Fitch Co. 2016 Long-Term Incentive Plan for Directors, incorporated herein by reference to Exhibit 4.10 to A&F's Registration Statement on Form S-8 (Registration No. 333-212059) filed on June 16, 2016. |
10.76* | Abercrombie & Fitch Co. 2016 Long-Term Incentive Plan for Associates, incorporated herein by reference to Exhibit 4.10 to A&F's Registration Statement on Form S-8 of Abercrombie & Fitch Co. (Registration No. 333-212060) filed on June 16, 2016. |
10.77* | Certificate regarding Approval of Amendment of Section 3(b) of the Abercrombie & Fitch Co. 2016 Long-Term Incentive Plan for Associates by the Board of Directors of Abercrombie & Fitch Co. on August 31, 2016, incorporated herein by reference to Exhibit 10.5.2 to A&F's Quarterly Report on Form 10-Q for the quarterly period ended July 30, 2016 (File No. 001-12107). |
10.78* | Form of Restricted Stock Unit Award Agreement used to evidence the grant of restricted stock units to associates (employees) of A&F and its subsidiaries under the Abercrombie & Fitch Co. 2016 Long-Term Incentive Plan for Associates after June 16, 2016, incorporated herein by reference to Exhibit 10.6 to A&F's Quarterly Report on Form 10-Q for the quarterly period ended July 30, 2016 (File No. 001-12107). |
10.79* | Form of Restricted Stock Unit Award Agreement used to evidence the grant of restricted stock units to associates (employees) of A&F and its subsidiaries, subject to special non-competition and non-solicitation agreements, under the Abercrombie & Fitch Co. 2016 Long-Term Incentive Plan for Associates after June 16, 2016, incorporated herein by reference to Exhibit 10.7 to A&F's Quarterly Report on Form 10-Q for the quarterly period ended July 30, 2016 (File No. 001-12107). |
10.80* | Form of Performance Share Award Agreement used to evidence the grant of performance shares to associates (employees) of A&F and its subsidiaries under the Abercrombie & Fitch Co. 2016 Long-Term Incentive Plan for Associates after June 16, 2016, incorporated herein by reference to Exhibit 10.8 to A&F's Quarterly Report on Form 10-Q for the quarterly period ended July 30, 2016 (File No. 001-12107). |
10.81* | Form of Restricted Stock Unit Award Agreement used to evidence the grant of restricted stock units to non-associate directors of A&F under the Abercrombie & Fitch Co. 2016 Long-Term Incentive Plan for Directors on and after June 16, 2016, incorporated herein by reference to Exhibit 10.10 to A&F's Quarterly Report on Form 10-Q for the quarterly period ended July 30, 2016 (File No. 001-12107). |
10.82* | Certificate regarding Approval of Amendment of Section 3(b) of the Abercrombie & Fitch Co. 2005 Long-Term Incentive Plan by Board of Directors of Abercrombie & Fitch Co. on August 20, 2014, incorporated herein by reference to Exhibit 10.11 to A&F's Quarterly Report on Form 10-Q for the quarterly period ended July 30, 2016 (File No. 001-12107). |
10.83* | Certificate regarding Approval of Amendment of Section 3(b) of the Abercrombie & Fitch Co. Amended and Restated 2007 Long-Term Incentive Plan by Board of Directors of Abercrombie & Fitch Co. on August 20, 2014, incorporated herein by reference to Exhibit 10.12 to A&F's Quarterly Report on Form 10-Q for the quarterly period ended July 30, 2016 (File No. 001-12107). |
10.84* | Agreement between Diane Chang and Abercrombie & Fitch Trading Co., executed by Ms. Chang on October 25, 2016 and by Abercrombie & Fitch Trading Co. on November 3, 2016, incorporated herein by reference to Exhibit 10.4 to A&F's Quarterly Report on Form 10-Q for the quarterly period ended October 29, 2016 (File No. 001-12107). |
10.85* | Letter Agreement between Abercrombie & Fitch Co. and Stacia Andersen, executed by Abercrombie & Fitch Co. on December 8, 2016. |
21.1 | List of Subsidiaries of A&F. |
23.1 | Consent of Independent Registered Public Accounting Firm — PricewaterhouseCoopers LLP. |
24.1 | Powers of Attorney. |
31.1 | Certifications by Chief Executive Officer (Principal Executive Officer) pursuant to Rule 13a-14(a) or Rule 15d-14(a) under the Securities Exchange Act of 1934, as adopted pursuant to Section 302 of the Sarbanes-Oxley Act of 2002. |
31.2 | Certifications by Executive Vice President, Chief Operating Officer and Chief Financial Officer (Principal Financial Officer) pursuant to Rule 13a-14(a) or Rule 15d-14(a) under the Securities Exchange Act of 1934, as adopted pursuant to Section 302 of the Sarbanes-Oxley Act of 2002. |
32.1 | Certifications by Chief Executive Officer (Principal Executive Officer) and Executive Vice President, Chief Operating Officer and Chief Financial Officer (Principal Financial Officer) pursuant to 18 U.S.C. Section 1350, as adopted pursuant to Section 906 of the Sarbanes-Oxley Act of 2002.** |
101 | The following materials from A&F’s Annual Report on Form 10-K for the fiscal year ended January 28, 2017, formatted in XBRL (eXtensible Business Reporting Language): (i) Consolidated Statements of Operations and Comprehensive Income (Loss) for the fiscal years ended January 28, 2017, January 30, 2016 and January 31, 2015; (ii) Consolidated Balance Sheets at January 28, 2017 and January 30, 2016; (iii) Consolidated Statements of Stockholders’ Equity for the fiscal years ended January 28, 2017, January 30, 2016 and January 31, 2015; (iv) Consolidated Statements of Cash Flows for the fiscal years ended January 28, 2017, January 30, 2016 and January 31, 2015; and (v) Notes to Consolidated Financial Statements. |
83
* | Management contract or compensatory plan or arrangement required to be filed as an exhibit to this Annual Report on Form 10-K pursuant to Item 15(a)(3) of Annual Report on Form 10-K. |
** | These certifications are furnished. |
† | Certain portions of this exhibit have been omitted based upon a request for confidential treatment filed with the Securities and Exchange Commission (the “SEC”). The non-public information has been separately filed with the SEC in connection with that request. |
(b) The documents listed in Item 15(a)(3) are filed or furnished with this Annual Report on Form 10-K as exhibits or incorporated into this Annual Report on Form 10-K by reference.
(c) Financial Statement Schedules
None
ITEM 16. FORM 10-K SUMMARY
Not applicable.
84
SIGNATURES
Pursuant to the requirements of Section 13 or l5(d) of the Securities Exchange Act of 1934, the registrant has duly caused this report to be signed on its behalf by the undersigned, thereunto duly authorized.
ABERCROMBIE & FITCH CO. | ||
Date: March 27, 2017 | By | /s/ Joanne C. Crevoiserat |
Joanne C. Crevoiserat | ||
Executive Vice President, Chief Operating Officer and Chief Financial Officer (Principal Financial Officer and Authorized Officer) | ||
Pursuant to the requirements of the Securities Exchange Act of 1934, this report has been signed below by the following persons on behalf of the registrant and in the capacities indicated on March 27, 2017.
* | ||
Arthur C. Martinez | Executive Chairman of the Board and Director | |
/s/ Fran Horowitz | ||
Fran Horowitz | Chief Executive Officer and Director (Principal Executive Officer) | |
* | ||
James B. Bachmann | Director | |
* | ||
Bonnie R. Brooks | Director | |
* | ||
Terry L. Burman | Director | |
/s/ Joanne C. Crevoiserat | ||
Joanne C. Crevoiserat | Executive Vice President, Chief Operating Officer and Chief Financial Officer (Principal Financial Officer and Principal Accounting Officer) | |
* | ||
Sarah M. Gallagher | Director | |
* | ||
Michael E. Greenlees | Director | |
* | ||
Archie M. Griffin | Director | |
* | ||
Charles R. Perrin | Director | |
* | ||
Stephanie M. Shern | Director | |
* | ||
Craig R. Stapleton | Director | |
* | The undersigned, by signing her name hereto, does hereby sign this Annual Report on Form 10-K on behalf of each of the above-named directors of the Registrant pursuant to powers of attorney executed by such directors, which powers of attorney are filed with this Annual Report on Form 10-K as Exhibit 24.1, in the capacities as indicated and on March 27, 2017. |
By | /s/ Joanne C. Crevoiserat | |
Joanne C. Crevoiserat | ||
Attorney-in-fact | ||
85
UNITED STATES
SECURITIES AND EXCHANGE COMMISSION
Washington, D.C. 20549
FORM 10-K
ANNUAL REPORT PURSUANT TO SECTION 13 OR 15(d) OF
THE SECURITIES EXCHANGE ACT OF 1934
FOR THE FISCAL YEAR ENDED JANUARY 28, 2017
ABERCROMBIE & FITCH CO.
(Exact name of registrant as specified in its charter)
EXHIBITS
86
EXHIBIT INDEX
Exhibit No. | Document |
4.1 | Agreement to furnish instruments and agreements defining rights of holders of long-term debt. |
10.13* | Summary of Terms of the Annual Restricted Stock Unit Grants made to the Non-Associate Directors of A&F under the 2016 Long-Term Incentive Plan for Directors in Fiscal 2016. |
10.14* | Summary of Compensation Structure for Non-Associate Directors of A&F for Fiscal 2016. |
10.85* | Letter Agreement between Abercrombie & Fitch Co. and Stacia Andersen, executed by Abercrombie & Fitch Co. on December 8, 2016. |
21.1 | List of Subsidiaries of A&F |
23.1 | Consent of Independent Registered Public Accounting Firm — PricewaterhouseCoopers LLP |
24.1 | Powers of Attorney |
31.1 | Certifications by Chief Executive Officer (Principal Executive Officer) pursuant to Rule 13a-14(a) or Rule 15d-14(a) under the Securities Exchange Act of 1934, as adopted pursuant to Section 302 of the Sarbanes-Oxley Act of 2002. |
31.2 | Certifications by Executive Vice President, Chief Operating Officer and Chief Financial Officer (Principal Financial Officer) pursuant to Rule 13a-14(a) or Rule 15d-14(a) under the Securities Exchange Act of 1934, as adopted pursuant to Section 302 of the Sarbanes-Oxley Act of 2002. |
32.1 | Certifications by Chief Executive Officer (Principal Executive Officer) and Executive Vice President, Chief Operating Officer and Chief Financial Officer (Principal Financial Officer) pursuant to 18 U.S.C. Section 1350, as adopted pursuant to Section 906 of the Sarbanes-Oxley Act of 2002.** |
101 | The following materials from A&F’s Annual Report on Form 10-K for the fiscal year ended January 28, 2017, formatted in XBRL (eXtensible Business Reporting Language): (i) Consolidated Statements of Operations and Comprehensive Income (Loss) for the fiscal years ended January 28, 2017, January 30, 2016 and January 31, 2015; (ii) Consolidated Balance Sheets at January 28, 2017 and January 30, 2016; (iii) Consolidated Statements of Stockholders’ Equity for the fiscal years ended January 28, 2017, January 30, 2016 and January 31, 2015; (iv) Consolidated Statements of Cash Flows for the fiscal years ended January 28, 2017, January 30, 2016 and January 31, 2015; and (v) Notes to Consolidated Financial Statements. |
* | Management contract or compensatory plan or arrangement required to be filed as an exhibit to this Annual Report on Form 10-K pursuant to Item 15(a)(3) of Annual Report on Form 10-K. |
87