United States
Securities and Exchange Commission
Washington, D.C. 20549
Washington, D.C. 20549
FORM 40-F
[ ] Registration Statement pursuant to section 12 of the Securities Exchange Act of 1934
[ X ] Annual report pursuant to section 13(a) or 15(d) of the Securities Exchange Act of 1934
|
For the fiscal year ended December 31, 2015
|
Commission File Number: 333-12138
|
|
CANADIAN NATURAL RESOURCES LIMITED
(Exact name of Registrant as specified in its charter)
|
|
ALBERTA, CANADA
(Province or other jurisdiction of incorporation or organization) |
|
1311
(Primary Standard Industrial Classification Code Numbers) |
|
Not Applicable
(I.R.S. Employer Identification Number (if applicable))
|
|
2100, 855-2nd Street S.W., Calgary, Alberta, Canada, T2P 4J8
Telephone: (403) 517-7345
(Address and telephone number of Registrant’s principal executive offices) |
|
CT Corporation System, 111-Eighth Avenue, New York, New York 10011
(212) 894-8940 (Name, address (including zip code) and telephone number (including area code) of agent for service in the United States) |
Securities registered or to be registered pursuant to Section 12(b) of the Act:
Securities registered or to be registered pursuant to Section 12(g) of the Act:
|
Title of Each Class:
Common Shares, no par value
|
Name of each exchange on which registered:
New York Stock Exchange
|
Title of Each Class: None
Securities for which there is a reporting obligation pursuant to Section 15(d) of the Act: None
For annual reports, indicate by check mark the information filed with this Form:
|
[ X ] Annual information form
|
[ X ] Audited annual financial statements
|
Number of outstanding shares of each of the issuer’s classes of capital or common stock as of the close of the period covered by the annual report.
1,094,667,814 Common Shares outstanding as of December 31, 2015
Indicate by check mark whether the Registrant (1) has filed all reports required to be filed by Section 13 or 15(d) of the Exchange Act during the preceding 12 months (or for such shorter period that the Registrant was required to file such reports) and (2) has been subject to such filing requirements for the past 90 days.
| Yes [X] | No [ ] |
Indicate by check mark whether the registrant has submitted electronically and posted on its corporate Web site, if any, every Interactive Data File required to be submitted and posted pursuant to Rule 405 of Regulation S-T (s.232.405 of this chapter) during the preceding 12 months (or for such shorter period that the Registrant was required to submit and post such files).
| Yes ____ | No ____ |
This Annual Report on Form 40-F shall be incorporated by reference into, or as an exhibit to, as applicable, the Registrant’s Registration Statement on Form F-10 (File No. 333-207578) under the Securities Act of 1933 as amended.
All dollar amounts in this Annual Report on Form 40-F are expressed in Canadian dollars. On March 22, 2016 the reported Bank of Canada noon rate for one Canadian dollar was US$0.7662. On March 22, 2016 the reported Bank of Canada noon rate for one U. S. dollar was C$1.3051.
Principal Documents
The following documents have been filed as part of this Annual Report on Form 40-F, starting on the following page:
| A. | Annual Information Form |
| B. | Audited Annual Financial Statements |
| C. | Management’s Discussion and Analysis |
Supplementary Oil & Gas Information
For Canadian Natural’s Supplementary Oil & Gas Information for the year ended December 31, 2015, see Exhibit 99.1 to this Annual Report on Form 40-F.
FOR THE YEAR ENDED DECEMBER 31, 2015
March 24, 2016
|
3
|
|
|
|
|
|
5
|
|
|
7
|
|
|
8
|
|
|
9
|
|
|
10
|
|
|
11
|
|
|
13
|
|
|
13
|
|
|
17
|
|
|
47
|
|
|
47
|
|
|
47
|
|
|
49
|
|
|
50
|
|
|
56
|
|
|
56
|
|
|
57
|
|
|
57
|
|
|
57
|
|
|
57
|
|
|
58
|
|
|
59
|
|
|
|
|
|
61
|
|
|
63
|
| 2 | Canadian Natural Resources Limited |
The following are definitions and selected abbreviations used in this Annual Information Form:
|
API
|
Specific gravity measured in degrees on the American Petroleum Institute scale
|
|
ARO
|
Asset retirement obligations
|
|
bbl
|
barrel
|
|
bbl/d
|
barrels per day
|
|
Bcf
|
billion cubic feet
|
|
BOE
|
barrels of oil equivalent
|
|
BOE/d
|
barrels of oil equivalent per day
|
|
“Canadian Natural Resources Limited”,
“Canadian Natural”, “Company”,
“Corporation”
|
Canadian Natural Resources Limited and includes, where applicable, reference to subsidiaries of and partnership interests held by Canadian Natural Resources Limited and its subsidiaries
|
|
CBM
|
Coal Bed Methane
|
|
CO2
|
Carbon dioxide
|
|
CO2e
|
Carbon dioxide equivalents
|
|
Crude oil, natural gas and NGLs
|
The Company’s light and medium crude oil, primary heavy crude oil, Pelican Lake heavy crude oil, synthetic crude oil, bitumen (thermal oil), natural gas and natural gas liquids
|
|
CSS
|
Cyclic Steam Simulation
|
|
development well
|
Well drilled inside the established limits of an oil or gas reservoir or in close proximity to the edge of the reservoir, to the depth of a stratigraphic horizon known to be productive
|
|
dry well
|
Well that proves to be incapable of producing either crude oil or natural gas in sufficient quantities to justify completion
|
|
EOR
|
Enhanced Oil Recovery
|
|
exploratory well
|
Well that is not a development well, a service well, or a stratigraphic test well
|
|
extension well
|
Well that is drilled to test if a known reservoir extends beyond what had previously been believed to be the outer reservoir perimeter
|
|
fee title interest
|
Absolute ownership of legal title to mineral lands, subject to conditional interests that may have been granted from the title, such as petroleum and natural gas leases
|
|
FPSO
|
Floating Production, Storage and Offloading vessel
|
|
GHG
|
Greenhouse gas
|
|
gross acres
|
Total number of acres in which the Company has a working interest or fee title interest
|
|
gross wells
|
Total number of wells in which the Company has a working interest
|
|
Horizon
|
Horizon Oil Sands
|
|
IFRS
|
International Financial Reporting Standards
|
|
Mbbl
|
thousand barrels
|
|
Mcf
|
thousand cubic feet
|
|
Mcf/d
|
thousand cubic feet per day
|
|
MD&A
|
Management’s Discussion and Analysis
|
|
MMbbl
|
million barrels
|
|
MMBOE
|
million barrels of oil equivalent
|
|
MMBtu
|
million British thermal units
|
|
MMcf
|
million cubic feet
|
|
MMcf/d
|
million cubic feet per day
|
| Canadian Natural Resources Limited | 3 |
|
MM$
|
million Canadian dollars
|
|
NGLs
|
Natural gas liquids
|
|
net acres
|
Gross acres multiplied by the percentage working interest or fee title interest therein owned
|
|
net asset value
|
Calculated as net present value, discounted at 10%, of the future net revenue (before income tax and excluding the ARO for development existing as at December 31, 2015) of the Company’s total proved plus probable crude oil, natural gas and NGLs reserves prepared using forecast prices and costs, plus the estimated market value of core unproved property, less net debt. Net debt is long term debt plus/minus the working capital deficit/surplus. Future development costs and abandonment and reclamation costs attributable to future development activity have been applied against the future net revenue
|
|
net wells
|
Gross wells multiplied by the percentage working interest therein owned by the Company
|
|
NYSE
|
New York Stock Exchange
|
|
productive well
|
Exploratory, development or extension well that is not dry
|
|
proved property
|
Property or part of a property to which reserves have been specifically attributed
|
|
PRT
|
Petroleum Revenue Tax
|
|
SAGD
|
Steam-Assisted Gravity Drainage
|
|
SCO
|
Synthetic crude oil
|
|
SEC
|
United States Securities and Exchange Commission
|
|
service well
|
Well drilled or completed for the purpose of supporting production in an existing field and drilled for the specific purposes of gas injection, water injection, steam injection, air injection, salt-water disposal, water supply for injection, observation, or injection for combustion
|
|
stratigraphic test well
|
Drilling effort, geologically directed, to obtain information pertaining to a specific geologic condition and ordinarily drilled without the intention of being completed for hydrocarbon production
|
|
TSX
|
Toronto Stock Exchange
|
|
UK
|
United Kingdom
|
|
unproved property
|
Property or part of a property to which no reserves have been specifically attributed
|
|
US
|
United States
|
|
working interest
|
Interest held by the Company in a crude oil or natural gas property, which interest normally bears its proportionate share of the costs of exploration, development, and operation as well as any royalties or other production burdens
|
|
WTI
|
West Texas Intermediate reference location at Cushing, Oklahoma
|
| 4 | Canadian Natural Resources Limited |
Certain statements relating to Canadian Natural Resources Limited (the “Company”) in this document or documents incorporated herein by reference constitute forward-looking statements or information (collectively referred to herein as “forward-looking statements”) within the meaning of applicable securities legislation. Forward-looking statements can be identified by the words “believe”, “anticipate”, “expect”, “plan”, “estimate”, “target”, “continue”, “could”, “intend”, “may”, “potential”, “predict”, “should”, “will”, “objective”, “project”, “forecast”, “goal”, “guidance”, “outlook”, “effort”, “seeks”, “schedule”, “proposed” or expressions of a similar nature suggesting future outcome or statements regarding an outlook. Disclosure related to expected future commodity pricing, forecast or anticipated production volumes, royalties, operating costs, capital expenditures, income tax expenses, and other guidance provided throughout this Annual Information Form (“AIF”) constitute forward-looking statements. Disclosure of plans relating to and expected results of existing and future developments, including but not limited to the Horizon Oil Sands operations and future expansions, Primrose thermal projects, Pelican Lake water and polymer flood project, the Kirby Thermal Oil Sands Project, the construction and future operations of the North West Redwater bitumen upgrader and refinery, construction by third parties of new or expansion of existing pipeline capacity or other means of transportation of bitumen, crude oil, natural gas or SCO that the Company may be reliant upon to transport its products to market and reference to the 2016 activity provided also constitute forward-looking statements. This forward-looking information is based on annual budgets and multi-year forecasts, and is reviewed and revised throughout the year as necessary in the context of targeted financial ratios, project returns, product pricing expectations and balance in project risk and time horizons. These statements are not guarantees of future performance and are subject to certain risks. The reader should not place undue reliance on these forward-looking statements as there can be no assurances that the plans, initiatives or expectations upon which they are based will occur.
In addition, statements relating to “reserves” are deemed to be forward-looking statements as they involve the implied assessment based on certain estimates and assumptions that the reserves described can be profitably produced in the future. There are numerous uncertainties inherent in estimating quantities of proved and proved plus probable crude oil, natural gas and NGLs reserves and in projecting future rates of production and the timing of development expenditures. The total amount or timing of actual future production may vary significantly from reserve and production estimates.
The forward-looking statements are based on current expectations, estimates and projections about the Company and the industry in which the Company operates, which speak only as of the date such statements were made or as of the date of the report or document in which they are contained, and are subject to known and unknown risks and uncertainties that could cause the actual results, performance or achievements of the Company to be materially different from any future results, performance or achievements expressed or implied by such forward-looking statements. Such risks and uncertainties include, among others: general economic and business conditions which will, among other things, impact demand for and market prices of the Company’s products; volatility of and assumptions regarding crude oil and natural gas prices; fluctuations in currency and interest rates; assumptions on which the Company’s current guidance is based; economic conditions in the countries and regions in which the Company conducts business; political uncertainty, including actions of or against terrorists, insurgent groups or other conflict including conflict between states; industry capacity; ability of the Company to implement its business strategy, including exploration and development activities; impact of competition; the Company’s defense of lawsuits; availability and cost of seismic, drilling and other equipment; ability of the Company and its subsidiaries to complete capital programs; the Company’s and its subsidiaries’ ability to secure adequate transportation for its products; unexpected disruptions or delays in the resumption of the mining, extracting or upgrading of the Company’s bitumen products; potential delays or changes in plans with respect to exploration or development projects or capital expenditures; ability of the Company to attract the necessary labour required to build its thermal and oil sands mining projects; operating hazards and other difficulties inherent in the exploration for and production and sale of crude oil and natural gas and in mining, extracting or upgrading the Company’s bitumen products; availability and cost of financing; the Company’s and its subsidiaries’ success of exploration and development activities and its ability to replace and expand crude oil and natural gas reserves; timing and success of integrating the business and operations of acquired companies; production levels; imprecision of reserve estimates and estimates of recoverable quantities of crude oil, natural gas and NGLs not currently classified as proved; actions by governmental authorities; government regulations and the expenditures required to comply with them (especially safety and environmental laws and regulations and the impact of climate change initiatives on capital and operating costs); asset retirement obligations; the adequacy of the Company’s provision for taxes; and other circumstances affecting revenues and expenses.
The Company’s operations have been, and in the future may be, affected by political developments and by federal, provincial and local laws and regulations such as restrictions on production, changes in taxes, royalties and other amounts payable to governments or governmental agencies, price or gathering rate controls and environmental protection regulations. Should one or more of these risks or uncertainties materialize, or should any of the Company’s assumptions prove incorrect, actual results may vary in material respects from those projected in the forward-looking statements. The impact of any one factor on a particular forward-looking statement is not determinable with certainty as such factors are dependent upon other factors,
| Canadian Natural Resources Limited | 5 |
and the Company’s course of action would depend upon its assessment of the future considering all information then available. For additional information refer to the “Risks Factors” section of this AIF.
Readers are cautioned that the foregoing list of factors is not exhaustive. Unpredictable or unknown factors not discussed in this AIF could also have material adverse effects on forward-looking statements. Although the Company believes that the expectations conveyed by the forward-looking statements are reasonable based on information available to it on the date such forward-looking statements are made, no assurances can be given as to future results, levels of activity and achievements. All subsequent forward-looking statements, whether written or oral, attributable to the Company or persons acting on its behalf are expressly qualified in their entirety by these cautionary statements. Except as required by law, the Company assumes no obligation to update forward-looking statements, whether as a result of new information, future events or other factors, or the foregoing factors affecting this information, should circumstances or Management’s estimates or opinions change.
Special Note Regarding Currency, Financial Information, Production and Reserves
In this document, all references to dollars refer to Canadian dollars unless otherwise stated. Reserves and production data are presented on a before royalties basis unless otherwise stated. In addition, reference is made to crude oil and natural gas in common units called barrel of oil equivalent ("BOE"). A BOE is derived by converting six thousand cubic feet of natural gas to one barrel of crude oil (6 Mcf:1 bbl). This conversion may be misleading, particularly if used in isolation, since the 6 Mcf:1 bbl ratio is based on an energy equivalency conversion method primarily applicable at the burner tip and does not represent a value equivalency at the wellhead. In comparing the value ratio using current crude oil prices relative to natural gas prices, the 6 Mcf:1 bbl conversion ratio may be misleading as an indication of value.
The comparative Consolidated Financial Statements and the Company’s MD&A for the most recently completed fiscal year ended December 31, 2015, herein incorporated by reference, and certain information included in this AIF, have been prepared in accordance with IFRS, as issued by the International Accounting Standards Board.
For the year ended December 31, 2015, the Company retained Independent Qualified Reserves Evaluators (“IQRE”), Sproule Associates Limited and Sproule International Limited (together as “Sproule”) and GLJ Petroleum Consultants Ltd. (“GLJ”), to evaluate and review all of the Company’s proved and proved plus probable reserves with an effective date of December 31, 2015 and a preparation date of February 1, 2016. Sproule evaluated the North America and International light and medium crude oil, primary heavy crude oil, Pelican Lake heavy crude oil, bitumen (thermal oil), natural gas and NGLs reserves. GLJ evaluated the Horizon SCO reserves. The evaluation and review was conducted in accordance with the standards contained in the Canadian Oil and Gas Evaluation Handbook (“COGE Handbook”) and disclosed in accordance with National Instrument 51-101 – Standards of Disclosure for Oil and Gas Activities (“NI 51-101”) requirements.
The Company annually discloses net proved reserves and the standardized measure of discounted future net cash flows using 12-month average prices and current costs in accordance with United States Financial Accounting Standards Board Topic 932 “Extractive Activities - Oil and Gas” in the Company’s annual report on Form 40-F filed with the SEC in the “Supplementary Oil and Gas Information” section of the Company’s Annual Report on pages 92 to 99 which is incorporated herein by reference.
Special Note Regarding Non GAAP Financial Measures
This AIF includes references to financial measures commonly used in the crude oil and natural gas industry, such as adjusted net earnings from operations, cash flow from operations, adjusted cash production costs, and net asset value. These financial measures are not defined by IFRS and therefore are referred to as non-GAAP measures. The non-GAAP measures used by the Company may not be comparable to similar measures presented by other companies. The Company uses these non-GAAP measures to evaluate its performance. The non-GAAP measures should not be considered an alternative to or more meaningful than net earnings, as determined in accordance with IFRS, as an indication of the Company’s performance. The non-GAAP measures adjusted net earnings from operations and cash flow from operations are reconciled to net earnings (loss), as determined in accordance with IFRS in the “Net Earnings (Loss) and Cash Flow from Operations” section of the Company’s MD&A which is incorporated by reference into this document. The derivation of adjusted cash production costs is included in the “Operating Highlights – Oil Sands Mining and Upgrading” section of the Company’s MD&A which is incorporated by reference into this document.
| 6 | Canadian Natural Resources Limited |
Canadian Natural Resources Limited was incorporated under the laws of the Province of British Columbia on November 7, 1973 as AEX Minerals Corporation (N.P.L.) and on December 5, 1975 changed its name to Canadian Natural Resources Limited. Canadian Natural was continued under the Companies Act of Alberta on January 6, 1982 and was further continued under the Business Corporations Act (Alberta) on November 6, 1985. The head, principal and registered office of the Company is located in Calgary, Alberta, Canada at 2100, 855 - 2nd Street S.W., T2P 4J8.
The Company has amalgamated pursuant to the Business Corporations Act (Alberta) under the name Canadian Natural Resources Limited with the following:
|
October 1, 2000 - Ranger Oil Limited (“Ranger”)
|
|
January 1, 2003 - Rio Alto Exploration Ltd. (“RAX”)
|
|
January 1, 2004 - CanNat Resources Inc.
|
|
January 1, 2007 - ACC-CNR Resources Corporation
|
|
January 1, 2008 - Ranger Oil (International) Ltd.; 764968 Alberta Inc.; CNR International (Norway) Limited; Renata Resources Inc.
|
|
January 1, 2012 - Aspect Energy Ltd.; Creo Energy Ltd.; 1585024 Alberta Ltd.
|
|
January 1, 2014 - Barrick Energy Inc.
|
|
January 1, 2015 - EOG Resources Canada Inc.
|
The main operating subsidiaries and partnerships of the Company, percentage of voting securities owned either directly or indirectly, and their jurisdictions of incorporation are as follows:
|
Jurisdiction of Incorporation
|
% Ownership
|
||||
|
Subsidiary
|
|||||
|
Canadian Natural Upgrading Limited
|
Alberta
|
100
|
|||
|
CanNat Energy Inc.
|
Delaware
|
100
|
|||
|
CNR (ECHO) Resources Inc.
|
Alberta
|
100
|
|||
|
CNR International (U.K.) Investments Limited
|
England
|
100
|
|||
|
CNR International (U.K.) Limited
|
England
|
100
|
|||
|
CNR International (Côte d’Ivoire) SARL
|
Côte d’Ivoire
|
100
|
|||
|
CNR International (Olowi) Limited
|
Bahamas
|
100
|
|||
|
CNR International (South Africa) Limited
|
Alberta
|
100
|
|||
|
Horizon Construction Management Ltd.
|
Alberta
|
100
|
|||
|
Partnership
|
|||||
|
Canadian Natural Resources
|
Alberta
|
100
|
|||
|
Canadian Natural Resources Northern Alberta Partnership
|
Alberta
|
100
|
|||
|
Canadian Natural Resources 2005 Partnership
|
Alberta
|
100
|
|||
Canadian Natural, as the managing partner, CNR (ECHO) Resources Inc. and Canadian Natural Resources 2005 Partnership are the partners of Canadian Natural Resources, a general partnership. Canadian Natural, as the managing partner, CNR (ECHO) Resources Inc., Canadian Natural Resources and Canadian Natural Resources 2005 Partnership are partners of Canadian Natural Resources Northern Alberta Partnership, a general partnership. Canadian Natural, as the managing partner, and CNR (ECHO) Resources Inc. are the partners of Canadian Natural Resources 2005 Partnership, a general partnership.
In the ordinary course of business, Canadian Natural restructures its subsidiaries and partnerships to maintain efficient operations and to facilitate acquisitions and divestitures.
| Canadian Natural Resources Limited | 7 |
The consolidated financial statements of Canadian Natural include the accounts of the Company and all of its subsidiaries and wholly owned partnerships.
2013
In 2011, the Company announced that it had entered into a partnership agreement with North West Upgrading Inc. to move forward with detailed engineering regarding the construction and operation of a bitumen upgrader and refinery (“the Project”) near Redwater, Alberta. In addition, the partnership has entered into processing agreements that target to process bitumen for the Company of 12,500 bbl/d and bitumen for the Alberta Petroleum Marketing Commission (“APMC”), an agent of the Government of Alberta, of 37,500 bbl/d under a 30 year fee-for-service tolling agreement under the Bitumen Royalty In Kind initiative. In 2012, the Project was sanctioned by the Board of Directors of each partner of the North West Redwater Partnership (“Redwater Partnership”), and the associated target toll amounts were accepted by Redwater Partnership, the Company and the APMC. In December 2013, Redwater Partnership, the Company and APMC agreed in principle to amend certain terms of the processing agreements. In conjunction with these amendments, the Company, along with APMC, each committed to provide additional funding up to $350 million to attain Project completion based on the revised Project cost estimate of approximately $8,500 million. The additional funding is in the form of subordinated debt bearing interest at prime plus 6%, which is anticipated to form part of the equity toll. Should final Project costs exceed the revised cost estimate, the Company and APMC have agreed, subject to the Company being able to meet certain funding conditions, to fund any shortfall in available third party commercial lending required to attain Project completion. Under its processing agreement, beginning on the earlier of the commercial operations date of the refinery and June 1, 2018, the Company is unconditionally obligated to pay its 25% pro rata share of the debt portion of the monthly cost of service toll, including interest, fees and principal repayments, of the Redwater Partnership’s syndicated credit facility and bonds, over the tolling period of 30 years.
During 2013, the Company discovered bitumen emulsion at surface in areas of the Primrose field. The Company continues to work with the regulator on the causation review of the bitumen emulsion seepage. The Company’s near-term steaming plan at Primrose has been modified, with steaming being reduced in certain areas.
During 2013, the Company acquired all the issued and outstanding shares of Barrick Energy Inc. and 1729580 Alberta Ltd., subsidiaries of Barrick Gold Corporation for approximately $173 million.
During 2013, the Company disposed of a 50% interest in its exploration right in South Africa, for a net cash consideration of US$255 million. In the event that a commercial crude oil or natural gas discovery occurs on this exploration right, resulting in the exploration right being converted into a production right, an additional cash payment would be due to the Company at such time, amounting to US$450 million for a commercial crude oil discovery and US$120 million for a commercial natural gas discovery.
During 2013, the Company entered into a 20 year transportation agreement to ship 80,000 bbl/d of crude oil on the proposed Energy East pipeline originating at Hardisty, Alberta with delivery points in Quebec City, Quebec and Saint John, New Brunswick. This pipeline is subject to regulatory approval.
During 2013, the Company issued $500 million of 2.89% medium-term notes due August 2020. Net proceeds from the sale were used to repay bank indebtedness and for general corporate purposes.
2014
In 2014, the Company completed the acquisition of certain Canadian crude oil and natural gas properties for cash consideration of approximately $3,110 million, subject to final closing adjustments. In connection with the agreement, the Company negotiated an additional $1,000 million unsecured bank credit facility with a two-year maturity and with terms similar to the Company’s current syndicated credit facilities. The acquired lands and production base are all located in Western Canada in areas adjacent to or near the Company’s current conventional operations, primarily in Northeast British Columbia, Northwest Alberta and Northern Plains areas.
In March 2014, the Company issued US$500 million floating rate unsecured notes due March 30, 2016 at a rate of 3 month LIBOR plus 0.375%, and US$500 million principal amount of 3.80% unsecured notes due April 15, 2024. Net proceeds from the sale were used to repay bank indebtedness and for general corporate purposes.
In May 2014, the Company issued $500 million of 2.60% unsecured notes due December 3, 2019 and $500 million of 3.55% unsecured notes due June 3, 2024. Net proceeds from the sale were used to repay bank indebtedness and for general corporate purposes.
| 8 | Canadian Natural Resources Limited |
In November 2014, the Company issued US$600 million of 1.75% unsecured notes due January 15, 2018 and US$600 million of 3.90% unsecured notes due February 1, 2025. Net proceeds from the sale were used to repay bank indebtedness and for general corporate purposes.
2015
In response to declining commodity prices, the Company’s capital expenditures for 2015 reflected reductions in its capital program by approximately $3,400 million, as well as changes to its capital allocation strategy, including the decrease in drilling activity in North America, partially offset by the planned drilling activities in Offshore Africa.
In 2015, the Company’s existing $1,000 million non-revolving term credit facility was extended, maturing January 2017. The Company also entered into a new $1,500 million non-revolving term credit facility maturing April 2018. Both facilities were fully drawn at December 31, 2015. In addition, the Company’s $1,500 million revolving syndicated credit facility was increased to $2,425 million and the maturity date was extended to June 2019 from June 2016. The $3,000 million revolving syndicated credit facility was reduced to $2,425 million and the maturity date was extended to June 2020 from June 2017.
In June 2015, the Company issued $500 million of series 2 medium-term notes due August 2020 through the reopening of its previously issued 2.89% notes. Net proceeds from the sale were used to repay bank indebtedness and for general corporate purposes. The Company also repaid $400 million of 4.95% medium-term notes.
In 2014, the Company commenced a review of its royalty lands and royalty revenue portfolio. The review included a detailed examination of the Company’s freehold and royalty land position, production volumes, product mix, associated cash flow and collection of payments. In the fourth quarter of 2015, the Company disposed of its North America royalty income assets for total consideration of $1,658 million. Total consideration on the disposition was comprised of $673 million in cash, together with $985 million of non-cash consideration, comprised of approximately 44.4 million common shares of PrairieSky with a value of $22.16 per common share determined at the closing date. Subject to certain conditions, including applicable regulatory and/or shareholder approvals, the Company has agreed with PrairieSky that, by no later than December 31, 2016, it will distribute sufficient common shares of PrairieSky to the Company’s shareholders so that the Company, after such distribution, will hold less than 10% of the issued and outstanding common shares of PrairieSky.
2016
In the first quarter of 2016, the Company prepaid $250 million of the borrowings outstanding under the $1,000 million non-revolving term credit facility and extended the facility to February 2019 from January 2017. The Company also entered into a new $125 million non-revolving term credit facility maturing February 2019, which was fully drawn.
On March 21, 2016, the Court of Queen’s Bench of Alberta (the “Court”) granted an interim order under subsection 193(4) of the Business Corporations Act (Alberta), containing declarations and directions with respect to a Plan of Arrangement (the “Plan”) which, if approved by the Company’s shareholders at a subsequent meeting, will allow for the a return of capital to shareholders of the Company through the distribution of a minimum of 0.02 of a PrairieSky share in respect of each common share of the Company outstanding as of the effective time in accordance with the terms of the Plan. In the event that shareholder approval is obtained, the Company intends to apply to the Court for a final order approving the Plan, at which time the Company will have the discretion to proceed with the Plan as it stands or amend, alter or cancel the Plan.
Canadian Natural is a Canadian based senior independent energy company engaged in the acquisition, exploration, development, production, marketing and sale of crude oil, natural gas and NGLs. The Company’s principal core regions of operations are western Canada, the UK sector of the North Sea and Offshore Africa.
The Company initiates, operates and maintains a large working interest in a majority of the prospects in which it participates. Canadian Natural’s objectives are to increase crude oil and natural gas production, reserves, cash flow and net asset value on a per common share basis through the development of its existing crude oil and natural gas properties and through the discovery and/or acquisition of new reserves.
| Canadian Natural Resources Limited | 9 |
The Company has a full complement of management, technical and support staff to pursue these objectives. As at December 31, 2015, the Company had the following full time equivalent permanent employees:
|
North America, Exploration and Production
|
4,513
|
|||
|
North America, Oil Sands Mining and Upgrading
|
2,651
|
|||
|
North Sea
|
372
|
|||
|
Offshore Africa
|
32
|
|||
|
Total Company
|
7,568
|
Operational discipline, safe, effective and efficient operations as well as cost control are fundamental to the Company. By consistently managing costs throughout all industry cycles, the Company believes it will achieve continued growth. Effective and efficient operations and cost control are attained by developing area knowledge and by maintaining high working interests and operator status in its properties. The Company has grown through a combination of internal growth and strategic acquisitions. Acquisitions are made with a view to either enter new core regions or increase presence in existing core regions.
The Company’s business approach is to maintain large project inventories and production diversification among each of the commodities it produces namely: natural gas and NGLs, light and medium crude oil, primary heavy crude oil, Pelican Lake heavy crude oil, SCO from our oil sands mining operations and bitumen (thermal oil). The Company’s large diversified project portfolio enables the effective allocation of capital to higher return opportunities, which together provide complementary infrastructure and balance throughout the business cycle. Natural gas is the largest single commodity sold, accounting for 34% of 2015 production. Virtually all of the Company’s natural gas and NGLs production is located in the Canadian provinces of Alberta, British Columbia and Saskatchewan and is marketed in Canada and the US. Light and medium crude oil and NGLs, representing 16% of 2015 production, is located in the Company’s North Sea and Offshore Africa properties, and in the provinces of Alberta, British Columbia and Saskatchewan. Primary heavy crude oil accounting for 15% of 2015 production, Pelican Lake heavy crude oil accounting for 6% of 2015 production, and our bitumen (thermal oil) accounting for 15% of 2015 production are in the provinces of Alberta and Saskatchewan. SCO from our oil sands mining operations in Northern Alberta accounted for approximately 14% of 2015 production. Midstream assets, primarily comprised of two operated and one non operated pipeline systems, and an electricity cogeneration facility, provide cost effective infrastructure supporting the heavy crude oil and bitumen operations. The Company’s Midstream assets also include a 50% interest in the Redwater Partnership.
The Company strives to carry out its activities in compliance with applicable regional, national and international regulations and industry standards. Environmental specialists in Canada and the UK track performance to numerous environmental performance indicators, review the operations of the Company’s world-wide interests and report on a regular basis to the senior management of the Company, which in turn reports on environmental matters directly to the Health, Safety, Asset Integrity and Environmental Committee of the Board of Directors.
The Company regularly meets with and submits to inspections by the various governments in the regions where the Company operates. The Company’s associated environmental risk management strategies focus on working with legislators and regulators to ensure that any new or revised policies, legislation or regulations properly reflect a balanced approach to sustainable development. Specific measures in response to existing or new legislation include a focus on the Company’s energy efficiency, air emissions management, released water quality, reduced fresh water use and the minimization of the impact on the landscape. Training and due diligence for operators and contractors are key to the effectiveness of the Company’s environmental management programs and the prevention of incidents. The Company believes that it meets all existing environmental standards and regulations and has included appropriate amounts in its capital expenditure budget to continue to meet current environmental protection requirements. Since these requirements apply to all operators in the crude oil and natural gas industry, it is not anticipated that the Company’s competitive position within the industry will be adversely affected by changes in applicable legislation.
The Company has internal procedures designed to ensure that the environmental aspects of new acquisitions and developments are taken into account prior to proceeding. The Company’s environmental management plan and operating guidelines focus on minimizing the environmental impact of operations while meeting regulatory requirements, regional management frameworks, industry operating standards and guidelines, and internal corporate standards. The Company’s proactive program includes: an internal environmental compliance audit and inspection program of the Company’s operating facilities; a suspended well inspection program to support future development or eventual abandonment; appropriate reclamation and decommissioning standards for wells and facilities ready for abandonment; an effective surface reclamation program; a due diligence program related to groundwater monitoring; an active program related to preventing and reclaiming
| 10 | Canadian Natural Resources Limited |
spill sites; a solution gas conservation program; a program to replace the majority of fresh water for steaming with brackish water; water programs to improve efficiency of use, recycle rates and water storage; environmental planning for all projects to assess environmental impacts and to implement avoidance and mitigation programs; reporting for environmental liabilities; a program to optimize efficiencies at the Company’s operated facilities; continued evaluation of new technologies to reduce environmental impacts and support for Canada’s Oil Sands Innovation Alliance (“COSIA”); CO2 reduction programs including the injection of CO2 into tailings and for use in EOR; a program in place related to progressive reclamation and tailings management for the Horizon facility through the operation of thickeners to reduce fluid tailings and the implementation of low fines mining to reduce fines from ore entering the bitumen extraction process and participation and support for the Joint Oil Sands Monitoring Program. The Company has also established operating standards in the following areas: exercising care with respect to all waste produced through effective waste management plans; using water-based, environmentally friendly drilling muds whenever possible; and minimizing produced water volumes offshore through cost-effective measures. The Company has also adopted the Hydraulic Fracturing Operating Practices that were developed by the Canadian Association of Petroleum Producers (“CAPP”). In 2015, Canadian Natural continued its environmental liability reduction program with the abandonment of 519 inactive wells. In addition, reclamation was initiated at many of these sites with the eventual goal of reclamation certification. In 2015 the Company received 170 reclamation certificates representing 477 hectares of land. Further, decommissioning of inactive facilities and cleanup of active facilities was conducted to address environmental liabilities at operating assets. The Company participates in both the Canadian federal and provincial regulated GHG emissions reporting programs and continues to quantify annual GHG emissions for internal reporting purposes. The Company has participated in the CAPP Responsible Canadian Energy Program since 2000. The Company continues to invest in people, proven and new technologies, facilities and infrastructure to recover and process crude oil and natural gas resources efficiently and in an environmentally sustainable manner.
The Company, through CAPP, is working with Canadian legislators and regulators as they develop and implement new GHG emissions laws and regulations. Internally, the Company is pursuing an integrated emissions reduction strategy, to ensure it is able to comply with existing and future emissions reduction requirements, for both GHGs and air pollutants (such as sulphur dioxide and oxides of nitrogen). The Company continues to develop strategies that will enable it to deal with the risks and opportunities associated with new GHG and air emissions policies. In addition, the Company is working with relevant parties to ensure that new policies encourage technological innovation, energy efficiency, and targeted research and development while not impacting competitiveness.
The Company continues to focus on reducing GHG emissions through improved efficiency, and on trading mechanisms to ensure compliance with requirements now in effect. The Company is committed to managing air emissions through an integrated corporate approach which considers opportunities to reduce both air pollutants and GHG emissions. Air quality programs continue to be an essential part of the Company’s environmental work plan and are operated within all regulatory standards and guidelines. The Company strategy for managing GHG emissions is based on six core principles: improving energy conservation and efficiency; reducing emission intensity; developing and adopting innovative technology and supporting associated research and development; trading capacity, both domestically and globally; offsetting emissions; and considering life cycle costs of emission reductions in decision-making about project development.
The Company continues to implement flaring, venting, fuel and solution gas conservation programs. In 2015, the Company completed approximately 593 gas conservation projects in its primary heavy crude oil operations, resulting in a reduction of 3.3 million tonnes/year of CO2e. Over the past five years the Company has spent over $102 million in its primary heavy crude oil and in situ oil sands operations to conserve the equivalent of over 18.5 million tonnes of CO2e. The Company also monitors the performance of its compressor fleet as part of the Company’s compressor optimization initiative to improve fuel gas efficiency. These programs also influence and direct the Company’s plans for new projects and facilities. Horizon has incorporated advancements in technology to further reduce GHG emissions through maximizing heat integration, the use of cogeneration to meet steam and electricity demands and the design of the hydrogen production facility to enable CO2 capture and the sequestration of CO2 in oil sands tailings. The Company implemented a fuel gas import project in its North Sea operations to reduce diesel consumption in addition to continued focus on its flare reduction program in both the North Sea and Offshore Africa operations.
The Company’s business is subject to regulations generally established by government legislation and governmental agencies. The regulations are summarized in the following paragraphs.
Canada
The crude oil and natural gas industry in Canada operates under government legislation and regulations, which govern exploration, development, production, refining, marketing, transportation, prevention of waste and other activities.
| Canadian Natural Resources Limited | 11 |
The Company’s Canadian properties are primarily located in Alberta, British Columbia, Saskatchewan, and Manitoba. Most of these properties are held under leases/licences obtained from the respective provincial or federal governments, which give the holder the right to explore for and produce crude oil and natural gas. The remainder of the properties are held under freehold (private ownership) lands.
Conventional petroleum and natural gas leases issued by the provinces of Alberta, Saskatchewan and Manitoba have a primary term from two to five years, and British Columbia leases/licences presently have a term of up to ten years. Those portions of the leases that are producing or are capable of producing at the end of the primary term will “continue” for the productive life of the lease.
An Alberta oil sands permit and oil sands primary lease is issued for five and fifteen years respectively. If the minimum level of evaluation of an oil sands permit is attained, a primary oil sands lease will be issued. A primary oil sands lease is continued based on the minimum level of evaluation attained on such lease. Continued primary oil sands leases that are designated as “producing” will continue for their productive lives and are not subject to escalating rentals while those designated as “non-producing” can be continued by payment of escalating rentals.
The provincial governments regulate the production of crude oil and natural gas as well as the removal of natural gas and NGLs from their respective province. Government royalties are payable on crude oil, natural gas and NGLs production from leases owned by the province. The royalties are determined by regulation and are generally calculated as a percentage of production varied by a number of different factors including selling prices, production levels, recovery methods, transportation and processing costs, location and date of discovery.
Alberta Oil Sands royalties are based on a sliding scale ranging from 1% to 9% on a gross revenue basis pre-payout and 25% to 40% on a net revenue basis post-payout, depending on benchmark crude oil pricing.
In January 2016, the Alberta government released its Royalty Review Panel Report (the “Panel Report”) recommending modernization of conventional crude oil and natural gas royalties effective for new wells drilled beginning in 2017 and also recommending no material change to the oil sands royalty framework. The Alberta government accepted the recommendations, subject to the terms being finalized, in the Panel Report and is expected to adopt the recommendations in 2016. Until the royalty terms to be implemented have been finalized, it is difficult to comment on the impact to industry of these changes.
During 2011, the Canadian federal government enacted legislation to implement several taxation changes. These changes include a requirement that, beginning in 2012, partnership income must be included in the taxable income of each corporate partner based on the tax year of the partner, rather than the fiscal year of the partnership. The legislation includes a five year transition provision and has no impact on net earnings.
In June 2015, the Alberta government enacted legislation that increased the provincial corporate income tax rate from 10% to 12% effective July 1, 2015. The Company is subject to federal and provincial income taxes in Canada at a combined rate of approximately 26% in 2015 and 27% thereafter, after allowable deductions.
In Alberta, GHG reduction regulations came into effect July 1, 2007, affecting facilities emitting more than 100 kilotonnes of CO2e annually. Five of the Company’s facilities, the Horizon facility, the Primrose/Wolf Lake in situ heavy crude oil facilities, the Kirby South in situ heavy crude oil facility, the Hays sour natural gas plant and the Wapiti gas plant are subject to compliance under the regulations. In British Columbia, carbon tax is currently being assessed at $30/tonne of CO2e on fuel consumed and gas flared in the province. The Saskatchewan Government released draft GHG regulations that would regulate facilities emitting more than 50 kilotonnes of CO2e annually and will likely require the North Tangleflags in situ heavy oil facility to meet the reduction target for its GHG emissions once the governing legislation comes into force.
In Canada, the federal government has indicated its intent to develop regulations to address industrial GHG emissions, as part of the national GHG reduction target. The federal government is also developing a comprehensive management system for air pollutants, and has released draft regulations pertaining to certain boilers, heaters and compressor engines operated by the Company. In Alberta, the provincial government has implemented increases in both the carbon price and stringency of the existing large-emitter regulatory system for 2016 and 2017. The Alberta Government has also announced additional changes to this system after 2017, as well as a program to reduce methane emissions from the upstream oil and gas sector, and a carbon price on combustion emissions from the upstream oil and gas sector beginning in 2023. In British Columbia, the provincial government is reviewing its climate change strategy with announcements on future changes expected in 2016.
United Kingdom
Under existing law, the UK government has broad authority to regulate the petroleum industry, including exploration, development, conservation and rates of production.
| 12 | Canadian Natural Resources Limited |
Crude oil and natural gas fields granted development approval before March 16, 1993 are subject to UK PRT of 50% charged on crude oil and natural gas profits. Approvals granted on or after March 16, 1993 are exempted from PRT. Profits for PRT purposes are calculated on a field-by-field basis by deducting field production costs and field development costs from production and third-party tariff revenue. In addition, certain statutory allowances are available, which may reduce the PRT payable. There is no PRT on profits of decommissioned fields subsequently redeveloped, subject to certain conditions being met.
In 2013, the UK government introduced a Decommissioning Relief Deed (“DRD”) which is a contractual mechanism whereby the UK government guarantees its participation in future field abandonments through a recovery of PRT and corporate income tax.
In March 2015, the UK government enacted legislation that reduced the supplementary charge on oil and gas profits from 32% to 20% effective January 1, 2015. In addition, the legislation reduced the PRT rate from 50% to 35% effective January 1, 2016. Allowable abandonment expenditures eligible for carryback to prior taxation years for PRT purposes are still recoverable at the previous tax rate of 50%. The legislation also replaced the existing Brownfield Allowance with a new Investment Allowance on qualifying capital expenditures, effective April 1, 2015. The new Investment Allowance is deductible for supplementary charge purposes, subject to certain restrictions.
The overall tax rate applicable to taxable income from oil and gas activities, including PRT and corporate and supplementary income tax charges, is 50% for non-PRT paying fields and for PRT paying fields is 75% in 2015 and 67.5% thereafter.
In March 2016, the UK government further reduced the PRT rate from 35% to 0%, effective January 1, 2016. The impact of the reduction to the Company is currently being determined. A proposed reduction to the supplementary charge from 20% to 10% was also introduced which remains subject to legislative approval.
In the UK, GHG regulations have been in effect since 2005. In Phase 1 (2005 – 2007) of the UK National Allocation Plan, the Company operated below its CO2 allocation. In Phase 2 (2008 – 2012) the Company’s CO2 allocation was decreased below the Company’s operations emissions. In Phase 3 (2013 - 2020) the Company’s CO2 allocation was further reduced. The Company continues to focus on implementing reduction programs based on efficiency audits to reduce CO2 emissions at its major facilities and on trading mechanisms to ensure compliance with requirements now in effect.
Offshore Africa
Terms of licences, including royalties and taxes payable on production or profit sharing arrangements, as appropriate, vary by country and, in some cases, by concession within each country.
Development of the Espoir Field in Block CI-26 and the Baobab Field in Block CI-40, Offshore Côte d’Ivoire, are subject to Production Sharing Agreements (“PSA”) that deem tax or royalty payments to the government are met from the government’s share of profit oil. The current corporate income tax rate in Côte d’Ivoire is 25% which is applicable to non PSA income.
The Olowi Field (Offshore Gabon) is also under the terms of a PSA which deems tax or royalty payments to the government are met from the government’s share of profit oil. The current corporate income tax rate is 35% which is applicable to non PSA income.
In South Africa, for oil and gas companies, royalty rates range from 0.5% to 5% and the corporate income tax rate is 28%.
The energy industry is highly competitive in all aspects of the business including the exploration for and the development of new sources of supply, the construction and operation of crude oil and natural gas pipelines and related facilities, the acquisition of crude oil and natural gas interests, the transportation and marketing of crude oil, natural gas and NGLs, and electricity and the attraction and retention of skilled personnel. The Company’s competitors include both integrated and non integrated crude oil and natural gas companies as well as other petroleum products and energy sources.
Volatility of Crude Oil and Natural Gas Prices
The Company’s financial condition is substantially dependent on, and highly sensitive to the prevailing prices of crude oil and natural gas. Significant declines in crude oil or natural gas prices could have a material adverse effect on the Company’s operations and financial condition and the value and amount of its reserves. Prices for crude oil and natural gas fluctuate in response to changes in the supply of and demand for, crude oil and natural gas, market uncertainty and a variety of additional factors beyond the Company’s control. Crude oil prices are primarily determined by international supply and
| Canadian Natural Resources Limited | 13 |
demand. Factors which affect crude oil prices include the actions of the Organization of Petroleum Exporting Countries, the condition of the Canadian, United States, European and Asian economies, government regulation, political stability in the Middle East and elsewhere, the foreign supply of crude oil, the price of foreign imports, the ability to secure adequate transportation for products which could be affected by pipeline constraints, the construction by third parties of new or expansion of existing pipeline capacity and other factors, and the availability of alternate fuel sources and weather conditions. Natural gas prices realized by the Company are affected primarily in North America by supply and demand, weather conditions, industrial demand, and prices of alternate sources of energy. Any substantial or extended decline in the prices of crude oil or natural gas could result in a delay or cancellation of existing or future drilling, development or construction programs, including but not limited to Horizon, Primrose, Pelican Lake, the Kirby Thermal Oil Sands Project, the North West Redwater bitumen upgrader and refinery and international projects, or curtailment in production at some properties, or result in unutilized long-term transportation commitments, all of which could have a material adverse effect on the Company’s financial condition.
Approximately 36% of the Company’s 2015 production on a BOE basis was primary heavy crude oil, Pelican Lake heavy crude oil, and bitumen (thermal oil). The market prices for these products may differ from the established market indices for light and medium grades of crude oil due principally to quality differences. As a result, the price received for these products may differ from the benchmark they are priced against. Future quality differentials are uncertain and a significant increase in differential could have a material adverse effect on the Company’s financial condition.
Canadian Natural conducts assessments of the carrying value of its assets in accordance with IFRS. If crude oil and natural gas forecast prices decline, the carrying value of related property, plant and equipment could be subject to downward revisions, and net earnings could be adversely affected.
Operational Risk
Exploring for, producing, mining, extracting, upgrading and transporting crude oil, natural gas and NGLs involves many risks, which even a combination of experience, knowledge and careful evaluation may not be able to overcome. These activities are subject to a number of hazards which may result in fires, explosions, spills, blow outs or other unexpected or dangerous conditions causing personal injury, property damage, environmental damage, interruption of operations and loss of production, whether caused by human error or nature. In addition to the foregoing, the Horizon operations are also subject to loss of production, potential shutdowns and increased production costs due to the integration of the various component parts.
Environmental Risks
All phases of the crude oil and natural gas business are subject to environmental regulation pursuant to a variety of Canadian, United States, United Kingdom, European Union, African and other federal, provincial, state and municipal laws and regulations as well as international conventions (collectively, "environmental legislation").
Environmental legislation imposes, among other things, restrictions, liabilities and obligations in connection with the generation, handling, storage, transportation, treatment and disposal of hazardous substances and waste and in connection with spills, releases and emissions of various substances to the environment. Environmental legislation also requires that wells, facility sites and other properties associated with the Company’s operations be operated, maintained, abandoned and reclaimed to the satisfaction of applicable regulatory authorities. In addition, certain types of operations including exploration and development projects and significant changes to certain existing projects may require the submission and approval of environmental impact assessments or permit applications. Compliance with environmental legislation can require significant expenditures and failure to comply with environmental legislation may result in the imposition of fines and penalties. The costs of complying with environmental legislation in the future may have a material adverse effect on the Company’s financial condition.
The crude oil and natural gas industry is experiencing incremental increases in costs related to environmental regulation, particularly in North America and the North Sea. Existing and expected legislation and regulations may require the Company to address and mitigate the effect of its activities on the environment. Increasingly stringent laws and regulations, including any new regulations the US may impose to limit purchases of crude oil in favour of less energy intensive sources, may have a material adverse effect on the Company’s financial condition.
There are a number of unresolved issues in relation to Canadian federal and provincial GHG regulatory requirements. Key among them is the form of regulation, an appropriate common facility emissions level, availability and duration of compliance mechanisms and resolution of federal/provincial harmonization agreements. In November 2015, the Government of Alberta announced a Climate Leadership Plan, including measures to reduce methane emissions, implement an emissions limit for oil sands, introduce a broad-based carbon price (with phase-in for the upstream industry), and modify the existing regulatory system for large emitting facilities. The Company continues to pursue GHG emission reduction initiatives including: solution
| 14 | Canadian Natural Resources Limited |
gas conservation, compressor optimization to improve fuel gas efficiency, CO2 capture and sequestration in oil sands tailings, CO2 capture and storage in association with EOR and participation in COSIA.
The US Environmental Protection Agency (“EPA”) is proceeding to regulate GHGs under the Clean Air Act. This EPA action has been subject to legal and political challenges, the outcome of which cannot be predicted. The ultimate form of Canadian regulation is anticipated to be strongly influenced by the regulatory and judicial decisions made within the United States. Various states in the United States have enacted or are evaluating low carbon fuel standards, which may affect access to market for crude oils with higher emissions intensity. In March 2016 the US and Canadian governments issued a joint statement regarding a commitment to lowering methane emissions from the oil and gas sector by 2025. This reduction is expected to be implemented through a combination of federal and provincial actions, such as those announced by the Alberta government in November 2015.
The additional requirements of enacted or proposed GHG regulations on the Company’s operations may increase capital expenditures and production expense, including those related to Horizon and the Company’s other existing and certain planned oil sands projects. This may have an adverse effect on the Company’s financial condition.
Air pollutant standards and guidelines are being developed federally and provincially and the Company is participating in these discussions. Ambient air quality and sector based reductions in air emissions are being reviewed. Through Company and industry participation with stakeholders, guidelines are being developed that adopt a structured process to emission reductions that is commensurate with technological development and operational requirements.
In February 2009, the Energy Resources Conservation Board (ERCB), now the Alberta Energy Regulator or AER, released Directive 74 - Tailings Performance Criteria and Requirements for Oil Sands Mining Schemes. In March 2015, Alberta Environment and Parks released the Tailings Management Framework (TMF) policy and the AER suspended Directive 74. In September 2015 the AER released a draft Directive to replace Directive 74, Fluid Tailings Management for Oil Sands Mining Projects. The proposed Directive establishes performance criteria for tailings operations and sets out the requirements for approval, monitoring and reporting in respect of tailings ponds and tailings management plans. The Company will submit an updated Tailings Management Plan application in 2016 to meet the proposed Directive criteria. There is a risk the Company will not be successful in meeting the stipulated performance criteria once the new tailings process commences which could have an adverse effect on the Company’s financial condition.
Need to Replace Reserves
Canadian Natural’s future crude oil and natural gas reserves and production, and therefore its cash flows and results of operations, are highly dependent upon success in exploiting its current reserve base and acquiring or discovering additional reserves. Without additions to reserves through exploration, acquisition or development activities, the Company’s production will decline over time as reserves are depleted. The business of exploring for, developing or acquiring reserves is capital intensive. To the extent the Company’s cash flows from operations are insufficient to fund capital expenditures and external sources of capital become limited or unavailable, the Company’s ability to make the necessary capital investments to maintain and expand its crude oil and natural gas reserves will be impaired. In addition, Canadian Natural may be unable to find and develop or acquire additional reserves to replace its crude oil and natural gas production at acceptable costs.
Uncertainty of Reserve Estimates
There are numerous uncertainties inherent in estimating quantities of reserves, including many factors beyond the Company’s control. In general, estimates of economically recoverable crude oil, natural gas and NGLs reserves and the future net cash flow therefrom are based upon a number of factors and assumptions made as of the date on which the reserve estimates were determined, such as geological and engineering estimates which have inherent uncertainties, the assumed effects of regulation by governmental agencies and estimates of future commodity prices and production costs, all of which may vary considerably from actual results. All such estimates are, to some degree, uncertain and classifications of reserves are only attempts to define the degree of uncertainty involved. For these reasons, estimates of the economically recoverable crude oil, natural gas and NGLs reserves attributable to any particular group of properties, the classification of such reserves based on risk of recovery and estimates of future net revenues expected therefrom, prepared by different engineers or by the same engineers at different times, may vary substantially. Canadian Natural’s actual production, revenues, royalties, taxes and development, abandonment and operating expenditures with respect to its reserves will likely vary from such estimates, and such variances could be material.
Estimates of reserves that may be developed in the future are often based upon volumetric calculations and upon analogy to actual production history from similar reservoirs and wells. Subsequent evaluation of the same reserves based upon production history will result in variations in the previously estimated reserves.
| Canadian Natural Resources Limited | 15 |
Project Risk
Canadian Natural has a variety of exploration, development and construction projects underway at any given time. Project delays may result in delayed revenue receipts and cost overruns may result in projects being uneconomic. The Company’s ability to complete projects is dependent on general business and market conditions as well as other factors beyond our control including the availability of skilled labour and manpower, the availability and proximity of pipeline capacity, weather, environmental and regulatory matters, ability to access lands, availability of drilling and other equipment, and availability of processing capacity.
Sources of Liquidity
The ability of the Company to fund current and future capital projects and carry out our business plan is dependent on our ability to raise capital in a timely manner under favourable terms and conditions and is impacted by our credit ratings and the condition of the capital and credit markets. In addition, changes in credit ratings may affect the Company's ability to, and the associated costs of, entering into ordinary course derivative or hedging transactions, as well as entering into and maintaining ordinary course contracts with customers and suppliers on acceptable terms. The Company also enters into various transactions with counterparties and is subject to credit risk related to non-payment for sales contracts or non-performance by counterparties to contracts.
Dividends
The Company’s payment of future dividends on common shares is dependent on, among other things, its financial condition and other business factors considered relevant by the Board of Directors. The dividend policy undergoes periodic review by the Board of Directors and is subject to change.
Foreign Investments
The Company’s foreign investments involve risks typically associated with investments in developing countries such as uncertain political, economic, legal and tax environments. These risks may include, among other things, currency restrictions and exchange rate fluctuations, loss of revenue, property and equipment as a result of hazards such as expropriation, nationalization, war, insurrection and other political risks, risk of increases in taxes and governmental royalties, renegotiation of contracts with governmental entities and quasi-governmental agencies, changes in laws and policies governing operations of foreign based companies, including compliance with existing and emerging anti-corruption laws, and other uncertainties arising out of foreign government sovereignty over the Company’s international operations. In addition, if a dispute arises in its foreign operations, the Company may be subject to the exclusive jurisdiction of foreign courts or may not be successful in subjecting foreign persons to the jurisdiction of a court in Canada or the United States.
Canadian Natural’s arrangement for the exploration and development of crude oil and natural gas properties in Canada and the UK sector of the North Sea differs distinctly from its arrangement for the exploration and development in other foreign crude oil and natural gas properties. In some foreign countries in which the Company does and may do business in the future, the state generally retains ownership of the minerals and consequently retains control of, and in many cases participates in, the exploration and production of reserves. Accordingly, operations may be materially affected by host governments through royalty payments, export taxes and regulations, surcharges, value added taxes, production bonuses and other charges. In addition, changes in prices and costs of operations, timing of production and other factors may affect estimates of crude oil and natural gas reserve quantities and future net cash flows attributable to foreign properties in a manner materially different than such changes would affect estimates for Canadian properties. Agreements covering foreign crude oil and natural gas operations also frequently contain provisions obligating the Company to spend specified amounts on exploration and development, or to perform certain operations or forfeit all or a portion of the acreage subject to the contract.
Risk Management Activities
In response to fluctuations in commodity prices, foreign exchange, and interest rates, the Company may utilize various derivative financial instruments and physical sales contracts to manage its exposure under a defined hedging program. The terms of these arrangements may limit the benefit to the Company of favourable changes in these factors and may also result in royalties being paid on a reference price which is higher than the hedged price. There is also increased exposure to counterparty credit risk.
Other Business Risks
Other business risks which may negatively impact the Company’s financial condition include regulatory issues, risk of increases in government taxes and changes to the royalty regime, risk of litigation, risk to the Company’s reputation resulting
| 16 | Canadian Natural Resources Limited |
from operational activities that may cause personal injury, property damage or environmental damage, labour risk associated with securing the manpower necessary to complete capital projects in a timely and cost effective manner, severe weather conditions, timing and success of integrating the business and operations of acquired companies, and the dependency on third party operators for some of the Company’s assets. The Company utilizes a variety of information systems in its operations. A significant interruption or failure of the Company’s information technology systems and related data and control systems or a significant breach of security could adversely affect the Company’s operations. The majority of the Company’s assets are held in one or more corporate subsidiaries or partnerships. In the event of the liquidation of any corporate subsidiary, the assets of the subsidiary would be used first to repay the indebtedness of the subsidiary, including trade payables or obligations under any guarantees, prior to being used by the Company to pay its indebtedness.
For the year ended December 31, 2015, the Company retained Independent Qualified Reserves Evaluators (“IQRE”), Sproule Associates Limited and Sproule International Limited (together as “Sproule”) and GLJ Petroleum Consultants Ltd. (“GLJ”), to evaluate and review all of the Company’s proved and proved plus probable reserves with an effective date of December 31, 2015 and a preparation date of February 1, 2016. Sproule evaluated the North America and International light and medium crude oil, primary heavy crude oil, Pelican Lake heavy crude oil, bitumen (thermal oil), natural gas and NGLs reserves. GLJ evaluated the Horizon SCO reserves. The evaluation and review was conducted in accordance with the standards contained in the Canadian Oil and Gas Evaluation Handbook (“COGE Handbook”) and disclosed in accordance with National Instrument 51-101 – Standards of Disclosure for Oil and Gas Activities (“NI 51-101”) requirements.
The Reserves Committee of the Company’s Board of Directors has met with and carried out independent due diligence procedures with each of the Company’s IQRE to review the qualifications of and procedures used by each IQRE in determining the estimate of the Company’s quantities and related net present value of future net revenue of the remaining reserves.
The Company annually discloses net proved reserves and the standardized measure of discounted future net cash flows using 12-month average prices and current costs in accordance with United States Financial Accounting Standards Board Topic 932 “Extractive Activities - Oil and Gas” in the Company’s Form 40-F filed with the SEC in the “Supplementary Oil and Gas Information” section of the Company’s Annual Report on pages 92 to 99 which is incorporated herein by reference.
The estimates of future net revenue presented in the tables below do not represent the fair market value of the reserves.
There is no assurance that the price and cost assumptions contained in the forecast case will be attained and variances could be material. The recovery and reserves estimates of crude oil, natural gas and NGLs reserves provided herein are estimates only and there is no guarantee the estimated reserves will be recovered. Actual crude oil, natural gas and NGLs reserves may be greater or less than the estimate provided herein.
| Canadian Natural Resources Limited | 17 |
Summary of Company Gross Reserves
As of December 31, 2015
Forecast Prices and Costs
As of December 31, 2015
Forecast Prices and Costs
|
Light and
Medium
Crude Oil
(MMbbl)
|
Primary
Heavy
Crude Oil
(MMbbl)
|
Pelican Lake
Heavy
Crude Oil (MMbbl)
|
Bitumen
(Thermal Oil)
(MMbbl)
|
Synthetic
Crude Oil
(MMbbl)
|
Natural Gas
(Bcf)
|
Natural Gas
Liquids
(MMbbl)
|
Barrels of Oil
Equivalent
(MMBOE)
|
|||||||||||||||||||||||||
|
North America
|
||||||||||||||||||||||||||||||||
|
Proved
|
||||||||||||||||||||||||||||||||
|
Developed Producing
|
102
|
112
|
222
|
351
|
2,283
|
3,848
|
99
|
3,810
|
||||||||||||||||||||||||
|
Developed Non-Producing
|
8
|
20
|
4
|
-
|
-
|
270
|
6
|
83
|
||||||||||||||||||||||||
|
Undeveloped
|
28
|
81
|
42
|
874
|
125
|
1,920
|
90
|
1,560
|
||||||||||||||||||||||||
|
Total Proved
|
138
|
213
|
268
|
1,225
|
2,408
|
6,038
|
195
|
5,453
|
||||||||||||||||||||||||
|
Probable
|
54
|
81
|
120
|
1,182
|
1,225
|
2,300
|
88
|
3,134
|
||||||||||||||||||||||||
|
Total Proved plus Probable
|
192
|
294
|
388
|
2,407
|
3,633
|
8,338
|
283
|
8,587
|
||||||||||||||||||||||||
|
North Sea
|
||||||||||||||||||||||||||||||||
|
Proved
|
||||||||||||||||||||||||||||||||
|
Developed Producing
|
3
|
26
|
7
|
|||||||||||||||||||||||||||||
|
Developed Non-Producing
|
21
|
9
|
23
|
|||||||||||||||||||||||||||||
|
Undeveloped
|
134
|
4
|
135
|
|||||||||||||||||||||||||||||
|
Total Proved
|
158
|
39
|
165
|
|||||||||||||||||||||||||||||
|
Probable
|
126
|
57
|
135
|
|||||||||||||||||||||||||||||
|
Total Proved plus Probable
|
284
|
96
|
300
|
|||||||||||||||||||||||||||||
|
Offshore Africa
|
||||||||||||||||||||||||||||||||
|
Proved
|
||||||||||||||||||||||||||||||||
|
Developed Producing
|
50
|
22
|
54
|
|||||||||||||||||||||||||||||
|
Developed Non-Producing
|
1
|
-
|
1
|
|||||||||||||||||||||||||||||
|
Undeveloped
|
39
|
7
|
40
|
|||||||||||||||||||||||||||||
|
Total Proved
|
90
|
29
|
95
|
|||||||||||||||||||||||||||||
|
Probable
|
52
|
45
|
59
|
|||||||||||||||||||||||||||||
|
Total Proved plus Probable
|
142
|
74
|
154
|
|||||||||||||||||||||||||||||
|
Total Company
|
||||||||||||||||||||||||||||||||
|
Proved
|
||||||||||||||||||||||||||||||||
|
Developed Producing
|
155
|
112
|
222
|
351
|
2,283
|
3,896
|
99
|
3,871
|
||||||||||||||||||||||||
|
Developed Non-Producing
|
30
|
20
|
4
|
-
|
-
|
279
|
6
|
107
|
||||||||||||||||||||||||
|
Undeveloped
|
201
|
81
|
42
|
874
|
125
|
1,931
|
90
|
1,735
|
||||||||||||||||||||||||
|
Total Proved
|
386
|
213
|
268
|
1,225
|
2,408
|
6,106
|
195
|
5,713
|
||||||||||||||||||||||||
|
Probable
|
232
|
81
|
120
|
1,182
|
1,225
|
2,402
|
88
|
3,328
|
||||||||||||||||||||||||
|
Total Proved plus Probable
|
618
|
294
|
388
|
2,407
|
3,633
|
8,508
|
283
|
9,041
|
||||||||||||||||||||||||
| 18 | Canadian Natural Resources Limited |
Summary of Company Net Reserves
As of December 31, 2015
Forecast Prices and Costs
Forecast Prices and Costs
|
Light and
Medium
Crude Oil
(MMbbl)
|
Primary
Heavy
Crude Oil
(MMbbl)
|
Pelican Lake
Heavy
Crude Oil (MMbbl)
|
Bitumen
(Thermal Oil)
(MMbbl)
|
Synthetic
Crude Oil
(MMbbl)
|
Natural Gas
(Bcf)
|
Natural Gas
Liquids
(MMbbl)
|
Barrels of Oil
Equivalent
(MMBOE)
|
|||||||||||||||||||||||||
|
North America
|
||||||||||||||||||||||||||||||||
|
Proved
|
||||||||||||||||||||||||||||||||
|
Developed Producing
|
90
|
96
|
168
|
276
|
1,926
|
3,495
|
73
|
3,211
|
||||||||||||||||||||||||
|
Developed Non-Producing
|
7
|
16
|
3
|
-
|
-
|
239
|
5
|
71
|
||||||||||||||||||||||||
|
Undeveloped
|
25
|
69
|
33
|
700
|
87
|
1,649
|
71
|
1,260
|
||||||||||||||||||||||||
|
Total Proved
|
122
|
181
|
204
|
976
|
2,013
|
5,383
|
149
|
4,542
|
||||||||||||||||||||||||
|
Probable
|
45
|
66
|
82
|
908
|
993
|
1,978
|
67
|
2,491
|
||||||||||||||||||||||||
|
Total Proved plus Probable
|
167
|
247
|
286
|
1,884
|
3,006
|
7,361
|
216
|
7,033
|
||||||||||||||||||||||||
|
North Sea
|
||||||||||||||||||||||||||||||||
|
Proved
|
||||||||||||||||||||||||||||||||
|
Developed Producing
|
3
|
26
|
7
|
|||||||||||||||||||||||||||||
|
Developed Non-Producing
|
21
|
9
|
22
|
|||||||||||||||||||||||||||||
|
Undeveloped
|
134
|
4
|
135
|
|||||||||||||||||||||||||||||
|
Total Proved
|
158
|
39
|
164
|
|||||||||||||||||||||||||||||
|
Probable
|
126
|
57
|
136
|
|||||||||||||||||||||||||||||
|
Total Proved plus Probable
|
284
|
96
|
300
|
|||||||||||||||||||||||||||||
|
Offshore Africa
|
||||||||||||||||||||||||||||||||
|
Proved
|
||||||||||||||||||||||||||||||||
|
Developed Producing
|
43
|
15
|
46
|
|||||||||||||||||||||||||||||
|
Developed Non-Producing
|
-
|
-
|
-
|
|||||||||||||||||||||||||||||
|
Undeveloped
|
31
|
6
|
32
|
|||||||||||||||||||||||||||||
|
Total Proved
|
74
|
21
|
78
|
|||||||||||||||||||||||||||||
|
Probable
|
39
|
29
|
43
|
|||||||||||||||||||||||||||||
|
Total Proved plus Probable
|
113
|
50
|
121
|
|||||||||||||||||||||||||||||
|
Total Company
|
||||||||||||||||||||||||||||||||
|
Proved
|
||||||||||||||||||||||||||||||||
|
Developed Producing
|
136
|
96
|
168
|
276
|
1,926
|
3,536
|
73
|
3,264
|
||||||||||||||||||||||||
|
Developed Non-Producing
|
28
|
16
|
3
|
-
|
-
|
248
|
5
|
93
|
||||||||||||||||||||||||
|
Undeveloped
|
190
|
69
|
33
|
700
|
87
|
1,659
|
71
|
1,427
|
||||||||||||||||||||||||
|
Total Proved
|
354
|
181
|
204
|
976
|
2,013
|
5,443
|
149
|
4,784
|
||||||||||||||||||||||||
|
Probable
|
210
|
66
|
82
|
908
|
993
|
2,064
|
67
|
2,670
|
||||||||||||||||||||||||
|
Total Proved plus Probable
|
564
|
247
|
286
|
1,884
|
3,006
|
7,507
|
216
|
7,454
|
||||||||||||||||||||||||
| Canadian Natural Resources Limited | 19 |
NOTES
| 1. | “Company gross reserves” are Canadian Natural’s working interest share of reserves before deduction of royalties and without including any royalty interests of the Company. |
| 2. | “Company net reserves” are the company gross reserves less all royalties payable to others plus royalties receivable from others. |
| 3. | References to “light and medium crude oil” means “light crude oil and medium crude oil combined”. |
| 4. | “Reserves” are estimated remaining quantities of oil and natural gas and related substances anticipated to be recoverable from known accumulations, as at a given date, based on analysis of drilling, geological, geophysical, and engineering data, with the use of established technology and under specified economic conditions which are generally accepted as being reasonable. |
Reserves are classified according to the degree of certainty associated with the estimates:
| — | “Proved reserves” are those reserves which can be estimated with a high degree of certainty to be recoverable. It is likely that the actual remaining quantities recovered will exceed the estimated proved reserves. |
| — | “Probable reserves” are those additional reserves that are less certain to be recovered than proved reserves. It is equally likely that the actual remaining quantities recovered will be greater or less than the sum of the estimated proved plus probable reserves. |
Each of the reserve categories (proved and probable) may be divided into developed and undeveloped categories:
| — | “Developed reserves” are reserves that are expected to be recovered from (i) existing wells and installed facilities or, if the facilities have not been installed, that would involve a low expenditure (compared to the cost of drilling a well) to put the reserves on production, and (ii) through installed extraction equipment and infrastructure operational at the time of the reserves estimate if the extraction is by means not involving a well. The developed category may be subdivided into producing and non-producing. |
| — | “Undeveloped reserves” are reserves that are expected to be recovered from known accumulations with new wells on undrilled acreage, or from existing wells where significant expenditures are required for the completion of these wells or for the installation of processing and gathering facilities prior to the production of these reserves. Reserves on undrilled acreage are limited to those drilling units directly offsetting development spacing areas that are reasonably certain of production when drilled unless reliable technology exists that establishes reasonable certainty of economic producibilty at greater distances. |
| 5. | The reserve evaluation involved data supplied by the Company with respect to geological and engineering data, adjustments for product quality, heating value and transportation, interests owned, royalties payable, production costs, capital costs and contractual commitments. This data was found by the IQRE to be reasonable. |
| 6. | Amendments to NI 51-101 effective July 1, 2015 included changes to the definition of natural gas. Natural gas reserves disclosure is consistent with the prior year. |
| 7. | BOE values as presented may not calculate due to rounding. |
A report on reserves data by the Evaluators is provided in Schedule “A” to this AIF. A report by the Company’s management and directors on crude oil, natural gas and NGLs reserves disclosure is provided in Schedule “B” to this AIF.
| 20 | Canadian Natural Resources Limited |
Summary of Net Present Values of Future Net Revenue Before Income Taxes
As of December 31, 2015
Forecast Prices and Costs
Forecast Prices and Costs
|
MM$
|
Discount @ 0%
|
Discount @ 5%
|
Discount @ 10%
|
Discount @ 15%
|
Discount @ 20%
|
Unit Value
Discounted at
10%/year
$/BOE (1) |
||||||||||||||||||
|
North America
|
||||||||||||||||||||||||
|
Proved
|
||||||||||||||||||||||||
|
Developed Producing
|
140,590
|
58,766
|
36,051
|
26,450
|
21,124
|
11.23
|
||||||||||||||||||
|
Developed Non-Producing
|
1,592
|
1,214
|
953
|
773
|
644
|
13.42
|
||||||||||||||||||
|
Undeveloped
|
39,900
|
38,964
|
24,741
|
15,630
|
10,245
|
19.64
|
||||||||||||||||||
|
Total Proved
|
182,082
|
98,944
|
61,745
|
42,853
|
32,013
|
13.59
|
||||||||||||||||||
|
Probable
|
152,865
|
45,391
|
19,341
|
10,843
|
7,195
|
7.76
|
||||||||||||||||||
|
Total Proved plus Probable
|
334,947
|
144,335
|
81,086
|
53,696
|
39,208
|
11.53
|
||||||||||||||||||
|
North Sea
|
||||||||||||||||||||||||
|
Proved
|
||||||||||||||||||||||||
|
Developed Producing
|
(985
|
)
|
(289
|
)
|
(79
|
)
|
(7
|
)
|
23
|
(11.29
|
)
|
|||||||||||||
|
Developed Non-Producing
|
(164
|
)
|
(143
|
)
|
(128
|
)
|
(118
|
)
|
(109
|
)
|
(5.82
|
)
|
||||||||||||
|
Undeveloped
|
3,884
|
2,648
|
1,790
|
1,218
|
833
|
13.26
|
||||||||||||||||||
|
Total Proved
|
2,735
|
2,216
|
1,583
|
1,093
|
747
|
9.65
|
||||||||||||||||||
|
Probable
|
8,995
|
5,085
|
3,114
|
2,049
|
1,432
|
22.90
|
||||||||||||||||||
|
Total Proved plus Probable
|
11,730
|
7,301
|
4,697
|
3,142
|
2,179
|
15.66
|
||||||||||||||||||
|
Offshore Africa
|
||||||||||||||||||||||||
|
Proved
|
||||||||||||||||||||||||
|
Developed Producing
|
1,399
|
1,224
|
1,049
|
906
|
794
|
22.80
|
||||||||||||||||||
|
Developed Non-Producing
|
24
|
18
|
14
|
12
|
9
|
-
|
||||||||||||||||||
|
Undeveloped
|
1,912
|
1,224
|
852
|
632
|
492
|
26.63
|
||||||||||||||||||
|
Total Proved
|
3,335
|
2,466
|
1,915
|
1,550
|
1,295
|
24.55
|
||||||||||||||||||
|
Probable
|
3,361
|
2,019
|
1,329
|
938
|
699
|
30.91
|
||||||||||||||||||
|
Total Proved plus Probable
|
6,696
|
4,485
|
3,244
|
2,488
|
1,994
|
26.81
|
||||||||||||||||||
|
Total Company
|
||||||||||||||||||||||||
|
Proved
|
||||||||||||||||||||||||
|
Developed Producing
|
141,004
|
59,701
|
37,021
|
27,349
|
21,941
|
11.34
|
||||||||||||||||||
|
Developed Non-Producing
|
1,452
|
1,089
|
839
|
667
|
544
|
9.02
|
||||||||||||||||||
|
Undeveloped
|
45,696
|
42,836
|
27,383
|
17,480
|
11,570
|
19.19
|
||||||||||||||||||
|
Total Proved
|
188,152
|
103,626
|
65,243
|
45,496
|
34,055
|
13.64
|
||||||||||||||||||
|
Probable
|
165,221
|
52,495
|
23,784
|
13,830
|
9,326
|
8.91
|
||||||||||||||||||
|
Total Proved plus Probable
|
353,373
|
156,121
|
89,027
|
59,326
|
43,381
|
11.94
|
||||||||||||||||||
|
(1)
|
Unit values are based on company net reserves.
|
| Canadian Natural Resources Limited | 21 |
Summary of Net Present Values of Future Net Revenue After Income Taxes(1)
As of December 31, 2015
Forecast Prices and Costs
Forecast Prices and Costs
|
MM$
|
Discount @ 0%
|
Discount @ 5%
|
Discount @ 10%
|
Discount @ 15%
|
Discount @ 20%
|
|||||||||||||||
|
North America
|
||||||||||||||||||||
|
Proved
|
||||||||||||||||||||
|
Developed Producing
|
105,376
|
46,041
|
29,102
|
21,764
|
17,617
|
|||||||||||||||
|
Developed Non-Producing
|
1,150
|
879
|
688
|
556
|
461
|
|||||||||||||||
|
Undeveloped
|
28,456
|
27,753
|
17,256
|
10,554
|
6,614
|
|||||||||||||||
|
Total Proved
|
134,982
|
74,673
|
47,046
|
32,874
|
24,692
|
|||||||||||||||
|
Probable
|
112,574
|
33,130
|
13,992
|
7,782
|
5,129
|
|||||||||||||||
|
Total Proved plus Probable
|
247,556
|
107,803
|
61,038
|
40,656
|
29,821
|
|||||||||||||||
|
North Sea
|
||||||||||||||||||||
|
Proved
|
||||||||||||||||||||
|
Developed Producing
|
(987
|
)
|
(296
|
)
|
(90
|
)
|
(20
|
)
|
8
|
|||||||||||
|
Developed Non-Producing
|
(195
|
)
|
(170
|
)
|
(152
|
)
|
(139
|
)
|
(128
|
)
|
||||||||||
|
Undeveloped
|
2,883
|
1,691
|
1,055
|
676
|
433
|
|||||||||||||||
|
Total Proved
|
1,701
|
1,225
|
813
|
517
|
313
|
|||||||||||||||
|
Probable
|
4,256
|
2,426
|
1,528
|
1,045
|
763
|
|||||||||||||||
|
Total Proved plus Probable
|
5,957
|
3,651
|
2,341
|
1,562
|
1,076
|
|||||||||||||||
|
Offshore Africa
|
||||||||||||||||||||
|
Proved
|
||||||||||||||||||||
|
Developed Producing
|
1,019
|
925
|
805
|
701
|
618
|
|||||||||||||||
|
Developed Non-Producing
|
19
|
14
|
11
|
9
|
7
|
|||||||||||||||
|
Undeveloped
|
1,445
|
933
|
655
|
491
|
385
|
|||||||||||||||
|
Total Proved
|
2,483
|
1,872
|
1,471
|
1,201
|
1,010
|
|||||||||||||||
|
Probable
|
2,513
|
1,522
|
1,010
|
717
|
538
|
|||||||||||||||
|
Total Proved plus Probable
|
4,996
|
3,394
|
2,481
|
1,918
|
1,548
|
|||||||||||||||
|
Total Company
|
||||||||||||||||||||
|
Proved
|
||||||||||||||||||||
|
Developed Producing
|
105,408
|
46,670
|
29,817
|
22,445
|
18,243
|
|||||||||||||||
|
Developed Non-Producing
|
974
|
723
|
547
|
426
|
340
|
|||||||||||||||
|
Undeveloped
|
32,784
|
30,377
|
18,966
|
11,721
|
7,432
|
|||||||||||||||
|
Total Proved
|
139,166
|
77,770
|
49,330
|
34,592
|
26,015
|
|||||||||||||||
|
Probable
|
119,343
|
37,078
|
16,530
|
9,544
|
6,430
|
|||||||||||||||
|
Total Proved plus Probable
|
258,509
|
114,848
|
65,860
|
44,136
|
32,445
|
|||||||||||||||
|
(1)
|
After-tax net present values consider the Company’s existing tax pool balances and current tax regulations and do not represent an estimate of the value at the consolidated entity level, which may be significantly different. For information at the consolidated entity level, refer to the Company’s Consolidated Financial Statements and the Management’s Discussion and Analysis for the year ended December 31, 2015.
|
| 22 | Canadian Natural Resources Limited |
Additional Information Concerning Future Net Revenue
The following table summarizes the undiscounted future net revenue as at December 31, 2015 using forecast prices and costs.
Total Future Net Revenue (Undiscounted)
|
North America
|
North Sea
|
Offshore Africa
|
Total
|
|||||||||||||||||||||||||||||
|
MM$
|
Proved
|
Proved plus Probable
|
Proved
|
Proved plus Probable
|
Proved
|
Proved plus Probable
|
Proved
|
Proved plus Probable
|
||||||||||||||||||||||||
|
Revenue
|
451,421
|
785,008
|
18,185
|
33,814
|
6,891
|
10,960
|
476,497
|
829,782
|
||||||||||||||||||||||||
|
Royalties
|
79,276
|
147,943
|
37
|
57
|
236
|
402
|
79,549
|
148,402
|
||||||||||||||||||||||||
|
Production Costs
|
136,945
|
229,930
|
9,315
|
14,039
|
2,322
|
2,566
|
148,582
|
246,535
|
||||||||||||||||||||||||
|
Development Costs
|
43,911
|
61,640
|
4,050
|
5,324
|
758
|
1,027
|
48,719
|
67,991
|
||||||||||||||||||||||||
|
Abandonment and Reclamation
Costs – Future Development(1)
|
573
|
892
|
16
|
193
|
19
|
48
|
608
|
1,133
|
||||||||||||||||||||||||
|
Abandonment and Reclamation
Costs – Existing Development(1)
|
8,634
|
9,656
|
2,032
|
2,471
|
221
|
221
|
10,887
|
12,348
|
||||||||||||||||||||||||
|
Future Net Revenue
Before Income Taxes
|
182,082
|
334,947
|
2,735
|
11,730
|
3,335
|
6,696
|
188,152
|
353,373
|
||||||||||||||||||||||||
|
Income Taxes
|
47,100
|
87,391
|
1,034
|
5,773
|
852
|
1,700
|
48,986
|
94,864
|
||||||||||||||||||||||||
|
Future Net Revenue
After Income Taxes (2) |
134,982
|
247,556
|
1,701
|
5,957
|
2,483
|
4,996
|
139,166
|
258,509
|
||||||||||||||||||||||||
|
(1)
|
Due to amendments to NI 51-101 effective July 1, 2015, abandonment and reclamation costs included in the calculation of the future net revenue for 2015 consist of both forecast estimates of abandonment and reclamation costs attributable to future development activity, as well as certain costs already included in the Company’s ARO for development existing as at December 31, 2015. The Company’s estimated ARO at December 31, 2015 was $1,415 million, discounted at 10% (unescalated and undiscounted ARO at December 31, 2015 was $12,137 million). Approximately $8,188 million of this unescalated and undiscounted amount was also included in the future net revenue and is escalated at 1.5% per year. Specifically, for North America (excluding SCO assets), future net revenue includes the costs associated with abandonment and reclamation of wells (wells, well sites, wellsite equipment and pipelines) with assigned reserves. For SCO assets, future net revenue includes the costs associated with the abandonment and reclamation of the mine site and all mining and upgrading facilities. For North Sea and Offshore Africa, future net revenue includes the costs associated with the abandonment and reclamation of offshore wells and facilities with assigned reserves.
|
| (2) | Future net revenue is prior to provision for interest, general and administrative expenses and the impact of any risk management activities. |
| Canadian Natural Resources Limited | 23 |
The following table summarizes the future net revenue by production group as at December 31, 2015 using forecast prices and costs.
|
Future Net Revenue By Product Type (1) (2)
|
|||||||||
|
Reserves
Category
|
Production Group
|
Future Net Revenue
Before Income Taxes (discounted at 10%/year) (MM$) |
Unit Value
($/BOE) |
||||||
|
Proved
Reserves
|
Light and Medium Crude Oil
(including solution gas and other by-products) |
6,924
|
16.43
|
||||||
|
Primary Heavy Crude Oil
(including solution gas) |
3,109
|
16.99
|
|||||||
|
Pelican Lake Heavy Crude Oil
(including solution gas) |
3,650
|
17.84
|
|||||||
|
Bitumen (Thermal Oil)
|
13,806
|
14.14
|
|||||||
|
Synthetic Crude Oil
|
33,009
|
16.40
|
|||||||
|
Natural Gas
(including by-products but excluding solution gas and by-products from oil wells) |
5,416
|
5.49
|
|||||||
|
Abandonment and Reclamation Costs – Existing
Development
|
(671
|
)
|
- | ||||||
|
Total
|
65,243
|
13.64 | |||||||
|
Proved Plus
Probable Reserves
|
Light and Medium Crude Oil
(including solution gas and other by-products) |
12,445
|
18.51
|
||||||
| Primary Heavy Crude Oil (including solution gas) |
4,619
|
18.47
|
|||||||
|
Pelican Lake Heavy Crude Oil
(including solution gas) |
4,923
|
17.15
|
|||||||
|
Bitumen (Thermal Oil)
|
19,875 | 10.55 | |||||||
|
Synthetic Crude Oil
|
40,230 | 13.38 | |||||||
|
Natural Gas
(including by-products but excluding solution gas and by-products from oil wells) |
7,725
|
5.70
|
|||||||
|
Abandonment and Reclamation Costs – Existing
Development
|
(790 |
)
|
- | ||||||
|
Total
|
89,027 | 11.94 | |||||||
| (1) | Unit values are based on company net reserves. |
| (2) | The net present values of the future net revenue for each product type includes the forecast estimates of abandonment and reclamation costs attributable to future development activity. The net present value of the future net revenue for the “Abandonment and Reclamation Costs – Existing Development” contains certain costs already included in the Company’s ARO for development existing as at December 31, 2015, which are not applied at the product type level. |
| 24 | Canadian Natural Resources Limited |
Pricing Assumptions
The crude oil, natural gas and NGLs reference pricing and the inflation and exchange rates used in the preparation of reserves and related future net revenue estimates are as per the Sproule price forecast dated December 31, 2015. The following is a summary of the Sproule price forecast.
|
2016
|
2017
|
2018
|
2019
|
2020
|
Average
annual
increase
thereafter
|
|||||||||||||||||||
|
Crude Oil and NGLs
|
||||||||||||||||||||||||
|
WTI(1) (US$/bbl)
|
$
|
45.00
|
$
|
60.00
|
$
|
70.00
|
$
|
80.00
|
$
|
81.20
|
1.50
|
%
|
||||||||||||
|
WCS(2) (C$/bbl)
|
$
|
45.26
|
$
|
57.96
|
$
|
65.88
|
$
|
75.11
|
$
|
77.03
|
1.50
|
%
|
||||||||||||
|
Canadian Light Sweet(3) (C$/bbl)
|
$
|
55.20
|
$
|
69.00
|
$
|
78.43
|
$
|
89.41
|
$
|
91.71
|
1.50
|
%
|
||||||||||||
|
Cromer LSB(4) (C$/bbl)
|
$
|
54.20
|
$
|
68.00
|
$
|
77.43
|
$
|
88.41
|
$
|
90.71
|
1.50
|
%
|
||||||||||||
|
Edmonton C5+(5) (C$/bbl)
|
$
|
59.10
|
$
|
73.88
|
$
|
83.98
|
$
|
95.73
|
$
|
98.19
|
1.50
|
%
|
||||||||||||
|
North Sea Brent(6) (US$/bbl)
|
$
|
45.00
|
$
|
60.00
|
$
|
70.00
|
$
|
80.00
|
$
|
81.20
|
1.50
|
%
|
||||||||||||
|
Natural Gas
|
||||||||||||||||||||||||
|
AECO(7) (C$/MMBtu)
|
$
|
2.25
|
$
|
2.95
|
$
|
3.42
|
$
|
3.91
|
$
|
4.20
|
1.50
|
%
|
||||||||||||
|
BC Westcoast Station 2(8) (C$/MMBtu)
|
$
|
1.45
|
$
|
2.55
|
$
|
3.02
|
$
|
3.51
|
$
|
3.80
|
1.50
|
%
|
||||||||||||
|
Henry Hub(9) (US$/MMBtu)
|
$
|
2.25
|
$
|
3.00
|
$
|
3.50
|
$
|
4.00
|
$
|
4.25
|
1.50
|
%
|
||||||||||||
| (1) | "WTI” refers to the price of West Texas Intermediate crude oil at Cushing, Oklahoma. |
| (2) | “WCS” refers to Western Canadian Select, a blend of heavy crude oils and bitumen with sweet synthetic and condensate diluents at Hardisty, Alberta; reference price used in the preparation of primary heavy crude oil, Pelican Lake heavy crude oil and bitumen (thermal oil) reserves. |
| (3) | “Canadian Light Sweet” refers to the price of light gravity (40˚ API), low sulphur content Mixed Sweet Blend (MSW) crude oil at Edmonton, Alberta; reference price used in the preparation of light and medium crude oil and SCO reserves. |
| (4) | "Cromer LSB” refers to the price of light sour blend (35˚ API) physical crude oil at Cromer, Manitoba; reference price used in the preparation of light and medium crude oil in SE Saskatchewan and SW Manitoba reserves. |
| (5) | “Edmonton C5+” refers to pentanes plus at Edmonton, Alberta; reference price used in the preparation of NGLs reserves; also used in determining the diluent costs associated with primary heavy crude oil and bitumen (thermal oil) reserves. |
| (6) | “North Sea Brent” refers to the benchmark price for European, African and Middle Eastern crude oil; reference price used in the preparation of North Sea and Offshore Africa light crude oil reserves. |
| (7) | “AECO” refers to the Alberta natural gas trading price at the AECO-C hub in southeast Alberta; reference price used in the preparation of North America (excluding British Columbia) natural gas reserves. |
| (8) | “BC Westcoast Station 2” refers to the natural gas delivery point on the Spectra Energy system at Chetwynd, British Columbia; reference price used in the preparation of British Columbia natural gas reserves. |
| (9) | “Henry Hub” refers to a distribution hub on the natural gas pipeline system in Erath, Louisiana and is the pricing point for natural gas futures on the New York Mercantile Exchange. |
The forecast prices and costs assume the continuance of current laws and regulations, and any increases in wellhead selling prices also take inflation into account. Sales prices are based on reference prices as detailed above and adjusted for quality and transportation on an individual property basis. A foreign exchange rate of 0.7500 US$/C$ for 2016, 0.8000 US$/C$ for 2017, 0.8300 US$/C$ for 2018 and 0.8500 US$/C$ after 2018 was used in the 2015 evaluation.
Production costs are escalated at Sproule’s cost inflation rate of 0% per year for 2016 to 2017 and 1.5% per year after 2017 for all products. Capital costs are escalated at Sproule’s cost inflation rate of 0% per year for 2016, 4% per year for 2017 to 2019 and 1.5% per year after 2019 for North America light and medium crude oil, primary heavy crude oil, Pelican Lake heavy crude oil and natural gas. Capital costs are escalated at Sproule’s cost inflation rate of 1.5% per year for bitumen (thermal oil), SCO and International light and medium crude oil.
The Company’s 2015 average pricing, net of blending costs and excluding risk management activities, was $59.72/bbl for light and medium crude oil, $40.71/bbl for primary heavy crude oil, $41.09/bbl for Pelican Lake heavy crude oil, $34.37/bbl for bitumen (thermal oil), $61.39/bbl for SCO, $23.30/bbl for NGLs and $3.16/Mcf for natural gas.
| Canadian Natural Resources Limited | 25 |
Reconciliation of Company Gross Reserves
As of December 31, 2015
Forecast Prices and Cost
Forecast Prices and Cost
|
PROVED
|
||||||||||||||||||||||||||||||||
|
North America
|
Light and
Medium
Crude Oil
(MMbbl)
|
Primary
Heavy
Crude Oil
(MMbbl)
|
Pelican Lake
Heavy
Crude Oil (MMbbl)
|
Bitumen
(Thermal Oil)
(MMbbl)
|
Synthetic
Crude Oil
(MMbbl)
|
Natural Gas
(Bcf)
|
Natural Gas
Liquids
(MMbbl)
|
Barrels of Oil
Equivalent
(MMBOE)
|
||||||||||||||||||||||||
|
December 31, 2014
|
145
|
229
|
274
|
1,217
|
2,158
|
5,869
|
188
|
5,189
|
||||||||||||||||||||||||
|
Discoveries
|
1
|
-
|
-
|
-
|
-
|
14
|
2
|
5
|
||||||||||||||||||||||||
|
Extensions
|
1
|
4
|
-
|
23
|
220
|
252
|
10
|
300
|
||||||||||||||||||||||||
|
Infill Drilling
|
4
|
10
|
-
|
-
|
-
|
298
|
7
|
71
|
||||||||||||||||||||||||
|
Improved Recovery
|
-
|
-
|
2
|
26
|
-
|
-
|
-
|
28
|
||||||||||||||||||||||||
|
Acquisitions
|
5
|
4
|
-
|
7
|
-
|
414
|
8
|
93
|
||||||||||||||||||||||||
|
Dispositions
|
(3
|
)
|
-
|
-
|
-
|
-
|
(7
|
)
|
-
|
(4
|
)
|
|||||||||||||||||||||
|
Economic Factors
|
(6
|
)
|
(3
|
)
|
-
|
-
|
7
|
(385
|
)
|
(6
|
)
|
(72
|
)
|
|||||||||||||||||||
|
Technical Revisions
|
10
|
16
|
10
|
(1
|
)
|
68
|
190
|
1
|
135
|
|||||||||||||||||||||||
|
Production
|
(19
|
)
|
(47
|
)
|
(18
|
)
|
(47
|
)
|
(45
|
)
|
(607
|
)
|
(15
|
)
|
(292
|
)
|
||||||||||||||||
|
December 31, 2015
|
138
|
213
|
268
|
1,225
|
2,408
|
6,038
|
195
|
5,453
|
||||||||||||||||||||||||
|
North Sea
|
||||||||||||||||||||||||||||||||
|
December 31, 2014
|
204
|
83
|
218
|
|||||||||||||||||||||||||||||
|
Discoveries
|
-
|
-
|
-
|
|||||||||||||||||||||||||||||
|
Extensions
|
-
|
-
|
-
|
|||||||||||||||||||||||||||||
|
Infill Drilling
|
-
|
-
|
-
|
|||||||||||||||||||||||||||||
|
Improved Recovery
|
-
|
-
|
-
|
|||||||||||||||||||||||||||||
|
Acquisitions
|
-
|
-
|
-
|
|||||||||||||||||||||||||||||
|
Dispositions
|
-
|
-
|
-
|
|||||||||||||||||||||||||||||
|
Economic Factors
|
(2
|
)
|
(7
|
)
|
(3
|
)
|
||||||||||||||||||||||||||
|
Technical Revisions
|
(36
|
)
|
(24
|
)
|
(40
|
)
|
||||||||||||||||||||||||||
|
Production
|
(8
|
)
|
(13
|
)
|
(10
|
)
|
||||||||||||||||||||||||||
|
December 31, 2015
|
158
|
39
|
165
|
|||||||||||||||||||||||||||||
|
Offshore Africa
|
||||||||||||||||||||||||||||||||
|
December 31, 2014
|
96
|
49
|
104
|
|||||||||||||||||||||||||||||
|
Discoveries
|
-
|
-
|
-
|
|||||||||||||||||||||||||||||
|
Extensions
|
-
|
-
|
-
|
|||||||||||||||||||||||||||||
|
Infill Drilling
|
-
|
-
|
-
|
|||||||||||||||||||||||||||||
|
Improved Recovery
|
-
|
-
|
-
|
|||||||||||||||||||||||||||||
|
Acquisitions
|
-
|
-
|
-
|
|||||||||||||||||||||||||||||
|
Dispositions
|
-
|
-
|
-
|
|||||||||||||||||||||||||||||
|
Economic Factors
|
1
|
-
|
1
|
|||||||||||||||||||||||||||||
|
Technical Revisions
|
-
|
(10
|
)
|
(1
|
)
|
|||||||||||||||||||||||||||
|
Production
|
(7
|
)
|
(10
|
)
|
(9
|
)
|
||||||||||||||||||||||||||
|
December 31, 2015
|
90
|
29
|
95
|
|||||||||||||||||||||||||||||
|
Total Company
|
||||||||||||||||||||||||||||||||
|
December 31, 2014
|
445
|
229
|
274
|
1,217
|
2,158
|
6,001
|
188
|
5,511
|
||||||||||||||||||||||||
|
Discoveries
|
1
|
-
|
-
|
-
|
-
|
14
|
2
|
5
|
||||||||||||||||||||||||
|
Extensions
|
1
|
4
|
-
|
23
|
220
|
252
|
10
|
300
|
||||||||||||||||||||||||
|
Infill Drilling
|
4
|
10
|
-
|
-
|
-
|
298
|
7
|
71
|
||||||||||||||||||||||||
|
Improved Recovery
|
-
|
-
|
2
|
26
|
-
|
-
|
-
|
28
|
||||||||||||||||||||||||
|
Acquisitions
|
5
|
4
|
-
|
7
|
-
|
414
|
8
|
93
|
||||||||||||||||||||||||
|
Dispositions
|
(3
|
)
|
-
|
-
|
-
|
-
|
(7
|
)
|
-
|
(4
|
)
|
|||||||||||||||||||||
|
Economic Factors
|
(7
|
)
|
(3
|
)
|
-
|
-
|
7
|
(392
|
)
|
(6
|
)
|
(74
|
)
|
|||||||||||||||||||
|
Technical Revisions
|
(26
|
)
|
16
|
10
|
(1
|
)
|
68
|
156
|
1
|
94
|
||||||||||||||||||||||
|
Production
|
(34
|
)
|
(47
|
)
|
(18
|
)
|
(47
|
)
|
(45
|
)
|
(630
|
)
|
(15
|
)
|
(311
|
)
|
||||||||||||||||
|
December 31, 2015
|
386
|
213
|
268
|
1,225
|
2,408
|
6,106
|
195
|
5,713
|
||||||||||||||||||||||||
| 26 | Canadian Natural Resources Limited |
|
PROBABLE
|
||||||||||||||||||||||||||||||||
|
North America
|
Light and
Medium
Crude Oil
(MMbbl)
|
Primary
Heavy
Crude Oil (MMbbl)
|
Pelican Lake
Heavy
Crude Oil
(MMbbl)
|
Bitumen
(Thermal Oil)
(MMbbl)
|
Synthetic
Crude Oil
(MMbbl)
|
Natural Gas
(Bcf)
|
Natural Gas
Liquids
(MMbbl)
|
Barrels of Oil
Equivalent
(MMBOE)
|
||||||||||||||||||||||||
|
December 31, 2014
|
58
|
88
|
121
|
1,095
|
1,435
|
2,057
|
70
|
3,210
|
||||||||||||||||||||||||
|
Discoveries
|
-
|
-
|
-
|
-
|
-
|
3
|
-
|
1
|
||||||||||||||||||||||||
|
Extensions
|
1
|
2
|
-
|
88
|
(175
|
)
|
106
|
5
|
(61
|
)
|
||||||||||||||||||||||
|
Infill Drilling
|
4
|
3
|
-
|
-
|
-
|
444
|
22
|
103
|
||||||||||||||||||||||||
|
Improved Recovery
|
-
|
-
|
1
|
14
|
-
|
1
|
-
|
15
|
||||||||||||||||||||||||
|
Acquisitions
|
1
|
1
|
-
|
2
|
-
|
101
|
2
|
23
|
||||||||||||||||||||||||
|
Dispositions
|
(2
|
)
|
-
|
-
|
-
|
-
|
(2
|
)
|
-
|
(3
|
)
|
|||||||||||||||||||||
|
Economic Factors
|
-
|
-
|
-
|
-
|
-
|
(117
|
)
|
(2
|
)
|
(22
|
)
|
|||||||||||||||||||||
|
Technical Revisions
|
(8
|
)
|
(13
|
)
|
(2
|
)
|
(17
|
)
|
(35
|
)
|
(293
|
)
|
(9
|
)
|
(132
|
)
|
||||||||||||||||
|
Production
|
-
|
-
|
-
|
-
|
-
|
-
|
-
|
-
|
||||||||||||||||||||||||
|
December 31, 2015
|
54
|
81
|
120
|
1,182
|
1,225
|
2,300
|
88
|
3,134
|
||||||||||||||||||||||||
|
North Sea
|
||||||||||||||||||||||||||||||||
|
December 31, 2014
|
104
|
31
|
109
|
|||||||||||||||||||||||||||||
|
Discoveries
|
-
|
-
|
-
|
|||||||||||||||||||||||||||||
|
Extensions
|
-
|
-
|
-
|
|||||||||||||||||||||||||||||
|
Infill Drilling
|
-
|
-
|
-
|
|||||||||||||||||||||||||||||
|
Improved Recovery
|
-
|
-
|
-
|
|||||||||||||||||||||||||||||
|
Acquisitions
|
-
|
-
|
-
|
|||||||||||||||||||||||||||||
|
Dispositions
|
-
|
-
|
-
|
|||||||||||||||||||||||||||||
|
Economic Factors
|
-
|
7
|
1
|
|||||||||||||||||||||||||||||
|
Technical Revisions
|
22
|
19
|
25
|
|||||||||||||||||||||||||||||
|
Production
|
-
|
-
|
-
|
|||||||||||||||||||||||||||||
|
December 31, 2015
|
126
|
57
|
135
|
|||||||||||||||||||||||||||||
|
Offshore Africa
|
||||||||||||||||||||||||||||||||
|
December 31, 2014
|
53
|
49
|
61
|
|||||||||||||||||||||||||||||
|
Discoveries
|
-
|
-
|
-
|
|||||||||||||||||||||||||||||
|
Extensions
|
-
|
-
|
-
|
|||||||||||||||||||||||||||||
|
Infill Drilling
|
-
|
-
|
-
|
|||||||||||||||||||||||||||||
|
Improved Recovery
|
-
|
-
|
-
|
|||||||||||||||||||||||||||||
|
Acquisitions
|
-
|
-
|
-
|
|||||||||||||||||||||||||||||
|
Dispositions
|
-
|
-
|
-
|
|||||||||||||||||||||||||||||
|
Economic Factors
|
(1
|
)
|
1
|
(1
|
)
|
|||||||||||||||||||||||||||
|
Technical Revisions
|
-
|
(5
|
)
|
(1
|
)
|
|||||||||||||||||||||||||||
|
Production
|
-
|
-
|
-
|
|||||||||||||||||||||||||||||
|
December 31, 2015
|
52
|
45
|
59
|
|||||||||||||||||||||||||||||
|
Total Company
|
||||||||||||||||||||||||||||||||
|
December 31, 2014
|
215
|
88
|
121
|
1,095
|
1,435
|
2,137
|
70
|
3,380
|
||||||||||||||||||||||||
|
Discoveries
|
-
|
-
|
-
|
-
|
-
|
3
|
-
|
1
|
||||||||||||||||||||||||
|
Extensions
|
1
|
2
|
-
|
88
|
(175
|
)
|
106
|
5
|
(61
|
)
|
||||||||||||||||||||||
|
Infill Drilling
|
4
|
3
|
-
|
-
|
-
|
444
|
22
|
103
|
||||||||||||||||||||||||
|
Improved Recovery
|
-
|
-
|
1
|
14
|
-
|
1
|
-
|
15
|
||||||||||||||||||||||||
|
Acquisitions
|
1
|
1
|
-
|
2
|
-
|
101
|
2
|
23
|
||||||||||||||||||||||||
|
Dispositions
|
(2
|
)
|
-
|
-
|
-
|
-
|
(2
|
)
|
-
|
(3
|
)
|
|||||||||||||||||||||
|
Economic Factors
|
(1
|
)
|
-
|
-
|
-
|
-
|
(109
|
)
|
(2
|
)
|
(22
|
)
|
||||||||||||||||||||
|
Technical Revisions
|
14
|
(13
|
)
|
(2
|
)
|
(17
|
)
|
(35
|
)
|
(279
|
)
|
(9
|
)
|
(108
|
)
|
|||||||||||||||||
|
Production
|
-
|
-
|
-
|
-
|
-
|
-
|
-
|
-
|
||||||||||||||||||||||||
|
December 31, 2015
|
232
|
81
|
120
|
1,182
|
1,225
|
2,402
|
88
|
3,328
|
||||||||||||||||||||||||
| Canadian Natural Resources Limited | 27 |
|
PROVED PLUS PROBABLE
|
||||||||||||||||||||||||||||||||
|
North America
|
Light and
Medium
Crude Oil
(MMbbl)
|
Primary
Heavy
Crude Oil (MMbbl)
|
Pelican Lake
Heavy
Crude Oil
(MMbbl)
|
Bitumen
(Thermal Oil)
(MMbbl)
|
Synthetic
Crude Oil
(MMbbl)
|
Natural Gas
(Bcf)
|
Natural Gas
Liquids
(MMbbl)
|
Barrels of Oil
Equivalent
(MMBOE)
|
||||||||||||||||||||||||
|
December 31, 2014
|
203
|
317
|
395
|
2,312
|
3,593
|
7,926
|
258
|
8,399
|
||||||||||||||||||||||||
|
Discoveries
|
1
|
-
|
-
|
-
|
-
|
17
|
2
|
6
|
||||||||||||||||||||||||
|
Extensions
|
2
|
6
|
-
|
111
|
45
|
358
|
15
|
239
|
||||||||||||||||||||||||
|
Infill Drilling
|
8
|
13
|
-
|
-
|
-
|
742
|
29
|
174
|
||||||||||||||||||||||||
|
Improved Recovery
|
-
|
-
|
3
|
40
|
-
|
1
|
-
|
43
|
||||||||||||||||||||||||
|
Acquisitions
|
6
|
5
|
-
|
9
|
-
|
515
|
10
|
116
|
||||||||||||||||||||||||
|
Dispositions
|
(5
|
)
|
-
|
-
|
-
|
-
|
(9
|
)
|
-
|
(7
|
)
|
|||||||||||||||||||||
|
Economic Factors
|
(6
|
)
|
(3
|
)
|
-
|
-
|
7
|
(502
|
)
|
(8
|
)
|
(94
|
)
|
|||||||||||||||||||
|
Technical Revisions
|
2
|
3
|
8
|
(18
|
)
|
33
|
(103
|
)
|
(8
|
)
|
3
|
|||||||||||||||||||||
|
Production
|
(19
|
)
|
(47
|
)
|
(18
|
)
|
(47
|
)
|
(45
|
)
|
(607
|
)
|
(15
|
)
|
(292
|
)
|
||||||||||||||||
|
December 31, 2015
|
192
|
294
|
388
|
2,407
|
3,633
|
8,338
|
283
|
8,587
|
||||||||||||||||||||||||
|
North Sea
|
||||||||||||||||||||||||||||||||
|
December 31, 2014
|
308
|
114
|
327
|
|||||||||||||||||||||||||||||
|
Discoveries
|
-
|
-
|
-
|
|||||||||||||||||||||||||||||
|
Extensions
|
-
|
-
|
-
|
|||||||||||||||||||||||||||||
|
Infill Drilling
|
-
|
-
|
-
|
|||||||||||||||||||||||||||||
|
Improved Recovery
|
-
|
-
|
-
|
|||||||||||||||||||||||||||||
|
Acquisitions
|
-
|
-
|
-
|
|||||||||||||||||||||||||||||
|
Dispositions
|
-
|
-
|
-
|
|||||||||||||||||||||||||||||
|
Economic Factors
|
(2
|
)
|
-
|
(2
|
)
|
|||||||||||||||||||||||||||
|
Technical Revisions
|
(14
|
)
|
(5
|
)
|
(15
|
)
|
||||||||||||||||||||||||||
|
Production
|
(8
|
)
|
(13
|
)
|
(10
|
)
|
||||||||||||||||||||||||||
|
December 31, 2015
|
284
|
96
|
300
|
|||||||||||||||||||||||||||||
|
Offshore Africa
|
||||||||||||||||||||||||||||||||
|
December 31, 2014
|
149
|
98
|
165
|
|||||||||||||||||||||||||||||
|
Discoveries
|
-
|
-
|
-
|
|||||||||||||||||||||||||||||
|
Extensions
|
-
|
-
|
-
|
|||||||||||||||||||||||||||||
|
Infill Drilling
|
-
|
-
|
-
|
|||||||||||||||||||||||||||||
|
Improved Recovery
|
-
|
-
|
-
|
|||||||||||||||||||||||||||||
|
Acquisitions
|
-
|
-
|
-
|
|||||||||||||||||||||||||||||
|
Dispositions
|
-
|
-
|
-
|
|||||||||||||||||||||||||||||
|
Economic Factors
|
-
|
1
|
-
|
|||||||||||||||||||||||||||||
|
Technical Revisions
|
-
|
(15
|
)
|
(2
|
)
|
|||||||||||||||||||||||||||
|
Production
|
(7
|
)
|
(10
|
)
|
(9
|
)
|
||||||||||||||||||||||||||
|
December 31, 2015
|
142
|
74
|
154
|
|||||||||||||||||||||||||||||
|
Total Company
|
||||||||||||||||||||||||||||||||
|
December 31, 2014
|
660
|
317
|
395
|
2,312
|
3,593
|
8,138
|
258
|
8,891
|
||||||||||||||||||||||||
|
Discoveries
|
1
|
-
|
-
|
-
|
-
|
17
|
2
|
6
|
||||||||||||||||||||||||
|
Extensions
|
2
|
6
|
-
|
111
|
45
|
358
|
15
|
239
|
||||||||||||||||||||||||
|
Infill Drilling
|
8
|
13
|
-
|
-
|
-
|
742
|
29
|
174
|
||||||||||||||||||||||||
|
Improved Recovery
|
-
|
-
|
3
|
40
|
-
|
1
|
-
|
43
|
||||||||||||||||||||||||
|
Acquisitions
|
6
|
5
|
-
|
9
|
-
|
515
|
10
|
116
|
||||||||||||||||||||||||
|
Dispositions
|
(5
|
)
|
-
|
-
|
-
|
-
|
(9
|
)
|
-
|
(7
|
)
|
|||||||||||||||||||||
|
Economic Factors
|
(8
|
)
|
(3
|
)
|
-
|
-
|
7
|
(501
|
)
|
(8
|
)
|
(96
|
)
|
|||||||||||||||||||
|
Technical Revisions
|
(12
|
)
|
3
|
8
|
(18
|
)
|
33
|
(123
|
)
|
(8
|
)
|
(14
|
)
|
|||||||||||||||||||
|
Production
|
(34
|
)
|
(47
|
)
|
(18
|
)
|
(47
|
)
|
(45
|
)
|
(630
|
)
|
(15
|
)
|
(311
|
)
|
||||||||||||||||
|
December 31, 2015
|
618
|
294
|
388
|
2,407
|
3,633
|
8,508
|
283
|
9,041
|
||||||||||||||||||||||||
| (1) | Discoveries are additions to reserves in reservoirs where no reserves were previously booked. |
| (2) | Extensions are additions to reserves resulting from step-out drilling or recompletions. |
| (3) | Infill Drilling are additions to reserves resulting from drilling or recompletions within the known boundaries of a reservoir. |
| (4) | Improved Recovery are additions to reserves resulting from the implementation of improved recovery schemes. |
| (5) | Negative volumes, if any, for probable reserves result from the transfer of probable reserves to proved reserves. If reserves previously assigned to a discovery, an extension, an infill drilling, or an improved recovery reserves change category are initially classified as probable, they may be classified as a proved addition, in the same reserves change category, in the year when the reserves are reclassified as proved. |
|
(6)
|
Economic Factors are changes primarily due to price forecasts.
|
|
(7)
|
Technical Revisions include changes in previous estimates resulting from new technical data or revised interpretations.
|
| 28 | Canadian Natural Resources Limited |
At December 31, 2015, the company gross proved crude oil, bitumen (thermal oil), SCO and NGLs reserves totaled 4,695 MMbbl, and company gross proved plus probable crude oil, bitumen (thermal oil), SCO and NGLs reserves totaled 7,623 MMbbl. Proved reserve additions and revisions replaced 189% of 2015 production. Additions to proved reserves resulting from exploration and development activities, acquisitions and future offset additions amounted to 331 MMbbl, and additions to proved plus probable reserves amounted to 300 MMbbl. Net positive revisions amounted to 59 MMbbl for proved reserves and net negative revisions amounted to 6 MMbbl for proved plus probable reserves, primarily due to technical revisions to prior estimates.
At December 31, 2015, the company gross proved natural gas reserves totaled 6,106 Bcf, and company gross proved plus probable natural gas reserves totaled 8,508 Bcf. Proved reserve additions and revisions replaced 117% of 2015 production. Additions to proved reserves resulting from exploration and development activities, acquisitions and future offset additions amounted to 971 Bcf, and additions to proved plus probable reserves amounted to 1,624 Bcf. Net negative revisions amounted to 236 Bcf for proved reserves and 624 Bcf for proved plus probable reserves, primarily due to economic factors.
Additional Information Relating to Reserves Data
Undeveloped Reserves
Undeveloped reserves are reserves expected to be recovered from known accumulations and require significant expenditure to develop and make capable of production. Proved and probable undeveloped reserves were estimated by the IQRE in accordance with the procedures and standards contained in the COGE Handbook.
|
Proved Undeveloped Reserves
|
||||||||||||||||||||||||||||||||
|
Year
|
Light and Medium
Crude Oil (MMbbl)
|
Primary
Heavy
Crude Oil (MMbbl) |
Pelican Lake
Heavy Crude Oil (MMbbl) |
Bitumen (Thermal Oil)
(MMbbl) |
Synthetic
Crude Oil (MMbbl)
|
Natural
Gas (Bcf) |
Natural Gas Liquids
(MMbbl)
|
Barrels of Oil Equivalent (MMBOE)
|
||||||||||||||||||||||||
|
2013
First Attributed
|
3
|
20
|
2
|
-
|
-
|
180
|
13
|
68
|
||||||||||||||||||||||||
|
Total
|
251
|
98
|
41
|
746
|
363
|
1,170
|
43
|
1,737
|
||||||||||||||||||||||||
|
2014
First Attributed
|
7
|
13
|
-
|
91
|
-
|
653
|
36
|
256
|
||||||||||||||||||||||||
|
Total
|
264
|
82
|
39
|
846
|
189
|
1,741
|
87
|
1,797
|
||||||||||||||||||||||||
|
2015
First Attributed
|
3
|
4
|
-
|
29
|
125
|
487
|
15
|
257
|
||||||||||||||||||||||||
|
Total
|
201
|
81
|
42
|
874
|
125
|
1,931
|
90
|
1,735
|
||||||||||||||||||||||||
|
Probable Undeveloped Reserves
|
||||||||||||||||||||||||||||||||
|
Year
|
Light and Medium
Crude Oil (MMbbl)
|
Primary
Heavy
Crude Oil (MMbbl) |
Pelican Lake
Heavy Crude Oil (MMbbl) |
Bitumen (Thermal Oil)
(MMbbl) |
Synthetic
Crude Oil (MMbbl)
|
Natural
Gas (Bcf) |
Natural Gas Liquids
(MMbbl)
|
Barrels of Oil Equivalent (MMBOE)
|
||||||||||||||||||||||||
|
2013
First Attributed
|
3
|
16
|
-
|
16
|
-
|
267
|
20
|
100
|
||||||||||||||||||||||||
|
Total
|
145
|
50
|
22
|
1,001
|
978
|
744
|
42
|
2,362
|
||||||||||||||||||||||||
|
2014
First Attributed
|
7
|
7
|
-
|
44
|
358
|
343
|
18
|
491
|
||||||||||||||||||||||||
|
Total
|
155
|
44
|
23
|
1,083
|
1,326
|
864
|
40
|
2,815
|
||||||||||||||||||||||||
|
2015
First Attributed
|
4
|
3
|
-
|
90
|
4
|
507
|
26
|
212
|
||||||||||||||||||||||||
|
Total
|
164
|
46
|
26
|
968
|
1,043
|
1,176
|
57
|
2,500
|
||||||||||||||||||||||||
| Canadian Natural Resources Limited | 29 |
Bitumen (thermal oil) accounts for approximately 50% of the Company’s total proved undeveloped BOE reserves and 39% of the total probable undeveloped BOE reserves. These undeveloped reserves are scheduled to be developed in a staged approach to align with current operational capacities and efficient capital spending commitments over approximately the next forty years. These plans are continuously reviewed and updated for internal and external factors affecting planned activity.
Undeveloped reserves, for products other than bitumen (thermal oil), are scheduled to be developed over approximately the next ten years. The Company continually reviews the economic viability and ranking of these undeveloped reserves within the total portfolio of development projects. Development opportunities are then pursued based on capital availability and allocation.
Significant Factors or Uncertainties Affecting Reserves Data
The development plan for the Company’s undeveloped reserves is based on forecast price and cost assumptions. Projects may be advanced or delayed based on actual prices that occur.
The evaluation of reserves is a process that can be significantly affected by a number of internal and external factors. Revisions are often necessary resulting in changes in technical data acquired, historical performance, fluctuations in production costs, development costs and product pricing, economic conditions, changes in royalty regimes and environmental regulations, and future technology improvements. See “Risk Factors” in this AIF for further information.
Future Development Costs
The following table summarizes the undiscounted future development costs, excluding abandonment costs, using forecast prices and costs as of December 31, 2015.
|
Future Development Costs (Undiscounted)
|
||||||||||||||||||||||||||||||||
|
North America
|
North Sea
|
Offshore Africa
|
Total
|
|||||||||||||||||||||||||||||
|
Year
|
Proved
(MM$)
|
Proved
plus
Probable
(MM$)
|
Proved
(MM$)
|
Proved
plus
Probable
(MM$)
|
Proved
(MM$)
|
Proved
plus
Probable
(MM$)
|
Proved
(MM$)
|
Proved
plus
Probable
(MM$)
|
||||||||||||||||||||||||
|
2016
|
2,962
|
3,048
|
139
|
139
|
184
|
341
|
3,285
|
3,528
|
||||||||||||||||||||||||
|
2017
|
2,962
|
3,167
|
487
|
498
|
43
|
43
|
3,492
|
3,708
|
||||||||||||||||||||||||
|
2018
|
3,353
|
3,701
|
525
|
593
|
11
|
11
|
3,889
|
4,305
|
||||||||||||||||||||||||
|
2019
|
2,746
|
3,237
|
374
|
440
|
195
|
242
|
3,315
|
3,919
|
||||||||||||||||||||||||
|
2020
|
2,351
|
2,554
|
261
|
400
|
42
|
42
|
2,654
|
2,996
|
||||||||||||||||||||||||
|
Thereafter
|
29,537
|
45,933
|
2,264
|
3,254
|
283
|
348
|
32,084
|
49,535
|
||||||||||||||||||||||||
|
Total
|
43,911
|
61,640
|
4,050
|
5,324
|
758
|
1,027
|
48,719
|
67,991
|
||||||||||||||||||||||||
Management believes internally generated cash flows, existing credit facilities and access to debt capital markets are sufficient to fund future development costs. We do not anticipate the costs of funding would make the development of any property uneconomic.
| 30 | Canadian Natural Resources Limited |
Other Oil and Gas Information
Daily Production
Set forth below is a summary of the production, before royalties, from crude oil, natural gas and NGLs properties for the fiscal years ended December 31, 2015 and 2014.
|
2015 Average Daily
Production Rates
|
2014 Average Daily
Production Rates
|
|||||||||||||||
|
Region
|
Crude Oil & NGLs
(Mbbl) |
Natural Gas
(MMcf) |
Crude Oil & NGLs
(Mbbl) |
Natural Gas
(MMcf) |
||||||||||||
|
North America
|
||||||||||||||||
|
Northeast British Columbia
|
17
|
521
|
17
|
494
|
||||||||||||
|
Northwest Alberta
|
42
|
679
|
39
|
624
|
||||||||||||
|
Northern Plains
|
321
|
222
|
315
|
217
|
||||||||||||
|
Southern Plains
|
14
|
238
|
13
|
190
|
||||||||||||
|
Southeast Saskatchewan
|
6
|
3
|
7
|
2
|
||||||||||||
|
Oil Sands Mining & Upgrading
|
123
|
-
|
111
|
-
|
||||||||||||
|
North America Total
|
523
|
1,663
|
502
|
1,527
|
||||||||||||
|
International
|
||||||||||||||||
|
North Sea UK Sector
|
22
|
36
|
17
|
7
|
||||||||||||
|
Offshore Africa
|
19
|
27
|
12
|
21
|
||||||||||||
|
International Total
|
41
|
63
|
29
|
28
|
||||||||||||
|
Company Total
|
564
|
1,726
|
531
|
1,555
|
||||||||||||
Northeast British Columbia

Significant geological variation extends throughout the productive reservoirs in this region located west of the British Columbia and Alberta border to Prince George, British Columbia, producing light and medium crude oil, natural gas and NGLs.
Crude oil reserves are found primarily in the Halfway formation, while natural gas and associated NGLs are found in numerous carbonate and sandstone formations at depths up to 4,500 vertical meters. The exploration strategy focuses on
| Canadian Natural Resources Limited | 31 |
comprehensive evaluation through two dimensional seismic, three dimensional seismic and targeting economic prospects close to existing infrastructure. The region has a mix of low risk multi-zone targets, deep higher risk exploration plays and emerging unconventional gas plays. In 2010, a natural gas processing plant with a design capacity of 50 MMcf/d was completed at our Septimus Montney gas play and in 2011 the Company completed a pipeline to a deep cut gas facility which increased liquids recoveries. In 2013, a plant expansion was completed and production capacity of 145 MMcf/d and 11,000 bbl/d of liquids was achieved in 2014 with the completion of new wells. During 2014, the Company acquired additional production and land in the area. The southern portion of this region encompasses the Company’s BC Foothills assets where natural gas is produced from the deep Mississippian and Triassic aged reservoirs in this highly deformed structural area.
Northwest Alberta
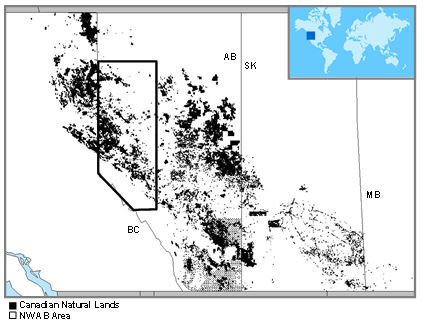
This region is located along the border of British Columbia and Alberta west of Edmonton, Alberta. The Wild River assets provide a premium land base in the deep basin, multi-zone gas fairway and the Peace River Arch assets provide premium lands in a multi-zone region along with key infrastructure. Northwest Alberta provides exploration and exploitation opportunities in combination with an extensive owned and operated infrastructure. In this region, the Company produces liquids rich natural gas from multiple, often technically complex horizons, with formation depths ranging from 700 to 4,500 meters. The northern portion of this core region provides extensive multi-zone opportunities similar to the geology of the Company’s Northern Plains core region. The Company continues to pursue development of gas plays in this region. The southern portion provides exploration and development opportunities in the regionally extensive Cretaceous Cardium formation and in the deeper, tight gas formations throughout the region. The Cardium is a complex, tight natural gas reservoir where high productivity may be achieved due to greater matrix porosity or natural fracturing. The south western portion of this region also contains significant Foothills assets with natural gas produced from the deep Mississippian and Triassic aged reservoirs.
| 32 | Canadian Natural Resources Limited |
Northern Plains
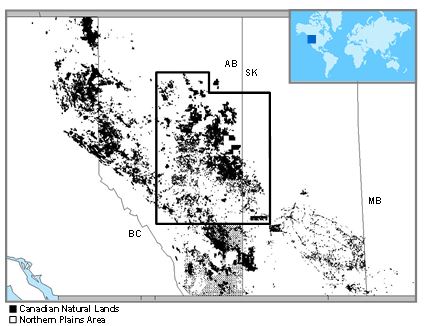
This region extends just south of Edmonton, Alberta and north to Fort McMurray, Alberta and from the Northwest Alberta region into western Saskatchewan. Over most of the region, both sweet and sour natural gas reserves are produced from numerous productive horizons at depths up to approximately 1,500 meters. In the southwest portion of the region, light crude oil and NGLs are also encountered at slightly greater depths.
Natural gas in this region is produced from shallow, low-risk, multi-zone prospects. The Company targets low-risk exploration and development opportunities and gas exploration in this area. During 2014, the Company acquired additional production and land in the area.
Near Lloydminster, Alberta, reserves of primary heavy crude oil (averaging 12°-14° API) and natural gas are produced through conventional vertical, slant and horizontal well bores from a number of productive horizons at depths up to 1,000 meters. The energy required to flow the heavy crude oil to the wellbore in this type of heavy crude oil reservoir comes from solution gas. The crude oil viscosity and the reservoir quality will determine the amount of crude oil produced from the reservoir. A key component to maintaining profitability in the production of heavy crude oil is to be an effective and efficient producer. The Company continues to control costs producing heavy crude oil by holding a dominant position that includes a significant land base and an extensive infrastructure of batteries and disposal facilities.
The Company’s holdings in this region of primary heavy crude oil production are the result of Crown land purchases and acquisitions. Included in this area is the 100% owned ECHO Pipeline system which is a high temperature, insulated crude oil transportation pipeline that eliminates the requirement for field condensate blending. The pipeline, which has a capacity of up to 87,000 bbl/d, enables the Company to transport its own production volumes at a reduced production cost. This transportation control enhances the Company’s ability to control the full spectrum of costs associated with the development and marketing of its heavy crude oil.
Included in the northern part of this region, approximately 200 miles north of Edmonton, Alberta are the Company’s holdings at Pelican Lake. These assets produce Pelican Lake heavy crude oil from the Wabasca formation with gravities of 12°-17° API. Production costs are low due to the absence of sand production and its associated disposal requirements, as well as the gathering and pipeline facilities in place. The Company has the major ownership position in the necessary infrastructure, roads, drilling pads, gathering and sales pipelines, batteries, gas plants and compressors, to ensure economic development of the large crude oil pool located on the lands, including the 62% owned and operated Pelican Lake Pipeline. A 20,000 bbl/d battery was completed in the first half of 2013. The Company is using an EOR scheme through polymer flooding to increase the ultimate recoveries from the field. At the end of 2015, approximately 56% of the field had been converted to polymer injection.
Production of bitumen (thermal oil) from the 100% owned Primrose Field located near Bonnyville, Alberta involves processes that utilize steam to increase the recovery of the bitumen (10°-11°API). The two processes employed by the Company are CSS and SAGD. Both recovery processes inject steam to heat the bitumen deposits, reducing the viscosity and thereby improving its flow characteristics. There is also an infrastructure of gathering systems, a processing plant with a capacity of 119,500 bbl/d, and the 15% Company owned Cold Lake Pipeline. In order to expand its pipeline infrastructure the Company
| Canadian Natural Resources Limited | 33 |
participated in the expansion of the Cold Lake pipeline system and commissioning was completed on the expansion in the first quarter of 2015. The Company also holds a 50% interest in a co-generation facility capable of producing 84 megawatts of electricity for the Company’s use and sale into the Alberta power grid at pool prices. The Company continues to optimize the CSS process which results in a significant improvement in well productivity and in ultimate bitumen recovery.
During 2013, the Company discovered bitumen emulsion at surface in areas of the Primrose field. The Company continues to work with the regulator on the causation review of the bitumen emulsion seepage. The Company’s near-term steaming plan at Primrose has been modified, with steaming being reduced in certain areas.
The regulatory application for the Kirby In Situ Oil Sands Project (“Kirby South Phase 1”), located approximately 85 km northeast of Lac la Biche, was approved in the third quarter 2010 and sanctioned by the Board of Directors, with construction commencing in the fourth quarter 2010. First steam injection was achieved at Kirby South in September 2013. In 2012, the Company acquired approximately 49 sections (12,630 hectares) of additional oil sands rights immediately adjacent to Canadian Natural’s Kirby In Situ Oil Sands Expansion Project (“Kirby Expansion Project”). The Kirby North Phase 1 project received all regulatory permits with facility construction commencing in the third quarter of 2014. In 2015, in response to declining commodity prices, the Company chose to temporarily delay spending on major construction activities on the Kirby North Project. The overall project is 46% complete.
Southern Plains and Southeast Saskatchewan
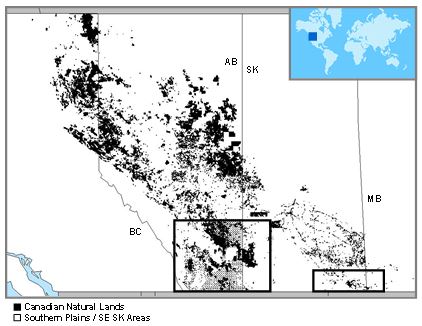
The Southern Plains region is principally located south of the Northern Plains region to the United States border and extending into western Saskatchewan.
Reserves of natural gas, NGLs and light and medium crude oil are contained in numerous productive horizons at depths up to 2,300 meters. Unlike the Company’s other three natural gas producing regions, which have areas with limited or winter access only, drilling can take place in this region throughout the year.
The Company maintains a large inventory of drillable locations on its land base in this region. This region is one of the more mature regions of the Western Canadian Sedimentary Basin and requires continual operational cost control through efficient utilization of existing facilities, flexible infrastructure design and consolidation of interests where appropriate.
The Southeast Saskatchewan area is located in the south eastern portion of the province extending into Manitoba. This region became a core region of the Company in mid-1996. This region produces primarily light sour crude oil from as many as seven productive horizons found at depths up to 2,700 meters.
| 34 | Canadian Natural Resources Limited |
Oil Sands Mining and Upgrading

Canadian Natural owns a 100% working interest in its Athabasca oil sands leases in northern Alberta, of which the main lease is subject to a 5% net carried interest in the bitumen development. Horizon is located on these leases, about 70 kilometers north of Fort McMurray, Alberta. The site is accessible by a private road and private airstrip. The oil sands resource is found in the Cretaceous McMurray Formation which is further subdivided into three informal members: lower, middle and upper. Most of Horizon’s oil sands resource is found within the lower and middle McMurray Formation at depths ranging from 50 to 100 meters below the surface.
Horizon Oil Sands includes surface oil sands mining, bitumen extraction, bitumen upgrading and associated infrastructure. Mining of the oil sands is done using conventional truck and shovel technology. The ore is then processed through extraction and froth treatment facilities to produce bitumen, which is upgraded on-site into 34ºAPI SCO. The SCO is transported from the site by a pipeline with a design capacity of 232,000 bbl/d to the Edmonton area for distribution. An on-site cogeneration plant with a design capacity of 115 MW provides power and steam for the operations.
Site clearing and pre-construction preparation activities commenced in 2004 following regulatory approvals and the Company received project sanction by the Board of Directors in February 2005, authorizing management to proceed with Phase 1 of Horizon. First SCO production was achieved during 2009 and production averaged 122,911 bbl/day in 2015.
In September 2014, the Company successfully completed the expansion of the Coker Plant (Phase 2A) increasing plant name plate capacity to 137,000 bbl/d.
At year-end 2015, Phase 2B and Phase 3 are 79% and 74% physically complete, respectively. Phase 2/3 expansion activity in 2015 continued to focus on field construction of the hydrogen unit, hydrotreater unit, vacuum distillation unit and distillation recovery unit, tank farms, tailings re-handling plant, froth treatment, froth tank, tailings transfer pumphouses and pipelines, extraction plant, ore preparation plants, and superpot along with engineering, procurement and construction related to tailings retrofit, sour water concentrator, combined hydrotreater and sulphur recovery units. In addition, the new extraction trains 3 and 4 were commissioned.
The Company targets to complete Phase 2B in 2016. Overall project completion is anticipated to be fourth quarter of 2017 and is targeted to increase Horizon SCO production to 250,000 bbl/d.
| Canadian Natural Resources Limited | 35 |
United Kingdom North Sea
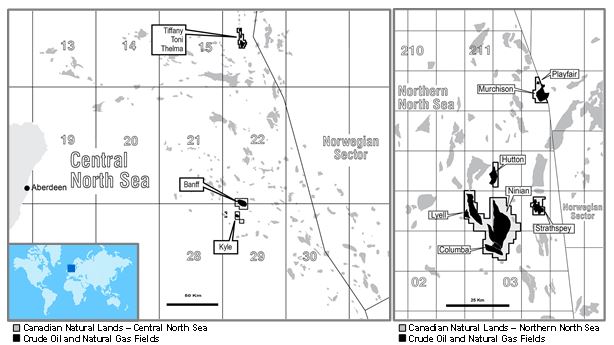
Through its wholly owned subsidiary CNR International (U.K.) Limited, formerly Ranger Oil (U.K.) Limited, the Company has operated in the North Sea for over 30 years and has developed a significant database, extensive operating experience and an experienced staff. In 2015, the Company produced from 10 crude oil fields.
The northerly fields are centered around the Ninian field where the Company has an 87.1% operated working interest. The central processing facility is connected to other fields including the Columba Terraces and Lyell fields where the Company operates with working interests of 91.6% to 100%. The Company acquired an additional 67.0% working interest in the Strathspey field in July 2013 and assumed operatorship of the field with total working interest of 73.5%. The Company also has an interest in 7 licences covering 10 blocks and part blocks surrounding the Ninian and Murchison platforms and a 66.5% working interest in the abandoned Hutton field.
In the central portion of the North Sea, the Company holds an 87.6% operated working interest in the Banff field and also owns a 45.7% operated working interest in the Kyle field. Production from the Kyle field is processed through the Banff FPSO facilities resulting in lower combined production costs from these fields.
The Company holds a 100% operated working interest in T-block (comprising the Tiffany, Toni and Thelma fields).
The Company receives tariff revenue from other field owners for the processing of crude oil and natural gas through some of the processing facilities. Opportunities for further long-reach well development on adjacent fields are provided by the existing processing facilities.
In 2013, the Company received Brownfield Allowance approvals for the Tiffany and Ninian fields. The Company completed two wells at the Tiffany field in 2013 and five wells at the Ninian field in 2014.
The decommissioning activities at the Murchison platform commenced in the fourth quarter of 2013 and cessation of production occurred in the first quarter of 2014. The decommissioning activities are ongoing and are expected to continue for approximately 5 years.
During 2015, the Company completed one injection well and no further drilling activities are currently planned for 2016.
| 36 | Canadian Natural Resources Limited |
Offshore Africa
Côte d’Ivoire
Côte d’Ivoire
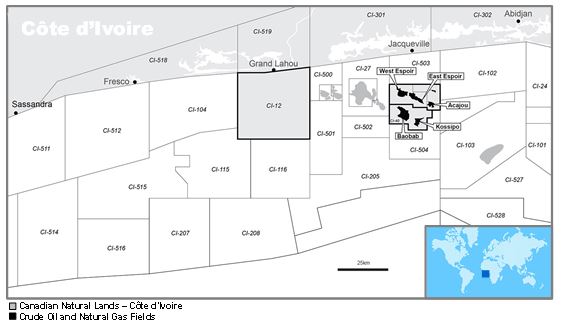
The Company owns interests in three exploration licences offshore Côte d’Ivoire.
The Company has a 58.7% operated interested in the Espoir field in Block CI-26 which is located in water depths ranging from 100 to 700 meters. Production from East Espoir commenced in 2002 and development drilling of West Espoir was completed in 2008. Crude oil from the East and West Espoir fields is produced to an FPSO with the associated natural gas delivered onshore through a subsea pipeline for local power generation. In 2014, the Company contracted a drilling rig for a 10 gross well development program. During 2015, the Company drilled 5 gross producing wells and 1 injector well. In 2016, upon completion of the sixth gross producing well, no additional wells will be drilled in the program.
The Company has a 57.6% operated interest in the Baobab field, located in Block CI-40, which is eight kilometers south of the Espoir facilities. Production from the Baobab field commenced in 2005. During 2015, the Company drilled 5 gross producing wells. In late December, the Baobab field was temporarily shut-in due to a riser failure, delaying first oil on the fifth gross producing well. After inspection of the riser system, production was reinstated in late January 2016. In 2016, upon completion of the sixth gross producing well, no additional wells will be drilled in the program.
In 2012, the Company acquired a 36% non-operated working interest in Block CI-514. During the fourth quarter of 2015, the Company provided notice of its withdrawal from Block CI-514 in Côte d’Ivoire, Offshore Africa.
In 2013, the Company acquired a 60% operated working interest in Block CI-12 which is prospective for deepwater channel/fan structures. The block is located approximately 35 kilometers west of the Company’s current production at Espoir and Baobab. A 3D seismic program has been completed and the data is currently being assessed to determine whether to drill an exploration well.
| Canadian Natural Resources Limited | 37 |
Gabon

The Company has a permit comprising a 92% operating interest in the production sharing agreement for the block containing the Olowi Field. The field is located about 20 kilometers from the Gabonese coast and in 30 meters water depth. First crude oil production was achieved during the second quarter of 2009 at Platform C and during 2010 on Platform A and B. In mid 2011, production was temporarily suspended as a result of a failure in the mid-water arch. Production was reinstated in mid August 2011. During 2012 a second failure of the mid-water arch occurred. The mid-water arch was stabilized and production was reinstated in late Q1 2013. The Company has no further development activities currently planned for 2016.
South Africa
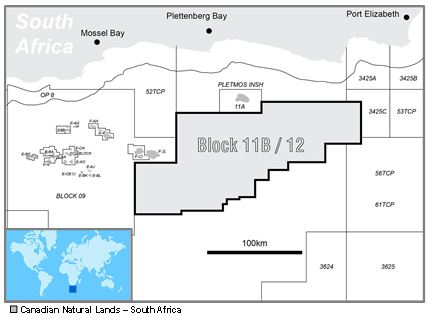
In May 2012 the Company completed the conversion of its 100% owned natural oil prospecting sub-lease in respect of Block 11B/12B off the south east coast of South Africa into an exploration right for petroleum in respect of this area. During 2013, the Company disposed of a 50% interest in its exploration right in South Africa, for net cash consideration of US$255 million. In the event that a commercial crude oil or natural gas discovery occurs on this exploration right, resulting in the exploration right being converted into a production right, an additional cash payment would be due to the Company at such time, amounting to US$450 million for a commercial crude oil discovery and US$120 million for a commercial natural gas discovery. In 2014, the exploration well drilled on Block 11B/12B was suspended due to mechanical issues with marine equipment on the drilling rig. The rig safely left the well location and, as the available drilling window had ended, it was demobilized by the operator. The South African authorities have formally confirmed the well drilled satisfies the work
| 38 | Canadian Natural Resources Limited |
obligation for the initial period of the Block 11B/12B Exploration Right. The operator is reviewing the course of action to re-enter the well, and has indicated drilling operations are unlikely to resume in the area before 2017.
Producing and Non Producing Crude Oil and Natural Gas Wells
Set forth below is a summary of the number of wells in which the Company has a working interest that were producing or mechanically capable of producing as of December 31, 2015.
|
Natural Gas Wells
|
Crude Oil Wells
|
Total Wells
|
||||||||||||||||||||||
|
Producing
|
Gross
|
Net
|
Gross
|
Net
|
Gross
|
Net
|
||||||||||||||||||
|
Canada
|
||||||||||||||||||||||||
|
Alberta
|
27,968.0
|
21,595.6
|
11,167.0
|
9,700.2
|
39,135.0
|
31,295.8
|
||||||||||||||||||
|
British Columbia
|
2,763.0
|
2,200.1
|
313.0
|
269.1
|
3,076.0
|
2,469.2
|
||||||||||||||||||
|
Saskatchewan
|
10,684.0
|
9,675.8
|
3,792.0
|
2,381.6
|
14,476.0
|
12,057.4
|
||||||||||||||||||
|
Manitoba
|
-
|
-
|
210.0
|
203.6
|
210.0
|
203.6
|
||||||||||||||||||
|
Total Canada
|
41,415.0
|
33,471.5
|
15,482.0
|
12,554.5
|
56,897.0
|
46,026.0
|
||||||||||||||||||
|
United States
|
-
|
-
|
2.0
|
0.3
|
2.0
|
0.3
|
||||||||||||||||||
|
North Sea UK Sector
|
2.0
|
1.5
|
72.0
|
62.8
|
74.0
|
64.3
|
||||||||||||||||||
|
Offshore Africa
|
||||||||||||||||||||||||
|
Côte d’Ivoire
|
-
|
-
|
25.0
|
14.6
|
25.0
|
14.6
|
||||||||||||||||||
|
Gabon
|
-
|
-
|
13.0
|
12.0
|
13.0
|
12.0
|
||||||||||||||||||
|
Total
|
41,417.0
|
33,473.0
|
15,594.0
|
12,644.2
|
57,011.0
|
46,117.2
|
||||||||||||||||||
Set forth below is a summary of the number of wells in which the Company has a working interest that were not producing or not mechanically capable of producing as of December 31, 2015.
|
Natural Gas Wells
|
Crude Oil Wells
|
Total Wells
|
||||||||||||||||||||||
|
Non Producing
|
Gross
|
Net
|
Gross
|
Net
|
Gross
|
Net
|
||||||||||||||||||
|
Canada
|
||||||||||||||||||||||||
|
Alberta
|
7,551.0
|
5,990.1
|
7,182.0
|
6,111.2
|
14,733.0
|
12,101.3
|
||||||||||||||||||
|
British Columbia
|
1,878.0
|
1,530.9
|
453.0
|
371.7
|
2,331.0
|
1,902.6
|
||||||||||||||||||
|
Saskatchewan
|
1,760.0
|
1,583.7
|
2,896.0
|
2,211.8
|
4,656.0
|
3,795.5
|
||||||||||||||||||
|
Manitoba
|
2.0
|
2.0
|
27.0
|
24.4
|
29.0
|
26.4
|
||||||||||||||||||
|
Northwest Territories
|
36.0
|
20.8
|
-
|
-
|
36.0
|
20.8
|
||||||||||||||||||
|
Total Canada
|
11,227.0
|
9,127.5
|
10,558.0
|
8,719.1
|
21,785.0
|
17,846.6
|
||||||||||||||||||
|
United States
|
1.0
|
0.1
|
2.0
|
0.3
|
3.0
|
0.4
|
||||||||||||||||||
|
North Sea UK Sector
|
2.0
|
1.5
|
25.0
|
23.3
|
27.0
|
24.8
|
||||||||||||||||||
|
Offshore Africa
|
||||||||||||||||||||||||
|
Côte d’Ivoire
|
-
|
-
|
10.0
|
5.8
|
10.0
|
5.8
|
||||||||||||||||||
|
Gabon
|
-
|
-
|
-
|
-
|
-
|
-
|
||||||||||||||||||
|
Total
|
11,230.0
|
9,129.1
|
10,595.0
|
8,748.5
|
21,825.0
|
17,877.6
|
||||||||||||||||||
| Canadian Natural Resources Limited | 39 |
Properties With Attributed and No Attributed Reserves
The following table summarizes the Company’s landholdings as at December 31, 2015.
|
Proved Properties
|
Unproved Properties
|
Total Acreage
|
Average
Working
Interest
|
|||||||||||||||||||||||||
|
Region (thousands of acres)
|
Gross
|
Net
|
Gross
|
Net
|
Gross
|
Net
|
%
|
|||||||||||||||||||||
|
North America
|
||||||||||||||||||||||||||||
|
Northeast British Columbia
|
1,068
|
881
|
5,043
|
4,240
|
6,111
|
5,121
|
84%
|
|
||||||||||||||||||||
|
Northwest Alberta
|
1,726
|
1,235
|
3,940
|
3,076
|
5,666
|
4,311
|
76%
|
|
||||||||||||||||||||
|
Northern Plains
|
2,051
|
1,712
|
8,230
|
7,262
|
10,281
|
8,974
|
87%
|
|
||||||||||||||||||||
|
Southern Plains
|
2,562
|
2,148
|
3,003
|
2,554
|
5,565
|
4,702
|
85%
|
|
||||||||||||||||||||
|
Southeast Saskatchewan
|
130
|
117
|
126
|
117
|
256
|
234
|
91%
|
|
||||||||||||||||||||
|
Thermal In Situ Oil Sands
|
93
|
91
|
930
|
825
|
1,023
|
916
|
90%
|
|
||||||||||||||||||||
|
Oil Sands Mining & Upgrading
|
24
|
24
|
57
|
57
|
81
|
81
|
100%
|
|
||||||||||||||||||||
|
Non-core Regions
|
8
|
3
|
1,192
|
432
|
1,200
|
435
|
36%
|
|
||||||||||||||||||||
|
Fee Title
|
90
|
83
|
842
|
830
|
932
|
913
|
98%
|
|
||||||||||||||||||||
|
North America Total
|
7,752
|
6,294
|
23,363
|
19,393
|
31,115
|
25,687
|
83%
|
|
||||||||||||||||||||
|
International
|
||||||||||||||||||||||||||||
|
North Sea UK Sector
|
63
|
55
|
101
|
93
|
164
|
148
|
90%
|
|
||||||||||||||||||||
|
Offshore Africa
|
||||||||||||||||||||||||||||
|
Côte d’Ivoire
|
10
|
6
|
360
|
214
|
370
|
220
|
59%
|
|
||||||||||||||||||||
|
Gabon
|
-
|
-
|
152
|
140
|
152
|
140
|
92%
|
|
||||||||||||||||||||
|
South Africa
|
-
|
-
|
4,002
|
2,001
|
4,002
|
2,001
|
50%
|
|
||||||||||||||||||||
|
International Total
|
73
|
61
|
4,615
|
2,448
|
4,688
|
2,509
|
54%
|
|
||||||||||||||||||||
|
Company Total
|
7,825
|
6,355
|
27,978
|
21,841
|
35,803
|
28,196
|
79%
|
|
||||||||||||||||||||
Where the Company holds interests in different formations under the same surface area pursuant to separate leases, the acreage for each lease is included in the gross and net amounts.
Canadian Natural has approximately 0.7 million net acres attributed to our North America properties which are currently expected to expire by December 31, 2016.
| 40 | Canadian Natural Resources Limited |
Significant Factors or Uncertainties Relevant to Properties with No Attributed Reserves
The Company’s unproved property holdings are diverse and located in the North America and International regions. The land assets range from discovery areas where tenure to the property is held indefinitely by hydrocarbon test results or production to exploration areas in the early stages of evaluation. The Company continually reviews the economic viability and ranking of these unproved properties on the basis of product pricing, capital availability and allocation and level of infrastructure development in any specific area. From this process, some properties are scheduled for economic development activities while others are temporarily held inactive, sold, swapped or allowed to expire and relinquished back to the mineral rights owner.
Forward Contracts
In the ordinary course of business, the Company has a number of delivery commitments to provide crude oil and natural gas under existing contracts and agreements. The Company has sufficient crude oil and natural gas reserves to meet these commitments.
2015 Costs Incurred in Crude Oil, Natural Gas and NGLs Activities
|
MM$
|
North America
|
North Sea
|
Offshore Africa
|
Total
|
||||||||||||
|
Property Acquisitions
|
||||||||||||||||
|
Proved
|
(556
|
)
|
-
|
-
|
(556
|
)
|
||||||||||
|
Unproved
|
(446
|
)
|
-
|
-
|
(446
|
)
|
||||||||||
|
Exploration
|
87
|
-
|
35
|
122
|
||||||||||||
|
Development
|
2,845
|
13
|
524
|
3,382
|
||||||||||||
|
1,930
|
13
|
559
|
2,502
|
|||||||||||||
|
Add: Net non-cash and other costs (1)
|
681
|
217
|
49
|
947
|
||||||||||||
|
Costs Incurred
|
2,611
|
230
|
608
|
3,449
|
||||||||||||
| (1) | Non-cash and other costs are comprised primarily of changes in ARO as well as proceeds on disposition of properties in excess of original cost. |
| Canadian Natural Resources Limited | 41 |
Exploration and Development Activities
Set forth below are summaries of crude oil, natural gas and NGLs drilling activities completed by the Company for the fiscal year ended December 31, 2015 by geographic region along with a general discussion of 2016 activity.
|
2015 Exploratory Wells
|
|||||||||||||||||||||||||
|
Crude Oil
|
Natural Gas
|
Dry
|
Service
|
Stratigraphic
|
Total
|
||||||||||||||||||||
|
North America
|
|||||||||||||||||||||||||
|
Northeast British Columbia
|
Gross
|
- | 1.0 | - | - | - | 1.0 | ||||||||||||||||||
|
Net
|
- | 1.0 | - | - | - | 1.0 | |||||||||||||||||||
|
Northwest Alberta
|
Gross
|
- | 5.0 | - | - | - | 5.0 | ||||||||||||||||||
|
Net
|
- | 5.0 | - | - | - | 5.0 | |||||||||||||||||||
|
Northern Plains
|
Gross
|
3.0 | - | - | - | - | 3.0 | ||||||||||||||||||
|
Net
|
3.0 | - | - | - | - | 3.0 | |||||||||||||||||||
|
Southern Plains
|
Gross
|
- | - | - | - | - | - | ||||||||||||||||||
|
Net
|
- | - | - | - | - | - | |||||||||||||||||||
|
Southeast Saskatchewan
|
Gross
|
- | - | - | - | - | - | ||||||||||||||||||
|
Net
|
- | - | - | - | - | - | |||||||||||||||||||
|
Oil Sands Mining and Upgrading
|
Gross
|
- | - | - | - | - | - | ||||||||||||||||||
|
Net
|
- | - | - | - | - | - | |||||||||||||||||||
|
Non-core Regions
|
Gross
|
- | - | - | - | - | - | ||||||||||||||||||
|
Net
|
- | - | - | - | - | - | |||||||||||||||||||
|
North America Total
|
Gross
|
3.0 | 6.0 | - | - | - | 9.0 | ||||||||||||||||||
|
Net
|
3.0 | 6.0 | - | - | - | 9.0 | |||||||||||||||||||
|
North Sea UK Sector
|
Gross
|
- | - | - | - | - | - | ||||||||||||||||||
|
Net
|
- | - | - | - | - | - | |||||||||||||||||||
|
Offshore Africa
|
Gross
|
- | - | - | - | 1.0 | 1.0 | ||||||||||||||||||
|
Net
|
- | - | - | - | 0.4 | 0.4 | |||||||||||||||||||
|
Company Total
|
Gross
|
3.0 | 6.0 | - | - | 1.0 | 10.0 | ||||||||||||||||||
|
Net
|
3.0 | 6.0 | - | - | 0.4 | 9.4 | |||||||||||||||||||
| 42 | Canadian Natural Resources Limited |
|
2015 Development Wells
|
|||||||||||||||||||||||||
|
Crude Oil
|
Natural Gas
|
Dry
|
Service
|
Stratigraphic
|
Total
|
||||||||||||||||||||
|
North America
|
|||||||||||||||||||||||||
|
Northeast British Columbia
|
Gross
|
-
|
2.0
|
-
|
-
|
-
|
2.0
|
||||||||||||||||||
|
Net
|
-
|
2.0
|
-
|
-
|
-
|
2.0
|
|||||||||||||||||||
|
Northwest Alberta
|
Gross
|
4.0
|
18.0
|
-
|
-
|
-
|
22.0
|
||||||||||||||||||
|
Net
|
3.1
|
9.3
|
-
|
-
|
-
|
12.4
|
|||||||||||||||||||
|
Northern Plains
|
Gross
|
108.0
|
6.0
|
6.0
|
26.0
|
52.0
|
198.0
|
||||||||||||||||||
|
Net
|
102.8
|
1.9
|
5.8
|
25.5
|
17.0
|
153.0
|
|||||||||||||||||||
|
Southern Plains
|
Gross
|
-
|
-
|
-
|
-
|
-
|
-
|
||||||||||||||||||
|
Net
|
-
|
-
|
-
|
-
|
-
|
-
|
|||||||||||||||||||
|
Southeast Saskatchewan
|
Gross
|
8.0
|
-
|
-
|
3.0
|
-
|
11.0
|
||||||||||||||||||
|
Net
|
0.3
|
-
|
-
|
-
|
-
|
0.3
|
|||||||||||||||||||
|
Oil Sands Mining and Upgrading
|
Gross
|
-
|
-
|
-
|
31.0
|
91.0
|
122.0
|
||||||||||||||||||
|
|
Net
|
-
|
-
|
-
|
31.0
|
91.0
|
122.0
|
||||||||||||||||||
|
Non-core Regions
|
Gross
|
-
|
-
|
-
|
-
|
-
|
-
|
||||||||||||||||||
|
Net
|
-
|
-
|
-
|
-
|
-
|
-
|
|||||||||||||||||||
|
North America Total
|
Gross
|
120.0
|
26.0
|
6.0
|
60.0
|
143.0
|
355.0
|
||||||||||||||||||
|
Net
|
106.2
|
13.2
|
5.8
|
56.5
|
108.0
|
289.7
|
|||||||||||||||||||
|
North Sea UK Sector
|
Gross
|
-
|
-
|
-
|
1.0
|
-
|
1.0
|
||||||||||||||||||
|
Net
|
-
|
-
|
-
|
0.9
|
-
|
0.9
|
|||||||||||||||||||
|
Offshore Africa
|
Gross
|
10.0
|
-
|
-
|
-
|
1.0
|
11.0
|
||||||||||||||||||
|
Net
|
5.8
|
-
|
-
|
-
|
0.5
|
6.3
|
|||||||||||||||||||
|
Company Total
|
Gross
|
130.0
|
26.0
|
6.0
|
61.0
|
144.0
|
367.0
|
||||||||||||||||||
|
Net
|
112.0
|
13.2
|
5.8
|
57.4
|
108.5
|
296.9
|
|||||||||||||||||||
Total success rate, excluding service and stratigraphic test wells, for 2015 is 96%.
| Canadian Natural Resources Limited | 43 |
2016 North America Activity
The Company maintains capital flexibility to increase or decrease activity in the conventional operations depending on the economic and pricing environment. Capital expenditures for North America are targeted to be approximately $1,085-1,335 million.
2016 Oil Sands Mining and Upgrading Activity
The Company targets to complete Phase 2B in 2016 and continue to progress Phase 3 construction. Overall capital expenditures for Horizon are targeted to be approximately $2,415-2,565 million.
2016 North Sea Activity
No further drilling activities are currently planned for 2016.
2016 Offshore Africa Activity
In 2016, upon completion of the sixth gross producing well at each field, no additional wells will be drilled for either the Espoir or Baobab programs.
Production Estimates
The following table illustrates Canadian Natural’s estimated 2016 company gross daily proved and probable production reflected in the reserve reports as of December 31, 2015 using forecast prices and costs.
|
Light and Medium
Crude Oil
(bbl/d) |
Primary
Heavy
Crude Oil
(bbl/d) |
Pelican Lake Heavy
Crude Oil (bbl/d) |
Bitumen (Thermal Oil)
(bbl/d) |
Synthetic
Crude Oil
(bbl/d)
|
Natural Gas
(MMcf/d) |
Natural Gas
Liquids (bbl/d) |
Barrels of Oil Equivalent
(BOE/d) |
|||||||||||||||||||||||||
|
PROVED
|
||||||||||||||||||||||||||||||||
|
North America
|
41,822
|
101,546
|
49,500
|
121,126
|
116,900
|
1,432
|
39,368
|
708,928
|
||||||||||||||||||||||||
|
North Sea
|
20,587
|
-
|
-
|
-
|
-
|
46
|
-
|
28,254
|
||||||||||||||||||||||||
|
Offshore Africa
|
25,828
|
-
|
-
|
-
|
-
|
27
|
-
|
30,328
|
||||||||||||||||||||||||
|
Total Proved
|
88,237
|
101,546
|
49,500
|
121,126
|
116,900
|
1,505
|
39,368
|
767,510
|
||||||||||||||||||||||||
|
PROBABLE
|
||||||||||||||||||||||||||||||||
|
North America
|
2,442
|
8,870
|
1,747
|
18
|
9,850
|
73
|
1,821
|
36,915
|
||||||||||||||||||||||||
|
North Sea
|
2,060
|
-
|
-
|
-
|
-
|
3
|
-
|
2,560
|
||||||||||||||||||||||||
|
Offshore Africa
|
4,328
|
-
|
-
|
-
|
-
|
3
|
-
|
4,828
|
||||||||||||||||||||||||
|
Total Probable
|
8,830
|
8,870
|
1,747
|
18
|
9,850
|
79
|
1,821
|
44,303
|
||||||||||||||||||||||||
Production History
|
2015
|
||||||||||||||||||||
|
Q1
|
Q2
|
Q3
|
Q4
|
Year Ended
|
||||||||||||||||
|
North America Production and Netbacks by Product Type (1)
|
||||||||||||||||||||
|
Light and Medium Crude Oil
|
||||||||||||||||||||
|
Average daily production
(before royalties) (bbl/d) |
55,382
|
51,454
|
49,599
|
48,773
|
51,279
|
|||||||||||||||
|
Netbacks ($/bbl)
|
||||||||||||||||||||
|
Sales price (2)
|
$
|
50.55
|
$
|
69.64
|
$
|
55.33
|
$
|
50.12
|
$
|
56.39
|
||||||||||
|
Transportation
|
3.56
|
3.72
|
3.42
|
3.44
|
3.54
|
|||||||||||||||
|
Royalties
|
6.30
|
7.29
|
6.56
|
6.90
|
6.75
|
|||||||||||||||
|
Production expenses
|
22.06
|
20.72
|
19.52
|
19.14
|
20.41
|
|||||||||||||||
|
Netback
|
$
|
18.63
|
$
|
37.91
|
$
|
25.83
|
$
|
20.64
|
$
|
25.69
|
||||||||||
|
Primary Heavy Crude Oil
|
||||||||||||||||||||
|
Average daily production
(before royalties) (bbl/d) |
137,687
|
128,781
|
125,662
|
120,269
|
128,046
|
|||||||||||||||
|
Netbacks ($/bbl)
|
||||||||||||||||||||
|
Sales price (2)
|
$
|
37.64
|
$
|
53.85
|
$
|
39.97
|
$
|
31.14
|
$
|
40.71
|
||||||||||
|
Transportation
|
2.99
|
3.03
|
2.98
|
3.01
|
3.00
|
|||||||||||||||
|
Royalties
|
3.32
|
6.05
|
3.22
|
2.86
|
3.86
|
|||||||||||||||
|
Production expenses
|
17.21
|
14.92
|
13.81
|
13.90
|
15.01
|
|||||||||||||||
|
Netback
|
$
|
14.12
|
$
|
29.85
|
$
|
19.96
|
$
|
11.37
|
$
|
18.84
|
||||||||||
|
Pelican Lake Heavy Crude Oil
|
||||||||||||||||||||
|
Average daily production
(before royalties) (bbl/d) |
51,085
|
52,015
|
50,852
|
49,340
|
50,818
|
|||||||||||||||
|
Netbacks ($/bbl)
|
||||||||||||||||||||
|
Sales price (2)
|
$
|
36.21
|
$
|
54.87
|
$
|
39.54
|
$
|
33.25
|
$
|
41.09
|
||||||||||
|
Transportation
|
3.49
|
4.07
|
3.61
|
4.36
|
3.88
|
|||||||||||||||
|
Royalties
|
6.47
|
10.24
|
5.45
|
5.27
|
6.88
|
|||||||||||||||
|
Production expenses
|
8.62
|
6.98
|
6.64
|
6.75
|
7.24
|
|||||||||||||||
|
Netback
|
$
|
17.63
|
$
|
33.58
|
$
|
23.84
|
$
|
16.87
|
$
|
23.09
|
||||||||||
|
Bitumen (Thermal Oil)
|
||||||||||||||||||||
|
Average daily production
(before royalties) (bbl/d) |
146,086
|
105,018
|
133,183
|
135,135
|
129,835
|
|||||||||||||||
|
Netbacks ($/bbl)
|
||||||||||||||||||||
|
Sales price (2)
|
$
|
30.25
|
$
|
44.63
|
$
|
37.46
|
$
|
27.92
|
$
|
34.37
|
||||||||||
|
Transportation
|
1.60
|
2.57
|
2.46
|
2.40
|
2.23
|
|||||||||||||||
|
Royalties
|
3.64
|
6.25
|
4.41
|
2.92
|
4.17
|
|||||||||||||||
|
Production expenses
|
10.64
|
12.18
|
9.74
|
9.59
|
10.43
|
|||||||||||||||
|
Netback
|
$
|
14.37
|
$
|
23.63
|
$
|
20.85
|
$
|
13.01
|
$
|
17.54
|
||||||||||
|
SCO
|
||||||||||||||||||||
|
Average daily production
(before royalties) (bbl/d) (3) |
96,607
|
134,166
|
131,779
|
129,050
|
122,911
|
|||||||||||||||
|
Netbacks ($/bbl)
|
||||||||||||||||||||
|
Sales price (2)
|
$
|
56.75
|
$
|
73.05
|
$
|
60.66
|
$
|
57.49
|
$
|
61.39
|
||||||||||
|
Transportation
|
1.83
|
1.98
|
1.82
|
1.66
|
1.81
|
|||||||||||||||
|
Royalties (4)
|
1.01
|
0.99
|
1.32
|
0.99
|
1.08
|
|||||||||||||||
|
Production expenses (5)
|
29.73
|
29.25
|
27.04
|
28.56
|
28.61
|
|||||||||||||||
|
Netback
|
$
|
24.18
|
$
|
40.83
|
$
|
30.48
|
$
|
26.28
|
$
|
29.89
|
||||||||||
|
Natural Gas
|
||||||||||||||||||||
|
Average daily production
(before royalties) (MMcf/d) |
1,713
|
1,716
|
1,592
|
1,635
|
1,663
|
|||||||||||||||
|
Netbacks ($/Mcf)
|
||||||||||||||||||||
|
Sales price (2)
|
$
|
3.14
|
$
|
2.80
|
$
|
2.99
|
$
|
2.73
|
$
|
2.91
|
||||||||||
|
Transportation
|
0.31
|
0.30
|
0.31
|
0.30
|
0.30
|
|||||||||||||||
|
Royalties
|
0.12
|
0.05
|
0.11
|
0.10
|
0.09
|
|||||||||||||||
|
Production expenses
|
1.38
|
1.28
|
1.25
|
1.17
|
1.27
|
|||||||||||||||
|
Netback
|
$
|
1.33
|
$
|
1.17
|
$
|
1.32
|
$
|
1.16
|
$
|
1.25
|
||||||||||
| Canadian Natural Resources Limited | 45 |
Production History
|
2015
|
||||||||||||||||||||
|
Q1
|
Q2
|
Q3
|
Q4
|
Year Ended
|
||||||||||||||||
|
Natural Gas Liquids
|
||||||||||||||||||||
|
Average daily production
(before royalties) (bbl/d) |
42,179
|
37,772
|
38,596
|
41,491
|
40,004
|
|||||||||||||||
|
Netbacks ($/bbl)
|
||||||||||||||||||||
|
Sales price (2)
|
$
|
23.34
|
$
|
27.51
|
$
|
22.31
|
$
|
20.37
|
$
|
23.30
|
||||||||||
|
Transportation
|
2.02
|
1.88
|
1.33
|
1.06
|
1.57
|
|||||||||||||||
|
Royalties
|
1.70
|
1.49
|
3.44
|
3.16
|
2.46
|
|||||||||||||||
|
Production expenses
|
8.58
|
7.89
|
7.76
|
6.98
|
7.80
|
|||||||||||||||
|
Netback
|
$
|
11.04
|
$
|
16.25
|
$
|
9.78
|
$
|
9.17
|
$
|
11.47
|
||||||||||
|
North Sea Production and Netbacks by Product Type (1)
|
||||||||||||||||||||
|
Light and Medium Crude Oil
|
||||||||||||||||||||
|
Average daily production
(before royalties) (bbl/d) |
23,036
|
20,330
|
22,387
|
23,110
|
22,216
|
|||||||||||||||
|
Netbacks ($/bbl)
|
||||||||||||||||||||
|
Sales price (2)
|
$
|
64.59
|
73.57
|
$
|
62.28
|
$
|
57.50
|
$
|
65.13
|
|||||||||||
|
Transportation
|
1.23
|
0.83
|
0.83
|
1.77
|
1.14
|
|||||||||||||||
|
Royalties
|
0.16
|
0.11
|
0.17
|
0.14
|
0.14
|
|||||||||||||||
|
Production expenses
|
65.23
|
60.61
|
72.69
|
56.97
|
63.67
|
|||||||||||||||
|
Netback
|
$
|
(2.03
|
)
|
$
|
12.02
|
$
|
(11.41
|
)
|
$
|
(1.38
|
)
|
$
|
0.18
|
|||||||
|
Natural Gas
|
||||||||||||||||||||
|
Average daily production
(before royalties) (MMcf/d) |
34
|
38
|
35
|
36
|
36
|
|||||||||||||||
|
Netbacks ($/Mcf)
|
||||||||||||||||||||
|
Sales price (2)
|
$
|
10.18
|
$
|
9.54
|
$
|
9.44
|
$
|
9.53
|
$
|
9.66
|
||||||||||
|
Transportation
|
3.49
|
3.91
|
3.95
|
4.46
|
3.96
|
|||||||||||||||
|
Royalties
|
-
|
-
|
-
|
-
|
-
|
|||||||||||||||
|
Production Expenses
|
3.89
|
6.47
|
3.85
|
3.27
|
4.41
|
|||||||||||||||
|
Netback
|
$
|
2.80
|
$
|
(0.84
|
)
|
$
|
1.64
|
$
|
1.80
|
$
|
1.29
|
|||||||||
|
Offshore Africa Production and Netbacks by Product Type (1)
|
||||||||||||||||||||
|
Light and Medium Crude Oil
|
||||||||||||||||||||
|
Average daily production
(before royalties) (bbl/d) |
13,188
|
17,070
|
21,077
|
24,832
|
19,079
|
|||||||||||||||
|
Netbacks ($/bbl)
|
||||||||||||||||||||
|
Sales price (2)
|
$
|
71.75
|
$
|
74.84
|
$
|
65.31
|
$
|
53.37
|
$
|
63.13
|
||||||||||
|
Transportation
|
-
|
-
|
-
|
-
|
-
|
|||||||||||||||
|
Royalties
|
3.27
|
3.19
|
2.89
|
2.61
|
2.87
|
|||||||||||||||
|
Production expenses
|
15.46
|
43.88
|
40.53
|
26.08
|
33.32
|
|||||||||||||||
|
Netback
|
$
|
53.02
|
$
|
27.77
|
$
|
21.89
|
$
|
24.68
|
$
|
26.94
|
||||||||||
|
Natural Gas
|
||||||||||||||||||||
|
Average daily production
(before royalties) (MMcf/d) |
24
|
25
|
26
|
32
|
27
|
|||||||||||||||
|
Netbacks ($/Mcf)
|
||||||||||||||||||||
|
Sales price (2)
|
$
|
11.70
|
$
|
10.49
|
$
|
9.01
|
$
|
7.63
|
$
|
9.53
|
||||||||||
|
Transportation
|
0.16
|
0.16
|
0.17
|
0.18
|
0.17
|
|||||||||||||||
|
Royalties
|
0.54
|
0.48
|
0.41
|
0.44
|
0.46
|
|||||||||||||||
|
Production expenses
|
2.80
|
1.42
|
1.43
|
1.55
|
1.76
|
|||||||||||||||
|
Netback
|
$
|
8.20
|
$
|
8.43
|
$
|
7.00
|
$
|
5.46
|
$
|
7.14
|
||||||||||
| (1) | Amounts expressed on a per unit basis are based on sales volumes. |
| (2) | Net of blending costs and excluding risk management activities. |
| (3) | 2015 SCO production before royalties excludes 2,122 bbl/d of SCO consumed internally as diesel. |
| (4) | Calculated based on actual bitumen royalties expensed during the year; divided by the corresponding SCO sales volumes. |
| (5) | Adjusted cash production costs on a per unit basis are based on sales volumes excluding turnaround periods. |
| 46 | Canadian Natural Resources Limited |
|
Year Ended December 31
|
|||||||||
|
(MM$, except per common share information)
|
2015
|
2014
|
|||||||
|
Product sales
|
$
|
13,167
|
$
|
21,301
|
|||||
|
Net earnings (loss)
|
$
|
(637
|
)
|
$
|
3,929
|
||||
|
Per common share
|
– basic |
$
|
(0.58
|
)
|
$
|
3.60
|
|||
|
|
– diluted
|
$
|
(0.58
|
)
|
$
|
3.58
|
|||
|
Adjusted net earnings from operations (1)
|
$
|
263
|
$
|
3,811
|
|||||
|
Per common share
|
– basic |
$
|
0.24
|
$
|
3.49
|
||||
|
|
– diluted
|
$
|
0.24
|
$
|
3.47
|
||||
|
Cash flow from operations (1)
|
$
|
5,785
|
$
|
9,587
|
|||||
|
Per common share
|
– basic |
$
|
5.29
|
$
|
8.78
|
||||
|
|
– diluted
|
$
|
5.28
|
$
|
8.74
|
||||
|
Dividends declared per common share
|
$
|
0.92
|
$
|
0.90
|
|||||
|
Total assets
|
$
|
59,275
|
$
|
60,200
|
|||||
|
Total long-term liabilities
|
$
|
27,299
|
$
|
26,167
|
|||||
|
Capital expenditures, net of dispositions
|
$
|
3,853
|
$
|
11,744
|
|||||
| (1) | These non-GAAP measures are reconciled to net earnings as determined in accordance with IFRS in the “Net Earnings (Loss) and Cash Flow from Operations” section of the Company’s MD&A which is incorporated by reference into this document. |
On January 17, 2001 the Board of Directors approved a dividend policy for the payment of regular quarterly dividends. Dividends have been paid on the first day of January, April, July and October of each year since April 2001. The dividend policy of the Company undergoes a periodic review by the Board of Directors and is subject to change at any time depending upon the earnings of the Company, its financial requirements and other factors existing at the time.
The following table shows the aggregate amount of the cash dividends declared per common share of the Company in each of its last three years ended December 31.
|
2015(1)
|
2014
|
2013
|
||||||||||
|
Cash dividends declared per common share
|
$
|
0.92
|
$
|
0.90
|
$
|
0.575
|
||||||
| (1) | On December 31, 2015, the Company paid the dividend it would historically have paid on January 1st of the following year. As a result, the actual dividends paid in 2015 were $1.145 per common share. |
Common Shares
The Company is authorized to issue an unlimited number of common shares, without nominal or par value. Holders of common shares are entitled to one vote per share at a meeting of shareholders of Canadian Natural, to receive such dividends as declared by the Board of Directors on the common shares and to receive pro-rata the remaining property and assets of the Company upon its dissolution or winding-up, subject to any rights having priority over the common shares.
Preferred Shares
The Company has no preferred shares outstanding. The Company is authorized to issue an unlimited number of Preferred Shares issuable in one or more series. The directors of the Company are authorized to fix, before the issue thereof, the number of shares in each series and to determine the designation, rights, privileges, restrictions and conditions attaching to the Preferred Shares of each series.
Credit Ratings
The following information relating to the Company's credit ratings is provided as it relates to the Company's financing costs, liquidity and operations. Specifically, credit ratings affect the Company's ability to obtain short-term and long-term financing and the cost of such financing. A reduction in the current rating on the Company's debt by its rating agencies or a negative
| Canadian Natural Resources Limited | 47 |
change to the Company's ratings outlook could adversely affect the Company's cost of financing and its access to sources of liquidity and capital. In addition, changes to credit ratings may affect the Company's ability to, and the associated costs of, entering into ordinary course derivative or hedging transactions and entering into and maintaining ordinary course contracts with customers and suppliers on acceptable terms.
Credit ratings accorded to the Company’s debt securities are not recommendations to purchase, hold or sell the debt securities inasmuch as such ratings do not comment on the current market price or suitability for a particular investor. Any rating may not remain in effect for any given period of time or may be revised or withdrawn entirely by a rating agency in the future if in its judgment circumstances so warrant, and if any such rating is so revised or withdrawn, the Company is under no obligation to update this AIF.
|
Senior Unsecured
Debt Securities |
Commercial
Paper |
Outlook/Trend(1)
|
|
|
Moody’s Investors Service, Inc. (“Moody’s”) (2)
|
Baa3
|
P-3
|
Negative
|
|
Standard & Poor’s Rating Services (“S&P”)
|
BBB+
|
A-2
|
Stable
|
|
DBRS Limited (“DBRS”) (2)
|
BBB (high)
|
-
|
Negative
|
| (1) | Moody’s and S&P assign a rating outlook to Canadian Natural and not to individual long-term debt instruments. |
| (2) | The above rating and outlook of Moody’s reflect changes made in February 2016 and the outlook of DBRS reflects a change made in January 2016. |
Credit ratings are intended to provide investors with an independent measure of credit quality of any issue of securities.
Moody’s credit ratings are on a long-term debt rating scale that ranges from Aaa to C, which represents the range from highest to lowest quality of such securities rated. A rating of Baa by Moody’s is within the fourth highest of nine categories and is assigned to obligations that are judged to be medium-grade and are subject to moderate credit risk. Such securities may possess certain speculative characteristics. Moody’s applies numerical modifiers 1, 2 and 3 to each generic rating classification from Aa through Caa in its corporate bond rating system. The modifier 1 indicates that the issue ranks in the higher end of its generic rating category; the modifier 2 indicates a mid-range ranking; and the modifier 3 indicates that the issue ranks in the lower end of its generic rating category. A Moody’s rating outlook is an opinion regarding the likely rating direction over the medium term. A negative, positive or developing outlook indicates a higher likelihood of a rating change over the medium term. Moody’s credit ratings on commercial paper are on a short-term debt rating scale that ranges from P-1 to NP, representing the range of such securities rated from highest to lowest quality. A rating of P-3 by Moody’s is the third highest of four categories and indicates an acceptable ability to repay short-term obligations.
S&P’s credit ratings are on a long-term debt rating scale that ranges from AAA to D, which represents the range from highest to lowest quality of such securities rated. According to the S&P rating system, debt securities rated BBB exhibit adequate protection parameters. However, adverse economic conditions or changing circumstances are more likely to lead to a weakened capacity of the obligor to meet its financial commitments on the obligation. The ratings from AA to CCC may be modified by the addition of a plus (+) or minus (-) sign to show relative standing within the major rating categories. An S&P rating outlook assesses the potential direction of a long-term credit rating over the intermediate term typically six months to two years. A “Stable” outlook indicates that a rating is not likely to change during that time period. In determining a rating outlook, consideration is given to any changes in the economic and/or fundamental business conditions. S&P credit ratings on commercial paper are on a short-term debt rating scale that ranges from A-1 to D, representing the range of such securities rated from highest to lowest quality. A rating of A-2 by S&P is the second highest of seven categories and indicates that the obligor is somewhat more susceptible to the adverse effects of changes in circumstances and economic conditions than obligations in the highest rating category, but the obligor’s capacity to meet its financial commitment on these obligations is satisfactory.
DBRS’ credit ratings are on a long-term debt rating scale that ranges from AAA to D, which represents the range from highest to lowest quality of such securities rated. According to the DBRS rating system, debt securities rated BBB are of adequate credit quality. The capacity for the payment of financial obligations is considered acceptable, though may be vulnerable to future events. All rating categories other than AAA and D also contain subcategories “(high)” and “(low)” which indicate the relative standing within such rating category. The rating trend is DBRS’ opinion regarding the outlook for the rating in question, with rating trends falling into one of three categories – “Positive”, “Stable”, or “Negative. The rating trend indicates the direction in which DBRS considers the rating may move if present circumstances continue, or in certain cases, unless challenges are addressed.
Canadian Natural has made payments to Moody’s, S&P and DBRS in connection with the assignment of ratings to our long-term and short-term debt and will make payments to Moody’s, S&P and DBRS in connection with the confirmation of such
| 48 | Canadian Natural Resources Limited |
ratings for purposes of the offering of debt securities from time to time. Canadian Natural has made payments to an affiliate of Moody’s in the last 2 years for subscription to use its online credit analytical tools.
The Company’s common shares are listed and posted for trading on Toronto Stock Exchange (“TSX”) and the New York Stock Exchange (“NYSE”) under the symbol CNQ. Set forth below is the trading activity of the Company’s common shares on the TSX in 2015.
|
2015 Monthly Historical Trading on TSX
|
||||||||||||||||
|
Month
|
High
|
Low
|
Close
|
Volume Traded
|
||||||||||||
|
January
|
$
|
37.24
|
$
|
31.20
|
$
|
36.84
|
76,468,663
|
|||||||||
|
February
|
$
|
40.80
|
$
|
36.36
|
$
|
36.36
|
50,169,720
|
|||||||||
|
March
|
$
|
39.51
|
$
|
35.37
|
$
|
38.82
|
61,417,637
|
|||||||||
|
April
|
$
|
42.46
|
$
|
38.70
|
$
|
40.09
|
44,459,484
|
|||||||||
|
May
|
$
|
40.38
|
$
|
37.30
|
$
|
38.38
|
42,261,245
|
|||||||||
|
June
|
$
|
38.78
|
$
|
33.61
|
$
|
33.90
|
49,860,822
|
|||||||||
|
July
|
$
|
34.01
|
$
|
29.95
|
$
|
31.92
|
53,981,483
|
|||||||||
|
August
|
$
|
33.57
|
$
|
25.01
|
$
|
29.65
|
68,168,213
|
|||||||||
|
September
|
$
|
29.38
|
$
|
25.47
|
$
|
25.99
|
71,185,316
|
|||||||||
|
October
|
$
|
32.69
|
$
|
25.32
|
$
|
30.32
|
89,804,865
|
|||||||||
|
November
|
$
|
34.51
|
$
|
29.91
|
$
|
32.34
|
60,772,620
|
|||||||||
|
December
|
$
|
32.57
|
$
|
27.71
|
$
|
30.22
|
59,483,109
|
|||||||||
During 2015, the Company did not purchase common shares under its previously filed Normal Course Issuer Bid.
| Canadian Natural Resources Limited | 49 |
The names, municipalities of residence, offices held with the Company and principal occupations of the Directors and Officers of the Company for the 5 preceding years, are set forth below. Further detail on the Directors and Named Executive Officers are found in the Company’s Information Circular dated March 16, 2016 incorporated herein by reference.
|
Name
|
Position Presently Held
|
Principal Occupation During Past 5 Years
|
|
Catherine M. Best, FCA, ICD.D
Calgary, Alberta
Canada
|
Director (1)(2)
(age 62)
|
Corporate director. She has served continuously as a director of the Company since November 2003 and is currently serving on the board of directors of Superior Plus Corporation, Aston Hill Financial Inc., Badger Daylighting Ltd. and AltaGas Ltd. She is also a member of the Board of the Alberta Children’s Hospital Foundation, The Calgary Foundation, The Wawanesa Mutual Insurance Company and serves as a volunteer member of the Audit Committee of the Calgary Stampede.
|
|
N. Murray Edwards, O.C.
London, United Kingdom
|
Executive Chairman and
Director (5) (age 56)
|
Corporate director and investor. He has served continuously as a director of the Company since September 1988. Prior to December 2015, he was President of Edco Financial Holdings Ltd. (private management and consulting company). Currently, he is Chairman and serving on the board of directors of Ensign Energy Services Inc. and Magellan Aerospace Corporation.
|
|
Timothy W. Faithfull
London, United Kingdom
|
Director (1)(3)
(age 71)
|
Corporate director. He has served continuously as a director of the Company since November 2010. He is Chairman of the Starehe Endowment Fund in the UK and sits as a Council Member of the Canada – UK Colloquia. He is currently serving on the board of directors of TransAlta Corporation, ICE Futures Europe, and LIFFE Administration and Management.
|
|
Honourable Gary A. Filmon,
P.C., O.C., O.M.
Winnipeg, Manitoba
Canada
|
Director (1)(4)
(age 73)
|
Corporate director. He has served continuously as a director of the Company since February 2006 and is currently serving on the board of directors of Arctic Glacier Income Trust, and Exchange Income Corporation.
|
|
Christopher L. Fong
Calgary, Alberta
Canada
|
Director (3)(5)
(age 66)
|
Corporate director. He has served continuously as a director of the Company since November 2010. He was appointed Advisor to the Alberta’s Department of Energy’s Competitive Review process in 2009. He is currently serving on the board of directors of Anderson Energy Inc., Computer Modelling Group Ltd. and sits on the Petroleum Advisory Committee of the Alberta Securities Commission.
|
|
Ambassador Gordon D. Giffin
Atlanta, Georgia
U.S.A
|
Director (1)(4)
(age 66)
|
Partner, Dentons US LLP (law firm); prior thereto Senior Partner, McKenna Long & Aldridge LLP (law firm) from May 2001 until its merger with Dentons in 2015. He has served continuously as a director of the Company since May 2002. Currently serving on the board of directors of Canadian National Railway Company, Canadian Imperial Bank of Commerce, Element Financial Corporation, and TransAlta Corporation.
|
| 50 | Canadian Natural Resources Limited |
|
Name
|
Position Presently Held
|
Principal Occupation During Past 5 Years
|
|
Wilfred A. Gobert
Calgary, Alberta
Canada
|
Director (2)(4)(5)
(age 68)
|
Independent businessman. He has served continuously as a director since November 2010. He is currently serving on the board of directors of Gluskin Sheff & Associates and Trilogy Energy Corp.
|
|
Steve W. Laut
Calgary, Alberta
Canada
|
President and Director (3)
(age 58)
|
Officer of the Company. He has served continuously as a director of the Company since August 2006.
|
|
Honourable Frank J. McKenna,
P.C., O.C., O.N.B., Q.C.
Cap Pelé, New Brunswick
Canada
|
Director (2)(4)
(age 68)
|
Deputy Chair, TD Bank Group. He has served continuously as a director of the Company since August 2006. Currently serving on the board of directors of Brookfield Asset Management Inc.
|
|
David A. Tuer
Calgary, Alberta
Canada
|
Director (1)(5)
(age 66)
|
Chairman, Optiom Inc. (private insurance company); prior thereto, from 2010 to 2015, the Vice-Chairman and Chief Executive Officer of Teine Energy Ltd. (private oil and gas exploration company) and served as Vice-Chairman and Chief Executive Officer of Marble Point Energy Ltd. the predecessor to Teine Energy Ltd. from 2008 to 2010. Prior thereto he was Chairman, Calgary Health Region from 2001 to 2008. He has served continuously as a director of the Company since May 2002.
|
|
Annette M. Verschuren, O.C.
Toronto, Ontario
Canada
|
Director(2)(3)
(age 59)
|
Ms. A. M. Verschuren is the Chair and Chief Executive Officer of NRStor Inc., an energy storage project developer of energy storage technologies. She has served as a director of the Corporation since November 2014. She was President of The Home Depot Canada from 1996 to 2011 where she oversaw the company's successful growth in Canada leading to its entry into China. She currently serves as Chancellor of Cape Breton University and as a director of Liberty Mutual Insurance Group and a board member of numerous non-profit organizations. Currently serving on the board of directors of Air Canada and Saputo Inc.
|
|
Troy J.P. Anderson
Calgary, Alberta
Canada
|
Vice-President,
West Conventional Operations
(age 37)
|
Officer of the Company since January 2015; prior thereto UK1 Production Manager from March 2009 to July 2011, Production Manager from July 2011 to October 2013 and most recently Northern Operations Manager from October 2013 to January 2015.
|
|
Jeffrey J. Bergeson
Calgary, Alberta
Canada
|
Vice-President,
Exploitation West (age 59)
|
Officer of the Company.
|
| Canadian Natural Resources Limited | 51 |
|
Name
|
Position Presently Held
|
Principal Occupation During Past 5 Years
|
|
Corey B. Bieber
Calgary, Alberta
Canada
|
Chief Financial Officer and Senior
Vice-President,
Finance (age 52)
|
Officer of the Company.
|
|
Bryan C. Bradley
Calgary, Alberta
Canada
|
Vice-President,
Marketing (age 50)
|
Officer of the Company since November 2011; prior thereto Manager Crude Oil Marketing from November 2006 to November 2011.
|
|
Trevor J. Cassidy
Calgary, Alberta
Canada
|
Vice-President, Production
Central
(age 42)
|
Officer of the Company since August 2014; prior thereto Production Manager from April 2005 to August 2014.
|
|
Mark Chalmers
Calgary, Alberta
Canada
|
Vice-President, Exploration
Central
(age 56)
|
Officer of the Company since January 2015; prior thereto Exploration Manager, British Columbia North from December 2006 to September 2010 and most recently Exploration Manager, Northern Plains from September 2010 to January 2015.
|
|
William R. Clapperton
Calgary, Alberta
Canada
|
Vice-President,
Regulatory, Stakeholder and Environmental Affairs
(age 53)
|
Officer of the Company.
|
|
James F. Corson
Calgary, Alberta
Canada
|
Vice-President,
Human Resources (age 65)
|
Officer of the Company.
|
|
Réal M. Cusson
Calgary, Alberta
Canada
|
Senior Vice-President,
Marketing (age 65)
|
Officer of the Company.
|
|
Réal J. H. Doucet
Calgary, Alberta
Canada
|
Senior Vice-President,
Horizon Projects (age 63)
|
Officer of the Company.
|
|
Darren M. Fichter
Calgary, Alberta
Canada
|
Senior Vice-President,
Exploitation (age 45)
|
Officer of the Company since January 2012; prior thereto Manager, Heavy Oil South April 2004 to June 2009 and most recently Vice-President, Exploitation of CNR International (U.K.) Limited, a wholly owned subsidiary of the Company, from June 2009 to January 2012.
|
|
Allan E. Frankiw
Calgary, Alberta
Canada
|
Vice-President,
Production, East (age 59)
|
Officer of the Company.
|
|
Jay E. Froc
Calgary, Alberta
Canada
|
Vice-President, Horizon
Infrastructure, Logistics
and Project Controls
(age 50)
|
Officer of the Company since June 2013. Most recently held various positions with Suncor Energy Inc. since 2006.
|
| 52 | Canadian Natural Resources Limited |
|
Name
|
Position Presently Held
|
Principal Occupation During Past 5 Years
|
|
Christopher I. Grayston
Calgary, Alberta
Canada
|
Vice-President,
Finance and E&P Accounting
(age 56)
|
Officer of the Company since May 2015; prior thereto Assistant Controller, Operations Accounting from November 2010 to March 2014 and most recently Controller, Operations Accounting from March 2014 to May 2015.
|
|
Dean W. Halewich
Calgary, Alberta
Canada
|
Vice-President,
Facilities and Pipelines (age 48)
|
Officer of the Company since September 2011; prior thereto Manager, Facilities Engineering from February 2002 to May 2011 and most recently Manager, Thermal Projects from May 2011 to September 2011.
|
|
Jon Halford
Calgary, Alberta
Canada
|
Vice-President,
Commercial Operations
(age 42)
|
Officer of the Company since January 2015; prior thereto Manager, Materials and Contracts from June 2010 to November 2010 and most recently Director, Supply Management – Major Projects.
|
|
Murray G. Harris
Calgary, Alberta
Canada
|
Vice-President,
Financial Controller and Horizon Accounting
(age 52)
|
Officer of the Company since March 2012; prior thereto Financial Controller from June 2005 to March 2012.
|
|
David B. Holt
Calgary, Alberta
Canada
|
Vice-President,
Production, West (age 50)
|
Officer of the Company since September 2011; prior thereto Production Manager, Heavy Oil North from January 2003 to September 2011.
|
|
John A. Howard
Calgary, Alberta
Canada
|
Vice-President,
Thermal Production Primrose
(age 57)
|
Officer of the Company since September 2011; prior thereto Project Manager, Bitumen Upgrading from May 2006 to May 2007; Manager, Deep Basin Production from May 2007 to October 2009 and most recently Manager, SAGD Production from October 2009 to September 2011.
|
|
Gerard Iannattone
Calgary, Alberta
Canada
|
Vice-President,
Thermal Exploitation Athabasca
(age 56)
|
Officer of the Company since March 2014; prior thereto Exploitation Manager, N. E. British Columbia from November 2006 to March 2014.
|
|
Terry J. Jocksch
Calgary, Alberta
Canada
|
Senior Vice-President,
Thermal (age 48)
|
Officer of the Company.
|
|
Philip A. Keele
Calgary, Alberta
Canada
|
Vice-President,
Mining (age 56)
|
Officer of the Company.
|
|
Kevin B. Kowbel
Calgary, Alberta
Canada
|
Vice-President,
Drilling and Completions (age 45)
|
Officer of the Company since January 2012; prior thereto Drilling Manager from April 2006 to January 2012.
|
| Canadian Natural Resources Limited | 53 |
|
Name
|
Position Presently Held
|
Principal Occupation During Past 5 Years
|
|
Trevor D. Krause
Calgary, Alberta
Canada
|
Vice-President,
Exploration, East
(age 44)
|
Officer of the Company since January 2015; prior thereto Exploration Manager, N. E. Alberta from April 2007 to July 2011 and most recently Exploration Manager, Heavy Oil South from July 2011 to January 2015.
|
|
Dan H. Krentz
Calgary, Alberta
Canada
|
Vice-President,
Exploration, West
(age 57)
|
Officer of the Company since March 2014; prior thereto Exploration Manager, Foothills from November 2006 to April 2011 and most recently Exploration Manager, Deep Basin from April 2011 to March 2014.
|
|
Ronald K. Laing
Calgary, Alberta
Canada
|
Senior Vice-President,
Corporate Development and Land
(age 46)
|
Officer of the Company.
|
|
Raul Lanfranchi
Calgary, Alberta
Canada
|
Vice-President, Horizon
Downstream Projects
(age 58)
|
Officer of the Company since February 2016; prior thereto Project Manager, Horizon from July 2006 to March 2013, Project Director, Horizon Downstream from April 2013 to January 2016.
|
|
Pamela A. McIntyre
Calgary, Alberta
Canada
|
Vice-President,
Safety and Asset Integrity (age 53)
|
Officer of the Company since May 2011; prior thereto Project Integration Manager from July 2007 to January 2011 and most recently Manager, Special Projects Assets from January 2011 to May 2011.
|
|
Tim S. McKay
Calgary, Alberta
Canada
|
Chief Operating Officer
(age 54)
|
Officer of the Company.
|
|
Casey D. McWhan
Calgary, Alberta
Canada
|
Vice-President, Horizon
Bitumen Production (age 53)
|
Officer of the Company since November 2011; prior thereto President, Modec du Brasil from January 2006 to September 2008; Senior Vice-President, Prosafe Production from September 2008 to January 2010 and most recently Continuous Process Improvement Lead with the Company from April 2010 to November 2011.
|
|
Kevin Melnyk
Calgary, Alberta
Canada
|
Vice-President, Horizon
Upgrading and Utilities
(age 49)
|
Officer of the Company since November 2015; prior thereto Agrium Plant Manager, Fort Saskatchewan Nitrogen Operations 2009 to 2012, Redwater Nitrogen Operations 2012-2015 and most recently Director, Utilities and Upgrading from January 2015 to October 2015.
|
|
Paul M. Mendes
Calgary, Alberta
Canada
|
Vice-President,
Legal, General Counsel and Corporate Secretary
(age 50)
|
Officer of the Company.
|
|
S. John Parr
Calgary, Alberta
Canada
|
Vice-President,
Thermal Projects (age 55)
|
Officer of the Company.
|
| 54 | Canadian Natural Resources Limited |
|
Name
|
Position Presently Held
|
Principal Occupation During Past 5 Years
|
|
David A. Payne
Calgary, Alberta
Canada
|
Vice-President,
Exploitation, Central (age 54)
|
Officer of the Company.
|
|
William R. Peterson
Calgary, Alberta
Canada
|
Senior Vice-President,
Production and Development Operations
(age 49)
|
Officer of the Company.
|
|
Andrew Richardson
Calgary, Alberta
Canada
|
Vice-President,
Thermal Production
Athabasca
(age 48)
|
Officer of the Company since March 2014; prior thereto Manager Production Engineering, Long Lake with Nexen Inc. from August 2006 to January 2012, Manager CSS Production with the Company from January 2012 to November 12, 2012 and most recently Manager, Wolf Lake and Production Development from December 2012 to March 2014.
|
|
Joy P. Romero
Calgary, Alberta
Canada
|
Vice-President,
Technology Development (age 59)
|
Officer of the Company.
|
|
Sheldon L. Schroeder
Fort McMurray, Alberta
Canada
|
Vice-President,
Horizon Upstream Projects (age 48)
|
Officer of the Company.
|
|
Kara Slemko
Calgary, Alberta
Canada
|
Vice-President,
Supply Management
(age 46)
|
Officer of the Company since January 2015; prior thereto Director Operations with Canadian National Railway from February 2003 to February 2011, Management Consultant with Ernst & Young LLP from March 2011 to September 2012 and most recently Director, Supply Management, Operations with the Corporation from September 2012 to January 2015.
|
|
Kendall W. Stagg
Calgary, Alberta
Canada
|
Senior Vice-President,
Exploration (age 54)
|
Officer of the Company.
|
|
Scott G. Stauth
Calgary, Alberta
Canada
|
Senior Vice-President,
North American Operations (age 50)
|
Officer of the Company.
|
|
Lyle G. Stevens
Calgary, Alberta
Canada
|
Executive Vice-President,
Canadian Conventional (age 61)
|
Officer of the Company.
|
|
Stephen C. Suche
Calgary, Alberta
Canada
|
Vice-President,
Information and Corporate Services (age 56)
|
Officer of the Company.
|
| Canadian Natural Resources Limited | 55 |
|
Name
|
Position Presently Held
|
Principal Occupation During Past 5 Years
|
|
Domenic Torriero
Calgary, Alberta
Canada
|
Vice-President,
Thermal Exploration (age 51)
|
Officer of the Company.
|
|
Gregory A. Ulrich
Calgary, Alberta
Canada
|
Vice-President, Thermal
And East Conventional
Field Operations
(age 53)
|
Officer of the Company since March 2014; prior thereto Field Operations Manager from November 2006 to March 2014.
|
|
Betty Yee
Calgary, Alberta
Canada
|
Vice-President,
Land
(age 51)
|
Officer of the Company since June 2013. Most recently was Manager of Acquisition and Divestments of the Company since 2003.
|
|
Daryl G. Youck
Calgary, Alberta
Canada
|
Vice-President,
Thermal Exploitation Primrose
(age 47)
|
Officer of the Company.
|
|
Robin S. Zabek
Calgary, Alberta
Canada
|
Vice-President,
Exploitation East
(age 44)
|
Officer of the Company since March 2014; prior thereto Manager Exploitation from September 2006 to March 2014.
|
| (1) | Member of the Audit Committee. |
| (2) | Member of the Compensation Committee. |
| (3) | Member of the Health, Safety, Asset Integrity and Environmental Committee. |
| (4) | Member of the Nominating, Governance and Risk Committee. |
| (5) | Member of the Reserves Committee. |
All directors stand for election at each Annual General Meeting of Canadian Natural shareholders. All of the current directors were elected to the Board at the last Annual General Meeting of Shareholders held on May 7, 2015.
As at December 31, 2015, the directors and executive officers of the Company, as a group, beneficially owned or controlled or directed, directly or indirectly, in the aggregate, approximately 3% of the total outstanding common shares (approximately 4% after the exercise of options held by them pursuant to the Company’s stock option plan).
There are potential conflicts of interest to which the directors and officers of the Company may become subject in connection with the operations of the Company. Some of the directors and officers have been and will continue to be engaged in the identification and evaluation of businesses and assets with a view to potential acquisition of interests on their own behalf and on behalf of other corporations. Situations may arise where the directors and officers will be in direct competition with the Company. Conflicts, if any, will be subject to the procedures and remedies under the Business Corporations Act (Alberta).
From time to time, Canadian Natural is the subject of litigation arising out of the Company’s normal course of operations. Damages claimed under such litigation may be material and the outcome of such litigation may materially impact the Company’s financial condition or results of operations. While the Company assesses the merits of each lawsuit and defends itself accordingly, the Company may be required to incur significant expenses or devote significant resources to defend itself against such litigation. The claims that have been made to date are not currently expected to have a material impact on the Company’s financial position.
No director, executive officer or principal shareholder of Canadian Natural, or associate or affiliate of those persons, has any material interest, direct or indirect, in any transaction within the last three years that has materially affected or is reasonably expected to materially affect the Company.
| 56 | Canadian Natural Resources Limited |
The Company’s transfer agent and registrar for its common shares is Computershare Trust Company of Canada in the cities of Calgary and Toronto and Computershare Investor Services LLC in the city of New York. The registers for transfers of the Company’s common shares are maintained by Computershare Trust Company of Canada.
Other than contracts entered into in the ordinary course of business, the Company has not entered into any material contracts in the most recently completed financial year nor has it entered into any material contracts before the most recently completed financial year and which are still in effect.
The Company’s auditors, PricewaterhouseCoopers LLP, have prepared an independent auditors’ report dated March 2, 2016 in respect of the Company’s consolidated balance sheets as at December 31, 2015 and December 31, 2014, the consolidated statements of earnings (loss), comprehensive income (loss), changes in equity and cash flows for each of the three years in the period ended December 31, 2015 and the Company’s internal control over financial reporting as at December 31, 2015. PricewaterhouseCoopers LLP has advised that they are independent with respect to the Company within the meaning of the Rules of Professional Conduct of the Institute of Chartered Professional Accountants of Alberta and the rules of the SEC.
Based on information provided by the relevant persons or companies, there are beneficial interests, direct or indirect, in less than 1% of the Company’s securities or property or securities or property of our associates or affiliates held by Sproule Associates Limited, Sproule International Limited or GLJ Petroleum Consultants Ltd., or any partners, employees or consultants of such independent reserves evaluators who participated in and who were in a position to directly influence the preparation of the relevant report, or any such person who, at the time of the preparation of the report was in a position to directly influence the outcome of the preparation of the report.
Audit Committee Members
The Audit Committee of the Board of Directors of the Company is comprised of Ms. C. M. Best, Chair, Messrs. T.W. Faithfull, G. A. Filmon, G. D. Giffin and D. A. Tuer, each of whom is independent and financially literate as those terms are defined under Canadian securities regulations, National Instrument 52-110 and the NYSE listing standards as they pertain to audit committees of listed issuers. All of the members of the Corporation’s Audit Committee are financially literate. The education and experience of each member of the Audit Committee relevant to their responsibilities as an Audit Committee member is described below.
Ms. C. M. Best is a chartered accountant with over 20 years experience as a staff member and partner of an international public accounting firm. During her tenure, she was responsible for direct oversight and supervision of a large staff of auditors conducting audits of the financial reporting of significant publicly traded entities, many of which were oil and gas companies. This oversight and supervision required Ms. C. M. Best to maintain a current understanding of generally accepted accounting principles, and be able to assess their application in each of her clients. It also required an understanding of internal controls and financial reporting processes and procedures. Ms. C. M. Best, who is chair of the Audit Committee, qualifies as an “audit committee financial expert” under the rules issued by the SEC pursuant to the requirements of the Sarbanes Oxley Act of 2002.
Mr. T. W. Faithfull holds a Master of Arts degree from the University of Oxford (Philosophy, Politics and Economics), and is an alumnus of the London Business School. As Chief Executive Officer of Shell Canada Limited and in his other capacities during his 36 years with the Royal Dutch/Shell group of companies, together with his experience as an audit committee member of other publicly traded companies, he has acquired significant financial experience and exposure to complex accounting and financial issues and an understanding of audit committee functions.
Honourable G. A. Filmon holds both a Bachelor of Science degree and a Master of Science degree in Civil Engineering. He was Premier of the Province of Manitoba for several years and during that time chaired the Treasury Board for a period of five years. He was President of Success Commercial College for 11 years and is currently a business management consultant. Mr. G. A. Filmon is a director of other public companies and is an active member of other audit committees.
Ambassador G. D. Giffin’s education and experience relevant to the performance of his responsibilities as an audit committee member is derived from a law practice of over thirty years, involving complex accounting and audit-related issues associated
| Canadian Natural Resources Limited | 57 |
with complicated commercial transactions and disputes. He has developed extensive practical experience and an understanding of internal controls and procedures for financial reporting from his service on audit committees for several publicly traded issuers and continues pursuit of extensive professional reading and study on related subjects.
Mr. D. A. Tuer's education and experience relevant to the performance of his responsibilities as an audit committee member is derived from professional training and a business career as a chief executive officer in a large publicly traded company which provided experience in analyzing and evaluating financial statements and supervising persons engaged in the preparation, analysis and evaluation of financial statements of publicly traded companies. He has gained an understanding of internal controls and procedures for financial reporting through oversight of those functions, and the understanding of audit committee functions through his years of chief executive involvement.
Auditor Service Fees
The Audit Committee of the Board of Directors in 2015 approved specified audit and non-audit services to be performed by PricewaterhouseCoopers LLP (“PwC”). The services provided include: (i) the annual audit of the Company's consolidated financial statements and internal controls over financial reporting, reviews of the Company's quarterly unaudited consolidated financial statements, audits of certain of the Company's subsidiary companies' annual financial statements as well as other audit services provided in connection with statutory and regulatory filings; (ii) audit related services including pension assets and Crown Royalty Statements; (iii) tax services related to expatriate personal tax and compliance and other corporate tax return matters; and (iv) non-audit services related to expatriate visa application assistance and to accessing resource materials through PwC’s accounting literature library. Fees accrued to PwC are shown in the table below.
|
Auditor service (000’s)
|
2015
|
2014
|
||||||
|
Audit fees
|
$
|
3,012
|
$
|
3,047
|
||||
|
Audit related fees
|
250
|
259
|
||||||
|
Tax fees
|
495
|
523
|
||||||
|
All other fees
|
84
|
87
|
||||||
|
$
|
3,841
|
$
|
3,916
|
|||||
The Charter of the Audit Committee of the Company is attached as Schedule “C” to this AIF.
Additional information relating to the Company can be found on the SEDAR website at www.sedar.com and on EDGAR at www.sec.gov.
Additional information including Directors' and Executive Officers' remuneration and indebtedness, Director nominees standing for re-election, principal holders of the Company's securities, options to purchase the Company's securities and interest of insiders in material transactions is contained in the Company's Notice of Annual and Special Meeting and Information Circular dated March 16, 2016 in connection with the Annual and Special Meeting of Shareholders of Canadian Natural to be held on May 5, 2016 which information is incorporated herein by reference. Additional financial information and discussion of the affairs of the Company and the business environment in which the Company operates is provided in the Company's Management’s Discussion and Analysis, comparative Consolidated Financial Statements and Supplementary Oil & Gas Information for the most recently completed fiscal year ended December 31, 2015 found on pages 20 to 53, 54 to 91 and 92 to 99 respectively, of the 2015 Annual Report to the Shareholders, which information is incorporated herein by reference.
For additional copies of this Annual Information Form, please contact:
Corporate Secretary of the Corporation at:
2100, 855 - 2nd Street S.W.
Calgary, Alberta T2P 4J8
2100, 855 - 2nd Street S.W.
Calgary, Alberta T2P 4J8
| 58 | Canadian Natural Resources Limited |
FORM 51-101F2
REPORT ON RESERVES DATA BY
INDEPENDENT QUALIFIED RESERVES EVALUATOR OR AUDITOR
INDEPENDENT QUALIFIED RESERVES EVALUATOR OR AUDITOR
Report on Reserves Data
To the Board of Directors of Canadian Natural Resources Limited (the “Company”):
| 1. | We have evaluated and reviewed the Company’s reserves data as at December 31, 2015. The reserves data are estimates of proved reserves and probable reserves and related future net revenue as at December 31, 2015, estimated using forecast prices and costs. |
| 2. | The reserves data are the responsibility of the Company’s management. Our responsibility is to express an opinion on the reserves data based on our evaluation and review. |
| 3. | We carried out our evaluation and review in accordance with standards set out in the Canadian Oil and Gas Evaluation Handbook as amended from time to time (the “COGE Handbook”) maintained by the Society of Petroleum Evaluation Engineers (Calgary Chapter). |
| 4. | Those standards require that we plan and perform an evaluation and review to obtain reasonable assurance as to whether the reserves data are free of material misstatement. An evaluation and review also includes assessing whether the reserves data are in accordance with principles and definitions presented in the COGE Handbook. |
| 5. | The following table shows the net present value of future net revenue (before deduction of income taxes) attributed to proved plus probable reserves, estimated using forecast prices and costs and calculated using a discount rate of 10 percent, included in the reserves data of the Company evaluated and reviewed for the year ended December 31, 2015, and identifies the respective portions thereof that we have evaluated and reviewed and reported on to the Company’s management and board of directors: |
|
Net Present Value of Future Net Revenue
(Before Income Taxes, 10% Discount Rate)
($ millions)
|
||||||||||||||||||||
|
Independent
Qualified Reserves
Evaluator or
Auditor
|
Effective Date of Evaluation/Review
Report
|
Location of
Reserves
(Country or Foreign
Geographic Area)
|
Audited
|
Evaluated
|
Reviewed
|
Total
|
||||||||||||||
|
Sproule Associates Limited
|
December 31, 2015
|
Canada and USA
|
-
|
40,021
|
1,225
|
41,246
|
||||||||||||||
|
Sproule International Limited
|
December 31, 2015
|
United Kingdom
and Offshore Africa |
-
|
7,941
|
-
|
7,941
|
||||||||||||||
|
GLJ Petroleum Consultants Ltd.
|
December 31, 2015
|
Canada
|
-
|
39,840
|
-
|
39,840
|
||||||||||||||
|
Total
|
-
|
87,802
|
1,225
|
89,027
|
||||||||||||||||
| 6. | In our opinion, the reserves data respectively evaluated by us have, in all material respects, been determined and are in accordance with the COGE Handbook, consistently applied. We express no opinion on the reserves data that we reviewed but did not audit or evaluate. |
| 7. | We have no responsibility to update our reports referred to in paragraph 5 for events and circumstances occurring after the effective date of our reports. |
| Canadian Natural Resources Limited | 59 |
| 8. | Because the reserves data are based on judgements regarding future events, actual results will vary and the variations may be material. |
Executed as to our report referred to above:
|
Sproule Associates Limited
Calgary, Alberta, Canada,
March 2, 2016
Original Signed By
SIGNED “HARRY J. HELWERDA”
|
Sproule International Limited
Calgary, Alberta, Canada,
March 2, 2016
Original Signed By
SIGNED “HARRY J. HELWERDA”
|
||
|
Harry J. Helwerda, P.Eng., FEC, FGC (Hon)
President and Director
|
Harry J. Helwerda, P.Eng., FEC, FGC (Hon)
President and Director
|
||
|
Original Signed By
SIGNED “NORA T. STEWART”
|
Original Signed By
SIGNED “SCOTT W. PENNELL”
|
||
|
Nora T. Stewart, P.Eng.
Vice President, Reserves Certification
and Director
|
Scott W. Pennell, P.Eng.
Vice President, Engineering
and Director
|
||
|
Original Signed By
SIGNED “STEVEN J. GOLKO”
|
|||
|
Steven J. Golko, P.Eng.
Vice President, Field Development & Capital
Strategies and Partner
|
|||
|
Original Signed By
SIGNED “CAMERON P. SIX”
|
|||
|
Cameron P. Six, P.Eng.
Vice President, Engineering, Chief
|
|||
| Engineer and Director | |||
|
GLJ Petroleum Consultants Ltd.
Calgary, Alberta, Canada,
March 2, 2016
Original Signed By
SIGNED “TIM R. FREEBORN”
|
|||
|
Tim R. Freeborn, P.Eng.
Vice President
Mineable Oil Sands and Shales
|
| 60 | Canadian Natural Resources Limited |
FORM 51-101F3
REPORT OF
MANAGEMENT AND DIRECTORS
ON OIL AND GAS DISCLOSURE
MANAGEMENT AND DIRECTORS
ON OIL AND GAS DISCLOSURE
Report of Management and Directors on Reserves Data and Other Information
Management of Canadian Natural Resources Limited (the “Company”) are responsible for the preparation and disclosure of information with respect to the Company’s oil and gas activities in accordance with securities regulatory requirements. This information includes reserves data.
Independent qualified reserves evaluators have evaluated and reviewed the Company’s reserves data. The report of the independent qualified reserves evaluators will be filed with securities regulatory authorities concurrently with this report.
The Reserves Committee of the Board of Directors of the Company has
| (a) | reviewed the Company’s procedures for providing information to the independent qualified reserves evaluators; |
| (b) | met with the independent qualified reserves evaluators to determine whether any restrictions affected the ability of the independent qualified reserves evaluators to report without reservation; and |
| (c) | reviewed the reserves data with management and the independent qualified reserves evaluators. |
The Reserves Committee of the Board of Directors has reviewed the Company’s procedures for assembling and reporting other information associated with oil and gas activities and has reviewed that information with management. The Board of Directors has, on the recommendation of the Reserves Committee, approved
| (a) | the content and filing with securities regulatory authorities of Form 51-101F1 containing reserves data and other oil and gas information; |
| (b) | the filing of Form 51-101F2 which is the report of the independent qualified reserves evaluators on the reserves data; and |
| (c) | the content and filing of this report. |
| Canadian Natural Resources Limited | 61 |
Because the reserves data are based on judgments regarding future events, actual results will vary and the variations may be material.
|
Original Signed By
|
|
||
|
Steve W. Laut
President
|
|||
|
Original Signed By
SIGNED “COREY B. BIEBER”
|
|||
|
Corey B. Bieber
Chief Financial Officer and Senior Vice President, Finance
|
|||
|
Original Signed By
SIGNED “DAVID A TUER”
|
|||
|
David A. Tuer
Independent Director and Chair of the Reserves Committee
|
|||
|
|
|||
|
Original Signed By
SIGNED “CHRISTOPHER L. FONG”
|
|||
|
Christopher L. Fong
Independent Director and Member of the Reserves Committee
|
|||
|
Dated this 2nd day of March, 2016
|
|||
| 62 | Canadian Natural Resources Limited |
CANADIAN NATURAL RESOURCES LIMITED
(the “Corporation”)
(the “Corporation”)
Charter of the Audit Committee of the Board of Directors
|
I
|
Audit Committee Purpose
|
The Audit Committee is appointed by the Board of Directors (the “Board”) to assist the Board in fulfilling its responsibility for the stewardship of the Corporation in overseeing the business and affairs of the Corporation. Although the Audit Committee has the powers and responsibilities set forth in this Charter, the role of the Audit Committee is oversight. The Audit Committee’s primary duties and responsibilities are to:
| 1. | ensure that the Corporation’s management implemented an effective system of internal controls over financial reporting; |
| 2. | monitor and oversee the integrity of the Corporation’s financial statements, financial reporting processes and systems of internal controls regarding financial, accounting and compliance with regulatory and statutory requirements as they relate to financial statements, taxation matters and disclosure of material facts; |
| 3. | select and recommend for appointment by the shareholders, the Corporation’s independent auditors, pre-approve all audit and non-audit services to be provided to the Corporation by the Corporation’s independent auditors consistent with all applicable laws, and establish the fees and other compensation to be paid to the independent auditors; |
| 4. | monitor the independence, qualifications and performance of the Corporation’s independent auditors and oversee the audit and review of the Corporation’s financial statements; |
| 5. | monitor the performance of the internal audit function; |
| 6. | establish procedures for the receipt, retention, response to and treatment of complaints, including confidential, anonymous submissions by the Corporation’s employees, regarding accounting, internal controls or auditing matters; and, |
| 7. | provide an avenue of communication among the independent auditors, management, the internal auditing function and the Board. |
|
II
|
Audit Committee Composition, Procedures and Organization
|
| 1. | The Audit Committee shall consist of at least three (3) directors as determined by the Board, each of whom shall be independent, non-executive directors, free from any relationship that would interfere with the exercise of his or her independent judgment. Audit Committee members shall meet the independence and experience requirements of the regulatory bodies to which the Corporation is subject to. All members of the Audit Committee shall have a basic understanding of finance and accounting and be able to read and understand fundamental financial statements at the time of their appointment to the Audit Committee. At least one member of the Audit Committee shall have accounting or related financial management expertise and qualify as a “financial expert” or similar designation in accordance with the requirements of the regulatory bodies to which the Corporation may be subject to. |
| 2. | The Board at its organizational meeting held in conjunction with each annual general meeting of the shareholders shall appoint the members of the Audit Committee for the ensuing year. The Board may at any time remove or replace any member of the Audit Committee and may fill any vacancy in the Audit Committee. |
| 3. | The Board shall appoint a member of the Audit Committee as chair of the Audit Committee. If an Audit Committee Chair is not designated by the Board, or is not present at a meeting of the Audit Committee, the members of the Audit Committee may designate a chair by majority vote of the Audit Committee membership. |
| Canadian Natural Resources Limited | 63 |
| 4. | The Secretary or the Assistant Secretary of the Corporation shall be secretary of the Audit Committee unless the Audit Committee appoints a secretary of the Audit Committee. |
| 5. | The quorum for meetings shall be one half (or where one half of the members of the Audit Committee is not a whole number, the whole number which is closest to and less than one half) of the members of the Audit Committee subject to a minimum of two members of the Audit Committee present in person or by telephone or other telecommunications device that permits all persons participating in the meeting to speak and to hear each other. |
| 6. | Meetings of the Audit Committee shall be conducted as follows: |
| (a) | the Audit Committee shall meet at least four (4) times annually at such times and at such locations as may be requested by the Chair of the Audit Committee; |
| (b) | the Audit Committee shall meet privately in executive sessions at each meeting with management, the manager of internal auditing, the independent auditors, and as a committee to discuss any matters that the Audit Committee or each of these groups believe should be discussed. |
| 7. | The independent auditors and internal auditors shall have a direct line of communication to the Audit Committee through its chair and may bypass management if deemed necessary. Any employee may bring before the Audit Committee directly and may bypass management if deemed necessary any matter involving questionable, illegal or improper financial practices or transactions. |
|
III
|
Audit Committee Duties and Responsibilities
|
| 1. | The overall duties and responsibilities of the Audit Committee shall be as follows: |
| a. | to assist the Board in the discharge of its responsibilities relating to the Corporation’s accounting principles, reporting practices and internal controls and its approval of the Corporation’s annual and quarterly consolidated financial statements; |
| b. | to establish and maintain a direct line of communication with the Corporation’s internal auditors and independent auditors and assess their performance; |
| c. | to ensure that the management of the Corporation has implemented and is maintaining an effective system of internal controls over financial reporting; |
| d. | to report regularly to the Board on the fulfillment of its duties and responsibilities; and, |
| e. | to review annually the Audit Committee Charter and recommend any changes to the Nominating, Governance and Risk Committee for approval by the Board. |
| 2. | The duties and responsibilities of the Audit Committee as they relate to the independent auditors shall be as follows: |
| a. | to select and recommend to the Board of Directors for appointment by the shareholders, the Corporation’s independent auditors, review the independence and monitor the performance of the independent auditors and approve any discharge of auditors when circumstances warrant; |
| b. | to approve the fees and other significant compensation to be paid to the independent auditors, scope and timing of the audit and other related services rendered by the independent auditors; |
| c. | to review and discuss with management and the independent auditors prior to the annual audit the independent auditor’s annual audit plan, including scope, staffing, locations and reliance upon management and internal audit department and oversee the audit of the Corporation’s financial statements; |
| d. | to pre-approve all proposed non-audit services to be provided by the independent auditors except those non-audit services prohibited by legislation; |
| e. | on an annual basis, obtain and review a report by the independent auditors describing (i) the independent auditor’s internal quality control procedures; (ii) any material issues raised by the most recent quality-control |
| 64 | Canadian Natural Resources Limited |
| review, or peer review, of the firm, or by any inquiry or investigation by governmental or professional authorities within the preceding five years respecting one or more independent audits carried out by the firm; and, (iii) any steps taken to address any such issues arising from the review, inquiry or investigation, and, receive a written statement from the independent auditors outlining all significant relationships they have with the Corporation that could impair the auditor’s independence. The Corporation’s independent auditors may not be engaged to perform prohibited activities under the Sarbanes-Oxley Act of 2002 or the rules of the Public Company Accounting Oversight Board or other regulatory bodies, which the Corporation is governed by; |
| f. | to review and discuss with the independent auditors, upon completion of their audit and prior to the filing or releasing annual financial statements: |
| (i) | contents of their report, including : |
| (a) |
all critical accounting policies and practices used;
|
| (b) | all alternative treatments of financial information within GAAP that have been discussed with management, ramifications of the use of such treatments and the treatment preferred by the independent auditor; |
| (c) | other material written communications between the independent auditor and management; |
| (ii) | scope and quality of the audit work performed; |
| (iii) | adequacy of the Corporation’s financial and auditing personnel; |
| (iv) | cooperation received from the Corporation’s personnel during the audit; |
| (v) | internal resources used; |
| (vi) | significant transactions outside of the normal business of the Corporation; |
| (vii) | significant proposed adjustments and recommendations for improving internal accounting controls, accounting principles or management systems; |
| (viii) | the non-audit services provided by the independent auditors; and, |
| (ix) | consider the independent auditor’s judgments about the quality and appropriateness of the Corporation’s accounting principles and critical accounting estimates as applied in its financial reporting. |
| g. | to review and approve a report to shareholders as required, to be included in the Corporation’s Information Circular and Proxy Statement, disclosing any non-audit services approved by the Audit Committee. |
| h. | to review and approve the Corporation’s hiring policies regarding partners, employees and former partners and employees of the present and former independent auditor of the Corporation. |
| 3. | The duties and responsibilities of the Audit Committee as they relate to the internal auditors shall be as follows: |
| a. | to review the budget, internal audit function with respect to the organization structure, staffing, effectiveness and qualifications of the Corporation’s internal audit department; |
| b. | to review the internal audit plan; and |
| c. | to review significant internal audit findings and recommendations together with management’s response and follow-up thereto. |
| 4. | The duties and responsibilities of the Audit Committee as they relate to the internal control procedures of the Corporation shall be as follows: |
| a. | to review the appropriateness and effectiveness of the Corporation’s policies and business practices which impact on the financial integrity of the Corporation, including those relating to internal auditing, insurance, accounting, information services and systems and financial controls, management reporting (including financial reporting) and risk management; |
| b. | to review any unresolved issues between management and the independent auditors that could affect the financial reporting or internal controls of the Corporation; and |
| c. | to periodically review the extent to which recommendations made by the internal audit staff or by the independent auditors have been implemented. |
| Canadian Natural Resources Limited | 65 |
| 5. | Other duties and responsibilities of the Audit Committee shall be as follows: |
| a. | to review and discuss with management, the internal audit group and the independent auditors, the Corporation’s unaudited quarterly consolidated financial statements and related Management Discussion & Analysis including the impact of unusual items and changes in accounting principles and estimates, the earnings press releases before disclosure to the public and report to the Board with respect thereto; |
| b. | to review and discuss with management, the internal audit group and the independent auditors, the Corporation’s audited annual consolidated financial statements and related Management Discussion & Analysis including the impact of unusual items and changes in accounting principles and estimates, the earnings press releases before disclosure to the public and report to the Board with respect thereto; |
| c. | to ensure adequate procedures are in place for the review of the Corporation’s public disclosure of financial information extracted or derived from the Corporation’s financial statements, other than the quarterly and annual earnings press releases, and periodically assess the adequacy of those procedures; |
| d. | to review management’s report on the appropriateness of the policies and procedures used in the preparation of the Corporation’s consolidated financial statements and other required disclosure documents and consider recommendations for any material change to such policies; |
| e. | to review with management, the independent auditors and if necessary with legal counsel, any litigation, claim or other contingency, including tax assessments that could have a material affect upon the financial position or operating results of the Corporation and the manner in which such matters have been disclosed in the consolidated financial statements; |
| f. | to establish procedures for: |
| (i) | the receipt, retention and treatment of complaints received by the Corporation regarding accounting, internal accounting controls, or auditing matters; and |
| (ii) | the confidential, anonymous submission by employees of the Corporation of concerns regarding questionable accounting or auditing matters. |
| g. | to co-ordinate meetings with the Reserves Committee of the Corporation, the Corporation’s senior engineering management, independent evaluating engineers and auditors as required and consider such further inquiries as are necessary to approve the consolidated financial statements; |
| h. | to develop a calendar of activities to be undertaken by the Audit Committee for each ensuing year and to submit the calendar in the appropriate format to the Board following each annual general meeting of shareholders; |
| i. | to perform any other activities consistent with this Charter, the Corporation’s By-laws and governing law, as the Audit Committee or the Board deems necessary or appropriate; and, |
| j. | to maintain minutes of meetings and to report on a regular basis to the Board on significant results of the foregoing activities. |
The Audit Committee has the authority to conduct any investigation appropriate to fulfilling its responsibilities, and it has direct access to the independent auditors as well as officers and employees of the Corporation. The Audit Committee has the authority to retain, at the Corporation’s expense, special legal, accounting or other consultants or experts it deems necessary in the performance of its duties. The Corporation shall at all times make adequate provisions for the payment of all fees and other compensation approved by the Audit Committee, to the Corporation’s independent auditors in connection with the issuance of its audit report, or to any consultants or experts employed by the Audit Committee.
| 66 | Canadian Natural Resources Limited |
The accompanying consolidated financial statements and all other information contained elsewhere in this Annual Report are the responsibility of management. The consolidated financial statements have been prepared by management in accordance with the accounting policies described in the accompanying notes. Where necessary, management has made informed judgements and estimates in accounting for transactions that were not complete at the balance sheet date. In the opinion of management, the financial statements have been prepared in accordance with International Financial Reporting Standards appropriate in the circumstances. The financial information presented elsewhere in the Annual Report has been reviewed to ensure consistency with that in the consolidated financial statements.
Management maintains appropriate systems of internal control. Policies and procedures are designed to give reasonable assurance that transactions are appropriately authorized and recorded, assets are safeguarded from loss or unauthorized use and financial records are properly maintained to provide reliable information for preparation of financial statements.
PricewaterhouseCoopers LLP, an independent firm of Chartered Professional Accountants, has been engaged, as approved by a vote of the shareholders at the Company’s most recent Annual General Meeting, to audit and provide their independent audit opinions on the following:
| — | the Company’s consolidated financial statements as at and for the year ended December 31, 2015; and |
| — | the effectiveness of the Company’s internal control over financial reporting as at December 31, 2015. |
Their report is presented with the consolidated financial statements.
The Board of Directors (the “Board”) is responsible for ensuring that management fulfills its responsibilities for financial reporting and internal controls. The Board exercises this responsibility through the Audit Committee of the Board, which is comprised entirely of independent directors. The Audit Committee meets with management and the independent auditors to satisfy itself that management responsibilities are properly discharged and to review the consolidated financial statements before they are presented to the Board for approval. The consolidated financial statements have been approved by the Board on the recommendation of the Audit Committee.
| (signed) “Steve W. Laut” | (signed) “Corey B. Bieber” | (signed) “Murray G. Harris” | |||
| Steve W. Laut
President
|
Corey B. Bieber, CA
Chief Financial Officer and
Senior Vice-President, Finance
|
Murray G. Harris, CA
Vice-President, Financial Controller
and Horizon Accounting |
Calgary, Alberta, Canada
March 2, 2016
Management’s Assessment of Internal Control Over Financial Reporting
Management is responsible for establishing and maintaining adequate internal control over financial reporting for the Company as defined in Rules 13a–15(f) and 15d–15(f) under the United States Securities Exchange Act of 1934, as amended.
Management, including the Company’s President and the Company’s Chief Financial Officer and Senior Vice-President, Finance, performed an assessment of the Company’s internal control over financial reporting based on the criteria established in Internal Control – Integrated Framework (2013) issued by the Committee of Sponsoring Organizations of the Treadway Commission (“COSO”).
Based on the assessment, management has concluded that the Company’s internal control over financial reporting is effective as at December 31, 2015. Management recognizes that all internal control systems have inherent limitations. Because of its inherent limitations, internal control over financial reporting may not prevent or detect misstatements. Also, projections of any evaluation of effectiveness to future periods are subject to the risk that controls may become inadequate because of changes in conditions, or that the degree of compliance with the policies or procedures may deteriorate.
PricewaterhouseCoopers LLP, an independent firm of Chartered Professional Accountants, has provided an opinion on the Company’s internal control over financial reporting as at December 31, 2015, as stated in their Auditor’s Report.
|
(signed) “Steve W. Laut”
|
(signed) “Corey B. Bieber”
|
||
|
Steve W. Laut
|
Corey B. Bieber, CA
|
||
|
President
|
Chief Financial Officer and
Senior Vice-President, Finance
|
Calgary, Alberta, Canada
March 2, 2016
Independent Auditor’s Report
To the Shareholders of Canadian Natural Resources Limited
We have completed integrated audits of Canadian Natural Resources Limited’s 2015, 2014, and 2013 consolidated financial statements and its internal control over financial reporting as at December 31, 2015. Our opinions, based on our audits are presented below.
Report on the consolidated financial statements
We have audited the accompanying consolidated financial statements of Canadian Natural Resources Limited, which comprise the consolidated balance sheets as at December 31, 2015 and December 31, 2014 and the consolidated statements of earnings (loss), comprehensive income (loss), changes in equity, and cash flows for each of the three years in the period ended December 31, 2015, and the related notes, which comprise a summary of significant accounting policies and other explanatory information.
Management’s responsibility for the consolidated financial statements
Management is responsible for the preparation and fair presentation of these consolidated financial statements in accordance with International Financial Reporting Standards as issued by the International Accounting Standards Board and for such internal control as management determines is necessary to enable the preparation of consolidated financial statements that are free from material misstatement, whether due to fraud or error.
Auditor’s responsibility
Our responsibility is to express an opinion on these consolidated financial statements based on our audits. We conducted our audits in accordance with Canadian generally accepted auditing standards and the standards of the Public Company Accounting Oversight Board (United States). Those standards require that we plan and perform the audit to obtain reasonable assurance about whether the consolidated financial statements are free from material misstatement. Canadian generally accepted auditing standards also require that we comply with ethical requirements.
An audit involves performing procedures to obtain audit evidence, on a test basis, about the amounts and disclosures in the consolidated financial statements. The procedures selected depend on the auditor’s judgement, including the assessment of the risks of material misstatement of the consolidated financial statements, whether due to fraud or error. In making those risk assessments, the auditor considers internal control relevant to Canadian Natural Resources Limited’s preparation and fair presentation of the consolidated financial statements in order to design audit procedures that are appropriate in the circumstances. An audit also includes evaluating the appropriateness of accounting principles and policies used and the reasonableness of accounting estimates made by management, as well as evaluating the overall presentation of the consolidated financial statements.
We believe that the audit evidence we have obtained in our audits is sufficient and appropriate to provide a basis for our audit opinion on the consolidated financial statements.
Opinion
In our opinion, the consolidated financial statements present fairly, in all material respects, the financial position of Canadian Natural Resources Limited as at December 31, 2015 and December 31, 2014 and its financial performance and its cash flows for each of the three years in the period ended December 31, 2015 in accordance with International Financial Reporting Standards as issued by the International Accounting Standards Board.
Report on internal control over financial reporting
We have also audited Canadian Natural Resources Limited’s internal control over financial reporting as at December 31, 2015, based on criteria established in Internal Control - Integrated Framework (2013), issued by the Committee of Sponsoring Organizations of the Treadway Commission (“COSO”).
Management’s responsibility for internal control over financial reporting
Management is responsible for maintaining effective internal control over financial reporting and for its assessment of the effectiveness of internal control over financial reporting included in the accompanying Management’s Assessment of Internal Control over Financial Reporting.
Auditor’s responsibility
Our responsibility is to express an opinion on Canadian Natural Resources Limited’s internal control over financial reporting based on our audit. We conducted our audit of internal control over financial reporting in accordance with the standards of the Public Company Accounting Oversight Board (United States). Those standards require that we plan and perform the audit to obtain reasonable assurance about whether effective internal control over financial reporting was maintained in all material respects.
An audit of internal control over financial reporting includes obtaining an understanding of internal control over financial reporting, assessing the risk that a material weakness exists, testing and evaluating the design and operating effectiveness of internal control, based on the assessed risk, and performing such other procedures as we consider necessary in the circumstances.
We believe that our audit provides a reasonable basis for our audit opinion on Canadian Natural Resources Limited’s internal control over financial reporting.
Definition of internal control over financial reporting
A company’s internal control over financial reporting is a process designed to provide reasonable assurance regarding the reliability of financial reporting and the preparation of financial statements for external purposes in accordance with generally accepted accounting principles. A company’s internal control over financial reporting includes those policies and procedures that: (i) pertain to the maintenance of records that, in reasonable detail, accurately and fairly reflect the transactions and dispositions of the assets of the company; (ii) provide reasonable assurance that transactions are recorded as necessary to permit preparation of financial statements in accordance with generally accepted accounting principles, and that receipts and expenditures of the company are being made only in accordance with authorizations of management and directors of the company; and (iii) provide reasonable assurance regarding prevention or timely detection of unauthorized acquisition, use, or disposition of the company’s assets that could have a material effect on the financial statements.
Inherent limitations
Because of its inherent limitations, internal control over financial reporting may not prevent or detect misstatements. Also, projections of any evaluation of effectiveness to future periods are subject to the risk that controls may become inadequate because of changes in conditions or that the degree of compliance with the policies or procedures may deteriorate.
Opinion
In our opinion, Canadian Natural Resources Limited maintained, in all material respects, effective internal control over financial reporting as at December 31, 2015, based on criteria established in Internal Control - Integrated Framework (2013) issued by COSO.
| /s/ PricewaterhouseCoopers LLP | |
|
|
|
|
Chartered Professional Accountants
|
|
|
|
|
Calgary, Alberta, Canada
March 2, 2016
Consolidated Balance Sheets
|
As at December 31
(millions of Canadian dollars) |
Note
|
2015 |
2014
|
|||||||||
|
ASSETS
|
||||||||||||
|
Current assets
|
||||||||||||
|
Cash and cash equivalents
|
$
|
69
|
$
|
25
|
||||||||
|
Accounts receivable
|
1,277
|
1,889
|
||||||||||
|
Current income taxes
|
677
|
228
|
||||||||||
|
Inventory
|
4
|
525
|
665
|
|||||||||
|
Prepaids and other
|
162
|
172
|
||||||||||
|
Investment in PrairieSky Royalty Ltd.
|
7
|
974
|
–
|
|||||||||
|
Current portion of other long-term assets
|
8
|
375
|
510
|
|||||||||
|
4,059
|
3,489
|
|||||||||||
|
Exploration and evaluation assets
|
5
|
2,586
|
3,557
|
|||||||||
|
Property, plant and equipment
|
6
|
51,475
|
52,480
|
|||||||||
|
Other long-term assets
|
8
|
1,155
|
674
|
|||||||||
|
$
|
59,275
|
$
|
60,200
|
|||||||||
|
LIABILITIES
|
||||||||||||
|
Current liabilities
|
||||||||||||
|
Accounts payable
|
$
|
571
|
$
|
564
|
||||||||
|
Accrued liabilities
|
2,089
|
3,279
|
||||||||||
|
Current portion of long-term debt
|
9
|
1,729
|
980
|
|||||||||
|
Current portion of other long-term liabilities
|
10
|
206
|
319
|
|||||||||
|
4,595
|
5,142
|
|||||||||||
|
Long-term debt
|
9
|
15,065
|
13,022
|
|||||||||
|
Other long-term liabilities
|
10
|
2,890
|
4,175
|
|||||||||
|
Deferred income taxes
|
11
|
9,344
|
8,970
|
|||||||||
|
31,894
|
31,309
|
|||||||||||
|
SHAREHOLDERS’ EQUITY
|
||||||||||||
|
Share capital
|
12
|
4,541
|
4,432
|
|||||||||
|
Retained earnings
|
22,765
|
24,408
|
||||||||||
|
Accumulated other comprehensive income
|
13
|
75
|
51
|
|||||||||
|
27,381
|
28,891
|
|||||||||||
|
$
|
59,275
|
$
|
60,200
|
|||||||||
Commitments and contingencies (note 18).
Approved by the Board of Directors on March 2, 2016
| /s/ Catherine M. Best | /s/ N. Murray Edwards | ||
|
Catherine M. Best
|
N. Murray Edwards
|
||
|
Chair of the Audit Committee and Director
|
Executive Chairman of the Board of Directors and Director
|
Consolidated Statements of Earnings (Loss)
|
For the years ended December 31
(millions of Canadian dollars, except per
common share amounts)
|
Note
|
2015
|
2014
|
2013
|
||||||||||||
|
Product sales
|
$
|
13,167
|
$
|
21,301
|
$
|
17,945
|
||||||||||
|
Less: royalties
|
(804
|
)
|
(2,438
|
)
|
(1,800
|
)
|
||||||||||
|
Revenue
|
12,363
|
18,863
|
16,145
|
|||||||||||||
|
Expenses
|
||||||||||||||||
|
Production
|
4,726
|
5,265
|
4,559
|
|||||||||||||
|
Transportation and blending
|
2,379
|
3,232
|
2,938
|
|||||||||||||
|
Depletion, depreciation and amortization
|
5, 6
|
5,483
|
4,880
|
4,844
|
||||||||||||
|
Administration
|
390
|
367
|
335
|
|||||||||||||
|
Share-based compensation
|
10
|
(46
|
)
|
66
|
135
|
|||||||||||
|
Asset retirement obligation accretion
|
10
|
173
|
193
|
171
|
||||||||||||
|
Interest and other financing expense
|
16
|
322
|
323
|
279
|
||||||||||||
|
Risk management activities
|
17
|
(469
|
)
|
(800
|
)
|
(77
|
)
|
|||||||||
|
Foreign exchange loss
|
761
|
303
|
210
|
|||||||||||||
|
Gains on disposition of properties and corporate
acquisitions
|
5, 6
|
(739
|
)
|
(137
|
)
|
(289
|
)
|
|||||||||
|
Loss from investments
|
7, 8
|
50
|
8
|
4
|
||||||||||||
|
13,030
|
13,700
|
13,109
|
||||||||||||||
|
Earnings (loss) before taxes
|
(667
|
)
|
5,163
|
3,036
|
||||||||||||
|
Current income tax (recovery) expense
|
11
|
(261
|
)
|
427
|
735
|
|||||||||||
|
Deferred income tax expense
|
11
|
231
|
807
|
31
|
||||||||||||
|
Net earnings (loss)
|
$
|
(637
|
)
|
$
|
3,929
|
$
|
2,270
|
|||||||||
|
Net earnings (loss) per common share
|
||||||||||||||||
|
Basic
|
15
|
$
|
(0.58
|
)
|
$
|
3.60
|
$
|
2.08
|
||||||||
|
Diluted
|
15
|
$
|
(0.58
|
)
|
$
|
3.58
|
$
|
2.08
|
||||||||
Consolidated Statements of Comprehensive Income (Loss)
|
For the years ended December 31
(millions of Canadian dollars)
|
2015
|
2014
|
2013
|
|||||||||
|
Net earnings (loss)
|
$
|
(637
|
)
|
$
|
3,929
|
$
|
2,270
|
|||||
|
Items that may be reclassified subsequently to net earnings
|
||||||||||||
|
Net change in derivative financial instruments designated as cash flow hedges
|
||||||||||||
|
Unrealized income (loss) , net of taxes of
$2 million (2014 – $nil, 2013 – $nil)
|
(23
|
)
|
5
|
(4
|
)
|
|||||||
|
Reclassification to net earnings (loss), net of taxes of
$2 million (2014 – $1 million, 2013 – $nil)
|
(13
|
)
|
8
|
(1
|
)
|
|||||||
|
(36
|
)
|
13
|
(5
|
)
|
||||||||
|
Foreign currency translation adjustment
|
||||||||||||
|
Translation of net investment
|
60
|
(4
|
)
|
(11
|
)
|
|||||||
|
Other comprehensive income (loss), net of taxes
|
24
|
9
|
(16
|
)
|
||||||||
|
Comprehensive income (loss)
|
$
|
(613
|
)
|
$
|
3,938
|
$
|
2,254
|
|||||
Consolidated Statements of Changes in Equity
|
For the years ended December 31
(millions of Canadian dollars)
|
Note
|
2015
|
2014 |
2013 |
||||||||||||
|
Share capital
|
12
|
|||||||||||||||
|
Balance – beginning of year
|
$
|
4,432
|
$
|
3,854
|
$
|
3,709
|
||||||||||
|
Issued upon exercise of stock options
|
91
|
488
|
130
|
|||||||||||||
|
Previously recognized liability on stock options
exercised for common shares
|
18
|
129
|
50
|
|||||||||||||
|
Purchase of common shares under Normal Course
Issuer Bid
|
–
|
(39
|
)
|
(35
|
)
|
|||||||||||
|
Balance – end of year
|
4,541
|
4,432
|
3,854
|
|||||||||||||
|
Retained earnings
|
||||||||||||||||
|
Balance – beginning of year
|
24,408
|
21,876
|
20,516
|
|||||||||||||
|
Net earnings (loss)
|
(637
|
)
|
3,929
|
2,270
|
||||||||||||
|
Purchase of common shares under Normal Course
Issuer Bid
|
12
|
–
|
(414
|
)
|
(285
|
)
|
||||||||||
|
Dividends on common shares
|
12
|
(1,006
|
)
|
(983
|
)
|
(625
|
)
|
|||||||||
|
Balance – end of year
|
22,765
|
24,408
|
21,876
|
|||||||||||||
|
Accumulated other comprehensive income
|
13
|
|||||||||||||||
|
Balance – beginning of year
|
51
|
42
|
58
|
|||||||||||||
|
Other comprehensive income (loss), net of taxes
|
24
|
9
|
(16
|
)
|
||||||||||||
|
Balance – end of year
|
75
|
51
|
42
|
|||||||||||||
|
Shareholders’ equity
|
$
|
27,381
|
$
|
28,891
|
$
|
25,772
|
||||||||||
Consolidated Statements of Cash Flows
|
For the years ended December 31
(millions of Canadian dollars)
|
Note
|
2015
|
2014 |
2013 |
||||||||||||
|
Operating activities
|
||||||||||||||||
|
Net earnings (loss)
|
$
|
(637
|
)
|
$
|
3,929
|
$
|
2,270
|
|||||||||
|
Non-cash items
|
||||||||||||||||
|
Depletion, depreciation and amortization
|
5,483
|
4,880
|
4,844
|
|||||||||||||
|
Share-based compensation
|
(46
|
)
|
66
|
135
|
||||||||||||
|
Asset retirement obligation accretion
|
173
|
193
|
171
|
|||||||||||||
|
Unrealized risk management loss (gain)
|
374
|
(451
|
)
|
39
|
||||||||||||
|
Unrealized foreign exchange loss
|
858
|
256
|
226
|
|||||||||||||
|
Realized foreign exchange loss (gain)
on repayment of US dollar debt securities
|
–
|
36
|
(12
|
)
|
||||||||||||
|
Loss from investments
|
7, 8
|
55
|
8
|
4
|
||||||||||||
|
Deferred income tax expense
|
231
|
807
|
31
|
|||||||||||||
|
Gains on disposition of properties and corporate acquisitions
|
(739
|
)
|
(137
|
)
|
(289
|
)
|
||||||||||
|
Current income tax on disposition of properties
|
33
|
–
|
58
|
|||||||||||||
|
Other
|
(22
|
)
|
(38
|
)
|
(19
|
)
|
||||||||||
|
Abandonment expenditures
|
(370
|
)
|
(346
|
)
|
(207
|
)
|
||||||||||
|
Net change in non-cash working capital
|
19
|
239
|
(744
|
)
|
(33
|
)
|
||||||||||
|
5,632
|
8,459
|
7,218
|
||||||||||||||
|
Financing activities
|
||||||||||||||||
|
Issue of bank credit facilities and commercial paper, net
|
970
|
1,195
|
803
|
|||||||||||||
|
Issue of medium-term notes, net
|
9
|
107
|
992
|
98
|
||||||||||||
|
Issue (repayment) of US dollar debt securities, net
|
9
|
–
|
1,482
|
(398
|
)
|
|||||||||||
|
Issue of common shares on exercise of stock options
|
91
|
488
|
130
|
|||||||||||||
|
Purchase of common shares under Normal Course Issuer Bid
|
–
|
(453
|
)
|
(320
|
)
|
|||||||||||
|
Dividends on common shares
|
(1,251
|
)
|
(955
|
)
|
(523
|
)
|
||||||||||
|
Net change in non-cash working capital
|
19
|
(40
|
)
|
(22
|
)
|
(23
|
)
|
|||||||||
|
(123
|
)
|
2,727
|
(233
|
)
|
||||||||||||
|
Investing activities
|
||||||||||||||||
|
Net proceeds (expenditures) on exploration and evaluation assets (1)
|
19
|
236
|
(1,190
|
)
|
144
|
|||||||||||
|
Net expenditures on property, plant and equipment (1)
|
19
|
(4,704
|
)
|
(10,208
|
)
|
(7,211
|
)
|
|||||||||
|
Current income tax on disposition of properties
|
(33
|
)
|
–
|
(58
|
)
|
|||||||||||
|
Investment in other long-term assets
|
(112
|
)
|
(113
|
)
|
–
|
|||||||||||
|
Net change in non-cash working capital
|
19
|
(852
|
)
|
334
|
119
|
|||||||||||
|
(5,465
|
)
|
(11,177
|
)
|
(7,006
|
)
|
|||||||||||
|
Increase (decrease) in cash and cash equivalents
|
44
|
9
|
(21
|
)
|
||||||||||||
|
Cash and cash equivalents – beginning of year
|
25
|
16
|
37
|
|||||||||||||
|
Cash and cash equivalents – end of year
|
$
|
69
|
$
|
25
|
$
|
16
|
||||||||||
|
Interest paid, net
|
$
|
541
|
$
|
521
|
$
|
460
|
||||||||||
|
Income taxes paid
|
$
|
42
|
$
|
792
|
$
|
357
|
||||||||||
| (1) | Net proceeds on exploration and evaluation assets and net expenditures on property, plant and equipment in 2015 exclude non-cash share consideration of $985 million received from PrairieSky Royalty Ltd. (“PrairieSky”) on the disposition of royalty income assets. |
Notes to the Consolidated Financial Statements
(tabular amounts in millions of Canadian dollars, unless otherwise stated)
1. ACCOUNTING POLICIES
Canadian Natural Resources Limited (the “Company”) is a senior independent crude oil and natural gas exploration, development and production company. The Company’s exploration and production operations are focused in North America, largely in Western Canada; the United Kingdom (“UK”) portion of the North Sea; and Côte d’Ivoire, Gabon, and South Africa in Offshore Africa.
The Horizon Oil Sands Mining and Upgrading segment (“Horizon”) produces synthetic crude oil through bitumen mining and upgrading operations.
Within Western Canada, the Company maintains certain midstream activities that include pipeline operations, an electricity co-generation system and an investment in the North West Redwater Partnership ("Redwater Partnership"), a general partnership formed in the Province of Alberta.
The Company was incorporated in Alberta, Canada. The address of its registered office is 2100, 855 - 2 Street S.W., Calgary, Alberta, Canada.
The Company’s consolidated financial statements and the related notes have been prepared in accordance with International Financial Reporting Standards (“IFRS”) as issued by the International Accounting Standards Board (“IASB”). The accounting policies adopted by the Company under IFRS are set out below. The Company has consistently applied the same accounting policies throughout all periods presented, except where IFRS permits new accounting standards to be adopted prospectively.
(A) PRINCIPLES OF CONSOLIDATION
The consolidated financial statements have been prepared under the historical cost basis, unless otherwise required.
The consolidated financial statements include the accounts of the Company and all of its subsidiary companies and wholly owned partnerships. Subsidiaries are all entities over which the Company has control. Subsidiaries are consolidated from the date on which the Company obtains control. They are deconsolidated from the date that control ceases.
Certain of the Company’s activities are conducted through joint arrangements in which two or more parties have joint control. Where the Company has a direct ownership interest in jointly controlled assets and obligations for the liabilities (a “joint operation”), the assets, liabilities, revenue and expenses related to the joint operation are included in the consolidated financial statements in proportion to the Company’s interest. Where the Company has an interest in jointly controlled entities (a “joint venture”), it uses the equity method of accounting. Under the equity method, the Company’s initial and subsequent investments are recognized at cost and subsequently adjusted for the Company’s share of the joint venture’s income or loss, less distributions received.
Joint ventures accounted for using the equity method of accounting are tested for impairment whenever objective evidence indicates that the carrying amount of the investment may not be recoverable. Indications of impairment include a history of losses, significant capital expenditure overruns, liquidity concerns, financial restructuring of the investee or significant adverse changes in the technological, economic or legal environment. The amount of the impairment is measured as the difference between the carrying amount of the investment and the higher of its fair value less costs of disposal and its value in use. Impairment losses are reversed in subsequent periods if the amount of the loss decreases and the decrease can be related objectively to an event occurring after the impairment was recognized.
(B) SEGMENTED INFORMATION
Operating segments have been determined based on the nature of the Company’s activities and the geographic locations in which the Company operates, and are consistent with the level of information regularly provided to and reviewed by the Company’s chief operating decision makers.
(C) CASH AND CASH EQUIVALENTS
Cash comprises cash on hand and demand deposits. Other investments (term deposits and certificates of deposit) with an original term to maturity at purchase of three months or less are reported as cash equivalents in the consolidated balance sheets.
(D) INVENTORY
Inventory is primarily comprised of product inventory and materials and supplies. Product inventory is comprised of crude oil held for sale, including pipeline linefill and crude oil stored in floating production, storage and offloading vessels. Inventories are carried at the lower of cost and net realizable value. Cost consists of purchase costs, direct production costs, directly attributable overhead and depletion, depreciation and amortization and is determined on a first-in, first-out basis. Net realizable value for product inventory is determined by reference to forward prices, and for materials and supplies is based on current market prices as at the date of the consolidated balance sheets.
(E) EXPLORATION AND EVALUATION ASSETS
Exploration and evaluation (“E&E”) assets consist of the Company’s crude oil and natural gas exploration projects that are pending the determination of proved reserves.
E&E costs are initially capitalized and include costs directly associated with the acquisition of licenses, technical services and studies, seismic acquisition, exploration drilling and evaluation, overhead and administration expenses, and the estimate of any asset retirement costs. E&E costs do not include general prospecting or evaluation costs incurred prior to having obtained the legal rights to explore an area. These costs are recognized in net earnings.
Once the technical feasibility and commercial viability of E&E assets are determined and a development decision is made by management, the E&E assets are tested for impairment upon reclassification to property, plant and equipment. The technical feasibility and commercial viability of extracting a mineral resource is considered to be determined when an assessment of proved reserves is made. An E&E asset is derecognized upon disposal or when no future economic benefits are expected to arise from its use. Any gain or loss arising on derecognition of the asset is recognized in net earnings within depletion, depreciation and amortization.
E&E assets are also tested for impairment when facts and circumstances suggest that the carrying amount of E&E assets may exceed their recoverable amount, by comparing the relevant costs to the fair value of Cash Generating Units (“CGUs”), aggregated at the segment level. Indications of impairment include leases approaching expiry, the existence of low benchmark commodity prices for an extended period of time, significant downward revisions in estimated probable reserves volumes, significant increases in estimated future exploration or development expenditures, or significant adverse changes in the applicable legislative or regulatory frameworks.
(F) PROPERTY, PLANT AND EQUIPMENT
Property, plant and equipment is measured at cost less accumulated depletion and depreciation and impairment provisions. Assets under construction are not depleted or depreciated until available for their intended use. The capitalized value of a finance lease is included in property, plant and equipment.
Exploration and Production
The cost of an asset comprises its acquisition costs, construction and development costs, costs directly attributable to bringing the asset into operation, the estimate of any asset retirement costs, and applicable borrowing costs. Property acquisition costs are comprised of the aggregate amount paid and the fair value of any other consideration given to acquire the asset.
When significant components of an item of property, plant and equipment, including crude oil and natural gas interests, have different useful lives, they are accounted for separately.
Crude oil and natural gas properties are depleted using the unit-of-production method over proved reserves, except for major components, which are depreciated using a straight-line method over their estimated useful lives. The unit-of-production depletion rate takes into account expenditures incurred to date, together with future development expenditures required to develop proved reserves.
Oil Sands Mining and Upgrading
Capitalized costs for the Oil Sands Mining and Upgrading segment are reported separately from the Company’s North America Exploration and Production segment. Capitalized costs include acquisition costs, construction and development costs, costs directly attributable to bringing the asset into operation, the estimate of any asset retirement costs, and applicable borrowing costs.
Mine-related costs are depleted using the unit-of-production method based on Horizon proved reserves. Costs of the upgrader and related infrastructure located on the Horizon site are depreciated on the unit-of-production method based on productive capacity of the upgrader and related infrastructure. Other equipment is depreciated on a straight-line basis over its estimated useful life ranging from 2 to 15 years.
Midstream and Head Office
The Company capitalizes all costs that expand the capacity or extend the useful life of the midstream and head office assets. Midstream assets are depreciated on a straight-line basis over their estimated useful lives ranging from 5 to 30 years. Head office assets are depreciated on a declining balance basis.
Useful lives
The depletion rates and expected useful lives of property, plant and equipment are reviewed on an annual basis, with changes in depletion rates and useful lives accounted for prospectively.
Derecognition
A property, plant and equipment asset is derecognized upon disposal or when no future economic benefits are expected to arise from the continued use of the asset. Any gain or loss arising on derecognition of the asset (calculated as the difference between the net disposal proceeds and the carrying amount of the asset) is recognized in net earnings within depletion, depreciation and amortization.
Major maintenance expenditures
Inspection costs associated with major maintenance turnarounds are capitalized and depreciated over the period to the next major maintenance turnaround. All other maintenance costs are expensed as incurred.
Impairment
The Company assesses property, plant and equipment for impairment whenever events or changes in circumstances indicate that the carrying amount of an asset or group of assets may not be recoverable. Indications of impairment include the existence of low benchmark commodity prices for an extended period of time, significant downward revisions of estimated reserves volumes, significant increases in estimated future development expenditures, or significant adverse changes in the applicable legislative or regulatory frameworks. If an indication of impairment exists, the Company performs an impairment test related to the assets. Individual assets are grouped for impairment assessment purposes into CGUs, which are the lowest level at which there are identifiable cash inflows that are largely independent of the cash inflows of other groups of assets. A CGU’s recoverable amount is the higher of its fair value less costs of disposal and its value in use. Where the carrying amount of a CGU exceeds its recoverable amount, the CGU is considered impaired and is written down to its recoverable amount through depletion, depreciation and amortization expense.
In subsequent periods, an assessment is made at each reporting date to determine whether there is any indication that previously recognized impairment losses may no longer exist or may have decreased. If such indication exists, the recoverable amount is re-estimated and the net carrying amount of the asset is increased to its revised recoverable amount. The revised recoverable amount cannot exceed the carrying amount that would have been determined, net of depletion, had no impairment loss been recognized for the asset in prior periods. A reversal of impairment is recognized in net earnings. After a reversal, the depletion charge is adjusted in future periods to allocate the asset’s revised carrying amount over its remaining useful life.
(G) BUSINESS COMBINATIONS
Business combinations are accounted for using the acquisition method. Assets acquired and liabilities assumed in a business combination are recognized at their fair value at the date of the acquisition. Any excess of the consideration paid over the fair value of the net assets acquired is recognized as an asset. Any excess of the fair value of the net assets acquired over the consideration paid is recognized in net earnings.
(H) OVERBURDEN REMOVAL COSTS
Overburden removal costs incurred during the initial development of a mine at Horizon are capitalized to property, plant and equipment. Overburden removal costs incurred during the production of a mine are included in the cost of inventory, unless the overburden removal activity has resulted in a probable inflow of future economic benefits to the Company, in which case the costs are capitalized to property, plant and equipment. Capitalized overburden removal costs are depleted over the life of the mining reserves that directly benefit from the overburden removal activity.
(I) CAPITALIZED BORROWING COSTS
Borrowing costs attributable to the acquisition, construction or production of qualifying assets are capitalized to the cost of those assets until such time as the assets are substantially available for their intended use. Qualifying assets are comprised of those significant assets that require a period greater than one year to be available for their intended use. All other borrowing costs are recognized in net earnings.
(J) LEASES
Finance leases, which transfer substantially all of the risks and rewards incidental to ownership of the leased item to the Company, are capitalized at the commencement of the lease term at the fair value of the leased property or, if lower, at the present value of the minimum lease payments. Capitalized leased assets are depreciated over the shorter of the estimated useful life of the asset or the lease term. Operating lease payments are recognized in net earnings over the lease term.
(K) ASSET RETIREMENT OBLIGATIONS
The Company provides for asset retirement obligations on all of its property, plant and equipment based on current legislation and industry operating practices. Provisions for asset retirement obligations related to property, plant and equipment are recognized as a liability in the period in which they are incurred. Provisions are measured at the present value of management’s best estimate of expenditures required to settle the obligation as at the date of the balance sheet. Subsequent to the initial measurement, the obligation is adjusted to reflect the passage of time, changes in credit adjusted interest rates, and changes in the estimated future cash flows underlying the obligation. The increase in the provision due to the passage of time is recognized as asset retirement obligation accretion expense whereas changes due to discount rates or estimated future cash flows are capitalized to or derecognized from property, plant, and equipment. Actual costs incurred upon settlement of the asset retirement obligation are charged against the provision.
(L) FOREIGN CURRENCY TRANSLATION
Functional and presentation currency
Items included in the financial statements of the Company’s subsidiary companies and partnerships are measured using the currency of the primary economic environment in which the subsidiary operates (the “functional currency”). The consolidated financial statements are presented in Canadian dollars, which is the Company’s functional currency.
The assets and liabilities of subsidiaries that have a functional currency different from that of the Company are translated into Canadian dollars at the closing rate at the date of the balance sheet, and revenue and expenses are translated at the average rate for the period. Cumulative foreign currency translation adjustments are recognized in other comprehensive income.
When the Company disposes of its entire interest in a foreign operation, or loses control, joint control, or significant influence over a foreign operation, the foreign currency gains or losses accumulated in other comprehensive income related to the foreign operation are recognized in net earnings.
Transactions and balances
Foreign currency transactions are translated into the functional currency of the Company and its subsidiaries and partnerships using the exchange rates prevailing at the dates of the transactions. Foreign exchange gains and losses resulting from the settlement of foreign currency transactions and from the translation at balance sheet date exchange rates of monetary assets and liabilities denominated in currencies other than the functional currency are recognized in net earnings.
(M) REVENUE RECOGNITION AND COSTS OF GOODS SOLD
Revenue from the sale of crude oil and natural gas is recognized when title passes to the customer, delivery has taken place and collection is reasonably assured. The Company assesses customer creditworthiness, both before entering into contracts and throughout the revenue recognition process.
Revenue represents the Company’s share net of royalty payments to governments and other mineral interest owners. Related costs of goods sold are comprised of production, transportation and blending, and depletion, depreciation and amortization expenses. These amounts have been separately presented in the consolidated statements of earnings.
(N) PRODUCTION SHARING CONTRACTS
Production generated from Côte d’Ivoire and Gabon in Offshore Africa is shared under the terms of various Production Sharing Contracts (“PSCs”). Product sales are divided into cost recovery oil and profit oil. Cost recovery oil allows the Company to recover its capital and production costs and the costs carried by the Company on behalf of the respective Government State Oil Companies (the “Governments”). Profit oil is allocated to the joint venture partners in accordance with their respective equity interests, after a portion has been allocated to the Governments. The Governments’ share of profit oil attributable to the Company’s equity interest is allocated to royalty expense and current income tax expense in accordance with the terms of the respective PSCs.
(O) INCOME TAX
The Company follows the liability method of accounting for income taxes. Under this method, deferred income tax assets and liabilities are recognized based on the estimated tax effects of temporary differences in the carrying amount of assets and liabilities in the consolidated financial statements and their respective tax bases.
Deferred income tax assets and liabilities are calculated using the substantively enacted income tax rates that are expected to apply when the asset or liability is recovered. Deferred income tax assets or liabilities are not recognized when they arise on the initial recognition of an asset or liability in a transaction (other than in a business combination) that, at the time of the transaction, affects neither accounting nor taxable profit. Deferred income tax assets or liabilities are also not recognized on possible future distributions of retained earnings of subsidiaries where the timing of the distribution can be controlled by the Company and it is probable that a distribution will not be made in the foreseeable future, or when distributions can be made without incurring income taxes.
Deferred income tax assets for deductible temporary differences and tax loss carryforwards are recognized to the extent that it is probable that future taxable profits will be available against which the temporary differences or tax loss carryforwards can be utilized. The carrying amount of deferred income tax assets is reviewed at each reporting date, and is reduced if it is no longer probable that sufficient future taxable profits will be available against which the temporary differences or tax loss carryforwards can be utilized.
Current income tax is calculated based on net earnings for the period, adjusted for items that are non-taxable or taxed in different periods, using income tax rates that are substantively enacted at each reporting date.
Income taxes are recognized in net earnings or other comprehensive income, consistent with the items to which they relate.
(P) SHARE-BASED COMPENSATION
The Company’s Stock Option Plan (the “Option Plan”) provides current employees with the right to elect to receive common shares or a cash payment in exchange for stock options surrendered. The liability for awards granted to employees is initially measured based on the grant date fair value of the awards and the number of awards expected to vest. The awards are re-measured each reporting period for subsequent changes in the fair value of the liability. Fair value is determined using the Black-Scholes valuation model under a graded vesting method. Expected volatility is estimated based on historic results. When stock options are surrendered for cash, the cash settlement paid reduces the outstanding liability. When stock options are exercised for common shares under the Option Plan, consideration paid by the employee and any previously recognized liability associated with the stock options are recorded as share capital. The unamortized costs of employer contributions to the Company’s share bonus program are included in other long-term assets.
(Q) FINANCIAL INSTRUMENTS
The Company classifies its financial instruments into one of the following categories: financial assets at amortized cost; financial liabilities at amortized cost; and fair value through profit or loss. All financial instruments are measured at fair value on initial recognition. Measurement in subsequent periods is dependent on the classification of the respective financial instrument.
Fair value through profit or loss financial instruments are subsequently measured at fair value with changes in fair value recognized in net earnings. All other categories of financial instruments are measured at amortized cost using the effective interest method.
Cash, cash equivalents, accounts receivable and certain other long-term assets are classified as financial assets at amortized cost since it is the Company’s intention to hold these assets to maturity and the related cash flows are mainly payments of principal and interest. Investments in publicly traded shares are classified as fair value through profit or loss. Accounts payable, accrued liabilities, certain other long-term liabilities, and long-term debt are classified as financial liabilities at amortized cost. Risk management assets and liabilities are classified as fair value through profit or loss.
Financial assets and liabilities are also categorized using a three-level hierarchy that reflects the significance of the inputs used in making fair value measurements for these assets and liabilities. The fair values of financial assets and liabilities included in Level 1 are determined by reference to quoted prices in active markets for identical assets and liabilities. Fair values of financial assets and liabilities in Level 2 are based on inputs other than Level 1 quoted prices that are observable for the asset or liability either directly (as prices) or indirectly (derived from prices). The fair values of Level 3 financial assets and liabilities are not based on observable market data. The disclosure of the fair value hierarchy excludes financial assets and liabilities where book value approximates fair value due to the liquid nature of the asset or liability.
Transaction costs in respect of financial instruments at fair value through profit or loss are recognized in net earnings. Transaction costs in respect of other financial instruments are included in the initial measurement of the financial instrument.
Impairment of financial assets
At each reporting date, the Company assesses whether there is objective evidence that a financial asset is impaired. If such evidence exists, an impairment loss is recognized.
Impairment losses on financial assets carried at amortized cost are calculated as the difference between the amortized cost of the financial asset and the present value of the estimated future cash flows, discounted using the instrument’s original effective interest rate. Impairment losses on financial assets carried at amortized cost are reversed in subsequent periods if the amount of the loss decreases and the decrease can be related objectively to an event occurring after the impairment was recognized.
(R) RISK MANAGEMENT ACTIVITIES
The Company periodically uses derivative financial instruments to manage its commodity price, foreign currency and interest rate exposures. These financial instruments are entered into solely for hedging purposes and are not used for speculative purposes. All derivative financial instruments are recognized in the consolidated balance sheets at their estimated fair value. The estimated fair value of derivative financial instruments has been determined based on appropriate internal valuation methodologies and/or third party indications. Fair values determined using valuation models require the use of assumptions concerning the amount and timing of future cash flows, discount rates and credit risk. In determining these assumptions, the Company primarily relied on external, readily-observable market inputs including quoted commodity prices and volatility, interest rate yield curves, and foreign exchange rates. The carrying amount of a risk management liability is adjusted for the Company’s own credit risk.
The Company documents all derivative financial instruments that are formally designated as hedging transactions at the inception of the hedging relationship, in accordance with the Company’s risk management policies. The effectiveness of the hedging relationship is evaluated, both at inception of the hedge and on an ongoing basis.
The Company periodically enters into commodity price contracts to manage anticipated sales and purchases of crude oil and natural gas in order to protect its cash flow for its capital expenditure programs. The effective portion of changes in the fair value of derivative commodity price contracts formally designated as cash flow hedges is initially recognized in other comprehensive income and is reclassified to risk management activities in net earnings in the same period or periods in which the commodity is sold or purchased. The ineffective portion of changes in the fair value of these designated contracts is recognized in risk management activities in net earnings. All changes in the fair value of non-designated crude oil and natural gas commodity price contracts are recognized in risk management activities in net earnings.
The Company periodically enters into interest rate swap contracts to manage its fixed to floating interest rate mix on certain of its long-term debt. The interest rate swap contracts require the periodic exchange of payments without the exchange of the notional principal amounts on which the payments are based. Changes in the fair value of interest rate swap contracts designated as fair value hedges and corresponding changes in the fair value of the hedged long-term debt are recognized in interest expense in net earnings. Changes in the fair value of non-designated interest rate swap contracts are recognized in risk management activities in net earnings.
Cross currency swap contracts are periodically used to manage currency exposure on US dollar denominated long-term debt. The cross currency swap contracts require the periodic exchange of payments with the exchange at maturity of notional principal amounts on which the payments are based. Changes in the fair value of the foreign exchange component of cross currency swap contracts designated as cash flow hedges related to the notional principal amounts are recognized in foreign exchange gains and losses in net earnings. The effective portion of changes in the fair value of the interest rate component of cross currency swap contracts designated as cash flow hedges is initially recognized in other comprehensive income and is reclassified to interest expense when the hedged item is recognized in net earnings, with the ineffective portion recognized in risk management activities in net earnings. Changes in the fair value of non-designated cross currency swap contracts are recognized in risk management activities in net earnings.
Realized gains or losses on the termination of financial instruments that have been designated as cash flow hedges are deferred under accumulated other comprehensive income and amortized into net earnings in the period in which the underlying hedged items are recognized. In the event a designated hedged item is sold, extinguished or matures prior to the termination of the related derivative instrument, any unrealized derivative gain or loss is recognized in net earnings. Realized gains or losses on the termination of financial instruments that have not been designated as hedges are recognized in net earnings.
Upon termination of an interest rate swap designated as a fair value hedge, the interest rate swap is derecognized in the consolidated balance sheets and the related long-term debt hedged is no longer revalued for subsequent changes in fair value due to interest rates changes. The fair value adjustment due to interest rates on the long-term debt at the date of termination of the interest rate swap is amortized to interest expense over the remaining term of the long-term debt.
Foreign currency forward contracts are periodically used to manage foreign currency cash requirements. The foreign currency forward contracts involve the purchase or sale of an agreed upon amount of US dollars at a specified future date at forward exchange rates. Changes in the fair value of foreign currency forward contracts designated as cash flow hedges are initially recorded in other comprehensive income and are reclassified to foreign exchange gains and losses when the hedged item is recognized in net earnings. Changes in the fair value of non-designated foreign currency forward contracts are recognized in risk management activities in net earnings.
Embedded derivatives are derivatives that are included in a non-derivative host contract. Embedded derivatives are recorded at fair value separately from the host contract when their economic characteristics and risks are not clearly and closely related to the host contract, except when the host contract is an asset.
(S) COMPREHENSIVE INCOME
Comprehensive income is comprised of the Company’s net earnings and other comprehensive income. Other comprehensive income includes the effective portion of changes in the fair value of derivative financial instruments designated as cash flow hedges and foreign currency translation gains and losses arising from the net investment in foreign operations that do not have a Canadian dollar functional currency. Other comprehensive income is shown net of related income taxes.
(T) PER COMMON SHARE AMOUNTS
The Company calculates basic earnings per common share by dividing net earnings by the weighted average number of common shares outstanding during the period. As the Company’s Option Plan allows for the settlement of stock options in either cash or shares at the option of the holder, diluted earnings per common share is calculated using the more dilutive of cash settlement or share settlement under the treasury stock method.
(U) SHARE CAPITAL
Common shares are classified as equity. Costs directly attributable to the issue of new shares or options are included in equity as a deduction from proceeds, net of tax. When the Company acquires its own common shares, share capital is reduced by the average carrying value of the shares purchased. The excess of the purchase price over the average carrying value is recognized as a reduction of retained earnings. Shares are cancelled upon purchase.
(V) DIVIDENDS
Dividends on common shares are recognized in the Company’s financial statements in the period in which the dividends are declared by the Board of Directors.
2. ACCOUNTING STANDARDS ISSUED BUT NOT YET APPLIED
In May 2014, the IASB issued IFRS 15 “Revenue from Contracts with Customers” to provide guidance on the recognition of revenue and cash flows arising from an entity’s contracts with customers, and related disclosures. The new standard replaces several existing standards related to recognition of revenue and states that revenue should be recognized as performance obligations related to the goods or services delivered are settled. IFRS 15 also provides revenue accounting guidance for contract modifications and multiple-element contracts and prescribes additional disclosure requirements. In 2015, the IASB deferred the effective date for the new standard to January 1, 2018. The new standard is required to be adopted retrospectively, with earlier adoption permitted. The Company is assessing the impact of IFRS 15 on its consolidated financial statements.
In May 2014, the IASB issued an amendment to IFRS 11 “Joint Arrangements” to clarify the accounting treatment when an entity acquires interests in joint ventures and joint operations. The amendment requires these acquisitions to be accounted for as business combinations. This amendment is effective January 1, 2016 and is to be applied prospectively. Adoption of this amended standard is not expected to result in a significant impact to the Company’s consolidated financial statements.
Effective January 1, 2014, the Company adopted the version of IFRS 9 “Financial Instruments” issued November 2013. In July 2014, the IASB issued amendments to IFRS 9 to include accounting guidance to assess and recognize impairment losses on financial assets based on an expected loss model. The amendments are effective January 1, 2018. The Company is assessing the impact of this amendment on its consolidated financial statements.
Subsequent to December 31, 2015, the IASB issued IFRS 16 “Leases”, which provides guidance on accounting for leases. The new standard replaces IAS 17 “Leases” and related interpretations. IFRS 16 eliminates the distinction between operating leases and financing leases for lessees. The new standard is effective January 1, 2019 with earlier adoption permitted providing that IFRS 15 has been adopted. The new standard is required to be applied retrospectively, with a policy alternative of restating comparative prior periods or recognizing the cumulative adjustment in opening retained earnings at the date of adoption. The Company is assessing the impact of this standard on its consolidated financial statements.
3. CRITICAL ACCOUNTING ESTIMATES AND JUDGEMENTS
The Company has made estimates, assumptions and judgements regarding certain assets, liabilities, revenues and expenses in the preparation of the consolidated financial statements, primarily related to unsettled transactions and events as of the date of the consolidated financial statements. Accordingly, actual results may differ from estimated amounts. The estimates, assumptions and judgements that have a significant risk of causing a material adjustment to the carrying amounts of assets and liabilities within the next financial year are addressed below.
(A) Crude Oil and Natural Gas Reserves
Purchase price allocations, depletion, depreciation and amortization, and amounts used in impairment calculations are based on estimates of crude oil and natural gas reserves. Reserve estimates are based on engineering data, estimated future prices, expected future rates of production and the timing of future capital expenditures, all of which are subject to many uncertainties, interpretations and judgements. The Company expects that, over time, its reserve estimates will be revised upward or downward based on updated information such as the results of future drilling, testing and production levels, and may be affected by changes in commodity prices.
(B) Asset Retirement Obligations
The Company provides for asset retirement obligations on its property, plant and equipment based on current legislation and operating practices. Estimated future costs include assumptions of dates of future abandonment and technological advances and estimates of future inflation rates and discount rates. Actual costs may vary from the estimated provision due to changes in environmental legislation, the impact of inflation, changes in technology, changes in operating practices, and changes in the date of abandonment due to changes in reserve life. These differences may have a material impact on the estimated provision.
(C) Income Taxes
The Company is subject to income taxes in numerous legal jurisdictions. Accounting for income taxes requires the Company to interpret frequently changing laws and regulations, including changing income tax rates, and make certain judgements with respect to the application of tax law, estimating the timing of temporary difference reversals, and estimating the realizability of tax assets. There are many transactions and calculations for which the ultimate tax determination is uncertain. The Company recognizes liabilities for potential tax audit issues based on assessments of whether additional taxes will likely be due.
(D) Fair Value of Derivatives and Other Financial Instruments
The fair value of financial instruments that are not traded in an active market is determined using valuation techniques. The Company uses its judgement to select a variety of methods and make assumptions that are primarily based on market conditions existing at the end of each reporting period. The Company uses directly and indirectly observable inputs in measuring the value of financial instruments that are not traded in active markets, including quoted commodity prices and volatility, interest rate yield curves and foreign exchange rates.
(E) Purchase Price Allocations
Purchase prices related to business combinations are allocated to the underlying acquired assets and liabilities based on their estimated fair value at the time of acquisition. The determination of fair value requires the Company to make estimates, assumptions and judgements regarding future events. The allocation process is inherently subjective and impacts the amounts assigned to individually identifiable assets and liabilities, including the fair value of crude oil and natural gas properties together with deferred income tax effects. As a result, the purchase price allocation impacts the Company’s reported assets and liabilities and future net earnings due to the impact on future depletion, depreciation, and amortization expense and impairment tests.
(F) Share-Based Compensation
The Company has made various assumptions in estimating the fair values of the stock options granted under the Option Plan, including expected volatility, expected exercise timing and future forfeiture rates. At each period end, stock options outstanding are remeasured for changes in the fair value of the liability.
(G) Identification of CGUs
CGUs are defined as the lowest grouping of integrated assets that generate identifiable cash inflows that are largely independent of the cash inflows of other assets or groups of assets. The classification of assets into CGUs requires significant judgement and interpretations with respect to the integration between assets, the existence of active markets, shared infrastructures, and the way in which management monitors the Company’s operations.
(H) Impairment of Assets
The recoverable amount of a CGU or an individual asset has been determined as the higher of the CGU’s or the asset’s fair value less costs of disposal and its value in use. These calculations require the use of estimates and assumptions and are subject to change as new information becomes available, including information on future commodity prices, expected production volumes, quantity of reserves, asset retirement obligations, future development and operating costs, after-tax discount rates currently ranging from 9.5% to 12%, and income taxes. Changes in assumptions used in determining the recoverable amount could affect the carrying value of the related assets and CGUs.
(I) Contingencies
Contingencies are subject to measurement uncertainty as the related financial impact will only be confirmed by the outcome of a future event. The assessment of contingencies requires the application of judgements and estimates including the determination of whether a present obligation exists and the reliable estimation of the timing and amount of cash flows required to settle the contingency.
4. INVENTORY
|
2015
|
2014
|
|||||||
|
Product inventory
|
$
|
186
|
$
|
332
|
||||
|
Materials and supplies
|
339
|
333
|
||||||
|
$
|
525
|
$
|
665
|
|||||
As a result of a decline in crude oil prices, the Company recorded a write-down of its product inventory of $174 million from cost to net realizable value as at December 31, 2015 (2014 – $70 million).
5. EXPLORATION AND EVALUATION ASSETS
|
Exploration and Production
|
Oil Sands
Mining and Upgrading
|
Total
|
||||||||||||||||||
|
North America
|
North Sea
|
Offshore Africa
|
||||||||||||||||||
|
Cost
|
||||||||||||||||||||
|
At December 31, 2013
|
$
|
2,570
|
$
|
–
|
$
|
39
|
$
|
–
|
$
|
2,609
|
||||||||||
|
Additions
|
1,103
|
–
|
87
|
–
|
1,190
|
|||||||||||||||
|
Transfers to property, plant and
equipment
|
(247
|
)
|
–
|
–
|
–
|
(247
|
)
|
|||||||||||||
|
Foreign exchange adjustments
|
–
|
–
|
5
|
–
|
5
|
|||||||||||||||
|
At December 31, 2014
|
3,426
|
–
|
131
|
–
|
3,557
|
|||||||||||||||
|
Additions
|
132
|
–
|
35
|
–
|
167
|
|||||||||||||||
|
Transfers to property, plant and
equipment
|
(567
|
)
|
–
|
–
|
–
|
(567
|
)
|
|||||||||||||
|
Disposals/derecognitions (1)
|
(491
|
)
|
(96
|
)
|
(587
|
)
|
||||||||||||||
|
Foreign exchange adjustments
|
–
|
–
|
16
|
–
|
16
|
|||||||||||||||
|
At December 31, 2015
|
$
|
2,500
|
$
|
–
|
$
|
86
|
$
|
–
|
$
|
2,586
|
||||||||||
| (1) | Refer to note 6 regarding the disposition of exploration and evaluation assets in the North America segment. |
In connection with the Company’s notice of withdrawal from Block CI-514 in Côte d’Ivoire, Offshore Africa in 2015, the Company derecognized $96 million of exploration and evaluation assets.
During 2013, the Company disposed of a 50% interest in its exploration right in South Africa, for net cash consideration of US$255 million, including a recovery of US$14 million of past incurred costs, resulting in a pre-tax gain on sale of exploration and evaluation property of $224 million ($166 million after-tax). In the event that a commercial crude oil or natural gas discovery occurs on this exploration right, resulting in the exploration right being converted into a production right, an additional cash payment would be due to the Company at such time, amounting to US$450 million for a commercial crude oil discovery and US$120 million for a commercial natural gas discovery.
6. PROPERTY, PLANT AND EQUIPMENT
|
Exploration and Production
|
Oil Sands
Mining and Upgrading
|
Midstream
|
Head
Office
|
Total
|
||||||||||||||||||||||||
|
North America
|
North Sea
|
Offshore
Africa
|
||||||||||||||||||||||||||
|
Cost
|
||||||||||||||||||||||||||||
|
At December 31, 2013
|
$
|
53,810
|
$
|
5,200
|
$
|
3,356
|
$
|
19,366
|
$
|
508
|
$
|
308
|
$
|
82,548
|
||||||||||||||
|
Additions
|
6,858
|
486
|
193
|
2,728
|
62
|
45
|
10,372
|
|||||||||||||||||||||
|
Transfers from E&E assets
|
247
|
–
|
–
|
–
|
–
|
–
|
247
|
|||||||||||||||||||||
|
Disposals/derecognitions
|
(309
|
)
|
–
|
–
|
(146
|
)
|
–
|
(1
|
)
|
(456
|
)
|
|||||||||||||||||
|
Foreign exchange adjustments and other
|
–
|
496
|
309
|
–
|
–
|
–
|
805
|
|||||||||||||||||||||
|
At December 31, 2014
|
60,606
|
6,182
|
3,858
|
21,948
|
570
|
352
|
93,516
|
|||||||||||||||||||||
|
Additions
|
691
|
13
|
524
|
2,523
|
7
|
26
|
3,784
|
|||||||||||||||||||||
|
Transfers from E&E assets
|
567
|
–
|
–
|
–
|
–
|
–
|
567
|
|||||||||||||||||||||
|
Disposals/derecognitions
|
(1,324
|
)
|
–
|
–
|
(128
|
)
|
–
|
–
|
(1,452
|
)
|
||||||||||||||||||
|
Foreign exchange adjustments and other
|
–
|
1,219
|
791
|
–
|
–
|
–
|
2,010
|
|||||||||||||||||||||
|
At December 31, 2015
|
$
|
60,540
|
$
|
7,414
|
$
|
5,173
|
$
|
24,343
|
$
|
577
|
$
|
378
|
$
|
98,425
|
||||||||||||||
|
Accumulated depletion and depreciation
|
||||||||||||||||||||||||||||
|
At December 31, 2013
|
$
|
28,315
|
$
|
3,467
|
$
|
2,551
|
$
|
1,414
|
$
|
111
|
$
|
203
|
$
|
36,061
|
||||||||||||||
|
Expense
|
3,880
|
265
|
105
|
596
|
9
|
25
|
4,880
|
|||||||||||||||||||||
|
Disposals/derecognitions
|
(309
|
)
|
–
|
–
|
(146
|
)
|
–
|
(1
|
)
|
(456
|
)
|
|||||||||||||||||
|
Foreign exchange adjustments and other
|
–
|
317
|
234
|
–
|
–
|
–
|
551
|
|||||||||||||||||||||
|
At December 31, 2014
|
31,886
|
4,049
|
2,890
|
1,864
|
120
|
227
|
41,036
|
|||||||||||||||||||||
|
Expense
|
4,226
|
383
|
177
|
562
|
12
|
27
|
5,387
|
|||||||||||||||||||||
|
Disposals/derecognitions
|
(758
|
)
|
–
|
–
|
(128
|
)
|
–
|
–
|
(886
|
)
|
||||||||||||||||||
|
Foreign exchange adjustments and other
|
(7
|
)
|
832
|
592
|
(4
|
)
|
–
|
–
|
1,413
|
|||||||||||||||||||
|
At December 31, 2015
|
$
|
35,347
|
$
|
5,264
|
$
|
3,659
|
$
|
2,294
|
$
|
132
|
$
|
254
|
$
|
46,950
|
||||||||||||||
|
Net book value
- at December 31, 2015
|
$
|
25,193
|
$
|
2,150
|
$
|
1,514
|
$
|
22,049
|
$
|
445
|
$
|
124
|
$
|
51,475
|
||||||||||||||
|
- at December 31, 2014
|
$
|
28,720
|
$
|
2,133
|
$
|
968
|
$
|
20,084
|
$
|
450
|
$
|
125
|
$
|
52,480
|
||||||||||||||
|
Project costs not subject to depletion and depreciation
|
2015
|
2014
|
||||||
|
Horizon
|
$
|
6,017
|
$
|
5,492
|
||||
|
Kirby Thermal Oil Sands – North
|
$
|
816
|
$
|
681
|
||||
During 2015, the Company acquired a number of producing crude oil and natural gas properties in the North America Exploration and Production segment, including exploration and evaluation assets of $37 million, for net cash consideration of $406 million (2014 – $3,753 million; 2013 – $252 million). These transactions were accounted for using the acquisition method of accounting. In connection with these acquisitions, the Company assumed associated asset retirement obligations of $133 million (2014 – $404 million; 2013 – $131 million), other long-term liabilities of $nil (2014 – $49 million; 2013 – $nil) and recognized net deferred income tax assets of $nil (2014 – $91 million; 2013 – $75 million) related to temporary differences in the carrying amount of certain of the acquired properties and their tax bases. No debt obligations were assumed and no working capital was acquired (2014 – $28 million; 2013 – $nil). No pre-tax gains were recognized on these acquisitions in 2015 (2014 – $137 million; 2013 – $65 million).
On December 16, 2015, the Company disposed of a number of North America royalty income assets, including exploration and evaluation assets of $488 million and property, plant and equipment of $480 million, for total consideration of $1,658 million, resulting in a pre-tax gain on sale of properties of $690 million. Total consideration on the disposition was comprised of $673 million in cash, together with $985 million of non-cash share consideration of approximately 44.4 million common shares of PrairieSky Royalty Ltd. (“PrairieSky”) with a value of $22.16 per common share, determined as of the closing date. The cash consideration received on the disposition is an estimate, and may be subject to change based on the receipt of new information.
In addition, during 2015 the Company disposed of a number of North America crude oil and natural gas properties, including exploration and evaluation assets of $3 million and property, plant and equipment of $86 million, for total cash consideration of $134 million, together with associated asset retirement obligations of $4 million, resulting in a pre-tax gain on sale of properties of $49 million.
As at December 31, 2015, the Company assessed the recoverability of its property, plant and equipment and its exploration and evaluation assets, and determined the carrying amounts to be recoverable.
The Company capitalizes construction period interest for qualifying assets based on costs incurred and the Company’s cost of borrowing. Interest capitalization to a qualifying asset ceases once the asset is substantially available for its intended use. During 2015, pre-tax interest of $244 million (2014 – $204 million; 2013 – $175 million) was capitalized to property, plant and equipment using a weighted average capitalization rate of 3.9% (2014 – 3.9%; 2013 – 4.4%).
7. INVESTMENT IN PRAIRIESKY ROYALTY LTD.
On December 16, 2015, as partial consideration for the disposal of a number of North America royalty income assets, the Company received non-cash share consideration of $985 million, comprised of approximately 44.4 million common shares of PrairieSky, at $22.16 per common share determined as of the closing date (refer to Note 6). PrairieSky is in the business of acquiring and managing oil and gas royalty income assets through indirect third-party oil and gas development. As the Company’s investment constitutes less than 20% of the outstanding shares of PrairieSky, the investment is accounted for at fair value through profit or loss and is remeasured at each reporting date. As at December 31, 2015, the Company’s investment in PrairieSky of $974 million has been classified as a current asset.
Subject to certain conditions, including applicable regulatory and/or Shareholder approvals, the Company has agreed with PrairieSky that, by no later than December 31, 2016, it will distribute sufficient common shares of PrairieSky to the Company’s shareholders so that the Company, after such distribution, will hold less than 10% of the issued and outstanding common shares of PrairieSky.
The loss from investment related to PrairieSky was comprised as follows:
|
2015
|
2014
|
2013
|
||||||||||
|
Fair value loss from PrairieSky
|
$
|
11
|
$
|
–
|
$
|
–
|
||||||
|
Dividend income from PrairieSky
|
(5
|
)
|
–
|
–
|
||||||||
|
$
|
6
|
$
|
–
|
$
|
–
|
|||||||
8. OTHER LONG-TERM ASSETS
|
2015
|
2014
|
|||||||
|
Investment in North West Redwater Partnership
|
$
|
254
|
$
|
298
|
||||
|
North West Redwater Partnership subordinated debt (1)
|
254
|
120
|
||||||
|
Risk Management (note 17)
|
854
|
599
|
||||||
|
Other
|
168
|
167
|
||||||
|
1,530
|
1,184
|
|||||||
|
Less: current portion
|
375
|
510
|
||||||
|
$
|
1,155
|
$
|
674
|
|||||
| (1) | Includes accrued interest. |
The Company’s 50% interest in Redwater Partnership is accounted for using the equity method based on Redwater Partnership’s voting and decision-making structure and legal form. Redwater Partnership has entered into agreements to construct and operate a 50,000 barrel per day bitumen upgrader and refinery (the "Project") under processing agreements that target to process 12,500 barrels per day of bitumen feedstock for the Company and 37,500 barrels per day of bitumen feedstock for the Alberta Petroleum Marketing Commission (“APMC”), an agent of the Government of Alberta, under a 30 year fee-for-service tolling agreement.
During 2013, the Company, along with APMC, each committed to provide funding up to $350 million by January 2016 in the form of subordinated debt bearing interest at prime plus 6%. During 2015, the Company and APMC each provided $112 million of subordinated debt (2014 – $113 million, 2013 – $nil). Subsequent to December 31, 2015, the Company and APMC each provided an additional $99 million in subordinated debt. Should final Project costs exceed the revised cost estimate, the Company and APMC have agreed, subject to the Company being able to meet certain funding conditions, to fund any shortfall in available third party commercial lending required to attain Project completion.
During 2015, Redwater Partnership issued $500 million of 2.10% series C senior secured bonds due February 2022, $500 million of 3.70% series D senior secured bonds due February 2043, $500 million of 3.20% series E senior secured bonds due April 2026, and $300 million of senior secured bonds through the reopening of its previously issued 4.05% series B senior secured bonds due July 2044. Subsequent to December 31, 2015, Redwater Partnership issued $550 million of 4.25% series F senior secured bonds due June 2029, and $300 million of 4.75% series G senior secured bonds due June 2037.
During 2014, Redwater Partnership issued $500 million of 3.20% series A senior secured bonds due July 2024 and $500 million of 4.05% series B senior secured bonds due July 2044. During 2014, Redwater Partnership also executed a $3,500 million syndicated credit facility with a group of financial institutions maturing June 2018 and repaid and cancelled its $1,200 million credit facility previously in place. As at December 31, 2015, Redwater Partnership had borrowings of $1,417 million under its secured $3,500 million syndicated credit facility.
Under its processing agreement, beginning on the earlier of the commercial operations date of the refinery and June 1, 2018, the Company is unconditionally obligated to pay its 25% pro rata share of the debt portion of the monthly cost of service toll, including interest, fees and principal repayments, of the syndicated credit facility and bonds, over the tolling period of 30 years.
Redwater Partnership has entered into various agreements related to the engineering, procurement and construction of the Project. These contracts can be cancelled by Redwater Partnership upon notice without penalty, subject to the costs incurred up to and in respect of the cancellation.
The assets, liabilities, partners’ equity and equity loss related to Redwater Partnership and the Company’s 50% interest at December 31, 2015 were comprised as follows:
|
2015
|
2014
|
|||||||||||||||
|
Redwater Partnership
100% interest
|
Company
50% interest
|
Redwater
Partnership
100% interest
|
Company
50% interest
|
|||||||||||||
|
Current assets
|
$
|
138
|
$
|
69
|
$
|
132
|
$
|
66
|
||||||||
|
Non-current assets
|
$
|
5,834
|
$
|
2,917
|
$
|
3,062
|
$
|
1,531
|
||||||||
|
Current liabilities
|
$
|
678
|
$
|
339
|
$
|
454
|
$
|
227
|
||||||||
|
Non-current liabilities
|
$
|
4,786
|
$
|
2,393
|
$
|
2,144
|
$
|
1,072
|
||||||||
|
Partners’ equity
|
$
|
508
|
$
|
254
|
$
|
596
|
$
|
298
|
||||||||
|
Equity loss
|
$
|
88
|
$
|
44
|
$
|
16
|
$
|
8
|
||||||||
9. LONG-TERM DEBT
|
2015
|
2014
|
|||||||
|
Canadian dollar denominated debt, unsecured
|
||||||||
|
Bank credit facilities
|
$
|
2,385
|
$
|
2,404
|
||||
|
Medium-term notes
|
||||||||
|
4.95% debentures due June 1, 2015
|
–
|
400
|
||||||
|
3.05% debentures due June 19, 2019
|
500
|
500
|
||||||
|
2.60% debentures due December 3, 2019
|
500
|
500
|
||||||
|
2.89% debentures due August 14, 2020
|
1,000
|
500
|
||||||
|
3.55% debentures due June 3, 2024
|
500
|
500
|
||||||
|
4,885
|
4,804
|
|||||||
|
US dollar denominated debt, unsecured
|
||||||||
|
Bank credit facilities (December 31, 2015 – US$657 million;
December 31, 2014 – $nil)
|
909
|
–
|
||||||
|
Commercial paper (US$500 million)
|
692
|
580
|
||||||
|
US dollar debt securities
|
||||||||
|
Three-month LIBOR plus 0.375% due March 30, 2016
(US$500 million)
|
692
|
580
|
||||||
|
6.00% due August 15, 2016 (US$250 million)
|
346
|
290
|
||||||
|
5.70% due May 15, 2017 (US$1,100 million)
|
1,523
|
1,276
|
||||||
|
1.75% due January 15, 2018 (US$600 million)
|
830
|
696
|
||||||
|
5.90% due February 1, 2018 (US$400 million)
|
554
|
464
|
||||||
|
3.45% due November 15, 2021 (US$500 million)
|
692
|
580
|
||||||
|
3.80% due April 15, 2024 (US$500 million)
|
692
|
580
|
||||||
|
3.90% due February 1, 2025 (US$600 million)
|
830
|
696
|
||||||
|
7.20% due January 15, 2032 (US$400 million)
|
554
|
464
|
||||||
|
6.45% due June 30, 2033 (US$350 million)
|
484
|
406
|
||||||
|
5.85% due February 1, 2035 (US$350 million)
|
484
|
406
|
||||||
|
6.50% due February 15, 2037 (US$450 million)
|
622
|
523
|
||||||
|
6.25% due March 15, 2038 (US$1,100 million)
|
1,523
|
1,276
|
||||||
|
6.75% due February 1, 2039 (US$400 million)
|
554
|
464
|
||||||
|
11,981
|
9,281
|
|||||||
|
Long-term debt before transaction costs and original issue discounts, net
|
16,866
|
14,085
|
||||||
|
Less: original issue discounts, net (1)
|
(10
|
)
|
(21
|
)
|
||||
|
transaction costs (1) (2)
|
(62
|
)
|
(62
|
)
|
||||
|
16,794
|
14,002
|
|||||||
|
Less: current portion of commercial paper
|
692
|
580
|
||||||
|
current portion of long-term debt (1) (2)
|
1,037
|
400
|
||||||
|
$
|
15,065
|
$
|
13,022
|
|||||
| (1) | The Company has included unamortized original issue discounts and premiums, and directly attributable transaction costs in the carrying amount of the outstanding debt. |
| (2) | Transaction costs primarily represent underwriting commissions charged as a percentage of the related debt offerings, as well as legal, rating agency and other professional fees. |
Bank Credit Facilities and Commercial Paper
As at December 31, 2015, the Company had in place bank credit facilities of $7,481 million available for general corporate purposes, comprised of:
| · | a $100 million demand credit facility; |
| · | a $1,000 million non-revolving term credit facility maturing January 2017; |
| · | a $1,500 million non-revolving term credit facility maturing April 2018; |
| · | a $2,425 million revolving syndicated credit facility maturing June 2019; |
| · | a $2,425 million revolving syndicated credit facility maturing June 2020; and, |
| · | a £15 million demand credit facility related to the Company’s North Sea operations. |
During 2015, the previously existing $1,500 million revolving syndicated credit facility was increased to $2,425 million and the maturity date was extended to June 2019 from June 2016. The previously existing $3,000 million revolving syndicated credit facility was reduced to $2,425 million and the maturity date was extended to June 2020 from June 2017. Each of the $2,425 million revolving facilities is extendible annually at the mutual agreement of the Company and the lenders. If the facilities are not extended, the full amount of the outstanding principal would be repayable on the maturity date. Borrowings under these facilities may be made by way of pricing referenced to Canadian dollar or US dollar bankers’ acceptances, or LIBOR, US base rate or Canadian prime loans.
During 2015, the $1,000 million non-revolving term credit facility originally maturing March 2016 was extended to January 2017. The facility was fully drawn as at December 31, 2015. Borrowings under this facility may be made by way of pricing referenced to Canadian dollar bankers’ acceptances or Canadian prime loans. Subsequent to December 31, 2015, the Company prepaid $250 million of the borrowings then outstanding and extended the facility to February 2019 from January 2017. Subsequent to December 31, 2015, the Company also entered into a new $125 million non-revolving term credit facility maturing February 2019, which was fully drawn. Borrowings under this facility may be made by way of pricing referenced to Canadian dollar bankers’ acceptances or Canadian prime loans.
In addition, during 2015, the Company entered into a new $1,500 million non-revolving credit facility maturing April 2018. Borrowings under this facility may be made by way of pricing referenced to Canadian dollar or US dollar bankers’ acceptances, or LIBOR, US base rate or Canadian prime loans. The facility was fully drawn as at December 31, 2015.
During 2015, all of the Company’s credit facilities became subject to a revised financial covenant that the Consolidated Debt to Capitalization Ratio, as defined in the credit agreements, shall not be more than 0.65 to 1.0.
The Company’s borrowings under its US commercial paper program are authorized up to a maximum US$2,500 million. The Company reserves capacity under its bank credit facilities for amounts outstanding under this program.
The Company’s weighted average interest rate on bank credit facilities and commercial paper outstanding as at December 31, 2015, was 1.7% (December 31, 2014 – 2.2%), and on long-term debt outstanding for the year ended December 31, 2015 was 3.9% (December 31, 2014 – 3.9%).
At December 31, 2015 letters of credit and guarantees aggregating $335 million, including a $39 million financial guarantee related to Horizon and $175 million of letters of credit related to North Sea operations, were outstanding. The letters of credit are supported by dedicated credit facilities.
Medium-Term Notes
During 2015, the Company issued $500 million of series 2 medium-term notes, due August 2020, through the reopening of its previously issued 2.89% notes under a previous base shelf prospectus and repaid $400 million of 4.95% medium term notes.
In October 2015, the Company filed a base shelf prospectus that allows for the offer for sale from time to time of up to $3,000 million of medium-term notes in Canada, which expires in November 2017. If issued, these securities may be offered in amounts and at prices, including interest rates, to be determined based on market conditions at the time of issuance.
During 2014, the Company issued $500 million of 2.60% medium-term notes due December 2019 and $500 million of 3.55% medium-term notes due June 2024.
US Dollar Debt Securities
In October 2015, the Company filed a base shelf prospectus that allows for the offer for sale from time to time of up to US$3,000 million of debt securities in the United States, which expires in November 2017. If issued, these securities may be offered in amounts and at prices, including interest rates, to be determined based on market conditions at the time of issuance.
During 2014, the Company issued US$500 million of three-month LIBOR plus 0.375% notes due March 2016, and concurrently entered into cross currency swaps to fix the foreign currency exchange rate risk at three-month CDOR plus 0.309% and $555 million (note 17). In addition, the Company issued US$500 million of 3.80% notes due April 2024, US$600 million of 1.75% notes due January 2018, and US$600 million of 3.90% notes due February 2025. In addition, the Company repaid US$500 million of 1.45% notes and US$350 million of 4.90% notes.
Scheduled Debt Repayments
Scheduled debt repayments are as follows:
|
Year
|
Repayment
|
|||
|
2016
|
$
|
1,730
|
||
|
2017
|
$
|
2,522
|
||
|
2018
|
$
|
2,899
|
||
|
2019
|
$
|
1,353
|
||
|
2020
|
$
|
1,427
|
||
|
Thereafter
|
$
|
6,935
|
||
10. OTHER LONG-TERM LIABILITIES
|
2015
|
2014
|
|||||||
|
Asset retirement obligations
|
$
|
2,950
|
$
|
4,221
|
||||
|
Share-based compensation
|
128
|
203
|
||||||
|
Other
|
18
|
70
|
||||||
|
3,096
|
4,494
|
|||||||
|
Less: current portion
|
206
|
319
|
||||||
|
$
|
2,890
|
$
|
4,175
|
|||||
Asset Retirement Obligations
The Company’s asset retirement obligations are expected to be settled on an ongoing basis over a period of approximately 60 years and have been discounted using a weighted average discount rate of 5.9% (2014 – 4.6%; 2013 – 5.0%). Reconciliations of the discounted asset retirement obligations were as follows:
|
2015
|
2014
|
2013
|
||||||||||
|
Balance – beginning of year
|
$
|
4,221
|
$
|
4,162
|
$
|
4,266
|
||||||
|
Liabilities incurred
|
7
|
41
|
62
|
|||||||||
|
Liabilities acquired, net
|
129
|
404
|
131
|
|||||||||
|
Liabilities settled
|
(370
|
)
|
(346
|
)
|
(207
|
)
|
||||||
|
Asset retirement obligation accretion
|
173
|
193
|
171
|
|||||||||
|
Revision of cost, inflation rates and timing estimates
|
(313
|
)
|
(907
|
)
|
375
|
|||||||
|
Change in discount rate
|
(1,150
|
)
|
558
|
(723
|
)
|
|||||||
|
Foreign exchange adjustments
|
253
|
116
|
87
|
|||||||||
|
Balance – end of year
|
2,950
|
4,221
|
4,162
|
|||||||||
|
Less: current portion
|
101
|
121
|
–
|
|||||||||
|
$
|
2,849
|
$
|
4,100
|
$
|
4,162
|
|||||||
Segmented Asset Retirement Obligations
|
2015
|
2014
|
|||||||
|
Exploration and Production
|
||||||||
|
North America
|
$
|
1,114
|
$
|
2,012
|
||||
|
North Sea
|
975
|
1,169
|
||||||
|
Offshore Africa
|
266
|
255
|
||||||
|
Oil Sands Mining and Upgrading
|
594
|
783
|
||||||
|
Midstream
|
1
|
2
|
||||||
|
$
|
2,950
|
$
|
4,221
|
|||||
Share-Based Compensation
As the Company’s Option Plan provides current employees with the right to elect to receive common shares or a cash payment in exchange for stock options surrendered, a liability for potential cash settlements is recognized. The current portion represents the maximum amount of the liability payable within the next twelve month period if all vested stock options are surrendered for cash settlement.
|
2015
|
2014
|
2013
|
||||||||||
|
Balance – beginning of year
|
$
|
203
|
$
|
260
|
$
|
154
|
||||||
|
Share-based compensation (recovery) expense
|
(46
|
)
|
66
|
135
|
||||||||
|
Cash payment for stock options surrendered
|
(1
|
)
|
(8
|
)
|
(4
|
)
|
||||||
|
Transferred to common shares
|
(18
|
)
|
(129
|
)
|
(50
|
)
|
||||||
|
(Recovered from) capitalized to Oil Sands Mining and Upgrading
|
(10
|
)
|
14
|
25
|
||||||||
|
Balance – end of year
|
128
|
203
|
260
|
|||||||||
|
Less: current portion
|
105
|
158
|
216
|
|||||||||
|
$
|
23
|
$
|
45
|
$
|
44
|
|||||||
The share-based compensation liability of $128 million at December 31, 2015 (2014 – $203 million; 2013 – $260 million) was estimated using the Black-Scholes valuation model with the following weighted average assumptions:
|
2015
|
2014
|
2013
|
||||||||||
|
Fair value
|
$
|
3.06
|
$
|
5.51
|
$
|
7.08
|
||||||
|
Share price
|
$
|
30.22
|
$
|
35.92
|
$
|
35.94
|
||||||
|
Expected volatility
|
28.6%
|
|
25.1%
|
|
27.2%
|
|
||||||
|
Expected dividend yield
|
3.0%
|
|
2.5%
|
|
2.2%
|
|
||||||
|
Risk free interest rate
|
0.6%
|
|
1.2%
|
|
1.5%
|
|
||||||
|
Expected forfeiture rate
|
4.8%
|
|
4.7%
|
|
4.6%
|
|
||||||
|
Expected stock option life (1)
|
4.5 years
|
4.5 years
|
4.5 years
|
|||||||||
| (1) | At original time of grant. |
The intrinsic value of vested stock options at December 31, 2015 was $10 million (2014 – $40 million; 2013 – $72 million).
11. INCOME TAXES
The provision for income tax was as follows:
|
2015
|
2014
|
2013
|
||||||||||
|
Current corporate income tax expense – North America
|
$
|
86
|
$
|
702
|
$
|
544
|
||||||
|
Current corporate income tax (recovery) expense – North Sea
|
(117
|
)
|
(68
|
)
|
23
|
|||||||
|
Current corporate income tax expense – Offshore Africa(1)
|
17
|
43
|
202
|
|||||||||
|
Current PRT(2) recovery – North Sea
|
(258
|
)
|
(273
|
)
|
(56
|
)
|
||||||
|
Other taxes
|
11
|
23
|
22
|
|||||||||
|
Current income tax (recovery) expense
|
(261
|
)
|
427
|
735
|
||||||||
|
Deferred corporate income tax expense
|
216
|
681
|
163
|
|||||||||
|
Deferred PRT(2) expense (recovery) – North Sea
|
15
|
126
|
(132
|
)
|
||||||||
|
Deferred income tax expense
|
231
|
807
|
31
|
|||||||||
|
Income tax (recovery) expense
|
$
|
(30
|
)
|
$
|
1,234
|
$
|
766
|
|||||
| (1) | Includes current income taxes relating to disposition of properties in 2013. |
| (2) | Petroleum Revenue Tax. |
The provision for income tax is different from the amount computed by applying the combined statutory Canadian federal and provincial income tax rates to earnings before taxes. The reasons for the difference are as follows:
|
2015
|
2014
|
2013
|
||||||||||
|
Canadian statutory income tax rate
|
26.0%
|
|
25.1%
|
|
25.1%
|
|
||||||
|
Income tax provision at statutory rate
|
$
|
(173
|
)
|
$
|
1,296
|
$
|
762
|
|||||
|
Effect on income taxes of:
|
||||||||||||
|
UK PRT and other taxes
|
(232
|
)
|
(124
|
)
|
(166
|
)
|
||||||
|
Impact of deductible UK PRT and other taxes on corporate
income tax
|
119
|
85
|
111
|
|||||||||
|
Foreign and domestic tax rate differentials
|
(157
|
)
|
(61
|
)
|
(66
|
)
|
||||||
|
Non-taxable portion of capital gains/losses
|
36
|
36
|
14
|
|||||||||
|
Stock options exercised for common shares
|
(12
|
)
|
14
|
33
|
||||||||
|
Income tax rate and other legislative changes
|
362
|
–
|
15
|
|||||||||
|
Non-taxable gain on corporate acquisitions
|
–
|
(34
|
)
|
(16
|
)
|
|||||||
|
Revisions arising from prior year tax filings
|
32
|
5
|
57
|
|||||||||
|
Other
|
(5
|
)
|
17
|
22
|
||||||||
|
Income tax (recovery) expense
|
$
|
(30
|
)
|
$
|
1,234
|
$
|
766
|
|||||
The following table summarizes the temporary differences that give rise to the net deferred income tax liability:
|
2015
|
2014
|
|||||||
|
Deferred income tax liabilities
|
||||||||
|
Property, plant and equipment and exploration and evaluation assets
|
$
|
10,257
|
$
|
9,985
|
||||
|
Timing of partnership items
|
261
|
437
|
||||||
|
Unrealized risk management activities
|
111
|
120
|
||||||
|
Unrealized foreign exchange gain on long-term debt
|
–
|
10
|
||||||
|
Deferred PRT
|
65
|
37
|
||||||
|
Investment in PrairieSky
|
60
|
–
|
||||||
|
10,754
|
10,589
|
|||||||
|
Deferred income tax assets
|
||||||||
|
Asset retirement obligations
|
(976
|
)
|
(1,362
|
)
|
||||
|
Loss carryforwards
|
(170
|
)
|
(117
|
)
|
||||
|
Unrealized foreign exchange loss on long-term debt
|
(212
|
)
|
–
|
|||||
|
PRT deduction for corporate income tax
|
(33
|
)
|
(23
|
)
|
||||
|
Other
|
(19
|
)
|
(117
|
)
|
||||
|
(1,410
|
)
|
(1,619
|
)
|
|||||
|
Net deferred income tax liability
|
$
|
9,344
|
$
|
8,970
|
||||
Movements in deferred tax assets and liabilities recognized in net earnings during the year were as follows:
|
2015
|
2014
|
2013
|
||||||||||
|
Property, plant and equipment and exploration and evaluation
assets
|
$
|
(7
|
)
|
$
|
647
|
$
|
250
|
|||||
|
Timing of partnership items
|
(176
|
)
|
(195
|
)
|
(199
|
)
|
||||||
|
Unrealized foreign exchange loss on long-term debt
|
(222
|
)
|
(77
|
)
|
(55
|
)
|
||||||
|
Unrealized risk management activities
|
(5
|
)
|
142
|
13
|
||||||||
|
Asset retirement obligations
|
522
|
119
|
76
|
|||||||||
|
Loss carryforwards
|
(53
|
)
|
109
|
25
|
||||||||
|
Investment in PrairieSky
|
60
|
–
|
–
|
|||||||||
|
Deferred PRT
|
15
|
126
|
(132
|
)
|
||||||||
|
PRT deduction for corporate income tax
|
(5
|
)
|
(77
|
)
|
78
|
|||||||
|
Other
|
102
|
13
|
(25
|
)
|
||||||||
|
$
|
231
|
$
|
807
|
$
|
31
|
|||||||
The following table summarizes the movements of the net deferred income tax liability during the year:
|
2015
|
2014
|
2013
|
||||||||||
|
Balance – beginning of year
|
$
|
8,970
|
$
|
8,183
|
$
|
8,174
|
||||||
|
Deferred income tax expense
|
231
|
807
|
31
|
|||||||||
|
Deferred income tax (recovery) expense included in other
comprehensive income
|
(4
|
)
|
1
|
–
|
||||||||
|
Foreign exchange adjustments
|
147
|
70
|
53
|
|||||||||
|
Business combinations
|
–
|
(91
|
)
|
(75
|
)
|
|||||||
|
Balance – end of year
|
$
|
9,344
|
$
|
8,970
|
$
|
8,183
|
||||||
Current income taxes recognized in each operating segment will vary depending upon available income tax deductions related to the nature, timing and amount of capital expenditures incurred in any particular year.
During 2015, the Alberta government enacted legislation that increased the provincial corporate income tax rate from 10% to 12% effective July 1, 2015. As a result of this income tax rate increase, the Company’s deferred income tax liability was increased by $579 million.
During 2015, the UK government enacted legislation that reduced the supplementary charge on oil and gas profits from 32% to 20% effective January 1, 2015. In addition, the legislation reduced the PRT rate from 50% to 35% effective January 1, 2016. Allowable abandonment expenditures eligible for carryback to prior taxation years for PRT purposes are still recoverable at the previous tax rate of 50%. The legislation also replaced the existing Brownfield Allowance with a new Investment Allowance on qualifying capital expenditures, effective April 1, 2015. The new Investment Allowance is deductible for supplementary charge purposes, subject to certain restrictions. As a result of these income tax changes, the Company’s deferred income tax liability was reduced by $217 million and the deferred PRT liability was reduced by $11 million.
During 2013, the British Columbia government substantively enacted legislation to increase its provincial corporate income tax rate effective April 1, 2013. As a result of this income tax rate change, the Company’s deferred income tax liability was increased by $15 million.
The Company files income tax returns in the various jurisdictions in which it operates. These tax returns are subject to periodic examinations in the normal course by the applicable tax authorities. The tax returns as prepared may include filing positions that could be subject to differing interpretations of applicable tax laws and regulations, which may take several years to resolve. The Company does not believe the ultimate resolution of these matters will have a material impact upon the Company’s results of operations, financial position or liquidity.
Deferred income tax assets are recognized for temporary differences to the extent that the realization of the related tax benefit through future taxable profits is probable. The Company has not recognized deferred income tax assets with respect to taxable capital loss carryforwards in excess of $1,000 million in North America, which can be carried forward indefinitely and only applied against future taxable capital gains. In addition, the Company has not recognized deferred income tax assets related to North American tax pools of approximately $650 million, which can only be claimed against income from certain oil and gas properties.
Deferred income tax liabilities have not been recognized on the unremitted net earnings of wholly controlled subsidiaries. The Company is able to control the timing and amount of distributions and no taxes are payable on distributions from these subsidiaries provided that the distributions remain within certain limits.
12. SHARE CAPITAL
Authorized
Preferred shares issuable in a series.
Unlimited number of common shares without par value.
Issued
|
2015
|
2014
|
|||||||||||||||
|
Common shares
|
Number
of shares (thousands)
|
Amount
|
Number
of shares (thousands)
|
Amount
|
||||||||||||
|
Balance – beginning of year
|
1,091,837
|
$
|
4,432
|
1,087,322
|
$
|
3,854
|
||||||||||
|
Issued upon exercise of stock options
|
2,831
|
91
|
14,610
|
488
|
||||||||||||
|
Previously recognized liability on stock options exercised for
common shares
|
–
|
18
|
–
|
129
|
||||||||||||
|
Purchase of common shares under Normal Course Issuer Bid
|
–
|
(10,095
|
)
|
(39
|
)
|
|||||||||||
|
Balance – end of year
|
1,094,668
|
$
|
4,541
|
1,091,837
|
$
|
4,432
|
||||||||||
Preferred Shares
Preferred shares are issuable in a series. If issued, the number of shares in each series, and the designation, rights, privileges, restrictions and conditions attached to the shares will be determined by the Board of Directors of the Company.
Dividend Policy
The Company has paid regular quarterly dividends in each year since 2001. The dividend policy undergoes periodic review by the Board of Directors and is subject to change.
On March 2, 2016, the Board of Directors declared a quarterly dividend of $0.23 per common share, beginning with the dividend payable on April 1, 2016. On March 4, 2015 the Board of Directors declared a quarterly dividend of $0.23 per common share, beginning with the dividend payable on April 1, 2015. On March 5, 2014, the Board of Directors declared a quarterly dividend of $0.225 per common share, beginning with the dividend payable on April 1, 2014. On November 5, 2013, the Board of Directors declared a dividend of $0.20 per common share, beginning with the dividend payable on January 1, 2014 ($0.125 per common share, declared on March 6, 2013, beginning with the dividend payable on April 1, 2013).
Normal Course Issuer Bid
In 2015, the Company announced a Normal Course Issuer Bid to purchase, through the facilities of the Toronto Stock Exchange, alternative Canadian trading platforms, and the New York Stock Exchange, during the twelve month period commencing April 2015 and ending April 2016, up to 54,640,607 common shares. The Company’s Normal Course Issuer Bid announced in 2014 expired April 2015.
During 2015, the Company did not purchase any common shares for cancellation. During 2014, the Company purchased for cancellation 10,095,000 common shares (2013 – 10,164,800 common shares) at a weighted average price of $44.85 per common share (2013 – $31.46 per common share), for a total cost of $453 million (2013 – $320 million). Retained earnings were reduced by $414 million (2013 – $285 million), representing the excess of the purchase price of common shares over their average carrying value.
Stock Options
The Company’s Option Plan provides for the granting of stock options to employees. Stock options granted under the Option Plan have terms ranging from five to six years to expiry and vest over a five-year period. The exercise price of each stock option granted is determined at the closing market price of the common shares on the Toronto Stock Exchange on the day prior to the grant. Each stock option granted provides the holder the choice to purchase one common share of the Company at the stated exercise price or receive a cash payment equal to the difference between the stated exercise price and the market price of the Company’s common shares on the date of surrender of the stock option.
The Option Plan is a "rolling 9%" plan, whereby the aggregate number of common shares that may be reserved for issuance under the plan shall not exceed 9% of the common shares outstanding from time to time.
The following table summarizes information relating to stock options outstanding at December 31, 2015 and 2014:
|
2015
|
2014
|
|||||||||||||||
|
Stock options (thousands)
|
Weighted average exercise price
|
Stock options (thousands)
|
Weighted average
exercise price
|
|||||||||||||
|
Outstanding – beginning of year
|
71,708
|
$
|
35.60
|
72,741
|
$
|
34.36
|
||||||||||
|
Granted
|
13,310
|
$
|
30.56
|
18,517
|
$
|
38.70
|
||||||||||
|
Surrendered for cash settlement
|
(185
|
)
|
$
|
33.30
|
(1,047
|
)
|
$
|
33.74
|
||||||||
|
Exercised for common shares
|
(2,831
|
)
|
$
|
32.31
|
(14,610
|
)
|
$
|
33.40
|
||||||||
|
Forfeited
|
(7,387
|
)
|
$
|
35.12
|
(3,893
|
)
|
$
|
36.00
|
||||||||
|
Outstanding – end of year
|
74,615
|
$
|
34.88
|
71,708
|
$
|
35.60
|
||||||||||
|
Exercisable – end of year
|
30,567
|
$
|
36.19
|
23,717
|
$
|
36.27
|
||||||||||
The range of exercise prices of stock options outstanding and exercisable at December 31, 2015 was as follows:
|
Stock options outstanding
|
Stock options exercisable
|
|||||||||||||||||||||
|
Range of exercise prices
|
Stock options
outstanding
(thousands)
|
Weighted
average
remaining
term (years)
|
Weighted
average
exercise price
|
Stock options
exercisable
(thousands)
|
Weighted
average
exercise price
|
|||||||||||||||||
|
$
|
27.72-$29.99
|
17,849
|
3.47
|
$
|
$28.53
|
4,919
|
$
|
$28.25
|
||||||||||||||
|
$
|
30.00-$34.99
|
20,255
|
3.26
|
$
|
$33.18
|
6,598
|
$
|
$33.48
|
||||||||||||||
|
$
|
35.00-$39.99
|
22,793
|
2.54
|
$
|
$36.48
|
11,053
|
$
|
$36.82
|
||||||||||||||
|
$
|
40.00-$44.99
|
12,152
|
1.76
|
$
|
$42.71
|
7,434
|
$
|
$42.23
|
||||||||||||||
|
$
|
45.00-$45.09
|
1,566
|
3.03
|
$
|
$45.07
|
563
|
$
|
$45.05
|
||||||||||||||
|
74,615
|
2.84
|
$
|
$34.88
|
30,567
|
$
|
$36.19
|
||||||||||||||||
13. ACCUMULATED OTHER COMPREHENSIVE INCOME
The components of accumulated other comprehensive income, net of taxes, were as follows:
|
2015
|
2014
|
|||||||
|
Derivative financial instruments designated as cash flow hedges
|
$
|
58
|
$
|
94
|
||||
|
Foreign currency translation adjustment
|
17
|
(43
|
)
|
|||||
|
$
|
75
|
$
|
51
|
|||||
14. CAPITAL DISCLOSURES
The Company does not have any externally imposed regulatory capital requirements for managing capital. The Company has defined its capital to mean its long-term debt and consolidated shareholders’ equity, as determined at each reporting date.
The Company’s objectives when managing its capital structure are to maintain financial flexibility and balance to enable the Company to access capital markets to sustain its on-going operations and to support its growth strategies. The Company primarily monitors capital on the basis of an internally derived financial measure referred to as its "debt to book capitalization ratio", which is the arithmetic ratio of current and long-term debt divided by the sum of the carrying value of shareholders’ equity plus current and long-term debt. The Company’s internal targeted range for its debt to book capitalization ratio is 25% to 45%. This range may be exceeded in periods when a combination of capital projects, acquisitions, or lower commodity prices occurs. The Company may be below the low end of the targeted range when cash flow from operating activities is greater than current investment activities. At December 31, 2015, the ratio was within the target range at 38%.
Readers are cautioned that the debt to book capitalization ratio is not defined by IFRS and this financial measure may not be comparable to similar measures presented by other companies. Further, there are no assurances that the Company will continue to use this measure to monitor capital or will not alter the method of calculation of this measure in the future.
|
2015
|
2014
|
|||||||
|
Long-term debt (1)
|
$
|
16,794
|
$
|
14,002
|
||||
|
Total shareholders’ equity
|
$
|
27,381
|
$
|
28,891
|
||||
|
Debt to book capitalization
|
38%
|
|
33%
|
|
||||
| (1) | Includes the current portion of long-term debt. |
15. NET EARNINGS (LOSS) PER COMMON SHARE
|
2015
|
2014
|
2013
|
|||||||||||
|
Weighted average common shares outstanding
– basic (thousands of shares)
|
1,093,862
|
1,091,754
|
1,088,682
|
||||||||||
|
Effect of dilutive stock options (thousands of shares)
|
–
|
5,068
|
1,859
|
||||||||||
|
Weighted average common shares outstanding
– diluted (thousands of shares)
|
1,093,862
|
1,096,822
|
1,090,541
|
||||||||||
|
Net earnings (loss)
|
$
|
(637
|
)
|
$
|
3,929
|
$
|
2,270
|
||||||
|
Net earnings (loss) per common share
|
– basic |
$
|
(0.58
|
)
|
$
|
3.60
|
$
|
2.08
|
|||||
|
– diluted
|
$
|
(0.58
|
)
|
$
|
3.58
|
$
|
2.08
|
||||||
In 2015, the Company excluded 62,757,000 potentially anti-dilutive stock options from the calculation of diluted earnings per common share.
16. INTEREST AND OTHER FINANCING EXPENSE
|
2015
|
2014
|
2013
|
||||||||||
|
Interest and other financing expense:
|
||||||||||||
|
Long-term debt
|
$
|
618
|
$
|
542
|
$
|
457
|
||||||
|
Other (1)
|
1
|
(7
|
)
|
(2
|
)
|
|||||||
|
619
|
535
|
455
|
||||||||||
|
Less: amounts capitalized on qualifying assets
|
244
|
204
|
175
|
|||||||||
|
Total interest and other financing expense
|
375
|
331
|
280
|
|||||||||
|
Total interest income
|
(53
|
)
|
(8
|
)
|
(1
|
)
|
||||||
|
Net interest and other financing expense
|
$
|
322
|
$
|
323
|
$
|
279
|
||||||
|
(1)
|
Includes the fair value impact of interest rate swaps on US dollar debt securities.
|
17. FINANCIAL INSTRUMENTS
The carrying amounts of the Company’s financial instruments by category were as follows:
|
2015
|
||||||||||||||||||||
|
Asset (liability)
|
Financial
assets
at amortized
cost
|
Fair value
through
profit or loss
|
Derivatives
used for
hedging
|
Financial
liabilities at amortized
cost
|
Total
|
|||||||||||||||
|
Accounts receivable
|
$
|
1,277
|
$
|
–
|
$
|
–
|
$
|
–
|
$
|
1,277
|
||||||||||
|
Investment in PrairieSky
|
–
|
974
|
–
|
–
|
974
|
|||||||||||||||
|
Other long-term assets
|
254
|
36
|
818
|
–
|
1,108
|
|||||||||||||||
|
Accounts payable
|
–
|
–
|
–
|
(571
|
)
|
(571
|
)
|
|||||||||||||
|
Accrued liabilities
|
–
|
–
|
–
|
(2,089
|
)
|
(2,089
|
)
|
|||||||||||||
|
Long-term debt (1)
|
–
|
–
|
–
|
(16,794
|
)
|
(16,794
|
)
|
|||||||||||||
|
$
|
1,531
|
$
|
1,010
|
$
|
818
|
$
|
(19,454
|
)
|
$
|
(16,095
|
)
|
|||||||||
|
2014
|
||||||||||||||||||||
|
Asset (liability)
|
Financial
assets
at amortized
cost
|
Fair value
through
profit or loss
|
Derivatives
used for
hedging
|
Financial
liabilities at amortized
cost
|
Total
|
|||||||||||||||
|
Accounts receivable
|
$
|
1,889
|
$
|
–
|
$
|
–
|
$
|
–
|
$
|
1,889
|
||||||||||
|
Other long-term assets
|
120
|
415
|
184
|
–
|
719
|
|||||||||||||||
|
Accounts payable
|
–
|
–
|
–
|
(564
|
)
|
(564
|
)
|
|||||||||||||
|
Accrued liabilities
|
–
|
–
|
–
|
(3,279
|
)
|
(3,279
|
)
|
|||||||||||||
|
Other long-term liabilities
|
–
|
–
|
–
|
(40
|
)
|
(40
|
)
|
|||||||||||||
|
Long-term debt (1)
|
–
|
–
|
–
|
(14,002
|
)
|
(14,002
|
)
|
|||||||||||||
|
$
|
2,009
|
$
|
415
|
$
|
184
|
$
|
(17,885
|
)
|
$
|
(15,277
|
)
|
|||||||||
| (1) | Includes the current portion of long-term debt. |
The carrying amounts of the Company’s financial instruments approximated their fair value, except for fixed rate long-term debt as noted below. The fair values of the Company’s recurring other long-term assets and fixed rate long-term debt are outlined below:
|
2015
|
||||||||||||||||
|
Carrying amount
|
Fair value
|
|||||||||||||||
|
Asset (liability) (1) (2)
|
Level 1
|
Level 2
|
Level 3
|
|||||||||||||
|
Investment in PrairieSky (3)
|
$
|
974
|
$
|
974
|
$
|
–
|
$
|
–
|
||||||||
|
Other long-term assets (4)
|
$
|
1,108
|
$
|
–
|
$
|
854
|
$
|
254
|
||||||||
|
Fixed rate long-term debt (5) (6)
|
$
|
(12,808
|
)
|
$
|
(12,431
|
)
|
$
|
–
|
$
|
–
|
||||||
|
2014
|
||||||||||||||||
|
Carrying amount
|
Fair value
|
|||||||||||||||
|
Asset (liability) (1) (2)
|
Level 1
|
Level 2
|
Level 3
|
|||||||||||||
|
Other long-term assets (4)
|
$
|
719
|
$
|
–
|
$
|
599
|
$
|
120
|
||||||||
|
Fixed rate long-term debt (5) (6)
|
$
|
(11,018
|
)
|
$
|
(11,855
|
)
|
$
|
–
|
$
|
–
|
||||||
| (1) | Excludes financial assets and liabilities where the carrying amount approximates fair value due to the liquid nature of the asset or liability (cash and cash equivalents, accounts receivable, accounts payable and accrued liabilities). |
| (2) | There were no transfers between Level 1, 2 and 3 financial instruments. |
| (3) | The fair value of the investment in PrairieSky is based on quoted market prices. |
| (4) | The fair value of North West Redwater Partnership subordinated debt is based on the present value of future cash receipts. |
| (5) | The fair value of fixed rate long-term debt has been determined based on quoted market prices. |
| (6) | Includes the current portion of fixed rate long-term debt. |
The following provides a summary of the carrying amounts of derivative financial instruments held and a reconciliation to the Company’s consolidated balance sheets.
|
Asset (liability)
|
2015
|
2014
|
||||||
|
Derivatives held for trading
|
||||||||
|
Crude oil price collars
|
$
|
–
|
$
|
410
|
||||
|
Crude oil WCS (1) differential swaps
|
–
|
(16
|
)
|
|||||
|
Foreign currency forward contracts
|
36
|
21
|
||||||
|
Cash flow hedges
|
||||||||
|
Foreign currency forward contracts
|
30
|
11
|
||||||
|
Cross currency swaps
|
788
|
173
|
||||||
|
$
|
854
|
$
|
599
|
|||||
|
Included within:
|
||||||||
|
Current portion of other long-term assets
|
$
|
305
|
$
|
436
|
||||
|
Other long-term assets
|
549
|
163
|
||||||
|
$
|
854
|
$
|
599
|
|||||
| (1) | Western Canadian Select. |
During 2015, the Company recognized a gain of $5 million (2014 – loss of $3 million; 2013 – gain of $4 million) related to ineffectiveness arising from cash flow hedges.
The estimated fair value of derivative financial instruments in Level 2 at each measurement date have been determined based on appropriate internal valuation methodologies and/or third party indications. Level 2 fair values determined using valuation models require the use of assumptions concerning the amount and timing of future cash flows and discount rates. In determining these assumptions, the Company primarily relied on external, readily-observable quoted market inputs including crude oil and natural gas forward benchmark commodity prices and volatility, Canadian and United States forward interest rate yield curves, and Canadian and United States foreign exchange rates, discounted to present value as appropriate. The resulting fair value estimates may not necessarily be indicative of the amounts that could be realized or settled in a current market transaction and these differences may be material.
Risk Management
The Company periodically uses derivative financial instruments to manage its commodity price, interest rate and foreign currency exposures. These financial instruments are entered into solely for hedging purposes and are not used for speculative purposes.
The changes in estimated fair values of derivative financial instruments included in the risk management asset (liability) were recognized in the financial statements as follows:
|
Asset (liability)
|
2015
|
2014
|
||||||
|
Balance – beginning of year
|
$
|
599
|
$
|
(136
|
)
|
|||
|
Net change in fair value of outstanding derivative financial instruments
recognized in:
|
||||||||
|
Risk management activities
|
(374
|
)
|
451
|
|||||
|
Foreign exchange
|
669
|
270
|
||||||
|
Other comprehensive (loss) income
|
(40
|
)
|
14
|
|||||
|
Balance – end of year
|
854
|
599
|
||||||
|
Less: current portion
|
305
|
436
|
||||||
|
$
|
549
|
$
|
163
|
|||||
Net (gains) losses from risk management activities for the years ended December 31 were as follows:
|
2015
|
2014
|
2013
|
||||||||||
|
Net realized risk management gain
|
$
|
(843
|
)
|
$
|
(349
|
)
|
$
|
(116
|
)
|
|||
|
Net unrealized risk management loss (gain)
|
374
|
(451
|
)
|
39
|
||||||||
|
$
|
(469
|
)
|
$
|
(800
|
)
|
$
|
(77
|
)
|
||||
Financial Risk Factors
| a) | Market risk |
Market risk is the risk that the fair value or future cash flows of a financial instrument will fluctuate because of changes in market prices. The Company’s market risk is comprised of commodity price risk, interest rate risk, and foreign currency exchange risk.
Commodity price risk management
The Company periodically uses commodity derivative financial instruments to manage its exposure to commodity price risk associated with the sale of its future crude oil and natural gas production and with natural gas purchases. At December 31, 2015, the Company had no commodity derivative financial instruments outstanding.
Interest rate risk management
The Company is exposed to interest rate price risk on its fixed rate long-term debt and to interest rate cash flow risk on its floating rate long-term debt. The Company periodically enters into interest rate swap contracts to manage its fixed to floating interest rate mix on long-term debt. Interest rate swap contracts require the periodic exchange of payments without the exchange of the notional principal amounts on which the payments are based. At December 31, 2015, the Company had no interest rate swap contracts outstanding.
Foreign currency exchange rate risk management
The Company is exposed to foreign currency exchange rate risk in Canada primarily related to its US dollar denominated long-term debt, commercial paper and working capital. The Company is also exposed to foreign currency exchange rate risk on transactions conducted in other currencies and in the carrying value of its foreign subsidiaries. The Company periodically enters into cross currency swap contracts and foreign currency forward contracts to manage known currency exposure on US dollar denominated long-term debt, commercial paper and working capital. The cross currency swap contracts require the periodic exchange of payments with the exchange at maturity of notional principal amounts on which the payments are based. At December 31, 2015, the Company had the following cross currency swap contracts outstanding:
|
Remaining term
|
Amount
|
Exchange rate
(US$/C$)
|
Interest rate
(US$)
|
Interest rate
(C$)
|
|||
|
Cross currency
|
|||||||
|
Swaps
|
Jan 2016
|
–
|
Mar 2016
|
US$500
|
1.109
|
Three-month
LIBOR plus
0.375%
|
Three-month
CDOR (1) plus
0.309%
|
|
Jan 2016
|
–
|
Aug 2016
|
US$250
|
1.116
|
6.00%
|
5.40%
|
|
|
Jan 2016
|
–
|
May 2017
|
US$1,100
|
1.170
|
5.70%
|
5.10%
|
|
|
Jan 2016
|
–
|
Nov 2021
|
US$500
|
1.022
|
3.45%
|
3.96%
|
|
|
Jan 2016
|
–
|
Mar 2038
|
US$550
|
1.170
|
6.25%
|
5.76%
|
|
| (1) | Canadian Dealer Offered Rate (“CDOR”). |
All cross currency swap derivative financial instruments were designated as hedges at December 31, 2015 and were classified as cash flow hedges.
In addition to the cross currency swap contracts noted above, at December 31, 2015, the Company had US$2,357 million of foreign currency forward contracts outstanding, with terms of approximately 30 days or less, including US$1,157 million designated as cash flow hedges.
Financial instrument sensitivities
The following table summarizes the annualized sensitivities of the Company’s 2015 net loss and other comprehensive loss to changes in the fair value of financial instruments outstanding as at December 31, 2015, resulting from changes in the specified variable, with all other variables held constant. These sensitivities are prepared on a different basis than those sensitivities disclosed in the Company’s other continuous disclosure documents, are limited to the impact of changes in a specified variable applied to financial instruments only and do not represent the impact of a change in the variable on the operating results of the Company taken as a whole. Further, these sensitivities are theoretical, as changes in one variable may contribute to changes in another variable, which may magnify or counteract the sensitivities. In addition, changes in fair value generally cannot be extrapolated because the relationship of a change in an assumption to the change in fair value may not be linear.
|
(Increase) decrease to
net loss |
(Increase) decrease to other comprehensive loss
|
|||||||
|
Interest rate risk
|
||||||||
|
Increase interest rate 1%
|
$
|
(17
|
)
|
$
|
(41
|
)
|
||
|
Decrease interest rate 1%
|
$
|
15
|
$
|
46
|
||||
|
Foreign currency exchange rate risk
|
||||||||
|
Increase exchange rate by US$0.01
|
$
|
(70
|
)
|
$
|
–
|
|||
|
Decrease exchange rate by US$0.01
|
$
|
68
|
$
|
–
|
||||
| b) | Credit risk |
Credit risk is the risk that a party to a financial instrument will cause a financial loss to the Company by failing to discharge an obligation.
Counterparty credit risk management
The Company’s accounts receivable are mainly with customers in the crude oil and natural gas industry and are subject to normal industry credit risks. The Company manages these risks by reviewing its exposure to individual companies on a regular basis and where appropriate, ensures that parental guarantees or letters of credit are in place to minimize the impact in the event of default. At December 31, 2015, substantially all of the Company’s accounts receivable were due within normal trade terms.
The Company is also exposed to possible losses in the event of nonperformance by counterparties to derivative financial instruments; however, the Company manages this credit risk by entering into agreements with counterparties that are substantially all investment grade financial institutions. At December 31, 2015, the Company had net risk management assets of $854 million with specific counterparties related to derivative financial instruments (December 31, 2014 – $622 million).
The carrying amount of financial assets approximates the maximum credit exposure.
| c) | Liquidity risk |
Liquidity risk is the risk that the Company will encounter difficulty in meeting obligations associated with financial liabilities.
Management of liquidity risk requires the Company to maintain sufficient cash and cash equivalents, along with other sources of capital, consisting primarily of cash flow from operating activities, available credit facilities, commercial paper and access to debt capital markets, to meet obligations as they become due. The Company believes it has adequate bank credit facilities to provide liquidity to manage fluctuations in the timing of the receipt and/or disbursement of operating cash flows.
The maturity dates for financial liabilities were as follows:
|
Less than
1 year |
1 to less than
2 years |
2 to less than
5 years |
Thereafter
|
|||||||||||||
|
Accounts payable
|
$
|
571
|
$
|
–
|
$
|
–
|
$
|
–
|
||||||||
|
Accrued liabilities
|
$
|
2,089
|
$
|
–
|
$
|
–
|
$
|
–
|
||||||||
|
Long-term debt (1)
|
$
|
1,730
|
$
|
2,522
|
$
|
5,679
|
$
|
6,935
|
||||||||
| (1) | Long-term debt represents principal repayments only and does not reflect interest, original issue discounts and premiums, or transaction costs. |
18. COMMITMENTS AND CONTINGENCIES
The Company has committed to certain payments as follows:
|
2016
|
2017
|
2018
|
2019
|
2020
|
Thereafter
|
|||||||||||||||||||
|
Product transportation and pipeline
|
$
|
423
|
$
|
341
|
$
|
303
|
$
|
261
|
$
|
246
|
$
|
1,304
|
||||||||||||
|
Offshore equipment operating leases and offshore drilling
|
$
|
247
|
$
|
93
|
$
|
71
|
$
|
22
|
$
|
–
|
$
|
–
|
||||||||||||
|
Office leases
|
$
|
42
|
$
|
42
|
$
|
42
|
$
|
43
|
$
|
42
|
$
|
193
|
||||||||||||
|
Other
|
$
|
141
|
$
|
38
|
$
|
48
|
$
|
1
|
$
|
–
|
$
|
–
|
||||||||||||
In addition to the commitments disclosed above, the Company has entered into various agreements related to the engineering, procurement and construction of subsequent phases of Horizon. These contracts can be cancelled by the Company upon notice without penalty, subject to the costs incurred up to and in respect of the cancellation.
The Company is defendant and plaintiff in a number of legal actions arising in the normal course of business. In addition, the Company is subject to certain contractor construction claims. The Company believes that any liabilities that might arise pertaining to any such matters would not have a material effect on its consolidated financial position.
19. SUPPLEMENTAL DISCLOSURE OF CASH FLOW INFORMATION
|
2015
|
2014
|
2013
|
||||||||||
|
Changes in non-cash working capital
|
||||||||||||
|
Accounts receivable
|
$
|
615
|
$
|
(456
|
)
|
$
|
(243
|
)
|
||||
|
Inventory
|
142
|
(31
|
)
|
(76
|
)
|
|||||||
|
Prepaids and other
|
11
|
(30
|
)
|
(14
|
)
|
|||||||
|
Accounts payable
|
7
|
(70
|
)
|
175
|
||||||||
|
Accrued liabilities
|
(981
|
)
|
741
|
127
|
||||||||
|
Current income tax (liabilities) assets
|
(447
|
)
|
(586
|
)
|
94
|
|||||||
|
Net changes in non-cash working capital
|
$
|
(653
|
)
|
$
|
(432
|
)
|
$
|
63
|
||||
|
Relating to:
|
||||||||||||
|
Operating activities
|
$
|
239
|
$
|
(744
|
)
|
$
|
(33
|
)
|
||||
|
Financing activities
|
(40
|
)
|
(22
|
)
|
(23
|
)
|
||||||
|
Investing activities
|
(852
|
)
|
334
|
119
|
||||||||
|
$
|
(653
|
)
|
$
|
(432
|
)
|
$
|
63
|
|||||
|
2015
|
2014
|
2013
|
||||||||||
|
Expenditures on exploration and evaluation assets
|
$
|
180
|
$
|
1,190
|
$
|
119
|
||||||
|
Net proceeds on sale of exploration and
evaluation assets (1) |
(416
|
)
|
–
|
(263
|
)
|
|||||||
|
Net (proceeds) expenditures on exploration and evaluation assets
|
$
|
(236
|
)
|
$
|
1,190
|
$
|
(144
|
)
|
||||
|
Expenditures on property, plant and equipment
|
$
|
5,118
|
$
|
10,252
|
$
|
7,249
|
||||||
|
Net proceeds on sale of property, plant
and equipment (1) |
(414
|
)
|
(44
|
)
|
(38
|
)
|
||||||
|
Net expenditures on property, plant and equipment
|
$
|
4,704
|
$
|
10,208
|
$
|
7,211
|
||||||
|
(1)
|
Net proceeds on exploration and evaluation assets and net expenditures on property, plant and equipment in 2015 exclude non-cash share consideration of $985 million received from PrairieSky on the disposition of royalty income assets.
|
20. SEGMENTED INFORMATION
The Company’s exploration and production activities are conducted in three geographic segments: North America, North Sea and Offshore Africa. These activities include the exploration, development, production and marketing of crude oil, natural gas liquids and natural gas.
The Company’s Oil Sands Mining and Upgrading activities are reported in a separate segment from exploration and production activities.
|
Exploration and Production
|
||||||||||||||||||||||||||||||||||||
|
North America
|
North Sea
|
Offshore Africa
|
||||||||||||||||||||||||||||||||||
|
2015
|
2014
|
2013
|
2015
|
2014
|
2013
|
2015
|
2014
|
2013
|
||||||||||||||||||||||||||||
|
Segmented product sales
|
$
|
9,222
|
$
|
15,963
|
$
|
12,659
|
$
|
638
|
$
|
701
|
$
|
805
|
$
|
482
|
$
|
503
|
$
|
824
|
||||||||||||||||||
|
Less: royalties
|
(732
|
)
|
(2,159
|
)
|
(1,477
|
)
|
(1
|
)
|
(2
|
)
|
(2
|
)
|
(22
|
)
|
(43
|
)
|
(137
|
)
|
||||||||||||||||||
|
Segmented revenue
|
8,490
|
13,804
|
11,182
|
637
|
699
|
803
|
460
|
460
|
687
|
|||||||||||||||||||||||||||
|
Segmented expenses
|
||||||||||||||||||||||||||||||||||||
|
Production
|
2,603
|
2,924
|
2,351
|
544
|
496
|
431
|
223
|
212
|
191
|
|||||||||||||||||||||||||||
|
Transportation
and blending
|
2,309
|
3,228
|
2,939
|
61
|
5
|
6
|
2
|
1
|
1
|
|||||||||||||||||||||||||||
|
Depletion, depreciation and amortization
|
4,248
|
3,901
|
3,568
|
388
|
269
|
552
|
273
|
105
|
134
|
|||||||||||||||||||||||||||
|
Asset retirement obligation accretion
|
93
|
98
|
92
|
39
|
38
|
35
|
10
|
10
|
10
|
|||||||||||||||||||||||||||
|
Realized risk management activities
|
(843
|
)
|
(349
|
)
|
(116
|
)
|
–
|
–
|
–
|
–
|
–
|
–
|
||||||||||||||||||||||||
|
Gains on disposition of properties and corporate acquisitions
|
(739
|
)
|
(137
|
)
|
(65
|
)
|
–
|
–
|
–
|
–
|
–
|
(224
|
)
|
|||||||||||||||||||||||
|
Loss from investments
|
6
|
–
|
–
|
–
|
–
|
–
|
–
|
–
|
–
|
|||||||||||||||||||||||||||
|
Total segmented expenses
|
7,677
|
9,665
|
8,769
|
1,032
|
808
|
1,024
|
508
|
328
|
112
|
|||||||||||||||||||||||||||
|
Segmented earnings (loss) before the following
|
$
|
813
|
$
|
4,139
|
$
|
2,413
|
$
|
(395
|
)
|
$
|
(109
|
)
|
$
|
(221
|
)
|
$
|
(48
|
)
|
$
|
132
|
$
|
575
|
||||||||||||||
|
Non–segmented expenses
|
||||||||||||||||||||||||||||||||||||
|
Administration
|
||||||||||||||||||||||||||||||||||||
|
Share-based compensation
|
||||||||||||||||||||||||||||||||||||
|
Interest and other financing expense
|
||||||||||||||||||||||||||||||||||||
|
Unrealized risk management activities
|
||||||||||||||||||||||||||||||||||||
|
Foreign exchange loss
|
||||||||||||||||||||||||||||||||||||
|
Total non–segmented
expenses
|
||||||||||||||||||||||||||||||||||||
|
Earnings (loss) before
taxes
|
||||||||||||||||||||||||||||||||||||
|
Current income tax (recovery) expense
|
||||||||||||||||||||||||||||||||||||
|
Deferred income tax expense
|
||||||||||||||||||||||||||||||||||||
|
Net earnings (loss)
|
||||||||||||||||||||||||||||||||||||
Midstream activities include the Company’s pipeline operations, an electricity co-generation system and Redwater Partnership. Production activities that are not included in the above segments are reported in the segmented information as other. Inter-segment eliminations include internal transportation and electricity charges.
Sales between segments are made at prices that approximate market prices, taking into account the volumes involved. Segment revenue and segment results include transactions between business segments. These transactions and any unrealized profits and losses are eliminated on consolidation, unless unrealized losses provide evidence of an impairment of the asset transferred. Sales to external customers are based on the location of the seller.
Operating segments are reported in a manner consistent with the internal reporting provided to the Company’s chief operating decision makers.
|
Oil Sands Mining and Upgrading
|
Midstream
|
Inter-segment
elimination and other
|
Total
|
|||||||||||||||||||||||||||||||||||||||||||
|
2015
|
2014
|
2013
|
2015
|
2014
|
2013
|
2015
|
2014
|
2013
|
2015
|
2014
|
2013
|
|||||||||||||||||||||||||||||||||||
|
$
|
2,764
|
$
|
4,095
|
$
|
3,631
|
$
|
136
|
$
|
120
|
$
|
110
|
$
|
(75
|
)
|
$
|
(81
|
)
|
$
|
(84
|
)
|
$
|
13,167
|
$
|
21,301
|
$
|
17,945
|
||||||||||||||||||||
|
(49
|
)
|
(234
|
)
|
(184
|
)
|
–
|
–
|
–
|
–
|
–
|
–
|
(804
|
)
|
(2,438
|
)
|
(1,800
|
)
|
|||||||||||||||||||||||||||||
|
2,715
|
3,861
|
3,447
|
136
|
120
|
110
|
(75
|
)
|
(81
|
)
|
(84
|
)
|
12,363
|
18,863
|
16,145
|
||||||||||||||||||||||||||||||||
|
1,332
|
1,609
|
1,567
|
32
|
34
|
34
|
(8
|
)
|
(10
|
)
|
(15
|
)
|
4,726
|
5,265
|
4,559
|
||||||||||||||||||||||||||||||||
|
82
|
75
|
63
|
–
|
–
|
–
|
(75
|
)
|
(77
|
)
|
(71
|
)
|
2,379
|
3,232
|
2,938
|
||||||||||||||||||||||||||||||||
|
562
|
596
|
582
|
12
|
9
|
8
|
–
|
–
|
–
|
5,483
|
4,880
|
4,844
|
|||||||||||||||||||||||||||||||||||
|
31
|
47
|
34
|
–
|
–
|
–
|
–
|
–
|
–
|
173
|
193
|
171
|
|||||||||||||||||||||||||||||||||||
|
–
|
–
|
–
|
–
|
–
|
–
|
–
|
–
|
–
|
(843
|
)
|
(349
|
)
|
(116
|
)
|
||||||||||||||||||||||||||||||||
|
–
|
–
|
–
|
–
|
–
|
–
|
–
|
–
|
–
|
(739
|
)
|
(137
|
)
|
(289
|
)
|
||||||||||||||||||||||||||||||||
|
–
|
–
|
–
|
44
|
8
|
4
|
–
|
–
|
–
|
50
|
8
|
4
|
|||||||||||||||||||||||||||||||||||
|
2,007
|
2,327
|
2,246
|
88
|
51
|
46
|
(83
|
)
|
(87
|
)
|
(86
|
)
|
11,229
|
13,092
|
12,111
|
||||||||||||||||||||||||||||||||
|
$
|
708
|
$
|
1,534
|
$
|
1,201
|
$
|
48
|
$
|
69
|
$
|
64
|
$
|
8
|
$
|
6
|
$
|
2
|
1,134
|
5,771
|
4,034
|
||||||||||||||||||||||||||
|
390
|
367
|
335
|
||||||||||||||||||||||||||||||||||||||||||||
|
(46
|
)
|
66
|
135
|
|||||||||||||||||||||||||||||||||||||||||||
|
322
|
323
|
279
|
||||||||||||||||||||||||||||||||||||||||||||
|
374
|
(451
|
)
|
39
|
|||||||||||||||||||||||||||||||||||||||||||
|
761
|
303
|
210
|
||||||||||||||||||||||||||||||||||||||||||||
|
1,801
|
608
|
998 |
||||||||||||||||||||||||||||||||||||||||||||
|
(667
|
)
|
5,163
|
3,036
|
|||||||||||||||||||||||||||||||||||||||||||
|
(261
|
)
|
427
|
735
|
|||||||||||||||||||||||||||||||||||||||||||
|
231
|
807
|
31
|
||||||||||||||||||||||||||||||||||||||||||||
|
$
|
(637
|
)
|
$
|
3,929
|
$
|
2,270
|
||||||||||||||||||||||||||||||||||||||||
Capital Expenditures (1)
|
2015
|
2014
|
|||||||||||||||||||||||
|
Net
expenditures (proceeds) (2)
|
Non-cash
and fair value changes (3)
|
Capitalized
costs
|
Net
expenditures
|
Non-cash
and fair value changes (3)
|
Capitalized
costs
|
|||||||||||||||||||
|
Exploration and
evaluation assets
|
||||||||||||||||||||||||
|
Exploration and Production
|
||||||||||||||||||||||||
|
North America (4)
|
$
|
(260
|
)
|
$
|
(666
|
)
|
$
|
(926
|
)
|
$
|
1,103
|
$
|
(247
|
)
|
$
|
856
|
||||||||
|
North Sea
|
–
|
–
|
–
|
–
|
–
|
–
|
||||||||||||||||||
|
Offshore Africa
|
35
|
(96
|
)
|
(61
|
)
|
87
|
–
|
87
|
||||||||||||||||
|
$
|
(225
|
)
|
$
|
(762
|
)
|
$
|
(987
|
)
|
$
|
1,190
|
$
|
(247
|
)
|
$
|
943
|
|||||||||
|
Property, plant and equipment
|
||||||||||||||||||||||||
|
Exploration and Production
|
||||||||||||||||||||||||
|
North America (4)
|
$
|
1,171
|
$
|
(1,237
|
)
|
$
|
(66
|
)
|
$
|
6,397
|
$
|
399
|
$
|
6,796
|
||||||||||
|
North Sea
|
230
|
(217
|
)
|
13
|
400
|
86
|
486
|
|||||||||||||||||
|
Offshore Africa
|
573
|
(49
|
)
|
524
|
194
|
(1
|
)
|
193
|
||||||||||||||||
|
1,974
|
(1,503
|
)
|
471
|
6,991
|
484
|
7,475
|
||||||||||||||||||
|
Oil Sands Mining
and Upgrading (5) |
2,730
|
(335
|
)
|
2,395
|
3,110
|
(528
|
)
|
2,582
|
||||||||||||||||
|
Midstream
|
8
|
(1
|
)
|
7
|
62
|
–
|
62
|
|||||||||||||||||
|
Head office
|
26
|
–
|
26
|
45
|
(1
|
)
|
44
|
|||||||||||||||||
|
$
|
4,738
|
$
|
(1,839
|
)
|
$
|
2,899
|
$
|
10,208
|
$
|
(45
|
)
|
$
|
10,163
|
|||||||||||
| (1) | This table provides a reconciliation of capitalized costs including derecognitions and does not include the impact of foreign exchange adjustments. |
| (2) | Net expenditures (proceeds) in 2015 do not include non-cash share consideration of $985 million received from PrairieSky on the disposition of royalty income assets. |
| (3) | Asset retirement obligations, deferred income tax adjustments related to differences between carrying amounts and tax values, transfers of exploration and evaluation assets, and other fair value adjustments. |
| (4) | The above noted figures in 2015 do not include the impact of other pre-tax gains on the sale of other properties totaling $49 million recognized in 2015. |
| (5) | Net expenditures for Oil Sands Mining and Upgrading also include capitalized interest and share-based compensation. |
Segmented Assets
|
2015
|
2014
|
|||||||
|
Exploration and Production
|
||||||||
|
North America
|
$
|
30,937
|
$
|
34,382
|
||||
|
North Sea
|
2,734
|
2,711
|
||||||
|
Offshore Africa
|
1,755
|
1,214
|
||||||
|
Other
|
73
|
18
|
||||||
|
Oil Sands Mining and Upgrading
|
22,598
|
20,702
|
||||||
|
Midstream
|
1,054
|
1,048
|
||||||
|
Head office
|
124
|
125
|
||||||
|
$
|
59,275
|
$
|
60,200
|
|||||
21. REMUNERATION OF DIRECTORS AND SENIOR MANAGEMENT
Remuneration of Non-Management Directors
|
2015
|
2014
|
2013
|
||||||||||
|
Fees earned
|
$
|
2
|
$
|
3
|
$
|
2
|
||||||
Remuneration of Senior Management (1)
|
2015
|
2014
|
2013
|
||||||||||
|
Salary
|
$
|
3
|
$
|
3
|
$
|
3
|
||||||
|
Common stock option based awards
|
7
|
8
|
11
|
|||||||||
|
Annual incentive plans
|
2
|
4
|
3
|
|||||||||
|
Long-term incentive plans
|
6
|
17
|
14
|
|||||||||
|
Other compensation
|
–
|
–
|
1
|
|||||||||
|
$
|
18
|
$
|
32
|
$
|
32
|
|||||||
| (1) | Senior management identified above are consistent with the disclosure on Named Executive Officers provided in the Company’s Information Circular to shareholders for the respective years. |
SPECIAL NOTE REGARDING FORWARD-LOOKING STATEMENTS
Certain statements relating to Canadian Natural Resources Limited (the “Company”) in this document or documents incorporated herein by reference constitute forward-looking statements or information (collectively referred to herein as “forward-looking statements”) within the meaning of applicable securities legislation. Forward-looking statements can be identified by the words “believe”, “anticipate”, “expect”, “plan”, “estimate”, “target”, “continue”, “could”, “intend”, “may”, “potential”, “predict”, “should”, “will”, “objective”, “project”, “forecast”, “goal”, “guidance”, “outlook”, “effort”, “seeks”, “schedule”, “proposed” or expressions of a similar nature suggesting future outcome or statements regarding an outlook. Disclosure related to expected future commodity pricing, forecast or anticipated production volumes, royalties, operating costs, capital expenditures, income tax expenses and other guidance provided throughout this Management’s Discussion and Analysis (“MD&A”), constitute forward-looking statements. Disclosure of plans relating to and expected results of existing and future developments, including but not limited to the Horizon Oil Sands operations and future expansions, Primrose thermal projects, Pelican Lake water and polymer flood project, the Kirby Thermal Oil Sands Project, the construction and future operations of the North West Redwater bitumen upgrader and refinery, and construction by third parties of new or expansion of existing pipeline capacity or other means of transportation of bitumen, crude oil, natural gas or synthetic crude oil (“SCO”) that the Company may be reliant upon to transport its products to market, and the “Outlook” section of this MD&A, particularly in reference to the 2016 guidance provided with respect to budgeted capital expenditures, also constitute forward-looking statements. This forward-looking information is based on annual budgets and multi-year forecasts, and is reviewed and revised throughout the year as necessary in the context of targeted financial ratios, project returns, product pricing expectations and balance in project risk and time horizons. These statements are not guarantees of future performance and are subject to certain risks. The reader should not place undue reliance on these forward-looking statements as there can be no assurances that the plans, initiatives or expectations upon which they are based will occur.
In addition, statements relating to “reserves” are deemed to be forward-looking statements as they involve the implied assessment based on certain estimates and assumptions that the reserves described can be profitably produced in the future. There are numerous uncertainties inherent in estimating quantities of proved and proved plus probable crude oil, natural gas and natural gas liquids (“NGLs”) reserves and in projecting future rates of production and the timing of development expenditures. The total amount or timing of actual future production may vary significantly from reserve and production estimates.
The forward-looking statements are based on current expectations, estimates and projections about the Company and the industry in which the Company operates, which speak only as of the date such statements were made or as of the date of the report or document in which they are contained, and are subject to known and unknown risks and uncertainties that could cause the actual results, performance or achievements of the Company to be materially different from any future results, performance or achievements expressed or implied by such forward-looking statements. Such risks and uncertainties include, among others: general economic and business conditions which will, among other things, impact demand for and market prices of the Company’s products; volatility of and assumptions regarding crude oil and natural gas prices; fluctuations in currency and interest rates; assumptions on which the Company’s current guidance is based; economic conditions in the countries and regions in which the Company conducts business; political uncertainty, including actions of or against terrorists, insurgent groups or other conflict including conflict between states; industry capacity; ability of the Company to implement its business strategy, including exploration and development activities; impact of competition; the Company’s defense of lawsuits; availability and cost of seismic, drilling and other equipment; ability of the Company and its subsidiaries to complete capital programs; the Company’s and its subsidiaries’ ability to secure adequate transportation for its products; unexpected disruptions or delays in the resumption of the mining, extracting or upgrading of the Company’s bitumen products; potential delays or changes in plans with respect to exploration or development projects or capital expenditures; ability of the Company to attract the necessary labour required to build its thermal and oil sands mining projects; operating hazards and other difficulties inherent in the exploration for and production and sale of crude oil and natural gas and in mining, extracting or upgrading the Company’s bitumen products; availability and cost of financing; the Company’s and its subsidiaries’ success of exploration and development activities and its ability to replace and expand crude oil and natural gas reserves; timing and success of integrating the business and operations of acquired companies; production levels; imprecision of reserve estimates and estimates of recoverable quantities of crude oil, natural gas and NGLs not currently classified as proved; actions by governmental authorities; government regulations and the expenditures required to comply with them (especially safety and environmental laws and regulations and the impact of climate change initiatives on capital and operating costs); asset retirement obligations; the adequacy of the Company’s provision for taxes; and other circumstances affecting revenues and expenses.
The Company’s operations have been, and in the future may be, affected by political developments and by federal, provincial and local laws and regulations such as restrictions on production, changes in taxes, royalties and other amounts payable to governments or governmental agencies, price or gathering rate controls and environmental protection regulations. Should one or more of these risks or uncertainties materialize, or should any of the Company’s assumptions prove incorrect, actual results may vary in material respects from those projected in the forward-looking statements. The impact of any one factor on a particular forward-looking statement is not determinable with certainty as such factors are dependent upon other factors, and the Company’s course of action would depend upon its assessment of the future considering all information then available. For additional information, refer to the “Risks and Uncertainties” section of this MD&A.
Readers are cautioned that the foregoing list of factors is not exhaustive. Unpredictable or unknown factors not discussed in this report could also have material adverse effects on forward-looking statements. Although the Company believes that the expectations conveyed by the forward-looking statements are reasonable based on information available to it on the date such forward-looking statements are made, no assurances can be given as to future results, levels of activity and achievements. All subsequent forward-looking statements, whether written or oral, attributable to the Company or persons acting on its behalf are expressly qualified in their entirety by these cautionary statements. Except as required by law, the Company assumes no obligation to update forward-looking statements, whether as a result of new information, future events or other factors, or the foregoing factors affecting this information, should circumstances or Management’s estimates or opinions change.
SPECIAL NOTE REGARDING NON-GAAP FINANCIAL MEASURES
This MD&A includes references to financial measures commonly used in the crude oil and natural gas industry, such as adjusted net earnings from operations, cash flow from operations, adjusted cash production costs and net asset value. These financial measures are not defined by International Financial Reporting Standards (“IFRS”) and therefore are referred to as non-GAAP measures. The non-GAAP measures used by the Company may not be comparable to similar measures presented by other companies. The Company uses these non-GAAP measures to evaluate its performance. The non-GAAP measures should not be considered an alternative to or more meaningful than net earnings, as determined in accordance with IFRS, as an indication of the Company’s performance. The non-GAAP measures adjusted net earnings from operations and cash flow from operations are reconciled to net earnings (loss), as determined in accordance with IFRS, in the “Net Earnings (Loss) and Cash Flow from Operations” section of this MD&A. The derivation of adjusted cash production costs and adjusted depreciation, depletion and amortization are included in the “Operating Highlights – Oil Sands Mining and Upgrading” section of this MD&A. The Company also presents certain non-GAAP financial ratios and their derivation in the “Liquidity and Capital Resources” section of this MD&A.
MANAGEMENT’S DISCUSSION AND ANALYSIS
This MD&A of the financial condition and results of operations of the Company should be read in conjunction with the Company’s audited consolidated financial statements and related notes for the year ended December 31, 2015.
All dollar amounts are referenced in millions of Canadian dollars, except where noted otherwise. The Company’s consolidated financial statements and this MD&A have been prepared in accordance with IFRS as issued by the International Accounting Standards Board (“IASB”).
A Barrel of Oil Equivalent (“BOE”) is derived by converting six thousand cubic feet (“Mcf”) of natural gas to one barrel (“bbl”) of crude oil (6 Mcf:1 bbl). This conversion may be misleading, particularly if used in isolation, since the 6 Mcf:1 bbl ratio is based on an energy equivalency conversion method primarily applicable at the burner tip and does not represent a value equivalency at the wellhead. In comparing the value ratio using current crude oil prices relative to natural gas prices, the 6 Mcf:1 bbl conversion ratio may be misleading as an indication of value. In addition, for the purposes of this MD&A, crude oil is defined to include the following commodities: light and medium crude oil, primary heavy crude oil, Pelican Lake heavy crude oil, bitumen (thermal oil), and synthetic crude oil.
Production volumes and per unit statistics are presented throughout this MD&A on a “before royalty” or “gross” basis, and realized prices are net of blending costs and exclude the effect of risk management activities. Production on an “after royalty” or “net” basis is also presented for information purposes only.
The following discussion and analysis refers primarily to the Company’s 2015 financial results compared to 2014 and 2013, unless otherwise indicated. In addition, this MD&A details the Company’s capital program for 2016. Additional information relating to the Company, including its quarterly MD&A for the year and three months ended December 31, 2015, its Annual Information Form for the year ended December 31, 2015, and its audited consolidated financial statements for the year ended December 31, 2015 is available on SEDAR at www.sedar.com and on EDGAR at www.sec.gov. This MD&A is dated March 2, 2016.
DEFINITIONS AND ABBREVIATIONS
|
AECO
|
Alberta natural gas reference location
|
|
AIF
|
Annual Information Form
|
|
API
|
specific gravity measured in degrees on the American Petroleum Institute scale
|
|
ARO
|
asset retirement obligations
|
|
bbl
|
barrel
|
|
bbl/d
|
barrels per day
|
|
Bcf
|
billion cubic feet
|
|
Bcf/d
|
billion cubic feet per day
|
|
BOE
|
barrels of oil equivalent
|
|
BOE/d
|
barrels of oil equivalent per day
|
|
Bitumen
|
solid or semi-solid viscous mixture consisting mainly of pentanes and heavier hydrocarbons with viscosity
greater than 10,000 centipoise
|
|
Brent
|
Dated Brent
|
|
C$
|
Canadian dollars
|
|
CAGR
|
compound annual growth rate
|
|
CAPEX
|
capital expenditures
|
|
CO2
|
carbon dioxide
|
|
CO2e
|
carbon dioxide equivalents
|
|
Crude oil
|
includes light and medium crude oil, primary heavy crude oil, Pelican Lake heavy crude oil, bitumen
(thermal oil), and synthetic crude oil
|
|
CSS
|
Cyclic Steam Stimulation
|
|
EOR
|
Enhanced Oil Recovery
|
|
E&P
|
Exploration and Production
|
|
FPSO
|
Floating Production, Storage and Offloading Vessel
|
|
GHG
|
greenhouse gas
|
|
GJ
|
gigajoules
|
|
GJ/d
|
gigajoules per day
|
|
Horizon
|
Horizon Oil Sands
|
|
IASB
|
International Accounting Standards Board
|
|
IFRS
|
International Financial Reporting Standards
|
|
LIBOR
|
London Interbank Offered Rate
|
|
Mbbl
|
thousand barrels
|
|
Mbbl/d
|
thousand barrels per day
|
|
MBOE
|
thousand barrels of oil equivalent
|
|
MBOE/d
|
thousand barrels of oil equivalent per day
|
|
Mcf
|
thousand cubic feet
|
|
Mcfe
|
thousands of cubic feet equivalent
|
|
Mcf/d
|
thousand cubic feet per day
|
|
MMbbl
|
million barrels
|
|
MMBOE
|
million barrels of oil equivalent
|
|
MMBtu
|
million British thermal units
|
|
MMcf
|
million cubic feet
|
|
MMcf/d
|
million cubic feet per day
|
|
NGLs
|
natural gas liquids
|
|
NYMEX
|
New York Mercantile Exchange
|
|
NYSE
|
New York Stock Exchange
|
|
PRT
|
Petroleum Revenue Tax
|
|
SAGD
|
Steam-Assisted Gravity Drainage
|
|
SCO
|
synthetic crude oil
|
|
SEC
|
United States Securities and Exchange Commission
|
|
Tcf
|
trillion cubic feet
|
|
TSX
|
Toronto Stock Exchange
|
|
UK
|
United Kingdom
|
|
US
|
United States
|
|
US GAAP
|
generally accepted accounting principles in the United States
|
|
US$
|
United States dollars
|
|
WCS
|
Western Canadian Select
|
|
WCS Heavy
|
|
|
Differential
|
WCS Heavy Differential from WTI
|
|
WTI
|
West Texas Intermediate reference location at Cushing, Oklahoma
|
OBJECTIVES AND STRATEGY
The Company’s objectives are to increase crude oil and natural gas production, reserves, cash flow and net asset value (1) on a per common share basis through the development of its existing crude oil and natural gas properties and through the discovery and/or acquisition of new reserves. The Company strives to meet these objectives by having a defined growth and value enhancement plan for each of its products and segments while transitioning to a long life, low decline asset base. The Company takes a balanced approach to growth and investments and focuses on creating long-term shareholder value. The Company allocates its capital by maintaining:
| — | Balance among its products, namely light and medium crude oil and NGLs, primary heavy crude oil, Pelican Lake heavy crude oil(2), bitumen (thermal oil), SCO and natural gas; |
| — | A large, balanced, diversified, high quality asset base; |
| — | Balance among acquisitions, exploitation and exploration; and |
| — | Balance between sources and terms of debt financing and a strong financial position. |
| (1) | Discounted value of crude oil and natural gas reserves plus value of unproved land, less net debt. |
| (2) | Pelican Lake heavy crude oil is 14–17º API oil, which receives medium quality crude netbacks due to lower production costs and lower royalty rates. |
The Company’s three-phase crude oil marketing strategy includes:
| — | Blending various crude oil streams with diluents to create more attractive feedstock; |
| — | Supporting and participating in pipeline expansions and/or new additions; and |
| — | Supporting and participating in projects that will increase the downstream conversion capacity for heavy crude oil and bitumen (thermal oil). |
Operational discipline, safe, effective and efficient operations as well as cost control are fundamental to the Company. By consistently managing costs throughout all cycles of the industry, the Company believes it will achieve continued growth. Effective and efficient operations and cost control are attained by developing area knowledge, and by maintaining high working interests and operator status in its properties.
The Company is committed to maintaining a strong balance sheet and flexible capital structure. The Company believes it has built the necessary financial capacity to complete its growth projects.
Strategic accretive acquisitions are a key component of the Company’s strategy. The Company has used a combination of internally generated cash flows and debt financing to selectively acquire properties generating future cash flows in its core areas.
NET EARNINGS (LOSS) AND CASH FLOW FROM OPERATIONS
|
Financial Highlights
|
|||||||||||||
|
($ millions, except per common share amounts)
|
2015
|
2014
|
2013
|
||||||||||
|
Product sales
|
$
|
13,167
|
$
|
21,301
|
$
|
17,945
|
|||||||
|
Net earnings (loss)
|
$
|
(637
|
)
|
$
|
3,929
|
$
|
2,270
|
||||||
|
Per common share
|
– basic |
$
|
(0.58
|
)
|
$
|
3.60
|
$
|
2.08
|
|||||
|
|
– diluted |
$
|
(0.58
|
)
|
$
|
3.58
|
$
|
2.08
|
|||||
|
Adjusted net earnings from operations (1)
|
$
|
263
|
$
|
3,811
|
$
|
2,435
|
|||||||
|
Per common share
|
– basic |
$
|
0.24
|
$
|
3.49
|
$
|
2.24
|
||||||
|
|
– diluted |
$
|
0.24
|
$
|
3.47
|
$
|
2.23
|
||||||
|
Cash flow from operations (2)
|
$
|
5,785
|
$
|
9,587
|
$
|
7,477
|
|||||||
|
Per common share
|
– basic |
$
|
5.29
|
$
|
8.78
|
$
|
6.87
|
||||||
|
|
– diluted |
$
|
5.28
|
$
|
8.74
|
$
|
6.86
|
||||||
|
Dividends declared per common share (3)
|
$
|
0.92
|
$
|
0.90
|
$
|
0.575
|
|||||||
|
Total assets
|
$
|
59,275
|
$
|
60,200
|
$
|
51,754
|
|||||||
|
Total long-term liabilities
|
$
|
27,299
|
$
|
26,167
|
$
|
20,748
|
|||||||
|
Capital expenditures, net of dispositions
|
$
|
3,853
|
$
|
11,744
|
$
|
7,274
|
|||||||
| (1) | Adjusted net earnings from operations is a non-GAAP measure that represents net earnings (loss) adjusted for certain items of a non-operational nature. The Company evaluates its performance based on adjusted net earnings from operations. The reconciliation “Adjusted Net Earnings from Operations” presents the after-tax effects of certain items of a non-operational nature that are included in the Company’s financial results. Adjusted net earnings from operations may not be comparable to similar measures presented by other companies. |
| (2) | Cash flow from operations is a non-GAAP measure that represents net earnings (loss) adjusted for non-cash items before working capital adjustments. The Company evaluates its performance based on cash flow from operations. The Company considers cash flow from operations a key measure as it demonstrates the Company’s ability to generate the cash flow necessary to fund future growth through capital investment and to repay debt. The reconciliation “Cash Flow from Operations” presents certain non-cash items that are included in the Company’s financial results. Cash flow from operations may not be comparable to similar measures presented by other companies. |
| (3) | On March 2, 2016, the Board of Directors declared a quarterly dividend of $0.23 per common share, beginning with the dividend payable on April 1, 2016. In 2015 the Board of Directors declared a quarterly dividend of $0.23 per common share, beginning with the dividend payable on April 1, 2015. In 2014, the Board of Directors approved a quarterly dividend of $0.225 per common share, beginning with the dividend payable on April 1, 2014. In 2013, the Board of Directors approved a dividend of $0.20 per common share on November 5, 2013, beginning with the dividend payable on January 1, 2014 ($0.125 per common share, approved on March 6, 2013, beginning with the dividend payable on April 1, 2013). |
|
Adjusted Net Earnings from Operations
|
||||||||||||
|
($ millions)
|
2015
|
2014
|
2013
|
|||||||||
|
Net earnings (loss)
|
$
|
(637
|
)
|
$
|
3,929
|
$
|
2,270
|
|||||
|
Share-based compensation, net of tax (1)
|
(46
|
)
|
66
|
135
|
||||||||
|
Unrealized risk management loss (gain), net of tax (2)
|
275
|
(339
|
)
|
32
|
||||||||
|
Unrealized foreign exchange loss, net of tax (3)
|
858
|
256
|
226
|
|||||||||
|
Realized foreign exchange loss (gain) on repayment of
US dollar debt securities, net of tax (4)
|
–
|
36
|
(12
|
)
|
||||||||
|
Loss from investments, net of tax (5)(6)
|
55
|
–
|
–
|
|||||||||
|
Gains on disposition of properties and corporate acquisitions,
net of tax (7)
|
(663
|
)
|
(137
|
)
|
(231
|
)
|
||||||
|
Derecognition of exploration and evaluation assets,
net of tax (8)
|
70
|
–
|
–
|
|||||||||
|
Effect of statutory tax rate and other legislative changes on deferred income tax liabilities (9)
|
351
|
–
|
15
|
|||||||||
|
Adjusted net earnings from operations
|
$
|
263
|
$
|
3,811
|
$
|
2,435
|
||||||
|
(1)
|
The Company’s employee stock option plan provides for a cash payment option. Accordingly, the fair value of the outstanding vested options is recorded as a liability on the Company’s balance sheets and periodic changes in the fair value are recognized in net earnings (loss) or are capitalized to Oil Sands Mining and Upgrading construction costs.
|
|
(2)
|
Derivative financial instruments are recorded at fair value on the Company’s balance sheets, with changes in the fair value of non-designated hedges recognized in net earnings. The amounts ultimately realized may be materially different than reflected in the financial statements due to changes in prices of the underlying items hedged, primarily crude oil, natural gas and foreign exchange.
|
|
(3)
|
Unrealized foreign exchange gains and losses result primarily from the translation of US dollar denominated long-term debt to period-end exchange rates, partially offset by the impact of cross currency swaps, and are recognized in net earnings (loss).
|
|
(4)
|
During 2014, the Company repaid US$500 million of 1.45% debt securities and US$350 million of 4.90% debt securities. During 2013, the Company repaid US$400 million of 5.15% debt securities.
|
|
(5)
|
The Company’s investment in the 50% owned North West Redwater Partnership (“Redwater Partnership”) is accounted for using the equity method of accounting. Included in the non-cash loss from investments is the Company’s pro-rata share of the Redwater Partnership’s accounting loss.
|
|
(6)
|
The Company’s investment in PrairieSky Royalty Ltd. (“PrairieSky”) has been accounted for at fair value through profit and loss and is remeasured each period with changes in fair value recognized in net earnings.
|
|
(7)
|
During 2015, the Company recorded a pre-tax gain of $739 million ($663 million after-tax) related to the disposition of a number of North America royalty income assets and crude oil and natural gas properties. During 2014, the Company recorded an after-tax gain of $137 million related to the acquisition of certain producing crude oil and natural gas properties. During 2013, the Company recorded an after-tax gain of $231 million related to the acquisition of Barrick Energy Inc. and the disposition of a 50% interest in an exploration right in South Africa.
|
|
(8)
|
In connection with the Company’s notice of withdrawal from Block CI-514 in Côte d’Ivoire, Offshore Africa in 2015, the Company derecognized $96 million ($70 million after-tax) of exploration and evaluation assets through depletion, depreciation and amortization expense.
|
|
(9)
|
All substantively enacted adjustments in applicable income tax rates and other legislative changes are applied to underlying assets and liabilities on the Company’s balance sheets in determining deferred income tax assets and liabilities. The impact of these tax rate and other legislative changes is recorded in net earnings (loss) during the period the legislation is substantively enacted. During 2015, the Alberta government enacted legislation that increased the provincial corporate income tax rate from 10% to 12%. As a result of this income tax rate increase, the Company's deferred income tax liability was increased by $579 million. In addition, the UK government enacted tax rate reductions to the supplementary charge on oil and gas profits and the PRT, and replaced the Brownfield Allowance with a new Investment Allowance, resulting in a decrease in the Company's deferred income tax liability of $228 million. During 2013, the British Columbia government substantively enacted legislation to increase its provincial corporate income tax rate, resulting in an increase in the Company’s deferred income tax liability of $15 million.
|
|
Cash Flow from Operations
|
||||||||||||
|
($ millions)
|
2015
|
2014
|
2013
|
|||||||||
|
Net earnings (loss)
|
$
|
(637
|
)
|
$
|
3,929
|
$
|
2,270
|
|||||
|
Non-cash items:
|
||||||||||||
|
Depletion, depreciation and amortization
|
5,483
|
4,880
|
4,844
|
|||||||||
|
Share-based compensation
|
(46
|
)
|
66
|
135
|
||||||||
|
Asset retirement obligation accretion
|
173
|
193
|
171
|
|||||||||
|
Unrealized risk management loss (gain)
|
374
|
(451
|
)
|
39
|
||||||||
|
Unrealized foreign exchange loss
|
858
|
256
|
226
|
|||||||||
|
Realized foreign exchange loss (gain) on repayment of
US dollar debt securities
|
–
|
36
|
(12
|
)
|
||||||||
|
Loss from investments
|
55
|
8
|
4
|
|||||||||
|
Deferred income tax expense
|
231
|
807
|
31
|
|||||||||
|
Gains on disposition of properties and corporate acquisitions
|
(739
|
)
|
(137
|
)
|
(289
|
)
|
||||||
|
Current income tax on disposition of properties
|
33
|
–
|
58
|
|||||||||
|
Cash flow from operations
|
$
|
5,785
|
$
|
9,587
|
$
|
7,477
|
||||||
For 2015, the Company reported a net loss of $637 million compared with net earnings of $3,929 million for 2014 (2013 – $2,270 million net earnings). The net loss for 2015 included net after-tax expenses of $900 million related to the effects of share-based compensation, risk management activities, fluctuations in foreign exchange rates including the impact of realized foreign exchange losses and gains on repayment of long-term debt, loss from investments, gains on disposition of properties and corporate acquisitions, derecognition of exploration and evaluation assets and the impact of statutory tax rate and other legislative changes on deferred income tax liabilities (2014 – $118 million after-tax income; 2013 – $165 million after-tax expenses). Excluding these items, adjusted net earnings from operations for 2015 were $263 million compared with $3,811 million for 2014 (2013 – $2,435 million).
The decrease in adjusted net earnings for 2015 compared to 2014 was primarily due to:
| — | lower crude oil and NGLs netbacks in the Exploration and Production segments; |
| — | lower realized SCO prices; |
| — | lower natural gas netbacks in the North America segment; and |
| — | higher depletion, depreciation and amortization expense; |
partially offset by:
| — | higher crude oil and NGLs, SCO and natural gas sales volumes across all segments; |
| — | higher realized risk management gains; and |
| — | the impact of a weaker Canadian dollar relative to the US dollar. |
The impacts of share-based compensation, risk management activities and fluctuations in foreign exchange rates are expected to continue to contribute to significant volatility in consolidated net earnings (loss) and are discussed in detail in the relevant sections of this MD&A.
Cash flow from operations for 2015 decreased to $5,785 million ($5.29 per common share) from $9,587 million for 2014 ($8.78 per common share) (2013 – $7,477 million; $6.87 per common share). The decrease in cash flow from operations for 2015 from 2014 was primarily due to the factors noted above relating to the decrease in adjusted net earnings, as well as due to the impact of cash taxes.
In the Company’s Exploration and Production activities, the 2015 average sales price per bbl of crude oil and NGLs decreased 47% to average $41.13 per bbl from $77.04 per bbl in 2014 (2013 – $73.81 per bbl), and the 2015 average natural gas price decreased 35% to average $3.16 per Mcf from $4.83 per Mcf in 2014 (2013 – $3.58 per Mcf). In the Oil Sands Mining and Upgrading segment, the Company’s 2015 SCO sales price decreased 39% to average $61.39 per bbl from $100.27 per bbl in 2014 (2013 – $100.75 per bbl).
Total production of crude oil and NGLs before royalties increased 6% to 564,188 bbl/d from 531,194 bbl/d in 2014 (2013 – 478,240 bbl/d). The increase in crude oil and NGLs production from 2014 was primarily due to increased production in the Horizon and International segments as well as from acquisitions of producing Canadian crude oil properties in 2014.
Total natural gas production before royalties increased 11% to average 1,726 MMcf/d from 1,555 MMcf/d in 2014 (2013 – 1,158 MMcf/d). The increase in natural gas production was primarily a result of the acquisitions of producing Canadian natural gas properties in 2014 and growth in production volumes in the North Sea.
Total crude oil and NGLs and natural gas production volumes before royalties increased 8% to average 851,901 BOE/d from 790,410 BOE/d in 2014 (2013 – 671,162 BOE/d).
SUMMARY OF QUARTERLY RESULTS
The following is a summary of the Company’s quarterly results for the eight most recently completed quarters:
|
($ millions, except per common share amounts)
|
|||||||||||||||||||||
|
2015
|
Total
|
Dec 31
|
Sep 30
|
Jun 30
|
Mar 31
|
||||||||||||||||
|
Product sales
|
$
|
13,167
|
$
|
2,963
|
$
|
3,316
|
$
|
3,662
|
$
|
3,226
|
|||||||||||
|
Net earnings (loss)
|
$
|
(637
|
)
|
$
|
131
|
$
|
(111
|
)
|
$
|
(405
|
)
|
$
|
(252
|
)
|
|||||||
|
Net earnings (loss) per common share
|
|||||||||||||||||||||
|
|
– basic |
$
|
(0.58
|
)
|
$
|
0.12
|
$
|
(0.10
|
)
|
$
|
(0.37
|
)
|
$
|
(0.23
|
)
|
||||||
|
|
– diluted
|
$
|
(0.58
|
)
|
$
|
0.12
|
$
|
(0.10
|
)
|
$
|
(0.37
|
)
|
$
|
(0.23
|
)
|
||||||
|
2014
|
Total
|
Dec 31
|
Sep 30
|
Jun 30
|
Mar 31
|
||||||||||||||||
|
Product sales
|
$
|
21,301
|
$
|
4,850
|
$
|
5,370
|
$
|
6,113
|
$
|
4,968
|
|||||||||||
|
Net earnings (loss)
|
$
|
3,929
|
$
|
1,198
|
$
|
1,039
|
$
|
1,070
|
$
|
622
|
|||||||||||
|
Net earnings (loss) per common share
|
|||||||||||||||||||||
|
|
– basic |
$
|
3.60
|
$
|
1.10
|
$
|
0.95
|
$
|
0.98
|
$
|
0.57
|
||||||||||
|
|
– diluted
|
$
|
3.58
|
$
|
1.09
|
$
|
0.94
|
$
|
0.97
|
$
|
0.57
|
||||||||||
Volatility in the quarterly net earnings (loss) over the eight most recently completed quarters was primarily due to:
| — | Crude oil pricing – The impact of increased shale oil production in North America, fluctuating global supply/demand including the Organization of the Petroleum Exporting Countries’ (“OPEC”) decision not to curtail crude oil production to offset the excess world supply, the impact of geopolitical uncertainties on worldwide benchmark pricing, the impact of the WCS Heavy Differential from WTI in North America and the impact of the differential between WTI and Brent benchmark pricing in the North Sea and Offshore Africa. |
| — | Natural gas pricing – The impact of fluctuations in both the demand for natural gas and inventory storage levels, and the impact of increased shale gas production in the US. |
| — | Crude oil and NGLs sales volumes – Fluctuations in production due to the cyclic nature of the Company’s Primrose thermal projects, production from Kirby South, the results from the Pelican Lake water and polymer flood projects, fluctuations in the Company’s drilling program in North America, the impact and timing of acquisitions, the impact of turnarounds at Horizon and higher drilling in Côte d’Ivoire in Offshore Africa. Sales volumes also reflected fluctuations due to timing of liftings and maintenance activities in the North Sea and Offshore Africa. |
| — | Natural gas sales volumes – Fluctuations in production due to the Company’s allocation of capital to higher return crude oil projects, as well as natural decline rates, shut-in natural gas production due to third party pipeline restrictions and related pricing impacts, and the impact and timing of acquisitions. |
| — | Production expense – Fluctuations primarily due to the impact of the demand and cost for services, fluctuations in product mix and production, the impact of seasonal costs that are dependent on weather, cost optimizations across all segments, the impact and timing of acquisitions, and turnarounds at Horizon. |
| — | Depletion, depreciation and amortization – Fluctuations due to changes in sales volumes including the impact and timing of acquisitions, proved reserves, asset retirement obligations, finding and development costs associated with crude oil and natural gas exploration, estimated future costs to develop the Company’s proved undeveloped reserves, fluctuations in international sales volumes subject to higher depletion rates, and the impact of turnarounds at Horizon. |
| — | Share-based compensation – Fluctuations due to the determination of fair market value based on the Black-Scholes valuation model of the Company’s share-based compensation liability. |
| — | Risk management – Fluctuations due to commodity volumes hedged and the recognition of gains and losses from the mark‑to‑market and subsequent settlement of the Company’s risk management activities. |
| — | Foreign exchange rates – Fluctuations in the Canadian dollar relative to the US dollar, which impacted the realized price the Company received for its crude oil and natural gas sales, as sales prices are based predominately on US dollar denominated benchmarks. Fluctuations in realized and unrealized foreign exchange gains and losses are recorded with respect to US dollar denominated debt, partially offset by the impact of cross currency swap hedges. |
| — | Income tax expense – Fluctuations in income tax expense include statutory tax rate and other legislative changes substantively enacted in the various periods. |
| — | Gains on disposition of properties and corporate acquisitions – Fluctuations due to the recognition of gains on disposition of properties in the third and fourth quarters of 2015 and acquisitions in the fourth quarter of 2014. |
BUSINESS ENVIRONMENT
|
(Yearly average)
|
2015
|
2014
|
2013
|
|||||||||
|
WTI benchmark price (US$/bbl)
|
$
|
48.76
|
$
|
92.92
|
$
|
98.00
|
||||||
|
Brent benchmark price (US$/bbl)
|
$
|
52.40
|
$
|
98.85
|
$
|
108.62
|
||||||
|
WCS blend differential from WTI (US$/bbl)
|
$
|
13.51
|
$
|
19.41
|
$
|
25.11
|
||||||
|
WCS blend differential from WTI (%)
|
28%
|
|
21%
|
|
26%
|
|
||||||
|
SCO price (US$/bbl)
|
$
|
48.59
|
$
|
91.35
|
$
|
98.18
|
||||||
|
Condensate benchmark price (US$/bbl)
|
$
|
47.34
|
$
|
92.84
|
$
|
101.67
|
||||||
|
NYMEX benchmark price (US$/MMBtu)
|
$
|
2.67
|
$
|
4.37
|
$
|
3.67
|
||||||
|
AECO benchmark price (C$/GJ)
|
$
|
2.62
|
$
|
4.19
|
$
|
3.00
|
||||||
|
US / Canadian dollar average exchange rate (US$)
|
$
|
0.7820
|
$
|
0.9054
|
$
|
0.9710
|
||||||
|
US / Canadian dollar year end exchange rate (US$)
|
$
|
0.7225
|
$
|
0.8620
|
$
|
0.9402
|
||||||
Substantially all of the Company’s production is sold based on US dollar benchmark pricing. Specifically, crude oil is marketed based on WTI and Brent indices. Canadian natural gas pricing is primarily based on Alberta AECO reference pricing, which is derived from the NYMEX reference pricing and adjusted for its basis or location differential to the NYMEX delivery point at Henry Hub. The Company’s realized prices are highly sensitive to fluctuations in foreign exchange rates. Realized prices in 2015 continued to be supported by the weak Canadian dollar, which increased the Canadian dollar sales price the Company received for its crude oil and natural gas sales, as realized pricing is based on US dollar denominated benchmarks. The average value of the Canadian dollar in relation to the US dollar fluctuated significantly throughout 2015, with a high of approximately US$0.85 in January 2015 and a low of approximately US$0.71 in December 2015.
Crude oil sales contracts in the North America segment are typically based on WTI benchmark pricing. For 2015, WTI averaged US$48.76 per bbl, a decrease of 48% from US$92.92 per bbl for 2014 (2013 – US$98.00 per bbl).
Crude oil sales contracts for the Company’s North Sea and Offshore Africa segments are typically based on Brent pricing, which is representative of international markets and overall world supply and demand. Brent averaged US$52.40 per bbl for 2015, a decrease of 47% from US$98.85 per bbl for 2014 (2013 – US$108.62 per bbl).
WTI and Brent pricing continued to reflect volatility in supply and demand factors and geopolitical events. An oversupply of crude oil in the world market contributed to a significant decrease in crude oil benchmark pricing in 2015. OPEC’s decision not to curtail crude oil production to offset the excess world supply continues to put downward pressure on benchmark pricing.
The WCS Heavy Differential averaged 28% for 2015 compared with 21% for 2014 (2013 – 26%). Fluctuations in the WCS Heavy Differential reflect seasonal demand, changes in transportation logistics, and refinery utilization and shutdowns.
The SCO price averaged US$48.59 per bbl in 2015, a decrease of 47% from US$91.35 per bbl for 2014 (2013 – US$98.18 per bbl). The decrease in SCO pricing for 2015 was primarily due to lower WTI benchmark pricing and the impact of industry wide unplanned upgrader outages.
NYMEX natural gas prices averaged US$2.67 per MMBtu for 2015, a decrease of 39% from US$4.37 per MMBtu for 2014 (2013 – US$3.67 per MMBtu). AECO natural gas pricing averaged $2.62 per GJ for 2015, a decrease of 37% from $4.19 per GJ for 2014 (2013 – $3.00 per GJ). Natural gas prices were lower in 2015 reflecting strong natural gas production and lower demand as North America experienced warmer than normal winter temperatures in 2015. In addition, 2014 prices were higher due to lower than average storage levels in 2014 due to colder than normal winter temperatures.
ANALYSIS OF CHANGES IN PRODUCT SALES
|
Changes due to
|
Changes due to
|
|||||||||||||||||||||||||||||||||||
|
($ millions)
|
2013
|
Volumes
|
Prices
|
Other
|
2014
|
Volumes
|
Prices
|
Other
|
2015
|
|||||||||||||||||||||||||||
|
North America
|
||||||||||||||||||||||||||||||||||||
|
Crude oil and
NGLs |
$
|
11,246
|
$
|
1,527
|
$
|
585
|
$
|
(26
|
)
|
$
|
13,332
|
$
|
402
|
$
|
(6,378
|
)
|
$
|
96
|
$
|
7,452
|
||||||||||||||||
|
Natural gas
|
1,413
|
497
|
721
|
–
|
2,631
|
234
|
(1,095
|
)
|
–
|
1,770
|
||||||||||||||||||||||||||
|
12,659
|
2,024
|
1,306
|
(26
|
)
|
15,963
|
636
|
(7,473
|
)
|
96
|
9,222
|
||||||||||||||||||||||||||
|
North Sea
|
||||||||||||||||||||||||||||||||||||
|
Crude oil and
NGLs |
795
|
(3
|
)
|
(37
|
)
|
(73
|
)
|
682
|
137
|
(317
|
)
|
10
|
512
|
|||||||||||||||||||||||
|
Natural gas
|
10
|
8
|
1
|
–
|
19
|
73
|
34
|
–
|
126
|
|||||||||||||||||||||||||||
|
805
|
5
|
(36
|
)
|
(73
|
)
|
701
|
210
|
(283
|
)
|
10
|
638
|
|||||||||||||||||||||||||
|
Offshore Africa
|
||||||||||||||||||||||||||||||||||||
|
Crude oil and
NGLs |
733
|
(264
|
)
|
(52
|
)
|
(7
|
)
|
410
|
185
|
(214
|
)
|
8
|
389
|
|||||||||||||||||||||||
|
Natural gas
|
91
|
(10
|
)
|
12
|
–
|
93
|
24
|
(24
|
)
|
–
|
93
|
|||||||||||||||||||||||||
|
824
|
(274
|
)
|
(40
|
)
|
(7
|
)
|
503
|
209
|
(238
|
)
|
8
|
482
|
||||||||||||||||||||||||
|
Subtotal
|
||||||||||||||||||||||||||||||||||||
|
Crude oil and
NGLs |
12,774
|
1,260
|
496
|
(106
|
)
|
14,424
|
724
|
(6,909
|
)
|
114
|
8,353
|
|||||||||||||||||||||||||
|
Natural gas
|
1,514
|
495
|
734
|
–
|
2,743
|
331
|
(1,085
|
)
|
–
|
1,989
|
||||||||||||||||||||||||||
|
14,288
|
1,755
|
1,230
|
(106
|
)
|
17,167
|
1,055
|
(7,994
|
)
|
114
|
10,342
|
||||||||||||||||||||||||||
|
Oil Sands Mining and Upgrading
|
3,631
|
463
|
(20
|
)
|
21
|
4,095
|
435
|
(1,749
|
)
|
(17
|
)
|
2,764
|
||||||||||||||||||||||||
|
Midstream
|
110
|
–
|
–
|
10
|
120
|
–
|
–
|
16
|
136
|
|||||||||||||||||||||||||||
|
Intersegment
eliminations and other (1) |
(84
|
)
|
–
|
–
|
3
|
(81
|
)
|
–
|
–
|
6
|
(75
|
)
|
||||||||||||||||||||||||
|
Total
|
$
|
17,945
|
$
|
2,218
|
$
|
1,210
|
$
|
(72
|
)
|
$
|
21,301
|
$
|
1,490
|
$
|
(9,743
|
)
|
$
|
119
|
$
|
13,167
|
||||||||||||||||
| (1) | Eliminates internal transportation and electricity charges. |
Product sales decreased 38% to $13,167 million for 2015 from $21,301 million for 2014 (2013 – $17,945 million). The decrease was primarily due to lower realized prices, partially offset by higher crude oil and NGLs, natural gas, and SCO sales volumes in all segments.
For 2015, 9% of the Company’s crude oil and NGLs and natural gas product sales were generated outside of North America (2014 – 6%; 2013 – 9%). North Sea accounted for 5% of crude oil and NGLs and natural gas product sales for 2015 (2014 – 3%; 2013 – 4%), and Offshore Africa accounted for 4% of crude oil and NGLs and natural gas product sales for 2015 (2014 – 3%; 2013 – 5%).
ANALYSIS OF DAILY PRODUCTION, BEFORE ROYALTIES
|
2015
|
2014
|
2013
|
|
|
Crude oil and NGLs (bbl/d)
|
|||
|
North America – Exploration and Production
|
399,982
|
390,814
|
343,699
|
|
North America – Oil Sands Mining and Upgrading (1)
|
122,911
|
110,571
|
100,284
|
|
North Sea
|
22,216
|
17,380
|
18,334
|
|
Offshore Africa
|
19,079
|
12,429
|
15,923
|
|
564,188
|
531,194
|
478,240
|
|
|
Natural gas (MMcf/d)
|
|||
|
North America
|
1,663
|
1,527
|
1,130
|
|
North Sea
|
36
|
7
|
4
|
|
Offshore Africa
|
27
|
21
|
24
|
|
1,726
|
1,555
|
1,158
|
|
|
Total barrels of oil equivalent (BOE/d)
|
851,901
|
790,410
|
671,162
|
|
Product mix
|
|||
|
Light and medium crude oil and NGLs
|
16%
|
15%
|
15%
|
|
Pelican Lake heavy crude oil
|
6%
|
6%
|
7%
|
|
Primary heavy crude oil
|
15%
|
18%
|
20%
|
|
Bitumen (thermal oil)
|
15%
|
14%
|
14%
|
|
Synthetic crude oil (1)
|
14%
|
14%
|
15%
|
|
Natural gas
|
34%
|
33%
|
29%
|
|
Percentage of gross revenue (1) (2)
|
|||
|
(excluding Midstream revenue)
|
|||
|
Crude oil and NGLs
|
82%
|
85%
|
90%
|
|
Natural gas
|
18%
|
15%
|
10%
|
| (1) | 2015 SCO production before royalties excludes 2,122 bbl/d of SCO consumed internally as diesel (2014 – 545 bbl/d; 2013 – nil). |
| (2) | Net of blending costs and excluding risk management activities. |
ANALYSIS OF DAILY PRODUCTION, NET OF ROYALTIES
|
2015
|
2014
|
2013
|
|
|
Crude oil and NGLs (bbl/d)
|
|||
|
North America – Exploration and Production
|
350,451
|
318,291
|
287,428
|
|
North America – Oil Sands Mining and Upgrading
|
121,208
|
104,095
|
95,098
|
|
North Sea
|
22,164
|
17,313
|
18,279
|
|
Offshore Africa
|
18,209
|
11,500
|
12,973
|
|
512,032
|
451,199
|
413,778
|
|
|
Natural gas (MMcf/d)
|
|||
|
North America
|
1,606
|
1,407
|
1,080
|
|
North Sea
|
36
|
7
|
4
|
|
Offshore Africa
|
25
|
18
|
20
|
|
1,667
|
1,432
|
1,104
|
|
|
Total barrels of oil equivalent (BOE/d)
|
789,799
|
689,893
|
597,835
|
The Company’s business approach is to maintain large project inventories and production diversification among each of the commodities it produces; namely light and medium crude oil and NGLs, primary heavy crude oil, Pelican Lake heavy crude oil, bitumen (thermal oil), SCO and natural gas.
Total 2015 production averaged 851,901 BOE/d, an 8% increase from 790,410 BOE/d in 2014 (2013 – 671,162 BOE/d).
Total production of crude oil and NGLs before royalties increased 6% to 564,188 bbl/d for 2015 from 531,194 bbl/d in 2014 (2013 – 478,240 bbl/d). The increase in crude oil and NGLs production from 2014 was primarily due to increased production in the Horizon and International segments as well as from acquisitions of producing Canadian crude oil properties in 2014. Crude oil and NGLs production for 2015 was within the Company’s previously issued guidance of 555,000 to 591,000 bbl/d.
Natural gas production continued to represent the Company’s largest product offering, accounting for 34% of the Company’s total production in 2015 on a BOE basis. Total natural gas production before royalties increased 11% to 1,726 MMcf/d for 2015 from 1,555 MMcf/d for 2014 (2013 – 1,158 MMcf/d). The increase in natural gas production from 2014 was primarily a result of acquisitions of producing Canadian natural gas properties in 2014 and growth in production volumes in the North Sea. Annual 2015 natural gas production reflected the impact of third party pipeline transportation restrictions in Northwest Alberta during the second half of 2015, including both temporary and permanent shut-ins of volumes in the fourth quarter of 2015 due to the impact of low natural gas prices resulting from these restrictions. As a result, 2015 natural gas production of 1,726 MMcf/d was slightly below the Company’s previously issued guidance of 1,730 to 1,770 MMcf/d.
North America – Exploration and Production
North America crude oil and NGLs production for 2015 increased 2% to average 399,982 bbl/d from 390,814 bbl/d for 2014 (2013 – 343,699 bbl/d). The increase in production from 2014 was primarily due to increased production in the Company’s thermal areas, including Kirby South, and increased production related to the acquisitions of producing Canadian crude oil properties in 2014.
North America natural gas production for 2015 increased 9% to average 1,663 MMcf/d from 1,527 MMcf/d in 2014 (2013 – 1,130 MMcf/d). The increase in natural gas production from 2014 was primarily a result of acquisitions of producing Canadian natural gas properties in 2014, offset by the impact of third party transportation restrictions during the second half of 2015.
North America – Oil Sands Mining and Upgrading
SCO production for 2015 increased 11% to average 122,911 bbl/d compared with 110,571 bbl/d for 2014 (2013 – 100,284 bbl/d). Production in 2015 continued to reflect high utilization rates and reliability, following the completion of the planned turnaround during the year and the coker expansion tie-in in 2014.
North Sea
North Sea crude oil production for 2015 was 22,216 bbl/d, an increase of 28% from 17,380 bbl/d for 2014 (2013 – 18,334 bbl/d). The increase in production from 2014 primarily reflected the reinstatement of production from both the Banff FPSO and the Tiffany platform in 2014 and the impact of planned turnarounds completed at the Ninian platforms in 2015.
Offshore Africa
Offshore Africa crude oil production for 2015 increased 54% to 19,079 bbl/d from 12,429 bbl/d for 2014 (2013 – 15,923 bbl/d) as new wells came on stream at both the Espoir and the Baobab fields throughout 2015, partially offset by natural field declines. In late December 2015, the Baobab field was temporarily shut-in due to a riser failure and after inspection of the riser system, production was reinstated in late January 2016.
Corporate Production Guidance for 2016
The Company targets production levels in 2016 to average between 514,000 bbl/d and 563,000 bbl/d of crude oil and NGLs and between 1,770 MMcf/d and 1,830 MMcf/d of natural gas.
INTERNATIONAL CRUDE OIL INVENTORY VOLUMES
The Company recognizes revenue on its crude oil production when title transfers to the customer and delivery has taken place. Revenue has not been recognized in the International business segments on crude oil volumes that were stored in various storage facilities or FPSOs, as follows:
|
(bbl)
|
2015
|
2014
|
2013
|
|
North Sea
|
835,806
|
368,808
|
385,073
|
|
Offshore Africa
|
1,271,170
|
461,997
|
185,476
|
|
2,106,976
|
830,805
|
570,549
|
OPERATING HIGHLIGHTS – EXPLORATION AND PRODUCTION
|
2015
|
2014
|
2013
|
||||||||||
|
Crude oil and NGLs ($/bbl) (1)
|
||||||||||||
|
Sales price (2)
|
$
|
41.13
|
$
|
77.04
|
$
|
73.81
|
||||||
|
Transportation
|
2.60
|
2.41
|
2.22
|
|||||||||
|
Realized sales price, net of transportation
|
38.53
|
74.63
|
71.59
|
|||||||||
|
Royalties
|
4.30
|
12.99
|
11.13
|
|||||||||
|
Production expense
|
15.74
|
18.25
|
17.14
|
|||||||||
|
Netback
|
$
|
18.49
|
$
|
43.39
|
$
|
43.32
|
||||||
|
Natural gas ($/Mcf) (1)
|
||||||||||||
|
Sales price (2)
|
$
|
3.16
|
$
|
4.83
|
$
|
3.58
|
||||||
|
Transportation
|
0.38
|
0.27
|
0.28
|
|||||||||
|
Realized sales price, net of transportation
|
2.78
|
4.56
|
3.30
|
|||||||||
|
Royalties
|
0.10
|
0.38
|
0.18
|
|||||||||
|
Production expense
|
1.34
|
1.48
|
1.42
|
|||||||||
|
Netback
|
$
|
1.34
|
$
|
2.70
|
$
|
1.70
|
||||||
|
Barrels of oil equivalent ($/BOE) (1)
|
||||||||||||
|
Sales price (2)
|
$
|
32.60
|
$
|
58.48
|
$
|
56.46
|
||||||
|
Transportation
|
2.56
|
2.18
|
2.10
|
|||||||||
|
Realized sales price, net of transportation
|
30.04
|
56.30
|
54.36
|
|||||||||
|
Royalties
|
2.85
|
8.90
|
7.74
|
|||||||||
|
Production expense
|
12.70
|
14.67
|
14.24
|
|||||||||
|
Netback
|
$
|
14.49
|
$
|
32.73
|
$
|
32.38
|
||||||
|
(1)
|
Amounts expressed on a per unit basis are based on sales volumes.
|
|
(2)
|
Net of blending costs and excluding risk management activities.
|
ANALYSIS OF PRODUCT PRICES – EXPLORATION AND PRODUCTION
|
2015
|
2014
|
2013
|
||||||||||
|
Crude oil and NGLs ($/bbl) (1) (2)
|
||||||||||||
|
North America
|
$
|
38.96
|
$
|
75.09
|
$
|
69.90
|
||||||
|
North Sea
|
$
|
65.13
|
$
|
106.63
|
$
|
112.46
|
||||||
|
Offshore Africa
|
$
|
63.13
|
$
|
97.81
|
$
|
110.21
|
||||||
|
Company average
|
$
|
41.13
|
$
|
77.04
|
$
|
73.81
|
||||||
|
Natural gas ($/Mcf) (1) (2)
|
||||||||||||
|
North America
|
$
|
2.91
|
$
|
4.72
|
$
|
3.43
|
||||||
|
North Sea
|
$
|
9.66
|
$
|
7.07
|
$
|
5.69
|
||||||
|
Offshore Africa
|
$
|
9.53
|
$
|
11.98
|
$
|
10.45
|
||||||
|
Company average
|
$
|
3.16
|
$
|
4.83
|
$
|
3.58
|
||||||
|
Company average ($/BOE) (1) (2)
|
$
|
32.60
|
$
|
58.48
|
$
|
56.46
|
||||||
| (1) | Amounts expressed on a per unit basis are based on sales volumes. |
| (2) | Net of blending costs and excluding risk management activities. |
Realized crude oil and NGLs prices decreased 47% to average $41.13 per bbl for 2015 from $77.04 per bbl for 2014 (2013 – $73.81 per bbl). The decrease in 2015 was primarily due to lower benchmark pricing and a widening WCS Heavy Differential as a percentage of WTI, partially offset by the impact of a weakening Canadian dollar.
The Company’s realized natural gas price decreased 35% to average $3.16 per Mcf for 2015 from $4.83 per Mcf for 2014 (2013 – $3.58 per Mcf). The decrease in 2015 was due to strong natural gas production and lower demand as North America experienced warmer than normal winter temperatures in 2015. In addition, 2014 prices were higher due to lower than average storage levels in 2014 due to colder than normal winter temperatures.
North America
North America realized crude oil prices decreased 48% to average $38.96 per bbl for 2015 from $75.09 per bbl for 2014 (2013 – $69.90 per bbl), primarily due to lower WTI benchmark pricing and a widening WCS Heavy Differential as a percentage of WTI, partially offset by the impact of a weakening Canadian dollar.
North America realized natural gas prices decreased 38% to average $2.91 per Mcf for 2015 from $4.72 per Mcf for 2014 (2013 – $3.43 per Mcf), primarily due to strong natural gas production and lower demand as North America experienced warmer than normal winter temperatures in 2015. In addition, 2014 prices were higher due to lower than average storage levels in 2014 due to colder than normal winter temperatures.
The Company continues to focus on its crude oil marketing strategy including a blending strategy that expands markets within current pipeline infrastructure, supporting pipeline projects that will provide capacity to transport crude oil to new markets, and working with refiners to add incremental heavy crude oil and bitumen (thermal oil) conversion capacity. During 2015, the Company contributed approximately 183,000 bbl/d of heavy crude oil blends to the WCS stream. During 2013, the Company entered into a 20 year transportation agreement to ship 80,000 bbl/d of crude oil on the proposed Energy East pipeline originating at Hardisty, Alberta with delivery points in Quebec City, Quebec and Saint John, New Brunswick. This pipeline is subject to regulatory approval. The Company previously entered into a 20 year transportation agreement to ship 75,000 bbl/d of crude oil on the proposed Kinder Morgan Trans Mountain Expansion from Edmonton, Alberta to Vancouver, British Columbia. This pipeline is subject to regulatory approval.
Comparisons of the prices received in North America Exploration and Production by product type were as follows:
|
(Yearly average)
|
2015
|
2014
|
2013
|
|||||||||
|
Wellhead Price (1) (2)
|
||||||||||||
|
Light and medium crude oil and NGLs (C$/bbl)
|
$
|
41.88
|
$
|
76.94
|
$
|
76.44
|
||||||
|
Pelican Lake heavy crude oil (C$/bbl)
|
$
|
41.09
|
$
|
77.58
|
$
|
70.62
|
||||||
|
Primary heavy crude oil (C$/bbl)
|
$
|
40.71
|
$
|
76.29
|
$
|
69.06
|
||||||
|
Bitumen (thermal oil) (C$/bbl)
|
$
|
34.37
|
$
|
70.78
|
$
|
66.14
|
||||||
|
Natural gas (C$/Mcf)
|
$
|
2.91
|
$
|
4.72
|
$
|
3.43
|
||||||
| (1) | Amounts expressed on a per unit basis are based on sales volumes. |
| (2) | Net of blending costs and excluding risk management activities. |
North Sea
North Sea realized crude oil prices decreased 39% to average $65.13 per bbl for 2015 from $106.63 per bbl for 2014 (2013 – $112.46 per bbl). Realized crude oil prices per bbl in any particular year are dependent on the terms of the various sales contracts, the frequency and timing of liftings of each field, and prevailing crude oil prices and foreign exchange rates at the time of lifting. The decrease in realized crude oil prices in 2015 reflected prevailing Brent benchmark pricing at the time of liftings, partially offset by the weaker Canadian dollar.
Offshore Africa
Offshore Africa realized crude oil prices decreased 35% to average $63.13 per bbl for 2015 from $97.81 per bbl for 2014 (2013 – $110.21 per bbl). Realized crude oil prices per bbl in any particular year are dependent on the terms of the various sales contracts, the frequency and timing of liftings of each field, and prevailing crude oil prices and foreign exchange rates at the time of lifting. The decrease in realized crude oil prices in 2015 reflected prevailing Brent benchmark pricing at the time of liftings, partially offset by the weaker Canadian dollar.
ROYALTIES – EXPLORATION AND PRODUCTION
|
2015
|
2014
|
2013
|
||||||||||
|
Crude oil and NGLs ($/bbl) (1)
|
||||||||||||
|
North America
|
$
|
4.57
|
$
|
13.74
|
$
|
11.30
|
||||||
|
North Sea
|
$
|
0.14
|
$
|
0.33
|
$
|
0.33
|
||||||
|
Offshore Africa
|
$
|
2.87
|
$
|
6.83
|
$
|
18.18
|
||||||
|
Company average
|
$
|
4.30
|
$
|
12.99
|
$
|
11.13
|
||||||
|
Natural gas ($/Mcf) (1)
|
||||||||||||
|
North America
|
$
|
0.09
|
$
|
0.36
|
$
|
0.14
|
||||||
|
Offshore Africa
|
$
|
0.46
|
$
|
1.74
|
$
|
1.83
|
||||||
|
Company average
|
$
|
0.10
|
$
|
0.38
|
$
|
0.18
|
||||||
|
Company average ($/BOE) (1)
|
$
|
2.85
|
$
|
8.90
|
$
|
7.74
|
||||||
| (1) | Amounts expressed on a per unit basis are based on sales volumes. |
North America
Government royalties on a significant portion of North America crude oil and NGLs production fall under the oil sands royalty regime and are calculated on a project by project basis as a percentage of gross revenue less operating, capital and abandonment costs incurred (“net profit”).
Crude oil and NGLs royalties averaged approximately 13% of product sales for 2015 compared with 19% in 2014 (2013 – 17%) primarily due to lower realized crude oil prices. North America crude oil and NGLs royalties per bbl are anticipated to average 7% to 9% of product sales for 2016.
Natural gas royalties averaged approximately 4% of product sales for 2015 compared with 8% in 2014 (2013 – 5%) primarily due to lower realized natural gas prices. North America natural gas royalties per Mcf are anticipated to average 1.5% to 2.5% of product sales for 2016.
North Sea
The UK government royalties on crude oil were eliminated effective January 1, 2003. The remaining royalty is a gross overriding royalty on the Ninian field.
Offshore Africa
Under the terms of the various Production Sharing Contracts, royalty rates fluctuate based on realized commodity pricing, capital and operating costs, the status of payouts, and the timing of liftings from each field.
Royalty rates as a percentage of product sales averaged approximately 5% for 2015 compared with 8% for 2014 (2013 – 17%). The decrease in royalties was primarily a result of the timing of liftings and the status of payout in the various fields. Offshore Africa royalty rates are anticipated to average 6% to 8% of product sales for 2016.
PRODUCTION EXPENSE – EXPLORATION AND PRODUCTION
|
2015
|
2014
|
2013
|
||||||||||
|
Crude oil and NGLs ($/bbl) (1)
|
||||||||||||
|
North America
|
$
|
12.51
|
$
|
14.98
|
$
|
14.20
|
||||||
|
North Sea
|
$
|
63.67
|
$
|
74.04
|
$
|
66.19
|
||||||
|
Offshore Africa
|
$
|
33.32
|
$
|
43.97
|
$
|
25.32
|
||||||
|
Company average
|
$
|
15.74
|
$
|
18.25
|
$
|
17.14
|
||||||
|
Natural gas ($/Mcf) (1)
|
||||||||||||
|
North America
|
$
|
1.27
|
$
|
1.42
|
$
|
1.39
|
||||||
|
North Sea
|
$
|
4.41
|
$
|
9.10
|
$
|
4.67
|
||||||
|
Offshore Africa
|
$
|
1.76
|
$
|
3.22
|
$
|
2.53
|
||||||
|
Company average
|
$
|
1.34
|
$
|
1.48
|
$
|
1.42
|
||||||
|
Company average ($/BOE) (1)
|
$
|
12.70
|
$
|
14.67
|
$
|
14.24
|
||||||
| (1) | Amounts expressed on a per unit basis are based on sales volumes. |
North America
North America crude oil and NGLs production expense for 2015 decreased 16% to $12.51 per bbl from $14.98 per bbl for 2014 (2013 – $14.20 per bbl), reflecting continued reductions in production expense in 2015, as a result of the Company’s ongoing focus on cost control and efficiencies across the asset base, together with lower industry service costs. North America crude oil and NGLs production expense is anticipated to average $11.25 to $12.25 per bbl for 2016.
North America natural gas production expense for 2015 decreased 11% to $1.27 per Mcf from $1.42 per Mcf for 2014 (2013 – $1.39 per Mcf), reflecting continued reductions in production expense in 2015, as a result of the Company’s ongoing focus on cost control and efficiencies across the asset base, together with lower industry service costs. North America natural gas production expense is anticipated to average $1.10 to $1.30 per Mcf for 2016.
North Sea
North Sea crude oil production expense for 2015 decreased 14% to $63.67 per bbl from $74.04 per bbl for 2014 (2013 – $66.19 per bbl). The decrease was primarily due to higher production volumes on a relatively fixed cost structure and reflected the Company’s continuous focus on cost control and efficiencies, partially offset by the impact of the weaker Canadian dollar in 2015 and the impact of product inventory valuation adjustments. North Sea crude oil production expense is anticipated to average $47.00 to $53.00 per bbl for 2016.
Offshore Africa
Offshore Africa crude oil production expense for 2015 decreased 24% to $33.32 per bbl from $43.97 per bbl for 2014 (2013 – $25.32 per bbl). The decrease in production expense was primarily due to the impact of higher production volumes and the timing of liftings from various fields, including the Olowi field, which have different cost structures, offset by the impact of the weaker Canadian dollar in 2015 and the impact of product inventory valuation adjustments in the Olowi field. Annual 2015 Offshore Africa production expense exceeded the Company’s previously issued guidance of $24.00 to $28.00 and is expected to average $18.00 to $22.00 per bbl for 2016.
DEPLETION, DEPRECIATION AND AMORTIZATION – EXPLORATION AND PRODUCTION
|
($ millions, except per BOE amounts)
|
2015
|
2014
|
2013
|
|||||||||
|
North America
|
$
|
4,248
|
$
|
3,901
|
$
|
3,568
|
||||||
|
North Sea
|
388
|
269
|
552
|
|||||||||
|
Offshore Africa
|
273
|
105
|
134
|
|||||||||
|
Expense
|
$
|
4,909
|
$
|
4,275
|
$
|
4,254
|
||||||
|
$/BOE (1)
|
$
|
18.50
|
$
|
17.27
|
$
|
20.38
|
||||||
| (1) | Amounts expressed on a per unit basis are based on sales volumes. |
Depletion, depreciation and amortization expense for 2015 increased 7% to $18.50 per BOE from $17.27 per BOE for 2014 (2013 – $20.38 per BOE). The increase primarily reflected increased sales volumes in the International segments which have higher associated depletion rates, together with the impact of depletion expense resulting from the Company’s derecognition of exploration and evaluation assets in Block CI-514 in Côte d’Ivoire, Offshore.
ASSET RETIREMENT OBLIGATION ACCRETION – EXPLORATION AND PRODUCTION
|
($ millions, except per BOE amounts)
|
2015
|
2014
|
2013
|
|||||||||
|
North America
|
$
|
93
|
$
|
98
|
$
|
92
|
||||||
|
North Sea
|
39
|
38
|
35
|
|||||||||
|
Offshore Africa
|
10
|
10
|
10
|
|||||||||
|
Expense
|
$
|
142
|
$
|
146
|
$
|
137
|
||||||
|
$/BOE (1)
|
$
|
0.54
|
$
|
0.59
|
$
|
0.66
|
||||||
| (1) | Amounts expressed on a per unit basis are based on sales volumes. |
Asset retirement obligation accretion expense decreased 8% to $0.54 per BOE from $0.59 per BOE for 2014 (2013 – $0.66 per BOE) primarily due to the impact of increased sales volumes.
OPERATING HIGHLIGHTS – OIL SANDS MINING AND UPGRADING
OPERATIONS UPDATE
The Company continues to focus on reliable and efficient operations. During 2015, operating performance continued to be strong, leading to average production of 122,911 bbl/d, reflecting high utilization rates and reliability.
PRODUCT PRICES, ROYALTIES AND TRANSPORTATION – OIL SANDS MINING AND UPGRADING
|
($/bbl)
|
2015
|
2014
|
2013
|
|||||||||
|
SCO sales price(1)
|
$
|
61.39
|
$
|
100.27
|
$
|
100.75
|
||||||
|
Bitumen value for royalty purposes (1) (2)
|
$
|
32.14
|
$
|
67.63
|
$
|
65.48
|
||||||
|
Bitumen royalties (1) (3)
|
$
|
1.08
|
$
|
5.77
|
$
|
5.11
|
||||||
|
Transportation
|
$
|
1.81
|
$
|
1.85
|
$
|
1.57
|
||||||
| (1) | Amounts expressed on a per unit basis are based on sales volumes. |
| (2) | Calculated as the quarterly average of the bitumen valuation methodology price. |
| (3) | Calculated based on actual bitumen royalties expensed during the year; divided by the corresponding SCO sales volumes. |
Realized SCO sales prices averaged $61.39 per bbl for 2015, a decrease of 39% compared with $100.27 per bbl in 2014 (2013 – $100.75 per bbl), reflecting lower WTI benchmark pricing and the impact of industry wide unplanned upgrader outages.
CASH PRODUCTION COSTS – OIL SANDS MINING AND UPGRADING
The following tables are reconciled to the Oil Sands Mining and Upgrading production costs disclosed in note 20 to the Company’s consolidated financial statements.
|
($ millions)
|
2015
|
2014
|
2013
|
|||||||||
|
Cash production costs
|
$
|
1,332
|
$
|
1,609
|
$
|
1,567
|
||||||
|
Less: costs incurred during turnaround periods
|
(45
|
)
|
(98
|
)
|
(104
|
)
|
||||||
|
Adjusted cash production costs
|
$
|
1,287
|
$
|
1,511
|
$
|
1,463
|
||||||
|
Adjusted cash production costs, excluding natural gas costs
|
$
|
1,212
|
$
|
1,395
|
$
|
1,359
|
||||||
|
Adjusted natural gas costs
|
75
|
116
|
104
|
|||||||||
|
Adjusted cash production costs
|
$
|
1,287
|
$
|
1,511
|
$
|
1,463
|
||||||
|
($/bbl) (1)
|
2015
|
2014
|
2013
|
|||||||||
|
Adjusted cash production costs, excluding natural gas costs
|
$
|
26.95
|
$
|
34.33
|
$
|
37.68
|
||||||
|
Adjusted natural gas costs
|
1.66
|
2.85
|
2.89
|
|||||||||
|
Adjusted cash production costs
|
$
|
28.61
|
$
|
37.18
|
$
|
40.57
|
||||||
|
Sales (bbl/d)
|
123,231
|
111,351
|
98,757
|
|||||||||
| (1) | Amounts expressed on a per unit basis are based on sales volumes. |
Adjusted cash production costs averaged $28.61 per bbl for 2015, a decrease of 23% compared with $37.18 per bbl for 2014 (2013 – $40.57 per bbl). The decrease in 2015 adjusted cash production costs primarily reflected the Company’s continuous focus on cost control and efficiencies, high utilization rates and reliability, and lower industry service costs, resulting in annual cash production costs being below the Company’s previously issued guidance of $29.00 to 32.00 per bbl. Cash production costs are anticipated to average $27.00 to $30.00 per bbl for 2016.
DEPLETION, DEPRECIATION AND AMORTIZATION – OIL SANDS MINING AND UPGRADING
|
($ millions, except per bbl amounts)
|
2015
|
2014
|
2013
|
|||||||||
|
Depletion, depreciation and amortization
|
$
|
562
|
$
|
596
|
$
|
582
|
||||||
|
Less: depreciation incurred during turnaround periods
|
(5
|
)
|
(28
|
)
|
(79
|
)
|
||||||
|
Adjusted depletion, depreciation and amortization
|
$
|
557
|
$
|
568
|
$
|
503
|
||||||
|
$/bbl (1)
|
$
|
12.37
|
$
|
13.97
|
$
|
13.95
|
||||||
| (1) | Amounts expressed on a per unit basis are based on sales volumes excluding turnaround periods. |
Adjusted depletion, depreciation and amortization expense on a per barrel basis for 2015 decreased 11% to $12.37 per bbl from $13.97 per bbl for 2014 (2013 – $13.95 per bbl), primarily reflecting a lower depletion rate associated with the increase in productive capacity of the upgrader and related infrastructure.
ASSET RETIREMENT OBLIGATION ACCRETION – OIL SANDS MINING AND UPGRADING
|
($ millions, except per bbl amounts)
|
2015
|
2014
|
2013
|
|||||||||
|
Expense
|
$
|
31
|
$
|
47
|
$
|
34
|
||||||
|
$/bbl (1)
|
$
|
0.69
|
$
|
1.16
|
$
|
0.94
|
||||||
| (1) | Amounts expressed on a per unit basis are based on sales volumes. |
Asset retirement obligation accretion expense represents the increase in the carrying amount of the asset retirement obligation due to the passage of time.
Asset retirement obligation accretion on a per barrel basis for the year ended December 31, 2015 decreased 41% to $0.69 from $1.16 per bbl for the year ended December 31, 2014 (2013 - $0.94 per bbl).
MIDSTREAM
|
($ millions)
|
2015
|
2014
|
2013
|
|||||||||
|
Revenue
|
$
|
136
|
$
|
120
|
$
|
110
|
||||||
|
Production expense
|
32
|
34
|
34
|
|||||||||
|
Midstream cash flow
|
104
|
86
|
76
|
|||||||||
|
Depreciation
|
12
|
9
|
8
|
|||||||||
|
Equity loss from Redwater Partnership
|
44
|
8
|
4
|
|||||||||
|
Segment earnings before taxes
|
$
|
48
|
$
|
69
|
$
|
64
|
||||||
The Company’s Midstream assets include three crude oil pipeline systems and a 50% working interest in an 84-megawatt cogeneration plant at Primrose. Approximately 85% of the Company’s heavy crude oil production is transported to international mainline liquid pipelines via the 100% owned and operated ECHO Pipeline, the 62% owned and operated Pelican Lake Pipeline and the 15% owned Cold Lake Pipeline. The Midstream pipeline assets allow the Company to control the transport of a portion of its own production volumes as well as earn third party revenue. This transportation control enhances the Company’s ability to manage the full range of costs associated with the development and marketing of its heavier crude oil.
The Company has a 50% interest in the Redwater Partnership. Redwater Partnership has entered into agreements to construct and operate a 50,000 barrel per day bitumen upgrader and refinery (the "Project") under processing agreements that target to process 12,500 barrels per day of bitumen feedstock for the Company and 37,500 barrels per day of bitumen feedstock for the Alberta Petroleum Marketing Commission (“APMC”), an agent of the Government of Alberta, under a 30 year fee-for-service tolling agreement.
During 2013, the Company, along with APMC, each committed to provide funding up to $350 million by January 2016 in the form of subordinated debt bearing interest at prime plus 6%. During 2015, the Company and APMC each provided $112 million of subordinated debt (year ended December 31, 2014 – $113 million). Subsequent to December 31, 2015, the Company and APMC each provided an additional $99 million in subordinated debt. Should final Project costs exceed the revised cost estimate, the Company and APMC have agreed, subject to the Company being able to meet certain funding conditions, to fund any shortfall in available third party commercial lending required to attain Project completion.
During 2015, Redwater Partnership issued $500 million of 2.10% series C senior secured bonds due February 2022, $500 million of 3.70% series D senior secured bonds due February 2043, $500 million of 3.20% series E senior secured bonds due April 2026 and $300 million of senior secured bonds through the reopening of its previously issued 4.05% series B senior secured bonds due July 2044. As at December 31, 2015, Redwater Partnership had borrowings of $1,417 million under its secured $3,500 million syndicated credit facility. Subsequent to December 31, 2015, the Partnership issued $550 million of 4.25% series F senior secured bonds due June 2029, and $300 million of 4.75% series G senior secured bonds due June 2037.
Under its processing agreement, beginning on the earlier of the commercial operations date of the refinery and June 1, 2018, the Company is unconditionally obligated to pay its 25% pro rata share of the debt portion of the monthly cost of service toll, including interest, fees and principal repayments, of the syndicated credit facility and bonds, over the tolling period of 30 years.
Redwater Partnership has entered into various agreements related to the engineering, procurement and construction of the Project. These contracts can be cancelled by Redwater Partnership upon notice without penalty, subject to the costs incurred up to and in respect of the cancellation.
ADMINISTRATION EXPENSE
|
($ millions, except per BOE amounts)
|
2015
|
2014
|
2013
|
|||||||||
|
Expense
|
$
|
390
|
$
|
367
|
$
|
335
|
||||||
|
$/BOE (1)
|
$
|
1.26
|
$
|
1.28
|
$
|
1.37
|
||||||
| (1) | Amounts expressed on a per unit basis are based on sales volumes. |
Administration expense for 2015 decreased 2% to $1.26 per BOE from $1.28 per BOE for 2014 (2013 – $1.37 per BOE) primarily due to lower staffing related costs and general corporate costs, partially offset by the impact of lower recoveries due to the reduction in the capital expenditure program.
SHARE-BASED COMPENSATION
|
($ millions)
|
2015
|
2014
|
2013
|
|||||||||
|
(Recovery) expense
|
$
|
(46
|
)
|
$
|
66
|
$
|
135
|
|||||
The Company’s stock option plan provides current employees with the right to receive common shares or a cash payment in exchange for stock options surrendered.
The share-based compensation liability at December 31, 2015 reflected the Company’s liability for awards granted to employees at fair value estimated using the Black-Scholes valuation model. In periods when substantial share price changes occur, the Company’s net earnings are subject to significant volatility. The Company utilizes its share-based compensation plan to attract and retain employees in a competitive environment. All employees participate in this plan.
The Company recorded a $46 million share-based compensation recovery for 2015, primarily as a result of remeasurement of the fair value of outstanding stock options related to the impact of normal course graded vesting of stock options granted in prior periods, the impact of vested stock options exercised or surrendered during the period and changes in the Company’s share price. During 2015, the Company recovered $10 million of share-based compensation costs to property, plant and equipment in the Oil Sands Mining and Upgrading segment (2014 – $14 million costs capitalized; 2013 – $25 million costs capitalized).
During 2015, the Company paid $1 million for stock options surrendered for cash settlement (2014 – $8 million; 2013 – $4 million).
INTEREST AND OTHER FINANCING EXPENSE
|
($ millions, except per BOE amounts and interest rates)
|
2015
|
2014
|
2013
|
|||||||||
|
Expense, gross
|
$
|
566
|
$
|
527
|
$
|
454
|
||||||
|
Less: capitalized interest
|
244
|
204
|
175
|
|||||||||
|
Expense, net
|
$
|
322
|
$
|
323
|
$
|
279
|
||||||
|
$/BOE (1)
|
$
|
1.04
|
$
|
1.12
|
$
|
1.14
|
||||||
|
Average effective interest rate
|
3.9%
|
|
3.9%
|
|
4.4%
|
|
||||||
| (1) | Amounts expressed on a per unit basis are based on sales volumes. |
Gross interest and other financing expense for 2015 increased from 2014 primarily due to the impact of higher overall debt levels. Capitalized interest of $244 million for 2015 was primarily related to the Horizon Phase 2/3 expansion.
Net interest and other financing expense on a per BOE basis for 2015 decreased 7% to $1.04 per BOE from $1.12 per BOE for 2014 (2013 – $1.14 per BOE) primarily due to the impact of higher sales volumes.
The Company’s average effective interest rate for 2015 was comparable with 2014.
RISK MANAGEMENT ACTIVITIES
The Company periodically utilizes various derivative financial instruments to manage its commodity price, interest rate and foreign currency exposures. These derivative financial instruments are not intended for trading or speculative purposes.
|
($ millions)
|
2015
|
2014
|
2013
|
|||||||||
|
Crude oil and NGLs financial instruments
|
$
|
(599
|
)
|
$
|
(284
|
)
|
$
|
44
|
||||
|
Natural gas financial instruments
|
–
|
34
|
–
|
|||||||||
|
Foreign currency contracts
|
(244
|
)
|
(99
|
)
|
(160
|
)
|
||||||
|
Realized gain
|
$
|
(843
|
)
|
$
|
(349
|
)
|
$
|
(116
|
)
|
|||
|
Crude oil and NGLs financial instruments
|
$
|
394
|
$
|
(427
|
)
|
$
|
17
|
|||||
|
Natural gas financial instruments
|
–
|
(3
|
)
|
3
|
||||||||
|
Foreign currency contracts
|
(20
|
)
|
(21
|
)
|
19
|
|||||||
|
Unrealized loss (gain)
|
$
|
374
|
$
|
(451
|
)
|
$
|
39
|
|||||
|
Net gain
|
$
|
(469
|
)
|
$
|
(800
|
)
|
$
|
(77
|
)
|
|||
During 2015, net realized risk management gains were related to the settlement of crude oil and foreign currency contracts. The Company recorded a net unrealized loss of $374 million ($275 million after-tax) on its risk management activities (2014 – $451 million unrealized gain, $339 million after-tax; 2013 – $39 million unrealized loss, $32 million after-tax), primarily related to changes in the fair value of these contracts.
The cash settlement amount of outstanding derivative financial instruments as at December 31, 2015 may vary materially depending upon the underlying foreign exchange and interest rates at the time of final settlement, as compared to their fair value at December 31, 2015.
Complete details related to outstanding derivative financial instruments at December 31, 2015 are disclosed in note 17 to the Company’s consolidated financial statements.
FOREIGN EXCHANGE
|
($ millions)
|
2015
|
2014
|
2013
|
|||||||||
|
Net realized (gain) loss
|
$
|
(97
|
)
|
$
|
47
|
$
|
(16
|
)
|
||||
|
Net unrealized loss (1)
|
858
|
256
|
226
|
|||||||||
|
Net loss
|
$
|
761
|
$
|
303
|
$
|
210
|
||||||
| (1) | Amounts are reported net of the hedging effect of cross currency swaps. |
The Company’s operating results are significantly impacted by fluctuations in the exchange rates between the Canadian dollar, US dollar, and UK pound sterling. Predominantly all of the Company’s revenue is based on reference to US dollar benchmark prices. An increase in the value of the Canadian dollar in relation to the US dollar results in decreased revenue from the sale of the Company’s production. Conversely a decrease in the value of the Canadian dollar in relation to the US dollar results in increased revenue from the sale of the Company’s production. Production expenses in the North Sea are subject to foreign currency fluctuations due to changes in the exchange rate of the UK pound sterling to the US and Canadian dollars. Production expenses in Offshore Africa are subject to foreign currency fluctuations due to changes in the exchange rate of the US dollar to the Canadian dollar. The value of the Company’s US dollar denominated debt is also impacted by the value of the Canadian dollar in relation to the US dollar.
The net realized foreign exchange gain for 2015 was primarily due to foreign exchange rate fluctuations on settlement of working capital items denominated in US dollars or UK pounds sterling. The net unrealized foreign exchange loss in 2015 was primarily related to the impact of the weakening Canadian dollar with respect to outstanding US dollar debt. Included in the net unrealized loss for 2015 was an unrealized gain of $649 million (2014 – $259 million unrealized gain, 2013 – $165 million unrealized gain) related to the impact of cross currency swaps. The US/Canadian dollar exchange rate at December 31, 2015 was US$0.7225 (December 31, 2014 – US$0.8620; December 31, 2013 – US$0.9402).
INCOME TAXES
|
($ millions, except income tax rates)
|
2015
|
2014
|
2013
|
|||||||||
|
North America (1)
|
$
|
86
|
$
|
702
|
$
|
544
|
||||||
|
North Sea
|
(117
|
)
|
(68
|
)
|
23
|
|||||||
|
Offshore Africa (2)
|
17
|
43
|
202
|
|||||||||
|
PRT recovery – North Sea
|
(258
|
)
|
(273
|
)
|
(56
|
)
|
||||||
|
Other taxes
|
11
|
23
|
22
|
|||||||||
|
Current income tax (recovery) expense
|
(261
|
)
|
427
|
735
|
||||||||
|
Deferred income tax expense
|
216
|
681
|
163
|
|||||||||
|
Deferred PRT expense (recovery) – North Sea
|
15
|
126
|
(132
|
)
|
||||||||
|
Deferred income tax expense
|
231
|
807
|
31
|
|||||||||
|
(30
|
)
|
1,234
|
766
|
|||||||||
|
Income tax rate and other legislative changes (3)
|
(351
|
)
|
–
|
(15
|
)
|
|||||||
|
$
|
(381
|
)
|
$
|
1,234
|
$
|
751
|
||||||
|
Effective income tax rate on adjusted net
earnings from operations (4)
|
61%
|
|
25%
|
|
26%
|
|
||||||
| (1) | Includes North America Exploration and Production, Midstream, and Oil Sands Mining and Upgrading segments. |
| (2) | Includes current income taxes relating to disposition of properties in 2013. |
| (3) | During 2015, the UK government enacted tax rate reductions to the supplementary charge on oil and gas profits and PRT, and replaced the Brownfield Allowance with a new Investment Allowance, resulting in a decrease in the Company’s deferred income tax liability of $228 million. During 2015, the Alberta government enacted legislation that increased the provincial corporate income tax rate from 10% to 12%. As a result of this income tax rate increase, the Company’s deferred income tax liability was increased by $579 million. During 2013, the British Columbia government substantively enacted legislation to increase its provincial corporate income tax rate. As a result of the income tax rate change, the Company’s deferred income tax liability was increased by $15 million. |
| (4) | Excludes the impact of current and deferred PRT expense and other current income tax expense. |
Current income taxes recognized in each operating segment will vary depending upon available income tax deductions related to the nature, timing and amount of capital expenditures incurred in any particular year.
The current PRT recovery in the North Sea in 2015 and 2014 reflected the impact of abandonment expenditures on the Murchison platform.
During 2015, the Alberta government enacted legislation that increased the provincial corporate income tax rate from 10% to 12% effective July 1, 2015. As a result of this income tax rate increase, the Company’s deferred income tax liability was increased by $579 million.
During 2015, the UK government enacted legislation that reduced the supplementary charge on oil and gas profits from 32% to 20% effective January 1, 2015. In addition, the legislation reduced the PRT rate from 50% to 35% effective January 1, 2016. Allowable abandonment expenditures eligible for carryback to prior taxation years for PRT purposes are still recoverable at the previous tax rate of 50%. The legislation also replaced the existing Brownfield Allowance with a new Investment Allowance on qualifying capital expenditures, effective April 1, 2015. The new Investment Allowance is deductible for supplementary charge purposes, subject to certain restrictions. As a result of the income tax changes, the Company’s deferred income tax liability was reduced by $217 million and the deferred PRT liability was reduced by $11 million.
During 2013, the British Columbia government substantively enacted legislation to increase its provincial corporate income tax rate effective April 1, 2013. As a result of the income tax rate change, the Company’s deferred income tax liability was increased by $15 million.
The Company files income tax returns in the various jurisdictions in which it operates. These tax returns are subject to periodic examinations in the normal course by the applicable tax authorities. The tax returns as prepared may include filing positions that could be subject to differing interpretations of applicable tax laws and regulations, which may take several years to resolve. The Company does not believe the ultimate resolution of these matters will have a material impact upon the Company’s results of operations, financial position or liquidity.
During 2015, the Company filed Scientific Research and Experimental Development claims of approximately $527 million (2014 – $450 million; 2013 – $390 million) relating to qualifying research and development expenditures for Canadian income tax purposes.
For 2016, based on forward commodity prices and the current availability of tax pools, the Company expects to incur current income tax recoveries of $260 million to $320 million in Canada and recoveries of $250 million to $300 million in the North Sea and Offshore Africa.
NET CAPITAL EXPENDITURES (1)
|
($ millions)
|
2015
|
2014
|
2013
|
|||||||||
|
Exploration and Evaluation
|
||||||||||||
|
Net (proceeds) expenditures (2) (3) (4)
|
$
|
(805
|
)
|
$
|
1,190
|
$
|
(144
|
)
|
||||
|
Property, Plant and Equipment
|
||||||||||||
|
Net property (disposals) acquisitions (2) (3) (4)
|
(451
|
)
|
2,893
|
246
|
||||||||
|
Well drilling, completion and equipping
|
965
|
2,162
|
2,140
|
|||||||||
|
Production and related facilities
|
908
|
1,830
|
1,878
|
|||||||||
|
Capitalized interest and other (5)
|
102
|
106
|
120
|
|||||||||
|
Net (proceeds) expenditures
|
1,524
|
6,991
|
4,384
|
|||||||||
|
Total Exploration and Production
|
719
|
8,181
|
4,240
|
|||||||||
|
Oil Sands Mining and Upgrading
|
||||||||||||
|
Horizon Phases 2/3 construction costs
|
2,187
|
2,502
|
2,057
|
|||||||||
|
Sustaining capital
|
301
|
352
|
278
|
|||||||||
|
Turnaround costs
|
18
|
29
|
100
|
|||||||||
|
Capitalized interest and other (5)
|
224
|
227
|
157
|
|||||||||
|
Total Oil Sands Mining and Upgrading
|
2,730
|
3,110
|
2,592
|
|||||||||
|
Midstream
|
8
|
62
|
197
|
|||||||||
|
Abandonments (6)
|
370
|
346
|
207
|
|||||||||
|
Head office
|
26
|
45
|
38
|
|||||||||
|
Total net capital expenditures
|
$
|
3,853
|
$
|
11,744
|
$
|
7,274
|
||||||
|
By segment
|
||||||||||||
|
North America (2) (3) (4)
|
$
|
(119
|
)
|
$
|
7,500
|
$
|
4,026
|
|||||
|
North Sea
|
230
|
400
|
334
|
|||||||||
|
Offshore Africa (3)
|
608
|
281
|
(120
|
)
|
||||||||
|
Oil Sands Mining and Upgrading
|
2,730
|
3,110
|
2,592
|
|||||||||
|
Midstream
|
8
|
62
|
197
|
|||||||||
|
Abandonments (6)
|
370
|
346
|
207
|
|||||||||
|
Head office
|
26
|
45
|
38
|
|||||||||
|
Total
|
$
|
3,853
|
$
|
11,744
|
$
|
7,274
|
||||||
| (1) | Net capital expenditures exclude adjustments related to differences between carrying amounts and tax values, and other fair value adjustments. |
| (2) | Includes Business Combinations. |
| (3) | Includes proceeds from the Company’s dispositions of properties. |
| (4) | The above noted figures include non-cash share consideration of $985 million received from PrairieSky on the disposition of royalty income assets in 2015 and the impact of other pre-tax gains on the sale of other properties totaling $49 million recognized in 2015. |
| (5) | Capitalized interest and other includes expenditures related to land acquisition and retention, seismic, and other adjustments. |
| (6) | Abandonments represent expenditures to settle asset retirement obligations and have been reflected as capital expenditures in this table. |
The Company’s strategy is focused on building a diversified asset base that is balanced among various products. In order to facilitate efficient operations, the Company concentrates its activities in core areas. The Company focuses on managing its land inventories to enable the continuous exploitation of play types and geological trends, greatly reducing overall exploration risk. By owning associated infrastructure, the Company is able to maximize utilization of its production facilities, thereby increasing control over production costs.
Net capital expenditures for 2015 were $3,853 million compared with $11,744 million for 2014 (2013 – $7,274 million). Capital expenditures for 2015 reflected reductions in the Company’s capital program by approximately $3,400 million, as well as changes to its capital allocation strategy, including the decrease in drilling activity in North America, partially offset by the planned drilling activities in Offshore Africa. Capital expenditures for 2015 also reflected the disposition of a number of North America royalty income assets on December 16, 2015, including exploration and evaluation assets of $488 million and property, plant and equipment of $480 million, for total consideration of $1,658 million. Total consideration on the disposition was comprised of $673 million in cash, together with $985 million of non-cash share consideration of approximately 44.4 million common shares of PrairieSky.
During 2014, the Company completed the acquisition of certain Canadian crude oil and natural gas properties, including exploration and evaluation assets of $823 million, for cash consideration of $3,110 million, subject to final closing adjustments. During 2014, the Company also acquired a number of additional producing crude oil and natural gas properties in the North American Exploration and Production segment for net cash consideration of $643 million, resulting in a non-cash gain of $137 million.
During 2013, the Company disposed of a 50% interest in its exploration right in South Africa, for net cash consideration of US$255 million, including a recovery of US$14 million of past incurred costs, resulting in an after-tax gain on sale of exploration and evaluation property of $166 million. In the event that a commercial crude oil or natural gas discovery occurs on this exploration right, resulting in the exploration right being converted into a production right, an additional cash payment would be due to the Company at such time, amounting to US$450 million for a commercial crude oil discovery and US$120 million for a commercial natural gas discovery.
As at December 31, 2015, the Company assessed the recoverability of its property, plant and equipment and its exploration and evaluation assets, and determined carrying amounts to be recoverable.
|
Drilling Activity (number of wells)
|
2015
|
2014
|
2013
|
|
Net successful natural gas wells
|
19
|
75
|
44
|
|
Net successful crude oil wells (1)
|
115
|
1,023
|
1,117
|
|
Dry wells
|
6
|
19
|
30
|
|
Stratigraphic test / service wells
|
166
|
437
|
384
|
|
Total
|
306
|
1,554
|
1,575
|
|
Success rate (excluding stratigraphic test / service wells)
|
96%
|
98%
|
97%
|
|
(1)
|
Includes bitumen wells.
|
North America
North America, excluding Oil Sands Mining and Upgrading, accounted for approximately 1% of the total net capital expenditures for 2015 compared with approximately 66% for 2014 (2013 – 59%).
During 2015, the Company targeted 19 net natural gas wells, including 14 wells in Northwest Alberta, 3 wells in Northeast British Columbia, and 2 wells in Northern Plains. The Company also targeted 108 net primary heavy crude oil wells in the Company’s Northern Plains region.
Overall thermal oil production for 2015 averaged approximately 129,800 bbl/d, compared with approximately 107,800 bbl/d in 2014 (2013 – 96,500 bbl/d). Production volumes reflected the cyclic nature of thermal oil production at Primrose and production at Kirby South.
Operating performance at the Pelican Lake tertiary recovery project continued to be strong, leading to average production of approximately 50,800 bbl/d in 2015 (2014 – 50,100 bbl/d; 2013 – 42,900 bbl/d).
Oil Sands Mining and Upgrading
Phase 2/3 expansion activity in 2015 continued to focus on field construction of the hydrogen unit, hydrotreater unit, vacuum distillation unit and distillation recovery unit, tank farms, tailings re-handling plant, froth treatment, froth tank, tailings transfer pumphouses and pipelines, extraction plant, ore preparation plants, and superpot along with engineering, procurement and construction related to tailings retrofit, sour water concentrator, combined hydrotreater and sulphur recovery units. In addition, the new Extraction trains 3 and 4 were commissioned. The Company targets to complete Phase 2B in 2016.
North Sea
During 2015, the Company completed one injection well and no further drilling activities are currently planned for 2016. The decommissioning activities at the Murchison platform are ongoing and are expected to continue for approximately five years.
Offshore Africa
During 2015, at the Espoir field, Côte d’Ivoire, the Company drilled 5 gross producing wells and 1 injector well, adding net production volumes of approximately 6,900 bbl/d to date. In 2016, upon completion of the sixth gross producing well, no additional wells will be drilled in the program. The infill drilling program is currently tracking to below its original sanction costs and above original sanction production.
During 2015, at the Baobab field, Côte d’Ivoire, the Company drilled 5 gross wells, adding net production volumes of approximately 13,400 bbl/d to date. In late December, the Baobab field was temporarily shut-in due to a riser failure, delaying first oil on the fifth gross well. After inspection of the riser system, production was reinstated in late January 2016. In 2016, upon completion of the sixth gross well, no additional wells will be drilled in the program. The drilling program is currently tracking to below its original sanction costs and above original sanction production.
During 2015, the Company provided notice of its withdrawal from Block CI-514 in Côte d’Ivoire, Offshore Africa.
LIQUIDITY AND CAPITAL RESOURCES
|
($ millions, except ratios)
|
2015
|
2014
|
2013
|
|||||||||
|
Working capital (deficit) (1)
|
$
|
1,193
|
$
|
(673
|
)
|
$
|
(1,574
|
)
|
||||
|
Long-term debt (2) (3)
|
$
|
16,794
|
$
|
14,002
|
$
|
9,661
|
||||||
|
Shareholders’ equity
|
||||||||||||
|
Share capital
|
$
|
4,541
|
$
|
4,432
|
$
|
3,854
|
||||||
|
Retained earnings
|
22,765
|
24,408
|
21,876
|
|||||||||
|
Accumulated other comprehensive income
|
75
|
51
|
42
|
|||||||||
|
Total
|
$
|
27,381
|
$
|
28,891
|
$
|
25,772
|
||||||
|
Debt to book capitalization (3) (4)
|
38
|
%
|
33
|
%
|
27
|
%
|
||||||
|
Debt to market capitalization (3) (5)
|
34
|
%
|
26
|
%
|
20
|
%
|
||||||
|
After-tax return on average common
shareholders’ equity (6)
|
(2
|
%)
|
14
|
%
|
9
|
%
|
||||||
|
After-tax return on average capital employed (3) (7)
|
(1
|
%)
|
10
|
%
|
7
|
%
|
||||||
| (1) | Calculated as current assets less current liabilities, excluding the current portion of long-term debt. |
| (2) | Includes the current portion of long-term debt (2015 – $1,729 million; 2014 – $980 million; 2013 – $1,444 million). |
| (3) | Long-term debt is stated at its carrying value, net of fair value adjustments, original issue discounts and premiums and transaction costs. |
| (4) | Calculated as current and long-term debt; divided by the book value of common shareholders’ equity plus current and long-term debt. |
| (5) | Calculated as current and long-term debt; divided by the market value of common shareholders’ equity plus current and long-term debt. |
| (6) | Calculated as net earnings (loss) for the year; as a percentage of average common shareholders’ equity for the year. |
| (7) | Calculated as net earnings (loss) plus after-tax interest and other financing expense for the year; as a percentage of average capital employed for the year. |
At December 31, 2015, the Company’s capital resources consisted primarily of cash flow from operations, available bank credit facilities and access to debt capital markets. Cash flow from operations and the Company’s ability to renew existing bank credit facilities and raise new debt is dependent on factors discussed in the “Risks and Uncertainties” section of this MD&A. In addition, the Company’s ability to renew existing bank credit facilities and raise new debt reflects current credit ratings as determined by independent rating agencies, and the conditions of the market. The Company continues to believe that its internally generated cash flow from operations, the flexibility of its capital expenditure programs supported by its multi-year financial plans, its existing bank credit facilities, and its ability to raise new debt on commercially acceptable terms will provide sufficient liquidity to sustain its operations in the short, medium and long term and support its growth strategy.
On an ongoing basis the Company continues to focus on its balance sheet strength and available liquidity by:
| — | Monitoring cash flow from operations, which is the primary source of funds; |
| — | Actively managing the allocation of maintenance and growth capital to ensure it is expended in a prudent and appropriate manner with flexibility to adjust to market conditions. In response to the decline in commodity prices, the Company continues to exercise its capital flexibility to address commodity price volatility and its impact on operating expenditures, capital commitments and long-term debt; |
| — | Reviewing the Company's borrowing capacity: |
| — | During 2015, the Company filed base shelf prospectuses that allow for the offer for sale from time to time of up to $3,000 million of medium-term notes in Canada and US$3,000 million of debt securities in the United States until November 2017. If issued, these securities may be offered separately or together, in amounts and at prices, including interest rates, to be determined based on market conditions at the time of issuance; |
| — | During 2015, the Company issued $500 million of series 2 medium-term notes, due August 2020, through the reopening of its previously issued 2.89% notes. In addition, the $1,500 million revolving syndicated credit facility was increased to $2,425 million and the maturity date was extended to June 2019 from June 2016. The $3,000 million revolving syndicated credit facility was reduced to $2,425 million and the maturity date was extended to June 2020 from June 2017. As a result, the Company's available liquidity increased by $350 million; |
| — | The Company's borrowings under its US commercial paper program are authorized up to a maximum of US$2,500 million. The Company reserves capacity under its bank credit facilities for amounts outstanding under the US commercial paper program; |
| — | During 2015, the Company extended its existing $1,000 million non-revolving term credit facility to January 2017. In addition, the Company entered into a new $1,500 million non-revolving term credit facility maturing April 2018. Both facilities were fully drawn at December 31, 2015. Subsequent to December 31, 2015, the Company prepaid $250 million of the borrowings outstanding under the $1,000 million non-revolving term credit facility and extended the facility to February 2019 from January 2017. Subsequent to December 31, 2015, the Company also entered into a new $125 million non-revolving term credit facility maturing February 2019, which was fully drawn. Borrowings under this new facility may be made by way of pricing referenced to Canadian dollar bankers’ acceptances or Canadian prime loans; |
| — | Subsequent to December 31, 2015, the Company retained its investment grade ratings with both Standard & Poor’s Rating Services and DBRS Limited. In addition, Moody’s Investors Service, Inc. downgraded the Company’s credit ratings within the investment grade debt rating scale. The current changes in the Company’s credit ratings are not expected to have a significant impact on the Company’s access to debt capital markets, its US commercial paper program or on its overall cost of borrowing. |
| — | Reviewing bank credit facilities and public debt indentures to ensure they are in compliance with applicable covenant packages. Beginning in 2015, all of the Company's credit facilities are now subject to a financial covenant that the Consolidated Debt to Capitalization Ratio, as defined in the credit agreements, shall not be more than 0.65 to 1.0; and |
| — | Monitoring exposure to individual customers, contractors, suppliers and joint venture partners on a regular basis and when appropriate, ensuring parental guarantees or letters of credit are in place to minimize the impact in the event of a default. |
During 2015, the Company repaid $400 million of 4.95% medium term notes.
At December 31, 2015, the Company had in place bank credit facilities of $7,481 million, of which approximately $3,495 million, net of commercial paper issuances of $692 million, was available for general corporate purposes.
At December 31, 2015, the Company had long-term debt with a carrying amount of $1,037 million maturing over the next 12 months (US$500 million of debt securities at three-month LIBOR plus 0.375% due March 2016 and US$250 million of 6.00% debt securities due August 2016). These debt securities have been hedged by way of cross currency swaps with principal repayment amounts fixed at $555 million and $279 million respectively.
At December 31, 2015, the Company had total US dollar denominated debt with a carrying amount of $11,981 million (US$8,657 million). This included $5,615 million (US$4,057 million) hedged by way of cross currency swaps (US$2,900 million) and foreign currency forwards (US$1,157 million). The fixed repayment amount of these hedging instruments is $4,845 million, resulting in a notional reduction of the carrying amount of the Company’s US dollar denominated debt by approximately $770 million to $11,211 million as at December 31, 2015.
Long-term debt was $16,794 million at December 31, 2015, resulting in a debt to book capitalization ratio of 38% (December 31, 2014 – 33%; December 31, 2013 – 27%). This ratio is within the 25% to 45% internal range utilized by management. This range may be exceeded in periods when a combination of capital projects, acquisitions, or lower commodity prices occurs. The Company may be below the low end of the targeted range when cash flow from operations is greater than current investment activities. The Company remains committed to maintaining a strong balance sheet, adequate available liquidity and a flexible capital structure. Further details related to the Company’s long-term debt at December 31, 2015 are discussed in note 9 to the Company’s consolidated financial statements.
The Company’s commodity hedge policy reduces the risk of volatility in commodity prices and supports the Company’s cash flow for its capital expenditure programs. This policy currently allows for the hedging of up to 60% of the near 12 months budgeted production and up to 40% of the following 13 to 24 months estimated production. For the purpose of this policy, the purchase of put options is in addition to the above parameters. At March 2, 2016 the Company had no commodity derivative financial instruments outstanding.
Share Capital
As at December 31, 2015, there were 1,094,668,000 common shares outstanding (December 31, 2014 – 1,091,837,000 common shares) and 74,615,000 stock options outstanding. As at March 1, 2016, the Company had 1,094,704,000 common shares outstanding and 71,353,000 stock options outstanding.
On March 2, 2016, the Board of Directors declared a regular quarterly dividend of $0.23 per common share. On an annualized basis, the dividend of $0.92 per common share remains unchanged from the previous annual dividend rate. This reflects confidence in the Company’s cash flow and provides a return to shareholders. The dividend policy undergoes periodic review by the Board of Directors and is subject to change.
During 2015, the Company announced a Normal Course Issuer Bid to purchase through the facilities of the Toronto Stock Exchange (“TSX”), alternative Canadian trading platforms, and the New York Stock Exchange (“NYSE”), during the twelve month period commencing April 2015 and ending April 2016, up to 54,640,607 common shares. The Company’s Normal Course Issuer Bid announced in 2014 expired April 2015.
During 2015, the Company did not purchase any common shares for cancellation.
COMMITMENTS AND OFF BALANCE SHEET ARRANGEMENTS
In the normal course of business, the Company has entered into various commitments that will have an impact on the Company’s future operations. The following table summarizes the Company’s commitments as at December 31, 2015:
|
($ millions)
|
2016
|
2017
|
2018
|
2019
|
2020
|
Thereafter
|
||||||||||||||||||
|
Product transportation and pipeline
|
$
|
423
|
$
|
341
|
$
|
303
|
$
|
261
|
$
|
246
|
$
|
1,304
|
||||||||||||
|
Offshore equipment operating leases and offshore drilling
|
$
|
247
|
$
|
93
|
$
|
71
|
$
|
22
|
$
|
–
|
$
|
–
|
||||||||||||
|
Long-term debt (1) (2)
|
$
|
1,730
|
$
|
2,522
|
$
|
2,899
|
$
|
1,353
|
$
|
1,427
|
$
|
6,935
|
||||||||||||
|
Interest and other financing expense (3)
|
$
|
649
|
$
|
564
|
$
|
478
|
$
|
437
|
$
|
408
|
$
|
4,608
|
||||||||||||
|
Office leases
|
$
|
42
|
$
|
42
|
$
|
42
|
$
|
43
|
$
|
42
|
$
|
193
|
||||||||||||
|
Other
|
$
|
141
|
$
|
38
|
$
|
48
|
$
|
1
|
$
|
–
|
$
|
–
|
||||||||||||
| (1) | Long-term debt represents principal repayments only and does not reflect original issue discounts and premiums or transaction costs. |
| (2) | At December 31, 2015, the Company had US$500 million of debt securities at three-month LIBOR plus 0.375% due March 2016 and US$250 million of 6.00% debt securities due August 2016. These debt securities have been hedged by way of cross currency swaps with principal repayment amounts fixed at $555 million and $279 million respectively. |
| (3) | Interest and other financing expense amounts represent the scheduled fixed rate and variable rate cash interest payments related to long-term debt. Interest on variable rate long-term debt was estimated based upon prevailing interest rates and foreign exchange rates as at December 31, 2015. |
In addition to the commitments disclosed above, the Company has entered into various agreements related to the engineering, procurement and construction of subsequent phases of Horizon. These contracts can be cancelled by the Company upon notice without penalty, subject to the costs incurred up to and in respect of the cancellation.
LEGAL PROCEEDINGS AND OTHER CONTINGENCIES
The Company is defendant and plaintiff in a number of legal actions arising in the normal course of business. In addition, the Company is subject to certain contractor construction claims. The Company believes that any liabilities that might arise pertaining to any such matters would not have a material effect on its consolidated financial position.
RESERVES
For the years ended December 31, 2015, 2014 and 2013, the Company retained Independent Qualified Reserves Evaluators to evaluate and review all of the Company’s proved and proved plus probable crude oil, NGLs and natural gas reserves. The evaluation and review was conducted in accordance with the standards contained in the Canadian Oil and Gas Evaluation Handbook (“COGE Handbook”) and disclosed in accordance with National Instrument 51-101 – Standards of Disclosure for Oil and Gas Activities (“NI 51-101”) requirements.
The Company annually discloses net proved reserves and the standardized measure of discounted future net cash flows using 12-month average prices and current costs in accordance with United States FASB Topic 932 “Extractive Activities - Oil and Gas” in the Company’s annual report on Form 40-F filed with the SEC and in the “Supplementary Oil and Gas Information” section of the Company’s Annual Report.
The following tables summarize the company gross proved and proved plus probable reserves using forecast prices and costs as at December 31, 2015, prepared in accordance with NI 51-101 reserves disclosures:
|
Proved Reserves
|
Light and
Medium
Crude Oil
|
Primary
Heavy
Crude Oil
|
Pelican Lake
Heavy
Crude
Oil
|
Bitumen
(Thermal
Oil)
|
Synthetic
Crude Oil
|
Natural Gas
|
Natural Gas
Liquids
|
Barrels
of Oil
Equivalent
|
|
(MMbbl)
|
(MMbbl)
|
(MMbbl)
|
(MMbbl)
|
(MMbbl)
|
(Bcf)
|
(MMbbl)
|
(MMBOE)
|
|
|
December 31, 2014
|
445
|
229
|
274
|
1,217
|
2,158
|
6,001
|
188
|
5,511
|
|
Discoveries
|
1
|
–
|
–
|
–
|
–
|
14
|
2
|
5
|
|
Extensions
|
1
|
4
|
–
|
23
|
220
|
252
|
10
|
300
|
|
Infill Drilling
|
4
|
10
|
–
|
–
|
–
|
298
|
7
|
71
|
|
Improved Recovery
|
–
|
–
|
2
|
26
|
–
|
–
|
–
|
28
|
|
Acquisitions
|
5
|
4
|
–
|
7
|
–
|
414
|
8
|
93
|
|
Dispositions
|
(3)
|
–
|
–
|
–
|
–
|
(7)
|
–
|
(4)
|
|
Economic Factors
|
(7)
|
(3)
|
–
|
–
|
7
|
(392)
|
(6)
|
(74)
|
|
Technical Revisions
|
(26)
|
16
|
10
|
(1)
|
68
|
156
|
1
|
94
|
|
Production
|
(34)
|
(47)
|
(18)
|
(47)
|
(45)
|
(630)
|
(15)
|
(311)
|
|
December 31, 2015
|
386
|
213
|
268
|
1,225
|
2,408
|
6,106
|
195
|
5,713
|
|
Proved Plus Probable Reserves
|
Light and
Medium
Crude Oil
|
Primary
Heavy
Crude Oil
|
Pelican Lake
Heavy
Crude
Oil
|
Bitumen
(Thermal
Oil)
|
Synthetic
Crude Oil
|
Natural Gas
|
Natural Gas
Liquids
|
Barrels
of Oil
Equivalent
|
|
(MMbbl)
|
(MMbbl)
|
(MMbbl)
|
(MMbbl)
|
(MMbbl)
|
(Bcf)
|
(MMbbl)
|
(MMBOE)
|
|
|
December 31, 2014
|
660
|
317
|
395
|
2,312
|
3,593
|
8,138
|
258
|
8,891
|
|
Discoveries
|
1
|
–
|
–
|
–
|
–
|
17
|
2
|
6
|
|
Extensions
|
2
|
6
|
–
|
111
|
45
|
358
|
15
|
239
|
|
Infill Drilling
|
8
|
13
|
–
|
–
|
–
|
742
|
29
|
174
|
|
Improved Recovery
|
–
|
–
|
3
|
40
|
–
|
1
|
–
|
43
|
|
Acquisitions
|
6
|
5
|
–
|
9
|
–
|
515
|
10
|
116
|
|
Dispositions
|
(5)
|
–
|
–
|
–
|
–
|
(9)
|
–
|
(7)
|
|
Economic Factors
|
(8)
|
(3)
|
–
|
–
|
7
|
(501)
|
(8)
|
(96)
|
|
Technical Revisions
|
(12)
|
3
|
8
|
(18)
|
33
|
(123)
|
(8)
|
(14)
|
|
Production
|
(34)
|
(47)
|
(18)
|
(47)
|
(45)
|
(630)
|
(15)
|
(311)
|
|
December 31, 2015
|
618
|
294
|
388
|
2,407
|
3,633
|
8,508
|
283
|
9,041
|
At December 31, 2015, the company gross proved crude oil, bitumen (thermal oil), SCO and NGLs reserves totaled 4,695 MMbbl, and company gross proved plus probable crude oil, bitumen (thermal oil), SCO and NGLs reserves totaled 7,623 MMbbl. Proved reserve additions and revisions replaced 189% of 2015 production. Additions to proved reserves resulting from exploration and development activities, acquisitions and future offset additions amounted to 331 MMbbl, and additions to proved plus probable reserves amounted to 300 MMbbl. Net positive revisions amounted to 59 MMbbl for proved reserves and net negative revisions amounted to 6 MMbbl for proved plus probable reserves, primarily due to technical revisions to prior estimates.
At December 31, 2015, the company gross proved natural gas reserves totaled 6,106 Bcf, and company gross proved plus probable natural gas reserves totaled 8,508 Bcf. Proved reserve additions and revisions replaced 117% of 2015 production. Additions to proved reserves resulting from exploration and development activities, acquisitions and future offset additions amounted to 971 Bcf, and additions to proved plus probable reserves amounted to 1,624 Bcf. Net negative revisions amounted to 236 Bcf for proved reserves and 624 Bcf for proved plus probable reserves, primarily due to economic factors.
The Reserves Committee of the Company’s Board of Directors has met with and carried out independent due diligence procedures with each of the Company’s Independent Qualified Reserves Evaluators to review the qualifications of and procedures used by each evaluator in determining the estimate of the Company’s quantities and related net present value of future net revenue of the remaining reserves.
Additional reserves disclosure is annually disclosed in the AIF and the “Supplementary Oil and Gas Information” section of the Company’s Annual Report.
RISKS AND UNCERTAINTIES
The Company is exposed to various operational risks inherent in the exploration, development, production and marketing of crude oil and NGLs and natural gas and the mining and upgrading of bitumen into SCO. These inherent risks include, but are not limited to, the following:
| — | The ability to find, produce and replace reserves, whether sourced from exploration, improved recovery or acquisitions, at a reasonable cost, including the risk of reserve revisions due to economic and technical factors. Reserve revisions can have a positive or negative impact on asset valuations, ARO and depletion rates; |
| — | Reservoir quality and uncertainty of reserve estimates; |
| — | Volatility in the prevailing prices of crude oil and NGLs and natural gas; |
| — | Regulatory risk related to approval for exploration and development activities, which can add to costs or cause delays in projects; |
| — | Labour risk associated with securing the manpower necessary to complete capital projects in a timely and cost effective manner; |
| — | Operating hazards and other difficulties inherent in the exploration for and production and sale of crude oil and natural gas and in mining, extracting or upgrading the Company’s bitumen products; |
| — | Timing and success of integrating the business and operations of acquired properties and/or companies; |
| — | Credit risk related to non-payment for sales contracts or non-performance by counterparties to contracts, including derivative financial instruments and physical sales contracts as part of a hedging program; |
| — | Interest rate risk associated with the Company’s ability to secure financing on commercially acceptable terms; |
| — | Foreign exchange risk due to fluctuating exchange rates on the Company’s US dollar denominated debt and as all sales are predominantly based on US dollar denominated benchmarks; |
| — | Environmental impact risk associated with exploration and development activities, including GHG; |
| — | Geopolitical risks associated with changing governments or governmental policies, social instability and other political, economic or diplomatic developments in the regions where the Company has its operations; |
| — | Future legislative and regulatory developments related to environmental regulation; |
| — | Potential actions of governments, regulatory authorities and other stakeholders that may result in costs or restrictions in the jurisdictions where the Company has operations; |
| — | Changing royalty regimes, including final resolution of the Alberta provincial royalty review; |
| — | Business interruptions because of unexpected events such as fires or explosions whether caused by human error or nature, severe storms and other calamitous acts of nature, blowouts, freeze-ups, mechanical or equipment failures of facilities and infrastructure and other similar events affecting the Company or other parties whose operations or assets directly or indirectly impact the Company and that may or may not be financially recoverable; |
| — | The ability to secure adequate transportation for products which could be affected by pipeline constraints, the construction by third parties of new or expansion of existing pipeline capacity and other factors; |
| — | The access to markets for the Company’s products; and |
| — | Other circumstances affecting revenue and expenses. |
The Company uses a variety of means to help mitigate and/or minimize these risks. The Company maintains a comprehensive property loss and business interruption insurance program to reduce risk. Operational control is enhanced by focusing efforts on large core areas with high working interests and by assuming operatorship of key facilities. Product mix is diversified, consisting of the production of natural gas and the production of crude oil of various grades. The Company believes this diversification reduces price risk when compared with over-leverage to one commodity. Accounts receivable from the sale of crude oil and natural gas are mainly with customers in the crude oil and natural gas industry and are subject to normal industry credit risks. The Company manages these risks by reviewing its exposure to individual companies on a regular basis and where appropriate, ensures that parental guarantees or letters of credit are in place to minimize the impact in the event of default. Derivative financial instruments are utilized to help ensure targets are met and to manage commodity price, foreign currency and interest rate exposures. The Company is exposed to possible losses in the event of non-performance by counterparties to derivative financial instruments; however, the Company manages this credit risk by entering into agreements with counterparties that are substantially all investment grade financial institutions. The arrangements and policies concerning the Company’s financial instruments are under constant review and may change depending upon the prevailing market conditions.
The Company’s capital structure mix is also monitored on a continual basis to ensure that it optimizes flexibility, minimizes cost and offers the greatest opportunity for growth. This includes the determination of a reasonable level of debt and any interest rate exposure risk that may exist.
For additional details regarding the Company’s risks and uncertainties, refer to the Company’s AIF for the year ended December 31, 2015.
ENVIRONMENT
The Company continues to invest in people, technologies, facilities and infrastructure to recover and process crude oil and natural gas resources efficiently and in an environmentally sustainable manner.
The crude oil and natural gas industry is experiencing incremental increases in costs related to environmental regulation, particularly in North America and the North Sea. Existing and expected legislation and regulations require the Company to address and mitigate the effect of its activities on the environment. Increasingly stringent laws and regulations may have an adverse effect on the Company’s future net earnings and cash flow from operations.
The Company’s associated environmental risk management strategies focus on working with legislators and regulators to ensure that any new or revised policies, legislation or regulations properly reflect a balanced approach to sustainable development. Specific measures in response to existing or new legislation include a focus on the Company’s energy efficiency, air emissions management, released water quality, reduced fresh water use and the minimization of the impact on the landscape. Training and due diligence for operators and contractors are key to the effectiveness of the Company’s environmental management programs and the prevention of incidents. The Company’s environmental risk management strategies employ an Environmental Management Plan (the “Plan”). Details of the Plan, along with performance results, are presented to, and reviewed by, the Board of Directors quarterly.
The Company’s Plan and operating guidelines focus on minimizing the impact of operations while meeting regulatory requirements, regional management frameworks, industry operating standards and guidelines, and internal corporate standards. The Company, as part of this Plan, has implemented a proactive program that includes:
| — | An internal environmental compliance audit and inspection program of the Company’s operating facilities; |
| — | A suspended well inspection program to support future development or eventual abandonment; |
| — | Appropriate reclamation and decommissioning standards for wells and facilities ready for abandonment; |
| — | An effective surface reclamation program; |
| — | A due diligence program related to groundwater monitoring; |
| — | An active program related to preventing and reclaiming spill sites; |
| — | A solution gas conservation program; |
| — | A program to replace the majority of fresh water for steaming with brackish water; |
| — | Water programs to improve efficiency of use, recycle rates and water storage; |
| — | Environmental planning for all projects to assess impacts and to implement avoidance and mitigation programs; |
| — | Reporting for environmental liabilities; |
| — | A program to optimize efficiencies at the Company’s operated facilities; |
| — | Continued evaluation of new technologies to reduce environmental impacts and support for Canada’s Oil Sands Innovation Alliance (“COSIA”); |
| — | CO2 reduction programs including carbon capture at hydrotreaters, the injection of CO2 into tailings and for use in EOR; |
| — | A program in place related to progressive reclamation and tailings management at Horizon including low fines mining; and |
| — | Participation and support for the Joint Oil Sands Monitoring Program. |
The Company’s asset retirement obligations are expected to be settled on an ongoing basis over a period of approximately 60 years and have been discounted using a weighted average discount rate of 5.9% (2014 – 4.6%; 2013 – 5.0%). For 2015, the Company’s capital expenditures included $370 million for abandonment expenditures (2014 – $346 million; 2013 – $207 million). The Company’s estimated discounted ARO at December 31, 2015 was as follows:
|
($ millions)
|
2015
|
2014
|
||||||
|
Exploration and Production
|
||||||||
|
North America
|
$
|
1,114
|
$
|
2,012
|
||||
|
North Sea
|
975
|
1,169
|
||||||
|
Offshore Africa
|
266
|
255
|
||||||
|
Oil Sands Mining and Upgrading
|
594
|
783
|
||||||
|
Midstream
|
1
|
2
|
||||||
|
$
|
2,950
|
$
|
4,221
|
|||||
The discounted ARO was based on estimates of future costs to abandon and restore wells, production facilities, mine sites, upgrading facilities and tailings, and offshore production platforms. Factors that affect costs include number of wells drilled, well depth, facility size and the specific environmental legislation. The estimated future costs are based on engineering estimates of current costs in accordance with present legislation, industry operating practice and the expected timing of abandonment. The Company’s strategy in the North Sea consists of developing commercial hubs around its core operated properties with the goal of increasing production and extending the economic lives of its production facilities, thereby delaying the eventual abandonment dates.
GREENHOUSE GAS AND OTHER AIR EMISSIONS
The Company, through the Canadian Association of Petroleum Producers, is working with Canadian legislators and regulators as they develop and implement new GHG emission laws and regulations. Internally, the Company is pursuing an integrated emissions reduction strategy, to ensure that it is able to comply with existing and future emissions reduction requirements, for both GHGs and air pollutants (such as sulphur dioxide and oxides of nitrogen). The Company continues to develop strategies that will enable it to deal with the risks and opportunities associated with new GHG and air emissions policies. In addition, the Company is working with relevant parties to ensure that new policies encourage technological innovation, energy efficiency, and targeted research and development while not impacting competitiveness.
In Canada, the federal government has indicated its intent to develop regulations to address industrial GHG emissions, as part of the national GHG reduction target. The federal government is also developing a comprehensive management system for air pollutants, and has released draft regulations pertaining to certain boilers, heaters and compressor engines operated by the Company. In Alberta, the provincial government has implemented increases in both the carbon price and stringency of the existing large-emitter regulatory system for 2016 and 2017. The Alberta government has also announced additional changes to this system after 2017, as well as a program to reduce methane emissions from the upstream oil and gas sector, and a carbon price on combustion emissions from the upstream oil and gas sector beginning in 2023. In British Columbia, the provincial government is reviewing its climate change strategy with announcements on future changes expected in 2016.
In Alberta, GHG reduction regulations came into effect July 1, 2007, affecting facilities emitting more than 100 kilotonnes of CO2e annually. Five of the Company’s facilities, the Horizon facility, the Primrose/Wolf Lake in situ heavy crude oil facilities, the Kirby South in situ heavy crude oil facility, the Hays sour natural gas plant, and the Wapiti gas plant are subject to compliance under the regulations. In British Columbia, carbon tax is currently being assessed at $30/tonne of CO2e on fuel consumed and gas flared in the province. The Saskatchewan government released draft GHG regulations that regulate facilities emitting more than 50 kilotonnes of CO2e annually and will likely require the North Tangleflags in situ heavy oil facility to meet the reduction target for its GHG emissions once the governing legislation comes into force. In the UK, GHG regulations have been in effect since 2005. In Phase 1 (2005 – 2007) of the UK National Allocation Plan, the Company operated below its CO2 allocation. In Phase 2 (2008 – 2012) the Company’s CO2 allocation was decreased below the Company’s operations emissions. In Phase 3 (2013 – 2020) the Company’s CO2 allocation was further reduced. The Company continues to focus on implementing reduction programs based on efficiency audits to reduce CO2 emissions at its major facilities and on trading mechanisms to ensure compliance with requirements now in effect. The United States Environmental Protection Agency (“EPA”) is proceeding to regulate GHGs under the Clean Air Act. This EPA action has been subject to legal and political challenges, the outcome of which cannot be predicted. The ultimate form of Canadian regulation is anticipated to be strongly influenced by the regulatory decisions made within the United States. Various states have enacted or are evaluating low carbon fuel standards, which may affect access to market for crude oil with higher emissions intensity.
There are a number of unresolved issues in relation to Canadian federal and provincial GHG regulatory requirements. Key among them is the form of regulation, an appropriate common facility emission level, availability and duration of compliance mechanisms, and resolution of federal/provincial harmonization agreements. The Company continues to pursue GHG emission reduction initiatives including: solution gas conservation, compressor optimization to improve fuel gas efficiency, CO2 capture and sequestration in oil sands tailings, CO2 capture and storage in association with EOR, and participation in COSIA.
The additional requirements of enacted or proposed GHG regulations on the Company’s operations may increase capital expenditures and operating expenses, including those related to Horizon and the Company’s other existing and certain planned oil sands projects. This may have an adverse effect on the Company’s future net earnings and cash flow from operations.
Air pollutant standards and guidelines are being developed federally and provincially and the Company is participating in these discussions. Ambient air quality and sector based reductions in air emissions are being reviewed. Through Company and industry participation with stakeholders, guidelines are being developed that adopt a structured process to emission reductions that is commensurate with technological development and operational requirements.
CRITICAL ACCOUNTING POLICIES AND ESTIMATES
The preparation of financial statements requires the Company to make estimates, assumptions and judgements in the application of IFRS that have a significant impact on the financial results of the Company. Actual results could differ from estimated amounts, and those differences may be material.
Critical accounting policies and estimates are reviewed by the Company’s Audit Committee annually. The Company believes the following are the most critical accounting policies and estimates in preparing its consolidated financial statements.
A) Depletion, Depreciation and Amortization and Impairment
Exploration and evaluation (“E&E”) costs relating to activities to explore and evaluate crude oil and natural gas properties are initially capitalized and include costs directly associated with the acquisition of licenses, technical services and studies, seismic acquisition, exploration drilling and evaluation, overhead and administration expenses, and the estimate of any asset retirement costs. E&E assets are carried forward until technical feasibility and commercial viability of extracting a mineral resource is determined. Technical feasibility and commercial viability of extracting a mineral resource is considered to be determined when an assessment of proved reserves is made. The judgements associated with the estimation of proved reserves are described below in “Crude Oil and Natural Gas Reserves”.
An alternative acceptable accounting method for E&E costs under IFRS 6 “Exploration for and Evaluation of Mineral Resources” is to charge exploratory dry holes and geological and geophysical exploration costs incurred after having obtained the legal rights to explore an area against net earnings in the period incurred rather than capitalizing to E&E assets.
E&E assets are tested for impairment when facts and circumstances suggest that the carrying amount of E&E assets may exceed their recoverable amount, by comparing the relevant costs to the fair value of Cash Generating Units (“CGUs”), aggregated at the segment level. Indications of impairment include leases approaching expiry, the existence of low benchmark commodity prices for an extended period of time, significant downward revisions in estimated probable reserves volumes, significant increases in estimated future exploration or development expenditures, or significant adverse changes in the applicable legislative or regulatory frameworks. The determination of the fair value of CGUs requires the use of assumptions and estimates including future commodity prices, expected production volumes, quantity of reserves, asset retirement obligations, future development and production costs, discount rates and income taxes. Changes in assumptions used in determining the recoverable amount could affect the carrying value of the related assets and CGUs.
Property, plant and equipment is measured at cost less accumulated depletion and depreciation and impairment provisions. Crude oil and natural gas properties in the Exploration and Production segments are depleted using the unit-of-production method over proved reserves, except for major components, which are depreciated using a straight-line method over their estimated useful lives. The unit-of-production depletion rate takes into account expenditures incurred to date, together with future estimated development expenditures required to develop proved reserves. Estimates of proved reserves have a significant impact on net earnings, as they are a key input to the calculation of depletion expense.
The Company assesses property, plant and equipment for impairment discounted at rates currently ranging from 9.5% to 12% whenever events or changes in circumstances indicate that the carrying value of an asset or group of assets may not be recoverable. Indications of impairment include the existence of low commodity prices for an extended period, significant downward revisions of estimated reserves volumes, significant increases in estimated future development expenditures, or significant adverse changes in the applicable legislative or regulatory frameworks. If an indication of impairment exists, the Company performs an impairment test related to the specific assets at the CGU level.
B) Crude Oil and Natural Gas Reserves
Reserve estimates are based on engineering data, estimated future prices, expected future rates of production and the timing of future capital expenditures, all of which are subject to many uncertainties, interpretations, and judgements. The Company expects that, over time, its reserve estimates will be revised upward or downward based on updated information such as the results of future drilling, testing and production levels, and may be affected by changes in commodity prices. Reserve estimates can have a significant impact on net earnings, as they are a key component in the calculation of depletion, depreciation and amortization and for determining potential asset impairment. For example, a revision to proved reserve estimates would result in a higher or lower depletion, depreciation and amortization charge to net earnings. Downward revisions to reserve estimates may also result in an impairment of E&E and property, plant and equipment carrying amounts as depletion, depreciation and amortization expense.
C) Asset Retirement Obligations
The Company is required to recognize a liability for ARO associated with its property, plant and equipment. An ARO liability associated with the retirement of a tangible long-lived asset is recognized to the extent of a legal obligation resulting from an existing or enacted law, statute, ordinance or written or oral contract, or by legal construction of a contract under the doctrine of promissory estoppel. The ARO is based on estimated costs, taking into account the anticipated method and extent of restoration consistent with legal requirements, technological advances and the possible use of the site. Since these estimates are specific to the sites involved, there are many individual assumptions underlying the Company’s total ARO amount. These individual assumptions can be subject to change.
The estimated present values of ARO related to long-term assets are recognized as a liability in the period in which they are incurred. The provision for the ARO is estimated by discounting the expected future cash flows to settle the ARO at the Company’s weighted average credit-adjusted risk-free interest rate, which is currently 5.9%. Subsequent to initial measurement, the ARO is adjusted to reflect the passage of time, changes in credit adjusted interest rates, and changes in the estimated future cash flows underlying the obligation. The increase in the provision due to the passage of time is recognized as asset retirement obligation accretion expense whereas changes in discount rates or estimated future cash flows are capitalized to or derecognized from property, plant and equipment. Changes in estimates would impact accretion and depletion expense in net earnings. In addition, differences between actual and estimated costs to settle the ARO, timing of cash flows to settle the obligation and future inflation rates may result in gains or losses on the final settlement of the ARO.
D) Income Taxes
The Company follows the liability method of accounting for income taxes. Under this method, deferred income tax assets and liabilities are recognized based on the estimated income tax effects of temporary differences in the carrying value of assets and liabilities in the consolidated financial statements and their respective tax bases, using income tax rates substantively enacted as at the date of the balance sheet. Accounting for income taxes requires the Company to interpret frequently changing laws and regulations, including changing income tax rates, and make certain judgements with respect to the application of tax law, estimating the timing of temporary difference reversals, and estimating the realizability of tax assets. There are many transactions and calculations for which the ultimate tax determination is uncertain. The Company recognizes liabilities for potential tax audit issues based on assessments of whether additional taxes will likely be due.
E) Risk Management Activities
The Company uses derivative financial instruments to manage its commodity price, foreign currency and interest rate exposures. These financial instruments are entered into solely for hedging purposes and are not used for speculative purposes. All derivative financial instruments are recognized in the consolidated balance sheets at their estimated fair value. The estimated fair value of derivative financial instruments has been determined based on appropriate internal valuation methodologies and/or third party indications. Fair values determined using valuation models require the use of assumptions concerning the amount and timing of future cash flows, discount rates and credit risk. In determining these assumptions, the Company primarily relied on external, readily-observable quoted market inputs including crude oil and natural gas forward benchmark commodity prices and volatility, Canadian and United States forward interest rate yield curves, and Canadian and United States foreign exchange rates, discounted to present value as appropriate. The carrying amount of a risk management liability is adjusted for the Company’s own credit risk. The resulting fair value estimates may not necessarily be indicative of the amounts that could be realized or settled in a current market transaction and these differences may be material.
F) Purchase Price Allocations
Purchase prices related to business combinations are allocated to the underlying acquired assets and liabilities based on their estimated fair value at the time of acquisition. The determination of fair value requires the Company to make estimates, assumptions and judgements regarding future events. The allocation process is inherently subjective and impacts the amounts assigned to individually identifiable assets and liabilities, including the fair value of crude oil and natural gas properties, together with deferred income tax effects. As a result, the purchase price allocation impacts the Company’s reported assets and liabilities and future net earnings due to the impact on future depletion, depreciation and amortization expense and impairment tests.
The Company has made various assumptions in determining the fair values of the acquired assets and liabilities. The most significant assumptions and judgements relate to the estimation of the fair value of the crude oil and natural gas properties. To determine the fair value of these properties, the Company estimates crude oil and natural gas reserves. Reserve estimates are based on the work performed by the Company’s internal engineers and outside consultants. The judgements associated with these estimated reserves are described above in “Crude Oil and Natural Gas Reserves”. Estimates of future prices are based on prices derived from price forecasts among industry analysts and internal assessments. The Company applies estimated future prices to the estimated reserves quantities acquired, and estimates future operating and development costs, to arrive at estimated future net revenues for the properties acquired.
G) Share-Based Compensation
The Company has made various assumptions in estimating the fair values of stock options granted including expected volatility, expected exercise behavior and future forfeiture rates. At each period end, stock options outstanding are remeasured for subsequent changes in the fair value of the liability.
ACCOUNTING STANDARDS ISSUED BUT NOT YET APPLIED
In May 2014, the IASB issued IFRS 15 “Revenue from Contracts with Customers” to provide guidance on the recognition of revenue and cash flows arising from an entity’s contracts with customers, and related disclosures. The new standard replaces several existing standards related to recognition of revenue and states that revenue should be recognized as performance obligations related to the goods or services delivered are settled. IFRS 15 also provides revenue accounting guidance for contract modifications and multiple-element contracts and prescribes additional disclosure requirements. In 2015, the IASB deferred the effective date for the new standard to January 1, 2018. The new standard is required to be adopted retrospectively, with earlier adoption permitted. The Company is assessing the impact of IFRS 15 on its consolidated financial statements.
In May 2014, the IASB issued an amendment to IFRS 11 “Joint Arrangements” to clarify the accounting treatment when an entity acquires interests in joint ventures and joint operations. The amendment requires these acquisitions to be accounted for as business combinations. This amendment is effective January 1, 2016 and is to be applied prospectively. Adoption of this amended standard is not expected to result in a significant impact to the Company’s consolidated financial statements.
Effective January 1, 2014, the Company adopted the version of IFRS 9 “Financial Instruments” issued November 2013. In July 2014, the IASB issued amendments to IFRS 9 to include accounting guidance to assess and recognize impairment losses on financial assets based on an expected loss model. The amendments are effective January 1, 2018. The Company is assessing the impact of this amendment on its consolidated financial statements.
Subsequent to December 31, 2015, the IASB issued IFRS 16 “Leases”, which provides guidance on accounting for leases. The new standard replaces IAS 17 “Leases” and related interpretations. IFRS 16 eliminates the distinction between operating leases and financing leases for lessees. The new standard is effective January 1, 2019 with, earlier adoption permitted providing that IFRS 15 has been adopted. The new standard is required to be applied retrospectively, with a policy alternative of restating comparative prior periods or recognizing the cumulative adjustment in opening retained earnings at the date of adoption. The Company is assessing the impact of this standard on its consolidated financial statements.
CONTROL ENVIRONMENT
The Company’s management, including the President and the Chief Financial Officer and Senior Vice-President, Finance, evaluated the effectiveness of disclosure controls and procedures as at December 31, 2015, and concluded that disclosure controls and procedures are effective to ensure that information required to be disclosed by the Company in its annual filings and other reports filed with securities regulatory authorities in Canada and the United States is recorded, processed, summarized and reported within the time periods specified and such information is accumulated and communicated to the Company’s management to allow timely decisions regarding required disclosures.
The Company’s management also performed an assessment of internal control over financial reporting as at December 31, 2015, and concluded that internal control over financial reporting is effective. Further, there were no changes in the Company’s internal control over financial reporting during 2015 that have materially affected, or are reasonably likely to materially affect, internal control over financial reporting.
While the Company’s management believes that the Company’s disclosure controls and procedures and internal control over financial reporting provide a reasonable level of assurance they are effective, they recognize that all control systems have inherent limitations. Because of its inherent limitations, the Company’s control systems may not prevent or detect misstatements. Also, projections of any evaluation of effectiveness to future periods are subject to the risk that controls may become inadequate because of changes in conditions, or that the degree of compliance with the policies or procedures may deteriorate.
OUTLOOK
The Company continues to implement its strategy of maintaining a large portfolio of varied projects, which the Company believes will enable it, over an extended period of time, to provide consistent growth in production and create shareholder value. Annual budgets are developed, scrutinized throughout the year and revised if necessary in the context of targeted financial ratios, project returns, product pricing expectations, and balance in project risk and time horizons. The Company maintains a high ownership level and operatorship level in all of its properties and can therefore control the nature, timing and extent of capital expenditures in each of its project areas.
Capital expenditures in 2016 are currently targeted to be as follows:
|
($ millions)
|
2016
|
|||
|
Exploration and Production
|
||||
|
North America natural gas and NGLs
|
$
|
160 – 195
|
||
|
North America crude oil
|
305 – 435
|
|||
|
International crude oil
|
450 – 495
|
|||
|
Thermal In Situ Oil Sands
|
||||
|
Primrose and future
|
120 – 140
|
|||
|
Kirby South
|
10 – 16
|
|||
|
Kirby North Phase 1
|
25 – 34
|
|||
|
Midstream and other
|
15 – 20
|
|||
|
Total Exploration and Production
|
$
|
1,085 – 1,335
|
||
|
Oil Sands Mining and Upgrading
|
||||
|
Project Capital
|
||||
|
Directive 74
|
50 – 60
|
|||
|
Phase 2B
|
1,180
|
|||
|
Phase 3
|
410 – 460
|
|||
|
Owner’s Costs and Other
|
250 – 290
|
|||
|
Total Project Capital
|
$
|
1,890 – 1,990
|
||
|
Technology and Phase 4
|
5
|
|||
|
Sustaining capital
|
280 – 310
|
|||
|
Turnarounds and reclamation
|
110 – 120
|
|||
|
Capitalized interest and other
|
130 – 140
|
|||
|
Total Oil Sands Mining and Upgrading
|
$
|
2,415 – 2,565
|
||
|
Total
|
$
|
3,500 – 3,900
|
||
SENSITIVITY ANALYSIS
The following table is indicative of the annualized sensitivities of cash flow from operations and net earnings (loss) from changes in certain key variables. The analysis is based on business conditions and sales volumes during the fourth quarter of 2015, excluding mark-to-market gains (losses) on risk management activities and is not necessarily indicative of future results. Each separate line item in the sensitivity analysis shows the effect of a change in that variable only with all other variables being held constant.
|
Cash flow
from operations ($ millions) |
Cash flow
from operations (per common share, basic)
|
Net earnings ($ millions) |
Net earnings (per common share, basic)
|
|||||||||||||
|
Price changes
|
||||||||||||||||
|
Crude oil – WTI US$1.00/bbl
|
$
|
198
|
$
|
0.18
|
$
|
194
|
$
|
0.18
|
||||||||
|
Natural gas – AECO C$0.10/Mcf
|
$
|
38
|
$
|
0.03
|
$
|
37
|
$
|
0.03
|
||||||||
|
Volume changes
|
||||||||||||||||
|
Crude oil – 10,000 bbl/d
|
$
|
72
|
$
|
0.07
|
$
|
27
|
$
|
0.02
|
||||||||
|
Natural gas – 10 MMcf/d
|
$
|
3
|
$
|
–
|
$
|
–
|
$
|
–
|
||||||||
|
Foreign currency rate change
|
||||||||||||||||
|
$0.01 change in US$ (1)
|
||||||||||||||||
|
Including financial derivatives
|
$
|
78 - 81
|
$
|
0.07
|
$
|
9
|
$
|
0.01
|
||||||||
|
Interest rate change – 1%
|
$
|
30
|
$
|
0.03
|
$
|
30
|
$
|
0.03
|
||||||||
| (1) | For details of financial instruments in place, refer to note 17 to the Company’s consolidated financial statements as at December 31, 2015. |
DAILY PRODUCTION BY SEGMENT, BEFORE ROYALTIES
|
Q1
|
Q2
|
Q3
|
Q4
|
2015
|
2014
|
2013
|
||||||||
|
Crude oil and NGLs (bbl/d)
|
||||||||||||||
|
North America –
Exploration and Production |
432,419
|
375,040
|
397,892
|
395,008
|
399,982
|
390,814
|
343,699
|
|||||||
|
North America –
Oil Sands Mining and Upgrading |
134,166
|
96,607
|
131,779
|
129,050
|
122,911
|
110,571
|
100,284
|
|||||||
|
North Sea
|
23,036
|
20,330
|
22,387
|
23,110
|
22,216
|
17,380
|
18,334
|
|||||||
|
Offshore
Africa |
13,188
|
17,070
|
21,077
|
24,832
|
19,079
|
12,429
|
15,923
|
|||||||
|
Total
|
602,809
|
509,047
|
573,135
|
572,000
|
564,188
|
531,194
|
478,240
|
|||||||
|
Natural gas (MMcf/d)
|
||||||||||||||
|
North America
|
1,713
|
1,716
|
1,592
|
1,635
|
1,663
|
1,527
|
1,130
|
|||||||
|
North Sea
|
34
|
38
|
35
|
36
|
36
|
7
|
4
|
|||||||
|
Offshore
Africa |
24
|
25
|
26
|
32
|
27
|
21
|
24
|
|||||||
|
Total
|
1,771
|
1,779
|
1,653
|
1,703
|
1,726
|
1,555
|
1,158
|
|||||||
|
Barrels of oil equivalent (BOE/d)
|
||||||||||||||
|
North America –
Exploration and Production |
718,050
|
660,975
|
663,260
|
667,504
|
677,270
|
645,227
|
531,961
|
|||||||
|
North America –
Oil Sands Mining and Upgrading |
134,166
|
96,607
|
131,779
|
129,050
|
122,911
|
110,571
|
100,284
|
|||||||
|
North Sea
|
28,692
|
26,737
|
28,195
|
29,135
|
28,191
|
18,629
|
19,029
|
|||||||
|
Offshore
Africa |
17,145
|
21,228
|
25,467
|
30,111
|
23,529
|
15,983
|
19,888
|
|||||||
|
Total
|
898,053
|
805,547
|
848,701
|
855,800
|
851,901
|
790,410
|
671,162
|
PER UNIT RESULTS – EXPLORATION AND PRODUCTION
|
Q1
|
Q2
|
Q3
|
Q4
|
2015
|
2014
|
2013
|
||||||||||||||||||||||
|
Crude oil and NGLs ($/bbl) (1)
|
||||||||||||||||||||||||||||
|
Sales price (2)
|
$
|
37.03
|
$
|
53.09
|
$
|
41.55
|
$
|
33.90
|
$
|
41.13
|
$
|
77.04
|
$
|
73.81
|
||||||||||||||
|
Transportation
|
2.46
|
2.80
|
2.56
|
2.61
|
2.60
|
2.41
|
2.22
|
|||||||||||||||||||||
|
Realized sales price, net of transportation
|
34.57
|
50.29
|
38.99
|
31.29
|
38.53
|
74.63
|
71.59
|
|||||||||||||||||||||
|
Royalties
|
3.83
|
5.91
|
4.09
|
3.49
|
4.30
|
12.99
|
11.13
|
|||||||||||||||||||||
|
Production expense
|
16.10
|
17.01
|
15.70
|
14.26
|
15.74
|
18.25
|
17.14
|
|||||||||||||||||||||
|
Netback
|
$
|
14.64
|
$
|
27.37
|
$
|
19.20
|
$
|
13.54
|
$
|
18.49
|
$
|
43.39
|
$
|
43.32
|
||||||||||||||
|
Natural gas ($/Mcf) (1)
|
||||||||||||||||||||||||||||
|
Sales price (2)
|
$
|
3.38
|
$
|
3.06
|
$
|
3.22
|
$
|
2.96
|
$
|
3.16
|
$
|
4.83
|
$
|
3.58
|
||||||||||||||
|
Transportation
|
0.36
|
0.38
|
0.39
|
0.38
|
0.38
|
0.27
|
0.28
|
|||||||||||||||||||||
|
Realized sales price, net of transportation
|
3.02
|
2.68
|
2.83
|
2.58
|
2.78
|
4.56
|
3.30
|
|||||||||||||||||||||
|
Royalties
|
0.12
|
0.05
|
0.11
|
0.10
|
0.10
|
0.38
|
0.18
|
|||||||||||||||||||||
|
Production expense
|
1.44
|
1.39
|
1.31
|
1.22
|
1.34
|
1.48
|
1.42
|
|||||||||||||||||||||
|
Netback
|
$
|
1.46
|
$
|
1.24
|
$
|
1.41
|
$
|
1.26
|
$
|
1.34
|
$
|
2.70
|
$
|
1.70
|
||||||||||||||
|
Barrels of oil equivalent ($/BOE) (1)
|
||||||||||||||||||||||||||||
|
Sales price (2)
|
$
|
30.57
|
$
|
38.85
|
$
|
33.46
|
$
|
27.79
|
$
|
32.60
|
$
|
58.48
|
$
|
56.46
|
||||||||||||||
|
Transportation
|
2.44
|
2.67
|
2.56
|
2.59
|
2.56
|
2.18
|
2.10
|
|||||||||||||||||||||
|
Realized sales price, net of transportation
|
28.13
|
36.18
|
30.90
|
25.20
|
30.04
|
56.30
|
54.36
|
|||||||||||||||||||||
|
Royalties
|
2.65
|
3.58
|
2.81
|
2.38
|
2.85
|
8.90
|
7.74
|
|||||||||||||||||||||
|
Production expense
|
13.20
|
13.39
|
12.68
|
11.55
|
12.70
|
14.67
|
14.24
|
|||||||||||||||||||||
|
Netback
|
$
|
12.28
|
$
|
19.21
|
$
|
15.41
|
$
|
11.27
|
$
|
14.49
|
$
|
32.73
|
$
|
32.38
|
| (1) | Amounts expressed on a per unit basis are based on sales volumes. |
| (2) | Net of blending costs and excluding risk management activities. |
PER UNIT RESULTS – OIL SANDS MINING AND UPGRADING
|
Q1
|
Q2
|
Q3
|
Q4
|
2015
|
2014
|
2013
|
||||||||||||||||||||||
|
Crude oil and NGLs ($/bbl) (1)
|
||||||||||||||||||||||||||||
|
SCO sales price
|
$
|
56.75
|
$
|
73.05
|
$
|
60.66
|
$
|
57.49
|
$
|
61.39
|
$
|
100.27
|
$
|
100.75
|
||||||||||||||
|
Bitumen royalties (2)
|
1.01
|
0.99
|
1.32
|
0.99
|
1.08
|
5.77
|
5.11
|
|||||||||||||||||||||
|
Transportation
|
1.83
|
1.98
|
1.82
|
1.66
|
1.81
|
1.85
|
1.57
|
|||||||||||||||||||||
|
Adjusted cash
production costs |
29.73
|
29.25
|
27.04
|
28.56
|
28.61
|
37.18
|
40.57
|
|||||||||||||||||||||
|
Netback
|
$
|
24.18
|
$
|
40.83
|
$
|
30.48
|
$
|
26.28
|
$
|
29.89
|
$
|
55.47
|
$
|
53.50
|
| (1) | Amounts expressed on a per unit basis are based on sales volumes. |
| (2) | Calculated based on actual bitumen royalties expensed during the period; divided by the corresponding SCO sales volumes. |
TRADING AND SHARE STATISTICS
|
Q1
|
Q2
|
Q3
|
Q4
|
2015
|
2014
|
|||||||||||||||||||
|
TSX – C$
|
||||||||||||||||||||||||
|
Trading volume (thousands)
|
188,056
|
136,582
|
193,335
|
210,061
|
728,034
|
717,580
|
||||||||||||||||||
|
Share Price ($/share)
|
||||||||||||||||||||||||
|
High
|
$
|
40.80
|
$
|
42.46
|
$
|
34.01
|
$
|
34.51
|
$
|
42.46
|
$
|
49.57
|
||||||||||||
|
Low
|
$
|
31.20
|
$
|
33.61
|
$
|
25.01
|
$
|
25.32
|
$
|
25.01
|
$
|
31.00
|
||||||||||||
|
Close
|
$
|
38.82
|
$
|
33.90
|
$
|
25.99
|
$
|
30.22
|
$
|
30.22
|
$
|
35.92
|
||||||||||||
|
Market capitalization as at
December 31 ($ millions)
|
$
|
33,081
|
$
|
39,219
|
||||||||||||||||||||
|
Shares outstanding
(thousands) |
1,094,668
|
1,091,837
|
||||||||||||||||||||||
|
NYSE – US$
|
||||||||||||||||||||||||
|
Trading volume (thousands)
|
229,008
|
150,833
|
296,623
|
274,847
|
951,311
|
812,521
|
||||||||||||||||||
|
Share Price ($/share)
|
||||||||||||||||||||||||
|
High
|
$
|
32.57
|
$
|
34.46
|
$
|
27.23
|
$
|
26.24
|
$
|
34.46
|
$
|
46.65
|
||||||||||||
|
Low
|
$
|
26.13
|
$
|
26.93
|
$
|
18.94
|
$
|
19.12
|
$
|
18.94
|
$
|
26.53
|
||||||||||||
|
Close
|
$
|
30.71
|
$
|
27.16
|
$
|
19.45
|
$
|
21.83
|
$
|
21.83
|
$
|
30.88
|
||||||||||||
|
Market capitalization as at
December 31 ($ millions)
|
$
|
23,897
|
$
|
33,716
|
||||||||||||||||||||
|
Shares outstanding
(thousands) |
1,094,668
|
1,091,837
|
ADDITIONAL DISCLOSURE
Certifications
The required disclosure is included in Exhibits 31.1, 31.2, 32.1 and 32.2 to this Annual Report on Form 40-F
Disclosure Controls and Procedures
As of the end of the registrant’s fiscal year ended December 31, 2015, an evaluation of the effectiveness of Canadian Natural’s “disclosure controls and procedures” (as such term is defined in Rules 13a-15(e) and 15d-15(e) of the Securities Exchange Act of 1934, as amended (the “Exchange Act”), was carried out by Canadian Natural’s management with the participation of Canadian Natural’s principal executive officer and principal financial officer. Based upon the evaluation, Canadian Natural’s principal executive officer and principal financial officer have concluded that as of the end of the fiscal year, Canadian Natural’s disclosure controls and procedures are effective to ensure that information required to be disclosed by Canadian Natural in reports that it files or submits under the Exchange Act is (i) recorded, processed, summarized and reported within the time periods specified in Securities and Exchange Commission rules and forms and (ii) accumulated and communicated to Canadian Natural’s management, including its principal executive officer and principal financial officer, to allow timely decisions regarding required disclosure.
It should be noted that while Canadian Natural’s principal executive officer and principal financial officer believe that Canadian Natural’s disclosure controls and procedures provide a reasonable level of assurance that they are effective, they do not expect Canadian Natural’s disclosure controls and procedures or internal control over financial reporting will prevent all errors and fraud. A control system, no matter how well conceived or operated, can provide only reasonable, not absolute, assurance that the objectives of the control system are met.
Management’s Annual Report on Internal Control Over Financial Reporting
The required disclosure is included in the “Management’s Assessment of Internal Control Over Financial Reporting” that accompanies Canadian Natural’s audited consolidated financial statements for the fiscal year ended December 31, 2015, filed as part of this Annual Report on Form 40-F.
Attestation Report of the Registered Public Accounting Firm
The required disclosure is included in the “Independent Auditor’s Report” that accompanies Canadian Natural’s audited consolidated financial statements for the fiscal year ended December 31, 2015, filed as part of this Annual Report on Form 40-F.
Changes in Internal Control Over Financial Reporting
During the fiscal year ended December 31, 2015, there were no changes in Canadian Natural’s internal control over financial reporting that have materially affected, or are reasonably likely to materially affect, Canadian Natural’s internal control over financial reporting.
Notices Pursuant to Regulation BTR
None.
Audit Committee Financial Expert
The Board of Directors of Canadian Natural has determined that Ms. C.M. Best qualifies as an “audit committee financial expert” (as defined in paragraph 8(b) of General Instruction B to Form 40-F) serving on its Audit Committee. Ms. C.M. Best is, as are all members of the Audit Committee of the Board of Directors of Canadian Natural, “independent” as such term is defined in the rules of the New York Stock Exchange.
Code of Ethics
Canadian Natural has a long-standing Code of Integrity, Business Ethics and Conduct (the “Code of Ethics”), which covers such topics as employment standards, conflict of interest, the treatment of confidential information and trading in Canadian Natural’s shares and is designed to ensure that Canadian Natural’s business is consistently conducted in a legal and ethical manner. Each director and all employees, including each member of senior management and more specifically the principal executive officer, principal financial officer, principal accounting officer or controller and persons performing similar functions, are required to abide by the Code of Ethics. The Nominating and Corporate Governance Committee periodically reviews the Code of Ethics to ensure it addresses appropriate topics and complies with regulatory requirements and recommends any appropriate changes to the Board for approval.
Any waivers of or amendments to the Code of Ethics must be approved by the Board of Directors and will be appropriately disclosed. In the past fiscal year, there have not been any waivers, including implicit waivers, from any provisions of the Code of Ethics and there have been no substantive amendments.
The Code of Ethics is available through the System for Electronic Document and Analysis and Retrieval (SEDAR) at www.sedar.com. Canadian Natural hereby undertakes to provide to any person, without charge and upon request, a copy of its Code of Ethics. Requests for copies can also be made by contacting: Paul M. Mendes, Vice President, Legal, General Counsel and Corporate Secretary, Canadian Natural Resources Limited, 2100-855 2nd Street, S.W., Calgary, Alberta, Canada T2P 4J8.
Principal Accountant Fees and Services
PricewaterhouseCoopers LLP (“PwC”) has been the auditor of Canadian Natural since Canadian Natural’s inception. The aggregate amounts billed by PwC for each of the last two fiscal years for audit fees, audit-related fees, tax fees and all other fees, excluding expenses, are set forth below.
Audit Fees
The aggregate fees billed for each of the last two fiscal years of Canadian Natural ended December 31, 2015 and December 31, 2014, for professional services rendered by PwC for the audit of its internal controls and annual consolidated financial statements in connection with statutory and regulatory filings or engagements for those fiscal years, unaudited reviews of the first, second and third quarters of its interim consolidated financial statements and audits of certain of Canadian Natural’s subsidiary companies’ annual financial statements were $3,012,000 for 2015 and were $3,047,000 for 2014.
Audit-Related Fees
The aggregate fees billed for each of the last two fiscal years of Canadian Natural, ended December 31, 2015 and December 31, 2014, for audit-related services by PwC including pension assets and Crown Royalty Statements, were $250,000 for 2015 and were $259,000 for 2014. Canadian Natural’s Audit Committee approved all of these audit-related services.
Tax Fees
The aggregate fees billed for each of the last two fiscal years of Canadian Natural, ended December 31, 2015 and December 31, 2014, for professional services rendered by PwC for tax services related to expatriate personal tax compliance and other corporate tax return matters were $495,000 for 2015 and were $523,000 for 2014. Canadian Natural’s Audit Committee approved all of these tax-related services.
All Other Fees
The aggregate fees billed for each of the last two fiscal years of Canadian Natural, ended December 31, 2015 and December 31, 2014 for other services were $84,000 for 2015 and were $87,000 for 2014, related to expatriate visa application assistance and to accessing resource materials through PwC’s accounting literature library. Canadian Natural’s Audit Committee approved all of the noted services.
Audit Committee Pre-Approval Policies and Procedures
The Audit Committee’s duties and responsibilities include the review and approval of fees to be paid to the independent auditors, scope and timing of the audit and other related services rendered by the independent auditors. The Audit Committee also reviews and approves the independent auditor’s annual audit plan, including scope, staffing, locations and reliance upon management and internal audit department prior to the commencement of the audit and reviews and approves proposed non-audit services to be provided by the independent auditors, except those non-audit services prohibited by legislation. Canadian Natural did not rely on the de minimis exemption provided by paragraph (c)(7)(i)(c) of Rule 2.01 of Regulation S-X in 2015.
Off Balance Sheet Arrangements
The Company does not have any off-balance sheet arrangements that have or are reasonably likely to have a current or future effect on its financial condition, changes in financial condition, revenues or expenses, results of operations, liquidity, capital expenditures or capital resources that is material to investors.
Tabular Disclosure of Contractual Obligations
In the normal course of business, the Company has entered into various commitments that will have an impact on the Company’s future operations. The following table summarizes the Company’s commitments as at December 31, 2015:
|
($ millions)
|
2016
|
2017
|
2018
|
2019
|
2020
|
Thereafter
|
||||||||||||||||||
|
Product transportation and pipeline
|
$
|
423
|
$
|
341
|
$
|
303
|
$
|
261
|
$
|
246
|
$
|
1,304
|
||||||||||||
|
Offshore equipment operating leases and offshore drilling
|
$
|
247
|
$
|
93
|
$
|
71
|
$
|
22
|
$
|
-
|
$
|
-
|
||||||||||||
|
Long-term debt (1)(2)
|
$
|
1,730
|
$
|
2,522
|
$
|
2,899
|
$
|
1,353
|
$
|
1,427
|
$
|
6,935
|
||||||||||||
|
Interest and other financing expense (3)
|
$
|
649
|
$
|
564
|
$
|
478
|
$
|
437
|
$
|
408
|
$
|
4,608
|
||||||||||||
|
Office leases
|
$
|
42
|
$
|
42
|
$
|
42
|
$
|
43
|
$
|
42
|
$
|
193
|
||||||||||||
|
Other
|
$
|
141
|
$
|
38
|
$
|
48
|
$
|
1
|
$
|
-
|
$
|
-
|
||||||||||||
| (1) | Long-term debt represents principal repayments only and does not reflect original issue discounts or transaction costs. |
| (2) | At December 31, 2015, the Company had US$500 million of debt securities at three-month LIBOR plus 0.375% due March 2016 and US$250 million of 6.00% debt securities due August 2016. These debt securities have been hedged by way of cross currency swaps with principal repayment amounts fixed at $555 million and $279 million respectively. |
| (3) | Interest and other financing expense amounts represent the scheduled fixed rate and variable rate cash interest payments related to long-term debt. Interest on variable rate long-term debt was estimated based upon prevailing interest rates and foreign exchange rates as at December 31, 2015. |
In addition to the commitments disclosed above, the Company has entered into various agreements related to the engineering, procurement and construction of subsequent phases of Horizon Oil Sands operations. These contracts can be cancelled by the Company upon notice without penalty, subject to the costs incurred up to and in respect of the cancellation.
Identification of the Audit Committee
Canadian Natural has a separately designated standing audit committee established in accordance with section 3(a)(58)(A) of the Exchange Act. The members of the Audit Committee are Ms. C.M. Best, who chairs the Audit Committee and Messrs. T. W. Faithfull, G. A. Filmon, G. D. Giffin, D. A. Tuer.
Mine Safety Disclosure
Not Applicable
UNDERTAKING AND CONSENT TO SERVICE OF PROCESS
Undertaking
Canadian Natural undertakes to make available, in person or by telephone, representatives to respond to inquiries made by the Commission staff, and to furnish promptly, when requested to do so by the Commission staff, information relating to: the securities registered pursuant to Form 40-F; the securities in relation to which the obligation to file an annual report on Form 40-F arises; or transactions in said securities.
Consent to Service of Process
Canadian Natural has previously filed a Form F-X in connection with the class of securities in relation to which the obligation to file this report arises.
Any change to the name or address of the agent for service of process of Canadian Natural shall be communicated promptly to the Commission by an amendment to the Form F-X referencing the file number of the registrant.
SIGNATURES
Pursuant to the requirements of the Exchange Act, Canadian Natural certifies that it meets all of the requirements for filing on Form 40-F and has duly caused this Annual Report to be signed on its behalf by the undersigned, thereto duly authorized.
Dated this 24th day of March, 2016.
| CANADIAN NATURAL RESOURCES LIMITED | |||
|
|
By:
|
SIGNED “STEVE W. LAUT” | |
| Name: Steve W. Laut | |||
| Title: President | |||
Documents filed as part of this report:
EXHIBIT INDEX