0001013237FACTSET RESEARCH SYSTEMS INCfalse--08-31FY201937000575.005463410,000,0000.01000150,000,0000.011053202043550Includes the cumulative effect of adoption of accounting standards primarily due to both the adoption of the new revenue recognition standard (ASC 606) resulting in a cumulative increase to retained earnings related to certain fulfillment costs and the accounting standard update related to the TCJA providing for the reclassification from accumulated other comprehensive loss to retained earnings for stranded tax effects. See Notes 3 and 4 for additional information.For fiscal 2019, 2018 and 2017, the Company repurchased 31,644, 8,070 and 49,771 shares, or $7.2 million, $1.5 million and $7.8 million, of common stock, respectively, in settlement of employee tax withholding obligations due upon the vesting of restricted stock.During the first quarter of fiscal 2018, FactSet adopted an accounting standard that requires all excess tax benefits or deficiencies related to share-based payments to be reported within the consolidated statement of income that were previously reported within equity. The adoption of this standard resulted in the recognition of $9.5 million of excess tax benefits to FactSet's provision for income taxes during fiscal 2018. Includes a 200 basis point benefit as a result of FactSet's global realignment. Effective September 1, 2016, FactSet realigned certain aspects of its global operations from FactSet Research Systems Inc., its U.S. parent company, to FactSet UK Limited, a U.K. operating company, to better position the Company to serve its growing client base outside the U.S. This realignment allows the Company to further implement strategic corporate objectives and helps achieve operational and financial efficiencies, while complementing FactSet's increasing global growth and reach.The Company's corporate money market funds are readily convertible into cash and the net asset value of each fund on the last day of the quarter is used to determine its fair value. As such, the Company's corporate money market funds are classified as Level 1 assets and included in Cash and cash equivalents within the Consolidated Balance Sheets.Under the Company's Option Plan, for each restricted stock award canceled/forfeited, an equivalent of 2.5 shares is added back to the available share-based awards balance.The unrealized gain (loss) on cash flow hedges disclosed above was net of tax (expense) benefit of ($387), $3,518, and ($3,049) for the fiscal years ended August 31, 2019, 2018 and 2017, respectively.Diluted earnings per common share is calculated independently for each of the periods presented. Accordingly, the sum of the quarterly EPS amounts may not equal the total for the fiscal year.Long-lived assets consist of property, equipment and leasehold improvements, net of accumulated depreciation and amortization and exclude goodwill, intangible assets, deferred taxes and other assets.The enactment of the TCJA resulted in a one-time transition tax expense of $23.2 million during the second quarter of fiscal 2018. Each restricted stock award granted is equivalent to 2.5 shares granted under the Company's Option Plan.The Company utilizes the income approach to measure fair value for its derivative instruments (foreign exchange forward contracts). The income approach uses pricing models that rely on market observable inputs such as spot, forward and interest rates, as well as credit default swap spreads and therefore are classified as Level 2 assets.Revenues are attributed to countries based on the location of the client.Additions to the receivable reserve for doubtful accounts are charged to bad debt expense. Additions to the receivable reserve for billing adjustments are charged against revenues.The Company's certificates of deposit held for investment are not debt securities and are classified as Level 2 assets. These certificates of deposit have original maturities greater than three months, but less than one year and, as such, are classified as Investments (short-term) within the Consolidated Balance Sheets.The 26,599 restricted stock awards that vested during fiscal 2018 were comprised of: 9,765 of awards relating to
restricted stock granted on October 16, 2015 and 8,600 of awards relating to restricted stock granted on June 30, 2017
which vest at a rate of 20% annually upon the anniversary date of the grant, respectively. Additionally, 8,234 awards
vested related to other grants.The 132,194 restricted stock awards that vested during fiscal 2017 were comprised of: 73,522 of awards relating to
restricted stock granted on November 1, 2013, which cliff vested 60% after three years, 17,328 of awards relating to
restricted stock granted on October 16, 2015, which vested 20% annually upon the anniversary date of the grant and
30,162 of awards relating to restricted stock granted on October 16, 2015, which were modified to accelerate vest 100%
in conjunction with employee severance. Additionally, 11,182 awards vested related to other grants.The 85,401 restricted stock awards that vested during fiscal 2019 were comprised of: 42,276 of awards relating to
restricted stock granted on November 1,2013 and 9,451 of awards relating to restricted stock granted on October 16,
2015, which vest at a rate of 20% annually upon the anniversary date of the grant, respectively, 18,691 of awards relating
to restricted stock granted on February 9, 2015, which vest 100% upon the four year anniversary date of the grant, 8,924
of awards relating to restricted stock granted on June 30, 2017, which vest 60% after three years and 40% after five years.
Additionally, there were 6,059 awards that vested related to other grants.The Company's mutual funds have a fair value based on the fair value of the underlying investments held by the mutual funds allocated to each share of the mutual fund using a net asset value approach. The fair value of the underlying investments is based on observable inputs. As such, the Company's mutual funds are classified as Level 2 assets and are classified as Investments (short-term) on the Consolidated Balance Sheets.10,5113,4900.010.0110,000,00010,000,000000.010.01150,000,000150,000,00040,104,19239,264,84938,117,84038,192,5861,986,3521,072,26300010132372018-09-012019-08-31xbrli:shares00010132372019-10-24thunderdome:itemiso4217:USD00010132372017-09-012018-08-3100010132372016-09-012017-08-31iso4217:USDxbrli:shares00010132372019-08-3100010132372018-08-3100010132372017-08-3100010132372016-08-310001013237us-gaap:CommonStockMember2016-08-310001013237us-gaap:AdditionalPaidInCapitalMember2016-08-310001013237us-gaap:TreasuryStockMember2016-08-310001013237us-gaap:RetainedEarningsMember2016-08-310001013237us-gaap:AccumulatedOtherComprehensiveIncomeMember2016-08-310001013237us-gaap:RetainedEarningsMember2016-09-012017-08-310001013237us-gaap:AccumulatedOtherComprehensiveIncomeMember2016-09-012017-08-310001013237us-gaap:CommonStockMember2016-09-012017-08-310001013237us-gaap:AdditionalPaidInCapitalMember2016-09-012017-08-310001013237us-gaap:TreasuryStockMember2016-09-012017-08-310001013237fds:ASRAgreementMemberus-gaap:AdditionalPaidInCapitalMember2016-09-012017-08-310001013237fds:ASRAgreementMemberus-gaap:TreasuryStockMember2016-09-012017-08-310001013237fds:ASRAgreementMember2016-09-012017-08-310001013237us-gaap:CommonStockMember2017-08-310001013237us-gaap:AdditionalPaidInCapitalMember2017-08-310001013237us-gaap:TreasuryStockMember2017-08-310001013237us-gaap:RetainedEarningsMember2017-08-310001013237us-gaap:AccumulatedOtherComprehensiveIncomeMember2017-08-310001013237us-gaap:RetainedEarningsMember2017-09-012018-08-310001013237us-gaap:AccumulatedOtherComprehensiveIncomeMember2017-09-012018-08-310001013237us-gaap:CommonStockMember2017-09-012018-08-310001013237us-gaap:AdditionalPaidInCapitalMember2017-09-012018-08-310001013237us-gaap:TreasuryStockMember2017-09-012018-08-310001013237us-gaap:CommonStockMember2018-08-310001013237us-gaap:AdditionalPaidInCapitalMember2018-08-310001013237us-gaap:TreasuryStockMember2018-08-310001013237us-gaap:RetainedEarningsMember2018-08-310001013237us-gaap:AccumulatedOtherComprehensiveIncomeMember2018-08-310001013237us-gaap:RetainedEarningsMember2018-09-012019-08-310001013237us-gaap:AccumulatedOtherComprehensiveIncomeMember2018-09-012019-08-310001013237us-gaap:CommonStockMember2018-09-012019-08-310001013237us-gaap:AdditionalPaidInCapitalMember2018-09-012019-08-310001013237us-gaap:TreasuryStockMember2018-09-012019-08-310001013237us-gaap:CommonStockMember2019-08-310001013237us-gaap:AdditionalPaidInCapitalMember2019-08-310001013237us-gaap:TreasuryStockMember2019-08-310001013237us-gaap:RetainedEarningsMember2019-08-310001013237us-gaap:AccumulatedOtherComprehensiveIncomeMember2019-08-31xbrli:pureutr:Y0001013237us-gaap:ComputerEquipmentMember2018-09-012019-08-310001013237us-gaap:FurnitureAndFixturesMember2018-09-012019-08-310001013237us-gaap:AccountingStandardsUpdate201409Member2018-09-012018-11-300001013237country:US2018-09-012019-08-310001013237country:US2017-09-012018-08-310001013237country:US2016-09-012017-08-310001013237srt:EuropeMember2018-09-012019-08-310001013237srt:EuropeMember2017-09-012018-08-310001013237srt:EuropeMember2016-09-012017-08-310001013237srt:AsiaPacificMember2018-09-012019-08-310001013237srt:AsiaPacificMember2017-09-012018-08-310001013237srt:AsiaPacificMember2016-09-012017-08-310001013237us-gaap:FairValueInputsLevel3Member2018-08-310001013237us-gaap:FairValueInputsLevel3Member2019-08-310001013237us-gaap:MoneyMarketFundsMemberus-gaap:FairValueInputsLevel1Memberus-gaap:FairValueMeasurementsRecurringMember2019-08-310001013237us-gaap:MoneyMarketFundsMemberus-gaap:FairValueInputsLevel2Memberus-gaap:FairValueMeasurementsRecurringMember2019-08-310001013237us-gaap:MoneyMarketFundsMemberus-gaap:FairValueInputsLevel3Memberus-gaap:FairValueMeasurementsRecurringMember2019-08-310001013237us-gaap:MoneyMarketFundsMemberus-gaap:FairValueMeasurementsRecurringMember2019-08-310001013237fds:MutualFundsMemberus-gaap:FairValueInputsLevel1Memberus-gaap:FairValueMeasurementsRecurringMember2019-08-310001013237fds:MutualFundsMemberus-gaap:FairValueInputsLevel2Memberus-gaap:FairValueMeasurementsRecurringMember2019-08-310001013237fds:MutualFundsMemberus-gaap:FairValueInputsLevel3Memberus-gaap:FairValueMeasurementsRecurringMember2019-08-310001013237fds:MutualFundsMemberus-gaap:FairValueMeasurementsRecurringMember2019-08-310001013237us-gaap:CertificatesOfDepositMemberus-gaap:FairValueInputsLevel1Memberus-gaap:FairValueMeasurementsRecurringMember2019-08-310001013237us-gaap:CertificatesOfDepositMemberus-gaap:FairValueInputsLevel2Memberus-gaap:FairValueMeasurementsRecurringMember2019-08-310001013237us-gaap:CertificatesOfDepositMemberus-gaap:FairValueInputsLevel3Memberus-gaap:FairValueMeasurementsRecurringMember2019-08-310001013237us-gaap:CertificatesOfDepositMemberus-gaap:FairValueMeasurementsRecurringMember2019-08-310001013237us-gaap:FairValueInputsLevel1Memberus-gaap:FairValueMeasurementsRecurringMember2019-08-310001013237us-gaap:FairValueInputsLevel2Memberus-gaap:FairValueMeasurementsRecurringMember2019-08-310001013237us-gaap:FairValueInputsLevel3Memberus-gaap:FairValueMeasurementsRecurringMember2019-08-310001013237us-gaap:FairValueMeasurementsRecurringMember2019-08-310001013237us-gaap:MoneyMarketFundsMemberus-gaap:FairValueInputsLevel1Memberus-gaap:FairValueMeasurementsRecurringMember2018-08-310001013237us-gaap:MoneyMarketFundsMemberus-gaap:FairValueInputsLevel2Memberus-gaap:FairValueMeasurementsRecurringMember2018-08-310001013237us-gaap:MoneyMarketFundsMemberus-gaap:FairValueInputsLevel3Memberus-gaap:FairValueMeasurementsRecurringMember2018-08-310001013237us-gaap:MoneyMarketFundsMemberus-gaap:FairValueMeasurementsRecurringMember2018-08-310001013237fds:MutualFundsMemberus-gaap:FairValueInputsLevel1Memberus-gaap:FairValueMeasurementsRecurringMember2018-08-310001013237fds:MutualFundsMemberus-gaap:FairValueInputsLevel2Memberus-gaap:FairValueMeasurementsRecurringMember2018-08-310001013237fds:MutualFundsMemberus-gaap:FairValueInputsLevel3Memberus-gaap:FairValueMeasurementsRecurringMember2018-08-310001013237fds:MutualFundsMemberus-gaap:FairValueMeasurementsRecurringMember2018-08-310001013237us-gaap:CertificatesOfDepositMemberus-gaap:FairValueInputsLevel1Memberus-gaap:FairValueMeasurementsRecurringMember2018-08-310001013237us-gaap:CertificatesOfDepositMemberus-gaap:FairValueInputsLevel2Memberus-gaap:FairValueMeasurementsRecurringMember2018-08-310001013237us-gaap:CertificatesOfDepositMemberus-gaap:FairValueInputsLevel3Memberus-gaap:FairValueMeasurementsRecurringMember2018-08-310001013237us-gaap:CertificatesOfDepositMemberus-gaap:FairValueMeasurementsRecurringMember2018-08-310001013237us-gaap:FairValueInputsLevel1Memberus-gaap:FairValueMeasurementsRecurringMember2018-08-310001013237us-gaap:FairValueInputsLevel2Memberus-gaap:FairValueMeasurementsRecurringMember2018-08-310001013237us-gaap:FairValueInputsLevel3Memberus-gaap:FairValueMeasurementsRecurringMember2018-08-310001013237us-gaap:FairValueMeasurementsRecurringMember2018-08-310001013237us-gaap:FairValueInputsLevel2Memberus-gaap:EstimateOfFairValueFairValueDisclosureMember2019-08-310001013237us-gaap:FairValueInputsLevel2Memberus-gaap:EstimateOfFairValueFairValueDisclosureMember2018-08-310001013237fds:ForeignCurrencyForwardContractsPhilippinePesoMembersrt:ScenarioForecastMember2020-06-012020-08-310001013237fds:ForeignCurrencyForwardContractsIndianRupeeMembersrt:ScenarioForecastMember2020-03-012020-05-310001013237fds:ForeignCurrencyForwardContractsIndianRupeeMembersrt:ScenarioForecastMember2020-06-012020-08-310001013237fds:ForeignCurrencyForwardContractsEuroMembersrt:ScenarioForecastMember2019-09-012019-11-300001013237fds:ForeignCurrencyForwardContractsEuroMembersrt:ScenarioForecastMember2019-12-012020-02-280001013237fds:ForeignCurrencyForwardContractsEuroMembersrt:ScenarioForecastMember2020-03-012020-05-310001013237fds:ForeignCurrencyForwardContractsBritishPoundSterlingMembersrt:ScenarioForecastMember2019-09-012019-11-300001013237fds:ForeignCurrencyForwardContractsBritishPoundSterlingMembersrt:ScenarioForecastMember2020-03-012020-05-310001013237fds:ForeignCurrencyForwardContractsBritishPoundSterlingMembersrt:ScenarioForecastMember2020-06-012020-08-310001013237fds:ForeignCurrencyForwardContractsPhilippinePesoMemberus-gaap:CashFlowHedgingMemberus-gaap:DesignatedAsHedgingInstrumentMember2019-08-310001013237fds:ForeignCurrencyForwardContractsPhilippinePesoMemberus-gaap:CashFlowHedgingMemberus-gaap:DesignatedAsHedgingInstrumentMember2018-08-310001013237fds:ForeignCurrencyForwardContractsIndianRupeeMemberus-gaap:CashFlowHedgingMemberus-gaap:DesignatedAsHedgingInstrumentMember2019-08-310001013237fds:ForeignCurrencyForwardContractsIndianRupeeMemberus-gaap:CashFlowHedgingMemberus-gaap:DesignatedAsHedgingInstrumentMember2018-08-310001013237fds:ForeignCurrencyForwardContractsEuroMemberus-gaap:CashFlowHedgingMemberus-gaap:DesignatedAsHedgingInstrumentMember2019-08-310001013237fds:ForeignCurrencyForwardContractsEuroMemberus-gaap:CashFlowHedgingMemberus-gaap:DesignatedAsHedgingInstrumentMember2018-08-310001013237fds:ForeignCurrencyForwardContractsBritishPoundSterlingMemberus-gaap:CashFlowHedgingMemberus-gaap:DesignatedAsHedgingInstrumentMember2019-08-310001013237fds:ForeignCurrencyForwardContractsBritishPoundSterlingMemberus-gaap:CashFlowHedgingMemberus-gaap:DesignatedAsHedgingInstrumentMember2018-08-310001013237us-gaap:ForeignExchangeContractMemberus-gaap:CashFlowHedgingMemberus-gaap:DesignatedAsHedgingInstrumentMember2019-08-310001013237us-gaap:ForeignExchangeContractMemberus-gaap:CashFlowHedgingMemberus-gaap:DesignatedAsHedgingInstrumentMember2018-08-31iso4217:PHPiso4217:INRiso4217:EURiso4217:GBP0001013237us-gaap:PrepaidExpensesAndOtherCurrentAssetsMemberus-gaap:ForeignExchangeContractMemberus-gaap:CashFlowHedgingMemberus-gaap:DesignatedAsHedgingInstrumentMember2019-08-310001013237us-gaap:PrepaidExpensesAndOtherCurrentAssetsMemberus-gaap:ForeignExchangeContractMemberus-gaap:CashFlowHedgingMemberus-gaap:DesignatedAsHedgingInstrumentMember2018-08-310001013237us-gaap:OtherAssetsMemberus-gaap:ForeignExchangeContractMemberus-gaap:CashFlowHedgingMemberus-gaap:DesignatedAsHedgingInstrumentMember2019-08-310001013237us-gaap:OtherAssetsMemberus-gaap:ForeignExchangeContractMemberus-gaap:CashFlowHedgingMemberus-gaap:DesignatedAsHedgingInstrumentMember2018-08-310001013237us-gaap:AccountsPayableAndAccruedLiabilitiesMemberus-gaap:ForeignExchangeContractMemberus-gaap:CashFlowHedgingMemberus-gaap:DesignatedAsHedgingInstrumentMember2019-08-310001013237us-gaap:AccountsPayableAndAccruedLiabilitiesMemberus-gaap:ForeignExchangeContractMemberus-gaap:CashFlowHedgingMemberus-gaap:DesignatedAsHedgingInstrumentMember2018-08-310001013237fds:DeferredRentAndOtherNoncurrentLiabilitiesMemberus-gaap:ForeignExchangeContractMemberus-gaap:CashFlowHedgingMemberus-gaap:DesignatedAsHedgingInstrumentMember2019-08-310001013237fds:DeferredRentAndOtherNoncurrentLiabilitiesMemberus-gaap:ForeignExchangeContractMemberus-gaap:CashFlowHedgingMemberus-gaap:DesignatedAsHedgingInstrumentMember2018-08-310001013237us-gaap:ForeignExchangeContractMemberus-gaap:CashFlowHedgingMemberus-gaap:DesignatedAsHedgingInstrumentMemberus-gaap:SellingGeneralAndAdministrativeExpensesMember2018-09-012019-08-310001013237us-gaap:ForeignExchangeContractMemberus-gaap:CashFlowHedgingMemberus-gaap:DesignatedAsHedgingInstrumentMemberus-gaap:SellingGeneralAndAdministrativeExpensesMember2017-09-012018-08-310001013237us-gaap:ForeignExchangeContractMemberus-gaap:CashFlowHedgingMemberus-gaap:DesignatedAsHedgingInstrumentMemberus-gaap:SellingGeneralAndAdministrativeExpensesMember2016-09-012017-08-310001013237us-gaap:ForeignExchangeContractMemberus-gaap:CashFlowHedgingMemberus-gaap:DesignatedAsHedgingInstrumentMember2018-09-012019-08-310001013237country:US2019-08-310001013237srt:EuropeMember2019-08-310001013237srt:AsiaPacificMember2019-08-310001013237country:US2018-08-310001013237srt:EuropeMember2018-08-310001013237srt:AsiaPacificMember2018-08-310001013237country:US2017-08-310001013237srt:EuropeMember2017-08-310001013237srt:AsiaPacificMember2017-08-310001013237country:GB2018-09-012019-08-310001013237country:GB2017-09-012018-08-310001013237country:GB2016-09-012017-08-310001013237fds:AllOtherEuropeanCountriesMember2018-09-012019-08-310001013237fds:AllOtherEuropeanCountriesMember2017-09-012018-08-310001013237fds:AllOtherEuropeanCountriesMember2016-09-012017-08-310001013237country:GB2019-08-310001013237country:GB2018-08-310001013237fds:AllOtherEuropeanCountriesMember2019-08-310001013237fds:AllOtherEuropeanCountriesMember2018-08-310001013237fds:BISAMTechnologiesMember2017-03-172017-03-170001013237fds:BISAMTechnologiesMembersrt:MinimumMember2017-03-170001013237fds:BISAMTechnologiesMemberus-gaap:SellingGeneralAndAdministrativeExpensesMember2016-09-012017-08-310001013237fds:BISAMTechnologiesMemberus-gaap:CustomerRelationshipsMember2017-03-172017-03-170001013237fds:BISAMTechnologiesMemberus-gaap:ComputerSoftwareIntangibleAssetMember2017-03-172017-03-170001013237fds:BISAMTechnologiesMemberus-gaap:TradeNamesMember2017-03-172017-03-170001013237fds:VermilionHoldingsLimitedMember2016-11-082016-11-080001013237fds:VermilionHoldingsLimitedMember2016-11-080001013237fds:VermilionHoldingsLimitedMemberus-gaap:SellingGeneralAndAdministrativeExpensesMember2016-09-012017-08-310001013237fds:VermilionHoldingsLimitedMember2016-11-082016-11-080001013237fds:VermilionHoldingsLimitedMemberus-gaap:CustomerRelationshipsMember2016-11-082016-11-080001013237fds:VermilionHoldingsLimitedMemberus-gaap:ComputerSoftwareIntangibleAssetMember2016-11-082016-11-080001013237fds:VermilionHoldingsLimitedMemberus-gaap:NoncompeteAgreementsMember2016-11-082016-11-080001013237fds:VermilionHoldingsLimitedMemberus-gaap:TradeNamesMember2016-11-082016-11-080001013237fds:DataContentMember2019-08-310001013237us-gaap:CustomerRelationshipsMember2019-08-310001013237us-gaap:ComputerSoftwareIntangibleAssetMember2019-08-310001013237us-gaap:NoncompeteAgreementsMember2019-08-310001013237us-gaap:TradeNamesMember2019-08-310001013237fds:DataContentMember2018-08-310001013237us-gaap:CustomerRelationshipsMember2018-08-310001013237us-gaap:ComputerSoftwareIntangibleAssetMember2018-08-310001013237us-gaap:NoncompeteAgreementsMember2018-08-310001013237us-gaap:TradeNamesMember2018-08-310001013237us-gaap:LeaseholdImprovementsMember2019-08-310001013237us-gaap:LeaseholdImprovementsMember2018-08-310001013237us-gaap:ComputerEquipmentMember2019-08-310001013237us-gaap:ComputerEquipmentMember2018-08-310001013237us-gaap:FurnitureAndFixturesMember2019-08-310001013237us-gaap:FurnitureAndFixturesMember2018-08-3100010132372019-05-172019-05-1700010132372019-05-162019-05-160001013237fds:RepurchaseOfCommonStockFromEmployeesMember2018-09-012019-08-310001013237fds:RepurchaseOfCommonStockFromEmployeesMember2017-09-012018-08-310001013237fds:RepurchaseOfCommonStockFromEmployeesMember2016-09-012017-08-310001013237fds:ShareRepurchaseProgramMember2018-09-012019-08-310001013237fds:ShareRepurchaseProgramMember2017-09-012018-08-310001013237fds:ShareRepurchaseProgramMember2016-09-012017-08-310001013237fds:ASRAgreementMember2018-09-012019-08-310001013237fds:ASRAgreementMember2017-09-012018-08-310001013237us-gaap:EmployeeStockOptionMember2018-09-012019-08-310001013237us-gaap:EmployeeStockOptionMember2017-09-012018-08-310001013237us-gaap:EmployeeStockOptionMember2016-09-012017-08-310001013237us-gaap:PerformanceSharesMember2018-09-012019-08-310001013237us-gaap:PerformanceSharesMember2017-09-012018-08-310001013237us-gaap:PerformanceSharesMember2016-09-012017-08-3100010132372018-01-312018-01-310001013237us-gaap:TreasuryStockMember2018-01-312018-01-310001013237us-gaap:CommonStockMember2018-01-312018-01-310001013237us-gaap:AdditionalPaidInCapitalMember2018-01-312018-01-310001013237us-gaap:RetainedEarningsMember2018-01-312018-01-3100010132372019-06-242019-06-240001013237us-gaap:RestrictedStockMember2018-09-012019-08-310001013237us-gaap:RestrictedStockMember2017-09-012018-08-3100010132372018-11-3000010132372018-09-012018-11-3000010132372019-02-2800010132372018-12-012019-02-2800010132372019-05-3100010132372019-03-012019-05-3100010132372019-06-012019-08-3100010132372017-11-3000010132372017-09-012017-11-3000010132372018-02-2800010132372017-12-012018-02-2800010132372018-05-3100010132372018-03-012018-05-3100010132372018-06-012018-08-310001013237us-gaap:EmployeeStockOptionMemberfds:LTIPMembersrt:MaximumMember2017-12-192017-12-190001013237us-gaap:EmployeeStockOptionMemberfds:LTIPMember2017-12-192017-12-190001013237us-gaap:EmployeeStockOptionMemberfds:LTIPMember2019-08-310001013237us-gaap:EmployeeStockOptionMemberfds:LTIPMember2018-09-012019-08-310001013237us-gaap:RestrictedStockMemberfds:LTIPMember2013-11-012013-11-010001013237us-gaap:EmployeeStockOptionMemberfds:LTIPMember2017-09-012018-08-310001013237us-gaap:EmployeeStockOptionMemberfds:LTIPMember2016-09-012017-08-310001013237fds:NonPerformanceBasedMember2016-09-012017-08-310001013237us-gaap:PerformanceSharesMember2016-09-012017-08-310001013237fds:NonEmployeeDirectorGrantMember2016-09-012017-08-310001013237fds:NonPerformanceBasedMember2017-09-012018-08-310001013237us-gaap:PerformanceSharesMember2017-09-012018-08-310001013237fds:NonEmployeeDirectorGrantMember2017-09-012018-08-310001013237fds:NonPerformanceBasedMember2018-09-012019-08-310001013237fds:NonEmployeeDirectorGrantMember2018-09-012019-08-310001013237fds:Range1Member2018-09-012019-08-310001013237fds:Range1Member2019-08-310001013237fds:Range2Member2018-09-012019-08-310001013237fds:Range2Member2019-08-310001013237fds:Range3Member2018-09-012019-08-310001013237fds:Range3Member2019-08-310001013237fds:Range4Member2018-09-012019-08-310001013237fds:Range4Member2019-08-310001013237fds:Range5Member2018-09-012019-08-310001013237fds:Range5Member2019-08-310001013237fds:Range6Member2018-09-012019-08-310001013237fds:Range6Member2019-08-310001013237fds:Range7Member2018-09-012019-08-310001013237fds:Range7Member2019-08-310001013237fds:Range8Member2018-09-012019-08-310001013237fds:Range8Member2019-08-310001013237us-gaap:EmployeeStockOptionMemberfds:LTIPMember2018-08-310001013237us-gaap:PerformanceSharesMemberfds:BISAMTechnologiesMember2017-06-012017-06-300001013237us-gaap:PerformanceSharesMemberfds:BISAMTechnologiesMemberus-gaap:ShareBasedCompensationAwardTrancheOneMember2017-06-012017-06-300001013237us-gaap:PerformanceSharesMemberfds:BISAMTechnologiesMemberus-gaap:ShareBasedCompensationAwardTrancheTwoMember2017-06-012017-06-300001013237us-gaap:PerformanceSharesMemberfds:BISAMTechnologiesMember2018-09-012019-08-310001013237us-gaap:RestrictedStockMemberfds:LTIPMember2018-09-012019-08-310001013237us-gaap:RestrictedStockMemberfds:LTIPMember2017-09-012018-08-310001013237us-gaap:RestrictedStockMemberfds:LTIPMember2016-09-012017-08-310001013237us-gaap:RestrictedStockMemberfds:LTIPMember2019-08-310001013237us-gaap:RestrictedStockMember2016-08-310001013237us-gaap:RestrictedStockMember2016-09-012017-08-310001013237us-gaap:RestrictedStockMember2017-08-310001013237us-gaap:RestrictedStockMember2018-08-310001013237us-gaap:RestrictedStockMember2019-08-310001013237us-gaap:RestrictedStockMemberfds:LTIPMemberus-gaap:ShareBasedCompensationAwardTrancheOneMember2013-11-012013-11-010001013237us-gaap:RestrictedStockMemberfds:LTIPMemberus-gaap:ShareBasedCompensationAwardTrancheOneMember2015-10-162015-10-160001013237us-gaap:RestrictedStockMemberfds:LTIPMemberus-gaap:ShareBasedCompensationAwardTrancheOneMember2017-06-302017-06-300001013237us-gaap:RestrictedStockMemberfds:LTIPMemberus-gaap:ShareBasedCompensationAwardTrancheTwoMember2015-10-162015-10-160001013237us-gaap:RestrictedStockMemberus-gaap:DisposalGroupDisposedOfBySaleNotDiscontinuedOperationsMemberfds:LTIPMember2016-09-012017-08-310001013237us-gaap:RestrictedStockMemberfds:LTIPMemberus-gaap:ShareBasedCompensationAwardTrancheThreeMember2015-10-162015-10-160001013237us-gaap:RestrictedStockMemberfds:LTIPMemberfds:SharebasedPaymentArrangementTrancheFourMember2015-10-162015-10-160001013237us-gaap:RestrictedStockMemberfds:MarketResearchBusinessMemberfds:LTIPMember2017-09-012018-08-310001013237us-gaap:RestrictedStockMemberfds:LTIPMemberus-gaap:ShareBasedCompensationAwardTrancheTwoMember2013-11-012013-11-010001013237us-gaap:RestrictedStockMemberfds:LTIPMember2015-02-092015-02-090001013237us-gaap:RestrictedStockMemberfds:LTIPMemberus-gaap:ShareBasedCompensationAwardTrancheOneMember2015-02-092015-02-090001013237us-gaap:RestrictedStockMemberfds:LTIPMember2017-06-302017-06-300001013237us-gaap:RestrictedStockMemberfds:LTIPMemberus-gaap:ShareBasedCompensationAwardTrancheTwoMember2017-06-302017-06-300001013237us-gaap:RestrictedStockMemberfds:LTIPMemberus-gaap:ShareBasedCompensationAwardTrancheThreeMember2017-06-302017-06-300001013237us-gaap:RestrictedStockMemberus-gaap:DisposalGroupDisposedOfBySaleNotDiscontinuedOperationsMemberfds:LTIPMember2018-09-012019-08-310001013237fds:LTIPMember2016-08-310001013237fds:DirectorPlanMember2016-08-310001013237fds:NonPerformanceBasedMemberfds:LTIPMember2016-09-012017-08-310001013237fds:NonPerformanceBasedMemberfds:DirectorPlanMember2016-09-012017-08-310001013237us-gaap:PerformanceSharesMemberfds:LTIPMember2016-09-012017-08-310001013237us-gaap:PerformanceSharesMemberfds:DirectorPlanMember2016-09-012017-08-310001013237fds:NonEmployeeDirectorGrantMemberfds:LTIPMember2016-09-012017-08-310001013237fds:NonEmployeeDirectorGrantMemberfds:DirectorPlanMember2016-09-012017-08-310001013237us-gaap:RestrictedStockMemberfds:DirectorPlanMember2016-09-012017-08-310001013237fds:LTIPMember2016-09-012017-08-310001013237fds:DirectorPlanMember2016-09-012017-08-310001013237fds:LTIPMember2017-08-310001013237fds:DirectorPlanMember2017-08-310001013237fds:LTIPMember2017-09-012018-08-310001013237fds:DirectorPlanMember2017-09-012018-08-310001013237fds:NonPerformanceBasedMemberfds:LTIPMember2017-09-012018-08-310001013237fds:NonPerformanceBasedMemberfds:DirectorPlanMember2017-09-012018-08-310001013237us-gaap:PerformanceSharesMemberfds:LTIPMember2017-09-012018-08-310001013237us-gaap:PerformanceSharesMemberfds:DirectorPlanMember2017-09-012018-08-310001013237fds:NonEmployeeDirectorGrantMemberfds:LTIPMember2017-09-012018-08-310001013237fds:NonEmployeeDirectorGrantMemberfds:DirectorPlanMember2017-09-012018-08-310001013237us-gaap:RestrictedStockMemberfds:DirectorPlanMember2017-09-012018-08-310001013237fds:LTIPMember2018-08-310001013237fds:DirectorPlanMember2018-08-310001013237fds:NonPerformanceBasedMemberfds:LTIPMember2018-09-012019-08-310001013237fds:NonPerformanceBasedMemberfds:DirectorPlanMember2018-09-012019-08-310001013237us-gaap:RestrictedStockMemberfds:DirectorPlanMember2018-09-012019-08-310001013237fds:LTIPMember2018-09-012019-08-310001013237fds:DirectorPlanMember2018-09-012019-08-310001013237fds:LTIPMember2019-08-310001013237fds:DirectorPlanMember2019-08-3100010132372018-09-102019-08-3000010132372019-08-3000010132372018-09-012019-08-3000010132372017-09-012018-08-3000010132372018-08-3000010132372016-09-012017-08-3000010132372016-08-012017-08-310001013237fds:NonPerformanceBasedMember2018-09-012018-11-300001013237fds:NonPerformanceBasedMember2018-12-012019-02-280001013237fds:NonPerformanceBasedMember2019-03-012019-05-310001013237fds:NonPerformanceBasedMember2019-06-012019-08-310001013237fds:NonPerformanceBasedMember2017-09-012017-11-300001013237fds:NonPerformanceBasedMember2017-12-012018-02-280001013237fds:NonPerformanceBasedMember2018-06-012018-08-310001013237us-gaap:PerformanceSharesMember2018-06-012018-08-310001013237us-gaap:EmployeeStockOptionMember2018-06-012018-08-310001013237fds:NonPerformanceBasedMember2016-09-012016-11-300001013237us-gaap:PerformanceSharesMember2016-09-012016-11-300001013237us-gaap:EmployeeStockOptionMember2016-09-012016-11-300001013237us-gaap:PerformanceSharesMember2016-12-012017-02-280001013237us-gaap:EmployeeStockOptionMember2016-12-012017-02-280001013237fds:NonPerformanceBasedMember2017-03-012017-05-310001013237us-gaap:EmployeeStockOptionMember2017-03-012017-05-310001013237fds:NonPerformanceBasedMember2017-06-012017-08-310001013237fds:PerformanceBasedMember2017-06-012017-08-310001013237us-gaap:EmployeeStockOptionMember2017-06-012017-08-310001013237srt:MinimumMember2018-09-012019-08-310001013237srt:MaximumMember2018-09-012019-08-310001013237srt:MinimumMember2017-09-012018-08-310001013237srt:MaximumMember2017-09-012018-08-310001013237srt:MinimumMember2016-09-012017-08-310001013237srt:MaximumMember2016-09-012017-08-310001013237fds:DirectorPlanMember2019-01-152019-01-150001013237fds:DirectorPlanMember2018-01-122018-01-120001013237fds:DirectorPlanMember2017-01-132017-01-130001013237fds:DirectorPlanMemberfds:MalcolmFrankMember2017-01-132017-01-130001013237us-gaap:RestrictedStockMember2018-09-012018-11-300001013237us-gaap:RestrictedStockMember2018-12-012019-02-280001013237us-gaap:RestrictedStockMember2019-03-012019-05-310001013237us-gaap:RestrictedStockMember2019-06-012019-08-310001013237us-gaap:RestrictedStockMember2017-09-012017-11-300001013237us-gaap:RestrictedStockMember2017-12-012018-02-280001013237us-gaap:RestrictedStockMember2018-03-012018-05-310001013237us-gaap:RestrictedStockMember2018-06-012018-08-310001013237us-gaap:RestrictedStockMember2016-09-012016-11-300001013237us-gaap:RestrictedStockMember2016-12-012017-02-280001013237us-gaap:RestrictedStockMember2017-03-012017-05-310001013237us-gaap:RestrictedStockMember2017-06-012017-08-310001013237fds:The2008EmployeeStockPurchasePlanMember2018-09-012019-08-310001013237fds:The2008EmployeeStockPurchasePlanMember2017-09-012018-08-310001013237fds:The2008EmployeeStockPurchasePlanMember2016-09-012017-08-310001013237fds:The2008EmployeeStockPurchasePlanMember2018-09-012019-08-310001013237fds:The2008EmployeeStockPurchasePlanMember2017-09-012018-08-310001013237fds:The2008EmployeeStockPurchasePlanMember2016-09-012017-08-31utr:M00010132372017-09-012018-05-3100010132372017-01-012017-12-3100010132372018-01-012018-12-310001013237us-gaap:DomesticCountryMemberus-gaap:InternalRevenueServiceIRSMember2018-09-012019-08-310001013237us-gaap:StateAndLocalJurisdictionMember2018-09-012019-08-310001013237us-gaap:ForeignCountryMemberus-gaap:HerMajestysRevenueAndCustomsHMRCMember2018-09-012019-08-310001013237us-gaap:ForeignCountryMemberus-gaap:MinistryOfTheEconomyFinanceAndIndustryFranceMember2018-09-012019-08-310001013237us-gaap:ForeignCountryMemberus-gaap:FederalMinistryOfFinanceGermanyMember2018-09-012019-08-310001013237fds:The2017RevolvingCreditFacilityMember2019-08-310001013237fds:The2017RevolvingCreditFacilityMember2018-08-310001013237fds:The2019RevolvingCreditFacilityMember2019-08-310001013237fds:The2019RevolvingCreditFacilityMember2018-08-310001013237fds:The2019RevolvingCreditFacilityMemberfds:PNCBankNationalAssociationsMember2019-03-290001013237fds:The2019RevolvingCreditFacilityMemberfds:PNCBankNationalAssociationsMember2019-08-310001013237fds:The2019RevolvingCreditFacilityMemberfds:PNCBankNationalAssociationsMember2019-03-012019-05-310001013237fds:The2017RevolvingCreditFacilityMemberfds:PNCBankNationalAssociationsMember2019-08-310001013237fds:The2019RevolvingCreditFacilityMemberfds:PNCBankNationalAssociationsMemberus-gaap:LondonInterbankOfferedRateLIBORMember2018-09-012019-08-310001013237srt:WeightedAverageMember2019-08-310001013237srt:WeightedAverageMember2018-08-310001013237fds:The2019RevolvingCreditFacilityMemberfds:PNCBankNationalAssociationsMember2019-03-310001013237fds:The2017RevolvingCreditFacilityMemberfds:PNCBankNationalAssociationsMember2017-03-170001013237fds:The2017RevolvingCreditFacilityMemberfds:PNCBankNationalAssociationsMemberus-gaap:LondonInterbankOfferedRateLIBORMember2017-03-172017-03-170001013237fds:DeferredRentMember2019-08-310001013237fds:DeferredRentMember2018-08-310001013237us-gaap:LondonInterbankOfferedRateLIBORMember2018-09-012019-08-310001013237us-gaap:RevolvingCreditFacilityMemberfds:TheLoanMember2018-09-012019-08-310001013237us-gaap:RevolvingCreditFacilityMemberfds:TheLoanMember2017-09-012018-08-310001013237us-gaap:RevolvingCreditFacilityMemberfds:TheLoanMember2018-09-102019-08-310001013237fds:SubscriptionRevenueMember2018-09-012019-08-310001013237fds:DataCostsMemberus-gaap:SupplierConcentrationRiskMember2019-08-310001013237fds:DataCostsMemberus-gaap:SupplierConcentrationRiskMember2018-09-012019-08-31
UNITED STATES
SECURITIES AND EXCHANGE COMMISSION
WASHINGTON, D.C. 20549
Form 10-K
| ☒ |
Annual Report pursuant to Section 13 or 15(d) of the Securities Exchange Act of 1934 |
For the fiscal year ended August 31, 2019
| ☐ |
Transition Report pursuant to Section 13 or 15(d) of the Securities Exchange Act of 1934 |
For the transition period from to
Commission File Number: 1-11869
FACTSET RESEARCH SYSTEMS INC.
(Exact name of Registrant as specified in its charter)

| Delaware (State or other jurisdiction of incorporation or organization) |
|
13-3362547 (I.R.S. Employer Identification No.) |
601 Merritt 7, Norwalk, Connecticut 06851
(Address of principal executive office, including zip code)
Registrant’s telephone number, including area code: (203) 810-1000
Securities registered pursuant to Section 12(b) of the Act:
| Title of each class |
Trading Symbols(s) |
Name of each exchange on which registered |
| Common Stock, $0.01 Par Value |
FDS |
New York Stock Exchange NASDAQ Global Select Market |
Indicate by check mark if the registrant is a well-known seasoned issuer, as defined in Rule 405 of the Securities Act.
Yes ☒ No ☐
Indicate by check mark if the registrant is not required to file reports pursuant to Section 13 or Section 15(d) of the Act.
Yes ☐ No ☒
Indicate by check mark whether the registrant (1) has filed all reports required to be filed by Section 13 or 15(d) of the Securities Exchange Act of 1934 during the preceding 12 months (or for such shorter period that the registrant was required to file such reports), and (2) has been subject to such filing requirements for the past 90 days. Yes ☒ No ☐
Indicate by check mark whether the registrant has submitted electronically, every Interactive Data File required to be submitted pursuant to Rule 405 of Regulation S-T (§232.405 of this chapter) during the preceding 12 months (or for such shorter period that the registrant was required to submit such files). Yes ☒ No ☐
Indicate by check mark if disclosure of delinquent filers pursuant to Item 405 of Regulation S-K (§229.405 of this chapter) is not contained herein, and will not be contained, to the best of registrant's knowledge, in definitive proxy or information statements incorporated by reference in Part III of this Form 10-K or any amendment to this Form 10-K. ☐
Indicate by check mark whether the registrant is a large accelerated filer, an accelerated filer, a non-accelerated filer, a smaller reporting company, or emerging growth company. See the definitions of “large accelerated filer,” “accelerated filer”, “smaller reporting company” and “emerging growth company” in Rule 12b-2 of the Exchange Act.
| Large accelerated filer ☒ |
Accelerated filer ☐ |
| Non-accelerated filer ☐ |
Smaller reporting company ☐ |
| |
Emerging growth company ☐ |
If an emerging growth company, indicate by check mark if the registrant has elected not to use the extended transition period for complying with any new or revised financial accounting standards provided pursuant to Section 13(a) of the Exchange Act.☐
Indicate by check mark whether the registrant is a shell company (as defined in Rule 12b-2 of the Act). Yes ☐ No ☒
The aggregate market value of the registrant’s common stock held by non-affiliates of the registrant based upon the closing price of a share of the registrant’s common stock on February 28, 2019, the last business day of the registrant’s most recently completed second fiscal quarter, as reported by the New York Stock Exchange on that date, was $8,808,676,952.
The number of shares outstanding of the registrant’s common stock, as of October 24, 2019, was 37,944,709.
DOCUMENTS INCORPORATED BY REFERENCE
Portions of the registrant’s definitive Proxy Statement dated October 30, 2019, for the 2019 Annual Meeting of Stockholders to be held on December 17, 2019, are incorporated by reference into Part III of this Report on Form 10-K where indicated.
FACTSET RESEARCH SYSTEMS INC.
FORM 10-K
For The Fiscal Year Ended August 31, 2019
| |
|
Page |
| PART I |
|
|
| ITEM 1. |
Business |
3 |
| ITEM 1A. |
Risk Factors |
11 |
| ITEM 1B. |
Unresolved Staff Comments |
16 |
| ITEM 2. |
Properties |
16 |
| ITEM 3. |
Legal Proceedings |
18 |
| ITEM 4. |
Mine Safety Disclosures |
18 |
| PART II |
|
|
| ITEM 5. |
Market for Registrant’s Common Equity, Related Stockholder Matters and Issuer Purchases of Equity Securities |
19 |
| ITEM 6. |
Selected Financial Data |
21 |
| ITEM 7. |
Management’s Discussion and Analysis of Financial Condition and Results of Operations |
23 |
| ITEM 7A. |
Quantitative and Qualitative Disclosures About Market Risk |
46 |
| ITEM 8. |
Financial Statements and Supplementary Data |
49 |
| ITEM 9. |
Changes in and Disagreements with Accountants on Accounting and Financial Disclosure |
97 |
| ITEM 9A. |
Controls and Procedures |
97 |
| ITEM 9B. |
Other Information |
97 |
| PART III |
|
|
| ITEM 10. |
Directors, Executive Officers and Corporate Governance |
98 |
| ITEM 11. |
Executive Compensation |
98 |
| ITEM 12. |
Security Ownership of Certain Beneficial Owners and Management and Related Stockholder Matters |
98 |
| ITEM 13. |
Certain Relationships and Related Transactions, and Director Independence |
99 |
| ITEM 14. |
Principal Accounting Fees and Services |
99 |
| PART IV |
|
|
| ITEM 15. |
Exhibits, Financial Statement Schedules |
100 |
| ITEM 16. |
Form 10-K Summary |
101 |
| Signatures |
|
102 |
Part I
ITEM 1. BUSINESS
Business Overview
FactSet Research Systems Inc. (the “Company” or “FactSet”) is a global provider of integrated financial information, analytical applications and industry-leading services for the investment and corporate communities. For over 40 years, global financial professionals have utilized our content and multi-asset class solutions across each stage of the investment process. Our goal is to provide a seamless user experience spanning idea generation, research, portfolio construction, trade execution, performance measurement, risk management, reporting, and portfolio analysis, in which we serve the front, middle, and back offices to drive productivity and improved performance. Our flexible, open data and technology solutions can be implemented both across the investment portfolio lifecycle or as standalone components serving different workflows in the organization. We are focused on growing our business throughout each of our three segments, the U.S., Europe, and Asia Pacific. We primarily deliver insight and information through the workflow solutions of Research, Analytics and Trading, Content and Technology Solutions and Wealth.
We currently serve financial professionals, which include portfolio managers, investment research professionals, investment bankers, risk and performance analysts, wealth advisors, and corporate clients. We provide both insights on global market trends and intelligence on companies and industries, as well as capabilities to monitor portfolio risk and performance and to execute trades. We combine dedicated client service with open and flexible technology offerings, such as a comprehensive data marketplace, a configurable mobile and desktop platform, digital portals and application programming interface (“APIs”). Our revenue is primarily derived from subscriptions to products and services such as workstations, analytics, enterprise data, research management, and trade execution.
Corporate History
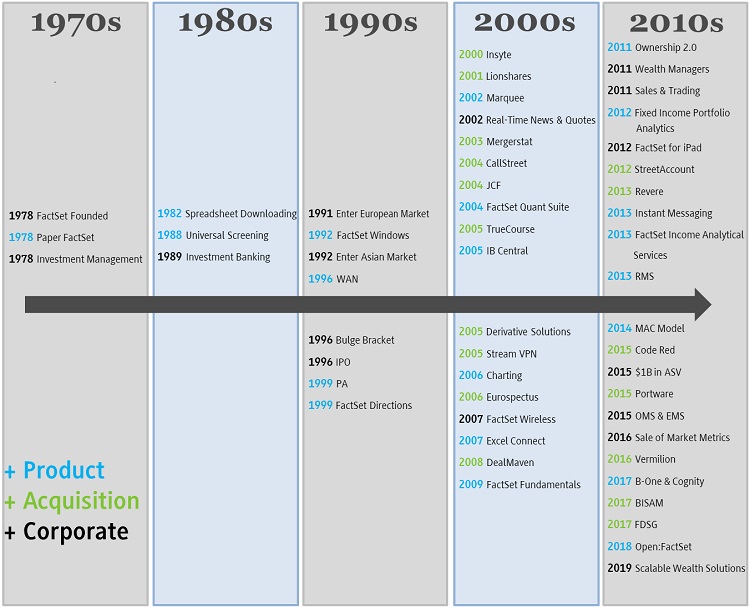
FactSet was founded in 1978 and has been publicly held since 1996. We are dual listed on the New York Stock Exchange (“NYSE”) and the NASDAQ Stock Market (“NASDAQ”) under the symbol “FDS.” Fiscal 2019 marked our 41st year of operations and while much has changed in the market and in technology, our focus has always been to provide best-in-class products and exceptional client service.
The following timeline depicts the Company’s history since our founding in 1978:
Business Strategy
As a premier financial solutions provider for the global financial community, we provide workflow solutions and leading analytical applications across the investment lifecycle to create an open and scalable platform. We bring the front, middle and back offices together to drive productivity and performance throughout the portfolio lifecycle. Our strategy is focused on growing our business throughout each of our three segments, the U.S., Europe, and Asia Pacific. We believe this geographical strategy alignment helps us better manage our resources and concentrate on markets that demand our products. To execute on our strategy of broad-based growth across each geographical segment, we continue to look at ways to create value for our clients by offering data, products and analytical applications within our workflow solutions of Research, Analytics and Trading, Wealth, and Content and Technology Solutions.
Research Solutions
Our Research Solutions workflow (“Research”) focuses on company analysis, idea generation, and research management. The tools within Research provide solutions to analyze public and private companies, generate ideas and discover opportunities with our proprietary data. Research also allows users to monitor the global markets, to gain industry and market insights, and to collaborate on and share information across teams. FactSet combines the global coverage, deep history, and transparency with over 1,000 FactSet-sourced and third-party databases integrated in one flexible platform.
Analytics and Trading Solutions
Our Analytics and Trading Solutions workflow (“Analytics and Trading”) addresses processes around portfolio analytics, risk management and performance measurement and attribution. Analytics and Trading also focuses on client reporting, portfolio construction, trade execution and order management. The applications within Analytics and Trading are modularized and deployed to fulfill both targeted and holistic needs in the front and middle offices. Analytics and Trading integrates our clients’ proprietary data along with FactSet and third-party content to bring actionable insights to the portfolio management process. Analytics and Trading tools are accessible through a variety of mediums, including the FactSet workstation and application programming interfaces.
Wealth Solutions
Our Wealth Solutions workflow (“Wealth”) is specific to the wealth management industry and creates offerings that enable wealth professionals across an entire enterprise, including home office, advisory, and client engagement. Wealth empowers wealth managers to demonstrate value to clients and prospects while protecting and growing their assets with FactSet’s combined solution set of portfolio analytics, market monitoring tools, multi-asset class research and customized client facing digital solutions. Our Research Management Solutions products enable our wealth management clients to increase collaboration and communication between Home Office and Advisory functions within the firm and deliver consistent and scalable messaging to the clients of the advisor.
Content and Technology Solutions
Our Content and Technology Solutions workflow (“CTS”) is focused on delivering value to our clients in the way they want to consume it. Our goal is to reduce the number of customizations by standardizing and bundling our proprietary data into data feeds. Whether a client needs market, company, or alternative data, our data delivery services provide normalized data through APIs and a direct delivery of local copies of standard data feeds. Our symbology links and aggregates a variety of content sources to ensure consistency, transparency, and data integrity across a client’s business.
FactSet Clients
Buy-side
As buy-side clients continue to shift towards multi-asset class investment strategies, we are positioned to be a partner in the space, given our ability to provide enterprise-wide solutions across their entire workflow. We provide solutions across asset classes and at nearly every stage of the investment process by utilizing our workstations, analytics, proprietary content, data feeds and portfolio services. Buy-side clients include portfolio managers, analysts, traders, wealth managers, performance teams and risk and compliance teams at a variety of firms, such as traditional asset managers, wealth advisors, corporations, hedge funds, insurance companies, plan sponsors and fund of funds.
The buy-side annual subscription value (“ASV”) growth rate for fiscal 2019 was 4.8%. Buy-side clients accounted for 83.7% of ASV as of August 31, 2019.
Sell-side
FactSet delivers comprehensive solutions to sell-side clients including workstation, proprietary and third-party content, productivity tools for Microsoft® Office, FactSet Web and Mobile, and FactSet Partners for research authoring and publishing. Our focus remains on expanding the depth of content offered and increasing workflow efficiency for investment banking, private equity, corporate and research firms.
The sell-side ASV growth rate for fiscal 2019 was 6.3%. Sell-side clients accounted for 16.3% of ASV as of August 31, 2019.
Client Subscription Growth
During fiscal 2019, we added 432 net new clients, increasing the number of clients by 8.4% over the prior year. In the first quarter of fiscal 2019, we changed our client count definition to include clients from the April 2017 acquisition of FDSG. The prior year client count was not restated to reflect this change. We added 34,925 net new users during fiscal 2019, leading to a healthy progression in the number of users in both our buy-side and sell-side clients.
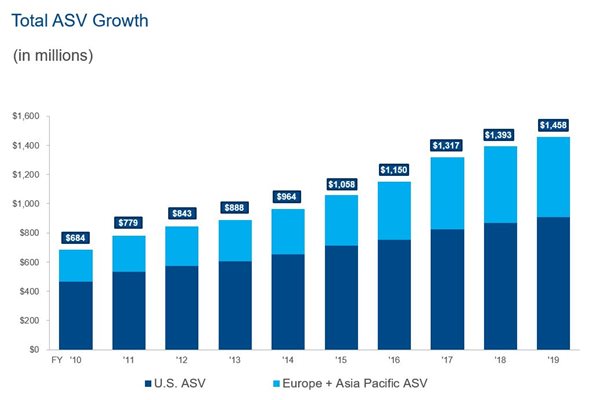
ASV Growth
ASV at any given point in time represents the forward-looking revenue for the next twelve months from all subscription services currently being supplied to clients and excludes professional service fees, which are not subscription-based. Organic ASV excludes ASV from acquisitions and dispositions completed within the last 12 months, and the effects of foreign currency, and professional services fees.
As of August 31, 2019, ASV was $1.46 billion, up from $1.39 billion a year ago. As of August 31, 2019, organic ASV was $1.46 billion, up $70.2 million or 5.0% from a year ago. This increase in organic ASV was due to growth across all of our geographic segments with the majority of growth in the U.S., followed by Asia Pacific and Europe. ASV growth from our workflow solutions was primarily driven by Analytics and Trading, CTS and Wealth.
The following chart provides a snapshot of FactSet’s historic ASV growth:
Financial Information on Geographic Areas
Operating segments are defined as components of an enterprise that have the following characteristics: (i) it engages in business activities from which it may earn revenues and incur expenses, (ii) its operating results are regularly reviewed by the company’s chief operating decision maker to make decisions about resources to be allocated to the segment and assess its performance, and (iii) its discrete financial information is available. Executive management, along with the CEO, constitute our chief operating decision making group (“CODMG”). Executive management consists of certain executives who directly report to the CEO, consisting of the Chief Financial Officer, Chief Technology and Product Officer, Global Head of Sales and Client Solutions, General Counsel, Chief Human Resources Officer and Head of Analytics and Trading. The CODMG reviews financial information at the operating segment level and is responsible for making decisions about resources allocated amongst the operating segments based on actual results.
Our operating segments are aligned with how the Company, including its CODMG, manages the business and the demographic markets in which it serves. Our internal financial reporting structure is based on three segments: the U.S., Europe and Asia Pacific. We believe this alignment helps to better manage the business and serve client needs, as each segment requires financial and economic information specific to their respective markets. Our primary functional groups within the U.S., Europe, and Asia Pacific segments include sales, consulting, data collection, product development and software engineering, which provide global financial and economic information to investment managers, investment banks and other financial services professionals.
The U.S. segment serves investment professionals, including financial institutions throughout the Americas. The Europe and Asia Pacific segments serve investment professionals located throughout Europe and Asia Pacific, respectively. Financial information, including revenues, operating income and long-lived assets related to our operations in each geographic area are presented in Note 8, Segment Information, and in the Notes to the Company’s Consolidated Financial Statements included in Item 8.
The U.S. segment has offices in 15 locations, within 13 states throughout the U.S., including our corporate headquarters in Norwalk, Connecticut, as well as two additional offices located in Brazil and Canada. The European segment maintains office locations in Bulgaria, UAE (Dubai), England, France, Germany, Italy, Latvia, Luxembourg, the Netherlands, South Africa, Spain, and Switzerland. The Asia Pacific segment has office locations in Australia, Hong Kong, China, India, Japan, the Philippines, and Singapore. Segment revenue reflects direct sales to clients based in their respective geographic locations. Each segment records compensation expense (including stock-based compensation), amortization of intangible assets, depreciation of furniture and fixtures, amortization of leasehold improvements, communication costs, professional fees, rent expense, travel, office and other direct expenses.
Expenditures associated with our data centers, third-party data costs and corporate headquarters charges are recorded by the U.S. segment and are not allocated to the other segments. The content collection centers, located in India, the Philippines, and Latvia, benefit all our operating segments, and thus the expenses incurred at these locations are allocated to each segment based on a percentage of revenue.
The following charts depict revenue related to our reportable segments.
Talent
We have built a collaborative culture that recognizes and rewards innovation and offers employees a variety of opportunities and experiences. Our employees are critical to our success and are the reason we continue to execute at a high level. We believe our continued focus on making employee engagement a top priority will help us provide high quality insights and information to clients globally.
As of August 31, 2019, our employee headcount was 9,681, an increase of 1.1% in the last twelve months. Of our total employees, 2,351 are in the U.S., 1,282 in Europe and 6,048 in the Asia Pacific segment. In order to optimize productivity, we have invested in expanding our footprint and talent pool in India and the Philippines, where we now have a combined workforce of approximately 5,800 people. As of August 31, 2019, approximately 430 FactSet employees within certain French and German subsidiaries were represented by mandatory works councils, an amount consistent with fiscal 2018. No other employees are represented by collective bargaining agreements.
In December 2018, we appointed Daniel Viens as Chief Human Resources Officer. In May 2019, we announced that John W. Wiseman, the Company’s Global Head of Sales and Client Solutions, would step down from his position on June 1, 2019, remaining at the company until August 31, 2019 to assist during the transition. In the same announcement, effective June 1, 2019, we appointed Franck A.R. Gossieaux as the Company's new Global Head of Sales and Client Solutions.
Third-Party Content
We aggregate content from over 1,000 third-party data suppliers, news sources, exchanges, brokers and contributors into our own dedicated single online service, which the client accesses to perform their analysis. We license content from premier providers of major global exchanges and data providers. We seek to maintain contractual relationships with a minimum of two content providers for each major type of financial data, though certain data sets on which we rely have a limited number of suppliers. We make every effort to assure that, where reasonable, alternative sources are available. We are not dependent on any one third-party data supplier in order to meet the needs of our clients. We have entered into third-party content agreements of varying lengths, which in some cases can be terminated on one year’s notice, at predefined dates, and in other cases on shorter notice. No single vendor or data supplier represented more than 10% of FactSet's total data costs during fiscal 2019, with the exception for one vendor, which is a supplier of risk models and portfolio optimizer data to FactSet and represented 11% of FactSet’s data costs in fiscal 2019.
Data Centers
Our business is dependent on our ability to process substantial volumes of data and transactions rapidly and efficiently on our networks and systems. Our global technology infrastructure supports our operations and is designed to facilitate the reliable and efficient processing and delivery of data and analytics to our clients. Our data centers contain multiple layers of redundancy to enhance system performance, including maintaining, processing and storing data at multiple data centers. User connections are load balanced between data centers. In the event of a site failure, equipment problem or localized disaster, the remaining centers have the capacity to handle the additional load. We continue to be focused on maintaining a global technological infrastructure that allows us to support our growing business.
We are embarking on a set of programs that will increasingly move our systems and applications to cloud computing platforms. We continue to operate fully redundant data centers in both Virginia and New Jersey in the U.S. that can handle our entire client capacity. In addition, select workloads are migrating to diverse cloud computing regions utilizing premier, market-leading Cloud providers.
The Competitive Landscape
We are a part of the financial information services industry, providing accurate financial information and workflow solutions to the global investment community. This extremely competitive market is comprised of both large, well-capitalized companies and smaller, niche firms including market data suppliers, news and information providers and many of the content providers that supply us with financial information included in the FactSet workstation. Our largest competitors are Bloomberg L.P., Refinitiv (formerly part of Thomson Reuters), and S&P Global Market Intelligence. Other competitors and competitive products include online database suppliers and integrators and their applications, such as MSCI Inc., Morningstar Inc., BlackRock Solutions and RIMES Technologies Corporation. Many of these firms offer products or services which are similar to those we sell. Our development of robust sets of proprietary content combined with our news and quotes offering have resulted in more direct competition with the largest financial data providers.
Despite competing products and services, we enjoy high barriers to entry and believe it would be difficult for another vendor to quickly replicate the extensive databases we currently offer. Through our in-depth analytics and client service, we believe we can offer clients a more comprehensive solution with one of the broadest sets of functionalities, through a desktop or mobile user interface or through a standardized or bespoke data feed. In addition, our applications, including our client support and service offerings, are entrenched in the workflow of many financial professionals given the downloading functions and portfolio analysis/screening capabilities offered. We are entrusted with significant amounts of our clients' own proprietary data, including portfolio holdings. As a result, our products have become central to our clients’ investment analysis and decision-making.
Intellectual Property
We have registered trademarks and copyrights for many of our products and services and will continue to evaluate the registration of additional trademarks and copyrights as appropriate. We enter into confidentiality agreements with our employees, clients, data suppliers and vendors. We seek to protect our workflow solutions, documentation and other written materials under trade secret, copyright and patent laws. While we do not believe we are dependent on any one of our intellectual property rights, we do rely on the combination of intellectual property rights and other measures to protect our proprietary rights. Despite these efforts, existing intellectual property laws may afford only limited protection.
Research and Product Development Costs
A key aspect of our growth strategy is to enhance our existing products and applications by making them faster with more reliable data. We strive to rapidly adopt new technology that can improve our products and services. At FactSet we do not have a separate research and product development department, but rather our product development and engineering departments work closely with our strategists, product managers, sales and other client-facing specialists to identify areas of improvement to provide increased value to our clients. Research and product development costs relate to the salary and benefits for our product development, software engineering and technical support staff. These costs are expensed as incurred within our cost of services as employee compensation. We intend to continue to invest in the development of new products and enhancements that will allow us to respond quickly to market changes and efficiently meet the needs of our clients. We incurred research and product development costs of $214.7 million, $217.1 million and $215.0 million during fiscal years 2019, 2018 and 2017, respectively.
Government Regulation
FactSet is subject to reporting requirements, disclosure obligations and other recordkeeping requirements of the Securities and Exchange Commission (“SEC”) and the various local authorities that regulate each location in which we operate. The Company’s P.A.N. Securities, LP, is a member of the Financial Industry Regulatory Authority, Inc. and is a registered broker-dealer under Section 15 of the Securities Exchange Act of 1934. P.A.N. Securities, LP, as a registered broker-dealer, is subject to Rule 15c3-1 under the Securities Exchange Act of 1934, which requires that the Company maintain minimum net capital requirements. The Company claims exemption under Rule 15c3-3(k)(2)(i).
Corporate Contact Information
FactSet was founded as a Delaware corporation in 1978, and its principal executive office is in Norwalk, Connecticut.
Mailing address of the Company’s headquarters: 601 Merritt 7, Norwalk, CT 06851 prior to January 1, 2020, and 45 Glover Avenue Norwalk, CT 06850, thereafter
Telephone number: +1 (203) 810-1000
Website address: www.factset.com
Available Information
Through the Investor Relations section of FactSet’s website (https://investor.factset.com), we make available the following filings as soon as practicable after they are electronically filed with, or furnished to, the SEC: the Company’s Annual Report on Form 10-K, Quarterly Reports on Form 10-Q, Current Reports on Form 8-K, Proxy Statements for the annual stockholder meetings, Reports on Forms 3, 4 and 5, and any amendments to those reports filed or furnished pursuant to Section 13(a) or 15(d) of the Securities Exchange Act of 1934, as amended. All such filings are available free of charge.
Additionally, we broadcast live our quarterly earnings calls via the investor relations section of our website. We also provide notifications of news or announcements regarding our financial performance, including SEC filings, investor events, press and earnings releases, and blogs as part of our investor relations website. The contents of this website section are not intended to be incorporated by reference into this Report on Form 10-K or in any other report or document the Company files and any reference to this section of our website is intended to be inactive textual references only.
In addition, the FactSet Code of Business Conduct and Ethics is posted in the Investor Relations section of the Company’s website. The same information is available in print to any stockholder who submits a written request to the Company’s Investor Relations department. Any amendments to or waivers of such code that are required to be publicly disclosed by the applicable exchange rules or the SEC will be posted on our website. The Corporate Governance Guidelines and the charters of each of the committees of the Company’s Board of Directors, including the Audit Committee, Compensation and Talent Committee, and Nominating and Corporate Governance Committee are available on the Investor Relations section of our website. The same information is available in print, free of charge, to any stockholder who submits a written request to our Investor Relations department.
Executive Officers of the Registrant
The following table shows FactSet’s current executive officers:
| Name of Officer |
Age |
Office Held with the Company |
Officer Since |
| F. Philip Snow |
55 |
Chief Executive Officer |
2014 |
| Helen L. Shan |
52 |
Executive Vice President and Chief Financial Officer |
2018 |
| Franck A.R. Gossieaux |
49 |
Executive Vice President, Global Head of Sales and Client Solutions |
2019 |
| Rachel R. Stern |
54 |
Executive Vice President, General Counsel and Secretary |
2009 |
| Gene D. Fernandez |
52 |
Executive Vice President, Chief Technology and Product Officer |
2017 |
| Robert J. Robie |
41 |
Executive Vice President, Head of Analytics and Trading |
2018 |
| Daniel Viens |
62 |
Senior Vice President, Chief Human Resources Officer |
2018 |
F. Philip Snow – Chief Executive Officer. Mr. Snow was named Chief Executive Officer effective July 1, 2015. Prior to that, Mr. Snow held the title of President. He began his career at FactSet in 1996 as a Consultant, before moving to Asia to hold positions in the Tokyo and Sydney offices. Following his move back to the U.S. in 2000, Mr. Snow held various sales leadership roles prior to assuming the role of Senior Vice President, Director of U.S. Investment Management Sales in 2013. Mr. Snow received a Bachelor of Arts in Chemistry from the University of California at Berkeley and a Master of International Management from the Thunderbird School of Global Management. He has earned the right to use the Chartered Financial Analyst designation.
Helen L. Shan – Executive Vice President and Chief Financial Officer. Ms. Shan joined FactSet in September 2018 from Marsh and McLennan Companies, where she was CFO for Mercer, a professional services firm. During her time at Mercer, Ms. Shan was responsible for global financial reporting and performance, operational finance, investments, and corporate strategy, leading a team of finance professionals supporting clients in over 130 countries. Preceding her tenure as the CFO for Mercer, Ms. Shan also served as the Vice President and Treasurer for Marsh and McLennan Companies, with additional prior experience in the same position with Pitney Bowes Inc. and served as a Managing Director at J.P. Morgan. In September 2018, Ms. Shan joined the Board of Directors of EPAM Systems Inc., a global provider of digital platform engineering and software development services. Ms. Shan holds dual degrees with a Bachelor of Science and a Bachelor of Applied Science from the University of Pennsylvania’s Wharton School of Business and School of Applied Science and Engineering. Ms. Shan also has a Master of Business Administration from Cornell University’s SC Johnson College of Business.
Frank A.R. Gossieaux – Executive Vice President, Global Head of Sales and Client Solutions. Mr. Gossieaux joined FactSet in September 2004. Mr. Gossieaux held multiple senior leadership roles at FactSet in both Europe and North America including Senior Vice President of Americas Sales, Senior Vice President of EMEA Sales, and Senior Vice President of International Investment Management. Mr. Gossieaux received a Bachelor of Science in Economics from the University Pantheon-Assas (Sorbonne-Assas) in Paris.
Rachel R. Stern – Executive Vice President, Strategic Resources and General Counsel. Ms. Stern joined FactSet in January 2001 as General Counsel. In addition to her role in the Legal Department, Ms. Stern is also responsible for Compliance, Facilities and Real Estate Planning, and the administration of our offices in Hyderabad, Manila and Riga. Ms. Stern is admitted to practice in New York, Washington D.C., and as House Counsel in Connecticut. Ms. Stern received a Bachelor of Arts from Yale University, a Master of Arts from the University of London and a Juris Doctor from the University of Pennsylvania Law School.
Gene D. Fernandez – Executive Vice President, Chief Technology and Product Officer. Mr. Fernandez joined FactSet in November 2017 from J.P. Morgan, where he served as the Chief Technology Officer, New Product Development. In this role, he developed the strategy and built the engineering function responsible for new product innovation. During a decade at J.P. Morgan, Mr. Fernandez held various other roles, including Chief Technology Officer for Client Technology and Research and Banking Information Technology. Prior to J.P. Morgan, he worked at Credit Suisse and Merrill Lynch. Mr. Fernandez received a Bachelor of Science in Computer Science and Economics from Rutgers University.
Robert J. Robie – Executive Vice President, Head of Analytics and Trading Solutions. Mr. Robie joined FactSet in July 2000 as a Product Sales Specialist. During his tenure at FactSet, Mr. Robie has held several positions of increasing responsibility, including Senior Director of Analytics and Director of Global Fixed Income and Analytics, where he led sales and support efforts for FactSet’s fixed income product offering. Although Mr. Robie joined FactSet in 2000, he did work at BTN Partners from 2004 through 2005 in their quantitative portfolio management and performance division, before returning to continue his career with FactSet. Mr. Robie holds a Bachelor of Arts in Economics from Beloit College.
Daniel Viens – Senior Vice President, Chief Human Resources Officer. Mr. Viens joined FactSet in September 1998 as a Vice President, Director of Human Resources and has held several leadership positions of increased responsibility in Human Resources. Prior to joining FactSet, Mr. Viens was a Director of Human Resources for First Data Solutions and Donnelly Marketing (a former company of Dun & Bradstreet), where he developed significant Human Resources acumen. Mr. Viens graduated from Boston University, and holds both a Master's Degree from Eastern Illinois University in Clinical Psychology, and a Master of Business Administration from Columbia University.
Additional Information
Additional information with respect to FactSet’s business is included in the following pages and is incorporated herein by reference:
| |
Page(s) |
| Five-Year Summary of Selected Financial Data |
21 |
| Management’s Discussion and Analysis of Financial Condition and Results of Operations |
23 |
| Quantitative and Qualitative Disclosures about Market Risk |
46 |
| Note 1 to Consolidated Financial Statements entitled Organization and Nature of Business |
59 |
| Note 8 to Consolidated Financial Statements entitled Segment Information |
72 |
ITEM 1A. RISK FACTORS
The following risks could materially and adversely affect our business, financial condition, cash flows, results of operations and as a result, the trading price of our common stock could decline. These risk factors do not identify all risks that we face; our operations could also be affected by factors that are not presently known to us or that we currently consider to be immaterial to our operations. Due to risks and uncertainties, known and unknown, our past financial results may not be a reliable indicator of future performance, and historical trends should not be used to anticipate results or trends in future periods. Investors should also refer to the other information set forth in this Report on Form 10-K, including “Management’s Discussion and Analysis of Financial Condition and Results of Operations” and our financial statements including the related notes. Investors should carefully consider all risks, including those disclosed, before making an investment decision.
Loss, corruption and misappropriation of data and information relating to clients and others
Many of our products, as well as our internal systems and processes, involve the storage and transmission of our own, as well as supplier and customer proprietary information and sensitive or confidential data. This includes data from client portfolios and strategies. Breaches of this confidentiality, should they occur, could result in the loss of clients and termination of arrangements with suppliers for the use of their data. If we fail to maintain the adequacy of our internal controls, unauthorized access or misappropriation of client or supplier data by an employee or an external third-party could occur. Additionally, the maintenance and enhancement of our systems may not be completely effective in preventing loss, unauthorized access or misappropriation. Data misappropriation, unauthorized access or data loss could instill a lack of confidence in our products and systems and damage our brand, reputation and business. Breaches of security measures could expose us, our clients or the individuals affected to a risk of loss or misuse of this information, potentially resulting in litigation and liability for us, as well as the loss of existing or potential clients. Many jurisdictions in which we operate have laws and regulations relating to data privacy and protection of personal information, including the European Union General Data Protection Regulation which became effective May 25, 2018, and California's Consumer Privacy Act, effective January 1, 2020. Both require companies to satisfy requirements regarding the handling of personal and sensitive data, including our use, protection and the ability of persons whose data is stored to correct or delete such data about themselves. The law in this area continues to develop and the changing nature of privacy laws could impact our processing of personal and sensitive information related to our content, operations, employees, clients, and suppliers, and may expose us to claims of violations.
Successful cyber-attacks and the failure of cyber-security systems and procedures
In providing our digital-enabled services to clients, we rely on information technology infrastructure that is primarily managed internally, along with some reliance placed on third-party service providers. We and these third-party service providers are subject to the risks of system failures and security breaches, including cyber-attacks, such as phishing scams, viruses and denials of service attacks, as well as employee errors or malfeasance. Our protective systems and procedures and those of third parties to which we are connected, such as cloud computing providers, may not be effective against these threats. We could suffer significant damage to our brand and reputation: if a cyber-attack or other security incident were to allow unauthorized access to, or modification of, clients’ or suppliers’ data, other external data, internal data or information technology systems; if the services provided to clients were disrupted; or if products or services were perceived as having security vulnerabilities. The costs we would incur to address and resolve these security incidents would increase our expenses. These types of security incidents could also lead to lawsuits, regulatory investigations and claims, loss of business and increased legal liability. We also make acquisitions periodically. While significant effort is placed on addressing information technology security issues with respect to the acquired companies, we may inherit such risks when these acquisitions are integrated into our infrastructure.
A prolonged or recurring outage at our data centers and other business continuity disruptions at facilities could result in reduced service and the loss of clients
Our clients rely on us for the delivery of time-sensitive, up-to-date data and applications. Our business is dependent on our ability to process substantial volumes of data and transactions rapidly and efficiently on our computer-based networks and systems. Our computer operations, as well as our other business centers, and those of our suppliers and clients are vulnerable to interruption by fire, natural disaster, power loss, telecommunications failures, terrorist attacks, acts of war, civil unrest, Internet failures, computer viruses, security breaches, and other events beyond our reasonable control. We maintain back-up facilities and certain other redundancies for each of our major data centers to minimize the risk that any such event will disrupt those operations. However, a loss of our services involving our significant facilities may materially disrupt our business and may induce our clients to seek alternative data suppliers. Any such losses or damages we incur could have a material adverse effect on our business. Although we seek to minimize these risks through security measures, controls, back-up data centers and emergency planning, there can be no assurance that such efforts will be successful or effective.
Competition in our industry may cause price reductions or loss of market share
We continue to experience intense competition across all markets for our products with competitors ranging in size from smaller, highly specialized, single-product businesses to multi-billion-dollar companies. While we believe the breadth and depth of our suite of products and applications offer benefits to our clients that are a competitive advantage, our competitors may offer price incentives to attract new business. Future competitive pricing pressures may result in decreased sales volumes and price reductions, resulting in lower revenue. Weak economic conditions may also result in clients seeking to utilize lower-cost information that is available from alternative sources. The impact of cost-cutting pressures across the industries we serve could lower demand for our products. Clients within the financial services industry that strive to reduce their operating costs may seek to reduce their spending on financial market data and related services, such as ours. If our clients consolidate their spending with fewer suppliers, by selecting suppliers with lower-cost offerings or by self-sourcing their needs for financial market data, our business could be negatively affected.
The continued shift from active to passive investing could negatively impact user count growth and revenue
The predominant investment strategy today is still active investing, which attempts to outperform the market. The main advantage of active management is the expectation that the investment managers will be able to outperform market indices. They make informed investment decisions based on their experiences, insights, knowledge and ability to identify opportunities that can translate into superior performance. The main advantage of passive investing is that it closely matches the performance of market indices. Passive investing requires little decision-making by investment managers and low operating costs which result in lower fees for the investor. A continued shift to passive investing, resulting in an increased outflow to passively managed index funds, could reduce demand for the services of active investment managers and consequently, the demand of our clients for our services.
A decline in equity and/or fixed income returns may impact the buying power of investment management clients
Approximately 83.7% of our ASV is derived from our investment management clients. The profitability and management fees of these clients are tied to assets under management. An equity market decline not only depresses the value of assets under management but also could cause a significant increase in redemption requests from our clients’ customers, further reducing their assets under management. Reduced client profits and management fees may cause our clients to cut costs. Moreover, extended declines in the equity and fixed income markets may reduce new fund or client creation. Each of these developments may result in lower demand from investment managers for our services and workstations, which could negatively affect our business.
Failure to develop and market new products and enhancements that maintain our technological and competitive position and failure to anticipate and respond to changes in the marketplace for our products
The market for our products is characterized by rapid technological change, including methods and speed of delivery, changes in client demands, development of new investment instruments and evolving industry standards. The direction of these trends can render our existing products less competitive, obsolete or unmarketable. As a result, our future success will continue to depend upon our ability to identify and develop new products and enhancements that address the future needs of our target markets and to respond to their changing standards and practices. We may not be successful in developing, introducing, marketing, licensing and implementing new products and enhancements on a timely and cost-effective basis or without impacting the stability and efficiency of existing products and customer systems. Further, any new products and enhancements may not adequately meet the requirements of the marketplace or achieve market acceptance. Our failure or inability to anticipate and respond to changes in the marketplace, including competitor and supplier developments, may also adversely affect our business, operations and growth.
Uncertainty, consolidation and business failures in the global investment banking industry may cause us to lose clients and users
Our investment banking clients that perform mergers and acquisitions ("M&A") advisory work, capital markets services and equity research, account for approximately 16.3% of our ASV. A significant portion of these revenues relate to services deployed by the largest banks. Consolidation or contraction in this industry directly impacts the number of prospective clients and users within the sector. Thus, economic uncertainty for our global investment banking clients, consolidation and business failures in this sector could adversely affect our financial results and future growth.
Volatility in the financial markets may delay the spending pattern of clients and reduce future ASV growth
The decision on the part of large institutional clients to purchase our services often requires management-level sponsorship and typically depends upon the size of the client, with larger clients having more complex and time-consuming purchasing processes. The process is also influenced by market volatility. These characteristics often lead us to engage in relatively lengthy sales efforts. Purchases (and incremental ASV) may therefore be delayed as uncertainties in the financial markets may cause clients to remain cautious about capital and data content expenditures, particularly in uncertain economic environments.
Additional cost due to tax assessments resulting from ongoing and future audits by tax authorities as well as changes in tax laws
In the ordinary course of business, we are subject to tax examinations by various governmental tax authorities. The global and diverse nature of our business means that there could be additional examinations by governmental tax authorities and the resolution of ongoing and other probable audits which could impose a future risk to the results of our business. In August 2019, FactSet received a Notice of Intent to Assess (the “Notice”) additional sales taxes, interest and underpayment penalties from the Commonwealth of Massachusetts Department of Revenue relating to prior tax periods. The Notice follows FactSet’s previously disclosed response to a letter from the Commonwealth requesting additional sales information. Based upon a preliminary review of the Notice, the Company believes the Commonwealth may assess sales tax, interest and underpayment penalties on previously recorded sales transactions. The Company intends to contest any such assessment, if assessed, and continues to cooperate with the Commonwealth’s inquiry. Due to uncertainty surrounding the assessment process, the Company is unable to reasonably estimate the ultimate outcome of this matter and, as such, has not recorded a liability as of August 31, 2019. While FactSet believes that it will ultimately prevail if the Company is presented with a formal assessment; if FactSet does not prevail, the amount could have a material impact on the Company’s consolidated financial position, cash flows and results of operations.
Changes in tax laws or the terms of tax treaties in a jurisdiction where we are subject to tax could increase our taxes payable. On December 22, 2017, the U.S. Tax Cuts and Jobs Act, ("TCJA") was signed into law. The TCJA enacted broad changes to the U.S. Internal Revenue code, including reducing the federal corporate income tax rate from 35% to 21%, amongst many other complex provisions. The ultimate impact of such tax reform may differ from our current estimate due to changes in interpretations and assumptions made by us as well as the issuance of further regulations or guidance.
Failure to identify, integrate, or realize anticipated benefits of acquisitions and strains on resources as a result of growth
There can be no assurance that we will be able to identify suitable candidates for successful acquisition at acceptable prices. Additionally, there may be integration risks or other risks resulting from acquired businesses. Our ability to achieve the expected returns and synergies from past and future acquisitions and alliances depends in part upon our ability to integrate the offerings, technology, sales, administrative functions and personnel of these businesses effectively into our core business. We cannot guarantee that our acquired businesses will perform at the levels anticipated. In addition, past and future acquisitions may subject us to unanticipated risks or liabilities or disrupt operations.
Growth, such as the addition of new clients and acquisitions, puts demands on our resources, including our internal systems and infrastructure. These may require improvements or replacement to meet the additional demands of a larger organization. Further, the addition of new clients and the implementation of such improvements would require additional management time and resources. These needs may result in increased costs that could negatively impact results of operations. Failure to implement needed improvements, such as improved scalability, could result in a deterioration in the performance of our internal systems and negatively impact the performance of our business.
Failure to enter into or renew contracts supplying new and existing data sets or products on competitive terms
We collect and aggregate third-party content from thousands of data suppliers, news sources, exchanges, brokers and contributors into our own dedicated online service, which clients access to perform their analyses. Clients have access to the data and content found within our databases. These databases are important to our operations as they provide clients with key information. We have entered into third-party content agreements of varying lengths, which in some cases can be terminated on one year’s notice at predefined dates, and in other cases on shorter notice. Some of our content provider agreements are with competitors, who may attempt to make renewals difficult or expensive. We seek to maintain favorable contractual relationships with our data suppliers, including those that are also competitors. We also make efforts, when reasonable, to locate alternative sources to ensure we are not dependent on any one third-party data supplier. We believe we are not dependent on any one significant third-party data supplier. Our failure to be able to maintain these relationships or the failure of our suppliers to deliver accurate data or in a timely manner could adversely affect our business.
Inability to hire and retain key qualified personnel
Our business is based on successfully attracting, motivating and retaining talented employees. Competition for talent, especially engineering personnel, is strong. We need technical resources such as engineers to help develop new products and enhance existing services. We rely upon sales personnel to sell our products and services and maintain healthy business relationships. If we are unsuccessful in our recruiting efforts, or if we are unable to retain key employees, our ability to develop and deliver successful products and services may be adversely affected and could have a material, adverse effect on our business.
Increased accessibility to free or relatively inexpensive information sources may reduce demand for our products
Each year, an increasing amount of free or relatively inexpensive information becomes available, particularly through the Internet, and this trend may continue. The availability of free or relatively inexpensive information may reduce demand for our products. While we believe our service offering is distinguished by such factors as customization, timeliness, accuracy, ease-of-use, completeness and other value-added factors, if users choose to obtain the information they need from public or other sources, our business and results of operations could be adversely affected.
Third parties may claim we infringe upon their intellectual property rights or may infringe upon our intellectual property rights
We may receive notice from others claiming that we have infringed upon their intellectual property rights. Responding to these claims may require us to enter into royalty and licensing agreements on unfavorable terms, incur litigation costs, enter into settlements, stop selling or redesign affected products, or pay damages and satisfy indemnification commitments with our clients or suppliers under contractual provisions of various license arrangements. Additionally, third parties may copy, infringe or otherwise profit from the unauthorized use of our intellectual property rights requiring us to litigate to protect our rights. Certain countries may not offer adequate protection of proprietary rights. If we are required to defend ourselves or assert our rights or take such actions mentioned, our operating margins may decline as a result. We have incurred, and expect to continue to incur, expenditures to acquire the use of technology and intellectual property rights as part of our strategy to manage this risk.
Operations outside the U.S. involve additional requirements and burdens that we may not be able to control or manage successfully
In fiscal 2019, approximately 38% of our revenue related to operations located outside the U.S. In addition, a significant number of our employees, approximately 76%, are located in offices outside the U.S. We expect our growth to continue outside the U.S., with non-U.S. revenues accounting for an increased portion of total revenue in the future. Our non-U.S. operations involve risks that differ from or are in addition to those faced by our U.S. operations. These risks include difficulties in developing products, services and technology tailored to the needs of non-U.S. clients, including in emerging markets; different employment laws and rules; rising labor costs in low-wage countries; difficulties in staffing and managing personnel that are located outside the U.S.; different regulatory, legal and compliance requirements, including in the areas of privacy and data protection, anti-bribery and anti-corruption, trade sanctions and currency controls, marketing and sales and other barriers to conducting business; social and cultural differences, such as languages; diverse or less stable political, operating and economic environments and market fluctuations; civil disturbances or other catastrophic events that reduce business activity; limited recognition of our brand and intellectual property protection; differing accounting principles and standards; restrictions on or adverse tax consequences from entity management efforts; and changes in U.S. or foreign tax laws. If we are not able to adapt efficiently or manage the business effectively in markets outside the U.S., our business prospects and operating results could be materially and adversely affected.
Exposure to fluctuations in currency exchange rates and the failure of hedging arrangements
Due to the global nature of our operations, we conduct business outside the U.S. in several currencies including the Euro, Indian Rupee, Philippine Peso, British Pound Sterling, and Japanese Yen. To the extent our international activities increase in the future, our exposure to fluctuations in currency exchange rates may increase as well. To manage this exposure, we utilize derivative instruments (such as foreign currency forward contracts). By their nature, all derivative instruments involve elements of market and credit risk. The market risk associated with these instruments resulting from currency exchange movements is expected to offset the market risk of the underlying transactions, assets and liabilities being hedged. Credit risk is managed through the continuous monitoring of exposure to the counterparties associated with these instruments. Our primary objective in holding derivatives is to reduce the volatility of earnings with changes in foreign currency. Although we believe that our foreign exchange hedging policies are reasonable and prudent under the circumstances, our attempt to hedge against these risks may not be successful, which could cause an adverse impact on our results of operations.
Legislative and regulatory changes in the environments in which we and our clients operate
Many of our clients operate within a highly regulated environment and must comply with governmental legislation and regulations. The U.S. regulators have increased their focus on the regulation of the financial services industry. Increased regulation of our clients may increase their expenses, causing them to seek to limit or reduce their costs from outside services such as ours. Additionally, if our clients are subjected to investigations or legal proceedings they may be adversely impacted, possibly leading to their liquidation, bankruptcy, receivership, reduction in assets under management, or diminished operations, which would adversely affect our revenue. In the European Union, the new version of the Markets in Financial Instruments Directive (recast), also known as “MiFID II” became effective in January 2018. We believe that compliance with MiFID II requirements is time-consuming and costly for the investment managers who are subject to it and will cause clients to adapt their pricing models and business practices significantly. These increased costs may impact our clients’ spending and may cause some investment managers to lose business or withdraw from the market, which may adversely affect demand for our services. However, MiFID II may also present us with new business opportunities for new service offerings. In addition to the MiFID II requirements, we further believe the proposed withdrawal of the U.K. from the European Union (also known as Brexit) on terms still being negotiated, has created economic uncertainty among our client base. This uncertainty may have an impact on our clients’ expansion or spending plans, which may in turn negatively impact our revenue or growth.
As a business, we are also subject to numerous laws and regulations in the U.S. and in the other countries in which we operate. These laws, rules, and regulations, and their interpretations, may change in the future, and compliance with these changes may increase our costs or cause us to make changes in or otherwise limit our business practices. In addition, the global nature and scope of our business operations make it more difficult to monitor areas that may be subject to regulatory and compliance risk. If we fail to comply with any applicable law, rule, or regulation, we could be subject to claims and fines and suffer reputational damage.
Adverse resolution of litigation or governmental investigations
We are party to lawsuits in the normal course of business. Litigation and governmental investigations can be expensive, lengthy and disruptive to normal business operations. Moreover, the results of complex legal proceedings are difficult to predict. Unfavorable resolution of lawsuits could have a material adverse effect on our business, operating results or financial condition. For additional information regarding legal matters, see Item 3, Legal Proceedings, contained in Part I of this Report on Form 10-K.
Failure to maintain reputation
We enjoy a positive reputation in the marketplace. Our ability to attract and retain clients and employees is affected by external perceptions of our brand and reputation. Reputational damage from negative perceptions or publicity could affect our ability to attract and retain clients and employees and our ability to maintain our pricing for our products. Although we monitor developments for areas of potential risk to our reputation and brand, negative perceptions or publicity could have a material adverse effect on our business and financial results.
ITEM 1B. UNRESOLVED STAFF COMMENTS
None.
ITEM 2. PROPERTIES
As of August 31, 2019, we leased approximately 202,000 square feet of office space at our headquarters in Norwalk, Connecticut. On February 14, 2018, we entered into a new lease agreement to relocate our corporate headquarters to 45 Glover Avenue in Norwalk, Connecticut. The new location will comprise approximately 173,000 square feet of office space. We took possession of the newly leased property on January 1, 2019, for fit-out purposes. We will continue to occupy our existing headquarters space until the new headquarters is ready for occupancy, currently estimated to be in the second quarter of fiscal 2020.
We have data content collection offices located in India, the Philippines and Latvia, which benefit all our operating segments. Additionally, we have data centers that support our technological infrastructure located in New Jersey and Virginia. The other locations listed in the table below are leased office space. The leases expire on various dates through 2035. We believe the amount of leased space as of August 31, 2019 is adequate for our current needs and that additional space can be available to meet any future needs.
Including new lease agreements executed during fiscal 2019, our Company’s worldwide leased space increased to approximately 1,860,000 square feet as of August 31, 2019, up 110,000 square feet, or 6.3%, from August 31, 2018 and includes properties at the following locations:
| Segment |
Leased Location |
| |
|
| United States |
Atlanta, Georgia |
| |
Austin, Texas |
| |
Boston, Massachusetts |
| |
Chicago, Illinois |
| |
Jackson, Wyoming |
| |
Los Angeles, California |
| |
Manchester, New Hampshire |
| |
Minneapolis, Minnesota |
| |
New York, New York |
| |
Norwalk, Connecticut |
| |
Piscataway, New Jersey |
| |
Reston, Virginia |
| |
San Francisco, California |
| |
Sao Paulo, Brazil |
| |
Toronto, Canada |
| |
Youngstown, Ohio |
| |
|
| Europe |
Avon, France |
| |
Amsterdam, the Netherlands |
| |
Cologne, Germany |
| |
Dubai, United Arab Emirates |
| |
Frankfurt, Germany |
| |
Gloucester, England |
| |
Johannesburg, South Africa |
| |
London, England |
| |
Luxembourg City, Luxembourg |
| |
Madrid, Spain |
| |
Milan, Italy |
| |
Paris, France |
| |
Riga, Latvia |
| |
Sofia, Bulgaria |
| |
Zurich, Switzerland |
| |
|
| Asia Pacific |
Chennai, India |
| |
Hong Kong, China |
| |
Hyderabad, India |
| |
Manila, the Philippines |
| |
Melbourne, Australia |
| |
Mumbai, India |
| |
Shanghai, China |
| |
Singapore |
| |
Sydney, Australia |
| |
Tokyo, Japan |
ITEM 3. LEGAL PROCEEDINGS
From time to time, the Company is subject to legal proceedings, claims and litigation arising in the ordinary course of business, including intellectual property litigation. Based on currently available information, the Company’s management does not believe that the ultimate outcome of these unresolved matters against FactSet, individually or in the aggregate, is likely to have a material adverse effect on the Company's consolidated financial position, its annual results of operations or its annual cash flows. However, these matters are subject to inherent uncertainties and management’s view of these matters may change in the future.
ITEM 4. MINE SAFETY DISCLOSURES
Not applicable.
Part II
ITEM 5. MARKET FOR REGISTRANT’S COMMON EQUITY, RELATED STOCKHOLDER MATTERS AND ISSUER PURCHASES OF EQUITY SECURITIES
| (a) |
Market Information, Holders and Dividends |
Market Information – Our common stock is listed on the New York Stock Exchange (“NYSE”) and the NASDAQ Stock Market under the symbol FDS. The following table sets forth, for each fiscal period indicated, the high and low sales prices per share of our common stock as reported on the NYSE:
| |
|
First |
|
|
Second |
|
|
Third |
|
|
Fourth |
|
| 2019 |
|
|
|
|
|
|
|
|
|
|
|
|
|
|
|
|
| High |
|
$ |
237.29 |
|
|
$ |
237.95 |
|
|
$ |
284.32 |
|
|
$ |
305.38 |
|
| Low |
|
$ |
210.11 |
|
|
$ |
188.31 |
|
|
$ |
228.43 |
|
|
$ |
266.06 |
|
| |
|
|
|
|
|
|
|
|
|
|
|
|
|
|
|
|
| 2018 |
|
|
|
|
|
|
|
|
|
|
|
|
|
|
|
|
| High |
|
$ |
200.31 |
|
|
$ |
209.02 |
|
|
$ |
217.36 |
|
|
$ |
229.98 |
|
| Low |
|
$ |
155.88 |
|
|
$ |
183.89 |
|
|
$ |
184.48 |
|
|
$ |
195.69 |
|
Holders of Record – As of October 24, 2019, we had approximately 199,571 holders of record of our common stock. However, because many of our shares of common stock are held by brokers and other institutions on behalf of stockholders, we are unable to estimate the total number of stockholders represented by these record holders. The closing price of our common stock on October 24, 2019, was $253.22 per share as reported on the NYSE.
Dividends - During fiscal years 2019 and 2018, our Board of Directors declared the following dividends on our common stock:
| Year Ended |
|
Dividends per Share of Common Stock |
|
|
Record Date |
|
Total $ Amount (in thousands) |
|
|
Payment Date |
| Fiscal 2019 |
|
|
|
|
|
|
|
|
|
|
|
|
| First Quarter |
|
$ |
0.64 |
|
|
November 30, 2018 |
|
$ |
24,372 |
|
|
December 18, 2018 |
| Second Quarter |
|
$ |
0.64 |
|
|
February 28, 2019 |
|
$ |
24,385 |
|
|
March 19, 2019 |
| Third Quarter |
|
$ |
0.72 |
|
|
May 31, 2019 |
|
$ |
27,506 |
|
|
June 18, 2019 |
| Fourth Quarter |
|
$ |
0.72 |
|
|
August 30, 2019 |
|
$ |
27,445 |
|
|
September 19, 2019 |
| |
|
|
|
|
|
|
|
|
|
|
|
|
| Fiscal 2018 |
|
|
|
|
|
|
|
|
|
|
|
|
| First Quarter |
|
$ |
0.56 |
|
|
November 30, 2017 |
|
$ |
21,902 |
|
|
December 19, 2017 |
| Second Quarter |
|
$ |
0.56 |
|
|
February 28, 2018 |
|
$ |
21,799 |
|
|
March 20, 2018 |
| Third Quarter |
|
$ |
0.64 |
|
|
May 31, 2018 |
|
$ |
24,566 |
|
|
June 19, 2018 |
| Fourth Quarter |
|
$ |
0.64 |
|
|
August 31, 2018 |
|
$ |
24,443 |
|
|
September 18, 2018 |
All the above cash dividends were paid from existing cash resources on a quarterly basis. Future dividend payments will depend on our earnings, capital requirements, financial condition and other factors considered relevant by us, and is subject to final determination by our Board of Directors.
| (b) |
Recent Sales of Unregistered Securities |
There were no sales of unregistered equity securities during fiscal 2019.
| (c) |
Issuer Purchases of Equity Securities |
The following table provides a month-to-month summary of the share repurchase activity under the current stock repurchase program during the three months ended August 31, 2019:
(in thousands, except per share data)
| Period |
|
Total number of shares purchased(1) |
|
|
Average price paid per share |
|
|
Total number of shares purchased as part of publicly announced plans or programs |
|
|
Maximum number of shares (or approximate dollar value) that may yet be purchased under the plans or programs(2) |
|
| June 2019 |
|
|
28,421 |
|
|
$ |
285.92 |
|
|
|
25,000 |
|
|
$ |
292,465 |
(3) |
| July 2019 |
|
|
102,629 |
|
|
$ |
283.86 |
|
|
|
102,500 |
|
|
$ |
263,370 |
|
| August 2019 |
|
|
90,242 |
|
|
$ |
275.02 |
|
|
|
90,000 |
|
|
$ |
238,619 |
|
| |
|
|
221,292 |
|
|
|
|
|
|
|
217,500 |
|
|
|
|
|
| |
(1) |
Includes 217,500 shares purchased under the existing stock repurchase program, as well as 3,792 shares repurchased from employees to cover their cost of taxes upon vesting of restricted stock. |
| |
(2) |
Repurchases may be made from time to time in the open market and privately negotiated transactions, subject to market conditions. There is no defined number of shares to be repurchased over a specified timeframe through the life of the share repurchase program. It is expected that share repurchases will be paid using existing and future cash generated by operations. |
| |
(3) |
The amount included in the Maximum number of shares that may yet be purchased under the plans or programs column for June 2019, includes a $210.0 million expansion of the existing share repurchase program as approved by the Board of Directors of FactSet on June 24, 2019. |
Securities Authorized for Issuance under Equity Compensation Plans – see Part III of this Report on Form 10-K
Stock Performance Graph
The annual changes for the five-year period shown in the graph below assume $100 had been invested in our common stock, the Standard & Poor’s 500 Index, the NYSE Composite Index and the Dow Jones U.S. Financial Services Index on August 31, 2014. The total cumulative dollar returns shown on the graph represent the value that such investments would have had on August 31, 2019. Stockholder returns over the indicated period are based on historical data and should not be considered indicative of future stockholder returns.
| |
|
2014 |
|
|
2015 |
|
|
2016 |
|
|
2017 |
|
|
2018 |
|
|
2019 |
|
| FactSet Research Systems Inc. |
|
$ |
100 |
|
|
$ |
124 |
|
|
$ |
140 |
|
|
$ |
123 |
|
|
$ |
180 |
|
|
$ |
214 |
|
| S&P 500 Index |
|
$ |
100 |
|
|
$ |
98 |
|
|
$ |
108 |
|
|
$ |
123 |
|
|
$ |
145 |
|
|
$ |
146 |
|
| NYSE Composite Index |
|
$ |
100 |
|
|
$ |
92 |
|
|
$ |
97 |
|
|
$ |
108 |
|
|
$ |
118 |
|
|
$ |
115 |
|
| Dow Jones U.S. Financial Services Index |
|
$ |
100 |
|
|
$ |
104 |
|
|
$ |
105 |
|
|
$ |
132 |
|
|
$ |
161 |
|
|
$ |
155 |
|
The information contained in the above graph shall not be deemed to be soliciting material or filed or incorporated by reference in future filings with the SEC, or subject to the liabilities of Section 18 of the Securities Exchange Act of 1934, except to the extent that FactSet specifically incorporates it by reference into a document filed under the Securities Act of 1933 or the Securities Exchange Act of 1934.
ITEM 6. SELECTED FINANCIAL DATA
The following selected financial data has been derived from our consolidated financial statements. This financial data should be read in conjunction with Item 7, Management’s Discussion and Analysis of Financial Condition and Results of Operations and Item 8, Financial Statements and Supplementary Data, of this Report on Form 10-K.
Consolidated Statements of Income Data
| |
|
For the year ended August 31, |
|
| (in thousands, except per share data) |
|
2019 |
|
|
2018 |
|
|
2017 |
|
|
2016 |
|
|
2015 |
|
| Revenue |
|
$ |
1,435,351 |
|
|
$ |
1,350,145 |
|
|
$ |
1,221,179 |
|
|
$ |
1,127,092 |
|
|
$ |
1,006,768 |
|
| Operating income |
|
$ |
438,035 |
(1) |
|
$ |
366,204 |
(4) |
|
$ |
352,135 |
(7) |
|
$ |
349,676 |
(10) |
|
$ |
331,918 |
(13) |
| Provision for income taxes |
|
$ |
69,175 |
|
|
$ |
84,753 |
|
|
$ |
86,053 |
|
|
$ |
122,178 |
|
|
$ |
92,703 |
|
| Net income |
|
$ |
352,790 |
(2) |
|
$ |
267,085 |
(5) |
|
$ |
258,259 |
(8) |
|
$ |
338,815 |
(11) |
|
$ |
241,051 |
(14) |
| Diluted earnings per common share |
|
$ |
9.08 |
(3) |
|
$ |
6.78 |
(6) |
|
$ |
6.51 |
(9) |
|
$ |
8.19 |
(12) |
|
$ |
5.71 |
(15) |
| Weighted average common shares (diluted) |
|
|
38,873 |
|
|
|
39,377 |
|
|
|
39,642 |
|
|
|
41,365 |
|
|
|
42,235 |
|
| Cash dividends declared per common share |
|
$ |
2.72 |
|
|
$ |
2.40 |
|
|
$ |
2.12 |
|
|
$ |
1.88 |
|
|
$ |
1.66 |
|
Consolidated Balance Sheets Data
| |
|
As of August 31, |
|
| (in thousands) |
|
2019 |
|
|
2018 |
|
|
2017 |
|
|
2016 |
|
|
2015 |
|
| Cash and cash equivalents |
|
$ |
359,799 |
|
|
$ |
208,623 |
|
|
$ |
194,731 |
|
|
$ |
228,407 |
|
|
$ |
158,914 |
|
| Accounts receivable, net of reserves |
|
$ |
146,309 |
|
|
$ |
156,639 |
|
|
$ |
148,331 |
|
|
$ |
97,797 |
|
|
$ |
95,064 |
|
| Goodwill and intangible assets, net |
|
$ |
806,280 |
|
|
$ |
850,768 |
|
|
$ |
881,103 |
|
|
$ |
546,076 |
|
|
$ |
348,339 |
|
| Total assets |
|
$ |
1,560,130 |
|
|
$ |
1,419,447 |
|
|
$ |
1,413,315 |
|
|
$ |
1,019,161 |
|
|
$ |
736,671 |
|
| Non-current liabilities |
|
$ |
668,951 |
|
|
$ |
672,413 |
|
|
$ |
652,485 |
|
|
$ |
343,570 |
|
|
$ |
65,307 |
|
| Total stockholders’ equity |
|
$ |
672,256 |
|
|
$ |
525,900 |
|
|
$ |
559,691 |
|
|
$ |
517,381 |
|
|
$ |
531,584 |
|
| (1) |
Operating income in fiscal 2019 included pre-tax charges of $8.0 million, primarily related to $4.3 million in severance costs, $8.7 million related to other corporate actions including stock-based compensation acceleration, professional fees related to infrastructure upgrade activities and a one-time adjustment related to data costs and occupancy costs, partially offset by $5.0 million in non-core transaction related revenue. |
| (2) |
Net income in fiscal 2019 included $6.3 million (after-tax) expenses, primarily related to $3.5 million (after-tax) in severance costs, $6.8 million (after-tax) related to other corporate actions including stock-based compensation acceleration, professional fees related to infrastructure upgrade activities and a one-time adjustment related to data costs and occupancy costs, partially offset by $4.0 million (after-tax) in non-core transaction related revenue. |
| (3) |
Diluted earnings per share (“EPS”) in fiscal 2019 was reduced by $0.15 per share, primarily related to $0.09 in severance costs, $0.16 related to other corporate actions including stock-based compensation acceleration, professional fees related to infrastructure upgrade activities and a one-time adjustment related to data costs and occupancy costs, partially offset by $0.10 in non-core transaction related revenue. |
| (4) |
Operating income in fiscal 2018 included pre-tax charges of $17.4 million from restructuring actions, $4.7 million related to other corporate actions including stock-based compensation acceleration and $4.9 million in legal matters. |
| (5) |
Net income in fiscal 2018 included $13.8 million (after-tax) expense related to restructuring actions, $3.8 million (after-tax) expense related to other corporate actions including stock-based compensation acceleration, $3.4 million (after-tax) expense related to legal matters and $21.3 million of tax charges primarily related to the one-time deemed repatriation tax on foreign earnings. |
| (6) |
Diluted earnings per share (“EPS”) in fiscal 2018 included a $0.35 decrease in diluted EPS from restructuring actions, a $0.10 detriment due to other corporate actions including stock-based compensation, a $0.09 decrease from legal matters and a $0.53 decrease from tax charges primarily related to the one-time deemed repatriation tax on foreign earnings. |
| (7) |
Operating income in fiscal 2017 included pre-tax charges of $5.6 million related to modifications of certain share-based compensation grants, $5.0 million related to restructuring actions and $7.4 million in acquisition-related expenses. |
| (8) |
Net income in fiscal 2017 included $4.2 million (after-tax) related to modifications of certain share-based compensation grants, $3.7 million (after-tax) related to restructuring actions and $5.5 million (after-tax) of acquisition-related expenses. Fiscal 2017 net income also included a loss of $0.9 million (after-tax) from a final working capital adjustment related to the sale of FactSet’s Market Metrics business in the fourth quarter of fiscal 2016. These charges were offset by income tax benefits of $1.9 million related primarily to finalizing prior year tax returns and other discrete items. |
| (9) |
Diluted EPS in fiscal 2017 included a $0.11 decrease in diluted EPS from the modifications of certain share-based compensation grants, a $0.09 decrease from the restructuring actions, a $0.13 decrease from acquisition-related expenses and $0.02 decrease from the working capital adjustment, partially offset by a $0.05 increase in diluted EPS from the income tax benefits. |
| (10) |
Operating income in fiscal 2016 included pre-tax charges of $4.6 million related primarily to legal matters, $2.8 million from restructuring actions and $1.8 million related to a change in the vesting of performance-based equity options. |
| (11) |
Net income in fiscal 2016 included $3.3 million (after-tax) related primarily to legal matters, $2.0 million (after-tax) from restructuring actions, $1.2 million (after-tax) related to a change in the vesting of performance-based equity instruments, partially offset by $10.5 million of income tax benefits primarily from the permanent reenactment of the U.S. Federal R&D tax credit (“R&D Tax Credit”), finalizing the fiscal 2015 tax returns and other discrete items and a gain of $81.7 million (after-tax) related to the sale of FactSet’s Market Metrics business in July 2016. |
| (12) |
Diluted EPS in fiscal 2016 included the net effect of a $2.01 increase in diluted EPS from the gain on sale and a $0.25 increase in diluted EPS from the income tax benefits, partially offset by a $0.08 decrease related primarily to legal matters, a $0.05 decrease from the restructuring actions and a $0.03 decrease from a change in the vesting of performance-based equity instruments. |
| (13) |
Operating income in fiscal 2015 included pre-tax charges of $3.0 million related to the vesting of performance-based equity instruments and $3.2 million related primarily to changes in the senior leadership responsible for the Company’s sales force. |
| (14) |
Net income in fiscal 2015 included $2.1 million (after-tax) of incremental expenses related to the vesting of performance-based equity instruments, $2.2 million (after-tax) related to the changes in the senior leadership responsible for the Company’s sales force and income tax benefits of $8.8 million primarily from the reenactment of the R&D Tax Credit in December 2014, and finalizing the fiscal 2014 tax returns and other discrete items. |
| (15) |
Diluted EPS in fiscal 2015 included the net effect of a $0.21 increase in diluted EPS from the income tax benefits, partially offset by a $0.05 decrease from the vesting of performance-based equity instruments and a $0.05 decrease from the changes in the senior leadership responsible for the Company’s sales force. |
ITEM 7. MANAGEMENT’S DISCUSSION AND ANALYSIS OF FINANCIAL CONDITION AND RESULTS OF OPERATIONS
Management’s Discussion and Analysis of Financial Condition and Results of Operations (“MD&A”) is designed to provide a reader of our financial statements with a narrative from the perspective of our management on our financial condition, results of operations, liquidity and certain other factors that may affect our future results. Our MD&A is presented in the following sections:
| |
• |
Off-Balance Sheet Arrangements |
| |
• |
Share Repurchase Program |
| |
• |
Contractual Obligations |
| |
• |
Significant Accounting Policies and Critical Accounting Estimates |
| |
• |
New Accounting Pronouncements |
| |
• |
Forward-Looking Factors |
The MD&A should be read in conjunction with the Consolidated Financial Statements and related Notes included in Item 8, Financial Statements and Supplementary Data, of this Report on Form 10-K.
Executive Overview
FactSet Research Systems Inc. (the “Company” or “FactSet”) is a global provider of integrated financial information, analytical applications and industry-leading services for the investment and corporate communities. For over 40 years, global financial professionals have utilized our content and multi-asset class solutions across each stage of the investment process. Our goal is to provide a seamless user experience spanning idea generation, research, portfolio construction, trade execution, performance measurement, risk management, reporting, and portfolio analysis, in which we serve the front, middle, and back offices to drive productivity and improved performance. Our flexible, open data and technology solutions can be implemented both across the investment portfolio lifecycle or as standalone components serving different workflows in the organization. We are focused on growing our business throughout each of our three segments, the U.S., Europe, and Asia Pacific. We primarily deliver insight and information through the workflow solutions of Research, Analytics and Trading, Content and Technology Solutions and Wealth.
We currently serve financial professionals, which include portfolio managers, investment research professionals, investment bankers, risk and performance analysts, wealth advisors, and corporate clients. We provide both insights on global market trends and intelligence on companies and industries, as well as capabilities to monitor portfolio risk and performance and to execute trades. We combine dedicated client service with open and flexible technology offerings, such as a comprehensive data marketplace, a configurable mobile and desktop platform, digital portals and application programming interface (“APIs”). Our revenue is primarily derived from subscriptions to products and services such as workstations, analytics, enterprise data, research management, and trade execution.
Fiscal 2019 Year in Review
Revenue for the fiscal year 2019 was $1.44 billion, an increase of 6.3% from the prior year comparable period, of which, 6.2% of the increase can be attributed to organic revenue growth. Revenue growth can be attributed primarily to Analytics and Trading, CTS and Wealth due mainly to increased demand for our portfolio analytics solutions, core and premium data feeds and our wealth workstations. As of August 31, 2019, organic annual subscription value (“organic ASV”) plus professional services totaled $1.48 billion, an increase of 5.1% over the prior year.
Operating income grew 19.6% and diluted earnings per share ("EPS") increased 33.9% compared to the prior year period. In addition, clients and users reached new highs of 5,574 and 126,822, respectively, in fiscal 2019. Over the last 12 months, we returned $320.4 million to stockholders in the form of share repurchases and dividends.
We won multiple awards, which included Best Data Provider to the Sell-Side, Best Performance Measurement and Attribution System Provider, and Best Client Reporting System at the Waters Technology Awards, Best Alternative Data Initiative and Best Data Analytics Provider at the Inside Market Data Awards. We expanded our data offering within CTS, on the Open:FactSet Marketplace, which now includes over 100 content and solution sets, including new data feeds from Mastercard and IHS Markit. Additionally, we launched a Global Robotics and Automation Index licensed to Sumitomo Mitsui Trust Asset Management Co., Ltd., marking our entry in the Japanese index mutual fund market.
In December 2018, we appointed Daniel Viens as Chief Human Resources Officer and in June 2019, we appointed Franck Gossieaux as Executive Vice President, Global Head of Sales and Client Solutions.
Client Service / Consultants
As part of the comprehensive value of FactSet’s solutions, consultants are versatile business people with knowledge of the financial markets and FactSet products. Consultants work closely with clients advising how FactSet solutions can be best leveraged to enhance their efficiency across workflows. A client-centric approach is a key foundation of our success at the Company. Additionally, our information and analytical applications are supported by a team of financial data and modeling experts. Client satisfaction is critical to how we measure the success of our service. According to our global client satisfaction survey, greater than 93% of respondents were satisfied or very satisfied with FactSet’s support. We believe that these strong relationships help enable high rates of retention and expansion of client business.
Key Metrics
The following is a review of our key metrics:
| |
|
As of and for the Year Ended August 31, |
|
| (in millions, except per share data, client and user counts) |
|
2019 |
|
|
2018 |
|
|
Change |
|
| Revenue |
|
$ |
1,435.4 |
|
|
$ |
1,350.1 |
|
|
|
6.3 |
% |
| Operating Income |
|
$ |
438.0 |
|
|
$ |
366.2 |
|
|
|
19.6 |
% |
| Net Income |
|
$ |
352.8 |
|
|
$ |
267.1 |
|
|
|
32.1 |
% |
| Diluted EPS |
|
$ |
9.08 |
|
|
$ |
6.78 |
|
|
|
33.9 |
% |
| Clients(1) |
|
|
5,574 |
|
|
|
5,142 |
|
|
|
8.4 |
% |
| Users |
|
|
126,822 |
|
|
|
91,897 |
|
|
|
38.0 |
% |
| (1) |
In the first quarter of fiscal 2019, we changed our client count definition to include clients from the April 2017 acquisition of FactSet Digital Solutions Group ("FDSG"). The prior year client count was not restated to reflect this change. |
The table below provides an unaudited reconciliation of ASV to organic ASV:
| |
|
As of August 31, |
|
| (in millions) |
|
2019 |
|
|
2018 |
|
|
Change |
|
| As reported ASV(1) |
|
$ |
1,458.0 |
|
|
$ |
1,393.1 |
|
|
|
|
|
| Currency impact to ASV |
|
|
5.3 |
|
|
|
— |
|
|
|
|
|
| Organic ASV(2) |
|
$ |
1,463.3 |
|
|
$ |
1,393.1 |
|
|
|
5.0 |
% |
| (1) |
ASV at any given point in time represents the forward-looking revenue for the next 12 months from all subscription services currently being supplied to clients and excludes professional service fees, which are not subscription-based. The professional service fees are $22.9 million and $21.6 million as of August 31, 2019 and 2018, respectively. |
| (2) |
Organic ASV excludes ASV from acquisitions and dispositions completed within the last 12 months, the effects of foreign currency, and professional services. |
Organic Annual Subscription Value Growth
Organic ASV at any given point in time represents the forward-looking revenue for the next 12 months from all subscription services currently being supplied to clients, excludes ASV from acquisitions and dispositions completed within the last 12 months, the effects of foreign currency, and professional services. With proper notice to us, our clients can add to, delete portions of, or terminate service at any time, subject to certain contractual limitations. As of August 31, 2019, our organic ASV totaled $1.46 billion, up 5.0% organically over the prior year. As of August 31, 2019, organic ASV plus professional services was $1.48 billion, an increase of 5.1%, compared to the prior year period.
The increase in year over year organic ASV was due to growth across all of our geographic segments with the majority of growth in the U.S., followed by Asia Pacific and Europe. ASV growth from our workflow solutions was primarily driven by Analytics and Trading, CTS and Wealth. The increase includes sales of products and solutions to new and existing clients, an annual price increase for both the majority of the U.S. and international clients, partially offset by cancellations due primarily to industry-wide cost pressures, firm consolidations and closures. ASV growth in Analytics and Trading was primarily due to increased sales for our portfolio analytics solutions. ASV growth in CTS was primarily driven by increased sales in core and premium data feeds while ASV growth in Wealth was mainly due to increased workstation sales.
As of August 31, 2019, ASV from the U.S. segment was $909.7 million, an increase of 4.7% from the prior year comparable period. This increase was primarily from Analytics and Trading, CTS and Wealth, due to the increased demand for our portfolio analytics solutions, core and premium data feeds and wealth workstations.
ASV from the international operations was $548.3 million as of August 31, 2019, an increase of 4.6% over August 31, 2018. International ASV represents 37.6% of total ASV as of August 31, 2019, remaining consistent with the prior year period. The ASV increase from our international operations was due to continued growth in Analytics and Trading in both Asia Pacific and Europe as well as CTS growth in Europe. The Analytics and Trading growth was driven by our portfolio analytics solutions, while the CTS growth was due to core and premium data feeds.
Buy-side and sell-side ASV growth rates for the last 12 months were 4.8% and 6.3% respectively. Buy-side clients account for 83.7% of ASV, which include traditional asset managers, wealth advisors, corporations, hedge funds, insurance companies, plan sponsors and fund of funds. The remaining portion of ASV is derived from sell-side firms that perform M&A advisory work, capital markets services and equity research.
Client and User Additions
Our total client count was 5,574 as of August 31, 2019, representing a net increase of 432 clients in the last twelve months. In the first quarter of fiscal 2019, we changed our client count definition to include clients from the April 2017 acquisition of FDSG. The prior year client count was not restated to reflect this change. The net increase was primarily driven by an increase in wealth management and corporate clients. As part of our long-term growth strategy, we continue to focus on expanding and cultivating relationships with our existing client base through sales of workstations, applications, services and content.
As of August 31, 2019, there were 126,822 professionals using FactSet, representing a net increase of 34,925 or 38.0% in the last 12 months primarily driven by Wealth and Research workstation sales.
Annual client retention as of August 31, 2019 was 89%, when expressed as a percentage of clients. Our successful client retention demonstrates that a majority of our clients maintain their subscriptions to FactSet year over year, highlighting the strength of our business strategy. As of August 31, 2019, our largest individual client accounted for approximately 3% of total subscriptions, and annual subscriptions from our ten largest clients did not surpass 15% of total client subscriptions.
Returning Value to Stockholders
On August 9, 2019, our Board of Directors approved a regular quarterly dividend of $0.72 per share. The cash dividend of $27.3 million was paid on September 19, 2019 to common stockholders of record at the close of business on August 30, 2019. We repurchased 0.9 million shares for $213.1 million during fiscal 2019 under our existing share repurchase program. Over the last 12 months, we have generated $427.1 million in cash from operations and have returned $320.4 million to stockholders in the form of share repurchases and cash dividends.
On June 24, 2019, the Board of Directors of FactSet approved a $210.0 million expansion of the existing share repurchase program. Subsequent to this expansion, $238.6 million was available for future repurchases as of August 31, 2019.
Capital Expenditures
Capital expenditures were $59.4 million during fiscal 2019, compared to $33.5 million a year ago. Capital expenditures of $28.0 million, or 47%, were primarily related to corporate infrastructure investments, additional server equipment for our data centers located in New Jersey and Virginia, as well as computers and peripherals for new office space primarily in India. The remainder of our capital expenditures was primarily for the build-out of office space, with $22.3 million related to the new corporate headquarters in Norwalk, Connecticut and $6.6 million related to new office space in India.
Results of Operations
For an understanding of the significant factors that influenced our performance during the past three fiscal years, the following discussion should be read in conjunction with the Consolidated Financial Statements and the Notes to Consolidated Financial Statements presented in this Report on Form 10-K.
| |
|
Years ended August 31, |
|
| (in thousands, except per share data) |
|
2019 |
|
|
2018 |
|
|
Change |
|
|
2018 |
|
|
2017 |
|
|
Change |
|
| Revenue |
|
$ |
1,435,351 |
|
|
$ |
1,350,145 |
|
|
|
6.3 |
% |
|
$ |
1,350,145 |
|
|
$ |
1,221,179 |
|
|
|
10.6 |
% |
| Cost of services |
|
$ |
663,446 |
|
|
$ |
659,296 |
|
|
|
0.6 |
% |
|
$ |
659,296 |
|
|
$ |
566,580 |
|
|
|
16.4 |
% |
| Selling, general and administrative |
|
$ |
333,870 |
|
|
$ |
324,645 |
|
|
|
2.8 |
% |
|
$ |
324,645 |
|
|
$ |
302,464 |
|
|
|
7.3 |
% |
| Operating income |
|
$ |
438,035 |
|
|
$ |
366,204 |
|
|
|
19.6 |
% |
|
$ |
366,204 |
|
|
$ |
352,135 |
|
|
|
4.0 |
% |
| Net income |
|
$ |
352,790 |
|
|
$ |
267,085 |
|
|
|
32.1 |
% |
|
$ |
267,085 |
|
|
$ |
258,259 |
|
|
|
3.4 |
% |
| Diluted earnings per common share |
|
$ |
9.08 |
|
|
$ |
6.78 |
|
|
|
33.9 |
% |
|
$ |
6.78 |
|
|
$ |
6.51 |
|
|
|
4.1 |
% |
| Diluted weighted average common shares |
|
|
38,873 |
|
|
|
39,377 |
|
|
|
|
|
|
|
39,377 |
|
|
|
39,642 |
|
|
|
|
|
Revenue
Fiscal 2019 compared to Fiscal 2018
Revenue in fiscal 2019 were $1.44 billion, increasing 6.3% compared to fiscal 2018. Our organic revenue growth rate for fiscal 2019 was 6.2% compared to the prior year period. Organic revenue excludes the effects of acquisitions and dispositions completed in the last 12 months, foreign currency in all periods presented and deferred revenue fair value adjustments from purchase accounting. The increase in revenue was due to revenue growth across all geographic segments and workflow solutions, including client additions and product expansion within our existing client base. The growth in the workflow solutions was primarily driven by Analytics and Trading, CTS and Wealth. The increase includes sales of products and solutions to new and existing clients, an annual price increase, partially offset by cancellations. Revenue growth in Analytics and Trading was primarily due to increased demand for our portfolio analytics solutions. The growth in CTS was driven mainly by increased sales of core and premium data feeds. Wealth also experienced revenue growth due to higher sales of our workstation product. Offsetting these growth factors were cancellations, resulting from continued industry-wide cost pressures and firm consolidations and closures.
Fiscal 2018 compared to Fiscal 2017
Revenue in fiscal 2018 were $1.35 billion, increasing 10.6% compared to fiscal 2017. Our organic revenue growth rate for fiscal 2018 was 5.6% compared to fiscal 2017, with cancellations remaining relatively flat during fiscal 2018. Organic revenue excludes the effects of acquisitions and dispositions completed in the last 12 months and foreign currency in all periods. The increase in revenue was throughout our geographical segments and workflow solutions. The U.S. segment revenues was up 7.4% compared to the fiscal 2017, primarily driven by additional clients, expansion from within our existing client base and an annual price increase, while holding client cancellations steady. Our international operations also grew as demonstrated by our 17.3% growth in Europe and a 13.1% increase in Asia Pacific. In addition to revenue growth amongst the geographic segments, achievements were also made across each workflow solution which include Research, Analytics and Trading, CTS, and Wealth. The Research workflow growth was driven by additional users due to banking new hires. The growth in the Analytics and Trading workflow was primarily attributed to increased sales in the portfolio analytics, reporting, and risk platforms, coupled with the enhancement of our multi-asset class risk model offerings, which strengthened our position in the analytics market. The CTS workflow growth was driven by increased demand for our proprietary content data feeds while new business sales drove the Wealth workflow growth.
Revenue by Geographic Segment
| |
|
Years ended August 31, |
|
| (in thousands) |
|
2019 |
|
|
2018 |
|
|
2017 |
|
| U.S. Revenue |
|
$ |
894,554 |
|
|
$ |
841,908 |
|
|
$ |
784,146 |
|
| % of revenue |
|
|
62.3 |
% |
|
|
62.4 |
% |
|
|
64.2 |
% |
| Europe Revenues |
|
$ |
408,084 |
|
|
$ |
387,589 |
|
|
$ |
330,332 |
|
| Asia Pacific Revenues |
|
$ |
132,713 |
|
|
$ |
120,648 |
|
|
$ |
106,701 |
|
| International Revenue |
|
$ |
540,797 |
|
|
$ |
508,237 |
|
|
$ |
437,033 |
|
| % of revenue |
|
|
37.7 |
% |
|
|
37.6 |
% |
|
|
35.8 |
% |
| Consolidated Revenue |
|
$ |
1,435,351 |
|
|
$ |
1,350,145 |
|
|
$ |
1,221,179 |
|
Fiscal 2019 compared to Fiscal 2018
Revenues from our U.S. segment increased 6.3% to $894.6 million in fiscal 2019 compared to $841.9 million in fiscal 2018. This increase was primarily due to increased sales of products and solutions to new and existing clients primarily in Analytics and Trading, CTS and Wealth, an annual price increase for the majority of our U.S. segment clients, partially offset by cancellations. Excluding the effects of acquisitions and dispositions, organic revenues in the U.S. was up 6.2% compared to fiscal 2018. Revenues from our U.S. operations accounted for 62.3% of our consolidated revenue during fiscal 2019, consistent with the prior year period.
Revenue from our international operations increased 6.4% in fiscal 2019 compared to fiscal 2018.
European revenues increased 5.3% to $408.1 million in fiscal 2019 compared to $387.6 million in fiscal 2018. This increase was primarily driven by increased sales of products and solutions to new and existing clients primarily in Analytics and Trading and CTS, which includes our annual price increase for the majority of our European clients, partially offset by increased cancellations in Research. European organic revenues grew 5.0% in fiscal 2019 compared to fiscal 2018. Foreign currency exchange rate fluctuations decreased our European growth rate by 30 basis points.
Asia Pacific revenues increased 10.0% during fiscal 2019, compared with fiscal 2018. This increase was due mainly to increased sales of products and solutions to new and existing clients primarily in Analytics and Trading, which includes our annual price increase for the majority of our Asia Pacific clients, partially offset by cancellations. Asia Pacific organic revenues grew 10.0% during fiscal 2019 compared to fiscal 2018, with foreign currency exchange rate fluctuations having a minimal impact.
Fiscal 2018 compared to Fiscal 2017
Revenues from our U.S. segment increased 7.4% to $841.9 million in fiscal 2018 compared to $784.1 million in fiscal 2017, due to organic ASV growth across our workflow solutions and strong performance executing new business sales. Cancellations remained relatively flat for fiscal 2018 showing signs of stability. Excluding the effects of acquisitions and dispositions, organic revenues in the U.S. were up 5.1% compared to fiscal 2017. Revenues from our U.S. operations accounted for 62.4% of our consolidated revenue during fiscal 2018, a decrease from 64.2% in fiscal 2017.
Revenue from our international operations increased 16.3% in fiscal 2018 compared to fiscal 2017, due to growth across our workflow solutions, partially offset by higher cancellations compared to the prior year.
European revenues increased 17.3% to $387.6 million in fiscal 2018 compared to $330.3 in fiscal 2017. Excluding the effects of acquisitions and dispositions completed in the last 12 months and foreign currency, European organic revenues grew 9.4% in fiscal 2018 compared to fiscal 2017. Foreign currency exchange rate fluctuations increased our European growth rate by 150 basis points.
Asia Pacific revenues increased 13.1% during fiscal 2018, compared with fiscal 2017. Excluding the effects of acquisitions and dispositions completed in the last 12 months and foreign currency, Asia Pacific organic revenues grew 12.9% during fiscal 2018 compared to fiscal 2017, with foreign currency exchange rate fluctuations having a minimal impact.
Operating Expenses
| |
|
Years ended August 31, |
|
| (in thousands) |
|
2019 |
|
|
2018 |
|
|
2017 |
|
| Cost of services |
|
$ |
663,446 |
|
|
$ |
659,296 |
|
|
$ |
566,580 |
|
| Selling, general and administrative (“SG&A”) |
|
|
333,870 |
|
|
|
324,645 |
|
|
|
302,464 |
|
| Total operating expenses |
|
$ |
997,316 |
|
|
$ |
983,941 |
|
|
$ |
869,044 |
|
| |
|
|
|
|
|
|
|
|
|
|
|
|
| Operating income |
|
$ |
438,035 |
|
|
$ |
366,204 |
|
|
$ |
352,135 |
|
| Operating Margin |
|
|
30.5 |
% |
|
|
27.1 |
% |
|
|
28.8 |
% |
Cost of Services
Fiscal 2019 compared to Fiscal 2018
Cost of services increased 0.6% to $663.4 million in fiscal 2019 compared to $659.3 in fiscal 2018. This increase was primarily due to an increase in data costs and computer-related expenses, partially offset by a reduction in compensation costs and contractor fees. Cost of services, expressed as a percentage of revenue, was 46.2% during fiscal 2019, a decrease of 260 basis points over the prior year period. This decrease was primarily due to revenue growth outpacing the growth of cost of services on a year over year basis, as well as a decrease in compensation costs, partially offset by an increase in computer-related expenses, when expressed as a percentage of revenue.
Employee compensation, when expressed as a percentage of revenue decreased 300 basis points in fiscal 2019, compared to the prior fiscal year. This decrease in employee compensation was primarily driven by a foreign currency benefit from a stronger U.S. dollar, a shift in headcount distribution from our higher to lower cost locations, the timing of new employee hiring, and a restructuring charge impacting the prior year period, partially offset by higher employee benefit costs. Computer-related expenses increased 40 basis points, when expressed as a percentage of revenue for fiscal 2019, compared to the prior year period, primarily driven by increased costs from cloud-based hosting and licensed software arrangements.
Fiscal 2018 compared to Fiscal 2017
Cost of services increased 16.4% to $659.3 million in fiscal 2018 compared to $566.6 million in fiscal 2017. Cost of services, expressed as a percentage of revenue, was 48.8% during fiscal 2018, an increase of 240 basis points over fiscal 2017. This increase was primarily due to higher employee compensation costs driven by increased employee headcount and restructuring actions, incremental data costs from recent acquisitions and additional users as well as amortization of intangible assets associated with our recent acquisitions. This increase was partially offset by a reduction in stock-based compensation expenses from accelerated vesting in fiscal 2017.
Employee compensation, including stock-based compensation, when expressed as a percentage of revenue increased 100 basis points in fiscal 2018, compared to fiscal 2017. The increase is primarily due to the hiring of 497 net new employees over the last 12 months, with the majority of their compensation recorded in cost of services due to their involvement with content collection, engineering and product development. Employee compensation expense further increased due to headcount expansion from fiscal 2017 acquisitions that were included for a full year in fiscal 2018, while fiscal 2017 only included a partial year amount. In addition, during fiscal 2018 we incurred $17.4 million of restructuring charges primarily related to severance of which $8.5 million was recorded within cost of services. Data costs, when expressed as a percentage of revenue, increased 60 basis points due primarily from our recent acquisitions and higher variable data costs associated with additional users. Amortization of acquired intangible assets, when expressed as a percentage of revenue, increased 20 basis points in fiscal 2018 compared to the same period a year ago, primarily due to recent acquisitions, which added $93.2 million of intangible assets to be amortized over a weighted-average life of 11.5 years. These intangible assets were amortized for the full fiscal 2018, while, fiscal 2017 did not include a similar amount of acquisition amortization due to the dates of each acquisition.
Selling, General and Administrative
Fiscal 2019 compared to Fiscal 2018
SG&A expenses increased 2.8% to $333.9 million during fiscal 2019 compared to $324.6 million in fiscal 2018. This increase was primarily due to an increase in bad debt expense and compensation costs, partially offset by a reduction in travel expenses. SG&A expenses, expressed as a percentage of revenue, were 23.3% in fiscal 2019, a decrease of 70 basis points over the prior year period. This year over year decrease was primarily due to revenue growth outpacing the growth of SG&A related expenses, lower employee compensation and a reduction in travel costs, partially offset by an increase in bad debt expense, when expressed as a percentage of revenue.
Employee compensation, when expressed as a percentage of revenue, decreased 50 basis points in fiscal 2019, compared to fiscal 2018. This decrease is primarily driven by a foreign currency benefit from a stronger U.S dollar, a shift in headcount distribution from our higher to lower cost locations, the timing of new employee hiring, and a restructuring charge impacting the prior year period, partially offset by higher employee benefit costs. Travel expenses decreased 30 basis points, as a percentage of revenue, due to an internal focus on cost discipline measures. Bad debt expense increased 60 basis points, as a percentage of revenue.
Fiscal 2018 compared to Fiscal 2017
SG&A expenses increased 7.3% to $324.6 million during fiscal 2018 compared to $302.5 million in fiscal 2017. SG&A expenses, expressed as a percentage of revenue, were 24.0% in fiscal 2018, a decrease of 70 basis points over fiscal 2017. This decrease was primarily due to revenue growth outpacing the growth of SG&A related expenses on a year over year basis, foreign currency exchange gains on hedging activities of our Indian Rupee and lower overall employee compensation including stock-based compensation expense. This decrease was partially offset primarily by higher legal costs, restructuring actions and new employee additions.
Employee compensation, including stock-based compensation, when expressed as a percentage of revenue decreased 50 basis points compared to fiscal 2017. The decrease is primarily related to a higher percentage of our employees working in a cost of services capacity compared to an SG&A role. Compensation for our employees within the content collection, consulting, product development, software and systems engineering groups is recorded within cost of services while employees within our sales and various other support and administrative departments are reflected in SG&A. In fiscal 2018, the majority of our hiring had been in departments within cost of services, thus driving a higher percentage of our employee compensation in this area. Partially offsetting these decreases were higher legal expenses primarily from the settlement of a legal matter in the fourth quarter of fiscal 2018, a full year of employee compensation from acquisitions and $8.9 million of severance charges.
Operating Income and Operating Margin
Fiscal 2019 compared to Fiscal 2018
Operating income increased 19.6% to $438.0 million in fiscal 2019 compared to $366.2 million in fiscal 2018. Operating income increased due to revenue growth, favorable foreign exchange rates which reduced the overall operating expense impact and mainly resulted in a reduction in compensation expense, as well as, decreased costs from restructuring actions, decreased travel expenses and contractor fees, partially offset by an increase in data costs, computer-related expenses and bad debt expense. Our operating margin increased in fiscal 2019 to 30.5%, compared to 27.1% for fiscal 2018. Operating margin increased due to incremental revenue that outpaced the growth of our operating expenses year over year, favorable foreign exchange rates, which reduced the overall operating expense impact and mainly resulted in a reduction in compensation expense, as well as, lower costs from restructuring actions, a reduction in travel expenses, partially offset by higher bad debt expense and computer-related expenses, when expressed as a percentage of revenue.
Fiscal 2018 compared to Fiscal 2017
Operating income increased 4.0% to $366.2 million in fiscal 2018 compared to $352.1 million in fiscal 2017. Our operating margin decreased in fiscal 2018 to 27.1%, compared to 28.8% for fiscal 2017. Operating income increased due to incremental revenue that outpaced the growth of SG&A expenses year over year partially offset by higher cost of services. The reduction in operating margin year over year was due to an increase in employee compensation costs, including restructuring actions, data costs from acquisitions and additional users, amortization of intangible assets associated with acquisitions, and incremental legal fees partially offset by foreign currency exchange gains on hedging activities and lower stock-based compensation.
Operating Income by Segment
| |
|
Years ended August 31, |
|
| (in thousands) |
|
2019 |
|
|
2018 |
|
|
2017 |
|
| U.S. |
|
$ |
179,374 |
|
|
$ |
148,095 |
|
|
$ |
137,104 |
|
| Europe |
|
|
179,258 |
|
|
|
148,977 |
|
|
|
153,676 |
|
| Asia Pacific |
|
|
79,403 |
|
|
|
69,132 |
|
|
|
61,355 |
|
| |
|
|
|
|
|
|
|
|
|
|
|
|
| Consolidated |
|
$ |
438,035 |
|
|
$ |
366,204 |
|
|
$ |
352,135 |
|
Our operating segments are aligned with how we manage the business, the demographic markets we serve, and how the CODMG assesses performance. Our internal financial reporting structure is based on three reportable segments, the U.S., Europe and Asia Pacific, which we believe helps us better manage the business and view the markets we serve. Sales, consulting, data collection, product development and software engineering are the primary functional groups within each segment. Each segment records compensation expense, including stock-based compensation, amortization of intangible assets, depreciation of furniture and fixtures, amortization of leasehold improvements, communication costs, professional fees, rent expense, travel, office and other direct expenses. Expenditures associated with our data centers, third-party data costs and corporate headquarter charges are recorded by the U.S. segment and are not allocated to the other segments. The centers of excellence, located in India and the Philippines, primarily focus on content collection that benefit all our segments. The expenses incurred at these locations are allocated to each segment based on a percentage of revenue.
Fiscal 2019 compared to Fiscal 2018
U.S. operating income increased 21.1% to $179.4 million during fiscal 2019, compared to $148.1 million a year ago. The increase in U.S. operating income was primarily due to revenue growth of 6.3% and a reduction in compensation expense, partially offset by increased computer-related expenses, data costs, bad debt expense and occupancy expense. Compensation expense decreased due to a net reduction in headcount of 4.9% over the past 12 months, the timing of new employee hiring, and a restructuring charge impacting the prior year period, partially offset by higher employee benefit costs. Computer related expenses increased year over year primarily due to increased costs from cloud-based hosting and licensed software arrangements. Data costs increased due to increased acquisition costs of fixed cost content and additional spend on variable cost content to drive revenue growth. Occupancy costs increased primarily related to leasing the new corporate headquarters space in Norwalk, Connecticut.
European operating income increased 20.3% to $179.3 million during fiscal 2019, compared to $149.0 million a year ago. The increase in European operating income was primarily due to revenue growth of 5.3% and an overall reduction in operating expenses driven mainly by a decrease in employee compensation expense and occupancy expense, partially offset by an increase in bad debt expense. Employee compensation decreased primarily due to a foreign currency benefit from a stronger U.S. dollar, a restructuring charge impacting the prior year period, partially offset by a net headcount increase of 2.9% over the past 12 months. Occupancy costs decreased due to a one-time adjustment recognized in fiscal 2019. The impact of foreign currency increased European operating income by $6.6 million year over year.
Asia Pacific operating income increased 14.9% to $79.4 million during fiscal 2019, compared to $69.1 million a year ago. The increase in Asia Pacific operating income was due to revenue growth of 10.0% and benefits from a stronger U.S. dollar, partially offset by increases in compensation expense and occupancy costs. Employee compensation was higher, year over year, due to a 3.3% increase in our Asia Pacific workforce, partially offset by a foreign currency benefit from a stronger U.S. dollar. Occupancy costs increased due primarily to the expansion of office space in India and the Philippines. The impact of foreign currency increased Asia Pacific operating income by $3.2 million year over year.
Fiscal 2018 compared to Fiscal 2017
U.S. operating income increased 8.0% to $148.1 million during fiscal 2018 compared to $137.1 million in fiscal 2017. The increase in U.S. operating income was primarily due to revenue growth of 7.4%, partially offset by increased expenses related to employee compensation, computer equipment and data costs. Employee compensation increased primarily due to annual base salary increases, restructuring actions, and higher employee benefit costs including medical expenditures. Computer related expenses, which include depreciation, maintenance, software and other fees, increased year over year due to expenses associated with upgrades to existing computer systems in Norwalk, additional server equipment in our data centers located in New Jersey and Virginia, as well as laptop computers and peripherals for new and existing employees. Data costs increased due to higher third-party data costs from our recent acquisitions and additional users.
European operating income decreased 3.1% to $149.0 million during fiscal 2018 compared to $153.7 million in fiscal 2017. The impact of foreign currency decreased European operating income by $4.9 million year over year. Additionally, the decrease in European operating income was due to a full year impact of fiscal 2017 acquisitions, that contributed to higher employee compensation, amortization of intangible assets, and data costs, partially offset by revenue growth of 17.3%.
Asia Pacific operating income increased 12.7% to $69.1 million during fiscal 2018 compared to $61.4 million in fiscal 2017. The increase in Asia Pacific operating income was due to revenue growth of 13.1% and benefits from a stronger U.S. dollar, partially offset by increases in employee compensation and occupancy costs. Employee compensation was higher year over year as result of a 9.2% increase in our Asia Pacific workforce. Occupancy costs increased due primarily to an increase in rent expense for additional office space in our Philippines location. The impact of foreign currency increased Asia Pacific operating income by $3.6 million year over year.
Income Taxes, Net Income and Diluted Earnings per Share
| |
|
Years ended August 31, |
|
| (in thousands) |
|
2019 |
|
|
2018 |
|
|
2017 |
|
| Provision for income taxes |
|
$ |
69,175 |
|
|
$ |
84,753 |
|
|
$ |
86,053 |
|
| Net income |
|
$ |
352,790 |
|
|
$ |
267,085 |
|
|
$ |
258,259 |
|
| Diluted earnings per common share |
|
$ |
9.08 |
|
|
$ |
6.78 |
|
|
$ |
6.51 |
|
Income Taxes
Fiscal 2019 compared to Fiscal 2018
The fiscal 2019 provision for income taxes was $69.2 million, a decrease of 18.4% from the same period a year ago. The decrease was primarily attributable to the enactment of the TCJA. The TCJA imposed a one-time transition tax expense, which resulted in a $23.2 million impact to the income tax provision for fiscal 2018, without a comparable impact in fiscal 2019. This transition tax impact was revised during fiscal 2019, resulting in a net benefit of $3.4 million upon finalizing the accounting for the tax effects of the TCJA. The TCJA also lowered the statutory U.S corporate income tax rate from 35% to 21%, effective January 1, 2018, which was fully applicable for fiscal 2019 compared to the lower tax rate being phased in for the prior year comparable period. The reduction in the U.S. corporate income tax rate required a remeasurement of our net U.S. deferred tax position, which resulted in a non-recurring tax charge of $2.2 million during fiscal 2018. The decrease in the income tax provision year over year was partially offset by a $3.3 million income tax expense from finalizing prior years’ tax returns and other discrete items for fiscal 2019.
Our effective tax rate was 16.4% for the full fiscal 2019 year compared to 24.1% a year ago was mainly due the reduction in the federal statutory rate from the enactment of the TCJA that was fully applicable for fiscal year 2019 compared to being phased in for the prior year comparable period. The decrease in the effective tax rate for fiscal 2019 was also due to the one-time transition tax from the TCJA that was recorded in the prior year period. These benefits were partially offset by higher foreign income taxed at rates lower than U.S. rates.
Fiscal 2018 compared to Fiscal 2017
The fiscal 2018 provision for income taxes was $84.8 million, a decrease of 1.5% from fiscal 2017. The decrease was primarily attributable to the impacts associated with the U.S. tax reform under the TCJA. On December 22, 2017, the U.S. government enacted comprehensive tax legislation through the TCJA. The TCJA, among other things, lowered the statutory U.S. corporate income tax rate from 35% to 21%, effective January 1, 2018. Due to our August 31 fiscal year-end, the lower tax rate was phased in, resulting in a blended U.S. statutory federal rate of 25.7% for fiscal 2018. The TCJA also implemented a modified territorial tax system and imposed a mandatory one-time transition tax on accumulated earnings and profits (“E&P”) of foreign subsidiaries that were previously deferred from U.S. income taxes.
Our effective tax rate was 24.1% for the full fiscal 2018 year compared to 25.0% in fiscal 2017, due to higher foreign income taxed at rates lower than U.S. rates, incremental income tax benefits from R&D tax credits and increased excess tax benefits from stock option exercises. These benefits were partially offset by the one-time transition tax of $23.2 million and a $2.3 million tax expense associated with the remeasurement of our net U.S. deferred tax position, both of which related to the TCJA. We had approximately $250 million in undistributed foreign E&P generated prior to December 31, 2017, which resulted in the provisional amount for the one-time transition tax expense of $23.2 million, payable over an eight-year period.
Net Income and Diluted Earnings per Share
Fiscal 2019 compared to Fiscal 2018
Net income increased 32.1% to $352.8 million while diluted earnings per share increased 33.9% to $9.08 during fiscal 2019 compared to fiscal 2018. Net income and diluted EPS increased primarily due to higher operating income, a reduction in the income tax provision primarily due to the TCJA reform, partially offset by an increase in interest expense associated with our outstanding debt. Diluted EPS also benefited from a 0.5 million share reduction in our diluted weighted average shares outstanding, compared to the same period a year ago, mainly due to share repurchases, partially offset by the impact from stock options issued.
Fiscal 2018 compared to Fiscal 2017
Net income increased 3.4% to $267.1 million, while diluted earnings per share increased 4.1% to $6.78 during fiscal 2018 compared to fiscal 2017. Net income and diluted EPS grew primarily from higher revenue from strong performances across our segments and workflow solutions, gains earned from our foreign currency hedges, and a decrease in our effective tax rate due to the TCJA. These benefits were partially offset by an increase in employee compensation expenses, data costs, amortization of intangible assets from acquisitions, occupancy costs, and interest expense associated with our outstanding debt. Diluted EPS also benefited from a 0.3 million reduction in our weighted average shares outstanding due to share repurchases partially offset by stock option exercises during fiscal 2018.
Non-GAAP Financial Measures
To supplement the financial measures prepared in accordance with GAAP, we use non-GAAP financial measures including organic revenue, adjusted operating margin, adjusted net income and adjusted diluted earnings per share. The reconciliations of these non-GAAP financial measures to the most directly comparable financial measures calculated and presented in accordance with GAAP are shown in tables below. These non-GAAP financial measures should not be considered in isolation from, or as a substitute for or superior to, financial measures reported in accordance with GAAP. Moreover, these non-GAAP financial measures have limitations in that they do not reflect all the items associated with the operations of the business as determined in accordance with GAAP. Other companies may calculate similarly titled non-GAAP financial measures differently than we do, limiting the usefulness of those measures for comparative purposes.
Despite the limitations of these non-GAAP financial measures, we believe these adjusted financial measures and the information they provide are useful in viewing our performance using the same tools that management uses to gauge progress in achieving our goals. Adjusted measures may also facilitate comparisons to our historical performance.
The table below provides an unaudited reconciliation of revenue to organic revenue.
| |
|
Twelve Months Ended August 31, |
|
| (In thousands) |
|
2019 |
|
|
2018 |
|
|
Change |
|
| Revenue |
|
$ |
1,435,351 |
|
|
$ |
1,350,145 |
|
|
|
6.3 |
% |
| Deferred revenue fair value adjustment(1) |
|
|
5,185 |
|
|
|
7,691 |
|
|
|
|
|
| Currency impact(2) |
|
|
985 |
|
|
|
— |
|
|
|
|
|
| Organic revenue |
|
$ |
1,441,521 |
|
|
$ |
1,357,836 |
|
|
|
6.2 |
% |
| |
(1) |
Deferred revenue fair value adjustments from purchase accounting. |
| |
(2) |
The impact from foreign currency movements over the past 12 months. |
The table below provides an unaudited reconciliation of operating income, operating margin, net income and diluted EPS to adjusted operating income, adjusted operating margin, adjusted net income and adjusted diluted EPS, respectively.
| |
|
Twelve Months Ended August 31, |
|
| (In thousands, except per share data) |
|
|
2019(1) |
|
|
|
2018(2) |
|
|
Change |
|
| Operating income |
|
$ |
438,035 |
|
|
$ |
366,204 |
|
|
|
19.6 |
% |
| Intangible asset amortization |
|
|
24,920 |
|
|
|
24,665 |
|
|
|
|
|
| Deferred revenue fair value adjustment |
|
|
5,185 |
|
|
|
7,691 |
|
|
|
|
|
| Other items |
|
|
8,045 |
|
|
|
26,950 |
|
|
|
|
|
| Adjusted operating income |
|
$ |
476,185 |
|
|
$ |
425,510 |
|
|
|
11.9 |
% |
| Adjusted operating margin |
|
|
33.2 |
% |
|
|
31.3 |
% |
|
|
|
|
| |
|
|
|
|
|
|
|
|
|
|
|
|
| Net income |
|
$ |
352,790 |
|
|
$ |
267,085 |
|
|
|
32.1 |
% |
| Intangible asset amortization(3) |
|
|
20,262 |
|
|
|
19,723 |
|
|
|
|
|
| Deferred revenue fair value adjustment(4) |
|
|
4,215 |
|
|
|
6,084 |
|
|
|
|
|
| Other items(5) |
|
|
6,315 |
|
|
|
21,614 |
|
|
|
|
|
| Income tax items |
|
|
5,274 |
|
|
|
21,310 |
|
|
|
|
|
| Adjusted net income |
|
$ |
388,856 |
|
|
$ |
335,816 |
|
|
|
15.8 |
% |
| |
|
|
|
|
|
|
|
|
|
|
|
|
| Diluted earnings per common share |
|
$ |
9.08 |
|
|
$ |
6.78 |
|
|
|
33.9 |
% |
| Intangible asset amortization |
|
|
0.52 |
|
|
|
0.50 |
|
|
|
|
|
| Deferred revenue fair value adjustment |
|
|
0.11 |
|
|
|
0.15 |
|
|
|
|
|
| Other items |
|
|
0.15 |
|
|
|
0.56 |
|
|
|
|
|
| Income tax items |
|
|
0.14 |
|
|
|
0.53 |
|
|
|
|
|
| Adjusted diluted earnings per common share(6) |
|
$ |
10.00 |
|
|
$ |
8.53 |
|
|
|
17.2 |
% |
| Weighted average common shares (diluted) |
|
|
38,873 |
|
|
|
39,377 |
|
|
|
|
|
| |
(1) |
Operating income, net income and diluted EPS in fiscal 2019 were adjusted to exclude (i) intangible asset amortization (ii) deferred revenue fair value adjustments from purchase accounting, and (iii) other items including severance, stock-based compensation acceleration, professional fees for infrastructure upgrade activities, a one-time adjustment related to data costs and occupancy costs, partially offset by non-core transaction related revenue. Net income and diluted EPS in fiscal 2019 were also adjusted to exclude amounts primarily related to finalizing prior years' tax returns and other discrete items. |
| |
(2) |
Operating income, net income and diluted EPS in fiscal 2018 were adjusted to exclude (i) intangible asset amortization (ii) deferred revenue fair value adjustments from purchase accounting, and (iii) other items including restructuring, legal matters and other corporate actions. Net income and diluted EPS in fiscal 2018 were also adjusted to exclude a one-time deemed repatriation tax on foreign earnings. |
| |
(3) |
The intangible asset amortization was recorded net of a tax impact of $4.7 million in fiscal 2019 compared with $4.9 million for fiscal 2018. |
| |
(4) |
The deferred revenue fair value adjustment was recorded net of a tax impact of $1.0 million in fiscal 2019 compared with $1.6 million for fiscal 2018. |
| |
(5) |
The other items were recorded net of a tax impact of $1.7 million in fiscal 2019 compared with $5.3 million for fiscal 2018. |
| |
(6) |
Details may not sum to total due to rounding |
Liquidity
The table below, for the periods indicated, provides selected cash flow information:
| |
|
Years ended August 31, |
|
| (in thousands) |
|
2019 |
|
|
2018 |
|
|
2017 |
|
| Net cash provided by operating activities |
|
$ |
427,136 |
|
|
$ |
385,668 |
|
|
$ |
320,527 |
|
| Capital expenditures(1) |
|
|
(59,370 |
) |
|
|
(33,520 |
) |
|
|
(36,862 |
) |
| Free cash flow(2) |
|
$ |
367,766 |
|
|
$ |
352,148 |
|
|
$ |
283,665 |
|
| Net cash used in investing activities |
|
$ |
(56,100 |
) |
|
$ |
(48,531 |
) |
|
$ |
(347,306 |
) |
| Net cash used in financing activities |
|
$ |
(214,274 |
) |
|
$ |
(320,037 |
) |
|
$ |
(8,161 |
) |
| Cash and cash equivalents at end of year |
|
$ |
359,799 |
|
|
$ |
208,623 |
|
|
$ |
194,731 |
|
| |
(1) |
Included in net cash used in investing activities during each fiscal year reported. |
| |
(2) |
Free cash flow is defined as cash provided by operating activities, which includes the cash cost for taxes and changes in working capital, less capital expenditures. |
Fiscal 2019 compared to Fiscal 2018
Cash and cash equivalents aggregated to $359.8 million, or 23.1% of total assets at August 31, 2019, compared with $208.6 million, or 14.7% of total assets at August 31, 2018. Our cash and cash equivalents increased $151.2 million during fiscal 2019, primarily due to $575.0 million in proceeds from debt, $427.1 million of net cash provided by operating activities, $107.1 million in proceeds from the exercise of employee stock options and $3.3 million in net proceeds from investments. These cash inflows were partially offset by $575.0 million related to the repayment of debt, $220.4 million in share repurchases (which included $213.1 million under the existing share repurchase program and $7.3 million in shares repurchased from employees to cover their cost of taxes upon vesting of restricted stock), $100.1 million in dividend payments, $59.4 million of capital expenditures, and $5.6 million from the effects of foreign currency translations.
Net cash used in investing activities was $56.1 million in fiscal 2019, representing a $7.6 million increase in cash used from investing activities, compared to fiscal 2018. This increase was primarily due to $25.9 million of higher capital expenditures, offset by a $15.0 million decrease in acquisition activity, and a $3.3 million increase in net proceeds from investments (net of purchases).
During fiscal 2019, net cash used in financing activities was $214.3 million, representing a $105.8 million decrease from fiscal 2018. This decrease was due primarily to $575.0 million of borrowings under our 2019 Credit Agreement, an $83.6 million decrease in share repurchases and a $35.4 million increase in proceeds from employee stock plans. This decrease was partially offset by the $575.0 million retirement of the 2017 Credit Agreement and a $10.6 million increase in dividend payments. Refer to the Capital Resources section of the MD&A for a discussion on our Long-term debt borrowings.
We expect that for at least the next 12 months, our operating expenses will continue to constitute a significant use of our cash. As of August 31, 2019, our total cash and cash equivalents worldwide was $359.8 million, with $132.6 million included in the U.S. segment, the majority of which is held in bank accounts located within the U.S., $183.5 million in the Europe segment, predominantly within bank accounts in the UK, France, and Germany, and the remaining $43.7 million held in the Asia Pacific segment. As of August 31, 2019, we also had $574.2 million in outstanding borrowings (net of $0.8 million of unamortized debt issuance costs). We believe our liquidity (including cash on hand, cash from operating activities and other cash flows that we expect to generate) within each geographic segment will be sufficient to meet our short-term and long-term operating requirements, including working capital needs, capital expenditures, dividend payments, stock repurchases, growth objectives and other financing activities. In addition, we expect existing foreign cash, cash equivalents and cash flows from operations to continue to be sufficient to fund our foreign operating activities and cash commitments for investing activities, such as capital expenditures, for at least the next 12 months and thereafter, for the foreseeable future.
Free cash flow generated in fiscal 2019 was $367.8 million, an increase of 4.4% compared to $352.1 million in fiscal 2018. Free cash flow is the result of $427.1 million of net cash provided by operating activities, partially offset by $59.4 million in capital expenditures. The year over year increase to free cash flow was primarily driven by higher net income and an increase in client collections due to a reduction in our days sales outstanding ("DSO") to 37 days as of August 31, 2019, compared to 41 days for the prior year period, partially offset by higher capital requirements from the build-out of new office space and the timing of supplier and tax payments.
Fiscal 2018 compared to Fiscal 2017
Cash and cash equivalents aggregated to $208.6 million, or 14.7% of our total assets at August 31, 2018, compared with $194.7 million, or 13.8% of our total assets at August 31, 2017. Our cash and cash equivalents increased $13.9 million during fiscal 2018 due to net cash provided by operating activities of $385.7 million and $71.6 million in proceeds from the exercise of employee stock options. These cash inflows were partially offset by $89.4 million in dividend payments, $33.5 million of capital expenditures, $15.0 million related to a business investment, $3.2 million from the effects of foreign currency translations and $303.9 million in share repurchases, which included $302.4 million under the existing share repurchase program and $1.5 million in shares repurchased from employees to cover their cost of taxes upon vesting of restricted stock.
Net cash used in investing activities was $48.5 million in fiscal 2018, representing a $298.8 million decrease from fiscal 2017. This reduction was primarily due to decreased acquisition activity with $15.0 million invested in fiscal 2018 compared to $303.1 million largely related to the BI-SAM Technologies (“BISAM”) and Vermilion Holdings Limited (“Vermilion”) acquisitions in fiscal 2017. Additionally, cash used in investing activities decreased year over year due to lower capital expenditures of $3.3 million and a decrease in the purchase of investments (net of proceeds) of $7.4 million year over year
During fiscal 2018, net cash used in financing activities was $320.0 million, representing a $311.9 million increase from fiscal 2017. This increase was due to $275.0 million in proceeds (net of repayment) from the issuance of long-term debt in fiscal 2017 that did not occur in fiscal 2018. In addition, the decrease was due to higher dividend payments of $8.5 million, an increase in share repurchases of $43.0 million, and a change in the presentation of tax benefits from share-based payment arrangements due to the adoption of the accounting standard update, which required us to disclose benefits from stock option exercises as an operating cash inflow instead of a financing activity. This presentation change was adopted prospectively beginning with fiscal 2018. These cash outflows were partially offset by an increase in proceeds from employee stock plans of $21.6 million.
Free cash flow generated in fiscal 2018 was $352.1 million, an increase of 24.1% compared to $283.7 million in fiscal 2017. Free cash flow was attributable to $267.1 million of net income, $87.0 million of non-cash items, $31.6 million of working capital changes, less $33.5 million in capital expenditures. The year over year free cash flow growth was driven by positive working capital changes totaling $47.6 million and lower capital expenditures of $3.3 million. Working capital improved year over year due to timing of supplier payments and payroll, stabilization of our days sales outstanding (“DSO”) at 41 days and the adoption of an accounting standard update for share-based payments, which required the presentation of benefits from stock options exercised to be reported as an operating activity, when in prior periods it was reported as a financing activity.
Capital Resources
Capital Expenditures
Capital expenditures were $59.4 million during fiscal 2019, compared to $33.5 million a year ago. Capital expenditures of $28.0 million, or 47%, were primarily related to corporate infrastructure investments, additional server equipment for our data centers located in New Jersey and Virginia, as well as computers and peripherals for new office space primarily in India. The remainder of our capital expenditures was primarily for the build-out of office space, with $22.3 million related to the new corporate headquarters in Norwalk, Connecticut and $6.6 million related to new office space in India.
Capital expenditures were $33.5 million during fiscal 2018, down from $36.9 million in fiscal 2017. Capital expenditures of $24.2 million, or 72% of our capital expenditures during fiscal 2018 related to upgrades to existing computer systems in Norwalk, additional server equipment in our data centers located in New Jersey and Virginia, as well as laptop computers and peripherals for new and existing employees. The remainder of our capital expenditures was primarily for the build out of office space including $2.2 million at our India location, $2.8 million at our Hong Kong location and $1.5 million at our Netherlands location.
Capital Needs
Long-Term Debt
2019 Credit Agreement
On March 29, 2019, the Company entered into the 2019 Credit Agreement ("the 2019 Credit Agreement") between FactSet, as the borrower, and PNC Bank, National Association ("PNC"), as the administrative agent and lender. The 2019 Credit Agreement provides for a $750.0 million revolving credit facility ("the 2019 Revolving Credit Facility"). FactSet may request borrowings under the 2019 Revolving Credit Facility until its maturity date of March 29, 2024. The 2019 Credit Agreement also allows FactSet, subject to certain requirements, to arrange for additional borrowings with PNC for an aggregate amount of up to $500.0 million, provided that any such request for additional borrowings must be in a minimum amount of $25.0 million.
FactSet borrowed $575.0 million of the available $750.0 million provided by the 2019 Revolving Credit Facility, resulting in $175.0 million available to be withdrawn. FactSet is required to pay a commitment fee using a pricing grid currently at 0.10% based on the daily amount by which the available balance in the 2019 Revolving Credit Facility exceeds the borrowed amount. All outstanding loan amounts are reported as Long-term debt within the consolidated balance sheets at August 31, 2019. The principal balance is payable in full on the maturity date.
The fair value of our long-term debt was $575.0 million as of August 31, 2019, which the Company believe approximates carrying amount as the terms and interest rates approximate market rates given its floating interest rate basis. Borrowings under the loan bear interest on the outstanding principal amount at a rate equal to the daily LIBOR rate plus a spread using a debt leverage pricing grid, currently at 0.875%. During fiscal years 2019, 2018 and 2017, FactSet recorded interest expense of $19.8 million, $15.9 million and $8.4 million, respectively, on its outstanding debt amounts. The weighted average interest rate on amounts outstanding under our credit facilities was 3.35% and 2.69% as of August 31, 2019 and 2018, respectively. Interest on the loan outstanding is payable quarterly, in arrears, and on the maturity date.
During fiscal 2019, FactSet incurred approximately $0.9 million in debt issuance costs related to the 2019 Credit Agreement. These costs were capitalized as loan origination fees and are amortized into interest expense ratably over the term of the 2019 Credit Agreement.
The 2019 Credit Agreement contains covenants and requirements restricting certain FactSet activities, which are usual and customary for this type of loan. In addition, the 2019 Credit Agreement requires that FactSet maintain a consolidated net leverage ratio, as measured by total net funded debt/EBITDA below a specified level as of the end of each fiscal quarter. The Company was in compliance with all the covenants and requirements within the 2019 Credit Agreement as of August 31, 2019.
The borrowings from the 2019 Credit Agreement were used to retire all outstanding debt under the previous 2017 Credit Agreement between FactSet, as the borrower, and PNC as the lender on March 29, 2019. The total principal amount of the debt outstanding at the time of retirement was $575.0 million and there were no prepayment penalties.
2017 Credit Agreement
On March 17, 2017, the Company entered into a Credit Agreement (the "2017 Credit Agreement") between FactSet, as the borrower, and PNC Bank, National Association ("PNC"), as the administrative agent and lender. The 2017 Credit Agreement provided for a $575.0 million revolving credit facility (the "2017 Revolving Credit Facility"). The 2017 Credit Agreement also allowed FactSet, subject to certain requirements, to arrange for additional borrowings with PNC for an aggregate amount of up to $225.0 million, provided that any such request for additional borrowings was in a minimum amount of $25.0 million. FactSet could have requested borrowings under the 2017 Revolving Credit Facility until its maturity or retirement date. Borrowings under the loan were subject to interest on the outstanding principal amount at a rate equal to the daily LIBOR rate plus 1.00%. Interest on the loan outstanding was payable quarterly in arrears and on the maturity date. There were no prepayment penalties if the Company elected to prepay the outstanding loan amounts prior to the scheduled maturity date. The principal balance was repaid in full on March 29, 2019.
Letters of Credit
From time to time, we are required to obtain letters of credit in the ordinary course of business. Approximately $2.8 million of standby letters of credit have been issued in connection with our leased office spaces as of August 31, 2019. These standby letters of credit contain covenants that, among other things, require us to maintain minimum levels of consolidated net worth and certain leverage and fixed charge ratios. As of August 31, 2019 and 2018, we were in compliance with all covenants contained in the standby letters of credit.
Foreign Currency
Foreign Currency Exposure
Certain wholly-owned subsidiaries within the Europe and Asia Pacific segments operate under a functional currency different from the U.S. dollar. The financial statements of these foreign subsidiaries are translated into U.S. dollars using period-end rates of exchange for assets and liabilities and average rates for the period for revenues and expenses. Translation gains and losses that arise from translating assets, liabilities, revenues and expenses of foreign operations are recorded in accumulated other comprehensive (loss) income as a component of stockholders’ equity.
Our foreign currency exchange exposure is related to our operating expense base in countries outside the U.S., where 76% of our employees were located as of August 31, 2019. During fiscal 2019, foreign currency movements increased operating income by $10.1 million, compared to a decrease in operating income by $1.3 million for fiscal 2018.
Foreign Currency Hedges
As of August 31, 2019, we maintained the following foreign currency forward contracts to hedge our exposures:
| |
• |
Philippine Peso – foreign currency forward contracts to hedge approximately 75% of our Philippine Peso exposure through the fourth quarter of fiscal 2020. |
| |
• |
Indian Rupee – foreign currency forward contracts to hedge approximately 50% of our Indian Rupee exposure through the end of the third quarter of fiscal 2020, and 25% of our Indian Rupee exposure through the fourth quarter of fiscal 2020. |
| |
• |
Euro – foreign currency forward contracts to hedge approximately 75% of our Euro exposure through the first quarter of fiscal 2020, 50% of our Euro exposure from the second quarter through the third quarter of fiscal 2020, and 25% of our Euro exposure through the fourth quarter of fiscal 2020. |
| |
• |
British Pound Sterling – foreign currency forward contracts to hedge approximately 75% of our British Pound sterling exposure through the first quarter of fiscal 2020, 50% of our British Pound Sterling exposure from the second quarter through the third quarter of fiscal 2020, and 25% of our British Pound sterling exposure through the fourth quarter of fiscal 2020. |
As of August 31, 2019, the gross notional value of foreign currency forward contracts to purchase Philippine Pesos and Indian Rupees with U.S. dollars was ₱1.4 billion and Rs.1.4 billion, respectively. The gross notional value of foreign currency forward contracts to purchase U.S. dollars with Euros and British Pound Sterling was €35.7 million and £20.5 million, respectively.
There were no other outstanding foreign currency contracts as of August 31, 2019. A loss on derivatives of $1.8 million was recorded in operating income during fiscal 2019, compared to a gain of $3.1 million in fiscal 2018.
Off-Balance Sheet Arrangements
At August 31, 2019 and 2018, we had no off-balance sheet financing or other arrangements with unconsolidated entities or financial partnerships (such as entities often referred to as structured finance or special purpose entities) established for purposes of facilitating off-balance sheet financing or other debt arrangements or for other contractually limited purposes.
Share Repurchase Program
Repurchases will be made from time to time in the open market and privately negotiated transactions, subject to market conditions. In fiscal 2019, we repurchased 0.9 million shares for $213.1 million compared to 1.5 million shares for $302.4 million in fiscal 2018 under the existing share repurchase program. Over the last 12 months, we have returned $320.4 million to stockholders in the form of share repurchases and dividends.
On June 24, 2019, the Board of Directors of FactSet approved a $210.0 million expansion of the existing share repurchase program. Subsequent to this expansion, $238.6 million is available for future repurchases as of August 31, 2019.
Contractual Obligations
Fluctuations in our operating results, the degree of success of our accounts receivable collection efforts, the timing of tax and other payments, as well as, necessary capital expenditures to support growth of our operations will impact our liquidity and cash flows in future periods. The effect of our contractual obligations on our liquidity and capital resources in future periods should be considered in conjunction with the factors disclosed below. As of August 31, 2019 and 2018, we had total purchase commitments with suppliers of $83.3 million and $79.0 million, respectively. There were no material changes in the Company’s purchase commitments with suppliers during fiscal 2019.
The following table summarizes our significant contractual obligations as of August 31, 2019 and the corresponding effect that these obligations will have on our liquidity and cash flows in future periods:
| |
|
Payments due by period |
|
| (in millions) |
|
2020 |
|
|
|
2021-2022 |
|
|
|
2023-2024 |
|
|
2025 and thereafter |
|
|
Total |
|
| Operating lease obligations(1) |
|
$ |
41.4 |
|
|
$ |
76.1 |
|
|
$ |
67.0 |
|
|
$ |
215.5 |
|
|
$ |
400.0 |
|
| Purchase commitments(2) |
|
|
62.7 |
|
|
|
17.8 |
|
|
|
2.8 |
|
|
|
— |
|
|
|
83.3 |
|
| Long-term debt obligations(3) |
|
|
— |
|
|
|
— |
|
|
|
575.0 |
|
|
|
— |
|
|
|
575.0 |
|
| Total contractual obligations by period(4) |
|
$ |
104.1 |
|
|
$ |
93.9 |
|
|
$ |
644.8 |
|
|
$ |
215.5 |
|
|
$ |
1,058.3 |
|
| |
(1) |
Operating lease amounts include future minimum lease payments under all our non-cancelable operating leases with an initial term in excess of one year. For more information on our operating leases, see Note 19, Commitments and Contingencies, in the Notes to the Company’s Consolidated Financial Statements included in Item 8 of this Report on Form 10-K. |
| |
(2) |
Purchase commitments represent payments due in future periods in respect of obligations to our various data vendors as well as commitments to purchase goods and services such as telecommunication services, computer software and maintenance support and consulting services. |
| |
(3) |
Represents the amount due under the Company’s 2019 Credit Agreement. |
| |
(4) |
Non-current income taxes payable of $26.3 million and non-current deferred tax liabilities of $16.4 million have been excluded in the table above due to uncertainty regarding the timing of future payments. |
Purchase orders do not necessarily reflect a binding commitment but are merely indicative of authorizations and intention to conclude purchases in the future. For the purpose of this tabular disclosure, purchase obligations for goods and services are defined as agreements that are enforceable and legally binding on us and that specify all significant terms, including: fixed or minimum quantities to be purchased; fixed, minimum or variable price provisions; and the approximate timing of the transaction. It is expected that all the contractual obligations noted in the table will be funded from existing cash and cash flows from operations. Expected timing pertaining to the contractual obligations included in the table above has been estimated based on information currently available. The amounts paid, and the timing of those payments may differ based on when the goods and services provided by our vendors to whom we are contractually obligated are received, as well, as due to changes to agreed-upon amounts for any of our obligations.
On February 14, 2018, we entered into a new lease to relocate our corporate headquarters to 45 Glover Avenue in Norwalk, Connecticut. The new location will comprise approximately 173,000 square feet of office space. We took possession of the newly leased property on January 1, 2019 for fit-out purposes. We will continue to occupy our existing headquarters space until the new headquarters property is ready for occupancy, currently estimated to be in the second quarter of fiscal 2020.
Including new lease agreements executed during fiscal 2019, our worldwide leased office space increased to approximately 1,860,000 square feet at August 31, 2019, up 110,000 square feet, or 6.3% from August 31, 2018. This increase was primarily related to additional office space in India. Future minimum requirements for our operating leases in place as of August 31, 2019 totaled $400.0 million, a decrease from $407.8 million as of August 31, 2018. This decrease is primarily due the passage of a year on remaining rental agreement terms, reducing the overall future minimum lease obligation, partially offset by added office space in India.
As disclosed earlier in the Capital Resources section of this MD&A, we entered into the 2019 Credit Agreement on March 29, 2019 and borrowed $575.0 million. In conjunction with the 2019 Credit Agreement, FactSet retired its loan outstanding under the 2017 Credit Agreement amount of $575.0 million.
With the exception of the new leases entered in the ordinary course of business, there were no other significant changes to our contractual obligations during fiscal 2019.
Dividends
On August 9, 2019, our Board of Directors approved a regular quarterly dividend of $0.72 to be paid on September 19, 2019. The $0.08 per share or 12.5% increase marked our 14th consecutive year we have increased dividends, highlighting our continued commitment to returning value to shareholders. Over the last 12 months, we have returned $320.4 million to stockholders in the form of share repurchases and cash dividends. Future cash dividends will depend on our earnings, capital requirements, financial condition and other relevant factors. Dividends must be authorized by our Board of Directors.
During fiscal years 2019 and 2018, our Board of Directors declared the following dividends on our common stock:
| Year Ended |
|
Dividends per Share of Common Stock |
|
|
Record Date |
|
Total $ Amount (in thousands) |
|
|
Payment Date |
| Fiscal 2019 |
|
|
|
|
|
|
|
|
|
|
|
|
| First Quarter |
|
$ |
0.64 |
|
|
November 30, 2018 |
|
$ |
24,372 |
|
|
December 18, 2018 |
| Second Quarter |
|
$ |
0.64 |
|
|
February 28, 2019 |
|
$ |
24,385 |
|
|
March 19, 2019 |
| Third Quarter |
|
$ |
0.72 |
|
|
May 31, 2019 |
|
$ |
27,506 |
|
|
June 18, 2019 |
| Fourth Quarter |
|
$ |
0.72 |
|
|
August 30, 2019 |
|
$ |
27,445 |
|
|
September 19, 2019 |
| |
|
|
|
|
|
|
|
|
|
|
|
|
| Fiscal 2018 |
|
|
|
|
|
|
|
|
|
|
|
|
| First Quarter |
|
$ |
0.56 |
|
|
November 30, 2017 |
|
$ |
21,902 |
|
|
December 19, 2017 |
| Second Quarter |
|
$ |
0.56 |
|
|
February 28, 2018 |
|
$ |
21,799 |
|
|
March 20, 2018 |
| Third Quarter |
|
$ |
0.64 |
|
|
May 31, 2018 |
|
$ |
24,566 |
|
|
June 19, 2018 |
| Fourth Quarter |
|
$ |
0.64 |
|
|
August 31, 2018 |
|
$ |
24,443 |
|
|
September 18, 2018 |
Significant Accounting Policies
We describe our significant accounting policies in Note 3, Summary of Significant Accounting Policies, of the Notes to our Consolidated Financial Statements included in Item 8 below.
Critical Accounting Estimates
We consider an accounting estimate to be critical if: (i) the accounting estimate requires us to make assumptions about matters that were highly uncertain at the time the accounting estimate was made, and (ii) changes in the estimate that are reasonably likely to occur from period to period, or use of different estimates that we reasonably could have used in the current period, would have a material impact on our financial condition or results of operations. Management has discussed the development and selection of these critical accounting estimates with the Audit Committee of our Board of Directors. In addition, there are other items within our consolidated financial statements that require estimation but are not deemed critical as defined above. Changes in estimates used in these and other items could have a material impact on our financial statements.
Business Combinations
The Company accounts for its business combinations using the purchase method of accounting. The acquisition purchase price is allocated to the underlying identified, tangible and intangible assets and liabilities assumed, based on their respective estimated fair values on the acquisition date. The excess of the purchase consideration over the fair values of the identified assets and liabilities is recorded as goodwill and assigned to one or more reporting units. The amounts and useful lives assigned to acquisition-related tangible and intangible assets impact the amount and timing of future amortization expense. Determining the fair value of assets acquired and liabilities assumed and the expected useful life, requires management’s judgment and often involves the use of significant estimates and assumptions, including assumptions with respect to future cash inflows and outflows, discount rates, asset lives and market multiples, among other items. Acquisition-related expenses and restructuring costs are recognized separately from the business combination and are expensed as incurred.
Performance-based Equity Awards
Performance-based equity awards, whether in the form of stock options or restricted stock, require management to make assumptions regarding the likelihood of achieving performance targets. The number of performance-based awards that vest will be predicated on achieving performance levels during the measurement period subsequent to the date of grant. Dependent on the financial performance levels attained, a percentage of the performance-based awards will vest to the grantees. However, there is no current guarantee that such awards will vest in whole or in part.
June 2017 Performance-based Option Grant Review
In connection with the acquisition of BISAM, FactSet granted 206,417 performance-based stock options in June 2017. These performance-based options were scheduled to vest 40% on the second anniversary date of the grant and 20% on each subsequent anniversary date, if certain BISAM revenue and operating income targets were achieved by March 31, 2019. In the third quarter of fiscal 2019, it was determined that the performance criteria were not achieved by March 31, 2019, and, as such, the options were forfeited, and no stock-based compensation expense was recorded for this performance-based option grant for fiscal 2019.
Accrued Compensation
We make significant estimates in determining our accrued compensation. We conduct a final review of Company, departmental and individual performance each year end to determine the amount of discretionary employee compensation. We also review compensation throughout the year to determine how overall performance tracks against management’s expectations. Management takes these and other factors, including historical performance, into account in reviewing accrued compensation estimates on a quarterly basis and adjusts accrual rates as appropriate. As of August 31, 2019, and 2018, the amount of the variable employee compensation recorded within accrued compensation was $49.4 million and $43.6 million, respectively.
Goodwill and Intangible Assets
Goodwill is not amortized as it is estimated to have an indefinite life. At least annually, we are required to test goodwill at the reporting unit level for potential impairment, and, if impaired, write down to fair value based on the present value of discounted cash flows. Our reporting units evaluated for potential impairment were the U.S., Europe and Asia Pacific, which is aligned with how the chief operating decision making group (“CODMG”), composed of the CEO and executive management, manages the business and the demographic markets we serve. The three reporting units are consistent with the operating segments reported as there is no discrete financial information available for the subsidiaries or business units within each operating segment. The impairment test requires management to make judgments in connection with these reporting units, including assigning assets, liabilities, goodwill and other indefinite-lived intangible assets to reporting units and determining the fair value of each reporting unit.
Our impairment analysis contains uncertainties as it requires management to make assumptions and apply judgment to estimate industry and economic factors including market conditions, legal and technological factors and the profitability of our business strategies. It is our policy to conduct impairment testing based on our current business strategies taking into consideration present industry and economic conditions, as well as future expectations. In fiscal 2019, we elected to perform a qualitative analysis for the reporting units to determine whether it is more likely than not the fair value of the reporting unit is greater than its carrying value. In performing a qualitative assessment, FactSet considers such factors as macro-economic conditions, industry and market conditions in which FactSet operates including the competitive environment and significant changes in demand for the Company’s services. The Company also considers its share price both in absolute terms and in relation to peer companies. If the qualitative analysis indicates that it is more likely than not the fair value of a reporting unit is less than its carrying amount or if FactSet elects not to perform a qualitative analysis, a quantitative analysis is performed to determine whether a goodwill impairment exists.
Future events could cause us to conclude that indicators of impairment do exist, and that goodwill associated with our previous acquisitions is impaired, which could result in an impairment loss in our Consolidated Statements of Income and a write-down of the related asset.
We performed our annual goodwill impairment test during the fourth quarter of fiscal 2019, consistent with the timing of previous years. It was determined that there was no impairment, as it was not more likely than not the fair value of any reporting unit was less than its carrying value, using the qualitative screen. The carrying value of goodwill as of August 31, 2019 and 2018, was $685.7 million and $701.8 million, respectively.
Our identifiable intangible assets consist of acquired content databases, client relationships, software technology, non-compete agreements and trade names resulting from acquisitions, which have been fully integrated into our operations. We amortize intangible assets over their estimated useful lives, which are evaluated quarterly to determine whether events and circumstances warrant a revision to the remaining period of amortization. The weighted average useful life of our identifiable intangible assets at August 31, 2019 was 12.6 years. If the estimate of the remaining useful life is changed, the remaining carrying amount of the intangible asset is amortized prospectively over that revised remaining useful life. There were no material adjustments to the useful lives of intangible assets subject to amortization during any of the periods presented. These intangible assets had no assigned residual values as of August 31, 2019 and 2018.
Intangible assets are reviewed for impairment whenever events or changes in circumstances indicate that the carrying amount of such assets may not be recoverable. Determination of recoverability is based on an estimate of undiscounted future cash flows resulting from the use of the asset and its eventual disposition. Measurement of any impairment loss for intangible assets that management expects to hold, and use is based on the amount the carrying value exceeds the fair value of the asset, which may be based on estimated future cash flows (discounted). No indicators of impairment of intangible assets has been identified during any of the periods presented. Our ongoing consideration of the recoverability could result in impairment charges in the future, which could adversely affect our results of operations. The carrying value of intangible assets as of August 31, 2019 and 2018, was $120.6 million and $148.9 million, respectively.
Long-lived Assets
Long-lived assets, comprised of property, equipment and leasehold improvements are evaluated for impairment whenever events or changes in circumstances indicate the carrying value may not be recoverable. Factors that may cause an impairment review include significant changes in technology that make current computer-related assets that we use in our operations obsolete or less useful, and significant changes in the way we use these assets in our operations. When evaluating long-lived assets for potential impairment, if impairment indicators are present, we first compare the carrying value of the asset to the asset’s estimated future cash flows (undiscounted and excluding interest charges). If the estimated future cash flows are less than the carrying value of the asset, we calculate an impairment loss. The impairment loss calculation compares the carrying value of the asset to the asset’s estimated fair value, which may be based on estimated future cash flows (discounted). We recognize an impairment loss if the amount of the asset’s carrying value exceeds the asset’s estimated fair value. If we recognize an impairment loss, the adjusted carrying amount of the asset becomes its new cost basis. The new cost basis will be depreciated (amortized) over the remaining useful life of that asset. Using the impairment evaluation methodology described here, there have been no long-lived asset impairment charges for each of the last three years. The carrying value of long-lived assets was $132.5 million as of August 31, 2019 and $100.5 million as of August 31, 2018.
Our impairment loss calculations contain uncertainties because they require management to make assumptions and to apply judgment to estimate future cash flows and asset fair values, including forecasting useful lives of the assets and selecting the discount rate that reflects the risk inherent in future cash flows. We have not made any material changes in our impairment loss assessment methodology during the past three fiscal years. We do not believe there is a reasonable likelihood that there will be a material change in the estimates or assumptions we use to calculate long-lived asset impairment losses. However, if actual results are not consistent with our estimates and assumptions used in estimating future cash flows and asset fair values, we may be exposed to losses that could be material.
Estimated Tax Provision and Tax Contingencies
We are subject to income taxes in the U.S. and numerous foreign jurisdictions. Our tax provision is an estimate based on our understanding of laws in Federal, state and foreign tax jurisdictions. These laws can be complicated and are difficult to apply to any business. The tax laws also require us to allocate our taxable income to many jurisdictions based on subjective allocation methodologies and information collection processes. Our effective tax rates differ from the statutory rate primarily due to the impact of state taxes, foreign operations, R&D and other tax credits, tax audit settlements, incentive-stock options and the Foreign Derived Intangible Income Deduction. Our annual effective tax rate was 16.4%, 24.1% and 25.0% in fiscal 2019, 2018 and 2017, respectively.
Our provision for income taxes is subject to volatility and could be adversely impacted by numerous factors such as changes in tax laws, regulations, or accounting principles, including accounting for uncertain tax positions or interpretations of them. Significant judgment is required to determine recognition and measurement. Further, as a result of certain ongoing employment and capital investment actions and commitments, our income in certain countries is subject to reduced tax rates and in some cases is wholly exempt from tax. Our failure to meet these commitments could adversely affect our provision for income taxes. In addition, we are subject to the continuous examination of our income tax returns by the Internal Revenue Service and other tax authorities. We regularly assess the likelihood of adverse outcomes resulting from these examinations to determine the adequacy of our provision for income taxes. There can be no assurance that the outcomes from these continuous examinations will not have an adverse impact on our operating results and financial condition.
To account for unrecognized tax benefits, we first determine whether it is more-likely-than-not (defined as a likelihood of more than fifty percent) that a tax position will be sustained based on its technical merits as of the reporting date. A tax position that meets this more-likely-than-not threshold is then measured and recognized at the largest amount of benefit that is greater than fifty percent likely to be realized upon effective settlement with a taxing authority. The determination of liabilities related to unrecognized tax benefits, including associated interest and penalties, requires significant estimates. There can be no assurance that we will accurately predict the outcomes of these audits, however, we have no reason to believe that such audits will result in the payment of additional taxes and/or penalties that would have a material adverse effect on the Company’s results of operations or financial position, beyond current estimates. For this reason and due to ongoing audits by multiple tax authorities, we regularly engage in discussions and negotiations with tax authorities regarding tax matters in various jurisdictions. We adjust these reserves in light of changing facts and circumstances, such as the closing of a tax audit or the refinement of an estimate. To the extent that the final outcome of these matters is different than the amounts recorded, such differences will affect the provision for income taxes in the period in which such determination is made. The Company does not currently anticipate that the total amounts of unrecognized tax benefits will significantly change within the next 12 months.
We classify the liability for unrecognized tax benefits as Taxes Payable (non-current) and to the extent that we anticipate payment of cash within one year, the benefit will be classified as Taxes Payable (current). Additionally, we accrue interest on all tax exposures for which reserves have been established consistent with jurisdictional tax laws. This interest is classified as income tax expense in the financial statements. As of August 31, 2019, we had gross unrecognized tax benefits totaling $10.9 million, including $1.1 million of accrued interest, recorded as Taxes Payable (non-current) within the Consolidated Balance Sheets.
New Accounting Pronouncements
See Note 3, Summary of Significant Accounting Policies, in the Notes to the Company’s Consolidated Financial Statements included in Item 8 for a full description of recent accounting pronouncements, including the expected dates of adoption, which we include here by reference.
Market Trends
In the ordinary course of business, we are exposed to financial risks involving the volatility of equity markets as well as foreign currency and interest rate fluctuations.
Shift from Active to Passive Investment Management
Approximately 83.7% of our ASV is derived from our investment management clients. The prosperity of these clients is tied to equity assets under management. An equity market decline not only depresses assets under management but also could cause a significant increase in redemption requests to move money out of equities and into other asset classes. Moreover, a shift from active investment management to passive investment management can result in lower demand for our services. Our investment banking clients that provide M&A advisory work, capital markets services and equity research, account for approximately 16.3% of our ASV. A significant portion of these revenues relate to services deployed by large, bulge-bracket banks. Credit continues to impact many of the large banking clients due to the amount of leverage deployed in past operations. Our clients could also encounter similar issues. A lack of confidence in the global banking system could cause declines in M&A funded by debt. Additional uncertainty, consolidation and business failures in the global investment banking sector could adversely affect our financial results and future growth. Our revenue may decline if banks, including those involved in merger activity, significantly reduce headcount in the areas of corporate M&A, capital markets and equity research to compensate for the challenges faced by other departments.
Brexit
On June 23, 2016, voters in the United Kingdom approved an advisory referendum to withdraw from the European Union ("Brexit"). On March 29, 2017, the United Kingdom invoked Article 50 of the Lisbon Treaty, formally starting negotiations with the European Union. United Kingdom and European Union leaders then backed an extension until October 31, 2019, to provide more time to complete negotiations on formal withdrawal and transitional arrangements. On October 17, 2019 a new Brexit deal was agreed between the European Union and the UK Government. On October 22, 2019 the UK Parliament approved the new Brexit deal but rejected the timing of its implementation. Following the vote in the UK Parliament, European Council President Donald Tusk confirmed that he would recommend that the European Union leaders agree to a third extension to the Article 50 period until January 31, 2020, to give the United Kingdom more time to scrutinize the new Brexit deal, and to avoid a no-deal Brexit. The political and economic instability created by the Brexit vote has caused, and may continue to cause, significant volatility in global financial markets. At this time, we cannot predict the impact that Brexit will have on our business as it will depend, in part, on the longer-term outcome of tariff, trade, regulatory and other negotiations. Although it is unknown what the result of those negotiations will be, it is possible that new terms may adversely affect our operations and financial results. While we evaluate our own risks and uncertainty related to Brexit, we will continue to partner with our clients to help them navigate the fluctuating international markets.
Markets in Financial Instruments Directive (“MiFID”)
MiFID II built upon many of the initiatives introduced through MiFID and is intended to help improve the functioning of the European Union single market by achieving a greater consistency of regulatory standards. MiFID originally became effective in 2007 and was enhanced through adoption of MiFID II, which became effective in January 2018. We continue to monitor the impact in the European Union of MiFID II on the investment process and trade lifecycle, as well as any impact of MiFID II on non-European Union countries. We also continue to review the application of key MiFID II requirements in the event of a no-deal Brexit in light of a recent publication by the European Securities and Markets Authority. We plan to work with our clients to navigate the MiFID II requirements.
Forward-Looking Factors
Forward-Looking Statements
In addition to current and historical information, this Report on Form 10-K, including Management’s Discussion and Analysis of Financial Condition and Results of Operations, contains forward-looking statements based on management’s current expectations, estimates, forecasts and projections about industries in which we operate and the beliefs and assumptions of management. All statements that address expectations, guidance, outlook or projections about the future, including statements about our strategy for growth, product development, revenue, future financial results, anticipated growth, market position, subscriptions, expected expenditures, trends in our business and financial results, are forward-looking statements. Forward-looking statements may be identified by words like “expects,” “believes,” “anticipates,” “plans,” “intends,” “estimates,” “projects,” “should,” “indicates,” “continues,” “may” and similar expressions. These statements are not guarantees of future performance and involve a number of risks, uncertainties and assumptions. Many factors, including those discussed more fully elsewhere in this Report on Form 10-K or in any of our other filings with the Securities and Exchange Commission, could cause results to differ materially from those stated. These factors include, but are not limited to: the ability to integrate newly acquired companies, clients and businesses; strains on resources as a result of growth, the volatility and stability of global securities markets, including declines in equity or fixed income returns impacting the buying power of investment management clients; the ability to hire and retain qualified personnel; the maintenance of our leading technological position and reputation; failure to maintain or improve our competitive position in the marketplace; fraudulent, misappropriation or unauthorized data access, including cyber-security and privacy breaches; failures or disruptions of telecommunications, data centers, network systems, facilities, or the Internet; uncertainty, consolidation and business failures in the global investment banking industry; the continued shift from active to passive investing, the negotiation of contract terms with vendors, data suppliers and landlords; the retention of clients and the attraction of new ones; the absence of U.S. or foreign governmental regulation restricting international business; the unfavorable resolution of tax assessments and legal proceedings; and legislative and regulatory changes in the environments in which we and our clients operate. Forward-looking statements speak only as of the date they are made, and we assume no duty to and do not undertake to update forward-looking statements. Actual results could differ materially from those anticipated in forward-looking statements and future results could differ materially from historical performance.
We intend that all forward-looking statements we make will be subject to safe harbor protection of the federal securities laws as found in Section 27A of the Securities Act of 1933 and Section 21E of the Securities Exchange Act of 1934.
These statements involve certain known and unknown risks and uncertainties that could cause our actual results to differ materially from those expressed or implied in our forward-looking statements. Such risks and uncertainties include, among others, those listed in Part 1 Item 1A, Risk Factors, of this Report on Form 10-K. We do not intend, and undertake no obligation, to update any of our forward-looking statements after the date of this Report on Form 10-K to reflect actual results or future events or circumstances.
Business Outlook
The following forward-looking statements reflect our expectations as of September 26, 2019. Given the number of risk factors, uncertainties and assumptions discussed in this MD&A above and Part 1 Item 1A, Risk Factors, of this Report on Form 10-K, actual results may differ materially. We do not intend to update our forward-looking statements until our next quarterly results announcement, other than in publicly available statements.
Fiscal 2020 Expectations
| |
• |
Organic ASV plus professional services is expected to increase in the range of $65 million and $85 million over fiscal 2019. |
| |
• |
GAAP revenue is expected to be in the range of $1.49 billion and $1.50 billion. |
| |
• |
GAAP operating margin is expected to be in the range of 28.5% and 29.5%. |
| |
• |
Adjusted operating margin is expected to be in the range of 31.5% and 32.5%. |
| |
• |
FactSet’s annual effective tax rate is expected to be in the range of 17.0% and 17.5%. |
| |
• |
GAAP diluted EPS is expected to be in the range of $8.70 and $9.00. Adjusted diluted EPS is expected to be in the range of $9.85 and $10.15. |
Both GAAP operating margin and GAAP diluted EPS guidance do not include certain effects of any non-recurring benefits or charges that may arise in fiscal 2020.
Business Developments
Departure of Global Head of Sales and Client Solutions and Appointment of Global Head of Sales and Client Solutions
On April 15, 2019, we entered into a separation of employment and general release agreement (the "Separation Agreement") with John W. Wiseman, the Executive Vice President, Global Head of Sales and Client Solutions. Pursuant to the Separation Agreement, Mr. Wiseman participated in an orderly transition of duties to his successor, Franck A.R. Gossieaux, appointed June 1, 2019. Mr. Wiseman remained an employee of FactSet until his effective termination date of August 31, 2019.
Effective June 1, 2019, we appointed Franck A.R. Gossieaux as the Executive Vice President, Global Head of Sales and Client Solutions. Mr. Gossieaux succeeded John W. Wiseman and reports directly to Philip Snow, the Chief Executive Officer.
Appointment of Chief Human Resources Officer
Effective December 1, 2018, we appointed Daniel Viens as the Chief Human Resources Officer. Mr. Viens reports directly to Philip Snow, the Chief Executive Officer.
ITEM 7A. QUANTITATIVE AND QUALITATIVE DISCLOSURES ABOUT MARKET RISK
In the normal course of business, we are exposed to foreign currency exchange risk that could impact our financial position and results of operations.
Foreign Currency Exchange Risk
We conduct business outside the U.S. in several currencies including the Euro, British Pound Sterling, Indian Rupee, and Philippine Peso. The financial statements of these foreign subsidiaries are translated into U.S. dollars using period-end rates of exchange for assets and liabilities and average rates for the period for revenues and expenses. To the extent that our international activities recorded in local currencies increase in the future, our exposure to fluctuations in currency exchange rates will correspondingly increase. To manage the exposures related to the effects of foreign exchange rate fluctuations, we utilize derivative instruments (foreign currency forward contracts). By their nature, all derivative instruments involve, to varying degrees, elements of market and credit risk. The market risk associated with these instruments resulting from currency exchange movements is expected to offset the market risk of the underlying transactions, assets and liabilities being hedged. We do not believe there is significant risk of loss in the event of non-performance by the counterparties associated with these instruments because these transactions are executed with a major financial institution. Further, our policy is to deal with counterparties having a minimum investment grade or better credit rating. Credit risk is managed through the continuous monitoring of exposures to such counterparties. Our primary objective in holding derivatives is to reduce the volatility of earnings associated with changes in foreign currency.
Foreign Currency Hedges
As of August 31, 2019, we maintained the following foreign currency forward contracts to hedge our exposures:
| |
• |
Philippine Peso – foreign currency forward contracts to hedge approximately 75% of our Philippine Peso exposure through the fourth quarter of fiscal 2020. |
| |
• |
Indian Rupee – foreign currency forward contracts to hedge approximately 50% of our Indian Rupee exposure through the end of the third quarter of fiscal 2020, and 25% of our Indian Rupee exposure through the fourth quarter of fiscal 2020. |
| |
• |
Euro – foreign currency forward contracts to hedge approximately 75% of our Euro exposure through the first quarter of fiscal 2020, 50% of our Euro exposure from the second quarter through the third quarter of fiscal 2020, and 25% of our Euro exposure through the fourth quarter of fiscal 2020. |
| |
• |
British Pound Sterling – foreign currency forward contracts to hedge approximately 75% of our British Pound sterling exposure through the first quarter of fiscal 2020, 50% of our British Pound Sterling exposure from the second quarter through the third quarter of fiscal 2020, and 25% of our British Pound Sterling exposure through the fourth quarter of fiscal 2020. |
As of August 31, 2019, the gross notional value of foreign currency forward contracts to purchase Philippine Pesos and Indian Rupees with U.S. dollars was ₱1.4 billion and Rs.1.4 billion, respectively. The gross notional value of foreign currency forward contracts to purchase U.S. dollars with Euros and British Pound Sterling was €35.7 million and £20.5 million, respectively.
A loss on derivatives of $1.8 million was recorded into operating income during fiscal 2019, compared to a gain of $3.1 million in fiscal 2018. The gains and losses on foreign currency forward contracts mitigate the variability in operating expenses associated with currency movements. These transactions are designated and accounted for as cash flow hedges in accordance with applicable accounting guidance. The changes in fair value for these foreign currency forward contracts are initially reported as a component of accumulated other comprehensive loss and subsequently reclassified into operating expenses when the hedged exposure affects earnings. The related cash flow impacts of all our derivative activities are reflected as cash flows from operating activities.
A sensitivity analysis was performed based on the estimated fair value of all foreign currency forward contracts outstanding at August 31, 2019. If the U.S. dollar had been 10% weaker, the fair value of outstanding foreign currency forward contracts would have increased by $10.8 million, which would have had an immaterial impact on our Consolidated Balance Sheets. Such a change in fair value of our financial instruments would be substantially offset by changes in our expense base. If we had no hedges in place as of August 31, 2019, a hypothetical 10% weaker U.S. dollar against all foreign currencies from the quoted foreign currency exchange rates at August 31, 2019, would result in a decrease in operating income by $28.0 million over the next 12 months. A hypothetical 10% weaker U.S. dollar against all foreign currencies at August 31, 2019 would increase the fair value of total assets by $66.9 million and equity by $60.1 million.
Volatility in the British Pound Sterling exchange rate is expected to continue in the short term as the UK negotiates its exit from the European Union. In the longer term, any impact from Brexit will depend on, in part, on the outcome of tariff, regulatory, and other negotiations.
Interest Rate Risk
Cash and Cash Equivalents and Investments
The fair market value of our cash and cash equivalents and investments at August 31, 2019, was $385.6 million. Our cash and cash equivalents consist of demand deposits and money market funds with original maturities of three months or less and are reported at fair value. Our investments consist of both mutual funds and certificates of deposit as both are part of our investment strategy. These mutual funds and certificates of deposit are included as Investments (current assets) on our consolidated balance sheets as the mutual funds can be liquidated at our discretion and the certificates of deposit have original maturities greater than three months, but less than one year. The mutual funds and certificates of deposit are held for investment purposes and are not considered debt securities. It is anticipated that the fair market value of our cash and cash equivalents and investments will continue to be immaterially affected by fluctuations in interest rates. Preservation of principal is the primary goal of our cash and investment policy. Pursuant to our established investment guidelines, we try to achieve high levels of credit quality, liquidity and diversification. Our investment guidelines do not permit us to invest in puts, calls, strips, short sales, straddles, options, commodities, precious metals, futures or investments on margin. As we have a restrictive investment policy, our financial exposure to fluctuations in interest rates is expected to remain low. We do not believe that the value or liquidity of our cash and cash equivalents and investments have been significantly impacted by current market events.
Debt
As of August 31, 2019, the fair value of our long-term debt was $575.0 million, which approximated its carrying amount. The application of a floating interest rate equal to the daily LIBOR rate plus a spread using a debt leverage pricing grid, approximates the current market rate for similar instruments. It is anticipated that the fair market value of our debt will continue to be immaterially affected by fluctuations in interest rates. We do not believe that the value of our debt has been significantly impacted by current market events. The debt bears interest on the outstanding principal amount at a rate equal to the daily LIBOR rate plus a spread using a debt leverage pricing grid currently at 0.875%. During fiscal years 2019, 2018 and 2017, we recorded interest expense of $19.8 million, $15.9 million and $8.4 million, respectively, on our outstanding debt amounts. Assuming all terms of our outstanding long-term debt remained the same, a hypothetical 25 basis point change (up or down) in the one-month LIBOR rate would result in a $1.4 million change to our annual interest expense.
ITEM 8. FINANCIAL STATEMENTS AND SUPPLEMENTARY DATA
Index to Consolidated Financial Statements
| Consolidated Financial Statements: |
Page |
| |
|
| Management’s Statement of Responsibility for Financial Statements |
50 |
| Management’s Report on Internal Control over Financial Reporting |
50 |
| Reports of Independent Registered Public Accounting Firm |
51 |
| Consolidated Statements of Income for the years ended August 31, 2019, 2018 and 2017 |
54 |
| Consolidated Statements of Comprehensive Income for the years ended August 31, 2019, 2018 and 2017 |
55 |
| Consolidated Balance Sheets at August 31, 2019 and 2018 |
56 |
| Consolidated Statements of Cash Flows for the years ended August 31, 2019, 2018 and 2017 |
57 |
| Consolidated Statements of Changes in Stockholders’ Equity for the years ended August 31, 2019, 2018 and 2017 |
58 |
| Notes to the Consolidated Financial Statements |
59 |
| Financial Statement Schedule: |
|
| Schedule II – Valuation and Qualifying Accounts |
100 |
Management’s Statement of Responsibility for Financial Statements
FactSet’s consolidated financial statements are prepared by management, which is responsible for their fairness, integrity and objectivity. The accompanying consolidated financial statements have been prepared in conformity with accounting principles generally accepted in the United States of America and include amounts based on management’s estimates and judgments. All financial information in this Report on Form 10-K has been presented on a basis consistent with the information included in the accompanying financial statements.
FactSet’s policies and practices reflect corporate governance initiatives that are compliant with the listing requirements of the New York Stock Exchange, the NASDAQ Stock Market and the corporate governance requirements of the Sarbanes-Oxley Act of 2002. Management, with oversight by the Company’s Board of Directors, has established and maintains a strong ethical climate so that its affairs are conducted to the highest standards of personal and corporate conduct.
FactSet maintains accounting systems, including internal accounting controls, designed to provide reasonable assurance of the reliability of financial records and the protection of assets. The concept of reasonable assurance is based on recognition that the cost of a system should not exceed the related benefits. The effectiveness of those systems depends primarily upon the careful selection of financial and other managers, clear delegation of authority and assignment of accountability, inculcation of high business ethics and conflict-of-interest standards, policies and procedures for coordinating the management of corporate resources, and the leadership and commitment of top management. In compliance with the Sarbanes-Oxley Act of 2002, FactSet assessed its internal control over financial reporting as of August 31, 2019 and issued a report (see below).
The Audit Committee of the Board of Directors, which consists solely of independent non-employee directors, is responsible for overseeing the functioning of the accounting system and related controls and the preparation of annual financial statements. The Audit Committee periodically meets with management and the independent accountants to review and evaluate their accounting, auditing and financial reporting activities and responsibilities, including management’s assessment of internal control over financial reporting. The independent registered public accounting firm has full and free access to the Audit Committee and has met with the committee, with and without management present.
Management’s Report on Internal Control over Financial Reporting
Management is responsible for establishing and maintaining adequate internal control over financial reporting for FactSet. Internal control over financial reporting is a process designed to provide reasonable assurance regarding the reliability of financial reporting and the preparation of financial statements for external purposes in accordance with generally accepted accounting principles. Internal control over financial reporting includes those policies and procedures that (i) pertain to the maintenance of records that in reasonable detail accurately and fairly reflect the transactions and dispositions of the assets of the Company; (ii) provide reasonable assurance that transactions are recorded as necessary to permit preparation of financial statements in accordance with generally accepted accounting principles and that receipts and expenditures of the Company are being made only in accordance with authorizations of management and directors of the Company; and (iii) provide reasonable assurance regarding prevention or timely detection of unauthorized acquisition, use, or disposition of the Company’s assets that could have a material effect on the financial statements.
Because of its inherent limitations, internal control over financial reporting may not prevent or detect misstatements. Also, projections of any evaluation of effectiveness to future periods are subject to the risk that controls may become inadequate because of changes in conditions or that the degree of compliance with the policies or procedures may deteriorate.
Management (with the participation of the Chief Executive Officer and Chief Financial Officer) conducted an evaluation of the effectiveness of FactSet’s internal control over financial reporting based on the framework in Internal Control—Integrated Framework (2013) issued by the Committee of Sponsoring Organizations of the Treadway Commission. Based on this evaluation, management concluded that FactSet’s internal control over financial reporting was effective as of August 31, 2019. Ernst & Young LLP, an independent registered public accounting firm, has audited the effectiveness of FactSet’s internal control over financial reporting and has issued a report on FactSet’s internal control over financial reporting, which is included in their report on the subsequent page.
| /s/ F. PHILIP SNOW |
|
/s/ HELEN L. SHAN |
| |
|
|
| F. Philip Snow |
|
Helen L. Shan |
| Chief Executive Officer |
|
Executive Vice President and Chief Financial Officer |
| October 30, 2019 |
|
October 30, 2019 |
Report of Independent Registered Public Accounting Firm
To the Board of Directors and Stockholders of FactSet Research Systems Inc.
Opinion on Internal Control over Financial Reporting
We have audited FactSet Research System Inc.’s (the Company) internal control over financial reporting as of August 31, 2019, based on criteria established in Internal Control - Integrated Framework issued by the Committee of Sponsoring Organizations of the Treadway Commission (2013 framework) (the COSO criteria). In our opinion, the Company maintained, in all material respects, effective internal control over financial reporting as of August 31, 2019, based on the COSO criteria.
We also have audited, in accordance with the standards of the Public Company Accounting Oversight Board (United States) (PCAOB), the 2019 consolidated financial statements of the Company and our report dated October 30, 2019, expressed an unqualified opinion thereon.
Basis for Opinion
The Company’s management is responsible for maintaining effective internal control over financial reporting and for its assessment of the effectiveness of internal control over financial reporting included in the accompanying Management’s Report on Internal Control over Financial Reporting. Our responsibility is to express an opinion on the Company’s internal control over financial reporting based on our audit. We are a public accounting firm registered with the PCAOB and are required to be independent with respect to the Company in accordance with the U.S. federal securities laws and the applicable rules and regulations of the Securities and Exchange Commission and the PCAOB.
We conducted our audit in accordance with the standards of the PCAOB. Those standards require that we plan and perform the audit to obtain reasonable assurance about whether effective internal control over financial reporting was maintained in all material respects.
Our audit included obtaining an understanding of internal control over financial reporting, assessing the risk that a material weakness exists, testing and evaluating the design and operating effectiveness of internal control based on the assessed risk, and performing such other procedures as we considered necessary in the circumstances. We believe that our audit provides a reasonable basis for our opinion.
Definition and Limitations of Internal Control over Financial Reporting
A company’s internal control over financial reporting is a process designed to provide reasonable assurance regarding the reliability of financial reporting and the preparation of financial statements for external purposes in accordance with generally accepted accounting principles. A company’s internal control over financial reporting includes those policies and procedures that (1) pertain to the maintenance of records that, in reasonable detail, accurately and fairly reflect the transactions and dispositions of the assets of the company; (2) provide reasonable assurance that transactions are recorded as necessary to permit preparation of financial statements in accordance with generally accepted accounting principles, and that receipts and expenditures of the company are being made only in accordance with authorizations of management and directors of the company; and (3) provide reasonable assurance regarding prevention or timely detection of unauthorized acquisition, use, or disposition of the company’s assets that could have a material effect on the financial statements.
Because of its inherent limitations, internal control over financial reporting may not prevent or detect misstatements. Also, projections of any evaluation of effectiveness to future periods are subject to the risk that controls may become inadequate because of changes in conditions, or that the degree of compliance with the policies or procedures may deteriorate.
/s/ Ernst & Young LLP
Stamford, CT
October 30, 2019
Report of Independent Registered Public Accounting Firm
To the Board of Directors and Stockholders of FactSet Research Systems Inc.
Opinion on the Financial Statements
We have audited the accompanying consolidated balance sheets of FactSet Research Systems Inc. (the Company) as of August 31, 2019 and 2018, and the related consolidated statements of income, comprehensive income, stockholders’ equity and cash flows for each of the three years in the period ended August 31, 2019, and the related notes and financial statement schedule listed in the Index at Item 8 (collectively referred to as the “consolidated financial statements”). In our opinion, the consolidated financial statements present fairly, in all material respects, the financial position of the Company at August 31, 2019 and 2018, and the results of its operations and its cash flows for each of the three years in the period ended August 31, 2019, in conformity with U.S. generally accepted accounting principles.
We also have audited, in accordance with the standards of the Public Company Accounting Oversight Board (United States) (PCAOB), the Company’s internal control over financial reporting as of August 31, 2019, based on criteria established in Internal Control - Integrated Framework issued by the Committee of Sponsoring Organizations of the Treadway Commission (2013 framework) and our report dated October 30, 2019 expressed an unqualified opinion thereon.
Basis for Opinion
These financial statements are the responsibility of the Company’s management. Our responsibility is to express an opinion on the Company’s financial statements based on our audits. We are a public accounting firm registered with the PCAOB and are required to be independent with respect to the Company in accordance with the U.S. federal securities laws and the applicable rules and regulations of the Securities and Exchange Commission and the PCAOB.
We conducted our audits in accordance with the standards of the PCAOB. Those standards require that we plan and perform the audit to obtain reasonable assurance about whether the financial statements are free of material misstatement, whether due to error or fraud. Our audits included performing procedures to assess the risks of material misstatement of the financial statements, whether due to error or fraud, and performing procedures that respond to those risks. Such procedures included examining, on a test basis, evidence regarding the amounts and disclosures in the financial statements. Our audits also included evaluating the accounting principles used and significant estimates made by management, as well as evaluating the overall presentation of the financial statements. We believe that our audits provide a reasonable basis for our opinion.
Critical Audit Matter
The critical audit matter communicated below is a matter arising from the current period audit of the financial statements that was communicated or required to be communicated to the audit committee and that: (1) relates to accounts or disclosures that are material to the financial statements and (2) involved our especially challenging, subjective, or complex judgments. The communication of the critical audit matter does not alter in any way our opinion on the consolidated financial statements, taken as a whole, and we are not, by communicating the critical audit matter below providing a separate opinion on the critical audit matter or on the accounts or disclosures to which it relates.
| |
|
Measurement of income tax provision |
| Description of the Matter |
|
As discussed in Note 3 and 17 of the consolidated financial statements, the Company serves international markets and is subject to income taxes in the U.S. and numerous foreign jurisdictions, which affect the Company’s provision for income taxes. The tax provision is an estimate based on management’s understanding of current enacted tax laws and tax rates of each tax jurisdiction and the use of subjective allocation methodologies to allocate taxable income to tax jurisdictions based upon the structure of the Company’s operations and customer arrangements. For the year-ended August 31, 2019, the Company recognized a consolidated provision for income taxes of $69.2 million with $55.8 million related to its U.S. operations and $13.4 million related to its non-U.S. operations. Management’s calculation of the provision for income taxes was significant to our audit because the provision for income taxes involved subjective estimation and complex audit judgement related to the evaluation of tax laws, including the methods used to allocate taxable income, and the amounts and disclosures are material to the financial statements. |
| |
|
|
| How We Addressed the Matter in Our Audit |
|
We obtained an understanding, evaluated the design and tested the operating effectiveness of internal controls over management’s calculation of its provision for income taxes. For example, we tested controls over management’s evaluation of the allocation methodologies and management’s review of the assumptions and data utilized in determining the allocation of income to applicable tax jurisdictions. Among other audit procedures performed, we evaluated the reasonableness of management’s allocation methodologies by analyzing the methodology based on the Company’s structure, operations and current tax law. We recalculated income tax expense using management’s methodology and agreed the data used in the calculations to the Company’s underlying books and records. We involved our tax professionals to evaluate the application of tax law to management’s allocation methodologies and tax positions. This included assessing the Company’s correspondence with the relevant tax authorities and evaluating third-party reports and advice obtained by the Company. We also performed a sensitivity analysis to evaluate the effect from changes in management’s allocation methodologies and assumptions. We have evaluated the Company’s income tax disclosures included in Note 17 of the consolidated financial statements in relation to these matters. |
/s/ Ernst & Young LLP
We have served as the Company’s auditor since 2013.
Stamford, CT
October 30, 2019
FactSet Research Systems Inc.
Consolidated Statements of Income
| |
|
Years ended August 31, |
|
| (in thousands, except per share data) |
|
2019 |
|
|
2018 |
|
|
2017 |
|
| Revenue |
|
$ |
1,435,351 |
|
|
$ |
1,350,145 |
|
|
$ |
1,221,179 |
|
| Operating expenses |
|
|
|
|
|
|
|
|
|
|
|
|
| Cost of services |
|
|
663,446 |
|
|
|
659,296 |
|
|
|
566,580 |
|
| Selling, general and administrative |
|
|
333,870 |
|
|
|
324,645 |
|
|
|
302,464 |
|
| Total operating expenses |
|
|
997,316 |
|
|
|
983,941 |
|
|
|
869,044 |
|
| |
|
|
|
|
|
|
|
|
|
|
|
|
| Operating income |
|
|
438,035 |
|
|
|
366,204 |
|
|
|
352,135 |
|
| |
|
|
|
|
|
|
|
|
|
|
|
|
| Other expenses |
|
|
|
|
|
|
|
|
|
|
|
|
| (Loss) on sale of business |
|
|
— |
|
|
|
— |
|
|
|
(1,223 |
) |
| Interest expense, net of interest income |
|
|
(16,070 |
) |
|
|
(14,366 |
) |
|
|
(6,600 |
) |
| Total other expense |
|
|
(16,070 |
) |
|
|
(14,366 |
) |
|
|
(7,823 |
) |
| |
|
|
|
|
|
|
|
|
|
|
|
|
| Income before income taxes |
|
|
421,965 |
|
|
|
351,838 |
|
|
|
344,312 |
|
| |
|
|
|
|
|
|
|
|
|
|
|
|
| Provision for income taxes |
|
|
69,175 |
|
|
|
84,753 |
|
|
|
86,053 |
|
| Net income |
|
$ |
352,790 |
|
|
$ |
267,085 |
|
|
$ |
258,259 |
|
| |
|
|
|
|
|
|
|
|
|
|
|
|
| Basic earnings per common share |
|
$ |
9.25 |
|
|
$ |
6.90 |
|
|
$ |
6.55 |
|
| Diluted earnings per common share |
|
$ |
9.08 |
|
|
$ |
6.78 |
|
|
$ |
6.51 |
|
| |
|
|
|
|
|
|
|
|
|
|
|
|
| Basic weighted average common shares |
|
|
38,144 |
|
|
|
38,733 |
|
|
|
39,444 |
|
| Diluted weighted average common shares |
|
|
38,873 |
|
|
|
39,377 |
|
|
|
39,642 |
|
The accompanying notes are an integral part of these consolidated financial statements.
FactSet Research Systems Inc.
Consolidated Statements of Comprehensive Income
| |
|
Years ended August 31, |
|
| (in thousands) |
|
2019 |
|
|
2018 |
|
|
2017 |
|
| Net income |
|
$ |
352,790 |
|
|
$ |
267,085 |
|
|
$ |
258,259 |
|
| |
|
|
|
|
|
|
|
|
|
|
|
|
| Other comprehensive (loss) income, net of tax |
|
|
|
|
|
|
|
|
|
|
|
|
| Net unrealized gain (loss) on cash flow hedges(1) |
|
|
504 |
|
|
|
(7,288 |
) |
|
|
5,017 |
|
| Foreign currency translation adjustments |
|
|
(24,325 |
) |
|
|
(9,431 |
) |
|
|
28,816 |
|
| Other comprehensive (loss) income |
|
|
(23,821 |
) |
|
|
(16,719 |
) |
|
|
33,833 |
|
| Comprehensive income |
|
$ |
328,969 |
|
|
$ |
250,366 |
|
|
$ |
292,092 |
|
| (1) |
The unrealized gain (loss) on cash flow hedges disclosed above was net of tax (expense) benefit of ($387), $3,518, and ($3,049) for the fiscal years ended August 31, 2019, 2018 and 2017, respectively. |
The accompanying notes are an integral part of these consolidated financial statements.
FactSet Research Systems Inc.
Consolidated Balance Sheets
| |
|
August 31, |
|
| (in thousands, except share data) |
|
2019 |
|
|
2018 |
|
| ASSETS |
|
|
|
|
|
|
|
|
| Cash and cash equivalents |
|
$ |
359,799 |
|
|
$ |
208,623 |
|
| Investments |
|
|
25,813 |
|
|
|
29,259 |
|
| Accounts receivable, net of reserves of $10,511 at August 31, 2019 and $3,490 at August 31, 2018 |
|
|
146,309 |
|
|
|
156,639 |
|
| Prepaid taxes |
|
|
15,033 |
|
|
|
6,274 |
|
| Prepaid expenses and other current assets |
|
|
36,858 |
|
|
|
30,121 |
|
| Total current assets |
|
|
583,812 |
|
|
|
430,916 |
|
| |
|
|
|
|
|
|
|
|
| Property, equipment and leasehold improvements, net |
|
|
132,524 |
|
|
|
100,545 |
|
| |
|
|
|
|
|
|
|
|
| Goodwill |
|
|
685,729 |
|
|
|
701,833 |
|
| Intangible assets, net |
|
|
120,551 |
|
|
|
148,935 |
|
| Deferred taxes |
|
|
7,571 |
|
|
|
9,716 |
|
| Other assets |
|
|
29,943 |
|
|
|
27,502 |
|
| TOTAL ASSETS |
|
$ |
1,560,130 |
|
|
$ |
1,419,447 |
|
| |
|
|
|
|
|
|
|
|
| LIABILITIES |
|
|
|
|
|
|
|
|
| Accounts payable and accrued expenses |
|
$ |
79,620 |
|
|
$ |
72,059 |
|
| Accrued compensation |
|
|
64,202 |
|
|
|
66,479 |
|
| Deferred fees |
|
|
47,656 |
|
|
|
49,700 |
|
| Taxes payable |
|
|
— |
|
|
|
8,453 |
|
| Dividends payable |
|
|
27,445 |
|
|
|
24,443 |
|
| Total current liabilities |
|
|
218,923 |
|
|
|
221,134 |
|
| |
|
|
|
|
|
|
|
|
| Long-term debt |
|
|
574,174 |
|
|
|
574,775 |
|
| Deferred taxes |
|
|
16,391 |
|
|
|
21,190 |
|
| Deferred fees |
|
|
10,088 |
|
|
|
7,833 |
|
| Taxes payable |
|
|
26,292 |
|
|
|
29,626 |
|
| Deferred rent and other non-current liabilities |
|
|
42,006 |
|
|
|
38,989 |
|
| TOTAL LIABILITIES |
|
$ |
887,874 |
|
|
$ |
893,547 |
|
| Commitments and contingencies (See Note 19) |
|
|
|
|
|
|
|
|
| |
|
|
|
|
|
|
|
|
| STOCKHOLDERS’ EQUITY |
|
|
|
|
|
|
|
|
| Preferred stock, $.01 par value, 10,000,000 shares authorized, none issued |
|
$ |
— |
|
|
$ |
— |
|
| Common stock, $.01 par value, 150,000,000 shares authorized, 40,104,192 and 39,264,849 shares issued, 38,117,840 and 38,192,586 shares outstanding at August 31, 2019 and 2018, respectively |
|
|
401 |
|
|
|
393 |
|
| Additional paid-in capital |
|
|
806,973 |
|
|
|
667,531 |
|
| Treasury stock, at cost: 1,986,352 and 1,072,263 shares at August 31, 2019 and 2018, respectively |
|
|
(433,799 |
) |
|
|
(213,428 |
) |
| Retained earnings |
|
|
373,225 |
|
|
|
122,843 |
|
| Accumulated other comprehensive loss |
|
|
(74,544 |
) |
|
|
(51,439 |
) |
| TOTAL STOCKHOLDERS’ EQUITY |
|
$ |
672,256 |
|
|
$ |
525,900 |
|
| |
|
|
|
|
|
|
|
|
| TOTAL LIABILITIES AND STOCKHOLDERS’ EQUITY |
|
$ |
1,560,130 |
|
|
$ |
1,419,447 |
|
The accompanying notes are an integral part of these consolidated financial statements.
FactSet Research Systems Inc.
Consolidated Statements of Cash Flows
| |
|
Years ended August 31, |
|
| (in thousands) |
|
2019 |
|
|
2018 |
|
|
2017 |
|
| CASH FLOWS FROM OPERATING ACTIVITIES |
|
|
|
|
|
|
|
|
|
|
|
|
| Net income |
|
$ |
352,790 |
|
|
$ |
267,085 |
|
|
$ |
258,259 |
|
| Adjustments to reconcile net income to net cash provided by operating activities |
|
|
|
|
|
|
|
|
|
|
|
|
| Depreciation and amortization |
|
|
60,463 |
|
|
|
57,285 |
|
|
|
48,294 |
|
| Stock-based compensation expense |
|
|
32,400 |
|
|
|
31,516 |
|
|
|
34,183 |
|
| Deferred income taxes |
|
|
(2,278 |
) |
|
|
(1,910 |
) |
|
|
4,879 |
|
| Loss on sale of assets |
|
|
196 |
|
|
|
140 |
|
|
|
1,282 |
|
| Tax benefits from share-based payment arrangements |
|
|
— |
|
|
|
— |
|
|
|
(10,331 |
) |
| Changes in assets and liabilities, net of effects of acquisitions |
|
|
|
|
|
|
|
|
|
|
|
|
| Accounts receivable, net of reserves |
|
|
10,205 |
|
|
|
(8,417 |
) |
|
|
(29,503 |
) |
| Accounts payable and accrued expenses |
|
|
(2,290 |
) |
|
|
12,077 |
|
|
|
(2,226 |
) |
| Accrued compensation |
|
|
(1,743 |
) |
|
|
5,735 |
|
|
|
6,427 |
|
| Deferred fees |
|
|
458 |
|
|
|
6,035 |
|
|
|
(229 |
) |
| Taxes payable, net of prepaid taxes |
|
|
(19,238 |
) |
|
|
27,659 |
|
|
|
7,877 |
|
| Other, net |
|
|
(3,827 |
) |
|
|
(11,537 |
) |
|
|
1,613 |
|
| Net cash provided by operating activities |
|
|
427,136 |
|
|
|
385,668 |
|
|
|
320,527 |
|
| |
|
|
|
|
|
|
|
|
|
|
|
|
| CASH FLOWS FROM INVESTING ACTIVITIES: |
|
|
|
|
|
|
|
|
|
|
|
|
| Acquisition of businesses and investments, net of cash and cash equivalents acquired |
|
|
— |
|
|
|
(15,000 |
) |
|
|
(303,086 |
) |
| Purchases of investments |
|
|
(11,135 |
) |
|
|
(12,470 |
) |
|
|
(30,757 |
) |
| Proceeds from maturity or sale of investments |
|
|
14,405 |
|
|
|
12,459 |
|
|
|
23,399 |
|
| Purchases of property, equipment and leasehold improvements |
|
|
(59,370 |
) |
|
|
(33,520 |
) |
|
|
(36,862 |
) |
| Net cash used in investing activities |
|
|
(56,100 |
) |
|
|
(48,531 |
) |
|
|
(347,306 |
) |
| |
|
|
|
|
|
|
|
|
|
|
|
|
| CASH FLOWS FROM FINANCING ACTIVITIES |
|
|
|
|
|
|
|
|
|
|
|
|
| Dividend payments |
|
|
(100,052 |
) |
|
|
(89,408 |
) |
|
|
(80,898 |
) |
| Repurchase of common stock |
|
|
(220,372 |
) |
|
|
(303,955 |
) |
|
|
(260,978 |
) |
| Repayment of debt |
|
|
(575,000 |
) |
|
|
— |
|
|
|
(365,000 |
) |
| Proceeds from debt |
|
|
575,000 |
|
|
|
— |
|
|
|
640,000 |
|
| Proceeds from employee stock plans |
|
|
107,051 |
|
|
|
71,610 |
|
|
|
50,045 |
|
| Tax benefits from share-based payment arrangements |
|
|
— |
|
|
|
— |
|
|
|
10,331 |
|
| Other financing activities, net |
|
|
(901 |
) |
|
|
1,716 |
|
|
|
(1,661 |
) |
| Net cash used in financing activities |
|
|
(214,274 |
) |
|
|
(320,037 |
) |
|
|
(8,161 |
) |
| |
|
|
|
|
|
|
|
|
|
|
|
|
| Effect of exchange rate changes on cash and cash equivalents |
|
|
(5,586 |
) |
|
|
(3,208 |
) |
|
|
1,264 |
|
| Net increase (decrease) in cash and cash equivalents |
|
|
151,176 |
|
|
|
13,892 |
|
|
|
(33,676 |
) |
| Cash and cash equivalents at beginning of period |
|
|
208,623 |
|
|
|
194,731 |
|
|
|
228,407 |
|
| Cash and cash equivalents at end of period |
|
$ |
359,799 |
|
|
$ |
208,623 |
|
|
$ |
194,731 |
|
| |
|
|
|
|
|
|
|
|
|
|
|
|
| Supplemental Disclosure of Cash Flow Information |
|
|
|
|
|
|
|
|
|
|
|
|
| Cash paid during the year for interest |
|
$ |
19,509 |
|
|
$ |
15,676 |
|
|
$ |
8,466 |
|
| Cash paid during the year for income taxes, net of refunds |
|
$ |
89,997 |
|
|
$ |
68,707 |
|
|
$ |
74,788 |
|
| |
|
|
|
|
|
|
|
|
|
|
|
|
| Supplemental Disclosure of Non-Cash Transactions |
|
|
|
|
|
|
|
|
|
|
|
|
| Dividends declared, not paid |
|
$ |
27,445 |
|
|
$ |
24,443 |
|
|
$ |
21,853 |
|
The accompanying notes are an integral part of these consolidated financial statements.
FactSet Research Systems Inc.
Consolidated Statements of Changes in Stockholders’ Equity
| |
|
Common Stock |
|
|
Additional |
|
|
Treasury Stock |
|
|
|
|
|
Accumulated Other |
|
|
Total |
|
| (in thousands, except share data) |
|
Shares |
|
|
Par Value |
|
|
Paid-in Capital |
|
|
Shares |
|
|
Amount |
|
|
Retained Earnings |
|
|
Comprehensive Loss |
|
|
Stockholders’ Equity |
|
| Balance as of September 1, 2016 |
|
|
51,150,978 |
|
|
$ |
512 |
|
|
$ |
623,195 |
|
|
|
11,112,753 |
|
|
$ |
(1,321,700 |
) |
|
$ |
1,283,927 |
|
|
$ |
(68,553 |
) |
|
$ |
517,381 |
|
| Net income |
|
|
|
|
|
|
|
|
|
|
|
|
|
|
|
|
|
|
|
|
|
|
258,259 |
|
|
|
|
|
|
|
258,259 |
|
| Other comprehensive income |
|
|
|
|
|
|
|
|
|
|
|
|
|
|
|
|
|
|
|
|
|
|
|
|
|
|
33,833 |
|
|
|
33,833 |
|
| Common stock issued for employee stock plans |
|
|
561,960 |
|
|
|
6 |
|
|
|
50,039 |
|
|
|
|
|
|
|
|
|
|
|
|
|
|
|
|
|
|
|
50,045 |
|
| Vesting of restricted stock |
|
|
132,194 |
|
|
|
|
|
|
|
|
|
|
|
49,771 |
|
|
|
(7,847 |
) |
|
|
|
|
|
|
|
|
|
|
(7,847 |
) |
| Repurchases of common stock |
|
|
|
|
|
|
|
|
|
|
|
|
|
|
1,556,660 |
|
|
|
(253,131 |
) |
|
|
|
|
|
|
|
|
|
|
(253,131 |
) |
| Stock-based compensation expense |
|
|
|
|
|
|
|
|
|
|
34,183 |
|
|
|
|
|
|
|
|
|
|
|
|
|
|
|
|
|
|
|
34,183 |
|
| Tax benefits from share-based payment arrangements |
|
|
|
|
|
|
|
|
|
|
10,331 |
|
|
|
|
|
|
|
|
|
|
|
|
|
|
|
|
|
|
|
10,331 |
|
| Accelerated share repurchase |
|
|
|
|
|
|
|
|
|
|
24,000 |
|
|
|
102,916 |
|
|
|
(24,000 |
) |
|
|
|
|
|
|
|
|
|
|
— |
|
| Dividends declared |
|
|
|
|
|
|
|
|
|
|
|
|
|
|
|
|
|
|
|
|
|
|
(83,363 |
) |
|
|
|
|
|
|
(83,363 |
) |
| Balance as of August 31, 2017 |
|
|
51,845,132 |
|
|
$ |
518 |
|
|
$ |
741,748 |
|
|
|
12,822,100 |
|
|
$ |
(1,606,678 |
) |
|
$ |
1,458,823 |
|
|
$ |
(34,720 |
) |
|
$ |
559,691 |
|
| Net income |
|
|
|
|
|
|
|
|
|
|
|
|
|
|
|
|
|
|
|
|
|
|
267,085 |
|
|
|
|
|
|
|
267,085 |
|
| Other comprehensive loss |
|
|
|
|
|
|
|
|
|
|
|
|
|
|
|
|
|
|
|
|
|
|
|
|
|
|
(16,719 |
) |
|
|
(16,719 |
) |
| Common stock issued for employee stock plans |
|
|
685,807 |
|
|
|
8 |
|
|
|
80,983 |
|
|
|
|
|
|
|
|
|
|
|
|
|
|
|
|
|
|
|
80,991 |
|
| Vesting of restricted stock |
|
|
26,599 |
|
|
|
|
|
|
|
|
|
|
|
8,070 |
|
|
|
(1,514 |
) |
|
|
|
|
|
|
|
|
|
|
(1,514 |
) |
| Repurchases of common stock |
|
|
|
|
|
|
|
|
|
|
|
|
|
|
1,534,782 |
|
|
|
(302,441 |
) |
|
|
|
|
|
|
|
|
|
|
(302,441 |
) |
| Stock-based compensation expense |
|
|
|
|
|
|
|
|
|
|
31,517 |
|
|
|
|
|
|
|
|
|
|
|
|
|
|
|
|
|
|
|
31,517 |
|
| Dividends declared |
|
|
|
|
|
|
|
|
|
|
|
|
|
|
|
|
|
|
|
|
|
|
(92,710 |
) |
|
|
|
|
|
|
(92,710 |
) |
| Retirement of treasury shares |
|
|
(13,292,689 |
) |
|
|
(133 |
) |
|
|
(186,717 |
) |
|
|
(13,292,689 |
) |
|
|
1,697,205 |
|
|
|
(1,510,355 |
) |
|
|
|
|
|
|
— |
|
| Balance as of August 31, 2018 |
|
|
39,264,849 |
|
|
$ |
393 |
|
|
$ |
667,531 |
|
|
|
1,072,263 |
|
|
$ |
(213,428 |
) |
|
$ |
122,843 |
|
|
$ |
(51,439 |
) |
|
$ |
525,900 |
|
| Net income |
|
|
|
|
|
|
|
|
|
|
|
|
|
|
|
|
|
|
|
|
|
|
352,790 |
|
|
|
|
|
|
|
352,790 |
|
| Other comprehensive loss |
|
|
|
|
|
|
|
|
|
|
|
|
|
|
|
|
|
|
|
|
|
|
|
|
|
|
(23,821 |
) |
|
|
(23,821 |
) |
| Common stock issued for employee stock plans |
|
|
753,942 |
|
|
|
7 |
|
|
|
107,043 |
|
|
|
|
|
|
|
|
|
|
|
|
|
|
|
|
|
|
|
107,050 |
|
| Vesting of restricted stock |
|
|
85,401 |
|
|
|
1 |
|
|
|
(1 |
) |
|
|
31,644 |
|
|
|
(7,241 |
) |
|
|
|
|
|
|
|
|
|
|
(7,241 |
) |
| Repurchases of common stock |
|
|
|
|
|
|
|
|
|
|
|
|
|
|
882,445 |
|
|
|
(213,130 |
) |
|
|
|
|
|
|
|
|
|
|
(213,130 |
) |
| Stock-based compensation expense |
|
|
|
|
|
|
|
|
|
|
32,400 |
|
|
|
|
|
|
|
|
|
|
|
|
|
|
|
|
|
|
|
32,400 |
|
| Dividends declared |
|
|
|
|
|
|
|
|
|
|
|
|
|
|
|
|
|
|
|
|
|
|
(103,710 |
) |
|
|
|
|
|
|
(103,710 |
) |
| Cumulative effect of adoption of accounting standards* |
|
|
|
|
|
|
|
|
|
|
|
|
|
|
|
|
|
|
|
|
|
|
1,302 |
|
|
|
716 |
|
|
|
2,018 |
|
| Balance as of August 31, 2019 |
|
|
40,104,192 |
|
|
$ |
401 |
|
|
$ |
806,973 |
|
|
|
1,986,352 |
|
|
$ |
(433,799 |
) |
|
$ |
373,225 |
|
|
$ |
(74,544 |
) |
|
$ |
672,256 |
|
* Includes the cumulative effect of adoption of accounting standards primarily due to both the adoption of the new revenue recognition standard (ASC 606) resulting in a cumulative increase to retained earnings related to certain fulfillment costs and the accounting standard update related to the TCJA providing for the reclassification from accumulated other comprehensive loss to retained earnings for stranded tax effects. See Notes 3 and 4 for additional information.
The accompanying notes are an integral part of these consolidated financial statements.
Notes to the Consolidated Financial Statements
1. ORGANIZATION AND NATURE OF BUSINESS
FactSet Research Systems Inc. (the “Company” or “FactSet”) is a global provider of integrated financial information, analytical applications and industry-leading services for the investment and corporate communities. For over 40 years, global financial professionals have utilized the Company’s content and multi-asset class solutions across each stage of the investment process. FactSet’s goal is to provide a seamless user experience spanning idea generation, research, portfolio construction, trade execution, performance measurement, risk management, reporting, and portfolio analysis, in which we serve the front, middle, and back offices to drive productivity and improved performance. FactSet’s flexible, open data and technology solutions can be implemented both across the investment portfolio lifecycle or as standalone components serving different workflows in the organization. FactSet is focused on growing the business throughout each of its three segments, the U.S., Europe, and Asia Pacific. The Company primarily delivers insight and information through the workflow solutions of Research, Analytics and Trading, Content and Technology Solutions and Wealth.
FactSet currently serves financial professionals, which include portfolio managers, investment research professionals, investment bankers, risk and performance analysts, wealth advisors, and corporate clients. FactSet provides both insights on global market trends and intelligence on companies and industries, as well as capabilities to monitor portfolio risk and performance and to execute trades. The Company combines dedicated client service with open and flexible technology offerings, such as a comprehensive data marketplace, a configurable mobile and desktop platform, digital portals and application programming interface (“APIs”). FactSet revenue is primarily derived from subscriptions to products and services such as workstations, analytics, enterprise data, research management, and trade execution.
2. BASIS OF PRESENTATION
FactSet conducts business globally and is managed on a geographic basis. The accompanying consolidated financial statements and notes of FactSet and its wholly-owned subsidiaries are prepared in accordance with generally accepted accounting principles in the United States (“GAAP”). The preparation of consolidated financial statements and related disclosures in conformity with GAAP requires management to make estimates and assumptions that affect the reported amounts of assets and liabilities and disclosure of contingent assets and liabilities at the date of the financial statements and the reported amounts of revenue and expenses during the reporting period. Significant estimates have been made in areas that include allocation of purchase price to acquired assets and liabilities, stock-based compensation, income taxes, accrued compensation, valuation of goodwill, and useful lives and valuation of fixed and intangible assets. The Company bases its estimates on historical experience and on various other assumptions that are believed to be reasonable, the results of which form the basis for making judgments about the carrying values of assets and liabilities. Actual results could differ from those estimates.
The Company has evaluated subsequent events through the date that the financial statements were issued.
Reclassification
Certain comparative figures in the Company's Consolidated Statement of Cash Flows have been reclassified to conform to the current year's presentation.
3. SUMMARY OF SIGNIFICANT ACCOUNTING POLICIES
The significant accounting policies of the Company and its subsidiaries are summarized below.
Revenue Recognition
The majority of the Company’s revenue is derived from client access to its hosted proprietary data and analytics platform, which can include various combinations of products and services available over the contractual term. The hosted platform is a subscription-based service that consists primarily of providing access to products and services including workstations, analytics, enterprise data, research management, and trade execution. The Company determined that the subscription-based service represents a single performance obligation covering a series of distinct products and services that are substantially the same and that have the same pattern of transfer to the client. Based on the nature of the services and products offered by FactSet, the Company applies an input time-based measure of progress as the client is simultaneously receiving and consuming the benefits of the platform. The Company records revenue for its contracts using the over-time revenue recognition model as a client is invoiced or performance is satisfied. A provision for billing adjustments and cancellation of services is estimated and accounted for as a reduction to revenue, with a corresponding reduction to accounts receivable.
59
Accounts Receivable and Deferred Fees
Amounts that have been earned but not yet paid are reflected on the Consolidated Balance Sheets as Accounts receivable, net of reserves. Amounts invoiced in advance of client payments that are in excess of earned subscription revenue are reflected on the Consolidated Balance Sheets as Deferred fees. As of August 31, 2019, the amount of accounts receivable that was unbilled totaled $15.8 million, which will be billed in fiscal 2020. As of August 31, 2018, the amount of accounts receivable that was unbilled totaled $6.4 million, which was billed in fiscal 2019.
The Company calculates its receivable reserve through analyzing aged client receivables, reviewing the recent history of client receivable write-offs and understanding general market and economic conditions. In accordance with this policy, a receivable reserve of $10.5 million and $3.5 million was recorded as of August 31, 2019 and 2018, respectively, within the Consolidated Balance Sheets as a reduction to Accounts receivable.
Cost of Services
Cost of services is comprised of compensation for Company employees within the content collection, consulting, product development, software and systems engineering groups in addition to data costs, computer maintenance and depreciation expenses, amortization of identifiable intangible assets, and client-related communication costs.
Selling, General and Administrative
Selling, general and administrative expenses include compensation for the sales and various other support and administrative departments in addition to travel and entertainment expenses, marketing costs, rent, amortization of leasehold improvements, depreciation of furniture and fixtures, office expenses, professional fees and other miscellaneous expenses.
Research and Product Development Costs
FactSet does not have a separate research and product development department, but rather the Product Development and Engineering departments work closely with our strategists, product managers, sales and other client-facing specialists to identify areas of improvement with the goal of providing increased value to clients. As such, research and product development costs relate to the salary and benefits for the Company’s product development, software engineering and technical support staff and, as such, these costs are expensed when incurred within cost of services as employee compensation. The Company expects to allocate a similar percentage of its workforce in future years in order to continue to develop new products and enhancements, respond quickly to market changes and meet the needs of its clients efficiently. FactSet incurred research and product development costs of $214.7 million, $217.1 million and $215.0 million during fiscal years 2019, 2018 and 2017, respectively.
Earnings per Share
Basic earnings per share (“EPS”) is computed by dividing net income by the number of weighted average common shares outstanding during the period. Diluted EPS is computed by dividing net income by the number of weighted average common shares outstanding during the period increased by the dilutive effect of potential common shares outstanding during the period. The number of potential common shares outstanding has been determined in accordance with the treasury stock method to the extent they are dilutive. For the purpose of calculating EPS, common shares outstanding include common shares issuable upon the exercise of outstanding share-based compensation awards, including employee stock options and restricted stock. Under the treasury stock method, the exercise price paid by the option holder and future stock-based compensation expense that the Company has not yet recognized are assumed to be used to repurchase shares.
60
Comprehensive Income (Loss)
The Company discloses comprehensive income (loss) in accordance with applicable standards for the reporting and display of comprehensive income (loss) in a set of financial statements. Comprehensive income (loss) is defined as the change in net assets of a business enterprise during a period from transactions generated from non-owner sources. It includes all changes in equity during a period except those resulting from investments by owners and distributions to owners.
Fair Value Measurements
Fair value is defined as the price that would be received from selling an asset or paid to transfer a liability (i.e., the “exit price”) in an orderly transaction between market participants at the measurement date. In determining fair value, the use of various valuation methodologies, including market, income and cost approaches is permissible. The Company considers the principal or most advantageous market in which it would transact and considers assumptions that market participants would use when pricing the asset or liability. The accounting guidance for fair value measurements establishes a fair value hierarchy that requires an entity to maximize the use of observable inputs and minimize the use of unobservable inputs when measuring fair value. There are three levels of inputs that may be used to measure fair value based on the reliability of inputs. A financial instrument’s categorization within the fair value hierarchy is based upon the lowest level of input that is significant to the fair value measurement. The Company’s cash equivalents are classified as Level 1 while the Company’s derivative instruments (foreign exchange forward contracts) and certificates of deposit are classified as Level 2. There were no Level 3 assets or liabilities held by FactSet as of August 31, 2019 or 2018. Refer to Note 5 Fair Value Measures for the definition of the fair value hierarchy.
Cash and Cash Equivalents
Cash and cash equivalents consist of demand deposits and money market funds with original maturities of three months or less and are reported at fair value. The Company’s corporate money market funds are readily convertible into cash and the net asset value of each fund on the last day of the quarter is used to determine its fair value.
Investments
Investments consist of both mutual funds and certificates of deposit as both are part of the Company’s investment strategy. These mutual funds and certificates of deposit are included as Investments (short-term) on the Company’s Consolidated Balance Sheets as the certificates of deposit have original maturities greater than three months, but less than one year and the mutual funds can be liquidated at that Company’s discretion. The mutual funds and certificates of deposit are held for investment and are not considered debt securities. Interest income earned from these investments during fiscal 2019, 2018 and 2017 was $1.5 million, $1.3 million and $1.6 million, respectively. The Company’s cash, cash equivalents and investments portfolio did not experience any realized or unrealized losses as a result of counterparty credit risk or ratings change during fiscal 2019 and 2018.
Property, Equipment and Leasehold Improvements
Property, equipment and leasehold improvements are stated at cost, less accumulated depreciation and amortization. Computers and related equipment are depreciated on a straight-line basis over estimated useful lives of three years. Furniture and fixtures are depreciated on a straight-line basis over their estimated useful lives of seven years. Leasehold improvements are amortized on a straight-line basis over the terms of the related leases or estimated useful lives of the improvements, whichever period is shorter. Repairs and maintenance expenditures, which are not considered leasehold improvements and do not extend the useful life of the property and equipment, are expensed as incurred.
The Company performs a test for impairment whenever events or changes in circumstances indicate that the carrying amount of an individual asset or asset group may not be recoverable. Should projected undiscounted future cash flows be less than the carrying amount of the asset or asset group, an impairment charge reducing the carrying amount to fair value is required. Fair value is determined based on the most appropriate valuation technique, including discounted cash flows.
61
Goodwill
Goodwill at the reporting unit level is reviewed for impairment annually, and more frequently if impairment indicators exist. Goodwill is deemed to be impaired and written-down in the period in which the carrying value of the reporting unit exceeds its fair value. FactSet has three reporting units, U.S, Europe and Asia Pacific, which are consistent with the operating segments reported, as discrete financial information is not available for subsidiaries within the operating segments.
FactSet may elect to perform a qualitative analysis for the reporting units to determine whether it is more likely than not the fair value of the reporting unit is greater than its carrying value. In performing a qualitative assessment, FactSet considers such factors as macro-economic conditions, industry and market conditions in which FactSet operates including the competitive environment and significant changes in demand for the Company’s services. The Company also considers its share price both in absolute terms and in relation to peer companies. If the qualitative analysis indicates that it is more likely than not the fair value of a reporting unit is less than its carrying amount or if FactSet elects not to perform a qualitative analysis, a quantitative analysis is performed to determine whether a goodwill impairment exists.
The quantitative goodwill impairment analysis is used to identify potential impairment by comparing fair value of a reporting unit with its carrying amount using an income approach, along with other relevant market information, derived from a discounted cash flow model to estimate fair value of FactSet’s reporting units. The annual review of carrying value of goodwill, requires the Company develop estimates of future business performance. These estimates are used to derive expected cash flows and include assumptions regarding future sales levels and the level of working capital needed to support a given business. The discounted cash flow model also includes a determination of FactSet’s weighted average cost of capital by reporting unit. Cost of capital is based on assumptions about interest rates, as well as a risk-adjusted rate of return required by FactSet’s equity investors. Changes in these estimates can impact present value of expected cash flows used in determining fair value of a reporting unit. An impairment charge for the amount by which the carrying amount exceeds the reporting unit’s fair value, if any, would be recognized. The loss recognized would not exceed total amount of goodwill allocated to that reporting unit.
The Company performed its annual goodwill impairment test during the fourth quarter of fiscal 2019 utilizing a qualitative analysis and concluded it was more likely than not the fair value of each reporting unit was greater than its respective carrying value and no impairment charge was required.
Intangible Assets
FactSet’s identifiable intangible assets consist of acquired content databases, client relationships, software technology, non-compete agreements and trade names resulting from previous acquisitions, which have been fully integrated into the Company’s operations. The Company amortizes intangible assets over their estimated useful lives, which are evaluated quarterly to determine whether events and circumstances warrant a revision to the remaining period of amortization. If the estimate of the remaining useful life is changed, the remaining carrying amount of the intangible asset is amortized prospectively over that revised remaining useful life. Amortizable Intangible assets are tested for impairment, if indicators of impairment are present, based on undiscounted cash flows, and, if impaired, written down to fair value based on discounted cash flows. No impairment of intangible assets has been identified during any of the fiscal years presented. The intangible assets have no assigned residual values.
Accrued Liabilities
Accrued liabilities include estimates relating to employee compensation, operating expenses and tax liabilities. At the end of each fiscal year, FactSet conducts a final review of both Company and individual performance within each department to determine the amount of discretionary employee compensation. The Company also reviews compensation throughout the year to determine how overall performance tracks against management’s expectations. Management takes these and other factors, including historical performance, into account in reviewing accrued compensation estimates quarterly and adjusting accrual rates as appropriate. The amount of the variable employee compensation recorded within accrued compensation as of August 31, 2019 and 2018, was $49.4 million and $43.6 million, respectively.
62
Derivative Instruments
FactSet conducts business outside the U.S. in several currencies including the Euro, Indian Rupee, Philippine Peso, British Pound Sterling, and Japanese Yen. As such, the Company is exposed to movements in foreign currency exchange rates compared to the U.S. dollar. The Company utilizes derivative instruments (foreign currency forward contracts) to manage the exposures related to the effects of foreign exchange rate fluctuations and reduce the volatility of earnings and cash flows associated with changes in foreign currency. The Company does not enter into foreign exchange forward contracts for trading or speculative purposes. In designing a specific hedging approach, FactSet considers several factors, including offsetting exposures, significance of exposures, forecasting risk and potential effectiveness of the hedge. These transactions are designated and accounted for as cash flow hedges in accordance with applicable accounting guidance. The changes in fair value for these foreign currency forward contracts are initially reported as a component of accumulated other comprehensive loss (“AOCL”) and subsequently reclassified into operating expenses when the hedged exposure affects earnings. The gains and losses on foreign currency forward contracts mitigate the variability in operating expenses associated with currency movements. All derivatives are assessed for effectiveness at each reporting period.
Foreign Currency Translation
Certain wholly-owned subsidiaries operate under a functional currency different from the U.S. dollar, such as the Euro, Indian Rupee, Philippine Peso, British Pound Sterling, and Japanese Yen. The financial statements of these foreign subsidiaries are translated into U.S. dollars using period-end rates of exchange for assets and liabilities, and average rates for the period for revenues and expenses. Translation gains and losses that arise from translating assets, liabilities, revenue and expenses of foreign operations are recorded in AOCL as a component of stockholders’ equity. The accumulated foreign currency translation loss totaled $72.3 million and $48.0 million at August 31, 2019 and 2018, respectively.
Income and Deferred Taxes
Income tax expense is based on taxable income determined in accordance with current enacted laws and tax rates. Deferred income taxes are recorded for the temporary differences between the financial statement and tax bases of assets and liabilities using current enacted tax rates. FactSet recognizes the financial effect of an income tax position only if it is more likely than not (greater than 50%) that the tax position will prevail upon tax examination, based solely on the technical merits of the tax position as of the reporting date. Otherwise, no benefit or expense can be recognized in the consolidated financial statements. The tax benefits recognized are measured based on the largest benefit that has a greater than 50% likelihood of being realized upon ultimate settlement. Additionally, FactSet accrues interest on all tax exposures for which reserves have been established consistent with jurisdictional tax laws. Interest is classified as income tax expense in the financial statements. As of August 31, 2019, the Company had gross unrecognized tax benefits totaling $10.9 million, including $1.1 million of accrued interest, recorded as Taxes payable (non-current) on the Consolidated Balance Sheets.
Stock-Based Compensation
Accounting guidance requires the measurement and recognition of compensation expense for all share-based payment awards made to employees and directors including stock options, restricted stock and common shares acquired under employee stock purchases based on estimated fair values of the share awards that are scheduled to vest during the period. FactSet uses the straight-line attribution method for all awards with graded vesting features and service conditions only. Under this method, the amount of compensation expense that is recognized on any date is at least equal to the vested portion of the award on that date. For all stock-based awards with performance conditions, the graded vesting attribution method is used by the Company to determine the monthly stock-based compensation expense over the applicable vesting periods.
As stock-based compensation expense recognized is based on awards ultimately expected to vest, it has been reduced for estimated forfeitures. Forfeitures are estimated at the time of grant and revised, if necessary, in subsequent periods if actual forfeitures differ from those estimates. Forfeitures are estimated based primarily on historical experience. For fiscal 2019 and 2018, windfall tax benefits, defined as tax deductions that exceed recorded stock-based compensation, are classified as cash inflows from operations and in fiscal 2017 are classified as cash inflows from financing activities.
63
Performance-based stock options require management to make assumptions regarding the likelihood of achieving Company performance targets on a quarterly basis. The number of performance-based options that vest will be predicated on the Company achieving certain performance levels. A change in the financial performance levels the Company achieves could result in changes to FactSet’s current estimate of the vesting percentage and related stock-based compensation.
Treasury Stock
The Company accounts for repurchased common stock under the cost method and includes such treasury stock as a component of its stockholders’ equity. The Company accounts for the formal retirement of treasury stock by deducting its par value from common stock, reducing additional paid-in capital (“APIC”) by the average amount recorded in APIC when the stock was originally issued and any remaining excess of cost deducted from retained earnings.
Operating Leases
The Company conducts all of its operations in leased facilities which have minimum lease obligations under non-cancelable operating leases. Certain of these leases contain rent escalations based on specified percentages. Most of the leases contain renewal options and require payments for taxes, insurance and maintenance. Rent expense is charged to operations as incurred except for escalating rents, which are charged to operations on a straight-line basis over the life of the lease. Lease incentives, relating to allowances provided by landlords, are amortized over the term of the lease as a reduction of rent expense. Costs associated with acquiring a subtenant, including broker commissions and tenant allowances, are amortized over the sublease term as a reduction of sublease income.
Business Combinations
The Company accounts for its business combinations using the purchase method of accounting. The acquisition purchase price is allocated to the underlying identified, tangible and intangible assets and liabilities assumed, based on their respective estimated fair values on the acquisition date. The excess of the purchase consideration over the fair values of the identified assets and liabilities is recorded as goodwill and assigned to one or more reporting units. The amounts and useful lives assigned to acquisition-related tangible and intangible assets impact the amount and timing of future amortization expense. Determining the fair value of assets acquired and liabilities assumed and the expected useful life, requires management’s judgment and often involves the use of significant estimates and assumptions, including assumptions with respect to future cash inflows and outflows, discount rates, asset lives and market multiples, among other items. Acquisition-related expenses and restructuring costs are recognized separately from the business combination and are expensed as incurred.
Concentrations of Risk
Cash and cash equivalents are maintained with several financial institutions. Deposits held with banks may exceed the amount of insurance provided on such deposits. Generally, these deposits may be redeemed upon demand and are maintained with financial institutions with reputable credit and therefore bear minimal credit risk. The Company seeks to mitigate its credit risks by spreading such risks across multiple counterparties and monitoring the risk profiles of these counterparties.
New Accounting Standards or Updates Recently Adopted
As of the beginning of fiscal 2019, FactSet implemented all applicable new accounting standards and updates issued by the Financial Accounting Standards Board (“FASB”) that were in effect. There were no new standards or updates adopted during the last three fiscal years that had a material impact on the consolidated financial statements.
Revenue Recognition
In May 2014 and July 2015, the FASB issued accounting standard updates which clarified principles for recognizing revenue arising from contracts with clients and superseded most current revenue recognition guidance, including industry-specific guidance. The core principle of the revenue model is that an entity recognizes revenue to depict the transfer of promised goods or services to clients in an amount that reflects the consideration to which the entity expects to be entitled, in exchange for those goods or services. The new guidance also requires increased disclosures including the nature, amount, timing, and uncertainty of revenue and cash flows related to contracts with clients.
64
The standard allows two methods of adoption: i) retrospectively to each prior period presented ("full retrospective method"), or ii) retrospectively with the cumulative effect recognized in retained earnings as of the date of adoption ("modified retrospective method"). FactSet adopted the new standard using the modified retrospective method as of the beginning of its first quarter of fiscal 2019.
FactSet’s implementation efforts include the evaluation of contract revenue under the new guidance. Additionally, an assessment of the qualitative and quantitative impacts of pricing changes during the contractual term and fulfillment costs was made.
The Company derives most of its revenue by providing client access to its hosted proprietary data and analytics platform, which can include various combinations of products and services available over the contractual term. The Company determined that the subscription-based service represents a single performance obligation covering a series of distinct products and services that are substantially the same and that have the same pattern of transfer to the client. FactSet recorded an opening cumulative increase to retained earnings of $2.5 million, or $2.0 million net of tax, during the first quarter of fiscal 2019, related to certain fulfillment costs, which include up-front costs to allow for the delivery of services and products that are expected to be recovered. Under the new standard, such up-front costs are recognized as an asset and amortized consistent with the associated revenue for providing the services. The adoption of the new standards did not materially change the Company’s accounting policy for revenue recognition and did not have a material impact on the Company’s consolidated financial statements. Refer to Note 4 Revenue Recognition for further details.
Recognition and Measurement of Financial Assets and Financial Liabilities
During the first quarter of fiscal 2019, FactSet adopted the accounting standard update issued by the FASB in January 2016, which amended the recognition, measurement, presentation, and disclosure of certain financial instruments. Under the amended guidance, investments in equity securities, excluding equity method investments, will be measured at fair value with changes in fair value to be recognized in net income. This guidance was applied on a modified retrospective approach through a cumulative effect adjustment to retained earnings as permitted by the standard and did not have a material impact on the Company’s consolidated financial statements.
Cash Flow Simplification
During the first quarter of fiscal 2019, FactSet adopted the accounting standard update issued by the FASB in August 2016, which simplified how certain transactions are classified in the statement of cash flows. This included revised guidance on the cash flow classification of debt prepayments and debt extinguishment costs, contingent consideration payments made after a business combination and distributions received from equity method investments. The guidance is intended to reduce diversity in practice across all industries. The adoption of this standard had no impact on the Company’s consolidated financial statements.
Income Taxes on Intra-Entity Transfers of Assets
During the first quarter of fiscal 2019, FactSet adopted the accounting standard update issued by the FASB in October 2016, which removed the prohibition against the immediate recognition of the current and deferred income tax effects of intra-entity transfers of assets other than inventory. The guidance was issued in order to reduce diversity in practice related to the tax consequences of certain types of intra-entity asset transfers, particularly those involving intellectual property. The adoption of this standard had no impact on the Company’s consolidated financial statements.
Share-Based Payments
During the first quarter of fiscal 2019, FactSet adopted the accounting standard update issued by the FASB in May 2017, which amended the scope of modification accounting for share-based payment arrangements. The guidance focused on changes to the terms or conditions of share-based payment awards that would require the application of modification accounting and specifies that an entity would not apply modification accounting if the fair value, vesting conditions and classification of the awards are the same immediately before and after the modification. The adoption of this standard had no impact on the Company’s consolidated financial statements.
Reclassification of Certain Tax Effects from Accumulated Other Comprehensive Income
During the first quarter of fiscal 2019, FactSet adopted the accounting standard update issued by the FASB in February 2018, which allowed companies to reclassify certain stranded income tax effects resulting from the enactment of the Tax Cuts and Jobs Act (the "TCJA") from accumulated other comprehensive income to retained earnings. The adoption of this standard did not have a material impact on the Company’s consolidated financial statements.
65
Implementation Costs in a Cloud Computing Arrangement
During the first quarter of fiscal 2019, FactSet adopted the accounting standard update issued by the FASB in August 2018, which related to a client’s accounting for implementation costs incurred in a cloud computing arrangement that is a service contract. This guidance aligns the requirements for capitalizing implementation costs in a cloud computing service contract with the guidance for capitalizing implementation costs to develop or obtain internal-use software. Capitalized implementation costs will be amortized over the term of the arrangement. This accounting standard update will be effective for the Company beginning in the first quarter of fiscal 2021, however the Company elected to early adopt this standard on a prospective basis during the first quarter of fiscal 2019. There was no impact to the Company’s consolidated financial statements as a result of the adoption of this standard, as FactSet is currently accounting for costs incurred in a cloud computing arrangement in accordance with the guidance provided in this standard.
Recent Accounting Standards or Updates Not Yet Effective
Leases
In February 2016, the FASB issued an accounting standard update related to accounting for leases. The guidance introduces a lessee model that requires most leases to be reported on the balance sheet. The accounting standard update aligns many of the underlying principles of the new lessor model with those in the FASB’s new revenue recognition standard. The guidance also eliminates the requirement in current GAAP for an entity to use bright-line tests in determining lease classification. FactSet will adopt the new accounting standard effective September 1, 2019, using a modified retrospective approach to record the required cumulative effect adjustments to the opening balance sheet in the period of adoption, rather than in the earliest comparative period presented. As such, the Company's historical consolidated financial statements will not be restated.
FactSet will elect the package of practical expedients permitted under the transition guidance, which permits the Company not to reassess under the new standard the prior conclusions about lease identification, lease classification, and initial direct costs. FactSet will not elect the use-of-hindsight practical expedient in determining the lease term and in assessing impairment. FactSet will also elect the practical expedient to not separate lease components from non-lease components but, rather, to combine them into one single lease component. The Company has also elected to apply the short-term lease exception to not recognize lease liabilities and right-of-use assets for leases with a term of 12 months or less. FactSet will recognize these lease payments on a straight-line basis over the lease term.
The Company does not expect the adoption of the new lease accounting standard to have a material impact on its Consolidated Statements of Income, Consolidated Statements of Comprehensive Income and Consolidated Statements of Cash flows. The Company does expect the adoption to have a material impact to its Consolidated Balance Sheet due to the recognition of the required right of use asset and liability, which will primarily relate to the Company's real estate operating leases. Refer to Note 19 Commitments and Contingencies for information regarding the Company's undiscounted future lease commitments.
Credit Losses on Financial Instruments
In June 2016, the FASB issued an accounting standard that significantly changes how entities will measure credit losses for most financial assets and certain other instruments that are not measured at fair value through net income. The standard will replace today’s “incurred loss” approach with an “expected loss” model for instruments measured at amortized cost. This guidance will be effective for the Company beginning in the first quarter of fiscal 2021. The Company is currently evaluating the impact of this accounting standard update but it is not expected to have a material impact on the consolidated financial statements.
Goodwill Impairment Test
In January 2017, the FASB issued an accounting standard update which removes the requirement for companies to compare the implied fair value of goodwill with its carrying amount as part of step 2 of the goodwill impairment test. A goodwill impairment will now be the amount by which a reporting unit’s carrying value exceeds its fair value, not to exceed the carrying amount of goodwill. This accounting standard update will be effective for the Company beginning in the first quarter of fiscal 2021, with early adoption permitted for any impairment tests performed after January 1, 2017 and is not expected to have a material impact on the consolidated financial statements.
66
Hedge Accounting Simplification
In August 2017, the FASB issued an accounting standard update to reduce the complexity of and simplify the application of hedge accounting. The guidance refines and expands hedge accounting for both financial and nonfinancial risk components, eliminates the need to separately measure and report hedge ineffectiveness, and aligns the recognition and presentation of the effects of the hedging instrument and the hedged item in the financial statements. This guidance will be effective for the Company beginning in the first quarter of fiscal 2020. The Company is currently evaluating the impact of this accounting standard update but it is not expected to have a material impact on the consolidated financial statements.
No other new accounting pronouncements issued or effective as of August 31, 2019 have had or are expected to have an impact on the Company’s consolidated financial statements.
4. REVENUE RECOGNITION
The Company derives most of its revenue by providing client access to its hosted proprietary data and analytics platform which can include various combinations of products and services available over the contractual term. The hosted platform is a subscription-based service that consists primarily of providing access to products and services including workstations, analytics, enterprise data, research management, and trade execution. The Company determined that the subscription-based service represents a single performance obligation covering a series of distinct products and services that are substantially the same and that have the same pattern of transfer to the client. The Company determined that the nature of the promise to the client is to provide daily access to one overall data and analytics platform. This platform provides integrated financial information, analytical applications and industry-leading service for the investment community. Based on the nature of the services and products offered by FactSet, the Company applies an input time-based measure of progress as the client is simultaneously receiving and consuming the benefits of the platform. The Company records revenue for its contracts using the over-time revenue recognition model as a client is invoiced or performance in satisfied, which is comparable with how revenue is recognized today. FactSet does not consider payment terms a performance obligation for customers with contractual terms that are one year or less and has elected the practical expedient.
In FactSet’s assessment of contracts with clients, the Company did identify a small portion of contracts with certain fulfillment costs, which include up-front costs to allow for the delivery of services and products that are expected to be recovered. In connection with the adoption of the new standard, these fulfillment costs are recognized as an asset and amortized consistent with the associated revenue for providing the services, which prior to adoption were expensed. As a result, during the first quarter of fiscal 2019, FactSet recorded an opening cumulative increase to Retained earnings of $2.5 million, or $2.0 million net of tax, with an offsetting increase related to the current asset portion in Prepaid expenses and other current assets and the non-current asset portion in Other assets based on the term of the license period. Prospectively, fulfillment costs will continue to be recognized in the same accounts used for the adoption impact, which include the Prepaid expenses and other current assets account for the current portion and Other assets for the non-current portion, based on the term of the license period. The differences between the Company’s reported operating results as of August 31, 2019, which reflect the application of the new standard on the Company’s contracts, and the results that would have been reported as if the accounting was performed pursuant to the accounting standards previously in effect, were not material. There are no significant judgments that would impact the timing of revenue recognition. The majority of client contracts have a duration of one year or less, or the amount FactSet is entitled to receive corresponds directly with the value of performance obligations completed to date, and therefore, the Company does not disclose the value of the remaining unsatisfied performance obligations.
Disaggregated Revenue
The Company disaggregates revenue from contracts with clients by demographic region which include U.S., Europe and Asia Pacific. FactSet believes these geographic regions are reflective of how the Company manages the business and the demographic markets in which it serves. The geographic regions best depict the nature, amount, timing and uncertainty of revenue and cash flows related to contracts with clients. Refer to Note 8 Segment Information for further information on revenue by geographic region.
67
The following table presents this disaggregation of revenue by geography:
| |
|
August 31, |
|
| (in thousands) |
|
2019 |
|
|
2018 |
|
|
2017 |
|
| U.S. |
|
$ |
894,554 |
|
|
$ |
841,908 |
|
|
$ |
784,146 |
|
| Europe |
|
$ |
408,084 |
|
|
$ |
387,589 |
|
|
$ |
330,332 |
|
| Asia Pacific |
|
$ |
132,713 |
|
|
$ |
120,648 |
|
|
$ |
106,701 |
|
| Total Revenue |
|
$ |
1,435,351 |
|
|
$ |
1,350,145 |
|
|
$ |
1,221,179 |
|
5. FAIR VALUE MEASURES
Fair value is defined as the price that would be received from selling an asset or paid to transfer a liability (i.e., the “exit price”) in an orderly transaction between market participants at the measurement date. In determining fair value, the use of various valuation methodologies, including market, income and cost approaches is permissible. The Company considers the principal or most advantageous market in which it would transact and considers assumptions that market participants would use when pricing the asset or liability.
Fair Value Hierarchy
The accounting guidance for fair value measurements establishes a fair value hierarchy that requires an entity to maximize the use of observable inputs and minimize the use of unobservable inputs when measuring fair value. There are three levels of inputs that may be used to measure fair value based on the reliability of inputs. A financial instrument’s categorization within the fair value hierarchy is based upon the lowest level of input that is significant to the fair value measurement. The Company’s assessment of the significance of a particular input to the fair value measurement requires judgment and may affect their placement within the fair value hierarchy levels. FactSet has categorized its cash equivalents, investments and derivatives within the fair value hierarchy as follows:
Level 1 - applies to assets or liabilities for which there are quoted prices in active markets for identical assets or liabilities. These Level 1 assets and liabilities include FactSet’s corporate money market funds that are classified as cash equivalents.
Level 2 - applies to assets or liabilities for which there are inputs other than quoted prices that are observable for the asset or liability such as quoted prices for similar assets or liabilities in active markets; quoted prices for identical assets or liabilities in markets with insufficient volume or infrequent transactions (less active markets); or model-derived valuations in which significant inputs are observable or can be derived principally from, or corroborated by, observable market data. The Company’s certificates of deposit, mutual funds and derivative instruments are classified as Level 2.
Level 3 - applies to assets or liabilities for which there are unobservable inputs to the valuation methodology that are significant to the measurement of the fair value of the assets or liabilities. There were no Level 3 assets or liabilities held by FactSet as of August 31, 2019 or 2018.
68
(a) Assets and Liabilities Measured at Fair Value on a Recurring Basis
The following tables shows by level within the fair value hierarchy the Company’s assets and liabilities that are measured at fair value on a recurring basis at August 31, 2019 and 2018:
| |
|
Fair Value Measurements at August 31, 2019 |
|
| (in thousands) |
|
Level 1 |
|
|
Level 2 |
|
|
Level 3 |
|
|
Total |
|
| Assets |
|
|
|
|
|
|
|
|
|
|
|
|
|
|
|
|
| Corporate money market funds(1) |
|
$ |
75,849 |
|
|
$ |
— |
|
|
$ |
— |
|
|
$ |
75,849 |
|
| Mutual Funds(2) |
|
|
— |
|
|
|
18,583 |
|
|
|
— |
|
|
|
18,583 |
|
| Certificates of deposit(3) |
|
|
— |
|
|
|
7,090 |
|
|
|
— |
|
|
|
7,090 |
|
| Derivative instruments(4) |
|
|
— |
|
|
|
520 |
|
|
|
— |
|
|
|
520 |
|
| Total assets measured at fair value |
|
$ |
75,849 |
|
|
$ |
26,193 |
|
|
$ |
— |
|
|
$ |
102,042 |
|
| |
|
|
|
|
|
|
|
|
|
|
|
|
|
|
|
|
| Liabilities |
|
|
|
|
|
|
|
|
|
|
|
|
|
|
|
|
| Derivative instruments(4) |
|
$ |
— |
|
|
$ |
3,575 |
|
|
$ |
— |
|
|
$ |
3,575 |
|
| Total liabilities measured at fair value |
|
$ |
— |
|
|
$ |
3,575 |
|
|
$ |
— |
|
|
$ |
3,575 |
|
| |
|
Fair Value Measurements at August 31, 2018 |
|
| (in thousands) |
|
Level 1 |
|
|
Level 2 |
|
|
Level 3 |
|
|
Total |
|
| Assets |
|
|
|
|
|
|
|
|
|
|
|
|
|
|
|
|
| Corporate money market funds(1) |
|
$ |
75 |
|
|
$ |
— |
|
|
$ |
— |
|
|
$ |
75 |
|
| Mutual Funds(2) |
|
|
— |
|
|
|
18,668 |
|
|
|
— |
|
|
|
18,668 |
|
| Certificates of deposit(3) |
|
|
— |
|
|
|
10,591 |
|
|
|
— |
|
|
|
10,591 |
|
| Derivative instruments(4) |
|
|
— |
|
|
|
90 |
|
|
|
— |
|
|
|
90 |
|
| Total assets measured at fair value |
|
$ |
75 |
|
|
$ |
29,349 |
|
|
$ |
— |
|
|
$ |
29,424 |
|
| |
|
|
|
|
|
|
|
|
|
|
|
|
|
|
|
|
| Liabilities |
|
|
|
|
|
|
|
|
|
|
|
|
|
|
|
|
| Derivative instruments(4) |
|
$ |
— |
|
|
$ |
4,036 |
|
|
$ |
— |
|
|
$ |
4,036 |
|
| Total liabilities measured at fair value |
|
$ |
— |
|
|
$ |
4,036 |
|
|
$ |
— |
|
|
$ |
4,036 |
|
| |
(1) |
The Company’s corporate money market funds are readily convertible into cash and the net asset value of each fund on the last day of the quarter is used to determine its fair value. As such, the Company’s corporate money market funds are classified as Level 1 assets and included in Cash and cash equivalents within the Consolidated Balance Sheets. |
| |
(2) |
The Company’s mutual funds have a fair value based on the fair value of the underlying investments held by the mutual funds allocated to each share of the mutual fund using a net asset value approach. The fair value of the underlying investments is based on observable inputs. As such, the Company’s mutual funds are classified as Level 2 assets and are classified as Investments (short-term) on the Consolidated Balance Sheets. |
| |
(3) |
The Company’s certificates of deposit held for investment are not debt securities and are classified as Level 2 assets. These certificates of deposit have original maturities greater than three months, but less than one year and, as such, are classified as Investments (short-term) within the Consolidated Balance Sheets. |
| |
(4) |
The Company utilizes the income approach to measure fair value for its derivative instruments (foreign exchange forward contracts). The income approach uses pricing models that rely on market observable inputs such as spot, forward and interest rates, as well as credit default swap spreads and therefore are classified as Level 2 assets. |
The Company did not have any transfers between Level 1 and Level 2 fair value measurements during the periods presented.
69
(b) Assets and Liabilities Measured at Fair Value on a Non-Recurring Basis
Certain assets, including goodwill and intangible assets, and liabilities, are measured at fair value on a non-recurring basis; that is, the assets and liabilities are not measured at fair value on an ongoing basis but are subject to fair value adjustments in certain circumstances such as when they are deemed to be other-than-temporarily impaired. The fair values of these non-financial assets and liabilities are determined based on valuation techniques using the best information available, and may include quoted market prices, market comparable information, and discounted cash flow projections. An impairment charge is recorded when the cost exceeds its fair value, based upon the results of such valuations. During fiscal 2019 and 2018, no fair value adjustments or material fair value measurements were required for the Company’s non-financial assets or liabilities.
(c) Assets and Liabilities Measured at Fair Value for Disclosure Purposes Only
As of August 31, 2019, and 2018, the fair value of the Company’s long-term debt was $575.0 million, which approximated its carrying amount given the application of a floating interest rate equal to the daily LIBOR rate plus a spread using a debt leverage pricing grid. As the interest rate is a variable rate, adjusted based on market conditions, it approximates the current market-rate for similar instruments available to companies with comparable credit quality and maturity, and therefore, the long-term debt is categorized as Level 2 in the fair value hierarchy.
6. DERIVATIVE INSTRUMENTS
Cash Flow Hedges
FactSet conducts business outside the U.S. in several currencies including the Euro, Indian Rupee, Philippine Peso, British Pound Sterling, and Japanese Yen. As such, it is exposed to movements in foreign currency exchange rates compared to the U.S. dollar. The Company utilizes derivative instruments (foreign currency forward contracts) to manage the exposures related to the effects of foreign exchange rate fluctuations and reduce the volatility of earnings and cash flows associated with changes in foreign currency. The Company does not enter into foreign currency forward contracts for trading or speculative purposes. See Note 19, Commitments and Contingencies - Concentration of Credit Risk, for further discussion on counterparty credit risk.
In designing a specific hedging approach, FactSet considered several factors, including offsetting exposures, the significance of exposures, the forecasting of risk and the potential effectiveness of the hedge. The gains and losses on foreign currency forward contracts offset the variability in operating expenses associated with currency movements. The changes in fair value for these foreign currency forward contracts are initially reported as a component of accumulated other comprehensive loss ("AOCL'") and subsequently reclassified into operating expenses when the hedge is settled. There was no discontinuance of cash flow hedges during fiscal 2019 or 2018, and as such, no corresponding gains or losses related to changes in the value of the Company’s contracts were reclassified into earnings prior to settlement.
As of August 31, 2019, FactSet maintained the following foreign currency forward contracts to hedge its exposures:
| |
• |
Philippine Peso – foreign currency forward contracts to hedge approximately 75% of its Philippine Peso exposure through the fourth quarter of fiscal 2020. |
| |
• |
Indian Rupee – foreign currency forward contracts to hedge approximately 50% of its Indian Rupee exposure through the end of the third quarter of fiscal 2020, and 25% of its Indian Rupee exposure through the fourth quarter of fiscal 2020. |
| |
• |
Euro – foreign currency forward contracts to hedge approximately 75% of its Euro exposure through the first quarter of fiscal 2020, 50% of its Euro exposure from the second quarter through the third quarter of fiscal 2020, and 25% of its Euro exposure through the fourth quarter of fiscal 2020. |
| |
• |
British Pound Sterling – foreign currency forward contracts to hedge approximately 75% of its British Pound sterling exposure through the first quarter of fiscal 2020, 50% of its British Pound Sterling exposure from the second quarter through the third quarter of fiscal 2020, and 25% of its British Pound Sterling exposure through the fourth quarter of fiscal 2020. |
70
The following is a summary of all hedging positions and corresponding fair values:
| Currency Hedged |
|
Gross Notional Value |
|
|
Fair Value (Liability) Asset |
|
| (in thousands, in U.S. dollars) |
|
August 31, 2019 |
|
|
August 31, 2018 |
|
|
August 31, 2019 |
|
|
August 31, 2018 |
|
| Philippine Peso |
|
$ |
26,000 |
|
|
$ |
52,000 |
|
|
$ |
520 |
|
|
$ |
(1,230 |
) |
| Indian Rupee |
|
|
20,410 |
|
|
|
50,780 |
|
|
|
(998 |
) |
|
|
(1,490 |
) |
| Euro |
|
|
40,854 |
|
|
|
26,312 |
|
|
|
(1,230 |
) |
|
|
(503 |
) |
| British Pound Sterling |
|
|
26,436 |
|
|
|
18,995 |
|
|
|
(1,347 |
) |
|
|
(723 |
) |
| Total |
|
$ |
113,700 |
|
|
$ |
148,087 |
|
|
$ |
(3,055 |
) |
|
$ |
(3,946 |
) |
As of August 31, 2019, the gross notional value of foreign currency forward contracts to purchase Philippine Pesos and Indian Rupees with U.S. dollars was ₱1.4 billion and Rs.1.4 billion, respectively. The gross notional value of foreign currency forward contracts to purchase U.S. dollars with Euros and British Pound Sterling was €35.7 million and £20.5 million, respectively.
Fair Value of Derivative Instruments
The following tables provide a summary of the fair value amounts of derivative instruments and gains and losses on derivative instruments:
| Designation of Derivatives (in thousands) |
|
Balance Sheet Location |
|
August 31, 2019 |
|
|
August 31, 2018 |
|
| Derivatives designated as hedging instruments |
|
Assets: Foreign Currency Forward Contracts |
|
|
|
|
|
|
|
|
| |
|
Prepaid expenses and other current assets |
|
$ |
520 |
|
|
$ |
90 |
|
| |
|
Other assets |
|
$ |
— |
|
|
$ |
— |
|
| |
|
|
|
|
|
|
|
|
|
|
| |
|
Liabilities: Foreign Currency Forward Contracts |
|
|
|
|
|
|
|
|
| |
|
Accounts payable and accrued expenses |
|
$ |
3,575 |
|
|
$ |
1,731 |
|
| |
|
Deferred rent and other non-current liabilities |
|
$ |
— |
|
|
$ |
2,305 |
|
All derivatives were designated as hedging instruments as of August 31, 2019 and 2018, respectively.
Derivatives in Cash Flow Hedging Relationships
The following table provides the pre-tax effect of derivative instruments in cash flow hedging relationships for the each of the three fiscal years ended August 31, 2019, 2018 and 2017:
| (in thousands) |
|
(Loss) Gain Recognized in AOCL on Derivatives (Effective Portion) |
|
Location of (Loss) Gain Reclassified from AOCL |
|
(Loss) Gain Reclassified from AOCL into Income (Effective Portion) |
|
| Derivatives in Cash Flow Hedging Relationships |
|
2019 |
|
|
2018 |
|
|
2017 |
|
into Income (Effective Portion) |
|
2019 |
|
|
2018 |
|
|
2017 |
|
| Foreign currency forward contracts |
|
$ |
(187 |
) |
|
$ |
(7,700 |
) |
|
$ |
5,183 |
|
SG&A |
|
$ |
(1,794 |
) |
|
$ |
3,106 |
|
|
$ |
(2,883 |
) |
No amount of ineffectiveness was recorded in the Consolidated Statements of Income for these designated cash flow hedges and all components of each derivative’s gain or loss were included in the assessment of hedge effectiveness. As of August 31, 2019, FactSet estimates that $3.1 million of net derivative losses related to its cash flow hedges included in AOCL will be reclassified into earnings within the next 12 months.
Offsetting of Derivative Instruments
FactSet’s master netting and other similar arrangements with its respective counterparties allow for net settlement under certain conditions. As of August 31, 2019 and 2018, there were no material amounts recorded net on the Consolidated Balance Sheets.
7. OTHER COMPREHENSIVE (LOSS) INCOME AND ACCUMULATED OTHER COMPREHENSIVE LOSS
The components of other comprehensive (loss) income during the fiscal years ended August 31, 2019, 2018 and 2017 are as follows:
| |
|
August 31, 2019 |
|
|
August 31, 2018 |
|
|
August 31, 2017 |
|
| (in thousands) |
|
Pre-tax |
|
|
Net of tax |
|
|
Pre-tax |
|
|
Net of tax |
|
|
Pre-tax |
|
|
Net of tax |
|
| Foreign currency translation adjustments |
|
$ |
(24,325 |
) |
|
$ |
(24,325 |
) |
|
$ |
(9,431 |
) |
|
$ |
(9,431 |
) |
|
$ |
28,816 |
|
|
$ |
28,816 |
|
| Net unrealized gain (loss) on cash flow hedges recognized in AOCL |
|
|
891 |
|
|
|
504 |
|
|
|
(10,806 |
) |
|
|
(7,288 |
) |
|
|
8,066 |
|
|
|
5,017 |
|
| Other comprehensive (loss) income |
|
$ |
(23,434 |
) |
|
$ |
(23,821 |
) |
|
$ |
(20,237 |
) |
|
$ |
(16,719 |
) |
|
$ |
36,882 |
|
|
$ |
33,833 |
|
The components of AOCL are as follows:
| (in thousands) |
|
August 31, 2019 |
|
|
August 31, 2018 |
|
| Accumulated unrealized losses on cash flow hedges, net of tax |
|
$ |
(2,266 |
) |
|
$ |
(3,486 |
) |
| Accumulated foreign currency translation adjustments |
|
|
(72,278 |
) |
|
|
(47,953 |
) |
| Total accumulated other comprehensive loss |
|
$ |
(74,544 |
) |
|
$ |
(51,439 |
) |
8. SEGMENT INFORMATION
Operating segments are defined as components of an enterprise that have the following characteristics: (i) it engages in business activities from which they may earn revenues and incur expenses, (ii) its operating results are regularly reviewed by the company’s chief operating decision maker to make decisions about resources to be allocated to the segment and assess its performance, and (iii) its discrete financial information is available. Executive management, along with the CEO, constitute FactSet’s chief operating decision making group (“CODMG”). Executive management consists of certain executives who directly report to the CEO, consisting of the Chief Financial Officer, Chief Technology and Product Officer, Global Head of Sales and Client Solutions, General Counsel, Chief Human Resources Officer and Head of Analytics and Trading. The CODMG reviews financial information at the operating segment level and is responsible for making decisions about resources allocated amongst the operating segments based on actual results.
The Company's operating segments are aligned with how the Company, including its CODMG, manages the business and the demographic markets in which it serves. The Company’s internal financial reporting structure is based on three segments: the U.S., Europe and Asia Pacific. The Company believes this alignment helps to better manage the business and view the markets it serves, which are centered on providing integrated global financial and economic information. Sales, consulting, data collection, product development and software engineering are the primary functional groups within the U.S., Europe and Asia Pacific segments. These functional groups provide global financial and economic information to investment managers, investment banks and other financial services professionals.
The U.S. segment serves investment professionals including financial institutions throughout the Americas. The Europe and Asia Pacific segments serve investment professionals located throughout Europe and Asia Pacific, respectively. Segment revenue reflects direct sales to clients based in their respective geographic locations. Each segment records compensation expense (including stock-based compensation), amortization of intangible assets, depreciation of furniture and fixtures, amortization of leasehold improvements, communication costs, professional fees, rent expense, travel, office and other direct expenses.
Expenditures associated with the Company’s data centers, third-party data costs and corporate headquarters charges are recorded by the U.S. segment and are not allocated to the other segments. The content collection centers located in India, the Philippines, and Latvia, benefit all the Company’s operating segments and thus the expenses incurred at these locations are allocated to each segment based on a percentage of revenue.
72
The following reflects the results of operations of the segments, consistent with the Company’s management structure. These results are used, in part, by management, both in evaluating the performance of, and in allocating resources to, each of the segments.
| (in thousands) |
|
|
|
|
|
|
|
|
|
|
|
|
|
|
|
|
| Year Ended August 31, 2019 |
|
U.S. |
|
|
Europe |
|
|
Asia Pacific |
|
|
Total |
|
| Revenue from clients |
|
$ |
894,554 |
|
|
$ |
408,084 |
|
|
$ |
132,713 |
|
|
$ |
1,435,351 |
|
| Segment operating profit |
|
|
179,374 |
|
|
|
179,258 |
|
|
|
79,403 |
|
|
|
438,035 |
|
| Total assets |
|
|
851,014 |
|
|
|
588,911 |
|
|
|
120,205 |
|
|
|
1,560,130 |
|
| Depreciation and amortization |
|
|
40,018 |
|
|
|
14,703 |
|
|
|
5,742 |
|
|
|
60,463 |
|
| Stock-based compensation |
|
|
26,152 |
|
|
|
5,320 |
|
|
|
928 |
|
|
|
32,400 |
|
| Capital expenditures |
|
|
43,647 |
|
|
|
2,595 |
|
|
|
13,128 |
|
|
|
59,370 |
|
| Year Ended August 31, 2018 |
|
U.S. |
|
|
Europe |
|
|
Asia Pacific |
|
|
Total |
|
| Revenue from clients |
|
$ |
841,908 |
|
|
$ |
387,589 |
|
|
$ |
120,648 |
|
|
$ |
1,350,145 |
|
| Segment operating profit |
|
|
148,095 |
|
|
|
148,977 |
|
|
|
69,132 |
|
|
|
366,204 |
|
| Total assets |
|
|
724,259 |
|
|
|
585,497 |
|
|
|
109,692 |
|
|
|
1,419,448 |
|
| Depreciation and amortization |
|
|
37,453 |
|
|
|
15,710 |
|
|
|
4,122 |
|
|
|
57,285 |
|
| Stock-based compensation |
|
|
26,014 |
|
|
|
4,857 |
|
|
|
645 |
|
|
|
31,516 |
|
| Capital expenditures |
|
|
20,358 |
|
|
|
3,140 |
|
|
|
10,022 |
|
|
|
33,520 |
|
| Year Ended August 31, 2017 |
|
U.S. |
|
|
Europe |
|
|
Asia Pacific |
|
|
Total |
|
| Revenue from clients |
|
$ |
784,146 |
|
|
$ |
330,332 |
|
|
$ |
106,701 |
|
|
$ |
1,221,179 |
|
| Segment operating profit |
|
|
137,104 |
|
|
|
153,676 |
|
|
|
61,355 |
|
|
|
352,135 |
|
| Total assets |
|
|
703,941 |
|
|
|
609,368 |
|
|
|
100,006 |
|
|
|
1,413,315 |
|
| Depreciation and amortization |
|
|
35,244 |
|
|
|
9,837 |
|
|
|
3,213 |
|
|
|
48,294 |
|
| Stock-based compensation |
|
|
30,247 |
|
|
|
3,320 |
|
|
|
616 |
|
|
|
34,183 |
|
| Capital expenditures |
|
|
29,561 |
|
|
|
2,385 |
|
|
|
4,916 |
|
|
|
36,862 |
|
GEOGRAPHIC INFORMATION - The following table sets forth information for those countries that are 10% or more of revenue:
| |
|
Years ended August 31, |
|
| (in thousands) |
|
2019 |
|
|
2018 |
|
|
2017 |
|
| Revenue(1) |
|
|
|
|
|
|
|
|
|
|
|
|
| United States |
|
$ |
894,554 |
|
|
$ |
841,908 |
|
|
$ |
784,146 |
|
| United Kingdom |
|
|
166,944 |
|
|
|
157,346 |
|
|
|
163,732 |
|
| All other European countries |
|
|
241,140 |
|
|
|
230,243 |
|
|
|
166,600 |
|
| Asia Pacific |
|
|
132,713 |
|
|
|
120,648 |
|
|
|
106,701 |
|
| Total revenue |
|
$ |
1,435,351 |
|
|
$ |
1,350,145 |
|
|
$ |
1,221,179 |
|
| |
(1) |
Revenue is attributed to countries based on the location of the client. |
73
The following table sets forth long-lived assets by geographic area:
| |
|
At August 31, |
|
| (in thousands) |
|
2019 |
|
|
2018 |
|
| Long-lived Assets(1) |
|
|
|
|
|
|
|
|
| United States |
|
$ |
99,783 |
|
|
$ |
74,792 |
|
| United Kingdom |
|
|
5,347 |
|
|
|
5,806 |
|
| All other European countries |
|
|
5,069 |
|
|
|
5,774 |
|
| Asia Pacific |
|
|
22,325 |
|
|
|
14,173 |
|
| Total long-lived assets |
|
$ |
132,524 |
|
|
$ |
100,545 |
|
| |
(1) |
Long-lived assets consist of property, equipment and leasehold improvements, net of accumulated depreciation and amortization and exclude goodwill, intangible assets, deferred taxes and other assets. |
9. BUSINESS COMBINATIONS
BISAM
On March 17, 2017, FactSet acquired BI-SAM Technologies (“BISAM”) for a total purchase price of $217.6 million. BISAM is a global provider of portfolio performance and attribution, multi-asset risk, GIPS composites management and reporting. BISAM’s product offerings include B-One, BISAM’s cross-asset solution, which will serve as a complement to both FactSet’s portfolio analytics suite and client reporting solutions, and Cognity, which enhances FactSet’s risk analysis for derivatives and quantitative portfolio construction. These factors contributed to a purchase price in excess of fair value of BISAM’s net tangible and intangible assets, leading to the recognition of goodwill. At the time of acquisition, BISAM employed over 160 employees based primarily in its New York, Boston, Paris, London and Sofia offices. Total transaction costs of $3.2 million were recorded within Selling, General and Administrative (“SG&A”) expenses in the Consolidated Statements of Income during fiscal 2017.
The total purchase price of $217.6 million was allocated to BISAM’s net tangible and intangible assets based upon their estimated fair value as of the date of acquisition. The allocation included $27.6 million to tangible assets and $56.6 million to amortizable intangible assets consisting of client relationships, amortized over 16 years using an accelerated amortization method; software technology, amortized over five years using a straight-line amortization method; and a trade name, amortized over four years using a straight-line amortization method.
Goodwill totaling $173.9 million represents the excess of the purchase price over the fair value of the net tangible and intangible assets acquired. Goodwill generated from the BISAM acquisition is included in the US and European segments and is not deductible for income tax purposes. The results of operations of BISAM have been included in the Company’s Consolidated Statements of Income since the completion of the acquisition on March 17, 2017. Pro forma information has not been presented because the effect of the BISAM acquisition is not material to the Company’s consolidated financial results.
VERMILION
On November 8, 2016, FactSet acquired Vermilion Holdings Limited (“Vermilion”) for a total purchase price of $67.9 million. Vermilion is a global provider of client reporting and communications solutions and services to the financial services industry. Client reporting is a growing area of the market as regulatory requirements rise and with the acquisition of Vermilion and its Vermilion Reporting Suite (“VRS”), FactSet now offers a workflow around all elements of the client reporting process, which it expects will expand as investors grow increasingly sophisticated. This factor contributed to a purchase price in excess of fair value of Vermilion’s net tangible and intangible assets, leading to the recognition of goodwill. At the time of acquisition, Vermilion employed 59 individuals in its London, Boston and Singapore offices. Total transaction costs related to the acquisition were $0.7 million in fiscal 2017 and recorded within SG&A expenses in the Consolidated Statements of Income during fiscal 2017.
74
The total purchase price of $67.9 million was allocated to Vermilion’s net tangible and intangible assets based upon their estimated fair value as of the date of acquisition. The allocation included $8.0 million to tangible assets and $18.2 million to intangible assets, consisting of client relationships, amortized over 15 years using an accelerated amortization method; software technology, amortized over six years using a straight-line amortization method; non-compete agreements, amortized over three years using a straight-line amortization method; and a trade name, amortized over four years using a straight-line amortization method.
Goodwill totaling $51.2 million represents the excess of the purchase price over the fair value of the net tangible and intangible assets acquired. Goodwill generated from the Vermilion acquisition is included in the European segment and is not deductible for income tax purposes. The results of operations of Vermilion have been included in the Company’s Consolidated Statements of Income since the completion of the acquisition on November 8, 2016. Pro forma information has not been presented because the effect of the Vermilion acquisition is not material to the Company’s consolidated financial results.
10. GOODWILL
Changes in the carrying amount of goodwill by segment for fiscal years ended August 31, 2019 and 2018 are as follows:
| (in thousands) |
|
U.S. |
|
|
Europe |
|
|
Asia Pacific |
|
|
Total |
|
| Balance at August 31, 2017 |
|
$ |
386,835 |
|
|
$ |
317,759 |
|
|
$ |
2,966 |
|
|
$ |
707,560 |
|
| Acquisitions and other adjustments |
|
|
(640 |
) |
|
|
(1,562 |
) |
|
|
— |
|
|
|
(2,202 |
) |
| Foreign currency translations |
|
|
— |
|
|
|
(3,503 |
) |
|
|
(22 |
) |
|
|
(3,525 |
) |
| Balance at August 31, 2018 |
|
$ |
386,195 |
|
|
$ |
312,694 |
|
|
$ |
2,944 |
|
|
$ |
701,833 |
|
| Foreign currency translations |
|
|
— |
|
|
|
(16,235 |
) |
|
|
131 |
|
|
|
(16,104 |
) |
| Balance at August 31, 2019 |
|
$ |
386,195 |
|
|
$ |
296,459 |
|
|
$ |
3,075 |
|
|
$ |
685,729 |
|
Goodwill is not amortized as it is estimated to have an indefinite life. At least annually, the Company is required to test goodwill at the reporting unit level for potential impairment, and, if impaired, write down to fair value based on the present value of discounted cash flows. The Company’s reporting units evaluated for potential impairment were the U.S., Europe and Asia Pacific, which reflect the level of internal reporting the Company uses to manage its business and operations. The three reporting units are consistent with the operating segments reported as there is no discrete financial information available for the subsidiaries within each operating segment. The Company performed its annual goodwill impairment test during the fourth quarter of fiscal 2019, consistent with the timing of previous years, utilizing a qualitative analysis and concluded it was more likely than not the fair value of each reporting unit was greater than its respective carrying value and no impairment charge was required.
11. INTANGIBLE ASSETS
FactSet’s identifiable intangible assets consist of acquired content databases, client relationships, software technology, non-compete agreements and trade names resulting from previous acquisitions, which have been fully integrated into the Company’s operations. The weighted average useful life of the Company’s intangible assets at August 31, 2019 was 12.6 years. The Company amortizes intangible assets over their estimated useful lives, which are evaluated quarterly to determine whether events and circumstances warrant a revision to the remaining period of amortization. There have been no material changes to the estimate of the remaining useful lives during fiscal years 2019, 2018 and 2017. If indicators of impairment are present, amortizable intangible assets are tested for impairment comparing the carrying value to undiscounted cash flows and, if impaired, written down to fair value based on discounted cash flows. No impairment of intangible assets has been identified during any of the periods presented. The intangible assets have no assigned residual values.
75
The gross carrying amounts and accumulated amortization totals related to the Company’s identifiable intangible assets are as follows:
| At August 31, 2019 (in thousands) |
|
Gross Carrying Amount |
|
|
Accumulated Amortization |
|
|
Net Carrying Amount |
|
| Data content |
|
$ |
32,200 |
|
|
$ |
21,512 |
|
|
$ |
10,688 |
|
| Client relationships |
|
|
95,905 |
|
|
|
35,506 |
|
|
|
60,399 |
|
| Software technology |
|
|
105,426 |
|
|
|
56,965 |
|
|
|
48,461 |
|
| Non-compete agreements |
|
|
1,311 |
|
|
|
1,228 |
|
|
|
83 |
|
| Trade names |
|
|
3,994 |
|
|
|
3,074 |
|
|
|
920 |
|
| Total |
|
$ |
238,836 |
|
|
$ |
118,285 |
|
|
$ |
120,551 |
|
| At August 31, 2018 (in thousands) |
|
Gross Carrying Amount |
|
|
Accumulated Amortization |
|
|
Net Carrying Amount |
|
| Data content |
|
$ |
33,992 |
|
|
$ |
20,990 |
|
|
$ |
13,002 |
|
| Client relationships |
|
|
98,882 |
|
|
|
29,387 |
|
|
|
69,495 |
|
| Software technology |
|
|
106,505 |
|
|
|
44,231 |
|
|
|
62,274 |
|
| Non-compete agreements |
|
|
4,840 |
|
|
|
2,381 |
|
|
|
2,459 |
|
| Trade names |
|
|
4,070 |
|
|
|
2,365 |
|
|
|
1,705 |
|
| Total |
|
$ |
248,289 |
|
|
$ |
99,354 |
|
|
$ |
148,935 |
|
Amortization expense recorded for intangible assets during fiscal years 2019, 2018 and 2017 was $25.1 million, $24.7 million and $19.9 million, respectively. As of August 31, 2019, estimated intangible asset amortization expense for each of the next five years and thereafter are as follows:
| Fiscal Year (in thousands) |
|
Estimated Amortization Expense |
|
| 2020 |
|
$ |
22,151 |
|
| 2021 |
|
|
20,859 |
|
| 2022 |
|
|
18,088 |
|
| 2023 |
|
|
13,508 |
|
| 2024 |
|
|
8,061 |
|
| Thereafter |
|
|
37,884 |
|
| Total |
|
$ |
120,551 |
|
12. PROPERTY, EQUIPMENT AND LEASEHOLD IMPROVEMENTS
Property, equipment and leasehold improvements consist of the following:
| |
|
August 31, |
|
| (in thousands) |
|
2019 |
|
|
2018 |
|
| Leasehold improvements |
|
$ |
155,520 |
|
|
$ |
119,479 |
|
| Computers and related equipment |
|
|
153,868 |
|
|
|
181,623 |
|
| Furniture and fixtures |
|
|
48,986 |
|
|
|
44,699 |
|
| Subtotal |
|
$ |
358,374 |
|
|
$ |
345,801 |
|
| Less accumulated depreciation and amortization |
|
|
(225,850 |
) |
|
|
(245,256 |
) |
| Property, equipment and leasehold improvements, net |
|
$ |
132,524 |
|
|
$ |
100,545 |
|
Depreciation expense was $35.4 million, $32.6 million and $28.0 million for fiscal years 2019, 2018 and 2017, respectively.
13. COMMON STOCK AND EARNINGS PER SHARE
On May 17, 2019, FactSet's Board of Directors approved a 12.5% increase in the regular quarterly dividend from $0.64 to $0.72 per share.
Shares of common stock outstanding were as follows:
| |
|
Years ended August 31, |
|
| (in thousands) |
|
2019 |
|
|
2018 |
|
|
2017 |
|
| Balance, beginning of year (September 1) |
|
|
38,193 |
|
|
|
39,023 |
|
|
|
40,038 |
|
| Common stock issued for employee stock plans |
|
|
839 |
|
|
|
712 |
|
|
|
693 |
|
| Repurchase of common stock from employees(1) |
|
|
(32 |
) |
|
|
(8 |
) |
|
|
(50 |
) |
| Repurchase of common stock under the share repurchase program |
|
|
(882 |
) |
|
|
(1,534 |
) |
|
|
(1,555 |
) |
| Repurchase of common stock under accelerated share repurchase agreement |
|
|
— |
|
|
|
— |
|
|
|
(103 |
) |
| Balance, end of year (August 31) |
|
|
38,118 |
|
|
|
38,193 |
|
|
|
39,023 |
|
| |
(1) |
For fiscal 2019, 2018 and 2017, the Company repurchased 31,644, 8,070 and 49,771 shares, or $7.2 million, $1.5 million and $7.8 million, of common stock, respectively, in settlement of employee tax withholding obligations due upon the vesting of restricted stock. |
A reconciliation of the weighted average shares outstanding used in the basic and diluted earnings per share (“EPS”) computations is as follows:
| (in thousands, except per share data) |
|
Net Income (Numerator) |
|
|
Weighted Average Common Shares (Denominator) |
|
|
Per Share Amount |
|
| For the year ended August 31, 2019 |
|
|
|
|
|
|
|
|
|
|
|
|
| Basic EPS |
|
|
|
|
|
|
|
|
|
|
|
|
| Income available to common stockholders |
|
$ |
352,790 |
|
|
|
38,144 |
|
|
$ |
9.25 |
|
| Diluted EPS |
|
|
|
|
|
|
|
|
|
|
|
|
| Dilutive effect of stock options and restricted stock |
|
|
|
|
|
|
729 |
|
|
|
|
|
| Income available to common stockholders plus assumed conversions |
|
$ |
352,790 |
|
|
|
38,873 |
|
|
$ |
9.08 |
|
| For the year ended August 31, 2018 |
|
|
|
|
|
|
|
|
|
|
|
|
| Basic EPS |
|
|
|
|
|
|
|
|
|
|
|
|
| Income available to common stockholders |
|
$ |
267,085 |
|
|
|
38,733 |
|
|
$ |
6.90 |
|
| Diluted EPS |
|
|
|
|
|
|
|
|
|
|
|
|
| Dilutive effect of stock options and restricted stock |
|
|
|
|
|
|
644 |
|
|
|
|
|
| Income available to common stockholders plus assumed conversions |
|
$ |
267,085 |
|
|
|
39,377 |
|
|
$ |
6.78 |
|
| For the year ended August 31, 2017 |
|
|
|
|
|
|
|
|
|
|
|
|
| Basic EPS |
|
|
|
|
|
|
|
|
|
|
|
|
| Income available to common stockholders |
|
$ |
258,259 |
|
|
|
39,444 |
|
|
$ |
6.55 |
|
| Diluted EPS |
|
|
|
|
|
|
|
|
|
|
|
|
| Dilutive effect of stock options and restricted stock |
|
|
|
|
|
|
198 |
|
|
|
|
|
| Income available to common stockholders plus assumed conversions |
|
$ |
258,259 |
|
|
|
39,642 |
|
|
$ |
6.51 |
|
Dilutive potential common shares consist of stock options and unvested restricted stock awards. There were 11,481 stock options excluded from the fiscal 2019 calculation of diluted EPS, because their inclusion would have been anti-dilutive. There were no stock options excluded from the fiscal 2018 calculation of diluted EPS and there were 704,786 stock options excluded from the fiscal 2017 calculations of diluted EPS, because their inclusion would have been anti-dilutive.
77
There were no performance-based stock options excluded from the calculation of diluted EPS for fiscal 2019. As of August 31, 2018 and 2017, the number of performance-based stock options excluded from the calculation of diluted EPS was 249,443 and 415,061, respectively. Performance-based stock options are omitted from the calculation of diluted EPS until the performance criteria is considered probable of being achieved.
14. STOCKHOLDERS’ EQUITY
Preferred Stock
At August 31, 2019 and 2018, there were 10,000,000 shares of preferred stock ($0.01 par value per share) authorized, of which no shares were issued and outstanding. FactSet’s Board of Directors may from time to time authorize the issuance of one or more series of preferred stock and, in connection with the creation of such series, determine the characteristics of each such series including, without limitation, the preference and relative, participating, optional or other special rights, and the qualifications, limitations or restrictions of the series.
Common Stock
At August 31, 2019 and 2018, there were 150,000,000 shares of common stock ($0.01 par value per share) authorized, of which 40,104,192 and 39,264,849 shares were issued, respectively. The authorized shares of common stock are issuable for any proper corporate purpose, including future stock splits, stock dividends, acquisitions, raising equity capital or to adopt additional employee benefit plans.
Treasury Stock
On January 31, 2018, FactSet retired 13,292,689 shares of treasury stock. These retired shares are now included in the Company’s pool of authorized but unissued shares. The retired treasury stock was initially recorded using the cost method and had a carrying value of $1.7 billion at January 31, 2018. The Company’s accounting policy upon the formal retirement of treasury stock is to deduct its par value from common stock ($0.1 million), reduce additional paid-in capital (“APIC”) by the average amount recorded in APIC when stock was originally issued ($186.7 million) and any remaining excess of cost as a reduction to retained earnings ($1.5 billion). As of August 31, 2019, and August 31, 2018, there were 1,986,352 and 1,072,263 shares of treasury stock (at cost) outstanding, respectively.
Share Repurchase Program
Repurchases will be made from time to time in the open market and privately negotiated transactions, subject to market conditions. During fiscal 2019, the Company repurchased 882,445 shares for $213.1 million compared to 1,534,398 shares for $302.4 million in fiscal 2018.
On June 24, 2019, the Board of Directors of FactSet approved a $210.0 million expansion of the existing share repurchase program. Subsequent to this expansion, $238.6 million remains authorized for future share repurchases as of August 31, 2019. There is no defined number of shares to be repurchased over a specified timeframe through the life of the share repurchase program. It is expected that share repurchases will be paid using existing and future cash generated by operations.
Restricted Stock
Restricted stock awards entitle the holder to shares of common stock as the awards vest over time. During fiscal 2019, previously granted restricted stock awards of 85,401 shares vested and were included in common stock outstanding as of August 31, 2019 (recorded net of 31,644 shares repurchased from employees at a cost of $7.2 million to cover their cost of taxes upon vesting of the restricted stock). During fiscal 2018, 26,599 shares of previously granted restricted stock awards vested and were included in common stock outstanding as of August 31, 2018 (recorded net of 8,070 shares repurchased from employees at a cost of $1.5 million to cover their cost of taxes upon vesting of the restricted stock).
78
Dividends
The Company’s Board of Directors declared the following dividends on our common stock during the periods presented:
| Year Ended |
|
Dividends per Share of Common Stock |
|
|
Record Date |
|
Total amount (in thousands) |
|
|
Payment Date |
| Fiscal 2019 |
|
|
|
|
|
|
|
|
|
|
|
|
| First Quarter |
|
$ |
0.64 |
|
|
November 30, 2018 |
|
$ |
24,372 |
|
|
December 18, 2018 |
| Second Quarter |
|
$ |
0.64 |
|
|
February 28, 2019 |
|
$ |
24,385 |
|
|
March 19, 2019 |
| Third Quarter |
|
$ |
0.72 |
|
|
May 31, 2019 |
|
$ |
27,506 |
|
|
June 18, 2019 |
| Fourth Quarter |
|
$ |
0.72 |
|
|
August 30, 2019 |
|
$ |
27,445 |
|
|
September 19, 2019 |
| |
|
|
|
|
|
|
|
|
|
|
|
|
| Fiscal 2018 |
|
|
|
|
|
|
|
|
|
|
|
|
| First Quarter |
|
$ |
0.56 |
|
|
November 30, 2017 |
|
$ |
21,902 |
|
|
December 19, 2017 |
| Second Quarter |
|
$ |
0.56 |
|
|
February 28, 2018 |
|
$ |
21,799 |
|
|
March 20, 2018 |
| Third Quarter |
|
$ |
0.64 |
|
|
May 31, 2018 |
|
$ |
24,566 |
|
|
June 19, 2018 |
| Fourth Quarter |
|
$ |
0.64 |
|
|
August 31, 2018 |
|
$ |
24,443 |
|
|
September 18, 2018 |
All the above cash dividends were paid from existing cash resources. Future dividend payments will depend on the Company’s earnings, capital requirements, financial condition and other factors considered relevant by the Company and is subject to final determination by the Company’s Board of Directors.
15. EMPLOYEE STOCK OPTION AND RETIREMENT PLANS
Stock Options Awards
The FactSet Research Systems Inc. Stock Option and Award Plan, as amended and restated (the “Long Term Incentive Plan” or “LTIP”) provides for the grant of share-based awards, including stock options and restricted stock awards to employees of FactSet. The expiration date of the Long Term Incentive Plan is December 19, 2027. Stock options granted under the LTIP expire not more than ten years from the date of grant and the majority vest ratably over a period of five years. Options become vested and exercisable provided the employee continues employment with the Company through the applicable vesting date and remain exercisable until expiration or cancellation. Options are not transferable or assignable other than by will or the laws of descent and distribution. During the grantee’s lifetime, the options may be exercised only by the grantee.
As of August 31, 2019, a total of 2,524,304 stock options were outstanding at a weighted average exercise price of $168.50. Unamortized stock-based compensation of $80.4 million is expected to be recognized as stock-based compensation expense over the remaining weighted average vesting period of 3.0 years.
Stock Option Activity
In fiscal years 2019, 2018 and 2017, FactSet granted 502,139, 610,628 and 1,026,984 stock options, respectively. These stock options have a weighted average exercise price of $223.68, $190.65 and $157.09 to existing employees of the Company, respectively.
79
A summary of stock option activity is as follows:
| |
|
Number Outstanding |
|
|
Weighted Average Exercise Price Per Share |
|
| Balance at August 31, 2016 |
|
|
3,364 |
|
|
$ |
129.54 |
|
| Granted – non performance-based |
|
|
713 |
|
|
$ |
152.89 |
|
| Granted – performance-based |
|
|
291 |
|
|
$ |
166.29 |
|
| Granted – non-employee Directors grant |
|
|
24 |
|
|
$ |
170.24 |
|
| Exercised |
|
|
(487 |
) |
|
$ |
86.17 |
|
| Forfeited |
|
|
(539 |
) |
|
$ |
160.31 |
|
| Balance at August 31, 2017 |
|
|
3,366 |
|
|
$ |
139.29 |
|
| Granted – non performance-based |
|
|
575 |
|
|
$ |
190.14 |
|
| Granted – performance-based |
|
|
17 |
|
|
$ |
200.20 |
|
| Granted – non-employee Directors grant |
|
|
19 |
|
|
$ |
197.75 |
|
| Exercised |
|
|
(622 |
) |
|
$ |
113.73 |
|
| Forfeited |
|
|
(212 |
) |
|
$ |
158.14 |
|
| Balance at August 31, 2018 |
|
|
3,143 |
|
|
$ |
153.05 |
|
| Granted – non performance-based |
|
|
482 |
|
|
$ |
224.35 |
|
| Granted – non-employee Directors grant |
|
|
20 |
|
|
$ |
207.88 |
|
| Exercised |
|
|
(705 |
) |
|
$ |
137.61 |
|
| Forfeited |
|
|
(416 |
) |
|
$ |
170.54 |
|
| Balance at August 31, 2019 |
|
|
2,524 |
|
|
$ |
168.50 |
|
Stock Options Outstanding and Exercisable
The following table summarizes ranges of outstanding and exercisable options as of August 31, 2019 (in thousands, except per share data and the weighted average remaining years of contractual life):
| |
|
|
|
|
Outstanding |
|
|
Exercisable |
|
| Range of Exercise Prices Per Share |
|
|
Number Outstanding |
|
|
Weighted Average Remaining Years of Contractual Life |
|
|
Weighted Average Exercise Price Per Share |
|
|
Aggregate Intrinsic Value |
|
|
Number Exercisable |
|
|
Weighted Average Exercise Price Per Share |
|
|
Aggregate Intrinsic Value |
|
| $87.26 |
- |
$92.22 |
|
|
|
184 |
|
|
|
2.98 |
|
|
$ |
91.86 |
|
|
$ |
33,175 |
|
|
|
184 |
|
|
$ |
91.86 |
|
|
$ |
33,175 |
|
| $94.84 |
- |
$110.31 |
|
|
|
88 |
|
|
|
2.89 |
|
|
$ |
99.70 |
|
|
$ |
15,102 |
|
|
|
88 |
|
|
$ |
99.70 |
|
|
$ |
15,102 |
|
| $131.31 |
- |
$148.52 |
|
|
|
280 |
|
|
|
5.01 |
|
|
$ |
134.18 |
|
|
$ |
38,636 |
|
|
|
156 |
|
|
$ |
136.38 |
|
|
$ |
21,134 |
|
| $150.81 |
- |
$152.28 |
|
|
|
470 |
|
|
|
7.12 |
|
|
$ |
152.25 |
|
|
$ |
56,307 |
|
|
|
150 |
|
|
$ |
152.25 |
|
|
$ |
18,007 |
|
| $159.14 |
- |
$170.24 |
|
|
|
299 |
|
|
|
6.09 |
|
|
$ |
164.99 |
|
|
$ |
32,050 |
|
|
|
98 |
|
|
$ |
164.19 |
|
|
$ |
10,612 |
|
| $171.22 |
- |
$175.20 |
|
|
|
254 |
|
|
|
6.21 |
|
|
$ |
175.04 |
|
|
$ |
24,715 |
|
|
|
124 |
|
|
$ |
175.04 |
|
|
$ |
11,989 |
|
| $189.98 |
- |
$200.20 |
|
|
|
475 |
|
|
|
8.21 |
|
|
$ |
190.73 |
|
|
$ |
38,637 |
|
|
|
73 |
|
|
$ |
190.45 |
|
|
$ |
5,985 |
|
| $200.99 |
- |
$286.74 |
|
|
|
474 |
|
|
|
9.18 |
|
|
$ |
223.79 |
|
|
$ |
22,883 |
|
|
|
1 |
|
|
$ |
221.88 |
|
|
$ |
71 |
|
| Total Fiscal 2019 |
|
|
|
2,524 |
|
|
|
|
|
|
|
|
|
|
$ |
261,505 |
|
|
|
874 |
|
|
|
|
|
|
$ |
116,075 |
|
80
The following table summarizes outstanding and exercisable options as of August 31, 2018 and 2017 (in thousands, except the weighted average exercise price per share):
| |
|
August 31, 2018 |
|
|
August 31, 2017 |
|
| |
|
Number of Shares |
|
|
Weighted Average Exercise Price Per Share |
|
|
Number of Shares |
|
|
Weighted Average Exercise Price Per Share |
|
| Outstanding at fiscal year end |
|
|
3,143 |
|
|
$ |
153.05 |
|
|
|
3,366 |
|
|
$ |
139.29 |
|
| Exercisable at fiscal year end |
|
|
1,022 |
|
|
$ |
126.27 |
|
|
|
918 |
|
|
$ |
105.14 |
|
The total number of in-the-money options exercisable as of August 31, 2019 was 0.9 million with a weighted average exercise price $139.32. The aggregate intrinsic value of in-the-money stock options exercisable at August 31, 2019 and 2018 was $116.1 million and $105.3 million, respectively. The aggregate intrinsic value represents the difference between the Company’s closing stock price as of August 31, 2019 of $272.09 and the exercise price, multiplied by the number of options exercisable as of that date.
The weighted average remaining contractual life of stock options exercisable at August 31, 2019 and 2018 was 5.3 years and 5.6 years, respectively. The total pre-tax intrinsic value of stock options exercised during fiscal 2019, 2018 and 2017 was $73.0 million, $50.1 million and $38.0 million, respectively.
Performance-based Equity Awards
Performance-based equity awards, whether in the form of stock options or restricted stock, require management to make assumptions regarding the likelihood of achieving Company performance targets. The number of performance-based awards that vest will be predicated on the Company achieving performance levels during the measurement period subsequent to the date of grant. Dependent on the financial performance levels attained by FactSet, a percentage of the performance-based awards will vest to the grantees. However, there is no current guarantee that such awards will vest in whole or in part.
June 2017 Performance-based Option Grant Review
In connection with the acquisition of BISAM, FactSet granted 206,417 performance-based stock options in June 2017. These performance-based options were scheduled to vest 40% on the second anniversary date of the grant and 20% on each subsequent anniversary date, if certain BISAM revenue and operating income targets were achieved by March 31, 2019. In the third quarter of fiscal 2019, it was determined that the performance criteria were not achieved by March 31, 2019, and, as such, the options were forfeited, and no stock-based compensation expense was recorded for this performance-based option grant for fiscal 2019.
Restricted Stock and Stock Unit Awards
The Company’s Option Plan plans permit the issuance of restricted stock and restricted stock units. Restricted stock awards are subject to continued employment over a specified period.
Restricted Stock and Stock Unit Awards Activity
In fiscal years 2019, 2018 and 2017, FactSet granted 73,047, 3,497 and 62,400 restricted stock awards to employees of the Company, respectively. These awards have a weighted average grant date fair value of $239.03, $189.28 and $158.26 for fiscal years 2019, 2018 and 2017, respectively.
As of August 31, 2019, a total of 123,794 shares of restricted stock and restricted stock units were unvested and outstanding, which results in unamortized stock-based compensation of $21.8 million to be recognized as stock-based compensation expense over the remaining vesting period of 3.1 years.
81
A summary of restricted stock award activity is as follows:
| (in thousands, except per award data) |
|
Number Outstanding |
|
|
Weighted Average Grant Date Fair Value Per Award |
|
| Balance at August 31, 2016 |
|
|
262 |
|
|
|
126.27 |
|
| Granted (restricted stock and stock units) |
|
|
62 |
|
|
|
158.26 |
|
| Vested(1) |
|
|
(132 |
) |
|
|
123.28 |
|
| Canceled/forfeited |
|
|
(10 |
) |
|
|
130.32 |
|
| Balance at August 31, 2017 |
|
|
182 |
|
|
|
138.62 |
|
| Granted (restricted stock and stock units) |
|
|
3 |
|
|
|
189.28 |
|
| Vested(2) |
|
|
(27 |
) |
|
|
155.95 |
|
| Canceled/forfeited |
|
|
(15 |
) |
|
|
116.29 |
|
| Balance at August 31, 2018 |
|
|
143 |
|
|
|
139.34 |
|
| Granted (restricted stock and stock units) |
|
|
73 |
|
|
|
239.03 |
|
| Vested(3) |
|
|
(85 |
) |
|
|
125.04 |
|
| Canceled/forfeited |
|
|
(7 |
) |
|
|
181.32 |
|
| Balance at August 31, 2019 |
|
|
124 |
|
|
|
205.47 |
|
| |
(1) |
The 132,194 restricted stock awards that vested during fiscal 2017 were comprised of: 73,522 of awards relating to restricted stock granted on November 1, 2013, which cliff vested 60% after three years, 17,328 of awards relating to restricted stock granted on October 16, 2015, which vested 20% annually upon the anniversary date of the grant and 30,162 of awards relating to restricted stock granted on October 16, 2015, which were modified to accelerate vest 100% in conjunction with employee severance. Additionally, 11,182 awards vested related to other grants. |
| |
(2) |
The 26,599 restricted stock awards that vested during fiscal 2018 were comprised of: 9,765 of awards relating to restricted stock granted on October 16, 2015 and 8,600 of awards relating to restricted stock granted on June 30, 2017 which vest at a rate of 20% annually upon the anniversary date of the grant, respectively. Additionally, 8,234 awards vested related to other grants. |
| |
(3) |
The 85,401 restricted stock awards that vested during fiscal 2019 were comprised of: 42,276 of awards relating to restricted stock granted on November 1,2013 and 9,451 of awards relating to restricted stock granted on October 16, 2015, which vest at a rate of 20% annually upon the anniversary date of the grant, respectively, 18,691 of awards relating to restricted stock granted on February 9, 2015, which vest 100% upon the four year anniversary date of the grant, 8,924 of awards relating to restricted stock granted on June 30, 2017, which vest 60% after three years and 40% after five years. Additionally, there were 6,059 awards that vested related to other grants. |
82
Share-based Awards Available for Grant
A summary of share-based awards available for grant is as follows:
| (in thousands) |
|
Share-based Awards Available for Grant under the Employee Stock Option Plan |
|
|
Share-based Awards Available for Grant under the Non-Employee Stock Option Plan |
|
| Balance at August 31, 2016 |
|
|
1,491 |
|
|
|
66 |
|
| Granted – non performance-based options |
|
|
(713 |
) |
|
|
— |
|
| Granted – performance-based options |
|
|
(291 |
) |
|
|
— |
|
| Granted – non-employee Directors grant |
|
|
— |
|
|
|
(24 |
) |
| Restricted stock awards granted(1) |
|
|
(156 |
) |
|
|
— |
|
| Share-based awards canceled/forfeited(2) |
|
|
566 |
|
|
|
— |
|
| Balance at August 31, 2017 |
|
|
897 |
|
|
|
42 |
|
| Increase in the number of shares available for issuance |
|
|
5,750 |
|
|
|
250 |
|
| Granted – non performance-based options |
|
|
(575 |
) |
|
|
— |
|
| Granted – performance-based options |
|
|
(17 |
) |
|
|
— |
|
| Granted – non-employee Directors grant |
|
|
— |
|
|
|
(19 |
) |
| Restricted stock awards granted(1) |
|
|
(9 |
) |
|
|
— |
|
| Share-based awards canceled/forfeited(2) |
|
|
252 |
|
|
|
9 |
|
| Balance at August 31, 2018 |
|
|
6,298 |
|
|
|
282 |
|
| Granted – non performance-based options |
|
|
(481 |
) |
|
|
(20 |
) |
| Restricted stock awards granted(1) |
|
|
(183 |
) |
|
|
— |
|
| Share-based awards canceled/forfeited(2) |
|
|
433 |
|
|
|
2 |
|
| Balance at August 31, 2019 |
|
|
6,067 |
|
|
|
264 |
|
| |
(1) |
Each restricted stock award granted is equivalent to 2.5 shares granted under the Company’s Option Plan. |
| |
(2) |
Under the Company’s Option Plan, for each restricted stock award canceled/forfeited, an equivalent of 2.5 shares is added back to the available share-based awards balance. |
Employee Stock Purchase Plan
Shares of FactSet common stock may be purchased by eligible employees under the FactSet Research Systems Inc. Employee Stock Purchase Plan, as Amended and Restated (the "ESPP") in three-month intervals. The purchase price is equal to 85% of the lesser of the fair market value of the Company’s common stock on either the first day or the last day of each three-month offering period. Employee purchases may not exceed 10% of their gross compensation and a $25,000 contribution limit during an offering period.
During fiscal 2019, employees purchased 48,532 shares at a weighted average price of $205.64 as compared to 64,230 shares at a weighted average price of $160.34 for fiscal 2018. At August 31, 2019, the ESPP had 220,410 shares reserved for future issuance.
Employee Benefit Plans
The Company established its 401(k) Plan in fiscal 1993. The 401(k) Plan is a defined contribution plan covering all full-time, U.S. employees of the Company and is subject to the provisions of the Employee Retirement Income Security Act of 1974 and the Internal Revenue Code of 1986 (“IRC”). Each year, participants may contribute up to 60% of their eligible annual compensation, subject to annual limitations established by the IRC. The Company matches up to 4% of employees’ earnings, capped at the Internal Revenue Service annual maximum. Company matching contributions are subject to a five-year graduated vesting schedule. All full-time, U.S. employees are eligible for the matching contribution by the Company. The Company contributed $10.9 million, $11.6 million, and $10.1 million in matching contributions to employee 401(k) accounts during fiscal 2019, 2018 and 2017, respectively.
16. STOCK-BASED COMPENSATION
The Company recognized total stock-based compensation expense of $32.4 million, $31.5 million and $34.2 million in fiscal 2019, 2018 and 2017, respectively. As of August 31, 2019, $80.4 million of total unrecognized compensation expense related to non-vested awards is expected to be recognized over a weighted average period of 3.0 years. There was no stock-based compensation capitalized as of August 31, 2019 and 2018, respectively.
Employee Stock Option Fair Value Determinations
The Company utilizes the lattice-binomial option-pricing model (“binomial model”) to estimate the fair value of new employee stock option grants. The binomial model is affected by the Company’s stock price, as well as, assumptions regarding several variables, which include, but are not limited to the Company’s expected stock price volatility over the term of the awards, interest rates, option forfeitures and employee stock option exercise behaviors, to determine the grant date stock option award fair value.
| Q1 2019 |
454,598 non-performance-based employee stock options were granted at a weighted average exercise price of $221.93 and a weighted average estimated fair value of $56.77 per share. |
| Q2 2019 |
6,115 non-performance-based employee stock options were granted at a weighted average exercise price of $207.84 and a weighted average estimated fair value of $53.18 per share. |
| Q3 2019 |
2,320 non-performance-based employee stock options were granted at a weighted average exercise price of $267.02 and a weighted average estimated fair value of $68.33 per share. |
| Q4 2019 |
18,530 non-performance-based employee stock options were granted at a weighted average exercise price of $283.96 and a weighted average estimated fair value of $65.60 per share. |
| Q1 2018 |
553,942 non-performance-based employee stock options were granted at a weighted average exercise price of $189.98 and a weighted average estimated fair value of $48.27 per share. |
| Q2 2018 |
15,363 non-performance-based employee stock options were granted at a weighted average exercise price of $192.11 and a weighted average estimated fair value of $48.82 per share. |
| Q3 2018 |
There were no employee stock options granted during the three months ended May 31, 2018. |
| Q4 2018 |
5,848 non-performance-based employee stock options and 16,512 performance-based employee stock options were both granted at a weighted average exercise price of $200.20 with a weighted average estimated fair value of $50.87 per share. |
| Q1 2017 |
671,263 non performance-based employee stock options and 22,460 performance-based employee stock options were both granted at a weighted average exercise price of $152.51 with a weighted average estimated fair value of $39.60 per share. |
| Q2 2017 |
61,744 performance-based employee stock options were granted at a weighted average exercise price of $169.16 and a weighted average estimated fair value of $43.81 per share. |
| Q3 2017 |
11,604 non performance-based employee stock options were granted at a weighted average exercise price of $163.05 and a weighted average estimated fair value of $42.23 per share. |
| Q4 2017 |
29,650 non performance-based employee stock options and 206,417 performance-based employee stock options were granted at a weighted average exercise price of $165.75 and a weighted average estimated fair value of $42.93 per share. |
84
The weighted average estimated fair value of employee stock options granted during fiscal 2019, 2018 and 2017 was determined using the binomial model with the following weighted average assumptions:
| |
2019 |
|
|
2018 |
|
|
2017 |
|
| Term structure of risk-free interest rate |
|
1.28% |
— |
3.14% |
|
|
|
1.28% |
— |
2.41% |
|
|
|
0.07% |
— |
2.09% |
|
| Expected life (years) |
|
7.1 |
— |
7.1 |
|
|
|
7.4 |
— |
7.4 |
|
|
|
7.4 |
— |
8.1 |
|
| Term structure of volatility |
|
18% |
— |
29% |
|
|
|
19% |
— |
29% |
|
|
|
21% |
— |
30% |
|
| Dividend yield |
|
|
1.15% |
|
|
|
|
|
1.32% |
|
|
|
|
|
1.18% |
|
|
| Weighted average estimated fair value |
|
|
$57.12 |
|
|
|
|
|
$48.39 |
|
|
|
|
|
$40.68 |
|
|
| Weighted average exercise price |
|
|
$224.35 |
|
|
|
|
|
$190.42 |
|
|
|
|
|
$156.77 |
|
|
| Fair value as a percentage of exercise price |
|
|
25.5% |
|
|
|
|
|
25.4% |
|
|
|
|
|
25.9% |
|
|
The risk-free interest rate assumption for periods within the contractual life of the option is based on the U.S. Treasury yield curve in effect at the time of grant. Expected volatility is based on a combination of historical volatility of the Company’s stock and implied volatilities of publicly traded options to buy FactSet common stock with contractual terms closest to the expected life of options granted to employees. The approach to utilize a mix of historical and implied volatility was based upon the availability of actively traded options on the Company’s stock and the Company’s assessment that a combination of implied volatility and historical volatility is best representative of future stock price trends. The Company uses historical data to estimate option exercises and employee termination within the valuation model. The dividend yield assumption is based on the Company’s history and expectation of dividend payouts. The expected life of employee stock options represents the weighted average period the stock options are expected to remain outstanding and is a derived output of the binomial model. The binomial model estimates employees exercise behavior based on the option’s remaining vested life and the extent to which the option is in-the-money. The binomial model estimates the probability of exercise as a function of these two variables based on the entire history of exercises and cancellations of all past option grants made by the Company.
Non-Employee Director Stock Option Fair Value Determinations
The Non-Employee Directors' Stock Option and Award Plan, as Amended and Restated (the "Director Plan"), provides for the grant of share-based awards, including stock options, to non-employee directors of FactSet. As of August 31, 2019, shares available for future grant under the Director Plan was 263,956. The expiration date of the Director Plan is December 19, 2027.
The Company utilizes the Black-Scholes model to estimate the fair value of new non-employee Director stock option grants. The Black-Scholes model is affected by the Company’s stock price, as well as, assumptions regarding several variables, which include, but are not limited to, the Company’s expected stock price volatility over the term of the awards, interest rates, option forfeitures and employee stock option exercise behaviors, to determine the grant date stock-based payment award fair value.
Fiscal 2019
On January 15, 2019, FactSet granted 20,576 stock options to the Company’s non-employee Directors. These options have a weighted average estimated fair value of $42.77 per share, using the Black-Scholes option-pricing model with the following weighted average assumptions:
| Risk-free interest rate |
|
|
2.51 |
% |
| Expected life (years) |
|
|
5.4 |
|
| Expected volatility |
|
|
20.5 |
% |
| Dividend yield |
|
|
1.17 |
% |
85
Fiscal 2018
On January 12, 2018, FactSet granted 18,963 stock options to the Company’s non-employee Directors. These options have a weighted average estimated fair value of $38.76 per share, using the Black-Scholes option-pricing model with the following weighted average assumptions:
| Risk-free interest rate |
|
|
2.34 |
% |
| Expected life (years) |
|
|
5.4 |
|
| Expected volatility |
|
|
19.7 |
% |
| Dividend yield |
|
|
1.16 |
% |
Fiscal 2017
On January 13, 2017, FactSet granted 23,846 stock options to the Company’s non-employee Directors, including one-time new director grants of 2,104 for both Malcolm Frank and Sheila B. Jordan, who were elected to FactSet’s Board of Directors on December 20, 2016. All the options granted on January 13, 2017, have a weighted average estimated fair value of $35.65 per share, using the Black-Scholes option-pricing model with the following weighted average assumptions:
| Risk-free interest rate |
|
|
1.95 |
% |
| Expected life (years) |
|
|
5.4 |
|
| Expected volatility |
|
|
22.7 |
% |
| Dividend yield |
|
|
1.24 |
% |
Restricted Stock Fair Value Determinations
Restricted stock granted to employees entitles the holder to shares of common stock as the award vests over time, but not to dividends declared on the underlying shares, while the restricted stock is unvested. The grant date fair value of restricted stock awards is measured by reducing the grant date price of FactSet’s share by the present value of the dividends expected to be paid on the underlying stock during the requisite service period, discounted at the appropriate risk-free interest rate. The expense associated with restricted stock awards is amortized over the vesting period. During fiscal 2019, there were 73,047 restricted stock awards granted with a weighted average grant date fair value of $239.03 compared to 3,497 restricted stock awards granted with a weighted average grant date fair value of $189.28 in fiscal 2018.
| Q1 2019 |
41,102 shares of restricted stock were granted at a weighted average estimated fair value of $212.66 per share. |
| Q2 2019 |
51 shares of restricted stock were granted at a weighted average estimated fair value of $210.67 per share. |
| Q3 2019 |
265 shares of restricted stock were granted at a weighted average estimated fair value of $255.95 per share. |
| Q4 2019 |
31,629 shares of restricted stock were granted at a weighted average estimated fair value of $273.19 per share. |
| Q1 2018 |
961 shares of restricted stock were granted at a weighted average estimated fair value of $182.17 per share. |
| Q2 2018 |
No restricted stock granted. |
| Q3 2018 |
No restricted stock granted. |
| Q4 2018 |
2,536 shares of restricted stock were granted at a weighted average estimated fair value of $191.97 per share. |
| Q1 2017 |
5,084 shares of restricted stock were granted at a weighted average estimated fair value of $151.63 per share. |
| Q2 2017 |
7,843 shares of restricted stock were granted at a weighted average estimated fair value of $161.31 per share. |
| Q3 2017 |
No restricted stock granted. |
| Q4 2017 |
49,473 shares of restricted stock were granted at a weighted average estimated fair value of $158.46 per share. |
Employee Stock Purchase Plan Fair Value Determinations
During fiscal 2019, employees purchased 48,532 shares at a weighted average price of $205.64 compared to 64,230 shares at a weighted average price of $160.34 in fiscal 2018 and 75,372 shares at a weighted average price of $136.34 in fiscal 2017. Stock-based compensation expense recorded during fiscal 2019, 2018 and 2017 relating to the employee stock purchase plan was $2.0 million, $1.6 million and $2.1 million, respectively.
86
The Company uses the Black-Scholes model to calculate the estimated fair value for the employee stock purchase plan. The weighted average estimated fair value of employee stock purchase plan grants during fiscal years 2019, 2018 and 2017, was $41.06, $31.83 and $28.16 per share, respectively, with the following weighted average assumptions:
| |
|
2019 |
|
|
2018 |
|
|
2017 |
|
| Risk-free interest rate |
|
|
2.33 |
% |
|
|
1.55 |
% |
|
|
0.69 |
% |
| Expected life (months) |
|
|
3 |
|
|
|
3 |
|
|
|
3 |
|
| Expected volatility |
|
|
10.89 |
% |
|
|
10.19 |
% |
|
|
8.60 |
% |
| Dividend yield |
|
|
1.12 |
% |
|
|
1.27 |
% |
|
|
1.25 |
% |
Accuracy of Fair Value Estimates
The Company is responsible for determining the assumptions used in estimating the fair value of its share-based payment awards. The Company’s determination of fair value of share-based payment awards on the date of grant using an option-pricing model is affected by the Company’s stock price, as well as, assumptions regarding several highly complex and subjective variables. These variables include but are not limited to, the Company’s expected stock price volatility over the term of the awards, interest rates, option forfeiture rates and actual and projected employee stock option exercise behaviors. Option-pricing models were developed for use in estimating the value of traded options that have no vesting or hedging restrictions and are fully transferable.
17. INCOME TAXES
Income tax expense is based on taxable income determined in accordance with current enacted laws and tax rates. Deferred income taxes are recorded for the temporary differences between the financial statement and tax bases of assets and liabilities using currently enacted tax rates.
Provision for Income Taxes
The provision for income taxes is as follows:
| |
|
Years ended August 31, |
|
| (in thousands) |
|
2019 |
|
|
2018 |
|
|
2017 |
|
| U.S. operations |
|
$ |
288,860 |
|
|
$ |
199,654 |
|
|
$ |
218,650 |
|
| Non-U.S. operations |
|
|
133,105 |
|
|
|
152,184 |
|
|
|
125,662 |
|
| Income before income taxes |
|
$ |
421,965 |
|
|
$ |
351,838 |
|
|
$ |
344,312 |
|
| |
|
|
|
|
|
|
|
|
|
|
|
|
| U.S. operations |
|
$ |
55,824 |
|
|
$ |
65,778 |
|
|
$ |
65,403 |
|
| Non-U.S. operations |
|
|
13,351 |
|
|
|
18,975 |
|
|
|
20,650 |
|
| Total provision for income taxes |
|
$ |
69,175 |
|
|
$ |
84,753 |
|
|
$ |
86,053 |
|
| Effective tax rate |
|
|
16.4 |
% |
|
|
24.1 |
% |
|
|
25.0 |
% |
87
The components of the provision for income taxes consist of the following:
| |
|
Years ended August 31, |
|
| (in thousands) |
|
2019 |
|
|
2018 |
|
|
2017 |
|
| Current |
|
|
|
|
|
|
|
|
|
|
|
|
| U.S. federal |
|
$ |
35,688 |
|
|
$ |
58,835 |
|
|
$ |
58,057 |
|
| U.S. state and local |
|
|
18,389 |
|
|
|
5,159 |
|
|
|
5,659 |
|
| Non-U.S. |
|
|
17,376 |
|
|
|
22,669 |
|
|
|
17,458 |
|
| Total current taxes |
|
$ |
71,453 |
|
|
$ |
86,663 |
|
|
$ |
81,174 |
|
| |
|
|
|
|
|
|
|
|
|
|
|
|
| Deferred |
|
|
|
|
|
|
|
|
|
|
|
|
| U.S. federal |
|
$ |
1,813 |
|
|
$ |
2,079 |
|
|
$ |
4,320 |
|
| U.S. state and local |
|
|
(217 |
) |
|
|
(295 |
) |
|
|
(77 |
) |
| Non-U.S. |
|
|
(3,874 |
) |
|
|
(3,694 |
) |
|
|
636 |
|
| Total deferred taxes |
|
$ |
(2,278 |
) |
|
$ |
(1,910 |
) |
|
$ |
4,879 |
|
| Total provision for income taxes |
|
$ |
69,175 |
|
|
$ |
84,753 |
|
|
$ |
86,053 |
|
The provision for income taxes differs from the amount of income tax determined by applying the U.S. statutory federal income tax rate to income before income taxes as a result of the following factors:
| |
|
Years ended August 31, |
|
|
| (expressed as a percentage of income before income taxes) |
|
2019 |
|
|
2018 |
|
|
2017 |
|
|
| Tax at U.S. Federal statutory tax rate |
|
|
21.0 |
% |
|
|
25.7 |
% |
|
|
35.0 |
% |
|
| Increase (decrease) in taxes resulting from: |
|
|
|
|
|
|
|
|
|
|
|
|
|
| State and local taxes, net of U.S. federal income tax benefit |
|
|
4.0 |
|
|
|
2.9 |
|
|
|
1.8 |
|
|
| Foreign income at other than U.S. rates |
|
|
(1.4 |
) |
|
|
(3.2 |
) |
|
|
(7.0 |
) |
(3) |
| Foreign derived intangible income deduction |
|
|
(1.7 |
) |
|
|
— |
|
|
|
— |
|
|
| Domestic production activities deduction |
|
|
— |
|
|
|
(1.6 |
) |
|
|
(2.1 |
) |
|
| Income tax benefits from R&D tax credits |
|
|
(3.5 |
) |
|
|
(3.7 |
) |
|
|
(3.3 |
) |
|
| Income tax benefits from foreign tax credits |
|
|
— |
|
|
|
— |
|
|
|
(0.3 |
) |
|
| Share-based payments(1) |
|
|
(3.2 |
) |
|
|
(2.7 |
) |
|
|
— |
|
|
| One-time transition tax from TCJA |
|
|
(0.4 |
) |
|
|
6.6 |
|
(2) |
|
— |
|
|
| Other, net |
|
|
1.6 |
|
|
|
0.1 |
|
|
|
0.9 |
|
|
| Effective tax rate |
|
|
16.4 |
% |
|
|
24.1 |
% |
|
|
25.0 |
% |
|
| |
(1) |
During the first quarter of fiscal 2018, FactSet adopted an accounting standard that requires all excess tax benefits or deficiencies related to share-based payments to be reported within the consolidated statement of income that were previously reported within equity. The adoption of this standard resulted in the recognition of $9.5 million of excess tax benefits to FactSet’s provision for income taxes during fiscal 2018. |
| |
(2) |
The enactment of the TCJA resulted in a one-time transition tax expense of $23.2 million during the second quarter of fiscal 2018. |
| |
(3) |
Includes a 200 basis point benefit as a result of FactSet’s global realignment. Effective September 1, 2016, FactSet realigned certain aspects of its global operations from FactSet Research Systems Inc., its U.S. parent company, to FactSet UK Limited, a U.K. operating company, to better position the Company to serve its growing client base outside the U.S. This realignment allows the Company to further implement strategic corporate objectives and helps achieve operational and financial efficiencies, while complementing FactSet’s increasing global growth and reach. |
88
The fiscal 2019 provision for income taxes was $69.2 million, a decrease of 18.4% from the same period a year ago. The decrease was primarily attributable to the enactment of the TCJA. The TCJA imposed a one-time transition tax expense, which resulted in a $23.2 million impact to the income tax provision for fiscal 2018, without a comparable impact in fiscal 2019. This transition tax impact was revised during fiscal 2019, resulting in a net benefit of $3.4 million upon finalizing the accounting for the tax effects of the TCJA. The TCJA also lowered the statutory U.S corporate income tax rate from 35% to 21%, effective January 1, 2018, which was fully applicable for fiscal 2019 compared to the lower tax rate being phased in for the prior year comparable period. The reduction in the U.S. corporate income tax rate required a remeasurement of FactSet's net U.S. deferred tax position, which resulted in a non-recurring tax charge of $2.2 million during fiscal 2018. The decrease in the income tax provision was partially offset by a $3.3 million income tax expense from finalizing prior years’ tax returns and other discrete items for fiscal 2019.
Due to the changes in taxation of undistributed foreign earnings under the TCJA, FactSet will continue to analyze foreign subsidiary earnings, as well as global working capital requirements, and may repatriate earnings when the amounts are remitted substantially free of additional tax.
Deferred Tax Assets and Liabilities
The significant components of deferred tax assets that recorded within the Consolidated Balance Sheets were as follows:
| |
|
At August 31, |
|
| (in thousands) |
|
2019 |
|
|
2018 |
|
| Deferred tax assets: |
|
|
|
|
|
|
|
|
| Receivable reserve |
|
$ |
1,517 |
|
|
$ |
599 |
|
| Depreciation on property, equipment and leasehold improvements |
|
|
2,858 |
|
|
|
1,032 |
|
| Deferred rent |
|
|
9,454 |
|
|
|
7,711 |
|
| Stock-based compensation |
|
|
13,755 |
|
|
|
14,827 |
|
| Purchased intangible assets, including acquired technology |
|
|
(27,116 |
) |
|
|
(24,059 |
) |
| Other |
|
|
7,103 |
|
|
|
9,606 |
|
| Total deferred tax assets |
|
$ |
7,571 |
|
|
$ |
9,716 |
|
The significant components of deferred tax liabilities recorded within the Consolidated Balance Sheets were as follows:
| |
|
At August 31, |
|
| (in thousands |
|
2019 |
|
|
2018 |
|
| Deferred tax liabilities: |
|
|
|
|
|
|
|
|
| Stock-based compensation |
|
$ |
(1,067 |
) |
|
$ |
(946 |
) |
| Purchased intangible assets, including acquired technology |
|
|
17,188 |
|
|
|
22,429 |
|
| Other |
|
|
270 |
|
|
|
(293 |
) |
| Total deferred tax liabilities |
|
$ |
16,391 |
|
|
$ |
21,190 |
|
Unrecognized Tax Positions
Applicable accounting guidance prescribes a comprehensive model for the financial statement recognition, measurement, classification and disclosure of uncertain tax positions that a company has taken or expects to take on a tax return. FactSet recognizes the financial effect of an income tax position only if it is more likely than not (greater than 50%) that the tax position will be sustained based on its technical merits of the tax position. Otherwise, no benefit or expense can be recognized in the consolidated financial statements. The tax benefits recognized are measured based on the largest benefit that has a greater than 50% likelihood of being realized upon effective settlement with a taxing authority. Additionally, FactSet accrues interest on all tax exposures for which reserves have been established consistent with jurisdictional tax laws.
The determination of liabilities related to unrecognized tax benefits, including associated interest and penalties, requires significant estimates. There can be no assurance that the Company will accurately predict the audit outcomes, however, FactSet has no reason to believe that such audits will result in the payment of additional taxes and/or penalties that would have a material adverse effect on the Company’s results of operations or financial position, beyond current estimates. For this reason and due to ongoing audits by multiple tax authorities, FactSet will regularly engage in discussions and negotiations with tax authorities regarding tax matters in various jurisdictions. The Company adjusts these reserves in light of changing facts and circumstances, such as the closing of a tax audit or the refinement of an estimate. To the extent that the final outcome of these matters is different than the amounts recorded, such differences will affect the provision for income taxes in the period in which such determination is made. The Company does not currently anticipate that the total amounts of unrecognized tax benefits will significantly change within the next 12 months.
89
FactSet classifies the liability for unrecognized tax benefits as Taxes Payable (non-current) and to the extent that the Company anticipates payment of cash within one year, the benefit will be classified as Taxes Payable (current). Additionally, the Company accrues interest on all tax exposures for which reserves have been established consistent with jurisdictional tax laws. This interest is classified as income tax expense in the financial statements. As of August 31, 2019, FactSet had gross unrecognized tax benefits totaling $10.9 million, including $1.1 million of accrued interest, recorded as Taxes Payable (non-current) within the Consolidated Balance Sheets.
The following table summarizes the changes in the balance of gross unrecognized tax benefits:
| (in thousands) |
|
|
|
|
| Unrecognized income tax benefits at August 31, 2016 |
|
$ |
8,782 |
|
| Additions based on tax positions related to the current year |
|
|
3,896 |
|
| Additions for tax positions of prior years |
|
|
628 |
|
| Statute of limitations lapse |
|
|
(1,822 |
) |
| Unrecognized income tax benefits at August 31, 2017 |
|
$ |
11,484 |
|
| Additions based on tax positions related to the current year |
|
|
2,954 |
|
| Additions for tax positions of prior years |
|
|
531 |
|
| Statute of limitations lapse |
|
|
(3,146 |
) |
| Reductions from settlements with Taxing Authorities |
|
|
(2,600 |
) |
| Unrecognized income tax benefits at August 31, 2018 |
|
$ |
9,223 |
|
| Additions based on tax positions related to the current year |
|
|
3,133 |
|
| Additions for tax positions of prior years |
|
|
507 |
|
| Statute of limitations lapse |
|
|
(1,979 |
) |
| Reductions from settlements with Taxing Authorities |
|
|
— |
|
| Unrecognized income tax benefits at August 31, 2019 |
|
$ |
10,884 |
|
In the normal course of business, the Company’s tax filings are subject to audit by federal, state and foreign tax authorities. At August 31, 2019, the Company remained subject to examination in the following major tax jurisdictions for the tax years as indicated below:
| Major Tax Jurisdictions |
Open Tax Years |
| U.S. |
|
|
|
| Federal |
2016 |
through |
2018 |
| State (various) |
2016 |
through |
2018 |
| |
|
|
|
| Europe |
|
|
|
| United Kingdom |
2017 |
through |
2018 |
| France |
2017 |
through |
2018 |
| Germany |
2016 |
through |
2018 |
18. DEBT
FactSet’s debt obligations consisted of the following:
| |
|
At August 31, |
|
| (in thousands) |
|
2019 |
|
|
2018 |
|
| 2017 Revolving Credit Facility |
|
$ |
— |
|
|
$ |
575,000 |
|
| 2019 Revolving Credit Facility (maturity date of March 29, 2024) |
|
$ |
575,000 |
|
|
$ |
— |
|
2019 Credit Agreement
On March 29, 2019, the Company entered into the 2019 Credit Agreement (the "2019 Credit Agreement") between FactSet, as the borrower, and PNC Bank, National Association ("PNC"), as the administrative agent and lender. The 2019 Credit Agreement provides for a $750.0 million revolving credit facility (the "2019 Revolving Credit Facility"). FactSet may request borrowings under the 2019 Revolving Credit Facility until its maturity date of March 29, 2024. The 2019 Credit Agreement also allows FactSet, subject to certain requirements, to arrange for additional borrowings with PNC for an aggregate amount up to $500.0 million, provided that any such request for additional borrowings must be in a minimum amount of $25.0 million.
FactSet borrowed $575.0 million of the available $750.0 million provided by the 2019 Revolving Credit Facility, resulting in $175.0 million available to be withdrawn. FactSet is required to pay a commitment fee using a pricing grid currently at 0.10% based on the daily amount by which the available balance in the 2019 Revolving Credit Facility exceeds the borrowed amount. All outstanding loan amounts are reported as Long-term debt within the consolidated balance sheets at August 31, 2019. The principal balance is payable in full on the maturity date.
The fair value of our long-term debt was $575.0 million as of August 31, 2019, which the Company believe approximates carrying amount as the terms and interest rates approximate market rates given its floating interest rate basis. Borrowings under the loan bear interest on the outstanding principal amount at a rate equal to the daily LIBOR rate plus a spread using a debt leverage pricing grid, currently at 0.875%. During fiscal years 2019, 2018 and 2017, FactSet recorded interest expense of $19.8 million, $15.9 million and $8.4 million, respectively, on its outstanding debt amounts. The weighted average interest rate on amounts outstanding under our credit facilities was 3.35% and 2.69% as of August 31, 2019 and 2018, respectively. Interest on the loan outstanding is payable quarterly, in arrears, and on the maturity date.
During fiscal 2019, FactSet incurred approximately $0.9 million in debt issuance costs related to the 2019 Credit Agreement. These costs were capitalized as loan origination fees and are amortized into interest expense ratably over the term of the 2019 Credit Agreement.
The 2019 Credit Agreement contains covenants and requirements restricting certain FactSet activities, which are usual and customary for this type of loan. In addition, the 2019 Credit Agreement requires that FactSet maintain a consolidated net leverage ratio, as measured by total net funded debt/EBITDA below a specified level as of the end of each fiscal quarter. The Company was in compliance with all the covenants and requirements within the 2019 Credit Agreement as of August 31, 2019.
The borrowings from the 2019 Credit Agreement were used to retire all outstanding debt under the previous 2017 Credit Agreement between FactSet, as the borrower, and PNC as the lender on March 29, 2019. The total principal amount of the debt outstanding at the time of retirement was $575.0 million and there were no prepayment penalties.
2017 Credit Agreement
On March 17, 2017, the Company entered into a Credit Agreement (the "2017 Credit Agreement") between FactSet, as the borrower, and PNC Bank, National Association ("PNC"), as the administrative agent and lender. The 2017 Credit Agreement provided for a $575.0 million revolving credit facility (the "2017 Revolving Credit Facility"). FactSet could have requested borrowings under the 2017 Revolving Credit Facility until its maturity or retirement date. The 2017 Credit Agreement also allowed FactSet, subject to certain requirements, to arrange for additional borrowings with PNC for an aggregate amount of up to $225.0 million, provided that any such request for additional borrowings was in a minimum amount of $25.0 million. Borrowings under the loan were subject to interest on the outstanding principal amount at a rate equal to the daily LIBOR rate plus 1.00%. Interest on the loan outstanding was payable quarterly in arrears and on the maturity date. The principal balance was also payable in full on the maturity date. There were no prepayment penalties when the Company elected to prepay the outstanding loan amounts on March 29, 2019.
19. COMMITMENTS AND CONTINGENCIES
Commitments represent obligations, such as those for future purchases of goods or services that are not yet recorded on the balance sheet as liabilities. FactSet records liabilities for commitments when incurred (i.e., when the goods or services are received).
Lease Commitments
Including new lease agreements executed during fiscal 2019, the Company's worldwide leased office space increased to approximately 1,860,000 square feet of office space under various non-cancelable operating leases which expire on various dates through 2035. Total minimum rental payments associated with the leases are recorded as occupancy expense (a component of Selling, General & Administrative, "SG&A" expense) on a straight-line basis over the periods of the respective non-cancelable lease terms. Future minimum commitments for the Company's operating leases in place as of August 31, 2019 are as follows:
| (in thousands)
Years ended August 31, |
|
Minimum Lease Payments |
|
| 2020 |
|
$ |
41,414 |
|
| 2021 |
|
|
40,051 |
|
| 2022 |
|
|
36,011 |
|
| 2023 |
|
|
33,890 |
|
| 2024 |
|
|
33,072 |
|
| Thereafter |
|
|
215,523 |
|
| Total |
|
$ |
399,961 |
|
During fiscal 2019, 2018 and 2017, rent expense (including operating costs) for all operating leases amounted to $56.7 million, $54.6 million and $48.4 million, respectively. At August 31, 2019 and 2018, deferred rent reported within the Consolidated Balance Sheets totaled $42.6 million and $39.4 million, of which $39.1 million and $33.6 million, respectively, was reported as a non-current liability within the line item Deferred Rent and Other Non-Current Liabilities.
Approximately $2.8 million of standby letters of credit have been issued during the ordinary course of business in connection with the Company’s current leased office space as of August 31, 2019. These standby letters of credit contain covenants that, among other things, require FactSet to maintain minimum levels of consolidated net worth and certain leverage and fixed charge ratios. As of August 31, 2019 and 2018, FactSet was in compliance with all covenants contained in the standby letters of credit.
Purchase Commitments with Suppliers
Purchase obligations represent payments due in future periods in respect of commitments to the Company’s various data vendors as well as commitments to purchase goods and services such as telecommunication and computer maintenance services. These purchase commitments are agreements that are enforceable and legally binding on FactSet, and they specify all significant terms, including: fixed or minimum quantities to be purchased; fixed, minimum or variable price provisions; and the approximate timing of the transaction. As of August 31, 2019 and 2018, the Company had total purchase commitments with suppliers of $83.3 million and $79.0 million, respectively. There were no material changes in the Company’s purchase commitments with suppliers during fiscal 2019.
92
Contingencies
Income Taxes
Uncertain income tax positions are accounted for in accordance with applicable accounting guidance, refer to Note 17 Income Taxes for further details. FactSet is currently under audit by tax authorities and has reserved for potential adjustments to its provision for income taxes that may result from examinations by, or any negotiated settlements with, these tax authorities. The Company believes that the final outcome of these examinations or settlements will not have a material effect on its results of operations. If events occur which indicate payment of these amounts is unnecessary, the reversal of the liabilities would result in the recognition of tax benefits in the period FactSet determines the liabilities are no longer necessary. If the Company’s estimates of the federal, state, and foreign income tax liabilities are less than the ultimate assessment, a further charge to expense would result.
Legal Matters
FactSet accrues non income-tax liabilities for contingencies when management believes that a loss is probable, and the amounts can be reasonably estimated, while contingent gains are recognized only when realized. The Company is engaged in various legal proceedings, claims and litigation that have arisen in the ordinary course of business, including employment matters, commercial and intellectual property litigation. The outcome of all the matters against the Company is subject to future resolution, including the uncertainties of litigation. Based on information available at August 31, 2019, FactSet’s management believes that the ultimate outcome of these unresolved matters against the Company, individually or in the aggregate, will not have a material adverse effect on the Company's consolidated financial position, its results of operations or its cash flows.
Sales Tax Matters
In August 2019, FactSet received a Notice of Intent to Assess (the “Notice”) additional sales taxes, interest and underpayment penalties from the Commonwealth of Massachusetts Department of Revenue relating to prior tax periods. The Notice follows FactSet’s previously disclosed response to a letter from the Commonwealth requesting additional sales information. Based upon the Notice, it is the Commonwealth's intention to assess sales/use tax, interest and penalties on previously recorded sales transactions. The Company filed an appeal to the Notice and intends to contest any such assessment, if assessed, and continues to cooperate with the Commonwealth’s inquiry. Due to uncertainty surrounding the assessment process, the Company is unable to reasonably estimate the ultimate outcome of this matter and, as such, has not recorded a liability as of August 31, 2019. While FactSet believes that it will ultimately prevail if the Company is presented with a formal assessment; if FactSet does not prevail, the amount could have a material impact on the Company’s consolidated financial position, cash flows and results of operations.
Indemnifications
As permitted or required under Delaware law and to the maximum extent allowable under that law, FactSet has certain obligations to indemnify its current and former officers and directors for certain events or occurrences while the officer or director is, or was serving, at FactSet’s request in such capacity. These indemnification obligations are valid as long as the director or officer acted in good faith and in a manner the person reasonably believed to be in, or not opposed to, the best interests of the Company, and with respect to any criminal action or proceeding, had no reasonable cause to believe his or her conduct was unlawful. The maximum potential amount of future payments FactSet could be required to make under these indemnification obligations is unlimited; however, FactSet has a director and officer insurance policy that it believes mitigates FactSet's exposure and may enable FactSet to recover a portion of any future amounts paid. The Company believes the estimated fair value of these indemnification obligations is immaterial.
20. RISKS AND CONCENTRATIONS OF CREDIT RISK
Financial Risk Management
Foreign Currency Exchange Risk
The Company conducts business outside the U.S. in several currencies including the Euro, Indian Rupee, Philippine Peso, British Pound Sterling, and Japanese Yen. The financial statements of these foreign subsidiaries are translated into U.S. dollars using period-end rates of exchange for assets and liabilities and average rates for the period for revenues and expenses. To manage the exposures related to the effects of foreign exchange rate fluctuations, the Company utilizes derivative instruments (foreign currency forward contracts). By their nature, all derivative instruments involve, to varying degrees, elements of market and credit risk. The market risk associated with these instruments resulting from currency exchange movements is expected to offset the market risk of the underlying transactions, assets and liabilities being hedged. FactSet does not believe there is significant risk of loss in the event of non-performance by the counterparties associated with these instruments because these transactions are executed with a major financial institution. Further, the Company’s policy is to deal with counterparties having a minimum investment grade or better credit rating. Credit risk is managed through the continuous monitoring of exposures to such counterparties. FactSet’s primary objective in holding derivatives is to reduce the volatility of earnings associated with changes in foreign currency.
Interest Rate Risk
Cash and Cash Equivalents and Investments
The fair market value of FactSet’s cash and cash equivalents and investments at August 31, 2019 was $385.6 million. The Company’s cash and cash equivalents consist of demand deposits and money market funds with original maturities of three months or less and are reported at fair value. The Company’s investments consist of both mutual funds and certificates of deposit as both are part of the Company’s investment strategy. These mutual funds and certificates of deposit are included as Investments (short term) on the Company’s Consolidated Balance Sheets as the mutual funds can be liquidated at our discretion and the certificates of deposit have original maturities greater than three months, but less than one year. The mutual funds and certificates of deposit are held for investment and are not considered debt securities. It is anticipated that the fair market value of the Company’s cash and cash equivalents and investments will continue to be immaterially affected by fluctuations in interest rates. Preservation of principal is the primary goal of FactSet’s cash and cash equivalents and investment policy. Pursuant to the FactSet's established investment guidelines, the Company tries to achieve high levels of credit quality, liquidity and diversification. The Company's investment guidelines do not permit FactSet to invest in puts, calls, strips, short sales, straddles, options, commodities, precious metals, futures or investments on margin. As the Company has a restrictive investment policy, its financial exposure to fluctuations in interest rates is expected to remain low. The Company does not believe that the value or liquidity of its cash and cash equivalents and investments have been significantly impacted by current market events.
Debt
As of August 31, 2019, the fair value of FactSet’s long-term debt was $575.0 million, which approximated its carrying amount. The application of a floating interest rate equal to the daily LIBOR rate plus a spread using a debt leverage pricing grid, approximates the current market rate for similar transactions. It is anticipated that the fair market value of FactSet’s debt will continue to be immaterially affected by fluctuations in interest rates and the Company does not believe that the value of its debt has been significantly impacted by current market events. The debt bears interest on the outstanding principal amount at a rate equal to the daily LIBOR rate plus a spread using a debt leverage pricing grid currently at 0.875%. During fiscal 2019 and fiscal 2018, the Company recorded interest expense of $19.8 million and $15.9 million, respectively, on its outstanding debt amounts. Assuming all terms of the Company’s outstanding long-term debt remained the same, a hypothetical 25 basis point change (up or down) in the one-month LIBOR rate would result in a $1.4 million change in its annual interest expense.
Current market events have not required the Company to modify materially or change its financial risk management strategies with respect to its exposures to foreign currency exchange risk and interest rate risk.
94
Concentrations of Credit Risk
Cash equivalents
Cash and cash equivalents are maintained primarily with five financial institutions. Deposits held with banks may exceed the amount of insurance provided on such deposits. These deposits may be redeemed upon demand and are maintained with financial institutions, with reputable credit, and therefore, bear minimal credit risk. The Company seeks to mitigate its credit risks by spreading such risks across multiple counterparties and monitoring the risk profiles of these counterparties.
Accounts Receivable
Accounts receivable are unsecured and are derived from revenue earned from clients located around the globe. FactSet does not require collateral from its clients but performs credit evaluations on an ongoing basis. The Company maintains reserves for potential write-offs and evaluates the adequacy of the reserves periodically. These losses have historically been within expectations. No single client represented 10% or more of FactSet's total revenue in any fiscal year presented. At August 31, 2019, the Company’s largest individual client accounted for approximately 3% of total annual subscriptions, and subscriptions from the ten largest clients did not surpass 15% of total annual subscriptions, consistent with August 31, 2018. As of August 31, 2019 and 2018, the receivable reserve was $10.5 million and $3.5 million, respectively.
Derivative Instruments
As a result of the use of derivative instruments, FactSet is exposed to counterparty credit risk. The Company has incorporated counterparty credit risk into the fair value of its derivative assets and its own credit risk into the value of the Company’s derivative liabilities, when applicable. For derivative instruments, the Company calculates credit risk from observable data related to credit default swaps (“CDS”) as quoted by publicly available information. Counterparty risk is represented by CDS spreads related to the senior secured debt of the respective bank with whom the Company has executed these derivative transactions. To mitigate counterparty credit risk, the Company enters into contracts with large financial institutions and regularly reviews its credit exposure balances as well as the creditworthiness of the counterparties. For the Company's liabilities, as CDS spread information is not available for FactSet, the Company's credit risk is determined based on using a simple average of CDS spreads for peer companies. The Company does not expect any losses as a result of default of its counterparties.
Concentration of Other Risk
Data Content Providers
Certain data sets that FactSet relies on have a limited number of suppliers, although the Company makes every effort to assure that, where reasonable, alternative sources are available. FactSet is not dependent on any one third-party data supplier in order to meet the needs of its clients. FactSet combines the data from these commercial databases into its own dedicated single online service, which the client accesses to perform their analysis. No single vendor or data supplier represented more than 10% of FactSet's total data costs during fiscal 2019, except for one vendor, which is a supplier of risk models and portfolio optimizer data to FactSet and represented 11% of FactSet’s data costs in fiscal 2019.
21. UNAUDITED QUARTERLY FINANCIAL DATA
The following table presents selected unaudited financial information for each of the quarterly periods in the years ended August 31, 2019 and 2018. The results for any quarter are not necessarily indicative of future quarterly results and, accordingly, period-to-period comparisons should not be relied upon as an indication of future performance.
| Fiscal 2019 (in thousands, except per share data) |
|
First Quarter |
|
|
Second Quarter |
|
|
Third Quarter |
|
|
Fourth Quarter |
|
| Revenue |
|
$ |
351,640 |
|
|
$ |
354,895 |
|
|
$ |
364,533 |
|
|
$ |
364,283 |
|
| Cost of services |
|
$ |
166,776 |
|
|
$ |
165,108 |
|
|
$ |
163,832 |
|
|
$ |
167,730 |
|
| Selling, general and administrative |
|
$ |
84,325 |
|
|
$ |
81,099 |
|
|
$ |
83,461 |
|
|
$ |
84,985 |
|
| Operating income |
|
$ |
100,539 |
|
|
$ |
108,688 |
|
|
$ |
117,240 |
|
|
$ |
111,568 |
|
| Net income |
|
$ |
84,296 |
|
|
$ |
84,702 |
|
|
$ |
92,265 |
|
|
$ |
91,527 |
|
| Diluted EPS(1) |
|
$ |
2.17 |
|
|
$ |
2.19 |
|
|
$ |
2.37 |
|
|
$ |
2.34 |
|
| Diluted weighted average common shares |
|
|
38,809 |
|
|
|
38,619 |
|
|
|
38,993 |
|
|
|
39,056 |
|
| Fiscal 2018 (in thousands, except per share data) |
|
First Quarter |
|
|
Second Quarter |
|
|
Third Quarter |
|
|
Fourth Quarter |
|
| Revenue |
|
$ |
329,141 |
|
|
$ |
335,231 |
|
|
$ |
339,911 |
|
|
$ |
345,861 |
|
| Cost of services |
|
$ |
161,524 |
|
|
$ |
163,232 |
|
|
$ |
165,073 |
|
|
$ |
169,467 |
|
| Selling, general and administrative |
|
$ |
78,519 |
|
|
$ |
76,514 |
|
|
$ |
81,573 |
|
|
$ |
88,038 |
|
| Operating income |
|
$ |
89,098 |
|
|
$ |
95,485 |
|
|
$ |
93,265 |
|
|
$ |
88,356 |
|
| Net income |
|
$ |
70,379 |
|
|
$ |
53,137 |
|
|
$ |
74,746 |
|
|
$ |
68,823 |
|
| Diluted EPS(1) |
|
$ |
1.77 |
|
|
$ |
1.33 |
|
|
$ |
1.91 |
|
|
$ |
1.77 |
|
| Diluted weighted average common shares |
|
|
39,680 |
|
|
|
39,846 |
|
|
|
39,104 |
|
|
|
38,879 |
|
| |
(1) |
Diluted earnings per common share is calculated independently for each of the periods presented. Accordingly, the sum of the quarterly EPS amounts may not equal the total for the fiscal year. |
ITEM 9. CHANGES IN AND DISAGREEMENTS WITH ACCOUNTANTS ON ACCOUNTING AND FINANCIAL DISCLOSURE
None.
ITEM 9A. CONTROLS AND PROCEDURES
Evaluation of Disclosure Controls and Procedures
Under the supervision and with the participation of our management, including the principal executive officer and principal financial officer, we have evaluated the effectiveness of our disclosure controls and procedures pursuant to Rules 13a-15(e) and 15d-15(e) under the Securities Exchange Act of 1934, as of the end of the annual period covered by this report. Based on that evaluation, the principal executive officer and principal financial officer have concluded that our disclosure controls and procedures as defined in Rules 13a-15(e) and 15d-15(e) under the Securities Exchange Act of 1934, as amended, (the “Exchange Act”) are effective to ensure that information required to be disclosed by us in reports that it files or submits under the Exchange Act is recorded, processed, summarized and reported within the time periods specified in Securities and Exchange Commission rules and forms and is accumulated and communicated to our management, including our principal executive officer and principal financial officer, as appropriate to allow timely decisions regarding required disclosure.
Changes in Internal Control over Financial Reporting
There have been no changes in our internal control over financial reporting (as such term is defined in Rules 13a-15(f) and 15d-15(f) under the Exchange Act) during the fourth quarter of fiscal 2019 that have materially affected, or are reasonably likely to materially affect, our internal control over financial reporting.
Management’s Report on Internal Control over Financial Reporting
See Management’s Report on Internal Control over Financial Reporting under Item 8 of this Report on Form 10-K, which is incorporated herein by reference.
Report of Independent Registered Public Accounting Firm
See Report of Independent Registered Public Accounting Firm under Item 8 of this Report on Form 10-K, which is incorporated herein by reference.
ITEM 9B. OTHER INFORMATION
None.
PART III
ITEM 10. DIRECTORS, EXECUTIVE OFFICERS AND CORPORATE GOVERNANCE
The information required by this item relating to our directors and nominees, relating to compliance with Section 16(a) of the Securities Act of 1934, and relating to our Audit Committee is included under the captions “Corporate Governance” and “Section 16(a) Beneficial Ownership Reporting Compliance” in the definitive Proxy Statement dated October 30, 2019, and all such information is incorporated herein by reference.
Pursuant to General Instruction G(3) of Form 10-K, the information required by this item relating to our executive officers is included under the caption “Executive Officers of the Registrant” in Part I of this Report on Form 10-K.
The Company has adopted a Code of Business Conduct and Ethics that applies to all employees, including the Company’s principal executive officer, principal financial officer and principal accounting officer, all other officers and the Company’s directors. A copy of this code is available on the Company’s website at https://investor.factset.com on the Leadership and Corporate Governance page. The Company intends to satisfy any disclosure requirement under Item 5.05 of Form 8-K regarding an amendment to, or waiver from, a provision of this code of ethics by posting such information on our website at the address and general location specified above.
The Corporate Governance Guidelines and the charters of the committees of our Board of Directors, including the Audit Committee, Compensation and Talent Committee and Nominating and Corporate Governance Committee are also available on our website at https://investor.factset.com on the Leadership and Corporate Governance page. The guidelines, charters and code of ethics are also available in print free of charge to any stockholder who submits a written request to our Investor Relations department at our corporate headquarters at 601 Merritt 7, Norwalk, CT 06851 prior to January 1, 2020 and 45 Glover Avenue Norwalk, CT 06850.
ITEM 11. EXECUTIVE COMPENSATION
The information required by this item relating to compensation is included under the captions “Executive Compensation,” “Compensation Discussion and Analysis,” “Compensation and Talent Committee Report,” “Director Compensation Program,” including “Equity Compensation,” and “Director Compensation Table” of the definitive Proxy Statement dated October 30, 2019, and all such information is incorporated herein by reference.
ITEM 12. SECURITY OWNERSHIP OF CERTAIN BENEFICIAL OWNERS AND MANAGEMENT AND RELATED STOCKHOLDER MATTERS
The information required by this item relating to security ownership of certain beneficial owners and management is included under the caption “Security Ownership of Certain Beneficial Owners and Management”, in the definitive Proxy Statement dated October 30, 2019, and such information is incorporated herein by reference.
Equity Compensation Plan Information
The following table summarizes as of August 31, 2019, the number of outstanding equity awards granted to employees and non-employee directors, as well as the number of equity awards remaining available for future issuance, under FactSet’s equity compensation plans:
| (In thousands, except per share data) |
|
| Plan category |
|
(a) Number of securities to be issued upon exercise of outstanding options and restricted stock vesting |
|
|
|
(b) Weighted-average exercise price of outstanding options |
|
|
(c) Number of securities remaining available for future issuances under equity compensation plans (excluding securities reflected in column (a)) |
|
| Equity compensation plans approved by security holders |
|
|
2,648 |
(1) |
|
|
$ |
168.50 |
(2) |
|
|
6,551 |
(3) |
| Equity compensation plans not approved by security holders |
|
|
— |
|
|
|
|
— |
|
|
|
— |
|
| Total |
|
|
2,648 |
(1) |
|
|
$ |
168.50 |
(2) |
|
|
6,551 |
(3) |
| |
(1) |
Includes shares of FactSet common stock subject to outstanding restricted stock that will entitle each holder to the issuance of one share of common stock as they vest. |
| |
(2) |
Calculated without taking into account shares of FactSet common stock subject to outstanding restricted stock that will become issuable as they vest, without any cash consideration or other payment required for such shares. |
| |
(3) |
Includes 263,956 shares available for future issuance under the FactSet Research Systems Inc. Non-Employee Directors’ Stock Option and Award Plan, as Amended and Restated and 220,410 shares available for purchase under the FactSet Research Systems Inc. 2008 Employee Stock Purchase Plan, as Amended and Restated. |
ITEM 13. CERTAIN RELATIONSHIPS AND RELATED TRANSACTIONS, AND DIRECTOR INDEPENDENCE
The information required by this item relating to review, approval or ratification of transactions with related persons is included under the caption “Certain Relationships and Related Transactions” and all the information required by this item relating to director independence is included under the caption “Corporate Governance” contained in the definitive Proxy Statement dated October 30, 2019, all of which information is incorporated herein by reference.
ITEM 14. PRINCIPAL ACCOUNTING FEES AND SERVICES
The information required by this item is included under the caption “Proposal 2: Ratification of Independent Registered Public Accounting Firm” in the definitive Proxy Statement dated October 30, 2019, all of which information is incorporated herein by reference.
PART IV
ITEM 15. EXHIBITS, FINANCIAL STATEMENT SCHEDULES
| (a) |
Documents filed as part of this Report on Form 10-K: |
| |
1. |
Financial Statements |
| |
|
|
| |
|
The information required by this item is included in Item 8, Financial Statements and Supplementary Data, which is incorporated herein. |
| |
2. |
Financial Statements Schedule |
| |
|
|
| |
|
Schedule II – Valuation and Qualifying Accounts |
| |
|
|
| |
|
Years ended August 31, 2019, 2018 and 2017 (in thousands): |
| Receivable Reserve and Billing Adjustments |
|
Balance at Beginning of Year |
|
|
Charged to Expense/ Against Revenue(1) |
|
|
Write-offs, Net of Recoveries |
|
|
Balance at End of Year |
|
| 2019 |
|
$ |
3,490 |
|
|
$ |
11,474 |
|
|
$ |
(4,453 |
) |
|
$ |
10,511 |
|
| 2018 |
|
$ |
2,738 |
|
|
$ |
4,737 |
|
|
$ |
(3,985 |
) |
|
$ |
3,490 |
|
| 2017 |
|
$ |
1,521 |
|
|
$ |
3,381 |
|
|
$ |
(2,164 |
) |
|
$ |
2,738 |
|
| |
(1) |
Additions to the receivable reserve for doubtful accounts are charged to bad debt expense. Additions to the receivable reserve for billing adjustments are charged against revenue. |
| |
Additional financial statement schedules are omitted since they are either not required, not applicable, or the information is otherwise included. |
| |
|
The information required by this Item is set forth below. |
| 10.4 |
|
FactSet Research Systems Inc. 2008 Non-Employee Directors’ Stock Option Plan(1) |
|
DEF-14A |
|
001-11869 |
|
Appendix A |
|
10/30/2008 |
|
|
| 10.5 |
|
FactSet Research Systems Inc. Non-Employee Directors’ Stock Option and Award Plan, as Amended and Restated(1) |
|
8-K |
|
001-11869 |
|
10.2 |
|
12/21/2017 |
|
|
| 10.6 |
|
Lease, dated February 14, 2018, between FactSet Research Systems Inc. and 45 Glover Partners, LLC(2) |
|
10-Q |
|
001-11869 |
|
10.1 |
|
4/9/2018 |
|
|
| 10.7 |
|
Credit Agreement with PNC Bank, National Association, Bank of America, N.A. and HSBC Bank USA, National Association as of March 29, 2019 |
|
8-K |
|
001-11869 |
|
10.1 |
|
3/29/2019 |
|
|
| 10.8 |
|
Separation Agreement and General Release of Claims with John W. Wiseman as of April 22, 2019(1) |
|
10-Q |
|
001-11869 |
|
10.1 |
|
7/10/2019 |
|
|
| 21 |
|
Subsidiaries of FactSet Research Systems Inc. |
|
|
|
|
|
|
|
|
|
X |
| 23 |
|
Consent of Ernst & Young LLP |
|
|
|
|
|
|
|
|
|
X |
| 31.1 |
|
Certification of the Chief Executive Officer pursuant to Rule 13a-14(a) and Rule 15d-14(a) of the Securities Exchange Act, as amended. |
|
|
|
|
|
|
|
|
|
X |
| 31.2 |
|
Certification of the Chief Financial Officer pursuant to Rule 13a-14(a) and Rule 15d-14(a) of the Securities Exchange Act, as amended. |
|
|
|
|
|
|
|
|
|
X |
| 32.1 |
|
Certification of the Chief Executive Officer pursuant to 18 U.S.C. 1350, as adopted pursuant to Section 906 of the Sarbanes-Oxley Act of 2002. |
|
|
|
|
|
|
|
|
|
X |
| 32.2 |
|
Certification of the Chief Financial Officer pursuant to 18 U.S.C. 1350, as adopted pursuant to Section 906 of the Sarbanes-Oxley Act of 2002 |
|
|
|
|
|
|
|
|
|
X |
| 101.INS |
|
Inline XBRL Instance Document |
|
|
|
|
|
|
|
|
|
X |
| 101.SCH |
|
Inline XBRL Taxonomy Extension Schema |
|
|
|
|
|
|
|
|
|
X |
| 101.CAL |
|
Inline XBRL Taxonomy Extension Calculation Linkbase |
|
|
|
|
|
|
|
|
|
X |
| 101.DEF |
|
Inline XBRL Taxonomy Extension Definition Linkbase Document |
|
|
|
|
|
|
|
|
|
X |
| 101.LAB |
|
Inline XBRL Taxonomy Extension Label Linkbase |
|
|
|
|
|
|
|
|
|
X |
| 101.PRE |
|
Inline XBRL Taxonomy Extension Presentation Linkbase |
|
|
|
|
|
|
|
|
|
X |
| 104 |
|
Cover Page Interactive Data File (formatted as Inline XBRL and contained in Exhibit 101) |
|
|
|
|
|
|
|
|
|
X |
| (1) |
Indicates a management contract or compensatory plan or arrangement |
| (2) |
Confidential treatment has been granted for portions of this exhibit. |
ITEM 16. FORM 10-K SUMMARY
None.
SIGNATURES
Pursuant to the requirements of Section 13 or 15(d) of the Securities Exchange Act of 1934, the Registrant has duly caused this Report on Form 10-K to be signed on its behalf by the undersigned, thereunto duly authorized.
| |
FACTSET RESEARCH SYSTEMS INC. |
| |
(Registrant) |
| |
|
| Date: October 30, 2019 |
/s/ F. PHILIP SNOW |
| |
F. Philip Snow |
| |
Chief Executive Officer |
Pursuant to the requirements of the Securities Exchange Act of 1934, this Report on Form 10-K has been signed below by the following persons on behalf of the Registrant and in the capacities and on the dates indicated.
| Name |
|
Title |
|
Date |
| /s/ F. PHILIP SNOW |
|
Chief Executive Officer and Director |
|
October 30, 2019 |
| F. Philip Snow |
|
(Principal Executive Officer) |
|
|
| |
|
|
|
|
| /s/ HELEN L. SHAN |
|
Executive Vice President and Chief Financial Officer |
|
October 30, 2019 |
| Helen L. Shan |
|
(Principal Financial Officer) |
|
|
| |
|
|
|
|
| /s/ GREGORY T. MOSKOFF |
|
Senior Vice President, Controller |
|
October 30, 2019 |
| Gregory T. Moskoff |
|
(Principal Accounting Officer) |
|
|
| |
|
|
|
|
| /s/ PHILIP A. HADLEY |
|
Chairman |
|
October 30, 2019 |
| Philip A. Hadley |
|
|
|
|
| |
|
|
|
|
| /s/ ROBIN A. ABRAMS |
|
Director |
|
October 30, 2019 |
| Robin A. Abrams |
|
|
|
|
| |
|
|
|
|
| /s/ SCOTT A. BILLEADEAU |
|
Director |
|
October 30, 2019 |
| Scott A. Billeadeau |
|
|
|
|
| |
|
|
|
|
| /s/ MALCOLM FRANK |
|
Director |
|
October 30, 2019 |
| Malcolm Frank |
|
|
|
|
| |
|
|
|
|
| /s/ SHEILA B. JORDAN |
|
Director |
|
October 30, 2019 |
| Sheila B. Jordan |
|
|
|
|
| |
|
|
|
|
| /s/ JAMES J. MCGONIGLE |
|
Director |
|
October 30, 2019 |
| James J. McGonigle |
|
|
|
|
| |
|
|
|
|
| /s/ LAURIE SIEGEL |
|
Director |
|
October 30, 2019 |
| Laurie Siegel |
|
|
|
|
| |
|
|
|
|
| /s/ JOSEPH R. ZIMMEL |
|
Director |
|
October 30, 2019 |
| Joseph R. Zimmel |
|
|
|
|
| |
|
|
|
|
102