00010132372020FYFALSEP3YP3YP5YP8YP3YP3YP2YP4YP5Y0M0D00010132372019-09-012020-08-310001013237exch:XNYS2019-09-012020-08-310001013237exch:XNAS2019-09-012020-08-31iso4217:USD00010132372020-02-28xbrli:shares00010132372020-10-220001013237us-gaap:EstimateOfFairValueFairValueDisclosureMemberus-gaap:FairValueInputsLevel2Member2020-08-310001013237us-gaap:EstimateOfFairValueFairValueDisclosureMemberus-gaap:FairValueInputsLevel2Member2019-08-310001013237us-gaap:DesignatedAsHedgingInstrumentMemberus-gaap:InterestRateSwapMemberus-gaap:CashFlowHedgingMember2020-08-3100010132372018-09-012019-08-3100010132372017-09-012018-08-31iso4217:USDxbrli:shares00010132372020-08-3100010132372019-08-3100010132372018-08-3100010132372017-08-310001013237us-gaap:CommonStockMember2017-08-310001013237us-gaap:AdditionalPaidInCapitalMember2017-08-310001013237us-gaap:TreasuryStockMember2017-08-310001013237us-gaap:RetainedEarningsMember2017-08-310001013237us-gaap:AccumulatedOtherComprehensiveIncomeMember2017-08-310001013237us-gaap:RetainedEarningsMember2017-09-012018-08-310001013237us-gaap:AccumulatedOtherComprehensiveIncomeMember2017-09-012018-08-310001013237us-gaap:CommonStockMember2017-09-012018-08-310001013237us-gaap:AdditionalPaidInCapitalMember2017-09-012018-08-310001013237us-gaap:TreasuryStockMember2017-09-012018-08-310001013237us-gaap:CommonStockMember2018-08-310001013237us-gaap:AdditionalPaidInCapitalMember2018-08-310001013237us-gaap:TreasuryStockMember2018-08-310001013237us-gaap:RetainedEarningsMember2018-08-310001013237us-gaap:AccumulatedOtherComprehensiveIncomeMember2018-08-310001013237us-gaap:RetainedEarningsMember2018-09-012019-08-310001013237us-gaap:AccumulatedOtherComprehensiveIncomeMember2018-09-012019-08-310001013237us-gaap:CommonStockMember2018-09-012019-08-310001013237us-gaap:AdditionalPaidInCapitalMember2018-09-012019-08-310001013237us-gaap:TreasuryStockMember2018-09-012019-08-310001013237us-gaap:RetainedEarningsMembersrt:CumulativeEffectPeriodOfAdoptionAdjustmentMember2018-08-310001013237srt:CumulativeEffectPeriodOfAdoptionAdjustmentMemberus-gaap:AccumulatedOtherComprehensiveIncomeMember2018-08-310001013237srt:CumulativeEffectPeriodOfAdoptionAdjustmentMember2018-08-310001013237us-gaap:CommonStockMember2019-08-310001013237us-gaap:AdditionalPaidInCapitalMember2019-08-310001013237us-gaap:TreasuryStockMember2019-08-310001013237us-gaap:RetainedEarningsMember2019-08-310001013237us-gaap:AccumulatedOtherComprehensiveIncomeMember2019-08-310001013237us-gaap:RetainedEarningsMember2019-09-012020-08-310001013237us-gaap:AccumulatedOtherComprehensiveIncomeMember2019-09-012020-08-310001013237us-gaap:CommonStockMember2019-09-012020-08-310001013237us-gaap:AdditionalPaidInCapitalMember2019-09-012020-08-310001013237us-gaap:TreasuryStockMember2019-09-012020-08-310001013237us-gaap:CommonStockMember2020-08-310001013237us-gaap:AdditionalPaidInCapitalMember2020-08-310001013237us-gaap:TreasuryStockMember2020-08-310001013237us-gaap:RetainedEarningsMember2020-08-310001013237us-gaap:AccumulatedOtherComprehensiveIncomeMember2020-08-31fds:segment0001013237srt:MinimumMemberus-gaap:ComputerEquipmentMember2019-09-012020-08-310001013237srt:MaximumMemberus-gaap:ComputerEquipmentMember2019-09-012020-08-310001013237us-gaap:FurnitureAndFixturesMember2019-09-012020-08-31fds:reportingUnit00010132372020-06-012020-08-310001013237srt:MinimumMemberus-gaap:SoftwareDevelopmentMember2019-09-012020-08-310001013237srt:MaximumMemberus-gaap:SoftwareDevelopmentMember2019-09-012020-08-310001013237fds:The2019RevolvingCreditFacilityMemberfds:PNCBankNationalAssociationsMember2020-08-310001013237fds:The2019RevolvingCreditFacilityMember2020-08-310001013237srt:MinimumMember2020-08-310001013237srt:MaximumMember2020-08-3100010132372019-11-300001013237srt:AmericasMember2019-09-012020-08-310001013237srt:AmericasMember2018-09-012019-08-310001013237srt:AmericasMember2017-09-012018-08-310001013237us-gaap:EMEAMember2019-09-012020-08-310001013237us-gaap:EMEAMember2018-09-012019-08-310001013237us-gaap:EMEAMember2017-09-012018-08-310001013237srt:AsiaPacificMember2019-09-012020-08-310001013237srt:AsiaPacificMember2018-09-012019-08-310001013237srt:AsiaPacificMember2017-09-012018-08-310001013237us-gaap:FairValueMeasurementsRecurringMemberus-gaap:FairValueInputsLevel1Memberus-gaap:MoneyMarketFundsMember2020-08-310001013237us-gaap:FairValueMeasurementsRecurringMemberus-gaap:FairValueInputsLevel2Memberus-gaap:MoneyMarketFundsMember2020-08-310001013237us-gaap:FairValueMeasurementsRecurringMemberus-gaap:FairValueInputsLevel3Memberus-gaap:MoneyMarketFundsMember2020-08-310001013237us-gaap:FairValueMeasurementsRecurringMemberus-gaap:MoneyMarketFundsMember2020-08-310001013237us-gaap:FairValueMeasurementsRecurringMemberus-gaap:FairValueInputsLevel1Memberfds:MutualFundsMember2020-08-310001013237us-gaap:FairValueMeasurementsRecurringMemberus-gaap:FairValueInputsLevel2Memberfds:MutualFundsMember2020-08-310001013237us-gaap:FairValueMeasurementsRecurringMemberus-gaap:FairValueInputsLevel3Memberfds:MutualFundsMember2020-08-310001013237us-gaap:FairValueMeasurementsRecurringMemberfds:MutualFundsMember2020-08-310001013237us-gaap:FairValueMeasurementsRecurringMemberus-gaap:FairValueInputsLevel1Memberus-gaap:CertificatesOfDepositMember2020-08-310001013237us-gaap:FairValueMeasurementsRecurringMemberus-gaap:FairValueInputsLevel2Memberus-gaap:CertificatesOfDepositMember2020-08-310001013237us-gaap:FairValueMeasurementsRecurringMemberus-gaap:FairValueInputsLevel3Memberus-gaap:CertificatesOfDepositMember2020-08-310001013237us-gaap:FairValueMeasurementsRecurringMemberus-gaap:CertificatesOfDepositMember2020-08-310001013237us-gaap:FairValueMeasurementsRecurringMemberus-gaap:FairValueInputsLevel1Member2020-08-310001013237us-gaap:FairValueMeasurementsRecurringMemberus-gaap:FairValueInputsLevel2Member2020-08-310001013237us-gaap:FairValueMeasurementsRecurringMemberus-gaap:FairValueInputsLevel3Member2020-08-310001013237us-gaap:FairValueMeasurementsRecurringMember2020-08-310001013237us-gaap:FairValueMeasurementsRecurringMemberus-gaap:FairValueInputsLevel1Memberus-gaap:MoneyMarketFundsMember2019-08-310001013237us-gaap:FairValueMeasurementsRecurringMemberus-gaap:FairValueInputsLevel2Memberus-gaap:MoneyMarketFundsMember2019-08-310001013237us-gaap:FairValueMeasurementsRecurringMemberus-gaap:FairValueInputsLevel3Memberus-gaap:MoneyMarketFundsMember2019-08-310001013237us-gaap:FairValueMeasurementsRecurringMemberus-gaap:MoneyMarketFundsMember2019-08-310001013237us-gaap:FairValueMeasurementsRecurringMemberus-gaap:FairValueInputsLevel1Memberfds:MutualFundsMember2019-08-310001013237us-gaap:FairValueMeasurementsRecurringMemberus-gaap:FairValueInputsLevel2Memberfds:MutualFundsMember2019-08-310001013237us-gaap:FairValueMeasurementsRecurringMemberus-gaap:FairValueInputsLevel3Memberfds:MutualFundsMember2019-08-310001013237us-gaap:FairValueMeasurementsRecurringMemberfds:MutualFundsMember2019-08-310001013237us-gaap:FairValueMeasurementsRecurringMemberus-gaap:FairValueInputsLevel1Memberus-gaap:CertificatesOfDepositMember2019-08-310001013237us-gaap:FairValueMeasurementsRecurringMemberus-gaap:FairValueInputsLevel2Memberus-gaap:CertificatesOfDepositMember2019-08-310001013237us-gaap:FairValueMeasurementsRecurringMemberus-gaap:FairValueInputsLevel3Memberus-gaap:CertificatesOfDepositMember2019-08-310001013237us-gaap:FairValueMeasurementsRecurringMemberus-gaap:CertificatesOfDepositMember2019-08-310001013237us-gaap:FairValueMeasurementsRecurringMemberus-gaap:FairValueInputsLevel1Member2019-08-310001013237us-gaap:FairValueMeasurementsRecurringMemberus-gaap:FairValueInputsLevel2Member2019-08-310001013237us-gaap:FairValueMeasurementsRecurringMemberus-gaap:FairValueInputsLevel3Member2019-08-310001013237us-gaap:FairValueMeasurementsRecurringMember2019-08-31xbrli:pure0001013237srt:MinimumMember2019-09-012020-08-310001013237srt:MaximumMember2019-09-012020-08-31iso4217:PHPiso4217:INRiso4217:EURiso4217:GBP0001013237us-gaap:LondonInterbankOfferedRateLIBORMemberfds:The2019RevolvingCreditFacilityMemberfds:PNCBankNationalAssociationsMember2019-09-012020-08-310001013237us-gaap:LondonInterbankOfferedRateLIBORMemberfds:The2019RevolvingCreditFacilityMemberfds:PNCBankNationalAssociationsMember2020-08-310001013237us-gaap:DesignatedAsHedgingInstrumentMemberus-gaap:CashFlowHedgingMemberus-gaap:ForeignExchangeContractMember2020-08-310001013237us-gaap:DesignatedAsHedgingInstrumentMemberus-gaap:CashFlowHedgingMemberus-gaap:ForeignExchangeContractMember2019-08-310001013237us-gaap:DesignatedAsHedgingInstrumentMemberus-gaap:InterestRateSwapMemberus-gaap:CashFlowHedgingMember2019-08-310001013237us-gaap:DesignatedAsHedgingInstrumentMemberus-gaap:CashFlowHedgingMember2020-08-310001013237us-gaap:DesignatedAsHedgingInstrumentMemberus-gaap:CashFlowHedgingMember2019-08-310001013237us-gaap:DesignatedAsHedgingInstrumentMemberus-gaap:CashFlowHedgingMemberus-gaap:ForeignExchangeContractMemberus-gaap:PrepaidExpensesAndOtherCurrentAssetsMember2020-08-310001013237us-gaap:DesignatedAsHedgingInstrumentMemberus-gaap:CashFlowHedgingMemberus-gaap:ForeignExchangeContractMemberus-gaap:PrepaidExpensesAndOtherCurrentAssetsMember2019-08-310001013237us-gaap:DesignatedAsHedgingInstrumentMemberus-gaap:AccountsPayableAndAccruedLiabilitiesMemberus-gaap:CashFlowHedgingMemberus-gaap:ForeignExchangeContractMember2020-08-310001013237us-gaap:DesignatedAsHedgingInstrumentMemberus-gaap:AccountsPayableAndAccruedLiabilitiesMemberus-gaap:CashFlowHedgingMemberus-gaap:ForeignExchangeContractMember2019-08-310001013237us-gaap:DesignatedAsHedgingInstrumentMemberus-gaap:InterestRateSwapMemberus-gaap:CashFlowHedgingMemberus-gaap:PrepaidExpensesAndOtherCurrentAssetsMember2020-08-310001013237us-gaap:DesignatedAsHedgingInstrumentMemberus-gaap:InterestRateSwapMemberus-gaap:CashFlowHedgingMemberus-gaap:PrepaidExpensesAndOtherCurrentAssetsMember2019-08-310001013237us-gaap:DesignatedAsHedgingInstrumentMemberus-gaap:AccountsPayableAndAccruedLiabilitiesMemberus-gaap:InterestRateSwapMemberus-gaap:CashFlowHedgingMember2020-08-310001013237us-gaap:DesignatedAsHedgingInstrumentMemberus-gaap:AccountsPayableAndAccruedLiabilitiesMemberus-gaap:InterestRateSwapMemberus-gaap:CashFlowHedgingMember2019-08-310001013237us-gaap:DesignatedAsHedgingInstrumentMemberus-gaap:OtherNoncurrentAssetsMemberus-gaap:InterestRateSwapMemberus-gaap:CashFlowHedgingMember2020-08-310001013237us-gaap:DesignatedAsHedgingInstrumentMemberus-gaap:OtherNoncurrentAssetsMemberus-gaap:InterestRateSwapMemberus-gaap:CashFlowHedgingMember2019-08-310001013237us-gaap:DesignatedAsHedgingInstrumentMemberus-gaap:InterestRateSwapMemberus-gaap:OtherNoncurrentLiabilitiesMemberus-gaap:CashFlowHedgingMember2020-08-310001013237us-gaap:DesignatedAsHedgingInstrumentMemberus-gaap:InterestRateSwapMemberus-gaap:OtherNoncurrentLiabilitiesMemberus-gaap:CashFlowHedgingMember2019-08-310001013237us-gaap:DesignatedAsHedgingInstrumentMemberus-gaap:SellingGeneralAndAdministrativeExpensesMemberus-gaap:CashFlowHedgingMemberus-gaap:ForeignExchangeContractMember2019-09-012020-08-310001013237us-gaap:DesignatedAsHedgingInstrumentMemberus-gaap:SellingGeneralAndAdministrativeExpensesMemberus-gaap:CashFlowHedgingMemberus-gaap:ForeignExchangeContractMember2018-09-012019-08-310001013237us-gaap:DesignatedAsHedgingInstrumentMemberus-gaap:SellingGeneralAndAdministrativeExpensesMemberus-gaap:CashFlowHedgingMemberus-gaap:ForeignExchangeContractMember2017-09-012018-08-310001013237us-gaap:DesignatedAsHedgingInstrumentMemberus-gaap:InterestExpenseMemberus-gaap:InterestRateSwapMemberus-gaap:CashFlowHedgingMember2019-09-012020-08-310001013237us-gaap:DesignatedAsHedgingInstrumentMemberus-gaap:InterestExpenseMemberus-gaap:InterestRateSwapMemberus-gaap:CashFlowHedgingMember2018-09-012019-08-310001013237us-gaap:DesignatedAsHedgingInstrumentMemberus-gaap:InterestExpenseMemberus-gaap:InterestRateSwapMemberus-gaap:CashFlowHedgingMember2017-09-012018-08-310001013237us-gaap:DesignatedAsHedgingInstrumentMemberus-gaap:CashFlowHedgingMember2019-09-012020-08-310001013237us-gaap:DesignatedAsHedgingInstrumentMemberus-gaap:CashFlowHedgingMember2018-09-012019-08-310001013237us-gaap:DesignatedAsHedgingInstrumentMemberus-gaap:CashFlowHedgingMember2017-09-012018-08-310001013237us-gaap:DesignatedAsHedgingInstrumentMemberus-gaap:CashFlowHedgingMemberus-gaap:ForeignExchangeContractMember2019-09-012020-08-310001013237us-gaap:LeaseholdImprovementsMember2020-08-310001013237us-gaap:LeaseholdImprovementsMember2019-08-310001013237us-gaap:ComputerEquipmentMember2020-08-310001013237us-gaap:ComputerEquipmentMember2019-08-310001013237us-gaap:FurnitureAndFixturesMember2020-08-310001013237us-gaap:FurnitureAndFixturesMember2019-08-310001013237srt:AmericasMember2018-08-310001013237us-gaap:EMEAMember2018-08-310001013237srt:AsiaPacificMember2018-08-310001013237srt:AmericasMember2019-08-310001013237us-gaap:EMEAMember2019-08-310001013237srt:AsiaPacificMember2019-08-310001013237srt:AmericasMember2020-08-310001013237us-gaap:EMEAMember2020-08-310001013237srt:AsiaPacificMember2020-08-310001013237srt:MinimumMemberfds:DataContentMember2019-09-012020-08-310001013237srt:MaximumMemberfds:DataContentMember2019-09-012020-08-310001013237srt:MinimumMemberus-gaap:CustomerRelationshipsMember2019-09-012020-08-310001013237srt:MaximumMemberus-gaap:CustomerRelationshipsMember2019-09-012020-08-310001013237srt:MinimumMemberus-gaap:ComputerSoftwareIntangibleAssetMember2019-09-012020-08-310001013237srt:MaximumMemberus-gaap:ComputerSoftwareIntangibleAssetMember2019-09-012020-08-310001013237srt:MinimumMemberus-gaap:NoncompeteAgreementsMember2019-09-012020-08-310001013237srt:MaximumMemberus-gaap:NoncompeteAgreementsMember2019-09-012020-08-310001013237srt:MinimumMemberus-gaap:TradeNamesMember2019-09-012020-08-310001013237srt:MaximumMemberus-gaap:TradeNamesMember2019-09-012020-08-310001013237fds:DataContentMember2020-08-310001013237us-gaap:CustomerRelationshipsMember2020-08-310001013237us-gaap:ComputerSoftwareIntangibleAssetMember2020-08-310001013237us-gaap:SoftwareDevelopmentMember2020-08-310001013237us-gaap:NoncompeteAgreementsMember2020-08-310001013237us-gaap:TradeNamesMember2020-08-310001013237fds:DataContentMember2019-08-310001013237us-gaap:CustomerRelationshipsMember2019-08-310001013237us-gaap:ComputerSoftwareIntangibleAssetMember2019-08-310001013237us-gaap:SoftwareDevelopmentMember2019-08-310001013237us-gaap:NoncompeteAgreementsMember2019-08-310001013237us-gaap:TradeNamesMember2019-08-310001013237fds:The2019RevolvingCreditFacilityMember2019-08-310001013237fds:The2019RevolvingCreditFacilityMemberfds:PNCBankNationalAssociationsMember2019-03-290001013237fds:The2019RevolvingCreditFacilityMemberfds:PNCBankNationalAssociationsMember2019-09-012020-08-310001013237fds:The2019RevolvingCreditFacilityMemberfds:PNCBankNationalAssociationsMember2019-08-310001013237fds:PNCBankNationalAssociationsMemberfds:The2017RevolvingCreditFacilityMember2017-03-170001013237us-gaap:LondonInterbankOfferedRateLIBORMemberfds:PNCBankNationalAssociationsMemberfds:The2017RevolvingCreditFacilityMember2017-03-172017-03-170001013237fds:RepurchaseOfCommonStockFromEmployeesMember2019-09-012020-08-310001013237fds:RepurchaseOfCommonStockFromEmployeesMember2018-09-012019-08-310001013237fds:RepurchaseOfCommonStockFromEmployeesMember2017-09-012018-08-310001013237fds:ShareRepurchaseProgramMember2019-09-012020-08-310001013237fds:ShareRepurchaseProgramMember2018-09-012019-08-310001013237fds:ShareRepurchaseProgramMember2017-09-012018-08-3100010132372018-01-312018-01-310001013237us-gaap:TreasuryStockMember2018-01-312018-01-310001013237us-gaap:CommonStockMember2018-01-312018-01-310001013237us-gaap:AdditionalPaidInCapitalMember2018-01-312018-01-310001013237us-gaap:RetainedEarningsMember2018-01-312018-01-3100010132372020-03-242020-03-240001013237us-gaap:RestrictedStockMember2019-09-012020-08-310001013237us-gaap:RestrictedStockMember2018-09-012019-08-3100010132372019-09-012019-11-3000010132372019-12-012020-02-2800010132372020-05-3100010132372020-02-292020-05-3100010132372018-11-3000010132372018-09-012018-11-3000010132372019-02-2800010132372018-12-012019-02-2800010132372019-05-3100010132372019-03-012019-05-3100010132372019-06-012019-08-3100010132372020-05-052020-05-050001013237us-gaap:EmployeeStockOptionMember2019-09-012020-08-310001013237us-gaap:EmployeeStockOptionMember2018-09-012019-08-310001013237us-gaap:PerformanceSharesMember2019-09-012020-08-310001013237us-gaap:PerformanceSharesMember2018-09-012019-08-310001013237fds:NonPerformanceBasedMember2017-09-012018-08-310001013237us-gaap:PerformanceSharesMember2017-09-012018-08-310001013237fds:NonEmployeeDirectorGrantMember2017-09-012018-08-310001013237fds:NonPerformanceBasedMember2018-09-012019-08-310001013237fds:NonEmployeeDirectorGrantMember2018-09-012019-08-310001013237fds:NonPerformanceBasedMember2019-09-012020-08-310001013237fds:NonEmployeeDirectorGrantMember2019-09-012020-08-310001013237us-gaap:EmployeeStockOptionMemberfds:LTIPMember2019-09-012020-08-310001013237us-gaap:EmployeeStockOptionMemberfds:LTIPMember2018-09-012019-08-310001013237us-gaap:EmployeeStockOptionMemberfds:LTIPMember2017-09-012018-08-310001013237us-gaap:EmployeeStockOptionMemberus-gaap:ShareBasedPaymentArrangementEmployeeMemberfds:LTIPMember2019-09-012020-08-310001013237srt:MinimumMemberus-gaap:EmployeeStockOptionMemberus-gaap:ShareBasedPaymentArrangementEmployeeMember2019-09-012020-08-310001013237srt:MaximumMemberus-gaap:EmployeeStockOptionMemberus-gaap:ShareBasedPaymentArrangementEmployeeMember2019-09-012020-08-310001013237srt:MinimumMemberus-gaap:EmployeeStockOptionMemberus-gaap:ShareBasedPaymentArrangementEmployeeMember2018-09-012019-08-310001013237srt:MaximumMemberus-gaap:EmployeeStockOptionMemberus-gaap:ShareBasedPaymentArrangementEmployeeMember2018-09-012019-08-310001013237srt:MinimumMemberus-gaap:EmployeeStockOptionMemberus-gaap:ShareBasedPaymentArrangementEmployeeMember2017-09-012018-08-310001013237srt:MaximumMemberus-gaap:EmployeeStockOptionMemberus-gaap:ShareBasedPaymentArrangementEmployeeMember2017-09-012018-08-310001013237us-gaap:EmployeeStockOptionMemberus-gaap:ShareBasedPaymentArrangementEmployeeMember2019-09-012020-08-310001013237us-gaap:EmployeeStockOptionMemberus-gaap:ShareBasedPaymentArrangementEmployeeMember2018-09-012019-08-310001013237us-gaap:EmployeeStockOptionMemberus-gaap:ShareBasedPaymentArrangementEmployeeMember2017-09-012018-08-310001013237us-gaap:ShareBasedPaymentArrangementNonemployeeMemberfds:DirectorPlanMemberus-gaap:EmployeeStockOptionMember2019-09-012020-08-310001013237us-gaap:ShareBasedPaymentArrangementNonemployeeMemberfds:DirectorPlanMemberus-gaap:EmployeeStockOptionMember2020-08-310001013237us-gaap:ShareBasedPaymentArrangementNonemployeeMemberfds:DirectorPlanMember2020-01-152020-01-150001013237us-gaap:ShareBasedPaymentArrangementNonemployeeMemberfds:DirectorPlanMember2019-01-152019-01-150001013237us-gaap:ShareBasedPaymentArrangementNonemployeeMemberfds:DirectorPlanMember2017-09-012018-08-310001013237us-gaap:ShareBasedPaymentArrangementNonemployeeMemberfds:DirectorPlanMemberus-gaap:EmployeeStockOptionMember2018-09-012019-08-310001013237us-gaap:ShareBasedPaymentArrangementNonemployeeMemberfds:DirectorPlanMemberus-gaap:EmployeeStockOptionMember2017-09-012018-08-310001013237fds:RestrictedStockAndPerformanceSharesMemberfds:LTIPMember2020-08-310001013237fds:RestrictedStockAndPerformanceSharesMemberfds:LTIPMember2019-09-012020-08-310001013237fds:RestrictedStockAndPerformanceSharesMember2017-08-310001013237fds:RestrictedStockAndPerformanceSharesMember2017-09-012018-08-310001013237fds:RestrictedStockAndPerformanceSharesMember2018-08-310001013237fds:RestrictedStockAndPerformanceSharesMember2018-09-012019-08-310001013237fds:RestrictedStockAndPerformanceSharesMember2019-08-310001013237fds:RestrictedStockAndPerformanceSharesMember2019-09-012020-08-310001013237fds:RestrictedStockAndPerformanceSharesMember2020-08-310001013237us-gaap:PerformanceSharesMember2019-09-012020-08-310001013237us-gaap:ShareBasedPaymentArrangementEmployeeMember2017-08-310001013237us-gaap:ShareBasedPaymentArrangementNonemployeeMember2017-08-310001013237us-gaap:ShareBasedPaymentArrangementEmployeeMember2017-09-012018-08-310001013237us-gaap:ShareBasedPaymentArrangementNonemployeeMember2017-09-012018-08-310001013237fds:NonPerformanceBasedMemberus-gaap:ShareBasedPaymentArrangementEmployeeMember2017-09-012018-08-310001013237us-gaap:ShareBasedPaymentArrangementNonemployeeMemberfds:NonPerformanceBasedMember2017-09-012018-08-310001013237us-gaap:PerformanceSharesMemberus-gaap:ShareBasedPaymentArrangementEmployeeMember2017-09-012018-08-310001013237us-gaap:PerformanceSharesMemberus-gaap:ShareBasedPaymentArrangementNonemployeeMember2017-09-012018-08-310001013237fds:NonEmployeeDirectorGrantMemberus-gaap:ShareBasedPaymentArrangementEmployeeMember2017-09-012018-08-310001013237us-gaap:ShareBasedPaymentArrangementNonemployeeMemberfds:NonEmployeeDirectorGrantMember2017-09-012018-08-310001013237us-gaap:RestrictedStockMemberus-gaap:ShareBasedPaymentArrangementEmployeeMember2017-09-012018-08-310001013237us-gaap:ShareBasedPaymentArrangementNonemployeeMemberus-gaap:RestrictedStockMember2017-09-012018-08-310001013237us-gaap:ShareBasedPaymentArrangementEmployeeMember2018-08-310001013237us-gaap:ShareBasedPaymentArrangementNonemployeeMember2018-08-310001013237fds:NonPerformanceBasedMemberus-gaap:ShareBasedPaymentArrangementEmployeeMember2018-09-012019-08-310001013237us-gaap:ShareBasedPaymentArrangementNonemployeeMemberfds:NonPerformanceBasedMember2018-09-012019-08-310001013237fds:NonEmployeeDirectorGrantMemberus-gaap:ShareBasedPaymentArrangementEmployeeMember2018-09-012019-08-310001013237us-gaap:ShareBasedPaymentArrangementNonemployeeMemberfds:NonEmployeeDirectorGrantMember2018-09-012019-08-310001013237us-gaap:RestrictedStockMemberus-gaap:ShareBasedPaymentArrangementEmployeeMember2018-09-012019-08-310001013237us-gaap:ShareBasedPaymentArrangementNonemployeeMemberus-gaap:RestrictedStockMember2018-09-012019-08-310001013237us-gaap:ShareBasedPaymentArrangementEmployeeMember2018-09-012019-08-310001013237us-gaap:ShareBasedPaymentArrangementNonemployeeMember2018-09-012019-08-310001013237us-gaap:ShareBasedPaymentArrangementEmployeeMember2019-08-310001013237us-gaap:ShareBasedPaymentArrangementNonemployeeMember2019-08-310001013237fds:NonPerformanceBasedMemberus-gaap:ShareBasedPaymentArrangementEmployeeMember2019-09-012020-08-310001013237us-gaap:ShareBasedPaymentArrangementNonemployeeMemberfds:NonPerformanceBasedMember2019-09-012020-08-310001013237fds:NonEmployeeDirectorGrantMemberus-gaap:ShareBasedPaymentArrangementEmployeeMember2019-09-012020-08-310001013237us-gaap:ShareBasedPaymentArrangementNonemployeeMemberfds:NonEmployeeDirectorGrantMember2019-09-012020-08-310001013237us-gaap:RestrictedStockMemberus-gaap:ShareBasedPaymentArrangementEmployeeMember2019-09-012020-08-310001013237us-gaap:ShareBasedPaymentArrangementNonemployeeMemberus-gaap:RestrictedStockMember2019-09-012020-08-310001013237us-gaap:RestrictedStockUnitsRSUMemberus-gaap:ShareBasedPaymentArrangementEmployeeMember2019-09-012020-08-310001013237us-gaap:ShareBasedPaymentArrangementNonemployeeMemberus-gaap:RestrictedStockUnitsRSUMember2019-09-012020-08-310001013237us-gaap:ShareBasedPaymentArrangementEmployeeMember2019-09-012020-08-310001013237us-gaap:ShareBasedPaymentArrangementNonemployeeMember2019-09-012020-08-310001013237us-gaap:ShareBasedPaymentArrangementEmployeeMember2020-08-310001013237us-gaap:ShareBasedPaymentArrangementNonemployeeMember2020-08-310001013237us-gaap:EmployeeStockMember2019-09-012020-08-310001013237us-gaap:EmployeeStockMember2020-08-310001013237us-gaap:EmployeeStockMember2018-09-012019-08-310001013237us-gaap:EmployeeStockMember2017-09-012018-08-310001013237country:US2019-09-012020-08-310001013237country:US2018-09-012019-08-310001013237country:US2017-09-012018-08-310001013237country:GB2019-09-012020-08-310001013237country:GB2018-09-012019-08-310001013237country:GB2017-09-012018-08-310001013237fds:AllOtherEMEACountriesMember2019-09-012020-08-310001013237fds:AllOtherEMEACountriesMember2018-09-012019-08-310001013237fds:AllOtherEMEACountriesMember2017-09-012018-08-310001013237fds:OtherCountriesMember2019-09-012020-08-310001013237fds:OtherCountriesMember2018-09-012019-08-310001013237fds:OtherCountriesMember2017-09-012018-08-310001013237country:US2020-08-310001013237country:US2019-08-310001013237country:PH2020-08-310001013237country:PH2019-08-310001013237country:IN2020-08-310001013237country:IN2019-08-310001013237country:GB2020-08-310001013237country:GB2019-08-310001013237fds:OtherCountriesMember2020-08-310001013237fds:OtherCountriesMember2019-08-310001013237us-gaap:RevolvingCreditFacilityMemberfds:TheLoanMember2019-09-012020-08-310001013237fds:SubscriptionRevenueMemberus-gaap:CustomerConcentrationRiskMemberfds:LargestClientMember2019-08-312019-08-310001013237fds:SubscriptionRevenueMemberus-gaap:CustomerConcentrationRiskMemberfds:LargestClientMember2020-08-312020-08-310001013237fds:TenLargestClientsMemberfds:SubscriptionRevenueMemberus-gaap:CustomerConcentrationRiskMember2019-08-312019-08-310001013237fds:TenLargestClientsMemberfds:SubscriptionRevenueMemberus-gaap:CustomerConcentrationRiskMember2020-08-312020-08-310001013237fds:OneVendorMemberfds:DataCostsMemberus-gaap:SupplierConcentrationRiskMember2019-09-012020-08-31
UNITED STATES
SECURITIES AND EXCHANGE COMMISSION
WASHINGTON, D.C. 20549
Form 10-K
| | | | | |
| ☒ | Annual Report pursuant to Section 13 or 15(d) of the Securities Exchange Act of 1934 |
For the fiscal year ended August 31, 2020
| | | | | |
| ☐ | Transition Report pursuant to Section 13 or 15(d) of the Securities Exchange Act of 1934 |
For the transition period from to
Commission File Number: 1-11869
FACTSET RESEARCH SYSTEMS INC.
(Exact name of Registrant as specified in its charter)
| | | | | | | | |
| Delaware | | 13-3362547 |
(State or other jurisdiction of incorporation or organization) | | (I.R.S. Employer Identification No.) |
45 Glover Avenue, Norwalk, Connecticut 06850
(Address of principal executive office, including zip code)
Registrant’s telephone number, including area code: (203) 810-1000
Securities registered pursuant to Section 12(b) of the Act:
| | | | | | | | |
| Title of each class | Trading Symbols(s) | Name of each exchange on which registered |
| Common Stock, $0.01 Par Value | FDS | New York Stock Exchange |
| NASDAQ Global Select Market |
Indicate by check mark if the registrant is a well-known seasoned issuer, as defined in Rule 405 of the Securities Act.
Yes x No o
Indicate by check mark if the registrant is not required to file reports pursuant to Section 13 or Section 15(d) of the Act.
Yes o No x
Indicate by check mark whether the registrant (1) has filed all reports required to be filed by Section 13 or 15(d) of the Securities Exchange Act of 1934 during the preceding 12 months (or for such shorter period that the registrant was required to file such reports), and (2) has been subject to such filing requirements for the past 90 days. Yes x No o
Indicate by check mark whether the registrant has submitted electronically, if any, every Interactive Data File required to be submitted pursuant to Rule 405 of Regulation S-T (§232.405 of this chapter) during the preceding 12 months (or for such shorter period that the registrant was required to submit such files). Yes x No o
Indicate by check mark if disclosure of delinquent filers pursuant to Item 405 of Regulation S-K (§229.405 of this chapter) is not contained herein, and will not be contained, to the best of registrant's knowledge, in definitive proxy or information statements incorporated by reference in Part III of this Form 10-K or any amendment to this Form 10-K. o
Indicate by check mark whether the registrant is a large accelerated filer, an accelerated filer, a non-accelerated filer, a smaller reporting company, or emerging growth company. See the definitions of "large accelerated filer," "accelerated filer," "smaller reporting company" and "emerging growth company" in Rule 12b-2 of the Exchange Act.
| | | | | | | | | | | | | | |
| Large accelerated filer | ☒ | | Accelerated filer | ☐ |
| Non-accelerated filer | ☐ | | Smaller reporting company | ☐ |
| | | | Emerging growth company | ☐ |
If an emerging growth company, indicate by check mark if the registrant has elected not to use the extended transition period for complying with any new or revised financial accounting standards provided pursuant to Section 13(a) of the Exchange Act.o
Indicate by check mark whether the registrant has filed a report on and attestation to its management's assessment of the effectiveness of its internal control over financial reporting under Section 404(b) of the Sarbanes-Oxley Act (15 U.S.C. 7262(b)) by the registered public accounting firm that prepared or issued its audit report. x
Indicate by check mark whether the registrant is a shell company (as defined in Rule 12b-2 of the Act). Yes o No x
The aggregate market value of the registrant’s common stock held by non-affiliates of the registrant based upon the closing price of a share of the registrant’s common stock on February 28, 2020, the last business day of the registrant’s most recently completed second fiscal quarter, as reported by the New York Stock Exchange on that date, was $9,934,201,702.
As of October 22, 2020, there were 37,991,892 shares of the registrant's common stock outstanding.
DOCUMENTS INCORPORATED BY REFERENCE
Certain information required by Part III of this annual report on Form 10-K is incorporated by reference to our definitive Proxy Statement for our 2020 Annual Meeting of Stockholders, which will be filed with the Securities and Exchange Commission not later than 120 days after August 31, 2020.
FACTSET RESEARCH SYSTEMS INC.
FORM 10-K
For The Fiscal Year Ended August 31, 2020
Special Note Regarding Forward-Looking Statements
FactSet Research Systems Inc. has made statements under the captions Item 1. Business, Item 1A. Risk Factors, Item 7. Management’s Discussion and Analysis of Financial Condition and Results of Operations and in other sections of this Annual Report on Form 10-K that are forward-looking statements. In some cases, you can identify these statements by words such as "may," "might," "will," "should," "expects," "plans," "anticipates," "believes," "estimates," "intends," "projects," "indicates," "predicts," "potential," or "continue," and similar expressions.
These forward-looking statements, which are subject to risks, uncertainties and assumptions about us, may include projections of our future financial performance and anticipated trends in our business. These statements are only predictions based on our current expectations, estimates, forecasts and projections about future events. These statements are not guarantees of future performance and involve a number of risks, uncertainties and assumptions. There are many important factors that could cause our actual results, level of activity, performance or achievements to differ materially from the results, level of activity, performance or achievements expressed or implied by the forward-looking statements, including the numerous factors discussed under Item 1A. Risk Factors in this Annual Report on Form 10-K, that should be specifically considered.
Although we believe the expectations reflected in the forward-looking statements are reasonable, we cannot guarantee future results, level of activity, performance or achievements. Moreover, neither we nor any other person assumes responsibility for the accuracy and completeness of any of these forward-looking statements. Forward-looking statements speak only as of the date they are made, and actual results could differ materially from those anticipated in forward-looking statements. We do not intend, and are under no duty, to update any of these forward-looking statements after the date of this Annual Report on Form 10-K to reflect actual results, future events or circumstances, or revised expectations.
We intend that all forward-looking statements we make will be subject to safe harbor protection of the federal securities laws as found in Section 27A of the Securities Act of 1933 and Section 21E of the Securities Exchange Act of 1934.
Part I
ITEM 1. BUSINESS
Business Overview
FactSet Research Systems Inc. and its wholly-owned subsidiaries (collectively, the "Company" or "FactSet") is a global provider of integrated financial information, analytical applications and industry-leading services for the investment and corporate communities. For over 40 years, global financial professionals have utilized our content and multi-asset class solutions across each stage of the investment process. Our goal is to provide a seamless user experience spanning idea generation, research, portfolio construction and analysis, trade execution, performance measurement, risk management, and reporting, in which we serve the front, middle, and back offices to drive productivity and improved performance. Our flexible, open data and technology solutions can be implemented both across the investment portfolio lifecycle or as standalone components serving different workflows in an organization. We are focused on growing our business through three segments: the Americas (formerly known as U.S.), EMEA (Europe and Africa, formerly known as Europe), and Asia Pacific. Within each of our segments, we primarily deliver insight and information through our four workflow solutions of Research, Analytics and Trading, Content and Technology Solutions ("CTS") and Wealth.
We currently serve a wide range of financial professionals, which include but are not limited to portfolio managers, investment research professionals, investment bankers, risk and performance analysts, wealth advisors, and corporate clients. We provide both insights on global market trends and intelligence on companies and industries, as well as capabilities to monitor portfolio risk and performance and execute trades. We combine dedicated client service with open and flexible technology offerings, such as a configurable desktop and mobile platform, comprehensive data feeds, an open marketplace, digital portals and application programming interfaces ("APIs"). Our revenue is primarily derived from subscriptions to products and services such as workstations, portfolio analytics, enterprise data, and research management.
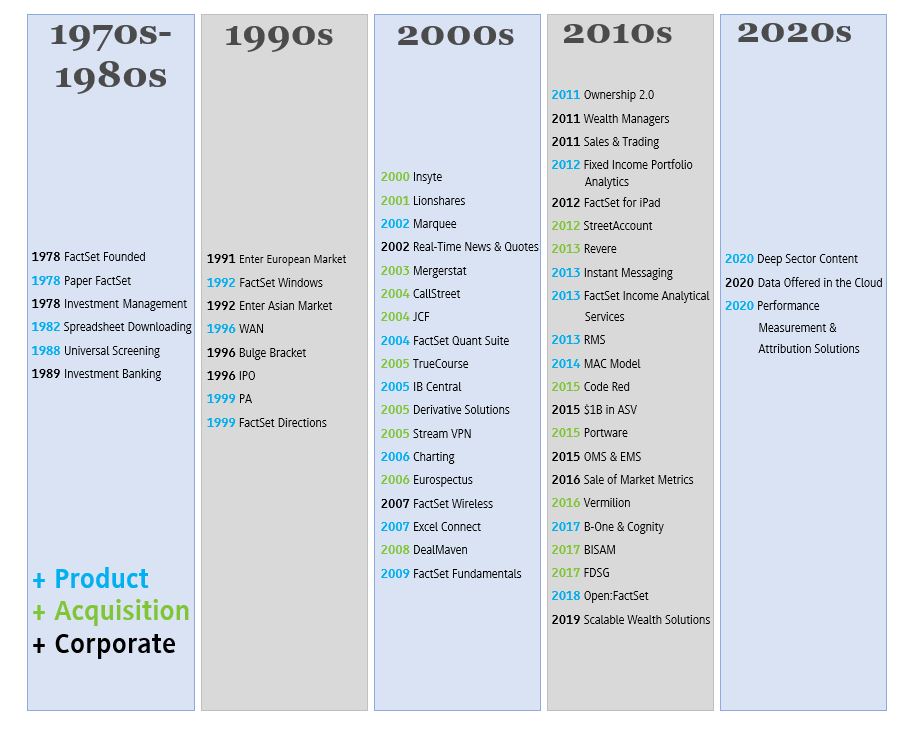
Corporate History
FactSet was founded in 1978 and has been publicly held since 1996. We are dual listed on the New York Stock Exchange ("NYSE") and the NASDAQ Stock Market ("NASDAQ") under the symbol "FDS". Fiscal 2020 marked our 42nd year of operations and while much has changed in both markets and technology, our focus has always been to provide best-in-class products and exceptional client service.
The following timeline depicts the Company’s history since our founding in 1978:
Business Strategy
Current technology trends are leading to a greater demand to deliver a fully digital and integrated client experience. To take advantage of these developments we have focused our innovations and strategic investments in cloud computing, data lakes, APIs and our hosted proprietary data and analytics platform to provide real-time, predictive business intelligence for a seamless client experience. We continue to expand our broad financial content to provide support for our clients' most sophisticated investment strategies, including enhanced data in private markets, industry specific deep sector and environmental, social and governance ("ESG"). As a premier financial solutions provider for the global financial community, we provide workflow solutions and leading analytical applications, powered by cognitive capabilities and robust technology, across the investment portfolio lifecycle. We bring the front, middle and back offices together to drive productivity and performance at every step of the investment process using our open and scalable solutions. Our strategy is focused on growing our business in our three segments: the Americas, EMEA and Asia Pacific. We believe this geographical strategic alignment helps us better manage our resources, direct our solutions and interact with our clients. To execute on our business strategy of broad-based growth, we continue to look at ways to create value for our clients by offering data, products, and analytical applications within our four workflow solutions of Research, Analytics and Trading, CTS and Wealth.
Research
Research focuses on company analysis, idea generation, and research management. The tools within Research provide solutions to analyze public and private companies, generate ideas and discover opportunities. Research also allows users to monitor the global markets, to gain industry and market insights, and to collaborate on and share information across teams. FactSet
combines global coverage, deep history, and transparency with thousands of FactSet-sourced and third-party databases integrated in one flexible platform.
Analytics and Trading
Analytics and Trading addresses processes around portfolio analytics, risk management and performance measurement and attribution. Analytics and Trading also focuses on client reporting, portfolio construction, trade execution and order management. The applications within Analytics and Trading are modularized and deployed to fulfill both targeted and holistic needs in the front and middle offices. Analytics and Trading integrates our clients’ proprietary data along with FactSet and third-party content to bring actionable insights to the portfolio management process. Analytics and Trading tools are accessible through a variety of mediums, including the FactSet workstation and application programming interfaces.
Wealth
Wealth is focused on the wealth management industry and creates offerings that enable wealth professionals across an entire enterprise, including home office, advisory, and client engagement. Wealth empowers wealth managers to demonstrate value to clients and prospects while growing and protecting their assets with FactSet’s combined solution set of portfolio analytics, market monitoring tools, multi-asset class research and customized client facing digital solutions. Our research management solutions products enable our wealth management clients to increase collaboration and communication between home office and advisory functions within the firm and deliver consistent and scalable messaging to the clients of the advisor.
CTS
CTS focuses on delivering content directly to our clients. Clients seamlessly discover, explore, and access organized and connected content via multiple delivery channels. Whether a client needs market, company, or alternative data, our data delivery services provide normalized data through a variety of technologies, such as APIs, cloud infrastructure, database loaders and formats that meet the needs of our clients’ workflows. Our symbology links and aggregates a diverse set of content sources to ensure consistency, transparency, and data integrity across a client’s business. By enabling our clients to utilize their preferred choice of industry standard databases, programming languages, and data visualization tools, we empower them to focus on the core competencies needed to drive their business.
FactSet Clients
Buy-side
Buy-side clients continue to shift increasingly towards multi-asset class investment strategies and FactSet is well-positioned to be a partner of choice in this space. Our ability to provide enterprise-wide solutions to our clients across their entire workflow covering virtually every asset class enables us to compete for greater market share. Buy-side clients primarily include portfolio managers, analysts, traders, wealth managers, performance teams and risk and compliance teams at a variety of firms, such as traditional asset managers, wealth advisors, corporations, hedge funds, insurance companies, plan sponsors and fund of funds. They access our multi-asset-class tools by utilizing our workstations, analytics and trading tools, proprietary content, data feeds, APIs and portfolio services.
The buy-side annual subscription value ("ASV") growth rate for fiscal 2020 was 5.4%. Buy-side clients accounted for approximately 84% of our ASV as of August 31, 2020. ASV at any given point in time represents the forward-looking revenue for the next 12 months from all subscription services currently being supplied to clients and excludes professional service fees, which are not subscription-based.
Sell-side
FactSet delivers comprehensive solutions to sell-side clients including workstation, proprietary and third-party content, productivity tools for Microsoft® Office, web and mobile, and research management solutions for research authoring and publishing. Our focus remains on expanding the depth of content offered and increasing workflow efficiency for our sell-side clients, primarily including investment bankers and private equity and research analysts.
The sell-side ASV growth rate for fiscal 2020 was 4.6%. Sell-side clients accounted for approximately 16% of our ASV as of August 31, 2020.
Client and User Additions
Our total client count as of August 31, 2020 was 5,875, representing a net increase of 301 or 5.4% in the last 12 months. The net increase was primarily due to an increase in corporate and wealth management clients, partially offset by a decrease in institutional asset management clients. As of August 31, 2020 there were 133,051 professionals using FactSet, representing a net increase of 6,229 or 4.9% in the last 12 months, driven primarily by wealth management and corporate professionals.
Annual client retention was greater than 95% of ASV for the period ended August 31, 2020 and August 31, 2019. When expressed as a percentage of clients, annual retention increased to approximately 90% for the period ended August 31, 2020, compared to approximately 89% for the period ended August 31, 2019.
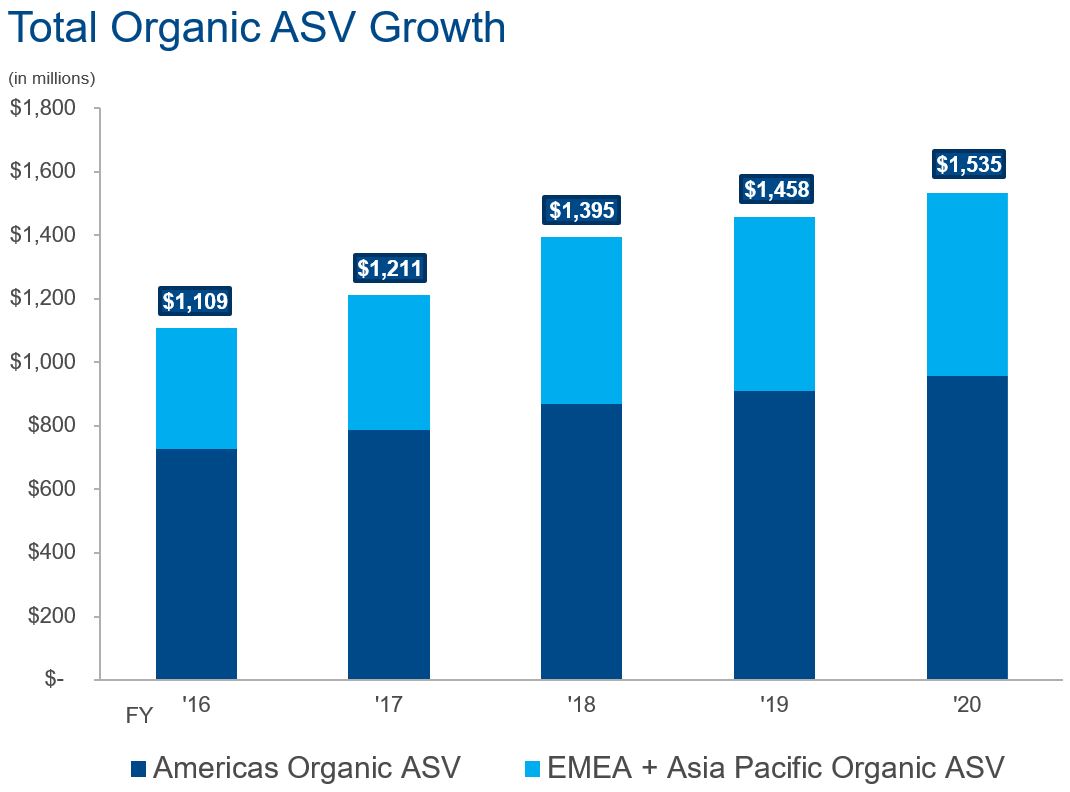
Organic ASV Growth
Organic ASV growth at any given point in time represents the forward-looking revenue for the next 12 months from all subscription services currently being supplied to clients and excludes ASV from acquisitions and dispositions completed within the last 12 months, the effects of foreign currency movements on the current year period and professional services. With proper notice provided to us, our clients can add to, delete portions of, or terminate service, subject to certain contractual limitations.
As of August 31, 2020, our organic ASV totaled $1.53 billion, up 5.2% over the prior year comparable period. The majority of the ASV increase was in the Americas, followed by increased sales in EMEA and Asia Pacific, as well as the benefit from our annual price increase, partially offset by cancellations. The increase in ASV was driven by growth in all our workflow solutions, mainly driven by an increase in Analytics and Trading, followed by CTS and Wealth.
The following chart provides a snapshot of FactSet’s historic organic ASV growth:
Financial Information on Geographic Areas
Operating segments are defined as components of an enterprise that have the following characteristics: (i) it engages in business activities from which it may earn revenues and incur expenses, (ii) its operating results are regularly reviewed by the company’s chief operating decision maker ("CODM") for resource allocation decisions and performance assessment, and (iii) its discrete financial information is available. FactSet's Chief Executive Officer functions as our CODM.
Our operating segments are aligned with how the Company, including our CODM, manages the business and the geographic markets in which we serve, with a primary focus on providing integrated global financial and economic information. Our internal financial reporting structure is based on three reportable segments, the Americas, EMEA and Asia Pacific. Within each of our segments, we primarily deliver insight and information through our four workflow solutions of Research, Analytics and Trading, CTS and Wealth. These workflow solutions provide global financial and economic information to investment managers, investment banks and other financial services professionals.
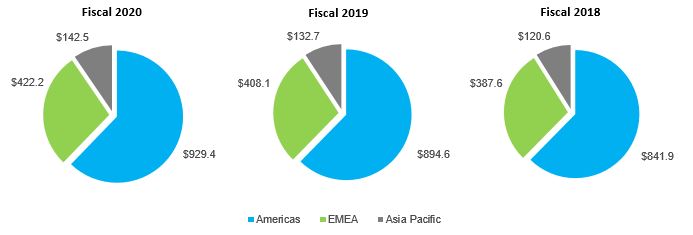
The Americas segment serves our clients throughout North, Central, and South America, with offices in 12 states throughout the United States ("U.S."), including our corporate headquarters in Norwalk, Connecticut, and an office in both Brazil and Canada. The EMEA segment serves our clients in countries in Europe and Africa and maintains office locations in Bulgaria, England, France, Germany, Italy, Latvia, Luxembourg, the Netherlands, South Africa, Spain, and Switzerland. The Asia Pacific segment serves our clients in countries in Asia and Australia and includes office locations in Australia, UAE (Dubai), China, Hong Kong, India, Japan, the Philippines, and Singapore. Segment revenue reflects sales to our clients based on their respective geographic locations.
Each segment records compensation expense (including stock-based compensation), depreciation of furniture and fixtures, amortization of lease right-of-use ("ROU") assets, leasehold improvements and intangible assets, as well as communication costs, professional fees, rent expense, travel, office and other direct expenses. Expenditures associated with our data centers, third-party data costs and corporate headquarters charges are recorded by the Americas segment and are not allocated to the other segments. The content collection centers, located in India, the Philippines, and Latvia, benefit all our operating segments, and thus the expenses incurred at these locations are allocated to each segment based on a percentage of revenue. Refer to Note 18, Segment Information in the Notes to the Company’s Consolidated Financial Statements included in Item 8. of this Annual Report on Form 10-K for financial information, including revenues, operating income and long-lived assets for each of our segments.
The following charts depict revenue related to our reportable segments.
(in millions)
Talent
We have built a collaborative culture that recognizes and rewards innovation and offers employees a variety of opportunities and experiences. Our employees are critical to our success and are the reason we continue to execute at a high level. We believe our continued focus on making employee engagement a top priority will help us provide high quality insights and information to clients globally.
We continuously cultivate a diverse and inclusive environment that promotes empowerment and engagement, which is key to our ability to attract, retain, and develop talent. We strive to achieve this successfully with various activities, including an annual global employee engagement survey. We share survey results with all employees to highlight areas that employees believe are strengths of the Company and reflect on areas where employees feel improvement may be needed. Each year, executive leadership focuses on key areas for improvement based upon the survey results and compiles initiatives to actively resolve or invest in improvements in a transparent manner. Progress on these initiatives is tracked and we survey employees again, to ensure that the actions taken addressed the underlying issues and to promote an environment of continuous improvement.
FactSet works diligently to create and nourish a culture which engages employees through direct responsibility, by distributing leadership decision-making and providing opportunities for employees to help shape the Company’s strategic vision. We challenge our employees to make an impact regarding position responsibilities and their career growth by providing them multiple opportunities to make a positive impact.
As of August 31, 2020, our employee headcount was 10,484, an increase of 8.3% in the last twelve months. Our employee workforce is located globally in 48 office locations in 22 countries. Of our total employees, 6,643 (63%) were located in Asia Pacific, 2,477 (24%) in the Americas and 1,364 (13%) in EMEA. In order to optimize productivity, we have invested in expanding our footprint and talent pool in India and the Philippines, where we now have a combined workforce of approximately 6,400 employees. Functionally, 22% of our employees are in Sales and Client Solutions; 31% are in Technology & Product Development; 43% are in Content Operations; and 4% are in Corporate Support.
As of August 31, 2020 and August 31, 2019, 420 and 430 FactSet employees, respectively, were represented by mandatory works councils within certain French and German subsidiaries. No other employees are represented by collective bargaining agreements.
Third-Party Content
We aggregate content from thousands of third-party data suppliers, news sources, exchanges, brokers and contributors into our dedicated managed database, which our clients access through our flexible delivery platforms to perform their analysis. We license content from premier providers of major global exchanges and data providers. We seek to maintain contractual relationships with a minimum of two content providers for each major type of financial data, though certain data sets on which we rely have a limited number of suppliers. We make every effort to assure that, where reasonable, alternative sources are available. We are not dependent on any one third-party data supplier in order to meet the needs of our clients. We have entered into third-party content agreements of varying lengths, which in some cases can be terminated on one year’s notice, at predefined dates, and in other cases on shorter notice. No single vendor or data supplier represented more than 10% of FactSet's total data costs during fiscal 2020, with the exception for one vendor, which is a supplier of risk models and portfolio optimizer data to FactSet and represented 11% of FactSet’s data costs in fiscal 2020.
Data Centers
Our business is dependent on our ability to process substantial volumes of data and transactions rapidly and efficiently on our networks and systems. Our global technology infrastructure supports our operations and is designed to facilitate the reliable and efficient processing and delivery of data and analytics to our clients. Our data centers contain multiple layers of redundancy to enhance system performance, including maintaining, processing and storing data at multiple data centers. User connections are load balanced between data centers. In the event of a site failure, equipment problem or localized disaster, the remaining centers have the capacity to handle the additional load. We continue to be focused on maintaining a global technological infrastructure that allows us to support our growing business.
We continue to operate fully redundant data centers in both Virginia and New Jersey in the U.S. that can handle our entire client capacity. In addition, we are migrating select systems and applications to diverse cloud computing regions utilizing premier, market-leading cloud providers.
The Competitive Landscape
We are a part of the financial information services industry, providing financial data and workflow solutions to the global investment community. This competitive market is comprised of both large, well-capitalized companies and smaller, niche firms including market data suppliers, news and information providers and many third party content providers that supply us with financial information included in FactSet's products. Our largest competitors are Bloomberg L.P., Refinitiv (formerly part of Thomson Reuters), and S&P Global Market Intelligence. Other competitors and competitive products include online database suppliers and integrators and their applications, such as BlackRock Solutions, Morningstar Inc. and MSCI Inc. Many of these firms provide products or services similar to our own offerings.
We believe there are high barriers to entry and we expect it would be difficult for another vendor to quickly replicate the extensive data we currently offer. Through our in-depth analytics and client service, we believe we can offer clients a more comprehensive solution with one of the broadest sets of functionalities delivered through a desktop or mobile user interface or through a standardized or bespoke data feed as well as an API. In addition, our applications, including our client support and service offerings, are entrenched in the workflow of many financial professionals given the downloadable functionality, instant data refresh and portfolio analysis/screening capabilities offered. We are entrusted with significant amounts of our clients' own
proprietary data, including portfolio holdings. As a result, we believe our products are central to our clients’ investment analysis and decision-making.
Intellectual Property
We have registered trademarks and copyrights for many of our products and services and will continue to evaluate the registration of additional trademarks and copyrights as appropriate. We enter into confidentiality agreements with our employees, clients, data suppliers and vendors. We seek to protect our workflow solutions, documentation and other written materials under trade secret, copyright and patent laws. While we do not believe we are dependent on any one of our intellectual property rights, we do rely on the combination of intellectual property rights and other measures to protect our proprietary rights. Despite these efforts, existing intellectual property laws may afford only limited protection.
Research and Product Development Costs
A key aspect of our growth strategy is to offer new solutions and enhance our existing products and applications by making them faster with more reliable data. We strive to rapidly adopt new technology that can improve our products and services. At FactSet we do not have a separate research and product development department, but rather our product development and engineering departments work closely with our strategists, product managers, sales and other client-facing specialists to identify areas of improvement to provide increased value to our clients. Research and product development costs include the salary and benefits for our product development, software engineering and technical support staff working on these initiatives. These costs are expensed as incurred within our cost of services as employee compensation. We intend to continue to invest in the development of new products and enhancements that will allow us to respond quickly to market changes and efficiently meet the needs of our clients. We incurred research and product development costs of $224.0 million, $214.7 million and $217.1 million during fiscal years 2020, 2019 and 2018, respectively.
Government Regulation
FactSet is subject to reporting requirements, disclosure obligations and other recordkeeping requirements of the Securities and Exchange Commission ("SEC") and the various local authorities that regulate each location in which we operate. The Company’s P.A.N. Securities, LP, is a member of the Financial Industry Regulatory Authority, Inc. and is a registered broker-dealer under Section 15 of the Securities Exchange Act of 1934. P.A.N. Securities, LP, as a registered broker-dealer, is subject to Rule 15c3-1 under the Securities Exchange Act of 1934, which requires that the Company maintain minimum net capital requirements. The Company claims exemption under Rule 15c3-3(k)(2)(i).
Corporate Contact Information
FactSet was founded as a Delaware corporation in 1978, and its principal executive office is in Norwalk, Connecticut.
Mailing address of the Company’s headquarters: 45 Glover Avenue Norwalk, CT 06850
Telephone number: +1 (203) 810-1000
Website address: www.factset.com
Available Information
Through the Investor Relations section of FactSet’s website (https://investor.factset.com), we make available the following filings as soon as practicable after they are electronically filed with, or furnished to, the SEC: the Company’s Annual Report on Form 10-K, Quarterly Reports on Form 10-Q, Current Reports on Form 8-K, Proxy Statements for the annual stockholder meetings, Reports on Forms 3, 4 and 5, and any amendments to those reports filed or furnished pursuant to Section 13(a) or 15(d) of the Securities Exchange Act of 1934, as amended. All such filings are available free of charge.
Additionally, we broadcast live our quarterly earnings calls via the investor relations section of our website. We also provide notifications of news or announcements regarding our financial performance, including SEC filings, investor events, press and earnings releases, and blogs as part of our investor relations website. The contents of this website section are not intended to be incorporated by reference into this Annual Report on Form 10-K or in any other report or document the Company files with the SEC and any reference to this section of our website is intended to be inactive textual references only.
In addition, the FactSet Code of Business Conduct and Ethics is posted in the Investor Relations section of the Company’s website. The same information is available in print to any stockholder who submits a written request to the Company’s Investor Relations department. Any amendments to or waivers of such code that are required to be publicly disclosed by the applicable
exchange rules or the SEC will be posted on our website. The Corporate Governance Guidelines and the charters of each of the committees of the Company’s Board of Directors, including the Audit Committee, Compensation and Talent Committee, and Nominating and Corporate Governance Committee, are available on the Investor Relations section of our website. The same information is available in print, free of charge, to any stockholder who submits a written request to our Investor Relations department.
Executive Officers of the Registrant
The following table shows FactSet’s current executive officers:
| | | | | | | | | | | |
| Name of Officer | Age | Office Held with the Company | Officer Since |
| F. Philip Snow | 56 | Chief Executive Officer | 2014 |
| Helen L. Shan | 53 | Executive Vice President and Chief Financial Officer | 2018 |
| Goran Skoko | 59 | Executive Vice President, Managing Director EMEA and Asia Pacific, Head of Wealth Solutions | 2019 |
| Gene D. Fernandez | 53 | Executive Vice President, Chief Technology and Product Officer | 2017 |
| Rachel R. Stern | 55 | Executive Vice President, Chief Legal Officer, Global Head of Strategic Resources and Secretary | 2009 |
| Robert J. Robie | 42 | Executive Vice President, Head of Analytics and Trading Solutions | 2018 |
| Daniel Viens | 63 | Senior Vice President, Chief Human Resources Officer | 2018 |
F. Philip Snow – Chief Executive Officer. Mr. Snow was named Chief Executive Officer effective July 1, 2015. Prior to that, Mr. Snow held the title of President. He began his career at FactSet in 1996 as a Consultant, before moving to Asia to hold positions in the Tokyo and Sydney offices. Following his move back to the U.S. in 2000, Mr. Snow held various sales leadership roles prior to assuming the role of Senior Vice President, Director of U.S. Investment Management Sales in 2013. Mr. Snow received a Bachelor of Arts in Chemistry from the University of California at Berkeley and a Master of International Management from the Thunderbird School of Global Management. He has earned the right to use the Chartered Financial Analyst designation.
Helen L. Shan – Executive Vice President and Chief Financial Officer. Ms. Shan joined FactSet in September 2018 from Marsh and McLennan Companies, where she was CFO for Mercer, a professional services firm. In her current role, she is responsible for activities related to accounting, finance, corporate development and strategy. Preceding her tenure as the CFO for Mercer, Ms. Shan served as the Vice President and Treasurer for Marsh and McLennan Companies, with additional prior experience in the same position with Pitney Bowes Inc. and served as a Managing Director in investment banking at J.P. Morgan. In September 2018, Ms. Shan joined the Board of Directors of EPAM Systems Inc., a global provider of digital platform engineering and software development services. Ms. Shan holds dual degrees with a Bachelor of Science and a Bachelor of Applied Science from the University of Pennsylvania’s Wharton School of Business and School of Applied Science and Engineering. Ms. Shan also has a Master of Business Administration from Cornell University’s SC Johnson College of Business.
Goran Skoko – Executive Vice President, Managing Director EMEA and Asia Pacific, Head of Wealth Solutions. Mr. Skoko joined FactSet in 2004 as a Senior Product developer and has held a number of positions of increased responsibility. In his current role, Mr. Skoko is responsible for providing direction to address the product and content needs for EMEA and Asia Pacific clients while also focusing on increased deployment and building community within the wealth management space. Prior to FactSet, he spent 16 years in various engineering and product management roles at Thomson Financial. Mr. Skoko earned his B.S. in Physics and Computer Science from Fordham University.
Gene D. Fernandez – Executive Vice President, Chief Technology and Product Officer. Mr. Fernandez joined FactSet in November 2017 from J.P. Morgan, where he served as the Chief Technology Officer, New Product Development. In this role, he developed the strategy and built the engineering function responsible for new product innovation. During a decade at J.P. Morgan, Mr. Fernandez held various other roles, including Chief Technology Officer for Client Technology and Research and Banking Information Technology. Prior to J.P. Morgan, he worked at Credit Suisse and Merrill Lynch. Mr. Fernandez received a Bachelor of Science in Computer Science and Economics from Rutgers University.
Rachel R. Stern – Executive Vice President, Chief Legal Officer, Global Head of Strategic Resources and Secretary. Ms. Stern joined FactSet in January 2001 as General Counsel. In addition to her role in the Legal Department, Ms. Stern is also responsible for Compliance, Facilities Management and Real Estate Planning and the administration of our offices in Hyderabad, Manila and Riga. Ms. Stern is admitted to practice in New York, Washington D.C., and as House Counsel in Connecticut. Ms. Stern received a Bachelor of Arts from Yale University, a Master of Arts from the University of London and a Juris Doctor from the University of Pennsylvania Law School.
Robert J. Robie – Executive Vice President, Head of Analytics and Trading Solutions. Mr. Robie joined FactSet in July 2000 as a Product Sales Specialist. In his current role, he oversees strategy, research, development and engineering for Analytics and Trading platforms. During his tenure at FactSet, Mr. Robie has held several positions of increased responsibility, including Senior Director of Analytics and Director of Global Fixed Income. Although Mr. Robie joined FactSet in 2000, he did work at BTN Partners from 2004 through 2005 in their quantitative portfolio management and performance division, before returning to continue his career with FactSet. Mr. Robie holds a Bachelor of Arts in Economics and Fine Arts from Beloit College.
Daniel Viens – Senior Vice President, Chief Human Resources Officer. Mr. Viens joined FactSet in September 1998 as a Vice President, Director of Human Resources and has held several leadership positions of increased responsibility in Human Resources. Prior to joining FactSet, Mr. Viens was a Director of Human Resources for First Data Solutions and Donnelly Marketing (a former company of Dun & Bradstreet), where he developed significant Human Resources acumen. Mr. Viens graduated from Boston University, and holds both a Master's Degree from Eastern Illinois University in Clinical Psychology and a Master of Business Administration from Columbia University.
Additional Information
Additional information with respect to FactSet’s business is included in the following pages and is incorporated herein by reference:
ITEM 1A. RISK FACTORS
The following risks could materially and adversely affect our business, financial condition, cash flows, and results of operations and, as a result, the trading price of our common stock could decline. These risk factors do not identify all risks that we face; our operations could also be affected by factors that are not presently known to us or that we currently consider to be immaterial to our operations. Due to risks and uncertainties, known and unknown, our past financial results may not be a reliable indicator of future performance, and historical trends should not be used to anticipate results or trends in future periods. Investors should also refer to the other information set forth in this Annual Report on Form 10-K, including Item 7. Management’s Discussion and Analysis of Financial Condition and Results of Operations and the Company’s Consolidated Financial Statements including the related Notes. Investors should carefully consider all risks, including those disclosed here, before making an investment decision.
Technology & Data Security Risks
Loss, corruption and misappropriation of data and information relating to clients and others
Many of our products, as well as our internal systems and processes, involve the storage and transmission of our own, as well as supplier and customer, proprietary information and sensitive or confidential data. This includes data from client portfolios and strategies. Breaches of this confidentiality, should they occur, could result in the loss of clients and termination of arrangements with suppliers for the use of their data. If we fail to maintain the adequacy of our internal data controls, unauthorized access or misappropriation of client or supplier data by an employee or an external third-party could occur. Additionally, the maintenance and enhancement of our systems may not be completely effective in preventing loss, unauthorized access or misappropriation. Data misappropriation, unauthorized access or data loss could instill a lack of confidence in our products and systems and damage our brand, reputation and business. Breaches of security measures could expose us, our clients or the individuals affected to a risk of loss or misuse of this information, potentially resulting in litigation and liability for us, as well as the loss of existing or potential clients. Many jurisdictions in which we operate have laws and regulations relating to data privacy and protection of personal information, including the European Union General Data Protection Regulation, which became effective
May 25, 2018, and California's Consumer Privacy Act, which became effective January 1, 2020. Both require companies to satisfy requirements regarding the handling of personal and sensitive data, including our use, protection and the ability of persons whose data is stored to correct or delete such data about themselves. The law in this area continues to develop and the changing nature of privacy laws could impact our processing of personal and sensitive information related to our content, operations, employees, clients, and suppliers, and may expose us to claims of violations.
Successful cyber-attacks and the failure of cyber-security systems and procedures
In providing our digital-enabled services to clients, we rely on information technology infrastructure that is managed internally along with placing reliance on third-party service providers. We and these third-party service providers are subject to the risks of system failures and security breaches, including cyber-attacks, such as phishing scams, viruses and denials of service attacks, as well as employee errors or malfeasance. Our and our vendors' use of mobile and cloud technologies may increase our risk for such threats. Our protective systems and procedures and those of third parties to which we are connected, such as cloud computing providers, may not be effective against these threats. Our information technology systems must be constantly updated and patched to protect against known vulnerabilities and to optimize performance. Our contracts with service providers typically require them to implement and maintain adequate security controls, but we may not have the ability to effectively monitor these security measures. As a result, inadequacies of the third party security technologies and practices may not be detected until after a security breach has occurred. We could suffer significant damage to our brand and reputation: if a cyber-attack or other security incident were to allow unauthorized access to, or modification of, clients’ or suppliers’ data, other external data, internal data or information technology systems; if the services provided to clients were disrupted; or if products or services were perceived as having security vulnerabilities. The costs we would incur to address and resolve these security incidents would increase our expenses. These types of security incidents could also lead to lawsuits, regulatory investigations and claims, loss of business and increased legal liability. We also make acquisitions periodically. While significant effort is placed on addressing information technology security issues with respect to the acquired companies, we may inherit such risks when these acquisitions are integrated into our infrastructure.
A prolonged or recurring outage at our data centers and other business continuity disruptions at facilities could result in reduced service and the loss of clients
Our clients rely on us for the delivery of time-sensitive, up-to-date data and applications. Our business is dependent on our ability to process substantial volumes of data and transactions rapidly and efficiently on our computer-based networks and systems. If we experience significant growth of our customer base or increases in the number of products or services or in the speed at which we are required to provide products and services, it may strain our systems. Additionally, our systems and networks may become strained due to aging or end-of-life technology that we have not yet updated or replaced. Our computer operations, as well as our other business centers, and those of our suppliers and clients, are vulnerable to interruption by fire, natural disaster, power loss, telecommunications failures, terrorist attacks, acts of war, civil unrest, Internet failures, computer viruses, security breaches, and other events beyond our reasonable control. We maintain back-up facilities and certain other redundancies for each of our major data centers to minimize the risk that any such event will disrupt those operations. However, a loss of our services involving our significant facilities may materially disrupt our business and may induce our clients to seek alternative data suppliers. Any such losses or damages we incur could have a material adverse effect on our business. Although we seek to minimize these risks through security measures, controls, back-up data centers and emergency planning, there can be no assurance that such efforts will be successful or effective. Additionally, we may also face significant increases in our use of power and data storage and may experience a shortage of capacity and increased costs associated with such usage.
Transition to new technologies, applications and processes could expose us to unanticipated disruptions
The technology landscape is constantly evolving. To remain competitive, we must adapt and migrate to new technologies, applications and processes. Use of more advanced technologies and infrastructure is critical to the development of our products and services, the scaling of our business for future growth, and the accurate maintenance of our data and operations. The implementation of new technologies and infrastructure, such as migration to new cloud-based systems, is complex and can involve substantial expenditures as well as risks inherent in the conversion to any new system, including potential loss of information and disruption to operations. We may experience unanticipated interruption and delay in the performance and delivery of certain of our products and services. Certain of our technologies are also dependent upon third party providers to maintain adequate systems to protect the security of our confidential information and data. Failure by our providers to maintain appropriate security could result in unauthorized access to our systems or a network disruption that could further lead to improper disclosure of confidential information or data, regulatory penalties and remedial costs. Any disruption to either the provider’s systems or the communication links between us and the provider could negatively affect our ability to operate our data systems and could impair our ability to provide services to our clients. If the services to our clients are disrupted, or if there is unauthorized access to the confidential information of our clients or our vendors, we could suffer significant damage to our brand and reputation and lose clients. As we increase our reliance on third party systems, our exposure to damages from services disruptions may increase, and we may incur additional costs to remedy damages caused by these disruptions.
Use of open source software could introduce security vulnerabilities, impose unanticipated restrictions on our ability to commercialize our products and services, and subject us to increased costs
We use open source code in our software development and incorporate it into our products and internal systems. The use of open source code may entail greater risks than the use of third-party commercial software. Open source licensors generally do not provide warranties or other contractual protections regarding infringement claims or the quality or security of the code. Some open source licenses provide that if we combine our proprietary applications with the open source software in a certain manner, we could be required to release the source code of our proprietary applications to the public. This would allow our competitors to create similar products with less development effort and time and ultimately put us at a competitive disadvantage. We have implemented procedures to control the use of source code so was to mitigate this risk; however, the terms of many open source licenses are also ambiguous and have not been interpreted by U.S. or other courts. Therefore, there is a risk that our internal procedures controlling the use of open source code could fail, or that the licenses could be construed in a manner that imposes unanticipated conditions or restrictions on us. If any of this were to occur, we could be required to seek alternative third-party licenses at increased costs or reduced scope, to re-engineer products or systems, or potentially to discontinue the licensing of certain products. Any remedial actions could divert resources away from our development efforts, be time intensive and have a significant cost.
Strategy & Market Demand Risks
Competition in our industry may cause price reductions or loss of market share
We continue to experience intense competition across all markets for our products, with competitors ranging in size from smaller, highly specialized, single-product businesses to multi-billion-dollar companies. While we believe the breadth and depth of our suite of products and applications offer benefits to our clients that are a competitive advantage, our competitors may offer price incentives to attract new business. Future competitive pricing pressures may result in decreased sales volumes and price reductions, resulting in lower revenue. Weak economic conditions may also result in clients seeking to utilize lower-cost information that is available from alternative sources. The impact of cost-cutting pressures across the industries we serve could lower demand for our products. Clients within the financial services industry that strive to reduce their operating costs may seek to reduce their spending on financial market data and related services, such as ours. If our clients consolidate their spending with fewer suppliers, by selecting suppliers with lower-cost offerings or by self-sourcing their needs for financial market data, our business could be negatively affected.
The continued shift from active to passive investing could negatively impact user count growth and revenue
The predominant investment strategy today is still active investing, which attempts to outperform the market. The main advantage of active management is the expectation that the investment managers will be able to outperform market indices. They make informed investment decisions based on their experiences, insights, knowledge and ability to identify opportunities that can translate into superior performance. The main advantage of passive investing is that it closely matches the performance of market indices. Passive investing requires little decision-making by investment managers and low operating costs which result in lower fees for the investor. A continued shift to passive investing, resulting in an increased outflow to passively managed index funds, could reduce demand for the services of active investment managers and consequently, the demand of our clients for our services.
A decline in equity and/or fixed income returns may impact the buying power of investment management clients
Approximately 84% of our ASV is derived from our investment management clients. The profitability and management fees of these clients are tied to assets under management. An equity market decline not only depresses the value of assets under management but also could cause a significant increase in redemption requests from our clients’ customers, further reducing their assets under management. Reduced client profits and management fees may cause our clients to cut costs. Moreover, extended declines in the equity and fixed income markets may reduce new fund or client creation. Each of these developments may result in lower demand from investment managers for our services and workstations, which could negatively affect our business.
Uncertainty in the global economy and consolidation in the financial services industry may cause us to lose clients and users
Many of our clients are investment banks, asset managers, wealth advisors, and other financial services entities. Uncertainty in the global economy or a lack of confidence in the global financial system could negatively impact our clients, which could cause a corresponding negative impact on our business results. Mergers, consolidation or contraction of our clients in the financial services industry also could directly impact the number of clients and prospective clients and users of our products and services. If our clients merge with or are acquired by other entities that are not our clients, or that use fewer of our products and services, they may discontinue or reduce their use of our products and services. Thus, economic uncertainty, lack of confidence
in the global financial system, and consolidation in this sector could adversely affect our business, financial results and future growth.
Volatility in the financial markets may delay the spending pattern of clients and reduce future ASV growth
The decision on the part of large institutional clients to purchase our services often requires management-level sponsorship and typically depends upon the size of the client, with larger clients having more complex and time-consuming purchasing processes. The process is also influenced by market volatility. These characteristics often lead us to engage in relatively lengthy sales efforts. Purchases (and incremental ASV) may therefore be delayed as uncertainties in the financial markets may cause clients to remain cautious about capital and data content expenditures, particularly in uncertain economic environments. The COVID-19 pandemic may increase this risk as it may curtail our client's spending and lead them to delay or defer purchasing decisions or product service implementations, or cause them to cancel or reduce their spending with us, which could negatively impact our revenues and future growth.
Failure to develop and market new products and enhancements that maintain our technological and competitive position and failure to anticipate and respond to changes in the marketplace for our products and customer demands
The market for our products is characterized by rapid technological change, including methods and speed of delivery, changes in client demands, development of new investment instruments and evolving industry standards. The direction of these trends can render our existing products less competitive, obsolete or unmarketable. As a result, our future success will continue to depend upon our ability to identify and develop new products and enhancements that address the future needs of our target markets and to respond to their changing standards and practices. We may not be successful in developing, introducing, marketing, licensing and implementing new products and enhancements on a timely and cost-effective basis or without impacting the stability and efficiency of existing products and customer systems. Further, any new products and enhancements may not adequately meet the requirements of the marketplace or achieve market acceptance. We must make long-term investments and commit significant resources before knowing whether these investments will eventually result in products and services that satisfy our clients' needs and generate revenues required to provide the desired results. Our failure or inability to anticipate and respond to changes in the marketplace, including competitor and supplier developments, may also adversely affect our business, operations and growth.
Errors or defects can exist at any point in a product's life cycle, but are more frequently found after the introduction of new products or enhancements to existing products. Despite internal testing and testing by clients, our products may contain errors. We may also experience delays while developing and introducing new products for various reasons, such as difficulties in licensing data inputs. Defects, errors, or delays in our products that are significant, or are perceived to be significant, could result in rejection or delay in market acceptance, damage to our reputation, loss of revenue, lower rate of license renewals or upgrades, diversion of development resources, product liability claims or regulatory actions, or increases in service and support costs.
We have provisions in our client contracts to limit our exposure to potential liability claims brought by clients based on the use of our products or services or our delay or failure to provide services. Contracts with customers also increasingly include service level requirements and audits rights to review our security. Many of our customers in the financial services sector are also subject to regulations and requirements to adopt risk management processes commensurate with the level of risk and complexity of their third-party relationships, and provide rigorous oversight of relationships that involve certain "critical activities," some of which may be deemed to be provided by us. Any failure on our part to comply with the specific provisions in customer contracts could result in the imposition of various penalties, which may include termination of contracts, service credits, suspension of payments, contractual penalties, adverse monetary judgments, and, in the case of government contracts, suspension from future government contracting. Even if the outcome of any claims brought against us were ultimately favorable, such a claim would require the time and attention of our management, personnel, as well as financial and other resources and potentially pose a significant disruption to our normal business operations.
Failure to identify, integrate, or realize anticipated benefits of acquisitions and strains on resources as a result of growth
There can be no assurance that we will be able to identify suitable candidates for successful acquisition at acceptable prices. Additionally, there may be integration risks or other risks resulting from acquired businesses. Our ability to achieve the expected returns and synergies from past and future acquisitions and alliances depends in part upon our ability to integrate the offerings, technology, sales, administrative functions and personnel of these businesses effectively into our core business. We cannot guarantee that our acquired businesses will perform at the levels anticipated. In addition, past and future acquisitions may subject us to unanticipated risks or liabilities or disrupt operations.
Growth, such as the addition of new clients and acquisitions, puts demands on our resources, including our internal systems and infrastructure. These may require improvements or replacement to meet the additional demands of a larger organization. Further, the addition of new clients and the implementation of such improvements would require additional management time
and resources. These needs may result in increased costs that could negatively impact results of operations. Failure to implement needed improvements, such as improved scalability, could result in a deterioration in the performance of our internal systems and negatively impact the performance of our business.
Failure to maintain reputation
We enjoy a positive reputation in the marketplace. Our ability to attract and retain clients and employees is affected by external perceptions of our brand and reputation. Reputational damage from negative perceptions or publicity could affect our ability to attract and retain clients and employees and our ability to maintain our pricing for our products. Although we monitor developments for areas of potential risk to our reputation and brand, negative perceptions or publicity could have a material adverse effect on our business and financial results.
Operational Risks
Failure to enter into, renew or comply with contracts supplying new and existing data sets or products on competitive terms
We collect and aggregate third-party content from thousands of data suppliers, news sources, exchanges, brokers and contributors into our own dedicated online service, which clients access to perform their analyses. We combine the data from these sources into our own dedicated databases. Clients have access to the data and content found within our databases. These databases are important to our operations as they provide clients with key information. We have entered into third-party content agreements of varying lengths, which in some cases can be terminated on one year’s notice at predefined dates, and in other cases on shorter notice. Some of our content provider agreements are with competitors, who may attempt to make renewals difficult or expensive. We seek to maintain favorable contractual relationships with our data suppliers, including those that are also competitors. However, we cannot control the actions and policies of our data suppliers and we may have data suppliers who provide us with notice of termination, or exclude or restrict us from use of their content, or only license such content at prohibitive cost. Additionally, despite our efforts to comply with our third-party data supplier agreements, there can be no assurances that third parties may not challenge our use of their content, which could result in increased licensing costs, loss of rights, and costly legal actions. Certain data sets that we rely on have a limited number of suppliers, although we make every effort to assure that, where reasonable, alternative sources are available. We are not dependent on any one third-party data supplier in order to meet the needs of our clients. No single vendor or data supplier represented more than 10% of our total data costs during fiscal 2020, except for one vendor, which is a supplier of risk models and portfolio optimizer data to FactSet and represented 11% of our data costs in fiscal 2020. Our failure to be able to maintain these relationships, or the failure of our suppliers to deliver accurate data or in a timely manner, or the occurrence of a dispute with a vendor over use of their content, could increase our costs and reduce the type of content and products available to our clients, which could harm our reputation in the marketplace and adversely affect our business.
Increased accessibility to free or relatively inexpensive information sources may reduce demand for our products
Each year, an increasing amount of free or relatively inexpensive information becomes available, particularly through the Internet, and this trend may continue. The availability of free or relatively inexpensive information may reduce demand for our products. While we believe our service offering is distinguished by such factors as customization, timeliness, accuracy, ease-of-use, completeness and other value-added factors, if users choose to obtain the information they need from public or other sources, our business and results of operations could be adversely affected.
Inability to hire and retain key qualified personnel
Our business is based on successfully attracting, motivating and retaining talented and diverse employees. Creating a diverse and inclusive environment that promotes empowerment and engagement is key to our ability to attract, retain, and develop talent. Competition for talent, especially engineering personnel, is strong. We need technical resources such as engineers to help develop new products and enhance existing services. We rely upon sales personnel to sell our products and services and maintain healthy business relationships. Our future success also is dependent on the continued service and performance of the members of our senior leadership team. All of these personnel possess business and technical capabilities that are difficult to replace. If we are unsuccessful in our recruiting efforts, or if we are unable to retain key employees, our ability to develop and deliver successful products and services may be adversely affected and could have a material, adverse effect on our business.
Operations outside the United States involve additional requirements and burdens that we may not be able to control or manage successfully
In fiscal 2020, approximately 41% of our revenue related to operations located outside the U.S. In addition, a significant number of our employees, approximately 76%, are located in offices outside the U.S. We expect our growth to continue outside the U.S., with non-U.S. revenues accounting for an increased portion of our total revenue in the future. Our non-U.S. operations involve risks that differ from or are in addition to those faced by our U.S. operations. These risks include difficulties in
developing products, services and technology tailored to the needs of non-U.S. clients, including in emerging markets; different employment laws and rules; rising labor costs in lower-wage countries; difficulties in staffing and managing personnel that are located outside the U.S.; different regulatory, legal and compliance requirements, including in the areas of privacy and data protection, anti-bribery and anti-corruption, trade sanctions and currency controls, marketing and sales and other barriers to conducting business; social and cultural differences, such as language; diverse or less stable political, operating and economic environments and market fluctuations; civil disturbances or other catastrophic events that reduce business activity; limited recognition of our brand and intellectual property protection; differing accounting principles and standards; restrictions on or adverse tax consequences from entity management efforts; and changes in U.S. or foreign tax laws. If we are not able to adapt efficiently or manage the business effectively in markets outside the U.S., our business prospects and operating results could be materially and adversely affected.
The current COVID-19 pandemic and other global public health epidemics may adversely impact our business, our future results of operations and our overall financial performance
Our business could be materially and adversely affected by the risk, or the public perception of risk, related to a pandemic or widespread health crisis, such as the current COVID-19 pandemic. A significant outbreak, epidemic or pandemic of contagious diseases in the human population could result in a widespread health crisis adversely affecting the broader economies, financial markets and overall demand for our products. In addition, any preventative or protective actions that governments implement or that we take in respect of a global health crisis such as COVID-19, such as travel restrictions, quarantines or site closures, may interfere with the ability of our employees, vendors, and data suppliers to perform their respective responsibilities and obligations relative to the conduct of our business, including our ability to gather content. Such results could have a material adverse effect on our operations, business, financial condition, results of operations, or cash flows.
Our operations have been affected by a range of external factors related to the COVID-19 pandemic that are not within our control. For example, many jurisdictions have imposed a wide range of restrictions on the physical movement of our employees and vendors to limit the spread of COVID-19. If the COVID-19 pandemic has a substantial impact on our employees' or vendors' attendance or productivity, our operations, including our ability to gather content, may suffer, and in turn our results of operations and overall financial performance may be impacted. Furthermore, if our employees incur substantial medical expenses due to COVID-19, our expenses may increase due to our self-funded employee medical insurance model. Our management is focused on mitigating the effects of COVID-19 on our business, which has required and will continue to require a substantial investment of their time and may delay their other efforts. The impact of COVID-19, and the volatile regional and global economic conditions stemming from the pandemic, may also increase the severity or likelihood of the other risks described in this Item, any of which could have a material effect on us.
We closely monitor the impact of the COVID-19 pandemic and continually assess its potential effects on our business. Given the dynamic nature of these circumstances, the full impact of the COVID-19 pandemic cannot be reasonably estimated at this time. The extent to which our business, financial condition, results of operations, or cash flows are affected by COVID-19 will depend in part on future developments which cannot be accurately predicted and are uncertain, as there are no comparable recent events that provide guidance as to the potential effect of the spread of a global pandemic. The impact of the COVID-19 pandemic depends upon various uncertainties, including the ultimate geographic spread of the virus, the severity of the virus, the duration of the outbreak, and actions that may be taken by governmental authorities to contain the virus. This situation is changing continually, and additional effects may arise that we are not presently aware of or that we currently do not consider to be significant risks to our operations. If we are not able to respond to and manage the impact of such events effectively, our business and financial condition could be negatively impacted. Refer to Management’s Discussion and Analysis of Financial Condition and Results of Operations - COVID-19 Update for additional information.
Legal & Regulatory Risks
Legislative and regulatory changes in the environments in which we and our clients operate
As a business, we are subject to numerous laws and regulations in the U.S. and in the other countries in which we operate. These laws, rules, and regulations, and their interpretations, may change in the future or conflict, and compliance with these changes may increase our costs or cause us to make changes in or otherwise limit our business practices. In addition, the global nature and scope of our business operations make it more difficult to monitor areas that may be subject to regulatory and compliance risk. If we fail to comply with any applicable law, rule, or regulation, we could be subject to claims and fines and suffer reputational damage. Uncertainty caused by political change globally, and complex relationships across countries, including the U.S. and nations in Europe and Asia, heightens the risk of regulatory uncertainty.
Many of our clients operate within a highly regulated environment and must comply with governmental legislation and regulations. The U.S. regulators have increased their focus on the regulation of the financial services industry. Increased regulation of our clients may increase their expenses, causing them to seek to limit or reduce their costs from outside services
such as ours. Additionally, if our clients are subjected to investigations or legal proceedings they may be adversely impacted, possibly leading to their liquidation, bankruptcy, receivership, reduction in assets under management, or diminished operations, which would adversely affect our revenue. Recent regulatory changes that we believe might materially impact us and our clients include:
MiFID
In the European Union, the new version of the Markets in Financial Instruments Directive (recast), also known as "MiFID II" became effective in January 2018. MiFID II built upon many of the initiatives introduced through MiFID and is intended to help improve the functioning of the European Union single market by achieving a greater consistency of regulatory standards. MiFID originally became effective in 2007. We believe that compliance with MiFID II requirements is time-consuming and costly for the investment managers who are subject to it and will cause clients to adapt their pricing models and business practices significantly. These increased costs may impact our clients’ spending and may cause some investment managers to lose business or withdraw from the market, which may adversely affect demand for our services. However, MiFID II may also present us with new business opportunities for new service offerings. We continue to monitor the impact of MiFID II on the investment process and trade lifecycle. We also continue to review the application of key MiFID II requirements and plan to work with our clients to navigate through them.
Brexit
On January 31, 2020, the United Kingdom formally left the European Union when the UK-EU Withdrawal Agreement became effective. Under the Withdrawal Agreement, a transition period began and will run until December 31, 2020 (but could be extended). The UK and the EU are currently in the process of negotiating a UK-EU free trade deal and the terms of their future relationship, but have so far not been able to finalize their future arrangement. The deadline for these negotiations is the expiry of the transition period and the UK government has made it clear that it will not ask to extend the transition period. At this time, we cannot predict the impact that the future UK-EU arrangements will have on our business and our clients, as it will depend on the longer-term outcome of tariff, trade, regulatory and other negotiations. Although the results of these negotiations are currently unknown, it is possible that new terms may adversely affect our operations and financial results. While we evaluate our own risks and uncertainty related to Brexit, we continue to partner with our clients to help them navigate the fluctuating international markets. This uncertainty may have an impact on our clients’ expansion or spending plans, which may in turn negatively impact our revenue or growth.
Adverse resolution of litigation or governmental investigations
We are party to lawsuits in the normal course of our business. Litigation and governmental investigations can be expensive, lengthy and disruptive to normal business operations. Moreover, the results of complex legal proceedings are difficult to predict. Unfavorable resolution of lawsuits could have a material adverse effect on our business, operating results or financial condition. For additional information regarding legal matters, see Item 3. Legal Proceedings, of this Annual Report on Form 10-K.
Third parties may claim we infringe upon their intellectual property rights or may infringe upon our intellectual property rights
We may receive notice from others claiming that we have infringed upon their intellectual property rights. Responding to these claims may require us to enter into royalty and licensing agreements on unfavorable terms, incur litigation costs, enter into settlements, stop selling or redesign affected products, or pay damages and satisfy indemnification commitments with our clients or suppliers under contractual provisions of various license arrangements. Additionally, third parties may copy, infringe or otherwise profit from the unauthorized use of our intellectual property rights, requiring us to litigate to protect our rights. Certain countries may not offer adequate protection of proprietary rights. If we are required to defend ourselves or assert our rights or take such actions mentioned, our operating margins may decline as a result. We have incurred, and expect to continue to incur, expenditures to acquire the use of technology and intellectual property rights as part of our strategy to manage this risk.
Additional cost due to tax assessments resulting from ongoing and future audits by tax authorities as well as changes in tax laws
In the ordinary course of business, we are subject to changes in tax laws as well as tax examinations by various governmental tax authorities. The global and diverse nature of our business means that there could be additional examinations by governmental tax authorities and the resolution of ongoing and other probable audits which could impose a future risk to the results of our business. In August 2019, we received a Notice of Intent to Assess (the "Notice") additional sales taxes, interest and underpayment penalties from the Commonwealth of Massachusetts Department of Revenue relating to prior tax periods. The Notice follows FactSet’s previously disclosed response to a letter from the Commonwealth requesting additional sales
information. Based upon a preliminary review of the Notice, we believe the Commonwealth may assess sales tax, interest and underpayment penalties on previously recorded sales transactions. We intend to contest any such assessment, if assessed, and continue to cooperate with the Commonwealth’s inquiry. Due to uncertainty surrounding the assessment process, we are unable to reasonably estimate the ultimate outcome of this matter and, as such, have not recorded a liability as of August 31, 2020. We believe that we ultimately will prevail if we are presented with a formal assessment; however, if we do not prevail, the amount could have a material impact on our consolidated financial position, cash flows and results of operations.
Changes in tax laws or the terms of tax treaties in a jurisdiction where we are subject to tax could increase our taxes payable. On December 22, 2017, the U.S. Tax Cuts and Jobs Act, ("TCJA") was signed into law. The TCJA enacted broad changes to the U.S. Internal Revenue code, including reducing the federal corporate income tax rate from 35% to 21%, among many other complex provisions. The ultimate impact of such tax reform may differ from our current estimate due to changes in interpretations and assumptions made by us, as well as the issuance of further regulations or guidance, or further legislative changes to the U.S. Internal Revenue code.
Financial Market Risks
Exposure to fluctuations in currency exchange rates and the failure of hedging arrangements
Due to the global nature of our operations, we conduct business outside the U.S. in several currencies including the British Pound Sterling, Euro, Indian Rupee, and Philippine Peso. To the extent our international activities increase in the future, our exposure to fluctuations in currency exchange rates may increase as well. To manage this exposure, we utilize derivative instruments (such as foreign currency forward contracts). By their nature, all derivative instruments involve elements of market and credit risk. The market risk associated with these instruments resulting from currency exchange movements is expected to offset the market risk of the underlying transactions, assets and liabilities being hedged. Credit risk is managed through the continuous monitoring of exposure to the counterparties associated with these instruments. Our primary objective in holding derivatives is to reduce the volatility of earnings with changes in foreign currency. Although we believe that our foreign exchange hedging policies are reasonable and prudent under the circumstances, our attempt to hedge against these risks may not be successful, which could cause an adverse impact on our results of operations.
Business performance may not be sufficient to meet financial guidance or publicly disclosed long-term targets
We provide public, full-year financial guidance based upon assumptions regarding our expected financial performance, including our ability to grow revenue and organic ASV plus professional services, to meet our planned expenses and maintain a certain tax rate, and our ability to achieve our profitability targets. We can provide no assurances that we will be able to maintain the levels of growth and profitability that we have experienced in the past, or that our growth strategies will be successful. If we are unable to successfully execute on our strategies to achieve our growth objectives and retain our existing clients, or if we experience higher than expected operating costs or taxes, we risk not meeting our full-year financial guidance or may find it necessary to revise such guidance during the year.
ITEM 1B. UNRESOLVED STAFF COMMENTS
None.
ITEM 2. PROPERTIES
Our corporate headquarters is located at 45 Glover Avenue in Norwalk, Connecticut. We lease our headquarters location, which is 173,164 square feet, and also lease the other locations listed in the table below. We have data content collection offices located in India, the Philippines and Latvia. Additionally, we have data centers that support our technological infrastructure located in New Jersey and Virginia.
We believe the amount of leased space as of August 31, 2020 is adequate for our current needs and that additional space can be available to meet any future needs.
| | | | | |
| Segment | Leased Location |
| | |
Americas | Austin, Texas |
| Boston, Massachusetts |
| Chicago, Illinois |
| Jackson, Wyoming |
| Los Angeles, California |
| Manchester, New Hampshire |
| Minneapolis, Minnesota |
| New York, New York |
| Norwalk, Connecticut |
| Piscataway, New Jersey |
| Reston, Virginia |
| San Francisco, California |
| Sao Paulo, Brazil |
| Toronto, Canada |
| Youngstown, Ohio |
| |
| |
EMEA | Amsterdam, the Netherlands |
| Avon, France |
| Cologne, Germany |
| Dubai, United Arab Emirates |
| Frankfurt, Germany |
| Gloucester, England |
| Johannesburg, South Africa |
| London, England |
| Luxembourg City, Luxembourg |
| Madrid, Spain |
| Milan, Italy |
| Paris, France |
| Riga, Latvia |
| Sofia, Bulgaria |
| Zurich, Switzerland |
| |
Asia Pacific | Chennai, India |
| Hong Kong, China |
| Hyderabad, India |
| Manila, the Philippines |
| Melbourne, Australia |
| Mumbai, India |
| Shanghai, China |
| Singapore |
| Sydney, Australia |
| Tokyo, Japan |
ITEM 3. LEGAL PROCEEDINGS
From time to time, we are subject to legal proceedings, claims and litigation arising in the ordinary course of business, including intellectual property litigation. Based on currently available information, our management does not believe that the ultimate outcome of these unresolved matters against FactSet, individually or in the aggregate, is likely to have a material adverse effect on our consolidated financial position, annual results of operations or annual cash flows. However, these matters are subject to inherent uncertainties and management’s view of these matters may change in the future.
ITEM 4. MINE SAFETY DISCLOSURES
Not applicable.
Part II
ITEM 5. MARKET FOR REGISTRANT’S COMMON EQUITY, RELATED STOCKHOLDER MATTERS AND ISSUER PURCHASES OF EQUITY SECURITIES
(a)Market Information, Holders and Dividends
Market Information – Our common stock is listed on the NYSE and NASDAQ under the symbol FDS. The following table sets forth, for each fiscal period indicated, the high and low sales prices per share of our common stock as reported on the NYSE:
| | | | | | | | | | | | | | | | | | | | | | | |
| | First | | Second | | Third | | Fourth |
| 2020 | | | | | | | |
| High | $ | 289.98 | | | $ | 310.25 | | | $ | 307.97 | | | $ | 363.64 | |
| Low | $ | 233.09 | | | $ | 275.12 | | | $ | 195.22 | | | $ | 279.01 | |
| | | | | | | |
| 2019 | | | | | | | |
| High | $ | 237.29 | | | $ | 237.95 | | | $ | 284.32 | | | $ | 305.38 | |
| Low | $ | 210.11 | | | $ | 188.31 | | | $ | 228.43 | | | $ | 266.06 | |
Holders of Record – As of October 22, 2020, we had approximately 2,604 holders of record of our common stock. However, because many of our shares of common stock are held by brokers and other institutions on behalf of stockholders, we are unable to estimate the total number of stockholders represented by these record holders. The closing price of our common stock on October 22, 2020, was $327.97 per share as reported on the NYSE.
Dividends - During fiscal years 2020 and 2019, our Board of Directors declared the following dividends on our common stock:
| | | | | | | | | | | | | | | | | |
| Year Ended | Dividends per
Share of
Common Stock | Record Date | | Total $ Amount (in thousands) | Payment Date |
| Fiscal 2020 | | | | | |
| First Quarter | $ | 0.72 | | November 29, 2019 | | $ | 27,291 | | December 19, 2019 |
| Second Quarter | $ | 0.72 | | February 28, 2020 | | $ | 27,251 | | March 19, 2020 |
| Third Quarter | $ | 0.77 | | May 29, 2020 | | $ | 29,189 | | June 18, 2020 |
| Fourth Quarter | $ | 0.77 | | August 31, 2020 | | $ | 29,283 | | September 17, 2020 |
| | | | | |
| Fiscal 2019 | | | | | |
| First Quarter | $ | 0.64 | | November 30, 2018 | | $ | 24,372 | | December 18, 2018 |
| Second Quarter | $ | 0.64 | | February 28, 2019 | | $ | 24,385 | | March 19, 2019 |
| Third Quarter | $ | 0.72 | | May 31, 2019 | | $ | 27,506 | | June 18, 2019 |
| Fourth Quarter | $ | 0.72 | | August 30, 2019 | | $ | 27,445 | | September 19, 2019 |
Future dividend payments will depend on our earnings, capital requirements, financial condition and other factors considered relevant by us, and is subject to final determination by our Board of Directors.
(b) Recent Sales of Unregistered Securities
There were no sales of unregistered equity securities during fiscal 2020.
(c)Issuer Purchases of Equity Securities
The following table provides a month-to-month summary of the share repurchase activity under our current share repurchase program during the three months ended August 31, 2020:
(in thousands, except per share data)
| | | | | | | | | | | | | | | | | | | | | | | | | | |
| Period | Total number of shares purchased(1) | | Average
price paid per
share | | Total number of shares purchased as part of
publicly announced plans or programs | | Maximum number of shares (or approximate dollar value) that may yet be purchased under the plans or programs(2) | |
| June 2020 | 2,940 | | | $ | 328.47 | | | — | | | $ | 287,616 | |
|
| July 2020 | 47,428 | | | $ | 344.03 | | | 46,480 | | | $ | 271,616 | | |
| August 2020 | 37,295 | | | $ | 355.76 | | | 35,468 | | | $ | 258,995 | | |
| | 87,663 | | | | | 81,948 | | | | |
(1)Includes 81,948 shares purchased under the existing share repurchase program, as well as 5,715 shares repurchased from employees to cover their cost of taxes due upon the vesting or exercise of stock-based awards.
(2)Repurchases may be made from time to time in the open market and privately negotiated transactions, subject to market conditions. No minimum number of shares to be repurchased has been fixed. There is no timeframe to complete the share repurchase program and it is expected that share repurchases will be paid using existing and future cash generated by operations.
Securities Authorized for Issuance under Equity Compensation Plans – refer to Item 12. Security Ownership of Certain Beneficial Owners and Management and Related Stockholder Matters of this Annual Report on Form 10-K.
Stock Performance Graph
The annual changes for the five-year period shown in the graph below assume $100 had been invested in our common stock, the Standard & Poor’s 500 Index, the NYSE Composite Index, the Dow Jones U.S. Financial Services Index, and the S&P 500 Financial Exchange and Data Index on August 31, 2015, or the origination date of each respective index. We are adding the S&P 500 Financial Exchange and Data Index as a comparison peer group this year, in lieu of the NYSE Composite Index, as we believe it is reflective of the stock performance of other companies that provide services similar to ours and will provide a more meaningful comparison of our stock performance to investors. The NYSE Composite Index is shown below for comparison purposes in the transitional year.
The total cumulative dollar returns shown on the graph represent the value that such investments would have had on August 31, 2020. Stockholder returns over the indicated period are based on historical data and should not be considered indicative of future stockholder returns.
| | | | | | | | | | | | | | | | | | | | |
| | 2015 | 2016 | 2017 | 2018 | 2019 | 2020 |
| FactSet Research Systems Inc. | $ | 100 | | $ | 113 | | $ | 100 | | $ | 145 | | $ | 172 | | $ | 222 | |
| S&P 500 Index | $ | 100 | | $ | 110 | | $ | 125 | | $ | 147 | | $ | 148 | | $ | 177 | |
| NYSE Composite Index | $ | 100 | | $ | 106 | | $ | 117 | | $ | 128 | | $ | 125 | | $ | 128 | |
| Dow Jones U.S. Financial Services Index | $ | 100 | | $ | 101 | | $ | 127 | | $ | 154 | | $ | 148 | | $ | 143 | |
| S&P 500 Financial Exchanges and Data | | $ | 100 | | $ | 119 | | $ | 155 | | $ | 191 | | $ | 222 | |
The information contained in the above graph shall not be deemed to be soliciting material or filed or incorporated by reference in future filings with the SEC, or subject to the liabilities of Section 18 of the Securities Exchange Act of 1934, except to the extent that FactSet specifically incorporates it by reference into a document filed under the Securities Act of 1933 or the Securities Exchange Act of 1934.
ITEM 6. SELECTED FINANCIAL DATA
The following selected financial data has been derived from our Consolidated Financial Statements. This financial data should be read in conjunction with Item 7. Management’s Discussion and Analysis of Financial Condition and Results of Operations and Item 8. Financial Statements and Supplementary Data, of this Annual Report on Form 10-K.
Consolidated Statements of Income Data
| | | | | | | | | | | | | | | | | |
| For the year ended August 31, |
| (in thousands, except per share data) | 2020 | 2019 | 2018 | 2017 | 2016 |
| Revenue | $ | 1,494,111 | | $ | 1,435,351 | | $ | 1,350,145 | | $ | 1,221,179 | | $ | 1,127,092 | |
| Operating income | $ | 439,660 | | $ | 438,035 | | $ | 366,204 | | $ | 352,135 | | $ | 349,676 | |
| Provision for income taxes | $ | 54,196 | | $ | 69,175 | | $ | 84,753 | | $ | 86,053 | | $ | 122,178 | |
| Net income | $ | 372,938 | | $ | 352,790 | | $ | 267,085 | | $ | 258,259 | | $ | 338,815 | |
| Diluted earnings per common share | $ | 9.65 | | $ | 9.08 | | $ | 6.78 | | $ | 6.51 | | $ | 8.19 | |
| Diluted weighted average common shares | 38,646 | | 38,873 | | 39,377 | | 39,642 | | 41,365 | |
| Cash dividends declared per common share | $ | 2.98 | | $ | 2.72 | | $ | 2.40 | | $ | 2.12 | | $ | 1.88 | |
Consolidated Balance Sheets Data
| | | | | | | | | | | | | | | | | |
| As of August 31, |
| (in thousands) | 2020 | 2019 | 2018 | 2017 | 2016 |
| Cash and cash equivalents | $ | 585,605 | | $ | 359,799 | | $ | 208,623 | | $ | 194,731 | | $ | 228,407 | |
| Accounts receivable, net of reserves | $ | 155,011 | | $ | 146,309 | | $ | 156,639 | | $ | 148,331 | | $ | 97,797 | |
| Goodwill and intangible assets, net | $ | 830,798 | | $ | 810,177 | | $ | 850,768 | | $ | 881,103 | | $ | 546,076 | |
| Total assets | $ | 2,083,388 | | $ | 1,560,130 | | $ | 1,419,447 | | $ | 1,413,315 | | $ | 1,019,161 | |
| Non-current liabilities | $ | 910,720 | | $ | 668,951 | | $ | 672,413 | | $ | 652,485 | | $ | 343,570 | |
| Total stockholders’ equity | $ | 896,375 | | $ | 672,256 | | $ | 525,900 | | $ | 559,691 | | $ | 517,381 | |
The items described below (pre-tax) represent a significant impact to the presentation and comparability of our selected financial data.
•During fiscal 2020, the Company recorded a $16.5 million impairment charge to reflect the estimated fair value of an investment in a company, expenses of $14.8 million related to professional fees associated with infrastructure upgrades and our ongoing multi-year investment plan, and $4.3 million of facilities costs. The facilities costs related to duplicate rent associated with the build-out of the new Norwalk, Connecticut headquarters while we still occupied our then-current Norwalk, Connecticut headquarters.
•During fiscal 2019, the Company recorded $5.0 million in non-core transaction related revenue. The Company also recorded expenses of $4.3 million in severance costs and $8.7 million related to other corporate actions including stock-based compensation acceleration, professional fees related to infrastructure upgrade activities, and a one-time adjustment related to data costs and occupancy costs.
•During fiscal 2018, the Company recorded expenses of $17.4 million in restructuring actions, $4.7 million related to other corporate actions, including stock-based compensation acceleration, and $4.9 million in legal matters.
•During fiscal 2017, the Company recorded expenses of $5.6 million related to modifications of certain share-based compensation grants, $5.0 million related to restructuring actions and $7.4 million in acquisition-related expenses.
•During fiscal 2016, the Company recorded expenses of $4.6 million related primarily to legal matters, $2.8 million from restructuring actions and $1.8 million related to a change in the vesting of performance-based equity options.
ITEM 7. MANAGEMENT’S DISCUSSION AND ANALYSIS OF FINANCIAL CONDITION AND RESULTS OF OPERATIONS
This Management’s Discussion and Analysis of Financial Condition and Results of Operations should be read in conjunction with the Consolidated Financial Statements and related Notes included in Item 8. Financial Statements and Supplementary Data, of this Annual Report on Form 10-K. For a similar detailed discussion comparing fiscal 2019 and 2018, refer to Item 7. Management's Discussion and Analysis of Financial Condition and Results of Operations within the Company's Annual Report on Form 10-K for the year ended August 31, 2019. This discussion contains forward-looking statements that involve risks and uncertainties. Our actual results could differ materially from those discussed below. Factors that could cause such differences include, but are not limited to, those identified below and those discussed in Item 1A. Risk Factors of this Annual Report on Form 10-K.
Management’s Discussion and Analysis of Financial Condition and Results of Operations ("MD&A") is designed to provide a reader of our financial statements with a narrative from the perspective of our management on our financial condition, results of operations, liquidity and certain other factors that may affect our future results. Our MD&A is presented in the following sections:
•Executive Overview
•Key Metrics
•Results of Operations
•Liquidity and Capital Resources
•Off-Balance Sheet Arrangements
•Foreign Currency
•Critical Accounting Policies and Estimates
•New Accounting Pronouncements
Executive Overview
FactSet is a global provider of integrated financial information, analytical applications and industry-leading services for the investment and corporate communities. For over 40 years, global financial professionals have utilized our content and multi-asset class solutions across each stage of the investment process. Our goal is to provide a seamless user experience spanning idea generation, research, portfolio construction and analysis, trade execution, performance measurement, risk management, and reporting, in which we serve the front, middle, and back offices to drive productivity and improved performance. Our flexible, open data and technology solutions can be implemented both across the investment portfolio lifecycle or as standalone components serving different workflows in the organization. We are focused on growing our business through three segments: the Americas, EMEA and Asia Pacific. Within each of our segments, we primarily deliver insight and information through our four workflow solutions of Research, Analytics and Trading, CTS and Wealth.
We currently serve a wide range of financial professionals, which include but are not limited to, portfolio managers, investment research professionals, investment bankers, risk and performance analysts, wealth advisors, and corporate clients. We provide both insights on global market trends and intelligence on companies and industries, as well as capabilities to monitor portfolio risk and performance and execute trades. We combine dedicated client service with open and flexible technology offerings, such as a configurable desktop and mobile platform, comprehensive data feeds, an open marketplace, digital portals and APIs. Our revenue is primarily derived from subscriptions to products and services such as workstations, portfolio analytics, enterprise data, and research management.
Business Strategy
Current technology trends are leading to a greater demand to deliver a fully digital and integrated client experience. To take advantage of these developments we have focused our innovations and strategic investments in cloud computing, data lakes, APIs and our hosted proprietary data and analytics platform to provide real-time, predictive business intelligence for a seamless client experience. We continue to expand our broad financial content to provide support for our clients' most sophisticated investment strategies including enhanced data in private markets, industry specific deep sector and ESG. As a premier financial solutions provider for the global financial community, we provide workflow solutions and leading analytical applications, powered by cognitive capabilities and robust technology, across the investment portfolio lifecycle. We bring the front, middle and back offices together to drive productivity and performance at every step of the investment process using our open and scalable solutions. Our strategy is focused on growing our business in each of our three segments: the Americas, EMEA, and
Asia Pacific. We believe this geographical strategic alignment helps us better manage our resources. To execute on our business strategy of broad-based growth across each geographical segment, we continue to look at ways to create value for our clients by offering data, products and analytical applications within our four workflow solutions of Research, Analytics and Trading, CTS and Wealth.
Fiscal 2020 Year in Review
Revenue for the fiscal year 2020 was $1.49 billion, an increase of 4.1% from the prior year. This increase was due to growth across all our operating segments, primarily in the Americas, followed by EMEA and Asia Pacific, supported by increased revenue from each of our workflow solutions, mainly in Analytics and Trading, followed by CTS and Wealth. Revenue also increased due to the benefit from our annual price increase. The revenue growth of 4.1% was fully attributed to organic revenue growth, which excludes the effects of acquisitions and dispositions completed in the last 12 months, changes in foreign currency rates in all periods presented and the deferred revenue fair value adjustments from purchase accounting (Refer to Results of Operations, Non-GAAP Financial Measures in this MD&A for further discussion on organic revenue). As of August 31, 2020, organic annual subscription value ("organic ASV") plus professional services totaled $1.56 billion, an increase of 5.3% over the prior year.
Operating income increased by 0.4% and diluted earnings per share ("EPS") increased 6.3% compared to the prior year. This increase in operating income and EPS was primarily driven by revenue growth of 4.1%, a decrease in non-compensatory employee related expenses and a reduction in bad debt expense. This increase was partially offset by higher spend in employee compensation, including stock-based compensation, increased computer-related expenses, the impairment of an investment and increased professional fees on a year-over-year basis. Additionally, EPS benefited from a reduction in the income tax provision, interest expense and diluted weighted average shares outstanding, compared to the prior year period.
Our clients and users reached new highs of 5,875 and 133,051, respectively, in fiscal 2020. Over the last 12 months, we returned $310.1 million to stockholders in the form of share repurchases and dividends.
As of August 31, 2020, our employee count was 10,484, up 8.3% in the past 12 months, due primarily to an increase in net new employees of 9.8% in Asia Pacific, 6.4% in EMEA, and 5.4% in the Americas. Of our total employees, as of August 31, 2020, 6,643 were located in Asia Pacific, 2,477 were located in the Americas and 1,364 were located in EMEA. Our centers of excellence, located in India and the Philippines, primarily focus on content collection that benefit all our segments.
FactSet garnered many awards in 2020, with honors covering every aspect of the Company's business. Highlights include: Buy-Side Market Risk Management Product of the Year from the Risk.net Markets Technology Awards; Best EMS from the Markets Media Markets Choice Awards; Best Client Reporting Solution from the FTF News Technology Innovation Awards; Best Technology Provider, Client Portals, from the Wealthmanagement.com Awards; and various awards including Best Data Provider to the Buy-Side, Best Data Provider to the Sell-Side, and Best Buy-Side Data Analytics Tool organized by Waters Technology.
Client Service / Customer Success
An important part of our comprehensive value to clients is our Customer Success team, a versatile group of business-people with knowledge of financial markets and FactSet's solutions. Customer Success Managers work closely with our clients, advising them on how FactSet's solutions can best be leveraged to enhance efficiency across workflows. Additionally, our information and analytical applications are supported by a team of financial data and modeling experts, who take a consultative approach to fully understand our clients’ challenges and advise them on how FactSet solutions can best be tailored and leveraged to meet each client's unique objectives and strategies.
A client-centric approach is foundational to the Company's ongoing achievements. Client satisfaction is therefore critical to how we measure the success our success. According to our global client satisfaction survey, greater than 93% of respondents were satisfied or very satisfied with FactSet’s support. We believe that these strong relationships help ensure continued high rates of retention and account expansion.
COVID-19 Update
A novel strain of coronavirus, now known as COVID-19 ("COVID-19"), was first reported in December 2019, and it has since extensively impacted the global health and economic environment, with the World Health Organization characterizing COVID-19 as a pandemic on March 11, 2020. The COVID-19 virus has spread to nearly all regions in the world, creating significant uncertainties and disruption in the global economy.
We closely monitor pandemic-related developments, and our highest priority is the health and safety of our employees, clients, vendors and stakeholders. We have taken, and continue to take, numerous steps to address the COVID-19 pandemic. We have implemented a business continuity plan with a dedicated incident management team to respond quickly and effectively to changes in our environment to continue offering our clients uninterrupted products, services and support while also protecting our employees. We will continue to coordinate our COVID-19 response based on guidance from global health organizations, relevant governments and pandemic response best practices.
We have required the vast majority of our employees at our offices across the globe (including our corporate headquarters) to work remotely on a temporary basis and have implemented global travel restrictions for our employees. Nearly all our employees are currently working remotely. We believe our transition to remote working has been successful and has not significantly affected our financial results for the fiscal year ended August 31, 2020.
We are planning to re-open many of our offices during fiscal 2021, utilizing a three-phased approach to provide flexibility for employees with a focus on social distancing and safety. Our offices will not re-open until local authorities permit us to do so and our own criteria and conditions to ensure employee health and safety are satisfied. There can be no assurances as to when we re-open our offices or that there will be no negative impacts arising from the return to the office environment.
As of August 31, 2020, there have been minimal interruptions in our ability to provide our products, services and support to our clients. Working remotely has had relatively little impact on the productivity of our employees, including our ability to gather content. We continue to work closely with our clients to provide consistent access to our products and services and have remained flexible to achieve client priorities as many implement their own contingency plans. We have increased our support desk resources to manage increased volumes and have extended additional web IDs to our clients in need of immediate remote access to financial data.
We have not observed any significant client loss, deterioration in the collectability of receivables, reduction in liquidity, or decline in subscription renewal rates as a result of the COVID-19 pandemic. Our revenue, earnings, and ASV are relatively stable and predictable as a result of our subscription-based business model. To date, we have not seen the COVID-19 pandemic having a material impact on our revenue or ASV, although we anticipate that there may be some level of revenue and ASV weakness going forward due to longer sales cycles and lower incremental client billings. The COVID-19 pandemic could curtail our clients’ spending and lead them to delay or defer purchasing decisions or product and service implementations or may cause them to cancel or reduce their spending with us. In determining the possible revenue and ASV impact from the COVID-19 pandemic, we consider the potential delay in decision making causing longer sales cycles (or conversely delayed cancellations from clients); implementation risk due to restrictions on being able to work onsite at our clients' facilities; and possible reduced seasonal hiring at investment banks, which are some of our largest clients, over the summer months.
We have incurred, and expect to continue to incur, additional expenses in response to the COVID-19 pandemic, including costs to enable our employees to support our clients while working remotely. These additional expenses were not material to our fiscal 2020 results, and reductions in discretionary spending, particularly travel and entertainment, have more than offset these increased expenses. We believe that implementing additional cost reduction efforts will help us mitigate the impact that any reduced revenues may have on our future operating income. We may consider reducing expenses further through such methods as reduction of discretionary spending, including travel and entertainment; tighter management of headcount spending; and reduction in variable third-party content costs in a manner consistent with client demand.
On March 27, 2020, the Coronavirus Aid, Relief, and Economic Security ("CARES") Act was signed into law to address the economic impact of the COVID-19 pandemic. We continue to monitor any effects that may result from the CARES Act and other similar legislation or actions in geographies in which our business operates.
Refer to Item 1A. Risk Factors of this Annual Report on Form 10-K for further discussion of the potential impact of the COVID-19 pandemic on our business.
Key Metrics
The table below provides a reconciliation of ASV to organic ASV:
| | | | | | | | | | | | | | |
| As of August 31, |
| (in millions) | 2020 | | 2019 | Change |
ASV(1) | $ | 1,539.2 | | | $ | 1,458.0 | | |
| Currency impact to ASV | (4.7) | | | — | | |
| Organic ASV | $ | 1,534.5 | | | $ | 1,458.0 | | 5.2 | % |
(1)ASV at any given point in time represents the forward-looking revenue for the next 12 months from all subscription services currently being supplied to clients and excludes professional service fees, which are not subscription-based.
Organic ASV Growth
As of August 31, 2020, our organic ASV totaled $1.53 billion, up 5.2% over the prior year comparable period. With proper notice provided to us, our clients can add to, delete portions of, or terminate service, subject to certain contractual limitations.
The increase in year-over-year organic ASV was due to growth across all of our geographic segments from increased sales of products and solutions to new and existing clients. The majority of the organic ASV increase related to increased sales in the Americas, followed by increased sales in EMEA and Asia Pacific, as well as the benefit from our annual price increase, partially offset by cancellations. The increase in organic ASV was due to growth in all our workflow solutions, driven mainly by an increase in Analytics and Trading, followed by CTS and Wealth. The organic ASV increase in Analytics and Trading was mainly due to increased sales for our risk management and portfolio reporting solutions. The increase in organic ASV from CTS was primarily driven by increased sales in premium and core data feeds, while the organic ASV increase in Wealth was mainly due to increased traditional and web-based workstation sales.
As of August 31, 2020, organic ASV plus professional services was $1.56 billion, an increase of 5.3% compared to the prior year period. The professional service fees were $25.0 million and $22.9 million as of August 31, 2020 and 2019, respectively.
Segment ASV
As of August 31, 2020, ASV from the Americas was $956.6 million, an increase of 5.2% from the prior year period. This increase was primarily due to increased sales from Analytics and Trading and CTS, as well as the benefit from our annual price increase, partially offset by cancellations.
ASV from EMEA was $426.0 million as of August 31, 2020, an increase of 5.7% compared to the prior year period. The ASV increase in EMEA was primarily driven by Analytics and Trading and CTS and the benefit from our annual price increase, partially offset by cancellations.
Asia Pacific ASV was $156.5 million as of August 31, 2020, an increase of 7.6% compared to the prior year period. ASV increased in Asia Pacific mainly due to Analytics and Trading and CTS, as well as the benefit from our annual price increase, partially offset by cancellations.
Combined EMEA and Asia Pacific ASV represented 37.8% of total ASV as of August 31, 2020, up from 37.6% in the prior year period.
Buy-side and Sell-side ASV Growth
Buy-side and sell-side ASV growth rates for the last 12 months were 5.4% and 4.6%, respectively. Buy-side clients account for approximately 84% of organic ASV, and primarily include portfolio managers, analysts, traders, wealth managers, performance teams and risk and compliance teams at a variety of firms, such as traditional asset managers, wealth advisors, corporations, hedge funds, insurance companies, plan sponsors and fund of funds. The remaining portion of our organic ASV is derived from sell-side clients, primarily including investment bankers, private equity and research analysts.
Client and User Additions
| | | | | | | | | | | |
| As of and for the
Year Ended August 31, |
| 2020 | 2019 | Change |
| Clients | 5,875 | | 5,574 | | 5.4 | % |
| Users | 133,051 | | 126,822 | | 4.9 | % |
Our total client count was 5,875 as of August 31, 2020, representing a net increase of 301 or 5.4% in the last 12 months. The net increase was primarily driven by an increase in corporate and wealth management clients, partially offset by institutional asset management clients. As part of our long-term growth strategy, we continue to focus on expanding and cultivating relationships with our existing client base through sales of workstations, applications, services and content.
As of August 31, 2020, there were 133,051 professionals using FactSet, representing a net increase of 6,229 or 4.9% in the last 12 months, primarily driven by wealth management and corporate professionals.
Annual client retention was greater than 95% of ASV for the period ended August 31, 2020 and August 31, 2019. When expressed as a percentage of clients, annual retention increased to approximately 90% for the period ended August 31, 2020, compared to approximately 89% for the period ended August 31, 2019. As of August 31, 2020, our largest individual client accounted for approximately 3% of our total subscriptions, and annual subscriptions from our ten largest clients did not surpass 15% of our total client subscriptions.
Returning Value to Stockholders
On August 14, 2020, our Board of Directors approved a regular quarterly dividend of $0.77 per share. The cash dividend of $29.1 million was paid on September 17, 2020 to common stockholders of record at the close of business on August 31, 2020. We repurchased 0.7 million shares of common stock for $199.6 million during fiscal 2020 under our existing share repurchase program. Over the last 12 months, we returned $310.1 million to stockholders in the form of share repurchases and dividends.
On March 24, 2020, our Board of Directors approved a $220.0 million increase to the existing share repurchase program. As a result of this expansion, $259.0 million is available for future share repurchases as of August 31, 2020.
Capital Expenditures
Capital expenditures as of August 31, 2020 were $77.6 million, compared to $59.4 million a year ago. Capital expenditures of $43.6 million, or 56% of our total capital expenditures, were related to facilities investments, primarily for the build-out of our new corporate headquarters in Norwalk, Connecticut, as well as new office space in India and the Philippines. The remainder of our capital expenditures included $17.0 million of investments in technology primarily in Norwalk, Connecticut, as well as in India and the Philippines and $17.0 million in development costs related to internal-use software.
Results of Operations
For an understanding of the significant factors that influenced our performance during fiscal 2020 and 2019, the following discussion should be read in conjunction with the Consolidated Financial Statements and related Notes included in Item 8. of this Annual Report on Form 10-K.
The following table summarizes the results of operations for the periods described:
| | | | | | | | | | | | | | | | | | | | | | | | | | |
| | | Years ended August 31, | | | | |
| (in thousands, except per share data) | | 2020 | | 2019 | | $ Change | | % Change |
| Revenue | | $ | 1,494,111 | | | $ | 1,435,351 | | | $ | 58,760 | | | 4.1 | % |
| Cost of services | | $ | 695,446 | | | $ | 663,446 | | | $ | 32,000 | | | 4.8 | % |
| Selling, general and administrative | | $ | 359,005 | | | $ | 333,870 | | | $ | 25,135 | | | 7.5 | % |
| Operating income | | $ | 439,660 | | | $ | 438,035 | | | $ | 1,625 | | | 0.4 | % |
| Net income | | $ | 372,938 | | | $ | 352,790 | | | $ | 20,148 | | | 5.7 | % |
| Diluted earnings per common share | | $ | 9.65 | | | $ | 9.08 | | | $ | 0.57 | | | 6.3 | % |
| Diluted weighted average common shares | | 38,646 | | | 38,873 | | | | | |
Revenue
Revenue in fiscal 2020 was $1.49 billion, an increase of 4.1% compared to the prior year. The increase in revenue was driven primarily by the Americas, followed by EMEA and Asia Pacific. This increase in segment revenue was supported by increased revenue across all our workflow solutions, most notably by Analytics and Trading, followed by CTS and Wealth, as well as the benefit from our annual price increase and lower cancellations as compared to the prior year. The revenue growth of 4.1% for fiscal 2020 compared to the prior year period was reflective of organic revenue growth of 4.0% and a 10 basis point increase from deferred revenue fair value adjustments from purchase accounting. (Refer to Item 7. Results of Operations, Non-GAAP Financial Measures in the MD&A of this Annual Report on Form 10-K for further discussion on organic revenue).
Revenue by Operating Segment
| | | | | | | | | | | | | | |
| (in thousands) | | Years ended August 31, |
| | 2020 | | 2019 |
Americas | | $ | 929,444 | | | $ | 894,554 | |
| % of revenue | | 62.2 | % | | 62.3 | % |
| EMEA | | $ | 422,203 | | | $ | 408,084 | |
| % of revenue | | 28.3 | % | | 28.5 | % |
| Asia Pacific | | $ | 142,464 | | | $ | 132,713 | |
| % of revenue | | 9.5 | % | | 9.2 | % |
| Consolidated Revenue | | $ | 1,494,111 | | | $ | 1,435,351 | |
Revenues from our Americas segment increased 3.9% to $929.4 million in fiscal 2020 compared to $894.6 million in fiscal 2019. This increase was primarily due to increased sales of products and solutions, particularly in Analytics and Trading and CTS, the benefit from our annual price increase for the majority of our Americas segment clients and a reduction in cancellations on a year-over-year basis. The revenue growth of 3.9% is fully attributed to organic revenue growth. Revenues from our Americas operations accounted for 62% of our consolidated revenue during fiscal 2020, which is consistent with the prior year period.
EMEA revenues increased 3.5% to $422.2 million in fiscal 2020 compared to $408.1 million in fiscal 2019. This increase was primarily driven by increased sales of products and solutions, particularly in Analytics and Trading, the benefit from our annual price increase for the majority of our EMEA clients and a reduction in cancellations on a year-over-year basis. The revenue growth of 3.5% for fiscal 2020 compared to the prior year period was reflective of organic revenue growth of 3.2%, a 10 basis point increase from foreign currency exchange rate fluctuations and a 20 basis point increase from deferred revenue fair value adjustments from purchase accounting.
Asia Pacific revenues increased 7.3% to $142.5 million during fiscal 2020, compared with $132.7 million in fiscal 2019. This increase was due mainly to increased sales of products and solutions, primarily in Analytics and Trading, the benefit from our annual price increase for the majority of our Asia Pacific clients and a reduction in cancellations on a year-over-year basis. The revenue growth of 7.3% for fiscal 2020 compared to the prior year period was reflective of organic revenue growth of 7.2% and a 10 basis point increase from foreign currency exchange rate fluctuations.
Revenue by Workflow Solution
The revenue growth of 4.1% across our operating segments for fiscal 2020 compared to the prior year period was primarily driven by Analytics and Trading, followed by CTS and Wealth, as well as the benefit from our annual price increase and a reduction in cancellations on a year-over-year basis. Revenue growth from Analytics and Trading was primarily due to increased demand for our risk management, portfolio analytics and reporting solutions. The growth in CTS was driven mainly by increased sales of core and premium data feeds. Revenue growth from Wealth was driven mainly by to higher sales of our traditional and web-based workstation product. Offsetting these positive growth factors were cancellations resulting from continued industry-wide cost pressures and firm consolidations.
Operating Expenses
| | | | | | | | | | | | | | | | | | | | | | | | | | |
| (in thousands) | | Years ended August 31, | | | | |
| 2020 | | 2019 | | $ Change | | % Change |
| Cost of services | | $ | 695,446 | | | $ | 663,446 | | | $ | 32,000 | | | 4.8 | % |
| Selling, general and administrative ("SG&A") | | 359,005 | | | 333,870 | | | $ | 25,135 | | | 7.5 | % |
| Total operating expenses | | $ | 1,054,451 | | | $ | 997,316 | | | $ | 57,135 | | | 5.7 | % |
| | | | | | | | |
| Operating income | | $ | 439,660 | | | $ | 438,035 | | | $ | 1,625 | | | 0.4 | % |
| Operating Margin | | 29.4 | % | | 30.5 | % | | | | |
Cost of Services
Cost of services increased 4.8% to $695.4 million in fiscal 2020 compared to $663.4 in fiscal 2019. This increase was primarily due to an increase in computer-related expenses and employee compensation costs, including stock-based compensation.
Cost of services, expressed as a percentage of revenue, was 46.5% during fiscal 2020, an increase of 30 basis points over the prior year period. This cost of service increase was primarily due to higher computer-related expenses, partially offset by a reduction in employee compensation costs and data costs, when expressed as a percentage of revenue. Computer-related expenses increased 150 basis points, primarily driven by increased technology investments, including cloud-based hosting and licensed software arrangements. Employee compensation costs decreased 60 basis points due mainly to higher capitalization of compensation costs related to development of our internal-use software projects, as well as a shift in headcount distribution from higher to lower cost locations. This employee compensation expense decrease was partially offset by higher annual base salaries, a net increase in employee headcount of 803 employees, with the majority of the compensation from new employee headcount included in cost of services, and higher vacation accrual expense. Data costs decreased 40 basis points primarily due to our efforts to control our data cost spend.
Selling, General and Administrative
Selling, general and administrative ("SG&A") expenses increased 7.5% to $359.0 million during fiscal 2020 compared to $333.9 million in fiscal 2019. This increase was primarily due to an impairment on an investment in a company, an increase in employee compensation costs, and professional fees, partially offset by a decrease in non-compensatory employee related expenses and bad debt expense.
SG&A expenses, expressed as a percentage of revenue, were 24.0% in fiscal 2020, an increase of 80 basis points over the prior year period. This SG&A increase was primarily due to an impairment on an investment in a company, an increase in professional fees and higher employee compensation costs, partially offset by a reduction in non-compensatory employee related expenses and bad debt expense. The investment impairment recorded to reflect the estimated fair value of an investment in a company resulted in a 110 basis point increase. Professional fees increased 60 basis points primarily to support our technology plan and business transformation activities. Employee compensation costs increased 40 basis point primarily driven by higher annual base salaries, a net increase in employee headcount, higher variable compensation accrual and higher vacation accrual expense. Non-compensatory employee related expenses, inclusive of travel, entertainment and office expenses,
decreased 110 basis points, mainly due to restrictions and impacts related to the COVID-19 pandemic, partially offset by increased technology investments to support remote work arrangements. Bad debt expense decreased 70 basis points.
Operating Income and Operating Margin
Operating income increased 0.4% to $439.7 million in fiscal 2020 compared to $438.0 million in fiscal 2019. Operating income increased primarily due to revenue growth, inclusive of our annual price increase, a reduction in non-compensatory employee related expenses and a decrease in bad debt expense, partially offset by an increase in computer-related expenses, an impairment of an investment in a company, employee compensation costs, including stock-based compensation, and professional fees. Operating income was positively impacted by movements in foreign currency exchange rates on a year-over-year basis. Our operating margin decreased in fiscal 2020 to 29.4%, compared to 30.5% for fiscal 2019. Operating margin decreased primarily due to the impact from an investment impairment, higher computer-related expenses and an increase in professional fees, partially offset by a decrease in non-compensatory employee related expenses, a reduction in bad debt expense and lower data costs, when expressed as a percentage of revenue.
Segment Information
Reportable Segments
Our operating segments are aligned with how we manage the business, the geographic markets we serve, and how our CODM, the Company's Chief Executive Officer, assesses performance. Our internal financial reporting structure is based on three reportable segments, the Americas, EMEA and Asia Pacific. Within each of our segments, we primarily deliver insight and information through our four workflow solutions of Research, Analytics and Trading, CTS and Wealth.
Each segment records compensation expense (including stock-based compensation), depreciation of furniture and fixtures, amortization of lease ROU assets, leasehold improvements and intangible assets, as well as communication costs, professional fees, rent expense, travel, office and other direct expenses. Expenditures associated with our data centers, third-party data costs and corporate headquarters charges are recorded by the Americas segment and are not allocated to the other segments. The content collection centers, located in India, the Philippines, and Latvia, benefit all our operating segments, and thus the expenses incurred at these locations are allocated to each segment based on a percentage of revenue. Refer to Note 18, Segment Information in the Notes to the Company’s Consolidated Financial Statements included in Item 8. of this Annual Report on Form 10-K for financial information, including revenues, operating income and long-lived assets for each of our segments.
Operating Income by Segment
| | | | | | | | | | | | | | | | | | | | | | | | | | |
| | | Years ended August 31, | | | | |
| (in thousands) | | 2020 | | 2019 | | $ Change | | % Change |
| Americas | | $ | 168,909 | | | $ | 179,374 | | | $ | (10,465) | | | (5.8) | % |
| EMEA | | 179,831 | | | 179,258 | | | $ | 573 | | | 0.3 | % |
| Asia Pacific | | 90,920 | | | 79,403 | | | $ | 11,517 | | | 14.5 | % |
| Total Operating Income | | $ | 439,660 | | | $ | 438,035 | | | $ | 1,625 | | | 0.4 | % |
Americas operating income decreased 5.8% to $168.9 million during fiscal 2020 compared to $179.4 million a year ago. The decrease in Americas operating income was primarily due to an increase in computer-related expenses, an impairment of an investment in a company and higher professional fees, partially offset by revenue growth of 3.9%, inclusive of our annual price increase, a decrease in bad debt expense and a reduction in non-compensatory employee related expenses.
Computer-related expenses increased primarily due to increased technology investments including cloud-based hosting and licensed software arrangements. An investment impairment was recorded to reflect the estimated fair value of an investment in a company. Professional fees increased primarily to support our technology plan and business transformation activities. Non-compensatory employee related expenses, inclusive of travel, entertainment and office expenses, decreased mainly due to restrictions and impacts related to the COVID-19 pandemic, partially offset by increased technology investments to support remote work arrangements.
EMEA operating income increased 0.3% to $179.8 million during fiscal 2020, compared to $179.3 million a year ago. The increase in EMEA operating income was primarily due to revenue growth of 3.5%, inclusive of our annual price increase, a decrease in bad debt expense and a reduction in non-compensatory employee related expenses, partially offset by an increase in employee compensation costs. Operating income was positively impacted by movements in foreign currency exchange rates on a year-over-year basis. Non-compensatory employee related expenses, inclusive of travel, entertainment and office expenses, decreased, mainly due to restrictions and impacts related to the COVID-19 pandemic, partially offset by investment in technology to allow employees to work from home. Employee compensation increased primarily due to a net increase in employee headcount of 6.4% over the past 12 months, annual base salary increases year-over-year, higher variable compensation accrual and higher vacation accrual expense.
Asia Pacific operating income increased 14.5% to $90.9 million during fiscal 2020, compared to $79.4 million a year ago. The increase in Asia Pacific operating income was mainly due to revenue growth of 7.3%, inclusive of our annual price increase, and a reduction in non-compensatory employee related expenses, partially offset by an increase in employee compensation costs and occupancy costs. Operating income was negatively impacted by movements in foreign currency exchange rates on a year-over-year basis. Non-compensatory employee related expenses, inclusive of travel, entertainment and office expenses, decreased, mainly due to restrictions and impacts related to the COVID-19 pandemic, partially offset by investment in technology to allow employees to work from home. Employee compensation increased mainly due to a 9.8% increase in our Asia Pacific workforce in the last 12 months and annual base salary increases year-over-year. Occupancy costs increased mainly due to an increase in facility costs in the Philippines.
Income Taxes, Net Income and Diluted Earnings per Share
| | | | | | | | | | | | | | | | | | | | | | | | | | |
| | | Years ended August 31, | | | | |
| (in thousands) | | 2020 | | 2019 | | $ Change | | % Change |
| Provision for income taxes | | $ | 54,196 | | | $ | 69,175 | | | $ | (14,979) | | | (21.7) | % |
| Net income | | $ | 372,938 | | | $ | 352,790 | | | $ | 20,148 | | | 5.7 | % |
| Diluted earnings per common share | | $ | 9.65 | | | $ | 9.08 | | | $ | 0.57 | | | 6.3 | % |
Income Taxes
The fiscal 2020 provision for income taxes was $54.2 million, compared to $69.2 million in fiscal 2019, a decrease of 21.7%. The decrease was primarily due to a lower effective tax rate in fiscal 2020 compared to the prior year period, driven mainly by higher research and development ("R&D") tax credits and a higher Foreign Derived Intangible Income ("FDII") deduction. The decrease was also driven by a reduction from finalizing prior year tax returns, which resulted in a benefit of $3.7 million in fiscal 2020 compared to an increase to the provision of $7.7 million in fiscal 2019. Additionally, the decrease in the provision was attributed to $1.9 million in higher windfall tax benefits from stock-based compensation for fiscal 2020 compared to fiscal 2019, partially offset by a $3.4 million income tax benefit from the revision of the one-time transition tax permitted by the TCJA recognized during fiscal 2019.
Net Income and Diluted Earnings per Share
Net income increased 5.7% to $372.9 million during fiscal 2020 compared to $352.8 million in fiscal 2019. Diluted earnings per share increased 6.3% to $9.65 in fiscal 2020 compared to $9.08 in fiscal 2019. Net income and diluted EPS increased primarily due to a lower income tax provision, a reduction in interest expense associated with our outstanding debt and higher operating income, partially offset by foreign currency losses. Interest expense decreased compared to the prior year period, primarily due to a reduction in the LIBOR rate. Diluted EPS also benefited from a 0.2 million share reduction in our diluted weighted average shares outstanding, compared to the same period a year ago, mainly due to share repurchases, partially offset by the impact from stock options issued.
Non-GAAP Financial Measures
To supplement the financial measures prepared in accordance with generally accepted accounting principles in the United States ("GAAP"), we use non-GAAP financial measures including organic revenue, adjusted operating margin, adjusted net
income and adjusted diluted earnings per share. The reconciliations of these non-GAAP financial measures to the most directly comparable financial measures calculated and presented in accordance with GAAP are show in the tables below. These non-GAAP financial measures should not be considered in isolation from, as a substitute for, or superior to, financial measures reported in accordance with GAAP. Moreover, these non-GAAP financial measures have limitations in that they do not reflect all the items associated with the operations of the business as determined in accordance with GAAP. Other companies may calculate similarly titled non-GAAP financial measures differently that we do, limiting the usefulness of those measures for comparative purposes.
Despite the limitations of these non-GAAP financial measures, we believe these adjusted financial measures and the information they provide are useful in viewing our performance using the same tools that management uses to gauge progress in achieving our goals. Adjusted measures may also facilitate comparisons to our historical performance.
The table below provides a reconciliation of revenue to organic revenue.
| | | | | | | | | | | | | | | | | |
| | Twelve Months Ended
August 31, |
| (In thousands) | 2020 | | 2019 | | Change |
| Revenue | $ | 1,494,111 | | | $ | 1,435,351 | | | 4.1 | % |
Deferred revenue fair value adjustment(1) | 4,192 | | | 5,185 | | | |
| Currency impact | (705) | | | — | | | |
| Organic revenue | $ | 1,497,598 | | | $ | 1,440,536 | | | 4.0 | % |
(1)Deferred revenue fair value adjustments from purchase accounting.
The table below provides a reconciliation of operating income, operating margin, net income and diluted EPS to adjusted operating income, adjusted operating margin, adjusted net income and adjusted diluted EPS.
| | | | | | | | | | | | | | | | | |
| | Twelve Months Ended
August 31, |
| (In thousands, except per share data) | 2020(1) | | 2019(2) | | Change |
| Operating income | $ | 439,660 | | | $ | 438,035 | | | 0.4 | % |
| Intangible asset amortization | 22,269 | | | 24,920 | | | |
| Deferred revenue fair value adjustment | 4,192 | | | 5,185 | | | |
| Impairment of investment | 16,500 | | | — | | | |
| Other items | 20,782 | | | 8,045 | | | |
| Adjusted operating income | $ | 503,403 | | | $ | 476,185 | | | 5.7 | % |
| Adjusted operating margin | 33.6 | % | | 33.2 | % | | |
| | | | | |
| Net income | $ | 372,938 | | | $ | 352,790 | | | 5.7 | % |
Intangible asset amortization(3) | 17,773 | | | 20,262 | | | |
Deferred revenue fair value adjustment(4) | 3,385 | | | 4,215 | | | |
Impairment of investment(5) | 16,500 | | | — | | | |
Other items(6) | 16,611 | | | 6,315 | | | |
| Income tax items | (7,085) | | | 5,274 | | | |
| Adjusted net income | $ | 420,122 | | | $ | 388,856 | | | 8.0 | % |
| | | | | |
| Diluted earnings per common share | $ | 9.65 | | | $ | 9.08 | | | 6.3 | % |
| Intangible asset amortization | 0.46 | | | 0.52 | | | |
| Deferred revenue fair value adjustment | 0.10 | | | 0.11 | | | |
| Impairment of investment | 0.42 | | | — | | | |
| Other items | 0.42 | | | 0.15 | | | |
| Income tax items | (0.18) | | | 0.14 | | | |
| Adjusted diluted earnings per common share | $ | 10.87 | | | $ | 10.00 | | | 8.7 | % |
| Weighted average common shares (diluted) | 38,646 | | | 38,873 | | | |
(1)Operating income, net income and diluted EPS in fiscal 2020 were adjusted to exclude (i) intangible asset amortization, (ii) deferred revenue fair value adjustments from purchase accounting, (iii) an impairment charge to reflect the estimated fair value of an investment in a company, and (iv) professional fees associated with infrastructure upgrades and our ongoing multi-year investment plan and facilities costs.
(2)Operating income, net income and diluted EPS in fiscal 2019 were adjusted to exclude (i) intangible asset amortization, (ii) deferred revenue fair value adjustments from purchase accounting, and (iii) other items including severance, stock-based compensation acceleration, professional fees for infrastructure upgrade activities, a one-time adjustment related to data costs and occupancy costs, partially offset by non-core transaction related revenue. Net income and diluted EPS in fiscal 2019 were also adjusted to exclude amounts primarily related to finalizing prior year tax returns and other discrete items.
(3)The intangible asset amortization was recorded net of a tax impact of $4.5 million in fiscal 2020 compared with $4.7 million for fiscal 2019.
(4)The deferred revenue fair value adjustment was recorded net of a tax impact of $0.8 million in fiscal 2020 compared with $1.0 million for fiscal 2019.
(5)There was no tax impact during fiscal 2020 resulting from the impairment of an investment in a company.
(6)The other items were recorded net of a tax impact of $4.2 million in fiscal 2020 compared with $1.7 million for fiscal 2019.
Liquidity and Capital Resources
Our primary sources of liquidity have been our cash flows generated from our operations, existing cash and cash equivalents and, when needed, our credit capacity under our existing credit facility. We have primarily used these sources of liquidity to, among other things, service our existing and future debt obligations, fund our working capital requirements for operations and capital expenditures, investments, acquisitions, dividend payments and repurchases of our common stock. Based on past performance and current expectations, we believe our liquidity, along with other financing alternatives, will provide us the necessary capital to fund these transactions and achieve our planned growth for the next 12 months and the foreseeable future.
Sources of Liquidity
Long-Term Debt
2019 Credit Agreement
On March 29, 2019, we entered into a credit agreement with PNC Bank, National Association ("PNC") (the "2019 Credit Agreement"), which provides for a $750.0 million revolving credit facility (the "2019 Revolving Credit Facility"). We may request borrowings under the 2019 Revolving Credit Facility until its maturity date of March 29, 2024. The 2019 Credit Agreement also allows us, subject to certain requirements, to arrange for additional borrowings with PNC for an aggregate amount up to $500.0 million, provided that any such request for additional borrowings must be in a minimum amount of $25.0 million.
As of August 31, 2020, we have borrowed $575.0 million of the available $750.0 million provided by the 2019 Revolving Credit Facility, resulting in $175.0 million available to be withdrawn. We are required to pay a commitment fee using a pricing grid which was 0.10% as of August 31, 2020. This fee is based on the daily amount by which the available balance in the 2019 Revolving Credit Facility exceeds the borrowed amount. All outstanding loan amounts are reported as Long-term debt within the Consolidated Balance Sheets at August 31, 2020 and August 31, 2019. The principal balance is payable in full on the maturity date.
The fair value of our long-term debt was $575.0 million as of August 31, 2020, which we believe approximates the carrying amount as the terms and interest rate approximate market rates given its floating interest rate basis. Borrowings under the loan bear interest on the outstanding principal amount at a rate equal to LIBOR plus a spread using a debt leverage pricing grid, which was 0.875% as of August 31, 2020. The variable rate of interest on our long-term debt can expose us to interest rate volatility due to changes in LIBOR. To mitigate this exposure, on March 5, 2020, we entered into an interest rate swap agreement with a notional amount of $287.5 million to hedge the variable interest rate obligation on a portion of our outstanding balance under the 2019 Revolving Credit Facility. Under the terms of the interest rate swap agreement, we will pay interest at a fixed rate of 0.7995% and receive variable interest payments based on the same one-month LIBOR utilized to calculate the interest expense from the 2019 Revolving Credit Facility. The interest rate swap agreement matures on March 29, 2024.
During fiscal 2019, we incurred approximately $0.9 million in debt issuance costs related to the 2019 Credit Agreement. These costs were capitalized as loan origination fees and are amortized into interest expense ratably over the term of the 2019 Credit Agreement.
During fiscal 2020, we recorded interest expense on our outstanding debt, including the amortization of debt issuance costs, net of the effects of the interest rate swap agreement of $12.9 million. During fiscal 2019, we recorded interest expense on our outstanding debt, including the amortization of debt issuance costs, of $19.8 million. Including the effects of the interest rate swap agreement, the weighted average interest rate on amounts outstanding under our credit facilities was 2.20% for the twelve months ended August 31, 2020. The weighted average interest rate for fiscal 2019 was 3.35%. Interest on the loan outstanding is payable quarterly, in arrears, and on the maturity date.
The 2019 Credit Agreement contains covenants and requirements restricting certain activities, which are usual and customary for this type of loan. In addition, the 2019 Credit Agreement requires that we maintain a consolidated net leverage ratio, as measured by total net funded debt/EBITDA (as defined in the 2019 Credit Agreement) below a specified level as of the end of each fiscal quarter. We were in compliance with all the covenants and requirements within the 2019 Credit Agreement as of August 31, 2020.
The borrowings under the 2019 Credit Agreement were used to retire all outstanding debt under the previous 2017 Credit Agreement between FactSet, as the borrower, and PNC, as the lender, on March 29, 2019. The total principal amount of the debt outstanding at the time of retirement was $575.0 million and there were no prepayment penalties.
2017 Credit Agreement
On March 17, 2017, the Company entered into a Credit Agreement (the "2017 Credit Agreement") between FactSet, as the borrower, and PNC, as the administrative agent and lender. The 2017 Credit Agreement provided for a $575.0 million revolving credit facility "). Borrowings under the loan were subject to interest on the outstanding principal amount at a rate equal to the daily LIBOR plus 1.00%. Interest on the loan outstanding was payable quarterly in arrears and on the maturity date. There were no prepayment penalties if we elected to prepay the outstanding loan amounts prior to the scheduled maturity date. The principal balance was repaid in full on March 29, 2019.
Letters of Credit
From time to time, we are required to obtain letters of credit in the ordinary course of business. Approximately $2.9 million of standby letters of credit have been issued in connection with our leased office spaces as of August 31, 2020. These standby letters of credit utilize the same covenants included in the 2019 Credit Agreement. Refer to Note 12, Debt of the Notes to the Company's Consolidated Financial Statements included in Item 8. of this Annual Report on Form 10-K for more information on these covenants.
Uses of Liquidity
Share Repurchase Program
Repurchases of shares of our common stock are made from time to time in the open market and privately negotiated transactions, subject to market conditions. In fiscal 2020, we repurchased 0.7 million shares for $199.6 million under our existing share repurchase program compared to 0.9 million shares for $213.1 million in fiscal 2019. A total of $259.0 million remains authorized for future share repurchases as of August 31, 2020. There is no defined number of shares to be repurchased over a specified timeframe through the life of the share repurchase program. It is expected that share repurchases will be paid using existing and future cash generated by operations.
Dividends
On August 14, 2020, our Board of Directors approved a regular quarterly dividend of $0.77 to be paid on September 17, 2020. During fiscal 2020, the dividend increased $0.05 per share or 6.9%, which marked the 15th consecutive year we have increased dividends, highlighting our continued commitment to returning value to stockholders. Over the last 12 months, we have paid $110.4 million in cash dividends. Future cash dividends will depend on our earnings, capital requirements, financial condition and other factors considered relevant by us and is subject to final determination by our Board of Directors.
Summary of Cash Flows
The table below, for the periods indicated, provides selected cash flow information:
| | | | | | | | | | | |
| Years ended August 31, |
| (in thousands) | 2020 | | 2019 |
| Net cash provided by operating activities | $ | 505,840 | | | $ | 427,136 | |
| Net cash used in investing activities | $ | (73,632) | | | $ | (56,100) | |
| Net cash used in financing activities | $ | (218,075) | | | $ | (214,274) | |
| Effect of exchange rate changes on cash and cash equivalents | 11,673 | | | (5,586) | |
| Net increase in cash and cash equivalents | 225,806 | | | 151,176 | |
Cash and cash equivalents aggregated to $585.6 million at August 31, 2020, compared with $359.8 million at August 31, 2019, an increase of $225.8 million. This increase was primarily due to $505.8 million of net cash provided by operating activities, $95.5 million in proceeds primarily from the exercise of employee stock options and purchases under the FactSet Research Systems Inc. Employee Stock Purchase Plan, as Amended and Restated (the "ESPP"), and $11.7 million from the effects of foreign currency translations. These cash inflows were partially offset by $199.6 million in share repurchases, $110.4 million in dividend payments and $77.6 million of capital expenditures.
Our cash and cash equivalents are held in numerous locations throughout the world, with $303.0 million within the Americas, $222.3 million within EMEA (predominantly within the UK, France, and Germany) and the remaining $60.3 million within Asia Pacific (predominantly within the Philippines and India) as of August 31, 2020. The Company intends to reinvest substantially all of its accumulated undistributed foreign earnings, except in instances where repatriation would result in
minimal additional tax. As a result of the TCJA, we believe that the income tax impact if such earnings were repatriated would be minimal.
Operating
For fiscal 2020, net cash provided by operating was $505.8 million compared to $427.1 million in fiscal 2019, an increase of $78.7 million. This increase was primarily driven by higher net income and timing of other operating cash flows, partially offset by the timing of income tax payments.
Investing
For fiscal 2020, net cash used in investing activities was $73.6 million compared to $56.1 million in fiscal 2019, an increase in cash used from investing activities of $17.5 million. This increase was mainly due to higher capital expenditures of $18.3 million, driven primarily by increased development costs related to internal-use software.
Financing
For fiscal 2020, net cash used in financing activities was $218.1 million compared to $214.3 million in fiscal 2019, representing a $3.8 million increase in cash used in financing activities. This increase was due primarily to a $11.5 million decrease in proceeds from the exercise of employee stock options and ESPP purchases and a $10.4 million increase in dividend payments, partially offset by a $20.7 million decrease in share repurchases.
Free Cash Flow
We define free cash flow, a non-GAAP financial measure, as cash provided by operating activities less purchases of property, equipment, leasehold improvements and intangible assets. We present free cash flow solely as a supplemental disclosure to provide useful information to investors about the amount of cash generated by the business after necessary capital expenditures. We consider free cash flow to be a liquidity measure that provides useful information to management and investors about the amount of cash generated by the business after necessary capital expenditures. The following table reconciles our net cash provided by operating activities to free cash flow:
| | | | | | | | | | | |
| Years ended August 31, |
| (in thousands) | 2020 | | 2019 |
| Net cash provided by operating activities | $ | 505,840 | | | $ | 427,136 | |
Capital expenditures(1) | (77,642) | | | (59,370) | |
| Free cash flow | $ | 428,198 | | | $ | 367,766 | |
(1)Capital expenditures are included in net cash used in investing activities during each fiscal period reported.
For fiscal 2020, we generated free cash flow of $428.2 million compared to $367.8 million in fiscal 2019 , an increase of $60.4 million. This increase reflects an increase of $78.7 million in cash provided by operating activities, partially offset by an increase in capital expenditures of $18.3 million.
Contractual Obligations
Fluctuations in our operating results, the degree of success of our accounts receivable collection efforts, the timing of tax and other payments, as well as necessary capital expenditures to support growth of our operations, will impact our liquidity and cash flows in future periods. The effect of our contractual obligations on our liquidity and capital resources in future periods should be considered in conjunction with the factors mentioned here. With the exception of the new leases entered in the ordinary course of business and purchase commitments associated with our technology investment plan and business transformation activities, there were no other significant changes to our contractual obligations during fiscal 2020.
The following table summarizes our significant contractual obligations as of August 31, 2020 and the corresponding effect that these obligations will have on our liquidity and cash flows in future periods:
| | | | | | | | | | | | | | | | | | | | | | | | | | | | | | | | |
| | | Payments due by fiscal year |
| (in millions) | | 2021 | | 2022-2023 | | 2024-2025 | | 2026 and thereafter | | Total |
Operating lease obligations(1) | | $ | 40.8 | | | $ | 76.4 | | | $ | 68.3 | | | $ | 186.7 | | | $ | 372.2 | |
Purchase commitments(2) | | 77.7 | | | 84.7 | | | 63.6 | | | — | | | 226.0 | |
Long-term debt obligations(3) | | — | | | — | | | 575.0 | | | — | | | 575.0 | |
Total contractual obligations by period(4) | | $ | 118.5 | | | $ | 161.1 | | | $ | 706.9 | | | $ | 186.7 | | | $ | 1,173.2 | |
(1)Operating lease amounts include future minimum lease payments under all our non-cancelable operating leases with an initial term in excess of one year. Operating lease amounts also include renewal options that are reasonably certain to be exercised and are included in the measurement of the lease liability. Amounts above do not include future lease payments under leases that have not commenced. For more information on our operating leases, refer to Note 11, Leases, in the Notes to the Company’s Consolidated Financial Statements included in Item 8. of this Annual Report on Form 10-K.
(2)Purchase commitments represent payments due in future periods in respect of obligations to our various data vendors as well as commitments to purchase goods and services such as telecommunication services, computer software and maintenance support and consulting services. As of August 31, 2020 and 2019, we had total purchase commitments of $226.0 million and $69.9 million, respectively.
(3)Represents the amount due under the 2019 Credit Agreement.
(4)Non-current income taxes payable of $27.7 million and non-current deferred tax liabilities of $19.7 million have been excluded in the table above due to uncertainty regarding the timing of future payments.
Purchase orders do not necessarily reflect a binding commitment but are merely indicative of authorizations and intention to conclude purchases in the future. For the purpose of this tabular disclosure, purchase obligations for goods and services are defined as agreements that are enforceable and legally binding on us and that specify all significant terms, including: fixed or minimum quantities to be purchased; fixed, minimum or variable price provisions; and the approximate timing of the transaction. It is expected that all the contractual obligations noted in the table will be funded from existing cash and cash flows from operations. Expected timing pertaining to the contractual obligations included in the table above has been estimated based on information currently available. The amounts paid, and the timing of those payments, may differ based on when the goods and services provided by our vendors to whom we are contractually obligated are received, as well as due to changes to agreed-upon amounts for any of our obligations.
We entered into the 2019 Credit Agreement on March 29, 2019 and borrowed $575.0 million. In conjunction with the 2019 Credit Agreement, we retired the loan outstanding under the 2017 Credit Agreement in the amount of $575.0 million. Refer to Note 12, Debt in the Notes to the Company’s Consolidated Financial Statements included in Item 8. of this Annual Report on Form 10-K for more information on the 2019 Credit Agreement.
Off-Balance Sheet Arrangements
At August 31, 2020 and 2019, we had no off-balance sheet financing or other arrangements with unconsolidated entities or financial partnerships (such as entities often referred to as structured finance or special purpose entities) established for purposes of facilitating off-balance sheet financing other debt arrangements, or other contractually limited purposes.
Foreign Currency
Foreign Currency Exposure
Certain wholly-owned subsidiaries within the EMEA and Asia Pacific segments operate under a functional currency different from the U.S. dollar. The financial statements of these foreign subsidiaries are translated into U.S. dollars using period-end rates of exchange for assets and liabilities and average exchange rates for revenue and expenses. Translation gains and losses that arise from translating assets, liabilities, revenue and expenses of foreign operations are recorded in accumulated other comprehensive loss ("AOCL") as a component of stockholders’ equity.
Our foreign currency exchange exposure is related to our operating expenses in countries outside the Americas, where approximately 76% of our employees were located as of August 31, 2020. During fiscal 2020, foreign currency movements
increased operating income by $5.0 million, compared to a $10.1 million increase to operating income in the same period a year earlier.
As of August 31, 2020, we maintained foreign currency forward contracts to hedge a portion of our British Pound Sterling, Euro, Indian Rupee, and Philippine Peso exposures. We entered into a series of forward contracts to mitigate our currency exposure ranging from 25% to 75% over their respective hedged periods. The current foreign currency forward contracts are set to mature at various points between the first quarter of fiscal 2021 through the fourth quarter of fiscal 2021.
As of August 31, 2020, the gross notional value of foreign currency forward contracts to purchase Philippine Pesos and Indian Rupees with U.S. dollars was ₱1.3 billion and Rs1.4 billion, respectively. The gross notional value of foreign currency forward contracts to purchase U.S. dollars with Euros and British Pound Sterling was €31.8 million and £36.4 million, respectively.
A loss on derivatives of $2.0 million was recorded in operating income during fiscal 2020, compared to a loss of $1.8 million in fiscal 2019.
Critical Accounting Policies and Estimates
We prepare the Consolidated Financial Statements in conformity with generally accepted accounting principles, which requires us to make certain estimates and apply judgements that affect the reported amounts of assets, liabilities, revenues and expenses and related disclosures. We base our estimates on historical experience and other assumptions that we believe to be reasonable at the time the Consolidated Financial Statements are prepared and, as such, they may ultimately differ materially from actual results.
We describe our significant accounting policies in Note 3, Summary of Significant Accounting Policies in the Notes to the Company’s Consolidated Financial Statements included in Item 8. of this Annual Report on Form 10-K. Management has discussed the development and selection of these critical accounting estimates with the Audit Committee of our Board of Directors. The critical accounting policies, estimates, and judgments that we believe to have the most significant impacts to our Consolidated Financial Statements are described below.
Revenue Recognition
The majority of our revenue is derived from client access to our hosted proprietary data and analytics platform, which can include various combinations of products and services available over the contractual term. The hosted platform is a subscription-based service that consists primarily of providing access to products and services including workstations, analytics, enterprise data, research management, and trade execution. We have determined that the subscription-based service represents a single performance obligation covering a series of distinct products and services that are substantially the same and that have the same pattern of transfer to the client. Based on the nature of the services and products offered by us, we apply an input time-based measure of progress as the client is simultaneously receiving and consuming the benefits of the platform. We record revenue for our contracts using the over-time revenue recognition model as a client is invoiced or performance is satisfied. A provision for billing adjustments and cancellation of services is estimated and accounted for as a reduction to revenue, with a corresponding reduction to accounts receivable. Refer to Note 4, Revenue Recognition in the Notes to the Company’s Consolidated Financial Statements included in Item 8. of this Annual Report on Form 10-K for further details.
Estimated Tax Provision and Tax Contingencies
We are subject to income taxes in the U.S. and numerous foreign jurisdictions. Our tax provision is an estimate based on our understanding of laws in Federal, state and foreign tax jurisdictions. These laws can be complicated and are difficult to apply to any business. The tax laws also require us to allocate our taxable income to many jurisdictions based on subjective allocation methodologies and information collection processes. Our effective tax rates differ from the statutory rate primarily due to the impact of state taxes, foreign operations, R&D and other tax credits, tax audit settlements, incentive-stock options and the FDII deduction. Our annual effective tax rate was 12.7%, 16.4% and 24.1% in fiscal 2020, 2019 and 2018, respectively.
Our provision for income taxes is subject to volatility and could be adversely impacted by numerous factors such as changes in tax laws, regulations, or accounting principles, including accounting for uncertain tax positions or interpretations of them. Significant judgment is required to determine recognition and measurement. Further, as a result of certain ongoing employment and capital investment actions and commitments, our income in certain countries is subject to reduced tax rates and in some cases is wholly exempt from tax. Our failure to meet these commitments could adversely affect our provision for income taxes. In addition, we are subject to the continuous examination of our income tax returns by the Internal Revenue Service and other tax authorities. We regularly assess the likelihood of adverse outcomes resulting from these examinations to determine the
adequacy of our provision for income taxes. There can be no assurance that the outcomes from these continuous examinations will not have an adverse impact on our operating results and financial condition.
To account for unrecognized tax benefits, we first determine whether it is more-likely-than-not (defined as a likelihood of more than fifty percent) that a tax position will be sustained based on its technical merits as of the reporting date. A tax position that meets this more-likely-than-not threshold is then measured and recognized at the largest amount of benefit that is greater than fifty percent likely to be realized upon effective settlement with a taxing authority. The determination of liabilities related to unrecognized tax benefits, including associated interest and penalties, requires significant estimates. There can be no assurance that we will accurately predict the outcomes of these audits, however, we have no reason to believe that such audits will result in the payment of additional taxes and/or penalties that would have a material adverse effect on our results of operations or financial position, beyond current estimates. For this reason and due to ongoing audits by multiple tax authorities, we regularly engage in discussions and negotiations with tax authorities regarding tax matters in various jurisdictions. We adjust these reserves in light of changing facts and circumstances, such as the closing of a tax audit or the refinement of an estimate. To the extent that the final outcome of these matters is different than the amounts recorded, such differences will affect the provision for income taxes in the period in which such determination is made. We do not currently anticipate that the total amounts of unrecognized tax benefits will significantly change within the next 12 months.
We classify the liability for unrecognized tax benefits as Taxes Payable (non-current) and to the extent that we anticipate payment of cash within one year, the benefit will be classified as Taxes Payable (current). Additionally, we accrue interest on all tax exposures for which reserves have been established consistent with jurisdictional tax laws. This interest is classified as income tax expense in the financial statements. As of August 31, 2020, we had gross unrecognized tax benefits totaling $12.3 million, including $0.9 million of accrued interest, recorded as Taxes Payable (non-current) within the Consolidated Balance Sheets. Refer to Note 10, Income Taxes in the Notes to the Company’s Consolidated Financial Statements included in Item 8. of this Annual Report on Form 10-K for further information
Business Combinations
We account for business combinations using the purchase method of accounting. The acquisition purchase price is allocated to the underlying identified, tangible and intangible assets and liabilities assumed, based on their respective estimated fair values on the acquisition date. The excess of the purchase consideration over the fair values of the identified assets and liabilities is recorded as goodwill and assigned to one or more reporting units. The amounts and useful lives assigned to acquisition-related tangible and intangible assets impact the amount and timing of future amortization expense. Determining the fair value of assets acquired and liabilities assumed and the expected useful life, requires management’s judgment and often involves the use of significant estimates and assumptions, including assumptions with respect to future cash inflows and outflows, discount rates, asset lives and market multiples, among other items. Acquisition-related expenses and restructuring costs are recognized separately from the business combination and are expensed as incurred.
Goodwill and Intangible Assets
Goodwill is assigned to one or more reporting units on the date of acquisition. Our reporting units are the same as our reportable segments. Goodwill is not amortized as it is estimated to have an indefinite life. We review our goodwill for impairment annually during the fourth quarter of each fiscal year and between annual tests if an event occurs or circumstances change that would more likely than not reduce the fair value of any one of our reporting units below its respective carrying amount.
In performing the goodwill impairment test, we first perform a qualitative assessment, which requires that we consider factors such as macro-economic conditions, industry and market conditions in which FactSet operates, including the competitive environment and significant changes in demand for our services. We also consider our share price both in absolute terms and in relation to our peers. If, after assessing the totality of events or circumstances, we determine that it is more likely than not that the fair values of our reporting units are greater than the carrying amounts, then the quantitative goodwill impairment test is not performed.
If the qualitative assessment indicates that the quantitative analysis should be performed, we then evaluate goodwill for impairment by comparing the fair value of each of our reporting units to its carrying value, including the associated goodwill. To determine the fair values, we use an income approach, along with other relevant market information, derived from a discounted cash flow model to estimate fair value of our reporting units. An impairment charge for the amount by which the carrying amount exceeds the reporting unit’s fair value, if any, would be recognized. The loss recognized would not exceed total amount of goodwill allocated to that reporting unit.
We completed our annual goodwill impairment test during the fourth quarter of fiscal 2020. We determined, after performing a qualitative review of each reporting unit, that it is more likely than not that the fair value of each reporting unit substantially exceeds their respective carrying amounts. Accordingly, there was no indication of impairment and the quantitative goodwill impairment test was not performed.
Our identifiable intangible assets consist of acquired content databases, client relationships, software technology, internal-use software, non-compete agreements and trade names resulting from acquisitions, which have been fully integrated into our operations. We amortize intangible assets over their estimated useful lives, which are evaluated quarterly to determine whether events and circumstances warrant a revision to the remaining period of amortization. The weighted average useful life of our identifiable intangible assets at August 31, 2020 was 11.9 years. If the estimate of the remaining useful life is changed, the remaining carrying amount of the intangible asset is amortized prospectively over that revised remaining useful life. There were no material adjustments to the useful lives of intangible assets subject to amortization during any of the periods presented. These intangible assets had no assigned residual values as of August 31, 2020 and 2019.
Intangible assets are reviewed for impairment whenever events or changes in circumstances indicate that the carrying amount of such assets may not be recoverable. Determination of recoverability is based on an estimate of undiscounted future cash flows resulting from the use of the asset and its eventual disposition. Measurement of any impairment loss for intangible assets that management expects to hold, and use is based on the amount the carrying value exceeds the fair value of the asset, which may be based on estimated future cash flows (discounted). No indicators of impairment of intangible assets has been identified during any of the periods presented. Our ongoing consideration of the recoverability could result in impairment charges in the future, which could adversely affect our results of operations. The carrying value of intangible assets as of August 31, 2020 and 2019 was $121.1 million and $124.4 million, respectively. Refer to Note 8, Goodwill and Note 9, Intangible Assets in the Notes to the Company’s Consolidated Financial Statements included in Item 8. of this Annual Report on Form 10-K for further details.
Long-lived Assets
Long-lived assets, comprised of property, equipment and leasehold improvements are evaluated for impairment whenever events or changes in circumstances indicate the carrying value may not be recoverable. Factors that may cause an impairment review include significant changes in technology that make current computer-related assets that we use in our operations obsolete or less useful, and significant changes in the way we use these assets in our operations. When evaluating long-lived assets for potential impairment, if impairment indicators are present, we first compare the carrying value of the asset to the asset’s estimated future cash flows (undiscounted and excluding interest charges). If the estimated future cash flows are less than the carrying value of the asset, we calculate an impairment loss. The impairment loss calculation compares the carrying value of the asset to the asset’s estimated fair value, which may be based on estimated future cash flows (discounted). We recognize an impairment loss if the amount of the asset’s carrying value exceeds the asset’s estimated fair value. If we recognize an impairment loss, the adjusted carrying amount of the asset becomes its new cost basis. The new cost basis will be depreciated (amortized) over the remaining useful life of that asset. Using the impairment evaluation methodology described here, there have been no long-lived asset impairment charges for each of the last three years. The carrying value of long-lived assets was $133.1 million as of August 31, 2020 and $119.4 million as of August 31, 2019.
Our impairment loss calculations contain uncertainties because they require management to make assumptions and to apply judgment to estimate future cash flows and asset fair values, including forecasting useful lives of the assets and selecting the discount rate that reflects the risk inherent in future cash flows. We have not made any material changes in our impairment loss assessment methodology during the past three fiscal years. We do not believe there is a reasonable likelihood that there will be a material change in the estimates or assumptions we use to calculate long-lived asset impairment losses. However, if actual results are not consistent with our estimates and assumptions used in estimating future cash flows and asset fair values, we may be exposed to losses that could be material. Refer to Note 7, Property, Equipment and Leasehold Improvements in the Notes to the Company’s Consolidated Financial Statements included in Item 8. of this Annual Report on Form 10-K for further information.
Performance-based Equity Awards
Performance-based equity awards, whether in the form of performance-based stock options or performance share units, require management to make assumptions regarding the likelihood of achieving performance targets. The number of performance-based awards that vest will be predicated on achieving performance levels during the measurement period subsequent to the date of grant. Dependent on the financial performance levels attained, a percentage of the performance-based awards will vest to the grantees. However, there is no current guarantee that such awards will vest in whole or in part. Refer to Note 16, Stock-Based Compensation in the Notes to the Company’s Consolidated Financial Statements included in Item 8. of this Annual Report on Form 10-K for further information.
New Accounting Pronouncements
See Note 3, Summary of Significant Accounting Policies in the Notes to the Company’s Consolidated Financial Statements included in Item 8. of this Annual Report on Form 10-K for a full description of recent accounting pronouncements, including the expected dates of adoption, which we include here by reference.
ITEM 7A. QUANTITATIVE AND QUALITATIVE DISCLOSURES ABOUT MARKET RISK
Foreign Currency Exchange Risk
In the normal course of business, we are exposed to foreign currency exchange risk as we conduct business outside the U.S. in several currencies including the British Pound Sterling, Euro, Indian Rupee, and Philippine Peso. Changes in the exchange rates for such currencies into U.S. dollars can affect our revenues, earnings, and the carrying values of our assets and liabilities in our consolidated balance sheet, either positively or negatively.
To manage the exposures related to the effects of foreign exchange rate fluctuations, the we utilize derivative instruments (foreign currency forward contracts). The changes in fair value for these foreign currency forward contracts are initially reported as a component of AOCL and subsequently reclassified into operating expenses when the hedged exposure affects earnings.
A sensitivity analysis was performed based on the estimated fair value of all foreign currency forward contracts outstanding at August 31, 2020. If the U.S. dollar had been 10% weaker, the fair value of outstanding foreign currency forward contracts would have increased by $13.0 million, which would have had an immaterial impact on our Consolidated Balance Sheet. Such a change in fair value of our financial instruments would be substantially offset by changes in our expense base. If we had no hedges in place as of August 31, 2020, a hypothetical 10% weaker U.S. dollar against all foreign currencies from the quoted foreign currency exchange rates at August 31, 2020, with operating results held constant in local currencies, would result in a decrease in operating income by $35.4 million over the next 12 months. A hypothetical 10% weaker U.S. dollar against all foreign currencies at August 31, 2020 would have increased the fair value of total assets by $66.3 million and equity by $41.6 million.
Volatility in the British Pound Sterling exchange rate remains a possibility in the short term as the UK continues the transition resulting from its exit from the European Union. In the longer term, any impact from Brexit will depend on, in part, the outcome of tariff, regulatory, and other negotiations. Refer to Item 1A. Risk Factors of this Annual Report on Form 10-K for further discussion on Brexit.
Refer to Note 6, Derivative Instruments in the Notes to the Company’s Consolidated Financial Statements included in Item 8. of this Annual Report on Form 10-K for more information on our foreign currency exposures and our foreign currency forward contracts.
Interest Rate Risk
Cash and Cash Equivalents and Investments
The fair market value of our cash and cash equivalents and investments at August 31, 2020 was $605.2 million. Our cash and cash equivalents consist of demand deposits and money market funds with original maturities of three months or less and are reported at fair value. We are exposed to interest rate risk through fluctuations of interest rates on our investments. As we have a restrictive investment policy, our financial exposure to fluctuations in interest rates is expected to remain low. Refer to Note 3, Summary of Significant Accounting Policies in the Notes to the Company’s Consolidated Financial Statements included in Item 8. of this Annual Report on Form 10-K for more information on our cash and cash equivalents and investments policies.
Debt
As of August 31, 2020, we had long term debt outstanding under the 2019 Revolving Credit Facility with a principal balance of $575.0 million. The debt bears interest on the outstanding principle at a rate equal to LIBOR plus a spread, using a debt leverage pricing grid. The variable rate of interest on our long-term debt can expose us to interest rate volatility due to changes in LIBOR. To mitigate this exposure, on March 5, 2020, we entered into an interest rate swap agreement with a notional amount of $287.5 million to hedge the variable interest rate obligation, effectively converting the floating interest rate to fixed for the hedged portion. Thus, we are only exposed to base interest rate risk on floating rate borrowings in excess of any amounts that are not hedged, or $287.5 million of our outstanding principal balance. Assuming all terms of our outstanding long-term debt remained the same, a hypothetical 25 basis point change (up or down) in the one-month LIBOR would result in a $0.7
million change to our annual interest expense for the portion of the long-term debt not hedged by the interest rate swap agreement. Refer to Note 12, Debt in the Notes to the Company’s Consolidated Financial Statements included in Item 8. of this Annual Report on Form 10-K for additional information regarding our outstanding debt obligations.
ITEM 8. FINANCIAL STATEMENTS AND SUPPLEMENTARY DATA
Index to Consolidated Financial Statements
| | | | | |
| Page |
| |
| |
| |
| |
| Consolidated Financial Statements: | |
| |
| |
| |
| |
| |
| |
| Financial Statement Schedule: | |
| |
Management’s Statement of Responsibility for Financial Statements
FactSet’s Consolidated Financial Statements are prepared by management, which is responsible for their fairness, integrity and objectivity. The accompanying Consolidated Financial Statements have been prepared in conformity with accounting principles generally accepted in the United States of America and include amounts based on management’s estimates and judgments. All financial information in this Report on Form 10-K has been presented on a basis consistent with the information included in the accompanying financial statements.
FactSet’s policies and practices reflect corporate governance initiatives that are compliant with the listing requirements of the New York Stock Exchange, the NASDAQ Stock Market and the corporate governance requirements of the Sarbanes-Oxley Act of 2002. Management, with oversight by the Company’s Board of Directors, has established and maintains a strong ethical climate so that its affairs are conducted to the highest standards of personal and corporate conduct.
FactSet maintains accounting systems, including internal accounting controls, designed to provide reasonable assurance of the reliability of financial records and the protection of assets. The concept of reasonable assurance is based on recognition that the cost of a system should not exceed the related benefits. The effectiveness of those systems depends primarily upon the careful selection of financial and other managers, clear delegation of authority and assignment of accountability, inculcation of high business ethics and conflict-of-interest standards, policies and procedures for coordinating the management of corporate resources, and the leadership and commitment of top management. In compliance with the Sarbanes-Oxley Act of 2002, FactSet assessed its internal control over financial reporting as of August 31, 2020 and issued a report (see below).
Management’s Report on Internal Control over Financial Reporting
Management is responsible for establishing and maintaining adequate internal control over financial reporting for FactSet. Internal control over financial reporting is a process designed to provide reasonable assurance regarding the reliability of financial reporting and the preparation of financial statements for external purposes in accordance with generally accepted accounting principles. Internal control over financial reporting includes those policies and procedures that (i) pertain to the maintenance of records that in reasonable detail accurately and fairly reflect the transactions and dispositions of the assets of the Company; (ii) provide reasonable assurance that transactions are recorded as necessary to permit preparation of financial statements in accordance with generally accepted accounting principles and that receipts and expenditures of the Company are being made only in accordance with authorizations of management and directors of the Company; and (iii) provide reasonable assurance regarding prevention or timely detection of unauthorized acquisition, use, or disposition of the Company’s assets that could have a material effect on the financial statements.
Because of its inherent limitations, internal control over financial reporting may not prevent or detect misstatements. Also, projections of any evaluation of effectiveness to future periods are subject to the risk that controls may become inadequate because of changes in conditions or that the degree of compliance with the policies or procedures may deteriorate.
Management (with the participation of the Chief Executive Officer and Chief Financial Officer) conducted an evaluation of the effectiveness of FactSet’s internal control over financial reporting based on the framework in Internal Control—Integrated Framework (2013) issued by the Committee of Sponsoring Organizations of the Treadway Commission. Based on this evaluation, management concluded that FactSet’s internal control over financial reporting was effective as of August 31, 2020. Ernst & Young LLP, an independent registered public accounting firm, has audited the effectiveness of FactSet’s internal control over financial reporting and has issued a report on FactSet’s internal control over financial reporting, which is included in their report on the subsequent page.
| | | | | | | | |
| /s/ F. PHILIP SNOW | | /s/ HELEN L. SHAN |
| | |
| F. Philip Snow | | Helen L. Shan |
| Chief Executive Officer | | Executive Vice President and Chief Financial Officer |
| October 29, 2020 | | October 29, 2020 |
Report of Independent Registered Public Accounting Firm
To the Board of Directors and Stockholders of FactSet Research Systems Inc.
Opinion on Internal Control over Financial Reporting
We have audited FactSet Research System Inc.’s (the Company) internal control over financial reporting as of August 31, 2020, based on criteria established in Internal Control - Integrated Framework issued by the Committee of Sponsoring Organizations of the Treadway Commission (2013 framework) (the COSO criteria). In our opinion, the Company maintained, in all material respects, effective internal control over financial reporting as of August 31, 2020, based on the COSO criteria.
We also have audited, in accordance with the standards of the Public Company Accounting Oversight Board (United States) (PCAOB), the 2020 Consolidated Financial Statements of the Company and our report dated October 29, 2020, expressed an unqualified opinion thereon.
Basis for Opinion
The Company’s management is responsible for maintaining effective internal control over financial reporting and for its assessment of the effectiveness of internal control over financial reporting included in the accompanying Management’s Report on Internal Control over Financial Reporting. Our responsibility is to express an opinion on the Company’s internal control over financial reporting based on our audit. We are a public accounting firm registered with the PCAOB and are required to be independent with respect to the Company in accordance with the U.S. federal securities laws and the applicable rules and regulations of the Securities and Exchange Commission and the PCAOB.
We conducted our audit in accordance with the standards of the PCAOB. Those standards require that we plan and perform the audit to obtain reasonable assurance about whether effective internal control over financial reporting was maintained in all material respects.
Our audit included obtaining an understanding of internal control over financial reporting, assessing the risk that a material weakness exists, testing and evaluating the design and operating effectiveness of internal control based on the assessed risk, and performing such other procedures as we considered necessary in the circumstances. We believe that our audit provides a reasonable basis for our opinion.
Definition and Limitations of Internal Control over Financial Reporting
A company’s internal control over financial reporting is a process designed to provide reasonable assurance regarding the reliability of financial reporting and the preparation of financial statements for external purposes in accordance with generally accepted accounting principles. A company’s internal control over financial reporting includes those policies and procedures that (1) pertain to the maintenance of records that, in reasonable detail, accurately and fairly reflect the transactions and dispositions of the assets of the company; (2) provide reasonable assurance that transactions are recorded as necessary to permit preparation of financial statements in accordance with generally accepted accounting principles, and that receipts and expenditures of the company are being made only in accordance with authorizations of management and directors of the company; and (3) provide reasonable assurance regarding prevention or timely detection of unauthorized acquisition, use, or disposition of the company’s assets that could have a material effect on the financial statements.
Because of its inherent limitations, internal control over financial reporting may not prevent or detect misstatements. Also, projections of any evaluation of effectiveness to future periods are subject to the risk that controls may become inadequate because of changes in conditions, or that the degree of compliance with the policies or procedures may deteriorate.
/s/ Ernst & Young LLP
Stamford, CT
October 29, 2020
Report of Independent Registered Public Accounting Firm
To the Board of Directors and Stockholders of FactSet Research Systems Inc.
Opinion on the Financial Statements
We have audited the accompanying consolidated balance sheets of FactSet Research Systems Inc. (the Company) as of August 31, 2020 and 2019, and the related consolidated statements of income, comprehensive income, stockholders’ equity and cash flows for each of the three years in the period ended August 31, 2020, and the related notes and financial statement schedule listed in the Index at Item 8. (collectively referred to as the “Consolidated Financial Statements”). In our opinion, the Consolidated Financial Statements present fairly, in all material respects, the financial position of the Company at August 31, 2020 and 2019, and the results of its operations and its cash flows for each of the three years in the period ended August 31, 2020, in conformity with U.S. generally accepted accounting principles.
We also have audited, in accordance with the standards of the Public Company Accounting Oversight Board (United States) (PCAOB), the Company’s internal control over financial reporting as of August 31, 2020, based on criteria established in Internal Control – Integrated Framework issued by the Committee of Sponsoring Organizations of the Treadway Commission (2013 framework) and our report dated October 29, 2020 expressed an unqualified opinion thereon.
Adoption of Accounting Standards Update (ASU) No. 2016-02
As discussed in Note 3, Summary of Significant Accounting Policies, to the Consolidated Financial Statements, the Company changed its method of accounting for leases in 2020 due to the adoption of ASU No. 2016-02, Leases (Topic 842).
Basis for Opinion
These financial statements are the responsibility of the Company’s management. Our responsibility is to express an opinion on the Company’s financial statements based on our audits. We are a public accounting firm registered with the PCAOB and are required to be independent with respect to the Company in accordance with the U.S. federal securities laws and the applicable rules and regulations of the Securities and Exchange Commission and the PCAOB.
We conducted our audits in accordance with the standards of the PCAOB. Those standards require that we plan and perform the audit to obtain reasonable assurance about whether the financial statements are free of material misstatement, whether due to error or fraud. Our audits included performing procedures to assess the risks of material misstatement of the financial statements, whether due to error or fraud, and performing procedures that respond to those risks. Such procedures included examining, on a test basis, evidence regarding the amounts and disclosures in the financial statements. Our audits also included evaluating the accounting principles used and significant estimates made by management, as well as evaluating the overall presentation of the financial statements. We believe that our audits provide a reasonable basis for our opinion.
Critical Audit Matter
The critical audit matter communicated below is a matter arising from the current period audit of the financial statements that was communicated or required to be communicated to the audit committee and that: (1) relates to accounts or disclosures that are material to the financial statements and (2) involved our especially challenging, subjective, or complex judgments. The communication of the critical audit matter does not alter in any way our opinion on the Consolidated Financial Statements, taken as a whole, and we are not, by communicating the critical audit matter below providing a separate opinion on the critical audit matter or on the accounts or disclosures to which it relates.
| | | | | |
| |
| Measurement of income tax provision |
| Description of the Matter | As discussed in Note 3, Summary of Significant Accounting Policies, and 10, Income Taxes, of the Consolidated Financial Statements, the Company serves international markets and is subject to income taxes in the U.S. and numerous foreign jurisdictions, which affect the Company’s provision for income taxes. The tax provision is an estimate based on management’s understanding of current enacted tax laws and tax rates of each tax jurisdiction and the use of subjective allocation methodologies to allocate taxable income to tax jurisdictions based upon the structure of the Company’s operations and customer arrangements. For the year-ended August 31, 2020, the Company recognized a consolidated provision for income taxes of $54.2 million with $31.9 million related to its U.S. operations and $22.3 million related to its non-U.S. operations.
Management’s calculation of the provision for income taxes was significant to our audit because the provision for income taxes involved subjective estimation and complex audit judgement related to the evaluation of tax laws, including the methods used to allocate taxable income, and the amounts and disclosures are material to the financial statements.
|
| |
| How We Addressed the Matter in Our Audit | We obtained an understanding, evaluated the design and tested the operating effectiveness of internal controls over management’s calculation of its provision for income taxes. For example, we tested controls over management’s evaluation of the allocation methodologies and management’s review of the assumptions and data utilized in determining the allocation of income to applicable tax jurisdictions. |
| Among other audit procedures performed, we evaluated the reasonableness of management’s allocation methodologies by analyzing the methodology based on the Company’s structure, operations and current tax law. We recalculated income tax expense using management’s methodology and agreed the data used in the calculations to the Company’s underlying books and records. We involved our tax professionals to evaluate the application of tax law to management’s allocation methodologies and tax positions. This included assessing the Company’s correspondence with the relevant tax authorities and evaluating third-party reports and advice obtained by the Company. We also performed a sensitivity analysis to evaluate the effect from changes in management’s allocation methodologies and assumptions. We have evaluated the Company’s income tax disclosures included in Note 10, Income Taxes, of the Consolidated Financial Statements in relation to these matters. |
| |
/s/ Ernst & Young LLP
We have served as the Company’s auditor since 2013.
Stamford, CT
October 29, 2020
FactSet Research Systems Inc.
Consolidated Statements of Income
| | | | | | | | | | | | | | | | | |
| (in thousands, except per share data) | Years ended August 31, |
| 2020 | | 2019 | | 2018 |
| Revenue | $ | 1,494,111 | | | $ | 1,435,351 | | | $ | 1,350,145 | |
| Operating expenses | | | | | |
| Cost of services | 695,446 | | | 663,446 | | | 659,296 | |
| Selling, general and administrative | 359,005 | | | 333,870 | | | 324,645 | |
| Total operating expenses | 1,054,451 | | | 997,316 | | | 983,941 | |
| | | | | |
| Operating income | 439,660 | | | 438,035 | | | 366,204 | |
| | | | | |
| Other expenses | | | | | |
| Interest expense, net | (9,829) | | | (16,624) | | | (16,286) | |
| Other (expense) income, net | (2,697) | | | 554 | | | 1,920 | |
| Total other expense | (12,526) | | | (16,070) | | | (14,366) | |
| | | | | |
| Income before income taxes | 427,134 | | | 421,965 | | | 351,838 | |
| | | | | |
| Provision for income taxes | 54,196 | | | 69,175 | | | 84,753 | |
| Net income | $ | 372,938 | | | $ | 352,790 | | | $ | 267,085 | |
| | | | | |
| Basic earnings per common share | $ | 9.83 | | | $ | 9.25 | | | $ | 6.90 | |
| Diluted earnings per common share | $ | 9.65 | | | $ | 9.08 | | | $ | 6.78 | |
| | | | | |
| Basic weighted average common shares | 37,936 | | | 38,144 | | | 38,733 | |
| Diluted weighted average common shares | 38,646 | | | 38,873 | | | 39,377 | |
The accompanying notes are an integral part of these Consolidated Financial Statements.
FactSet Research Systems Inc.
Consolidated Statements of Comprehensive Income
| | | | | | | | | | | | | | | | | |
| (in thousands) | Years ended August 31, |
| 2020 | | 2019 | | 2018 |
| Net income | $ | 372,938 | | | $ | 352,790 | | | $ | 267,085 | |
| | | | | |
| Other comprehensive income, net of tax: | | | | | |
Net unrealized gain (loss) on cash flow hedges(1) | 674 | | | 504 | | | (7,288) | |
| Foreign currency translation adjustments | 34,577 | | | (24,325) | | | (9,431) | |
| Other comprehensive income (loss) | 35,251 | | | (23,821) | | | (16,719) | |
| Comprehensive income | $ | 408,189 | | | $ | 328,969 | | | $ | 250,366 | |
(1)The unrealized gain (loss) on cash flow hedges disclosed above was net of tax (expense) benefit of ($251), ($387), and $3,518 for the fiscal years ended August 31, 2020, 2019 and 2018, respectively.
The accompanying notes are an integral part of these Consolidated Financial Statements.
FactSet Research Systems Inc.
Consolidated Balance Sheets
| | | | | | | | | | | |
| (in thousands, except share data) | August 31, |
| 2020 | | 2019 |
| ASSETS | | | |
| Cash and cash equivalents | $ | 585,605 | | | $ | 359,799 | |
| Investments | 19,572 | | | 25,813 | |
Accounts receivable, net of reserves of $7,987 at August 31, 2020 and $10,511 at August 31, 2019 | 155,011 | | | 146,309 | |
| Prepaid taxes | 38,067 | | | 15,033 | |
| Prepaid expenses and other current assets | 43,675 | | | 36,858 | |
| Total current assets | 841,930 | | | 583,812 | |
| | | |
| Property, equipment and leasehold improvements, net | 133,102 | | | 119,384 | |
| Goodwill | 709,703 | | | 685,729 | |
| Intangible assets, net | 121,095 | | | 124,448 | |
| Deferred taxes | — | | | 7,571 | |
| Lease right-of-use assets, net | 248,929 | | | — | |
| Other assets | 28,629 | | | 39,186 | |
| TOTAL ASSETS | $ | 2,083,388 | | | $ | 1,560,130 | |
| | | |
| LIABILITIES | | | |
| Accounts payable and accrued expenses | $ | 82,094 | | | $ | 79,620 | |
| Current lease liabilities | 29,056 | | | — | |
| Accrued compensation | 81,873 | | | 64,202 | |
| Deferred fees | 53,987 | | | 47,656 | |
| Dividends payable | 29,283 | | | 27,445 | |
| Total current liabilities | 276,293 | | | 218,923 | |
| | | |
| Long-term debt | 574,354 | | | 574,174 | |
| Deferred taxes | 19,713 | | | 16,391 | |
| Deferred fees | 9,319 | | | 10,088 | |
| Taxes payable | 27,739 | | | 26,292 | |
| Long-term lease liabilities | 272,269 | | | — | |
| Other non-current liabilities | 7,326 | | | 42,006 | |
| TOTAL LIABILITIES | $ | 1,187,013 | | | $ | 887,874 | |
| Commitments and contingencies (See Note 13) | | | |
| | | |
| STOCKHOLDERS’ EQUITY | | | |
Preferred stock, $0.01 par value, 10,000,000 shares authorized, none issued | $ | — | | | $ | — | |
Common stock, $0.01 par value, 150,000,000 shares authorized, 40,767,708 and 40,104,192 shares issued, 38,030,252 and 38,117,840 shares outstanding at August 31, 2020 and 2019, respectively | 408 | | | 401 | |
| Additional paid-in capital | 939,067 | | | 806,973 | |
Treasury stock, at cost: 2,737,456 and 1,986,352 shares at August 31, 2020 and 2019, respectively | (636,956) | | | (433,799) | |
| Retained earnings | 633,149 | | | 373,225 | |
| Accumulated other comprehensive loss | (39,293) | | | (74,544) | |
| TOTAL STOCKHOLDERS’ EQUITY | $ | 896,375 | | | $ | 672,256 | |
| | | |
| TOTAL LIABILITIES AND STOCKHOLDERS’ EQUITY | $ | 2,083,388 | | | $ | 1,560,130 | |
The accompanying notes are an integral part of these Consolidated Financial Statements.
FactSet Research Systems Inc.
Consolidated Statements of Cash Flows
| | | | | | | | | | | | | | | | | |
| (in thousands) | Years ended August 31, |
| 2020 | | 2019 | | 2018 |
| CASH FLOWS FROM OPERATING ACTIVITIES | | | | | |
| Net income | $ | 372,938 | | | $ | 352,790 | | | $ | 267,085 | |
| Adjustments to reconcile net income to net cash provided by operating activities | | | | | |
| Depreciation and amortization | 57,614 | | | 60,463 | | | 57,285 | |
| Amortization of lease right-of-use assets | 43,185 | | | — | | | — | |
| Stock-based compensation expense | 36,579 | | | 32,400 | | | 31,516 | |
| Deferred income taxes | 10,626 | | | (2,278) | | | (1,910) | |
| Impairment charge | 16,500 | | | — | | | — | |
| Loss on sale of assets | 172 | | | 196 | | | 140 | |
| Changes in assets and liabilities, net of effects of acquisitions | | | | | |
| Accounts receivable, net of reserves | (8,608) | | | 10,205 | | | (8,417) | |
| Accounts payable and accrued expenses | 12,427 | | | (2,290) | | | 12,077 | |
| Accrued compensation | 16,446 | | | (1,743) | | | 5,735 | |
| Deferred fees | 5,571 | | | 458 | | | 6,035 | |
| Taxes payable, net of prepaid taxes | (24,224) | | | (19,238) | | | 27,659 | |
| Lease liabilities, net | (33,340) | | | — | | | — | |
| Other, net | (46) | | | (3,827) | | | (11,537) | |
| Net cash provided by operating activities | 505,840 | | | 427,136 | | | 385,668 | |
| | | | | |
| CASH FLOWS FROM INVESTING ACTIVITIES: | | | | | |
| Purchases of property, equipment, leasehold improvements and intangible assets | (77,642) | | | (59,370) | | | (33,520) | |
| Purchases of investments | (2,736) | | | (11,135) | | | (12,470) | |
| Proceeds from maturity or sale of investments | 6,746 | | | 14,405 | | | 12,459 | |
| Acquisition of businesses and investments, net of cash and cash equivalents acquired | — | | | — | | | (15,000) | |
| Net cash used in investing activities | (73,632) | | | (56,100) | | | (48,531) | |
| | | | | |
| CASH FLOWS FROM FINANCING ACTIVITIES | | | | | |
| Repurchase of common stock | (199,625) | | | (220,372) | | | (303,955) | |
| Dividend payments | (110,439) | | | (100,052) | | | (89,408) | |
| Repayment of debt | — | | | (575,000) | | | — | |
| Proceeds from debt | — | | | 575,000 | | | — | |
| Proceeds from employee stock plans | 95,520 | | | 107,051 | | | 71,610 | |
| Tax benefits from share-based payment arrangements | — | | | — | | | — | |
| Other financing activities, net | (3,531) | | | (901) | | | 1,716 | |
| Net cash used in financing activities | (218,075) | | | (214,274) | | | (320,037) | |
| | | | | |
| Effect of exchange rate changes on cash and cash equivalents | 11,673 | | | (5,586) | | | (3,208) | |
| Net increase in cash and cash equivalents | 225,806 | | | 151,176 | | | 13,892 | |
| Cash and cash equivalents at beginning of period | 359,799 | | | 208,623 | | | 194,731 | |
| Cash and cash equivalents at end of period | $ | 585,605 | | | $ | 359,799 | | | $ | 208,623 | |
| | | | | |
| Supplemental Disclosure of Cash Flow Information | | | | | |
| Cash paid during the year for interest | $ | 12,876 | | | $ | 19,509 | | | $ | 15,676 | |
| Cash paid during the year for income taxes, net of refunds | $ | 69,092 | | | $ | 89,997 | | | $ | 68,707 | |
| | | | | |
| Supplemental Disclosure of Non-Cash Transactions | | | | | |
| Dividends declared, not paid | $ | 29,283 | | | $ | 27,445 | | | $ | 24,443 | |
The accompanying notes are an integral part of these Consolidated Financial Statements.
FactSet Research Systems Inc.
Consolidated Statements of Changes in Stockholders’ Equity
| | | | | | | | | | | | | | | | | | | | | | | | | | | | | | | | | | | | | | | | | | | | | | | |
| (in thousands, except share data) | Common Stock | | Additional
Paid-in
Capital | | Treasury Stock | | Retained
Earnings | | Accumulated
Other
Comprehensive
Loss | | Total
Stockholders’
Equity |
| Shares | | Par Value | | | Shares | | Amount | |
| Balance as of September 1, 2017 | 51,845,132 | | | $ | 518 | | | $ | 741,748 | | | 12,822,100 | | | $ | (1,606,678) | | | $ | 1,458,823 | | | $ | (34,720) | | | $ | 559,691 | |
| Net income | | | | | | | | | | | 267,085 | | | | | 267,085 | |
| Other comprehensive loss | | | | | | | | | | | | | (16,719) | | | (16,719) | |
| Common stock issued for employee stock plans | 685,807 | | | 8 | | | 80,983 | | | | | | | | | | | 80,991 | |
| Vesting of restricted stock | 26,599 | | | | | | | 8,070 | | | (1,514) | | | | | | | (1,514) | |
| Repurchases of common stock | | | | | | | 1,534,782 | | | (302,441) | | | | | | | (302,441) | |
| Stock-based compensation | | | | | 31,517 | | | | | | | | | | | 31,517 | |
| Dividends declared | | | | | | | | | | | (92,710) | | | | | (92,710) | |
| Retirement of Treasury Shares | (13,292,689) | | | $ | (133) | | | (186,717) | | | (13,292,689) | | | 1,697,205 | | | (1,510,355) | | | | | — | |
| Balance as of August 31, 2018 | 39,264,849 | | | $ | 393 | | | $ | 667,531 | | | 1,072,263 | | | $ | (213,428) | | | $ | 122,843 | | | $ | (51,439) | | | $ | 525,900 | |
| Net income | | | | | | | | | | | 352,790 | | | | | 352,790 | |
| Other comprehensive loss | | | | | | | | | | | | | (23,821) | | | (23,821) | |
| Common stock issued for employee stock plans | 753,942 | | | 7 | | | 107,043 | | | | | | | | | | | 107,050 | |
| Vesting of restricted stock | 85,401 | | | 1 | | | (1) | | | 31,644 | | | (7,241) | | | | | | | (7,241) | |
| Repurchases of common stock | | | | | | | 882,445 | | | (213,130) | | | | | | | (213,130) | |
| Stock-based compensation | | | | | 32,400 | | | | | | | | | | | 32,400 | |
| Dividends declared | | | | | | | | | | | (103,710) | | | | | (103,710) | |
| Cumulative effect of adoption of accounting standards* | | | | | | | | | | | 1,302 | | | 716 | | | 2,018 | |
| Balance as of August 31, 2019 | 40,104,192 | | | $ | 401 | | | $ | 806,973 | | | 1,986,352 | | | $ | (433,799) | | | $ | 373,225 | | | $ | (74,544) | | | $ | 672,256 | |
| Net income | | | | | | | | | | | 372,938 | | | | | 372,938 | |
| Other comprehensive income | | | | | | | | | | | | | 35,251 | | | 35,251 | |
| Common stock issued for employee stock plans | 630,520 | | | 7 | | | 95,515 | | | 75 | | (21) | | | | | | | 95,501 | |
| Vesting of restricted stock | 32,996 | | | | | | | 11,945 | | | (3,511) | | | | | | | (3,511) | |
| Repurchases of common stock | | | | | | | 739,084 | | | (199,625) | | | | | | | (199,625) | |
| Stock-based compensation | | | | | 36,579 | | | | | | | | | | | 36,579 | |
| Dividends declared | | | | | | | | | | | (113,014) | | | | | (113,014) | |
| Balance as of August 31, 2020 | 40,767,708 | | | $ | 408 | | | $ | 939,067 | | | 2,737,456 | | | $ | (636,956) | | | $ | 633,149 | | | $ | (39,293) | | | $ | 896,375 | |
* Includes the cumulative effect of adoption of accounting standards primarily due to both the adoption of the new revenue recognition standard (ASC 606) resulting in a cumulative increase to retained earnings related to certain fulfillment costs and the accounting standard update related to the U.S. Tax Cuts and Jobs Act ("TCJA") providing for the reclassification from accumulated other comprehensive loss to retained earnings for stranded tax effects. Refer to Note 3, Basis of Presentation and Note 4, Revenue Recognition in the Notes to the Company's Consolidated Financial Statements included in Item 8. of this Annual Report on Form 10-K for additional information.
The accompanying notes are an integral part of these Consolidated Financial Statements.
Notes to the Consolidated Financial Statements
1. DESCRIPTION OF BUSINESS
FactSet Research Systems Inc. and its wholly-owned subsidiaries (collectively, the "Company" or "FactSet") is a global provider of integrated financial information, analytical applications and industry-leading services for the investment and corporate communities. For over 40 years, global financial professionals have utilized the Company’s content and multi-asset class solutions across each stage of the investment process. FactSet’s goal is to provide a seamless user experience spanning idea generation, research, portfolio construction and analysis, trade execution, performance measurement, risk management, and reporting, in which the Company serves the front, middle, and back offices to drive productivity and improved performance. FactSet’s flexible, open data and technology solutions can be implemented both across the investment portfolio lifecycle or as standalone components serving different workflows in an organization. FactSet is focused on growing the business through three segments: the Americas (formerly known as U.S.), EMEA (Europe and Africa, formerly known as Europe), and Asia Pacific. Within each of the segments, the Company primarily delivers insight and information through the four workflow solutions of Research, Analytics and Trading, Content and Technology Solutions ("CTS"), and Wealth.
FactSet currently serves a wide range of financial professionals, which include but are not limited to portfolio managers, investment research professionals, investment bankers, risk and performance analysts, wealth advisors, and corporate clients. FactSet provides both insights on global market trends and intelligence on companies and industries, as well as capabilities to monitor portfolio risk and performance and execute trades. The Company combines dedicated client service with open and flexible technology offerings, such as a configurable desktop and mobile platform, comprehensive data feeds, and open marketplace and digital portals and application programming interface ("APIs"). The Company's revenue is primarily derived from subscriptions to products and services such as workstations, portfolio analytics, enterprise data, and research management.
2. BASIS OF PRESENTATION
FactSet conducts business globally and is managed on a geographic basis. The accompanying Consolidated Financial Statements and Notes to the Company's Consolidated Financial Statements are prepared in accordance with generally accepted accounting principles in the United States ("GAAP"). All intercompany balances, transactions, and profits have been eliminated. The preparation of Consolidated Financial Statements and related disclosures in conformity with GAAP requires management to make estimates and assumptions that affect the reported amounts of assets and liabilities and disclosure of contingent assets and liabilities at the date of the financial statements and the reported amounts of revenue and expenses during the reporting period. Significant estimates have been made in areas that include allocation of purchase price to acquired assets and liabilities, stock-based compensation, income taxes, valuation of goodwill, and useful lives and valuation of fixed and intangible assets. The Company bases its estimates on historical experience and on various other assumptions that are believed to be reasonable, the results of which form the basis for making judgments about the carrying values of assets and liabilities. Actual results could differ from those estimates.
Reclassification
The Company reclassified certain prior year comparative figures from Interest expense, net, to Other expense, net including non-operational foreign exchange gains and losses in the Consolidated Statement of Income to conform to the current year's presentation.
The Company reclassified certain capitalized software from Property, equipment and leasehold improvements, net to Intangible assets, net, except for capitalized develop costs associated with hosted solutions, which were reclassified to Other assets, in the prior year comparative figures in the Consolidated Balance Sheets to conform to the current year's presentation.
COVID-19
A novel strain of coronavirus, now known as COVID-19 ("COVID-19"), was first reported in December 2019, and it has since extensively impacted the global health and economic environment, with the World Health Organization characterizing COVID-19 as a pandemic on March 11, 2020. FactSet is closely monitoring pandemic-related developments and has taken, and continues to take, numerous steps to address them. FactSet has required nearly all its employees to work remotely on a temporary basis and has implemented global travel restrictions for employees. The Company believes the transition to remote working has been successful and has not significantly affected financial results for the fiscal year ended August 31, 2020. Since the situation surrounding the COVID-19 pandemic remains fluid, FactSet is actively managing its response and has assessed potential impacts to its financial position and operating results for fiscal 2020 as of August 31, 2020. The extent of the effect on the Company’s future operational and financial performance will depend on future developments, including the duration, spread and intensity of the pandemic, and governmental, regulatory and private sector responses, all of which are uncertain and difficult to predict.
3. SUMMARY OF SIGNIFICANT ACCOUNTING POLICIES
The significant accounting policies of the Company and its subsidiaries are summarized below.
Revenue Recognition
The majority of the Company’s revenue is derived from client access to its hosted proprietary data and analytics platform, which can include various combinations of products and services available over the contractual term. The hosted platform is a subscription-based service that consists primarily of providing access to products and services including workstations, analytics, enterprise data, research management, and trade execution. The Company determined that the subscription-based service represents a single performance obligation covering a series of distinct products and services that are substantially the same and that have the same pattern of transfer to the client. Based on the nature of the services and products offered by FactSet, the Company applies an input time-based measure of progress as the client is simultaneously receiving and consuming the benefits of the platform. The Company records revenue for its contracts using the over-time revenue recognition model as a client is invoiced or performance is satisfied. A provision for billing adjustments and cancellation of services is estimated and accounted for as a reduction to revenue, with a corresponding reduction to accounts receivable.
Accounts Receivable and Deferred Fees
Amounts that have been earned but not yet paid are reflected on the Consolidated Balance Sheets as Accounts receivable, net of reserves. Amounts invoiced in advance of client payments that are in excess of earned subscription revenue are reflected on the
Consolidated Balance Sheets as Deferred fees. As of August 31, 2020, the amount of accounts receivable that was unbilled totaled $17.1 million, and will be billed in fiscal 2021. As of August 31, 2019, the amount of accounts receivable that was unbilled totaled $15.8 million, and was billed in fiscal 2020.
The Company calculates its receivable reserve through analyzing aged client receivables, reviewing the recent history of client receivable write-offs and understanding general market and economic conditions. In accordance with this policy, a receivable reserve of $8.0 million and $10.5 million was recorded as of August 31, 2020 and 2019, respectively, within the Consolidated Balance Sheets as a reduction to Accounts receivable.
Cost of Services
Cost of services is comprised of compensation for Company employees within the content collection, consulting, product development, software and systems engineering groups in addition to data costs, computer maintenance and depreciation expenses, amortization of identifiable intangible assets, and client-related communication costs.
Selling, General and Administrative
Selling, general and administrative expenses include compensation for the sales and various other support and administrative departments in addition to travel and entertainment expenses, marketing costs, rent, depreciation of furniture and fixtures, amortization of lease right-of-use ("ROU") assets and leasehold improvements, as well as office expenses, professional fees and other miscellaneous expenses.
Research and Product Development Costs
FactSet does not have a separate research and product development department, but rather the Product Development and Engineering departments work closely with our strategists, product managers, sales and other client-facing specialists to identify areas of improvement with the goal of providing increased value to clients. As such, research and product development costs relate to the salary and benefits for the Company’s product development, software engineering and technical support staff and these costs are expensed as incurred and primarily included within Cost of services as employee compensation. The Company expects to allocate a similar percentage of its workforce in future years in to continue to develop new products and enhancements, respond quickly to market changes and meet the needs of its clients efficiently. FactSet incurred research and product development costs of $224.0 million, $214.7 million and $217.1 million during fiscal years 2020, 2019 and 2018, respectively.
Earnings per Share
Basic earnings per share ("EPS") is computed by dividing net income by the number of weighted average common shares outstanding during the period. Diluted EPS is computed by dividing net income by the number of weighted average common shares outstanding during the period increased by the dilutive effect of potential common shares outstanding during the period. The number of potential common shares outstanding has been determined in accordance with the treasury stock method to the extent they are dilutive. For the purpose of calculating EPS, common shares outstanding include common shares issuable upon the exercise of outstanding share-based compensation awards, including employee stock options and grants of restricted stock and restricted stock units. Performance-based awards are omitted from the calculation of diluted EPS until it is determined that the performance criteria has been met at the end of the reporting period. Under the treasury stock method, the exercise price paid by the option holder and future stock-based compensation expense that the Company has not yet recognized are assumed to be used to repurchase shares.
Comprehensive Income
The Company discloses comprehensive income in accordance with applicable standards for the reporting and display of comprehensive income in a set of financial statements. Comprehensive income is defined as the change in net assets of a business enterprise during a period from transactions generated from non-owner sources. It includes all changes in equity during a period except those resulting from investments by owners and distributions to owners.
Fair Value Measurements
Fair value is defined as the price that would be received from selling an asset or paid to transfer a liability (i.e., the "exit price") in an orderly transaction between market participants at the measurement date. In determining fair value, the use of various valuation methodologies, including market, income and cost approaches is permissible. The Company considers the principal or most advantageous market in which it would transact and considers assumptions that market participants would use when pricing the asset or liability. The accounting guidance for fair value measurements establishes a fair value hierarchy that
requires an entity to maximize the use of observable inputs and minimize the use of unobservable inputs when measuring fair value. There are three levels of inputs that may be used to measure fair value based on the reliability of inputs. A financial instrument’s categorization within the fair value hierarchy is based upon the lowest level of input that is significant to the fair value measurement. The Company’s cash equivalents are classified as Level 1 while the Company’s derivative instruments (foreign exchange forward contracts) and certificates of deposit are classified as Level 2. There were no Level 3 assets or liabilities held by FactSet as of August 31, 2020 or 2019. Refer to Note 5, Fair Value Measures for the definition of the fair value hierarchy.
Cash and Cash Equivalents
Cash and cash equivalents consist of demand deposits and money market funds with original maturities of three months or less and are reported at fair value. The Company’s corporate money market funds are readily convertible into cash and the net asset value of each fund on the last day of the quarter is used to determine its fair value.
Investments
Investments consist of both mutual funds and certificates of deposit as both are part of the Company’s investment strategy. These mutual funds and certificates of deposit are included as Investments (short-term) on the Company’s Consolidated Balance Sheets as the mutual funds can be liquidated at the Company’s discretion and the certificates of deposit have original maturities greater than three months. The mutual funds and certificates of deposit are held for investment and are not considered debt securities. Preservation of principal is the primary goal of our cash and investment policy. Pursuant to our established investment guidelines, we try to achieve high levels of credit quality, liquidity and diversification. Our investment guidelines do not permit us to invest in puts, calls, strips, short sales, straddles, options, commodities, precious metals, futures or investments on margin. Interest income earned from these investments during fiscal 2020, 2019 and 2018 was $1.1 million, $1.5 million and $1.3 million, respectively. The Company’s cash, cash equivalents and investments portfolio did not experience any realized or unrealized losses as a result of counterparty credit risk or ratings change during fiscal 2020 and 2019.
Property, Equipment and Leasehold Improvements
Property, equipment and leasehold improvements are stated at cost, less accumulated depreciation and amortization. Computers and related equipment are depreciated on a straight-line basis over an estimated useful life ranging from three to five years. Furniture and fixtures are depreciated on a straight-line basis over their estimated useful lives of seven years. Leasehold improvements are amortized on a straight-line basis over the terms of the related leases or estimated useful lives of the improvements, whichever period is shorter. Repairs and maintenance expenditures, which are not considered leasehold improvements and do not extend the useful life of the property and equipment, are expensed as incurred.
The Company performs a test for impairment whenever events or changes in circumstances indicate that the carrying amount of an individual asset or asset group may not be recoverable. Should projected undiscounted future cash flows be less than the carrying amount of the asset or asset group, an impairment charge reducing the carrying amount to fair value is required. Fair value is determined based on the most appropriate valuation technique, including discounted cash flows.
Goodwill
Goodwill at the reporting unit level is reviewed for impairment annually, and more frequently if impairment indicators exist. Goodwill is deemed to be impaired and written-down in the period in which the carrying value of the reporting unit exceeds its fair value. FactSet has three reporting units, Americas, EMEA and Asia Pacific, which are consistent with the operating segments reported, as discrete financial information is not available for subsidiaries within the operating segments.
FactSet may elect to perform a qualitative analysis for the reporting units to determine whether it is more likely than not the fair value of the reporting unit is greater than its carrying value. In performing a qualitative assessment, FactSet considers such factors as macro-economic conditions, industry and market conditions in which FactSet operates including the competitive environment and significant changes in demand for the Company’s services. The Company also considers its share price both in absolute terms and in relation to peer companies. If the qualitative analysis indicates that it is more likely than not the fair value of a reporting unit is less than its carrying amount or if FactSet elects not to perform a qualitative analysis, a quantitative analysis is performed to determine whether a goodwill impairment exists.
The quantitative goodwill impairment analysis is used to identify potential impairment by comparing fair value of a reporting unit with its carrying amount using an income approach, along with other relevant market information, derived from a discounted cash flow model to estimate fair value of FactSet’s reporting units. The annual review of carrying value of goodwill requires the Company develop estimates of future business performance. These estimates are used to derive expected cash
flows and include assumptions regarding future sales levels and the level of working capital needed to support a given business. The discounted cash flow model also includes a determination of FactSet’s weighted average cost of capital by reporting unit. Cost of capital is based on assumptions about interest rates, as well as a risk-adjusted rate of return required by FactSet’s equity investors. Changes in these estimates can impact present value of expected cash flows used in determining fair value of a reporting unit. An impairment charge for the amount by which the carrying amount exceeds the reporting unit’s fair value, if any, would be recognized. The loss recognized would not exceed total amount of goodwill allocated to that reporting unit.
The Company performed its annual goodwill impairment test during the fourth quarter of fiscal 2020 utilizing a qualitative analysis and concluded it was more likely than not the fair value of each reporting unit was greater than its respective carrying value and no impairment charge was required.
Intangible Assets
Acquired Intangible Assets
FactSet’s identifiable intangible assets consist of acquired content databases, client relationships, software technology, non-compete agreements and trade names resulting from previous acquisitions, which have been fully integrated into the Company’s operations. The Company amortizes intangible assets over their estimated useful lives, which are evaluated quarterly to determine whether events and circumstances warrant a revision to the remaining period of amortization. If the estimate of the remaining useful life is changed, the remaining carrying amount of the intangible asset is amortized prospectively over that revised remaining useful life. Amortizable Intangible assets are tested for impairment, if indicators of impairment are present, based on undiscounted cash flows, and, if impaired, written down to fair value based on discounted cash flows. No impairment of intangible assets has been identified during any of the fiscal years presented. The intangible assets have no assigned residual values.
Internally Developed Software
FactSet capitalizes internal and external costs related to developing, modifying or obtaining software for internal use, incurred during the application development stage in accordance with ASC 350-40, Internal-Use Software. Costs related to software upgrades and enhancements are capitalized if it is determined that these upgrades or enhancements provide additional functionality to the software. The capitalized software is amortized using the straight-line method over the estimated useful life of the software, generally three to five years. These assets are subject to the impairment test guidance specified in the acquired intangible assets above.
Accrued Liabilities
Accrued liabilities include estimates relating to employee compensation, operating expenses and tax liabilities. At the end of each fiscal year, FactSet conducts a review of both Company and individual performance within each department to determine the amount of discretionary employee compensation. The Company also reviews compensation throughout the year to determine how overall performance tracks against management’s expectations. Management takes these and other factors, including historical performance, into account in reviewing accrued compensation estimates quarterly and adjusting accrual rates as appropriate. The majority of variable employee compensation recorded within accrued compensation related to the annual performance bonus, which was $54.4 million and $49.4 million as of August 31, 2020 and 2019, respectively.
Derivative Instruments
Foreign Currency Forward Contracts
FactSet conducts business outside the U.S. in several currencies including the British Pound Sterling, Euro, Indian Rupee, and Philippine Peso. As such, the Company is exposed to movements in foreign currency exchange rates relative to the U.S. dollar. The Company utilizes derivative instruments (foreign currency forward contracts) to manage the exposures related to the effects of foreign exchange rate fluctuations and reduce the volatility of earnings and cash flows associated with changes in foreign currency. The Company does not enter into foreign exchange forward contracts for trading or speculative purposes. In designing a specific hedging approach, FactSet considers several factors, including offsetting exposures, significance of exposures, forecasting risk and potential effectiveness of the hedge. These transactions are designated and accounted for as cash flow hedges in accordance with applicable accounting guidance. The gains and losses on foreign currency forward contracts mitigate the variability in operating expenses associated with currency movements.
Interest Rate Swap Agreement
On March 29, 2019, FactSet entered into a credit agreement with PNC Bank, National Association ("PNC") (the "2019 Credit Agreement"), which provides for a $750.0 million revolving credit facility (the "2019 Revolving Credit Facility"). The outstanding principal balance of $575.0 million bears interest at a rate equal to LIBOR plus a spread, using a debt leverage pricing grid. The variable rate of interest on the Company's long-term debt can expose FactSet to interest rate volatility due to changes in LIBOR. To mitigate this exposure, on March 5, 2020, FactSet entered into an interest rate swap agreement with a notional amount of $287.5 million to hedge the variable interest rate obligation, effectively converting the floating interest rate to fixed for the hedged portion. Thus, FactSet is only exposed to base interest rate risk on floating rate borrowings in excess of any amounts that are not hedged, or $287.5 million of the outstanding principal balance.
Derivative Instrument Classification
The changes in fair value for these cash flow hedges are initially reported as a component of accumulated other comprehensive loss ("AOCL") and subsequently reclassified into operating expenses when the hedged exposure affects earnings. All derivatives are assessed for effectiveness at each reporting period.
Foreign Currency Translation
Certain wholly-owned subsidiaries operate under a functional currency different from the U.S. dollar, such as the British Pound Sterling, Euro, Indian Rupee, and Philippine Peso. The financial statements of these foreign subsidiaries are translated into U.S. dollars using period-end rates of exchange for assets and liabilities, and average rates for the period for revenues and expenses. Translation gains and losses that arise from translating assets, liabilities, revenue and expenses of foreign operations are recorded in AOCL as a component of stockholders’ equity. The accumulated foreign currency translation loss totaled $37.7 million and $72.3 million at August 31, 2020 and 2019, respectively.
Income and Deferred Taxes
Income tax expense is based on taxable income determined in accordance with current enacted laws and tax rates. Deferred income taxes are recorded for the temporary differences between the financial statement and tax bases of assets and liabilities using current enacted tax rates. FactSet recognizes the financial effect of an income tax position only if it is more likely than not (greater than 50%) that the tax position will prevail upon tax examination, based solely on the technical merits of the tax position as of the reporting date. Otherwise, no benefit or expense can be recognized in the Consolidated Financial Statements. The tax benefits recognized are measured based on the largest benefit that has a greater than 50% likelihood of being realized upon ultimate settlement. Additionally, FactSet accrues interest on all tax exposures for which reserves have been established consistent with jurisdictional tax laws. Interest is classified as income tax expense in the financial statements. As of August 31, 2020, the Company had gross unrecognized tax benefits totaling $12.3 million, including $0.9 million of accrued interest, recorded as Taxes payable (non-current) on the Consolidated Balance Sheets.
Stock-Based Compensation
Accounting guidance requires the measurement and recognition of compensation expense for all share-based payment awards made to employees and directors including stock options, restricted stock, performance share units, and common shares acquired under employee stock purchases based on estimated fair values of the share awards that are scheduled to vest during the period. FactSet uses the straight-line attribution method for all awards with graded vesting features and service conditions only. Under this method, the amount of compensation expense that is recognized on any date is at least equal to the vested portion of the award on that date. For all stock-based awards with performance conditions, the graded vesting attribution method is used by the Company to determine the monthly stock-based compensation expense over the applicable vesting periods.
As stock-based compensation expense recognized is based on awards ultimately expected to vest, it has been reduced for estimated forfeitures. Forfeitures are estimated at the time of grant and revised, if necessary, in subsequent periods if actual forfeitures differ from those estimates. Forfeitures are estimated based primarily on historical experience. Windfall tax benefits, defined as tax deductions that exceed recorded stock-based compensation, are classified as cash inflows from operations.
Performance-based options and performance share units require management to make assumptions regarding the likelihood of achieving Company performance targets on a quarterly basis. The number of performance-based options and performance share units that vest will be predicated on the Company achieving certain performance levels. A change in the financial performance levels the Company achieves could result in changes to FactSet’s current estimate of the vesting percentage and related stock-based compensation.
Treasury Stock
The Company accounts for repurchased common stock under the cost method and includes such treasury stock as a component of its Stockholders’ equity. The Company accounts for the formal retirement of treasury stock by deducting its par value from common stock, reducing additional paid-in capital ("APIC") by the average amount recorded in APIC when the stock was originally issued and any remaining excess of cost deducted from retained earnings.
Leases
FactSet adopted the standard, ASC 842-10, Leases ("ASC 842") as of September 1, 2019, using a modified retrospective approach. The adoption of the lease standard primarily related to the Company’s real estate operating leases. FactSet reviews new arrangements at inception to evaluate whether the Company obtains substantially all the economic benefits of and has the right to control the use of an asset. If FactSet determines that an arrangement qualifies as a lease, with a lease term of greater than one year, the Company records a lease ROU asset and lease liability at the lease commencement date. As there is no rate implicit in the Company’s operating lease arrangements, these balances are initially recorded as the present value of the future minimum lease payments, (including fixed lease payments and certain qualifying index-based variable payments) over the lease term, using FactSet’s incremental borrowing rate ("IBR") within the geography where the leased asset is located. As FactSet does not have any outstanding public debt, the Company estimates the IBR based on FactSet’s estimated credit rating and available market information. The IBR is determined at lease commencement and subsequently reassessed upon a modification to the lease arrangement. Certain adjustments to our lease ROU assets may be required for items such as initial direct costs paid or incentives received.
FactSet elected the practical expedient not to separate lease components from non-lease components but, rather, to combine them into one single lease component, which we recognize over the expected term on a straight-line expense basis in occupancy costs (a component of SG&A expense).
As of August 31, 2020, the Company’s leases have remaining terms of less than one year to just over 15 years. The lease ROU assets and lease liabilities recognized did not include any renewal or termination options that were not yet reasonably certain to be exercised.
Business Combinations
The Company accounts for its business combinations using the purchase method of accounting. The acquisition purchase price is allocated to the underlying identified tangible and intangible assets and liabilities assumed, based on their respective estimated fair values on the acquisition date. The excess of the purchase consideration over the fair values of the identified assets and liabilities is recorded as goodwill and assigned to one or more reporting units. The amounts and useful lives assigned to acquisition-related tangible and intangible assets impact the amount and timing of future amortization expense. Determining the fair value of assets acquired and liabilities assumed and the expected useful life requires management’s judgment and often involves the use of significant estimates and assumptions, including assumptions with respect to future cash inflows and outflows, discount rates, asset lives and market multiples, among other items. Acquisition-related expenses and restructuring costs are recognized separately from the business combination and are expensed as incurred.
Concentrations of Risk
Cash and cash equivalents are maintained with several financial institutions. Deposits held with banks may exceed the amount of insurance provided on such deposits. Generally, these deposits may be redeemed upon demand and are maintained with financial institutions with reputable credit and therefore bear minimal credit risk. The Company seeks to mitigate its credit risks by spreading such risks across multiple counterparties and monitoring the risk profiles of these counterparties.
New Accounting Standards or Updates Recently Adopted
As of the beginning of fiscal 2020, FactSet implemented all applicable new accounting standards and updates issued by the Financial Accounting Standards Board ("FASB") that were in effect. There were no new standards or updates adopted during the last three fiscal years that had a material impact on the Company's Consolidated Financial Statements, other than the new lease accounting standard discussed below. Refer to Note 11, Leases for additional information.
Leases
In February 2016, the FASB issued an accounting standard update related to accounting for leases, ASC 842. The update requires the recognition of lease ROU assets and lease liabilities on the balance sheet and the disclosure of qualitative and quantitative information about leasing arrangements. The guidance also eliminates the requirement for an entity to use bright-
line tests in determining lease classification. FactSet adopted the new accounting standard effective September 1, 2019, using a modified retrospective approach to record the required cumulative effect adjustments to the opening balance sheet in the period of adoption, rather than in the earliest comparative period presented. As such, the Company's historical Consolidated Financial Statements were not restated and follow the Company's previous policy under ASC 840, Leases. Refer to FactSet’s Annual Report on Form 10-K for the fiscal year ended August 31, 2019 for further details of the Company’s policy prior to adoption of ASC 842.
FactSet elected the package of practical expedients permitted under the transition guidance, which permits the Company not to reassess the prior conclusions about lease identification, lease classification, and initial direct costs. FactSet did not elect the use-of-hindsight practical expedient in determining the lease term and in assessing impairment. FactSet elected the practical expedient not to separate lease components from non-lease components but, rather, to combine them into one single lease component. The Company has also elected to apply the short-term lease exception not to recognize lease ROU assets and lease liabilities for leases with a term of 12 months or less. FactSet will recognize lease payments on a straight-line basis over the lease term.
As of November 30, 2019, the Company recognized Lease ROU assets, net of amortization of $217.0 million and corresponding Current and Long-term lease liabilities of $266.4 million, related primarily to the Company’s real estate leases. There was no material impact to the Company’s Consolidated Statements of Income, Consolidated Statements of Comprehensive Income, Consolidated Statements of Cash Flows and Consolidated Statement of Changes in Stockholders' Equity. Refer to Note 11, Leases for more information regarding the Company's lease accounting.
Hedge Accounting Simplification
During the first quarter of fiscal 2020, FactSet adopted the accounting standard updated issued by the FASB in August 2017, which focused on reducing the complexity of and simplifying the application of hedge accounting. The guidance refines and expands hedge accounting for both financial and nonfinancial risk components, eliminates the need to separately measure and report hedge ineffectiveness, and aligns the recognition and presentation of the effects of the hedging instrument and the hedged item in the financial statements. The adoption of this standard had no impact on the Company's Consolidated Financial Statements.
Recent Accounting Standards or Updates Not Yet Effective
Credit Losses on Financial Instruments
In June 2016, the FASB issued an accounting standard that significantly changes how entities will measure credit losses for most financial assets and certain other instruments that are not measured at fair value through net income. The standard will replace today’s "incurred loss" approach with an "expected loss" model for instruments measured at amortized cost. The guidance will be effective for the Company beginning in the first quarter of fiscal 2021. The Company has evaluated the impact of this accounting standard update and has determined that its adoption will not have a material impact on the Company's Consolidated Financial Statements.
Goodwill Impairment Test
In January 2017, the FASB issued an accounting standard update which removes the requirement for companies to compare the implied fair value of goodwill with its carrying amount as part of step 2 of the goodwill impairment test. A goodwill impairment will now be the amount by which a reporting unit’s carrying value exceeds its fair value, not to exceed the carrying amount of goodwill. This accounting standard update will be effective for the Company beginning in the first quarter of fiscal 2021, with early adoption permitted for any impairment tests performed after January 1, 2017. The Company has evaluated the impact of this accounting standard update and has determined that its adoption will not have a material impact on the Company's Consolidated Financial Statements.
Income Tax Simplification
In December 2019, the FASB issued an accounting standard update to simplify various aspects related to accounting for income taxes, eliminating certain exceptions to the general principles in accounting for income taxes related to intraperiod tax allocation, simplifying when companies recognize deferred taxes in an interim period, and clarifying certain aspects of the current guidance to promote consistent application. The guidance will be effective for the Company in the first quarter of fiscal 2022, with early adoption permitted. Most amendments are required to be applied on a prospective basis, while certain amendments must be applied on a retrospective or modified retrospective basis. The Company is currently evaluating the potential impact of adopting the guidance on its Consolidated Financial Statements.
Facilitation of the Effects of Reference Rate Reform on Financial Reporting
In March 2020, the FASB issued an accounting standard to provide optional expedients and exceptions for applying GAAP to contract modifications, hedging relationships, and other transactions affected by the anticipated transition from LIBOR. As a result of the reference rate reform initiative, certain widely used reference rates such as LIBOR are expected to be discontinued. The guidance is designed to simplify how entities account for contracts, such as receivables, debt, leases, derivative instruments and hedging, that are modified to replace LIBOR or other benchmark interest rates with new rates. The guidance is effective upon issuance and may be applied through December 31, 2022. The Company is currently evaluating the impact of this accounting standard, but it is not expected to have a material impact on the Company’s Consolidated Financial Statements.
No other new accounting pronouncements issued or effective as of August 31, 2020 have had or are expected to have a material impact on the Company’s Consolidated Financial Statements.
4. REVENUE RECOGNITION
The Company derives most of its revenue by providing client access to its hosted proprietary data and analytics platform which can include various combinations of products and services available over the contractual term. The hosted platform is a subscription-based service that consists primarily of providing access to products and services including workstations, portfolio analytics, enterprise data and research management. The Company determined that the subscription-based service represents a single performance obligation covering a series of distinct products and services that are substantially the same and that have the same pattern of transfer to the client. The Company also determined the nature of the promise to the client is to provide daily access to one overall data and analytics platform. This platform provides integrated financial information, analytical applications and industry-leading service for the investment community. Based on the nature of the services and products offered by FactSet, the Company applies an input time-based measure of progress as the client is simultaneously receiving and consuming the benefits of the platform. The Company records revenue for its contracts using the over-time revenue recognition model as a client is invoiced or performance is satisfied. FactSet does not consider payment terms as a performance obligation for clients with contractual terms that are one year or less and the Company has elected the practical expedient.
Contracts with clients can include certain fulfillment costs, comprised of up-front costs to allow for the delivery of services and products, which are recoverable. In connection with the adoption of the revenue recognition standard, fulfillment costs are recognized as an asset, recorded in the Prepaid expenses and other current assets account for the current portion and Other assets for the non-current portion, based on the term of the license period, and amortized consistent with the associated revenue for providing the services. There are no significant judgments that would impact the timing of revenue recognition. The majority of client contracts have a duration of one year or less, or the amount FactSet is entitled to receive corresponds directly with the value of performance obligations completed to date, and therefore, the Company does not disclose the value of the remaining unsatisfied performance obligations.
Disaggregated Revenue
The Company disaggregates revenue from contracts with clients by geographic region, which includes the Americas , EMEA and Asia Pacific. FactSet believes these regions are reflective of how the Company manages the business and the markets in which it serves. These regions best depict the nature, amount, timing and uncertainty of revenue and cash flows related to contracts with clients. Refer to Note 18, Segment Information for further information on revenue by geographic region.
The following table presents this disaggregation of revenue by geography:
| | | | | | | | | | | | | | | | | |
| August 31, |
(in thousands) | 2020 | | 2019 | | 2018 |
Americas | $ | 929,444 | | | $ | 894,554 | | | $ | 841,908 | |
EMEA | $ | 422,203 | | | $ | 408,084 | | | $ | 387,589 | |
Asia Pacific | $ | 142,464 | | | $ | 132,713 | | | $ | 120,648 | |
Total Revenue | $ | 1,494,111 | | | $ | 1,435,351 | | | $ | 1,350,145 | |
5. FAIR VALUE MEASURES
Fair value is defined as the price that would be received from selling an asset or paid to transfer a liability (i.e., the "exit price") in an orderly transaction between market participants at the measurement date. In determining fair value, the use of various valuation methodologies, including market, income and cost approaches is permissible. The Company considers the principal or most advantageous market in which it would transact and considers assumptions that market participants would use when pricing the asset or liability.
Fair Value Hierarchy
The accounting guidance for fair value measurements establishes a fair value hierarchy that requires an entity to maximize the use of observable inputs and minimize the use of unobservable inputs when measuring fair value. There are three levels of inputs that may be used to measure fair value based on the reliability of inputs. A financial instrument’s categorization within the fair value hierarchy is based upon the lowest level of input that is significant to the fair value measurement. The Company’s assessment of the significance of a particular input to the fair value measurement requires judgment and may affect its placement within the fair value hierarchy levels. FactSet has categorized its cash equivalents, investments and derivatives within the fair value hierarchy as follows:
Level 1 - applies to assets or liabilities for which there are quoted prices in active markets for identical assets or liabilities. These Level 1 assets and liabilities include the Company's corporate money market funds that are classified as cash equivalents.
Level 2 - applies to assets or liabilities for which there are inputs other than quoted prices that are observable for the asset or liability such as quoted prices for similar assets or liabilities in active markets; quoted prices for identical assets or liabilities in markets with insufficient volume or infrequent transactions (less active markets); or model-derived valuations in which significant inputs are observable or can be derived principally from, or corroborated by, observable market data. The Company’s certificates of deposit, mutual funds and derivative instruments are classified as Level 2.
Level 3 - applies to assets or liabilities for which there are unobservable inputs to the valuation methodology that are significant to the measurement of the fair value of the assets or liabilities. There were no Level 3 assets or liabilities held by the Company as of August 31, 2020 or 2019.
Assets and Liabilities Measured at Fair Value on a Recurring Basis
The following tables show, by level within the fair value hierarchy, the Company’s assets and liabilities that are measured at fair value on a recurring basis at August 31, 2020 and 2019. The Company did not have any transfers between Level 1 and Level 2 fair value measurements during the periods presented.
| | | | | | | | | | | | | | | | | | | | | | | |
| (in thousands) | Fair Value Measurements at August 31, 2020 |
| Level 1 | | Level 2 | | Level 3 | | Total |
| Assets | | | | | | | |
Corporate money market funds(1) | $ | 276,852 | | | $ | — | | | $ | — | | | $ | 276,852 | |
Mutual Funds(2) | — | | | 17,257 | | | — | | | 17,257 | |
Certificates of deposit(3) | — | | | 2,315 | | | — | | | 2,315 | |
Derivative instruments(4) | — | | | 3,644 | | | — | | | 3,644 | |
| Total assets measured at fair value | $ | 276,852 | | | $ | 23,216 | | | $ | — | | | $ | 300,068 | |
| | | | | | | |
| Liabilities | | | | | | | |
Derivative instruments(4) | $ | — | | | $ | 5,773 | | | $ | — | | | $ | 5,773 | |
| Total liabilities measured at fair value | $ | — | | | $ | 5,773 | | | $ | — | | | $ | 5,773 | |
| | | | | | | | | | | | | | | | | | | | | | | |
| (in thousands) | Fair Value Measurements at August 31, 2019 |
| Level 1 | | Level 2 | | Level 3 | | Total |
| Assets | | | | | | | |
Corporate money market funds(1) | $ | 75,849 | | | $ | — | | | $ | — | | | $ | 75,849 | |
Mutual Funds(2) | — | | | 18,583 | | | — | | | 18,583 | |
Certificates of deposit(3) | — | | | 7,090 | | | — | | | 7,090 | |
Derivative instruments(4) | — | | | 520 | | | — | | | 520 | |
| Total assets measured at fair value | $ | 75,849 | | | $ | 26,193 | | | $ | — | | | $ | 102,042 | |
| | | | | | | |
| Liabilities | | | | | | | |
Derivative instruments(4) | $ | — | | | $ | 3,575 | | | $ | — | | | $ | 3,575 | |
| Total liabilities measured at fair value | $ | — | | | $ | 3,575 | | | $ | — | | | $ | 3,575 | |
(1)The Company’s corporate money market funds are readily convertible into cash and the net asset value of each fund on the last day of the quarter is used to determine its fair value. As such, the Company’s corporate money market funds are classified as Level 1 assets and included in Cash and cash equivalents within the Consolidated Balance Sheets.
(2)The Company’s mutual funds have a fair value based on the fair value of the underlying investments held by the mutual funds, allocated to each share of the mutual fund using a net asset value approach. The fair value of the underlying investments is based on observable inputs. As such, the Company’s mutual funds are classified as Level 2 and are classified as Investments (short-term) on the Consolidated Balance Sheets.
(3)The Company’s certificates of deposit held for investment are not debt securities and are classified as Level 2 assets. These certificates of deposit have original maturities greater than three months but less than one year and, as such, are classified as Investments (short-term) within the Consolidated Balance Sheets.
(4)The Company utilizes the income approach to measure fair value for its foreign exchange forward contracts. The income approach uses pricing models that rely on market observable inputs such as spot, forward and interest rates, as well as credit default swap spreads, and are classified as Level 2 assets. To estimate fair value for the interest rate swap agreement, the Company utilizes a present value of future cash flows, leveraging a model-derived valuation that uses Level 2 observable inputs such as interest rate yield curves. Refer to Note 6, Derivative Instruments for more information on the Company's derivative instruments designed as cash flow hedges.
Assets and Liabilities Measured at Fair Value on a Non-Recurring Basis
Assets and liabilities that are measured at fair value on a nonrecurring basis relate primarily to our tangible fixed assets, operating lease assets, goodwill and intangible assets. The fair values of these non-financial assets and liabilities are determined based on valuation techniques using the best information available, and may include quoted market prices, market comparable information, and discounted cash flow projections. The Company reviews goodwill and intangible assets for impairment annually, during the fourth quarter of each fiscal year, or as circumstances indicate the possibility for impairment. The Company monitors the carrying value of long-lived assets for impairment whenever events or changes in circumstances indicate the carrying amount may not be recoverable. During fiscal 2020 and 2019, no fair value adjustments or material fair value measurements were required for the Company’s non-financial assets or liabilities.
Assets and Liabilities Measured at Fair Value for Disclosure Purposes Only
As of each of August 31, 2020 and 2019, the fair value of the Company’s long-term debt was $575.0 million, which approximated its carrying amount given the application of a floating interest rate equal to LIBOR plus a spread using a debt leverage pricing grid. As the interest rate is a variable rate, adjusted based on market conditions, it approximates the current market-rate for similar instruments available to companies with comparable credit quality and maturity, and therefore, the long-term debt is categorized as Level 2 in the fair value hierarchy.
6. DERIVATIVE INSTRUMENTS
Cash Flow Hedges
Foreign Currency Forward Contracts
FactSet conducts business outside the U.S. in several currencies including the British Pound Sterling, Euro, Indian Rupee, and Philippine Peso. As such, the Company is exposed to movements in foreign currency exchange rates compared to the U.S. dollar. The Company utilizes derivative instruments (foreign currency forward contracts) to manage the exposures related to the effects of foreign exchange rate fluctuations and reduce the volatility of earnings and cash flows associated with changes in foreign currency. The Company does not enter into foreign currency forward contracts for trading or speculative purposes. Refer to Note 19, Risks and Concentrations of Credit Risk, for further discussion on counterparty credit risk.
In designing a specific hedging approach, FactSet considered several factors, including offsetting exposures, the significance of exposures, the forecasting of risk and the potential effectiveness of the hedge. The gains and losses on foreign currency forward contracts offset the variability in operating expenses associated with currency movements. The changes in fair value for these foreign currency forward contracts are initially reported as a component of AOCL and subsequently reclassified into operating expenses when the hedge is settled. There was no discontinuance of cash flow hedges during fiscal 2020 or 2019, and as such, no corresponding gains or losses related to changes in the value of the Company’s contracts were reclassified into earnings prior to settlement.
As of August 31, 2020, FactSet maintained foreign currency forward contracts to hedge a portion of its British Pound Sterling, Euro, Indian Rupee, and Philippine Peso exposures. FactSet entered into a series of forward contracts to mitigate its currency exposure ranging from 25% to 75% over their respective hedged periods. The current foreign currency forward contracts are set to mature at various points between the first quarter of fiscal 2021 through the fourth quarter of fiscal 2021.
As of August 31, 2020, the gross notional value of foreign currency forward contracts to purchase Philippine Pesos and Indian Rupees with U.S. dollars was ₱1.3 billion and Rs1.4 billion, respectively. The gross notional value of foreign currency forward contracts to purchase U.S. dollars with Euros and British Pound Sterling was €31.8 million and £36.4 million, respectively.
Interest Rate Swap Agreement
On March 5, 2020, FactSet entered into an interest rate swap agreement with a notional amount of $287.5 million to hedge the variable interest rate obligation on a portion of its outstanding debt under its 2019 Revolving Credit Facility (as defined in Note 12, Debt). As of August 31, 2020, FactSet has borrowed $575.0 million of the available $750.0 million under the 2019 Revolving Credit Facility, which bears interest on the outstanding principal amount at a rate equal to a contractual one month LIBOR plus a spread using a debt leverage pricing grid, which was 0.875% as of August 31, 2020. The variable interest rate on FactSet’s long-term debt can expose the Company to interest rate volatility arising from changes in LIBOR. Under the terms of the interest rate swap agreement, FactSet will pay interest at a fixed rate of 0.7995% and receive variable interest payments based on the same one-month LIBOR utilized to calculate the interest expense from the 2019 Revolving Credit Facility. The interest rate swap agreement matures on March 29, 2024. Refer to Note 12, Debt, for further discussion on the 2019 Revolving Credit Facility.
As the terms for the interest rate swap agreement align with the 2019 Revolving Credit Facility, the Company does not expect any hedge ineffectiveness. The Company has designated and accounted for this instrument as a cash flow hedge with the unrealized gains or losses on the interest rate swap agreement recorded in AOCL in the Consolidated Balance Sheets.
The following is a summary of the gross notional values of the derivative instruments:
| | | | | | | | | | | |
(in thousands, in U.S. dollars) | Gross Notional Value |
August 31, 2020 | | August 31, 2019 |
| Foreign currency forward contracts | $ | 129,649 | | | $ | 113,700 | |
| Interest rate swap agreement | 287,500 | | | — | |
| Total cash flow hedges | $ | 417,149 | | | $ | 113,700 | |
Fair Value of Derivative Instruments
The following is a summary of the fair values of the derivative instruments:
| | | | | | | | | | | | | | | | | | | | |
| Fair Value of Derivative Instruments |
| Derivatives designated as hedging instruments | | Derivative Assets | | Derivative Liabilities |
| August 31, | | August 31, |
| 2020 | 2019 | | 2020 | 2019 |
| Balance Sheet Classification | Fair Value | Fair Value | Balance Sheet Classification | Fair Value | Fair Value |
| Foreign currency forward contracts | Prepaid expenses and other current assets | $ | 3,644 | | $ | 520 | | Accounts payable and accrued expenses | $ | 93 | | $ | 3,575 | |
| Interest rate swap agreement | Prepaid expenses and other current assets | — | | — | | Accounts payable and accrued expenses | 1,861 | | — | |
| Other assets | — | | — | | Other non-current liabilities | 3,819 | | — | |
| Total cash flow hedges | | $ | 3,644 | | $ | 520 | | | $ | 5,773 | | $ | 3,575 | |
All derivatives were designated as hedging instruments as of August 31, 2020 and 2019, respectively.
Derivatives in Cash Flow Hedging Relationships
The following table provides the pre-tax effect of derivative instruments in cash flow hedging relationships for the each of the three fiscal years ended August 31, 2020, 2019 and 2018:
| | | | | | | | | | | | | | | | | | | | | | | |
(in thousands) | Gain (Loss) Recognized
in AOCL on Derivatives
(Effective Portion) | Location of (Loss) Gain Reclassified
from AOCL
into Income
(Effective Portion) | (Loss) Gain Reclassified
from AOCL into Income
(Effective Portion) |
Derivatives in Cash Flow Hedging Relationships | 2020 | 2019 | 2018 | 2020 | 2019 | 2018 |
| Foreign currency forward contracts | $ | 5,049 | | $ | (187) | | $ | (7,700) | | SG&A | $ | (1,556) | | $ | (1,794) | | $ | 3,106 | |
| Interest rate swap agreement | $ | (6,138) | | $ | — | | $ | — | | Interest expense, net | $ | (458) | | $ | — | | $ | — | |
| Total cash flow hedges | $ | (1,089) | | $ | (187) | | $ | (7,700) | | | $ | (2,014) | | $ | (1,794) | | $ | 3,106 | |
As of August 31, 2020, the Company assessed that these cash flow hedges were effective. Foreign currency forward contract gains and losses are recorded in the Consolidated Statement of Income in Selling, general, and administrative ("SG&A"). The gain or loss from the interest rate swap agreement is recorded in the Consolidated Statement of Income in Interest expense, net.
As of August 31, 2020, the Company estimates that net pre-tax derivative gains of $1.7 million included in AOCL will be reclassified into earnings within the next 12 months. No amount of ineffectiveness was recorded in the Consolidated Statements of Income for these designated cash flow hedges and all components of each derivative’s gain or loss were included in the assessment of hedge effectiveness.
Offsetting of Derivative Instruments
FactSet’s master netting and other similar arrangements with its respective counterparties allow for net settlement under certain conditions. As of August 31, 2020 and 2019, there were no material amounts recorded net on the Consolidated Balance Sheets.
7. PROPERTY, EQUIPMENT AND LEASEHOLD IMPROVEMENTS
Property, equipment and leasehold improvements consist of the following:
| | | | | | | | | | | |
| (in thousands) | August 31, |
| 2020 | | 2019 |
| Leasehold improvements | $ | 182,899 | | | $ | 155,520 | |
| Computers and related equipment | 127,794 | | | 129,549 | |
| Furniture and fixtures | 56,269 | | | 48,986 | |
| Subtotal | $ | 366,962 | | | $ | 334,055 | |
| Less accumulated depreciation and amortization | (233,860) | | | (214,671) | |
| Property, equipment and leasehold improvements, net | $ | 133,102 | | | $ | 119,384 | |
Depreciation expense was $32.2 million, $35.4 million and $32.6 million for fiscal years 2020, 2019 and 2018, respectively.
8. GOODWILL
Changes in the carrying amount of goodwill by segment for fiscal years ended August 31, 2020 and 2019 are as follows:
| | | | | | | | | | | | | | | | | | | | | | | |
| (in thousands) | Americas | | EMEA | | Asia Pacific | | Total |
| Balance at August 31, 2018 | $ | 386,195 | | | $ | 312,694 | | | $ | 2,944 | | | $ | 701,833 | |
| Foreign currency translations | — | | | (16,235) | | | 131 | | | (16,104) | |
| Balance at August 31, 2019 | $ | 386,195 | | | $ | 296,459 | | | $ | 3,075 | | | $ | 685,729 | |
| Foreign currency translations | — | | | 23,968 | | | 6 | | | 23,974 | |
| Balance at August 31, 2020 | $ | 386,195 | | | $ | 320,427 | | | $ | 3,081 | | | $ | 709,703 | |
Goodwill is not amortized as it is estimated to have an indefinite life. At least annually, the Company is required to test goodwill at the reporting unit level for potential impairment, and, if impaired, write down to fair value based on the present value of discounted cash flows. The Company’s reporting units evaluated for potential impairment were the Americas, EMEA and Asia Pacific, which reflect the level of internal reporting the Company uses to manage its business and operations. The three reporting units are consistent with the operating segments reported as there is no discrete financial information available for the subsidiaries within each operating segment. The Company performed its annual goodwill impairment test during the fourth quarter of fiscal 2020, consistent with the timing of previous years, utilizing a qualitative analysis, and concluded it was more likely than not the fair value of each reporting unit was greater than its respective carrying value and no impairment charge was required.
9. INTANGIBLE ASSETS
FactSet’s identifiable intangible assets consist of acquired content databases, client relationships, acquired software technology, internally developed software, non-compete agreements and trade names resulting from previous acquisitions, which have been fully integrated into the Company’s operations. The Company amortizes intangible assets over their estimated useful lives. Data content intangible assets have estimated useful lives ranging from five to 20 years. Client relationship intangible assets have estimated useful lives ranging from eight to 18 years. Acquired software technology intangible assets have estimated useful lives ranging from three to nine years. The majority of the developed software technology intangible assets has estimated useful lives ranging from three to five years. Non-compete agreement intangible assets have estimated useful lives ranging from two to four years. Trade name intangible assets have estimated useful lives ranging from four to seven years. The weighted average useful life of the Company’s intangible assets at August 31, 2020 was 11.9 years. The Company evaluates the intangible asset useful lives on an annual basis to determine whether events and circumstances warrant a revision to the remaining period of amortization. There have been no material changes to the estimate of the remaining useful lives during fiscal years 2020, 2019 and 2018.
The Company assesses the intangible assets for indicators of impairment on a quarterly basis. If indicators of impairment are present, amortizable intangible assets are tested for impairment by comparing the carrying value to undiscounted cash flows and, if impaired, written down to fair value based on discounted cash flows. No impairment of intangible assets has been identified during any of the periods presented. The intangible assets have no assigned residual values.
The gross carrying amounts and accumulated amortization totals related to the Company’s identifiable intangible assets are as follows:
| | | | | | | | | | | | | | | | | |
| At August 31, 2020 (in thousands) | Gross Carrying Amount | | Accumulated Amortization | | Net Carrying Amount |
| Data content | $ | 35,872 | | | $ | 24,847 | | | $ | 11,025 | |
| Client relationships | 100,316 | | | 43,026 | | | 57,290 | |
| Acquired software technology | 108,384 | | | 72,396 | | | 35,988 | |
| Internally developed software | 30,276 | | | 13,689 | | | 16,587 | |
| Non-compete agreements | 1,388 | | | 1,355 | | | 33 | |
| Trade names | 4,106 | | | 3,934 | | | 172 | |
| Total | $ | 280,342 | | | $ | 159,247 | | | $ | 121,095 | |
| | | | | | | | | | | | | | | | | |
| At August 31, 2019 (in thousands) | Gross Carrying Amount | | Accumulated Amortization | | Net Carrying Amount |
| Data content | $ | 32,200 | | | $ | 21,512 | | | $ | 10,688 | |
| Client relationships | 95,905 | | | 35,506 | | | 60,399 | |
| Acquired software technology | 105,426 | | | 56,965 | | | 48,461 | |
| Internally developed software | 14,262 | | | 10,365 | | | 3,897 | |
| Non-compete agreements | 1,311 | | | 1,228 | | | 83 | |
| Trade names | 3,994 | | | 3,074 | | | 920 | |
| Total | $ | 253,098 | | | $ | 128,650 | | | $ | 124,448 | |
Amortization expense recorded for intangible assets during fiscal years 2020, 2019 and 2018 was $25.4 million, $25.1 million and $24.7 million, respectively. As of August 31, 2020, estimated intangible asset amortization expense for each of the next five years and thereafter are as follows:
| | | | | |
Fiscal Year (in thousands) | Estimated Amortization Expense |
| 2021 | $ | 26,939 | |
| 2022 | 24,133 | |
| 2023 | 18,092 | |
| 2024 | 10,389 | |
| 2025 | 7,712 | |
| Thereafter | 33,830 | |
| Total | $ | 121,095 | |
10. INCOME TAXES
Income tax expense is based on taxable income determined in accordance with current enacted laws and tax rates. Deferred income taxes are recorded for the temporary differences between the financial statement and tax bases of assets and liabilities using currently enacted tax rates.
Provision for Income Taxes
The provision for income taxes is as follows:
| | | | | | | | | | | | | | | | | |
| (in thousands) | Years ended August 31, |
| 2020 | | 2019 | | 2018 |
| U.S. operations | $ | 280,283 | | | $ | 288,860 | | | $ | 199,654 | |
| Non-U.S. operations | 146,851 | | | 133,105 | | | 152,184 | |
| Income before income taxes | $ | 427,134 | | | $ | 421,965 | | | $ | 351,838 | |
| | | | | |
| U.S. operations | $ | 31,926 | | | $ | 55,824 | | | $ | 65,778 | |
| Non-U.S. operations | 22,270 | | | 13,351 | | | 18,975 | |
| Total provision for income taxes | $ | 54,196 | | | $ | 69,175 | | | $ | 84,753 | |
| | | | | |
| Effective tax rate | 12.7 | % | | 16.4 | % | | 24.1 | % |
The components of the provision for income taxes consist of the following:
| | | | | | | | | | | | | | | | | |
| (in thousands) | Years ended August 31, |
| 2020 | | 2019 | | 2018 |
| Current | | | | | |
| U.S. federal | $ | 9,332 | | | $ | 35,688 | | | $ | 58,835 | |
| U.S. state and local | 8,034 | | | 18,389 | | | 5,159 | |
| Non-U.S. | 27,640 | | | 17,376 | | | 22,669 | |
| Total current taxes | $ | 45,006 | | | $ | 71,453 | | | $ | 86,663 | |
| | | | | |
| Deferred | | | | | |
| U.S. federal | $ | 11,896 | | | $ | 1,813 | | | $ | 2,079 | |
| U.S. state and local | 2,665 | | | (217) | | | (295) | |
| Non-U.S. | (5,371) | | | (3,874) | | | (3,694) | |
| Total deferred taxes | $ | 9,190 | | | $ | (2,278) | | | $ | (1,910) | |
| Total provision for income taxes | $ | 54,196 | | | $ | 69,175 | | | $ | 84,753 | |
The Company’s effective tax rate will vary based on, among other things, changes in levels of foreign income, as well as discrete and other nonrecurring events that may not be predictable. The provision for income taxes differs from the amount of income tax determined by applying the U.S. statutory federal income tax rate to income before income taxes as a result of the following recurring factors and nonrecurring events, including the taxation of foreign income:
| | | | | | | | | | | | | | | | | | | | |
| | Years ended August 31, | |
| (expressed as a percentage of income before income taxes) | 2020 | | 2019 | | 2018 | |
| Tax at U.S. Federal statutory tax rate | 21.0 | % | | 21.0 | % | | 25.7 | % | |
| Increase (decrease) in taxes resulting from: | | | | | | |
| State and local taxes, net of U.S. federal income tax benefit | 3.1 | | | 4.0 | | | 2.9 | | |
| Foreign income at other than U.S. rates | (1.4) | | | (1.4) | | | (3.2) | |
|
| Foreign derived intangible income ("FDII") deduction | (1.8) | | | (1.7) | | | — | | |
| Domestic production activities deduction | — | | | — | | | (1.6) | | |
| Income tax benefits from R&D tax credits | (3.8) | | | (3.5) | | | (3.7) | | |
| Share-based payments | (3.7) | | | (3.2) | | | (2.7) | | |
| One-time transition tax from TCJA | — | | | (0.4) | | (1) | 6.6 | | (1) |
| Other, net | (0.7) | | | 1.6 | | | 0.1 | | |
| Effective tax rate | 12.7 | % | | 16.4 | % | | 24.1 | % | |
1.The enactment of the TCJA resulted in a one-time transition tax expense of $23.2 million during fiscal 2018 and a $3.4 million net benefit revision recorded during fiscal 2019 associated with finalizing the accounting for the tax effects of the TCJA during fiscal 2019.
The fiscal 2020 provision for income taxes was $54.2 million, compared to $69.2 million in fiscal 2019, a decrease of 21.7%. The decrease was primarily due to a lower effective tax rate in fiscal 2020 compared to the prior year period, driven mainly by higher research and development ("R&D") tax credits and a higher FDII deduction. The decrease was also driven by a reduction from finalizing prior year tax returns, which resulted in a benefit of $3.7 million from finalizing prior year tax returns in fiscal 2020 compared to an increase to the provision of $7.7 million in fiscal 2019. Additionally, the decrease in the provision was attributed to $1.9 million in higher windfall tax benefits from stock-based compensation for fiscal 2020 compared to fiscal 2019, partially offset by a $3.4 million income tax benefit from the revision of the one-time transition tax permitted by the TCJA recognized during fiscal 2019.
Due to the changes in taxation of undistributed foreign earnings under the TCJA, FactSet will continue to analyze foreign subsidiary earnings, as well as global working capital requirements, and may repatriate earnings when the amounts are remitted substantially free of additional tax.
Deferred Tax Assets and Liabilities
The significant components of deferred tax assets that recorded within the Consolidated Balance Sheets were as follows:
| | | | | | | | | | | |
| (in thousands) | At August 31, |
| 2020 | | 2019 |
| Deferred tax assets: | | | |
| Depreciation on property, equipment and leasehold improvements | $ | — | | | $ | 2,264 | |
| Deferred rent | — | | | 9,479 | |
| Lease liabilities | 56,280 | | | — | |
| Stock-based compensation | 16,341 | | | 14,822 | |
| Unrealized tax loss on investment | 4,172 | | | — | |
| Other | 8,840 | | | 9,903 | |
| Total deferred tax assets | $ | 85,633 | | | $ | 36,468 | |
The significant components of deferred tax liabilities recorded within the Consolidated Balance Sheets were as follows:
| | | | | | | | | | | |
| (in thousands) | At August 31, |
| 2020 | | 2019 |
| Deferred tax liabilities: | | | |
| Depreciation on property, equipment and leasehold improvements | $ | 15,291 | | | $ | — | |
| Purchased intangible assets, including acquired technology | 43,088 | | | 44,304 | |
| Lease right-of-use assets | 45,344 | | | — | |
| Other | 1,623 | | | 984 | |
| Total deferred tax liabilities | $ | 105,346 | | | $ | 45,288 | |
Unrecognized Tax Positions
Applicable accounting guidance prescribes a comprehensive model for the financial statement recognition, measurement, classification and disclosure of uncertain tax positions that a company has taken or expects to take on a tax return. FactSet recognizes the financial effect of an income tax position only if it is more likely than not (greater than 50%) that the tax position will be sustained based on its technical merits of the tax position. Otherwise, no benefit or expense can be recognized in the Consolidated Financial Statements. The tax benefits recognized are measured based on the largest benefit that has a greater than 50% likelihood of being realized upon effective settlement with a taxing authority. Additionally, FactSet accrues interest on all tax exposures for which reserves have been established consistent with jurisdictional tax laws.
The determination of liabilities related to unrecognized tax benefits, including associated interest and penalties, requires significant estimates. There can be no assurance that the Company will accurately predict the audit outcomes, however, FactSet has no reason to believe that such audits will result in the payment of additional taxes and/or penalties that would have a material adverse effect on the Company’s results of operations or financial position, beyond current estimates. For this reason and due to ongoing audits by multiple tax authorities, FactSet will regularly engage in discussions and negotiations with tax authorities regarding tax matters in various jurisdictions. The Company adjusts these reserves in light of changing facts and circumstances, such as the closing of a tax audit or the refinement of an estimate. To the extent that the final outcome of these matters is different than the amounts recorded, such differences will affect the provision for income taxes in the period in which such determination is made. The Company does not currently anticipate that the total amounts of unrecognized tax benefits will significantly change within the next 12 months.
FactSet classifies the liability for unrecognized tax benefits as Taxes Payable (non-current) and to the extent that the Company anticipates payment of cash within one year, the benefit will be classified as Taxes Payable (current). Additionally, the Company accrues interest on all tax exposures for which reserves have been established consistent with jurisdictional tax laws. This interest is classified as income tax expense in the financial statements. As of August 31, 2020, FactSet had gross unrecognized tax benefits totaling $12.3 million, including $0.9 million of accrued interest, recorded as Taxes Payable (non-current) within the Consolidated Balance Sheets.
The following table summarizes the changes in the balance of gross unrecognized tax benefits:
| | | | | |
| (in thousands) | |
| Unrecognized income tax benefits at August 31, 2017 | $ | 11,484 | |
| Additions based on tax positions related to the current year | 2,954 | |
| Additions for tax positions of prior years | 531 | |
| Statute of limitations lapse | (3,146) | |
| Reductions from settlements with Taxing Authorities | (2,600) | |
| Unrecognized income tax benefits at August 31, 2018 | $ | 9,223 | |
| Additions based on tax positions related to the current year | 3,133 | |
| Additions for tax positions of prior years | 507 | |
| Statute of limitations lapse | (1,979) | |
| Unrecognized income tax benefits at August 31, 2019 | $ | 10,884 | |
| Additions based on tax positions related to the current year | 3,533 | |
| Release for tax positions of prior years | (2,086) | |
| Unrecognized income tax benefits at August 31, 2020 | $ | 12,331 | |
In the normal course of business, the Company’s tax filings are subject to audit by federal, state and foreign tax authorities. At August 31, 2020, the Company remained subject to examination in the following major tax jurisdictions for the tax years as indicated below:
| | | | | | | | | | | |
| Major Tax Jurisdictions | Open Tax Years |
| U.S. | | | |
| Federal | 2017 | through | 2019 |
| State (various) | 2017 | through | 2019 |
| | | |
| Europe | | | |
| United Kingdom | 2018 | through | 2019 |
| France | 2018 | through | 2019 |
| Germany | 2017 | through | 2019 |
11. LEASES
In February 2016, the FASB issued an accounting standard update related to accounting for leases. The update requires the recognition of lease ROU assets and lease liabilities on the balance sheet and the disclosure of qualitative and quantitative information about leasing arrangements. FactSet adopted the standard, ASC 842, as of September 1, 2019, using a modified retrospective approach to record the required cumulative effect adjustments to the opening balance sheet in the period of adoption.
FactSet reviews new arrangements at inception to evaluate whether the Company obtains substantially all the economic benefits of and has the right to control the use of an asset. If FactSet determines that an arrangement qualifies as a lease, a lease liability and a corresponding lease ROU asset are recognized on the lease commencement date which includes fixed lease payments and certain qualifying index-based variable payments.
In determining the amount of lease payments used in measuring each lease ROU asset and lease liability, FactSet elected the package of practical expedients permitted under the transition guidance, which permits the Company not to reassess under the new standard the prior conclusions about lease identification, lease classification, and initial direct costs. FactSet did not elect the use-of-hindsight practical expedient in determining the lease term and in assessing impairment. FactSet elected the practical expedient not to separate lease components from non-lease components but, rather, to combine them into one single lease component, which we recognize over the expected lease term on a straight-line expense basis in occupancy costs (a component of SG&A expense). The Company has also elected to apply the short-term lease exception to not recognize lease ROU assets and lease liabilities for leases with a term of 12 months or less. FactSet will recognize these lease payments on a straight-line basis over the lease term in occupancy costs.
The adoption of the lease standard primarily related to the Company’s real estate operating leases. As a result of the adoption of the standard, the Company recognized lease liabilities (initially measured at the present value of the future minimum lease payments over the remaining lease term at the commencement date) of $266.4 million as of November 30, 2019, included in Current and Long-term lease liabilities on the Consolidated Balance Sheet. The Company also recognized lease ROU assets, net of amortization (initially measured as the lease liabilities, adjusted for deferred rent and lease incentives) of $217.0 million as of November 30, 2019, included in Lease right-of-use assets, net on the Consolidated Balance Sheet. As of August 31, 2020, the Lease right-of-use assets, net balance was $248.9 million and the Current and Long-term lease liabilities balance was $301.3 million, classified in the same Consolidated Balance Sheet accounts used upon adoption.
Lease liabilities are measured as the present value of the future minimum lease payments over the lease term using FactSet’s incremental borrowing rate ("IBR") within the geography where the leased asset is located, as there is no rate implicit in the Company’s operating lease arrangements. As FactSet does not have any outstanding public debt, the Company estimates the IBR based on FactSet’s estimated credit rating and available market information. The IBR is determined at lease commencement, or as of September 1, 2019 for operating leases in existence upon adoption of ASC 842. The IBR is subsequently reassessed upon a modification to the lease arrangement.
As of August 31, 2020, the Company’s leases have remaining terms of less than one year to just over 15 years. The lease ROU assets and lease liabilities recognized did not include any renewal or termination options that were not yet reasonably certain to be exercised.
For fiscal 2019 and 2018, the Company followed ASC 840-10, Leases, which required the recognition of rent expense on a straight-line basis over the lease term. Rent expense for office space, as well as operating expenses associated with the leased premises, primarily related to utilities, real estate taxes, insurance and maintenance for fiscal 2019 and 2018 was $56.7 million and $54.6 million, respectively. For fiscal 2020, the Company followed ASC 842, and recognized fixed lease payments and qualifying index-based variable payments on a straight-line basis over the lease term, resulting in a net operating lease expense of $43.0 million for fiscal 2020. FactSet recognized $17.9 million in occupancy costs that were not included in the measurement of the lease liabilities during fiscal 2020, primarily related to variable non-lease costs and leases that qualified for the short-term lease exception. These variable non-lease costs included costs that were not fixed at the lease commencement date nor dependent on an index or a rate, which primarily related to utilities, real estate taxes, insurance and maintenance.
The following table reconciles FactSet’s future undiscounted cash flows related to the Company’s operating leases and the reconciliation to the Current and Long-term lease liabilities as of August 31, 2020:
| | | | | |
(in thousands) | Minimum Lease
Payments |
| Fiscal Years Ended August 31 |
| 2021 | $ | 40,848 | |
| 2022 | 39,958 | |
| 2023 | 36,426 | |
| 2024 | 34,530 | |
| 2025 | 33,742 | |
| Thereafter | 186,658 | |
| Total | 372,162 | |
| Imputed Interest | 70,837 | |
| Present Value | $ | 301,325 | |
FactSet previously entered into a real estate lease in the Philippines, which was planned to commence in phases, providing FactSet with access to the underlying leased rental space during fiscal 2020 and the first quarter of fiscal 2021. The rental space that FactSet has not taken possession of as of August 31, 2020 is not included in the table above nor included in the Lease ROU assets, net and Current and Long-term lease liabilities on the Consolidated Balance Sheets as of August 31, 2020. The overall lease term is approximately 10 years and the undiscounted future rent payments for the lease that has not commenced as of August 31, 2020 is approximately $19 million.
The following table summarizes the Company's lease term and discount rate assumptions related to the operating leases recorded on the Consolidated Balance Sheets as of August 31, 2020:
| | | | | |
| As of August 31, 2020 |
Weighted average remaining lease term (in years) | 10.1 |
Weighted average discount rate (IBR) | 4.2% |
The following table summarizes supplemental cash flow information related to the Company's operating leases:
| | | | | |
(in thousands) | As of August 31, 2020 |
| Cash paid for amounts included in the measurement of lease liabilities | $39.7 |
| Lease ROU assets obtained in exchange for lease liabilities | $43.7 |
12. DEBT
FactSet’s debt obligations consisted of the following:
| | | | | | | | | | | |
| (in thousands) | At August 31, |
| 2020 | | 2019 |
| 2019 Revolving Credit Facility | $ | 575,000 | | | $ | 575,000 | |
| Loan origination fees | $ | (646) | | | (826) | |
| Long-term debt | $ | 574,354 | | | $ | 574,174 | |
2019 Credit Agreement
On March 29, 2019, the Company entered into a credit agreement between FactSet, as the borrower, and PNC Bank, National Association ("PNC") (the "2019 Credit Agreement"), as the administrative agent and lender. The 2019 Credit Agreement provides for a $750.0 million revolving credit facility (the "2019 Revolving Credit Facility"). FactSet may request borrowings
under the 2019 Revolving Credit Facility until its maturity date of March 29, 2024. The 2019 Credit Agreement also allows FactSet, subject to certain requirements, to arrange for additional borrowings with PNC for an aggregate amount up to $500.0 million, provided that any such request for additional borrowings must be in a minimum amount of $25.0 million.
FactSet borrowed $575.0 million of the available $750.0 million provided by the 2019 Revolving Credit Facility, resulting in $175.0 million available to be withdrawn. FactSet is required to pay a commitment fee using a pricing grid currently at 0.10% based on the daily amount by which the available balance in the 2019 Revolving Credit Facility exceeds the borrowed amount. All outstanding loan amounts are reported as Long-term debt within the consolidated balance sheets at August 31, 2020. The principal balance is payable in full on the maturity date.
The fair value of our long-term debt was $575.0 million as of August 31, 2020, which the Company believe approximates carrying amount as the terms and interest rates approximate market rates given its floating interest rate basis. Borrowings under the loan bear interest on the outstanding principal amount at a rate equal to the daily LIBOR plus a spread using a debt leverage pricing grid, currently at 0.875%. During fiscal 2020, FactSet recorded interest expense on its outstanding debt, including the amortization of debt issuance costs, net of the effects of the interest rate swap agreement of $12.9 million. During fiscal 2019 and 2018, FactSet recorded interest expense on its outstanding debt, including the amortization of debt issuance costs, of $19.8 million and $15.9 million, respectively. Including the effects of the interest rate swap agreement, the weighted average interest rate on amounts outstanding under the Company's credit facilities was 2.20%. The weighted average interest rate for fiscal 2019 was 3.35%. Interest on the loan outstanding is payable quarterly, in arrears, and on the maturity date.
During fiscal 2019, FactSet incurred approximately $0.9 million in debt issuance costs related to the 2019 Credit Agreement. These costs were capitalized as loan origination fees and are amortized into interest expense ratably over the term of the 2019 Credit Agreement.
The 2019 Credit Agreement contains covenants and requirements restricting certain FactSet activities, which are usual and customary for this type of loan. In addition, the 2019 Credit Agreement requires that FactSet maintain a consolidated net leverage ratio, as measured by total net funded debt/EBITDA below a specified level as of the end of each fiscal quarter. The Company was in compliance with all the covenants and requirements within the 2019 Credit Agreement as of August 31, 2020.
The borrowings from the 2019 Credit Agreement were used to retire all outstanding debt under the previous 2017 Credit Agreement between FactSet, as the borrower, and PNC as the lender on March 29, 2019. The total principal amount of the debt outstanding at the time of retirement was $575.0 million and there were no prepayment penalties.
2017 Credit Agreement
On March 17, 2017, the Company entered into a Credit Agreement (the "2017 Credit Agreement") between FactSet, as the borrower, and PNC, as the administrative agent and lender. The 2017 Credit Agreement provided for a $575.0 million revolving credit facility. Borrowings under the loan were subject to interest on the outstanding principal amount at a rate equal to the daily LIBOR plus 1.00%. Interest on the loan outstanding was payable quarterly in arrears and on the maturity date. The principal balance was also payable in full on the maturity date. There were no prepayment penalties when the Company elected to prepay the outstanding loan amounts on March 29, 2019.
13. COMMITMENTS AND CONTINGENCIES
Commitments represent obligations, such as those for future purchases of goods or services that are not yet recorded on the balance sheet as liabilities. FactSet records liabilities for commitments when incurred (i.e., when the goods or services are received).
Purchase Commitments with Suppliers
Purchase obligations represent payments due in future periods in respect of commitments to the Company’s various data vendors as well as commitments to purchase goods and services such as telecommunication and computer maintenance services. These purchase commitments are agreements that are enforceable and legally binding on FactSet, and they specify all significant terms, including: fixed or minimum quantities to be purchased; fixed, minimum or variable price provisions; and the approximate timing of the transaction. As of August 31, 2020 and 2019, the Company had total purchase commitments with suppliers of $226.0 million and $69.9 million, respectively. Refer to Note 11, Leases and Note 12, Debt for information regarding lease commitments and outstanding debt obligations, respectively.
Letters of Credit
Approximately $2.9 million of standby letters of credit have been issued during the ordinary course of business in connection with the Company’s current leased office space as of August 31, 2020. These standby letters of credit contain covenants that, among other things, require FactSet to maintain minimum levels of consolidated net worth and certain leverage and fixed charge ratios. As of August 31, 2020 and 2019, FactSet was in compliance with all covenants contained in the standby letters of credit.
Contingencies
Income Taxes
Uncertain income tax positions are accounted for in accordance with applicable accounting guidance, refer to Note 10, Income Taxes for further details. FactSet is currently under audit by tax authorities and has reserved for potential adjustments to its provision for income taxes that may result from examinations by, or any negotiated settlements with, these tax authorities. The Company believes that the final outcome of these examinations or settlements will not have a material effect on its results of operations. If events occur which indicate payment of these amounts is unnecessary, the reversal of the liabilities would result in the recognition of tax benefits in the period FactSet determines the liabilities are no longer necessary. If the Company’s estimates of the federal, state, and foreign income tax liabilities are less than the ultimate assessment, a further charge to expense would result.
Legal Matters
FactSet accrues non income-tax liabilities for contingencies when management believes that a loss is probable, and the amounts can be reasonably estimated, while contingent gains are recognized only when realized. The Company is engaged in various legal proceedings, claims and litigation that have arisen in the ordinary course of business, including employment matters, commercial and intellectual property litigation. The outcome of all the matters against the Company is subject to future resolution, including the uncertainties of litigation. Based on information available at August 31, 2020, FactSet’s management believes that the ultimate outcome of these unresolved matters against the Company, individually or in the aggregate, will not have a material adverse effect on the Company's consolidated financial position, its results of operations or its cash flows.
Sales Tax Matters
In August 2019, FactSet received a Notice of Intent to Assess (the "Notice") additional sales taxes, interest and underpayment penalties from the Commonwealth of Massachusetts Department of Revenue (the "Commonwealth") relating to prior tax periods. The Notice follows FactSet’s previously disclosed response to a letter from the Commonwealth requesting additional sales information. Based upon the Notice, it is the Commonwealth's intention to assess sales/use tax, interest and penalties on previously recorded sales transactions. The Company filed an appeal to the Notice and intends to contest any such assessment, if assessed, and continues to cooperate with the Commonwealth’s inquiry. Due to uncertainty surrounding the assessment process, the Company is unable to reasonably estimate the ultimate outcome of this matter and, as such, has not recorded a liability as of August 31, 2020. While FactSet believes that it will ultimately prevail if the Company is presented with a formal assessment; if FactSet does not prevail, the amount could have a material impact on the Company’s consolidated financial position, cash flows and results of operations.
Indemnifications
As permitted or required under Delaware law and to the maximum extent allowable under that law, FactSet has certain obligations to indemnify its current and former officers and directors for certain events or occurrences while the officer or director is, or was serving, at FactSet’s request in such capacity. These indemnification obligations are valid as long as the director or officer acted in good faith and in a manner the person reasonably believed to be in, or not opposed to, the best interests of the Company, and with respect to any criminal action or proceeding, had no reasonable cause to believe his or her conduct was unlawful. The maximum potential amount of future payments FactSet could be required to make under these indemnification obligations is unlimited; however, FactSet has a director and officer insurance policy that it believes mitigates FactSet's exposure and may enable FactSet to recover a portion of any future amounts paid. The Company believes the estimated fair value of these indemnification obligations is immaterial.
14. STOCKHOLDERS’ EQUITY
Preferred Stock
At August 31, 2020 and 2019, there were 10,000,000 shares of preferred stock ($0.01 par value per share) authorized, of which no shares were issued and outstanding. FactSet’s Board of Directors may from time to time authorize the issuance of one or more series of preferred stock and, in connection with the creation of such series, determine the characteristics of each such series including, without limitation, the preference and relative, participating, optional or other special rights, and the qualifications, limitations or restrictions of the series.
Common Stock
At August 31, 2020 and 2019, there were 150,000,000 shares of common stock ($0.01 par value per share) authorized, of which 40,767,708 and 40,104,192 shares were issued, respectively. The authorized shares of common stock are issuable for any proper corporate purpose, including future stock splits, stock dividends, acquisitions, raising capital or to adopt additional employee benefit plans.
Shares of common stock outstanding were as follows:
| | | | | | | | | | | | | | | | | |
| (in thousands) | Years ended August 31, |
| 2020 | | 2019 | | 2018 |
Balance, beginning of year at September 1, 2019, 2018 and 2017, respectively | 38,118 | | | 38,193 | | | 39,023 | |
| Common stock issued for employee stock plans | 663 | | | 839 | | | 712 | |
Repurchase of common stock from employees(1) | (12) | | | (32) | | | (8) | |
| Repurchase of common stock under the share repurchase program | (739) | | | (882) | | | (1,534) | |
Balance, end of year at August 31, 2020, 2019, and 2018 respectively | 38,030 | | | 38,118 | | | 38,193 | |
(1)For fiscal years 2020, 2019 and 2018, the Company repurchased 11,945, 31,644 and 8,070 shares, or $3.5 million, $7.2 million and $1.5 million, of common stock, respectively, in settlement of employee tax withholding obligations to cover their cost of taxes due upon the vesting and exercise of stock-based awards.
Treasury Stock
On January 31, 2018, FactSet retired 13,292,689 shares of treasury stock. These retired shares are now included in the Company’s pool of authorized but unissued shares. The retired treasury stock was initially recorded using the cost method and had a carrying value of $1.7 billion at January 31, 2018. The Company’s accounting policy upon the formal retirement of treasury stock is to deduct its par value from common stock ($0.1) million, reduce additional paid-in capital ("APIC") by the average amount recorded in APIC when stock was originally issued ($186.7) million and any remaining excess of cost as a reduction to retained earnings ($1.5) billion.
At August 31, 2020, and 2019, there were 2,737,456 and 1,986,352 shares of treasury stock (at cost) outstanding, respectively.
Share Repurchase Program
Repurchases of shares of common stock are made from time to time in the open market and privately negotiated transactions, subject to market conditions. During fiscal 2020, the Company repurchased 0.7 million shares for $199.6 million compared to 0.9 million shares for $213.1 million in fiscal 2019.
On March 24, 2020, the Board of Directors of FactSet approved a $220.0 million increase to the existing share repurchase program. Subsequent to this expansion, a total of $259.0 million remained authorized for future share repurchases as of August 31, 2020. There is no defined number of shares to be repurchased over a specified timeframe through the life of the share repurchase program. It is expected that share repurchases will be paid using existing and future cash generated by operations.
Restricted Stock
Awards of restricted stock entitle the holder to shares of common stock as the awards vest over time. During fiscal 2020, 32,996 shares of previously granted restricted stock vested and were included in common stock outstanding as of August 31, 2020 (recorded net of 11,945 shares repurchased from employees at a cost of $3.5 million to cover their cost of taxes upon vesting of the restricted stock). During fiscal 2019, 85,401 shares of previously granted restricted stock vested and were included in
common stock outstanding as of August 31, 2019 (recorded net of 31,644 shares repurchased from employees at a cost of $7.2 million to cover their cost of taxes upon vesting of the restricted stock).
Dividends
The Company’s Board of Directors declared the following dividends on our common stock during the periods presented:
| | | | | | | | | | | | | | | | | | | | | | | | | | |
| Year Ended | | Dividends per
Share of
Common Stock | | Record Date | | Total amount (in thousands) | | Payment Date |
| Fiscal 2020 | | | | | | | | |
| First Quarter | | $ | 0.72 | | | November 29, 2019 | | $ | 27,291 | | | December 19, 2019 |
| Second Quarter | | $ | 0.72 | | | February 28, 2020 | | $ | 27,251 | | | March 19, 2020 |
| Third Quarter | | $ | 0.77 | | | May 29, 2020 | | $ | 29,189 | | | June 18, 2020 |
| Fourth Quarter | | $ | 0.77 | | | August 31, 2020 | | $ | 29,283 | | | September 17, 2020 |
| | | | | | | | |
| Fiscal 2019 | | | | | | | | |
| First Quarter | | $ | 0.64 | | | November 30, 2018 | | $ | 24,372 | | | December 18, 2018 |
| Second Quarter | | $ | 0.64 | | | February 28, 2019 | | $ | 24,385 | | | March 19, 2019 |
| Third Quarter | | $ | 0.72 | | | May 31, 2019 | | $ | 27,506 | | | June 18, 2019 |
| Fourth Quarter | | $ | 0.72 | | | August 31, 2019 | | $ | 27,445 | | | September 19, 2019 |
Future cash dividend payments will depend on the Company’s earnings, capital requirements, financial condition and other factors considered relevant by the Company and are subject to final determination by the Company’s Board of Directors.
On May 5, 2020, FactSet's Board of Directors approved a 7% increase in the regular quarterly dividend from $0.72 to $0.77 per share.
Accumulated Other Comprehensive Loss
The components of AOCL are as follows:
| | | | | | | | | | | |
| (in thousands) | August 31, 2020 | | August 31, 2019 |
| Accumulated unrealized losses on cash flow hedges, net of tax | $ | (1,591) | | | $ | (2,266) | |
| Accumulated foreign currency translation adjustments | (37,702) | | | (72,278) | |
| Total AOCL | $ | (39,293) | | | $ | (74,544) | |
15. EARNINGS PER SHARE
A reconciliation of the weighted average shares outstanding used in the basic and diluted earnings per share ("EPS") computations is as follows:
| | | | | | | | | | | | | | | | | |
| (in thousands, except per share data) | Net Income
(Numerator) | | Weighted Average Common Shares
(Denominator) | | Per Share Amount |
| For the year ended August 31, 2020 | | | | | |
| Basic EPS | | | | | |
| Income available to common stockholders | $ | 372,938 | | | 37,936 | | | $ | 9.83 | |
| Diluted EPS | | | | | |
| Dilutive effect of stock options and restricted stock | | | 710 | | | |
| Income available to common stockholders plus assumed conversions | $ | 372,938 | | | 38,646 | | | $ | 9.65 | |
| For the year ended August 31, 2019 | | | | | |
| Basic EPS | | | | | |
| Income available to common stockholders | $ | 352,790 | | | 38,144 | | | $ | 9.25 | |
| Diluted EPS | | | | | |
| Dilutive effect of stock options and restricted stock | | | 729 | | | |
| Income available to common stockholders plus assumed conversions | $ | 352,790 | | | 38,873 | | | $ | 9.08 | |
| For the year ended August 31, 2018 | | | | | |
| Basic EPS | | | | | |
| Income available to common stockholders | $ | 267,085 | | | 38,733 | | | $ | 6.90 | |
| Diluted EPS | | | | | |
| Dilutive effect of stock options and restricted stock | | | 644 | | | |
| Income available to common stockholders plus assumed conversions | $ | 267,085 | | | 39,377 | | | $ | 6.78 | |
Dilutive potential common shares consist of stock options and unvested performance-based awards. There were 1,750 stock options excluded from the calculation of diluted EPS as of August 31, 2020, because their inclusion would have been anti-dilutive. There were 11,481 stock options excluded from the calculation of diluted EPS as of August 31, 2019.
Performance-based awards are omitted from the calculation of diluted EPS until it is determined that the performance criteria has been met at the end of the reporting period. As of August 31, 2020, there were 35,666 performance-based awards excluded from the calculation of diluted EPS. There were no performance-based awards excluded from the calculation of diluted EPS as of August 31, 2019.
16. STOCK-BASED COMPENSATION
The Company recognized total stock-based compensation expense of $36.6 million, $32.4 million and $31.5 million in fiscal 2020, 2019 and 2018, respectively. As of August 31, 2020, $81.9 million of total unrecognized compensation expense related to
non-vested awards is expected to be recognized over a weighted average period of 2.9 years. There was no stock-based compensation capitalized as of August 31, 2020 and 2019, respectively.
Stock Option Awards
A summary of stock option activity is as follows:
| | | | | | | | | | | | | | |
| Number Outstanding | Weighted Average
Exercise Price Per Share | Aggregate Intrinsic Value | Weighted Average Remaining Contractual Life (years) |
| | | | |
| Outstanding as of August 31, 2017 | 3,366 | | $ | 139.29 | | | |
| Granted – non performance-based | 575 | | $ | 190.14 | | | |
| Granted – performance-based | 17 | | $ | 200.20 | | | |
| Granted – non-employee Directors grant | 19 | | $ | 197.75 | | | |
| Exercised | (622) | | $ | 113.73 | | | |
| Forfeited | (212) | | $ | 158.14 | | | |
| Outstanding as of August 31, 2018 | 3,143 | | $ | 153.05 | | | |
| Granted – non performance-based | 482 | | $ | 224.35 | | | |
| Granted – non-employee Directors grant | 20 | | $ | 207.88 | | | |
| Exercised | (705) | | $ | 137.61 | | | |
| Forfeited | (416) | | $ | 170.54 | | | |
| Outstanding as of August 31, 2019 | 2,524 | | $ | 168.50 | | | |
| Granted – non performance-based | 424 | | $ | 256.43 | | | |
| Granted – non-employee Directors grant | 16 | | $ | 271.51 | | | |
| Exercised | (588) | | $ | 145.54 | | | |
| Forfeited | (122) | | $ | 218.36 | | | |
| Outstanding as of August 31, 2020 | 2,254 | | $ | 189.32 | | $ | 129.6 | | 6.6 |
| Options vested and exercisable as of August 31, 2020 | 875 | | $ | 155.58 | | $ | 170.4 | | 5.1 |
| Options expected to vest as of August 31, 2020 | 1,264 | | $ | 209.33 | | $ | 178.4 | | 7.5 |
The aggregate intrinsic value represents the difference between the Company’s closing stock price as of August 31, 2020 of $350.40 and the exercise price, multiplied by the number of options exercisable as of that date.
The total pre-tax intrinsic value of stock options exercised during fiscal 2020, 2019 and 2018 was $85.0 million, $73.0 million and $50.1 million, respectively.
Employee Stock Option Awards
The FactSet Research Systems Inc. Stock Option and Award Plan, as amended and restated (the "Long Term Incentive Plan" or "LTIP") provides for the grant of share-based awards, including stock options and performance-based stock options, to employees of FactSet. The expiration date of the Long Term Incentive Plan is December 19, 2027. Stock options granted under the LTIP expire not more than ten years from the date of grant and the majority vest ratably over a period of five years. Options become vested and exercisable, provided the employee continues employment with the Company through the applicable vesting date, and remain exercisable until expiration or cancellation. Vesting of the shares underlying the performance-based stock options are also subject to the Company achieving performance levels during the measurement period subsequent to the date of grant.
Employee Stock Option Fair Value Determinations
The Company utilizes the lattice-binomial option-pricing model ("binomial model") to estimate the fair value of new employee stock option grants. The binomial model is affected by the Company’s stock price, as well as, assumptions regarding several
variables, which include, but are not limited to the Company’s expected stock price volatility over the term of the awards, interest rates, option forfeitures and employee stock option exercise behaviors, to determine the grant date stock option award fair value.
The weighted average estimated fair value of employee stock options granted during fiscal 2020, 2019 and 2018 was determined using the binomial model with the following weighted average assumptions:
(Weighted average assumptions)
| | | | | | | | | | | | | | | | | | | | | | | | | | | | | |
| 2020 | 2019 | 2018 |
| Term structure of risk-free interest rate | 0.10 | % | — | 1.79% | 1.28 | % | — | 3.14% | 1.28 | % | — | 2.41% |
| Expected life (years) | 7.2 | — | 7.2 | 7.1 | — | 7.1 | 7.4 | — | 7.4 |
| Term structure of volatility | 25 | % | — | 25% | 18 | % | — | 29% | 19 | % | — | 29% |
| Dividend yield | 1.09% | 1.15% | 1.32% |
| Weighted average estimated fair value | $60.33 | $57.12 | $48.39 |
| Weighted average exercise price | $256.43 | $224.35 | $190.42 |
| Fair value as a percentage of exercise price | 23.5% | 25.5% | 25.4% |
The risk-free interest rate assumption for periods within the contractual life of the option is based on the U.S. Treasury yield curve in effect at the time of grant. Expected volatility is based on a combination of historical volatility of the Company’s stock and implied volatilities of publicly traded options to buy FactSet common stock with contractual terms closest to the expected life of options granted to employees. The approach to utilize a mix of historical and implied volatility was based upon the availability of actively traded options on the Company’s stock and the Company’s assessment that a combination of implied volatility and historical volatility is best representative of future stock price trends. The Company uses historical data to estimate option exercises and employee termination within the valuation model. The dividend yield assumption is based on the Company’s history and expectation of dividend payouts. The expected life of employee stock options represents the weighted average period the stock options are expected to remain outstanding and is a derived output of the binomial model. The binomial model estimates employees exercise behavior based on the option’s remaining vested life and the extent to which the option is in-the-money. The binomial model estimates the probability of exercise as a function of these two variables based on the entire history of exercises and cancellations of all past option grants made by the Company.
Non-Employee Directors' Stock Option Awards
The FactSet Research Systems Inc. Non-Employee Directors’ Stock Option and Award Plan as Amended and Restated (the “Director Plan”) provides for the grant of share-based awards, including stock options, to non-employee directors of FactSet. The expiration date of the Director Plan is December 19, 2027. The non-qualified stock options granted to directors vest 100% after three years on the anniversary date of the grant and expire seven years from the date the options were granted. As of August 31, 2020, shares available for future grant under the Director Plan was 249,886. The expiration date of the Director Plan is December 19, 2027.
Non-Employee Director Stock Option Fair Value Determinations
The Company utilizes the Black-Scholes model to estimate the fair value of new non-employee Director stock option grants. The Black-Scholes model is affected by the Company’s stock price, as well as, assumptions regarding several variables, which include, but are not limited to, the Company’s expected stock price volatility over the term of the awards, interest rates, option forfeitures and employee stock option exercise behaviors, to determine the grant date stock-based payment award fair value.
On January 15, 2020, January 15, 2019, and January 12, 2018, FactSet granted, 16,080, 20,576, and 18,963 stock options, respectively, to the Company’s non-employee Directors using the weighted average fair values, based on the following weighted average assumptions used in the Black-Scholes option-pricing model:
(Weighted average assumptions)
| | | | | | | | | | | |
| Years ended August 31, |
| 2020 | 2019 | 2018 |
| Fair value | $ | 54.74 | | $ | 42.77 | | $ | 38.76 | |
| Risk-free interest rate | 1.64 % | 2.51 | % | 2.34 | % |
| Expected life (years) | 5.4 | 5.4 | 5.4 |
| Expected volatility | 22.0 | % | 20.5 | % | 19.7 | % |
| Dividend yield | 1.11 % | 1.17 | % | 1.16 | % |
Restricted Stock and Performance Share Unit Awards
The Company’s LTIP provides for the grant of share-based awards, including awards of restricted stock and performance share units ("PSUs"; restricted stock and PSUs, collectively, "Stock Awards"). The Stock Awards are subject to continued employment over a specified period. The Stock Awards granted to employees entitle the holders to shares of common stock as the Stock Awards vest over time, but not to dividends declared on the underlying shares, while the stock subject to the Stock Awards is unvested. Vesting of the shares underlying the PSUs are also subject to the Company achieving performance levels during the measurement period subsequent to the date of grant.
The grant date fair value of Stock Awards is measured by reducing the grant date price of FactSet’s common stock by the present value of the dividends expected to be paid on the underlying stock during the requisite service period, discounted at the appropriate risk-free interest rate. The expense associated with Stock Awards is amortized over the vesting period.
As of August 31, 2020, a total of 145,897 shares underlying Stock Awards were unvested and outstanding, which results in unamortized stock-based compensation of $28.2 million to be recognized as stock-based compensation expense over the remaining vesting period of 2.7 years.
A summary of Stock Award activity is as follows:
| | | | | | | | |
| (in thousands, except per award data) | Number Outstanding | Weighted Average Grant
Date Fair Value Per Award |
| Balance at August 31, 2017 | 182 | | 138.62 |
Granted - restricted stock(1) | 3 | | 189.28 |
| Vested - restricted stock | (27) | | 155.95 |
| Forfeited | (15) | | 116.29 |
| Balance at August 31, 2018 | 143 | | 139.34 |
Granted - restricted stock(1) | 73 | | 239.03 |
| Vested - restricted stock | (85) | | 125.04 |
| Forfeited | (7) | | 181.32 |
| Balance at August 31, 2019 | 124 | | 205.47 |
Granted - restricted stock & PSUs(1)(2) | 74 | | 252.17 |
| Vested - restricted stock | (33) | | 197.37 |
| Forfeited | (19) | | 198.53 |
| Balance at August 31, 2020 | 146 | | 231.55 |
(1)Each Stock Award granted is equivalent to 2.5 shares granted under the LTIP.
(2)FactSet granted 36,709 awards of restricted stock and 36,888 PSUs.
Performance-based Equity Awards
Performance-based equity awards, whether in the form of performance-based stock options or PSUs, require management to make assumptions regarding the likelihood of achieving Company performance targets. The number of performance-based
awards that vest will be predicated on the Company achieving performance levels during the measurement period subsequent to the date of grant. Dependent on the financial performance levels attained by FactSet, a percentage of the performance-based awards will vest to the grantees. However, there is no current guarantee that such awards will vest in whole or in part.
Share-based Awards Available for Grant
A summary of share-based awards available for grant is as follows:
| | | | | | | | |
| (in thousands) | Share-based Awards
Available for Grant under the
Employee Stock Option Plan | Share-based Awards
Available for Grant under the
Non-Employee Stock Option Plan |
| Balance at August 31, 2017 | 897 | | 42 | |
| Increase in the number of shares available for issuance | 5,750 | | 250 | |
| Granted – non performance-based options | (575) | | — | |
| Granted – performance-based options | (17) | | — | |
| Granted – non-employee Directors options | — | | (19) | |
Granted – restricted stock(1) | (9) | | — | |
Forfeited - Share-based awards(2) | 252 | | 9 | |
| Balance at August 31, 2018 | 6,298 | | 282 | |
| Granted – non performance-based options | (481) | | — | |
| Granted – non-employee Directors options | — | | (20) | |
Granted – restricted stock(1) | (183) | | — | |
Forfeited - Share-based awards(2) | 433 | | 2 | |
| Balance at August 31, 2019 | 6,067 | | 264 | |
| Granted – non performance-based options | (424) | | — | |
| Granted – non-employee Directors options | — | | (16) | |
Granted – restricted stock(1) | (93) | | — | |
Granted – PSUs(1) | (91) | | — | |
Forfeited – Share-based awards(2) | 167 | | 2 | |
| Balance at August 31, 2020 | 5,626 | | 250 | |
(1)Each Stock Award granted is equivalent to 2.5 shares granted under the LTIP.
(2)Under the LTIP, for each Stock Award canceled/forfeited, an equivalent of 2.5 shares is added back to the available share-based awards balance.
Employee Stock Purchase Plan
Shares of FactSet common stock may be purchased by eligible employees under the FactSet Research Systems Inc. Employee Stock Purchase Plan, as Amended and Restated (the "ESPP") in three-month intervals. The purchase price is equal to 85% of the lesser of the fair market value of the Company’s common stock on the first day or the last day of each three-month offering period. Employee purchases may not exceed 10% of their gross compensation and there is a $25,000 contribution limit per employee during an offering period. Dividends paid on shares held in the ESPP are used to purchase additional ESPP shares at the market price on the dividend payment date.
During fiscal 2020, employees purchased 42,606 shares at a weighted average price of $234.41 compared to 48,532 shares at a weighted average price of $205.64 in fiscal 2019 and 64,230 shares at a weighted average price of $160.34 in fiscal 2018. Stock-based compensation expense recorded during fiscal 2020, 2019 and 2018 relating to the employee stock purchase plan was $2.1 million, $2.0 million and $1.6 million, respectively. At August 31, 2020, the ESPP had 177,804 shares reserved for future issuance.
The Company uses the Black-Scholes model to calculate the estimated fair value for the employee stock purchase plan. The weighted average estimated fair value of employee stock purchase plan grants during fiscal years 2020, 2019 and 2018, was $50.69, $41.06 and $31.83 per share, respectively, with the following weighted average assumptions:
(Weighted average assumptions)
| | | | | | | | | | | | | | | | | |
| 2020 | | 2019 | | 2018 |
| Risk-free interest rate | 0.95 | % | | 2.33 | % | | 1.55 | % |
| Expected life (months) | 3 | | 3 | | 3 |
| Expected volatility | 20.04 | % | | 10.89 | % | | 10.19 | % |
| Dividend yield | 1.08 | % | | 1.12 | % | | 1.27 | % |
17. EMPLOYEE BENEFIT PLANS
Defined Contribution Plan
The Company established its 401(k) Plan in fiscal 1993. The 401(k) Plan is a defined contribution plan covering all full-time, U.S. employees of the Company and is subject to the provisions of the Employee Retirement Income Security Act of 1974 and the Internal Revenue Code of 1986 ("IRC"). Each year, participants may contribute up to 60% of their eligible annual compensation, subject to annual limitations established by the IRC. The Company matches up to 4% of employees’ earnings, capped at the Internal Revenue Service annual maximum. Company matching contributions are subject to a five-year graduated vesting schedule. All full-time, U.S. employees are eligible for the matching contribution by the Company. The Company contributed $11.3 million, $10.9 million, and $11.6 million in matching contributions to employee 401(k) accounts during fiscal 2020, 2019 and 2018, respectively.
18. SEGMENT INFORMATION
Operating segments are defined as components of an enterprise that have the following characteristics: (i) it engages in business activities from which it may earn revenue and incur expense, (ii) its operating results are regularly reviewed by the company’s chief operating decision maker ("CODM") for resource allocation decisions and performance assessment, and (iii) its discrete financial information is available. The Company's Chief Executive Officer functions as the CODM.
The Company's operating segments are aligned with how the Company, including its CODM, manages the business and the geographic markets in which it serves, with a primary focus on providing integrated global financial and economic information. The Company’s internal financial reporting structure is based on three segments: the Americas, EMEA and Asia Pacific. Withing each of the segments, the Company primarily delivers insight and information through four workflow solutions including Research, Analytics and Trading, CTS and Wealth. These workflow solutions provide global financial and economic information to investment managers, investment banks and other financial services professionals.
The Americas segment serves our clients throughout North, Central, and South America. The EMEA segment serves our clients in countries in Europe and Africa. The Asia Pacific segment serves our clients in countries in Asia and Australia. Segment revenue reflects direct sales to clients based in these respective geographic locations.
Each segment records compensation expense (including stock-based compensation), depreciation of furniture and fixtures, amortization of lease ROU assets, leasehold improvements and intangible assets, as well as communication costs, professional fees, rent expense, travel, office and other direct expenses. Expenditures associated with the Company’s data centers, third-party data costs and corporate headquarters charges are recorded by the Americas segment and are not allocated to the other segments. The content collection centers, located in India, the Philippines, and Latvia, benefit all the Company’s operating segments and thus the expenses incurred at these locations are allocated to each segment based on a percentage of revenue.
Segment Information
Segment Results of Operations
The following tables reflect the results of operations of the Company's segments:
| | | | | | | | | | | | | | |
| (in thousands) | | | | |
| Year Ended August 31, 2020 | Americas | EMEA | Asia Pacific | Total |
| Revenue from clients | $ | 929,444 | | $ | 422,203 | | $ | 142,464 | | $ | 1,494,111 | |
| Segment operating profit | 168,909 | | 179,831 | | 90,920 | | 439,660 | |
| Depreciation and amortization | 36,128 | | 14,338 | | 7,148 | | 57,614 | |
| Stock-based compensation | 28,780 | | 6,576 | | 1,223 | | 36,579 | |
| Capital expenditures | 60,204 | | 2,079 | | 15,359 | | 77,642 | |
| | | | | | | | | | | | | | |
| Year Ended August 31, 2019 | Americas | EMEA | Asia Pacific | Total |
| Revenue from clients | $ | 894,554 | | $ | 408,084 | | $ | 132,713 | | $ | 1,435,351 | |
| Segment operating profit | 179,374 | | 179,258 | | 79,403 | | 438,035 | |
| Depreciation and amortization | 40,018 | | 14,703 | | 5,742 | | 60,463 | |
| Stock-based compensation | 26,152 | | 5,320 | | 928 | | 32,400 | |
| Capital expenditures | 43,647 | | 2,595 | | 13,128 | | 59,370 | |
| | | | | | | | | | | | | | |
| Year Ended August 31, 2018 | Americas | EMEA | Asia Pacific | Total |
| Revenue from clients | $ | 841,908 | | $ | 387,589 | | $ | 120,648 | | $ | 1,350,145 | |
| Segment operating profit | 148,095 | | 148,977 | | 69,132 | | 366,204 | |
| Depreciation and amortization | 37,453 | | 15,710 | | 4,122 | | 57,285 | |
| Stock-based compensation | 26,014 | | 4,857 | | 645 | | 31,516 | |
| Capital expenditures | 20,358 | | 3,140 | | 10,022 | | 33,520 | |
Segment Total Assets
The following table reflects the total assets for the Company's segments:
| | | | | | | | |
| As of August 31, |
| (in thousands) | 2020 | 2019 |
| Segment Assets | | |
| Americas | $ | 1,111,600 | | $ | 851,014 | |
| EMEA | 757,524 | | 588,911 | |
| Asia Pacific | 214,264 | | 120,205 | |
| Total assets | $ | 2,083,388 | | $ | 1,560,130 | |
Geographic Information
The following tables reflect FactSet revenues and long-lived assets, split geographically by the Company's country of domicile (the United States) and other countries where major subsidiaries are domiciled.
Geographic Revenue
The following table sets forth revenue by geography, attributed to countries based on the location of the client:
| | | | | | | | | | | | | | | | | |
| (in thousands) | Years ended August 31, |
| 2020 | | 2019 | | 2018 |
| Revenues | | | | | |
| United States | $ | 885,082 | | | $ | 854,675 | | | $ | 806,426 | |
| United Kingdom | 179,966 | | | 166,944 | | | 157,346 | |
| Other European Countries | 242,237 | | | 241,140 | | | 230,243 | |
| All Other Countries | 186,826 | | | 172,592 | | | 156,130 | |
| Total revenue | $ | 1,494,111 | | | $ | 1,435,351 | | | $ | 1,350,145 | |
Geographic Long-Lived Assets
The following table sets forth long-lived assets by geographic area. Long-lived assets consist of Property, equipment and leasehold improvements, net and Lease right-of-use assets, net and excludes goodwill, intangible assets, deferred taxes and other assets.
| | | | | | | | | | | |
| (in thousands) | At August 31, |
| 2020 | | 2019 |
| Long-lived Assets | | | |
| United States | $ | 205,929 | | | $ | 86,238 | |
| Philippines | 53,124 | | | 4,188 | |
| India | 42,923 | | | 15,051 | |
| United Kingdom | 32,184 | | | 5,347 | |
| All Other Countries | 47,871 | | | 8,560 | |
| Total long-lived assets | $ | 382,031 | | | $ | 119,384 | |
19. RISKS AND CONCENTRATIONS OF CREDIT RISK
Financial Risk Management
Foreign Currency Exchange Risk
In the normal course of business, FactSet is exposed to foreign currency exchange risk as the Company conducts business outside the U.S. in several currencies including the British Pound Sterling, Euro, Indian Rupee, and Philippine Peso. Changes in the exchange rates for such currencies into U.S. dollars can affect our revenues, earnings, and the carrying values of our assets and liabilities in our consolidated balance sheet, either positively or negatively.
To manage the exposures related to the effects of foreign exchange rate fluctuations, the Company utilizes derivative instruments (foreign currency forward contracts). The changes in fair value for these foreign currency forward contracts are initially reported as a component of AOCL and subsequently reclassified into operating expenses when the hedged exposure affects earnings.
By their nature, all derivative instruments involve, to varying degrees, elements of market and credit risk. The market risk associated with these instruments resulting from currency exchange movements is expected to offset the market risk of the underlying transactions, assets and liabilities being hedged. FactSet does not believe there is significant risk of loss in the event of non-performance by the counterparties associated with these instruments because these transactions are executed with a major financial institutions. Further, the Company’s policy is to deal with counterparties having a minimum investment grade
or better credit rating. Credit risk is managed through the continuous monitoring of exposures to such counterparties. FactSet’s primary objective in holding derivatives is to reduce the volatility of earnings associated with changes in foreign currency.
Refer to Note 6, Derivative Instruments for more information on our foreign currency exposures and our foreign currency forward contracts.
Interest Rate Risk
Cash and Cash Equivalents and Investments
The fair market value of our cash and cash equivalents and investments at August 31, 2020 was $605.2 million. Our cash and cash equivalents consist of demand deposits and money market funds with original maturities of three months or less and are reported at fair value. We are exposed to interest rate risk through fluctuations of interest rates on our investments. As we have a restrictive investment policy, our financial exposure to fluctuations in interest rates is expected to remain low.
Refer to Note 3, Summary of Significant Accounting Policies for more information on our cash and cash equivalents.
Debt
As of August 31, 2020, the Company had long term debt outstanding under the 2019 Revolving Credit Facility, with a principal balance of $575.0 million. The debt bears interest on the outstanding principle at a rate equal to LIBOR plus a spread, using a debt leverage pricing grid. The variable rate of interest on our long-term debt can expose us to interest rate volatility due to changes in LIBOR. To mitigate this exposure, on March 5, 2020, we entered into an interest rate swap agreement with a notional amount of $287.5 million to hedge the variable interest rate obligation, effectively converting the floating interest rate to fixed for the hedged portion. Thus, we are only exposed to base interest rate risk on floating rate borrowings in excess of any amounts that are not hedged, or $287.5 million of our outstanding principal balance. Assuming all terms of the Company’s outstanding long-term debt remained the same, a hypothetical 25 basis point change (up or down) in the one-month LIBOR would result in a $0.7 million change in its annual interest expense.
Refer to Note 12, Debt for additional information regarding our outstanding debt obligations.
Current market events have not required the Company to modify materially or change its financial risk management strategies with respect to its exposures to foreign currency exchange risk and interest rate risk.
Concentrations of Credit Risk
Cash equivalents
Cash and cash equivalents are maintained primarily with five financial institutions. Deposits held with banks may exceed the amount of insurance provided on such deposits. These deposits may be redeemed upon demand and are maintained with financial institutions, with reputable credit, and therefore, bear minimal credit risk. The Company seeks to mitigate its credit risks by spreading such risks across multiple counterparties and monitoring the risk profiles of these counterparties.
Accounts Receivable
Accounts receivable are unsecured and are derived from revenue earned from clients located around the globe. FactSet does not require collateral from its clients but performs credit evaluations on an ongoing basis. The Company maintains reserves for potential write-offs and evaluates the adequacy of the reserves periodically. These losses have historically been within expectations. No single client represented 10% or more of FactSet's total revenue in any fiscal year presented. At August 31, 2020, the Company’s largest individual client accounted for approximately 3% of total annual subscriptions, and subscriptions from the ten largest clients did not surpass 15% of total annual subscriptions, consistent with August 31, 2019. As of August 31, 2020 and 2019, the receivable reserve was $8.0 million and $10.5 million, respectively.
Derivative Instruments
As a result of the use of derivative instruments, FactSet is exposed to counterparty credit risk. The Company has incorporated counterparty credit risk into the fair value of its derivative assets and its own credit risk into the value of the Company’s derivative liabilities, when applicable. For derivative instruments, the Company calculates credit risk from observable data related to credit default swaps ("CDS") as quoted by publicly available information. Counterparty risk is represented by CDS spreads related to the senior secured debt of the respective bank with whom the Company has executed these derivative transactions. To mitigate counterparty credit risk, the Company enters into contracts with large financial institutions and
regularly reviews its credit exposure balances as well as the creditworthiness of the counterparties. For the Company's liabilities, as CDS spread information is not available for FactSet, the Company's credit risk is determined based on using a simple average of CDS spreads for peer companies. The Company does not expect any losses as a result of default of its counterparties.
Concentration of Other Risk
Data Content Providers
Certain data sets that FactSet relies on have a limited number of suppliers, although the Company makes every effort to assure that, where reasonable, alternative sources are available. FactSet is not dependent on any one third-party data supplier in order to meet the needs of its clients. FactSet combines the data from these commercial databases into its own dedicated single online service, which the client accesses to perform their analysis. No single vendor or data supplier represented more than 10% of FactSet's total data costs during fiscal 2020, except for one vendor, which is a supplier of risk models and portfolio optimizer data to FactSet and represented 11% of FactSet’s data costs in fiscal 2020.
20. UNAUDITED QUARTERLY FINANCIAL DATA
The following table presents selected unaudited financial information for each of the quarterly periods in the years ended August 31, 2020 and 2019. The results for any quarter are not necessarily indicative of future quarterly results and, accordingly, period-to-period comparisons should not be relied upon as an indication of future performance.
| | | | | | | | | | | | | | |
| Fiscal 2020 (in thousands, except per share data) | First
Quarter | Second
Quarter | Third
Quarter | Fourth
Quarter |
| Revenue | $ | 366,658 | | $ | 369,780 | | $ | 374,083 | | $ | 383,590 | |
| Cost of services | $ | 164,957 | | $ | 176,218 | | $ | 170,703 | | $ | 183,568 | |
| Selling, general and administrative | $ | 88,515 | | $ | 87,305 | | $ | 81,740 | | $ | 101,445 | |
| Operating income | $ | 113,186 | | $ | 106,257 | | $ | 121,640 | | $ | 98,577 | |
| Net income | $ | 93,957 | | $ | 88,686 | | $ | 101,216 | | $ | 89,079 | |
Diluted EPS(1) | $ | 2.43 | | $ | 2.30 | | $ | 2.63 | | $ | 2.29 | |
| Diluted weighted average common shares | 38,587 | | 38,576 | | 38,481 | | 38,940 | |
| | | | | | | | | | | | | | |
| Fiscal 2019 (in thousands, except per share data) | First
Quarter | Second
Quarter | Third
Quarter | Fourth
Quarter |
| Revenue | $ | 351,640 | | $ | 354,895 | | $ | 364,533 | | $ | 364,283 | |
| Cost of services | $ | 166,776 | | $ | 165,108 | | $ | 163,832 | | $ | 167,730 | |
| Selling, general and administrative | $ | 84,325 | | $ | 81,099 | | $ | 83,461 | | $ | 84,985 | |
| Operating income | $ | 100,539 | | $ | 108,688 | | $ | 117,240 | | $ | 111,568 | |
| Net income | $ | 84,296 | | $ | 84,702 | | $ | 92,265 | | $ | 91,527 | |
Diluted EPS(1) | $ | 2.17 | | $ | 2.19 | | $ | 2.37 | | $ | 2.34 | |
| Diluted weighted average common shares | 38,809 | | 38,619 | | 38,993 | | 39,056 | |
(1)Diluted earnings per common share is calculated independently for each of the periods presented. Accordingly, the sum of the quarterly EPS amounts may not equal the total for the fiscal year.
21. SUBSEQUENT EVENTS
As previously announced, effective September 21, 2020, the Company entered into an Amendment to the 2019 Credit Agreement (the “Amendment”). The Amendment provides, among other things, that the Company may make an investment in
a person that is not a subsidiary of FactSet, so long as no potential default has occurred and is continuing or would result from such an investment.
As previously announced, on October 20, 2020, FactSet entered into a definitive agreement to acquire all of the issued and outstanding shares of Truvalue Labs, Inc. ("TVL"). The acquisition of TVL further enhances FactSet's commitment to providing industry leading environmental, social, and governance ("ESG") data.
Revenue from TVL will be recognized based on geographic business activities in accordance with how the Company’s operating segments are currently aligned. The Company expects the majority of the TVL purchase price to be allocated to goodwill and acquired intangible assets. The transaction is expected to close during 2020 and is not expected to have a material impact on FactSet’s fiscal 2021 results.
ITEM 9. CHANGES IN AND DISAGREEMENTS WITH ACCOUNTANTS ON ACCOUNTING AND FINANCIAL DISCLOSURE
None.
ITEM 9A. CONTROLS AND PROCEDURES
Evaluation of Disclosure Controls and Procedures
The Company's management, including its principal executive officer and principal financial officer, have evaluated the effectiveness of our disclosure controls and procedures pursuant to Rules 13a-15(e) and 15d-15(e) under the Securities Exchange Act of 1934, as amended (the "Exchange Act"), as of the end of the annual period covered by this report. Based on that evaluation, the principal executive officer and principal financial officer have concluded that our disclosure controls and procedures are effective as of the end of the annual period covered by this report.
Changes in Internal Control over Financial Reporting
During the first and third quarters of fiscal 2020, the Company implemented a new general ledger and financial reporting system and a new purchase to payables system, respectively, as part of a multi-year global project to design, configure and install an integrated suite of enterprise software. The implementations have involved changes to certain processes and related internal controls over financial reporting. The Company has reviewed the system and the controls affected and made appropriate changes as necessary.
There have been no other changes in the Company's internal control over financial reporting (as such term is defined in Rules 13a-15(f) and 15d-15(f) under the Exchange Act) during the Company's fourth quarter of fiscal 2020 that have materially affected, or are reasonably likely to materially affect, the Company's internal control over financial reporting.
Management’s Report on Internal Control over Financial Reporting
See Item 8. Management’s Report on Internal Control over Financial Reporting of this Annual Report on Form 10-K, which is incorporated herein by reference.
Report of Independent Registered Public Accounting Firm
See Item 8. Report of Independent Registered Public Accounting Firm of this Annual Report on Form 10-K, which is incorporated herein by reference.
ITEM 9B. OTHER INFORMATION
None.
Part III
ITEM 10. DIRECTORS, EXECUTIVE OFFICERS AND CORPORATE GOVERNANCE
The information required to be furnished by this Item 10. is incorporated herein by reference to our Notice of Annual Meeting of Stockholders and Proxy Statement to be filed within 120 days of August 31, 2020 (the "Proxy Statement").
Pursuant to General Instruction G(3) of Form 10-K, the information required by this item relating to our executive officers is included in Item 1. Executive Officers of the Registrant of this Annual Report on Form 10-K.
The Company has adopted a Code of Business Conduct and Ethics that applies to all employees, including the Company’s principal executive officer, principal financial officer and principal accounting officer, all other officers and the Company’s directors. A copy of this code is available on the Company’s website at https://investor.factset.com on the Leadership and Corporate Governance page. The Company intends to satisfy any disclosure requirement under Item 5.05 of Form 8-K regarding an amendment to, or waiver from, a provision of this code of ethics by posting such information on our website at the address and general location specified above.
The Corporate Governance Guidelines and the charters of the committees of our Board of Directors, including the Audit Committee, Compensation and Talent Committee and Nominating and Corporate Governance Committee, are also available on our website at https://investor.factset.com on the Leadership and Corporate Governance page. The guidelines, charters and code of ethics are also available in print free of charge to any stockholder who submits a written request to our Investor Relations department at our corporate headquarters at 45 Glover Avenue Norwalk, CT 06850.
ITEM 11. EXECUTIVE COMPENSATION
The information required to be furnished by this Item 11. is incorporated herein by reference to our Proxy Statement.
ITEM 12. SECURITY OWNERSHIP OF CERTAIN BENEFICIAL OWNERS AND MANAGEMENT AND RELATED STOCKHOLDER MATTERS
The information required to be furnished by this Item 12. is incorporated herein by reference to our Proxy Statement.
Equity Compensation Plan Information
The following table summarizes as of August 31, 2020, the number of outstanding equity awards granted to employees and non-employee directors, as well as the number of equity awards remaining available for future issuance, under FactSet’s equity compensation plans:
| | | | | | | | | | | | | | | | | | | | |
| (In thousands, except per share data) |
| Plan category |
Number of securities
to be issued upon exercise
of outstanding options, warrants and rights
(a) | | Weighted-average
exercise price of
outstanding options, warrants and rights
(b) | | Number of securities remaining
available for future issuances under
equity compensation plans (excluding
securities reflected in column (a))
(c) | |
| Equity compensation plans approved by security holders | 2,400 | | (1) | $ | 189.32 | | (2) | 6,053 | | (3) |
| Equity compensation plans not approved by security holders | — | | | — | | | — | | |
| Total | 2,400 | | (1) | $ | 189.32 | | (2) | 6,053 | | (3) |
(1)Includes 2,254 shares issuable upon exercise of outstanding options, 109 shares issuable upon vesting of awards of restricted stock and 37 shares issuable upon the conversion of outstanding performance share units.
(2)Calculated without taking into account shares of FactSet common stock subject to outstanding stock awards that will become issuable as they vest, without any cash consideration or other payment required for such shares.
(3)Includes 5,625,791 shares available for future issuance under the FactSet Research Systems Inc. Stock Option and Award Plan, as Amended and Restated, 249,886 shares available for future issuance under the FactSet Research Systems Inc. Non-Employee Directors’ Stock Option and Award Plan, as Amended and Restated, and 177,804 shares available for purchase under the FactSet Research Systems Inc. 2008 Employee Stock Purchase Plan, as Amended and Restated.
ITEM 13. CERTAIN RELATIONSHIPS AND RELATED TRANSACTIONS, AND DIRECTOR INDEPENDENCE
The information required to be furnished by this Item 13. is incorporated herein by reference to our Proxy Statement.
ITEM 14. PRINCIPAL ACCOUNTING FEES AND SERVICES
The information required to be furnished by this Item 14. is incorporated herein by reference to our Proxy Statement.
Part IV
ITEM 15. EXHIBITS, FINANCIAL STATEMENT SCHEDULES
(a)Documents filed as part of this Annual Report on Form 10-K:
1.Financial Statements
The information required by this item is included in Item 8. Financial Statements and Supplementary Data, of this Annual Report on Form 10-K which is incorporated herein.
2.Financial Statements Schedule
Schedule II – Valuation and Qualifying Accounts
Years ended August 31, 2020, 2019 and 2018 (in thousands):
| | | | | | | | | | | | | | | | | | | | | | | |
Receivable reserve
and billing adjustments | Balance at Beginning of Year | | Charged to Expense/ Against Revenue(1) | | Write-offs,
Net of Recoveries | | Balance at
End of Year |
| 2020 | $ | 10,511 | | | $ | 754 | | | $ | (3,278) | | | $ | 7,987 | |
| 2019 | $ | 3,490 | | | $ | 11,474 | | | $ | (4,453) | | | $ | 10,511 | |
| 2018 | $ | 2,738 | | | $ | 4,737 | | | $ | (3,985) | | | $ | 3,490 | |
(1) Additions to the receivable reserve for doubtful accounts are charged to bad debt expense. Additions to the receivable reserve for billing adjustments are charged against revenue.
Additional financial statement schedules are omitted since they are either not required, not applicable, or the information is otherwise included.
3.Exhibits
The information required by this Item is set forth below.
| | | | | | | | | | | | | | | | | | | | | | | | | | | | | | | | | | | | | | |
| | Incorporated by Reference |
Exhibit
Number | | Exhibit
Description | | Form | | File No. | | Exhibit No. | | Filing Date | | Filed
Herewith |
| 3.1 | | Restated Certificate of Incorporation | | S-1/A | | 333-04238 | | 3.1 | | 6/26/1996 | | |
| 3.2 | | Certificate of Amendment of Certificate of Incorporation | | 10-K | | 333-22319 | | 3.12 | | 11/20/2001 | | |
| 3.3 | | Second Amendment to the Restated Certificate of Incorporation | | 8-K | | 001-11869 | | 3.1 | | 12/16/2011 | | |
| 3.4 | | Amended and Restated By-laws of FactSet Research Systems Inc. as amended September 1, 2018 | | 8-K | | 001-11869 | | 3.1 | | 9/6/2018 | | |
| 4.0 | | Form of Common Stock | | S-1/A | | 333-04238 | | 4.1 | | 6/26/1996 | | |
| | | | DEF-14A | | 001-11869 | | Exhibit A | | 11/10/2004 | | |
| | | | DEFR-14A | | 001-11869 | | Appendix A | | 12/6/2010 | | |
| | | | 8-K | | 001-11869 | | 10.1 | | 12/21/2017 | | |
| | | | DEF-14A | | 001-11869 | | Appendix A | | 10/30/2008 | | |
| | | | | | | | | | | | | | | | | | | | | | | | | | | | | | | | | | | | | | |
| | | | 8-K | | 001-11869 | | 10.2 | | 12/21/2017 | | |
| | | | 10-Q | | 001-11869 | | 10.1 | | 4/9/2018 | | |
| | | | 8-K | | 001-11869 | | 10.1 | | 3/29/2019 | | |
| | | | 8-K | | 001-11869 | | 10.1 | | 9/25/2020 | | |
| | | | 8-K | | 001-11869 | | 10.1 | | 3/5/2020 | | |
| | | | 8-K | | 001-11869 | | 10.2 | | 3/5/2020 | | |
| | | | 8-K | | 001-11869 | | 10.1 | | 6/9/2020 | | |
| | | | | | | | | | | | X |
| | | | | | | | | | | | X |
| | | | | | | | | | | | X |
| | | | | | | | | | | | X |
| | | | | | | | | | | | X |
| | | | | | | | | | | | X |
| 101.INS | | XBRL Instance Document | | | | | | | | | | X |
| 101.SCH | | XBRL Taxonomy Extension Schema | | | | | | | | | | X |
| 101.CAL | | XBRL Taxonomy Extension Calculation Linkbase | | | | | | | | | | X |
| 101.DEF | | XBRL Taxonomy Extension Definition Linkbase Document | | | | | | | | | | X |
| 101.LAB | | XBRL Taxonomy Extension Label Linkbase | | | | | | | | | | X |
| | | | | | | | | | | | | | | | | | | | | | | | | | | | | | | | | | | | | | |
| 101.PRE | | XBRL Taxonomy Extension Presentation Linkbase | | | | | | | | | | X |
| 104 | | Cover page Interactive Data File (formatted as Inline XBRL and contained in Exhibit 101 | | | | | | | | | | X |
(1)Indicates a management contract or compensatory plan or arrangement
(2)Confidential treatment has been granted for portions of this exhibit.
ITEM 16. FORM 10-K SUMMARY
None.
SIGNATURES
Pursuant to the requirements of Section 13 or 15(d) of the Securities Exchange Act of 1934, the Registrant has duly caused this Report on Form 10-K to be signed on its behalf by the undersigned, thereunto duly authorized.
| | | | | |
| FACTSET RESEARCH SYSTEMS INC. |
| (Registrant) |
| |
| Date: October 29, 2020 | /s/ F. PHILIP SNOW |
| F. Philip Snow |
| Chief Executive Officer |
Pursuant to the requirements of the Securities Exchange Act of 1934, this Report on Form 10-K has been signed below by the following persons on behalf of the Registrant and in the capacities and on the dates indicated.
| | | | | | | | | | | | | | |
Name | | Title | | Date |
| /s/ F. PHILIP SNOW | | Chief Executive Officer and Director | | October 29, 2020 |
| F. Philip Snow | | (Principal Executive Officer) | | |
| | | | |
| /s/ HELEN L. SHAN | | Executive Vice President and Chief Financial Officer | | October 29, 2020 |
| Helen L. Shan | | (Principal Financial Officer) | | |
| | | | |
| /s/ GREGORY T. MOSKOFF | | Senior Vice President, Controller and Chief Accounting Officer | | October 29, 2020 |
| Gregory T. Moskoff | | (Principal Accounting Officer) | | |
| | | | |
| /s/ ROBIN A. ABRAMS | | Chair | | October 29, 2020 |
| Robin A. Abrams | | | | |
| | | | |
| /s/ SCOTT A. BILLEADEAU | | Director | | October 29, 2020 |
| Scott A. Billeadeau | | | | |
| | | | |
| /s/ SIEW KAI CHOY | | Director | | October 29, 2020 |
| Siew Kai Choy | | | | |
| | | | |
| /s/ MALCOLM FRANK | | Director | | October 29, 2020 |
| Malcolm Frank | | | | |
| | | | |
| /s/ SHEILA B. JORDAN | | Director | | October 29, 2020 |
| Sheila B. Jordan | | | | |
| | | | |
| /s/ JAMES J. MCGONIGLE | | Director | | October 29, 2020 |
| James J. McGonigle | | | | |
| | | | |
| /s/ LEE SHAVEL | | Director | | October 29, 2020 |
| Lee Shavel | | | | |
| | | | |
| /s/ LAURIE SIEGEL | | Director | | October 29, 2020 |
| Laurie Siegel | | | | |
| | | | |
| /s/ JOSEPH R. ZIMMEL | | Director | | October 29, 2020 |
| Joseph R. Zimmel | | | | |