0001010470--06-302024Q100false0001010470us-gaap:TreasuryStockCommonMember2023-07-012023-09-300001010470us-gaap:CommonStockMember2023-07-012023-09-300001010470us-gaap:CommonStockMember2022-07-012022-09-300001010470prov:AprilTwoThousandTwentyTwoStockRepurchasePlanMember2023-07-012023-09-300001010470prov:AprilTwoThousandTwentyTwoStockRepurchasePlanMember2022-04-280001010470prov:AprilTwoThousandTwentyTwoStockRepurchasePlanMember2022-04-282022-04-280001010470us-gaap:TreasuryStockCommonMember2022-07-012022-09-300001010470us-gaap:TreasuryStockCommonMember2023-09-300001010470us-gaap:RetainedEarningsMember2023-09-300001010470us-gaap:AdditionalPaidInCapitalMember2023-09-300001010470us-gaap:AccumulatedOtherComprehensiveIncomeMember2023-09-300001010470srt:CumulativeEffectPeriodOfAdoptionAdjustmentMemberus-gaap:AccountingStandardsUpdate201613Memberus-gaap:RetainedEarningsMember2023-06-300001010470us-gaap:TreasuryStockCommonMember2023-06-300001010470us-gaap:RetainedEarningsMember2023-06-300001010470us-gaap:AdditionalPaidInCapitalMember2023-06-300001010470us-gaap:AccumulatedOtherComprehensiveIncomeMember2023-06-300001010470us-gaap:TreasuryStockCommonMember2022-09-300001010470us-gaap:RetainedEarningsMember2022-09-300001010470us-gaap:AdditionalPaidInCapitalMember2022-09-300001010470us-gaap:AccumulatedOtherComprehensiveIncomeMember2022-09-300001010470us-gaap:TreasuryStockCommonMember2022-06-300001010470us-gaap:RetainedEarningsMember2022-06-300001010470us-gaap:AdditionalPaidInCapitalMember2022-06-300001010470us-gaap:AccumulatedOtherComprehensiveIncomeMember2022-06-300001010470us-gaap:DepositAccountMember2023-07-012023-09-300001010470us-gaap:CreditCardMember2023-07-012023-09-300001010470us-gaap:DepositAccountMember2022-07-012022-09-300001010470us-gaap:CreditCardMember2022-07-012022-09-300001010470us-gaap:MortgageBackedSecuritiesIssuedByUSGovernmentSponsoredEnterprisesMember2023-07-012023-09-300001010470us-gaap:MortgageBackedSecuritiesIssuedByUSGovernmentSponsoredEnterprisesMember2022-07-012022-09-300001010470us-gaap:AccumulatedOtherComprehensiveIncomeMember2023-07-012023-09-300001010470us-gaap:AccumulatedOtherComprehensiveIncomeMember2022-07-012022-09-300001010470srt:CumulativeEffectPeriodOfAdoptionAdjustedBalanceMemberus-gaap:AccountingStandardsUpdate201613Memberus-gaap:UnfundedLoanCommitmentMember2023-06-300001010470us-gaap:UnfundedLoanCommitmentMember2023-06-300001010470us-gaap:CommitmentsToExtendCreditMember2023-09-300001010470us-gaap:CommitmentsToExtendCreditMember2023-06-300001010470us-gaap:CommitmentsToExtendCreditMember2022-09-300001010470us-gaap:CommitmentsToExtendCreditMember2022-06-300001010470prov:BankOwnedLifeInsuranceMember2023-07-012023-09-300001010470prov:BankOwnedLifeInsuranceMember2022-07-012022-09-300001010470prov:WithinOneYearMemberus-gaap:ResidentialPortfolioSegmentMemberus-gaap:ConstructionLoansMember2023-09-300001010470prov:WithinOneYearMemberus-gaap:ResidentialPortfolioSegmentMemberprov:MortgageLoansSingleFamilyMember2023-09-300001010470prov:WithinOneYearMemberus-gaap:ResidentialPortfolioSegmentMemberprov:MortgageLoansMultiFamilyMember2023-09-300001010470prov:WithinOneYearMemberus-gaap:ResidentialPortfolioSegmentMemberprov:MortgageLoansCommercialRealEstateMember2023-09-300001010470prov:AfterOneYearThrough3yearsMemberus-gaap:ResidentialPortfolioSegmentMemberprov:MortgageLoansSingleFamilyMember2023-09-300001010470prov:AfterOneYearThrough3yearsMemberus-gaap:ResidentialPortfolioSegmentMemberprov:MortgageLoansMultiFamilyMember2023-09-300001010470prov:AfterOneYearThrough3yearsMemberus-gaap:ResidentialPortfolioSegmentMemberprov:MortgageLoansCommercialRealEstateMember2023-09-300001010470prov:After5YearsThrough10YearsMemberus-gaap:ResidentialPortfolioSegmentMemberprov:MortgageLoansSingleFamilyMember2023-09-300001010470prov:After5YearsThrough10YearsMemberus-gaap:ResidentialPortfolioSegmentMemberprov:MortgageLoansMultiFamilyMember2023-09-300001010470prov:After3YearsThrough5YearsMemberus-gaap:ResidentialPortfolioSegmentMemberprov:MortgageLoansSingleFamilyMember2023-09-300001010470prov:After3YearsThrough5YearsMemberus-gaap:ResidentialPortfolioSegmentMemberprov:MortgageLoansMultiFamilyMember2023-09-300001010470prov:After3YearsThrough5YearsMemberus-gaap:ResidentialPortfolioSegmentMemberprov:MortgageLoansCommercialRealEstateMember2023-09-300001010470prov:WithinOneYearMemberus-gaap:ConsumerPortfolioSegmentMember2023-09-300001010470prov:WithinOneYearMemberus-gaap:CommercialPortfolioSegmentMember2023-09-300001010470prov:WithinOneYearMember2023-09-300001010470prov:AfterOneYearThrough3yearsMember2023-09-300001010470prov:After5YearsThrough10YearsMember2023-09-300001010470prov:After3YearsThrough5YearsMember2023-09-300001010470us-gaap:AssetPledgedAsCollateralMemberus-gaap:FederalReserveBankAdvancesMember2023-09-300001010470us-gaap:AssetPledgedAsCollateralMemberus-gaap:FederalReserveBankAdvancesMember2023-06-300001010470prov:LondonInterbankOfferedRateMember2023-06-300001010470srt:CumulativeEffectPeriodOfAdoptionAdjustmentMember2023-09-300001010470srt:CumulativeEffectPeriodOfAdoptionAdjustmentMemberus-gaap:ResidentialPortfolioSegmentMemberus-gaap:ConstructionLoansMember2023-06-300001010470srt:CumulativeEffectPeriodOfAdoptionAdjustmentMemberus-gaap:ResidentialPortfolioSegmentMemberprov:MortgageLoansSingleFamilyMember2023-06-300001010470srt:CumulativeEffectPeriodOfAdoptionAdjustmentMemberus-gaap:ResidentialPortfolioSegmentMemberprov:MortgageLoansOtherMember2023-06-300001010470srt:CumulativeEffectPeriodOfAdoptionAdjustmentMemberus-gaap:ResidentialPortfolioSegmentMemberprov:MortgageLoansMultiFamilyMember2023-06-300001010470srt:CumulativeEffectPeriodOfAdoptionAdjustmentMemberus-gaap:ResidentialPortfolioSegmentMemberprov:MortgageLoansCommercialRealEstateMember2023-06-300001010470srt:CumulativeEffectPeriodOfAdoptionAdjustmentMemberus-gaap:ConsumerPortfolioSegmentMember2023-06-300001010470srt:CumulativeEffectPeriodOfAdoptionAdjustmentMemberus-gaap:CommercialPortfolioSegmentMember2023-06-300001010470srt:CumulativeEffectPeriodOfAdoptionAdjustmentMember2023-06-300001010470us-gaap:ResidentialPortfolioSegmentMemberus-gaap:ConstructionLoansMember2022-06-300001010470us-gaap:ResidentialPortfolioSegmentMemberprov:MortgageLoansSingleFamilyMember2022-06-300001010470us-gaap:ResidentialPortfolioSegmentMemberprov:MortgageLoansOtherMember2022-06-300001010470us-gaap:ResidentialPortfolioSegmentMemberprov:MortgageLoansMultiFamilyMember2022-06-300001010470us-gaap:ResidentialPortfolioSegmentMemberprov:MortgageLoansCommercialRealEstateMember2022-06-300001010470us-gaap:ConsumerPortfolioSegmentMember2022-06-300001010470us-gaap:CommercialPortfolioSegmentMember2022-06-300001010470us-gaap:FederalFundsPurchasedMember2023-09-300001010470us-gaap:FederalFundsPurchasedMember2023-06-300001010470prov:DiscountWindowFacilityMemberus-gaap:FederalReserveBankAdvancesMember2023-09-300001010470prov:DiscountWindowFacilityMemberus-gaap:FederalReserveBankAdvancesMember2023-06-300001010470us-gaap:FairValueInputsLevel3Memberus-gaap:FairValueMeasurementsRecurringMemberus-gaap:USGovernmentAgenciesDebtSecuritiesMember2023-09-300001010470us-gaap:FairValueInputsLevel3Memberus-gaap:FairValueMeasurementsRecurringMemberus-gaap:MortgageBackedSecuritiesIssuedByUSGovernmentSponsoredEnterprisesMember2023-09-300001010470us-gaap:FairValueInputsLevel3Memberus-gaap:FairValueMeasurementsRecurringMemberus-gaap:CollateralizedMortgageObligationsMember2023-09-300001010470us-gaap:FairValueInputsLevel2Memberus-gaap:FairValueMeasurementsRecurringMemberus-gaap:USGovernmentAgenciesDebtSecuritiesMember2023-09-300001010470us-gaap:FairValueInputsLevel2Memberus-gaap:FairValueMeasurementsRecurringMemberus-gaap:MortgageBackedSecuritiesIssuedByUSGovernmentSponsoredEnterprisesMember2023-09-300001010470us-gaap:FairValueInputsLevel2Memberus-gaap:FairValueMeasurementsRecurringMemberus-gaap:CollateralizedMortgageObligationsMember2023-09-300001010470us-gaap:FairValueInputsLevel1Memberus-gaap:FairValueMeasurementsRecurringMemberus-gaap:USGovernmentAgenciesDebtSecuritiesMember2023-09-300001010470us-gaap:FairValueInputsLevel1Memberus-gaap:FairValueMeasurementsRecurringMemberus-gaap:MortgageBackedSecuritiesIssuedByUSGovernmentSponsoredEnterprisesMember2023-09-300001010470us-gaap:FairValueInputsLevel1Memberus-gaap:FairValueMeasurementsRecurringMemberus-gaap:CollateralizedMortgageObligationsMember2023-09-300001010470us-gaap:FairValueMeasurementsRecurringMemberus-gaap:USGovernmentAgenciesDebtSecuritiesMember2023-09-300001010470us-gaap:FairValueMeasurementsRecurringMemberus-gaap:MortgageBackedSecuritiesIssuedByUSGovernmentSponsoredEnterprisesMember2023-09-300001010470us-gaap:FairValueMeasurementsRecurringMemberus-gaap:CollateralizedMortgageObligationsMember2023-09-300001010470us-gaap:FairValueInputsLevel3Memberus-gaap:FairValueMeasurementsRecurringMemberus-gaap:USGovernmentAgenciesDebtSecuritiesMember2023-06-300001010470us-gaap:FairValueInputsLevel3Memberus-gaap:FairValueMeasurementsRecurringMemberus-gaap:MortgageBackedSecuritiesIssuedByUSGovernmentSponsoredEnterprisesMember2023-06-300001010470us-gaap:FairValueInputsLevel3Memberus-gaap:FairValueMeasurementsRecurringMemberus-gaap:CollateralizedMortgageObligationsMember2023-06-300001010470us-gaap:FairValueInputsLevel2Memberus-gaap:FairValueMeasurementsRecurringMemberus-gaap:USGovernmentAgenciesDebtSecuritiesMember2023-06-300001010470us-gaap:FairValueInputsLevel2Memberus-gaap:FairValueMeasurementsRecurringMemberus-gaap:MortgageBackedSecuritiesIssuedByUSGovernmentSponsoredEnterprisesMember2023-06-300001010470us-gaap:FairValueInputsLevel2Memberus-gaap:FairValueMeasurementsRecurringMemberus-gaap:CollateralizedMortgageObligationsMember2023-06-300001010470us-gaap:FairValueInputsLevel1Memberus-gaap:FairValueMeasurementsRecurringMemberus-gaap:USGovernmentAgenciesDebtSecuritiesMember2023-06-300001010470us-gaap:FairValueInputsLevel1Memberus-gaap:FairValueMeasurementsRecurringMemberus-gaap:MortgageBackedSecuritiesIssuedByUSGovernmentSponsoredEnterprisesMember2023-06-300001010470us-gaap:FairValueInputsLevel1Memberus-gaap:FairValueMeasurementsRecurringMemberus-gaap:CollateralizedMortgageObligationsMember2023-06-300001010470us-gaap:FairValueMeasurementsRecurringMemberus-gaap:USGovernmentAgenciesDebtSecuritiesMember2023-06-300001010470us-gaap:FairValueMeasurementsRecurringMemberus-gaap:MortgageBackedSecuritiesIssuedByUSGovernmentSponsoredEnterprisesMember2023-06-300001010470us-gaap:FairValueMeasurementsRecurringMemberus-gaap:CollateralizedMortgageObligationsMember2023-06-300001010470us-gaap:RestrictedStockMember2023-07-012023-09-300001010470us-gaap:RestrictedStockMember2022-07-012022-09-300001010470us-gaap:ResidentialPortfolioSegmentMember2022-07-012022-09-3000010104702023-07-012023-07-010001010470us-gaap:ResidentialPortfolioSegmentMemberprov:MortgageLoansMultiFamilyMemberus-gaap:SpecialMentionMember2023-06-300001010470us-gaap:ResidentialPortfolioSegmentMemberus-gaap:ConstructionLoansMemberus-gaap:PassMember2023-06-300001010470us-gaap:ConsumerPortfolioSegmentMemberprov:NotGradedMember2023-06-300001010470us-gaap:ResidentialPortfolioSegmentMemberprov:MortgageLoansOtherMemberus-gaap:PassMember2023-06-300001010470us-gaap:ConsumerPortfolioSegmentMemberus-gaap:PassMember2023-06-300001010470us-gaap:CommercialPortfolioSegmentMemberus-gaap:PassMember2023-06-300001010470us-gaap:ResidentialPortfolioSegmentMemberprov:MortgageLoansSingleFamilyMemberus-gaap:SubstandardMember2023-06-300001010470us-gaap:ResidentialPortfolioSegmentMemberprov:MortgageLoansSingleFamilyMemberus-gaap:PassMember2023-06-300001010470us-gaap:ResidentialPortfolioSegmentMemberprov:MortgageLoansMultiFamilyMemberus-gaap:PassMember2023-06-300001010470us-gaap:ResidentialPortfolioSegmentMemberprov:MortgageLoansCommercialRealEstateMemberus-gaap:SubstandardMember2023-06-300001010470us-gaap:ResidentialPortfolioSegmentMemberprov:MortgageLoansCommercialRealEstateMemberus-gaap:PassMember2023-06-300001010470us-gaap:ResidentialPortfolioSegmentMemberus-gaap:ConstructionLoansMemberus-gaap:PassMember2023-09-300001010470us-gaap:ResidentialPortfolioSegmentMemberus-gaap:ConstructionLoansMemberus-gaap:FinancialAssetNotPastDueMember2023-09-300001010470us-gaap:ResidentialPortfolioSegmentMemberprov:MortgageLoansSingleFamilyMemberus-gaap:SubstandardMember2023-09-300001010470us-gaap:ResidentialPortfolioSegmentMemberprov:MortgageLoansSingleFamilyMemberus-gaap:SpecialMentionMember2023-09-300001010470us-gaap:ResidentialPortfolioSegmentMemberprov:MortgageLoansSingleFamilyMemberus-gaap:PassMember2023-09-300001010470us-gaap:ResidentialPortfolioSegmentMemberprov:MortgageLoansSingleFamilyMemberus-gaap:FinancialAssetNotPastDueMember2023-09-300001010470us-gaap:ResidentialPortfolioSegmentMemberprov:MortgageLoansSingleFamilyMemberprov:FinancingReceivables30To89DaysPastDueMember2023-09-300001010470us-gaap:ResidentialPortfolioSegmentMemberprov:MortgageLoansOtherMemberus-gaap:PassMember2023-09-300001010470us-gaap:ResidentialPortfolioSegmentMemberprov:MortgageLoansOtherMemberus-gaap:FinancialAssetNotPastDueMember2023-09-300001010470us-gaap:ResidentialPortfolioSegmentMemberprov:MortgageLoansMultiFamilyMemberus-gaap:SpecialMentionMember2023-09-300001010470us-gaap:ResidentialPortfolioSegmentMemberprov:MortgageLoansMultiFamilyMemberus-gaap:PassMember2023-09-300001010470us-gaap:ResidentialPortfolioSegmentMemberprov:MortgageLoansMultiFamilyMemberus-gaap:FinancialAssetNotPastDueMember2023-09-300001010470us-gaap:ResidentialPortfolioSegmentMemberprov:MortgageLoansCommercialRealEstateMemberus-gaap:SubstandardMember2023-09-300001010470us-gaap:ResidentialPortfolioSegmentMemberprov:MortgageLoansCommercialRealEstateMemberus-gaap:PassMember2023-09-300001010470us-gaap:ResidentialPortfolioSegmentMemberprov:MortgageLoansCommercialRealEstateMemberus-gaap:FinancialAssetNotPastDueMember2023-09-300001010470us-gaap:ConsumerPortfolioSegmentMemberus-gaap:PassMember2023-09-300001010470us-gaap:ConsumerPortfolioSegmentMemberus-gaap:FinancialAssetNotPastDueMember2023-09-300001010470us-gaap:ConsumerPortfolioSegmentMemberprov:NotGradedMember2023-09-300001010470us-gaap:ConsumerPortfolioSegmentMemberprov:FinancingReceivables30To89DaysPastDueMember2023-09-300001010470us-gaap:CommercialPortfolioSegmentMemberus-gaap:PassMember2023-09-300001010470us-gaap:CommercialPortfolioSegmentMemberus-gaap:FinancialAssetNotPastDueMember2023-09-300001010470us-gaap:FinancialAssetNotPastDueMember2023-09-300001010470prov:FinancingReceivables30To89DaysPastDueMember2023-09-300001010470us-gaap:ResidentialPortfolioSegmentMemberus-gaap:ConstructionLoansMemberus-gaap:FinancialAssetNotPastDueMember2023-06-300001010470us-gaap:ResidentialPortfolioSegmentMemberprov:MortgageLoansSingleFamilyMemberus-gaap:FinancialAssetNotPastDueMember2023-06-300001010470us-gaap:ResidentialPortfolioSegmentMemberprov:MortgageLoansOtherMemberus-gaap:FinancialAssetNotPastDueMember2023-06-300001010470us-gaap:ResidentialPortfolioSegmentMemberprov:MortgageLoansMultiFamilyMemberus-gaap:FinancialAssetNotPastDueMember2023-06-300001010470us-gaap:ResidentialPortfolioSegmentMemberprov:MortgageLoansCommercialRealEstateMemberus-gaap:FinancialAssetNotPastDueMember2023-06-300001010470us-gaap:ResidentialPortfolioSegmentMemberprov:MortgageLoansCommercialRealEstateMember2023-06-300001010470us-gaap:ConsumerPortfolioSegmentMemberus-gaap:FinancialAssetNotPastDueMember2023-06-300001010470us-gaap:ConsumerPortfolioSegmentMemberprov:FinancingReceivables30To89DaysPastDueMember2023-06-300001010470us-gaap:CommercialPortfolioSegmentMemberus-gaap:FinancialAssetNotPastDueMember2023-06-300001010470us-gaap:FinancialAssetNotPastDueMember2023-06-300001010470prov:FinancingReceivables30To89DaysPastDueMember2023-06-300001010470us-gaap:ConsumerPortfolioSegmentMember2023-09-300001010470srt:CumulativeEffectPeriodOfAdoptionAdjustmentMemberus-gaap:AccountingStandardsUpdate201613Member2023-09-300001010470srt:CumulativeEffectPeriodOfAdoptionAdjustmentMemberus-gaap:AccountingStandardsUpdate201613Memberus-gaap:ResidentialPortfolioSegmentMemberus-gaap:ConstructionLoansMember2023-06-300001010470srt:CumulativeEffectPeriodOfAdoptionAdjustmentMemberus-gaap:AccountingStandardsUpdate201613Memberus-gaap:ResidentialPortfolioSegmentMemberus-gaap:CommercialRealEstateMember2023-06-300001010470srt:CumulativeEffectPeriodOfAdoptionAdjustmentMemberus-gaap:AccountingStandardsUpdate201613Memberus-gaap:ResidentialPortfolioSegmentMemberprov:MortgageLoansSingleFamilyMember2023-06-300001010470srt:CumulativeEffectPeriodOfAdoptionAdjustmentMemberus-gaap:AccountingStandardsUpdate201613Memberus-gaap:ResidentialPortfolioSegmentMemberprov:MortgageLoansOtherMember2023-06-300001010470srt:CumulativeEffectPeriodOfAdoptionAdjustmentMemberus-gaap:AccountingStandardsUpdate201613Memberus-gaap:ResidentialPortfolioSegmentMemberprov:MortgageLoansMultiFamilyMember2023-06-300001010470srt:CumulativeEffectPeriodOfAdoptionAdjustedBalanceMemberus-gaap:AccountingStandardsUpdate201613Memberus-gaap:ResidentialPortfolioSegmentMemberus-gaap:ConstructionLoansMember2023-06-300001010470srt:CumulativeEffectPeriodOfAdoptionAdjustedBalanceMemberus-gaap:AccountingStandardsUpdate201613Memberus-gaap:ResidentialPortfolioSegmentMemberus-gaap:CommercialRealEstateMember2023-06-300001010470srt:CumulativeEffectPeriodOfAdoptionAdjustedBalanceMemberus-gaap:AccountingStandardsUpdate201613Memberus-gaap:ResidentialPortfolioSegmentMemberprov:MortgageLoansSingleFamilyMember2023-06-300001010470srt:CumulativeEffectPeriodOfAdoptionAdjustedBalanceMemberus-gaap:AccountingStandardsUpdate201613Memberus-gaap:ResidentialPortfolioSegmentMemberprov:MortgageLoansOtherMember2023-06-300001010470srt:CumulativeEffectPeriodOfAdoptionAdjustedBalanceMemberus-gaap:AccountingStandardsUpdate201613Memberus-gaap:ResidentialPortfolioSegmentMemberprov:MortgageLoansMultiFamilyMember2023-06-300001010470srt:CumulativeEffectPeriodOfAdoptionAdjustmentMemberus-gaap:AccountingStandardsUpdate201613Memberus-gaap:ConsumerPortfolioSegmentMember2023-06-300001010470srt:CumulativeEffectPeriodOfAdoptionAdjustmentMemberus-gaap:AccountingStandardsUpdate201613Memberus-gaap:CommercialPortfolioSegmentMember2023-06-300001010470srt:CumulativeEffectPeriodOfAdoptionAdjustedBalanceMemberus-gaap:AccountingStandardsUpdate201613Memberus-gaap:CommercialPortfolioSegmentMember2023-06-300001010470us-gaap:ResidentialPortfolioSegmentMemberus-gaap:ConstructionLoansMember2023-06-300001010470us-gaap:ResidentialPortfolioSegmentMemberus-gaap:CommercialRealEstateMember2023-06-300001010470us-gaap:ResidentialPortfolioSegmentMemberprov:MortgageLoansOtherMember2023-06-300001010470us-gaap:ResidentialPortfolioSegmentMemberprov:MortgageLoansMultiFamilyMember2023-06-300001010470srt:CumulativeEffectPeriodOfAdoptionAdjustmentMemberus-gaap:AccountingStandardsUpdate201613Member2023-06-300001010470srt:CumulativeEffectPeriodOfAdoptionAdjustedBalanceMemberus-gaap:AccountingStandardsUpdate201613Member2023-06-300001010470us-gaap:ConsumerPortfolioSegmentMember2023-06-300001010470us-gaap:CommercialPortfolioSegmentMember2023-06-300001010470us-gaap:ResidentialPortfolioSegmentMemberus-gaap:ConstructionLoansMember2023-09-300001010470us-gaap:ResidentialPortfolioSegmentMemberprov:MortgageLoansOtherMember2023-09-300001010470us-gaap:ResidentialPortfolioSegmentMemberprov:MortgageLoansMultiFamilyMember2023-09-300001010470us-gaap:ResidentialPortfolioSegmentMemberprov:MortgageLoansCommercialRealEstateMember2023-09-300001010470us-gaap:CommercialPortfolioSegmentMember2023-09-300001010470us-gaap:ResidentialPortfolioSegmentMemberus-gaap:ConstructionLoansMember2022-09-300001010470us-gaap:ResidentialPortfolioSegmentMemberprov:MortgageLoansSingleFamilyMember2022-09-300001010470us-gaap:ResidentialPortfolioSegmentMemberprov:MortgageLoansOtherMember2022-09-300001010470us-gaap:ResidentialPortfolioSegmentMemberprov:MortgageLoansMultiFamilyMember2022-09-300001010470us-gaap:ResidentialPortfolioSegmentMemberprov:MortgageLoansCommercialRealEstateMember2022-09-300001010470us-gaap:ConsumerPortfolioSegmentMember2022-09-300001010470us-gaap:CommercialPortfolioSegmentMember2022-09-300001010470us-gaap:FederalHomeLoanBankAdvancesMember2023-09-300001010470us-gaap:FederalHomeLoanBankAdvancesMember2023-06-300001010470us-gaap:FairValueInputsLevel3Member2023-09-300001010470srt:CumulativeEffectPeriodOfAdoptionAdjustmentMemberus-gaap:InterestOnlyStripMemberus-gaap:FairValueInputsLevel3Member2023-06-300001010470srt:CumulativeEffectPeriodOfAdoptionAdjustmentMemberus-gaap:CollateralizedMortgageObligationsMemberus-gaap:FairValueInputsLevel3Member2023-06-300001010470srt:CumulativeEffectPeriodOfAdoptionAdjustmentMemberprov:LoansHeldForInvestmentAtFairValueMemberus-gaap:FairValueInputsLevel3Member2023-06-300001010470us-gaap:InterestOnlyStripMemberus-gaap:FairValueInputsLevel3Member2023-06-300001010470us-gaap:CollateralizedMortgageObligationsMemberus-gaap:FairValueInputsLevel3Member2023-06-300001010470srt:CumulativeEffectPeriodOfAdoptionAdjustmentMemberus-gaap:FairValueInputsLevel3Member2023-06-300001010470prov:LoansHeldForInvestmentAtFairValueMemberus-gaap:FairValueInputsLevel3Member2023-06-300001010470us-gaap:FairValueInputsLevel3Member2023-06-300001010470us-gaap:InterestOnlyStripMemberus-gaap:FairValueInputsLevel3Member2022-09-300001010470us-gaap:CollateralizedMortgageObligationsMemberus-gaap:FairValueInputsLevel3Member2022-09-300001010470prov:LoansHeldForInvestmentAtFairValueMemberus-gaap:FairValueInputsLevel3Member2022-09-300001010470us-gaap:FairValueInputsLevel3Member2022-09-300001010470us-gaap:InterestOnlyStripMemberus-gaap:FairValueInputsLevel3Member2022-06-300001010470us-gaap:CollateralizedMortgageObligationsMemberus-gaap:FairValueInputsLevel3Member2022-06-300001010470prov:LoansHeldForInvestmentAtFairValueMemberus-gaap:FairValueInputsLevel3Member2022-06-300001010470us-gaap:FairValueInputsLevel3Member2022-06-300001010470us-gaap:InterestOnlyStripMemberus-gaap:FairValueInputsLevel3Member2023-07-012023-09-300001010470us-gaap:CollateralizedMortgageObligationsMemberus-gaap:FairValueInputsLevel3Member2023-07-012023-09-300001010470prov:LoansHeldForInvestmentAtFairValueMemberus-gaap:FairValueInputsLevel3Member2023-07-012023-09-300001010470us-gaap:FairValueInputsLevel3Member2023-07-012023-09-300001010470us-gaap:InterestOnlyStripMemberus-gaap:FairValueInputsLevel3Member2022-07-012022-09-300001010470us-gaap:CollateralizedMortgageObligationsMemberus-gaap:FairValueInputsLevel3Member2022-07-012022-09-300001010470prov:LoansHeldForInvestmentAtFairValueMemberus-gaap:FairValueInputsLevel3Member2022-07-012022-09-300001010470us-gaap:FairValueInputsLevel3Member2022-07-012022-09-300001010470prov:UndisbursedLinesOfCreditConsumerLoansMember2023-09-300001010470prov:UndisbursedLinesOfCreditConstructionLoansMember2023-09-300001010470prov:UndisbursedLinesOfCreditCommercialBusinessLoansMember2023-09-300001010470prov:CommitmentsToExtendCreditLoansToBeHeldForInvestmentMember2023-09-300001010470prov:UndisbursedLinesOfCreditConsumerLoansMember2023-06-300001010470prov:UndisbursedLinesOfCreditConstructionLoansMember2023-06-300001010470prov:UndisbursedLinesOfCreditCommercialBusinessLoansMember2023-06-300001010470prov:CommitmentsToExtendCreditLoansToBeHeldForInvestmentMember2023-06-300001010470us-gaap:RetainedEarningsMember2023-07-012023-09-300001010470us-gaap:RetainedEarningsMember2022-07-012022-09-300001010470prov:SmallBusinessAdministrationLoanPoolSecuritiesMember2023-09-300001010470prov:CollateralizedMortgageObligationsIssuedByUsGovernmentSponsoredEnterprisesMember2023-09-300001010470prov:SmallBusinessAdministrationLoanPoolSecuritiesMember2023-06-300001010470prov:CollateralizedMortgageObligationsIssuedByUsGovernmentSponsoredEnterprisesMember2023-06-300001010470prov:PrivateIssueCmoMember2023-06-300001010470us-gaap:DomesticCorporateDebtSecuritiesMember2023-09-300001010470us-gaap:CommonStockMember2023-09-300001010470us-gaap:CommonStockMember2023-06-300001010470us-gaap:CommonStockMember2022-09-300001010470us-gaap:CommonStockMember2022-06-300001010470us-gaap:SubsequentEventMember2023-10-262023-10-260001010470us-gaap:USGovernmentAgenciesDebtSecuritiesMember2023-09-300001010470us-gaap:MortgageBackedSecuritiesIssuedByUSGovernmentSponsoredEnterprisesMember2023-09-300001010470us-gaap:CollateralizedMortgageObligationsMember2023-09-300001010470us-gaap:USGovernmentAgenciesDebtSecuritiesMember2023-06-300001010470us-gaap:MortgageBackedSecuritiesIssuedByUSGovernmentSponsoredEnterprisesMember2023-06-300001010470us-gaap:CollateralizedMortgageObligationsMember2023-06-300001010470us-gaap:ServicingContractsMemberus-gaap:FairValueInputsLevel3Member2023-09-300001010470us-gaap:InterestOnlyStripMemberus-gaap:FairValueInputsLevel3Member2023-09-300001010470us-gaap:CollateralizedMortgageObligationsMemberus-gaap:FairValueInputsLevel3Member2023-09-300001010470prov:LoansHeldForInvestmentAtFairValueMemberus-gaap:FairValueInputsLevel3Member2023-09-300001010470prov:IndividuallyEvaluatedAllowanceLoanMemberus-gaap:FairValueInputsLevel3Member2023-09-300001010470us-gaap:AdditionalPaidInCapitalMember2023-07-012023-09-300001010470us-gaap:AdditionalPaidInCapitalMember2022-07-012022-09-300001010470prov:AprilTwoThousandTwentyTwoStockRepurchasePlanMember2023-09-280001010470srt:MaximumMember2023-07-012023-09-300001010470prov:OtherInvestorsMemberprov:MortgagePartnershipFinanceMpfProgramMember2023-09-300001010470prov:FederalHomeLoanBankFhlbMember2023-09-300001010470prov:OtherInvestorsMemberprov:MortgagePartnershipFinanceMpfProgramMember2023-06-300001010470prov:FederalHomeLoanBankFhlbMember2023-06-3000010104702022-09-3000010104702022-06-300001010470prov:AprilTwoThousandTwentyTwoStockRepurchasePlanMember2023-09-282023-09-2800010104702022-07-012023-06-300001010470us-gaap:FairValueInputsLevel3Memberus-gaap:EstimateOfFairValueFairValueDisclosureMember2023-09-300001010470us-gaap:FairValueInputsLevel2Memberus-gaap:EstimateOfFairValueFairValueDisclosureMember2023-09-300001010470us-gaap:FairValueInputsLevel1Memberus-gaap:EstimateOfFairValueFairValueDisclosureMember2023-09-300001010470us-gaap:EstimateOfFairValueFairValueDisclosureMember2023-09-300001010470us-gaap:CarryingReportedAmountFairValueDisclosureMember2023-09-300001010470us-gaap:FairValueInputsLevel3Memberus-gaap:EstimateOfFairValueFairValueDisclosureMember2023-06-300001010470us-gaap:FairValueInputsLevel2Memberus-gaap:EstimateOfFairValueFairValueDisclosureMember2023-06-300001010470us-gaap:FairValueInputsLevel1Memberus-gaap:EstimateOfFairValueFairValueDisclosureMember2023-06-300001010470us-gaap:EstimateOfFairValueFairValueDisclosureMember2023-06-300001010470us-gaap:CarryingReportedAmountFairValueDisclosureMember2023-06-300001010470us-gaap:FairValueInputsLevel3Memberus-gaap:FairValueMeasurementsRecurringMember2023-09-300001010470us-gaap:FairValueInputsLevel2Memberus-gaap:FairValueMeasurementsRecurringMember2023-09-300001010470us-gaap:FairValueInputsLevel1Memberus-gaap:FairValueMeasurementsRecurringMember2023-09-300001010470us-gaap:FairValueMeasurementsRecurringMember2023-09-300001010470us-gaap:FairValueInputsLevel3Memberus-gaap:FairValueMeasurementsRecurringMember2023-06-300001010470us-gaap:FairValueInputsLevel2Memberus-gaap:FairValueMeasurementsRecurringMember2023-06-300001010470us-gaap:FairValueInputsLevel1Memberus-gaap:FairValueMeasurementsRecurringMember2023-06-300001010470us-gaap:FairValueMeasurementsRecurringMember2023-06-300001010470prov:MortgagePartnershipFinanceMpfProgramMember2023-07-012023-09-300001010470us-gaap:FirstMortgageMember2023-07-012023-09-300001010470prov:TroubledDebtRestructuringsMember2023-07-012023-09-300001010470prov:CommercialRealEstateOrSecondMortgageMember2023-07-012023-09-300001010470prov:BankruptcyMember2023-07-012023-09-300001010470us-gaap:FairValueInputsLevel3Memberus-gaap:FairValueMeasurementsNonrecurringMember2023-09-300001010470us-gaap:FairValueInputsLevel2Memberus-gaap:FairValueMeasurementsNonrecurringMember2023-09-300001010470us-gaap:FairValueInputsLevel1Memberus-gaap:FairValueMeasurementsNonrecurringMember2023-09-300001010470us-gaap:FairValueMeasurementsNonrecurringMember2023-09-300001010470us-gaap:FairValueInputsLevel3Memberus-gaap:FairValueMeasurementsNonrecurringMember2023-06-300001010470us-gaap:FairValueInputsLevel2Memberus-gaap:FairValueMeasurementsNonrecurringMember2023-06-300001010470us-gaap:FairValueInputsLevel1Memberus-gaap:FairValueMeasurementsNonrecurringMember2023-06-300001010470us-gaap:FairValueMeasurementsNonrecurringMember2023-06-300001010470us-gaap:ResidentialPortfolioSegmentMemberprov:MortgageLoansSingleFamilyMember2023-06-300001010470us-gaap:ServicingContractsMemberus-gaap:FairValueInputsLevel3Memberus-gaap:MeasurementInputPrepaymentRateMemberus-gaap:ValuationTechniqueDiscountedCashFlowMember2023-07-012023-09-300001010470us-gaap:InterestOnlyStripMemberus-gaap:FairValueInputsLevel3Memberus-gaap:MeasurementInputPrepaymentRateMemberus-gaap:ValuationTechniqueDiscountedCashFlowMember2023-07-012023-09-300001010470us-gaap:InterestOnlyStripMemberus-gaap:FairValueInputsLevel3Memberus-gaap:MeasurementInputDiscountRateMemberus-gaap:ValuationTechniqueDiscountedCashFlowMember2023-07-012023-09-300001010470us-gaap:CollateralizedMortgageObligationsMemberus-gaap:FairValueInputsLevel3Memberus-gaap:MeasurementInputComparabilityAdjustmentMemberus-gaap:ValuationTechniqueConsensusPricingModelMember2023-07-012023-09-300001010470prov:LoansHeldForInvestmentAtFairValueMemberus-gaap:FairValueInputsLevel3Memberprov:MeasurementInputEntityAclFactorsMemberprov:ValuationTechniqueRelativeValueAnalysisMember2023-07-012023-09-300001010470prov:LoansHeldForInvestmentAtFairValueMemberus-gaap:FairValueInputsLevel3Memberprov:MeasurementInputBrokerQuotesMemberprov:ValuationTechniqueRelativeValueAnalysisMember2023-07-012023-09-300001010470prov:IndividuallyEvaluatedAllowanceLoanMemberus-gaap:FairValueInputsLevel3Memberus-gaap:MeasurementInputDefaultRateMemberus-gaap:ValuationTechniqueDiscountedCashFlowMember2023-07-012023-09-300001010470us-gaap:ResidentialPortfolioSegmentMember2023-07-012023-09-300001010470us-gaap:ResidentialPortfolioSegmentMemberprov:MortgageLoansSingleFamilyMember2023-09-3000010104702023-09-3000010104702023-06-300001010470srt:WeightedAverageMemberus-gaap:ServicingContractsMemberus-gaap:FairValueInputsLevel3Memberus-gaap:MeasurementInputPrepaymentRateMemberus-gaap:ValuationTechniqueDiscountedCashFlowMember2023-09-300001010470srt:WeightedAverageMemberus-gaap:ServicingContractsMemberus-gaap:FairValueInputsLevel3Memberus-gaap:MeasurementInputDiscountRateMemberus-gaap:ValuationTechniqueDiscountedCashFlowMember2023-09-300001010470srt:WeightedAverageMemberus-gaap:InterestOnlyStripMemberus-gaap:FairValueInputsLevel3Memberus-gaap:MeasurementInputPrepaymentRateMemberus-gaap:ValuationTechniqueDiscountedCashFlowMember2023-09-300001010470srt:WeightedAverageMemberus-gaap:CollateralizedMortgageObligationsMemberus-gaap:FairValueInputsLevel3Memberus-gaap:MeasurementInputComparabilityAdjustmentMemberus-gaap:ValuationTechniqueConsensusPricingModelMember2023-09-300001010470srt:WeightedAverageMemberprov:LoansHeldForInvestmentAtFairValueMemberus-gaap:FairValueInputsLevel3Memberprov:MeasurementInputBrokerQuotesMemberprov:ValuationTechniqueRelativeValueAnalysisMember2023-09-300001010470srt:WeightedAverageMemberprov:LoansHeldForInvestmentatFairValueMemberus-gaap:FairValueInputsLevel3Memberprov:MeasurementInputBrokerQuotesMemberprov:ValuationTechniqueRelativeValueAnalysisMember2023-09-300001010470srt:MinimumMemberus-gaap:ServicingContractsMemberus-gaap:FairValueInputsLevel3Memberus-gaap:MeasurementInputPrepaymentRateMemberus-gaap:ValuationTechniqueDiscountedCashFlowMember2023-09-300001010470srt:MinimumMemberus-gaap:ServicingContractsMemberus-gaap:FairValueInputsLevel3Memberus-gaap:MeasurementInputDiscountRateMemberus-gaap:ValuationTechniqueDiscountedCashFlowMember2023-09-300001010470srt:MinimumMemberus-gaap:InterestOnlyStripMemberus-gaap:FairValueInputsLevel3Memberus-gaap:MeasurementInputPrepaymentRateMemberus-gaap:ValuationTechniqueDiscountedCashFlowMember2023-09-300001010470srt:MinimumMemberus-gaap:CollateralizedMortgageObligationsMemberus-gaap:FairValueInputsLevel3Memberus-gaap:MeasurementInputComparabilityAdjustmentMemberus-gaap:ValuationTechniqueConsensusPricingModelMember2023-09-300001010470srt:MinimumMemberprov:LoansHeldForInvestmentAtFairValueMemberus-gaap:FairValueInputsLevel3Memberprov:MeasurementInputBrokerQuotesMemberprov:ValuationTechniqueRelativeValueAnalysisMember2023-09-300001010470srt:MinimumMemberprov:LoansHeldForInvestmentatFairValueMemberus-gaap:FairValueInputsLevel3Memberprov:MeasurementInputBrokerQuotesMemberprov:ValuationTechniqueRelativeValueAnalysisMember2023-09-300001010470srt:MaximumMemberus-gaap:ServicingContractsMemberus-gaap:FairValueInputsLevel3Memberus-gaap:MeasurementInputPrepaymentRateMemberus-gaap:ValuationTechniqueDiscountedCashFlowMember2023-09-300001010470srt:MaximumMemberus-gaap:ServicingContractsMemberus-gaap:FairValueInputsLevel3Memberus-gaap:MeasurementInputDiscountRateMemberus-gaap:ValuationTechniqueDiscountedCashFlowMember2023-09-300001010470srt:MaximumMemberus-gaap:InterestOnlyStripMemberus-gaap:FairValueInputsLevel3Memberus-gaap:MeasurementInputPrepaymentRateMemberus-gaap:ValuationTechniqueDiscountedCashFlowMember2023-09-300001010470srt:MaximumMemberus-gaap:CollateralizedMortgageObligationsMemberus-gaap:FairValueInputsLevel3Memberus-gaap:MeasurementInputComparabilityAdjustmentMemberus-gaap:ValuationTechniqueConsensusPricingModelMember2023-09-300001010470srt:MaximumMemberprov:LoansHeldForInvestmentAtFairValueMemberus-gaap:FairValueInputsLevel3Memberprov:MeasurementInputBrokerQuotesMemberprov:ValuationTechniqueRelativeValueAnalysisMember2023-09-300001010470srt:MaximumMemberprov:LoansHeldForInvestmentatFairValueMemberus-gaap:FairValueInputsLevel3Memberprov:MeasurementInputBrokerQuotesMemberprov:ValuationTechniqueRelativeValueAnalysisMember2023-09-300001010470us-gaap:InterestOnlyStripMemberus-gaap:FairValueInputsLevel3Memberus-gaap:MeasurementInputDiscountRateMemberus-gaap:ValuationTechniqueDiscountedCashFlowMember2023-09-300001010470prov:IndividuallyEvaluatedAllowanceLoanMemberus-gaap:FairValueInputsLevel3Memberus-gaap:MeasurementInputDefaultRateMemberus-gaap:ValuationTechniqueDiscountedCashFlowMember2023-09-300001010470srt:MaximumMemberprov:BankruptcyMember2023-07-012023-09-300001010470us-gaap:ResidentialPortfolioSegmentMemberus-gaap:ConstructionLoansMember2023-07-012023-09-300001010470us-gaap:ResidentialPortfolioSegmentMemberprov:MortgageLoansSingleFamilyMember2023-07-012023-09-300001010470us-gaap:ResidentialPortfolioSegmentMemberprov:MortgageLoansOtherMember2023-07-012023-09-300001010470us-gaap:ResidentialPortfolioSegmentMemberprov:MortgageLoansMultiFamilyMember2023-07-012023-09-300001010470us-gaap:ResidentialPortfolioSegmentMemberprov:MortgageLoansCommercialRealEstateMember2023-07-012023-09-300001010470us-gaap:CommercialPortfolioSegmentMember2023-07-012023-09-300001010470us-gaap:ResidentialPortfolioSegmentMemberus-gaap:ConstructionLoansMember2022-07-012022-09-300001010470us-gaap:ResidentialPortfolioSegmentMemberprov:MortgageLoansSingleFamilyMember2022-07-012022-09-300001010470us-gaap:ResidentialPortfolioSegmentMemberprov:MortgageLoansOtherMember2022-07-012022-09-300001010470us-gaap:ResidentialPortfolioSegmentMemberprov:MortgageLoansMultiFamilyMember2022-07-012022-09-300001010470us-gaap:ResidentialPortfolioSegmentMemberprov:MortgageLoansCommercialRealEstateMember2022-07-012022-09-300001010470us-gaap:ConsumerPortfolioSegmentMember2022-07-012022-09-300001010470us-gaap:CommercialPortfolioSegmentMember2022-07-012022-09-3000010104702022-07-012022-09-3000010104702023-10-3100010104702023-07-012023-09-30xbrli:sharesxbrli:pureiso4217:USDprov:loanprov:propertyiso4217:USDxbrli:shares

Table of Contents

UNITED STATES

SECURITIES AND EXCHANGE COMMISSION

Washington, D.C. 20549

FORM 10-Q

(Mark One)

[   ]

QUARTERLY REPORT PURSUANT TO SECTION 13 OR 15(d) OF THE SECURITIES EXCHANGE ACT OF 1934

For the quarterly period ended

September 30, 2023

[     ]

TRANSITION REPORT PURSUANT TO SECTION 13 OR 15(d) OF THE SECURITIES EXCHANGE ACT OF 1934

For the transition period from ________________ to _________________

Commission File Number 000-28304

PROVIDENT FINANCIAL HOLDINGS, INC.

(Exact name of registrant as specified in its charter)

Delaware

33-0704889

(State or other jurisdiction of
incorporation or organization)

(I.R.S. Employer
Identification No.)

3756 Central Avenue, Riverside, California 92506

(Address of principal executive offices and zip code)

(951) 686-6060

(Registrant’s telephone number, including area code)

_________________________________________________________

(Former name, former address and former fiscal year, if changed since last report)

Securities registered pursuant to Section 12(b) of the Act:

Title of each class

Trading Symbol(s)

Name of each exchange on which registered

Common stock, par value $0.01 per share

PROV

The NASDAQ Stock Market LLC

Indicate by check mark whether the registrant (1) has filed all reports required to be filed by Section 13 or 15(d) of the Securities Exchange Act of 1934 during the preceding 12 months (or for such shorter period that the registrant was required to file such reports), and (2) has been subject to such filing requirements for the past 90 days.                 Yes    No

Indicate by check mark whether the registrant has submitted electronically every Interactive Data File required to be submitted pursuant to Rule 405 of Regulation S-T (§232.405 of this chapter) during the preceding 12 months (or for such shorter period that the registrant was required to submit such files).                  Yes    No

Indicate by check mark whether the registrant is a large accelerated filer, an accelerated filer, a non-accelerated filer, smaller reporting company, or an emerging growth company. See the definitions of “large accelerated filer,” “accelerated filer,” “smaller reporting company,” and “emerging growth company” in Rule 12b-2 of the Exchange Act.

Large accelerated filer 

Accelerated filer  

Non-accelerated filer 

Smaller reporting company

Emerging growth company

If an emerging growth company, indicate by check mark if the registrant has elected not to use the extended transition period for complying with any new or revised financial accounting standards provided pursuant to Section 13(a) of the Exchange Act  

Indicate by check mark whether the registrant is a shell company (as defined in Rule 12b-2 of the Exchange Act).

 Yes   No

APPLICABLE ONLY TO CORPORATE ISSUERS

Indicate the number of shares outstanding of each of the issuer’s classes of common stock, as of the latest practicable date. As of October 31, 2023, there were 6,985,926 shares of the registrant's common stock, $0.01 par value per share, outstanding.

Table of Contents

PROVIDENT FINANCIAL HOLDINGS, INC.

Table of Contents

PART 1  -

FINANCIAL INFORMATION

Page

ITEM 1  -

Financial Statements. The Unaudited Interim Condensed Consolidated Financial Statements of
Provident Financial Holdings, Inc. filed as a part of the report are as follows:

Condensed Consolidated Statements of Financial Condition
as of September 30, 2023 and June 30, 2023

1

Condensed Consolidated Statements of Operations
for the Quarters Ended September 30, 2023 and 2022

2

Condensed Consolidated Statements of Comprehensive Income
for the Quarters Ended September 30, 2023 and 2022

3

Condensed Consolidated Statements of Stockholders’ Equity
for the Quarters Ended September 30, 2023 and 2022

4

Condensed Consolidated Statements of Cash Flows
for the Three Months Ended September 30, 2023 and 2022

5

Notes to Unaudited Interim Condensed Consolidated Financial Statements

6

ITEM 2  -

Management’s Discussion and Analysis of Financial Condition and Results of Operations:

General

33

Safe-Harbor Statement

34

Critical Accounting Estimates

35

Executive Summary and Operating Strategy

35

Commitments and Derivative Financial Instruments

36

Comparison of Financial Condition at September 30, 2023 and June 30, 2023

36

Comparison of Operating Results for the Quarters Ended September 30, 2023 and 2022

38

Asset Quality

43

Loan Volume Activities

45

Liquidity and Capital Resources

45

Supplemental Information

47

ITEM 3  -

Quantitative and Qualitative Disclosures about Market Risk

47

ITEM 4  -

Controls and Procedures

52

PART II  -

OTHER INFORMATION

ITEM 1  -

Legal Proceedings

52

ITEM 1A -

Risk Factors

53

ITEM 2  -

Unregistered Sales of Equity Securities, Use of Proceeds and Issuer Purchased of Equity Securities

53

ITEM 3  -

Defaults Upon Senior Securities

53

ITEM 4  -

Mine Safety Disclosures

53

ITEM 5  -

Other Information

53

ITEM 6  -

Exhibits

54

SIGNATURES

55

Table of Contents

PROVIDENT FINANCIAL HOLDINGS, INC.

Condensed Consolidated Statements of Financial Condition

(Unaudited)

In Thousands, Except Share and Per Share Information

September 30, 

June 30, 

2023


2023

Assets

Cash and cash equivalents

$

57,978

$

65,849

Investment securities - held to maturity, at cost with no allowance for credit losses


147,574


154,337

Investment securities - available for sale, at fair value with no allowance for credit losses


2,090


2,155

Loans held for investment, net of allowance for credit losses of $7,679 and $5,946, respectively; includes $1,061 and $1,312 of loans held at fair value, respectively; $861.4 million and $967.6 million pledged to Federal Home Loan Bank ("FHLB") - San Francisco, respectively; $106.6 million and $0 pledged to Federal Reserve Bank ("FRB") - San Francisco, respectively


1,072,170


1,077,629

Accrued interest receivable


3,952


3,711

FHLB - San Francisco stock


9,505


9,505

Premises and equipment, net


9,426


9,231

Prepaid expenses and other assets


10,420


10,531


Total assets

$

1,313,115

$

1,332,948


Liabilities and Stockholders’ Equity


Liabilities:


Noninterest-bearing deposits

$

105,944

$

103,007

Interest-bearing deposits


825,187


847,564

Total deposits


931,131


950,571


Borrowings


235,009


235,009

Accounts payable, accrued interest and other liabilities


17,770


17,681

Total liabilities


1,183,910


1,203,261


Commitments and Contingencies


Stockholders’ equity:


Preferred stock, $0.01 par value (2,000,000 shares authorized; none issued and outstanding)


Common stock, $0.01 par value; (40,000,000 and 40,000,000 shares authorized; 18,229,615 and 18,229,615 shares issued respectively; 7,007,058 and 7,043,170 outstanding, respectively)


183


183

Additional paid-in capital


99,554


99,505

Retained earnings


207,231


207,274

Treasury stock at cost (11,222,557 and 11,186,445 shares, respectively)


(177,732)


(177,237)

Accumulated other comprehensive loss, net of tax


(31)


(38)


Total stockholders’ equity


129,205


129,687


Total liabilities and stockholders’ equity

$

1,313,115

$

1,332,948

The accompanying notes are an integral part of these condensed consolidated financial statements.

1

Table of Contents

PROVIDENT FINANCIAL HOLDINGS, INC.

Condensed Consolidated Statements of Operations

(Unaudited)

In Thousands, Except Per Share Information

Quarter Ended

September 30, 


2023

2022


Interest income:


Loans receivable, net

$

12,176


$

9,100

Investment securities


524


536

FHLB - San Francisco stock


179


123

Interest-earning deposits


463


139

Total interest income


13,342


9,898


Interest expense:


Checking and money market deposits

57

60

Savings deposits

38

44

Time deposits

1,790

213

Borrowings


2,318


616

Total interest expense


4,203


933


Net interest income


9,139


8,965

Provision for credit losses


545


70

Net interest income, after provision for credit losses


8,594


8,895


Non-interest income:


Loan servicing and other fees


(21)


108

Deposit account fees


288


343

Card and processing fees


353


381

Other


131


171

Total non-interest income


751


1,003


Non-interest expense:


Salaries and employee benefits


4,114


4,139

Premises and occupancy


903


861

Equipment expense


287


311

Professional expense


472


592

Sales and marketing expense


168


147

Deposit insurance premium and regulatory assessments


197


135

Other


715


756

Total non-interest expense


6,856


6,941


Income before income taxes


2,489


2,957

Provision for income taxes


727


867

Net income

$

1,762


$

2,090


Basic earnings per share

$

0.25


$

0.29

Diluted earnings per share

$

0.25


$

0.29

The accompanying notes are an integral part of these condensed consolidated financial statements.

2

Table of Contents

PROVIDENT FINANCIAL HOLDINGS, INC.

Condensed Consolidated Statements of Comprehensive Income

(Unaudited)

In Thousands

For the Quarter Ended

September 30, 


2023


2022


Net income

$

1,762


$

2,090


Change in unrealized holding income (losses) on securities available for sale and interest-only strips


10


(27)

Reclassification of losses to net income


Other comprehensive income (loss), before income tax expense (benefit)


10


(27)

Income tax expense (benefit)


3


(8)

Other comprehensive income (loss)


7


(19)

Total comprehensive income

$

1,769


$

2,071

The accompanying notes are an integral part of these condensed consolidated financial statements.

3

Table of Contents

PROVIDENT FINANCIAL HOLDINGS, INC.

Condensed Consolidated Statements of Stockholders' Equity

(Unaudited)

In Thousands, Except Share and Per Share Information

For the Quarters Ended September 30, 2023 and 2022:


Accumulated 


Other 


Common 

Additional 

Comprehensive 


Stock

Paid-In

Retained

Treasury

(Loss) Income,


Shares

Amount

Capital

Earnings

Stock

Net of Tax

Total

Balance at June 30, 2023


7,043,170

$

183

$

99,505

$

207,274

$

(177,237)

$

(38)

$

129,687

Net income


1,762


1,762

Other comprehensive income


7

7

Purchase of treasury stock


(36,112)


(495)


(495)

Amortization of restricted stock


43


43

Stock options expense


6


6

Cash dividends(1)


(981)


(981)

Adoption of CECL standard

(824)

(824)

Balance at September 30, 2023


7,007,058

$

183

$

99,554

$

207,231

$

(177,732)

$

(31)

$

129,205

(1)Cash dividends of $0.14 per share were paid in the quarter ended September 30, 2023.


Accumulated 


Other 


Common 

Additional 

Comprehensive 


Stock

Paid-In

Retained

Treasury

Income (Loss),


Shares

Amount

Capital

Earnings

Stock

Net of Tax

Total

Balance at June 30, 2022


7,285,184

$

183

$

98,826

$

202,680

$

(173,041)

$

2

$

128,650

Net income


2,090


2,090

Other comprehensive loss


(19)

(19)

Purchase of treasury stock


(49,624)


(724)


(724)

Awards of restricted stock

(479)

479

Amortization of restricted stock


197


197

Stock options expense


15


15

Cash dividends(1)


(1,020)


(1,020)

Balance at September 30, 2022


7,235,560

$

183

$

98,559

$

203,750

$

(173,286)

$

(17)

$

129,189

(1)Cash dividends of $0.14 per share were paid in the quarter ended September 30, 2022.

The accompanying notes are an integral part of these condensed consolidated financial statements.

4

Table of Contents

PROVIDENT FINANCIAL HOLDINGS, INC.

Condensed Consolidated Statements of Cash Flows

(Unaudited - In Thousands)

Quarter Ended

September 30, 


2023


2022


Cash flows from operating activities:


Net income

$

1,762


$

2,090

Adjustments to reconcile net income to net cash provided by operating activities :


Depreciation and amortization


757


889

Provision for credit losses


545


70

Stock-based compensation


49


212

Provision for deferred income taxes


96


383

Increase (decrease) in accounts payable, accrued interest and other liabilities


64


(1,492)

Decrease in prepaid expenses and other assets


91


110

Net cash provided by operating activities


3,364


2,262


Cash flows from investing activities:


Net decrease (increase) in loans held for investment


3,562


(54,316)

Maturity of investment securities - held to maturity


200

Principal payments from investment securities - held to maturity


6,608


9,145

Principal payments from investment securities - available for sale


75


132

Purchase of premises and equipment


(564)


(212)

Net cash provided by (used for) investing activities


9,681


(45,051)

Cash flows from financing activities:

Net (decrease) increase in deposits

(19,440)

29,820

Proceeds from long-term borrowings

25,000

Repayments of long-term borrowings

(10,000)

(20,000)

(Repayments of) proceeds from short-term borrowings, net

(15,000)

50,000

Treasury stock purchases

(495)

(724)

Cash dividends

(981)

(1,020)

Net cash (used for) provided by financing activities

(20,916)

58,076

Net (decrease) increase in cash and cash equivalents

(7,871)

15,287

Cash and cash equivalents at beginning of period

65,849

23,414

Cash and cash equivalents at end of period

$

57,978

$

38,701

Supplemental information:

Cash paid for interest

$

3,808

$

835

The accompanying notes are an integral part of these condensed consolidated financial statements.

5

Table of Contents

PROVIDENT FINANCIAL HOLDINGS, INC.

Notes to Unaudited Interim Condensed Consolidated Financial Statements

September 30, 2023

Note 1: Basis of Presentation

The unaudited interim condensed consolidated financial statements included herein reflect all adjustments which are, in the opinion of management, necessary to present a fair statement of the results of operations for the interim periods presented. All such adjustments are of a normal, recurring nature. The condensed consolidated statement of financial condition at June 30, 2023 is derived from the audited consolidated financial statements of Provident Financial Holdings, Inc. and its wholly-owned subsidiary, Provident Savings Bank, F.S.B. (the "Bank") (collectively, the "Corporation"). Certain information and note disclosures normally included in financial statements prepared in accordance with accounting principles generally accepted in the United States of America ("GAAP") have been omitted pursuant to the rules and regulations of the United States Securities and Exchange Commission ("SEC") with respect to interim financial reporting. It is recommended that these unaudited interim condensed consolidated financial statements be read in conjunction with the audited consolidated financial statements and notes thereto included in the Corporation’s Annual Report on Form 10-K for the fiscal year ended June 30, 2023 (“2023 Annual Form 10-K”). The results of operations for the quarter ended September 30, 2023 are not necessarily indicative of results that may be expected for the entire fiscal year ending June 30, 2024.

Note 2: Accounting Standard Updates (“ASU”)

ASU 2020-04:

In March 2020, the Financial Accounting Standards Board (“FASB”) issued ASU No. 2020-04, Reference Rate Reform (Topic 848): Facilitation of the Effects of reference Rate Reform on Financial Reporting. This ASU applies to contracts, hedging relationships and other transactions that reference the London Interbank Offered Rate (“LIBOR”) or other rate references expected to be discontinued because of reference rate reform. The ASU permits an entity to make necessary modifications to eligible contracts or transactions without requiring contract remeasurement or reassessment of a previous accounting determination. In January 2021, ASU 2021-01 clarified that certain optional expedients and exceptions in Topic 848 for contract modifications and hedge accounting apply to derivatives that are affected by the changes in the interest rates used for margining, discounting, or contract price alignment for derivative instruments that are being implemented as part of the market-wide transition to new reference rates (commonly referred to as the “discounting transition”). In December 2022, the FASB issued ASU 2022-06, Deferral of the Sunset Date of Topic 848. The FASB had originally included a sunset provision within Topic 848 based on expectations of when the LIBOR would cease being published. In March 2021, it was announced that the intended cessation date of LIBOR was extended to June 30, 2023. As a result, the FASB issued ASU 2022-06 deferring the sunset date of Topic 848 from March 31, 2023 to December 31, 2024. This ASU is effective for all entities as of March 12, 2020 through December 31, 2024. As of June 30, 2023, the Corporation had approximately $469.4 million in loans held for investment with LIBOR indices. Beginning July 1, 2023, the Corporation started to transition these loans to Secured Overnight Financing Rate (“SOFR”) indices or other rate indices in accordance with the government agency guidelines. As of September 30, 2023, all loans held for investment with LIBOR indices had been transitioned to SOFR or other rate indices. The Corporation determined that the impact of the adoption of this ASU did not have a material impact to its consolidated financial statements.

ASU 2016-13:

In June 2016, the FASB issued ASU 2016-13, “Financial Instruments - Credit Losses (Topic 326): Measurement of Credit Losses on Financial Instruments,” and subsequent amendments to the initial guidance. On July 1, 2023, the Corporation adopted this ASU that replaced the incurred loss methodology with the current expected credit loss (“CECL”) methodology. CECL requires an estimate of credit losses for the remaining estimated life of the financial asset using historical experience, current conditions, and reasonable and supportable forecasts and applies to financial assets measured at amortized cost, including loans held for investment and held-to-maturity investment securities, and some off-balance sheet credit exposures such as unfunded commitments to extend credit. Financial assets measured at amortized cost will be presented at the net amount expected to be collected by using an allowance for credit losses (“ACL”).

6

Table of Contents

In addition, CECL made changes to the accounting for available for sale investment securities. One such change is to require credit losses to be presented as an allowance rather than as a write-down on available for sale debt securities if management does not intend to sell and does not believe that it is more likely than not, they will be required to sell.

The Corporation adopted ASC 326, “Financial Instruments – Credit Losses,” and all related subsequent amendments using the prospective transition approach for all financial assets measured at amortized cost and off-balance sheet credit exposures. The transition adjustment of the adoption of CECL included an $1.2 million increase in the ACL, which is presented as a reduction to net loans held for investment. The Corporation recorded a net decrease to retained earnings of $824,000 as of July 1, 2023 for the cumulative effect of adopting CECL, which reflects the transition adjustments noted above, net of the applicable deferred tax assets recorded. Results for reporting periods beginning after July 1, 2023 are presented under CECL while prior period amounts continue to be reported in accordance with previously applicable accounting standards.

The Corporation adopted ASC 326 using the prospective transition approach for debt securities for which other-than-temporary impairment had been recognized prior to July 1, 2023. As of June 30, 2023, the Corporation did not have any other-than-temporary impaired investment securities. Therefore, upon adoption of ASC 326, the Corporation determined that an ACL on available for sale securities was not deemed necessary.

The following table illustrates the impact on the ACL from the adoption of ASC 326:

Allowance for

Allowance

Impact to

credit losses

before adoption

allowance after ASC

under ASC 326

of ASC 326

326 adoption

(In Thousands)

(07/01/2023)

(06/30/2023)

(07/01/2023)

Assets:


Mortgage loans:


Single-family

$

6,325

$

1,720


$

4,605

Multi-family

656

3,270

(2,614)

Commercial real estate

82

868

(786)

Construction

62

15

47

Other

5

2

3

Commercial business loans

13

67

(54)

Consumer loans

4

(4)

ACL on loans

$

7,143

$

5,946

$

1,197

Liabilities:

Unfunded loan commitment reserve

$

42

$

42

$

In March 2022, FASB issued ASU 2022-02, “Financial Instruments-Credit Losses (Topic 326) Troubled Debt Restructurings and Vintage Disclosures.” This ASU provides new guidance on the treatment of troubled debt restructurings in relation to the adoption of the CECL model for the accounting for credit losses (see note above regarding ASU 2016-13). Previous accounting guidance related to troubled debt restructurings (“TDRs”) is eliminated and new disclosure requirements are adopted in regards to loan refinancing and restructurings made to borrowers experiencing financial difficulties under the assumption that the CECL model will capture credit losses related to TDRs. These required disclosures regarding gross write-offs for financing receivables by year of origination and loan modifications are also included in this ASU. The Corporation will no longer report TDRs or classify loans as TDRs given those previously recognized as TDRs have been incorporated into the CECL methodology in regard to loan loss reserves as of July 1, 2023.  

7

Table of Contents

Note 3: Earnings Per Share

Basic earnings per share (“EPS”) excludes dilution and is computed by dividing income available to common shareholders by the weighted-average number of shares outstanding for the period. Diluted EPS reflects the potential dilution that could occur if securities or other contracts to issue common stock were exercised or converted into common stock or resulted in the issuance of common stock that would then share in the earnings of the Corporation.

As of September 30, 2023 and 2022, there were outstanding stock options to purchase 434,500 shares and 461,000 shares of the Corporation’s common stock, respectively. As of September 30, 2023 and 2022, all outstanding stock options were excluded from the diluted EPS computation as their effect was anti-dilutive. As of September 30, 2023 and 2022, there were outstanding restricted stock awards of 51,000 shares and 147,750 shares, respectively.

The following table provides the basic and diluted EPS computations for the quarters ended September 30, 2023 and 2022, respectively.

For the Quarter Ended

September 30, 

(In Thousands, Except Earnings Per Share)


2023


2022

Numerator:

     Net income – numerator for basic earnings per share and 

       diluted earnings per share - available to common

       stockholders

$

1,762

$

2,090

Denominator:

     Denominator for basic earnings per share:

        Weighted-average shares


7,017


7,273

     Effect of dilutive shares:

        Stock options


        Restricted stock


10


37

     Denominator for diluted earnings per share:

        Adjusted weighted-average shares and assumed

          conversions

7,027

7,310

Basic earnings per share


$

0.25


$

0.29

Diluted earnings per share


$

0.25


$

0.29

8

Table of Contents

Note 4: Investment Securities

The amortized cost and estimated fair value of investment securities as of September 30, 2023 and June 30, 2023 were as follows:


Gross


Gross


Estimated


Amortized

Unrealized

Unrealized

Fair

Carrying

September 30, 2023

Cost

Gains

(Losses)

Value

Value

(In Thousands)


Held to maturity


U.S. government sponsored enterprise MBS(1)

$

143,070

$

1

$

(20,376)

$

122,695

$

143,070

U.S. government sponsored enterprise CMO(2)

3,870

(347)

3,523

3,870

U.S. SBA securities(3)


634


(1)


633


634

Total investment securities - held to maturity

147,574

1

(20,724)

126,851

147,574


Available for sale


U.S. government agency MBS

1,379

(39)

1,340

1,340

U.S. government sponsored enterprise MBS

662

(10)

652


652

Private issue CMO


101


(3)


98


98

Total investment securities - available for sale

2,142

(52)

2,090

2,090

Total investment securities

$

149,716

$

1

$

(20,776)

$

128,941

$

149,664

(1)Mortgage-Backed Securities (“MBS”).
(2)Collateralized Mortgage Obligations (“CMO”).
(3)Small Business Administration (“SBA”).


Gross


Gross


Estimated


Amortized

Unrealized

Unrealized

Fair

Carrying

June 30, 2023

Cost

Gains

(Losses)

Value

Value

(In Thousands)


Held to maturity


U.S. government sponsored enterprise MBS

$

149,803

$

$

(18,459)

$

131,344

$

149,803

U.S. government sponsored enterprise CMO

3,883

(336)

3,547

3,883

U.S. SBA securities


651


(1)


650


651

Total investment securities - held to maturity

154,337

(18,796)

135,541

154,337


Available for sale


U.S. government agency MBS

1,417

(47)

1,370

1,370

U.S. government sponsored enterprise MBS


697


(14)


683


683

Private issue CMO


103


(1)


102


102

Total investment securities - available for sale

2,217

(62)

2,155

2,155

Total investment securities

$

156,554

$

$

(18,858)

$

137,696

$

156,492

In the first quarters of fiscal 2024 and 2023, the Corporation received MBS principal payments of $6.7 million and $9.3 million, respectively, and there were no purchases or sales of investment securities during these periods.

9

Table of Contents

The Corporation held investments with an unrealized loss position of $20.8 million at September 30, 2023 and $18.9 million at June 30, 2023.

As of September 30, 2023

Unrealized Holding Losses

Unrealized Holding Losses

Unrealized Holding Losses

(In Thousands)

Less Than 12 Months

12 Months or More

Total

Fair

Unrealized

Fair

Unrealized

Fair

Unrealized

Description of Securities


Value


Losses


Value


Losses


Value


Losses

Held to maturity

U.S. government sponsored enterprise MBS

$

2,237

$

3

$

119,202

$

20,373

$

121,439

$

20,376

U.S. government sponsored enterprise CMO

3,523

347

3,523

347

U.S. SBA securities

633

1

633

1

Total investment securities - held to maturity

2,237

3

123,358

20,721

125,595

20,724

Available for sale

U.S government agency MBS

1,340

39

1,340

39

U.S. government sponsored enterprise MBS

62

1

558

9

620

10

Private issue CMO

98

3

98

3

Total investment securities - available for sale

62

1

1,996

51

2,058

52

Total investment securities

$

2,299

$

4

125,354

$

20,772

$

127,653

$

20,776

As of June 30, 2023

Unrealized Holding Losses

Unrealized Holding Losses

Unrealized Holding Losses

(In Thousands)

Less Than 12 Months

12 Months or More

Total

Fair

Unrealized

Fair

Unrealized

Fair

Unrealized

Description of Securities


Value


Losses


Value


Losses


Value


Losses

Held to maturity

U.S. government sponsored enterprise MBS

$

10,839

$

253

$

120,506

$

18,206

$

131,345

$

18,459

U.S. government sponsored enterprise CMO

3,547

336

3,547

336

U.S. SBA securities

650

1

650

1

Total investment securities - held to maturity

11,489

254

124,053

18,542

135,542

18,796

Available for sale

U.S government agency MBS

696

20

673

27

1,369

47

U.S. government sponsored enterprise MBS

87

2

558

12

645

14

Private issue CMO

102

1

102

1

Total investment securities - available for sale

783

22

1,333

40

2,116

62

Total investment securities

$

12,272

$

276

$

125,386

$

18,582

$

137,658

$

18,858

The Corporation adopted ASC 326 on July 1, 2023. The Corporation evaluates individual investment securities quarterly for impairment. At September 30, 2023, predominately all of the $20.8 million of unrealized holding losses were in a loss position for 12 months or more; while at June 30, 2023, $18.6 million of the $18.9 million of unrealized holding losses were in a loss position for 12 months or more. The unrealized losses on investment securities were attributable to changes

10

Table of Contents

in interest rates relative to when the investment securities were purchased and not due to the credit quality of the investment securities, which are predominately U.S. government sponsored enterprise (GSE) securities that are either explicitly or implicitly guaranteed by the U.S. government and have a long history of no credit losses. Therefore, the Corporation has determined that the unrealized losses are due to the fluctuating nature of interest rates, and not related to credit risks. As a part of the Corporation’s monthly risk assessment, the Corporation runs a number of stressed liquidity scenarios. These liquidity scenarios support the Corporation’s assessment that the Corporation has the ability to hold these securities until maturity and does not need to liquidate these investment securities in order to maintain adequate liquidity. As a result, no ACL on investment securities was recorded at adoption and at September 30, 2023.

In order to maintain adequate liquidity, the Bank has established borrowing facilities with various counterparties. The Bank had a remaining borrowing capacity of $286.9 million as of September 30, 2023 at the FHLB of San Francisco. In addition, the Bank has secured an estimated $185.3 million discount window facility at the FRB of San Francisco collateralized by investment securities with total balance of $143.6 million and loans with total balance of $106.6 million as of September 30, 2023. As of September 30, 2023, the Bank also has a borrowing arrangement in the form of a federal funds facility with its correspondent bank for $50.0 million. The Bank had no advances under the Federal Reserve discount window or correspondent bank facility as of September 30, 2023.

At June 30, 2023, the Bank had a remaining borrowing capacity of $287.9 million at the FHLB of San Francisco. In addition, the Bank had secured an estimated $139.0 million discount window facility at the FRB of San Francisco collateralized by investment securities with a June 30, 2023 total balance of $150.3 million. As of June 30, 2023, the Bank also had a borrowing arrangement in the form of a federal funds facility with its correspondent bank for $50.0 million. The Bank had no advances under the Federal Reserve discount window or correspondent bank facility as of June 30, 2023.

At September 30, 2023 and 2022, the Corporation did not hold any investment securities with the intent to sell and determined it had the ability to hold these investment securities until maturity. It also determined that it was more likely than not that the Corporation would not be required to sell the securities prior to recovery of the amortized cost basis; therefore, no impairment losses were recorded for the quarters ended September 30, 2023 and 2022.

Contractual maturities of investment securities as of September 30, 2023 and June 30, 2023 were as follows:

September 30, 2023

June 30, 2023


Estimated


Estimated

Amortized

Fair

Amortized

Fair

(In Thousands)

Cost

Value

Cost

Value

Held to maturity


Due in one year or less

$

101

$

100

$

303

$

300

Due after one through five years


6,861


6,557


7,686


7,365

Due after five through ten years


57,770


51,267


61,043


54,686

Due after ten years


82,842


68,927


85,305


73,190

Total investment securities - held to maturity

147,574

126,851

154,337

135,541


Available for sale


Due in one year or less

Due after one through five years


Due after five through ten years


569


560


590


580

Due after ten years


1,573


1,530


1,627


1,575

Total investment securities - available for sale

2,142

2,090

2,217

2,155

Total investment securities

$

149,716

$

128,941

$

156,554

$

137,696

11

Table of Contents

Note 5: Loans Held for Investment

Loans held for investment, net of fair value adjustments, consisted of the following:

September 30, 

June 30, 

(In Thousands)

2023


2023

Mortgage loans:


Single-family

$

521,576

$

518,821

Multi-family


457,351


461,113

Commercial real estate


87,954


90,558

Construction


2,100


1,936

Other


104


106

Commercial business loans


1,321


1,565

Consumer loans


62


65

Total loans held for investment, gross


1,070,468


1,074,164


Advance payments of escrows


125


148

Deferred loan costs, net


9,256


9,263

ACL on loans


(7,679)


(5,946)

Total loans held for investment, net

$

1,072,170

$

1,077,629

The following table sets forth information at September 30, 2023 regarding the dollar amount of loans held for investment that are contractually repricing during the periods indicated, segregated between adjustable rate loans and fixed rate loans. Fixed-rate loans comprised 11 percent of loans held for investment at both September 30, 2023 and June 30, 2023. Adjustable rate loans having no stated repricing dates that reprice when the index they are tied to reprices (e.g. prime rate index) and checking account overdrafts are reported as repricing within one year. The table does not include any estimate of prepayments which may cause the Corporation’s actual repricing experience to differ materially from that shown.

Adjustable Rate


After


After


After


Within

One Year

3 Years

5 Years

(In Thousands)

One Year

Through 3 Years

Through 5 Years

Through 10 Years

Fixed Rate

Total

Mortgage loans:

Single-family

$

55,866

$

25,584

$

78,271

$

249,761

$

112,094

$

521,576

Multi-family


160,821


153,088


111,204


32,119


119


457,351

Commercial real estate


38,446


13,573


34,666


1,269


87,954

Construction


2,100


2,100

Other


104


104

Commercial business loans


1,321


1,321

Consumer loans


62


62

Total loans held for investment, gross

$

258,616

$

192,245

$

224,141

$

281,880

$

113,586

$

1,070,468

The Corporation has developed an internal loan grading system to evaluate and quantify the Bank’s loans held for investment portfolio with respect to quality and risk. Management continually evaluates the credit quality of the Corporation’s loan portfolio and conducts a quarterly review of the adequacy of the ACL. The Corporation has adopted an internal risk rating policy in which each loan is rated for credit quality with a rating of pass, special mention, substandard, doubtful or loss.

The two primary components that are used during the loan review process to determine the proper allowance levels are individually evaluated allowances and collectively evaluated allowances. The collectively evaluated allowance is based on a pooling method for groups of homogeneous loans sharing similar loan characteristics to calculate an allowance which reflects an estimate of lifetime expected credit losses using historical experience, current conditions, and reasonable and supportable forecasts. The individually evaluated allowance is allocated to loans identified for evaluation and is calculated based upon the appraised value of the collateral, less selling costs or discounted cash flow with an appropriate default factor.

12

Table of Contents

The Corporation categorizes all of the loans held for investment into risk categories based on relevant information about the ability of the borrower to service their debt such as current financial information, historical payment experience, credit documentation, public information, and current economic trends, among other factors. A description of the general characteristics of the risk grades is as follows:

Pass - These loans range from minimal credit risk to average, but still acceptable, credit risk. The likelihood of loss is considered remote.
Special Mention - A special mention loan has potential weaknesses that may be temporary or, if left uncorrected, may result in a loss. While concerns exist, the bank is currently protected and loss is considered unlikely and not imminent.
Substandard - A substandard loan is inadequately protected by the current sound worth and paying capacity of the borrower or of the collateral pledged, if any. Loans so classified must have a well-defined weakness, or weaknesses, that may jeopardize the liquidation of the debt. A substandard loan is characterized by the distinct possibility that the Bank will sustain some loss if the deficiencies are not corrected.
Doubtful - A doubtful loan has all of the weaknesses inherent in one classified as substandard with the added characteristic that the weaknesses make collection or liquidation in full, on the basis of the currently existing facts, conditions and values, highly questionable and improbable.
Loss - A loss loan is considered uncollectible and of such little value that continuance as an asset of the institution is not warranted.

13

Table of Contents

The following table presents the Corporation’s recorded investment in loans by risk categories by year of origination as of September 30, 2023:

September 30, 2023

Term Loans by Year of Origination

Revolving

(In Thousands)


2023


2022


2021


2020


2019


Prior


Loans


Total

Mortgage loans:

Single-family:

Pass

$

61,583

$

213,223

$

156,078

$

20,591

$

11,729

$

56,862

$

29

$

520,095

Special Mention

-

-

-

-

-

73

-

73

Substandard

-

-

-

250

-

1,158

-

1,408

Total single-family

61,583

213,223

156,078

20,841

11,729

58,093

29

521,576

Current period gross charge-off

$

-

$

-

$

-

$

-

$

-

$

-

$

-

$

-

Multi-family:

Pass

22,501

77,566

90,408

63,897

58,850

143,622

-

456,844

Special Mention

-

-

507

-

-

-

-

507

Substandard

-

-

-

-

-

-

-

-

Total multi-family

22,501

77,566

90,915

63,897

58,850

143,622

-

457,351

Current period gross charge-off

$

-

$

-

$

-

$

-

$

-

$

-

$

-

$

-

Commercial real estate:

Pass

9,407

23,690

5,489

6,486

9,916

32,420

-

87,408

Special Mention

-

-

-

-

-

-

-

-

Substandard

-

-

-

-

-

546

-

546

Total commercial real estate

9,407

23,690

5,489

6,486

9,916

32,966

-

87,954

Current period gross charge-off

$

-

$

-

$

-

$

-

$

-

$

-

$

-

$

-

Construction:

Pass

160

438

1,502

-

-

-

-

2,100

Special Mention

-

-

-

-

-

-

-

-

Substandard

-

-

-

-

-

-

-

-

Total construction

160

438

1,502

-

-

-

-

2,100

Current period gross charge-off

$

-

$

-

$

-

$

-

$

-

$

-

$

-

$

-

Other:

Pass

-

-

-

104

-

-

-

104

Special Mention

-

-

-

-

-

-

-

-

Substandard

-

-

-

-

-

-

-

-

Total other

-

-

-

104

-

-

-

104

Current period gross charge-off

$

-

$

-

$

-

$

-

$

-

$

-

$

-

$

-

Commercial business loans:

Pass

-

161

-

-

-

-

1,160

1,321

Special Mention

-

-

-

-

-

-

-

-

Substandard

-

-

-

-

-

-

-

-

Total commercial business loans

-

161

-

-

-

-

1,160

1,321

Current period gross charge-off

$

-

$

-

$

-

$

-

$

-

$

-

$

-

$

-

Consumer loans:

Not graded

17

-

-

-

-

-

-

17

Pass

-

-

-

-

-

-

45

45

Special Mention

-

-

-

-

-

-

-

-

Substandard

-

-

-

-

-

-

-

-

Total consumer loans

17

-

-

-

-

-

45

62

Current period gross charge-off

$

-

$

-

$

-

$

-

$

-

$

-

$

-

$

-

Total loans held for investment, gross

$

93,668

$

315,078

$

253,984

$

91,328

$

80,495

$

234,681

$

1,234

$

1,070,468

Total current period charge-offs

$

$

$

$

$

$

$

$

14

Table of Contents

The following table presents the Corporation’s recorded investment in loans by risk categories by year of origination as of June 30, 2023:

June 30, 2023

Term Loans by Year of Origination

Revolving

(In Thousands)


2023


2022


2021


2020


2019


Prior


Loans


Total

Mortgage loans:

Single-family:

Pass

$

51,378

$

216,989

$

157,015

$

20,741

$

11,793

$

59,451

$

32

$

517,399

Special Mention

-

-

-

-

-

-

-

-

Substandard

-

-

-

251

-

1,171

-

1,422

Total single-family

51,378

216,989

157,015

20,992

11,793

60,622

32

518,821

Current period gross charge-off

$

-

$

-

$

-

$

-

$

-

$

-

$

-

$

-

Multi-family:

Pass

17,429

77,956

90,926

65,127

59,709

149,456

-

460,603

Special Mention

-

-

510

-

-

-

-

510

Substandard

-

-

-

-

-

-

-

-

Total multi-family

17,429

77,956

91,436

65,127

59,709

149,456

-

461,113

Current period gross charge-off

$

-

$

-

$

-

$

-

$

-

$

-

$

-

$

-

Commercial real estate:

Pass

8,586

23,815

5,527

6,525

9,981

35,577

-

90,011

Special Mention

-

-

-

-

-

-

-

-

Substandard

-

-

-

-

-

547

-

547

Total commercial real estate

8,586

23,815

5,527

6,525

9,981

36,124

-

90,558

Current period gross charge-off

$

-

$

-

$

-

$

-

$

-

$

-

$

-

$

-

Construction:

Pass

94

726

1,116

-

-

-

-

1,936

Special Mention

-

-

-

-

-

-

-

-

Substandard

-

-

-

-

-

-

-

-

Total construction

94

726

1,116

-

-

-

-

1,936

Current period gross charge-off

$

-

$

-

$

-

$

-

$

-

$

-

$

-

$

-

Other:

Pass

-

-

-

106

-

-

-

106

Special Mention

-

-

-

-

-

-

-

-

Substandard

-

-

-

-

-

-

-

-

Total other

-

-

-

106

-

-

-

106

Current period gross charge-off

$

-

$

-

$

-

$

-

$

-

$

-

$

-

$

-

Commercial business loans:

Pass

-

171

-

-

-

-

1,394

1,565

Special Mention

-

-

-

-

-

-

-

-

Substandard

-

-

-

-

-

-

-

-

Total commercial business loans

-

171

-

-

-

-

1,394

1,565

Current period gross charge-off

$

-

$

-

$

-

$

-

$

-

$

-

$

-

$

-

Consumer loans:

Not graded

15

-

-

-

-

-

-

15

Pass

-

-

-

-

-

-

50

50

Special Mention

-

-

-

-

-

-

-

-

Substandard

-

-

-

-

-

-

-

-

Total consumer loans

15

-

-

-

-

-

50

65

Current period gross charge-off

$

-

$

-

$

-

$

-

$

-

$

-

$

-

$

-

Total loans held for investment, gross

$

77,502

$

319,657

$

255,094

$

92,750

$

81,483

$

246,202

$

1,476

$

1,074,164

Total current period charge-offs

$

$

$

$

$

$

$

$

As required by ASC 326, on July 1, 2023 the Corporation implemented CECL and recognized a $1.2 million one-time increase to its ACL. Under ASC 326, the ACL is a valuation account that is deducted from the related loan’s amortized cost basis to present the net amount expected to be collected on the loans. The measurement of expected credit losses is based on relevant information about past events, including historical experience, current conditions, and reasonable and supportable forecasts that affect the collectability of the reported amount. The Corporation’s ACL is calculated quarterly, with any difference in the calculated ACL and the recorded ACL trued-up through an entry to the provision for credit losses. Management calculates the quantitative portion of collectively evaluated reserves for all loan categories using an average charge-off or loss rate methodology and generally evaluates collectively evaluated loans by Call Report code in

15

Table of Contents

order to group and determine portfolio loan segments with similar risk characteristics. The Corporation primarily utilizes historical loss rates for the CECL calculation based on its own specific historical losses and or with peer loss history where applicable.

The expected loss rates are applied to expected monthly loan balances estimated through the consideration of contractual repayment terms and expected prepayments. The prepayment assumptions applied to expected cash flow over the contractual life of the loans are estimated based on historical and bank-specific experience and the consideration of current and expected conditions and circumstances including the level of interest rates. The prepayment assumptions may be updated by management in the event that changing conditions impact management’s estimate or additional historical data gathered has resulted in the need for a reevaluation.

For its reasonable and supportable forecasting of current expected credit losses, the Corporation utilizes a regression using forecasted economic metrics and historical loss data. The regression model utilized upon implementation of CECL on July 1, 2023and as of September 30, 2023, relied upon reasonable and supportable forecasts of the National Unemployment Rate and change in the Real Gross Domestic Product. Management selected the National Unemployment Rate and the Real Gross Domestic Product as the drivers of the forward look component of the collectively evaluated reserves, primarily as a result of high correlation coefficients identified in regression modeling, the availability of forecasts including the quarterly Federal Open Market Committee forecast, and the widespread familiarity with these economic metrics.

Management recognizes that there are additional factors impacting risk of loss in the loan portfolio beyond what is captured in the quantitative portion of reserves on collectively evaluated loans. As current and expected conditions, may vary compared with conditions over the historical lookback period, which is utilized in the calculation of quantitative reserves, management considers whether additional or reduced reserve levels on collectively evaluated loans may be warranted given the consideration of a variety of qualitative factors. The following qualitative factors (“Q-factors”) considered by management reflect the regulatory guidance on the Q-factors:

Changes in the experience, ability, and depth of lending management and other relevant staff.
Changes in the value of underlying collateral for collateral-dependent loans.
The existence and effect of any concentrations of credit, and changes in the level of such concentrations.
Changes in international, national, regional, and local economic and business conditions and developments that affect the collectability of the portfolio, including the condition of various market segments.
The effect of other external factors such as competition and legal and regulatory requirements on the level of estimated credit losses in the institution's existing portfolio.
Changes in the volume and severity of past due loans, the volume of non-performing loans, and the volume and severity of adversely classified or graded loans.
Changes in the quality of the Corporation’s loan review system.
Changes in the nature and volume of the portfolio and in the terms of loans.
Changes in lending policies and procedures, including changes in underwriting standards and collection, charge-off, and recovery practices not considered elsewhere in estimating credit losses.


The qualitative portion of the Corporation’s reserves on collectively evaluated loans are calculated using management judgement, to determine risk categorizations in each of the Q-factors presented above. The amount of qualitative reserves is also contingent upon the relative weighting of the Q-factors according to management’s judgement.


Loans that do not share risk characteristics are evaluated on an individual basis. When management determines that foreclosure is probable and the borrower is experiencing financial difficulty, the expected credit losses are based on the fair value of collateral at the reporting date, less selling costs.

Accrued interest receivable for loans is included in the accrued interest receivable line item on the Corporation’s Condensed Consolidated Statements of Financial Condition. The Corporation elected not to measure an allowance for accrued interest receivable and instead elected to reverse accrued interest income on loans that are placed on non-performing status. A non-performing status is defined as when loans are 90 days or more delinquent and the Bank has stopped accruing interest income. Any outstanding interest receivable that has not been collected is reversed, disclosed accordingly; and therefore, there is no allowance for the accrued interest income. The Corporation believes this policy results in the timely reversal of uncollectible interest.

16

Table of Contents

Pursuant to ASU 2022-02, “Troubled Debt Restructurings and Vintage Disclosures,” the Corporation may agree to different types of modifications, including principal forgiveness, interest rate reductions, term extension, significant payment delay or any combination of modifications noted above. During the quarter ended September 30, 2023, there were no loan modifications to borrowers experiencing financial difficulties.

Management believes the ACL on loans held for investment is maintained at a level sufficient to provide for expected losses on the Corporation’s loans held for investment based on historical loss experience, current conditions, and reasonable and supportable forecasts. The provision for (reversal of) credit losses is charged (credited) against operations on a quarterly basis, as necessary, to maintain the ACL at appropriate levels. Future adjustments to the ACL may be necessary and results of operations could be significantly and adversely affected as a result of economic, operating, regulatory, and other conditions beyond the Corporation’s control.

Non-performing loans are charged-off to their fair market values in the period the loans, or portion thereof, are deemed uncollectible, generally after the loan becomes 150 days delinquent for real estate secured first trust deed loans and 120 days delinquent for commercial business or real estate secured second trust deed loans. For loans that were modified from their original terms, were re-underwritten and identified as modified loans, the charge-off occurs when the loan becomes 90 days delinquent; and where borrowers file bankruptcy, the charge-off occurs when the loan becomes 60 days delinquent. The amount of the charge-off is determined by comparing the loan balance to the estimated fair value of the underlying collateral, less disposition costs, with the loan balance in excess of the estimated fair value charged-off against the ACL. For modified loans that are less than 90 days delinquent, the ACL is segregated into (a) individually evaluated allowances for those loans with applicable discounted cash flow calculations still in their modification period, classified lower than pass, and containing an embedded loss component or (b) collectively evaluated allowances based on the aggregated pooling method. For non-performing loans less than 60 days delinquent where the borrower has filed bankruptcy, the collectively evaluated allowances are assigned based on the aggregated pooling method. For non-performing commercial real estate loans, an individually evaluated allowance is derived based on the loan's discounted cash flow fair value (for modified loans) or collateral fair value less estimated selling costs and if the fair value is higher than the loan balance, no allowance is required.

17

Table of Contents

The following table is provided to disclose additional details for the periods indicated on the Corporation’s ACL on loans held for investment:

For the Quarter Ended 


September 30, 

(Dollars in Thousands)


2023


2022


Allowance at beginning of period

$

5,946

$

5,564

Impact of ASC 326 CECL adoption(1)

1,197

Provision for credit losses


536


70

Recoveries:


Mortgage loans:


Single-family


4

Total recoveries


4

Total charge-offs


Net recoveries (charge-offs)


4

Allowance at end of period

$

7,679

$

5,638

ACL as a percentage of gross loans held for investment


0.72

%  


0.57

%  

Net (recoveries) charge-offs as a percentage of average loans receivable, net, during the period (annualized)


(0.00)

%  


(0.00)

%  

ACL as a percentage of gross non-performing loans at the end of the period

545.38

%  

537.98

%  

(1)Represents the impact of adopting ASC 326 on July 1, 2023. Since that date, as a result of adopting ASC 326, the methodology to compute the ACL has been based on CECL methodology, rather than the previously applied incurred loss methodology.

The following tables denote the past due status of the Corporation's gross loans held for investment, net of fair value adjustments, at the dates indicated.

September 30, 2023

30-89 Days Past

Total Loans Held for

(In Thousands)


Current


Due


Non-Performing


Investment, Gross

Mortgage loans:

Single-family

$

520,095

$

73

$

1,408

$

521,576

Multi-family


457,351


457,351

Commercial real estate


87,954


87,954

Construction


2,100


2,100

Other


104


104

Commercial business loans


1,321


1,321

Consumer loans


61


1


62

Total loans held for investment, gross

$

1,068,986

$

74

$

1,408

$

1,070,468

18

Table of Contents

June 30, 2023


30-89 Days Past


Total Loans Held for

(In Thousands)

Current

Due

Non-Performing

Investment, Gross

Mortgage loans:

Single-family

$

517,399

$

$

1,422

$

518,821

Multi-family


461,113


461,113

Commercial real estate


90,558


90,558

Construction


1,936


1,936

Other

106


106

Commercial business loans


1,565


1,565

Consumer loans


64


1


65

Total loans held for investment, gross

$

1,072,741

$

1

$

1,422

$

1,074,164

The following tables summarize the Corporation’s ACL and recorded investment in gross loans, by portfolio type, at the dates and for the periods indicated.

Quarter Ended September 30, 2023


Commercial

Commercial

(In Thousands)


Single-family


Multi-family


Real Estate


Construction


Other


Business


Consumer


Total


ACL:


Allowance at beginning of period

$

1,720

$

3,270

$

868

$

15

$

2

$

67

$

4

$

5,946

Adjustment to allowance for adoption of ASC 326


4,605


(2,614)


(786)


47


3


(54)


(4)


1,197

Provision for (reversal of) credit losses

550

3

(6)

(8)

(1)

(2)

536

Recoveries


Charge-offs


ACL, end of period

$

6,875

$

659

$

76

$

54

$

4

$

11

$

$

7,679

ACL:

Individually evaluated for impairment

$

37

$

$

$

$

$

$

$

37

Collectively evaluated for impairment


6,838


659


76


54


4


11


7,642

ACL, end of period

$

6,875

$

659

$

76

$

54

$

4

$

11

$

$

7,679

Loans held for investment:

Individually evaluated for impairment

$

990

$

$

$

$

$

$

$

990

Collectively evaluated for impairment


520,586


457,351


87,954


2,100


104


1,321


62


1,069,478

Total loans held for investment, gross

$

521,576

$

457,351

$

87,954

$

2,100

$

104

$

1,321

$

62

$

1,070,468

ACL as a percentage of gross loans held for investment


1.32

%  


0.14

%  


0.09

%  


2.57

%  


3.85

%  


0.83

%  


%  


0.72

%

Net (recoveries) charge-offs to average loans receivable, net during the period

%  

%  

%  

%  

%  

%  

%  

%

19

Table of Contents

Quarter Ended September 30, 2022


Commercial

Commercial

(In Thousands)


Single-family


Multi-family


Real Estate


Construction


Other


Business


Consumer


Total


ACL:


Allowance at beginning of period

$

1,383

$

3,282

$

816

$

23

$

3

$

52

$

5

$

5,564

Provision for (reversal of) credit losses


63


23


(10)


(1)


(4)


(1)


70

Recoveries


4


4

Charge-offs


ACL, end of period

$

1,450

$

3,305

$

806

$

22

$

3

$

48

$

4

$

5,638

ACL:


Individually evaluated for impairment

$

38

$

$

$

$

$

$

$

38

Collectively evaluated for impairment


1,412


3,305


806


22


3


48


4


5,600

ACL, end of period

$

1,450

$

3,305

$

806

$

22

$

3

$

48

$

4

$

5,638

Loans held for investment:


Individually evaluated for impairment

$

819

$

$

$

$

$

$

$

819

Collectively evaluated for impairment


428,756


468,031


89,339


3,151


118


1,117


70


990,582

Total loans held for investment, gross

$

429,575

$

468,031

$

89,339

$

3,151

$

118

$

1,117

$

70

$

991,401

ACL as a percentage of gross loans held for investment


0.34

%  


0.71

%  


0.90

%  


0.70

%  


2.54

%  


4.30

%  


5.71

%  


0.57

%

Net (recoveries) charge-offs to average loans receivable, net during the period

(0.01)

%  

%  

%  

%  

%  

%  

%  

%

20

Table of Contents

The following tables identify the Corporation’s total recorded investment in non-performing loans by type at the dates and for the periods indicated. Generally, a loan is placed on non-performing status when it becomes 90 days past due as to principal or interest or if the loan is deemed impaired, after considering economic and business conditions and collection efforts, where the borrower’s financial condition is such that collection of the contractual principal or interest on the loan is doubtful. In addition, interest income is not recognized on any loan where management has determined that collection is not reasonably assured. A non-performing loan may be restored to accrual status when delinquent principal and interest payments are brought current, the borrower(s) has demonstrated sustained payment performance and future monthly principal and interest payments are expected to be collected on a timely basis. Loans with a related allowance have been (a) collectively evaluated allowance using a pooling method analysis or (b) individually evaluated for impairment using either a discounted cash flow analysis or, for collateral dependent loans, current appraisals less costs to sell, to establish realizable value. This analysis may identify a specific impairment amount needed or may conclude that no reserve is needed.

At September 30, 2023

Unpaid

Net

Principal

Related

Recorded

Recorded

(In Thousands)


Balance


Charge-offs


Investment


Allowance(1)


Investment

Mortgage loans:

Single-family:


With a related allowance

$

1,158

$

$

1,158

$

(47)

$

1,111

Without a related allowance(2)


275


(25)


250


250

Total single-family loans


1,433


(25)


1,408


(47)


1,361

Total non-performing loans

$

1,433

$

(25)

$

1,408

$

(47)

$

1,361

(1)Consists of an ACL, specifically assigned to the individual loan.
(2)There was no related ACL because the loans were charged-off to their fair value or the fair value of the collateral was higher than the loan balance.

At June 30, 2023

Unpaid

Related

Net

Principal

Charge-offs

Recorded

Recorded

(In Thousands)


Balance


Related


Investment


Allowance(1)


Investment

Mortgage loans:


Single-family:


With a related allowance

$

1,171

$

$

1,171

$

(122)

$

1,049

Without a related allowance(2)


276


(25)


251


251

Total single-family loans


1,447


(25)


1,422


(122)


1,300

Total non-performing loans

$

1,447

$

(25)

$

1,422

$

(122)

$

1,300

(1)Consists of an ACL, specifically assigned to the individual loan.
(2)There was no related ACL because the loans were charged-off to their fair value or the fair value of the collateral was higher than the loan balance.

At September 30, 2023, there were no commitments to lend additional funds to those borrowers whose loans were classified as non-performing.

For the quarters ended September 30, 2023 and 2022, the Corporation’s average recorded investment in non-performing loans was $1.4 million and $1.1 million, respectively. The Corporation records payments on non-performing loans utilizing the cash basis or cost recovery method of accounting during the periods when the loans are on non-performing status. For the quarter ended September 30, 2023, the Bank received $18,000 in interest payments from non-performing loans, of which all $18,000 was recognized as interest income and none was applied to reduce the loan balances under the cost recovery method. In comparison, for the quarter ended September 30, 2022, the Bank received $7,000 in interest payments from non-performing loans, of which $5,000 was recognized as interest income and the remaining $2,000 was applied to reduce the loan balances under the cost recovery method.

21

Table of Contents

The following tables present the average recorded investment in non-performing loans and the related interest income recognized for the quarters ended September 30, 2023 and 2022:

Quarter Ended September 30, 

2023

2022

Average

Interest

Average

Interest

Recorded

Income

Recorded

Income

(In Thousands)


Investment


Recognized


Investment


Recognized

Without related allowances:


Mortgage loans:

Single-family

$

250

$

$

127


$


250


127


With related allowances:


Mortgage loans:

Single-family


1,163


18


991


5


1,163


18


991


5

Total

$

1,413

$

18

$

1,118


$

5

During the quarters ended September 30, 2023 and 2022, no properties were acquired in the settlement of loans and no previously foreclosed upon properties were sold. A new appraisal is obtained on each of the properties at the time of foreclosure and fair value is derived by using the lower of the appraised value or the listing price of the property, net of selling costs. As of both September 30, 2023 and June 30, 2023, there was no real estate owned property. Any initial loss upon repossession is recorded as a charge to the ACL before being transferred to real estate owned. Subsequent to transfer to real estate owned, if there is further deterioration in real estate values, specific real estate owned loss reserves are established and charged to the condensed consolidated statements of operations.  In addition, the Corporation records costs to carry real estate owned as real estate owned operating expenses as incurred.

As outlined in the implementation of ASC 326, the Bank includes the off-balance sheet reserve for the unfunded loan commitments within the provision for credit losses.

The following table provides information regarding the unfunded commitment reserve for the quarters ended September 30, 2023 and 2022.

For the Quarter Ended

September 30, 

(In Thousands)


2023


2022


Balance, beginning of the period

$

42

$

130

Impact of ASC 326 CECL adoption


Provision for credit losses

9

7

Balance, end of the period

$

51

$

137

The method for calculating the unfunded commitment reserve is based on a historical funding rate applied to the undisbursed loan amount to estimate an average outstanding amount during the life of the loan commitment. The Corporation applies the same assumptions and methodologies by loan groupings to these unfunded loan commitments as it does for its funded loans held for investment to determine the reserve rate and the allowance. Assumptions are evaluated by management periodically as part of the CECL procedures. The unfunded commitment reserve is recorded in Accounts payable, accrued interest and other liabilities on the Condensed Consolidated Statements of Financial Condition.

22

Table of Contents

Note 6: Derivative and Other Financial Instruments with Off-Balance Sheet Risks

The Corporation is a party to financial instruments with off-balance sheet risk in the normal course of business to meet the financing needs of its customers. These financial instruments include commitments to extend credit in the form of originating loans or providing funds under existing lines of credit, loan sale commitments to third parties and option contracts. These instruments involve, to varying degrees, elements of credit and interest-rate risk in excess of the amount recognized in the accompanying Condensed Consolidated Statements of Financial Condition. The Corporation’s exposure to credit loss, in the event of non-performance by the counterparty to these financial instruments, is represented by the contractual amount of these instruments. The Corporation uses the same credit policies in entering into financial instruments with off-balance sheet risk as it does for on-balance sheet instruments. As of September 30, 2023 and June 30, 2023, the Corporation had commitments to extend credit on loans to be held for investment of $6.7 million and $2.4 million, respectively.

The following table provides information regarding unfunded loan commitments, which are comprised of undisbursed funds on construction loans, undisbursed funds to borrowers on existing lines of credit with the Corporation and commitments to originate loans to be held for investment at the dates indicated below.


Commitments

September 30, 2023

June 30, 2023

(In Thousands)


Undisbursed loan funds – Construction loans

$

1,231

$

2,032

Undisbursed lines of credit – Commercial business loans


516


607

Undisbursed lines of credit – Consumer loans


363


363

Commitments to extend credit on loans to be held for investment


6,706


2,394

Total

$

8,816

$

5,396

In accordance with ASC 815, “Derivatives and Hedging,” and interpretations of the Derivatives Implementation Group of the FASB, the fair value of the commitments to extend credit on loans to be held for sale, loan sale commitments, to be announced (“TBA”) MBS trades, put option contracts and call option contracts are recorded at fair value on the Condensed Consolidated Statements of Financial Condition. The Corporation does not apply hedge accounting to its derivative financial instruments; therefore, all changes in fair value are recorded in earnings. As of September 30, 2023 and June 30, 2023, there were no outstanding derivative financial instruments.

Loans previously sold to the FHLB – San Francisco under the Mortgage Partnership Finance (“MPF”) program have a recourse liability. The FHLB – San Francisco absorbs the first four basis points of loss by establishing a first loss account and a credit scoring process is used to calculate the maximum recourse amount for the Bank. All losses above the Bank’s maximum recourse amount are the responsibility of the FHLB – San Francisco. The FHLB – San Francisco pays the Bank a credit enhancement fee on a monthly basis to compensate the Bank for accepting the recourse obligation. As of September 30, 2023 and June 30, 2023, the Bank serviced $3.4 million and $3.5 million of loans under this program, respectively, and has established a recourse liability of $8,000 at both dates.

Occasionally, the Bank is required to repurchase loans sold to Freddie Mac, Fannie Mae or other investors if it is determined that such loans do not meet the credit requirements of the investor, or if one of the parties involved in the loan misrepresented pertinent facts, committed fraud, or if such loans were 90-days past due within 120 days of the loan funding date. During the quarters ended September 30, 2023 and 2022, the Bank did not repurchase any loans or settle any request to repurchase a loan. In addition to the specific recourse liability for the MPF program, the Bank established a recourse liability of $25,000 for loans sold to other investors at both September 30, 2023 and June 30, 2023.

23

Table of Contents

The following table shows the summary of the recourse liability for the quarters ended September 30, 2023 and 2022:

For the Quarter Ended 


September 30, 

Recourse Liability


2023


2022


(In Thousands)

Balance, beginning of the period

$

33

$

160

Provision for recourse liability


Net settlements in lieu of loan repurchases


Balance, end of the period

$

33

$

160

Note 7: Fair Value of Financial Instruments

The Corporation adopted ASC 820, “Fair Value Measurements and Disclosures,” and elected the fair value option pursuant to ASC 825, “Financial Instruments.” ASC 820 defines fair value, establishes a framework for measuring fair value, and expands disclosures about fair value measurements. ASC 825 permits entities to elect to measure many financial instruments and certain other assets and liabilities at fair value on an instrument-by-instrument basis (the “Fair Value Option”) at specified election dates. The Corporation elected the fair value option on loans held for investment which were previously originated for sale. At each subsequent reporting date, an entity is required to report unrealized gains and losses on items in earnings for which the fair value option has been elected. The objective of the Fair Value Option is to improve financial reporting by providing entities with the opportunity to mitigate volatility in reported earnings caused by measuring related assets and liabilities differently without having to apply complex hedge accounting provisions.

The following table describes the difference at the dates indicated between the aggregate fair value and the aggregate unpaid principal balance of loans held for investment at fair value:

Aggregate

Unpaid

Net

Aggregate

Principal

Unrealized

(In Thousands)


Fair Value


Balance


Loss

As of September 30, 2023:

Loans held for investment, at fair value

$

1,061

$

1,256

$

(195)

As of June 30, 2023:


Loans held for investment, at fair value

$

1,312

$

1,483

$

(171)

ASC 820 establishes a three-level valuation hierarchy that prioritizes inputs to valuation techniques used in fair value calculations. The three levels of inputs are defined as follows:

Level 1

-

Unadjusted quoted prices in active markets for identical assets or liabilities that the Corporation has the ability to access at the measurement date.

Level 2

-

Observable inputs other than Level 1 such as: quoted prices for similar assets or liabilities in active markets, quoted prices for identical or similar assets or liabilities in markets that are not active, or other inputs that are observable or can be corroborated to observable market data for substantially the full term of the asset or liability.

Level 3

-

Unobservable inputs for the asset or liability that use significant assumptions, including assumptions of risks. These unobservable assumptions reflect the Corporation’s estimate of assumptions that market participants would use in pricing the asset or liability. Valuation techniques include the use of pricing models, discounted cash flow models and similar techniques.

ASC 820 requires the Corporation to maximize the use of observable inputs and minimize the use of unobservable inputs. If a financial instrument uses inputs that fall in different levels of the hierarchy, the instrument will be categorized based upon the lowest level of input that is significant to the fair value calculation.

24

Table of Contents

The Corporation’s financial assets and liabilities measured at fair value on a recurring basis consist of investment securities available for sale, loans held for investment at fair value and interest-only strips; while non-performing loans and mortgage servicing assets (“MSA”) are measured at fair value on a nonrecurring basis.

Investment securities - available for sale are primarily comprised of U.S. government agency MBS, U.S. government sponsored enterprise MBS and private issue CMO. The Corporation utilizes quoted prices in active markets for similar securities for its fair value measurement of MBS (Level 2) and broker price indications for similar securities in non-active markets for its fair value measurement of the private issue CMO (Level 3).

Loans held for investment at fair value are primarily single-family loans which have been transferred from loans held for sale. The fair value is determined by management estimates of the specific credit risk attributes of each loan, in addition to the quoted secondary-market prices which account for the interest rate characteristics of each loan (Level 3).

Loans with individually evaluated allowance that are recorded at fair value on a non-recurring basis are loans which are inadequately protected by the current sound worth and paying capacity of the borrowers or of the collateral pledged. These loans are characterized by the distinct possibility that the Corporation will sustain some loss if the deficiencies are not corrected. The fair value of a loan with an individually evaluated allowance is determined based on discounted cash flow or current appraised value of the underlying collateral. Appraised and reported values may be discounted based on management’s historical knowledge, changes in market conditions from the time of valuation, and/or management’s expertise and knowledge of the collateral. For commercial real estate loans with individually evaluated for allowance, the fair value is derived from the appraised value of its collateral. Loans with individually evaluated allowance are reviewed and evaluated on at least a quarterly basis for additional allowance and adjusted accordingly, based on the same factors identified above. This loss is not recorded directly as an adjustment to current earnings or other comprehensive income (loss), but rather as a component in determining the overall adequacy of the ACL. These adjustments to the estimated fair value of non-performing loans may result in increases or decreases to the provision for credit losses recorded in current earnings.

The Corporation uses the amortization method for its MSA, which amortizes the MSA in proportion to and over the period of estimated net servicing income and assesses the MSA for impairment based on fair value at each reporting date. The fair value of the MSA is derived using the present value method; which includes a third party’s prepayment projections of similar instruments, weighted-average coupon rates, estimated servicing costs and discount interest rates (Level 3).

The fair value of interest-only strips is derived using the same assumptions that are used to value the related MSA (Level 3).

The Corporation’s valuation methodologies may produce a fair value calculation that may not be indicative of net realizable value or reflective of future fair values. While management believes the Corporation’s valuation methodologies are appropriate and consistent with other market participants, the use of different methodologies or assumptions to determine the fair value of certain financial instruments could result in a different estimate of fair value at the reporting date.

25

Table of Contents

The following fair value hierarchy tables present information at the dates indicated about the Corporation’s assets and liabilities measured at fair value on a recurring basis:

Fair Value Measurement at September 30, 2023 Using:

(In Thousands)


Level 1


Level 2


Level 3


Total

Assets:

Investment securities - available for sale:

U.S. government agency MBS

$

$

1,340

$

$

1,340

U.S. government sponsored enterprise MBS


652


652

Private issue CMO


98


98

Investment securities - available for sale


1,992


98


2,090

Loans held for investment, at fair value


1,061


1,061

Interest-only strips


9


9

Total assets

$

$

1,992

$

1,168

$

3,160

Liabilities:

$

$

$

$

Total liabilities

$

$

$

$

Fair Value Measurement at June 30, 2023 Using:

(In Thousands)


Level 1

Level 2


Level 3


Total

Assets:

Investment securities - available for sale:

U.S. government agency MBS

$

$

1,370

$

$

1,370

U.S. government sponsored enterprise MBS


683


683

Private issue CMO


102


102

Investment securities - available for sale


2,053


102


2,155

Loans held for investment, at fair value


1,312


1,312

Interest-only strips


9


9

Total assets

$

$

2,053

$

1,423

$

3,476

Liabilities:

$

$

$

$

Total liabilities

$

$

$

$

26

Table of Contents

The following tables summarize reconciliations of the beginning and ending balances during the periods shown of recurring fair value measurements recognized in the Condensed Consolidated Statements of Financial Condition using Level 3 inputs:

For the Quarter Ended September 30, 2023

Fair Value Measurement

Using Significant Other Unobservable Inputs

(Level 3)

Private

Loans Held For

Interest-

Issue

Investment, at

Only

(In Thousands)


CMO


fair value(1)


Strips


Total

Beginning balance at June 30, 2023

$

102

$

1,312

$

9

$

1,423

Adjustment due to ASC 326 CECL adoption

28

28

Total gains or losses (realized/unrealized):

Included in earnings


(52)


(52)

Included in other comprehensive loss


(1)


(1)

Purchases


Issuances


Settlements


(3)


(227)


(230)

Transfers in and/or out of Level 3


Ending balance at September 30, 2023

$

98

$

1,061

$

9

$

1,168

(1)The valuation of loans held for investment at fair value includes management estimates of the specific credit risk attributes of each loan, in addition to the quoted secondary-market prices which account for the interest rate characteristics of each loan.

For the Quarter Ended September 30, 2022

Fair Value Measurement

Using Significant Other Unobservable Inputs

(Level 3)

Private

Loans Held For

Interest-

Issue

Investment, at

Only

(In Thousands)


CMO


fair value(1)


Strips


Total

Beginning balance at June 30, 2022

$

113

$

1,396

$

7

$

1,516

Total gains or losses (realized/unrealized):

Included in earnings


(26)


(26)

Included in other comprehensive loss


(1)


(1)

Purchases


Issuances


Settlements


(5)


(20)


(25)

Transfers in and/or out of Level 3


Ending balance at September 30, 2022

$

107

$

1,350

$

7

$

1,464

(1)The valuation of loans held for investment at fair value includes management estimates of the specific credit risk attributes of each loan, in addition to the quoted secondary-market prices which account for the interest rate characteristics of each loan.

27

Table of Contents

The following fair value hierarchy tables present information about the Corporation’s assets measured at fair value at the dates indicated on a nonrecurring basis:

Fair Value Measurement at September 30, 2023 Using:

(In Thousands)


Level 1


Level 2


Level 3


Total

Loans with individually evaluated allowance

$

$

$

703

$

703

Mortgage servicing assets


67


67

Total

$

$

$

770

$

770

Fair Value Measurement at June 30, 2023 Using:

(In Thousands)

Level 1

Level 2

Level 3

Total

Loans with individually evaluated allowance


$

$

251

$

1,049

$

1,300

Mortgage servicing assets


90


90

Total

$

$

251

$

1,139

$

1,390

The following table presents additional information about valuation techniques and inputs used for assets and liabilities, which are measured at fair value and categorized within Level 3 as of September 30, 2023:

Impact to

Fair Value

Valuation

As of

from an

September 30, 

Valuation

Range(1)

Increase in

(Dollars In Thousands)


2023


Techniques


Unobservable Inputs


(Weighted Average)


Inputs(2)

Assets:

Securities available-for sale: Private issue CMO

$

98


Market comparable pricing


Comparability adjustment


(1.7%) - (6.6%) (2.7%)


Increase

Loans held for investment, at fair value

$

1,061


Relative value analysis


Broker quotes


84.4% - 87.6% (85.6%)


Increase

ACL factors


0.0% - 1.2% (1.1%)

Decrease

Loans with individually evaluated allowance

$

703


Discounted cash flow


Default rates


5.0%

Decrease

Mortgage servicing assets

$

67


Discounted cash flow


Prepayment speed (CPR)


4.7% - 60.0% (8.1%)


Decrease


Discount rate


9.0% - 10.5% (9.1%)


Decrease

Interest-only strips

$

9


Discounted cash flow


Prepayment speed (CPR)


6.4% - 8.9% (8.0%)

Decrease


Discount rate


9.0%


Decrease

Liabilities:


None

(1)The range is based on the historical estimated fair values and management estimates.
(2)Unless otherwise noted, this column represents the directional change in the fair value of the Level 3 asset instruments that would result from an increase to the corresponding unobservable input. A decrease to the unobservable input would have the opposite effect. Significant changes in these inputs in isolation could result in significantly higher or lower fair value measurements.

The significant unobservable inputs used in the fair value measurement of the Corporation’s assets and liabilities include the following: prepayment speeds, discount rates and broker quotes, among others. Significant increases or decreases in any of these inputs in isolation could result in significantly lower or higher fair value measurement. The various unobservable inputs used to determine valuations may have similar or diverging impacts on valuation.

28

Table of Contents

The carrying amount and fair value of the Corporation’s other financial instruments as of September 30, 2023 and June 30, 2023 was as follows:

September 30, 2023

Carrying

Fair

(In Thousands)


Amount


Value


Level 1


Level 2


Level 3

Financial assets:

Loans held for investment, not recorded at fair value

$

1,071,109

$

966,437

$

$

$

966,437

Investment securities - held to maturity

$

147,574

$

126,851

$

$

126,851

$

FHLB – San Francisco stock

$

9,505

$

9,505

$

$

9,505

$

Financial liabilities:


Deposits

$

931,131

$

928,497

$

$

928,497

$

Borrowings

$

235,009

$

232,686

$

$

232,686

$

June 30, 2023

Carrying

Fair

(In Thousands)


Amount


Value


Level 1


Level 2


Level 3

Financial assets:

Loans held for investment, not recorded at fair value

$

1,076,317

$

970,277

$

$

$

970,277

Investment securities - held to maturity

$

154,337

$

135,541

$

$

135,541

$

FHLB – San Francisco stock

$

9,505

$

9,505

$

$

9,505

$

Financial liabilities:


Deposits

$

950,571

$

949,116

$

$

949,116

$

Borrowings

$

235,009

$

232,764

$

$

232,764

$

Loans held for investment, not recorded at fair value: For loans that reprice frequently at market rates, the carrying amount approximates the fair value. For fixed-rate loans, the fair value is determined by either (i) discounting the estimated future cash flows of such loans over their estimated remaining contractual maturities using a current interest rate at which similar loans would be made to borrowers, or (ii) quoted market prices.

Investment securities - held to maturity: The investment securities - held to maturity consist of U.S. SBA securities, U.S. government sponsored enterprise MBS and U.S. government sponsored enterprise CMO. For the U.S. SBA securities and U.S. government sponsored enterprise MBS and CMO, the Corporation utilizes quoted prices in active markets for similar securities for its fair value measurement (Level 2).

FHLB – San Francisco stock: The carrying amount reported for FHLB – San Francisco stock approximates fair value. When redeemed, the Corporation will receive an amount equal to the par value of the stock.

Deposits: The fair value of time deposits is estimated using a discounted cash flow calculation. The discount rate is based upon observable inputs, including rates currently offered for deposits of similar remaining maturities. The fair value of transaction accounts (checking, money market and savings accounts) is equal to the carrying amounts payable on demand or estimated using a discounted cash flow calculation and management estimates of current market conditions.

Borrowings: The fair value of borrowings has been estimated using a discounted cash flow calculation. The discount rate on such borrowings is based upon rates currently offered for borrowings of similar remaining maturities.

The Corporation has various processes and controls in place to ensure that fair value is reasonably estimated. The Corporation generally determines fair value of their Level 3 assets and liabilities by using internally developed models which primarily utilize discounted cash flow techniques and prices obtained from independent management services or brokers. The Corporation performs due diligence procedures over third-party pricing service providers in order to support their use in the valuation process.

29

Table of Contents

While the Corporation believes its valuation methods are appropriate and consistent with other market participants, the use of different methodologies or assumptions to determine the fair value of certain financial instruments could result in a different estimate of fair value at the reporting date. For the first three months of fiscal 2024, there were no significant changes to the Corporation’s valuation techniques that had, or are expected to have, a material impact on its condensed consolidated financial position or results of operations.

Note 8: Revenue From Contracts With Customers

In accordance with ASC 606, revenues are recognized when goods or services are transferred to the customer in exchange for the consideration the Corporation expects to be entitled to receive. The largest portion of the Corporation's revenue is from interest income, which is not in the scope of ASC 606. All of the Corporation's revenue from contracts with customers in the scope of ASC 606 is recognized in non-interest income.

If a contract is determined to be within the scope of ASC 606, the Corporation recognizes revenue as it satisfies a performance obligation. Payments from customers are generally collected at the time services are rendered, monthly, quarterly or annually. For contracts with customers within the scope of ASC 606, revenue is either earned at a point in time or revenue is earned over time. Examples of revenue earned at a point in time are automated teller machine ("ATM") transaction fees, wire transfer fees, overdraft fees and interchange fees. Revenue is primarily based on the number and type of transactions that are generally derived from transactional information accumulated by our systems and is recognized immediately as the transactions occur or upon providing the service to complete the customer's transaction. The Corporation is generally the principal in these contracts, with the exception of interchange fees, in which case the Corporation is acting as the agent and records revenue net of expenses paid to the principal. Examples of revenue earned over time, which generally occur on a monthly basis, are deposit account maintenance fees, investment advisory fees, merchant revenue, trust and investment management fees and safe deposit box fees. Revenue is generally derived from transactional information accumulated by our systems or those of third-parties and is recognized as the related transactions occur or services are rendered to the customer.

Disaggregation of Revenue:

The following table includes the Corporation's non-interest income disaggregated by type of services for the quarters ended September 30, 2023 and 2022:

Quarter Ended

September 30, 

Type of Services


2023


2022

(In Thousands)


Loan servicing and other fees(1)

$

(21)

$

108

Deposit account fees

288

343

Card and processing fees

353

381

Other(2)


131


171

Total non-interest income

$

751

$

1,003

(1)Not within the scope of ASC 606.
(2)Includes net BOLI income of $46 thousand for both quarters ended September 30, 2023 and 2022, which are not within the scope of ASC 606.

For both the quarters ended September 30, 2023 and 2022, substantially all of the Corporation's revenues within the scope of ASC 606 are for performance obligations satisfied at a specified date.

Revenues recognized within the scope of ASC 606:

Deposit account fees: Fees are earned on the Bank's deposit accounts for various products offered to or services performed for the Bank's customers. Fees include business account fees, non-sufficient fund fees, ATM fees and other fees. These

30

Table of Contents

fees are recognized concurrent with the event on a daily, monthly, quarterly or annual basis, depending on the type of service.

Card and processing fees: Debit interchange income represents fees earned when a debit card issued by the Bank is used. The Bank earns interchange fees from cardholder transactions through a third-party payment network. Interchange fees from cardholder transactions represent a percentage of the underlying transaction value and are recognized daily, concurrently with the transaction processing services provided to the cardholder. The performance obligation is satisfied and the fees are earned when the cost of the transaction is charged to the cardholders’ debit card. Certain expenses directly associated with the debit cards are recorded on a net basis with the interchange income.

Other fees: Includes asset management fees, certain loan related fees, stop payment fees, wire services fees, safe deposit box fees and other fees earned on other services, such as merchant services or occasional non-recurring type services, and are recognized at the time of the event or the applicable billing cycle. Asset management fees are variable, since they are based on the underlying portfolio value, which is subject to market conditions and amounts invested by customers through a third-party provider. Asset management fees are recognized over the period that services are provided, and when the portfolio values are known or can be estimated at the end of each month. Loan related fees include (loss) gain on sale of loans, prepayment fees, late charges, brokered loan fees, maintenance fees and others. These fees are recognized  concurrent with the event on a daily, monthly, quarterly or annual basis, depending on the type of service.

Note 9: Leases

The Corporation accounts for its leases in accordance with ASC 842 which requires the Corporation to record liabilities for future lease obligations as well as assets representing the right to use the underlying leased assets. The Corporation's leases primarily represent future obligations to make payments for the use of buildings, space or equipment for its operations. Liabilities to make future lease payments are recorded in accounts payable, accrued interest and other liabilities, while right-of-use assets are recorded in premises and equipment in the Corporation's condensed consolidated statements of financial condition. At September 30, 2023, all of the Corporation's leases were classified as operating leases and the Corporation did not have any operating leases with an initial term of 12 months or less ("short-term leases"). Liabilities to make future lease payments and right-of-use assets are recorded for operating leases and do not include short-term leases. These liabilities and right-of-use assets are determined based on the total contractual base rents for each lease, which include options to extend or renew each lease, where applicable, and where the Corporation believes it has an economic incentive to extend or renew the lease. Due to the fact that lease extensions are not reasonably certain, the Corporation generally does not recognize payments occurring during option periods in the calculation of its operating right-of-use lease assets and operating lease liabilities. The Corporation utilizes the FHLB – San Francisco rates as a discount rate for each of the remaining contractual terms at the adoption date as well as for future leases if the discount rate is not stated in the lease. For leases that contain variable lease payments, the Corporation assumes future lease payment escalations based on a lease payment escalation rate specified in the lease or the specified index rate observed at the time of lease commencement. Liabilities to make future lease payments are accounted for using the interest method, being reduced by periodic contractual lease payments net of periodic interest accretion. Right-of-use assets for operating leases are amortized over the term of the associated lease by amounts that represent the difference between periodic straight-line lease expense and periodic interest accretion in the related liability to make future lease payments.

For the quarters ended September 30, 2023 and 2022, expenses associated with the Corporation’s leases totaled $247,000 and $215,000, respectively, and were recorded in premises and occupancy expenses and equipment expenses in the condensed consolidated statements of operations.

31

Table of Contents

The following tables present supplemental information related to operating leases at the date and for the periods indicated:


As of

(In Thousands)

September 30, 2023

June 30, 2023

Condensed Consolidated Statements of Condition:


Premises and equipment - Operating lease right of use assets

$

1,934


$

2,147

Accounts payable, accrued interest and other liabilities – Operating lease liabilities

$

1,968


$

2,169

Quarter Ended


September 30, 


(In Thousands)

2023

2022

Condensed Consolidated Statements of Operations:


Premises and occupancy expenses from operating leases(1)

$

213


$

193

Equipment expenses from operating leases

34


22

Total lease expense

$

247

$

215

(1)Includes immaterial variable lease costs.


Quarter Ended

Quarter Ended

(In Thousands)

September 30, 2023

September 30, 2022

Condensed Consolidated Statements of Cash Flows:


Operating cash flows from operating leases, net

$

231


$

219

The following table provides information related to remaining minimum contractual lease payments and other information associated with the Corporation’s leases as of September 30, 2023:


Amount(1)


Year Ending June 30, 


(In Thousands)

2024

$

649

2025


674

2026


383

2027


188

2028


151

Thereafter


33

Total contract lease payments

$

2,078

Total liability to make lease payments

$

1,968

Difference in undiscounted and discounted future lease payments

$

110

Weighted average discount rate


3.16

%

Weighted average remaining lease term (years)


3.2

(1)Contractual base rents do not include property taxes and other operating expenses due under respective lease agreements.

Note 10: Stock Repurchases

On April 28, 2022, the Board of Directors of the Corporation announced a stock repurchase plan which authorized 364,259 shares for repurchase over a one year period. On April 27, 2023, the Board of Directors of the Corporation announced an extension of its existing stock repurchase plan through April 28, 2024 or until completed, whichever occurs first. The timing, volume and price of purchases are made at our discretion, and are contingent upon our overall financial condition, as well as general market and other conditions. The stock repurchase program does not obligate the Corporation to acquire any specific number of shares in any period, and may be expanded, extended, modified or discontinued at any time.

32

Table of Contents

During the quarter ended September 30, 2023, the Corporation purchased 36,112 shares of its common stock under the April 2022 stock repurchase plan with a weighted average cost of $13.70 per share. As of September 28, 2023, the Corporation purchased a total of 338,831 shares, or 93 percent of the total authorized stock repurchase, with a weighted average cost of $13.98 per share pursuant to its April 2022 stock repurchase plan. On September 28, 2023, the Board of Directors approved the new stock repurchase plan that authorizes 350,353 shares to be purchased over a one-year period and cancelled the 25,428 shares remaining available for purchase under the April 2022 plan. As of September 30, 2023, all of the shares authorized for repurchase under the September 2023 plan remain available to purchase until the plan expires on September 28, 2024.

Note 11: Subsequent Events

On October 26, 2023, the Corporation announced that the Board of Directors declared a quarterly cash dividend of $0.14 per share. Shareholders of the Corporation’s common stock at the close of business on November 16, 2023 are entitled to receive the cash dividend. The cash dividend will be payable on December 7, 2023.

ITEM 2 – Management’s Discussion and Analysis of Financial Condition and Results of Operations

General

Provident Financial Holdings, Inc., a Delaware corporation, was organized in January 1996 for the purpose of becoming the holding company of Provident Savings Bank, F.S.B. (the “Bank") upon the Bank’s conversion from a federal mutual to a federal stock savings bank (“Conversion”). The Conversion was completed on June 27, 1996. The Corporation is regulated by the Federal Reserve Board (“FRB”). At September 30, 2023, the Corporation had total assets of $1.31 billion, total deposits of $931.1 million and total stockholders’ equity of $129.2 million. The Corporation has not engaged in any significant activity other than holding the stock of the Bank. Accordingly, the information set forth in this report, including financial statements and related data, relates primarily to the Bank and its subsidiaries. As used in this report, the terms “we,” “our,” “us,” and “Corporation” refer to Provident Financial Holdings, Inc. and its consolidated subsidiaries, unless the context indicates otherwise.

The Bank, founded in 1956, is a federally chartered stock savings bank headquartered in Riverside, California. The Bank is regulated by the Office of the Comptroller of the Currency (“OCC”), its primary federal regulator, and the Federal Deposit Insurance Corporation (“FDIC”), the insurer of its deposits. The Bank’s deposits are federally insured up to applicable limits by the FDIC. The Bank has been a member of the FHLB System since 1956.

The Corporation operates in a single business segment through the Bank. The Bank’s activities include attracting deposits, offering banking services and originating and purchasing single-family, multi-family, commercial real estate, construction and, to a lesser extent, other mortgage, commercial business and consumer loans. Deposits are collected primarily from 13 banking locations located in Riverside and San Bernardino counties in California. Loans are primarily originated and purchased in California. There are various risks inherent in the Corporation’s business including, among others, the general business environment, interest rates, the California real estate market, the demand for loans, the prepayment of loans, the repurchase of loans previously sold to investors, the secondary market conditions to buy and sell loans, competitive conditions, legislative and regulatory changes, fraud and other risks.

The Corporation began paying quarterly cash dividends during the quarter ended September 30, 2002. On July 27, 2023, the Corporation’s Board of Directors declared a quarterly cash dividend of $0.14 per share for the Corporation’s shareholders of record at the close of business on August 17, 2023, which was paid on September 7, 2023. Future declarations or payments of dividends will be subject to the consideration of the Corporation’s Board of Directors, which will take into account the Corporation’s financial condition, results of operations, tax considerations, capital requirements, industry standards, legal restrictions, economic conditions and other factors, including the regulatory restrictions which affect the payment of dividends by the Bank to the Corporation. Under Delaware law, dividends may be paid either out of surplus or, if there is no surplus, out of net profits for the current fiscal year and/or the preceding fiscal year in which the dividend is declared.

33

Table of Contents

Management’s Discussion and Analysis of Financial Condition and Results of Operations is intended to assist in understanding the financial condition and results of operations of the Corporation. The information contained in this section should be read in conjunction with the Unaudited Interim Condensed Consolidated Financial Statements and accompanying selected Notes to Unaudited Interim Condensed Consolidated Financial Statements.

Safe-Harbor Statement

This Form 10-Q contains statements that the Corporation believes are “forward-looking statements” within the meaning of the Private Securities Litigation Reform Act of 1995. These statements relate to the Corporation’s financial condition, liquidity, results of operations, plans, objectives, future performance or business. When considering these forward-looking statements, you should keep in mind these risks and uncertainties, as well as any cautionary statements the Corporation may make. Moreover, you should treat these statements as speaking only as of the date they are made and based only on information then actually known to the Corporation. There are a number of important factors that could cause future results to differ materially from historical performance and these forward-looking statements. Factors which could cause actual results to differ materially include, but are not limited to the following: potential adverse impacts to economic conditions in our local market areas, other markets where the Corporation has lending relationships, or other aspects of the Corporation's business operations or financial markets, including, without limitation, as a result of employment levels, labor shortages and the effects of inflation, a potential recession or slowed economic growth; changes in the interest rate environment, including the recent increases in the Board of Governors of the Federal Reserve Board (the “Federal Reserve”) benchmark rate and duration at which such increased interest rate levels are maintained, which could adversely affect our revenues and expenses, the value of assets and obligations, and the availability and cost of capital and liquidity; the impact of continuing inflation and the current and future monetary policies of the Federal Reserve in response thereto; the effects of any federal government shutdown; the impact of bank failures or adverse developments at other banks and related negative press about the banking industry in general on investor and depositor sentiment; the credit risks of lending activities, including changes in the level and trend of loan delinquencies and charge-offs and changes in our allowance for credit losses (“ACL”) that may be impacted by deterioration in the residential and commercial real estate markets and may lead to increased losses and non-performing assets and may result in our ACL not being adequate to cover actual losses and require us to materially increase our reserve; changes in the levels of general interest rates, and the relative differences between short and long term interest rates, deposit interest rates, our net interest margin and funding sources; fluctuations in the demand for loans, the number of unsold homes, land and other properties and fluctuations in real estate values in our market areas; results of examinations of the Corporation by the FRB or of the Bank by the OCC or other regulatory authorities, including the possibility that any such regulatory authority may, among other things, require us to enter into a formal enforcement action or to increase our ACL, write-down assets, change our regulatory capital position or affect our ability to borrow funds or maintain or increase deposits, or impose additional requirements and restrictions on us, any of which could adversely affect our liquidity and earnings; legislative or regulatory changes that adversely affect our business including changes in banking, securities and tax law, and in regulatory policies and principles, or the interpretation of regulatory capital or other rules, and other governmental initiatives affecting the financial services industry; the availability of resources to address changes in laws, rules, or regulations or to respond to regulatory actions; adverse changes in the securities markets; our ability to attract and retain deposits; our ability to control operating costs and expenses; the use of estimates in determining fair value of certain of our assets, which estimates may prove to be incorrect and result in significant declines in valuation; difficulties in reducing risk associated with the loans on our balance sheet; staffing fluctuations in response to product demand or the implementation of corporate strategies that affect our workforce and potential associated charges; disruptions, security breaches, or other adverse events, failures or interruptions in, or attacks on, our information technology systems or on the third-party vendors who perform several of our critical processing functions; our ability to successfully integrate any assets, liabilities, customers, systems, and management personnel we have acquired or may in the future acquire into our operations and our ability to realize related revenue synergies and cost savings within expected time frames and any goodwill charges related thereto; our ability to manage loan delinquency rates; our ability to retain key members of our senior management team; costs and effects of litigation, including settlements and judgments; increased competitive pressures among financial services companies and non-financial services companies; changes in consumer spending, borrowing and savings habits; the availability of resources to address changes in laws, rules, or regulations or to respond to regulatory actions; our ability to pay dividends on our common stock; the quality and composition of our securities portfolio and the impact of any adverse changes in the securities markets; the inability of key third-party providers to perform their obligations to us; changes in accounting policies and practices, as may be adopted by the financial institution regulatory agencies or the Financial Accounting Standards Board,

34

Table of Contents

including additional guidance and interpretation on accounting issues and details of the implementation of new accounting methods; the effects of climate change, severe weather events, natural disasters, pandemics, epidemics and other public health crises, acts of war or terrorism, and other external events on our business; other economic, competitive, governmental, regulatory and technological factors affecting our operations, pricing, products and services; and other risks detailed in this report and in the Corporation’s other reports filed with or furnished to the SEC, including our Annual Report on Form 10-K for the fiscal year ended June 30, 2023 (“2023 Annual Form 10-K”).

Forward-looking statements are based upon management’s beliefs and assumptions at the time they are made. We undertake no obligation to publicly update or revise any forward-looking statements included in this document or to update the reasons why actual results could differ from those contained in such statements, whether as a result of new information, future events or otherwise. In light of these risks, uncertainties and assumptions, the forward-looking statements discussed in this document might not occur, and you should not put undue reliance on any forward-looking statements. These factors could cause our actual results for the remaining fiscal 2024 and beyond to differ materially from those expressed in any forward-looking statements by, or on behalf of, us and could negatively affect the Corporation’s consolidated financial condition and consolidated results of operations as well as its stock price performance.

Critical Accounting Estimates

The discussion and analysis of the Corporation’s financial condition and results of operations is based upon the Corporation’s condensed consolidated financial statements, which have been prepared in accordance with accounting principles generally accepted in the United States of America. The preparation of these financial statements requires management to make estimates and judgments that affect the reported amounts of assets and liabilities, revenues and expenses, and related disclosures of contingent assets and liabilities at the date of the condensed consolidated financial statements. Actual results may differ from these estimates under different assumptions or conditions.

The Corporation’s critical accounting estimates are described in the Critical Accounting Estimates section of Management’s Discussion and Analysis of Financial Condition and Results of Operations and in Note 1 - Organization and Summary of Significant Accounting Policies of the Notes to Consolidated Financial Statement of our 2023 Annual Form 10-K. The Corporation adopted the current expected credit loss, or CECL, methodology on July 1, 2023, which required management to make critical accounting estimates to its ACL. Accounting for the ACL involve significant judgement and assumptions by management and is based on historical data, current economic conditions and a reasonable and supportable forecast of future events. On a quarterly basis, management reviews the methodology and adequacy of the ACL.  Refer to Note 2 and Note 5 of the Notes to Unaudited Interim Condensed Consolidated Financial Statements, and the “Provision for Credit Losses” section in this Form 10-Q for more information on the establishment of the ACL and the implementation of CECL.

Executive Summary and Operating Strategy

Provident Savings Bank, F.S.B., established in 1956, is a financial services company committed to serving consumers and small to mid-sized businesses in the Inland Empire region of Southern California. The Bank conducts its business operations as Provident Bank and through its subsidiary, Provident Financial Corp. The business activities of the Corporation, primarily through the Bank, consist of community banking and, to a lesser degree, investment services for customers and trustee services on behalf of the Bank.

Community banking operations primarily consist of accepting deposits from customers within the communities surrounding the Corporation’s full service offices and investing those funds in single-family, multi-family and commercial real estate loans. Also, to a lesser extent, the Corporation makes construction, commercial business, consumer and other mortgage loans. The primary source of income in community banking is net interest income, which is the difference between the interest income earned on loans and investment securities, and the interest expense paid on interest-bearing deposits and borrowed funds. Additionally, certain fees are collected from depositors, such as returned check fees, deposit account service charges, ATM fees, IRA/KEOGH fees, safe deposit box fees, wire transfer fees and overdraft protection fees, among others.

35

Table of Contents

During the next three years, subject to market conditions, the Corporation intends to improve its community banking business by moderately increasing total assets (by increasing single-family, multi-family, commercial real estate, construction and commercial business loans). Overtime, the Corporation intends to decrease the percentage of time deposits in its deposit base and to increase the percentage of lower cost checking and savings accounts, although deposit accounts diversification will also remain a focus. This strategy is intended to improve core revenue through a higher net interest margin and ultimately, coupled with the growth of the Corporation, an increase in net interest income. While the Corporation’s long-term strategy is for moderate growth, management recognizes that growth may be challenging given the current general economic conditions, high interest rates and risk of recession.

Investment services operations primarily consist of selling alternative investment products such as annuities and mutual funds to the Bank’s depositors. Provident Financial Corp performs trustee services for the Bank’s real estate secured loan transactions and has in the past held, and may in the future hold, real estate for investment. Investment services and trustee services contribute a very small percentage of gross revenue.

There are a number of risks associated with the business activities of the Corporation, many of which are beyond the Corporation’s control as described in the Corporation’s 2023 Annual Form 10-K. The Corporation attempts to mitigate many of these risks through prudent banking practices, such as interest rate risk management, credit risk management, operational risk management, and liquidity risk management. The California economic environment presents heightened risk for the Corporation primarily with respect to real estate values and loan delinquencies. Since the majority of the Corporation’s loans are secured by real estate located within California, significant declines in the value of California real estate may also inhibit the Corporation’s ability to recover on defaulted loans by selling the underlying real estate.

Commitments and Derivative Financial Instruments

The Corporation is a party to financial instruments with off-balance sheet risk in the normal course of business to meet the financing needs of its customers. These financial instruments include commitments to extend credit, in the form of originating loans or providing funds under existing lines of credit, loan sale agreements to third parties and option contracts. These instruments involve, to varying degrees, elements of credit and interest-rate risk in excess of the amount recognized in the accompanying Condensed Consolidated Statements of Financial Condition. The Corporation’s exposure to credit loss, in the event of non-performance by the counterparty to these financial instruments, is represented by the contractual amount of these instruments. The Corporation uses the same credit policies in entering into financial instruments with off-balance sheet risk as it does for on-balance sheet instruments. For a discussion on commitments and derivative financial instruments, see Note 6 of the Notes to Unaudited Interim Condensed Consolidated Financial Statements of this Form 10-Q.

Comparison of Financial Condition at September 30, 2023 and June 30, 2023

Total assets decreased two percent to $1.31 billion at September 30, 2023 from $1.33 billion at June 30, 2023. The decrease was attributable to decreases in cash and cash equivalents, investment securities and loans held for investment.

Total cash and cash equivalents, primarily excess cash deposited with the FRB of San Francisco, decreased $7.8 million, or 12 percent, to $58.0 million at September 30, 2023 from $65.8 million at June 30, 2023. The decrease in total cash and cash equivalents was primarily attributable to deposit outflows and management’s fluid strategy to manage liquidity due to recent industry instability as a result of several high-profile bank failures.

Investment securities (held to maturity and available for sale) decreased $6.8 million, or four percent, to $149.7 million at September 30, 2023 from $156.5 million at June 30, 2023. The decrease was primarily the result of scheduled and accelerated principal payments on mortgage-backed and other securities during the first three months of fiscal 2024. For further analysis on investment securities, see Note 4 of the Notes to Unaudited Interim Condensed Consolidated Financial Statements of this Form 10-Q.

Loans held for investment decreased $5.5 million, or one percent, to $1.07 billion at September 30, 2023 from $1.08 billion at June 30, 2023, primarily due to decreases in multi-family and commercial real estate loans, partly offset by an increase

36

Table of Contents

in single-family loans. During the first three months of fiscal 2024, the Corporation originated $18.5 million of loans held for investment, consisting primarily of single-family, multi-family and commercial real estate loans located throughout California. The Corporation did not purchase any loans from other institutions during the first three months of fiscal 2024. Total loan principal payments during the first three months of fiscal 2024 were $23.0 million, down 27 percent from $31.7 million during the comparable period in fiscal 2023. Single-family loans held for investment at September 30, 2023 and June 30, 2023 totaled $521.6 million and $518.8 million and represented approximately 49 percent and 48 percent of loans held for investment, respectively. Multi-family loans held for investment at September 30, 2023 and June 30, 2023 totaled $457.4 million and $461.1 million, respectively, and represented approximately 43 percent of loans held for investment at both dates.

The tables below describe the geographic dispersion of gross real estate secured loans held for investment at September 30, 2023 and June 30, 2023, as a percentage of the total dollar amount of loans outstanding:

As of September 30, 2023:


Inland 


Southern 


Other 


Other 


Empire

California(1)

California

States

Total

Loan Category


Balance

Percent

Balance

Percent

Balance

Percent

Balance

Percent

Balance

Percent

Single-family

$

149,608


29

%  

$

178,026


34

%  

$

193,684


37

%  

$

258


%  

$

521,576


100

%

Multi-family


61,273


13

%  


268,565


59

%  


127,513


28

%  


%  


457,351


100

%

Commercial real estate


15,383


18

%  


48,584


55

%  


23,987


27

%  


%  


87,954


100

%

Construction


160


8

%  


1,502


71

%  


438


21

%  


%  


2,100


100

%

Other


%  


104


100

%  


%  


%  


104


100

%

Total

$

226,424


21

%  

$

496,781


47

%  

$

345,622


32

%  

$

258


%  

$

1,069,085


100

%

(1)Other than the Inland Empire.

As of June 30, 2023:

Inland 


Southern 


Other 


Other 


Empire

California(1)

California

States

Total

Loan Category


Balance

Percent

Balance

Percent

Balance

Percent

Balance

Percent

Balance

Percent

Single-family

$

149,569


29

%  

$

174,421


34

%  

$

194,570


37

%  

$

261


%  

$

518,821


100

%

Multi-family


61,672


13

%  


272,178


59

%  


127,263


28

%  


%  


461,113


100

%

Commercial real estate


16,586


18

%  


49,183


54

%  


24,789


28

%  


%  


90,558


100

%

Construction


590


30

%  


1,116


58

%  


230


12

%  


%  


1,936


100

%

Other


%  


106


100

%  


%  


%  


106


100

%

Total

$

228,417


23

%  

$

497,004


46

%  

$

346,852


31

%  

$

261


%  

$

1,072,534


100

%

(1)Other than the Inland Empire.

For further analysis on loans held for investment, see Note 5 of the Notes to Unaudited Interim Condensed Consolidated Financial Statements of this Form 10-Q.

Total deposits decreased $19.5 million, or two percent, to $931.1 million at September 30, 2023 from $950.6 million at June 30, 2023, primarily due to a decrease in transaction accounts, partly offset by an increase in time deposits. Total uninsured deposits were approximately $146.1 million and $140.1 million at September 30, 2023 and June 30, 2023, respectively. The amounts of uninsured deposits are based on estimated amounts of uninsured deposits as of the reported period. Such estimates are based on the same methodologies and assumptions used for regulatory reporting requirements

Transaction account balances or “core deposits” decreased $27.1 million, or four percent, to $702.5 million at September 30, 2023 from $729.6 million at June 30, 2023 while time deposits increased $7.7 million, or three percent, to $228.6 million at September 30, 2023 from $220.9 million at June 30, 2023. The increase in time deposits was primarily due to an increase in retail time deposits. Excluding brokered certificates of deposit, the percentage of time deposits to total deposits increased to 15 percent at September 30, 2023 from 14 percent at June 30, 2023. At September 30, 2023 and June 30, 2023, total brokered certificates of deposit were $105.6 million and $106.4 million, respectively.

37

Table of Contents

Total borrowings remained unchanged at $235.0 million at both September 30, 2023 and June 30, 2023. At September 30, 2023 and June 30, 2023, borrowings were comprised of short-term and long-term FHLB - San Francisco advances used for liquidity and interest rate risk management purposes.

Total stockholders’ equity decreased slightly to $129.2 million at September 30, 2023 from $129.7 million at June 30, 2023, primarily as a result of $981,000 of cash dividends paid to shareholders, the $824,000 impact of the CECL adoption and $495,000 of stock repurchases, partly offset by $1.8 million of net income in the first three months of fiscal 2024. The Corporation repurchased 36,112 shares of its common stock under its April 2022 stock repurchase plan at a weighted average cost of $13.70 per share during the first three months of fiscal 2024.

Comparison of Operating Results for the Quarters Ended September 30, 2023 and 2022

Net income for the first quarter of fiscal 2024 was $1.8 million, down $328,000 or 16 percent from $2.1 million in the same period of fiscal 2023. The decrease in net income was primarily attributable to a $475,000 increase in the provision for credit losses and a $252,000 decrease in non-interest income, partly offset by a $174,000 increase in net interest income and an $85,000 decrease in non-interest expenses.

The Corporation’s efficiency ratio, defined as non-interest expense divided by the sum of net interest income and non-interest income, improved slightly to 69.32 percent for the first quarter of fiscal 2024 from 69.63 percent in the same period last year.

Return on average assets was 0.54 percent in the first quarter of fiscal 2024, down 15 basis points from 0.69 percent in the same period last year. Return on average stockholders’ equity was 5.40 percent in the first quarter of fiscal 2024, down from 6.42 percent in the same period last year. Diluted earnings per share for the first quarter of fiscal 2024 were $0.25, down 14 percent from $0.29 in the same period last year.

Net Interest Income:

For the Quarters Ended September 30, 2023 and 2022. Net interest income increased $174,000 or two percent to $9.1 million from $9.0 million for the same quarter last year. The increase in net interest income was due to higher average earning assets, partly offset by a lower net interest margin. The average balance of interest-earning assets increased eight percent to $1.27 billion in the first quarter of fiscal 2024 from $1.18 billion in the same quarter last year. The increase in earning assets was primarily due to increases in the average balance of loans receivable and interest-earning deposits, partly offset by a decrease in the average balance of investment securities. The average balance of interest-bearing liabilities increased $88.2 million, or eight percent, to $1.15 billion in the first quarter of fiscal 2024 from $1.06 billion in the same quarter last year primarily reflecting an increase in the average balance of borrowings, partly offset by a decrease in the average balance of deposits. The lower net interest margin was due to increases in the weighted average cost of customer deposits and borrowings, partly offset by an increase in the average yield on interest-earning deposits reflecting increases in the targeted federal funds rate. The net interest margin during the first quarter of fiscal 2024 decreased 17 basis points to 2.88 percent from 3.05 percent in the same quarter last year. The average yield on interest-earning assets increased 84 basis points to 4.20 percent in the first quarter of fiscal 2024 from 3.36 percent in the same quarter last year, while the average cost of interest-bearing liabilities increased 110 basis points to 1.45 percent in the first quarter of fiscal 2024 from 0.35 percent in the same quarter last year.

Interest Income:

For the Quarters Ended September 30, 2023 and 2022. Total interest income increased $3.4 million, or 34 percent, to $13.3 million for the first quarter of fiscal 2024 as compared to $9.9 million for the same quarter of fiscal 2023. The increase was due primarily to an increase in interest income from loans receivable.

Interest income on loans receivable increased $3.1 million, or 34 percent, to $12.2 million in the first quarter of fiscal 2024 from $9.1 million in the same quarter of fiscal 2023. The increase was due to a higher average yield and, to a lesser extent, a higher average balance. The average yield on loans receivable increased 75 basis points to 4.54 percent in the first quarter of fiscal 2024 from an average yield of 3.79 percent in the same quarter last year. The higher weighted average loan yield

38

Table of Contents

was due primarily to the repricing of adjustable rate loans and new loan originations with higher weighted average interest rates. Adjustable-rate loans of approximately $99.9 million were repriced upward in the first quarter of fiscal 2024 by approximately 118 basis points from a weighted average 5.94 percent to 7.12 percent. The average balance of loans receivable increased $112.0 million, or 12 percent, to $1.07 billion in the first quarter of fiscal 2024 from $960.6 million in the same quarter last year. Net deferred loan cost amortization in the first quarter of fiscal 2024 decreased 35 percent to $192,000 from $296,000 in the same quarter last year, attributable primarily to fewer loan payoffs. Total loans originated for investment in the first quarter of fiscal 2024 were $18.5 million, down 78 percent from $84.6 million in the same quarter last year. Loan principal payments received in the first quarter of fiscal 2024 were $23.0 million, down 27 percent from $31.7 million in the same quarter last year.    

Interest income from investment securities decreased $12,000, or two percent, to $524,000 in the first quarter of fiscal 2024 from $536,000 for the same quarter of fiscal 2023. This decrease was attributable to a lower average balance, partly offset by a higher average yield. The average balance of investment securities decreased $30.7 million, or 17 percent, to $153.7 million in the first quarter of fiscal 2024 from $184.4 million in the same quarter last year. The decrease in the average balance of investment securities was primarily the result of scheduled and accelerated principal payments on mortgage-backed securities. The average yield on investment securities increased 20 basis points to 1.36 percent in the first quarter of fiscal 2024 from 1.16 percent for the same quarter last year. The increase in the average investment securities yield was primarily attributable to a lower premium amortization during the current quarter in comparison to the same quarter last year ($155,000 vs. $238,000) due to lower total principal repayments ($6.7 million vs. $9.3 million) and the upward repricing of adjustable-rate mortgage-backed securities.

The FHLB – San Francisco distributed a $179,000 cash dividend to the Bank on its stock in the first quarter of fiscal 2024, up 46 percent from $123,000 in the same quarter last year. The average balance of FHLB – San Francisco stock in the first quarter of fiscal 2024 was $9.5 million, up 16 percent from $8.2 million in the same quarter of fiscal 2023 while the average yield was 7.53 percent, up 156 basis points from 5.97 percent.

Interest income from interest-earning deposits, primarily cash deposited at the FRB of San Francisco, was $463,000 in the first quarter of fiscal 2024, up 233 percent from $139,000 in the same quarter of fiscal 2023. The increase was due to a higher average yield and, to a lesser extent, a higher average balance. The average yield earned on interest-earning deposits in the first quarter of fiscal 2024 was 5.32 percent, up 302 basis points from 2.30 percent in the same quarter last year, due primarily to an increase in the interest rate paid on excess reserves. The average balance of  interest-earning deposits increased by $10.4 million, or 44 percent, to $34.0 million in the first quarter of fiscal 2024 from $23.6 million in the same quarter last year primarily due to the Bank increasing its liquidity position.

Interest Expense:

For the Quarters Ended September 30, 2023 and 2022. Total interest expense increased $3.3 million or 350 percent to $4.2 million in the first quarter of fiscal 2024 from $933,000 in the same quarter last year. The increase was attributable to higher interest expense on borrowings and time deposits, particularly brokered certificates of deposit.

Interest expense on deposits for the first quarter of fiscal 2024 was $1.9 million, a 495 percent increase from $317,000 for the same period last year. The increase in interest expense on deposits was attributable to a higher average balance and cost of time deposits. The average cost of deposits was 0.80 percent for the first quarter of fiscal 2024, up 67 basis points from 0.13 percent in the same quarter last year, attributable primarily to the average cost of time deposits (mainly brokered certificates of deposit) which increased 250 basis points to 3.16% for the first quarter of fiscal 2024 from 0.66 percent in the same quarter of fiscal 2023. The average balance of deposits decreased two percent to $940.2 million in the first quarter of fiscal 2024 from $962.3 million in the same quarter last year due to decreases in transaction accounts which was mainly offset by an increase in brokered certificates of deposit.

Interest expense on borrowings, consisting of FHLB – San Francisco advances, for the first quarter of fiscal 2024 increased $1.7 million, or 276 percent, to $2.3 million from $616,000 for the same period last year. The increase was primarily the result of a higher average balance and, to a lesser extent, a higher average cost. The average balance of borrowings increased $110.3 million or 108 percent to $212.5 million in the first quarter of fiscal 2024 from $102.2 million in the same quarter last year and the average cost of borrowings increased 194 basis points to 4.33 percent in the first quarter of fiscal 2024 from 2.39 percent in the same quarter last year.

39

Table of Contents

The following table presents the average balance sheets for the quarters ended September 30, 2023 and 2022, respectively. Average balances include non-performing loans. Amortization of net deferred loan costs is included with interest income on loans receivable.

Average Balance Sheets

Quarter Ended

Quarter Ended

September 30, 2023

September 30, 2022

Average

Yield/

Average

Yield/

(Dollars In Thousands)

Balance

Interest

Cost

Balance

Interest

Cost

Interest-earning assets:


Loans receivable, net(1)

$

1,072,609

$

12,176


4.54

%  

$

960,610

$

9,100


3.79

%  

Investment securities


153,711


524


1.36

%  


184,352


536


1.16

%  

FHLB – San Francisco stock


9,505


179


7.53

%  


8,239


123


5.97

%  

Interest-earning deposits


34,043


463


5.32

%  


23,614


139


2.30

%  

Total interest-earning assets


1,269,868


13,342


4.20

%  


1,176,815


9,898


3.36

%  

Noninterest-earning assets


30,284


33,947


Total assets

$

1,300,152


$

1,210,762


Interest-bearing liabilities:


Checking and money market accounts(2)

$

432,739

$

57


0.05

%  

$

499,953

$

60


0.05

%  

Savings accounts


282,421


38


0.05

%  


334,670


44


0.05

%  

Time deposits


225,023


1,790


3.16

%  


127,643


213


0.66

%  

Total deposits(3)


940,183


1,885


0.80

%  


962,266


317


0.13

%  

Borrowings


212,455


2,318


4.33

%  


102,174


616


2.39

%  

Total interest-bearing liabilities


1,152,638


4,203


1.45

%  


1,064,440


933


0.35

%  

Noninterest-bearing liabilities


16,972


16,156


Total liabilities


1,169,610


1,080,596


Stockholders’ equity


130,542


130,166


Total liabilities and stockholders’ equity

$

1,300,152


$

1,210,762


Net interest income


$

9,139


$

8,965


Interest rate spread(4)


2.75

%  


3.01

%  

Net interest margin(5)


2.88

%  


3.05

%  

Ratio of average interest- earning assets to average interest-bearing liabilities


110.17

%  


110.56

%  

Return on average assets

0.54

%

0.69

%

Return on average equity

5.40

%

6.42

%

(1)Includes the average balance of non-performing loans of $1.4 million and $1.1 million and net deferred loan cost amortization of $192 thousand and $296 thousand for the quarters ended September 30, 2023 and 2022, respectively.
(2)Includes the average balance of noninterest-bearing checking accounts of $106.2 million and $123.4 million during the quarters ended September 30, 2023 and 2022, respectively.
(3)Includes the average balance of uninsured deposits (adjusted lower by collateralized deposits) of approximately $138.9 million and $171.0 million in the quarters ended September 30, 2023 and 2022, respectively.
(4)Represents the difference between the weighted-average yield on all interest-earning assets and the weighted-average rate on all interest-bearing liabilities.
(5)Represents net interest income before provision for (reversal of) credit losses as a percentage of average interest-earning assets.

40

Table of Contents

The following table sets forth the effects of changing rates and volumes on interest income and expense for the quarters ended September 30, 2023 and 2022, respectively. Information is provided with respect to the effects attributable to changes in volume (changes in volume multiplied by prior rate), the effects attributable to changes in rate (changes in rate multiplied by prior volume) and the effects attributable to changes that cannot be allocated between rate and volume.

Rate/Volume Variance

Quarter Ended September 30, 2023 Compared 

To Quarter Ended September 30, 2022

Increase (Decrease) Due to

(In Thousands)

Rate

Volume

Rate/Volume

Net

Interest-earning assets:


Loans receivable(1)

$

1,805

$

1,061

$

210

$

3,076

Investment securities


92


(89)


(15)


(12)

FHLB – San Francisco stock


32


19


5


56

Interest-earning deposits


185


60


79


324

Total net change in income on interest-earning assets


2,114


1,051


279


3,444

Interest-bearing liabilities:


Checking and money market accounts


(3)


(3)

Savings accounts


(6)


(6)

Time deposits


801


162


614


1,577

Borrowings


499


664


539


1,702

Total net change in expense on interest-bearing liabilities


1,300


817


1,153


3,270

Net increase (decrease) in net interest income

$

814

$

234

$

(874)

$

174

(1)For purposes of calculating volume, rate and rate/volume variances, non-performing loans were included in the weighted-average balance outstanding.

Provision for Credit Losses:

For the Quarters Ended September 30, 2023 and 2022. During the first quarter of fiscal 2024, the Bank recorded a provision for credit losses of $545,000, as compared to a $70,000 provision for credit losses recorded during the same period last year. On July 1, 2023, the Bank adopted ASU 2016-13 (CECL) resulting in a one-time increase to the ACL of $1.20 million, an $824,000 reduction to equity, a $345,000 increase to deferred tax assets and a $28,000 decrease to the mark on loans held at fair value. All amounts prior to July 1, 2023 were calculated using the previous incurred loss methodology to compute our allowance for loan losses, which is not directly comparable to the new CECL methodology. The provision for credit losses recorded in the first quarter of fiscal 2024 was primarily attributable to a longer estimated life of the loan portfolio resulting from higher market interest rates and lower loan prepayment estimates, while the outstanding balance of loans held for investment at September 30, 2023 remained virtually unchanged from June 30, 2023.

Non-performing assets, comprised solely of non-performing loans with underlying collateral located in California, increased $61,000 or five percent to $1.4 million, or 0.10 percent of total assets, at September 30, 2023, compared to $1.3 million, or 0.10 percent of total assets, at June 30, 2023. Non-performing loans at September 30, 2023 and June 2023 were comprised of six single-family loans. At both September 30, 2023 and June 30, 2023, there was no real estate owned.

Classified assets were $2.5 million at September 30, 2023, consisting of $578,000 of loans in the special mention category and $1.9 million of loans in the substandard category; while classified assets at June 30, 2023 were $2.3 million, consisting of $510,000 of loans in the special mention category and $1.8 million of loans in the substandard category.

At September 30, 2023, the ACL on loans held for investment was $7.7 million, comprised of collectively evaluated allowances of $7.6 million and individually evaluated allowances of $37,000; up 29 percent from $5.9 million at June 30, 2023. The ACL as a percentage of gross loans held for investment was 0.72 percent at September 30, 2023, compared to 0.55 percent at June 30, 2023. The increase in the ACL was due primarily to the CECL adoption ($1.2 million) and the

41

Table of Contents

provision for credit losses on loans in the first quarter of fiscal 2024 ($545,000, which includes $9,000 for unfunded commitment reserves).

The following chart quantifies the factors contributing to the changes in the ACL on loans held for investment (“LHFI”) for the quarter ended September 30, 2023 subsequent to the CECL adoption on July 1, 2023:

Graphic

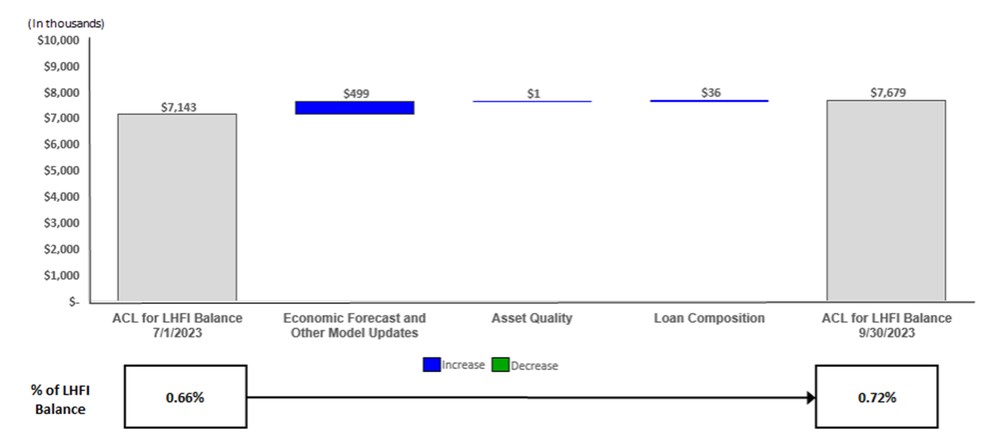
Management considers, based on currently available information, the ACL sufficient to absorb estimated losses in loans held for investment. See “Asset Quality” below and Note 5 of the Notes to Unaudited Interim Condensed Consolidated Financial Statements in this Form 10-Q for additional discussion regarding the ACL on loans held for investment.

Non-Interest Income:

For the Quarters Ended September 30, 2023 and 2022. Non-interest income decreased $252,000, or 25 percent, to $751,000 in the first quarter of fiscal 2024 from $1.0 million in the same period last year, primarily due to a decrease in loan servicing and other fees, and, to a lesser extent, decreases in deposit account fees, card and processing fees, and other non-interest income.

Loan servicing and other fees decreased $129,000 or 119 percent to a net loss of $21,000 in the first quarter of fiscal 2024 from a net gain of $108,000 in the same quarter last year. The decrease was attributable primarily to lower loan prepayment fees resulting from fewer loan payoffs, particularly in multi-family loans. Total loan prepayment fees in the first quarter of fiscal 2024 were $19,000, down $140,000 or 88 percent from $159,000 in the same quarter last year. Total loan repayments were $23.0 million in the first quarter of fiscal 2024, down 27 percent from $31.7 million in the same quarter last year.

Non-Interest Expense:

For the Quarters Ended September 30, 2023 and 2022. Non-interest expenses decreased $85,000 or one percent to $6.9 million in the first quarter of fiscal 2024 from the same quarter last year. The decrease in the non-interest expense in the first quarter of fiscal 2024 was primarily due to lower professional expenses, attributable mainly to lower legal expenses.

Provision for Income Taxes:

The income tax provision reflects accruals for taxes at the applicable rates for federal income tax and California franchise tax based upon reported pre-tax income, adjusted for the effect of all permanent differences between income for tax and financial reporting purposes, such as non-deductible stock-based compensation, earnings from bank-owned life insurance

42

Table of Contents

policies, among others. Therefore, there are fluctuations in the effective income tax rate from period to period based on the relationship of net permanent differences to income before tax.

For the Quarters Ended September 30, 2023 and 2022. The income tax provision was $727,000 for the first quarter of fiscal 2024, down 16 percent from $867,000 in the same quarter last year primarily due to lower pre-tax income. The effective tax rate in the first quarter of fiscal 2024 was 29.2 percent as compared to 29.3 percent in the same quarter last year.

Asset Quality

Non-performing assets were comprised solely of non-performing loans at both September 30, 2023 and June 30, 2023. Non-performing loans, net of the ACL, consisting of loans with collateral located in California, were $1.4 million at September 30, 2023, up five percent from $1.3 million at June 30, 2023. Non-performing loans as a percentage of loans held for investment at September 30, 2023 was 0.13%, slightly higher than 0.12% at June 30, 2023. The non-performing loans at September 30, 2023 and June 30, 2023 were comprised of six single-family loans. No interest accruals were made for loans that were past due 90 days or more or if the loans were deemed non-performing. There was no real estate owned at either September 30, 2023 or June 30, 2023. For further analysis on non-performing loans, see Note 5 of the Notes to Unaudited Interim Condensed Consolidated Financial Statements of this Form 10-Q.

A decline in real estate values subsequent to the time of origination of the Corporation’s real estate secured loans could result in higher loan delinquency levels, foreclosures, provision for credit losses and net charge-offs. Real estate values and real estate markets are beyond the Corporation’s control and are generally affected by changes in national, regional or local economic conditions and other factors. These factors include fluctuations in interest rates and the availability of loans to potential purchasers, changes in tax laws and other governmental statutes, regulations and policies and acts of nature, such as earthquakes, fires and national disasters particular to California where substantially all of the Corporation’s real estate collateral is located. If real estate values decline, the value of the real estate collateral securing the Corporation’s loans as set forth in the table could be significantly overstated. The Corporation’s ability to recover on defaulted loans by foreclosing and selling the real estate collateral would then be diminished and it would be more likely to suffer losses on defaulted loans. The Corporation generally does not update the loan-to-value ratio on its loans held for investment by obtaining new appraisals or broker price opinions (nor does the Corporation intend to do so in the future as a result of the costs and inefficiencies associated with completing the task) unless a specific loan has demonstrated deterioration in which case individually evaluated allowances are established, if required.

43

Table of Contents

The following table sets forth information with respect to the Corporation’s non-performing assets, net of ACL, at the dates indicated:


At September 30, 


At June 30, 


(In Thousands)

2023

2023

Loans on non-performing status


Mortgage loans:


Single-family

$

1,361

$

1,300

Total


1,361


1,300

Accruing loans past due 90 days or more


Total non-performing loans


1,361


1,300

Real estate owned, net


Total non-performing assets

$

1,361

$

1,300

Non-performing loans as a percentage of loans held for investment, net of ACL


0.13

%  


0.12

%

Non-performing loans as a percentage of total assets


0.10

%  


0.10

%

Non-performing assets as a percentage of total assets


0.10

%  


0.10

%  

The following table summarizes classified assets, which is comprised of classified loans, net of ACL and fair value adjustments, and real estate owned, if any, at the dates indicated:


At September 30, 2023


At June 30, 2023

(Dollars In Thousands)


Balance


Count


Balance


Count

Special mention loans:


Mortgage loans:


Single-family

$

72


1

$


Multi-family


506


1


510


1

Total special mention loans


578


2


510


1

Substandard loans:


Mortgage loans:


Single-family


1,361


6


1,300


6

Commercial real estate

545

1

547

1

Total substandard loans


1,906


7


1,847


7

Total classified loans


2,484


9


2,357


8

Real estate owned


Total classified assets

$

2,484


9

$

2,357


8

Total classified assets as a percentage of total assets


0.19

%  


0.18

%  


44

Table of Contents

Loan Volume Activities

The following table provides details related to the volume of loan originations and principal payments for the quarters indicated:

For the Quarter Ended


September 30, 

(In Thousands)


2023


2022


Loans originated for investment:


Mortgage loans:


Single-family

12,452

57,049

Multi-family


5,113


24,196

Commercial real estate


939


3,325

Total loans originated for investment


18,504


84,570

Loan principal payments


(22,988)


(31,728)

(Decrease) increase in other items, net⁽¹⁾


(975)


1,108

Net (decrease) increase in loans held for investment

$

(5,459)

$

53,950

(1)Includes net changes in undisbursed loan funds, deferred loan fees or costs, ACL, fair value of loans held for investment and advance payments of escrows.

Liquidity and Capital Resources

The Corporation’s primary sources of funds are deposits, proceeds from principal and interest payments on loans and investment securities, proceeds from the maturity of loans and investment securities, FHLB – San Francisco advances, access to the discount window facility at the FRB of San Francisco and access to a federal funds facility with its correspondent bank. While maturities and scheduled amortization of loans and investment securities are a relatively predictable source of funds, deposit flows and mortgage prepayments are greatly influenced by general interest rates, economic conditions and competition.

The primary investing activity of the Corporation is the origination and purchase of loans held for investment. During the first three months of fiscal 2024 and 2023, the Corporation originated loans held for investment of $18.5 million and $84.6 million, respectively. At September 30, 2023, the Corporation had loan origination commitments totaling $6.7 million, undisbursed lines of credit totaling $879,000 and undisbursed construction loan funds totaling $1.2 million. The Corporation anticipates that it will have sufficient funds available to meet its current loan commitments. During the first three months of fiscal 2024 and 2023, total loan repayments were $23.0 million and $31.7 million, respectively.

The Corporation’s primary financing activity is gathering deposits and, when needed, borrowings, principally FHLB – San Francisco advances. During the first three months of fiscal 2023, total deposits decreased $19.5 million, or two percent, to $931.1 million, due primarily to a decrease in transaction accounts, partly offset by an increase in time deposits. The time deposits include brokered certificates of deposit totaling $105.6 million at September 30, 2023. At September 30, 2023, time deposits with a principal amount of $250,000 or less and scheduled to mature in one year or less were $143.8 million and total time deposits with a principal amount of more than $250,000 and scheduled to mature in one year or less were $28.3 million. Historically, the Corporation has been able to retain a significant percentage of its time deposits as they mature.

The Corporation must maintain an adequate level of liquidity to ensure the availability of sufficient funds to support loan growth and deposit withdrawals, to satisfy financial commitments and to take advantage of investment opportunities. The Corporation maintains sufficient cash and cash equivalents to meet short-term liquidity needs. At September 30, 2023, total cash and cash equivalents were $58.0 million, or four percent of total assets. Depending on market conditions and the pricing of deposit products and the FHLB – San Francisco advances, the Bank may rely on FHLB – San Francisco advances for part of its liquidity needs. As of September 30, 2023, total borrowings were $235.0 million and the financing

45

Table of Contents

availability at the FHLB – San Francisco was limited to 40 percent of total assets. As a result, the remaining borrowing capacity available was $286.9 million and the remaining available collateral was $422.1 million at September 30, 2023. In addition, the Bank has secured a $185.8 million discount window facility at the FRB of San Francisco, collateralized by investment securities and single-family fixed-rate loans with a total outstanding balance of $250.2 million. As of September 30, 2023, the Bank also has a borrowing arrangement in the form of a federal funds facility with its correspondent bank for $50.0 million. The Bank had no advances under its discount window or correspondent bank facilities as of September 30, 2023.

The Bank continues to work with both the FHLB - San Francisco and FRB of San Francisco to ensure that borrowing capacity is continuously reviewed and updated in order to be accessed seamlessly should the need arise. This includes establishing accounts and pledging assets as needed in order to maximize borrowing capacity and liquidity. The total available borrowing capacity across all sources totaled approximately $522.2 million at September 30, 2023.

Regulations require thrifts to maintain adequate liquidity to assure safe and sound operations. The Bank’s average liquidity ratio (defined as the ratio of average qualifying liquid assets to average deposits and borrowings) for the quarter ended September 30, 2023 increased slightly to 18.4 percent from 18.1 percent for the quarter ended June 30, 2023.

During the quarter ended September 30, 2023, the Corporation purchased 36,112 shares of its common stock under the April 2022 stock repurchase plan with a weighted average cost of $13.70 per share. As of September 30, 2023, the Corporation purchased a total of 338,831 shares or 93 percent of the total authorized stock repurchase with a weighted average cost of $13.98 per share pursuant to its April 2022 stock repurchase plan. On September 28, 2023, the Board of Directors approved the new stock repurchase plan that authorizes 350,353 shares to be purchased over a one-year period and cancelled the 25,428 shares remaining available for purchase under the April 2022 plan. As of September 30, 2023, all of the shares authorized for repurchase under the September 2023 plan remain available to purchase until the plan expires on September 28, 2024. The Corporation purchases the shares from time to time in the open market or through privately negotiated transactions depending on market conditions, the capital requirements of the Corporation, and available cash that can be allocated to the stock repurchase program, among other considerations.

Provident Financial Holdings is a separate legal entity from the Bank and, on a stand-alone level, must provide for its own liquidity and pay its own operating expenses and cash dividends. Provident Financial Holdings’ primary sources of funds consist of capital raised through dividends or capital distributions from the Bank, although there are regulatory restrictions on the ability of the Bank to pay dividends. We currently expect to continue our current practice of paying quarterly cash dividends on our common stock subject to our Board of Directors’ discretion to modify or terminate this practice at any time and for any reason without prior notice. Our current quarterly common stock dividend rate is $0.14 per share, as approved by our Board of Directors, which we believe is a dividend rate per share which enables us to balance our multiple objectives of managing and investing in the Bank, and returning a portion of our cash to our shareholders. Assuming continued payment during fiscal 2024 at this rate of $0.14 per share, our average total dividend paid each quarter would be approximately $1.0 million based on the number of outstanding shares at September 30, 2023. At September 30, 2023, the Corporation (on an unconsolidated basis) had liquid assets of $9.0 million.

The Bank, as a federally-chartered, federally insured savings bank, is subject to the capital requirements established by the OCC. Under the OCC’s capital adequacy guidelines and the regulatory framework for prompt corrective action, the Bank must meet specific capital guidelines that involve quantitative measures of the Bank’s assets, liabilities and certain off-balance-sheet items as calculated under regulatory accounting practices. The Bank’s capital amounts and classification are also subject to qualitative judgments by the regulators about components, risk weighting and other factors.

At September 30, 2023, the Bank exceeded all regulatory capital requirements. The Bank was categorized as "well-capitalized" at September 30, 2023 under the regulations of the OCC. As a bank holding company registered with the Federal Reserve, Provident Financial Holdings, Inc. is subject to the capital adequacy requirements of the Federal Reserve. For a bank holding company with less than $3.0 billion in assets, the capital guidelines apply on a bank only basis, and the Federal Reserve expects the holding company’s subsidiary bank to be well capitalized under the prompt corrective action regulations.

46

Table of Contents

The Bank’s actual and required minimum capital amounts and ratios at the dates indicated are as follows (dollars in thousands):

Regulatory Requirements


Minimum for Capital

Minimum to Be


Actual

Adequacy Purposes(1)

Well Capitalized


Amount


Ratio


Amount


Ratio


Amount


Ratio


Provident Savings Bank, F.S.B.:


As of September 30, 2023(2)


Tier 1 leverage capital (to adjusted average assets)

$

120,207


9.25

%  

$

52,004


4.00

%  

$

65,005


5.00

%

CET1 capital (to risk-weighted assets)

$

120,207


17.91

%  

$

46,993


7.00

%  

$

43,636


6.50

%

Tier 1 capital (to risk-weighted assets)

$

120,207


17.91

%  

$

57,062


8.50

%  

$

53,706


8.00

%

Total capital (to risk-weighted assets)

$

127,937


19.06

%  

$

70,489


10.50

%  

$

67,132


10.00

%

As of June 30, 2023


Tier 1 leverage capital (to adjusted average assets)

$

125,979


9.59

%  

$

52,521


4.00

%  

$

65,651


5.00

%

CET1 capital (to risk-weighted assets)

$

125,979


18.50

%  

$

47,674


7.00

%  

$

44,269


6.50

%

Tier 1 capital (to risk-weighted assets)

$

125,979


18.50

%  

$

57,890


8.50

%  

$

54,485


8.00

%

Total capital (to risk-weighted assets)

$

131,967


19.38

%  

$

71,511


10.50

%  

$

68,106


10.00

%

(1)Inclusive of the conservation buffer of not less than 2.50% for Common Equity Tier 1 (“CET1”) capital, Tier 1 capital and Total capital ratios.
(2)The Bank elected to recognize the full $824 thousand adjustment to retained earnings resulting from the adoption of CECL on July 1, 2023 instead of a three-year permitted phase-in option.

In addition to the minimum CET1, Tier 1 and Total capital ratios, the Bank must maintain a capital conservation buffer consisting of additional CET1 capital greater than 2.5% of risk-weighted assets above the required minimum levels in order to avoid limitations on paying dividends, engaging in share repurchases, and paying discretionary bonuses based on percentages of eligible retained income that could be utilized for such actions.

If the Bank does not have the ability to pay dividends to the Corporation, the Corporation may be limited in its ability to pay dividends to its stockholders. The Bank may not declare or pay a cash dividend if the effect thereof would cause its net worth to be reduced below the regulatory capital requirements imposed by federal regulation.

Supplemental Information

At

At

At

September 30, 

June 30, 

September 30, 

2023

2023

2022

Loans serviced for others (in thousands)

$

31,687

$

32,624

$

35,861

Book value per share

$

18.44

$

18.41

$

17.85

ITEM 3 – Quantitative and Qualitative Disclosures about Market Risk.

One of the Corporation’s principal financial objectives is to achieve long-term profitability while reducing its exposure to fluctuating interest rates. The Corporation has sought to reduce the exposure of its earnings to changes in interest rates by attempting to manage the repricing mismatch between interest-earning assets and interest-bearing liabilities. The principal element in achieving this objective is to increase the interest-rate sensitivity of the Corporation’s interest-earning assets by retaining for its portfolio new loan originations with interest rates subject to periodic adjustment to market conditions.

47

Table of Contents

In addition, the Corporation maintains an investment portfolio, which is largely comprised of U.S. government sponsored enterprise MBS with contractual maturities of up to 30 years that reprice frequently or have a relatively short average life. The Corporation relies on retail deposits as its primary source of funds while utilizing FHLB – San Francisco advances and, from time to time, brokered certificates of deposit as a secondary source of funding. Management believes retail deposits, unlike brokered certificates of deposit, reduces the effects of interest rate fluctuations because they generally represent a more stable source of funds. As part of its interest rate risk management strategy, the Corporation promotes transaction accounts and time deposits with terms up to seven years.

Through the use of an internal interest rate risk model, the Corporation is able to analyze its interest rate risk exposure by measuring the change in net portfolio value (“NPV”) over a variety of interest rate scenarios. NPV is defined as the net present value of expected future cash flows from assets, liabilities and off-balance sheet contracts. The calculation is intended to illustrate the change in NPV that would occur in the event of an immediate change in interest rates of -300, -200, -100, +100, +200 and +300 basis points (“bp”) with no consideration given to steps that management might take to counter the effect of the interest rate movement. As of September 30, 2023, the targeted federal funds rate range was 5.25% to 5.50%.

The following table is derived from the internal interest rate risk model and represents the NPV based on the indicated changes in interest rates as of September 30, 2023 (dollars in thousands).


Net


Portfolio


NPV as Percentage


Basis Points ("bp")

Portfolio

NPV

Value of

of Portfolio Value

Sensitivity

Change in Rates

Value

Change(1)

Assets

Assets(2)

Measure(3)

+300 bp

$

115,279

$

5,208

$

1,290,519


8.93

%  

45

bp

+200 bp

$

114,396

$

4,325

$

1,293,789


8.84

%  

36

bp

+100 bp

$

112,250

$

2,179

$

1,295,883


8.66

%  

18

bp

Base Case

$

110,071

$

$

1,298,035


8.48

%  

-100 bp

$

126,077

$

16,006

$

1,318,464


9.56

%  

108

bp

-200 bp

$

115,154

$

5,083

$

1,312,046

8.78

%  

30

bp

-300 bp

$

106,272

$

(3,799)

$

1,307,797

8.13

%  

(35)

bp

(1)Represents the increase (decrease) of the NPV at the indicated interest rate change in comparison to the NPV at September 30, 2023 (“base case”).
(2)Derived from the NPV divided by the portfolio value of total assets.
(3)Derived from the change in the NPV as Percentage of Portfolio Value Assets from the base case ratio assuming the indicated change in interest rates (expressed in basis points).

The following table is derived from the internal interest rate risk model and represents the change in the NPV at a +100 basis point rate shock at September 30, 2023 and at a -200 basis point rate shock at June 30, 2023, each of which scenarios were the most severe shock of plus or minus 100 and 200 basis point rate shocks.


At September 30, 2023


At June 30, 2023


(+100 bp rate shock)


(-200 bp rate shock)

Pre-Shock NPV Ratio: NPV as a % of PV Assets


8.48

%

9.29

%

Post-Shock NPV Ratio: NPV as a % of PV Assets


8.66

%

8.37

%

Sensitivity Measure: Change in NPV Ratio


18

bp


-92

bp

The pre-shock NPV ratio decreased 81 basis points to 8.48 percent at September 30, 2023 from 9.29 percent at June 30, 2023 while the post-shock NPV ratio increased 29 basis points to 8.66 percent at September 30, 2023 from 8.37 percent at June 30, 2023. The decrease of the pre-shock NPV ratios was primarily attributable to a $7.0 million cash dividend distribution from the Bank to the Provident Financial Holdings in September 2023 and a $824,000 decrease in stockholders’ equity resulting from the CECL adoption, the changes in market interest rates and the composition of the balance sheet, partly offset by net income in the first three months of fiscal 2024.

As with any method of measuring interest rate risk, certain shortcomings are inherent in the method of analysis presented in the foregoing tables. For example, although certain assets and liabilities may have similar maturities or periods to

48

Table of Contents

repricing, they may react in different degrees to changes in market interest rates. Also, the interest rates on certain types of assets and liabilities may fluctuate in advance of changes in market interest rates, while interest rates on other types of assets and liabilities may lag behind changes in market interest rates. Additionally, certain assets, such as adjustable rate mortgage (“ARM”) loans, have features that restrict changes in interest rates on a short-term basis and over the life of the asset. Further, in the event of a change in interest rates, expected rates of prepayments on loans and early withdrawals from time deposits could likely deviate significantly from those assumed when calculating the results described in the tables above. It is also possible that, as a result of an interest rate increase, the higher mortgage payments required from ARM loans could result in an increase in delinquencies and defaults. Accordingly, the data presented in the tables in this section should not be relied upon as indicative of actual results in the event of changes in interest rates. Furthermore, the NPV presented in the foregoing tables is not intended to present the fair market value of the Corporation, nor does it represent amounts that would be available for distribution to shareholders in the event of the liquidation of the Corporation.

The Corporation measures and evaluates the potential effects of interest rate movements through an interest rate sensitivity "gap" analysis. Interest rate sensitivity reflects the potential effect on net interest income when there is movement in interest rates. For loans, securities and liabilities with contractual maturities, the table presents contractual repricing or scheduled maturity. For transaction accounts (checking, money market and savings deposits) that have no contractual maturity, the table presents estimated principal cash flows and, as applicable, the Corporation’s historical experience, management’s judgment and statistical analysis concerning their most likely withdrawal behaviors.

49

Table of Contents

The following table represents the interest rate gap analysis of the Corporation’s assets and liabilities as of September 30, 2023:

Term to Contractual Repricing, Estimated Repricing, or Contractual


Maturity(1)


As of September 30, 2023


Greater than


Greater than


Greater than


12 months or

1 year to 3

3 years to

5 years or


(Dollars In Thousands)

less


years


5 years


non-sensitive

Total

Repricing Assets:


Cash and cash equivalents

$

50,942

$

$

$

7,036

$

57,978

Investment securities


8,373


141,291


149,664

Loans held for investment


259,196


192,750


224,743


395,481


1,072,170

FHLB - San Francisco stock


9,505


9,505

Other assets


3,952


19,846


23,798

Total assets


331,968


192,750


224,743


563,654


1,313,115

Repricing Liabilities and Equity:


Checking deposits - noninterest-bearing


105,944


105,944

Checking deposits - interest bearing


43,461


86,923


86,923


72,436


289,743

Savings deposits


55,024


110,048


110,047


275,119

Money market deposits


15,861


15,861


31,722

Time deposits


172,036


50,397


4,648


1,522


228,603

Borrowings


130,000


90,000


15,009


235,009

Other liabilities


2,132


15,638


17,770

Stockholders' equity


129,205


129,205

Total liabilities and stockholders' equity


418,514


353,229


216,627


324,745


1,313,115

Repricing gap (negative) positive

$

(86,546)

$

(160,479)

$

8,116

$

238,909

$

Cumulative repricing gap:


Dollar amount

$

(86,546)

$

(247,025)

$

(238,909)

$

$

Percent of total assets


(7)

%  


(19)

%  


(18)

%  


%  


%

(1)Cash and cash equivalents are presented as estimated repricing; investment securities and loans held for investment are presented as contractual maturities or contractual repricing (without consideration for prepayments); FHLB - San Francisco stock is presented as contractual repricing; transaction accounts (checking, savings and money market deposits) are presented as estimated repricing; while time deposits (without consideration for early withdrawals) and borrowings are presented as contractual maturities.

The static gap analysis under “12 months or less” duration, “Greater than 1 year to 3 years” duration and “Greater than 3 years to 5 years” duration show negative positions in the "Cumulative repricing gap - dollar amount" category, indicating more liabilities are sensitive to repricing than assets in the short and intermediate terms. Management views noninterest-bearing deposits to be the least sensitive to changes in market interest rates and these accounts are therefore characterized as long-term funding. Interest-bearing checking deposits are considered more sensitive, followed by increased sensitivity for savings and money market deposits. For the purpose of calculating gap, a portion of these interest-bearing deposit balances are assumed to be subject to estimated repricing as follows: interest-bearing checking deposits at 15% per year, savings deposits at 20% per year and money market deposits at 50% in the first and second years.

The gap results presented above could vary substantially if different assumptions are used or if actual experience differs from the assumptions used in the preparation of the gap analysis. Furthermore, the gap analysis provides a static view of

50

Table of Contents

interest rate risk exposure at a specific point in time without taking into account redirection of cash flows activity and deposit fluctuations.

The extent to which the net interest margin will be impacted by changes in prevailing interest rates will depend on a number of factors, including how quickly interest-earning assets and interest-bearing liabilities react to interest rate changes. It is not uncommon for rates on certain assets or liabilities to lag behind changes in the market interest rates. Additionally, prepayments of loans and early withdrawals of certificates of deposit could cause interest sensitivities to vary. As a result, the relationship between interest-earning assets and interest-bearing liabilities, as shown in the previous table, is only a general indicator of interest rate sensitivity and the effect of changing interest rates on net interest income is likely to be different from that predicted solely on the basis of the interest rate sensitivity analysis set forth in the previous table.

The Corporation also models the sensitivity of net interest income for the 12-month period subsequent to any given month-end assuming a dynamic balance sheet accounting for, among other items:

The Corporation’s current balance sheet and repricing characteristics;
Forecasted balance sheet growth consistent with the business plan;
Current interest rates and yield curves and management estimates of projected interest rates;
Embedded options, interest rate floors, periodic caps and lifetime caps;
Repricing characteristics for market rate sensitive instruments;
Loan, investment, deposit and borrowing cash flows;
Loan prepayment estimates for each type of loan; and
Immediate, permanent and parallel movements in interest rates of plus 300, 200 and 100, and minus 100, minus 200 and minus 300 basis points.

The following table describes the results of the analysis at September 30, 2023 and June 30, 2023.

At September 30, 2023

At June 30, 2023


Basis Point (bp)

Change in

Basis Point (bp)

Change in


Change in Rates

Net Interest Income

Change in Rates

Net Interest Income


+300 bp


-6.32%

+300 bp


-10.56%

+200 bp


-2.98%

+200 bp


-5.26%

+100 bp


-0.85%

+100 bp


-1.95%

-100 bp


-1.19%

-100 bp


1.25%

-200 bp


-4.12%

-200 bp


-0.59%

-300 bp


-7.86%

-300 bp


-3.33%

At September 30, 2023, the Corporation was close to a neutral position as its interest-bearing liabilities and interest-earning assets are expected to reprice similarly during the subsequent 12-month period. Therefore, in a rising or falling interest rate environment, the model projects a slight decrease in net interest income over the subsequent 12-month period for all scenarios.

At June 30, 2023, the Corporation was liability sensitive as its interest-bearing liabilities were expected to reprice more quickly than its interest-earning assets during the subsequent 12-month period. Therefore, in a rising interest rate environment, the model projects a decrease in net interest income over the subsequent 12-month period. In a falling interest rate environment, the results project an increase in net interest income over the subsequent 12-month period at the -100 basis point scenario and a decrease in net interest income over the subsequent 12-month period for the -200 and -300 basis point scenarios.

Management believes that the assumptions used to complete the analysis described in the table above are reasonable. However, past experience has shown that immediate, permanent and parallel movements in interest rates will not necessarily occur. Additionally, while the analysis provides a tool to evaluate the projected net interest income to changes in interest rates, actual results may be substantially different if actual experience differs from the assumptions used to complete the analysis, particularly with respect to the 12-month business plan when asset growth is forecast. Therefore,

51

Table of Contents

the model results that the Corporation discloses should be thought of as a risk management tool to compare the trends of the Corporation’s current disclosure to previous disclosures, over time, within the context of the actual performance of the treasury yield curve.

ITEM 4 – Controls and Procedures.

(a)    An evaluation of the Corporation’s disclosure controls and procedures (as defined in Section 13a-15(e) or 15d-15(e) of the Securities Exchange Act of 1934 (the “Act”)) was carried out under the supervision and with the participation of the Corporation’s Chief Executive Officer (principal executive officer), Chief Financial Officer (principal financial officer) and the Corporation’s Disclosure Committee as of the end of the period covered by this quarterly report. In designing and evaluating the Corporation’s disclosure controls and procedures, management recognizes that disclosure controls and procedures, no matter how well conceived and operated, can provide only reasonable, not absolute, assurance that the objectives of the disclosure controls and procedures are met. Also, because of the inherent limitations in all control procedures, no evaluation of controls can provide absolute assurance that all control issues and instances of fraud, if any, within the Corporation have been detected. Additionally, in designing disclosure controls and procedures, management necessarily was required to apply its judgment in evaluating the cost-benefit relationship of possible disclosure controls and procedures. The design of any disclosure controls and procedures is also based in part upon certain assumptions about the likelihood of future events, and there can be no assurance that any design will succeed in achieving its stated goals under all potential future conditions. Based on their evaluation, the Corporation’s Chief Executive Officer and Chief Financial Officer concluded that the Corporation’s disclosure controls and procedures as of September 30, 2023 were effective, at the reasonable assurance level, in ensuring that the information required to be disclosed by the Corporation in the reports it files or submits under the Act is (i) accumulated and communicated to the Corporation’s management (including the Chief Executive Officer and Chief Financial Officer) in a timely manner, and (ii) recorded, processed, summarized and reported within the time periods specified in the SEC’s rules and forms.

(b)    There have been no changes in the Corporation’s internal control over financial reporting (as defined in Rule 13a-15(f) of the Act) that occurred during the quarter ended September 30, 2023, that has materially affected, or is reasonably likely to materially affect, the Corporation’s internal control over financial reporting. The Corporation does not expect that its internal control over financial reporting will prevent all error and all fraud. A control procedure, no matter how well conceived and operated, can provide only reasonable, not absolute, assurance that the objectives of the control procedure are met. Because of the inherent limitations in all control procedures, no evaluation of controls can provide absolute assurance that all control issues and instances of fraud, if any, within the Corporation have been detected. These inherent limitations include the realities that judgments in decision-making can be faulty, and that breakdowns can occur because of simple error or mistake. Additionally, controls can be circumvented by the individual acts of some persons, by collusion of two or more people, or by management override of the control. The design of any control procedure is also based in part upon certain assumptions about the likelihood of future events, and there can be no assurance that any design will succeed in achieving its stated goals under all potential future conditions; over time, controls may become inadequate because of changes in conditions, or the degree of compliance with the policies or procedures may deteriorate. Because of the inherent limitations in a cost-effective control procedure, misstatements due to error or fraud may occur and not be detected.

PART II – OTHER INFORMATION

Item 1. Legal Proceedings.

Periodically, there have been various claims and lawsuits involving the Corporation, such as claims to enforce liens, condemnation proceedings on properties in which the Corporation holds security interests, claims involving the making and servicing of real property loans, employment matters and other issues in the ordinary course of and incidental to the Corporation’s business. These proceedings and the associated legal claims are often contested and the outcome of individual matters is not always predictable. Additionally, in some actions, it is difficult to assess potential exposure because the Corporation is still in the early stages of the litigation. The Corporation is not a party to any pending legal proceedings that it believes would have a material adverse effect on its financial condition, operations or cash flows.

52

Table of Contents

Item 1A. Risk Factors.

There have been no material changes in the risk factors previously disclosed in Part I, Item 1A of the Corporation’s 2023 Annual Form 10-K.

Item 2. Unregistered Sales of Equity Securities, Use of Proceeds and Issuer Purchases of Equity Securities.

(a)Not applicable.
(b)Not applicable.
(c)The table below represents the Corporation’s purchases of its equity securities for the first quarter of fiscal 2024.


Maximum


Total Number of

Number of Shares


Shares Purchased as

that May Yet Be


Total Number of

Average Price

Part of Publicly

Purchased Under


Period

Shares Purchased

Paid per Share

Announced Plan

the Plan(1)


July 1, 2023 – July 31, 2023


24,893

$

13.53


24,893


36,647


August 1, 2023 – August 31, 2023


10,497

$

14.11


10,497


26,150


September 1, 2023 – September 30, 2023


722

$

13.46


722


350,353

(2)

Total


36,112

$

13.70


36,112


350,353

(1)The Corporation may purchase the shares from time to time in the open market or through privately negotiated transactions depending on market conditions, the capital requirements of the Corporation, and available cash that can be allocated to the stock repurchase program, among other considerations.
(2)On September 28, 2023, the Board of Directors approved the new stock repurchase plan that authorizes 350,353 shares to be purchased over a one-year period and cancelled the 25,428 shares that remained available for purchase under the April 2022 plan. As of September 30, 2023, all of the shares authorized for repurchase under the September 2023 plan remain available to purchase until the plan expires on September 28, 2024.

Item 3. Defaults Upon Senior Securities.

Not applicable.

Item 4. Mine Safety Disclosures.

Not applicable.

Item 5. Other Information.

(a)Not applicable.
(b)Not applicable.
(c)Trading Plans. During the quarter ended September 30, 2023, no director or officer (as defined in Rule 16a-1(f) under the Exchange Act) of the Corporation adopted or terminated a “Rule 10b5-1 trading arrangement” or “non-Rule 10b5-1 trading arrangement,” as each term is defined in Item 408(a) of Regulation S-K.

53

Table of Contents

Item 6. Exhibits.

Exhibits:

3.1


Amended and Restated Certificate of Incorporation of Provident Financial Holdings, Inc. as filed with the Delaware Secretary of State on November 24, 2009 (incorporated by reference to Exhibit 3.1 to the Corporation’s Quarterly Report on Form 10-Q filed on November 9, 2010)

3.2

Amended and Restated Bylaws of Provident Financial Holdings, Inc. (incorporated by reference to Exhibit 3.2 to the Corporation’s Form 8-K filed on November 30, 2022)

4.1

Form of Certificate of Provident’s Common Stock (incorporated by reference to the Corporation’s Registration Statement on Form S-1 (333-2230) filed on March 11, 1996))

10.22

2022 Equity Incentive Plan (incorporated by reference to Exhibit A to the Corporation’s proxy statement dated October 27, 2022)

10.23

Form of Incentive Stock Option Agreement for options granted under the 2022 Equity Incentive Plan (incorporated by reference to Exhibit 10.2 in the Corporation’s Form S-8 dated December 16, 2022)

10.24

Form of Non-Qualified Stock Option Agreement for options granted under the 2022 Equity Incentive Plan (incorporated by reference to Exhibit 10.3 in the Corporation’s Form S-8 dated December 16, 2022)

10.25

Form of Restricted Stock Agreement for restricted shares awarded under the 2022 Equity Incentive Plan (incorporated by reference to Exhibit 10.4 in the Corporation’s Form S-8 dated December 16, 2022)

31.1

Certification of Chief Executive Officer Pursuant to Section 302 of the Sarbanes-Oxley Act of 2002

31.2

Certification of Chief Financial Officer Pursuant to Section 302 of the Sarbanes-Oxley Act of 2002

32.1

Certification of Chief Executive Officer Pursuant to Section 906 of the Sarbanes-Oxley Act of 2002

32.2

Certification of Chief Financial Officer Pursuant to Section 906 of the Sarbanes-Oxley Act of 2002

101

The following materials from the Corporation’s Quarterly Report on Form 10-Q for the quarter ended September 30, 2023, formatted in Extensible Business Reporting Language (XBRL): (1) Condensed Consolidated Statements of Financial Condition; (2) Condensed Consolidated Statements of Operations; (3) Condensed Consolidated Statements of Comprehensive Income; (4) Condensed Consolidated Statements of Stockholders’ Equity; (5) Condensed Consolidated Statements of Cash Flows; and (6) Selected Notes to Condensed Consolidated Financial Statements.

104

Cover Page Interactive Data File (formatted in Inline XBRL and contained in Exhibit 101)

54

Table of Contents

SIGNATURES

Pursuant to the requirements of Section 13 or 15(d) of the Securities Exchange Act of 1934, the registrant has duly caused this report to be signed on its behalf by the undersigned thereunto duly authorized.

Provident Financial Holdings, Inc.

Date: November 8, 2023

/s/ Craig G. Blunden

Craig G. Blunden

Chairman and Chief Executive Officer

(Principal Executive Officer)

Date: November 8, 2023

/s/ Donavon P. Ternes

Donavon P. Ternes

President, Chief Operating Officer and

Chief Financial Officer

(Principal Financial and Accounting Officer)

55