Exhibit 1
| TSX: CCO NYSE: CCJ |

|
website: cameco.com currency: Cdn (unless noted) |
2121 – 11th Street West, Saskatoon, Saskatchewan, S7M 1J3 Canada
Tel: 306-956-6200 Fax: 306-956-6201
Cameco Reports Document Filings
Saskatoon, Saskatchewan, Canada, March 29, 2019 . . . . . . . . . . . . .
Cameco (TSX: CCO; NYSE: CCJ) reported today that it filed its annual report on Form 40-F with the US Securities and Exchange Commission. The document includes Cameco’s audited annual financial statements for the year ended December 31, 2018, its management’s discussion and analysis (MD&A), and its Canadian annual information form (AIF).
In addition, Cameco filed with Canadian securities regulatory authorities its AIF. Its audited annual financial statements for the year ended December 31, 2018, and its MD&A were filed with Canadian securities regulatory authorities in February 2019.
Cameco also filed a technical report for the McArthur River operation under Canadian Securities Administrators’ National Instrument 43-101. Production at the operation has been suspended for an indeterminate duration and no production restart decision has been made.
“The McArthur River operation is one of the best uranium mines in the world, and we are pleased with the significant improvement in the economics of the McArthur River operation since the last report in 2012, which clearly highlights how much value this asset will create when it comes back into production. However, we want to be very clear, the market conditions necessary for a restart decision have not been achieved, and therefore the production suspension will continue for an indeterminate duration,” said Tim Gitzel, Cameco’s president and CEO.
Key highlights of the technical report include:
| • | Cameco has updated the mineral reserve and mineral resource estimates for McArthur River. As of December 31, 2018, the mineral reserve estimates increased 9.1% compared to December 31, 2017. |
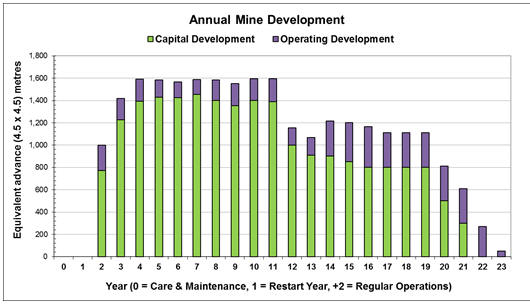
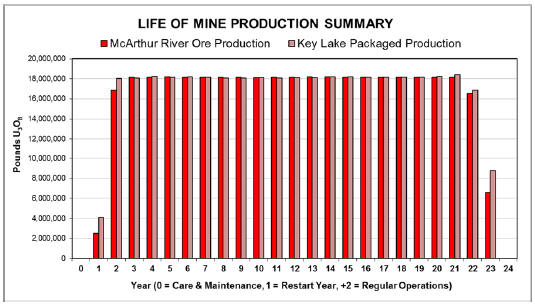
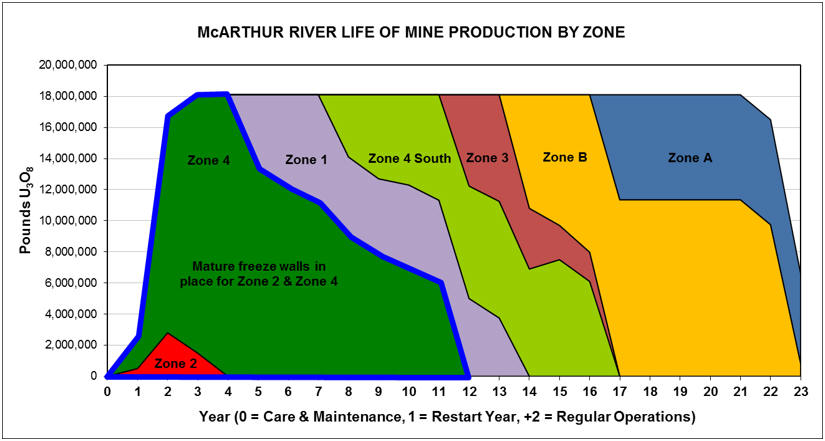
| • | The McArthur River production schedule has been modified to incorporate the additional mineral reserves and to maintain a production rate of 18.0 million pounds U3O8 per year upon a production restart. Based on the current assumed production schedule, Cameco estimates that McArthur River will have a mine life of 23 years. |
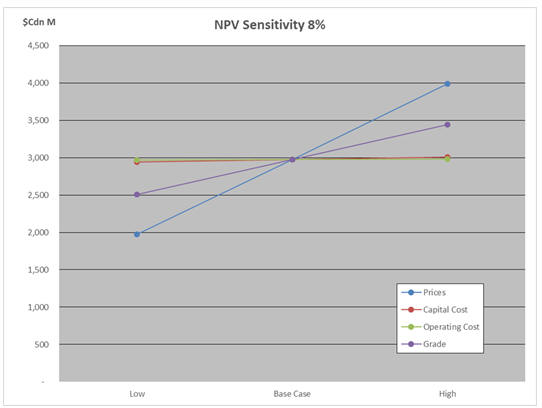
| • | Cameco’s share of the total estimated life of mine capital costs for the McArthur River and Key Lake operations is $658 million compared to $2.5 billion in the 2012 technical report. |
| • | Operating costs are estimated to average $14.97 per pound U3O8 over the mine life. This is a significant decrease from the estimate of $19.23 per pound U3O8 in the 2012 technical report. |
| • | Cameco’s share of cash operating and capital costs to maintain both operations during the production suspension shutdown is expected to range between $6 million and $7 million per month. |
Please see the full technical report for more information. All of these documents are posted on our website. Shareholders may obtain hard copies of these documents, including the financial statements, free of charge by contacting:
Cameco Investor Relations
2121 11th Street West
Saskatoon, SK S7M 1J3
Phone: 306-956-6340
Profile
Cameco is one of the world’s largest providers of uranium fuel. Our competitive position is based on our controlling ownership of the world’s largest high-grade reserves and low-cost operations. Our uranium products are used to generate clean electricity in nuclear power plants around the world. Our shares trade on the Toronto and New York stock exchanges. Our head office is in Saskatoon, Saskatchewan.
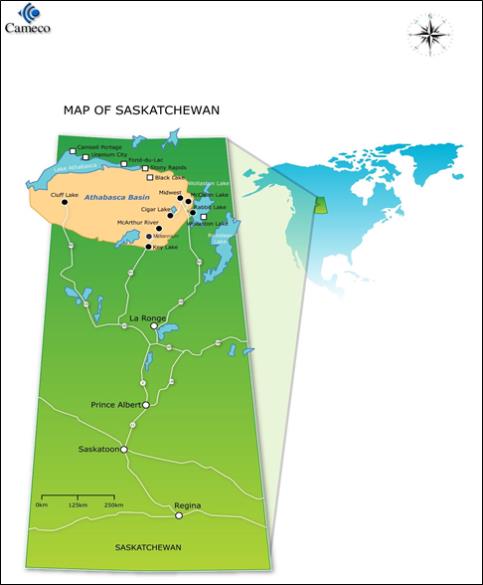
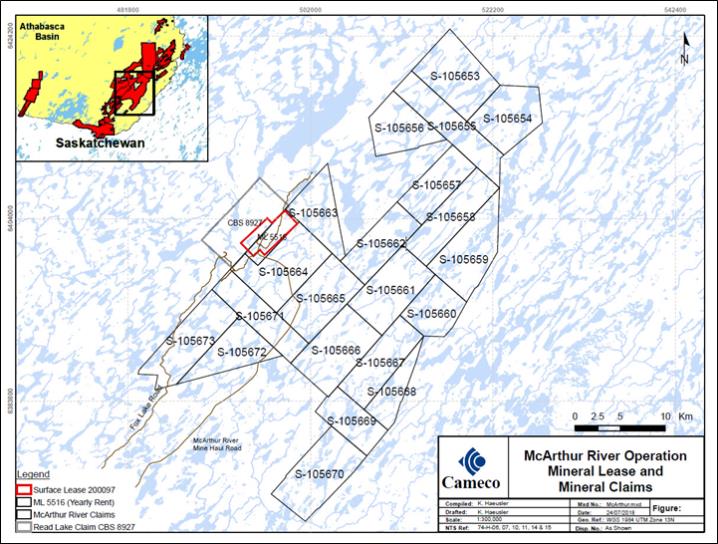
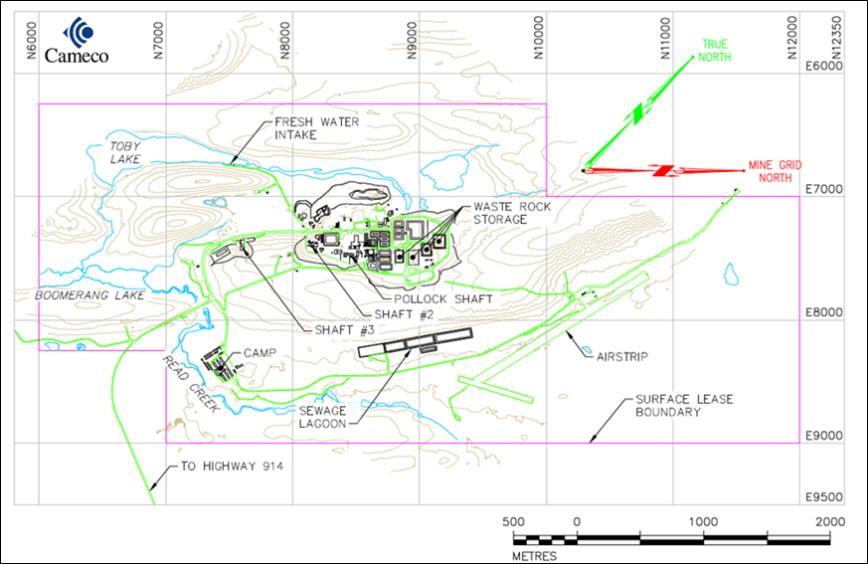
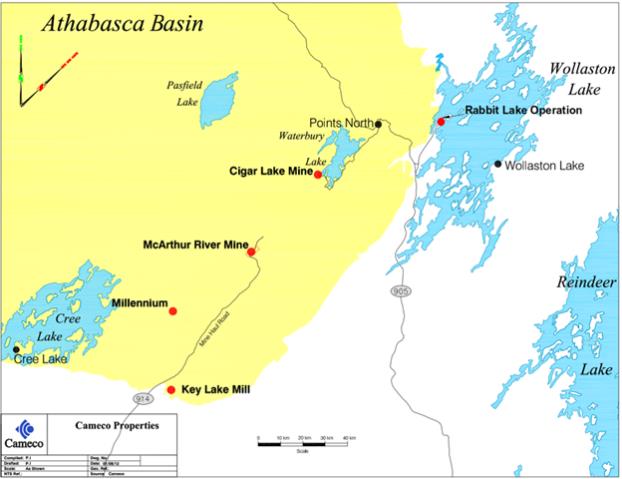
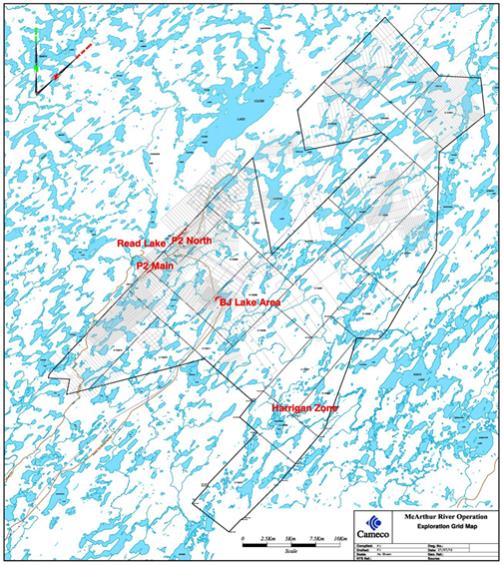
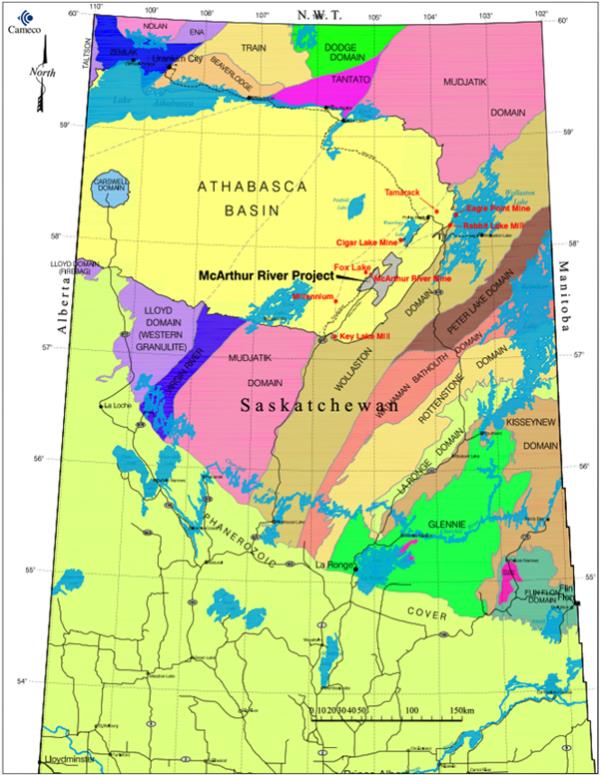
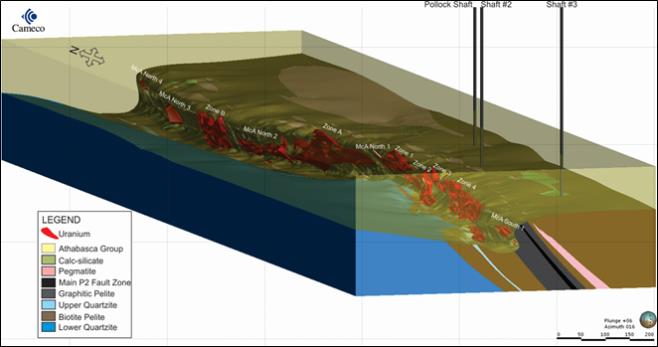
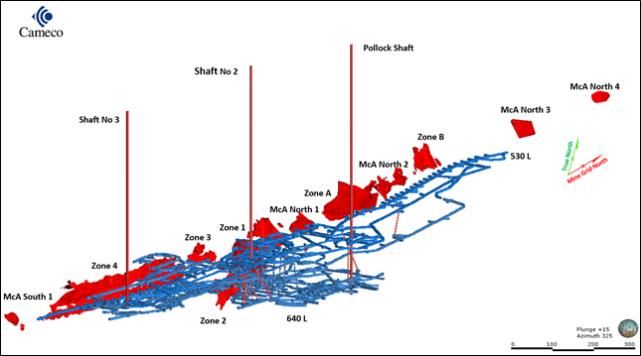
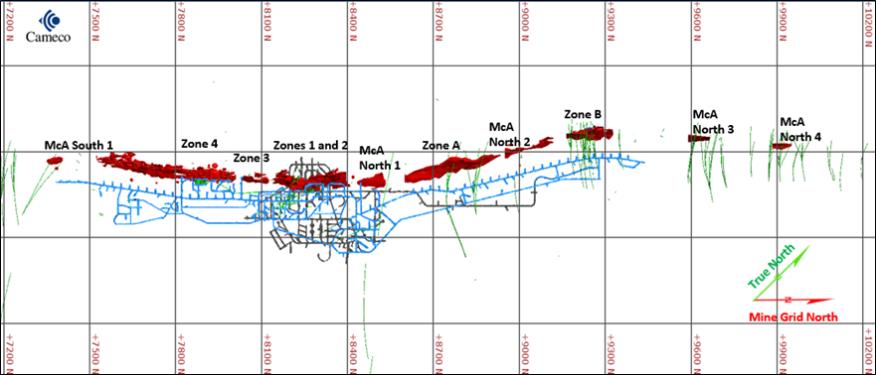
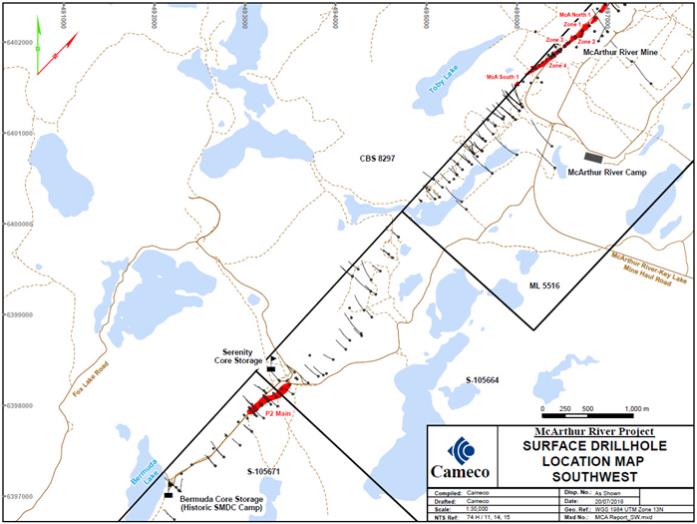
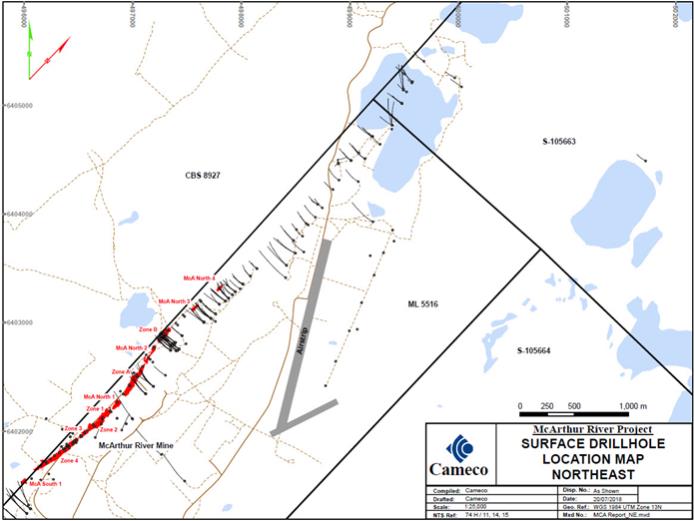
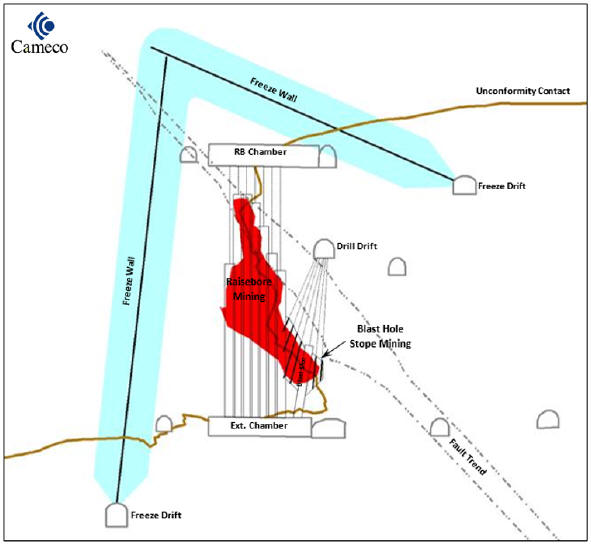
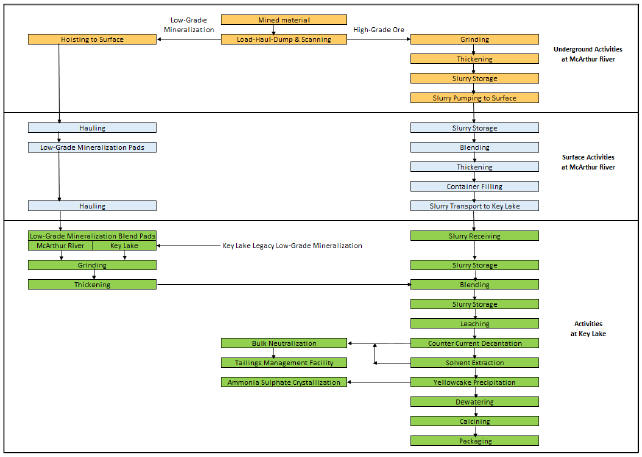
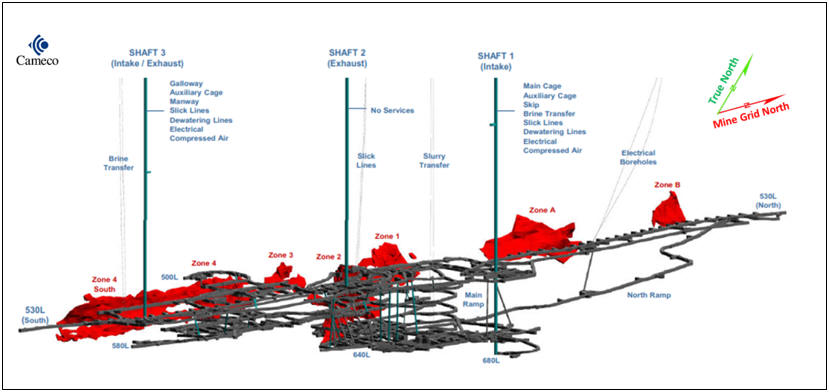
The McArthur River operation is an underground uranium mine located in northern Saskatchewan. It contains the largest known high-grade uranium deposit and has extracted 327.5 million pounds U3O8 since the start of production in 1999. Cameco is the operator. The McArthur River joint venture consisting of Cameco (69.805%) and Orano Canada Inc. (30.195%) owns the operation.
All uranium mined at McArthur River is processed and packaged at the Key Lake mill located in northern Saskatchewan. Cameco is the operator. The Key Lake joint venture consisting of Cameco (83.333%) and Orano (16.667%) owns the mill.
Caution Regarding Forward-Looking Information and Statements
This news release includes statements and information about our expectations for the future, which we refer to as forward-looking information. Forward-looking information is based on our current views, which can change significantly, and actual results and events may be significantly different from what we currently expect. Examples of forward-looking information in this news release include: the duration of the suspension of McArthur River operations, the expected value created when McArthur River comes back into production, mineral reserve estimates, production rate estimate, estimated mine life of 23 years, Cameco’s share of total estimated life of mine capital and operating costs, and Cameco’s expected monthly share of cash operating and capital costs to maintain both operations during the production suspension. Material risks that could lead to different results include the risk that Cameco’s expectations relating to these estimates, including value creation, mineral reserves, production rate, mine life, life of mine capital and operating costs, and care and maintenance costs during the production suspension, prove to be inaccurate, and the other material risks referred to in the technical report for the McArthur River operation, including in sections 24.4 and 24.5, and in our AIF and MD&A. In presenting the forward-looking information, we have made material assumptions which may prove incorrect including that these estimates will be as expected, along with the underlying assumptions associated with them, in addition to the other material assumptions related to them referred to in the technical report for the McArthur River operation, and in our MD&A and AIF. Forward looking information is designed to help you understand management’s current views of our near term and longer-term prospects, and it may not be appropriate for other purposes. We will not necessarily update this information unless we are required to by securities laws.
- 2-
Qualified Persons
The technical and scientific information discussed in this news release was approved by the following individuals who are qualified persons for the purposes of NI 43-101:
| • | Linda Bray, P.Eng., Principal Metallurgist, Technical Services, Cameco Corporation |
| • | Gregory M. Murdock, P.Eng., General Manager, McArthur River/Key Lake, Cameco Corporation |
| • | Alain D. Renaud, P.Geo., Lead Geologist, Technical Services, Cameco Corporation |
- End -
| Investor inquiries: | Rachelle Girard | 306-956-6403 | ||
| Media inquiries: | Carey Hyndman | 306-956-6317 | ||
- 3 -