| UNITED STATES SECURITIES AND EXCHANGE COMMISSION | ||
| Washington, D.C. 20549 | ||
FORM N-CSR | ||
| CERTIFIED SHAREHOLDER REPORT OF REGISTERED MANAGEMENT INVESTMENT COMPANIES | ||
| Investment Company Act file number: | (811-07513) |
| Exact name of registrant as specified in charter: | Putnam Funds Trust |
| Address of principal executive offices: | One Post Office Square, Boston, Massachusetts 02109 |
| Name and address of agent for service: | Robert T. Burns, Vice President One Post Office Square Boston, Massachusetts 02109 |
| Copy to: | Bryan Chegwidden, Esq. Ropes & Gray LLP 1211 Avenue of the Americas New York, New York 10036 |
| Registrant’s telephone number, including area code: | (617) 292-1000 |
| Date of fiscal year end: | May 31, 2015 |
| Date of reporting period : | June 1, 2014 — May 31, 2015 |
Item 1. Report to Stockholders: |
| The following is a copy of the report transmitted to stockholders pursuant to Rule 30e-1 under the Investment Company Act of 1940: | |||

Putnam
Dynamic Risk
Allocation Fund
Annual report
5 | 31 | 15
|
Message from the Trustees |
1 |
|
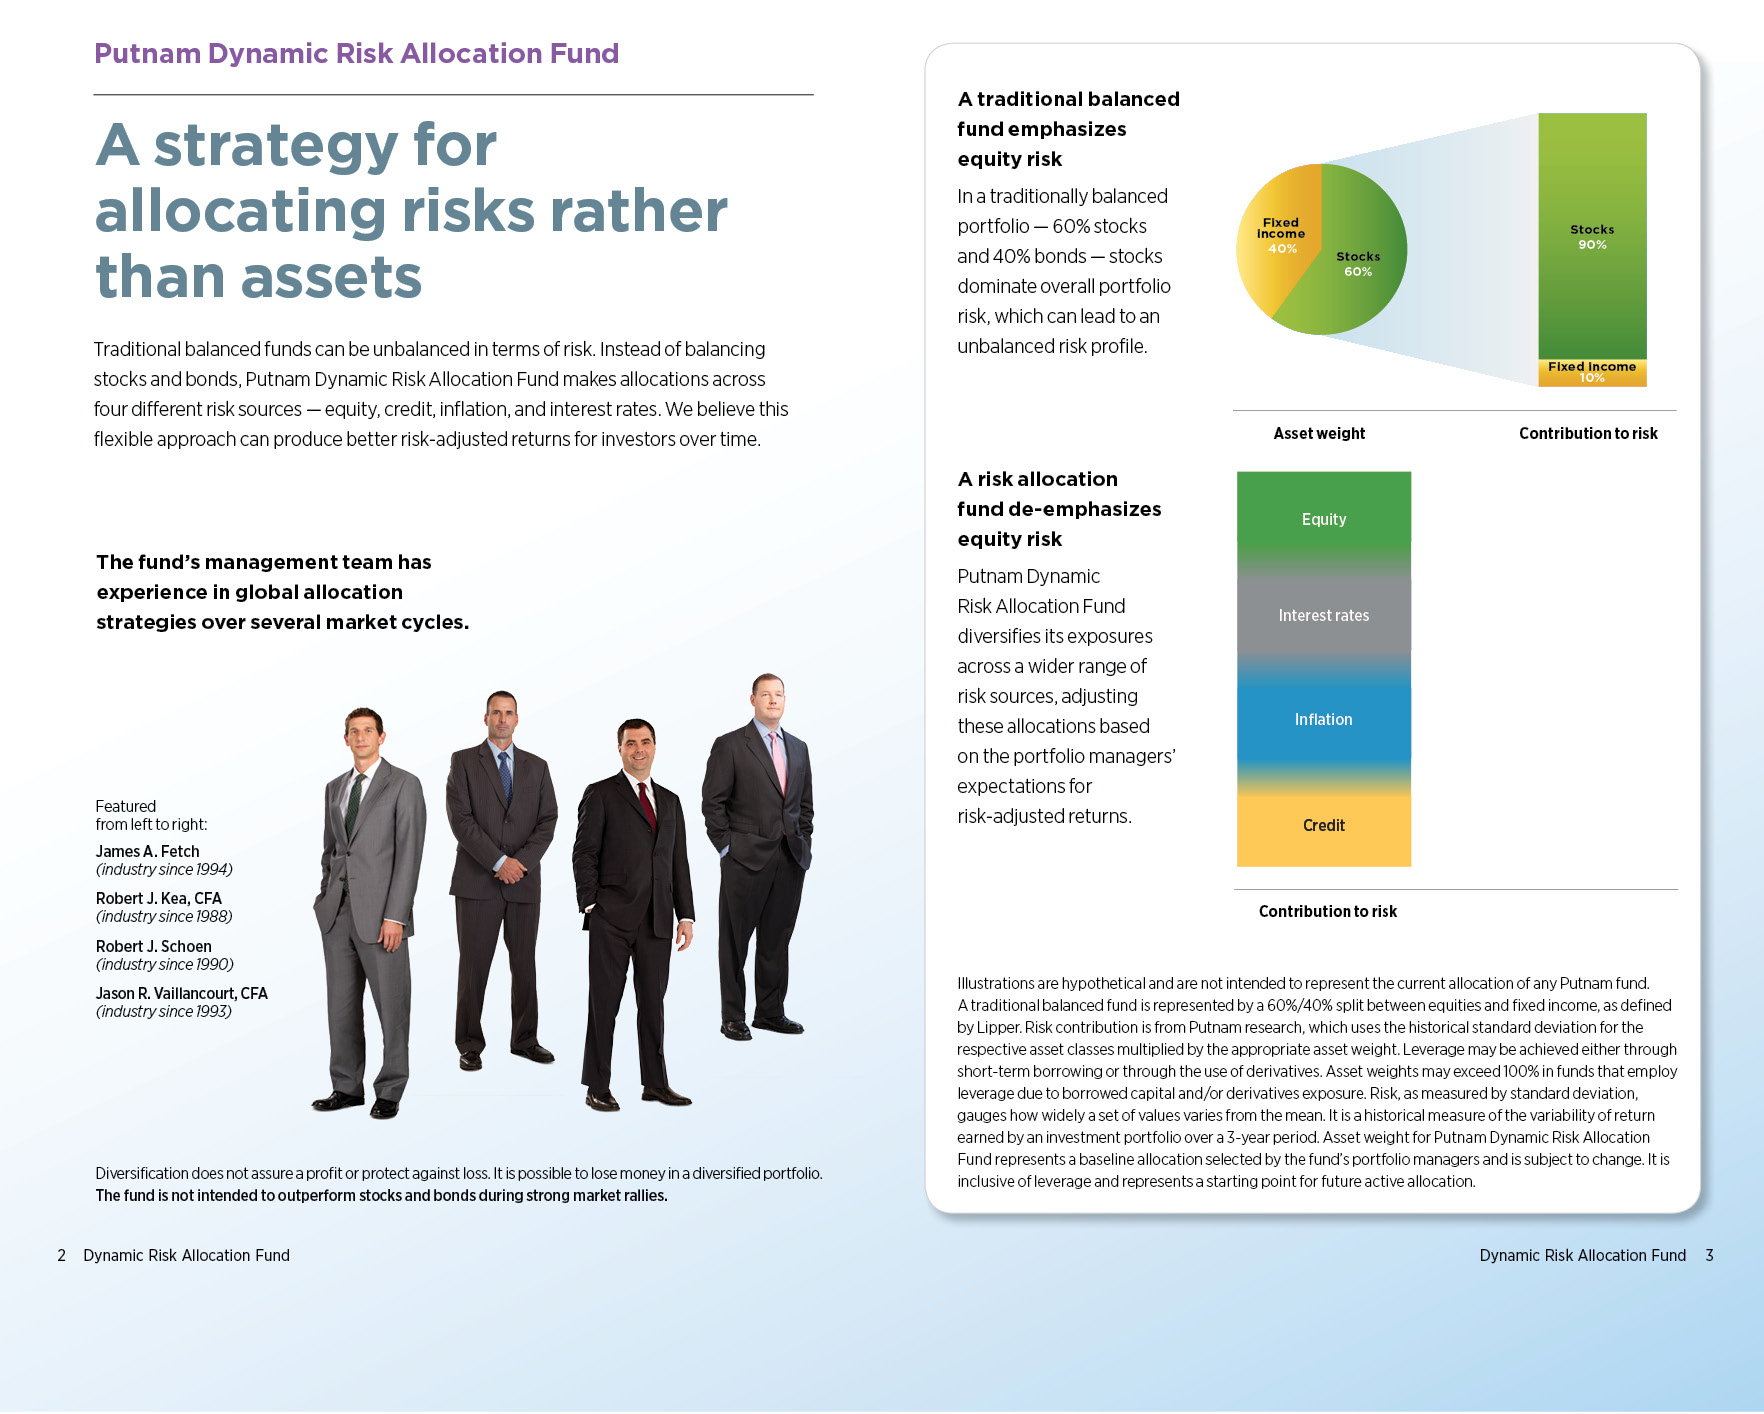
About the fund |
2 |
|
Performance snapshot |
4 |
|
Interview with your fund’s portfolio manager |
5 |
|
Your fund’s performance |
12 |
|
Your fund’s expenses |
15 |
|
Terms and definitions |
17 |
|
Other information for shareholders |
18 |
|
Important notice regarding Putnam’s privacy policy |
19 |
|
Financial statements |
20 |
|
Federal tax information |
100 |
|
About the Trustees |
101 |
|
Officers |
103 |
Consider these risks before investing: International investing involves currency, economic, and political risks. Emerging-market securities carry illiquidity and volatility risks. The fund may invest a portion of its assets in small and/or midsize companies. Such investments increase the risk of greater price fluctuations. Funds that invest in government securities are not guaranteed. Mortgage-backed securities are subject to prepayment risk and the risk that they may increase in value less when interest rates decline and decline in value more when interest rates rise. Allocation of assets among asset classes may hurt performance, and efforts to diversify risk through the use of leverage and allocation decisions may not be successful. Derivatives carry additional risks, such as the inability to terminate or sell derivatives positions and the failure of the other party to meet its obligations. Growth stocks may be more susceptible to earnings disappointments, and value stocks may fail to rebound. Bond investments are subject to interest-rate risk (the risk of bond prices falling if interest rates rise) and credit risk (the risk of an issuer defaulting on interest or principal payments). Interest-rate risk is greater for longer-term bonds, and credit risk is greater for below-investment-grade bonds. Unlike bonds, funds that invest in bonds have fees and expenses. Active trading strategies may lose money or not earn a return sufficient to cover trading and other costs. Use of leverage obtained through derivatives increases these risks by increasing investment exposure. Over-the-counter derivatives are also subject to the risk of the potential inability to terminate or sell derivatives positions and the potential failure of the other party to the instrument to meet its obligations. REITs are subject to the risk of economic downturns that have an adverse impact on real estate markets. The use of short selling may result in losses if the securities appreciate in value. Commodities involve market, political, regulatory, and natural conditions risks. Stock and bond prices may fall or fail to rise over time for several reasons, including general financial market conditions, factors related to a specific issuer or industry and, with respect to bond prices, changing market perceptions of the risk of default and changes in government intervention. These factors may also lead to increased volatility and reduced liquidity in the bond markets. You can lose money by investing in the fund.
Message from the Trustees
Dear Fellow Shareholder:
Investors today are weighing multiple factors, including the anticipated first interest-rate increase by the U.S. Federal Reserve in nine years and mixed economic data.
Some market participants believe a potential pullback in the economy could be in store for the United States, as recent economic data indicate a slowdown. Many others, however, believe the slight contraction in gross domestic product in the first quarter may be similar to the winter weather downturn in 2014. Meanwhile, Europe has shown some early signs of recovery in the areas of both growth and inflation, despite ongoing concerns about Greece’s fiscal situation.
For the past seven years, the Fed has undertaken unprecedented measures to stimulate the economy through bond buying and interest-rate cuts. Now, the Fed is planning to raise interest rates, likely by the end of the year. While negative for bonds, a gradual rise in interest rates could potentially be positive for stocks, indicating economic growth and possibilities for higher corporate profits.
International markets, some of which have delivered solid returns in the first several months of 2015, would also be affected by higher interest rates in the United States. You will find in the following pages an update on your fund’s performance as well as a market outlook from your fund’s portfolio manager.
During a time of shifting market environments, it is important for you to consult with your financial advisor to ensure that your portfolio matches your tolerance for risk and investment goals and to make any necessary adjustments.
Putnam’s professional managers pursue consistent strategies and have experience navigating changing market conditions. They, and we, share a deep conviction that an active approach based on fundamental research can play a valuable role in your portfolio.
As always, thank you for investing with Putnam. We would also like to extend our thanks to Charles Curtis, who has retired from the Board of Trustees, for his many years of dedicated service.
Respectfully yours,

Robert L. Reynolds
President and Chief Executive Officer
Putnam Investments

Jameson A. Baxter
Chair, Board of Trustees
July 13, 2015

Performance
snapshot
Annualized total return (%) comparison as of 5/31/15

Current performance may be lower or higher than the quoted past performance, which cannot guarantee future results. Share price, principal value, and return will fluctuate, and you may have a gain or a loss when you sell your shares. Performance of class A shares assumes reinvestment of distributions and does not account for taxes. Fund returns in the bar chart do not reflect a sales charge of 5.75%; had they, returns would have been lower. See pages 5 and 12–14 for additional performance information. For a portion of the periods, the fund had expense limitations, without which returns would have been lower. To obtain the most recent month-end performance, visit putnam.com.
*The Putnam Dynamic Risk Allocation Blended Index is an unmanaged index administered by Putnam Management, 50% of which is the MSCI World Index (ND), 40% of which is the Barclays Global Aggregate Bond Index, and 10% of which is the S&P Goldman Sachs Commodity Index. See index descriptions on pages 17–18.
4 Dynamic Risk Allocation Fund
Interview with your fund’s portfolio manager
|
|
|
Robert J. Kea, CFA |

How did the fund perform during the 12-month reporting period ended May 31, 2015?
Putnam Dynamic Risk Allocation Fund’s class A shares achieved a modestly positive result for the annual period, returning 0.53%, excluding sales charges. This result compares with a negative return of 3.68% for the fund’s custom benchmark, the Putnam Dynamic Risk Allocation Blended Index, which represents a diverse exposure to stocks, bonds, and commodities.
The fund allocates its assets across four different risk categories: equities, interest-sensitive assets, credit-sensitive assets, and inflation-sensitive assets. The custom benchmark’s risk allocations comprise roughly 50% in global equities and about 17% each in interest-rate-sensitive fixed-income securities, credit-sensitive high-yield bonds, and commodities and other inflation-sensitive instruments.
The fund’s modestly positive absolute return reflects a global investment environment characterized by generally strong performance by assets further out on the risk spectrum. Global equity returns were the strongest on an absolute basis, with most of the mid-single-digit gain in this area supported by U.S. equities, which far surpassed the returns of equities in the developed and emerging markets. In addition, U.S. investment-grade bonds and high-yield bonds both posted positive results for the

Broad market index and fund performance

This comparison shows your fund’s performance in the context of broad market indexes for the 12 months ended 5/31/15. See pages 4, and 12–14 for additional fund performance information. Index descriptions can be found on pages 17–18.
Dynamic Risk Allocation Fund 5
period. What drove the custom benchmark into negative territory was its commodities exposure, with the precipitous decline in energy prices in late 2014 mostly to blame for the poor performance of commodities.
What was the investment environment like during the 12-month reporting period?
It was a generally constructive period for global equities during the period, but the overall performance of the asset class was led primarily by the strength of U.S. stocks. For equities in the developed and emerging markets, slow or slowing economic growth constrained much of the forward momentum in stock prices, particularly in U.S. dollar terms. For most of the period, the U.S. dollar strengthened considerably against other major currencies, which had the effect of dampening the growth of many international stock prices in dollar terms. A stronger dollar also had some negative effects on large U.S. multinational companies whose overseas revenues lost value.
In the United States, major equity indexes achieved new record highs during the second half of 2014, as investors bid up stock prices on encouraging economic indicators and solid
Portfolio composition

Allocations are shown as a percentage of the fund’s net assets as of 5/31/15. Cash and net other assets, if any, represent the market value weights of cash, derivatives, short-term securities, and other unclassified assets in the portfolio. Summary information may differ from the portfolio schedule included in the financial statements due to the inclusion of derivative securities, any interest accruals, the exclusion of as-of trades, if any, and the use of different classifications of securities for presentation purposes. Holdings and allocations may vary over time.
A negative percentage reflects the effects of fund strategies that are designed to enhance performance if certain securities decline in value.
6 Dynamic Risk Allocation Fund
“The timing of the Fed’s seemingly
inevitable move to raise short-term
interest rates continues to be ‘the
elephant in the room.’”
Bob Kea
corporate earnings. Significant rollbacks in oil prices during the closing months of 2014 — the result of unrestrained supply growth and shrinking global energy demand — also helped stir investors’ enthusiasm, especially around consumer-oriented stocks. But for the energy sector worldwide, falling oil prices and their dampening effect on top-line revenue growth were not good news. Even so, during the second half of 2014, U.S. gross domestic product [GDP], a broad measure of overall economic activity, posted solid growth in the range of 2.0% to 2.5% on an annualized basis.
Market enthusiasm soon waned, however. A severe winter in the Northeast and a protracted labor dispute at major West Coast ports, among other factors, combined to stall the early-in-the-period economic momentum in the United States. When first quarter 2015 GDP numbers were printed later in the period, growth had not only stalled but had
Top 10 holdings
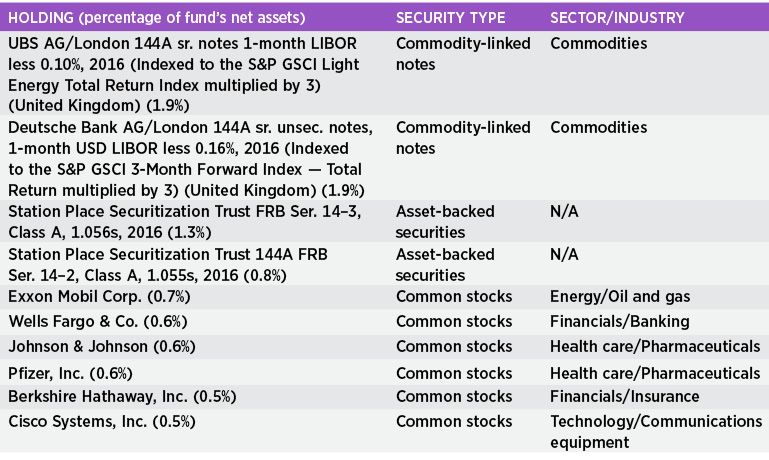
This table shows the fund’s top 10 individual holdings and the percentage of the fund’s net assets that each represented as of 5/31/15. Short-term holdings, TBA commitments, and derivatives, if any, are excluded. Holdings may vary over time.
Dynamic Risk Allocation Fund 7
actually fallen back into negative territory. Less encouraging economic data helped to support conjecture that the Federal Reserve might continue to delay its plans to increase short-term interest rates, but, at the same time, slowing domestic growth, coupled with relatively high equity valuations, were worrisome to many investors. Thus, the latter part of the reporting period exhibited a fair amount of volatility in U.S. markets.
In other developed nations of the world, the search for solid equity returns proved largely fruitless. Eurozone stocks were hard pressed to find much growth in the ongoing shade of the region’s stubborn economic woes. While the European Central Bank [ECB] did signal its intention to adopt a more aggressive monetary stimulus regime during the period, the specter of Greece’s potential sovereign debt default withdrew most of the lift from the ECB’s accommodative policy stance. Japan’s central bank, too, continued its aggressive attempts to snap the country out of its decades-long period of economic deflation. In the emerging-market economies of Asia and Latin America, once-torrid economic growth continued to slow measurably, and foreign equity investors in
Risk allocations

Allocations are shown as a percentage of the fund’s net assets as of 5/31/15. Risk contribution is from Putnam research, which uses the historical standard deviation for the respective asset classes multiplied by the appropriate asset weight. Holdings and allocations may vary over time.
8 Dynamic Risk Allocation Fund
those regions were far less active in pursuing potential opportunities.
What factors drove the fund’s relative outperformance?
While commodity weakness was a major storyline over the past 12 months, a benchmark-relative underweight and strong selection within commodities drove positive relative performance. The fund’s underweight allocation to commodities made a significant positive contribution to our relative results, partially shielding the fund from some of the downdraft of that asset class’s weakness during the period. Security selection within commodities also was quite beneficial to our relative performance in that we chose to de-emphasize securities with direct, energy-related characteristics, thus helping to neutralize some of the deflating effects of declining energy prices.
Overall, active asset allocation and security selection decisions were helpful during the reporting period. The fund was overweight in its exposure to U.S. equities, including large-cap and small-cap stocks, which made a meaningful contribution to our relative performance. Favorable security selection in the high-yield bond category also was additive, while a small underweight allocation to U.S. investment-grade bonds had a modest negative effect on the fund’s results versus its custom benchmark.
The fund also reaped the benefits of steps we took to capitalize on the strong U.S. dollar, as well as our use of currency forwards, currency futures, and other derivative instruments to hedge our local currency risk in foreign equity markets against the strong U.S. dollar.
To fulfill its low-volatility mandate, the fund occasionally uses equity option strategies to help enhance risk-adjusted returns. Typically, the use of such strategies often involves buying put options and selling call options to try to limit downside risk in the
ABOUT DERIVATIVES
Derivatives are an increasingly common type of investment instrument, the performance of which is derived from an underlying security, index, currency, or other area of the capital markets. Derivatives employed by the fund’s managers generally serve one of two main purposes: to implement a strategy that may be difficult or more expensive to invest in through traditional securities, or to hedge unwanted risk associated with a particular position.
For example, the fund’s managers might use currency forward contracts to capitalize on an anticipated change in exchange rates between two currencies. This approach would require a significantly smaller outlay of capital than purchasing traditional bonds denominated in the underlying currencies. In another example, the managers may identify a bond that they believe is undervalued relative to its risk of default, but may seek to reduce the interest-rate risk of that bond by using interest-rate swaps, a derivative through which two parties “swap” payments based on the movement of certain rates. In other examples, the managers may use options and futures contracts to hedge against a variety of risks by establishing a combination of long and short exposures to specific equity markets or sectors.
Like any other investment, derivatives may not appreciate in value and may lose money. Derivatives may amplify traditional investment risks through the creation of leverage and may be less liquid than traditional securities. And because derivatives typically represent contractual agreements between two financial institutions, derivatives entail “counterparty risk,” which is the risk that the other party is unable or unwilling to pay. Putnam monitors the counterparty risks we assume. For example, Putnam often enters into collateral agreements that require the counterparties to post collateral on a regular basis to cover their obligations to the fund. Counterparty risk for exchange-traded futures and centrally cleared swaps is mitigated by the daily exchange of margin and other safeguards against default through their respective clearinghouses.
Dynamic Risk Allocation Fund 9
portfolio. During the reporting period, which saw equity valuations mostly on the rise, that downside protection was a small drag on strategy returns.
What is your current thinking about whether the equity market is fully valued?
The recent volatility in the equity markets created opportunities to add to positions on the “dips,” meaning to buy more shares after a decline in prices with the expectation that eventually there will be a market upswing. With that said, however, we do acknowledge that equity market valuations, particularly here in the United States, are higher than normal, and that causes us some level of concern because of the portfolio’s significant exposure to U.S. stocks.
We spoke earlier about the divergence that is occurring in central bank policies across the globe, with the Fed appearing to be poised to begin a normalization of U.S. interest rates and central banks in the developed and emerging markets beginning to adopt more accommodative monetary policies to stimulate economic growth. Given these factors — that U.S. equities are perhaps at or near the high point of their valuation ranges and that global monetary policy is in a changing pattern — we have begun a slight shift in our equity strategy to focus a bit more on international stocks than we had in the recent past. At period-end, the portfolio’s allocation to international equities had moved from a slight underweight to a neutral stance. We also are maintaining a neutral positioning with regard to the portfolio’s market-cap allocations among our U.S. holdings.
In short, given that we expect the markets to continue to experience a fair amount of volatility during the summer months of 2015, we have sought to reduce risk in the portfolio by hewing closer to benchmark weightings from an asset allocation viewpoint.
What is your outlook for the investment environment through the remainder of 2015?
The timing of the Fed’s seemingly inevitable move to raise short-term interest rates continues to be “the elephant in the room.” Opinions may differ as to when the first rate hike will occur, but we believe there is no doubt that it will happen. Our belief is that when the Fed does begin to hike, it will likely be at a measured pace. If history is any guide, it is also fair to note that rate hikes — especially at the short end of the yield curve — may not necessarily have a profound negative impact on equities in the immediate term. Against that overall backdrop, we remain generally constructive in our top-down outlook for equities.
Within commodities, we have slowly trimmed the fund’s underweight, bringing our commodities exposure back roughly in line with our internal benchmark. In fixed income, although the Fed appears poised to raise short-term interest rates, we believe that longer-term U.S. Treasury rates will tend to be range-bound for the near term. We base that view on the observation that there is still a considerable amount of demand for rate-sensitive fixed-income securities, which we believe can help keep a lid on longer-term rates. The demand for rate-sensitive securities appears to be coming from various sources, including older, more risk-averse investors, overfunded pension funds looking to reduce risk, and foreign investors seeking to take advantage of the comparatively higher yields on U.S. debt securities.
Thank you, Bob, for your time and insights today.
The views expressed in this report are exclusively those of Putnam Management and are subject to change. They are not meant as investment advice.
10 Dynamic Risk Allocation Fund
Please note that the holdings discussed in this report may not have been held by the fund for the entire period. Portfolio composition is subject to review in accordance with the fund’s investment strategy and may vary in the future. Current and future portfolio holdings are subject to risk. Statements in the Q&A concerning the fund’s performance or portfolio composition relative to those of the fund’s Lipper peer group may reference information produced by Lipper Inc. or through a third party.
Portfolio Manager Robert J. Kea is Co-Head of Global Asset Allocation at Putnam. He holds an M.B.A. from the Bentley University Graduate School of Business and a B.A. from the University of Massachusetts at Amherst. Bob joined Putnam in 1989 and has been in the investment industry since 1988.
In addition to Bob, your fund’s portfolio managers are James A. Fetch; Robert J. Schoen; and Jason R. Vaillancourt, CFA.
IN THE NEWS
Since 1949, U.S. stocks have experienced 11 bull markets — when equity prices rise above their historical average for a prolonged period. As of mid-May, the current bull market has charged ahead for 74 months, the third-longest-running bull market behind the 1990–2000 bull, which lasted for 113 months, and the bull of 1949–1956, which delivered returns for 86 consecutive months, according to a recent report from S&P Capital IQ. The current bull’s duration is tied with the bull of 1974–1980. The remaining seven bull markets each lasted from 26 to 60 months, the report states. The current bull market hit its first all-time high on March 28, 2013, a full 49 months after its start, compared with the average of 29 months for all 11 bull markets since 1949. The three bull stretches of 1966–1968, 1982–1987, and 1990–2000 each reached its first new record high less than ten months after it began, according to the report.
Dynamic Risk Allocation Fund 11
|
Your fund’s performance |
|
This section shows your fund’s performance, price, and distribution information for periods ended May 31, 2015, the end of its most recent fiscal year. In accordance with regulatory requirements for mutual funds, we also include performance as of the most recent calendar quarter-end and expense information taken from the fund’s current prospectus. Performance should always be considered in light of a fund’s investment strategy. Data represent past performance. Past performance does not guarantee future results. More recent returns may be less or more than those shown. Investment return and principal value will fluctuate, and you may have a gain or a loss when you sell your shares. Performance information does not reflect any deduction for taxes a shareholder may owe on fund distributions or on the redemption of fund shares. For the most recent month-end performance, please visit the Individual Investors section at putnam.com or call Putnam at 1-800-225-1581. Class R, R5, R6, and Y shares are not available to all investors. See the Terms and Definitions section in this report for definitions of the share classes offered by your fund. |
Fund performance Total return for periods ended 5/31/15
|
Class A |
Class B |
Class C |
Class M |
Class R |
Class R5 |
Class R6 |
Class Y |
|||||
|
(inception dates) |
(9/19/11) |
(9/19/11) |
(9/19/11) |
(9/19/11) |
(9/19/11) |
(7/2/12) |
(7/2/12) |
(9/19/11) |
||||
|
Before sales charge |
After sales charge |
Before CDSC |
After CDSC |
Before CDSC |
After CDSC |
Before sales charge |
After sales charge |
Net |
Net |
Net |
Net |
|
|
Life of fund |
23.42% |
16.33% |
20.05% |
17.05% |
20.07% |
20.07% |
21.21% |
16.97% |
22.30% |
24.79% |
24.93% |
24.65% |
|
Annual average |
5.85 |
4.17 |
5.06 |
4.35 |
5.07 |
5.07 |
5.34 |
4.33 |
5.59 |
6.17 |
6.20 |
6.14 |
|
3 years |
18.95 |
12.11 |
16.33 |
13.33 |
16.34 |
16.34 |
17.24 |
13.14 |
18.06 |
19.97 |
20.10 |
19.83 |
|
Annual average |
5.95 |
3.88 |
5.17 |
4.26 |
5.17 |
5.17 |
5.44 |
4.20 |
5.69 |
6.26 |
6.30 |
6.22 |
|
1 year |
0.53 |
–5.25 |
–0.26 |
–5.04 |
–0.27 |
–1.23 |
0.01 |
–3.49 |
0.25 |
0.75 |
0.79 |
0.79 |
Current performance may be lower or higher than the quoted past performance, which cannot guarantee future results. After-sales-charge returns for class A and M shares reflect the deduction of the maximum 5.75% and 3.50% sales charge, respectively, levied at the time of purchase. Class B share returns after contingent deferred sales charge (CDSC) reflect the applicable CDSC, which is 5% in the first year, declining over time to 1% in the sixth year, and is eliminated thereafter. Class C share returns after CDSC reflect a 1% CDSC for the first year that is eliminated thereafter. Class R, R5, R6, and Y shares have no initial sales charge or CDSC. Performance for class R5 and R6 shares prior to their inception is derived from the historical performance of class Y shares and has not been adjusted for the lower investor servicing fees applicable to class R5 and R6 shares; had it, returns would have been higher.
For a portion of the periods, the fund had expense limitations, without which returns would have been lower.
12 Dynamic Risk Allocation Fund
Comparative index returns For periods ended 5/31/15
|
Putnam Dynamic Risk |
Lipper Alternative |
|
|
Life of fund |
24.38% |
16.77% |
|
Annual average |
6.08 |
4.05 |
|
3 years |
22.66 |
15.86 |
|
Annual average |
7.05 |
4.83 |
|
1 year |
–3.68 |
0.17 |
Index and Lipper results should be compared with fund performance before sales charge, before CDSC, or at net asset value.
*Over the 1-year, 3-year, and life-of-fund periods ended 5/31/15, there were 313, 202, and 176 funds, respectively, in this Lipper category.
Change in the value of a $10,000 investment ($9,425 after sales charge)
Cumulative total return from 9/19/11 to 5/31/15

Past performance does not indicate future results. At the end of the same time period, a $10,000 investment in the fund’s class B shares would have been valued at $12,005 ($11,705 after contingent deferred sales charge). A $10,000 investment in the fund’s class C shares would be valued at $12,007, and no contingent deferred sales charge would apply. A $10,000 investment in the fund’s class M shares ($9,650 after sales charge) would have been valued at $11,697. A $10,000 investment in the fund’s class R, R5, R6, and Y shares would have been valued at $12,230, $12,479, $12,493 and $12,465, respectively.
Dynamic Risk Allocation Fund 13
Fund price and distribution information For the 12-month period ended 5/31/15
|
Distributions |
Class A |
Class B |
Class C |
Class M |
Class R |
Class R5 |
Class R6 |
Class Y |
||
|
Number |
1 |
1 |
1 |
1 |
1 |
1 |
1 |
1 |
||
|
Income |
$0.266 |
$0.198 |
$0.187 |
$0.219 |
$0.255 |
$0.310 |
$0.324 |
$0.304 |
||
|
Capital gains |
||||||||||
|
Long-term gains |
0.259 |
0.259 |
0.259 |
0.259 |
0.259 |
0.259 |
0.259 |
0.259 |
||
|
Short-term gains |
— |
— |
— |
— |
— |
— |
— |
— |
||
|
Total |
$0.525 |
$0.457 |
$0.446 |
$0.478 |
$0.514 |
$0.569 |
$0.583 |
$0.563 |
||
|
Share value |
Before |
After |
Net asset |
Net asset |
Before |
After |
Net asset |
Net asset |
Net asset |
Net asset |
|
5/31/14 |
$11.58 |
$12.29 |
$11.44 |
$11.44 |
$11.60 |
$12.02 |
$11.52 |
$11.62 |
$11.61 |
$11.59 |
|
5/31/15 |
11.10 |
11.78 |
10.94 |
10.95 |
11.11 |
11.51 |
11.02 |
11.12 |
11.10 |
11.10 |
The classification of distributions, if any, is an estimate. Before-sales-charge share value and current dividend rate for class A and M shares, if applicable, do not take into account any sales charge levied at the time of purchase. After-sales-charge share value, current dividend rate, and current 30-day SEC yield, if applicable, are calculated assuming that the maximum sales charge (5.75% for class A shares and 3.50% for class M shares) was levied at the time of purchase. Final distribution information will appear on your year-end tax forms.
Fund performance as of most recent calendar quarter
Total return for periods ended 6/30/15
|
Class A |
Class B |
Class C |
Class M |
Class R |
Class R5 |
Class R6 |
Class Y |
|||||
|
(inception dates) |
(9/19/11) |
(9/19/11) |
(9/19/11) |
(9/19/11) |
(9/19/11) |
(7/2/12) |
(7/2/12) |
(9/19/11) |
||||
|
Before sales charge |
After sales charge |
Before CDSC |
After CDSC |
Before CDSC |
After CDSC |
Before sales charge |
After sales charge |
Net |
Net |
Net |
Net |
|
|
Life of fund |
20.53% |
13.60% |
17.09% |
14.09% |
17.11% |
17.11% |
18.27% |
14.13% |
19.41% |
21.87% |
22.00% |
21.73% |
|
Annual average |
5.07 |
3.43 |
4.26 |
3.55 |
4.27 |
4.27 |
4.54 |
3.56 |
4.81 |
5.37 |
5.40 |
5.34 |
|
3 years |
13.39 |
6.87 |
10.85 |
7.85 |
10.86 |
10.86 |
11.66 |
7.75 |
12.63 |
14.38 |
14.50 |
14.24 |
|
Annual average |
4.28 |
2.24 |
3.49 |
2.55 |
3.50 |
3.50 |
3.74 |
2.52 |
4.04 |
4.58 |
4.62 |
4.54 |
|
1 year |
–2.83 |
–8.42 |
–3.65 |
–8.27 |
–3.66 |
–4.58 |
–3.41 |
–6.80 |
–3.12 |
–2.61 |
–2.58 |
–2.66 |
See the discussion following the fund performance table on page 12 for information about the calculation of fund performance.
14 Dynamic Risk Allocation Fund
|
Your fund’s expenses |
|
As a mutual fund investor, you pay ongoing expenses, such as management fees, distribution fees (12b-1 fees), and other expenses. In the most recent six-month period, your fund’s expenses were limited; had expenses not been limited, they would have been higher. Using the following information, you can estimate how these expenses affect your investment and compare them with the expenses of other funds. You may also pay one-time transaction expenses, including sales charges (loads) and redemption fees, which are not shown in this section and would have resulted in higher total expenses. For more information, see your fund’s prospectus or talk to your financial representative. |
Expense ratios
|
Class A |
Class B |
Class C |
Class M |
Class R |
Class R5 |
Class R6 |
Class Y |
|
|
Net expenses for the fiscal year ended 5/31/14* |
1.42% |
2.17% |
2.17% |
1.92% |
1.67% |
1.17% |
1.13% |
1.17% |
|
Total annual operating expenses for the fiscal year ended 5/31/14 |
1.52% |
2.27% |
2.27% |
2.02% |
1.77% |
1.23% |
1.13% |
1.27% |
|
Annualized expense ratio for the six-month period ended 5/31/15† |
1.41% |
2.16% |
2.16% |
1.91% |
1.66% |
1.16% |
1.12% |
1.16% |
Fiscal-year expense information in this table is taken from the most recent prospectus, is subject to change, and may differ from that shown for the annualized expense ratio and in the financial highlights of this report.
Prospectus expense information also includes the impact of acquired fund fees and expenses of 0.02%, which is not included in the financial highlights or annualized expense ratios. Expenses are shown as a percentage of average net assets.
*Reflects Putnam Management’s contractual obligation to limit expenses through 9/30/15.
†For the fund’s most recent fiscal half year; may differ from expense ratios based on one-year data in the financial highlights.
Expenses per $1,000
The following table shows the expenses you would have paid on a $1,000 investment in the fund from December 1, 2014, to May 31, 2015. It also shows how much a $1,000 investment would be worth at the close of the period, assuming actual returns and expenses.
|
Class A |
Class B |
Class C |
Class M |
Class R |
Class R5 |
Class R6 |
Class Y |
|
|
Expenses paid per $1,000*† |
$7.06 |
$10.80 |
$10.80 |
$9.56 |
$8.31 |
$5.82 |
$5.62 |
$5.82 |
|
Ending value (after expenses) |
$1,009.70 |
$1,006.20 |
$1,006.00 |
$1,008.00 |
$1,008.70 |
$1,011.00 |
$1,011.40 |
$1,011.40 |
*Expenses for each share class are calculated using the fund’s annualized expense ratio for each class, which represents the ongoing expenses as a percentage of average net assets for the six months ended 5/31/15. The expense ratio may differ for each share class.
†Expenses are calculated by multiplying the expense ratio by the average account value for the period; then multiplying the result by the number of days in the period; and then dividing that result by the number of days in the year.
Dynamic Risk Allocation Fund 15
|
Estimate the expenses you paid |
|
To estimate the ongoing expenses you paid for the six months ended May 31, 2015, use the following calculation method. To find the value of your investment on December 1, 2014, call Putnam at 1-800-225-1581. |
|
|

Compare expenses using the SEC’s method
The Securities and Exchange Commission (SEC) has established guidelines to help investors assess fund expenses. Per these guidelines, the following table shows your fund’s expenses based on a $1,000 investment, assuming a hypothetical 5% annualized return. You can use this information to compare the ongoing expenses (but not transaction expenses or total costs) of investing in the fund with those of other funds. All mutual fund shareholder reports will provide this information to help you make this comparison. Please note that you cannot use this information to estimate your actual ending account balance and expenses paid during the period.
|
Class A |
Class B |
Class C |
Class M |
Class R |
Class R5 |
Class R6 |
Class Y |
|
|
Expenses paid per $1,000*† |
$7.09 |
$10.85 |
$10.85 |
$9.60 |
$8.35 |
$5.84 |
$5.64 |
$5.84 |
|
Ending value (after expenses) |
$1,017.90 |
$1,014.16 |
$1,014.16 |
$1,015.41 |
$1,016.65 |
$1,019.15 |
$1,019.35 |
$1,019.15 |
*Expenses for each share class are calculated using the fund’s annualized expense ratio for each class, which represents the ongoing expenses as a percentage of average net assets for the six months ended 5/31/15. The expense ratio may differ for each share class.
†Expenses are calculated by multiplying the expense ratio by the average account value for the six-month period; then multiplying the result by the number of days in the six-month period; and then dividing that result by the number of days in the year.
16 Dynamic Risk Allocation Fund
Terms and definitions
Important terms
Total return shows how the value of the fund’s shares changed over time, assuming you held the shares through the entire period and reinvested all distributions in the fund.
Before sales charge, or net asset value, is the price, or value, of one share of a mutual fund, without a sales charge. Before-sales-charge figures fluctuate with market conditions, and are calculated by dividing the net assets of each class of shares by the number of outstanding shares in the class.
After sales charge is the price of a mutual fund share plus the maximum sales charge levied at the time of purchase. After-sales-charge performance figures shown here assume the 5.75% maximum sales charge for class A shares and 3.50% for class M shares.
Contingent deferred sales charge (CDSC) is generally a charge applied at the time of the redemption of class B or C shares and assumes redemption at the end of the period. Your fund’s class B CDSC declines over time from a 5% maximum during the first year to 1% during the sixth year. After the sixth year, the CDSC no longer applies. The CDSC for class C shares is 1% for one year after purchase.
Share classes
Class A shares are generally subject to an initial sales charge and no CDSC (except on certain redemptions of shares bought without an initial sales charge).
Class B shares are not subject to an initial sales charge and may be subject to a CDSC.
Class C shares are not subject to an initial sales charge and are subject to a CDSC only if the shares are redeemed during the first year.
Class M shares have a lower initial sales charge and a higher 12b-1 fee than class A shares and no CDSC (except on certain redemptions of shares bought without an initial sales charge).
Class R shares are not subject to an initial sales charge or CDSC and are available only to employer-sponsored retirement plans.
Class R5 and R6 shares are not subject to an initial sales charge or CDSC, and carry no 12b-1 fee. They are available only to employer-sponsored retirement plans.
Class Y shares are not subject to an initial sales charge or CDSC, and carry no 12b-1 fee. They are generally only available to corporate and institutional clients and clients in other approved programs.
Comparative indexes
Barclays Global Aggregate Bond Index is an unmanaged index of global investment-grade fixed-income securities.
Barclays U.S. Aggregate Bond Index is an unmanaged index of U.S. investment-grade fixed-income securities.
BofA Merrill Lynch U.S. 3-Month Treasury Bill Index is an unmanaged index that seeks to measure the performance of U.S. Treasury bills available in the marketplace.
MSCI EAFE Index (ND) is an unmanaged index of equity securities from developed countries in Western Europe, the Far East, and Australasia.
MSCI World Index (ND) is an unmanaged index of equity securities from developed countries.
Putnam Dynamic Risk Allocation Blended Index is a benchmark administered by Putnam Management, comprising 50% the MSCI World Index (ND), 40% the Barclays Global Aggregate Bond Index, and 10% the S&P Goldman Sachs Commodity Index.
S&P 500 Index is an unmanaged index of common stock performance.
Dynamic Risk Allocation Fund 17
S&P Goldman Sachs Commodity Index is a composite index of commodity sector returns that represents a broadly diversified, unleveraged, long-only position in commodity futures.
Indexes assume reinvestment of all distributions and do not account for fees. Securities and performance of a fund and an index will differ. You cannot invest directly in an index.
Lipper is a third-party industry-ranking entity that ranks mutual funds. Its rankings do not reflect sales charges. Lipper rankings are based on total return at net asset value relative to other funds that have similar current investment styles or objectives as determined by Lipper. Lipper may change a fund’s category assignment at its discretion. Lipper category averages reflect performance trends for funds within a category.
Other information for shareholders
Proxy voting
Putnam is committed to managing our mutual funds in the best interests of our shareholders. The Putnam funds’ proxy voting guidelines and procedures, as well as information regarding how your fund voted proxies relating to portfolio securities during the 12-month period ended June 30, 2014, are available in the Individual Investors section of putnam.com, and on the Securities and Exchange Commission (SEC) website, www.sec.gov. If you have questions about finding forms on the SEC’s website, you may call the SEC at 1-800-SEC-0330. You may also obtain the Putnam funds’ proxy voting guidelines and procedures at no charge by calling Putnam’s Shareholder Services at 1-800-225-1581.
Fund portfolio holdings
The fund will file a complete schedule of its portfolio holdings with the SEC for the first and third quarters of each fiscal year on Form N-Q. Shareholders may obtain the fund’s Form N-Q on the SEC’s website at www.sec.gov. In addition, the fund’s Form N-Q may be reviewed and copied at the SEC’s Public Reference Room in Washington, D.C. You may call the SEC at 1-800-SEC-0330 for information about the SEC’s website or the operation of the Public Reference Room.
Trustee and employee fund ownership
Putnam employees and members of the Board of Trustees place their faith, confidence, and, most importantly, investment dollars in Putnam mutual funds. As of May 31, 2015, Putnam employees had approximately $504,000,000 and the Trustees had approximately $143,000,000 invested in Putnam mutual funds. These amounts include investments by the Trustees’ and employees’ immediate family members as well as investments through retirement and deferred compensation plans.
18 Dynamic Risk Allocation Fund
Important notice regarding Putnam’s privacy policy
In order to conduct business with our shareholders, we must obtain certain personal information such as account holders’ names, addresses, Social Security numbers, and dates of birth. Using this information, we are able to maintain accurate records of accounts and transactions.
It is our policy to protect the confidentiality of our shareholder information, whether or not a shareholder currently owns shares of our funds. In particular, it is our policy not to sell information about you or your accounts to outside marketing firms. We have safeguards in place designed to prevent unauthorized access to our computer systems and procedures to protect personal information from unauthorized use.
Under certain circumstances, we must share account information with outside vendors who provide services to us, such as mailings and proxy solicitations. In these cases, the service providers enter into confidentiality agreements with us, and we provide only the information necessary to process transactions and perform other services related to your account. Finally, it is our policy to share account information with your financial representative, if you’ve listed one on your Putnam account.
Dynamic Risk Allocation Fund 19
Financial statements
These sections of the report, as well as the accompanying Notes, preceded by the Report of Independent Registered Public Accounting Firm, constitute the fund’s financial statements.
The fund’s portfolio lists all the fund’s investments and their values as of the last day of the reporting period. Holdings are organized by asset type and industry sector, country, or state to show areas of concentration and diversification.
Statement of assets and liabilities shows how the fund’s net assets and share price are determined. All investment and non-investment assets are added together. Any unpaid expenses and other liabilities are subtracted from this total. The result is divided by the number of shares to determine the net asset value per share, which is calculated separately for each class of shares. (For funds with preferred shares, the amount subtracted from total assets includes the liquidation preference of preferred shares.)
Statement of operations shows the fund’s net investment gain or loss. This is done by first adding up all the fund’s earnings — from dividends and interest income — and subtracting its operating expenses to determine net investment income (or loss). Then, any net gain or loss the fund realized on the sales of its holdings — as well as any unrealized gains or losses over the period — is added to or subtracted from the net investment result to determine the fund’s net gain or loss for the fiscal year.
Statement of changes in net assets shows how the fund’s net assets were affected by the fund’s net investment gain or loss, by distributions to shareholders, and by changes in the number of the fund’s shares. It lists distributions and their sources (net investment income or realized capital gains) over the current reporting period and the most recent fiscal year-end. The distributions listed here may not match the sources listed in the Statement of operations because the distributions are determined on a tax basis and may be paid in a different period from the one in which they were earned.
Financial highlights provide an overview of the fund’s investment results, per-share distributions, expense ratios, net investment income ratios, and portfolio turnover in one summary table, reflecting the five most recent reporting periods. In a semiannual report, the highlights table also includes the current reporting period.
20 Dynamic Risk Allocation Fund
Report of Independent Registered Public Accounting Firm
The Board of Trustees and Shareholders
Putnam Funds Trust:
We have audited the accompanying statement of assets and liabilities of Putnam Dynamic Risk Allocation Fund (the fund), a series of Putnam Funds Trust, including the fund’s portfolio, as of May 31, 2015, and the related statement of operations for the year then ended, the statements of changes in net assets for each of the years in the two-year period then ended, and the financial highlights for each of the years or periods in the period from September 19, 2011 (commencement of operations) through May 31, 2015. These financial statements and financial highlights are the responsibility of the fund’s management. Our responsibility is to express an opinion on these financial statements and financial highlights based on our audits.
We conducted our audits in accordance with the standards of the Public Company Accounting Oversight Board (United States). Those standards require that we plan and perform the audit to obtain reasonable assurance about whether the financial statements and financial highlights are free of material misstatement. An audit includes examining, on a test basis, evidence supporting the amounts and disclosures in the financial statements. Our procedures included confirmation of securities owned as of May 31, 2015, by correspondence with the custodian and brokers or by other appropriate auditing procedures. An audit also includes assessing the accounting principles used and significant estimates made by management, as well as evaluating the overall financial statement presentation. We believe that our audits provide a reasonable basis for our opinion.
In our opinion, the financial statements and financial highlights referred to above present fairly, in all material respects, the financial position of Putnam Dynamic Risk Allocation Fund as of May 31, 2015, the results of its operations, the changes in its net assets and the financial highlights for the periods specified in the first paragraph above, in conformity with U.S. generally accepted accounting principles.

Boston, Massachusetts
July 13, 2015
Dynamic Risk Allocation Fund 21
The fund’s portfolio 5/31/15
|
COMMON STOCKS (40.5%)* |
Shares |
Value |
|
|
Banking (3.2%) |
|||
|
Access National Corp. |
429 |
$9,236 |
|
|
Australia & New Zealand Banking Group, Ltd. (Australia) |
3,685 |
93,028 |
|
|
Banco Bilbao Vizcaya Argentaria SA (Spain) |
8,936 |
88,261 |
|
|
Banco Latinoamericano de Exportaciones SA Class E (Panama) |
939 |
28,480 |
|
|
Banco Santander SA (Spain) |
16,637 |
118,478 |
|
|
Bank of Yokohama, Ltd. (The) (Japan) |
19,000 |
117,800 |
|
|
Bankia SA (Spain) † |
56,749 |
73,359 |
|
|
Barclays PLC (United Kingdom) |
13,664 |
56,387 |
|
|
BB&T Corp. |
12,903 |
509,281 |
|
|
BNP Paribas SA (France) |
1,744 |
105,215 |
|
|
BofI Holding, Inc. † |
279 |
26,271 |
|
|
Capital One Financial Corp. |
10,018 |
837,104 |
|
|
Cardinal Financial Corp. |
864 |
17,833 |
|
|
Citizens & Northern Corp. |
485 |
9,404 |
|
|
Commonwealth Bank of Australia (Australia) |
4,736 |
306,011 |
|
|
Credit Agricole SA (France) |
11,716 |
174,936 |
|
|
Credit Suisse Group AG (Switzerland) |
2,668 |
70,713 |
|
|
Cullen/Frost Bankers, Inc. |
1,221 |
89,634 |
|
|
Customers Bancorp, Inc. † |
1,079 |
27,083 |
|
|
DBS Group Holdings, Ltd. (Singapore) |
8,100 |
121,445 |
|
|
East West Bancorp, Inc. |
287 |
12,312 |
|
|
Farmers Capital Bank Corp. † |
376 |
10,336 |
|
|
FCB Financial Holdings, Inc. Class A † |
790 |
22,728 |
|
|
Financial Institutions, Inc. |
517 |
11,927 |
|
|
First Community Bancshares, Inc. |
506 |
8,450 |
|
|
First NBC Bank Holding Co. † |
577 |
19,612 |
|
|
FirstMerit Corp. |
615 |
12,079 |
|
|
Flushing Financial Corp. |
543 |
10,523 |
|
|
Hang Seng Bank, Ltd. (Hong Kong) |
9,100 |
182,401 |
|
|
Hanmi Financial Corp. |
1,040 |
23,010 |
|
|
Heartland Financial USA, Inc. |
336 |
11,451 |
|
|
Heritage Financial Group, Inc. |
509 |
13,779 |
|
|
Joyo Bank, Ltd. (The) (Japan) |
19,000 |
102,475 |
|
|
Lloyds Banking Group PLC (United Kingdom) |
210,560 |
282,461 |
|
|
MainSource Financial Group, Inc. |
778 |
15,576 |
|
|
Meta Financial Group, Inc. |
299 |
11,999 |
|
|
National Australia Bank, Ltd. (Rights) (Australia) † F |
313 |
1,268 |
|
|
National Australia Bank, Ltd. (Australia) |
3,913 |
102,073 |
|
|
Northern Trust Corp. |
3,283 |
244,748 |
|
|
Opus Bank |
475 |
15,005 |
|
|
Pacific Premier Bancorp, Inc. † |
551 |
8,678 |
|
|
PacWest Bancorp |
214 |
9,606 |
|
|
Peoples Bancorp, Inc. |
517 |
11,938 |
|
|
PNC Financial Services Group, Inc. |
7,444 |
712,316 |
|
|
Popular, Inc. (Puerto Rico) † |
406 |
13,191 |
|
|
Republic Bancorp, Inc. Class A |
349 |
8,571 |
22 Dynamic Risk Allocation Fund
|
COMMON STOCKS (40.5%)* cont. |
Shares |
Value |
|
|
Banking cont. |
|||
|
Resona Holdings, Inc. (Japan) |
34,900 |
$199,129 |
|
|
Skandinaviska Enskilda Banken AB (Sweden) |
9,823 |
121,311 |
|
|
Swedbank AB Class A (Sweden) |
4,735 |
111,066 |
|
|
Talmer Bancorp, Inc. Class A |
879 |
13,967 |
|
|
UniCredit SpA (Italy) |
12,656 |
88,544 |
|
|
United Community Banks, Inc. |
534 |
10,226 |
|
|
Wells Fargo & Co. |
24,072 |
1,347,069 |
|
|
Westpac Banking Corp. (Australia) |
4,368 |
111,553 |
|
|
6,761,337 |
|||
|
Basic materials (1.8%) |
|||
|
Aceto Corp. |
373 |
8,792 |
|
|
Airgas, Inc. |
1,193 |
121,614 |
|
|
Amcor, Ltd. (Australia) |
13,121 |
144,724 |
|
|
Andersons, Inc. (The) |
336 |
14,898 |
|
|
Antofagasta PLC (United Kingdom) |
5,808 |
66,222 |
|
|
ArcelorMittal SA (France) |
7,341 |
78,191 |
|
|
Axalta Coating Systems, Ltd. † |
1,331 |
45,587 |
|
|
BASF SE (Germany) |
1,507 |
139,363 |
|
|
Bemis Co., Inc. |
2,339 |
107,454 |
|
|
BHP Billiton PLC (Australia) |
3,708 |
78,181 |
|
|
BHP Billiton, Ltd. (Australia) |
4,525 |
101,491 |
|
|
Boise Cascade Co. † |
348 |
12,333 |
|
|
Cabot Corp. |
254 |
10,533 |
|
|
Cambrex Corp. † |
1,070 |
42,821 |
|
|
Chicago Bridge & Iron Co. NV |
475 |
25,774 |
|
|
Constellium NV Class A (Netherlands) † |
1,347 |
18,346 |
|
|
Continental Building Products, Inc. † |
1,350 |
30,105 |
|
|
Domtar Corp. (Canada) |
366 |
15,819 |
|
|
EMS-Chemie Holding AG (Switzerland) |
219 |
93,265 |
|
|
Glencore PLC (Rights) (United Kingdom) F |
16,966 |
395 |
|
|
Glencore PLC (United Kingdom) |
16,966 |
74,668 |
|
|
Horsehead Holding Corp. † S |
1,964 |
24,393 |
|
|
Innophos Holdings, Inc. |
301 |
15,685 |
|
|
Innospec, Inc. |
402 |
17,238 |
|
|
International Flavors & Fragrances, Inc. |
1,426 |
169,751 |
|
|
Kaiser Aluminum Corp. |
415 |
33,669 |
|
|
Koninklijke Boskalis Westminster NV (Netherlands) |
1,932 |
95,730 |
|
|
Koppers Holdings, Inc. |
1,117 |
28,841 |
|
|
Kraton Performance Polymers, Inc. † |
406 |
9,643 |
|
|
L.B. Foster Co. Class A |
202 |
7,706 |
|
|
LSB Industries, Inc. † |
951 |
40,446 |
|
|
Matrix Service Co. † |
1,024 |
17,275 |
|
|
Minerals Technologies, Inc. |
137 |
9,221 |
|
|
Newmont Mining Corp. |
10,165 |
276,895 |
|
|
Nippon Paint Holdings Co., Ltd. (Japan) |
4,600 |
141,999 |
|
|
NN, Inc. |
1,040 |
28,340 |
|
|
Orion Engineered Carbons SA (Luxembourg) |
906 |
18,256 |
|
|
PolyOne Corp. |
318 |
12,367 |
Dynamic Risk Allocation Fund 23
|
COMMON STOCKS (40.5%)* cont. |
Shares |
Value |
|
|
Basic materials cont. |
|||
|
Rio Tinto PLC (United Kingdom) |
1,931 |
$84,290 |
|
|
Royal Gold, Inc. |
1,565 |
101,365 |
|
|
SBA Communications Corp. Class A † |
2,910 |
325,367 |
|
|
Sherwin-Williams Co. (The) |
1,838 |
529,675 |
|
|
South32, Ltd. (Australia) † |
4,525 |
7,577 |
|
|
South32, Ltd. (Australia) † |
3,708 |
6,121 |
|
|
Sumitomo Metal Mining Co., Ltd. (Japan) |
7,000 |
107,751 |
|
|
Syngenta AG (Switzerland) |
338 |
153,023 |
|
|
ThyssenKrupp AG (Germany) |
6,570 |
174,046 |
|
|
U.S. Silica Holdings, Inc. |
393 |
12,124 |
|
|
UPM-Kymmene OYJ (Finland) |
6,768 |
121,386 |
|
|
US Concrete, Inc. † |
433 |
16,363 |
|
|
Wendel SA (France) |
853 |
108,721 |
|
|
3,925,840 |
|||
|
Capital goods (2.4%) |
|||
|
ABB, Ltd. (Switzerland) |
5,969 |
130,577 |
|
|
Airbus Group NV (France) |
936 |
63,737 |
|
|
Altra Industrial Motion Corp. |
828 |
22,770 |
|
|
American Axle & Manufacturing Holdings, Inc. † |
374 |
9,391 |
|
|
Atlas Copco AB Class A (Sweden) |
6,327 |
191,298 |
|
|
Atlas Copco AB Class A (Sweden) † |
6,327 |
4,415 |
|
|
Avery Dennison Corp. |
2,164 |
133,973 |
|
|
AZZ, Inc. |
237 |
11,359 |
|
|
BAE Systems PLC (United Kingdom) |
18,590 |
146,327 |
|
|
Ball Corp. |
3,034 |
215,384 |
|
|
Canon, Inc. (Japan) |
3,700 |
127,717 |
|
|
Chase Corp. |
193 |
7,861 |
|
|
Cooper-Standard Holding, Inc. † |
348 |
21,774 |
|
|
Douglas Dynamics, Inc. |
300 |
6,090 |
|
|
General Dynamics Corp. |
5,661 |
793,446 |
|
|
Greenbrier Cos., Inc. (The) S |
580 |
34,933 |
|
|
Hyster-Yale Materials Holdings, Inc. |
158 |
11,212 |
|
|
Kadant, Inc. |
464 |
21,854 |
|
|
Lockheed Martin Corp. |
3,938 |
741,132 |
|
|
MasTec, Inc. † |
1,357 |
23,965 |
|
|
Meritor, Inc. † |
1,613 |
23,082 |
|
|
Middleby Corp. (The) † |
94 |
10,218 |
|
|
Miller Industries, Inc. |
547 |
11,219 |
|
|
Mitsubishi Electric Corp. (Japan) |
15,000 |
204,708 |
|
|
MSA Safety, Inc. |
197 |
8,806 |
|
|
OM Group, Inc. |
452 |
11,996 |
|
|
Orbital ATK, Inc. |
92 |
7,038 |
|
|
OSRAM Licht AG (Germany) |
1,641 |
86,493 |
|
|
Raytheon Co. |
5,462 |
564,006 |
|
|
Rockwell Collins, Inc. |
2,993 |
284,904 |
|
|
Safran SA (France) |
2,934 |
207,556 |
|
|
Standard Motor Products, Inc. |
755 |
26,553 |
|
|
Standex International Corp. |
222 |
17,762 |
24 Dynamic Risk Allocation Fund
|
COMMON STOCKS (40.5%)* cont. |
Shares |
Value |
|
|
Capital goods cont. |
|||
|
Stericycle, Inc. † |
1,142 |
$156,797 |
|
|
Stoneridge, Inc. † |
1,268 |
15,127 |
|
|
Tenneco, Inc. † |
212 |
12,449 |
|
|
Tetra Tech, Inc. |
1,222 |
31,968 |
|
|
THK Co., Ltd. (Japan) |
4,200 |
100,789 |
|
|
Tower International, Inc. † |
519 |
14,278 |
|
|
TransDigm Group, Inc. |
1,090 |
246,384 |
|
|
Trinity Industries, Inc. |
796 |
23,872 |
|
|
Trinseo SA † |
1,391 |
40,631 |
|
|
Triumph Group, Inc. |
347 |
23,141 |
|
|
Wabash National Corp. † |
2,121 |
28,718 |
|
|
Waste Management, Inc. |
5,531 |
274,614 |
|
|
5,152,324 |
|||
|
Communication services (0.9%) |
|||
|
ARRIS Group, Inc. † |
154 |
5,084 |
|
|
BT Group PLC (United Kingdom) |
26,824 |
183,137 |
|
|
CalAmp Corp. † |
1,126 |
22,227 |
|
|
Comtech Telecommunications Corp. |
910 |
27,336 |
|
|
Deutsche Telekom AG (Germany) |
8,451 |
145,213 |
|
|
EchoStar Corp. Class A † |
675 |
33,818 |
|
|
IDT Corp. Class B |
480 |
8,635 |
|
|
Inteliquent, Inc. |
702 |
12,376 |
|
|
Iridium Communications, Inc. † S |
1,200 |
12,420 |
|
|
magicJack VocalTec, Ltd. (Israel) † |
1,859 |
15,337 |
|
|
NeuStar, Inc. Class A † |
503 |
13,742 |
|
|
NTT DoCoMo, Inc. (Japan) |
6,900 |
123,729 |
|
|
Orange SA (France) |
7,453 |
117,546 |
|
|
ShoreTel, Inc. † |
1,272 |
8,751 |
|
|
Spok Holdings, Inc. |
577 |
10,011 |
|
|
Telefonica SA (Spain) |
6,842 |
96,788 |
|
|
Telenor ASA (Norway) † |
4,456 |
101,032 |
|
|
Telstra Corp., Ltd. (Australia) |
28,558 |
135,158 |
|
|
Verizon Communications, Inc. |
15,086 |
745,852 |
|
|
Vodafone Group PLC (United Kingdom) |
20,273 |
79,121 |
|
|
1,897,313 |
|||
|
Conglomerates (0.4%) |
|||
|
Danaher Corp. |
8,659 |
747,445 |
|
|
Exor SpA (Italy) |
1,747 |
86,957 |
|
|
Siemens AG (Germany) |
964 |
101,408 |
|
|
935,810 |
|||
|
Consumer cyclicals (5.0%) |
|||
|
Adecco SA (Switzerland) |
1,177 |
93,549 |
|
|
Adidas AG (Germany) |
828 |
65,049 |
|
|
Ascena Retail Group, Inc. † |
1,333 |
19,702 |
|
|
Automatic Data Processing, Inc. |
6,154 |
526,229 |
|
|
AutoZone, Inc. † |
741 |
499,152 |
|
|
Babcock International Group PLC (United Kingdom) |
5,578 |
95,911 |
|
|
Bayerische Motoren Werke (BMW) AG (Germany) |
1,072 |
118,562 |
|
|
Big Lots, Inc. |
538 |
23,618 |
Dynamic Risk Allocation Fund 25
|
COMMON STOCKS (40.5%)* cont. |
Shares |
Value |
|
|
Consumer cyclicals cont. |
|||
|
Bunzl PLC (United Kingdom) |
4,160 |
$120,550 |
|
|
Bureau Veritas SA (France) |
3,239 |
74,225 |
|
|
Caleres, Inc. |
731 |
22,610 |
|
|
Carmike Cinemas, Inc. † |
1,218 |
33,897 |
|
|
CEB, Inc. |
126 |
10,658 |
|
|
Children’s Place, Inc. (The) |
271 |
17,723 |
|
|
Clorox Co. (The) |
1,497 |
161,167 |
|
|
Compagnie Financiere Richemont SA (Switzerland) |
904 |
78,103 |
|
|
Compass Group PLC (United Kingdom) |
9,291 |
162,452 |
|
|
Conn’s, Inc. † |
525 |
19,420 |
|
|
Continental AG (Germany) |
1,062 |
245,234 |
|
|
Cooper Tire & Rubber Co. |
707 |
25,954 |
|
|
Ctrip.com International, Ltd. ADR (China) † |
206 |
16,453 |
|
|
Dana Holding Corp. |
835 |
18,178 |
|
|
Deckers Outdoor Corp. † |
267 |
18,196 |
|
|
Deluxe Corp. |
725 |
46,277 |
|
|
Denso Corp. (Japan) |
1,700 |
88,642 |
|
|
Dillards, Inc. Class A |
252 |
29,235 |
|
|
Discovery Communications, Inc. Class C † |
5,292 |
166,407 |
|
|
Dollar General Corp. |
6,982 |
506,823 |
|
|
Dollar Tree, Inc. † |
4,684 |
351,253 |
|
|
Ennis, Inc. |
641 |
10,782 |
|
|
Eros International PLC † |
452 |
9,017 |
|
|
Ethan Allen Interiors, Inc. |
772 |
19,377 |
|
|
Experian PLC (United Kingdom) |
5,239 |
99,771 |
|
|
FactSet Research Systems, Inc. |
716 |
118,262 |
|
|
Five Below, Inc. † |
264 |
8,778 |
|
|
Fuji Heavy Industries, Ltd. (Japan) |
5,700 |
214,609 |
|
|
G&K Services, Inc. Class A |
283 |
19,719 |
|
|
Geberit International AG (Switzerland) |
336 |
120,836 |
|
|
Global Cash Access Holdings, Inc. † |
1,467 |
11,340 |
|
|
Green Dot Corp. Class A † |
458 |
6,710 |
|
|
Harley-Davidson, Inc. |
4,821 |
257,875 |
|
|
Horizon Pharma PLC † |
326 |
10,572 |
|
|
Host Hotels & Resorts, Inc. R |
7,299 |
145,396 |
|
|
Iconix Brand Group, Inc. † |
716 |
18,487 |
|
|
Interpublic Group of Cos., Inc. (The) |
9,385 |
191,642 |
|
|
Isetan Mitsukoshi Holdings, Ltd. (Japan) |
6,300 |
105,417 |
|
|
ITV PLC (United Kingdom) |
48,903 |
203,526 |
|
|
KAR Auction Services, Inc. |
753 |
28,057 |
|
|
Kohl’s Corp. |
1,481 |
96,991 |
|
|
Landauer, Inc. |
558 |
19,017 |
|
|
Lear Corp. |
384 |
44,552 |
|
|
LifeLock, Inc. † |
628 |
9,558 |
|
|
Lions Gate Entertainment Corp. |
1,138 |
37,656 |
|
|
Live Nation Entertainment, Inc. † |
787 |
22,508 |
|
|
Madison Square Garden Co. (The) Class A † |
1,418 |
121,140 |
|
|
Marcus Corp. |
1,024 |
20,070 |
|
|
Marks & Spencer Group PLC (United Kingdom) |
13,406 |
119,455 |
26 Dynamic Risk Allocation Fund
|
COMMON STOCKS (40.5%)* cont. |
Shares |
Value |
|
|
Consumer cyclicals cont. |
|||
|
Marriott Vacations Worldwide Corp. |
272 |
$24,012 |
|
|
Men’s Wearhouse, Inc. (The) |
509 |
29,527 |
|
|
MGM China Holdings, Ltd. (Hong Kong) |
36,000 |
65,297 |
|
|
Monster Worldwide, Inc. † |
4,547 |
27,600 |
|
|
National CineMedia, Inc. |
1,310 |
20,868 |
|
|
NIKE, Inc. Class B |
328 |
33,348 |
|
|
Omnicom Group, Inc. |
4,385 |
326,814 |
|
|
Oriental Land Co., Ltd. (Japan) |
1,400 |
89,622 |
|
|
Oxford Industries, Inc. |
335 |
25,416 |
|
|
Panasonic Corp. (Japan) |
13,100 |
192,053 |
|
|
Peugeot SA (France) † |
5,887 |
122,848 |
|
|
PGT, Inc. † |
2,264 |
27,077 |
|
|
Pitney Bowes, Inc. |
655 |
14,312 |
|
|
Publicis Groupe SA (France) |
1,400 |
111,954 |
|
|
Ralph Lauren Corp. |
1,322 |
172,389 |
|
|
RE/MAX Holdings, Inc. Class A |
691 |
23,114 |
|
|
Remy International, Inc. |
434 |
9,591 |
|
|
Ryman Hospitality Properties R |
3,434 |
189,248 |
|
|
Scripps Networks Interactive Class A |
2,389 |
160,087 |
|
|
SeaWorld Entertainment, Inc. |
1,124 |
24,278 |
|
|
Securitas AB Class B (Sweden) |
9,032 |
122,665 |
|
|
Sequential Brands Group, Inc. † |
975 |
13,621 |
|
|
Shimano, Inc. (Japan) |
700 |
99,032 |
|
|
Skechers U.S.A., Inc. Class A † |
91 |
9,634 |
|
|
Smith & Wesson Holding Corp. † |
1,544 |
22,712 |
|
|
Sotheby’s Class A |
367 |
16,453 |
|
|
Steven Madden, Ltd. † |
253 |
9,558 |
|
|
Swatch Group AG (The) (Switzerland) † |
162 |
64,328 |
|
|
Target Corp. |
10,727 |
850,866 |
|
|
Toyota Motor Corp. (Japan) |
4,700 |
324,058 |
|
|
Vail Resorts, Inc. |
106 |
10,996 |
|
|
Valeo SA (France) |
1,004 |
160,276 |
|
|
Vantiv, Inc. Class A † |
2,883 |
115,320 |
|
|
VF Corp. |
5,768 |
406,240 |
|
|
Vista Outdoor, Inc. † |
184 |
8,481 |
|
|
Visteon Corp. † |
232 |
25,409 |
|
|
Wal-Mart Stores, Inc. |
3,313 |
246,057 |
|
|
Walt Disney Co. (The) |
7,239 |
798,968 |
|
|
10,740,478 |
|||
|
Consumer finance (0.6%) |
|||
|
Cardtronics, Inc. † |
512 |
18,688 |
|
|
Encore Capital Group, Inc. † S |
581 |
23,072 |
|
|
Federal Agricultural Mortgage Corp. Class C |
374 |
11,807 |
|
|
Mitsubishi UFJ Lease & Finance Co., Ltd. (Japan) |
23,100 |
120,993 |
|
|
Nelnet, Inc. Class A |
604 |
24,830 |
|
|
PRA Group, Inc. † |
304 |
17,255 |
|
|
Synchrony Financial † S |
2,881 |
93,027 |
|
|
Visa, Inc. Class A |
13,620 |
935,422 |
|
|
1,245,094 |
Dynamic Risk Allocation Fund 27
|
COMMON STOCKS (40.5%)* cont. |
Shares |
Value |
|
|
Consumer staples (3.7%) |
|||
|
Altria Group, Inc. |
17,371 |
$889,395 |
|
|
Anheuser-Busch InBev NV (Belgium) |
1,440 |
173,101 |
|
|
Avon Products, Inc. |
971 |
6,525 |
|
|
Barrett Business Services, Inc. |
145 |
5,221 |
|
|
Beacon Roofing Supply, Inc. † |
621 |
19,475 |
|
|
Bloomin’ Brands, Inc. |
583 |
13,094 |
|
|
Bright Horizons Family Solutions, Inc. † |
196 |
10,911 |
|
|
British American Tobacco PLC (United Kingdom) |
2,503 |
137,931 |
|
|
Bunge, Ltd. |
2,836 |
262,500 |
|
|
Cal-Maine Foods, Inc. |
500 |
28,345 |
|
|
Calbee, Inc. (Japan) |
2,500 |
95,596 |
|
|
Carrefour SA (France) † |
3,528 |
119,751 |
|
|
Chipotle Mexican Grill, Inc. † |
102 |
62,783 |
|
|
Church & Dwight Co., Inc. |
1,759 |
147,703 |
|
|
Colgate-Palmolive Co. |
9,124 |
609,392 |
|
|
Costco Wholesale Corp. |
5,980 |
852,688 |
|
|
Coty, Inc. Class A † |
939 |
23,409 |
|
|
Diageo PLC (United Kingdom) |
3,302 |
91,624 |
|
|
Distribuidora Internacional de Alimentacion SA (Spain) |
9,667 |
77,039 |
|
|
Dr. Pepper Snapple Group, Inc. |
4,114 |
315,297 |
|
|
Farmer Bros Co. † |
262 |
6,432 |
|
|
Geo Group, Inc. (The) R |
3,970 |
150,582 |
|
|
Grand Canyon Education, Inc. † |
584 |
24,943 |
|
|
Heineken Holding NV (Netherlands) |
1,746 |
121,424 |
|
|
Imperial Tobacco Group PLC (United Kingdom) |
3,033 |
156,221 |
|
|
ITT Educational Services, Inc. † S |
335 |
1,464 |
|
|
John B. Sanfilippo & Son, Inc. |
789 |
39,931 |
|
|
Kao Corp. (Japan) |
3,700 |
167,746 |
|
|
Kforce, Inc. |
911 |
20,051 |
|
|
Koninklijke Ahold NV (Netherlands) |
8,426 |
171,343 |
|
|
Korn/Ferry International |
492 |
15,788 |
|
|
L’Oreal SA (France) |
659 |
124,454 |
|
|
McDonald’s Corp. |
9,647 |
925,437 |
|
|
Nestle SA (Switzerland) |
5,857 |
454,302 |
|
|
Nutraceutical International Corp. † |
334 |
7,328 |
|
|
On Assignment, Inc. † |
1,381 |
51,774 |
|
|
Papa John’s International, Inc. |
220 |
15,116 |
|
|
Philip Morris International, Inc. |
3,749 |
311,429 |
|
|
Pinnacle Foods, Inc. |
1,961 |
82,656 |
|
|
Popeyes Louisiana Kitchen, Inc. † |
222 |
12,345 |
|
|
Reckitt Benckiser Group PLC (United Kingdom) |
1,164 |
105,053 |
|
|
RetailMeNot, Inc. † |
1,135 |
22,882 |
|
|
Reynolds American, Inc. |
5,412 |
415,371 |
|
|
SABMiller PLC (United Kingdom) |
1,615 |
86,245 |
|
|
Sanderson Farms, Inc. |
200 |
16,306 |
|
|
Shutterfly, Inc. † |
105 |
4,883 |
|
|
Sonic Corp. |
727 |
21,912 |
|
|
SpartanNash Co. |
748 |
23,382 |
28 Dynamic Risk Allocation Fund
|
COMMON STOCKS (40.5%)* cont. |
Shares |
Value |
|
|
Consumer staples cont. |
|||
|
TrueBlue, Inc. † |
907 |
$25,831 |
|
|
Tupperware Brands Corp. |
1,120 |
73,629 |
|
|
Unilever NV ADR (Netherlands) |
2,650 |
113,015 |
|
|
Unilever PLC (United Kingdom) |
1,990 |
87,809 |
|
|
United Natural Foods, Inc. † |
140 |
9,390 |
|
|
USANA Health Sciences, Inc. † |
96 |
12,297 |
|
|
Woolworths, Ltd. (Australia) |
2,252 |
48,035 |
|
|
7,868,586 |
|||
|
Energy (1.9%) |
|||
|
Amec Foster Wheeler PLC (United Kingdom) |
6,818 |
98,996 |
|
|
BG Group PLC (United Kingdom) |
5,268 |
91,547 |
|
|
BP PLC (United Kingdom) |
36,798 |
253,511 |
|
|
Callon Petroleum Co. † |
3,331 |
26,182 |
|
|
Canadian Solar, Inc. (Canada) † |
667 |
21,784 |
|
|
Delek US Holdings, Inc. |
532 |
20,142 |
|
|
Diamondback Energy, Inc. † |
83 |
6,458 |
|
|
EP Energy Corp. Class A † S |
1,205 |
15,846 |
|
|
Exxon Mobil Corp. |
17,821 |
1,518,349 |
|
|
Green Plains, Inc. |
716 |
23,528 |
|
|
Gulfport Energy Corp. † |
317 |
13,682 |
|
|
HollyFrontier Corp. |
4,445 |
185,134 |
|
|
National Oilwell Varco, Inc. |
8,317 |
409,113 |
|
|
Northern Oil and Gas, Inc. † S |
3,908 |
26,692 |
|
|
Pacific Ethanol, Inc. † |
1,387 |
15,964 |
|
|
REX American Resources Corp. † |
327 |
20,885 |
|
|
Royal Dutch Shell PLC Class A (United Kingdom) |
5,973 |
177,379 |
|
|
Royal Dutch Shell PLC Class B (United Kingdom) |
5,442 |
164,147 |
|
|
SM Energy Co. |
305 |
15,958 |
|
|
Spectra Energy Corp. |
15,127 |
532,017 |
|
|
Statoil ASA (Norway) |
7,208 |
135,233 |
|
|
Stone Energy Corp. † |
452 |
6,138 |
|
|
Total SA (France) |
3,916 |
197,736 |
|
|
Triangle Petroleum Corp. † |
2,196 |
11,265 |
|
|
Unit Corp. † |
201 |
6,338 |
|
|
W&T Offshore, Inc. |
465 |
2,516 |
|
|
Whiting Petroleum Corp. † |
465 |
15,340 |
|
|
Woodside Petroleum, Ltd. (Australia) |
2,741 |
76,322 |
|
|
4,088,202 |
|||
|
Financial (0.4%) |
|||
|
Credit Acceptance Corp. † |
43 |
9,908 |
|
|
HSBC Holdings PLC (United Kingdom) |
28,606 |
272,253 |
|
|
Mitsubishi UFJ Financial Group, Inc. (Japan) |
23,000 |
169,473 |
|
|
NASDAQ OMX Group, Inc. (The) |
689 |
35,656 |
|
|
SBI Holdings, Inc. (Japan) |
8,000 |
114,070 |
|
|
UBS Group AG (Switzerland) |
6,713 |
144,424 |
|
|
745,784 |
|||
|
Health care (5.3%) |
|||
|
Abbott Laboratories |
15,139 |
735,755 |
|
|
ACADIA Pharmaceuticals, Inc. † |
406 |
16,727 |
|
|
Accuray, Inc. † |
1,045 |
6,422 |
Dynamic Risk Allocation Fund 29
|
COMMON STOCKS (40.5%)* cont. |
Shares |
Value |
|
|
Health care cont. |
|||
|
Akorn, Inc. † |
152 |
$6,977 |
|
|
Alere, Inc. † |
980 |
50,548 |
|
|
Alimera Sciences, Inc. † |
1,468 |
6,210 |
|
|
Alkermes PLC † |
106 |
6,477 |
|
|
AMAG Pharmaceuticals, Inc. † S |
1,324 |
92,124 |
|
|
AmerisourceBergen Corp. |
5,100 |
574,056 |
|
|
AmSurg Corp. † |
339 |
22,828 |
|
|
Applied Genetic Technologies Corp. † |
375 |
7,519 |
|
|
Ardelyx, Inc. † |
1,284 |
14,060 |
|
|
ARIAD Pharmaceuticals, Inc. † S |
4,228 |
38,813 |
|
|
Astellas Pharma, Inc. (Japan) |
8,900 |
129,157 |
|
|
AstraZeneca PLC (United Kingdom) |
3,266 |
218,264 |
|
|
AtriCure, Inc. † |
474 |
10,874 |
|
|
Avalanche Biotechnologies, Inc. † |
160 |
5,965 |
|
|
Bayer AG (Germany) |
1,716 |
243,407 |
|
|
BioDelivery Sciences International, Inc. † |
926 |
7,890 |
|
|
Biospecifics Technologies Corp. † |
217 |
10,338 |
|
|
Bluebird Bio, Inc. † |
99 |
19,231 |
|
|
C.R. Bard, Inc. |
1,466 |
249,689 |
|
|
Cardinal Health, Inc. |
2,408 |
212,313 |
|
|
Cardiome Pharma Corp. (Canada) † |
3,819 |
36,548 |
|
|
Centene Corp. † |
194 |
14,616 |
|
|
Chemed Corp. |
404 |
50,173 |
|
|
Coloplast A/S Class B (Denmark) |
2,529 |
190,994 |
|
|
Conatus Pharmaceuticals, Inc. † |
167 |
910 |
|
|
Conmed Corp. |
404 |
22,438 |
|
|
DaVita HealthCare Partners, Inc. † |
3,817 |
319,788 |
|
|
Depomed, Inc. † |
487 |
10,159 |
|
|
DexCom, Inc. † |
224 |
16,065 |
|
|
Dyax Corp. † |
355 |
9,351 |
|
|
Dynavax Technologies Corp. † S |
1,204 |
27,415 |
|
|
Edwards Lifesciences Corp. † |
2,409 |
314,904 |
|
|
Eli Lilly & Co. |
11,950 |
942,855 |
|
|
Emergent BioSolutions, Inc. † |
660 |
21,028 |
|
|
Enanta Pharmaceuticals, Inc. † |
257 |
10,506 |
|
|
GlaxoSmithKline PLC (United Kingdom) |
8,949 |
198,805 |
|
|
Globus Medical, Inc. Class A † |
513 |
13,307 |
|
|
Greatbatch, Inc. † |
608 |
31,604 |
|
|
Health Net, Inc. † |
498 |
30,996 |
|
|
HealthEquity, Inc. † |
593 |
15,720 |
|
|
HealthSouth Corp. |
579 |
24,990 |
|
|
Hill-Rom Holdings, Inc. |
550 |
28,358 |
|
|
ICU Medical, Inc. † |
448 |
43,456 |
|
|
Immune Design Corp. † |
307 |
6,702 |
|
|
Impax Laboratories, Inc. † |
649 |
30,509 |
|
|
Insulet Corp. † |
239 |
6,757 |
|
|
Insys Therapeutics, Inc. † S |
456 |
27,178 |
|
|
Isis Pharmaceuticals, Inc. † |
275 |
18,513 |
30 Dynamic Risk Allocation Fund
|
COMMON STOCKS (40.5%)* cont. |
Shares |
Value |
|
|
Health care cont. |
|||
|
Jazz Pharmaceuticals PLC † |
596 |
$106,893 |
|
|
Johnson & Johnson |
13,250 |
1,326,855 |
|
|
Kindred Healthcare, Inc. |
662 |
15,166 |
|
|
Ligand Pharmaceuticals, Inc. † |
93 |
8,194 |
|
|
Medicines Co. (The) † |
388 |
11,004 |
|
|
Mednax, Inc. † |
1,810 |
128,836 |
|
|
Merck & Co., Inc. |
17,891 |
1,089,383 |
|
|
Merck KGaA (Germany) |
872 |
93,253 |
|
|
Merrimack Pharmaceuticals, Inc. † S |
1,181 |
13,936 |
|
|
MiMedx Group, Inc. † |
1,068 |
11,054 |
|
|
Neurocrine Biosciences, Inc. † |
243 |
10,658 |
|
|
Novartis AG (Switzerland) |
2,586 |
265,520 |
|
|
Novo Nordisk A/S Class B (Denmark) |
3,527 |
196,944 |
|
|
Omega Healthcare Investors, Inc. R |
278 |
10,016 |
|
|
OncoMed Pharmaceuticals, Inc. † |
237 |
5,906 |
|
|
Ophthotech Corp. † |
259 |
12,955 |
|
|
OraSure Technologies, Inc. † |
1,874 |
11,600 |
|
|
Pacira Pharmaceuticals, Inc. † |
207 |
16,189 |
|
|
Pernix Therapeutics Holdings † |
1,895 |
12,071 |
|
|
Pfizer, Inc. |
34,356 |
1,193,871 |
|
|
POZEN, Inc. † |
2,822 |
18,202 |
|
|
Press Ganey Holdings, Inc. † |
118 |
3,228 |
|
|
Prestige Brands Holdings, Inc. † |
308 |
13,527 |
|
|
Prothena Corp. PLC (Ireland) † S |
897 |
35,378 |
|
|
Providence Service Corp. (The) † |
385 |
18,503 |
|
|
PTC Therapeutics, Inc. † |
195 |
11,328 |
|
|
Puma Biotechnology, Inc. † |
46 |
8,991 |
|
|
RadNet, Inc. † |
1,494 |
9,726 |
|
|
Ramsay Health Care, Ltd. (Australia) |
2,184 |
105,680 |
|
|
Receptos, Inc. † |
191 |
31,494 |
|
|
Repligen Corp. † |
545 |
22,214 |
|
|
Retrophin, Inc. † |
296 |
9,365 |
|
|
Roche Holding AG-Genusschein (Switzerland) |
1,074 |
315,624 |
|
|
Rockwell Medical, Inc. † |
1,896 |
20,989 |
|
|
Sage Therapeutics, Inc. † |
118 |
8,835 |
|
|
Sanofi (France) |
1,874 |
183,490 |
|
|
Select Medical Holdings Corp. |
1,681 |
27,484 |
|
|
Shionogi & Co., Ltd. (Japan) |
3,300 |
116,045 |
|
|
Shire PLC (United Kingdom) |
1,115 |
96,030 |
|
|
Sientra, Inc. † |
240 |
5,407 |
|
|
Spectranetics Corp. (The) † |
512 |
12,713 |
|
|
STAAR Surgical Co. † |
846 |
7,902 |
|
|
Steris Corp. |
145 |
9,690 |
|
|
Sucampo Pharmaceuticals, Inc. Class A † |
783 |
12,708 |
|
|
Surgical Care Affiliates, Inc. † |
550 |
20,895 |
|
|
TESARO, Inc. † |
222 |
13,045 |
|
|
Teva Pharmaceutical Industries, Ltd. ADR (Israel) |
1,726 |
103,733 |
|
|
Threshold Pharmaceuticals, Inc. † |
1,294 |
5,034 |
Dynamic Risk Allocation Fund 31
|
COMMON STOCKS (40.5%)* cont. |
Shares |
Value |
|
|
Health care cont. |
|||
|
Trevena, Inc. † |
642 |
$4,468 |
|
|
Trinity Biotech PLC ADR (Ireland) |
319 |
5,519 |
|
|
Triple-S Management Corp. Class B (Puerto Rico) † |
438 |
10,512 |
|
|
uniQure BV (Netherlands) † |
255 |
7,329 |
|
|
Ventas, Inc. R |
3,478 |
231,357 |
|
|
WellCare Health Plans, Inc. † |
238 |
20,389 |
|
|
West Pharmaceutical Services, Inc. |
532 |
28,802 |
|
|
XenoPort, Inc. † |
2,136 |
12,731 |
|
|
11,258,960 |
|||
|
Insurance (2.0%) |
|||
|
Ageas (Belgium) |
3,415 |
127,899 |
|
|
AIA Group, Ltd. (Hong Kong) |
30,400 |
199,654 |
|
|
Allianz SE (Germany) |
1,154 |
180,927 |
|
|
Allied World Assurance Co. Holdings AG |
771 |
32,760 |
|
|
American Equity Investment Life Holding Co. |
1,009 |
25,639 |
|
|
Amtrust Financial Services, Inc. S |
509 |
30,632 |
|
|
Assicurazioni Generali SpA (Italy) |
7,503 |
145,116 |
|
|
AXA SA (France) |
4,311 |
108,497 |
|
|
Axis Capital Holdings, Ltd. |
1,957 |
107,713 |
|
|
Berkshire Hathaway, Inc. Class B † |
7,760 |
1,109,680 |
|
|
Chubb Corp. (The) |
1,451 |
141,473 |
|
|
CNO Financial Group, Inc. |
1,073 |
19,314 |
|
|
CNP Assurances (France) |
9,338 |
154,403 |
|
|
Employers Holdings, Inc. |
1,254 |
28,365 |
|
|
Everest Re Group, Ltd. |
819 |
148,657 |
|
|
Federated National Holding Co. |
1,252 |
32,151 |
|
|
Genworth Financial, Inc. Class A † |
1,989 |
15,793 |
|
|
HCI Group, Inc. |
549 |
23,733 |
|
|
Heritage Insurance Holdings, Inc. † |
1,266 |
26,586 |
|
|
Legal & General Group PLC (United Kingdom) |
32,615 |
132,498 |
|
|
Maiden Holdings, Ltd. (Bermuda) |
869 |
12,149 |
|
|
Muenchener Rueckversicherungs-Gesellschaft AG in Muenchen (Germany) |
416 |
76,758 |
|
|
PartnerRe, Ltd. |
1,027 |
134,979 |
|
|
Prudential PLC (United Kingdom) |
4,133 |
102,776 |
|
|
RenaissanceRe Holdings, Ltd. |
925 |
94,452 |
|
|
Swiss Life Holding AG (Switzerland) |
435 |
104,370 |
|
|
Symetra Financial Corp. |
869 |
21,256 |
|
|
Travelers Cos., Inc. (The) |
5,991 |
605,810 |
|
|
United Insurance Holdings Corp. |
1,769 |
25,509 |
|
|
XL Group PLC |
6,227 |
234,633 |
|
|
4,204,182 |
|||
|
Investment banking/Brokerage (0.1%) |
|||
|
Ashford, Inc. † |
20 |
1,930 |
|
|
Deutsche Bank AG (Germany) |
2,813 |
84,699 |
|
|
Gain Capital Holdings, Inc. |
1,400 |
13,020 |
|
|
KCG Holdings, Inc. Class A † |
1,971 |
26,589 |
|
|
Oppenheimer Holdings, Inc. Class A |
521 |
13,515 |
|
|
139,753 |
32 Dynamic Risk Allocation Fund
|
COMMON STOCKS (40.5%)* cont. |
Shares |
Value |
|
|
Real estate (5.3%) |
|||
|
AG Mortgage Investment Trust, Inc. R |
245 |
$4,616 |
|
|
Agree Realty Corp. R |
401 |
12,154 |
|
|
Alexandria Real Estate Equities, Inc. R |
3,747 |
347,459 |
|
|
American Campus Communities, Inc. R |
2,407 |
93,897 |
|
|
American Capital Agency Corp. R |
8,040 |
167,714 |
|
|
American Realty Capital Properties, Inc. R |
5,272 |
46,763 |
|
|
Apartment Investment & Management Co. Class A R |
4,584 |
173,871 |
|
|
Apollo Commercial Real Estate Finance, Inc. R |
637 |
10,937 |
|
|
Apollo Residential Mortgage, Inc. R |
1,056 |
16,812 |
|
|
Arlington Asset Investment Corp. Class A |
272 |
5,628 |
|
|
ARMOUR Residential REIT, Inc. R |
1,303 |
3,896 |
|
|
Ashford Hospitality Trust, Inc. R |
1,628 |
14,001 |
|
|
AvalonBay Communities, Inc. R |
2,656 |
442,224 |
|
|
Boston Properties, Inc. R |
3,282 |
426,758 |
|
|
Brixmor Property Group, Inc. R |
8,653 |
214,421 |
|
|
Camden Property Trust R |
2,826 |
211,893 |
|
|
Campus Crest Communities, Inc. R |
1,962 |
11,105 |
|
|
CBL & Associates Properties, Inc. R |
556 |
9,813 |
|
|
Corporate Office Properties Trust R |
6,211 |
159,436 |
|
|
CYS Investments, Inc. R |
850 |
7,608 |
|
|
DDR Corp. R |
820 |
13,874 |
|
|
Dexus Property Group (Australia) R |
17,092 |
104,132 |
|
|
DiamondRock Hospitality Co. R |
12,671 |
166,877 |
|
|
Digital Realty Trust, Inc. R |
715 |
47,219 |
|
|
Duke Realty Corp. R |
9,970 |
195,013 |
|
|
DuPont Fabros Technology, Inc. R |
8,036 |
259,081 |
|
|
EPR Properties R |
237 |
13,668 |
|
|
Equity Residential Trust R |
6,524 |
484,864 |
|
|
Essex Property Trust, Inc. R |
564 |
125,558 |
|
|
Extra Space Storage, Inc. R |
449 |
31,443 |
|
|
Federal Realty Investment Trust R |
433 |
58,226 |
|
|
First Industrial Realty Trust R |
533 |
10,399 |
|
|
General Growth Properties R |
13,284 |
376,336 |
|
|
Hammerson PLC (United Kingdom) R |
7,850 |
80,206 |
|
|
HCP, Inc. R |
14,169 |
548,624 |
|
|
Health Care REIT, Inc. R |
8,216 |
577,256 |
|
|
Healthcare Realty Trust, Inc. R |
5,703 |
135,845 |
|
|
Hersha Hospitality Trust R |
1,696 |
10,787 |
|
|
Highwoods Properties, Inc. R |
4,484 |
188,104 |
|
|
Invesco Mortgage Capital, Inc. R |
374 |
5,935 |
|
|
Investors Real Estate Trust R |
1,202 |
8,702 |
|
|
Kimco Realty Corp. R |
11,481 |
275,085 |
|
|
Lexington Realty Trust R |
2,265 |
20,793 |
|
|
Liberty Property Trust R |
4,935 |
172,429 |
|
|
LTC Properties, Inc. R |
551 |
23,192 |
|
|
Macerich Co. (The) R |
1,125 |
92,374 |
|
|
Medical Properties Trust, Inc. R |
15,610 |
211,672 |
|
|
MFA Financial, Inc. R |
1,402 |
11,132 |
Dynamic Risk Allocation Fund 33
|
COMMON STOCKS (40.5%)* cont. |
Shares |
Value |
|
|
Real estate cont. |
|||
|
Mid-America Apartment Communities, Inc. R |
203 |
$15,507 |
|
|
National Health Investors, Inc. R |
2,563 |
169,517 |
|
|
One Liberty Properties, Inc. R |
570 |
12,654 |
|
|
Post Properties, Inc. R |
2,705 |
153,671 |
|
|
Prologis, Inc. R |
10,291 |
407,421 |
|
|
Public Storage R |
4,288 |
829,900 |
|
|
Ramco-Gershenson Properties Trust R |
643 |
11,072 |
|
|
Realty Income Corp. R |
1,850 |
84,305 |
|
|
Regency Centers Corp. R |
204 |
12,881 |
|
|
Scentre Group (Australia) R |
38,088 |
114,570 |
|
|
Sekisui Chemical Co., Ltd. (Japan) |
9,000 |
121,169 |
|
|
Select Income REIT R |
450 |
10,548 |
|
|
Simon Property Group, Inc. R |
5,337 |
968,132 |
|
|
SL Green Realty Corp. R |
768 |
91,131 |
|
|
Spirit Realty Capital, Inc. R |
14,416 |
155,549 |
|
|
Starwood Property Trust, Inc. R |
5,036 |
120,310 |
|
|
Summit Hotel Properties, Inc. R |
1,492 |
19,933 |
|
|
Sunstone Hotel Investors, Inc. R |
11,901 |
181,609 |
|
|
Taubman Centers, Inc. R |
3,857 |
285,534 |
|
|
Tokyo Tatemono Co., Ltd. (Japan) |
18,000 |
139,167 |
|
|
UDR, Inc. R |
1,289 |
41,970 |
|
|
Universal Health Realty Income Trust R |
123 |
5,892 |
|
|
Vornado Realty Trust R |
1,788 |
178,603 |
|
|
Washington Real Estate Investment Trust R |
4,380 |
109,719 |
|
|
Weingarten Realty Investors R |
5,649 |
190,541 |
|
|
Westfield Corp. (Australia) R |
14,653 |
107,669 |
|
|
Wheelock and Co., Ltd. (Hong Kong) |
35,000 |
187,670 |
|
|
WP Carey, Inc. R |
287 |
18,279 |
|
|
11,374,755 |
|||
|
Technology (5.1%) |
|||
|
A10 Networks, Inc. † |
2,223 |
13,449 |
|
|
Accenture PLC Class A |
8,526 |
818,837 |
|
|
Advanced Energy Industries, Inc. † |
989 |
28,206 |
|
|
Analog Devices, Inc. |
4,291 |
291,616 |
|
|
Apigee Corp. † |
605 |
8,500 |
|
|
Apple, Inc. |
7,451 |
970,716 |
|
|
Aspen Technology, Inc. † |
310 |
13,268 |
|
|
AVG Technologies NV (Netherlands) † |
458 |
11,230 |
|
|
Barracuda Networks, Inc. † |
304 |
11,959 |
|
|
Blackbaud, Inc. |
266 |
13,635 |
|
|
Broadcom Corp. Class A |
12,063 |
685,782 |
|
|
Brocade Communications Systems, Inc. |
3,321 |
41,064 |
|
|
Brother Industries, Ltd. (Japan) |
7,100 |
110,807 |
|
|
CACI International, Inc. Class A † |
339 |
29,025 |
|
|
Cavium, Inc. † |
94 |
6,615 |
|
|
Ceva, Inc. † |
801 |
16,453 |
|
|
Cirrus Logic, Inc. † |
368 |
13,892 |
|
|
Cisco Systems, Inc. |
37,252 |
1,091,856 |
|
|
Computer Sciences Corp. |
3,249 |
222,881 |
34 Dynamic Risk Allocation Fund
|
COMMON STOCKS (40.5%)* cont. |
Shares |
Value |
|
|
Technology cont. |
|||
|
Constant Contact, Inc. † |
295 |
$8,042 |
|
|
Cornerstone OnDemand, Inc. † |
298 |
9,277 |
|
|
Cray, Inc. † |
361 |
11,039 |
|
|
Cypress Semiconductor Corp. † |
2,674 |
36,714 |
|
|
DSP Group, Inc. † |
1,863 |
20,828 |
|
|
eBay, Inc. † |
15,841 |
972,004 |
|
|
EMC Corp. |
31,198 |
821,755 |
|
|
EnerSys |
551 |
36,719 |
|
|
Engility Holdings, Inc. |
742 |
20,717 |
|
|
Fairchild Semiconductor International, Inc. † |
594 |
11,832 |
|
|
FANUC Corp. (Japan) |
1,100 |
241,736 |
|
|
Fidelity National Information Services, Inc. |
2,895 |
181,517 |
|
|
Fiserv, Inc. † |
3,607 |
289,101 |
|
|
FUJIFILM Holdings Corp. (Japan) |
3,400 |
129,699 |
|
|
Fujitsu, Ltd. (Japan) |
15,000 |
83,872 |
|
|
Gentex Corp. |
6,619 |
113,714 |
|
|
Glu Mobile, Inc. † |
4,765 |
30,877 |
|
|
Hoya Corp. (Japan) |
5,600 |
205,830 |
|
|
Infineon Technologies AG (Germany) |
10,344 |
134,853 |
|
|
Intuit, Inc. |
5,164 |
537,831 |
|
|
Iron Mountain, Inc. R |
5,647 |
205,946 |
|
|
Ixia † |
2,173 |
27,336 |
|
|
L-3 Communications Holdings, Inc. |
1,996 |
235,149 |
|
|
Lexmark International, Inc. Class A |
275 |
12,645 |
|
|
Linear Technology Corp. |
2,572 |
123,070 |
|
|
Manhattan Associates, Inc. † |
321 |
17,607 |
|
|
Maxim Integrated Products, Inc. |
6,440 |
225,851 |
|
|
MAXIMUS, Inc. |
187 |
12,224 |
|
|
Mellanox Technologies, Ltd. (Israel) † |
267 |
13,435 |
|
|
Mentor Graphics Corp. |
1,323 |
34,544 |
|
|
Microsemi Corp. † |
355 |
12,918 |
|
|
Microsoft Corp. |
1,813 |
84,957 |
|
|
MobileIron, Inc. † |
934 |
5,623 |
|
|
Monolithic Power Systems, Inc. |
184 |
10,046 |
|
|
Motorola Solutions, Inc. |
813 |
47,967 |
|
|
MTS Systems Corp. |
128 |
8,709 |
|
|
NetApp, Inc. |
7,092 |
236,873 |
|
|
Netscout Systems, Inc. † |
112 |
4,489 |
|
|
NIC, Inc. |
387 |
6,521 |
|
|
Nimble Storage, Inc. † |
336 |
8,696 |
|
|
NTT Data Corp. (Japan) |
1,500 |
66,367 |
|
|
ON Semiconductor Corp. † |
1,011 |
13,406 |
|
|
Pandora Media, Inc. † |
386 |
7,207 |
|
|
Paychex, Inc. |
7,387 |
364,992 |
|
|
Perficient, Inc. † |
699 |
13,225 |
|
|
Plexus Corp. † |
602 |
27,379 |
|
|
Power Integrations, Inc. |
221 |
11,218 |
|
|
Proofpoint, Inc. † |
217 |
12,831 |
Dynamic Risk Allocation Fund 35
|
COMMON STOCKS (40.5%)* cont. |
Shares |
Value |
|
|
Technology cont. |
|||
|
PROS Holdings, Inc. † |
335 |
$6,449 |
|
|
QAD, Inc. Class A |
604 |
14,436 |
|
|
QLogic Corp. † |
3,276 |
50,844 |
|
|
Qorvo, Inc. † |
578 |
47,483 |
|
|
Quantum Corp. † |
6,541 |
13,344 |
|
|
Rovi Corp. † |
659 |
11,045 |
|
|
Sanmina Corp. † |
580 |
12,563 |
|
|
SAP AG (Germany) |
874 |
64,689 |
|
|
Semtech Corp. † |
345 |
7,369 |
|
|
SoftBank Corp. (Japan) |
2,500 |
149,240 |
|
|
SS&C Technologies Holdings, Inc. |
291 |
17,149 |
|
|
Synaptics, Inc. † |
606 |
60,382 |
|
|
Synchronoss Technologies, Inc. † |
278 |
12,243 |
|
|
SYNNEX Corp. |
254 |
20,998 |
|
|
Tyler Technologies, Inc. † |
141 |
17,129 |
|
|
Ultimate Software Group, Inc. † |
84 |
13,590 |
|
|
Veeva Systems, Inc. Class A † |
390 |
10,577 |
|
|
VeriFone Systems, Inc. † |
470 |
17,940 |
|
|
Verint Systems, Inc. † |
296 |
19,142 |
|
|
Web.com Group, Inc. † |
859 |
19,474 |
|
|
Woodward, Inc. |
650 |
33,111 |
|
|
Xcerra Corp. † |
2,934 |
22,650 |
|
|
10,790,826 |
|||
|
Transportation (0.8%) |
|||
|
Aegean Marine Petroleum Network, Inc. (Greece) |
2,036 |
28,952 |
|
|
ANA Holdings, Inc. (Japan) |
66,000 |
181,517 |
|
|
ArcBest Corp. |
622 |
21,266 |
|
|
CH Robinson Worldwide, Inc. |
3,351 |
206,857 |
|
|
ComfortDelgro Corp., Ltd. (Singapore) |
55,200 |
125,207 |
|
|
Deutsche Post AG (Germany) |
3,205 |
96,608 |
|
|
Expeditors International of Washington, Inc. |
1,164 |
53,358 |
|
|
Hawaiian Holdings, Inc. † |
1,421 |
34,417 |
|
|
JetBlue Airways Corp. † |
1,646 |
33,183 |
|
|
Matson, Inc. |
205 |
8,257 |
|
|
Saia, Inc. † |
549 |
22,476 |
|
|
Scorpio Tankers, Inc. |
1,574 |
14,355 |
|
|
Swift Transportation Co. † |
1,844 |
42,910 |
|
|
United Parcel Service, Inc. Class B |
8,581 |
851,407 |
|
|
Universal Truckload Services, Inc. |
67 |
1,356 |
|
|
1,722,126 |
|||
|
Utilities and power (1.6%) |
|||
|
Alliant Energy Corp. |
1,033 |
63,323 |
|
|
American Electric Power Co., Inc. |
7,549 |
424,933 |
|
|
American Water Works Co., Inc. |
2,171 |
114,781 |
|
|
Centrica PLC (United Kingdom) |
22,540 |
95,634 |
|
|
Enel SpA (Italy) |
26,344 |
127,829 |
|
|
ENI SpA (Italy) |
5,931 |
106,765 |
|
|
Kinder Morgan, Inc. |
20,402 |
846,479 |
|
|
Pinnacle West Capital Corp. |
2,518 |
153,397 |
36 Dynamic Risk Allocation Fund
|
COMMON STOCKS (40.5%)* cont. |
Shares |
Value |
|
|
Utilities and power cont. |
|||
|
Power Assets Holdings, Ltd. (Hong Kong) |
11,000 |
$105,288 |
|
|
Red Electrica Corporacion SA (Spain) |
2,525 |
212,372 |
|
|
Southern Co. (The) |
14,946 |
652,991 |
|
|
Tokyo Electric Power Co., Inc. (Japan) † |
28,800 |
163,934 |
|
|
Tokyo Gas Co., Ltd. (Japan) |
30,000 |
165,230 |
|
|
United Utilities Group PLC (United Kingdom) |
9,080 |
138,224 |
|
|
3,371,180 |
|||
|
Total common stocks (cost $75,246,759) |
|
||
|
CORPORATE BONDS AND NOTES (21.9%)* |
Principal |
Value |
||
|
Basic materials (1.7%) |
||||
|
A Schulman, Inc. 144A company guaranty sr. unsec. unsub. notes 6 7/8s, 2023 |
$90,000 |
$91,800 |
||
|
Agrium, Inc. sr. unsec. notes 3 3/8s, 2025 (Canada) |
40,000 |
39,115 |
||
|
Agrium, Inc. sr. unsec. unsub. 5 1/4s, 2045 (Canada) |
10,000 |
10,545 |
||
|
Alcoa, Inc. sr. unsec. unsub. notes 5.4s, 2021 |
10,000 |
10,875 |
||
|
Alcoa, Inc. sr. unsec. unsub. notes 5 1/8s, 2024 |
10,000 |
10,675 |
||
|
ArcelorMittal SA sr. unsec. bonds 10.6s, 2019 (France) |
85,000 |
103,275 |
||
|
ArcelorMittal SA sr. unsec. unsub. bonds 6 1/8s, 2025 (France) |
25,000 |
25,375 |
||
|
ArcelorMittal SA sr. unsec. unsub. notes 7 3/4s, 2039 (France) |
15,000 |
15,426 |
||
|
Archer-Daniels-Midland Co. sr. unsec. notes 5.45s, 2018 |
143,000 |
158,661 |
||
|
Boise Cascade Co. company guaranty sr. unsec. notes 6 3/8s, 2020 |
60,000 |
63,450 |
||
|
Celanese US Holdings, LLC company guaranty sr. unsec. unsub. notes 4 5/8s, 2022 (Germany) |
25,000 |
25,313 |
||
|
Celanese US Holdings, LLC sr. notes 5 7/8s, 2021 (Germany) |
140,000 |
151,900 |
||
|
CF Industries, Inc. company guaranty sr. unsec. notes 5 3/8s, 2044 |
15,000 |
15,555 |
||
|
CF Industries, Inc. company guaranty sr. unsec. notes 5.15s, 2034 |
10,000 |
10,496 |
||
|
Chemours Co. (The) 144A sr. unsec. notes 7s, 2025 |
20,000 |
20,350 |
||
|
Chemours Co. (The) 144A sr. unsec. notes 6 5/8s, 2023 |
55,000 |
55,825 |
||
|
Compass Minerals International, Inc. 144A company guaranty sr. unsec. notes 4 7/8s, 2024 |
50,000 |
50,375 |
||
|
CPG Merger Sub, LLC 144A company guaranty sr. unsec. unsub. notes 8s, 2021 |
65,000 |
68,250 |
||
|
Dow Chemical Co. (The) sr. unsec. unsub. notes 3 1/2s, 2024 |
70,000 |
69,767 |
||
|
Eastman Chemical Co. sr. unsec. unsub. notes 3.8s, 2025 |
20,000 |
20,484 |
||
|
Eldorado Gold Corp. 144A sr. unsec. notes 6 1/8s, 2020 (Canada) |
15,000 |
14,746 |
||
|
First Quantum Minerals, Ltd. 144A company guaranty sr. unsec. notes 7s, 2021 (Canada) |
30,000 |
29,063 |
||
|
Glencore Funding, LLC 144A company guaranty sr. unsec. unsub. notes 4s, 2025 |
194,000 |
187,053 |
||
|
Glencore Funding, LLC 144A company guaranty sr. unsec. unsub. notes 2 7/8s, 2020 |
130,000 |
129,358 |
||
|
HD Supply, Inc. company guaranty sr. unsec. notes 7 1/2s, 2020 |
75,000 |
81,094 |
||
|
HD Supply, Inc. company guaranty sr. unsec. unsub. notes 11 1/2s, 2020 |
35,000 |
40,950 |
Dynamic Risk Allocation Fund 37
|
CORPORATE BONDS AND NOTES (21.9%)* cont. |
Principal |
Value |
||
|
Basic materials cont. |
||||
|
HD Supply, Inc. 144A company guaranty sr. notes 5 1/4s, 2021 |
$70,000 |
$72,800 |
||
|
Hexion U.S. Finance Corp. company guaranty sr. notes 6 5/8s, 2020 |
10,000 |
9,425 |
||
|
HudBay Minerals, Inc. company guaranty sr. unsec. notes 9 1/2s, 2020 (Canada) |
115,000 |
122,763 |
||
|
Huntsman International, LLC company guaranty sr. unsec. unsub. notes 4 7/8s, 2020 |
105,000 |
106,575 |
||
|
Huntsman International, LLC 144A company guaranty sr. unsec. unsub. notes 5 1/8s, 2022 |
15,000 |
15,038 |
||
|
JM Huber Corp. 144A sr. unsec. notes 9 7/8s, 2019 |
90,000 |
96,863 |
||
|
JMC Steel Group, Inc. 144A sr. unsec. notes 8 1/4s, 2018 |
30,000 |
27,150 |
||
|
Louisiana-Pacific Corp. company guaranty sr. unsec. unsub. notes 7 1/2s, 2020 |
60,000 |
64,200 |
||
|
LyondellBasell Industries NV sr. unsec. unsub. notes 4 5/8s, 2055 |
25,000 |
22,822 |
||
|
Mercer International, Inc. company guaranty sr. unsec. notes 7 3/4s, 2022 (Canada) |
55,000 |
59,263 |
||
|
Methanex Corp. sr. unsec. unsub. notes 5.65s, 2044 (Canada) |
30,000 |
30,229 |
||
|
Momentive Performance Materials, Inc. company guaranty sr. notes 3.88s, 2021 |
45,000 |
40,556 |
||
|
Momentive Performance Materials, Inc. escrow company guaranty sr. notes 8 7/8s, 2020 F |
45,000 |
— |
||
|
Monsanto Company sr. unsec. notes 5 1/2s, 2025 |
60,000 |
70,519 |
||
|
New Gold, Inc. 144A sr. unsec. notes 6 1/4s, 2022 (Canada) |
35,000 |
35,175 |
||
|
Norbord, Inc. 144A company guaranty sr. notes 6 1/4s, 2023 (Canada) |
45,000 |
45,791 |
||
|
Platform Specialty Products Corp. 144A sr. unsec. notes 6 1/2s, 2022 |
45,000 |
47,250 |
||
|
PQ Corp. 144A sr. notes 8 3/4s, 2018 |
60,000 |
62,100 |
||
|
Rio Tinto Finance USA PLC company guaranty sr. unsec. unsub. notes 1 5/8s, 2017 (United Kingdom) |
145,000 |
145,384 |
||
|
Rockwood Specialties Group, Inc. company guaranty sr. unsec. notes 4 5/8s, 2020 |
160,000 |
167,000 |
||
|
Ryerson, Inc./Joseph T Ryerson & Son, Inc. company guaranty sr. notes 9s, 2017 |
65,000 |
66,138 |
||
|
SBA Communications Corp. 144A sr. unsec. notes 4 7/8s, 2022 |
45,000 |
45,257 |
||
|
Sealed Air Corp. 144A company guaranty sr. unsec. notes 8 3/8s, 2021 |
25,000 |
28,125 |
||
|
Sealed Air Corp. 144A company guaranty sr. unsec. notes 6 7/8s, 2033 |
15,000 |
15,600 |
||
|
Sealed Air Corp. 144A sr. unsec. notes 6 1/2s, 2020 |
45,000 |
50,175 |
||
|
Sealed Air Corp. 144A sr. unsec. notes 5 1/4s, 2023 |
50,000 |
51,750 |
||
|
Sealed Air Corp. 144A sr. unsec. notes 5 1/8s, 2024 |
25,000 |
25,438 |
||
|
Sealed Air Corp. 144A sr. unsec. notes 4 7/8s, 2022 |
20,000 |
20,150 |
||
|
Smurfit Kappa Treasury Funding, Ltd. company guaranty sr. unsub. notes 7 1/2s, 2025 (Ireland) |
40,000 |
49,700 |
||
|
Steel Dynamics, Inc. company guaranty sr. unsec. unsub. notes 5 1/2s, 2024 |
30,000 |
30,938 |
||
|
Steel Dynamics, Inc. company guaranty sr. unsec. unsub. notes 5 1/4s, 2023 |
33,000 |
33,743 |
38 Dynamic Risk Allocation Fund
|
CORPORATE BONDS AND NOTES (21.9%)* cont. |
Principal |
Value |
||
|
Basic materials cont. |
||||
|
Steel Dynamics, Inc. company guaranty sr. unsec. unsub. notes 5 1/8s, 2021 |
$10,000 |
$10,125 |
||
|
TMS International Corp. 144A company guaranty sr. unsec. notes 7 5/8s, 2021 |
55,000 |
54,313 |
||
|
USG Corp. 144A company guaranty sr. unsec. notes 5 7/8s, 2021 |
10,000 |
10,713 |
||
|
USG Corp. 144A company guaranty sr. unsec. notes 5 1/2s, 2025 |
50,000 |
51,750 |
||
|
Weekley Homes, LLC/Weekley Finance Corp. sr. unsec. bonds 6s, 2023 |
40,000 |
38,100 |
||
|
Westvaco Corp. company guaranty sr. unsec. unsub. notes 8.2s, 2030 |
30,000 |
41,413 |
||
|
Westvaco Corp. company guaranty sr. unsec. unsub. notes 7.95s, 2031 |
29,000 |
37,643 |
||
|
WR Grace & Co.- Conn. 144A company guaranty sr. unsec. notes 5 5/8s, 2024 |
75,000 |
78,938 |
||
|
WR Grace & Co.- Conn. 144A company guaranty sr. unsec. notes 5 1/8s, 2021 |
35,000 |
36,138 |
||
|
3,516,826 |
||||
|
Capital goods (0.9%) |
||||
|
ADS Waste Holdings, Inc. company guaranty sr. unsec. notes 8 1/4s, 2020 |
130,000 |
136,988 |
||
|
American Axle & Manufacturing, Inc. company guaranty sr. unsec. notes 7 3/4s, 2019 |
10,000 |
11,400 |
||
|
Amstead Industries, Inc. 144A company guaranty sr. unsec. notes 5 3/8s, 2024 |
40,000 |
40,400 |
||
|
Amstead Industries, Inc. 144A company guaranty sr. unsec. notes 5s, 2022 |
25,000 |
25,375 |
||
|
Belden, Inc. 144A company guaranty sr. unsec. sub. notes 5 1/2s, 2022 |
25,000 |
25,625 |
||
|
Belden, Inc. 144A company guaranty sr. unsec. sub. notes 5 1/4s, 2024 |
30,000 |
29,925 |
||
|
Berry Plastics Corp. company guaranty notes 5 1/2s, 2022 |
20,000 |
20,463 |
||
|
Berry Plastics Corp. company guaranty unsub. notes 5 1/8s, 2023 |
25,000 |
24,875 |
||
|
Bombardier, Inc. 144A sr. unsec. notes 7 1/2s, 2025 (Canada) |
35,000 |
33,469 |
||
|
Briggs & Stratton Corp. company guaranty sr. unsec. notes 6 7/8s, 2020 |
80,000 |
88,000 |
||
|
Covidien International Finance SA company guaranty sr. unsec. unsub. notes 6s, 2017 (Luxembourg) |
145,000 |
160,837 |
||
|
Crown Americas, LLC/Crown Americas Capital Corp. IV company guaranty sr. unsec. notes 4 1/2s, 2023 |
60,000 |
59,250 |
||
|
Crown Cork & Seal Co., Inc. sr. unsec. bonds 7 3/8s, 2026 |
35,000 |
40,250 |
||
|
Delphi Corp. company guaranty sr. unsec. unsub. notes 5s, 2023 |
100,000 |
107,688 |
||
|
DH Services Luxembourg Sarl 144A company guaranty sr. unsec. notes 7 3/4s, 2020 (Luxembourg) |
65,000 |
68,250 |
||
|
Gates Global, LLC/Gates Global Co. 144A sr. unsec. notes 6s, 2022 |
90,000 |
82,800 |
||
|
Huntington Ingalls Industries, Inc. 144A company guaranty sr. unsec. notes 5s, 2021 |
25,000 |
26,000 |
||
|
KLX, Inc. 144A company guaranty sr. unsec. unsub. notes 5 7/8s, 2022 |
20,000 |
20,250 |
Dynamic Risk Allocation Fund 39
|
CORPORATE BONDS AND NOTES (21.9%)* cont. |
Principal |
Value |
||
|
Capital goods cont. |
||||
|
Legrand France SA sr. unsec. unsub. debs 8 1/2s, 2025 (France) |
$15,000 |
$20,844 |
||
|
Manitowoc Co., Inc. (The) company guaranty sr. unsec. notes 5 7/8s, 2022 |
80,000 |
86,400 |
||
|
MasTec, Inc. company guaranty sr. unsec. unsub. notes 4 7/8s, 2023 |
52,000 |
48,490 |
||
|
Moog, Inc. 144A company guaranty sr. unsec. notes 5 1/4s, 2022 |
25,000 |
25,750 |
||
|
Novelis, Inc. company guaranty sr. unsec. notes 8 3/4s, 2020 |
20,000 |
21,306 |
||
|
Oshkosh Corp. company guaranty sr. unsec. notes 5 3/8s, 2022 |
135,000 |
140,738 |
||
|
Oshkosh Corp. 144A company guaranty sr. unsec. notes 5 3/8s, 2025 |
30,000 |
31,050 |
||
|
Owens-Brockway Glass Container, Inc. 144A company guaranty sr. unsec. notes 5 3/8s, 2025 |
50,000 |
50,375 |
||
|
Pittsburgh Glass Works, LLC 144A company guaranty sr. notes 8s, 2018 |
96,000 |
101,040 |
||
|
Tenneco, Inc. company guaranty sr. unsec. unsub. notes 5 3/8s, 2024 |
65,000 |
67,600 |
||
|
Terex Corp. company guaranty sr. unsec. unsub. notes 6 1/2s, 2020 |
30,000 |
31,425 |
||
|
Terex Corp. company guaranty sr. unsec. unsub. notes 6s, 2021 |
153,000 |
155,678 |
||
|
TransDigm, Inc. company guaranty sr. unsec. sub. notes 7 1/2s, 2021 |
60,000 |
64,950 |
||
|
TransDigm, Inc. company guaranty sr. unsec. sub. notes 6 1/2s, 2024 |
85,000 |
86,700 |
||
|
1,934,191 |
||||
|
Communication services (2.6%) |
||||
|
Altice SA 144A company guaranty sr. notes 7 3/4s, 2022 (Luxembourg) |
200,000 |
202,000 |
||
|
American Tower Corp. sr. unsec. notes 4s, 2025 R |
85,000 |
84,499 |
||
|
AT&T, Inc. sr. unsec. notes 4 3/4s, 2046 |
67,000 |
63,801 |
||
|
AT&T, Inc. sr. unsec. unsub. notes 3.4s, 2025 |
68,000 |
66,137 |
||
|
AT&T, Inc. sr. unsec. unsub. notes 1.7s, 2017 |
145,000 |
145,829 |
||
|
CCO Holdings, LLC/CCO Holdings Capital Corp. company guaranty sr. unsec. notes 6 1/2s, 2021 |
45,000 |
47,306 |
||
|
CCO Holdings, LLC/CCO Holdings Capital Corp. company guaranty sr. unsec. notes 5 1/4s, 2022 |
195,000 |
199,144 |
||
|
CCO Holdings, LLC/CCO Holdings Capital Corp. company guaranty sr. unsec. unsub. bonds 5 1/8s, 2023 |
25,000 |
25,125 |
||
|
CenturyLink, Inc. sr. unsec. unsub. notes 6 3/4s, 2023 |
85,000 |
90,738 |
||
|
CenturyLink, Inc. sr. unsec. unsub. notes 5 5/8s, 2020 |
15,000 |
15,656 |
||
|
Comcast Corp. company guaranty sr. unsec. unsub. bonds 6 1/2s, 2017 |
145,000 |
157,785 |
||
|
Comcast Corp. company guaranty sr. unsec. unsub. notes 6.95s, 2037 |
30,000 |
39,960 |
||
|
Comcast Corp. company guaranty sr. unsec. unsub. notes 6 1/2s, 2035 |
85,000 |
109,079 |
||
|
CommScope Technologies Finance, LLC 144A sr. unsec. notes 6s, 2025 |
40,000 |
40,500 |
||
|
Crown Castle International Corp. sr. unsec. notes 5 1/4s, 2023 R |
115,000 |
121,239 |
||
|
Crown Castle International Corp. sr. unsec. unsub. notes 4 7/8s, 2022 R |
25,000 |
26,000 |
40 Dynamic Risk Allocation Fund
|
CORPORATE BONDS AND NOTES (21.9%)* cont. |
Principal |
Value |
||
|
Communication services cont. |
||||
|
CSC Holdings, LLC sr. unsec. unsub. notes 6 3/4s, 2021 |
$220,000 |
$239,250 |
||
|
CSC Holdings, LLC 144A sr. unsec. notes 5 1/4s, 2024 |
35,000 |
34,256 |
||
|
Deutsche Telekom International Finance BV company guaranty 8 3/4s, 2030 (Netherlands) |
16,000 |
23,614 |
||
|
DISH DBS Corp. company guaranty sr. unsec. unsub. notes 5 7/8s, 2024 |
60,000 |
60,150 |
||
|
Frontier Communications Corp. sr. unsec. notes 8 1/8s, 2018 |
70,000 |
77,218 |
||
|
Frontier Communications Corp. sr. unsec. notes 6 1/4s, 2021 |
5,000 |
4,816 |
||
|
Frontier Communications Corp. sr. unsec. unsub. notes 7 5/8s, 2024 |
20,000 |
19,350 |
||
|
Intelsat Jackson Holdings SA company guaranty sr. unsec. bonds 6 5/8s, 2022 (Bermuda) |
20,000 |
18,600 |
||
|
Intelsat Jackson Holdings SA company guaranty sr. unsec. notes 7 1/2s, 2021 (Bermuda) |
315,000 |
319,725 |
||
|
Intelsat Luxembourg SA company guaranty sr. unsec. bonds 8 1/8s, 2023 (Luxembourg) |
55,000 |
48,950 |
||
|
Intelsat Luxembourg SA company guaranty sr. unsec. bonds 7 3/4s, 2021 (Luxembourg) |
110,000 |
99,275 |
||
|
Level 3 Communications, Inc. sr. unsec. unsub. notes 5 3/4s, 2022 |
20,000 |
20,425 |
||
|
Level 3 Financing, Inc. company guaranty sr. unsec. unsub. notes 6 1/8s, 2021 |
145,000 |
153,700 |
||
|
Level 3 Financing, Inc. company guaranty sr. unsec. unsub. notes 5 3/8s, 2022 |
45,000 |
45,900 |
||
|
Numericable Group SA 144A sr. notes 6s, 2022 (France) |
200,000 |
201,376 |
||
|
Quebecor Media, Inc. sr. unsec. unsub. notes 5 3/4s, 2023 (Canada) |
70,000 |
72,625 |
||
|
Quebecor Media, Inc. 144A sr. unsec. notes 7 3/8s, 2021 (Canada) |
CAD |
295,000 |
251,744 |
|
|
Qwest Corp. sr. unsec. notes 6 3/4s, 2021 |
$36,000 |
40,500 |
||
|
Sprint Communications, Inc. sr. unsec. unsub. notes 7s, 2020 |
330,000 |
336,188 |
||
|
Sprint Corp. company guaranty sr. unsec. notes 7 7/8s, 2023 |
120,000 |
122,028 |
||
|
Sprint Corp. company guaranty sr. unsec. notes 7 1/4s, 2021 |
195,000 |
196,219 |
||
|
T-Mobile USA, Inc. company guaranty sr. unsec. unsub. notes 6.836s, 2023 |
10,000 |
10,663 |
||
|
T-Mobile USA, Inc. company guaranty sr. unsec. unsub. notes 6.633s, 2021 |
25,000 |
26,625 |
||
|
T-Mobile USA, Inc. company guaranty sr. unsec. unsub. notes 6 5/8s, 2023 |
80,000 |
84,400 |
||
|
T-Mobile USA, Inc. company guaranty sr. unsec. unsub. notes 6.464s, 2019 |
25,000 |
25,828 |
||
|
T-Mobile USA, Inc. company guaranty sr. unsec. unsub. notes 6 3/8s, 2025 |
30,000 |
31,313 |
||
|
T-Mobile USA, Inc. company guaranty sr. unsec. unsub. notes 6 1/4s, 2021 |
75,000 |
79,031 |
||
|
T-Mobile USA, Inc. company guaranty sr. unsec. unsub. notes 6 1/8s, 2022 |
25,000 |
26,125 |
||
|
T-Mobile USA, Inc. company guaranty sr. unsec. unsub. notes 6s, 2023 |
20,000 |
20,763 |
||
|
Telefonica Emisiones SAU company guaranty sr. unsec. unsub. notes 7.045s, 2036 (Spain) |
220,000 |
283,337 |
Dynamic Risk Allocation Fund 41
|
CORPORATE BONDS AND NOTES (21.9%)* cont. |
Principal |
Value |
||
|
Communication services cont. |
||||
|
Verizon Communications, Inc. sr. unsec. notes 6.35s, 2019 |
$36,000 |
$41,470 |
||
|
Verizon Communications, Inc. sr. unsec. notes 2 5/8s, 2020 |
95,000 |
95,822 |
||
|
Verizon Communications, Inc. sr. unsec. unsub. notes 6.4s, 2033 |
64,000 |
75,274 |
||
|
Verizon Communications, Inc. sr. unsec. unsub. notes 4 1/2s, 2020 |
30,000 |
32,707 |
||
|
Verizon Communications, Inc. sr. unsec. unsub. notes 4.4s, 2034 |
30,000 |
28,874 |
||
|
Verizon Communications, Inc. 144A sr. unsec. unsub. notes 4.522s, 2048 |
328,000 |
299,642 |
||
|
Verizon New York, Inc. company guaranty sr. unsec. notes Ser. B, 7 3/8s, 2032 |
31,000 |
38,312 |
||
|
Vodafone Group PLC sr. unsec. unsub. notes 1 1/4s, 2017 (United Kingdom) |
251,000 |
248,231 |
||
|
West Corp. 144A company guaranty sr. unsec. notes 5 3/8s, 2022 |
45,000 |
43,538 |
||
|
WideOpenWest Finance, LLC/WideOpenWest Capital Corp. company guaranty sr. unsec. notes 10 1/4s, 2019 |
95,000 |
101,413 |
||
|
Windstream Holdings, Inc. company guaranty sr. unsec. unsub. notes 7 3/4s, 2021 |
90,000 |
85,050 |
||
|
Windstream Holdings, Inc. company guaranty sr. unsec. unsub. notes 6 3/8s, 2023 |
40,000 |
33,600 |
||
|
5,532,725 |
||||
|
Consumer cyclicals (3.1%) |
||||
|
21st Century Fox America, Inc. company guaranty sr. unsec. unsub. notes 7 3/4s, 2045 |
124,000 |
175,835 |
||
|
Amazon.com, Inc. sr. unsec. notes 1.2s, 2017 |
143,000 |
142,972 |
||
|
AMC Entertainment, Inc. company guaranty sr. sub. notes 9 3/4s, 2020 |
95,000 |
103,854 |
||
|
AMC Entertainment, Inc. company guaranty sr. unsec. sub. notes 5 7/8s, 2022 |
35,000 |
36,488 |
||
|
American Tire Distributors, Inc. 144A sr. unsec. sub. notes 10 1/4s, 2022 |
60,000 |
63,450 |
||
|
Autonation, Inc. company guaranty sr. unsec. unsub. notes 5 1/2s, 2020 |
105,000 |
115,369 |
||
|
Bed Bath & Beyond, Inc. sr. unsec. notes 5.165s, 2044 |
115,000 |
118,463 |
||
|
Bon-Ton Department Stores, Inc. (The) company guaranty notes 8s, 2021 |
50,000 |
40,500 |
||
|
Boyd Gaming Corp. company guaranty sr. unsec. sub. notes 6 7/8s, 2023 |
35,000 |
35,613 |
||
|
Brookfield Residential Properties, Inc. 144A company guaranty sr. unsec. notes 6 1/2s, 2020 (Canada) |
120,000 |
123,300 |
||
|
Brookfield Residential Properties, Inc./Brookfield Residential US Corp. 144A company guaranty sr. unsec. notes 6 1/8s, 2022 (Canada) |
35,000 |
35,361 |
||
|
Building Materials Corp. of America 144A sr. unsec. notes 6 3/4s, 2021 |
25,000 |
26,469 |
||
|
Building Materials Corp. of America 144A sr. unsec. notes 5 3/8s, 2024 |
95,000 |
95,771 |
||
|
CBS Corp. company guaranty sr. unsec. debs. 7 7/8s, 2030 |
137,000 |
183,917 |
||
|
Cedar Fair LP/Canada’s Wonderland Co./Magnum Management Corp. company guaranty sr. unsec. notes 5 3/8s, 2024 |
10,000 |
10,425 |
||
|
Cedar Fair LP/Canada’s Wonderland Co./Magnum Management Corp. company guaranty sr. unsec. notes 5 1/4s, 2021 |
45,000 |
47,025 |
42 Dynamic Risk Allocation Fund
|
CORPORATE BONDS AND NOTES (21.9%)* cont. |
Principal |
Value |
||
|
Consumer cyclicals cont. |
||||
|
Cinemark USA, Inc. company guaranty sr. unsec. notes 5 1/8s, 2022 |
$15,000 |
$15,300 |
||
|
Cinemark USA, Inc. company guaranty sr. unsec. notes 4 7/8s, 2023 |
25,000 |
25,093 |
||
|
Clear Channel Worldwide Holdings, Inc. company guaranty sr. unsec. notes 7 5/8s, 2020 |
50,000 |
52,875 |
||
|
Clear Channel Worldwide Holdings, Inc. company guaranty sr. unsec. unsub. notes 6 1/2s, 2022 |
35,000 |
37,056 |
||
|
Dana Holding Corp. sr. unsec. notes 5 1/2s, 2024 |
30,000 |
30,600 |
||
|
Dana Holding Corp. sr. unsec. unsub. notes 6s, 2023 |
55,000 |
58,163 |
||
|
Dana Holding Corp. sr. unsec. unsub. notes 5 3/8s, 2021 |
15,000 |
15,619 |
||
|
Dollar General Corp. sr. unsec. notes 3 1/4s, 2023 |
25,000 |
24,268 |
||
|
Family Tree Escrow, LLC 144A sr. unsec. unsub. notes 5 3/4s, 2023 |
20,000 |
21,100 |
||
|
Family Tree Escrow, LLC 144A sr. unsec. unsub. notes 5 1/4s, 2020 |
15,000 |
15,731 |
||
|
First Cash Financial Services, Inc. company guaranty sr. unsec. unsub. notes 6 3/4s, 2021 (Mexico) |
25,000 |
26,438 |
||
|
Ford Motor Co. sr. unsec. unsub. notes 9.98s, 2047 |
115,000 |
179,871 |
||
|
Ford Motor Co. sr. unsec. unsub. notes 7.45s, 2031 |
192,000 |
250,134 |
||
|
Gannett Co., Inc. company guaranty sr. unsec. bonds 5 1/8s, 2020 |
35,000 |
36,575 |
||
|
Gannett Co., Inc. company guaranty sr. unsec. bonds 5 1/8s, 2019 |
25,000 |
26,156 |
||
|
Gannett Co., Inc. 144A company guaranty sr. unsec. notes 4 7/8s, 2021 |
30,000 |
30,225 |
||
|
Garda World Security Corp. 144A company guaranty sr. unsec. unsub. notes 7 1/4s, 2021 (Canada) |
80,000 |
78,928 |
||
|
General Motors Co. sr. unsec. unsub. notes 6 1/4s, 2043 |
95,000 |
109,906 |
||
|
General Motors Co. sr. unsec. unsub. notes 5.2s, 2045 |
20,000 |
20,407 |
||
|
General Motors Financial Co., Inc. company guaranty sr. unsec. unsub. Notes 3.45s, 2022 |
85,000 |
83,706 |
||
|
General Motors Financial Co., Inc. company guaranty sr. unsec. unsub. notes 4s, 2025 |
10,000 |
9,935 |
||
|
Gibson Brands, Inc. 144A sr. notes 8 7/8s, 2018 |
40,000 |
41,050 |
||
|
GLP Capital LP/GLP Financing II, Inc. company guaranty sr. unsec. notes 4 7/8s, 2020 |
60,000 |
62,100 |
||
|
GLP Capital LP/GLP Financing II, Inc. company guaranty sr. unsec. notes 4 3/8s, 2018 |
35,000 |
36,225 |
||
|
Gray Television, Inc. company guaranty sr. unsec. notes 7 1/2s, 2020 |
60,000 |
63,900 |
||
|
Host Hotels & Resorts LP sr. unsec. unsub. notes 5 1/4s, 2022 R |
77,000 |
84,891 |
||
|
Howard Hughes Corp. (The) 144A sr. unsec. notes 6 7/8s, 2021 |
65,000 |
68,250 |
||
|
Igloo Holdings Corp. 144A sr. unsec. unsub. notes 8 1/4s, 2017 ‡‡ |
70,000 |
71,050 |
||
|
iHeartCommunications, Inc. company guaranty sr. notes 9s, 2019 |
330,000 |
324,225 |
||
|
INVISTA Finance, LLC 144A company guaranty sr. notes 4 1/4s, 2019 |
37,000 |
36,445 |
||
|
Isle of Capri Casinos, Inc. company guaranty sr. unsec. notes 5 7/8s, 2021 |
35,000 |
36,225 |
Dynamic Risk Allocation Fund 43
|
CORPORATE BONDS AND NOTES (21.9%)* cont. |
Principal |
Value |
||
|
Consumer cyclicals cont. |
||||
|
JC Penney Corp, Inc. company guaranty sr. unsec. bonds 8 1/8s, 2019 |
$10,000 |
$10,075 |
||
|
JC Penney Corp, Inc. company guaranty sr. unsec. notes 5 3/4s, 2018 |
15,000 |
14,813 |
||
|
JC Penney Corp, Inc. company guaranty sr. unsec. unsub. notes 5.65s, 2020 |
10,000 |
9,025 |
||
|
Jo-Ann Stores Holdings, Inc. 144A sr. unsec. notes 9 3/4s, 2019 ‡‡ |
40,000 |
38,200 |
||
|
Jo-Ann Stores, Inc. 144A sr. unsec. notes 8 1/8s, 2019 |
60,000 |
58,350 |
||
|
Johnson Controls, Inc. sr. unsec. notes 4.95s, 2064 |
35,000 |
35,069 |
||
|
L Brands, Inc. company guaranty sr. unsec. notes 6 5/8s, 2021 |
35,000 |
39,506 |
||
|
Lamar Media Corp. company guaranty sr. sub. notes 5 7/8s, 2022 |
50,000 |
52,750 |
||
|
Lamar Media Corp. company guaranty sr. unsec. notes 5 3/8s, 2024 |
20,000 |
20,650 |
||
|
Lender Processing Services, Inc./Black Knight Lending Solutions, Inc. company guaranty sr. unsec. unsub. notes 5 3/4s, 2023 |
30,000 |
31,800 |
||
|
Lennar Corp. company guaranty sr. unsec. unsub. notes 4 3/4s, 2022 |
110,000 |
109,038 |
||
|
Lennar Corp. company guaranty sr. unsec. unsub. notes 4 1/2s, 2019 |
25,000 |
25,625 |
||
|
Macy’s Retail Holdings, Inc. company guaranty sr. unsec. notes 4.3s, 2043 |
32,000 |
30,521 |
||
|
Macy’s Retail Holdings, Inc. company guaranty sr. unsec. unsub. notes 7s, 2028 |
25,000 |
31,800 |
||
|
Masonite International Corp. 144A company guaranty sr. unsec. notes 5 5/8s, 2023 |
20,000 |
20,700 |
||
|
Mattamy Group Corp. 144A sr. unsec. notes 6 1/2s, 2020 (Canada) |
60,000 |
58,200 |
||
|
Media General Financing Sub, Inc. 144A sr. unsec. notes 5 7/8s, 2022 |
15,000 |
15,375 |
||
|
MGM Resorts International company guaranty sr. unsec. notes 6 3/4s, 2020 |
40,000 |
43,350 |
||
|
MGM Resorts International company guaranty sr. unsec. notes 5 1/4s, 2020 |
55,000 |
56,650 |
||
|
MGM Resorts International company guaranty sr. unsec. unsub. notes 8 5/8s, 2019 |
125,000 |
143,750 |
||
|
MGM Resorts International company guaranty sr. unsec. unsub. notes 6 5/8s, 2021 |
5,000 |
5,375 |
||
|
MTR Gaming Group, Inc. company guaranty notes 11 1/2s, 2019 |
85,000 |
90,738 |
||
|
Navistar International Corp. sr. notes 8 1/4s, 2021 |
30,000 |
30,000 |
||
|
Neiman Marcus Group, LLC (The) company guaranty sr. notes 7 1/8s, 2028 |
80,000 |
82,000 |
||
|
Neiman Marcus Group, Ltd. 144A company guaranty sr. unsec. notes 8 3/4s, 2021 ‡‡ |
40,000 |
43,200 |
||
|
Neiman Marcus Group, Ltd. 144A company guaranty sr. unsec. notes 8s, 2021 |
30,000 |
32,175 |
||
|
Nielsen Co. Luxembourg Sarl (The) 144A company guaranty sr. unsec. notes 5 1/2s, 2021 (Luxembourg) |
95,000 |
97,494 |
||
|
Nordstrom, Inc. sr. unsec. notes 5s, 2044 |
15,000 |
16,765 |
44 Dynamic Risk Allocation Fund
|
CORPORATE BONDS AND NOTES (21.9%)* cont. |
Principal |
Value |
||
|
Consumer cyclicals cont. |
||||
|
Nordstrom, Inc. sr. unsec. unsub. notes 6.95s, 2028 |
$90,000 |
$117,577 |
||
|
Nortek, Inc. company guaranty sr. unsec. notes 8 1/2s, 2021 |
50,000 |
54,188 |
||
|
Outfront Media Capital, LLC/Outfront Media Capital Corp. company guaranty sr. unsec. notes 5 7/8s, 2025 |
30,000 |
31,650 |
||
|
Outfront Media Capital, LLC/Outfront Media Capital Corp. company guaranty sr. unsec. notes 5 5/8s, 2024 |
55,000 |
57,750 |
||
|
Outfront Media Capital, LLC/Outfront Media Capital Corp. 144A sr. unsec. notes 5 5/8s, 2024 |
5,000 |
5,250 |
||
|
Penn National Gaming, Inc. sr. unsec. notes 5 7/8s, 2021 |
75,000 |
76,219 |
||
|
Penske Automotive Group, Inc. company guaranty sr. unsec. sub. notes 5 3/4s, 2022 |
30,000 |
31,800 |
||
|
Penske Automotive Group, Inc. company guaranty sr. unsec. sub. notes 5 3/8s, 2024 |
45,000 |
46,575 |
||
|
Petco Holdings, Inc. 144A sr. unsec. notes 8 1/2s, 2017 ‡‡ |
25,000 |
25,750 |
||
|
Priceline Group, Inc. (The) sr. unsec. unsub. notes 3.65s, 2025 |
36,000 |
36,168 |
||
|
PulteGroup, Inc. company guaranty sr. unsec. unsub. notes 6s, 2035 |
90,000 |
89,100 |
||
|
QVC, Inc. company guaranty sr. unsub. notes 4.45s, 2025 |
55,000 |
54,589 |
||
|
Regal Entertainment Group sr. unsec. notes 5 3/4s, 2023 |
60,000 |
60,750 |
||
|
Regal Entertainment Group sr. unsec. notes 5 3/4s, 2022 |
25,000 |
25,688 |
||
|
ROC Finance, LLC/ROC Finance 1 Corp. 144A notes 12 1/8s, 2018 |
150,000 |
161,344 |
||
|
Sabre GLBL, Inc. 144A company guaranty sr. notes 5 3/8s, 2023 |
50,000 |
50,875 |
||
|
Scientific Games Corp. company guaranty sr. unsec. sub. notes 8 1/8s, 2018 |
15,000 |
14,025 |
||
|
Scientific Games International, Inc. company guaranty sr. unsec. notes 10s, 2022 |
125,000 |
120,938 |
||
|
Scientific Games International, Inc. company guaranty sr. unsec. sub. notes 6 1/4s, 2020 |
15,000 |
11,475 |
||
|
Scientific Games International, Inc. 144A company guaranty sr. notes 7s, 2022 |
50,000 |
52,125 |
||
|
Sinclair Television Group, Inc. company guaranty sr. unsec. notes 6 3/8s, 2021 |
50,000 |
52,750 |
||
|
Sinclair Television Group, Inc. company guaranty sr. unsec. notes 5 3/8s, 2021 |
20,000 |
20,350 |
||
|
Sinclair Television Group, Inc. sr. unsec. notes 6 1/8s, 2022 |
10,000 |
10,550 |
||
|
Sinclair Television Group, Inc. 144A company guaranty sr. unsec. notes 5 5/8s, 2024 |
15,000 |
15,150 |
||
|
Sirius XM Radio, Inc. 144A company guaranty sr. unsec. notes 6s, 2024 |
55,000 |
57,200 |
||
|
Sirius XM Radio, Inc. 144A sr. unsec. bonds 5 7/8s, 2020 |
50,000 |
52,063 |
||
|
Six Flags Entertainment Corp. 144A company guaranty sr. unsec. unsub. notes 5 1/4s, 2021 |
90,000 |
92,925 |
||
|
Spectrum Brands, Inc. company guaranty sr. unsec. notes 6 3/8s, 2020 |
5,000 |
5,338 |
||
|
Spectrum Brands, Inc. 144A company guaranty sr. unsec. notes 5 3/4s, 2025 |
35,000 |
36,050 |
||
|
Spectrum Brands, Inc. 144A company guaranty sr. unsec. unsub. notes 6 1/8s, 2024 |
30,000 |
31,875 |
||
|
Standard Pacific Corp. company guaranty sr. unsec. notes 6 1/4s, 2021 |
50,000 |
53,250 |
Dynamic Risk Allocation Fund 45
|
CORPORATE BONDS AND NOTES (21.9%)* cont. |
Principal |
Value |
||
|
Consumer cyclicals cont. |
||||
|
Standard Pacific Corp. company guaranty sr. unsec. notes 5 7/8s, 2024 |
$25,000 |
$26,000 |
||
|
SugarHouse HSP Gaming Prop. Mezz LP/SugarHouse HSP Gaming Finance Corp. 144A sr. notes 6 3/8s, 2021 |
50,000 |
47,750 |
||
|
Taylor Morrison Communities, Inc./Monarch Communities, Inc. 144A company guaranty sr. unsec. notes 5 5/8s, 2024 |
20,000 |
19,600 |
||
|
Taylor Morrison Communities, Inc./Monarch Communities, Inc. 144A company guaranty sr. unsec. notes 5 1/4s, 2021 |
53,000 |
53,265 |
||
|
Tiffany & Co. sr. unsec. unsub. notes 4.9s, 2044 |
30,000 |
29,646 |
||
|
Toyota Motor Credit Corp. sr. unsec. unsub. notes Ser. MTN, 1 1/4s, 2017 |
145,000 |
145,775 |
||
|
Tri Pointe Holdings, Inc. 144A sr. unsec. unsub. notes 5 7/8s, 2024 |
95,000 |
93,456 |
||
|
TRW Automotive, Inc. 144A company guaranty sr. unsec. notes 4 1/2s, 2021 |
15,000 |
15,206 |
||
|
Univision Communications, Inc. 144A company guaranty sr. notes 5 1/8s, 2025 |
15,000 |
14,918 |
||
|
Univision Communications, Inc. 144A company guaranty sr. unsec. notes 8 1/2s, 2021 |
30,000 |
31,988 |
||
|
Vulcan Materials Co. sr. unsec. unsub. notes 4 1/2s, 2025 |
15,000 |
15,169 |
||
|
Wal-Mart Stores, Inc. sr. unsec. unsub. notes 6 1/2s, 2037 |
34,000 |
45,268 |
||
|
6,659,631 |
||||
|
Consumer staples (1.5%) |
||||
|
Altria Group, Inc. company guaranty sr. unsec. unsub. notes 2.85s, 2022 |
31,000 |
30,395 |
||
|
Anheuser-Busch InBev Finance, Inc. company guaranty sr. unsec. notes 1 1/4s, 2018 |
145,000 |
145,234 |
||
|
Anheuser-Busch InBev Worldwide, Inc. company guaranty sr. unsec. unsub. notes 8.2s, 2039 |
106,000 |
162,127 |
||
|
Ashtead Capital, Inc. 144A company guaranty sr. notes 6 1/2s, 2022 |
65,000 |
69,794 |
||
|
Avis Budget Car Rental, LLC/Avis Budget Finance, Inc. company guaranty sr. unsec. unsub. notes 5 1/2s, 2023 |
95,000 |
97,375 |
||
|
Avis Budget Car Rental, LLC/Avis Budget Finance, Inc. 144A company guaranty sr. unsec. unsub. notes 5 1/8s, 2022 |
10,000 |
10,025 |
||
|
BC ULC/New Red Finance, Inc. 144A company guaranty sr. notes 4 5/8s, 2022 (Canada) |
25,000 |
25,031 |
||
|
BC ULC/New Red Finance, Inc. 144A notes 6s, 2022 (Canada) |
115,000 |
119,255 |
||
|
BlueLine Rental Finance Corp. 144A sr. notes 7s, 2019 |
70,000 |
72,275 |
||
|
CEC Entertainment, Inc. company guaranty sr. unsec. notes 8s, 2022 |
35,000 |
35,525 |
||
|
Ceridian HCM Holding, Inc. 144A sr. unsec. notes 11s, 2021 |
35,000 |
37,056 |
||
|
Coca-Cola Co. (The) sr. unsec. unsub. notes 3.2s, 2023 |
30,000 |
31,072 |
||
|
ConAgra Foods, Inc. sr. unsec. notes 7s, 2019 |
96,000 |
111,136 |
||
|
Constellation Brands, Inc. company guaranty sr. unsec. notes 4 1/4s, 2023 |
15,000 |
15,113 |
||
|
Constellation Brands, Inc. company guaranty sr. unsec. unsub. notes 6s, 2022 |
65,000 |
73,288 |
||
|
Constellation Brands, Inc. company guaranty sr. unsec. unsub. notes 4 3/4s, 2024 |
5,000 |
5,181 |
||
|
Constellation Brands, Inc. company guaranty sr. unsec. unsub. notes 3 7/8s, 2019 |
5,000 |
5,119 |
46 Dynamic Risk Allocation Fund
|
CORPORATE BONDS AND NOTES (21.9%)* cont. |
Principal |
Value |
||
|
Consumer staples cont. |
||||
|
Corrections Corp. of America company guaranty sr. unsec. notes 4 5/8s, 2023 R |
$124,000 |
$123,690 |
||
|
Corrections Corp. of America company guaranty sr. unsec. notes 4 1/8s, 2020 R |
15,000 |
15,225 |
||
|
CVS Health Corp. sr. unsec. unsub. notes 2 1/4s, 2018 |
145,000 |
147,777 |
||
|
Dean Foods Co. 144A sr. unsec. notes 6 1/2s, 2023 |
45,000 |
46,688 |
||
|
Diageo Capital PLC company guaranty sr. unsec. unsub. notes 1 1/2s, 2017 (United Kingdom) |
32,000 |
32,274 |
||
|
Diageo Investment Corp. company guaranty sr. unsec. debs. 8s, 2022 |
9,000 |
11,930 |
||
|
Elizabeth Arden, Inc. sr. unsec. unsub. notes 7 3/8s, 2021 |
90,000 |
75,938 |
||
|
ERAC USA Finance, LLC 144A company guaranty sr. unsec. bonds 4 1/2s, 2045 |
50,000 |
48,200 |
||
|
ERAC USA Finance, LLC 144A company guaranty sr. unsec. notes 7s, 2037 |
200,000 |
256,141 |
||
|
ERAC USA Finance, LLC 144A company guaranty sr. unsec. notes 5 5/8s, 2042 |
56,000 |
63,043 |
||
|
ERAC USA Finance, LLC 144A company guaranty sr. unsec. notes 3.85s, 2024 |
21,000 |
21,588 |
||
|
JBS USA, LLC/JBS USA Finance, Inc. 144A sr. unsec. notes 7 1/4s, 2021 (Brazil) |
125,000 |
132,063 |
||
|
JBS USA, LLC/JBS USA Finance, Inc. 144A sr. unsec. notes 7 1/4s, 2021 (Brazil) |
20,000 |
21,130 |
||
|
Kraft Foods Group, Inc. sr. unsec. notes Ser. 144A, 6 7/8s, 2039 |
95,000 |
118,136 |
||
|
Kroger Co. (The) company guaranty sr. unsec. notes 6.9s, 2038 |
45,000 |
58,826 |
||
|
Landry’s Holdings II, Inc. 144A sr. unsec. notes 10 1/4s, 2018 |
15,000 |
15,619 |
||
|
Landry’s, Inc. 144A sr. unsec. notes 9 3/8s, 2020 |
115,000 |
123,769 |
||
|
Molson Coors Brewing Co. company guaranty sr. unsec. unsub. notes 5s, 2042 |
11,000 |
10,965 |
||
|
PepsiCo, Inc. sr. unsec. unsub. notes 4 1/4s, 2044 |
45,000 |
45,397 |
||
|
PepsiCo, Inc. sr. unsec. unsub. notes 1 1/4s, 2017 |
144,000 |
144,410 |
||
|
Pilgrim’s Pride Corp. 144A company guaranty sr. unsec. notes 5 3/4s, 2025 |
30,000 |
30,450 |
||
|
Prestige Brands, Inc. 144A sr. unsec. notes 5 3/8s, 2021 |
50,000 |
50,750 |
||
|
Revlon Consumer Products Corp. company guaranty sr. unsec. notes 5 3/4s, 2021 |
75,000 |
75,188 |
||
|
Rite Aid Corp. 144A company guaranty sr. unsec. notes 6 1/8s, 2023 |
60,000 |
62,400 |
||
|
Tyson Foods, Inc. company guaranty sr. unsec. bonds 4 7/8s, 2034 |
23,000 |
24,301 |
||
|
Tyson Foods, Inc. company guaranty sr. unsec. unsub. bonds 5.15s, 2044 |
32,000 |
34,806 |
||
|
United Rentals North America, Inc. company guaranty sr. unsec. notes 7 5/8s, 2022 |
5,000 |
5,475 |
||
|
United Rentals North America, Inc. company guaranty sr. unsec. notes 5 3/4s, 2024 |
25,000 |
25,406 |
||
|
United Rentals North America, Inc. company guaranty sr. unsec. notes 5 1/2s, 2025 |
45,000 |
44,944 |
||
|
United Rentals North America, Inc. company guaranty sr. unsec. unsub. notes 6 1/8s, 2023 |
75,000 |
78,375 |
Dynamic Risk Allocation Fund 47
|
CORPORATE BONDS AND NOTES (21.9%)* cont. |
Principal |
Value |
||
|
Consumer staples cont. |
||||
|
Vander Intermediate Holding II Corp. 144A sr. unsec. notes 9 3/4s, 2019 ‡‡ |
$55,000 |
$55,550 |
||
|
Walgreens Boots Alliance, Inc. company guaranty sr. unsec. unsub. notes 3.3s, 2021 |
35,000 |
35,350 |
||
|
WhiteWave Foods Co. (The) company guaranty sr. unsec. unsub. notes 5 3/8s, 2022 |
65,000 |
70,200 |
||
|
3,151,005 |
||||
|
Energy (2.3%) |
||||
|
Anadarko Petroleum Corp. sr. unsec. notes 6.45s, 2036 |
130,000 |
156,212 |
||
|
Antero Resources Corp. company guaranty sr. unsec. notes 5 1/8s, 2022 |
35,000 |
34,913 |
||
|
Antero Resources Corp. 144A company guaranty sr. unsec. notes 5 5/8s, 2023 |
35,000 |
35,945 |
||
|
Antero Resources Finance Corp. company guaranty sr. unsec. notes 5 3/8s, 2021 |
45,000 |
45,563 |
||
|
Baytex Energy Corp. 144A company guaranty sr. unsec. notes 5 5/8s, 2024 (Canada) |
55,000 |
53,075 |
||
|
Baytex Energy Corp. 144A company guaranty sr. unsec. notes 5 1/8s, 2021 (Canada) |
5,000 |
4,864 |
||
|
BP Capital Markets PLC company guaranty sr. unsec. unsub. notes 2.315s, 2020 (United Kingdom) |
110,000 |
110,817 |
||
|
BP Capital Markets PLC company guaranty sr. unsec. unsub. notes 1.846s, 2017 (United Kingdom) |
145,000 |
147,140 |
||
|
Calfrac Holdings LP 144A company guaranty sr. unsec. unsub. notes 7 1/2s, 2020 |
25,000 |
23,375 |
||
|
California Resources Corp. company guaranty sr. unsec. notes 6s, 2024 |
100,000 |
92,000 |
||
|
California Resources Corp. company guaranty sr. unsec. notes 5s, 2020 |
60,000 |
57,150 |
||
|
Canadian Natural Resources, Ltd. sr. unsec. unsub. notes 5.7s, 2017 (Canada) |
145,000 |
156,199 |
||
|
CHC Helicopter SA company guaranty sr. notes 9 1/4s, 2020 (Canada) |
90,000 |
76,275 |
||
|
Chesapeake Energy Corp. company guaranty sr. unsec. notes 5 3/4s, 2023 |
20,000 |
19,750 |
||
|
Chesapeake Energy Corp. company guaranty sr. unsec. notes 4 7/8s, 2022 |
25,000 |
23,813 |
||
|
Chesapeake Energy Corp. company guaranty sr. unsec. unsub. notes 6 1/8s, 2021 |
80,000 |
81,400 |
||
|
Chevron Corp. sr. unsec. unsub. notes 1.104s, 2017 |
143,000 |
142,845 |
||
|
Concho Resources, Inc. company guaranty sr. unsec. unsub. notes 5 1/2s, 2023 |
55,000 |
55,825 |
||
|
Concho Resources, Inc. company guaranty sr. unsec. unsub. notes 5 1/2s, 2022 |
55,000 |
55,825 |
||
|
ConocoPhillips Co. company guaranty sr. unsec. notes 1.05s, 2017 |
145,000 |
144,394 |
||
|
CONSOL Energy, Inc. company guaranty sr. unsec. unsub. notes 5 7/8s, 2022 |
120,000 |
111,900 |
||
|
DCP Midstream Operating LP company guaranty sr. unsec. notes 2.7s, 2019 |
40,000 |
37,966 |
||
|
Denbury Resources, Inc. company guaranty sr. unsec. sub. notes 5 1/2s, 2022 |
70,000 |
67,200 |
48 Dynamic Risk Allocation Fund
|
CORPORATE BONDS AND NOTES (21.9%)* cont. |
Principal |
Value |
||
|
Energy cont. |
||||
|
Ecopetrol SA sr. unsec. unsub. bonds 4 1/8s, 2025 (Colombia) |
$45,000 |
$42,548 |
||
|
EQT Midstream Partners LP company guaranty sr. unsec. notes 4s, 2024 |
5,000 |
4,853 |
||
|
EXCO Resources, Inc. company guaranty sr. unsec. notes 7 1/2s, 2018 |
35,000 |
23,975 |
||
|
Exterran Partners LP/EXLP Finance Corp. company guaranty sr. unsec. notes 6s, 2022 |
55,000 |
53,900 |
||
|
Freeport-McMoran Oil & Gas, LLC/FCX Oil & Gas, Inc. company guaranty sr. unsec. notes 6 3/4s, 2022 |
43,000 |
45,795 |
||
|
Freeport-McMoran Oil & Gas, LLC/FCX Oil & Gas, Inc. company guaranty sr. unsec. unsub. notes 6 7/8s, 2023 |
9,000 |
9,664 |
||
|
FTS International, Inc. 144A company guaranty sr. FRN 7.808s, 2020 |
30,000 |
29,987 |
||
|
Gulfport Energy Corp. company guaranty sr. unsec. unsub. notes 7 3/4s, 2020 |
85,000 |
89,888 |
||
|
Gulfport Energy Corp. 144A company guaranty sr. unsec. notes 6 5/8s, 2023 |
35,000 |
35,700 |
||
|
Halcon Resources Corp. company guaranty sr. unsec. unsub. notes 9 3/4s, 2020 |
15,000 |
10,838 |
||
|
Halcon Resources Corp. company guaranty sr. unsec. unsub. notes 8 7/8s, 2021 |
130,000 |
91,325 |
||
|
Halcon Resources Corp. 144A company guaranty notes 8 5/8s, 2020 |
30,000 |
30,450 |
||
|
Hiland Partners LP/Hiland Partners Finance Corp. 144A company guaranty sr. notes 7 1/4s, 2020 |
40,000 |
43,500 |
||
|
Hiland Partners LP/Hiland Partners Finance Corp. 144A company guaranty sr. unsec. notes 5 1/2s, 2022 |
10,000 |
10,375 |
||
|
Hilcorp Energy I LP/Hilcorp Finance Co. 144A sr. unsec. notes 5s, 2024 |
20,000 |
19,450 |
||
|
Lightstream Resources, Ltd. 144A sr. unsec. notes 8 5/8s, 2020 (Canada) |
80,000 |
57,960 |
||
|
Linn Energy, LLC/Linn Energy Finance Corp. company guaranty sr. unsec. notes 6 1/2s, 2021 |
25,000 |
20,063 |
||
|
Linn Energy, LLC/Linn Energy Finance Corp. company guaranty sr. unsec. notes 6 1/4s, 2019 |
135,000 |
115,425 |
||
|
Newfield Exploration Co. sr. unsec. notes 5 3/4s, 2022 |
60,000 |
63,300 |
||
|
Newfield Exploration Co. sr. unsec. unsub. notes 5 3/8s, 2026 |
35,000 |
36,225 |
||
|
Noble Holding International, Ltd. company guaranty sr. unsec. notes 6.05s, 2041 |
19,000 |
16,519 |
||
|
Oasis Petroleum, Inc. company guaranty sr. unsec. unsub. notes 6 7/8s, 2022 |
115,000 |
117,588 |
||
|
Offshore Group Investment, Ltd. company guaranty sr. notes 7 1/2s, 2019 (Cayman Islands) |
50,000 |
36,125 |
||
|
Offshore Group Investment, Ltd. company guaranty sr. notes 7 1/8s, 2023 (Cayman Islands) |
55,000 |
38,500 |
||
|
Paragon Offshore PLC 144A company guaranty sr. unsec. notes 6 3/4s, 2022 |
30,000 |
12,300 |
||
|
Paragon Offshore PLC 144A company guaranty sr. unsec. unsub. notes 7 1/4s, 2024 |
95,000 |
39,425 |
||
|
Pertamina Persero PT 144A sr. unsec. unsub. notes 4.3s, 2023 (Indonesia) |
200,000 |
197,000 |
Dynamic Risk Allocation Fund 49
|
CORPORATE BONDS AND NOTES (21.9%)* cont. |
Principal |
Value |
||
|
Energy cont. |
||||
|
Petrobras Global Finance BV company guaranty sr. unsec. unsub. notes 6 1/4s, 2024 (Brazil) |
$175,000 |
$173,524 |
||
|
Petroleos de Venezuela SA company guaranty sr. unsec. notes 5 1/4s, 2017 (Venezuela) |
85,000 |
45,263 |
||
|
Petroleos de Venezuela SA 144A company guaranty sr. notes 8 1/2s, 2017 (Venezuela) |
175,000 |
131,236 |
||
|
Petroleos de Venezuela SA 144A company guaranty sr. unsec. notes 6s, 2026 (Venezuela) |
110,000 |
40,975 |
||
|
Petroleos Mexicanos 144A company guaranty sr. unsec. notes 4 1/2s, 2026 (Mexico) |
15,000 |
15,056 |
||
|
Petroleos Mexicanos 144A company guaranty sr. unsec. unsub. notes 5 5/8s, 2046 (Mexico) |
95,000 |
94,002 |
||
|
Petroleos Mexicanos 144A company guaranty sr. unsec. unsub. notes 3 1/2s, 2020 (Mexico) |
15,000 |
15,258 |
||
|
Phillips 66 company guaranty sr. unsec. unsub. notes 2.95s, 2017 |
145,000 |
149,395 |
||
|
Rose Rock Midstream LP/Rose Rock Finance Corp. company guaranty sr. unsec. notes 5 5/8s, 2022 |
30,000 |
29,925 |
||
|
Rose Rock Midstream LP/Rose Rock Finance Corp. 144A company guaranty sr. unsec. notes 5 5/8s, 2023 |
35,000 |
34,475 |
||
|
Rosetta Resources, Inc. company guaranty sr. unsec. unsub. notes 5 5/8s, 2021 |
30,000 |
31,803 |
||
|
Sabine Pass Liquefaction, LLC company guaranty sr. notes 5 5/8s, 2023 |
145,000 |
147,538 |
||
|
Sabine Pass LNG LP company guaranty sr. notes 6 1/2s, 2020 |
20,000 |
21,050 |
||
|
Samson Investment Co. company guaranty sr. unsec. unsub. notes 9 3/4s, 2020 |
110,000 |
9,075 |
||
|
SandRidge Energy, Inc. 144A company guaranty notes 8 3/4s, 2020 |
70,000 |
69,431 |
||
|
Seven Generations Energy, Ltd. 144A sr. unsec. bonds 6 3/4s, 2023 (Canada) |
35,000 |
35,368 |
||
|
Seven Generations Energy, Ltd. 144A sr. unsec. notes 8 1/4s, 2020 (Canada) |
60,000 |
64,293 |
||
|
Seventy Seven Energy, Inc. sr. unsec. notes 6 1/2s, 2022 |
50,000 |
32,000 |
||
|
Shelf Drilling Holdings, Ltd. 144A sr. notes 8 5/8s, 2018 |
95,000 |
84,550 |
||
|
Shell International Finance BV company guaranty sr. unsec. unsub. notes 5.2s, 2017 (Netherlands) |
156,000 |
168,118 |
||
|
Tervita Corp. 144A sr. unsec. notes 10 7/8s, 2018 (Canada) |
15,000 |
10,805 |
||
|
Total Capital International SA company guaranty sr. unsec. unsub. notes 1.55s, 2017 (France) |
143,000 |
144,700 |
||
|
Triangle USA Petroleum Corp. 144A sr. unsec. notes 6 3/4s, 2022 |
25,000 |
21,125 |
||
|
Unit Corp. company guaranty sr. sub. notes 6 5/8s, 2021 |
25,000 |
24,375 |
||
|
Weatherford International, Ltd./Bermuda company guaranty sr. unsec. notes 9 7/8s, 2039 (Bermuda) |
30,000 |
35,872 |
||
|
Whiting Petroleum Corp. company guaranty sr. unsec. unsub. notes 5 3/4s, 2021 |
125,000 |
127,188 |
||
|
Williams Cos., Inc. (The) notes 8 3/4s, 2032 |
23,000 |
29,554 |
||
|
Williams Cos., Inc. (The) sr. unsec. notes 4.55s, 2024 |
30,000 |
30,696 |
||
|
Williams Partners LP/ACMP Finance Corp. company guaranty sr. unsec. unsub. notes 4 7/8s, 2023 |
120,000 |
122,100 |
||
|
WPX Energy, Inc. sr. unsec. unsub. notes 6s, 2022 |
35,000 |
35,263 |
||
|
5,001,137 |
50 Dynamic Risk Allocation Fund
|
CORPORATE BONDS AND NOTES (21.9%)* cont. |
Principal |
Value |
||
|
Financials (5.6%) |
||||
|
Abbey National Treasury Services PLC/London company guaranty sr. unsec. unsub. notes 1 3/8s, 2017 (United Kingdom) |
$156,000 |
$156,611 |
||
|
ABN Amro Bank NV 144A sr. unsec. notes 2.45s, 2020 (Netherlands) |
200,000 |
199,560 |
||
|
Aflac, Inc. sr. unsec. notes 6.9s, 2039 |
17,000 |
22,271 |
||
|
Air Lease Corp. sr. unsec. unsub. notes 3 3/4s, 2022 |
20,000 |
20,180 |
||
|
Alliance Data Systems Corp. 144A company guaranty sr. unsec. notes 5 3/8s, 2022 |
55,000 |
55,413 |
||
|
Ally Financial, Inc. company guaranty sr. notes 6 1/4s, 2017 |
230,000 |
246,675 |
||
|
Ally Financial, Inc. company guaranty sr. unsec. unsub. notes 8s, 2031 |
90,000 |
110,700 |
||
|
Ally Financial, Inc. company guaranty sr. unsec. unsub. notes 7 1/2s, 2020 |
30,000 |
35,175 |
||
|
American Express Co. jr. unsec. sub. FRN Ser. C, 4.9s, perpetual maturity |
35,000 |
34,386 |
||
|
American Express Co. sr. unsec. notes 7s, 2018 |
94,000 |
107,503 |
||
|
American Express Co. sr. unsec. notes 6.15s, 2017 |
57,000 |
62,728 |
||
|
American International Group, Inc. jr. sub. FRB 8.175s, 2058 |
290,000 |
394,763 |
||
|
ARC Properties Operating Partnership LP/Clark Acquisition, LLC company guaranty sr. unsec. unsub. notes 4.6s, 2024 R |
60,000 |
59,400 |
||
|
Bank of America Corp. jr. unsec. sub. FRN Ser. AA, 6.1s, perpetual maturity |
219,000 |
221,464 |
||
|
Bank of America Corp. jr. unsec. sub. FRN Ser. Z, 6 1/2s, perpetual maturity |
25,000 |
26,438 |
||
|
Bank of America Corp. sr. unsec. notes Ser. MTN, 1.7s, 2017 |
95,000 |
95,356 |
||
|
Bank of America Corp. sr. unsec. unsub. notes 2s, 2018 |
149,000 |
150,050 |
||
|
Bank of Montreal sr. unsec. unsub. notes Ser. MTN, 2 1/2s, 2017 (Canada) |
143,000 |
146,805 |
||
|
Bank of Nova Scotia sr. unsec. unsub. notes 1 3/8s, 2017 (Canada) |
145,000 |
144,989 |
||
|
Bank of Tokyo-Mitsubishi UFJ, Ltd. (The) 144A sr. unsec. notes 1.2s, 2017 (Japan) |
250,000 |
249,209 |
||
|
Barclays Bank PLC 144A sub. notes 10.179s, 2021 (United Kingdom) |
270,000 |
363,395 |
||
|
BNP Paribas SA company guaranty sr. unsec. unsub. bonds Ser. MTN, 1 3/8s, 2017 (France) |
162,000 |
162,209 |
||
|
BPCE SA 144A unsec. sub. notes 5.15s, 2024 (France) |
200,000 |
210,475 |
||
|
CBL & Associates LP company guaranty sr. unsec. unsub. notes 5 1/4s, 2023 R |
180,000 |
188,568 |
||
|
CBRE Services, Inc. company guaranty sr. unsec. notes 5 1/4s, 2025 |
25,000 |
26,750 |
||
|
CBRE Services, Inc. company guaranty sr. unsec. unsub. notes 5s, 2023 |
40,000 |
41,200 |
||
|
CIT Group, Inc. sr. unsec. notes 5s, 2023 |
35,000 |
35,788 |
||
|
CIT Group, Inc. sr. unsec. notes 5s, 2022 |
115,000 |
118,163 |
||
|
CIT Group, Inc. sr. unsec. unsub. notes 3 7/8s, 2019 |
20,000 |
20,050 |
||
|
CIT Group, Inc. 144A company guaranty notes 5 1/2s, 2019 |
155,000 |
163,719 |
||
|
Citigroup, Inc. jr. unsec. sub. FRB Ser. B, 5.9s, perpetual maturity |
3,000 |
2,996 |
||
|
Citigroup, Inc. jr. unsec. sub. FRB Ser. P, 5.95s, perpetual maturity |
48,000 |
47,340 |
||
|
Citigroup, Inc. jr. unsec. sub. FRN 5 7/8s, perpetual maturity |
6,000 |
6,045 |
Dynamic Risk Allocation Fund 51
|
CORPORATE BONDS AND NOTES (21.9%)* cont. |
Principal |
Value |
||
|
Financials cont. |
||||
|
Citigroup, Inc. sr. unsec. unsub. notes 4.45s, 2017 |
$151,000 |
$158,351 |
||
|
CNO Financial Group, Inc. sr. unsec. unsub. notes 5 1/4s, 2025 |
60,000 |
62,250 |
||
|
CNO Financial Group, Inc. sr. unsec. unsub. notes 4 1/2s, 2020 |
35,000 |
36,180 |
||
|
Commonwealth Bank of Australia/New York, NY sr. unsec. bonds Ser. GMTN, 1 5/8s, 2018 |
330,000 |
331,579 |
||
|
Communications Sales & Leasing, Inc. 144A company guaranty sr. unsec. notes 8 1/4s, 2023 R |
20,000 |
20,400 |
||
|
Cooperatieve Centrale Raiffeisen-Boerenleenbank BA/Netherlands (Rabobank Nederland) company guaranty sr. unsec. notes 3 3/8s, 2017 (Netherlands) |
130,000 |
134,954 |
||
|
Credit Acceptance Corp. company guaranty sr. unsec. bonds 6 1/8s, 2021 |
80,000 |
81,000 |
||
|
Credit Acceptance Corp. 144A company guaranty sr. unsec. notes 7 3/8s, 2023 |
25,000 |
25,938 |
||
|
Credit Suisse Group AG 144A jr. unsec. sub. FRN 7 1/2s, perpetual maturity (Switzerland) |
200,000 |
213,000 |
||
|
DDR Corp. sr. unsec. unsub. notes 7 7/8s, 2020 R |
11,000 |
13,602 |
||
|
Deutsche Bank AG/London sr. unsec. notes 6s, 2017 (United Kingdom) |
149,000 |
163,243 |
||
|
DFC Finance Corp. 144A company guaranty sr. notes 10 1/2s, 2020 |
55,000 |
42,350 |
||
|
Dresdner Funding Trust I 144A bonds 8.151s, 2031 |
180,000 |
226,800 |
||
|
Duke Realty LP company guaranty sr. unsec. unsub. notes 4 3/8s, 2022 R |
21,000 |
22,302 |
||
|
E*Trade Financial Corp. sr. unsec. unsub. notes 5 3/8s, 2022 |
45,000 |
47,025 |
||
|
E*Trade Financial Corp. sr. unsec. unsub. notes 4 5/8s, 2023 |
55,000 |
55,275 |
||
|
EPR Properties unsec. notes 5 1/4s, 2023 R |
60,000 |
63,930 |
||
|
Fairfax US, Inc. 144A company guaranty sr. unsec. notes 4 7/8s, 2024 |
60,000 |
58,950 |
||
|
Fifth Third Bancorp jr. unsec. sub. FRB 5.1s, perpetual maturity |
38,000 |
35,910 |
||
|
General Electric Capital Corp. sr. unsec. notes 6 3/4s, 2032 |
202,000 |
272,209 |
||
|
General Electric Capital Corp. sr. unsec. notes Ser. MTN, 5.4s, 2017 |
143,000 |
153,759 |
||
|
Genworth Holdings, Inc. company guaranty jr. unsec. sub. FRB 6.15s, 2066 |
112,000 |
70,280 |
||
|
Goldman Sachs Group, Inc. (The) sr. notes 7 1/2s, 2019 |
44,000 |
52,125 |
||
|
Goldman Sachs Group, Inc. (The) sr. unsec. unsub. notes Ser. GLOB, 2 3/8s, 2018 |
2,000 |
2,030 |
||
|
HBOS PLC 144A unsec. sub. bonds 6s, 2033 (United Kingdom) |
95,000 |
106,811 |
||
|
Healthcare Realty Trust, Inc. sr. unsec. unsub. notes 3 7/8s, 2025 R |
25,000 |
24,681 |
||
|
Hospitality Properties Trust sr. unsec. unsub. notes 4 1/2s, 2025 R |
20,000 |
20,223 |
||
|
HSBC Finance Corp. sr. unsec. sub. notes 6.676s, 2021 |
122,000 |
143,574 |
||
|
Hub Holdings, LLC/Hub Holdings Finance, Inc. 144A sr. unsec. notes 8 1/8s, 2019 ‡‡ |
10,000 |
9,950 |
||
|
HUB International, Ltd. 144A sr. unsec. notes 7 7/8s, 2021 |
80,000 |
82,600 |
||
|
Icahn Enterprises LP/Icahn Enterprises Finance Corp. company guaranty sr. unsec. notes 6s, 2020 |
145,000 |
155,875 |
||
|
Icahn Enterprises LP/Icahn Enterprises Finance Corp. company guaranty sr. unsec. notes 5 7/8s, 2022 |
60,000 |
62,925 |
52 Dynamic Risk Allocation Fund
|
CORPORATE BONDS AND NOTES (21.9%)* cont. |
Principal |
Value |
||
|
Financials cont. |
||||
|
ING Bank NV 144A unsec. sub. notes 5.8s, 2023 (Netherlands) |
$220,000 |
$248,329 |
||
|
iStar Financial, Inc. company guaranty sr. unsec. unsub. notes 4 7/8s, 2018 R |
45,000 |
44,381 |
||
|
iStar Financial, Inc. sr. unsec. notes 7 1/8s, 2018 R |
30,000 |
32,100 |
||
|
iStar Financial, Inc. sr. unsec. notes 5s, 2019 R |
20,000 |
19,775 |
||
|
JPMorgan Chase & Co. sr. unsec. unsub. notes 2s, 2017 |
144,000 |
145,807 |
||
|
KeyCorp sr. unsec. unsub. notes Ser. MTN, 2.3s, 2018 |
4,000 |
4,054 |
||
|
Liberty Mutual Group, Inc. 144A company guaranty jr. unsec. sub. bonds 7.8s, 2037 |
240,000 |
291,000 |
||
|
Lloyds Banking Group PLC jr. unsec. sub. FRB 7 1/2s, perpetual maturity (United Kingdom) |
512,000 |
544,640 |
||
|
Lloyds Banking Group PLC 144A jr. unsec. sub. FRN 6.657s, perpetual maturity (United Kingdom) |
30,000 |
34,200 |
||
|
Merrill Lynch & Co., Inc. unsec. sub. notes 6.11s, 2037 |
170,000 |
197,070 |
||
|
MetLife, Inc. sr. unsec. unsub. notes 6 3/4s, 2016 |
145,000 |
153,484 |
||
|
Mid-America Apartments LP sr. unsec. notes 4.3s, 2023 R |
60,000 |
63,118 |
||
|
Morgan Stanley sr. unsec. notes 4 3/4s, 2017 |
149,000 |
157,954 |
||
|
MPT Operating Partnership LP/MPT Finance Corp. company guaranty sr. unsec. unsub. notes 6 3/8s, 2022 R |
35,000 |
37,713 |
||
|
Nationstar Mortgage, LLC/Nationstar Capital Corp. company guaranty sr. unsec. notes 7 7/8s, 2020 |
40,000 |
40,600 |
||
|
Nationstar Mortgage, LLC/Nationstar Capital Corp. company guaranty sr. unsec. unsub. notes 6 1/2s, 2021 |
30,000 |
28,838 |
||
|
Nationwide Mutual Insurance Co. 144A notes 9 3/8s, 2039 |
20,000 |
30,936 |
||
|
Neuberger Berman Group, LLC/Neuberger Berman Finance Corp. 144A sr. unsec. notes 5 7/8s, 2022 |
36,000 |
38,700 |
||
|
Neuberger Berman Group, LLC/Neuberger Berman Finance Corp. 144A sr. unsec. notes 4 7/8s, 2045 |
40,000 |
37,400 |
||
|
Ocwen Financial Corp. 144A company guaranty sr. unsec. notes 6 5/8s, 2019 |
25,000 |
23,438 |
||
|
OneMain Financial Holdings, Inc. 144A company guaranty sr. unsec. notes 6 3/4s, 2019 |
50,000 |
53,531 |
||
|
OneMain Financial Holdings, Inc. 144A company guaranty sr. unsec. unsub. notes 7 1/4s, 2021 |
35,000 |
37,538 |
||
|
Peachtree Corners Funding Trust 144A company guaranty sr. unsec. unsub. bonds 3.976s, 2025 |
100,000 |
101,320 |
||
|
PHH Corp. sr. unsec. unsub. notes 6 3/8s, 2021 |
80,000 |
80,200 |
||
|
PNC Bank NA sr. unsec. unsub. notes Ser. BKNT, 1 1/8s, 2017 |
250,000 |
250,376 |
||
|
Progressive Corp. (The) jr. unsec. sub. FRN 6.7s, 2037 |
116,000 |
121,220 |
||
|
Provident Funding Associates LP/PFG Finance Corp. 144A company guaranty sr. unsec. notes 6 3/4s, 2021 |
75,000 |
72,375 |
||
|
Royal Bank of Canada sr. unsec. unsub. notes Ser. GMTN, 2.2s, 2018 (Canada) |
145,000 |
147,921 |
||
|
Royal Bank of Scotland Group PLC jr. sub. unsec. FRN Ser. U, 7.64s, perpetual maturity (United Kingdom) |
200,000 |
218,250 |
||
|
Royal Bank of Scotland Group PLC unsec. sub. notes 6s, 2023 (United Kingdom) |
35,000 |
38,064 |
||
|
Select Income REIT sr. unsec. unsub. notes 3.6s, 2020 R |
35,000 |
35,999 |
||
|
Select Income REIT sr. unsec. unsub. notes 2.85s, 2018 R |
35,000 |
35,491 |
||
|
Simon Property Group LP 144A sr. unsec. unsub. notes 1 1/2s, 2018 R |
131,000 |
131,241 |
Dynamic Risk Allocation Fund 53
|
CORPORATE BONDS AND NOTES (21.9%)* cont. |
Principal |
Value |
||
|
Financials cont. |
||||
|
Societe Generale SA company guaranty sr. unsec. notes 2 3/4s, 2017 (France) |
$250,000 |
$256,808 |
||
|
Springleaf Finance Corp. sr. unsec. notes 5 1/4s, 2019 |
20,000 |
20,176 |
||
|
Springleaf Finance Corp. sr. unsec. unsub. notes 7 3/4s, 2021 |
15,000 |
16,725 |
||
|
Springleaf Finance Corp. sr. unsec. unsub. notes 6s, 2020 |
30,000 |
30,825 |
||
|
Standard Chartered Bank 144A unsec. sub. notes 8s, 2031 (United Kingdom) |
100,000 |
133,877 |
||
|
State Street Capital Trust IV company guaranty jr. unsec. sub. FRB 1.271s, 2037 |
220,000 |
188,100 |
||
|
Svenska Handelsbanken AB company guaranty sr. unsec. notes 2 7/8s, 2017 (Sweden) |
250,000 |
257,866 |
||
|
TIERS Trust/United States 144A sr. bonds stepped-coupon zero % (8 1/8s, 3/15/18), 2046 †† |
100,000 |
104,500 |
||
|
TMX Finance, LLC/TitleMax Finance Corp. 144A sr. notes 8 1/2s, 2018 |
20,000 |
17,000 |
||
|
Travelers Property Casualty Corp. sr. unsec. unsub. bonds 7 3/4s, 2026 |
9,000 |
11,977 |
||
|
UBS AG/Stamford, CT sr. unsec. unsub. notes Ser. BKNT, 5 7/8s, 2017 |
130,000 |
143,668 |
||
|
Walter Investment Management Corp. company guaranty sr. unsec. unsub. notes 7 7/8s, 2021 |
45,000 |
41,288 |
||
|
Wells Fargo & Co. jr. unsec. sub. FRB Ser. U, 5 7/8s, perpetual maturity |
70,000 |
73,588 |
||
|
Wells Fargo & Co. sr. unsec. notes 2.1s, 2017 |
143,000 |
145,922 |
||
|
Westpac Banking Corp. sr. unsec. unsub. notes 1.55s, 2018 (Australia) |
26,000 |
25,993 |
||
|
11,841,831 |
||||
|
Health care (1.7%) |
||||
|
AbbVie, Inc. sr. unsec. notes 3.6s, 2025 |
12,000 |
12,077 |
||
|
AbbVie, Inc. sr. unsec. unsub. notes 2.9s, 2022 |
18,000 |
17,768 |
||
|
AbbVie, Inc. sr. unsec. unsub. notes 1 3/4s, 2017 |
130,000 |
130,467 |
||
|
Acadia Healthcare Co., Inc. company guaranty sr. unsec. notes 6 1/8s, 2021 |
60,000 |
62,100 |
||
|
Acadia Healthcare Co., Inc. company guaranty sr. unsec. notes 5 1/8s, 2022 |
35,000 |
35,000 |
||
|
Actavis Funding SCS company guaranty sr. unsec. unsub. notes 4 3/4s, 2045 (Luxembourg) |
68,000 |
67,338 |
||
|
Actavis Funding SCS company guaranty sr. unsec. unsub. notes 3.45s, 2022 (Luxembourg) |
33,000 |
33,287 |
||
|
Amgen, Inc. sr. unsec. unsub. notes 2 1/8s, 2017 |
145,000 |
147,385 |
||
|
AstraZeneca PLC sr. unsec. unsub. notes 6.45s, 2037 (United Kingdom) |
16,000 |
21,044 |
||
|
AstraZeneca PLC sr. unsub. notes 5.9s, 2017 (United Kingdom) |
145,000 |
160,412 |
||
|
Capsugel SA 144A sr. unsec. notes 7s, 2019 (Luxembourg) ‡‡ |
50,000 |
51,125 |
||
|
Centene Corp. sr. unsec. unsub. notes 4 3/4s, 2022 |
55,000 |
57,750 |
||
|
CHS/Community Health Systems, Inc. company guaranty sr. notes 5 1/8s, 2021 |
60,000 |
62,250 |
||
|
CHS/Community Health Systems, Inc. company guaranty sr. unsec. notes 6 7/8s, 2022 |
15,000 |
16,013 |
||
|
Concordia Healthcare Corp. 144A company guaranty sr. unsec. notes 7s, 2023 (Canada) |
60,000 |
60,375 |
54 Dynamic Risk Allocation Fund
|
CORPORATE BONDS AND NOTES (21.9%)* cont. |
Principal |
Value |
||
|
Health care cont. |
||||
|
Crimson Merger Sub, Inc. 144A sr. unsec. notes 6 5/8s, 2022 |
$65,000 |
$57,119 |
||
|
DaVita HealthCare Partners, Inc. company guaranty sr. unsec. notes 5 1/8s, 2024 |
35,000 |
35,372 |
||
|
DaVita HealthCare Partners, Inc. company guaranty sr. unsec. sub. notes 5s, 2025 |
50,000 |
49,563 |
||
|
DPx Holdings BV 144A sr. unsec. notes 7 1/2s, 2022 (Netherlands) |
65,000 |
68,006 |
||
|
Endo Finance, LLC 144A company guaranty sr. unsec. notes 5 3/4s, 2022 |
50,000 |
50,813 |
||
|
Endo Finance, LLC/Endo Finco, Inc. 144A company guaranty sr. unsec. unsub. notes 5 3/8s, 2023 |
40,000 |
39,000 |
||
|
Halyard Health, Inc. 144A sr. unsec. notes 6 1/4s, 2022 |
45,000 |
47,363 |
||
|
HCA, Inc. company guaranty sr. notes 5s, 2024 |
40,000 |
41,700 |
||
|
HCA, Inc. company guaranty sr. notes 3 3/4s, 2019 |
50,000 |
50,750 |
||
|
HCA, Inc. company guaranty sr. unsec. bonds 5 3/8s, 2025 |
15,000 |
15,450 |
||
|
HCA, Inc. sr. notes 6 1/2s, 2020 |
170,000 |
189,975 |
||
|
IASIS Healthcare, LLC/IASIS Capital Corp. company guaranty sr. unsec. notes 8 3/8s, 2019 |
55,000 |
57,509 |
||
|
Jaguar Holding Co. I 144A sr. unsec. notes 9 3/8s, 2017 ‡‡ |
55,000 |
56,238 |
||
|
JLL/Delta Dutch Pledgeco BV 144A sr. unsec. notes 8 3/4s, 2020 (Netherlands) ‡‡ |
45,000 |
45,731 |
||
|
Johnson & Johnson sr. unsec. notes 5.15s, 2018 |
91,000 |
102,374 |
||
|
Kinetic Concepts, Inc./KCI USA, Inc. company guaranty notes 10 1/2s, 2018 |
85,000 |
91,375 |
||
|
Mallinckrodt International Finance SA/Mallinckrodt CB, LLC 144A company guaranty sr. unsec. unsub. notes 5 1/2s, 2025 (Luxembourg) |
40,000 |
40,300 |
||
|
Medtronic PLC 144A sr. unsec. notes 4 3/8s, 2035 |
15,000 |
15,377 |
||
|
Medtronic PLC 144A sr. unsec. notes 3 1/2s, 2025 |
15,000 |
15,360 |
||
|
Merck & Co., Inc. sr. unsec. unsub. notes 1.3s, 2018 |
125,000 |
125,318 |
||
|
Omega Healthcare Investors, Inc. company guaranty sr. unsec. notes 4.95s, 2024 R |
149,000 |
155,622 |
||
|
Omega Healthcare Investors, Inc. 144A company guaranty sr. unsec. notes 4 1/2s, 2027 R |
60,000 |
58,350 |
||
|
Omnicare, Inc. sr. unsec. notes 5s, 2024 |
10,000 |
11,050 |
||
|
Omnicare, Inc. sr. unsec. notes 4 3/4s, 2022 |
39,000 |
42,413 |
||
|
Par Pharmaceutical Cos., Inc. company guaranty sr. unsec. unsub. notes 7 3/8s, 2020 |
165,000 |
176,550 |
||
|
Quintiles Transnational Corp. 144A company guaranty sr. unsec. notes 4 7/8s, 2023 |
30,000 |
30,450 |
||
|
Service Corporation International sr. unsec. unsub. notes 5 3/8s, 2024 |
240,000 |
254,400 |
||
|
Service Corporation International sr. unsec. unsub. notes 5 3/8s, 2022 |
50,000 |
53,250 |
||
|
Sterigenics-Nordion Holdings, LLC 144A sr. unsec. notes 6 1/2s, 2023 |
45,000 |
45,338 |
||
|
Teleflex, Inc. company guaranty sr. unsec. notes 5 1/4s, 2024 |
15,000 |
15,300 |
||
|
Tenet Healthcare Corp. company guaranty sr. bonds 4 1/2s, 2021 |
30,000 |
29,700 |
||
|
Tenet Healthcare Corp. company guaranty sr. bonds 4 3/8s, 2021 |
45,000 |
44,100 |
||
|
Tenet Healthcare Corp. company guaranty sr. notes 6 1/4s, 2018 |
100,000 |
108,750 |
||
|
Tenet Healthcare Corp. company guaranty sr. notes 6s, 2020 |
55,000 |
58,850 |
||
|
Tenet Healthcare Corp. company guaranty sr. notes 4 3/4s, 2020 |
10,000 |
10,175 |
Dynamic Risk Allocation Fund 55
|
CORPORATE BONDS AND NOTES (21.9%)* cont. |
Principal |
Value |
||
|
Health care cont. |
||||
|
UnitedHealth Group, Inc. sr. unsec. notes 6s, 2018 |
$65,000 |
$72,982 |
||
|
UnitedHealth Group, Inc. sr. unsec. unsub. notes 4.7s, 2021 |
58,000 |
64,975 |
||
|
Valeant Pharmaceuticals International 144A company guaranty sr. unsec. notes 6 3/8s, 2020 |
5,000 |
5,319 |
||
|
Valeant Pharmaceuticals International, Inc. 144A company guaranty sr. unsec. notes 5 5/8s, 2021 |
5,000 |
5,188 |
||
|
Valeant Pharmaceuticals International, Inc. 144A company guaranty sr. unsec. notes 5 1/2s, 2023 |
25,000 |
25,438 |
||
|
Valeant Pharmaceuticals International, Inc. 144A sr. unsec. notes 6 1/8s, 2025 |
55,000 |
57,269 |
||
|
Valeant Pharmaceuticals International, Inc. 144A sr. unsec. notes 5 7/8s, 2023 |
60,000 |
62,175 |
||
|
Valeant Pharmaceuticals International, Inc. 144A sr. unsec. notes 5 3/8s, 2020 |
55,000 |
57,200 |
||
|
WellCare Health Plans, Inc. sr. unsec. notes 5 3/4s, 2020 |
85,000 |
89,409 |
||
|
3,663,337 |
||||
|
Technology (1.1%) |
||||
|
ACI Worldwide, Inc. 144A company guaranty sr. unsec. unsub. notes 6 3/8s, 2020 |
40,000 |
42,150 |
||
|
Apple, Inc. sr. unsec. unsub. notes 4 3/8s, 2045 |
69,000 |
69,907 |
||
|
Apple, Inc. sr. unsec. unsub. notes 3.85s, 2043 |
100,000 |
93,382 |
||
|
Avaya, Inc. 144A company guaranty notes 10 1/2s, 2021 |
70,000 |
59,938 |
||
|
Avaya, Inc. 144A company guaranty sr. notes 7s, 2019 |
300,000 |
300,000 |
||
|
Cisco Systems, Inc. sr. unsec. unsub. notes 1.1s, 2017 |
66,000 |
66,345 |
||
|
eBay, Inc. sr. unsec. unsub. notes 1.35s, 2017 |
145,000 |
145,020 |
||
|
First Data Corp. company guaranty sr. unsec. sub. notes 11 3/4s, 2021 |
53,000 |
60,619 |
||
|
First Data Corp. 144A company guaranty notes 8 1/4s, 2021 |
340,000 |
362,525 |
||
|
Freescale Semiconductor, Inc. 144A company guaranty sr. notes 5s, 2021 |
25,000 |
26,188 |
||
|
Freescale Semiconductor, Inc. 144A sr. notes 6s, 2022 |
40,000 |
43,100 |
||
|
Hewlett-Packard Co. sr. unsec. notes 5 1/2s, 2018 |
75,000 |
82,817 |
||
|
Hewlett-Packard Co. sr. unsec. unsub. notes 2.6s, 2017 |
124,000 |
126,885 |
||
|
Infor US, Inc. 144A sr. unsec. notes 6 1/2s, 2022 |
85,000 |
88,307 |
||
|
Intel Corp. sr. unsec. unsub. notes 1.35s, 2017 |
145,000 |
145,856 |
||
|
Iron Mountain, Inc. company guaranty sr. unsec. unsub. notes 6s, 2023 R |
60,000 |
63,600 |
||
|
Jabil Circuit, Inc. sr. unsec. notes 8 1/4s, 2018 |
14,000 |
16,118 |
||
|
Micron Technology, Inc. sr. unsec. bonds 5 7/8s, 2022 |
55,000 |
57,750 |
||
|
Micron Technology, Inc. 144A sr. unsec. notes 5 1/4s, 2023 |
50,000 |
50,000 |
||
|
Oracle Corp. sr. unsec. unsub. notes 4 1/8s, 2045 |
50,000 |
48,398 |
||
|
Plantronics, Inc. 144A company guaranty sr. unsec. notes 5 1/2s, 2023 |
60,000 |
60,900 |
||
|
SoftBank Corp. 144A sr. unsec. notes 4 1/2s, 2020 (Japan) |
200,000 |
205,500 |
||
|
SunGard Data Systems, Inc. company guaranty sr. unsec. sub. notes 6 5/8s, 2019 |
30,000 |
31,313 |
||
|
Zebra Technologies Corp. 144A sr. unsec. unsub. notes 7 1/4s, 2022 |
40,000 |
43,400 |
||
|
2,290,018 |
56 Dynamic Risk Allocation Fund
|
CORPORATE BONDS AND NOTES (21.9%)* cont. |
Principal |
Value |
||
|
Transportation (0.1%) |
||||
|
Air Medical Merger Sub Corp. 144A sr. unsec. notes 6 3/8s, 2023 |
$70,000 |
$67,550 |
||
|
Burlington Northern Santa Fe, LLC sr. unsec. unsub. notes 5 3/4s, 2040 |
15,000 |
18,001 |
||
|
United Airlines 2014-2 Class A Pass Through Trust sr. notes Ser. A, 3 3/4s, 2026 |
25,000 |
25,563 |
||
|
Watco Cos., LLC/Watco Finance Corp. 144A company guaranty sr. unsec. notes 6 3/8s, 2023 |
105,000 |
107,100 |
||
|
218,214 |
||||
|
Utilities and power (1.3%) |
||||
|
AES Corp./Virginia (The) sr. unsec. notes 8s, 2020 |
240,000 |
280,800 |
||
|
AES Corp./Virginia (The) sr. unsec. notes 5 1/2s, 2025 |
140,000 |
138,950 |
||
|
AES Corp./Virginia (The) sr. unsec. unsub. notes 4 7/8s, 2023 |
25,000 |
24,125 |
||
|
Calpine Corp. sr. unsec. notes 5 3/4s, 2025 |
110,000 |
110,688 |
||
|
Calpine Corp. 144A company guaranty sr. notes 6s, 2022 |
50,000 |
53,375 |
||
|
Calpine Corp. 144A company guaranty sr. notes 5 7/8s, 2024 |
15,000 |
16,069 |
||
|
Consolidated Edison Co. of New York, Inc. sr. unsec. notes 7 1/8s, 2018 |
96,000 |
113,338 |
||
|
Dynegy, Inc. 144A company guaranty sr. unsec. notes 7 3/8s, 2022 |
5,000 |
5,325 |
||
|
Dynegy, Inc. 144A company guaranty sr. unsec. notes 6 3/4s, 2019 |
80,000 |
84,600 |
||
|
Dynegy, Inc. 144A company guaranty sr. unsec. unsub. notes 7 5/8s, 2024 |
5,000 |
5,363 |
||
|
Electricite de France (EDF) 144A jr. unsec. sub. FRN 5 5/8s, perpetual maturity (France) |
695,000 |
728,152 |
||
|
Energy Future Intermediate Holding Co., LLC/EFIH Finance, Inc. 144A notes 11 3/4s, 2022 (In default) † |
47,606 |
54,389 |
||
|
Enterprise Products Operating, LLC company guaranty sr. unsec. unsub. notes 4.85s, 2042 |
18,000 |
18,089 |
||
|
EP Energy, LLC/Everest Acquisition Finance, Inc. sr. unsec. notes 9 3/8s, 2020 |
125,000 |
136,094 |
||
|
EP Energy, LLC/Everest Acquisition Finance, Inc. 144A company guaranty sr. unsec. notes 6 3/8s, 2023 |
25,000 |
25,031 |
||
|
FirstEnergy Transmission, LLC 144A sr. unsec. unsub. notes 5.45s, 2044 |
130,000 |
140,587 |
||
|
GenOn Americas Generation, LLC sr. unsec. notes 9 1/8s, 2031 |
100,000 |
94,000 |
||
|
Kinder Morgan Energy Partners LP company guaranty sr. unsec. unsub. notes 3.45s, 2023 |
60,000 |
57,938 |
||
|
Kinder Morgan Energy Partners LP sr. unsec. unsub. notes 5.4s, 2044 |
44,000 |
42,210 |
||
|
MidAmerican Energy Holdings Co. bonds 6 1/8s, 2036 |
10,000 |
12,125 |
||
|
MidAmerican Funding, LLC sr. bonds 6.927s, 2029 |
20,000 |
26,594 |
||
|
NRG Energy, Inc. company guaranty sr. unsec. notes 7 7/8s, 2021 |
115,000 |
123,194 |
||
|
NRG Yield Operating, LLC 144A company guaranty sr. unsec. notes 5 3/8s, 2024 |
30,000 |
30,900 |
||
|
Oncor Electric Delivery Co., LLC 144A sr. bonds 3 3/4s, 2045 |
85,000 |
79,813 |
||
|
Puget Sound Energy, Inc. jr. sub. FRN Ser. A, 6.974s, 2067 |
90,000 |
85,500 |
||
|
Regency Energy Partners LP/Regency Energy Finance Corp. company guaranty sr. unsec. unsub. notes 5 7/8s, 2022 |
80,000 |
87,600 |
Dynamic Risk Allocation Fund 57
|
CORPORATE BONDS AND NOTES (21.9%)* cont. |
Principal |
Value |
||
|
Utilities and power cont. |
||||
|
Regency Energy Partners LP/Regency Energy Finance Corp. company guaranty sr. unsec. unsub. notes 5 1/2s, 2023 |
$30,000 |
$31,050 |
||
|
Regency Energy Partners LP/Regency Energy Finance Corp. company guaranty sr. unsec. unsub. notes 5s, 2022 |
30,000 |
31,368 |
||
|
Regency Energy Partners LP/Regency Energy Finance Corp. company guaranty sr. unsec. unsub. notes 4 1/2s, 2023 |
35,000 |
35,193 |
||
|
Southern Star Central Corp. 144A sr. unsec. notes 5 1/8s, 2022 |
65,000 |
67,925 |
||
|
2,740,385 |
||||
|
Total corporate bonds and notes (cost $46,703,675) |
|
|||
|
U.S. GOVERNMENT AND AGENCY |
Principal |
Value |
|
|
U.S. Government Guaranteed Mortgage Obligations (2.0%) |
|||
|
Government National Mortgage Association Pass-Through Certificates 3 1/2s, TBA, June 1, 2045 |
$4,000,000 |
$4,201,562 |
|
|
4,201,562 |
|||
|
U.S. Government Agency Mortgage Obligations (5.5%) |
|||
|
Federal National Mortgage Association Pass-Through Certificates |
|||
|
6s, TBA, June 1, 2045 |
2,000,000 |
2,284,998 |
|
|
4s, TBA, June 1, 2045 |
5,000,000 |
5,339,063 |
|
|
3s, TBA, June 1, 2045 |
2,000,000 |
2,027,812 |
|
|
3s, TBA, June 1, 2030 |
2,000,000 |
2,089,688 |
|
|
11,741,561 |
|||
|
Total U.S. government and agency mortgage obligations (cost $15,908,282) |
|
||
|
COMMODITY LINKED NOTES (3.8%)* ††† |
Principal |
Value |
|
|
Deutsche Bank AG/London 144A sr. unsec. notes, 1-month USD LIBOR less 0.16%, 2016 (Indexed to the S&P GSCI 3-Month Forward Index — Total Return multiplied by 3) (United Kingdom) |
$4,606,000 |
$4,027,947 |
|
|
UBS AG/London 144A sr. notes 1-month LIBOR less 0.10%, 2016 (Indexed to the S&P GSCI Light Energy Total Return Index multiplied by 3) (United Kingdom) |
3,900,000 |
4,048,493 |
|
|
Total commodity Linked Notes (cost $8,506,000) |
|
||
|
MORTGAGE-BACKED SECURITIES (3.4%)* |
Principal |
Value |
||
|
Commercial mortgage-backed securities (2.6%) |
||||
|
Banc of America Commercial Mortgage Trust |
||||
|
FRB Ser. 07-3, Class A3, 5.576s, 2049 |
$32,727 |
$32,710 |
||
|
Ser. 06-5, Class A2, 5.317s, 2047 |
5,038 |
5,038 |
||
|
Banc of America Merrill Lynch Commercial Mortgage, Inc. |
||||
|
FRB Ser. 05-1, Class AJ, 5.355s, 2042 |
105,296 |
105,150 |
||
|
Ser. 05-4, Class B, 5.118s, 2045 |
212,000 |
214,120 |
||
|
Bear Stearns Commercial Mortgage Securities Trust |
||||
|
FRB Ser. 06-PW12, Class AJ, 5.74s, 2038 |
48,000 |
49,195 |
||
|
FRB Ser. 06-PW11, Class AJ, 5.43s, 2039 |
68,000 |
69,615 |
||
|
CFCRE Commercial Mortgage Trust 144A FRB Ser. 11-C2, Class D, 5.568s, 2047 |
100,000 |
107,231 |
58 Dynamic Risk Allocation Fund
|
MORTGAGE-BACKED SECURITIES (3.4%)* cont. |
Principal |
Value |
||
|
Commercial mortgage-backed securities cont. |
||||
|
Citigroup Commercial Mortgage Trust |
||||
|
FRB Ser. 06-C4, Class AJ, 5.776s, 2049 |
$193,000 |
$199,562 |
||
|
FRB Ser. 13-GC17, Class C, 5.106s, 2046 |
49,000 |
53,646 |
||
|
Ser. 14-GC21, Class AS, 4.026s, 2047 |
74,000 |
78,721 |
||
|
FRB Ser. 14-GC19, Class X, IO, 1.323s, 2047 |
1,543,118 |
121,937 |
||
|
COMM Mortgage Trust |
||||
|
Ser. 14-UBS6, Class C, 4.467s, 2047 |
113,000 |
116,080 |
||
|
FRB Ser. 14-LC15, Class XA, IO, 1.41s, 2047 F |
632,737 |
49,858 |
||
|
FRB Ser. 14-CR16, Class XA, IO, 1.263s, 2047 |
663,736 |
48,023 |
||
|
FRB Ser. 14-CR17, Class XA, IO, 1.203s, 2047 |
1,035,915 |
74,508 |
||
|
FRB Ser. 14-UBS6, Class XA, IO, 1.082s, 2047 |
1,491,111 |
104,814 |
||
|
GCCFC Commercial Mortgage Trust FRB Ser. 05-GG3, Class D, 4.986s, 2042 |
44,000 |
44,212 |
||
|
GE Capital Commercial Mortgage Corp. Trust FRB Ser. 06-C1, Class AJ, 5.273s, 2044 |
120,000 |
120,715 |
||
|
GS Mortgage Securities Corp. II Ser. 05-GG4, Class B, 4.841s, 2039 |
44,980 |
44,925 |
||
|
GS Mortgage Securities Trust FRB Ser. 14-GC22, Class XA, IO, 1.082s, 2047 F |
2,107,713 |
145,039 |
||
|
GS Mortgage Securities Trust 144A FRB Ser. 10-C1, Class D, 6.036s, 2043 |
158,403 |
174,830 |
||
|
JPMorgan Chase Commercial Mortgage Securities Trust |
||||
|
FRB Ser. 06-LDP7, Class B, 5.905s, 2045 |
118,000 |
83,425 |
||
|
Ser. 06-LDP6, Class AJ, 5.565s, 2043 |
24,000 |
24,392 |
||
|
Ser. 06-LDP8, Class AJ, 5.48s, 2045 |
386,000 |
393,527 |
||
|
Ser. 04-LN2, Class A2, 5.115s, 2041 |
9,983 |
10,004 |
||
|
FRB Ser. 13-LC11, Class D, 4.24s, 2046 |
53,000 |
51,188 |
||
|
FRB Ser. 13-C10, Class C, 4.157s, 2047 |
108,000 |
111,391 |
||
|
JPMorgan Chase Commercial Mortgage Securities Trust 144A |
||||
|
FRB Ser. 10-C1, Class D, 6.256s, 2043 |
142,000 |
160,140 |
||
|
FRB Ser. 11-C3, Class E, 5.567s, 2046 |
213,000 |
230,578 |
||
|
FRB Ser. 12-C6, Class E, 5.207s, 2045 |
114,000 |
117,869 |
||
|
LB-UBS Commercial Mortgage Trust |
||||
|
Ser. 07-C6, Class A4, 5.858s, 2040 |
74,505 |
77,678 |
||
|
Ser. 06-C6, Class E, 5.541s, 2039 |
125,000 |
123,529 |
||
|
Ser. 06-C6, Class D, 5.502s, 2039 |
125,000 |
123,269 |
||
|
ML-CFC Commercial Mortgage Trust Ser. 06-3, Class AJ, 5.485s, 2046 |
47,000 |
47,513 |
||
|
Morgan Stanley Bank of America Merrill Lynch Trust |
||||
|
FRB Ser. 13-C11, Class C, 4.415s, 2046 |
83,000 |
86,120 |
||
|
FRB Ser. 14-C17, Class XA, IO, 1.282s, 2047 |
917,366 |
69,280 |
||
|
FRB Ser. 13-C12, Class XA, IO, 0.998s, 2046 |
858,996 |
41,308 |
||
|
Morgan Stanley Capital I Trust |
||||
|
Ser. 06-HQ9, Class C, 5.842s, 2044 |
117,000 |
121,051 |
||
|
FRB Ser. 06-HQ8, Class D, 5.498s, 2044 |
125,000 |
124,570 |
||
|
Morgan Stanley Capital I Trust 144A FRB Ser. 11-C3, Class E, 5.183s, 2049 |
56,000 |
59,143 |
Dynamic Risk Allocation Fund 59
|
MORTGAGE-BACKED SECURITIES (3.4%)* cont. |
Principal |
Value |
||
|
Commercial mortgage-backed securities cont. |
||||
|
UBS-Barclays Commercial Mortgage Trust 144A |
||||
|
FRB Ser. 12-C3, Class C, 4.958s, 2049 |
$50,000 |
$53,731 |
||
|
FRB Ser. 13-C6, Class D, 4.35s, 2046 |
110,000 |
105,227 |
||
|
Wachovia Bank Commercial Mortgage Trust FRB Ser. 06-C25, Class AJ, 5.712s, 2043 |
270,000 |
276,723 |
||
|
WF-RBS Commercial Mortgage Trust |
||||
|
Ser. 14-C19, Class C, 4.646s, 2047 F |
53,000 |
56,447 |
||
|
Ser. 13-C18, Class AS, 4.387s, 2046 |
63,000 |
69,631 |
||
|
Ser. 13-UBS1, Class AS, 4.306s, 2046 |
48,000 |
52,741 |
||
|
FRB Ser. 13-C17, Class XA, IO, 1.58s, 2046 |
1,447,452 |
114,010 |
||
|
FRB Ser. 14-C19, Class XA, IO, 1.303s, 2047 |
1,164,349 |
86,744 |
||
|
WF-RBS Commercial Mortgage Trust 144A |
||||
|
FRB Ser. 11-C2, Class D, 5.466s, 2044 |
169,000 |
182,953 |
||
|
FRB Ser. 13-C16, Class D, 4.983s, 2046 |
77,000 |
77,569 |
||
|
FRB Ser. 12-C10, Class D, 4.457s, 2045 |
48,000 |
47,760 |
||
|
FRB Ser. 12-C9, Class XA, IO, 2.195s, 2045 |
870,435 |
91,413 |
||
|
FRB Ser. 11-C5, Class XA, IO, 1.969s, 2044 |
544,586 |
45,370 |
||
|
FRB Ser. 12-C10, Class XA, IO, 1.78s, 2045 |
2,738,873 |
259,810 |
||
|
FRB Ser. 13-C12, Class XA, IO, 1.484s, 2048 |
256,786 |
19,727 |
||
|
5,555,760 |
||||
|
Residential mortgage-backed securities (non-agency) (0.8%) |
||||
|
APS Resecuritization Trust 144A FRB Ser. 15-1, Class 2M, 0.316s, 2054 |
100,000 |
76,188 |
||
|
BCAP, LLC Trust 144A FRB Ser. 15-RR2, Class 22A3, 0.371s, 2035 |
125,000 |
111,875 |
||
|
Bear Stearns Alt-A Trust FRB Ser. 05-7, Class 11A2, 0.865s, 2035 |
74,608 |
68,079 |
||
|
CSMC Trust 144A FRB Ser. 13-5R, Class 1A6, 0.398s, 2036 |
110,000 |
89,100 |
||
|
Nomura Resecuritization Trust 144A |
||||
|
FRB Ser. 15-1R, Class 6A9, 0.404s, 2047 |
160,000 |
99,200 |
||
|
FRB Ser. 14-7R, Class 2A3, 0.374s, 2035 |
124,654 |
104,709 |
||
|
WaMu Mortgage Pass-Through Certificates Trust |
||||
|
FRB Ser. 04-AR12, Class A2B, 0.648s, 2044 |
396,975 |
360,255 |
||
|
FRB Ser. 05-AR11, Class A1B3, 0.585s, 2045 |
314,092 |
283,468 |
||
|
FRB Ser. 05-AR9, Class A1B, 0.565s, 2045 |
395,642 |
371,328 |
||
|
Wells Fargo Mortgage Loan Trust 144A FRB Ser. 12-RR2, Class 1A2, 0.377s, 2047 |
60,000 |
44,350 |
||
|
1,608,552 |
||||
|
Total mortgage-backed securities (cost $7,143,993) |
|
|||
|
ASSET-BACKED SECURITIES (2.1%)* |
Principal |
Value |
||
|
Station Place Securitization Trust FRB Ser. 14-3, Class A, 1.056s, 2016 |
$2,682,000 |
$2,682,000 |
||
|
Station Place Securitization Trust 144A FRB Ser. 14-2, Class A, 1.055s, 2016 |
1,712,000 |
1,712,000 |
||
|
Total asset-backed securities (cost $4,394,000) |
|
|||
60 Dynamic Risk Allocation Fund
|
FOREIGN GOVERNMENT AND AGENCY |
Principal |
|
||
|
Argentina (Republic of) sr. unsec. unsub. notes Ser. LOC, 8.28s, 2033 (Argentina) |
$719,245 |
$629,699 |
||
|
Argentina (Republic of) sr. unsec. unsub. notes Ser. NY, 8.28s, 2033 (Argentina) (In default) † |
121,977 |
122,282 |
||
|
Buenos Aires (Province of) 144A sr. unsec. unsub. notes 10 7/8s, 2021 (Argentina) |
150,000 |
153,000 |
||
|
United Mexican States sr. unsec. unsub. notes Ser. MTN, 4 3/4s, 2044 (Mexico) |
120,000 |
120,417 |
||
|
Total foreign government and agency bonds and notes (cost $1,015,685) |
|
|||
|
PURCHASED OPTIONS |
Expiration date/strike price |
Contract amount |
Value |
|
|
SPDR S&P 500 ETF Trust (Put) |
May-16/$183.00 |
$38,022 |
$230,131 |
|
|
SPDR S&P 500 ETF Trust (Put) |
Apr-16/180.00 |
37,929 |
187,026 |
|
|
SPDR S&P 500 ETF Trust (Put) |
Mar-16/183.00 |
37,812 |
185,844 |
|
|
SPDR S&P 500 ETF Trust (Put) |
Feb-16/183.00 |
36,576 |
154,444 |
|
|
SPDR S&P 500 ETF Trust (Put) |
Jan-16/170.00 |
37,854 |
77,998 |
|
|
SPDR S&P 500 ETF Trust (Put) |
Dec-15/180.00 |
38,482 |
94,630 |
|
|
Total purchased options outstanding (cost $1,524,846) |
|
|||
|
SENIOR LOANS (0.2%)* c |
Principal |
Value |
||
|
Caesars Entertainment Operating Co., Inc. bank term loan FRN Ser. B6, 11s, 2017 |
$243,508 |
$228,974 |
||
|
Caesars Entertainment Operating Co., Inc. bank term loan FRN Ser. B7, 13s, 2017 |
19,900 |
18,362 |
||
|
Fieldwood Energy, LLC bank term loan FRN 8 3/8s, 2020 |
55,000 |
45,283 |
||
|
Getty Images, Inc. bank term loan FRN Ser. B, 4 3/4s, 2019 |
60,000 |
49,137 |
||
|
Grifols Worldwide Operations USA, Inc. bank term loan FRN 3.184s, 2021 |
64,511 |
64,658 |
||
|
Neiman Marcus Group, Ltd., Inc. bank term loan FRN 4 1/4s, 2020 |
74,063 |
74,116 |
||
|
Total senior loans (cost $500,476) |
|
|||
|
PREFERRED STOCKS (0.1%)* |
Shares |
Value |
|
|
Ally Financial, Inc. 144A 7.00% cum. pfd. |
43 |
$43,430 |
|
|
Citigroup, Inc. Ser. K, $1.719 ARP |
2,640 |
71,201 |
|
|
HSBC USA, Inc. $0.88 pfd. (United Kingdom) |
6,280 |
142,054 |
|
|
M/I Homes, Inc. Ser. A, $2.438 pfd. |
1,230 |
31,525 |
|
|
Total preferred stocks (cost $278,354) |
|
||
|
CONVERTIBLE BONDS AND NOTES (—%)* |
Principal |
Value |
||
|
iStar Financial, Inc. cv. sr. unsec. unsub. notes 3s, 2016 R |
$35,000 |
$44,297 |
||
|
Total convertible bonds and notes (cost $36,457) |
|
|||
Dynamic Risk Allocation Fund 61
|
INVESTMENT COMPANIES (—%)* |
Shares |
Value |
|
|
Hercules Technology Growth Capital, Inc. |
905 |
$11,611 |
|
|
Medley Capital Corp. |
1,816 |
17,016 |
|
|
Solar Capital, Ltd. |
736 |
14,072 |
|
|
Total investment companies (cost $43,841) |
|
||
|
CONVERTIBLE PREFERRED STOCKS (—%)* |
Shares |
Value |
|
|
EPR Properties Ser. C, $1.438 cv. pfd. R |
1,550 |
$37,006 |
|
|
Total convertible preferred stocks (cost $34,286) |
|
||
|
SHORT-TERM INVESTMENTS (30.0%)* |
Principal |
Value |
|
|
Putnam Cash Collateral Pool, LLC 0.23% d |
Shares 426,625 |
$426,625 |
|
|
Putnam Money Market Liquidity Fund 0.08% L |
Shares 10,139,420 |
10,139,420 |
|
|
Putnam Short Term Investment Fund 0.07% L |
Shares 41,010,048 |
41,010,048 |
|
|
SSgA Prime Money Market Fund Class N 0.03% P |
Shares 60,000 |
60,000 |
|
|
U.S. Treasury Bills 0.01%, October 1, 2015 § |
$500,000 |
499,975 |
|
|
U.S. Treasury Bills 0.02%, August 27, 2015 # Δ § |
621,000 |
620,985 |
|
|
U.S. Treasury Bills 0.01%, August 20, 2015 # Δ § |
1,740,000 |
1,739,962 |
|
|
U.S. Treasury Bills 0.02%, August 13, 2015 # Δ § |
1,216,000 |
1,215,988 |
|
|
U.S. Treasury Bills 0.02%, July 23, 2015 # Δ § |
1,050,000 |
1,049,966 |
|
|
U.S. Treasury Bills 0.01%, July 9, 2015 Δ |
100,000 |
99,999 |
|
|
U.S. Treasury Bills 0.02%, July 2, 2015 # Δ § |
6,500,000 |
6,499,914 |
|
|
U.S. Treasury Bills 0.09%, June 11, 2015 # Δ § |
388,000 |
387,989 |
|
|
Total short-term investments (cost $63,750,815) |
|
||
|
TOTAL INVESTMENTS |
||
|
Total investments (cost $225,087,469) |
$234,948,809 |
|
|
||
|
CAD |
Canadian Dollar |
|
|
|
||
|
ADR |
American Depository Receipts: represents ownership of foreign securities on deposit with a custodian bank |
|
|
ARP |
Adjustable Rate Preferred Stock: the rate shown is the current interest rate at the close of the reporting period |
|
|
BKNT |
Bank Note |
|
|
bp |
Basis Points |
|
|
ETF |
Exchange Traded Fund |
|
|
FRB |
Floating Rate Bonds: the rate shown is the current interest rate at the close of the reporting period |
|
|
FRN |
Floating Rate Notes: the rate shown is the current interest rate or yield at the close of the reporting period |
|
|
GMTN |
Global Medium Term Notes |
|
|
IO |
Interest Only |
|
|
MTN |
Medium Term Notes |
|
|
SPDR |
S&P Depository Receipts |
|
|
TBA |
To Be Announced Commitments |
|
62 Dynamic Risk Allocation Fund
|
Notes to the fund’s portfolio |
|
|
Unless noted otherwise, the notes to the fund’s portfolio are for the close of the fund’s reporting period, which ran from June 1, 2014 through May 31, 2015 (the reporting period). Within the following notes to the portfolio, references to “ASC 820” represent Accounting Standards Codification 820 Fair Value Measurements and Disclosures and references to “OTC”, if any, represent over-the-counter. |
|
|
* |
Percentages indicated are based on net assets of $212,849,976. |
|
††† |
The value of the commodity linked notes, which are marked to market daily, may be based on a multiple of the performance of the index. The multiple (or leverage) will increase the volatility of the note’s value relative to the change in the underlying index. |
|
† |
This security is non-income-producing. |
|
†† |
The interest rate and date shown parenthetically represent the new interest rate to be paid and the date the fund will begin accruing interest at this rate. |
|
‡‡ |
Income may be received in cash or additional securities at the discretion of the issuer. |
|
§ |
This security, in part or in entirety, was pledged and segregated with the broker to cover margin requirements for futures contracts at the close of the reporting period. |
|
Δ |
This security, in part or in entirety, was pledged and segregated with the custodian for collateral on certain derivative contracts at the close of the reporting period. |
|
§ |
This security, in part or in entirety, was pledged and segregated with the custodian for collateral on the initial margin on certain centrally cleared derivative contracts at the close of the reporting period. |
|
c |
Senior loans are exempt from registration under the Securities Act of 1933, as amended, but contain certain restrictions on resale and cannot be sold publicly. These loans pay interest at rates which adjust periodically. The interest rates shown for senior loans are the current interest rates at the close of the reporting period. Senior loans are also subject to mandatory and/or optional prepayment which cannot be predicted. As a result, the remaining maturity may be substantially less than the stated maturity shown (Notes 1 and 6). |
|
d |
Affiliated company. See Note 1 to the financial statements regarding securities lending. The rate quoted in the security description is the annualized 7-day yield of the fund at the close of the reporting period. |
|
F |
This security is valued at fair value following procedures approved by the Trustees. Securities may be classified as Level 2 or Level 3 for ASC 820 based on the securities’ valuation inputs. At the close of the reporting period, fair value pricing was also used for certain foreign securities in the portfolio (Note 1). |
|
L |
Affiliated company (Note 5). The rate quoted in the security description is the annualized 7-day yield of the fund at the close of the reporting period. |
|
P |
This security was pledged, or purchased with cash that was pledged, to the fund for collateral on certain derivative contracts. The rate quoted in the security description is the annualized 7-day yield of the fund at the close of the reporting period (Note 1). |
|
R |
Real Estate Investment Trust. |
|
S |
Security on loan, in part or in entirety, at the close of the reporting period (Note 1). |
|
At the close of the reporting period, the fund maintained liquid assets totaling $172,861,393 to cover certain derivative contracts and delayed delivery securities. |
|
|
Unless otherwise noted, the rates quoted in Short-term investments security descriptions represent the weighted average yield to maturity. |
|
|
Debt obligations are considered secured unless otherwise indicated. |
|
|
144A after the name of an issuer represents securities exempt from registration under Rule 144A under the Securities Act of 1933, as amended. These securities may be resold in transactions exempt from registration, normally to qualified institutional buyers. |
|
|
See Note 1 to the financial statements regarding TBA commitments. |
|
|
The dates shown on debt obligations are the original maturity dates. |
Dynamic Risk Allocation Fund 63
|
DIVERSIFICATION BY COUNTRY |
|
|
Distribution of investments by country of risk at the close of the reporting period, excluding collateral received, if any (as a percentage of Portfolio Value): |
|
United States |
81.8% |
|
United Kingdom |
6.6 |
|
Japan |
2.3 |
|
France |
1.7 |
|
Switzerland |
1.0 |
|
Germany |
1.0 |
|
Canada |
0.9 |
|
Australia |
0.7 |
|
Netherlands |
0.6 |
|
Other |
3.4 |
|
Total |
100.0% |
|
|
|||||||
|
Counterparty |
Currency |
Contract |
Delivery |
Value |
Aggregate |
Unrealized |
|
|
|
|||||||
|
Australian Dollar |
Buy |
7/15/15 |
$169,340 |
$168,547 |
$793 |
||
|
British Pound |
Buy |
6/17/15 |
158,171 |
159,097 |
(926) |
||
|
Canadian Dollar |
Sell |
7/15/15 |
294,586 |
289,226 |
(5,360) |
||
|
Euro |
Buy |
6/17/15 |
326,257 |
320,380 |
5,877 |
||
|
Euro |
Sell |
6/17/15 |
323,071 |
328,631 |
5,560 |
||
|
Mexican Peso |
Buy |
7/15/15 |
322,276 |
325,481 |
(3,205) |
||
|
Norwegian Krone |
Buy |
6/17/15 |
327,992 |
325,259 |
2,733 |
||
|
Norwegian Krone |
Sell |
6/17/15 |
309,483 |
311,454 |
1,971 |
||
|
|
|||||||
|
Australian Dollar |
Buy |
7/15/15 |
265,682 |
278,176 |
(12,494) |
||
|
British Pound |
Buy |
6/17/15 |
158,477 |
161,526 |
(3,049) |
||
|
Canadian Dollar |
Sell |
7/15/15 |
102,294 |
98,571 |
(3,723) |
||
|
Euro |
Buy |
6/17/15 |
8,018 |
10,007 |
(1,989) |
||
|
Hong Kong Dollar |
Sell |
8/19/15 |
431,684 |
431,892 |
208 |
||
|
Japanese Yen |
Sell |
8/19/15 |
852,808 |
875,391 |
22,583 |
||
|
Mexican Peso |
Buy |
7/15/15 |
299,502 |
304,271 |
(4,769) |
||
|
New Zealand Dollar |
Sell |
7/15/15 |
240,344 |
256,918 |
16,574 |
||
|
Norwegian Krone |
Buy |
6/17/15 |
309,804 |
296,482 |
13,322 |
||
|
Singapore Dollar |
Sell |
8/19/15 |
363,341 |
369,258 |
5,917 |
||
|
Swedish Krona |
Sell |
6/17/15 |
639,126 |
640,778 |
1,652 |
||
|
Swiss Franc |
Sell |
6/17/15 |
39,601 |
39,024 |
(577) |
||
|
|
|||||||
|
Australian Dollar |
Sell |
7/15/15 |
43,174 |
43,396 |
222 |
||
|
British Pound |
Buy |
6/17/15 |
157,712 |
158,633 |
(921) |
||
|
Canadian Dollar |
Sell |
7/15/15 |
366,908 |
357,386 |
(9,522) |
||
|
Chilean Peso |
Buy |
7/15/15 |
12,209 |
12,413 |
(204) |
||
|
Danish Krone |
Sell |
6/17/15 |
178,062 |
196,217 |
18,155 |
||
|
Euro |
Buy |
6/17/15 |
950,320 |
977,500 |
(27,180) |
||
|
Japanese Yen |
Sell |
8/19/15 |
221,841 |
229,641 |
7,800 |
||
|
Mexican Peso |
Buy |
7/15/15 |
303,626 |
308,481 |
(4,855) |
||
|
New Zealand Dollar |
Sell |
7/15/15 |
44,946 |
45,121 |
175 |
||
|
Norwegian Krone |
Buy |
6/17/15 |
56,890 |
50,125 |
6,765 |
||
64 Dynamic Risk Allocation Fund
|
|
|||||||
|
Counterparty |
Currency |
Contract |
Delivery |
Value |
Aggregate |
Unrealized |
|
|
|
|||||||
|
Philippine Peso |
Buy |
8/19/15 |
$155,997 |
$156,077 |
$(80) |
||
|
Swedish Krona |
Sell |
6/17/15 |
164,451 |
160,785 |
(3,666) |
||
|
Swiss Franc |
Sell |
6/17/15 |
136,367 |
137,438 |
1,071 |
||
|
|
|||||||
|
Australian Dollar |
Buy |
7/15/15 |
608,175 |
619,770 |
(11,595) |
||
|
Australian Dollar |
Sell |
7/15/15 |
612,294 |
608,850 |
(3,444) |
||
|
British Pound |
Buy |
6/17/15 |
1,055,849 |
1,038,908 |
16,941 |
||
|
British Pound |
Sell |
6/17/15 |
323,066 |
312,447 |
(10,619) |
||
|
Canadian Dollar |
Buy |
7/15/15 |
326,568 |
332,320 |
(5,752) |
||
|
Canadian Dollar |
Sell |
7/15/15 |
1,006,544 |
989,212 |
(17,332) |
||
|
Euro |
Buy |
6/17/15 |
330,321 |
333,158 |
(2,837) |
||
|
Euro |
Sell |
6/17/15 |
1,016,340 |
1,015,059 |
(1,281) |
||
|
Indian Rupee |
Buy |
8/19/15 |
346,253 |
344,692 |
1,561 |
||
|
Japanese Yen |
Buy |
8/19/15 |
2,471,093 |
2,557,541 |
(86,448) |
||
|
New Zealand Dollar |
Buy |
7/15/15 |
197,660 |
206,937 |
(9,277) |
||
|
New Zealand Dollar |
Sell |
7/15/15 |
305,782 |
330,333 |
24,551 |
||
|
Norwegian Krone |
Buy |
6/17/15 |
161,166 |
162,209 |
(1,043) |
||
|
Singapore Dollar |
Sell |
8/19/15 |
327,799 |
333,135 |
5,336 |
||
|
Swedish Krona |
Buy |
6/17/15 |
322,707 |
319,256 |
3,451 |
||
|
Swedish Krona |
Sell |
6/17/15 |
324,103 |
327,955 |
3,852 |
||
|
Swiss Franc |
Buy |
6/17/15 |
659,909 |
643,014 |
16,895 |
||
|
Swiss Franc |
Sell |
6/17/15 |
480,215 |
463,012 |
(17,203) |
||
|
|
|||||||
|
Australian Dollar |
Sell |
7/15/15 |
158,432 |
151,466 |
(6,966) |
||
|
British Pound |
Buy |
6/17/15 |
143,500 |
138,689 |
4,811 |
||
|
Canadian Dollar |
Sell |
7/15/15 |
285,265 |
272,152 |
(13,113) |
||
|
Euro |
Buy |
6/17/15 |
3,150,961 |
3,081,622 |
69,339 |
||
|
New Zealand Dollar |
Buy |
7/15/15 |
198,366 |
207,669 |
(9,303) |
||
|
Norwegian Krone |
Sell |
6/17/15 |
249,402 |
251,033 |
1,631 |
||
|
Polish Zloty |
Sell |
6/17/15 |
311,324 |
312,349 |
1,025 |
||
|
Swedish Krona |
Sell |
6/17/15 |
298,881 |
305,420 |
6,539 |
||
|
Turkish Lira |
Buy |
6/17/15 |
35,928 |
42,686 |
(6,758) |
||
|
|
|||||||
|
Australian Dollar |
Buy |
7/15/15 |
314,347 |
312,384 |
1,963 |
||
|
British Pound |
Sell |
6/17/15 |
168,257 |
166,061 |
(2,196) |
||
|
Canadian Dollar |
Sell |
7/15/15 |
90,160 |
88,570 |
(1,590) |
||
|
Euro |
Sell |
6/17/15 |
167,852 |
171,755 |
3,903 |
||
|
Japanese Yen |
Buy |
8/19/15 |
1,439,573 |
1,490,210 |
(50,637) |
||
|
New Zealand Dollar |
Buy |
7/15/15 |
144,658 |
151,458 |
(6,800) |
||
|
Norwegian Krone |
Sell |
6/17/15 |
62,666 |
63,088 |
422 |
||
|
|
|||||||
|
Australian Dollar |
Sell |
7/15/15 |
75,593 |
66,837 |
(8,756) |
||
|
British Pound |
Buy |
6/17/15 |
739,660 |
721,028 |
18,632 |
||
Dynamic Risk Allocation Fund 65
|
|
|||||||
|
Counterparty |
Currency |
Contract |
Delivery |
Value |
Aggregate |
Unrealized |
|
|
|
|||||||
|
Canadian Dollar |
Sell |
7/15/15 |
$418,817 |
$411,825 |
$(6,992) |
||
|
Euro |
Buy |
6/17/15 |
168,182 |
174,009 |
(5,827) |
||
|
Japanese Yen |
Buy |
8/19/15 |
1,439,573 |
1,490,340 |
(50,767) |
||
|
New Zealand Dollar |
Buy |
7/15/15 |
140,842 |
147,398 |
(6,556) |
||
|
Swedish Krona |
Sell |
6/17/15 |
131,697 |
134,606 |
2,909 |
||
|
|
|||||||
|
Australian Dollar |
Buy |
7/15/15 |
272,622 |
265,454 |
7,168 |
||
|
British Pound |
Sell |
6/17/15 |
1,473,665 |
1,509,333 |
35,668 |
||
|
Canadian Dollar |
Buy |
7/15/15 |
594,396 |
607,474 |
(13,078) |
||
|
Euro |
Buy |
6/17/15 |
2,796,802 |
2,712,953 |
83,849 |
||
|
Indian Rupee |
Sell |
8/19/15 |
49,507 |
49,417 |
(90) |
||
|
Japanese Yen |
Sell |
8/19/15 |
93,901 |
97,209 |
3,308 |
||
|
Mexican Peso |
Buy |
7/15/15 |
377,877 |
382,169 |
(4,292) |
||
|
New Zealand Dollar |
Sell |
7/15/15 |
114,130 |
127,099 |
12,969 |
||
|
Norwegian Krone |
Buy |
6/17/15 |
280,092 |
270,318 |
9,774 |
||
|
Philippine Peso |
Buy |
8/19/15 |
155,995 |
155,571 |
424 |
||
|
Singapore Dollar |
Sell |
8/19/15 |
422,873 |
427,634 |
4,761 |
||
|
Swedish Krona |
Sell |
6/17/15 |
166,480 |
158,349 |
(8,131) |
||
|
Swiss Franc |
Sell |
6/17/15 |
1,461,615 |
1,439,068 |
(22,547) |
||
|
|
|||||||
|
Australian Dollar |
Buy |
7/15/15 |
235,093 |
241,523 |
(6,430) |
||
|
British Pound |
Buy |
6/17/15 |
405,132 |
425,758 |
(20,626) |
||
|
Canadian Dollar |
Buy |
7/15/15 |
25,634 |
44,515 |
(18,881) |
||
|
Euro |
Sell |
6/17/15 |
100,843 |
118,469 |
17,626 |
||
|
Japanese Yen |
Sell |
8/19/15 |
465,434 |
478,117 |
12,683 |
||
|
New Zealand Dollar |
Sell |
7/15/15 |
326,559 |
339,883 |
13,324 |
||
|
Norwegian Krone |
Buy |
6/17/15 |
374,116 |
371,968 |
2,148 |
||
|
Singapore Dollar |
Buy |
8/19/15 |
31,691 |
32,224 |
(533) |
||
|
Swedish Krona |
Sell |
6/17/15 |
625,717 |
628,319 |
2,602 |
||
|
|
|||||||
|
Australian Dollar |
Sell |
7/15/15 |
206,946 |
205,281 |
(1,665) |
||
|
Brazilian Real |
Buy |
7/2/15 |
309,887 |
319,545 |
(9,658) |
||
|
British Pound |
Sell |
6/17/15 |
11,614 |
2,977 |
(8,637) |
||
|
Canadian Dollar |
Sell |
7/15/15 |
526,012 |
507,265 |
(18,747) |
||
|
Chilean Peso |
Buy |
7/15/15 |
398 |
399 |
(1) |
||
|
Euro |
Buy |
6/17/15 |
835,525 |
836,947 |
(1,422) |
||
|
Hungarian Forint |
Buy |
6/17/15 |
308,944 |
318,277 |
(9,333) |
||
|
Israeli Shekel |
Buy |
7/15/15 |
6,771 |
6,610 |
161 |
||
|
Japanese Yen |
Sell |
8/19/15 |
457,027 |
475,031 |
18,004 |
||
|
New Zealand Dollar |
Buy |
7/15/15 |
48,973 |
51,274 |
(2,301) |
||
|
Norwegian Krone |
Buy |
6/17/15 |
11,190 |
11,260 |
(70) |
||
|
Singapore Dollar |
Sell |
8/19/15 |
316,321 |
319,351 |
3,030 |
||
|
Swedish Krona |
Buy |
6/17/15 |
375,792 |
373,885 |
1,907 |
||
66 Dynamic Risk Allocation Fund
|
|
|||||||
|
Counterparty |
Currency |
Contract |
Delivery |
Value |
Aggregate |
Unrealized |
|
|
|
|||||||
|
Swiss Franc |
Sell |
6/17/15 |
$44,604 |
$43,994 |
$(610) |
||
|
Turkish Lira |
Sell |
6/17/15 |
64,378 |
53,848 |
(10,530) |
||
|
|
|||||||
|
Australian Dollar |
Buy |
7/15/15 |
212,591 |
218,475 |
(5,884) |
||
|
Australian Dollar |
Sell |
7/15/15 |
44,395 |
44,145 |
(250) |
||
|
British Pound |
Buy |
6/17/15 |
744,703 |
726,182 |
18,521 |
||
|
Canadian Dollar |
Sell |
7/15/15 |
373,175 |
366,717 |
(6,458) |
||
|
Chilean Peso |
Buy |
7/15/15 |
398 |
402 |
(4) |
||
|
Euro |
Buy |
6/17/15 |
2,680,251 |
2,607,514 |
72,737 |
||
|
Israeli Shekel |
Buy |
7/15/15 |
321,022 |
325,383 |
(4,361) |
||
|
Israeli Shekel |
Sell |
7/15/15 |
322,934 |
322,120 |
(814) |
||
|
Japanese Yen |
Sell |
8/19/15 |
91,649 |
94,882 |
3,233 |
||
|
New Zealand Dollar |
Buy |
7/15/15 |
429,523 |
449,625 |
(20,102) |
||
|
New Zealand Dollar |
Sell |
7/15/15 |
149,746 |
158,605 |
8,859 |
||
|
Norwegian Krone |
Buy |
6/17/15 |
481,119 |
459,845 |
21,274 |
||
|
Norwegian Krone |
Sell |
6/17/15 |
452,680 |
442,373 |
(10,307) |
||
|
Swedish Krona |
Buy |
6/17/15 |
312,829 |
318,956 |
(6,127) |
||
|
Swedish Krona |
Sell |
6/17/15 |
342,122 |
338,522 |
(3,600) |
||
|
Swiss Franc |
Buy |
6/17/15 |
552,497 |
560,732 |
(8,235) |
||
|
|
|||||||
|
Australian Dollar |
Sell |
7/15/15 |
13,273 |
6,259 |
(7,014) |
||
|
British Pound |
Buy |
6/17/15 |
302,741 |
304,502 |
(1,761) |
||
|
Canadian Dollar |
Sell |
7/15/15 |
431,675 |
424,235 |
(7,440) |
||
|
Euro |
Buy |
6/17/15 |
56,463 |
57,784 |
(1,321) |
||
|
Japanese Yen |
Buy |
8/19/15 |
1,439,574 |
1,490,198 |
(50,624) |
||
|
New Zealand Dollar |
Buy |
7/15/15 |
346,487 |
362,721 |
(16,234) |
||
|
Total |
|
||||||
|
|
|||||||
|
Number of |
Value |
Expiration |
Unrealized |
||||
|
Euro STOXX 50 Index (Long) |
75 |
$2,934,109 |
Jun-15 |
$(98,712) |
|||
|
Euro-Bobl 5 yr (Long) |
50 |
7,075,798 |
Jun-15 |
(11,844) |
|||
|
Euro-Bund 10 yr (Long) |
49 |
8,364,730 |
Jun-15 |
(61,682) |
|||
|
Euro-Buxl 30 yr (Long) |
24 |
4,270,718 |
Jun-15 |
(59,373) |
|||
|
Euro-Schatz 2 yr (Long) |
10 |
1,221,035 |
Jun-15 |
247 |
|||
|
Japanese Government Bond 10 yr (Long) |
21 |
24,978,689 |
Jun-15 |
75,418 |
|||
|
Russell 2000 Index Mini (Short) |
28 |
3,484,040 |
Jun-15 |
(95,536) |
|||
|
S&P 500 Index E-Mini (Long) |
1 |
105,300 |
Jun-15 |
3,701 |
|||
|
S&P 500 Index E-Mini (Short) |
13 |
1,368,900 |
Jun-15 |
(7,942) |
|||
|
Tokyo Price Index (Long) |
32 |
4,308,263 |
Jun-15 |
421,429 |
|||
|
U.K. Gilt 10 yr (Long) |
34 |
6,121,548 |
Sep-15 |
38,891 |
|||
Dynamic Risk Allocation Fund 67
|
|
|||||||
|
Number of |
Value |
Expiration |
Unrealized |
||||
|
U.S. Treasury Bond 30 yr (Long) |
13 |
$2,023,125 |
Sep-15 |
$12,060 |
|||
|
U.S. Treasury Bond Ultra 30 yr (Long) |
19 |
3,045,344 |
Sep-15 |
32,573 |
|||
|
U.S. Treasury Bond Ultra 30 yr (Short) |
1 |
160,281 |
Sep-15 |
(1,721) |
|||
|
U.S. Treasury Note 2 yr (Long) |
38 |
8,316,656 |
Sep-15 |
11,206 |
|||
|
U.S. Treasury Note 2 yr (Short) |
1 |
218,859 |
Sep-15 |
(299) |
|||
|
U.S. Treasury Note 5 yr (Long) |
72 |
8,620,313 |
Sep-15 |
33,044 |
|||
|
U.S. Treasury Note 5 yr (Short) |
20 |
2,394,531 |
Sep-15 |
(9,259) |
|||
|
U.S. Treasury Note 10 yr (Long) |
17 |
2,170,688 |
Sep-15 |
7,005 |
|||
|
U.S. Treasury Note 10 yr (Short) |
165 |
21,068,438 |
Sep-15 |
(45,953) |
|||
|
Total |
|
||||||
|
|
|||||||
|
Expiration |
Contract |
Value |
|||||
|
SPDR S&P 500 ETF Trust (Call) |
Jun-15/$217.00 |
$90,892 |
$29,994 |
||||
|
SPDR S&P 500 ETF Trust (Call) |
Jun-15/216.50 |
34,085 |
11,589 |
||||
|
SPDR S&P 500 ETF Trust (Call) |
Jun-15/218.50 |
33,431 |
3,017 |
||||
|
SPDR S&P 500 ETF Trust (Call) |
Jun-15/218.00 |
34,112 |
1,099 |
||||
|
SPDR S&P 500 ETF Trust (Call) |
Jun-15/217.50 |
34,194 |
396 |
||||
|
Total |
|
||||||
|
CENTRALLY CLEARED INTEREST RATE SWAP CONTRACTS OUTSTANDING at 5/31/15 |
|||||||
|
Notional amount |
Upfront |
Termination |
Payments |
Payments |
|
||
|
$62,100,000 E |
$(614,531) |
6/17/25 |
3 month USD-LIBOR-BBA |
2.20% |
$(595,528) |
||
|
4,342,100 E |
42,968 |
6/17/25 |
2.20% |
3 month USD-LIBOR-BBA |
41,640 |
||
|
7,500,000 E |
(10,073) |
6/17/17 |
3 month USD-LIBOR-BBA |
1.10% |
23,399 |
||
|
13,265,800 E |
16,479 |
6/17/17 |
1.10% |
3 month USD-LIBOR-BBA |
(42,725) |
||
|
2,100,000 E |
24,375 |
6/17/20 |
1.80% |
3 month USD-LIBOR-BBA |
7,230 |
||
|
614,600 E |
(7,799) |
6/17/45 |
2.38% |
3 month USD-LIBOR-BBA |
23,954 |
||
|
1,840,200 E |
22,976 |
6/17/45 |
3 month USD-LIBOR-BBA |
2.38% |
(72,098) |
||
|
11,115,600 E |
(456,749) |
6/17/20 |
3 month USD-LIBOR-BBA |
2.40% |
(42,126) |
||
|
926,300 E |
37,986 |
6/17/20 |
2.40% |
3 month USD-LIBOR-BBA |
3,434 |
||
68 Dynamic Risk Allocation Fund
|
CENTRALLY CLEARED INTEREST RATE SWAP CONTRACTS OUTSTANDING at 5/31/15 cont. |
|||||||
|
Notional amount |
Upfront |
Termination |
Payments |
Payments |
|
||
|
$436,000 E |
$747 |
6/17/17 |
1.00% |
3 month USD-LIBOR-BBA |
$(330) |
||
|
10,000 E |
(18) |
6/17/20 |
1.69% |
3 month USD-LIBOR-BBA |
(46) |
||
|
173,000 E |
(1,914) |
6/17/25 |
2.21% |
3 month USD-LIBOR-BBA |
(2,126) |
||
|
6,000 E |
270 |
6/17/45 |
3.00% |
3 month USD-LIBOR-BBA |
(231) |
||
|
Total |
$(945,283) |
|
|||||
|
E Extended effective date. |
|||||||
|
OTC TOTAL RETURN SWAP CONTRACTS OUTSTANDING at 5/31/15 |
|||||||
|
Swap counterparty/ |
Upfront |
Termination |
Payments |
Total return |
|
||
|
|
|||||||
|
$3,800,000 |
$— |
9/21/21 |
(2.305%) |
USA Non Revised Consumer Price Index-Urban (CPI-U) |
$(274,687) |
||
|
5,000,000 |
— |
7/19/23 |
(2.585%) |
USA Non Revised Consumer Price Index-Urban (CPI-U) |
(441,650) |
||
|
4,000,000 |
— |
6/10/24 |
(2.50%) |
USA Non Revised Consumer Price Index-Urban (CPI-U) |
(295,300) |
||
|
1,000,000 |
— |
11/7/24 |
(2.2625%) |
USA Non Revised Consumer Price Index-Urban (CPI-U) |
(44,393) |
||
|
1,000,000 |
— |
12/8/24 |
(2.075%) |
USA Non Revised Consumer Price Index-Urban (CPI-U) |
(24,074) |
||
|
baskets |
196,783 |
— |
5/31/16 |
(3 month USD-LIBOR-BBA plus 10 bp) |
A basket (MLTRFCF5) of common stocks |
52,420 |
|
|
units |
5,066 |
— |
5/31/16 |
3 month USD-LIBOR-BBA minus 7 bp |
Russell 1000 Total Return Index |
38,375 |
|
|
|
|||||||
|
$3,739,744 |
— |
1/12/41 |
4.00% (1 month USD-LIBOR) |
Synthetic TRS Index 4.00% 30 year Fannie Mae pools |
(37,182) |
||
|
3,700,000 |
— |
5/8/23 |
(2.59%) |
USA Non Revised Consumer Price Index-Urban (CPI-U) |
(356,088) |
||
|
3,600,000 |
— |
7/19/23 |
(2.569%) |
USA Non Revised Consumer Price Index-Urban (CPI-U) |
(311,746) |
||
Dynamic Risk Allocation Fund 69
|
OTC TOTAL RETURN SWAP CONTRACTS OUTSTANDING at 5/31/15 cont. |
|||||||
|
Swap counterparty/ |
Upfront |
Termination |
Payments |
Total return |
|
||
|
|
|||||||
|
$1,500,000 |
$— |
8/7/22 |
2.515% |
USA Non Revised Consumer Price Index-Urban (CPI-U) |
$136,701 |
||
|
baskets |
69 |
— |
12/17/15 |
(3 month USD-LIBOR-BBA plus 42 bp) |
A basket (CGPUTQL2) of common stocks |
121,266 |
|
|
units |
1,512 |
— |
12/17/15 |
3 month USD-LIBOR-BBA plus 15 bp |
Russell 1000 Total Return Index |
(165,391) |
|
|
|
|||||||
|
$2,600,000 |
— |
1/9/23 |
(2.76%) |
USA Non Revised Consumer Price Index Urban (CPI-U) |
(305,903) |
||
|
3,400,000 |
— |
8/7/22 |
(2.515%) |
USA Non Revised Consumer Price Index-Urban (CPI-U) |
(309,856) |
||
|
1,600,000 |
— |
8/8/22 |
(2.5325%) |
USA Non Revised Consumer Price Index-Urban (CPI-U) |
(148,830) |
||
|
700,000 |
— |
9/10/22 |
(2.5925%) |
USA Non Revised Consumer Price Index-Urban (CPI-U) |
(67,179) |
||
|
3,300,000 |
— |
2/8/23 |
(2.81%) |
USA Non Revised Consumer Price Index-Urban (CPI-U) |
(394,327) |
||
|
6,900,000 |
— |
7/19/23 |
(2.57%) |
USA Non Revised Consumer Price Index-Urban (CPI-U) |
(598,258) |
||
|
shares |
94,529 |
— |
7/1/15 |
(3 month USD-LIBOR-BBA plus 15 bp) |
Common stock of Vanguard FTSE Emerging Markets ETF |
84,153 |
|
|
shares |
18,900 |
— |
6/8/15 |
(3 month USD-LIBOR-BBA plus 20 bp) |
Common stock of Vanguard FTSE Emerging Markets ETF |
45,129 |
|
|
shares |
37,583 |
— |
9/21/15 |
(3 month USD-LIBOR-BBA plus 0.20%) |
Vanguard Index Funds — MSCI Emerging Markets ETF |
80,886 |
|
|
|
|||||||
|
$500,000 |
— |
11/7/21 |
(2.43%) |
USA Non Revised Consumer Price Index-Urban (CPI-U) |
(43,684) |
||
70 Dynamic Risk Allocation Fund
|
OTC TOTAL RETURN SWAP CONTRACTS OUTSTANDING at 5/31/15 cont. |
|||||||
|
Swap counterparty/ |
Upfront |
Termination |
Payments |
Total return |
|
||
|
|
|||||||
|
$1,500,000 |
$— |
10/5/22 |
(2.73%) |
USA Non Revised Consumer Price Index-Urban (CPI-U) |
$(166,620) |
||
|
1,700,000 |
— |
4/5/23 |
(2.7475%) |
USA Non Revised Consumer Price Index-Urban (CPI-U) |
(190,179) |
||
|
4,400,000 |
— |
7/19/23 |
(2.58%) |
USA Non Revised Consumer Price Index-Urban (CPI-U) |
(387,860) |
||
|
2,900,000 |
— |
4/9/25 |
(2.055%) |
USA Non Revised Consumer Price Index-Urban (CPI-U) |
(3,509) |
||
|
baskets |
3,859 |
— |
12/15/15 |
(1 month USD-LIBOR-BBA plus 90 bp) |
A basket (GSCBSAUD) of common stocks |
(42,627) |
|
|
|
|||||||
|
$13,500,000 |
— |
8/7/22 |
(2.515%) |
USA Non Revised Consumer Price Index-Urban (CPI-U) |
(1,230,309) |
||
|
shares |
11,620 |
— |
7/14/15 |
(3 month USD-LIBOR-BBA plus 26 bp) |
Common stock of Vanguard FTSE Emerging Markets ETF |
(16,980) |
|
|
Total |
$— |
|
|||||
|
OTC CREDIT DEFAULT CONTRACTS OUTSTANDING at 5/31/15 |
|||||||||
|
Swap counterparty/ |
Rating*** |
Upfront |
Notional |
Termi- |
Payments |
Unrealized |
|||
|
Barclays Bank PLC |
|||||||||
|
CMBX NA |
— |
$(21) |
$2,000 |
1/17/47 |
(300 bp) |
$— |
|||
|
EM Series 23 Index |
BBB/P |
37,560 |
400,000 |
6/20/20 |
100 bp |
3,560 |
|||
|
EM Series 23 Index |
BBB/P |
1,710,275 |
16,850,000 |
6/20/20 |
100 bp |
281,302 |
|||
|
|
|||||||||
|
CMBX NA |
BBB–/P |
28,126 |
367,000 |
5/11/63 |
300 bp |
31,717 |
|||
|
CMBX NA |
BBB–/P |
1,641 |
40,000 |
5/11/63 |
300 bp |
2,033 |
|||
|
CMBX NA |
BBB–/P |
353 |
23,000 |
5/11/63 |
300 bp |
578 |
|||
|
CMBX NA |
BBB–/P |
1,940 |
20,000 |
5/11/63 |
300 bp |
2,136 |
|||
|
CMBX NA |
BBB–/P |
1,596 |
20,000 |
5/11/63 |
300 bp |
1,792 |
|||
Dynamic Risk Allocation Fund 71
|
OTC CREDIT DEFAULT CONTRACTS OUTSTANDING at 5/31/15 cont. |
|||||||||
|
Swap counterparty/ |
Rating*** |
Upfront |
Notional |
Termi- |
Payments |
Unrealized |
|||
|
Credit Suisse International cont. |
|||||||||
|
CMBX NA |
BBB–/P |
$1,549 |
$20,000 |
5/11/63 |
300 bp |
$1,744 |
|||
|
CMBX NA |
BBB–/P |
1,316 |
20,000 |
5/11/63 |
300 bp |
1,511 |
|||
|
CMBX NA |
BBB–/P |
243 |
8,000 |
5/11/63 |
300 bp |
322 |
|||
|
CMBX NA |
BBB–/P |
(31) |
2,000 |
5/11/63 |
300 bp |
(12) |
|||
|
CMBX NA |
— |
66 |
6,000 |
5/11/63 |
(300 bp) |
7 |
|||
|
CMBX NA |
BBB–/P |
9 |
1,000 |
1/17/47 |
300 bp |
(2) |
|||
|
CMBX NA |
BBB–/P |
2 |
1,000 |
1/17/47 |
300 bp |
(9) |
|||
|
CMBX NA |
BBB–/P |
13 |
2,000 |
1/17/47 |
300 bp |
(8) |
|||
|
CMBX NA |
BBB–/P |
10 |
2,000 |
1/17/47 |
300 bp |
(11) |
|||
|
CMBX NA |
BBB–/P |
6 |
2,000 |
1/17/47 |
300 bp |
(14) |
|||
|
CMBX NA |
BBB–/P |
6 |
2,000 |
1/17/47 |
300 bp |
(14) |
|||
|
CMBX NA |
BBB–/P |
28 |
4,000 |
1/17/47 |
300 bp |
(14) |
|||
|
CMBX NA |
BBB–/P |
7 |
4,000 |
1/17/47 |
300 bp |
(35) |
|||
|
CMBX NA |
BBB–/P |
16 |
5,000 |
1/17/47 |
300 bp |
(36) |
|||
|
CMBX NA |
BBB–/P |
46 |
13,000 |
1/17/47 |
300 bp |
(89) |
|||
|
CMBX NA |
BBB–/P |
125 |
16,000 |
1/17/47 |
300 bp |
(41) |
|||
|
CMBX NA |
BBB–/P |
114 |
16,000 |
1/17/47 |
300 bp |
(53) |
|||
|
CMBX NA |
BBB–/P |
89 |
18,000 |
1/17/47 |
300 bp |
(99) |
|||
|
CMBX NA |
BBB–/P |
502 |
40,000 |
1/17/47 |
300 bp |
62 |
|||
|
CMBX NA BB Index |
— |
(22) |
6,000 |
5/11/63 |
(500 bp) |
(67) |
|||
|
CMBX NA BB Index |
— |
33 |
6,000 |
5/11/63 |
(500 bp) |
(13) |
|||
|
CMBX NA BB Index |
— |
(77) |
10,000 |
5/11/63 |
(500 bp) |
(153) |
|||
|
CMBX NA BB Index |
— |
(96) |
10,000 |
5/11/63 |
(500 bp) |
(172) |
|||
|
CMBX NA BB Index |
— |
(91) |
10,000 |
5/11/63 |
(500 bp) |
(167) |
|||
|
CMBX NA BB Index |
— |
220 |
11,000 |
5/11/63 |
(500 bp) |
137 |
|||
|
CMBX NA BB Index |
— |
423 |
16,000 |
5/11/63 |
(500 bp) |
301 |
|||
72 Dynamic Risk Allocation Fund
|
OTC CREDIT DEFAULT CONTRACTS OUTSTANDING at 5/31/15 cont. |
|||||||||
|
Swap counterparty/ |
Rating*** |
Upfront |
Notional |
Termi- |
Payments |
Unrealized |
|||
|
Credit Suisse International cont. |
|||||||||
|
CMBX NA BB Index |
— |
$340 |
$22,000 |
5/11/63 |
(500 bp) |
$174 |
|||
|
CMBX NA BB Index |
— |
227 |
22,000 |
5/11/63 |
(500 bp) |
61 |
|||
|
CMBX NA BB Index |
— |
(384) |
22,000 |
5/11/63 |
(500 bp) |
(551) |
|||
|
CMBX NA BB Index |
— |
(157) |
30,000 |
5/11/63 |
(500 bp) |
(384) |
|||
|
CMBX NA BB Index |
— |
(427) |
22,000 |
5/11/63 |
(500 bp) |
(593) |
|||
|
CMBX NA |
BBB–/P |
102 |
22,000 |
5/11/63 |
300 bp |
317 |
|||
|
CMBX NA |
BBB–/P |
(221) |
22,000 |
5/11/63 |
300 bp |
(6) |
|||
|
CMBX NA |
BBB–/P |
83 |
18,000 |
5/11/63 |
300 bp |
260 |
|||
|
CMBX NA |
BBB–/P |
179 |
15,000 |
5/11/63 |
300 bp |
326 |
|||
|
CMBX NA |
BBB–/P |
149 |
15,000 |
5/11/63 |
300 bp |
296 |
|||
|
CMBX NA |
BBB–/P |
(140) |
15,000 |
5/11/63 |
300 bp |
6 |
|||
|
CMBX NA |
BBB–/P |
(150) |
15,000 |
5/11/63 |
300 bp |
(4) |
|||
|
CMBX NA |
BBB–/P |
(50) |
15,000 |
5/11/63 |
300 bp |
97 |
|||
|
CMBX NA |
BBB–/P |
(50) |
15,000 |
5/11/63 |
300 bp |
97 |
|||
|
CMBX NA |
BBB–/P |
(126) |
15,000 |
5/11/63 |
300 bp |
21 |
|||
|
CMBX NA |
BBB–/P |
79 |
13,000 |
5/11/63 |
300 bp |
206 |
|||
|
CMBX NA |
BBB–/P |
7 |
11,000 |
5/11/63 |
300 bp |
115 |
|||
|
CMBX NA |
BBB–/P |
(42) |
7,000 |
5/11/63 |
300 bp |
26 |
|||
|
CMBX NA |
BBB–/P |
8 |
6,000 |
5/11/63 |
300 bp |
67 |
|||
|
CMBX NA |
BBB–/P |
11 |
4,000 |
5/11/63 |
300 bp |
50 |
|||
|
|
|||||||||
|
CMBX NA |
BBB–/P |
(166) |
24,000 |
5/11/63 |
300 bp |
69 |
|||
|
CMBX NA |
BBB–/P |
16 |
2,000 |
1/17/47 |
300 bp |
(5) |
|||
|
CMBX NA |
BBB–/P |
7 |
2,000 |
1/17/47 |
300 bp |
(14) |
|||
|
CMBX NA |
BBB–/P |
8 |
2,000 |
1/17/47 |
300 bp |
(13) |
|||
Dynamic Risk Allocation Fund 73
|
OTC CREDIT DEFAULT CONTRACTS OUTSTANDING at 5/31/15 cont. |
|||||||||
|
Swap counterparty/ |
Rating*** |
Upfront |
Notional |
Termi- |
Payments |
Unrealized |
|||
|
Goldman Sachs International cont. |
|||||||||
|
CMBX NA |
BBB–/P |
$7 |
$2,000 |
1/17/47 |
300 bp |
$(14) |
|||
|
CMBX NA |
BBB–/P |
17 |
4,000 |
1/17/47 |
300 bp |
(25) |
|||
|
CMBX NA |
BBB–/P |
14 |
4,000 |
1/17/47 |
300 bp |
(27) |
|||
|
CMBX NA |
BBB–/P |
14 |
4,000 |
1/17/47 |
300 bp |
(27) |
|||
|
CMBX NA |
BBB–/P |
51 |
6,000 |
1/17/47 |
300 bp |
(12) |
|||
|
CMBX NA |
BBB–/P |
10 |
9,000 |
1/17/47 |
300 bp |
(84) |
|||
|
CMBX NA |
BBB–/P |
223 |
29,000 |
1/17/47 |
300 bp |
(79) |
|||
|
CMBX NA BB Index |
— |
50 |
3,000 |
5/11/63 |
(500 bp) |
28 |
|||
|
CMBX NA BB Index |
— |
31 |
3,000 |
5/11/63 |
(500 bp) |
8 |
|||
|
CMBX NA BB Index |
— |
4 |
3,000 |
5/11/63 |
(500 bp) |
(19) |
|||
|
CMBX NA BB Index |
— |
(96) |
10,000 |
5/11/63 |
(500 bp) |
(172) |
|||
|
CMBX NA BB Index |
— |
249 |
11,000 |
5/11/63 |
(500 bp) |
165 |
|||
|
CMBX NA BB Index |
— |
(201) |
19,000 |
5/11/63 |
(500 bp) |
(345) |
|||
|
CMBX NA BB Index |
— |
(4) |
2,000 |
1/17/47 |
(500 bp) |
17 |
|||
|
CMBX NA |
BBB–/P |
(120) |
15,000 |
5/11/63 |
300 bp |
26 |
|||
|
CMBX NA |
BBB–/P |
(140) |
15,000 |
5/11/63 |
300 bp |
6 |
|||
|
CMBX NA |
BBB–/P |
(150) |
15,000 |
5/11/63 |
300 bp |
(4) |
|||
|
CMBX NA |
BBB–/P |
(150) |
15,000 |
5/11/63 |
300 bp |
(4) |
|||
|
CMBX NA |
BBB–/P |
(60) |
15,000 |
5/11/63 |
300 bp |
87 |
|||
|
CMBX NA |
BBB–/P |
84 |
14,000 |
5/11/63 |
300 bp |
220 |
|||
|
CMBX NA |
BBB–/P |
156 |
14,000 |
5/11/63 |
300 bp |
297 |
|||
|
Total |
$1,785,268 |
|
|||||||
|
|
|||||||||
|
|
|||||||||
|
|
|||||||||
74 Dynamic Risk Allocation Fund
|
CENTRALLY CLEARED CREDIT DEFAULT CONTRACTS OUTSTANDING at 5/31/15 |
|||||||||
|
Referenced debt* |
Rating*** |
Upfront |
Notional |
Termi- |
Payments |
Unrealized |
|||
|
NA HY Series 24 Index |
B+/P |
$(2,280,621) |
$32,308,000 |
6/20/20 |
500 bp |
$63,146 |
|||
|
NA IG Series 24 Index |
BBB+/P |
(210,546) |
10,800,000 |
6/20/20 |
100 bp |
|
|||
|
Total |
$(2,491,167) |
|
|||||||
|
|
|||||||||
|
|
|||||||||
|
|
|||||||||
Dynamic Risk Allocation Fund 75
|
ASC 820 establishes a three-level hierarchy for disclosure of fair value measurements. The valuation hierarchy is based upon the transparency of inputs to the valuation of the fund’s investments. The three levels are defined as follows: |
|
|
Level 1: Valuations based on quoted prices for identical securities in active markets. |
|
|
Level 2: Valuations based on quoted prices in markets that are not active or for which all significant inputs are observable, either directly or indirectly. |
|
|
Level 3: Valuations based on inputs that are unobservable and significant to the fair value measurement. |
|
|
|
|
Valuation inputs |
||||
|
Investments in securities: |
Level 1 |
Level 2 |
Level 3 |
|
|
Common stocks*: |
||||
|
Basic materials |
$3,429,480 |
$496,360 |
$— |
|
|
Capital goods |
4,719,110 |
433,214 |
— |
|
|
Communication services |
1,638,426 |
258,887 |
— |
|
|
Conglomerates |
935,810 |
— |
— |
|
|
Consumer cyclicals |
9,561,748 |
1,178,730 |
— |
|
|
Consumer staples |
7,557,209 |
311,377 |
— |
|
|
Energy |
4,011,880 |
76,322 |
— |
|
|
Financials |
21,755,155 |
2,715,750 |
— |
|
|
Health care |
10,908,078 |
350,882 |
— |
|
|
Technology |
9,803,275 |
987,551 |
— |
|
|
Transportation |
1,415,402 |
306,724 |
— |
|
|
Utilities and power |
2,936,728 |
434,452 |
— |
|
|
Total common stocks |
78,672,301 |
7,550,249 |
— |
|
|
Asset-backed securities |
— |
1,712,000 |
2,682,000 |
|
|
Commodity linked notes |
— |
8,076,440 |
— |
|
|
Convertible bonds and notes |
— |
44,297 |
— |
|
|
Convertible preferred stocks |
— |
37,006 |
— |
|
|
Corporate bonds and notes |
— |
46,444,800 |
104,500 |
|
|
Foreign government and agency bonds and notes |
— |
1,025,398 |
— |
|
|
Investment companies |
42,699 |
— |
— |
|
|
Mortgage-backed securities |
— |
6,963,337 |
200,975 |
|
|
Preferred stocks |
213,255 |
74,955 |
— |
|
|
Purchased options outstanding |
— |
930,073 |
— |
|
|
Senior loans |
— |
480,530 |
— |
|
|
U.S. government and agency mortgage obligations |
— |
15,943,123 |
— |
|
|
Short-term investments |
51,209,468 |
12,541,403 |
— |
|
|
Totals by level |
$130,137,723 |
$101,823,611 |
$2,987,475 |
|
76 Dynamic Risk Allocation Fund
|
Valuation inputs |
||||
|
Other financial instruments: |
Level 1 |
Level 2 |
Level 3 |
|
|
Forward currency contracts |
$— |
$(84,561) |
$— |
|
|
Futures contracts |
243,253 |
— |
— |
|
|
Written options outstanding |
— |
(46,095) |
— |
|
|
Interest rate swap contracts |
— |
289,730 |
— |
|
|
Total return swap contracts |
— |
(5,297,702) |
— |
|
|
Credit default contracts |
— |
1,089,794 |
— |
|
|
Totals by level |
$243,253 |
$(4,048,834) |
$— |
|
|
*Common stock classifications are presented at the sector level, which may differ from the fund’s portfolio presentation. |
||||
|
The following is a reconciliation of Level 3 assets as of the close of the reporting period: |
|
Investments in |
Balance as of |
Accrued |
Realized |
Change |
Purchases |
Sales |
Net transfers |
Balance |
|
|
Asset-backed |
$— |
$— |
$— |
$— |
$— |
$— |
$2,682,000 |
$2,682,000 |
|
|
Corporate bonds |
$— |
— |
— |
— |
— |
— |
104,500 |
$104,500 |
|
|
Mortgage-backed |
$— |
— |
— |
— |
— |
— |
200,975 |
$200,975 |
|
|
Totals |
$— |
$— |
$— |
$— |
$— |
$— |
$2,987,475 |
$2,987,475 |
†Transfers during the reporting period are accounted for using the end of period market value and include valuations provided by a single broker quote. Such valuations involve certain inputs and estimates that were unobservable at the end of the reporting period.
Level 3 securities, which are fair valued, are not material to the fund.
#Includes $— related to Level 3 securities still held at period end. Total change in unrealized appreciation/(depreciation) for securities (including Level 1 and Level 2) can be found in the Statement of operations.
During the reporting period, transfers between level 1 and level 2 within the fair value hierarchy, if any, (other than certain transfers involving non-U.S. equity securities as described in Note 1) did not represent, in the aggregate, more than 1% of the fund’s net assets measured as of the end of the period.
The accompanying notes are an integral part of these financial statements.
Dynamic Risk Allocation Fund 77
|
Statement of assets and liabilities 5/31/15 |
||
|
ASSETS |
||
|
Investment in securities, at value, including $422,441 of securities on loan (Note 1): |
||
|
Unaffiliated issuers (identified cost $173,511,376) |
$183,372,716 |
|
|
Affiliated issuers (identified cost $51,576,093) (Notes 1 and 5) |
51,576,093 |
|
|
Cash |
16,479 |
|
|
Foreign currency (cost $15,058) (Note 1) |
14,948 |
|
|
Dividends, interest and other receivables |
1,052,862 |
|
|
Receivable for shares of the fund sold |
774,300 |
|
|
Receivable for investments sold |
2,822,431 |
|
|
Receivable for variation margin (Note 1) |
1,768,421 |
|
|
Unrealized appreciation on forward currency contracts (Note 1) |
649,169 |
|
|
Unrealized appreciation on OTC swap contracts (Note 1) |
889,174 |
|
|
Premium paid on OTC swap contracts (Note 1) |
3,172 |
|
|
Prepaid assets |
23,015 |
|
|
Total assets |
242,962,780 |
|
|
LIABILITIES |
||
|
Payable for investments purchased |
2,287,419 |
|
|
Payable for purchases of delayed delivery securities (Note 1) |
18,210,855 |
|
|
Payable for shares of the fund repurchased |
209,203 |
|
|
Payable for compensation of Manager (Note 2) |
123,874 |
|
|
Payable for custodian fees (Note 2) |
29,175 |
|
|
Payable for investor servicing fees (Note 2) |
63,643 |
|
|
Payable for Trustee compensation and expenses (Note 2) |
11,749 |
|
|
Payable for administrative services (Note 2) |
782 |
|
|
Payable for distribution fees (Note 2) |
28,864 |
|
|
Payable for variation margin (Note 1) |
126,953 |
|
|
Unrealized depreciation on OTC swap contracts (Note 1) |
5,860,023 |
|
|
Premium received on OTC swap contracts (Note 1) |
1,788,440 |
|
|
Unrealized depreciation on forward currency contracts (Note 1) |
733,730 |
|
|
Written options outstanding, at value (premiums $64,664) (Notes 1 and 3) |
46,095 |
|
|
Collateral on securities loaned, at value (Note 1) |
426,625 |
|
|
Collateral on certain derivative contracts, at value (Note 1) |
60,000 |
|
|
Other accrued expenses |
105,374 |
|
|
Total liabilities |
30,112,804 |
|
|
Net assets |
$212,849,976 |
|
|
REPRESENTED BY |
||
|
Paid-in capital (Unlimited shares authorized) (Notes 1 and 4) |
$204,543,904 |
|
|
Undistributed net investment income (Note 1) |
36,221 |
|
|
Accumulated net realized gain on investments and foreign currency transactions (Note 1) |
3,803,771 |
|
|
Net unrealized appreciation of investments and assets and liabilities in foreign currencies |
4,466,080 |
|
|
Total — Representing net assets applicable to capital shares outstanding |
$212,849,976 |
|
|
(Continued on next page) |
The accompanying notes are an integral part of these financial statements.
78 Dynamic Risk Allocation Fund
|
Statement of assets and liabilities (Continued) |
||
|
COMPUTATION OF NET ASSET VALUE AND OFFERING PRICE |
||
|
Net asset value and redemption price per class A share ($28,222,512 divided by 2,542,185 shares) |
$11.10 |
|
|
Offering price per class A share (100/94.25 of $11.10)* |
$11.78 |
|
|
Net asset value and offering price per class B share ($3,829,407 divided by 350,015 shares)** |
$10.94 |
|
|
Net asset value and offering price per class C share ($15,125,067 divided by 1,381,215 shares)** |
$10.95 |
|
|
Net asset value and redemption price per class M share ($335,851 divided by 30,229 shares) |
$11.11 |
|
|
Offering price per class M share (100/96.50 of $11.11)* |
$11.51 |
|
|
Net asset value, offering price and redemption price per class R share ($260,848 divided by 23,669 shares) |
$11.02 |
|
|
Net asset value, offering price and redemption price per class R5 share ($11,660 divided by 1,048 shares)† |
$11.12 |
|
|
Net asset value, offering price and redemption price per class R6 share ($30,006,695 divided by 2,703,170 shares) |
$11.10 |
|
|
Net asset value, offering price and redemption price per class Y share ($135,057,936 divided by 12,165,611 shares) |
$11.10 |
|
|
* |
On single retail sales of less than $50,000. On sales of $50,000 or more the offering price is reduced. |
|
|
** |
Redemption price per share is equal to net asset value less any applicable contingent deferred sales charge. |
|
|
† |
Net asset value may not recalculate due to rounding of fractional shares. |
|
The accompanying notes are an integral part of these financial statements.
Dynamic Risk Allocation Fund 79
|
Statement of operations Year ended 5/31/15 |
||
|
INVESTMENT INCOME |
||
|
Interest (including interest income of $39,614 from investments in affiliated issuers) (Note 5) |
$2,604,794 |
|
|
Dividends (net of foreign tax of $56,275) |
2,354,947 |
|
|
Securities lending (Note 1) |
1,211 |
|
|
Total investment income |
4,960,952 |
|
|
EXPENSES |
||
|
Compensation of Manager (Note 2) |
1,894,611 |
|
|
Investor servicing fees (Note 2) |
386,237 |
|
|
Custodian fees (Note 2) |
84,047 |
|
|
Trustee compensation and expenses (Note 2) |
8,424 |
|
|
Distribution fees (Note 2) |
275,087 |
|
|
Administrative services (Note 2) |
5,488 |
|
|
Other |
258,406 |
|
|
Fees waived and reimbursed by Manager (Note 2) |
(182,629) |
|
|
Total expenses |
2,729,671 |
|
|
Expense reduction (Note 2) |
(1,402) |
|
|
Net expenses |
2,728,269 |
|
|
Net investment income |
2,232,683 |
|
|
Net realized gain on investments (Notes 1 and 3) |
390,346 |
|
|
Net realized gain on swap contracts (Note 1) |
6,738,857 |
|
|
Net realized gain on futures contracts (Note 1) |
3,773,615 |
|
|
Net realized gain on foreign currency transactions (Note 1) |
1,229,787 |
|
|
Net realized loss on written options (Notes 1 and 3) |
(962,512) |
|
|
Net unrealized appreciation of assets and liabilities in foreign currencies during the year |
23,352 |
|
|
Net unrealized depreciation of investments, futures contracts, swap contracts and written options during the year |
(12,057,942) |
|
|
Net loss on investments |
(864,497) |
|
|
Net increase in net assets resulting from operations |
$1,368,186 |
The accompanying notes are an integral part of these financial statements.
80 Dynamic Risk Allocation Fund
|
Statement of changes in net assets |
|||
|
INCREASE (DECREASE) IN NET ASSETS |
Year ended 5/31/15 |
Year ended 5/31/14 |
|
|
Operations: |
|||
|
Net investment income |
$2,232,683 |
$991,425 |
|
|
Net realized gain on investments and foreign currency transactions |
11,170,093 |
5,738,825 |
|
|
Net unrealized appreciation (depreciation) of investments and assets and liabilities in foreign currencies |
(12,034,590) |
11,284,886 |
|
|
Net increase in net assets resulting from operations |
1,368,186 |
18,015,136 |
|
|
Distributions to shareholders (Note 1): |
|||
|
From ordinary income |
|||
|
Net investment income |
|||
|
Class A |
(651,128) |
(256,283) |
|
|
Class B |
(66,768) |
(4,243) |
|
|
Class C |
(264,771) |
— |
|
|
Class M |
(6,432) |
(628) |
|
|
Class R |
(12,111) |
(2,406) |
|
|
Class R5 |
(309) |
(109) |
|
|
Class R6 |
(835,328) |
(24,169) |
|
|
Class Y |
(3,573,474) |
(1,370,389) |
|
|
From net realized long-term gain on investments |
|||
|
Class A |
(633,993) |
— |
|
|
Class B |
(87,338) |
— |
|
|
Class C |
(366,380) |
— |
|
|
Class M |
(7,606) |
— |
|
|
Class R |
(12,301) |
— |
|
|
Class R5 |
(258) |
— |
|
|
Class R6 |
(667,747) |
— |
|
|
Class Y |
(3,044,285) |
— |
|
|
Increase (decrease) from capital share transactions (Note 4) |
31,576,777 |
(75,119,062) |
|
|
Total increase (decrease) in net assets |
22,714,734 |
(58,762,153) |
|
|
NET ASSETS |
|||
|
Beginning of year |
190,135,242 |
248,897,395 |
|
|
End of year (including undistributed net investment income of $36,221 and $93,318, respectively) |
$212,849,976 |
$190,135,242 |
|
The accompanying notes are an integral part of these financial statements.
Dynamic Risk Allocation Fund 81
Financial highlights (For a common share outstanding throughout the period)
|
INVESTMENT OPERATIONS: |
LESS DISTRIBUTIONS: |
RATIOS AND SUPPLEMENTAL DATA: |
|||||||||||
|
Period ended |
Net asset value, beginning of period |
Net investment income (loss)a |
Net realized and unrealized gain (loss) on investments |
Total from investment operations |
From |
From |
Total |
Net asset value, end of period |
Total return at net asset value (%)b |
Net assets, end of period (in thousands) |
Ratio of expenses to average net assets (%)c,d |
Ratio of net investment income (loss) to average net assets (%)d |
Portfolio turnover (%) |
|
Class A |
|||||||||||||
|
May 31, 2015 |
$11.58 |
.10 |
(.05) |
.05 |
(.27) |
(.26) |
(.53) |
$11.10 |
.53 |
$28,223 |
1.41 |
.91 |
245e |
|
May 31, 2014 |
10.63 |
.04 |
.98 |
1.02 |
(.07) |
— |
(.07) |
11.58 |
9.59 |
33,884 |
1.40 |
.33 |
117f |
|
May 31, 2013 |
10.24 |
.01 |
.81 |
.82 |
(.20) |
(.23) |
(.43) |
10.63 |
7.97 |
68,440 |
1.40 |
.06 |
130f,g |
|
May 31, 2012† |
10.00 |
(.02) |
.39 |
.37 |
(.09) |
(.04) |
(.13) |
10.24 |
3.77* |
38,666 |
.98* |
(.22) * |
41* |
|
Class B |
|||||||||||||
|
May 31, 2015 |
$11.44 |
.02 |
(.06) |
(.04) |
(.20) |
(.26) |
(.46) |
$10.94 |
(.26) |
$3,829 |
2.16 |
.17 |
245e |
|
May 31, 2014 |
10.53 |
(.03) |
.95 |
.92 |
(.01) |
— |
(.01) |
11.44 |
8.78 |
3,705 |
2.15 |
(.32) |
117f |
|
May 31, 2013 |
10.20 |
(.07) |
.81 |
.74 |
(.18) |
(.23) |
(.41) |
10.53 |
7.22 |
2,852 |
2.15 |
(.61) |
130f,g |
|
May 31, 2012† |
10.00 |
(.07) |
.38 |
.31 |
(.07) |
(.04) |
(.11) |
10.20 |
3.19* |
727 |
1.50* |
(.68) * |
41* |
|
Class C |
|||||||||||||
|
May 31, 2015 |
$11.44 |
.02 |
(.06) |
(.04) |
(.19) |
(.26) |
(.45) |
$10.95 |
(.27) |
$15,125 |
2.16 |
.16 |
245e |
|
May 31, 2014 |
10.51 |
(.04) |
.97 |
.93 |
— |
— |
— |
11.44 |
8.85 |
16,325 |
2.15 |
(.38) |
117f |
|
May 31, 2013 |
10.19 |
(.06) |
.80 |
.74 |
(.19) |
(.23) |
(.42) |
10.51 |
7.18 |
21,015 |
2.15 |
(.57) |
130f,g |
|
May 31, 2012† |
10.00 |
(.07) |
.38 |
.31 |
(.08) |
(.04) |
(.12) |
10.19 |
3.21* |
3,151 |
1.50* |
(.66) * |
41* |
|
Class M |
|||||||||||||
|
May 31, 2015 |
$11.60 |
.05 |
(.06) |
(.01) |
(.22) |
(.26) |
(.48) |
$11.11 |
.01 |
$336 |
1.91 |
.42 |
245e |
|
May 31, 2014 |
10.66 |
(.01) |
.97 |
.96 |
(.02) |
— |
(.02) |
11.60 |
9.03 |
339 |
1.90 |
(.09) |
117f |
|
May 31, 2013 |
10.21 |
(.05) |
.82 |
.77 |
(.09) |
(.23) |
(.32) |
10.66 |
7.52 |
358 |
1.90 |
(.47) |
130f,g |
|
May 31, 2012† |
10.00 |
(.06) |
.39 |
.33 |
(.08) |
(.04) |
(.12) |
10.21 |
3.39* |
363 |
1.33* |
(.60) * |
41* |
|
Class R |
|||||||||||||
|
May 31, 2015 |
$11.52 |
.07 |
(.05) |
.02 |
(.26) |
(.26) |
(.52) |
$11.02 |
.25 |
$261 |
1.66 |
.66 |
245e |
|
May 31, 2014 |
10.59 |
.02 |
.97 |
.99 |
(.06) |
— |
(.06) |
11.52 |
9.34 |
484 |
1.65 |
.17 |
117f |
|
May 31, 2013 |
10.23 |
(.01) |
.80 |
.79 |
(.20) |
(.23) |
(.43) |
10.59 |
7.70 |
458 |
1.65 |
(.11) |
130f,g |
|
May 31, 2012† |
10.00 |
(.05) |
.40 |
.35 |
(.08) |
(.04) |
(.12) |
10.23 |
3.59* |
102 |
1.15* |
(.45) * |
41* |
|
Class R5 |
|||||||||||||
|
May 31, 2015 |
$11.62 |
.13 |
(.06) |
.07 |
(.31) |
(.26) |
(.57) |
$11.12 |
.75 |
$12 |
1.16 |
1.17 |
245e |
|
May 31, 2014 |
10.68 |
.07 |
.98 |
1.05 |
(.11) |
— |
(.11) |
11.62 |
9.91 |
12 |
1.15 |
.67 |
117f |
|
May 31, 2013†† |
10.56 |
.03 |
.53 |
.56 |
(.21) |
(.23) |
(.44) |
10.68 |
5.26* |
11 |
1.05* |
.25* |
130f,g |
|
Class R6 |
|||||||||||||
|
May 31, 2015 |
$11.61 |
.14 |
(.07) |
.07 |
(.32) |
(.26) |
(.58) |
$11.10 |
.79 |
$30,007 |
1.11 |
1.23 |
245e |
|
May 31, 2014 |
10.68 |
.07 |
.98 |
1.05 |
(.12) |
— |
(.12) |
11.61 |
9.93 |
2,055 |
1.11 |
.68 |
117f |
|
May 31, 2013†† |
10.56 |
.08 |
.49 |
.57 |
(.22) |
(.23) |
(.45) |
10.68 |
5.31* |
2,713 |
1.05* |
.63* |
130f,g |
|
Class Y |
|||||||||||||
|
May 31, 2015 |
$11.59 |
.13 |
(.06) |
.07 |
(.30) |
(.26) |
(.56) |
$11.10 |
.79 |
$135,058 |
1.16 |
1.17 |
245e |
|
May 31, 2014 |
10.65 |
.07 |
.98 |
1.05 |
(.11) |
— |
(.11) |
11.59 |
9.87 |
133,332 |
1.15 |
.64 |
117f |
|
May 31, 2013 |
10.26 |
.03 |
.82 |
.85 |
(.23) |
(.23) |
(.46) |
10.65 |
8.21 |
153,051 |
1.15 |
.32 |
130f,g |
|
May 31, 2012† |
10.00 |
.01 |
.38 |
.39 |
(.09) |
(.04) |
(.13) |
10.26 |
4.02* |
84,578 |
.80* |
.11* |
41* |
See notes to financial highlights at the end of this section.
The accompanying notes are an integral part of these financial statements.
|
82 |
Dynamic Risk Allocation Fund |
Dynamic Risk Allocation Fund |
83 |
Financial highlights (Continued)
* Not annualized
† For the period September 19, 2011 (commencement of operations) to May 31, 2012.
†† For the period July 3, 2012 (commencement of operations) to May 31, 2013.
a Per share net investment income (loss) has been determined on the basis of the weighted average number of shares outstanding during the period.
b Total return assumes dividend reinvestment and does not reflect the effect of sales charges.
c Includes amounts paid through expense offset arrangements, if any (Note 2). Also excludes acquired fund fees and expenses, if any.
d Reflects an involuntary contractual expense limitation in effect during the period. As a result of such limitation, the expenses of each class reflect a reduction of the following amounts as a percentage of average net assets (Note 2):
|
Percentage of average net assets |
||||
|
5/31/15 |
5/31/14 |
5/31/13 |
5/31/12 |
|
|
Class A |
0.10% |
0.10% |
0.16% |
0.61% |
|
Class B |
0.10 |
0.10 |
0.16 |
0.61 |
|
Class C |
0.10 |
0.10 |
0.16 |
0.61 |
|
Class M |
0.10 |
0.10 |
0.16 |
0.61 |
|
Class R |
0.10 |
0.10 |
0.16 |
0.61 |
|
Class R5 |
0.05 |
0.06 |
0.08 |
N/A |
|
Class R6 |
N/A |
N/A |
N/A |
N/A |
|
Class Y |
0.10 |
0.10 |
0.16 |
0.61 |
e Portfolio turnover includes TBA purchase and sale commitments.
f Portfolio turnover excludes TBA purchase and sale commitments. Including TBA purchase and sale commitments to conform with current year presentation, the portfolio turnover would have been following:
|
Portfolio turnover % |
|
|
May 31, 2014 |
212% |
|
May 31, 2013 |
230 |
g Reflects revision of portfolio turnover rate presented in the fund’s May 31, 2013 audited financial statements.
84 Dynamic Risk Allocation Fund
Notes to financial statements 5/31/15
Within the following Notes to financial statements, references to “State Street” represent State Street Bank and Trust Company, references to “the SEC” represent the Securities and Exchange Commission, references to “Putnam Management” represent Putnam Investment Management, LLC, the fund’s manager, an indirect wholly-owned subsidiary of Putnam Investments, LLC and references to “OTC”, if any, represent over-the-counter. Unless otherwise noted, the “reporting period” represents the period from June 1, 2014 through May 31, 2015.
Putnam Dynamic Risk Allocation Fund (the fund) is a diversified series of Putnam Funds Trust (the Trust), a Massachusetts business trust registered under the Investment Company Act of 1940, as amended, as an open-end management investment company. The goal of the fund is to seek total return. Total return is composed of capital appreciation and income. The fund invests in a diversified set of asset classes. By investing in a broader set of asset classes than a traditional balanced fund, and by using leverage to increase the fund’s exposures to asset classes, Putnam Management believes the fund may achieve a higher total return than a traditional balanced fund with approximately the same amount of risk as a traditional balanced fund. Risk is measured by the volatility of the fund’s investment portfolio. The fund may invest without limit in U.S., international, and emerging markets equity securities (growth or value stocks or both) of companies of any size and fixed-income securities (including in below-investment-grade securities, which are sometimes referred to as “junk bonds”); mortgage- and asset-backed securities; inflation-protected securities; commodities; and real estate investment trusts. These asset classes offer different return potential and exposure to different investment risks.
The fund offers class A, class B, class C, class M, class R, class R5, class R6 and class Y shares. Class A and class M shares are sold with a maximum front-end sales charge of 5.75% and 3.50%, respectively, and generally do not pay a contingent deferred sales charge. Class B shares, which convert to class A shares after approximately eight years, do not pay a front-end sales charge and are subject to a contingent deferred sales charge if those shares are redeemed within six years of purchase. Class C shares have a one-year 1.00% contingent deferred sales charge and do not convert to class A shares. Class R shares, which are not available to all investors, are sold at net asset value. The expenses for class A, class B, class C, class M and class R shares may differ based on the distribution fee of each class, which is identified in Note 2. Class R5, class R6 and class Y shares, which are sold at net asset value, are generally subject to the same expenses as class A, class B, class C, class M and class R shares, but do not bear a distribution fee and in the case of class R5 and class R6 shares, bear a lower investor servicing fee, which is identified in Note 2. Class R5, class R6 and class Y shares are not available to all investors.
In the normal course of business, the fund enters into contracts that may include agreements to indemnify another party under given circumstances. The fund’s maximum exposure under these arrangements is unknown as this would involve future claims that may be, but have not yet been, made against the fund. However, the fund’s management team expects the risk of material loss to be remote.
Note 1: Significant accounting policies
The following is a summary of significant accounting policies consistently followed by the fund in the preparation of its financial statements. The preparation of financial statements is in conformity with accounting principles generally accepted in the United States of America and requires management to make estimates and assumptions that affect the reported amounts of assets and liabilities in the financial statements and the reported amounts of increases and decreases in net assets from operations. Actual results could differ from those estimates. Subsequent events after the Statement of assets and liabilities date through the date that the financial statements were issued have been evaluated in the preparation of the financial statements.
Investment income, realized and unrealized gains and losses and expenses of the fund are borne pro-rata based on the relative net assets of each class to the total net assets of the fund, except that each class bears expenses unique to that class (including the distribution fees applicable to such classes). Each class votes as a class only with respect to its own distribution plan or other matters on which a class vote is required by law or determined by the Trustees. If the fund were liquidated, shares of each class would receive their pro-rata share of the net assets of the fund. In addition, the Trustees declare separate dividends on each class of shares.
Security valuation Portfolio securities and other investments are valued using policies and procedures adopted by the Board of Trustees. The Trustees have formed a Pricing Committee to oversee the implementation of these procedures and have delegated responsibility for valuing the fund’s assets in accordance with these procedures to Putnam Management. Putnam Management has established an internal Valuation Committee that is responsible
Dynamic Risk Allocation Fund 85
for making fair value determinations, evaluating the effectiveness of the pricing policies of the fund and reporting to the Pricing Committee.
Investments for which market quotations are readily available are valued at the last reported sales price on their principal exchange, or official closing price for certain markets, and are classified as Level 1 securities under Accounting Standards Codification 820 Fair Value Measurements and Disclosures (ASC 820). If no sales are reported, as in the case of some securities that are traded OTC, a security is valued at its last reported bid price and is generally categorized as a Level 2 security.
Investments in open-end investment companies (excluding exchange-traded funds), if any, which can be classified as Level 1 or Level 2 securities, are valued based on their net asset value. The net asset value of such investment companies equals the total value of their assets less their liabilities and divided by the number of their outstanding shares.
Market quotations are not considered to be readily available for certain debt obligations and other investments; such investments are valued on the basis of valuations furnished by an independent pricing service approved by the Trustees or dealers selected by Putnam Management. Such services or dealers determine valuations for normal institutional-size trading units of such securities using methods based on market transactions for comparable securities and various relationships, generally recognized by institutional traders, between securities (which consider such factors as security prices, yields, maturities and ratings). These securities will generally be categorized as Level 2. Short-term securities with remaining maturities of 60 days or less may be valued at amortized cost, which approximates fair value, and are classified as Level 2 securities.
Many securities markets and exchanges outside the U.S. close prior to the close of the New York Stock Exchange and therefore the closing prices for securities in such markets or on such exchanges may not fully reflect events that occur after such close but before the close of the New York Stock Exchange. Accordingly, on certain days, the fund will fair value foreign equity securities taking into account multiple factors including movements in the U.S. securities markets, currency valuations and comparisons to the valuation of American Depository Receipts, exchange-traded funds and futures contracts. These securities, which would generally be classified as Level 1 securities, will be transferred to Level 2 of the fair value hierarchy when they are valued at fair value. The number of days on which fair value prices will be used will depend on market activity and it is possible that fair value prices will be used by the fund to a significant extent. At the close of the reporting period, fair value pricing was used for certain foreign securities in the portfolio. Securities quoted in foreign currencies, if any, are translated into U.S. dollars at the current exchange rate.
To the extent a pricing service or dealer is unable to value a security or provides a valuation that Putnam Management does not believe accurately reflects the security’s fair value, the security will be valued at fair value by Putnam Management in accordance with policies and procedures approved by the Trustees. Certain investments, including certain restricted and illiquid securities and derivatives, are also valued at fair value following procedures approved by the Trustees. These valuations consider such factors as significant market or specific security events such as interest rate or credit quality changes, various relationships with other securities, discount rates, U.S. Treasury, U.S. swap and credit yields, index levels, convexity exposures, recovery rates, sales and other multiples and resale restrictions. These securities are classified as Level 2 or as Level 3 depending on the priority of the significant inputs.
To assess the continuing appropriateness of fair valuations, the Valuation Committee reviews and affirms the reasonableness of such valuations on a regular basis after considering all relevant information that is reasonably available. Such valuations and procedures are reviewed periodically by the Trustees. Certain securities may be valued on the basis of a price provided by a single source.
The fair value of securities is generally determined as the amount that the fund could reasonably expect to realize from an orderly disposition of such securities over a reasonable period of time. By its nature, a fair value price is a good faith estimate of the value of a security in a current sale and does not reflect an actual market price, which may be different by a material amount.
Security transactions and related investment income Security transactions are recorded on the trade date (the date the order to buy or sell is executed). Gains or losses on securities sold are determined on the identified cost basis.
Interest income, net of any applicable withholding taxes, is recorded on the accrual basis. Dividend income, net of any applicable withholding taxes, is recognized on the ex-dividend date except that certain dividends from foreign securities, if any, are recognized as soon as the fund is informed of the ex-dividend date. Non-cash dividends, if any, are recorded at the fair value of the securities received. Dividends representing a return of capital or capital gains, if any, are reflected as a reduction of cost and/or as a realized gain.
All premiums/discounts are amortized/accreted on a yield-to-maturity basis.
86 Dynamic Risk Allocation Fund
The fund earned certain fees in connection with its senior loan purchasing activities. These fees are treated as market discount and are amortized into income in the Statement of operations.
Securities purchased or sold on a delayed delivery basis may be settled at a future date beyond customary settlement time; interest income is accrued based on the terms of the securities. Losses may arise due to changes in the fair value of the underlying securities or if the counterparty does not perform under the contract.
Stripped securities The fund may invest in stripped securities which represent a participation in securities that may be structured in classes with rights to receive different portions of the interest and principal. Interest-only securities receive all of the interest and principal-only securities receive all of the principal. If the interest-only securities experience greater than anticipated prepayments of principal, the fund may fail to recoup fully its initial investment in these securities. Conversely, principal-only securities increase in value if prepayments are greater than anticipated and decline if prepayments are slower than anticipated. The fair value of these securities is highly sensitive to changes in interest rates.
Foreign currency translation The accounting records of the fund are maintained in U.S. dollars. The fair value of foreign securities, currency holdings, and other assets and liabilities is recorded in the books and records of the fund after translation to U.S. dollars based on the exchange rates on that day. The cost of each security is determined using historical exchange rates. Income and withholding taxes are translated at prevailing exchange rates when earned or incurred. The fund does not isolate that portion of realized or unrealized gains or losses resulting from changes in the foreign exchange rate on investments from fluctuations arising from changes in the market prices of the securities. Such gains and losses are included with the net realized and unrealized gain or loss on investments. Net realized gains and losses on foreign currency transactions represent net realized exchange gains or losses on closed forward currency contracts, disposition of foreign currencies, currency gains and losses realized between the trade and settlement dates on securities transactions and the difference between the amount of investment income and foreign withholding taxes recorded on the fund’s books and the U.S. dollar equivalent amounts actually received or paid. Net unrealized appreciation and depreciation of assets and liabilities in foreign currencies arise from changes in the value of open forward currency contracts and assets and liabilities other than investments at the period end, resulting from changes in the exchange rate.
Options contracts The fund uses options contracts to hedge duration and convexity, to isolate prepayment risk, to gain exposure to interest rates, to hedge against changes in values of securities it owns, owned or expects to own, to hedge prepayment risk, to generate additional income for the portfolio, to enhance returns on securities owned, to enhance the return on a security owned, to gain exposure to securities and to manage downside risks.
The potential risk to the fund is that the change in value of options contracts may not correspond to the change in value of the hedged instruments. In addition, losses may arise from changes in the value of the underlying instruments if there is an illiquid secondary market for the contracts, if interest or exchange rates move unexpectedly or if the counterparty to the contract is unable to perform. Realized gains and losses on purchased options are included in realized gains and losses on investment securities. If a written call option is exercised, the premium originally received is recorded as an addition to sales proceeds. If a written put option is exercised, the premium originally received is recorded as a reduction to the cost of investments.
Exchange-traded options are valued at the last sale price or, if no sales are reported, the last bid price for purchased options and the last ask price for written options. OTC traded options are valued using prices supplied by dealers.
Options on swaps are similar to options on securities except that the premium paid or received is to buy or grant the right to enter into a previously agreed upon interest rate or credit default contract. Forward premium swap option contracts include premiums that have extended settlement dates. The delayed settlement of the premiums is factored into the daily valuation of the option contracts. In the case of interest rate cap and floor contracts, in return for a premium, ongoing payments between two parties are based on interest rates exceeding a specified rate, in the case of a cap contract, or falling below a specified rate in the case of a floor contract.
Written option contracts outstanding at period end, if any, are listed after the fund’s portfolio.
Futures contracts The fund uses futures contracts to manage exposure to market risk, to hedge prepayment risk, to hedge interest rate risk, to gain exposure to interest rates, and to equitize cash.
The potential risk to the fund is that the change in value of futures contracts may not correspond to the change in value of the hedged instruments. In addition, losses may arise from changes in the value of the underlying instruments, if there is an illiquid secondary market for the contracts, if interest or exchange rates move unexpectedly or if the counterparty to the contract is unable to perform. With futures, there is minimal counterparty credit risk to the fund since futures are exchange traded and the exchange’s clearinghouse, as counterparty to all exchange traded futures, guarantees the futures against default. Risks may exceed amounts recognized on the
Dynamic Risk Allocation Fund 87
Statement of assets and liabilities. When the contract is closed, the fund records a realized gain or loss equal to the difference between the value of the contract at the time it was opened and the value at the time it was closed.
Futures contracts are valued at the quoted daily settlement prices established by the exchange on which they trade. The fund and the broker agree to exchange an amount of cash equal to the daily fluctuation in the value of the futures contract. Such receipts or payments are known as “variation margin.”
Futures contracts outstanding at period end, if any, are listed after the fund’s portfolio.
Forward currency contracts The fund buys and sells forward currency contracts, which are agreements between two parties to buy and sell currencies at a set price on a future date. These contracts are used to hedge foreign exchange risk, and to gain exposure to currencies.
The U.S. dollar value of forward currency contracts is determined using current forward currency exchange rates supplied by a quotation service. The fair value of the contract will fluctuate with changes in currency exchange rates. The contract is marked to market daily and the change in fair value is recorded as an unrealized gain or loss. The fund records a realized gain or loss equal to the difference between the value of the contract at the time it was opened and the value at the time it was closed when the contract matures or by delivery of the currency. The fund could be exposed to risk if the value of the currency changes unfavorably, if the counterparties to the contracts are unable to meet the terms of their contracts or if the fund is unable to enter into a closing position. Risks may exceed amounts recognized on the Statement of assets and liabilities.
Forward currency contracts outstanding at period end, if any, are listed after the fund’s portfolio.
Interest rate swap contracts The fund entered into OTC and/or centrally cleared interest rate swap contracts, which are arrangements between two parties to exchange cash flows based on a notional principal amount, to hedge interest rate risk, to gain exposure on interest rates, and to hedge prepayment risk.
An OTC and centrally cleared interest rate swap can be purchased or sold with an upfront premium. For OTC interest rate swap contracts, an upfront payment received by the fund is recorded as a liability on the fund’s books. An upfront payment made by the fund is recorded as an asset on the fund’s books. OTC and centrally cleared interest rate swap contracts are marked to market daily based upon quotations from an independent pricing service or market makers. Any change is recorded as an unrealized gain or loss on OTC interest rate swaps. Daily fluctuations in the value of centrally cleared interest rate swaps are settled through a central clearing agent and are recorded in variation margin on the Statement of assets and liabilities and recorded as unrealized gain or loss. Payments, including upfront premiums, received or made are recorded as realized gains or losses at the reset date or the closing of the contract. Certain OTC and centrally cleared interest rate swap contracts may include extended effective dates. Payments related to these swap contracts are accrued based on the terms of the contract.
The fund could be exposed to credit or market risk due to unfavorable changes in the fluctuation of interest rates or if the counterparty defaults, in the case of OTC interest rate contracts, or the central clearing agency or a clearing member defaults, in the case of centrally cleared interest rate swap contracts, on its respective obligation to perform under the contract. The fund’s maximum risk of loss from counterparty risk or central clearing risk is the fair value of the contract. This risk may be mitigated for OTC interest rate swap contracts by having a master netting arrangement between the fund and the counterparty and for centrally cleared interest rate swap contracts through the daily exchange of variation margin. There is minimal counterparty risk with respect to centrally cleared interest rate swap contracts due to the clearinghouse guarantee fund and other resources that are available in the event of a clearing member default. Risk of loss may exceed amounts recognized on the Statement of assets and liabilities.
OTC and centrally cleared interest rate swap contracts outstanding, including their respective notional amounts at period end, if any, are listed after the fund’s portfolio.
Total return swap contracts The fund entered into OTC total return swap contracts, which are arrangements to exchange a market-linked return for a periodic payment, both based on a notional principal amount, to hedge sector exposure, to manage exposure to specific sectors or industries, to manage exposure to specific securities, to gain exposure to a basket of securities, to gain exposure to specific markets or countries, and to gain exposure to specific sectors or industries.
To the extent that the total return of the security, index or other financial measure underlying the transaction exceeds or falls short of the offsetting interest rate obligation, the fund will receive a payment from or make a payment to the counterparty. OTC total return swap contracts are marked to market daily based upon quotations from an independent pricing service or market makers and the change, if any, is recorded as an unrealized gain or loss. Payments received or made are recorded as realized gains or losses. Certain OTC total return swap contracts may include extended
88 Dynamic Risk Allocation Fund
effective dates. Payments related to these swap contracts are accrued based on the terms of the contract. The fund could be exposed to credit or market risk due to unfavorable changes in the fluctuation of interest rates or in the price of the underlying security or index, the possibility that there is no liquid market for these agreements or that the counterparty may default on its obligation to perform. The fund’s maximum risk of loss from counterparty risk is the fair value of the contract. This risk may be mitigated by having a master netting arrangement between the fund and the counterparty. Risk of loss may exceed amounts recognized on the Statement of assets and liabilities.
OTC total return swap contracts outstanding, including their respective notional amounts at period end, if any, are listed after the fund’s portfolio.
Credit default contracts The fund entered into OTC and/or centrally cleared credit default contracts to hedge credit risk, and to gain exposure on individual names and/or baskets of securities.
In OTC and centrally cleared credit default contracts, the protection buyer typically makes a periodic stream of payments to a counterparty, the protection seller, in exchange for the right to receive a contingent payment upon the occurrence of a credit event on the reference obligation or all other equally ranked obligations of the reference entity. Credit events are contract specific but may include bankruptcy, failure to pay, restructuring and obligation acceleration. For OTC credit default contracts, an upfront payment received by the fund is recorded as a liability on the fund’s books. An upfront payment made by the fund is recorded as an asset on the fund’s books. Centrally cleared credit default contracts provide the same rights to the protection buyer and seller except the payments between parties, including upfront premiums, are settled through a central clearing agent through variation margin payments. Upfront and periodic payments received or paid by the fund for OTC and centrally cleared credit default contracts are recorded as realized gains or losses at the reset date or close of the contract. The OTC and centrally cleared credit default contracts are marked to market daily based upon quotations from an independent pricing service or market makers. Any change in value of OTC credit default contracts is recorded as an unrealized gain or loss. Daily fluctuations in the value of centrally cleared credit default contracts are recorded in variation margin on the Statement of assets and liabilities and recorded as unrealized gain or loss. Upon the occurrence of a credit event, the difference between the par value and fair value of the reference obligation, net of any proportional amount of the upfront payment, is recorded as a realized gain or loss.
In addition to bearing the risk that the credit event will occur, the fund could be exposed to market risk due to unfavorable changes in interest rates or in the price of the underlying security or index or the possibility that the fund may be unable to close out its position at the same time or at the same price as if it had purchased the underlying reference obligations. In certain circumstances, the fund may enter into offsetting OTC and centrally cleared credit default contracts which would mitigate its risk of loss. Risks of loss may exceed amounts recognized on the Statement of assets and liabilities. The fund’s maximum risk of loss from counterparty risk, either as the protection seller or as the protection buyer, is the fair value of the contract. This risk may be mitigated for OTC credit default contracts by having a master netting arrangement between the fund and the counterparty and for centrally cleared credit default contracts through the daily exchange of variation margin. Counterparty risk is further mitigated with respect to centrally cleared credit default swap contracts due to the clearinghouse guarantee fund and other resources that are available in the event of a clearing member default. Where the fund is a seller of protection, the maximum potential amount of future payments the fund may be required to make is equal to the notional amount.
OTC and centrally cleared credit default contracts outstanding, including their respective notional amounts at period end, if any, are listed after the fund’s portfolio.
TBA commitments The fund may enter into TBA (to be announced) commitments to purchase securities for a fixed unit price at a future date beyond customary settlement time. Although the unit price and par amount have been established, the actual securities have not been specified. However, it is anticipated that the amount of the commitments will not significantly differ from the principal amount. The fund holds, and maintains until settlement date, cash or high-grade debt obligations in an amount sufficient to meet the purchase price, or the fund may enter into offsetting contracts for the forward sale of other securities it owns. Income on the securities will not be earned until settlement date.
The fund may also enter into TBA sale commitments to hedge its portfolio positions, to sell mortgage-backed securities it owns under delayed delivery arrangements or to take a short position in mortgage-backed securities. Proceeds of TBA sale commitments are not received until the contractual settlement date. During the time a TBA sale commitment is outstanding, either equivalent deliverable securities or an offsetting TBA purchase commitment deliverable on or before the sale commitment date are held as “cover” for the transaction, or other liquid assets in an amount equal to the notional value of the TBA sale commitment are segregated. If the TBA sale
Dynamic Risk Allocation Fund 89
commitment is closed through the acquisition of an offsetting TBA purchase commitment, the fund realizes a gain or loss. If the fund delivers securities under the commitment, the fund realizes a gain or a loss from the sale of the securities based upon the unit price established at the date the commitment was entered into.
TBA commitments, which are accounted for as purchase and sale transactions, may be considered securities themselves, and involve a risk of loss due to changes in the value of the security prior to the settlement date as well as the risk that the counterparty to the transaction will not perform its obligations. Counterparty risk is mitigated by having a master agreement between the fund and the counterparty.
Unsettled TBA commitments are valued at their fair value according to the procedures described under “Security valuation” above. The contract is marked to market daily and the change in fair value is recorded by the fund as an unrealized gain or loss. Based on market circumstances, Putnam Management will determine whether to take delivery of the underlying securities or to dispose of the TBA commitments prior to settlement.
TBA purchase commitments outstanding at period end, if any, are listed within the fund’s portfolio and TBA sale commitments outstanding at period end, if any, are listed after the fund’s portfolio.
Master agreements The fund is a party to ISDA (International Swaps and Derivatives Association, Inc.) Master Agreements that govern OTC derivative and foreign exchange contracts and Master Securities Forward Transaction Agreements that govern transactions involving mortgage-backed and other asset-backed securities that may result in delayed delivery (Master Agreements) with certain counterparties entered into from time to time. The Master Agreements may contain provisions regarding, among other things, the parties’ general obligations, representations, agreements, collateral requirements, events of default and early termination. With respect to certain counterparties, in accordance with the terms of the Master Agreements, collateral posted to the fund is held in a segregated account by the fund’s custodian and, with respect to those amounts which can be sold or repledged, are presented in the fund’s portfolio. Collateral posted to the fund which cannot be sold or repledged totaled $124,800 at the close of the reporting period.
Collateral pledged by the fund is segregated by the fund’s custodian and identified in the fund’s portfolio. Collateral can be in the form of cash or debt securities issued by the U.S. Government or related agencies or other securities as agreed to by the fund and the applicable counterparty. Collateral requirements are determined based on the fund’s net position with each counterparty.
With respect to ISDA Master Agreements, termination events applicable to the fund may occur upon a decline in the fund’s net assets below a specified threshold over a certain period of time. Termination events applicable to counterparties may occur upon a decline in the counterparty’s long-term or short-term credit ratings below a specified level. In each case, upon occurrence, the other party may elect to terminate early and cause settlement of all derivative and foreign exchange contracts outstanding, including the payment of any losses and costs resulting from such early termination, as reasonably determined by the terminating party. Any decision by one or more of the fund’s counterparties to elect early termination could impact the fund’s future derivative activity.
At the close of the reporting period, the fund had a net liability position of $6,088,264 on open derivative contracts subject to the Master Agreements. Collateral posted by the fund at period end for these agreements totaled $5,949,000 and may include amounts related to unsettled agreements.
Securities lending The fund may lend securities, through its agent, to qualified borrowers in order to earn additional income. The loans are collateralized by cash in an amount at least equal to the fair value of the securities loaned. The fair value of securities loaned is determined daily and any additional required collateral is allocated to the fund on the next business day. The risk of borrower default will be borne by the fund’s agent; the fund will bear the risk of loss with respect to the investment of the cash collateral. Income from securities lending is included in investment income on the Statement of operations. Cash collateral is invested in Putnam Cash Collateral Pool, LLC, a limited liability company managed by an affiliate of Putnam Management. Investments in Putnam Cash Collateral Pool, LLC are valued at its closing net asset value each business day. There are no management fees charged to Putnam Cash Collateral Pool, LLC. At the close of the reporting period, the fund received cash collateral of $426,625 and the value of securities loaned amounted to $422,441.
Interfund lending The fund, along with other Putnam funds, may participate in an interfund lending program pursuant to an exemptive order issued by the SEC. This program allows the fund to borrow from or lend to other Putnam funds that permit such transactions. Interfund lending transactions are subject to each fund’s investment policies and borrowing and lending limits. Interest earned or paid on the interfund lending transaction will be based on the average of certain current market rates. During the reporting period, the fund did not utilize the program.
90 Dynamic Risk Allocation Fund
Lines of credit The fund participates, along with other Putnam funds, in a $392.5 million unsecured committed line of credit and a $235.5 million unsecured uncommitted line of credit, both provided by State Street. Borrowings may be made for temporary or emergency purposes, including the funding of shareholder redemption requests and trade settlements. Interest is charged to the fund based on the fund’s borrowing at a rate equal to the Federal Funds rate plus 1.25% for the committed line of credit and the Federal Funds rate plus 1.30% for the uncommitted line of credit. A closing fee equal to 0.04% of the committed line of credit and 0.04% of the uncommitted line of credit has been paid by the participating funds. In addition, a commitment fee of 0.11% per annum on any unutilized portion of the committed line of credit is allocated to the participating funds based on their relative net assets and paid quarterly. During the reporting period, the fund had no borrowings against these arrangements.
Federal taxes It is the policy of the fund to distribute all of its taxable income within the prescribed time period and otherwise comply with the provisions of the Internal Revenue Code of 1986, as amended (the Code), applicable to regulated investment companies. It is also the intention of the fund to distribute an amount sufficient to avoid imposition of any excise tax under Section 4982 of the Code.
The fund is subject to the provisions of Accounting Standards Codification 740 Income Taxes (ASC 740). ASC 740 sets forth a minimum threshold for financial statement recognition of the benefit of a tax position taken or expected to be taken in a tax return. The fund did not have a liability to record for any unrecognized tax benefits in the accompanying financial statements. No provision has been made for federal taxes on income, capital gains or unrealized appreciation on securities held nor for excise tax on income and capital gains. Each of the fund’s federal tax returns for the prior three fiscal years remains subject to examination by the Internal Revenue Service.
The fund may also be subject to taxes imposed by governments of countries in which it invests. Such taxes are generally based on either income or gains earned or repatriated. The fund accrues and applies such taxes to net investment income, net realized gains and net unrealized gains as income and/or capital gains are earned. In some cases, the fund may be entitled to reclaim all or a portion of such taxes, and such reclaim amounts, if any, are reflected as an asset on the fund’s books. In many cases, however, the fund may not receive such amounts for an extended period of time, depending on the country of investment.
Distributions to shareholders Distributions to shareholders from net investment income are recorded by the fund on the ex-dividend date. Distributions from capital gains, if any, are recorded on the ex-dividend date and paid at least annually. The amount and character of income and gains to be distributed are determined in accordance with income tax regulations, which may differ from generally accepted accounting principles. These differences include temporary and/or permanent differences from losses on wash sale transactions, from foreign currency gains and losses, from nontaxable dividends, from income on swap contracts, and from a redesignation of taxable income. Reclassifications are made to the fund’s capital accounts to reflect income and gains available for distribution (or available capital loss carryovers) under income tax regulations. At the close of the reporting period, the fund reclassified $3,120,541 to decrease distributions in excess of net investment income, $12,166 to increase paid-in-capital and $3,132,707 to decrease accumulated net realized gain.
The tax basis components of distributable earnings and the federal tax cost as of the close of the reporting period were as follows:
|
Unrealized appreciation |
$14,113,345 |
|
Unrealized depreciation |
(4,408,943) |
|
Net unrealized appreciation |
9,704,402 |
|
Undistributed ordinary income |
474,105 |
|
Undistributed long-term gain |
3,677,460 |
|
Cost for federal income tax purposes |
$225,244,407 |
Expenses of the Trust Expenses directly charged or attributable to any fund will be paid from the assets of that fund. Generally, expenses of the Trust will be allocated among and charged to the assets of each fund on a basis that the Trustees deem fair and equitable, which may be based on the relative assets of each fund or the nature of the services performed and relative applicability to each fund.
Note 2: Management fee, administrative services and other transactions
The fund pays Putnam Management a management fee (based on the fund’s average net assets and computed and paid monthly) at annual rates that may vary based on the average of the aggregate net assets of most open-end
Dynamic Risk Allocation Fund 91
funds, as defined in the fund’s management contract, sponsored by Putnam Management. Such annual rates may vary as follows:
|
1.050% |
of the first $5 billion, |
|
1.000% |
of the next $5 billion, |
|
0.950% |
of the next $10 billion, |
|
0.900% |
of the next $10 billion, |
|
0.850% |
of the next $50 billion, |
|
0.830% |
of the next $50 billion, |
|
0.820% |
of the next $100 billion and |
|
0.815% |
of any excess thereafter. |
Putnam Management has contractually agreed to waive fees (and, to the extent necessary, bear other expenses) of the fund through September 30, 2016, to the extent that total expenses of the fund (excluding brokerage, interest, taxes, investment-related expenses, payments under distribution plans, extraordinary expenses and acquired fund fees and expenses) would exceed an annual rate of 1.15% of the fund’s average net assets. During the reporting period, the fund’s expenses were reduced by $182,629 as a result of this limit.
Putnam Management has also contractually agreed, through September 30, 2016, to waive fees or reimburse the fund’s expenses to the extent necessary to limit the cumulative expenses of the fund, exclusive of brokerage, interest, taxes, investment-related expenses, extraordinary expenses, acquired fund fees and expenses and payments under the fund’s investor servicing contract, investment management contract and distribution plans, on a fiscal year-to-date basis to an annual rate of 0.20% of the fund’s average net assets over such fiscal year-to-date period. During the reporting period, the fund’s expenses were not reduced as a result of this limit.
Putnam Investments Limited (PIL), an affiliate of Putnam Management, is authorized by the Trustees to manage a separate portion of the assets of the fund as determined by Putnam Management from time to time. Putnam Management pays a quarterly sub-management fee to PIL for its services at an annual rate of 0.35% of the average net assets of the portion of the fund managed by PIL.
The fund reimburses Putnam Management an allocated amount for the compensation and related expenses of certain officers of the fund and their staff who provide administrative services to the fund. The aggregate amount of all such reimbursements is determined annually by the Trustees.
Custodial functions for the fund’s assets are provided by State Street. Custody fees are based on the fund’s asset level, the number of its security holdings and transaction volumes.
Putnam Investor Services, Inc., an affiliate of Putnam Management, provides investor servicing agent functions to the fund. Putnam Investor Services, Inc. received fees for investor servicing (except for class R5 and R6 shares) that included (1) a per account fee for each direct and underlying non-defined contribution account (“retail account”) of the fund and each of the other funds in its specified category, which was totaled and then allocated to each fund in the category based on its average daily net assets; (2) a specified rate of the fund’s assets attributable to defined contribution plan accounts; and (3) for the portion of the fund’s fiscal year beginning after January 1, 2015, a specified rate based on the average net assets in retail accounts. Putnam Investor Services has agreed that the aggregate investor servicing fees for each fund’s retail and defined contribution accounts will not exceed an annual rate of 0.320% of the fund’s average assets attributable to such accounts. Class R5 shares paid a monthly fee based on the average net assets of class R5 shares at an annual rate of 0.15%. Class R6 shares paid a monthly fee based on the average net assets of class R6 shares at an annual rate of 0.05%. During the reporting period, the expenses for each class of shares related to investor servicing fees were as follows:
|
Class A |
$59,537 |
|
Class B |
7,677 |
|
Class C |
31,937 |
|
Class M |
679 |
|
Class R |
1,030 |
|
Class R5 |
17 |
|
Class R6 |
14,561 |
|
Class Y |
270,799 |
|
Total |
$386,237 |
The fund has entered into expense offset arrangements with Putnam Investor Services, Inc. and State Street whereby Putnam Investor Services, Inc.’s and State Street’s fees are reduced by credits allowed on cash balances. The fund also reduced expenses through brokerage/service arrangements. For the reporting period, the fund’s expenses were reduced by $337 under the expense offset arrangements and by $1,065 under the brokerage/service arrangements.
Each Independent Trustee of the fund receives an annual Trustee fee, of which $124, as a quarterly retainer, has been allocated to the fund, and an additional fee for each Trustees meeting attended. Trustees also are reimbursed for expenses they incur relating to their services as Trustees.
92 Dynamic Risk Allocation Fund
The fund has adopted a Trustee Fee Deferral Plan (the Deferral Plan) which allows the Trustees to defer the receipt of all or a portion of Trustees fees payable on or after July 1, 1995. The deferred fees remain invested in certain Putnam funds until distribution in accordance with the Deferral Plan.
The fund has adopted an unfunded noncontributory defined benefit pension plan (the Pension Plan) covering all Trustees of the fund who have served as a Trustee for at least five years and were first elected prior to 2004. Benefits under the Pension Plan are equal to 50% of the Trustee’s average annual attendance and retainer fees for the three years ended December 31, 2005. The retirement benefit is payable during a Trustee’s lifetime, beginning the year following retirement, for the number of years of service through December 31, 2006. Pension expense for the fund is included in Trustee compensation and expenses in the Statement of operations. Accrued pension liability is included in Payable for Trustee compensation and expenses in the Statement of assets and liabilities. The Trustees have terminated the Pension Plan with respect to any Trustee first elected after 2003.
The fund has adopted distribution plans (the Plans) with respect to its class A, class B, class C, class M and class R shares pursuant to Rule 12b–1 under the Investment Company Act of 1940. The purpose of the Plans is to compensate Putnam Retail Management Limited Partnership, an indirect wholly-owned subsidiary of Putnam Investments, LLC, for services provided and expenses incurred in distributing shares of the fund. The Plans provide for payments by the fund to Putnam Retail Management Limited Partnership at an annual rate of up to 0.35%, 1.00%, 1.00%, 1.00% and 1.00% of the average net assets attributable to class A, class B, class C, class M and class R shares, respectively. The Trustees have approved payment by the fund at an annual rate of 0.25%, 1.00%, 1.00%, 0.75% and 0.50% of the average net assets attributable to class A, class B, class C, class M and class R shares, respectively. During the reporting period, the class specific expenses related to distribution fees were as follows:
|
Class A |
$73,757 |
|
Class B |
38,027 |
|
Class C |
158,228 |
|
Class M |
2,523 |
|
Class R |
2,552 |
|
Total |
$275,087 |
For the reporting period, Putnam Retail Management Limited Partnership, acting as underwriter, received net commissions of $12,473 and $84 from the sale of class A and class M shares, respectively, and received $1,651 and $451 in contingent deferred sales charges from redemptions of class B and class C shares, respectively.
A deferred sales charge of up to 1.00% and 0.65% is assessed on certain redemptions of class A and class M shares, respectively. For the reporting period, Putnam Retail Management Limited Partnership, acting as underwriter, received $12 and no monies on class A and class M redemptions, respectively.
Note 3: Purchases and sales of securities
During the reporting period, the cost of purchases and the proceeds from sales, excluding short-term investments, were as follows:
|
Cost of purchases |
Proceeds from sales |
|
|
Investments in securities, including TBA commitments |
$442,276,666 |
$405,192,511 |
|
U.S. government securities (Long-term) |
— |
— |
|
Total |
$442,276,666 |
$405,192,511 |
Written option transactions during the reporting period are summarized as follows:
|
Written option |
Written option |
|
|
Written options outstanding at the beginning of the reporting period |
$226,536 |
$51,227 |
|
Options opened |
2,574,591 |
938,760 |
|
Options exercised |
— |
— |
|
Options expired |
(1,548,556) |
(491,638) |
|
Options closed |
(1,025,857) |
(433,685) |
|
Written options outstanding at the end of the reporting period |
$226,714 |
$64,664 |
Dynamic Risk Allocation Fund 93
Note 4: Capital shares
At the close of the reporting period, there were an unlimited number of shares of beneficial interest authorized. Transactions in capital shares were as follows:
|
Year ended 5/31/15 |
Year ended 5/31/14 |
|||
|
Class A |
Shares |
Amount |
Shares |
Amount |
|
Shares sold |
498,210 |
$5,629,425 |
804,548 |
$8,713,678 |
|
Shares issued in connection with reinvestment of distributions |
111,531 |
1,200,072 |
20,972 |
228,803 |
|
609,741 |
6,829,497 |
825,520 |
8,942,481 |
|
|
Shares repurchased |
(992,689) |
(11,353,441) |
(4,336,778) |
(46,475,698) |
|
Net decrease |
(382,948) |
$(4,523,944) |
(3,511,258) |
$(37,533,217) |
|
Year ended 5/31/15 |
Year ended 5/31/14 |
|||
|
Class B |
Shares |
Amount |
Shares |
Amount |
|
Shares sold |
48,217 |
$540,985 |
101,490 |
$1,096,016 |
|
Shares issued in connection with reinvestment of distributions |
12,041 |
128,117 |
306 |
3,313 |
|
60,258 |
669,102 |
101,796 |
1,099,329 |
|
|
Shares repurchased |
(34,167) |
(382,608) |
(48,780) |
(526,630) |
|
Net increase |
26,091 |
$286,494 |
53,016 |
$572,699 |
|
Year ended 5/31/15 |
Year ended 5/31/14 |
|||
|
Class C |
Shares |
Amount |
Shares |
Amount |
|
Shares sold |
168,084 |
$1,887,992 |
366,562 |
$3,883,865 |
|
Shares issued in connection with reinvestment of distributions |
54,205 |
577,280 |
— |
— |
|
222,289 |
2,465,272 |
366,562 |
3,883,865 |
|
|
Shares repurchased |
(268,562) |
(2,982,715) |
(937,842) |
(10,045,435) |
|
Net decrease |
(46,273) |
$(517,443) |
(571,280) |
$(6,161,570) |
|
Year ended 5/31/15 |
Year ended 5/31/14 |
|||
|
Class M |
Shares |
Amount |
Shares |
Amount |
|
Shares sold |
1,819 |
$20,779 |
9,177 |
$98,335 |
|
Shares issued in connection with reinvestment of distributions |
1,300 |
14,038 |
57 |
628 |
|
3,119 |
34,817 |
9,234 |
98,963 |
|
|
Shares repurchased |
(2,090) |
(23,595) |
(13,577) |
(145,979) |
|
Net increase (decrease) |
1,029 |
$11,222 |
(4,343) |
$(47,016) |
|
Year ended 5/31/15 |
Year ended 5/31/14 |
|||
|
Class R |
Shares |
Amount |
Shares |
Amount |
|
Shares sold |
7,451 |
$82,929 |
6,331 |
$67,319 |
|
Shares issued in connection with reinvestment of distributions |
1,801 |
19,272 |
170 |
1,846 |
|
9,252 |
102,201 |
6,501 |
69,165 |
|
|
Shares repurchased |
(27,557) |
(305,103) |
(7,736) |
(82,379) |
|
Net decrease |
(18,305) |
$(202,902) |
(1,235) |
$(13,214) |
94 Dynamic Risk Allocation Fund
|
Year ended 5/31/15 |
Year ended 5/31/14 |
|||
|
Class R5 |
Shares |
Amount |
Shares |
Amount |
|
Shares sold |
— |
$— |
— |
$— |
|
Shares issued in connection with reinvestment of distributions |
52 |
566 |
10 |
109 |
|
52 |
566 |
10 |
109 |
|
|
Shares repurchased |
— |
— |
— |
— |
|
Net increase |
52 |
$566 |
10 |
$109 |
|
Year ended 5/31/15 |
Year ended 5/31/14 |
|||
|
Class R6 |
Shares |
Amount |
Shares |
Amount |
|
Shares sold |
2,419,071 |
$28,026,344 |
48,166 |
$526,412 |
|
Shares issued in connection with reinvestment of distributions |
139,821 |
1,503,075 |
2,213 |
24,169 |
|
2,558,892 |
29,529,419 |
50,379 |
550,581 |
|
|
Shares repurchased |
(32,760) |
(361,930) |
(127,386) |
(1,378,922) |
|
Net increase (decrease) |
2,526,132 |
$29,167,489 |
(77,007) |
$(828,341) |
|
Year ended 5/31/15 |
Year ended 5/31/14 |
|||
|
Class Y |
Shares |
Amount |
Shares |
Amount |
|
Shares sold |
2,113,790 |
$23,875,110 |
1,822,112 |
$19,827,758 |
|
Shares issued in connection with reinvestment of distributions |
595,127 |
6,397,619 |
121,533 |
1,325,923 |
|
2,708,917 |
30,272,729 |
1,943,645 |
21,153,681 |
|
|
Shares repurchased |
(2,042,929) |
(22,917,434) |
(4,808,631) |
(52,262,193) |
|
Net increase (decrease) |
665,988 |
$7,355,295 |
(2,864,986) |
$(31,108,512) |
At the close of the reporting period, Putnam Investments, LLC owned the following shares of the fund:
|
Shares owned |
Percentage of ownership |
Value |
|
|
Class R |
10,000 |
42.2% |
$110,200 |
|
Class R5 |
1,048 |
100.0 |
11,660 |
|
Class R6 |
1,051 |
0.0 |
11,666 |
At the close of the reporting period, a shareholder of record owned 13% of the outstanding shares of the fund.
Note 5: Affiliated transactions
Transactions during the reporting period with Putnam Money Market Liquidity Fund and Putnam Short Term Investment Fund, which are under common ownership or control, were as follows:
|
Name of affiliate |
Fair value at the beginning of the reporting period |
Purchase cost |
Sale proceeds |
Investment income |
Fair value at the end of the reporting period |
|
Putnam Money Market Liquidity Fund* |
$10,960,847 |
$31,515,228 |
$32,336,655 |
$10,349 |
$10,139,420 |
|
Putnam Short Term Investment Fund* |
35,761,784 |
62,903,459 |
57,655,195 |
29,265 |
41,010,048 |
|
Totals |
$46,722,631 |
$94,418,687 |
$89,991,850 |
$39,614 |
$51,149,468 |
*Management fees charged to Putnam Money Market Liquidity Fund and Putnam Short Term Investment Fund have been waived by Putnam Management.
Dynamic Risk Allocation Fund 95
Note 6: Senior loan commitments
Senior loans are purchased or sold on a when-issued or delayed delivery basis and may be settled a month or more after the trade date, which from time to time can delay the actual investment of available cash balances; interest income is accrued based on the terms of the securities. Senior loans can be acquired through an agent, by assignment from another holder of the loan, or as a participation interest in another holder’s portion of the loan. When the fund invests in a loan or participation, the fund is subject to the risk that an intermediate participant between the fund and the borrower will fail to meet its obligations to the fund, in addition to the risk that the borrower under the loan may default on its obligations.
Note 7: Market, credit and other risks
In the normal course of business, the fund trades financial instruments and enters into financial transactions where risk of potential loss exists due to changes in the market (market risk) or failure of the contracting party to the transaction to perform (credit risk). The fund may be exposed to additional credit risk that an institution or other entity with which the fund has unsettled or open transactions will default. Investments in foreign securities involve certain risks, including those related to economic instability, unfavorable political developments, and currency fluctuations. The fund may invest a significant portion of its assets in securitized debt instruments, including mortgage-backed and asset-backed investments. The yields and values of these investments are sensitive to changes in interest rates, the rate of principal payments on the underlying assets and the market’s perception of the issuers. The market for these investments may be volatile and limited, which may make them difficult to buy or sell.
Note 8: Summary of derivative activity
The volume of activity for the reporting period for any derivative type that was held during the period is listed below and was as follows based on an average of the holdings at the end of each fiscal quarter:
|
Purchased equity option contracts (contract amount) |
$240,000 |
|
Written equity option contracts (contract amount) (Note 3) |
$180,000 |
|
Futures contracts (number of contracts) |
600 |
|
Forward currency contracts (contract amount) |
$88,400,000 |
|
Centrally cleared interest rate swap contracts (notional) |
$92,100,000 |
|
OTC total return swap contracts (notional) |
$161,500,000 |
|
OTC credit default contracts (notional) |
$18,000,000 |
|
Centrally cleared credit default contracts (notional) |
$31,700,000 |
96 Dynamic Risk Allocation Fund
The following is a summary of the fair value of derivative instruments as of the close of the reporting period:
Fair value of derivative instruments as of the close of the reporting period
|
Asset derivatives |
Liability derivatives |
|||
|
Derivatives not accounted for as hedging instruments under ASC 815 |
Statement of |
Fair value |
Statement of |
Fair value |
|
Credit contracts |
Receivables, Net assets — Unrealized appreciation |
$2,556,617* |
Payables |
$1,466,823 |
|
Foreign exchange contracts |
Receivables |
649,169 |
Payables |
733,730 |
|
Equity contracts |
Investments, Receivables, Net assets — Unrealized appreciation |
1,777,432* |
Payables, Net assets — Unrealized depreciation |
473,283* |
|
Interest rate contracts |
Investments, Receivables, Net assets — Unrealized appreciation |
845,996* |
Payables, Net assets — Unrealized depreciation |
6,030,886* |
|
Total |
$5,829,214 |
$8,704,722 |
||
*Includes cumulative appreciation/depreciation of futures contracts and/or centrally cleared swaps as reported in the fund’s portfolio. Only current day’s variation margin is reported within the Statement of assets and liabilities.
The following is a summary of realized and change in unrealized gains or losses of derivative instruments on the Statement of operations for the reporting period (see Note 1):
Amount of realized gain or (loss) on derivatives recognized in net gain or (loss) on investments
|
Derivatives not accounted for as hedging instruments under ASC 815 |
Options |
Futures |
Forward currency contracts |
Swaps |
Total |
|
Credit contracts |
$— |
$— |
$— |
$(68,282) |
$(68,282) |
|
Foreign exchange |
— |
— |
1,159,140 |
— |
$1,159,140 |
|
Equity contracts |
(2,682,679) |
699,923 |
— |
1,222,420 |
$(760,336) |
|
Interest rate contracts |
— |
3,073,692 |
— |
5,584,719 |
$8,658,411 |
|
Total |
$(2,682,679) |
$3,773,615 |
$1,159,140 |
$6,738,857 |
$8,988,933 |
Change in unrealized appreciation or (depreciation) on derivatives recognized in net gain or (loss) on investments
|
Derivatives not accounted for as hedging instruments under ASC 815 |
Options |
Futures |
Forward currency contracts |
Swaps |
Total |
|
Credit contracts |
$— |
$— |
$— |
$(622,748) |
$(622,748) |
|
Foreign exchange |
— |
— |
55,580 |
— |
$55,580 |
|
Equity contracts |
79,616 |
719,870 |
— |
(216,757) |
$582,729 |
|
Interest rate contracts |
— |
(477,489) |
— |
(6,204,081) |
$(6,681,570) |
|
Total |
$79,616 |
$242,381 |
$55,580 |
$(7,043,586) |
$(6,666,009) |
Dynamic Risk Allocation Fund 97
Note 9: Offsetting of financial and derivative assets and liabilities
The following table summarizes any derivatives, repurchase agreements and reverse repurchase agreements, at the end of the reporting period, that are subject to an enforceable master netting agreement or similar agreement. For securities lending transactions or borrowing transactions associated with securities sold short, if any, see Note 1. For financial reporting purposes, the fund does not offset financial assets and financial liabilities that are subject to the master netting agreements in the Statement of assets and liabilities.
|
Bank of America N.A. |
Barclays Bank PLC |
Barclays Capital Inc. (clearing broker) |
Citibank, N.A. |
Credit Suisse International |
Deutsche Bank AG |
Goldman Sachs International |
HSBC Bank USA, National Association |
JPMorgan Chase Bank N.A. |
Merrill Lynch, Pierce, Fenner & Smith, Inc. |
Royal Bank of Scotland PLC (The) |
State Street Bank and Trust Co. |
UBS AG |
WestPac Banking Corp. |
Total |
|
|
Assets: |
|||||||||||||||
|
Centrally cleared interest rate swap contracts§ |
$— |
$— |
$176,560 |
$— |
$— |
$— |
$— |
$— |
$— |
$— |
$— |
$— |
$— |
$— |
$176,560 |
|
OTC Total return swap contracts*# |
90,795 |
— |
— |
257,967 |
210,168 |
— |
— |
— |
— |
— |
— |
— |
— |
— |
558,930 |
|
OTC Credit default contracts*# |
— |
21 |
— |
— |
7,123 |
— |
1,264 |
— |
— |
— |
— |
— |
— |
— |
8,408 |
|
Centrally cleared credit default contracts§ |
— |
— |
1,408,522 |
— |
— |
— |
— |
— |
— |
— |
— |
— |
— |
— |
1,408,522 |
|
Futures contracts§ |
— |
— |
— |
— |
— |
— |
— |
— |
— |
183,339 |
— |
— |
— |
— |
183,339 |
|
Forward currency contracts# |
16,934 |
60,256 |
— |
34,188 |
72,587 |
83,345 |
6,288 |
21,541 |
157,921 |
— |
48,383 |
23,102 |
124,624 |
— |
649,169 |
|
Purchased options**# |
— |
— |
— |
— |
— |
— |
— |
— |
930,073 |
— |
— |
— |
— |
— |
930,073 |
|
Total Assets |
$107,729 |
$60,277 |
$1,585,082 |
$292,155 |
$289,878 |
$83,345 |
$7,552 |
$21,541 |
$1,087,994 |
$183,339 |
$48,383 |
$23,102 |
$124,624 |
$— |
$3,915,001 |
|
Liabilities: |
|||||||||||||||
|
Centrally cleared interest rate swap contracts§ |
— |
— |
5,689 |
— |
— |
— |
— |
— |
— |
— |
— |
— |
— |
— |
5,689 |
|
OTC Total return swap contracts*# |
1,080,104 |
705,016 |
— |
165,391 |
1,824,353 |
43,684 |
790,795 |
— |
1,247,289 |
— |
— |
— |
— |
— |
5,856,632 |
|
OTC Credit default contracts*# |
— |
1,462,973 |
— |
— |
2,811 |
— |
1,039 |
— |
— |
— |
— |
— |
— |
— |
1,466,823 |
|
Centrally cleared credit default contracts§ |
— |
— |
164 |
— |
— |
— |
— |
— |
— |
— |
— |
— |
— |
— |
164 |
|
Futures contracts§ |
— |
— |
— |
— |
— |
— |
— |
— |
— |
121,100 |
— |
— |
— |
— |
121,100 |
|
Forward currency contracts# |
9,491 |
26,601 |
— |
46,428 |
166,831 |
36,140 |
61,223 |
78,898 |
48,138 |
— |
46,470 |
62,974 |
66,142 |
84,394 |
733,730 |
|
Written options# |
33,011 |
396 |
— |
11,589 |
— |
1,099 |
— |
— |
— |
— |
— |
— |
— |
— |
46,095 |
|
Total Liabilities |
$1,122,606 |
$2,194,986 |
$5,853 |
$223,408 |
$1,993,995 |
$80,923 |
$853,057 |
$78,898 |
$1,295,427 |
$121,100 |
$46,470 |
$62,974 |
$66,142 |
$84,394 |
$8,230,233 |
|
Total Financial and Derivative Net Assets |
$(1,014,877) |
$(2,134,709) |
$1,579,229 |
$68,747 |
$(1,704,117) |
$2,422 |
$(845,505) |
$(57,357) |
$(207,433) |
$62,239 |
$1,913 |
$(39,872) |
$58,482 |
$(84,394) |
$(4,315,232) |
|
Total collateral received (pledged)†## |
$(1,014,877) |
$(2,119,000) |
$— |
$60,000 |
$(1,540,000) |
$— |
$(842,000) |
$— |
$(207,433) |
$— |
$— |
$— |
$58,482 |
$— |
|
|
Net amount |
$— |
$(15,709) |
$1,579,229 |
$8,747 |
$(164,117) |
$2,422 |
$(3,505) |
$(57,357) |
$— |
$62,239 |
$1,913 |
$(39,872) |
$— |
$(84,394) |
|
* |
Excludes premiums, if any. Included in unrealized appreciation and depreciation on OTC swap contracts on the Statement of assets and liabilities. |
|
** |
Included with Investments in securities on the Statement of assets and liabilities. |
|
† |
Additional collateral may be required from certain brokers based on individual agreements. |
|
# |
Covered by master netting agreement (Note 1). |
|
## |
Any over-collateralization of total financial and derivative net assets is not shown. Collateral may include amounts related to unsettled agreements. |
|
§ |
Includes current day’s variation margin only as reported on the Statement of assets and liabilities, which is not collateralized. Cumulative appreciation/(depreciation) for futures contracts and centrally cleared swap contracts is represented in the tables listed after the fund’s portfolio. |
|
98 |
Dynamic Risk Allocation Fund |
Dynamic Risk Allocation Fund |
99 |
Federal tax information (Unaudited)
Pursuant to §852 of the Internal Revenue Code, as amended, the fund hereby designates $8,658,326 as a capital gain dividend with respect to the taxable year ended May 31, 2015, or, if subsequently determined to be different, the net capital gain of such year.
The fund designated 23.88% of ordinary income distributions as qualifying for the dividends received deduction for corporations.
For the reporting period, the fund hereby designates 40.12%, or the maximum amount allowable, of its taxable ordinary income distributions as qualified dividends taxed at the individual net capital gain rates.
The Form 1099 that will be mailed to you in January 2016 will show the tax status of all distributions paid to your account in calendar 2015.
100 Dynamic Risk Allocation Fund
About the Trustees
Independent Trustees

Liaquat Ahamed
Born 1952, Trustee since 2012
Principal occupations during past five years: Pulitzer Prize-winning author of Lords of Finance: The Bankers Who Broke the World, whose articles on economics have appeared in such publications as the New York Times, Foreign Affairs, and the Financial Times. Director of Aspen Insurance Co., a New York Stock Exchange company, and Chair of the Aspen Board’s Investment Committee. Trustee of the Brookings Institution.
Other directorships: The Rohatyn Group, an emerging-market fund complex that manages money for institutions

Ravi Akhoury
Born 1947, Trustee since 2009
Principal occupations during past five years: Trustee of American India Foundation and of the Rubin Museum. From 1992 to 2007, was Chairman and CEO of MacKay Shields, a multi-product investment management firm.
Other directorships: RAGE Frameworks, Inc., a private software company; English Helper, Inc., a private software company

Barbara M. Baumann
Born 1955, Trustee since 2010
Principal occupations during past five years: President and Owner of Cross Creek Energy Corporation, a strategic consultant to domestic energy firms and direct investor in energy projects. Current Board member of The Denver Foundation. Former Chair and current Board member of Girls Incorporated of Metro Denver. Member of the Finance Committee, the Children’s Hospital of Colorado.
Other directorships: Buckeye Partners, L.P., a publicly traded master limited partnership focused on pipeline transport, storage, and distribution of petroleum products; Devon Energy Corporation, a leading independent natural gas and oil exploration and production company

Jameson A. Baxter
Born 1943, Trustee since 1994, Vice Chair from 2005 to 2011, and Chair since 2011
Principal occupations during past five years: President of Baxter Associates, Inc., a private investment firm. Chair of Mutual Fund Directors Forum. Chair Emeritus of the Board of Trustees of Mount Holyoke College. Director of the Adirondack Land Trust and Trustee of the Nature Conservancy’s Adirondack Chapter.

Robert J. Darretta
Born 1946, Trustee since 2007
Principal occupations during past five years: From 2009 until 2012, served as Health Care Industry Advisor to Permira, a global private equity firm. Until April 2007, was Vice Chairman of the Board of Directors of Johnson & Johnson. Served as Johnson & Johnson’s Chief Financial Officer for a decade.
Other directorships: UnitedHealth Group, a diversified health-care company

Katinka Domotorffy
Born 1975, Trustee since 2012
Principal occupations during past five years: Voting member of the Investment Committees of the Anne Ray Charitable Trust and Margaret A. Cargill Foundation, part of the Margaret A. Cargill Philanthropies. Until 2011, Partner, Chief Investment Officer, and Global Head of Quantitative Investment Strategies at Goldman Sachs Asset Management.
Other directorships: Reach Out and Read of Greater New York, an organization dedicated to promoting childhood literacy; Great Lakes Science Center

John A. Hill
Born 1942, Trustee since 1985 and Chairman from 2000 to 2011
Principal occupations during past five years: Founder and Vice-Chairman of First Reserve Corporation, the leading private equity buyout firm focused on the worldwide energy industry. Trustee and Chairman of the Board of Trustees of Sarah Lawrence College. Member of the Advisory Board of the Millstein Center for Global Markets and Corporate Ownership at The Columbia University Law School.
Other directorships: Devon Energy Corporation, a leading independent natural gas and oil exploration and production company
Dynamic Risk Allocation Fund 101

Paul L. Joskow
Born 1947, Trustee since 1997
Principal occupations during past five years: Economist and President of the Alfred P. Sloan Foundation, a philanthropic institution focused primarily on research and education on issues related to science, technology, and economic performance. Elizabeth and James Killian Professor of Economics, Emeritus at the Massachusetts Institute of Technology (MIT). Prior to 2007, served as the Director of the Center for Energy and Environmental Policy Research at MIT.
Other directorships: Yale University; Exelon Corporation, an energy company focused on power services; Boston Symphony Orchestra; Prior to April 2013, served as Director of TransCanada Corporation and TransCanada Pipelines Ltd., energy companies focused on natural gas transmission, oil pipelines and power services

Kenneth R. Leibler
Born 1949, Trustee since 2006
Principal occupations during past five years: Founder and former Chairman of Boston Options Exchange, an electronic marketplace for the trading of derivative securities. Serves on the Board of Trustees of Beth Israel Deaconess Hospital in Boston, Massachusetts. Director of Beth Israel Deaconess Care Organization. Until November 2010, director of Ruder Finn Group, a global communications and advertising firm.
Other directorships: Eversource Corporation, which operates New England’s largest energy delivery system

Robert E. Patterson
Born 1945, Trustee since 1984
Principal occupations during past five years: Co-Chairman of Cabot Properties, Inc., a private equity firm investing in commercial real estate, and Chairman of its Investment Committee. Past Chairman and Trustee of the Joslin Diabetes Center.

George Putnam, III
Born 1951, Trustee since 1984
Principal occupations during past five years: Chairman of New Generation Research, Inc., a publisher of financial advisory and other research services. Founder and President of New Generation Advisors, LLC, a registered investment advisor to private funds. Director of The Boston Family Office, LLC, a registered investment advisor.

W. Thomas Stephens
Born 1942, Trustee from 1997 to 2008 and since 2009
Principal occupations during past five years: Retired as Chairman and Chief Executive Officer of Boise Cascade, LLC, a paper, forest products, and timberland assets company, in December 2008. Prior to 2010, Director of Boise Inc., a manufacturer of paper and packaging products.
Other directorships: Prior to April 2014, served as Director of TransCanada Pipelines Ltd., an energy infrastructure company
Interested Trustee

Robert L. Reynolds*
Born 1952, Trustee since 2008 and President of the Putnam Funds since 2009
Principal occupations during past five years: President and Chief Executive Officer of Putnam Investments since 2008 and, since 2014, President and Chief Executive Officer of Great-West Financial, a financial services company that provides retirement savings plans, life insurance, and annuity and executive benefits products, and of Great-West Lifeco U.S. Inc., a holding company that owns Putnam Investments and Great-West Financial. Prior to joining Putnam Investments, served as Vice Chairman and Chief Operating Officer of Fidelity Investments from 2000 to 2007.
*Mr. Reynolds is an “interested person” (as defined in the Investment Company Act of 1940) of the fund and Putnam Investments. He is President and Chief Executive Officer of Putnam Investments, as well as the President of your fund and each of the other Putnam funds.
The address of each Trustee is One Post Office Square, Boston, MA 02109.
As of May 31, 2015, there were 117 Putnam funds. All Trustees serve as Trustees of all Putnam funds.
Each Trustee serves for an indefinite term, until his or her resignation, retirement at age 75, removal, or death.
102 Dynamic Risk Allocation Fund
Officers
In addition to Robert L. Reynolds, the other officers of the fund are shown below:
Jonathan S. Horwitz (Born 1955)
Executive Vice President, Principal Executive Officer, and Compliance Liaison
Since 2004
Steven D. Krichmar (Born 1958)
Vice President and Principal Financial Officer
Since 2002
Chief of Operations, Putnam Investments and Putnam Management
Robert T. Burns (Born 1961)
Vice President and Chief Legal Officer
Since 2011
General Counsel, Putnam Investments, Putnam Management, and Putnam Retail Management
Robert R. Leveille (Born 1969)
Vice President and Chief Compliance Officer
Since 2007
Chief Compliance Officer, Putnam Investments, Putnam Management, and Putnam Retail Management
Michael J. Higgins (Born 1976)
Vice President, Treasurer, and Clerk
Since 2010
Manager of Finance, Dunkin’ Brands (2008–2010); Senior Financial Analyst, Old Mutual Asset Management (2007–2008); Senior Financial Analyst, Putnam Investments (1999–2007)
Janet C. Smith (Born 1965)
Vice President, Principal Accounting Officer, and Assistant Treasurer
Since 2007
Director of Fund Administration Services, Putnam Investments and Putnam Management
Susan G. Malloy (Born 1957)
Vice President and Assistant Treasurer
Since 2007
Director of Accounting & Control Services, Putnam Investments and Putnam Management
James P. Pappas (Born 1953)
Vice President
Since 2004
Director of Trustee Relations, Putnam Investments and Putnam Management
Mark C. Trenchard (Born 1962)
Vice President and BSA Compliance Officer
Since 2002
Director of Operational Compliance, Putnam Investments and Putnam Retail Management
Nancy E. Florek (Born 1957)
Vice President, Director of Proxy Voting and Corporate Governance, Assistant Clerk, and Associate Treasurer
Since 2000
The principal occupations of the officers for the past five years have been with the employers as shown above, although in some cases they have held different positions with such employers. The address of each officer is One Post Office Square, Boston, MA 02109.
Dynamic Risk Allocation Fund 103
Putnam family of funds
The following is a list of Putnam’s open-end mutual funds offered to the public. Investors should carefully consider the investment objective, risks, charges, and expenses of a fund before investing. For a prospectus, or a summary prospectus if available, containing this and other information for any Putnam fund or product, contact your financial advisor or call Putnam Investor Services at 1-800-225-1581. Please read the prospectus carefully before investing.
Growth
Growth Opportunities Fund
International Growth Fund
Multi-Cap Growth Fund
Small Cap Growth Fund
Voyager Fund
Blend
Asia Pacific Equity Fund
Capital Opportunities Fund
Capital Spectrum Fund
Emerging Markets Equity Fund
Equity Spectrum Fund
Europe Equity Fund
Global Equity Fund
International Capital Opportunities Fund
International Equity Fund
Investors Fund
Low Volatility Equity Fund
Multi-Cap Core Fund
Research Fund
Strategic Volatility Equity Fund
Value
Convertible Securities Fund
Equity Income Fund
Global Dividend Fund
The Putnam Fund for Growth and Income
International Value Fund
Multi-Cap Value Fund
Small Cap Value Fund
Income
American Government Income Fund
Diversified Income Trust
Emerging Markets Income Fund
Floating Rate Income Fund
Global Income Trust
High Yield Advantage Fund
High Yield Trust
Income Fund
Money Market Fund*
Short Duration Income Fund
U.S. Government Income Trust
Tax-free Income
AMT-Free Municipal Fund
Intermediate-Term Municipal Income Fund
Short-Term Municipal Income Fund
Tax Exempt Income Fund
Tax Exempt Money Market Fund*
Tax-Free High Yield Fund
State tax-free income funds†:
Arizona, California, Massachusetts, Michigan, Minnesota, New Jersey, New York, Ohio, and Pennsylvania.
* An investment in a money market fund is not insured or guaranteed by the Federal Deposit Insurance Corporation or any other government agency. Although the fund seeks to preserve the value of your investment at $1.00 per share, it is possible to lose money by investing in the fund.
†Not available in all states.
104 Dynamic Risk Allocation Fund
Absolute Return
Absolute Return 100 Fund®
Absolute Return 300 Fund®
Absolute Return 500 Fund®
Absolute Return 700 Fund®
Global Sector
Global Consumer Fund
Global Energy Fund
Global Financials Fund
Global Health Care Fund
Global Industrials Fund
Global Natural Resources Fund
Global Sector Fund
Global Technology Fund
Global Telecommunications Fund
Global Utilities Fund
Asset Allocation
George Putnam Balanced Fund
Global Asset Allocation Funds — four investment portfolios that spread your money across a variety of stocks, bonds, and money market instruments.
Dynamic Asset Allocation Balanced Fund
Dynamic Asset Allocation Conservative Fund
Dynamic Asset Allocation Growth Fund
Dynamic Risk Allocation Fund
Retirement Income Lifestyle Funds — portfolios with managed allocations to stocks, bonds, and money market investments to generate retirement income.
Retirement Income Fund Lifestyle 1
Retirement Income Fund Lifestyle 2
Retirement Income Fund Lifestyle 3
RetirementReady® Funds — portfolios with adjusting allocations to stocks, bonds, and money market instruments, becoming more conservative over time.
RetirementReady® 2055 Fund
RetirementReady® 2050 Fund
RetirementReady® 2045 Fund
RetirementReady® 2040 Fund
RetirementReady® 2035 Fund
RetirementReady® 2030 Fund
RetirementReady® 2025 Fund
RetirementReady® 2020 Fund
RetirementReady® 2015 Fund
Check your account balances and the most recent month-end performance in the Individual Investors section
at putnam.com.
Dynamic Risk Allocation Fund 105
Services for shareholders
Investor services
Systematic investment plan Tell us how much you wish to invest regularly — weekly, semimonthly, or monthly — and the amount you choose will be transferred automatically from your checking or savings account. There’s no additional fee for this service, and you can suspend it at any time. This plan may be a great way to save for college expenses or to plan for your retirement.
Please note that regular investing does not guarantee a profit or protect against loss in a declining market. Before arranging a systematic investment plan, consider your financial ability to continue making purchases in periods when prices are low.
Systematic exchange You can make regular transfers from one Putnam fund to another Putnam fund. There are no additional fees for this service, and you can cancel or change your options at any time.
Dividends PLUS You can choose to have the dividend distributions from one of your Putnam funds automatically reinvested in another Putnam fund at no additional charge.
Free exchange privilege You can exchange money between Putnam funds free of charge, as long as they are the same class of shares. A signature guarantee is required if you are exchanging more than $500,000. The fund reserves the right to revise or terminate the exchange privilege.
Reinstatement privilege If you’ve sold Putnam shares or received a check for a dividend or capital gain, you may reinvest the proceeds with Putnam within 90 days of the transaction and they will be reinvested at the fund’s current net asset value — with no sales charge. However, reinstatement of class B shares may have special tax consequences. Ask your financial or tax representative for details.
Check-writing service You have ready access to many Putnam accounts. It’s as simple as writing a check, and there are no special fees or service charges. For more information about the check-writing service, call Putnam or visit our website.
Dollar cost averaging When you’re investing for long-term goals, it’s time, not timing, that counts. Investing on a systematic basis is a better strategy than trying to figure out when the markets will go up or down. This means investing the same amount of money regularly over a long period. This method of investing is called dollar cost averaging. When a fund’s share price declines, your investment dollars buy more shares at lower prices. When it increases, they buy fewer shares. Over time, you will pay a lower average price per share.
For more information
Visit the Individual Investors section at putnam.com A secure section of our website contains complete information on your account, including balances and transactions, updated daily. You may also conduct transactions, such as exchanges, additional investments, and address changes. Log on today to get your password.
Call us toll free at 1-800-225-1581 Ask a helpful Putnam representative or your financial advisor for details about any of these or other services, or see your prospectus.
106 Dynamic Risk Allocation Fund
Fund information
Founded over 75 years ago, Putnam Investments was built around the concept that a balance between risk and reward is the hallmark of a well-rounded financial program. We manage over 100 funds across income, value, blend, growth, asset allocation, absolute return, and global sector categories.
Investment Manager
Putnam Investment
Management, LLC
One Post Office Square
Boston, MA 02109
Investment Sub-Manager
Putnam Investments Limited
57–59 St James’s Street
London, England SW1A 1LD
Marketing Services
Putnam Retail Management
One Post Office Square
Boston, MA 02109
Custodian
State Street Bank
and Trust Company
Legal Counsel
Ropes & Gray LLP
Independent Registered Public Accounting Firm
KPMG LLP
Trustees
Jameson A. Baxter, Chair
Liaquat Ahamed
Ravi Akhoury
Barbara M. Baumann
Robert J. Darretta
Katinka Domotorffy
John A. Hill
Paul L. Joskow
Kenneth R. Leibler
Robert E. Patterson
George Putnam, III
Robert L. Reynolds
W. Thomas Stephens
Officers
Robert L. Reynolds
President
Jonathan S. Horwitz
Executive Vice President,
Principal Executive Officer, and
Compliance Liaison
Steven D. Krichmar
Vice President and
Principal Financial Officer
Robert T. Burns
Vice President and
Chief Legal Officer
Robert R. Leveille
Vice President and
Chief Compliance Officer
Michael J. Higgins
Vice President, Treasurer,
and Clerk
Janet C. Smith
Vice President,
Principal Accounting Officer,
and Assistant Treasurer
Susan G. Malloy
Vice President and
Assistant Treasurer
James P. Pappas
Vice President
Mark C. Trenchard
Vice President and
BSA Compliance Officer
Nancy E. Florek
Vice President, Director of
Proxy Voting and Corporate
Governance, Assistant Clerk,
and Associate Treasurer
Dynamic Risk Allocation Fund 107
This report is for the information of shareholders of Putnam Dynamic Risk Allocation Fund. It may also be used as sales literature when preceded or accompanied by the current prospectus, the most recent copy of Putnam’s Quarterly Performance Summary, and Putnam’s Quarterly Ranking Summary. For more recent performance, please visit putnam.com. Investors should carefully consider the investment objectives, risks, charges, and expenses of a fund, which are described in its prospectus. For this and other information or to request a prospectus or summary prospectus, call 1-800-225-1581 toll free. Please read the prospectus carefully before investing. The fund’s Statement of Additional Information contains additional information about the fund’s Trustees and is available without charge upon request by calling 1-800-225-1581.
108 Dynamic Risk Allocation Fund

| Item 2. Code of Ethics: |
| (a) The fund’s principal executive, financial and accounting officers are employees of Putnam Investment Management, LLC, the Fund’s investment manager. As such they are subject to a comprehensive Code of Ethics adopted and administered by Putnam Investments which is designed to protect the interests of the firm and its clients. The Fund has adopted a Code of Ethics which incorporates the Code of Ethics of Putnam Investments with respect to all of its officers and Trustees who are employees of Putnam Investment Management, LLC. For this reason, the Fund has not adopted a separate code of ethics governing its principal executive, financial and accounting officers. |
| (c) In July 2013, the Code of Ethics of Putnam Investment Management, LLC was amended. The changes to the Code of Ethics were as follows: (i) eliminating the requirement for employees to hold their shares of Putnam mutual funds for specified periods of time, (ii) removing the requirement to preclear transactions in certain kinds of exchange-traded funds and exchange-traded notes, although reporting of all such instruments remains required; (iii) eliminating the excessive trading rule related to employee transactions in securities requiring preclearance under the Code; (iv) adding provisions related to monitoring of employee trading; (v) changing from a set number of shares to a set dollar value of stock of mid- and large-cap companies on the Restricted List that can be purchased or sold; (vi) adding a requirement starting in March 2014 for employees to generally use certain approved brokers that provide Putnam with an electronic feed of transactions and statements for their personal brokerage accounts; and (vii) certain other changes. |
| Item 3. Audit Committee Financial Expert: |
| The Funds’ Audit and Compliance Committee is comprised solely of Trustees who are “independent” (as such term has been defined by the Securities and Exchange Commission (“SEC”) in regulations implementing Section 407 of the Sarbanes-Oxley Act (the “Regulations”)). The Trustees believe that each of the members of the Audit and Compliance Committee also possess a combination of knowledge and experience with respect to financial accounting matters, as well as other attributes, that qualify them for service on the Committee. In addition, the Trustees have determined that each of Mr. Leibler, Mr. Hill, Mr. Darretta, and Ms. Baumann qualifies as an “audit committee financial expert” (as such term has been defined by the Regulations) based on their review of his or her pertinent experience and education. The SEC has stated, and the funds’ amended and restated agreement and Declaration of Trust provides, that the designation or identification of a person as an audit committee financial expert pursuant to this Item 3 of Form N-CSR does not impose on such person any duties, obligations or liability that are greater than the duties, obligations and liability imposed on such person as a member of the Audit and Compliance Committee and the Board of Trustees in the absence of such designation or identification. |
| Item 4. Principal Accountant Fees and Services: |
| The following table presents fees billed in each of the last two fiscal years for services rendered to the fund by the fund’s independent auditor: |
| Fiscal year ended | Audit Fees | Audit-Related Fees | Tax Fees | All Other Fees | |
| May 31, 2015 | $69,204 | $ — | $4,858 | $ — | |
| May 31, 2014 | $67,104 | $ — | $4,763 | $ — | |
| For the fiscal years ended May 31, 2015 and May 31, 2014, the fund’s independent auditor billed aggregate non-audit fees in the amounts of $4,858 and $4,763 respectively, to the fund, Putnam Management and any entity controlling, controlled by or under common control with Putnam Management that provides ongoing services to the fund. |
| Audit Fees represent fees billed for the fund’s last two fiscal years relating to the audit and review of the financial statements included in annual reports and registration statements, and other services that are normally provided in connection with statutory and regulatory filings or engagements. |
| Audit-Related Fees represent fees billed in the fund’s last two fiscal years for services traditionally performed by the fund’s auditor, including accounting consultation for proposed transactions or concerning financial accounting and reporting standards and other audit or attest services not required by statute or regulation. |
| Tax Fees represent fees billed in the fund’s last two fiscal years for tax compliance, tax planning and tax advice services. Tax planning and tax advice services include assistance with tax audits, employee benefit plans and requests for rulings or technical advice from taxing authorities. |
| Pre-Approval Policies of the Audit and Compliance Committee. The Audit and Compliance Committee of the Putnam funds has determined that, as a matter of policy, all work performed for the funds by the funds’ independent auditors will be pre-approved by the Committee itself and thus will generally not be subject to pre-approval procedures. |
| The Audit and Compliance Committee also has adopted a policy to pre-approve the engagement by Putnam Management and certain of its affiliates of the funds’ independent auditors, even in circumstances where pre-approval is not required by applicable law. Any such requests by Putnam Management or certain of its affiliates are typically submitted in writing to the Committee and explain, among other things, the nature of the proposed engagement, the estimated fees, and why this work should be performed by that particular audit firm as opposed to another one. In reviewing such requests, the Committee considers, among other things, whether the provision of such services by the audit firm are compatible with the independence of the audit firm. |
| The following table presents fees billed by the fund’s independent auditor for services required to be approved pursuant to paragraph (c)(7)(ii) of Rule 2-01 of Regulation S-X. |
| Fiscal year ended | Audit-Related Fees | Tax Fees | All Other Fees | Total Non-Audit Fees | |
| May 31, 2015 | $ — | $ — | $ — | $ — | |
| May 31, 2014 | $ — | $ — | $ — | $ — | |
| Item 5. Audit Committee of Listed Registrants |
| Not applicable |
| Item 6. Schedule of Investments: |
| The registrant’s schedule of investments in unaffiliated issuers is included in the report to shareholders in Item 1 above. |
| Item 7. Disclosure of Proxy Voting Policies and Procedures For Closed-End Management Investment Companies: |
| Not applicable |
| Item 8. Portfolio Managers of Closed-End Investment Companies |
| Not Applicable |
| Item 9. Purchases of Equity Securities by Closed-End Management Investment Companies and Affiliated Purchasers: |
| Not applicable |
| Item 10. Submission of Matters to a Vote of Security Holders: |
| Not applicable |
| Item 11. Controls and Procedures: |
| (a) The registrant’s principal executive officer and principal financial officer have concluded, based on their evaluation of the effectiveness of the design and operation of the registrant’s disclosure controls and procedures as of a date within 90 days of the filing date of this report, that the design and operation of such procedures are generally effective to provide reasonable assurance that information required to be disclosed by the registrant in this report is recorded, processed, summarized and reported within the time periods specified in the Commission’s rules and forms. |
| (b) Changes in internal control over financial reporting: Not applicable |
| Item 12. Exhibits: |
| (a)(1) The Code of Ethics of The Putnam Funds, which incorporates the Code of Ethics of Putnam Investments, is filed herewith. |
| (a)(2) Separate certifications for the principal executive officer and principal financial officer of the registrant as required by Rule 30a-2(a) under the Investment Company Act of 1940, as amended, are filed herewith. |
| (b) The certifications required by Rule 30a-2(b) under the Investment Company Act of 1940, as amended, are filed herewith. |
| SIGNATURES |
| Pursuant to the requirements of the Securities Exchange Act of 1934 and the Investment Company Act of 1940, the registrant has duly caused this report to be signed on its behalf by the undersigned, thereunto duly authorized. |
| Putnam Funds Trust |
| By (Signature and Title): |
| /s/ Janet C. Smith Janet C. Smith Principal Accounting Officer |
| Date: July 29, 2015 |
| Pursuant to the requirements of the Securities Exchange Act of 1934 and the Investment Company Act of 1940, this report has been signed below by the following persons on behalf of the registrant and in the capacities and on the dates indicated. |
| By (Signature and Title): |
| /s/ Jonathan S. Horwitz Jonathan S. Horwitz Principal Executive Officer |
| Date: July 29, 2015 |
| By (Signature and Title): |
| /s/ Steven D. Krichmar Steven D. Krichmar Principal Financial Officer |
| Date: July 29, 2015 |